Characterizing spatial uncertainty when integrating social data in conservation planning
15
Special Section Characterizing spatial uncertainty when integrating social data in conservation planning A. M. Lechner, ∗ §§§ C. M. Raymond,†‡§ V. M. Adams, ∗∗ M. Polyakov,†† A. Gordon,‡‡ J. R. Rhodes,§§ ∗∗∗ M. Mills,††† A. Stein,‡‡‡ C. D. Ives,‡‡ and E. C. Lefroy ∗ ∗ The Centre for Environment, University of Tasmania, Private Bag 141, Hobart, TAS 7001, Australia †Barbara Hardy Institute, University of South Australia, GPO Box 2471, Adelaide, SA 5001, Australia ‡Geography and Environmental Studies, School of Land and Food, University of Tasmania, Private Bag 50, HOBART TAS 7001, Australia §Enviroconnect, P.O. Box 190 Stirling, SA 5152, Australia ∗∗ Research Institute for the Environment and Livelihoods, Charles Darwin University, Darwin, NT 0909, Australia ††Centre for Environmental Economics and Policy, School of Agriculture and Resource Economics, The University of Western Australia, M089, 35 Stirling Hwy, Crawley, WA 6009, Australia ‡‡School of Global, Urban and Social Studies, RMIT University, GPO Box 2476, Melbourne, VIC 3001, Australia §§ARC Centre of Excellence for Environmental Decisions, School of Geography, Planning and Environmental Management, The University of Queensland, QLD 4072, Australia ∗∗∗ NERP Environmental Decisions Hub, School of Geography, Planning and Environmental Management, The University of Queensland, QLD 4072, Australia †††Global Change Institute, The University of Queensland, QLD 4072, Australia ‡‡‡Faculty of Geo-Information Science and Earth Observation (ITC), University of Twente, P.O. Box 217, 7500, AE Enschede, The Netherlands Abstract: Recent conservation planning studies have presented approaches for integrating spatially refer- enced social (SRS) data with a view to improving the feasibility of conservation action. We reviewed the growing conservation literature on SRS data, focusing on elicited or stated preferences derived through social survey methods such as choice experiments and public participation geographic information systems. Elicited SRS data includes the spatial distribution of willingness to sell, willingness to pay, willingness to act, and assessments of social and cultural values. We developed a typology for assessing elicited SRS data uncertainty which describes how social survey uncertainty propagates when projected spatially and the importance of accounting for spatial uncertainty such as scale effects and data quality. These uncertainties will propagate when elicited SRS data is integrated with biophysical data for conservation planning and may have important consequences for assessing the feasibility of conservation actions. To explore this issue further, we conducted a systematic review of the elicited SRS data literature. We found that social survey uncertainty was commonly tested for, but that these uncertainties were ignored when projected spatially. Based on these results we developed a framework which will help researchers and practitioners estimate social survey uncertainty and use these quantitative estimates to systematically address uncertainty within an analysis. This is important when using SRS data in conservation applications because decisions need to be made irrespective of data quality and well characterized uncertainty can be incorporated into decision theoretic approaches. Keywords: conservation opportunity, conservation planning, elicited values, public participation GIS, social research, spatial data quality, spatial uncertainty, systematic conservation assessment Caracterizaci´ on de la Incertidumbre Espacial cuando se Integran Datos Sociales a la Planeaci´ on de la Conservaci´ on §§§email [email protected] Paper submitted March 29, 2014; revised manuscript accepted July 30, 2014. 1497 Conservation Biology, Volume 28, No. 6, 1497–1511 C 2014 Society for Conservation Biology DOI: 10.1111/cobi.12409
Transcript of Characterizing spatial uncertainty when integrating social data in conservation planning
Special Section
Characterizing spatial uncertainty when integratingsocial data in conservation planningA. M. Lechner,∗ §§§ C. M. Raymond,†‡§ V. M. Adams,∗∗ M. Polyakov,†† A. Gordon,‡‡J. R. Rhodes,§§∗∗∗ M. Mills,††† A. Stein,‡‡‡ C. D. Ives,‡‡ and E. C. Lefroy∗∗The Centre for Environment, University of Tasmania, Private Bag 141, Hobart, TAS 7001, Australia†Barbara Hardy Institute, University of South Australia, GPO Box 2471, Adelaide, SA 5001, Australia‡Geography and Environmental Studies, School of Land and Food, University of Tasmania, Private Bag 50, HOBART TAS 7001,Australia§Enviroconnect, P.O. Box 190 Stirling, SA 5152, Australia∗∗Research Institute for the Environment and Livelihoods, Charles Darwin University, Darwin, NT 0909, Australia††Centre for Environmental Economics and Policy, School of Agriculture and Resource Economics, The University of WesternAustralia, M089, 35 Stirling Hwy, Crawley, WA 6009, Australia‡‡School of Global, Urban and Social Studies, RMIT University, GPO Box 2476, Melbourne, VIC 3001, Australia§§ARC Centre of Excellence for Environmental Decisions, School of Geography, Planning and Environmental Management, TheUniversity of Queensland, QLD 4072, Australia∗∗∗NERP Environmental Decisions Hub, School of Geography, Planning and Environmental Management, The University ofQueensland, QLD 4072, Australia†††Global Change Institute, The University of Queensland, QLD 4072, Australia‡‡‡Faculty of Geo-Information Science and Earth Observation (ITC), University of Twente, P.O. Box 217, 7500, AE Enschede, TheNetherlands
Abstract: Recent conservation planning studies have presented approaches for integrating spatially refer-enced social (SRS) data with a view to improving the feasibility of conservation action. We reviewed thegrowing conservation literature on SRS data, focusing on elicited or stated preferences derived through socialsurvey methods such as choice experiments and public participation geographic information systems. ElicitedSRS data includes the spatial distribution of willingness to sell, willingness to pay, willingness to act, andassessments of social and cultural values. We developed a typology for assessing elicited SRS data uncertaintywhich describes how social survey uncertainty propagates when projected spatially and the importance ofaccounting for spatial uncertainty such as scale effects and data quality. These uncertainties will propagatewhen elicited SRS data is integrated with biophysical data for conservation planning and may have importantconsequences for assessing the feasibility of conservation actions. To explore this issue further, we conducteda systematic review of the elicited SRS data literature. We found that social survey uncertainty was commonlytested for, but that these uncertainties were ignored when projected spatially. Based on these results wedeveloped a framework which will help researchers and practitioners estimate social survey uncertainty anduse these quantitative estimates to systematically address uncertainty within an analysis. This is importantwhen using SRS data in conservation applications because decisions need to be made irrespective of dataquality and well characterized uncertainty can be incorporated into decision theoretic approaches.
Keywords: conservation opportunity, conservation planning, elicited values, public participation GIS, socialresearch, spatial data quality, spatial uncertainty, systematic conservation assessment
Caracterizacion de la Incertidumbre Espacial cuando se Integran Datos Sociales a la Planeacion de la Conservacion
§§§email [email protected] submitted March 29, 2014; revised manuscript accepted July 30, 2014.
1497Conservation Biology, Volume 28, No. 6, 1497–1511C© 2014 Society for Conservation BiologyDOI: 10.1111/cobi.12409
1498 Social Data Spatial Uncertainty
Resumen: Estudios recientes de la planeacion de la conservacion han presentado estrategias para integrardatos sociales con referencia espacial (SRE) con miras a mejorar la viabilidad de las acciones de conservacion.Revisamos la creciente literatura de conservacion sobre los datos SRE, enfocandonos en las preferenciasobtenidas o mencionadas derivadas de metodos de encuestas sociales como los experimentos de opcion ylos sistemas de informacion geografica de participacion publica. Los datos SRE obtenidos incluyeron a ladistribucion espacial de la disposicion de vender, de pagar, de actuar y evaluaciones de los valores culturalesy sociales. Desarrollamos una tipologıa para evaluar la incertidumbre de los datos SRE obtenidos, la quedescribe como la incertidumbre de las encuestas sociales se propaga cuando se proyecta espacialmente yla importancia de responder a la incertidumbre espacial como los efectos de escala y la calidad de datos.Estas incertidumbres se propagaran cuando los datos SRE obtenidos se integren con datos biofısicos para laplaneacion de la conservacion y pueden tener consecuencias importantes para evaluar la viabilidad de lasacciones de conservacion. Para explorar mas a fondo este tema, llevamos a cabo una revision sistematica dela literatura sobre datos SRE obtenidos. Encontramos que la incertidumbre de encuestas sociales se probabacomunmente, pero que estas incertidumbres se ignoraban al proyectarse espacialmente. Con base en estosresultados desarrollamos un marco de trabajo que ayudara a los investigadores y a los practicantes a estimarla incertidumbre de las encuestas sociales y a usar estos estimados cuantitativos para senalar sistematicamentea la incertidumbre dentro de un analisis. Estos es importante cuando se usan datos SRE en aplicaciones de laconservacion ya que las decisiones deben tomarse sin importar la calidad de los datos y una incertidumbrebien caracterizada puede ser incorporada a las estrategias de decision teorica.
Palabras clave: calidad de datos espaciales, evaluacion de la conservacion sistematica, incertidumbre espacial,investigacion social, oportunidad de conservacion, planeacion de la conservacion, SIG de participacion publica,valores obtenidos
Introduction
One of the great challenges to conservation planningis accounting for the feasibility of conservation actions,which requires an understanding of the complex social,economic, and institutional environments in which con-servation occurs (Knight et al. 2006). Recent conserva-tion planning studies have presented tools for utilizingmapped quantitative social data with the view towardquantifying opportunities for conservation interventions.Although tools for assessing conservation opportunitieshave considered social and cultural values (Brown 2012),governance characteristics (Mills et al. 2013), and self-reported behavior (Curtis et al. 2005; Raymond & Brown2011) these tools rarely consider the uncertainties as-sociated with mapping these attributes. This can havethe perverse result of recommending actions that haveneutral or even negative conservation outcomes.
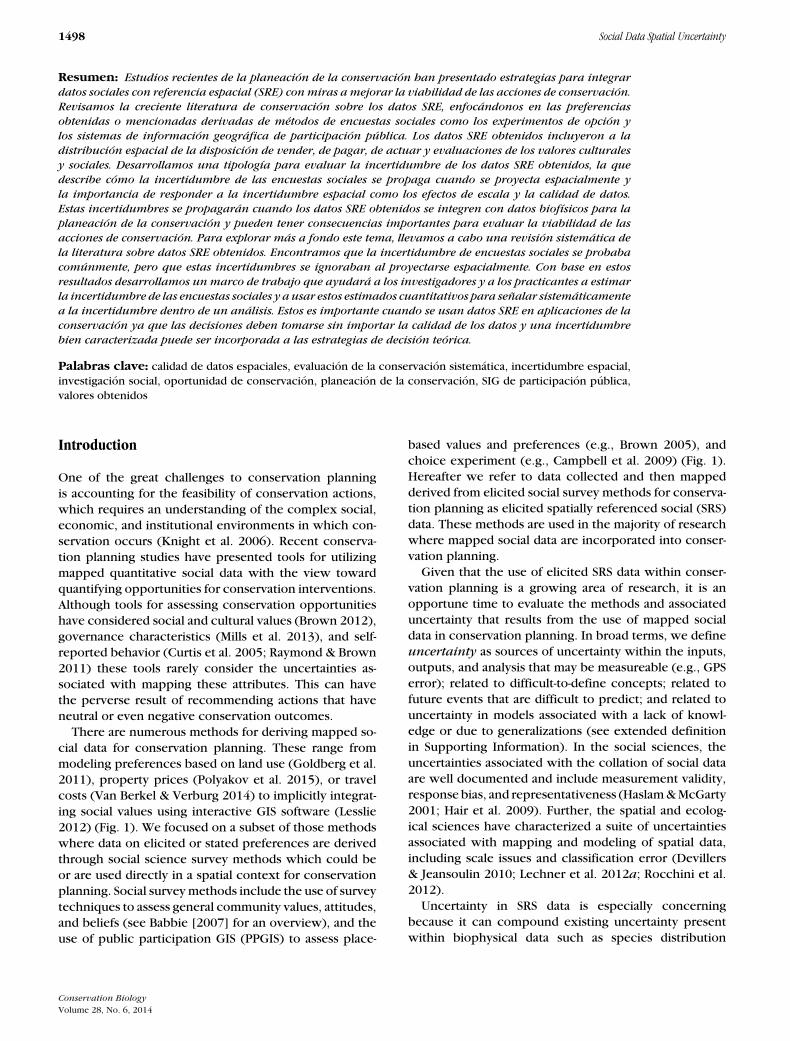
There are numerous methods for deriving mapped so-cial data for conservation planning. These range frommodeling preferences based on land use (Goldberg et al.2011), property prices (Polyakov et al. 2015), or travelcosts (Van Berkel & Verburg 2014) to implicitly integrat-ing social values using interactive GIS software (Lesslie2012) (Fig. 1). We focused on a subset of those methodswhere data on elicited or stated preferences are derivedthrough social science survey methods which could beor are used directly in a spatial context for conservationplanning. Social survey methods include the use of surveytechniques to assess general community values, attitudes,and beliefs (see Babbie [2007] for an overview), and theuse of public participation GIS (PPGIS) to assess place-
based values and preferences (e.g., Brown 2005), andchoice experiment (e.g., Campbell et al. 2009) (Fig. 1).Hereafter we refer to data collected and then mappedderived from elicited social survey methods for conserva-tion planning as elicited spatially referenced social (SRS)data. These methods are used in the majority of researchwhere mapped social data are incorporated into conser-vation planning.
Given that the use of elicited SRS data within conser-vation planning is a growing area of research, it is anopportune time to evaluate the methods and associateduncertainty that results from the use of mapped socialdata in conservation planning. In broad terms, we defineuncertainty as sources of uncertainty within the inputs,outputs, and analysis that may be measureable (e.g., GPSerror); related to difficult-to-define concepts; related tofuture events that are difficult to predict; and related touncertainty in models associated with a lack of knowl-edge or due to generalizations (see extended definitionin Supporting Information). In the social sciences, theuncertainties associated with the collation of social dataare well documented and include measurement validity,response bias, and representativeness (Haslam & McGarty2001; Hair et al. 2009). Further, the spatial and ecolog-ical sciences have characterized a suite of uncertaintiesassociated with mapping and modeling of spatial data,including scale issues and classification error (Devillers& Jeansoulin 2010; Lechner et al. 2012a; Rocchini et al.2012).
Uncertainty in SRS data is especially concerningbecause it can compound existing uncertainty presentwithin biophysical data such as species distribution
Conservation BiologyVolume 28, No. 6, 2014
Lechner et al. 1499
Figure 1. Methods for assigning preferences to spatially referenced social data (Supporting Information for fullversion with examples) (dotted-line rectangle, scope of review).
models and when used within systematic conservationplanning (SCP) tools. Combining SRS data with biophys-ical data may result in greater levels of uncertainty asthese multiple forms of uncertainty may interact (e.g.,Lechner et al. 2013) and multiply (e.g., Langford et al.2011). For example, using simulated data Visconti et al.(2010) found that data on vulnerability to habitat lossshould only be included in SCP when uncertainty inthis data is <20–30%. They showed that with greateruncertainty it was counterproductive to utilize this dataand better results could be obtained using biodiversityvalue alone. A key motivation for including SRS data isto make plans more implementable, but data uncertaintycould result in less accurate or implementable plans—thedirect opposite of the desired outcome.
We addressed the question of how to manage uncer-tainties in SRS data by identifying the types of social dataanalyzed and the common types of geospatial processingmethods used for creating elicited SRS data; developinga typology of SRS data uncertainty based on a review ofthe types of uncertainty identified in the social and spa-tial science literatures associated with the social surveyand geospatial methods used; reviewing whether existingconservation planning studies are addressing SRS datauncertainty as defined by the typology; and using theresults of the reviews to develop a process for more effec-tively managing uncertainty issues in future conservationplanning studies. We also considered research directionsrequired to systematically address these uncertainties andthe implications this has for conservation planning ingeneral.
Geospatial Methods for Deriving Elicited SRS Data
We focused specifically on elicited SRS data which meetsall the following criteria: one of the final outputs is amap describing individual preferences elicited directly
through social science survey methods for use in con-servation planning; mapping outputs aim to characterizethe whole of the study area; and there is a potential forthese mapped outputs to be integrated with spatially ex-plicit biophysical data for use within SCP (e.g., Zonation[Moilanen et al. 2011]).
Three broad methods for eliciting social data are com-monly used for deriving elicited SRS data: PPGIS, choiceexperiments, and standard survey methods. The PPGISis a suite of techniques for engaging local communi-ties through the use of a GIS whereby participants lo-cate points or regions on maps describing values relatedto conservation outcomes (Brown 2012). In contrast, achoice experiment is a survey technique where respon-dents are asked to choose between different bundles of(environmental) goods, which are described in terms oftheir attributes, or characteristics, and the levels thatthese attributes take (Hanley et al. 1998; Adamowicz2004). By a standard survey we mean commonly appliedmethods of eliciting information through questionnairesor interviews.
A range of geospatial and statistical methods canbe used to spatially project elicited social data forintegration with biophysical data (Table 1). Thesemethods have been used to map social data including theperceptual values individuals associate with landscapes(e.g., Campbell et al. 2009; Raymond et al. 2009)and stated preferences which describe the preferencefor products and services such as willingness to pay(WTP), collaborate, or sell for conservation (e.g., Knightet al. 2010; Curran et al. 2012). Spatial layers usingdata of perceptual values are produced using a range ofprocessing methods based on geographic units definedeither by a raster grid or areal boundary (Table 1 &methods 2 and 4). In contrast, stated preferences in somecases requires no geospatial processing as individualsocial data are linked directly to their spatial locations(such as owners properties) (Table 1 & method 1).
Conservation BiologyVolume 28, No. 6, 2014

1500 Social Data Spatial Uncertainty
Tabl
e1.
Geos
patia
lcha
ract
eris
tics
ofel
icite
dsp
atia
llyre
fere
nced
soci
al(S
RS)
data
.a
Geo
spa
tia
lm
eth
od
1.A
rea
l2
.Are
al
3.A
rea
l4
.Poin
tpa
tter
n5
.Loca
lst
ati
stic
sda
ta–i
ndiv
idu
al
agg
rega
tion
bda
ta–p
redic
tive
met
hod
an
aly
sis
(e.g
.,P
PG
IS)
(e.g
.,kri
gin
g)
Exam
ple
lan
do
wn
ers
pla
ceva
lues
on
thei
rp
rop
erti
esas
sets
or
will
ingn
ess
tose
llo
fh
is/h
erp
rop
erty
;Cu
rran
etal
.20
12
aggr
egat
edso
cial
dat
afr
om
mu
ltip
lein
div
idu
als
such
asce
nsu
sd
ata;
no
exam
ple
of
elic
ited
SRS
dat
aav
aila
ble
der
ive
stat
isti
cal
rela
tio
nsh
ipb
etw
een
soci
ald
ata
and
sub
catc
hm
ent;
Bro
uw
eret
al.2
010
soci
alo
rec
on
om
icva
lues
ind
ivid
ual
sat
tach
tom
ult
iple
pla
ces
on
the
lan
dsc
ape;
Bro
wn
&D
on
ova
n20
13
krig
edso
cial
dat
a;C
amp
bel
let
al.2
009
Inp
ut
dat
an
/ap
oin
ts—
qu
anti
tati
ven
/ap
oin
ts—
no
min
alp
oin
ts—
qu
anti
tati
veM
eth
od
of
der
ivin
gva
lue
des
crip
tive
des
crip
tive
stat
isti
cal
des
crip
tive
stat
isti
cal
Geo
spat
ialp
roce
ssin
gm
eth
od
no
ne
po
int
toar
ean
on
ep
oin
tto
area
po
int
tosu
rfac
e
Geo
grap
hic
un
itp
rop
erty
bo
un
dar
yar
eal—
cen
sus
bo
un
dar
yar
eal—
cen
sus
area
or
catc
hm
ent
area
l—gr
idar
eal—
grid
Geo
spat
ialp
roce
ssin
gm
eth
od
des
crip
tio
nas
soci
ate
ind
ivid
ual
soci
ald
ata
wit
hsi
ngl
esp
atia
lob
ject
(e.g
.,p
rop
erty
)
der
ive
des
crip
tive
stat
isti
c(e
.g.,
mea
n)
bas
edo
nag
greg
atio
nu
nit
such
asce
nsu
sd
istr
ict
or
gove
rnm
ent
bo
un
dar
y
der
ive
stat
isti
cal
rela
tio
nsh
ipb
etw
een
lan
d-c
ove
rty
pe
and
soci
ald
ata;
no
n-s
pat
ial
anal
ysis
un
der
take
nan
dre
sult
sp
roje
cted
spat
ially
po
int
pat
tern
anal
ysis
(e.g
.,id
enti
fyin
gar
eas
wit
hh
igh
nu
mb
ero
fo
ccu
rren
ces)
inte
rpo
late
valu
esb
etw
een
po
int
loca
tio
ns
Ou
tpu
td
ata
typ
eq
uan
tita
tive
—co
nti
nu
ou
sq
uan
tita
tive
—av
erag
e(G
auss
ian
)q
uan
tita
tive
—av
erag
e(G
auss
ian
)q
uan
tita
tive
—co
un
ts(b
ino
mia
l)q
uan
tita
tive
—fi
eld
so
rras
ter
grid
aSe
eSu
pport
ing
Info
rma
tion
for
spa
tia
lda
tagr
aph
ica
lex
am
ple
s.bTh
isty
pe
of
an
aly
sis
wa
sin
clu
ded
inth
ista
ble
even
thou
ghit
wa
sn
ot
pre
sen
tin
the
revi
ewa
sit
repre
sen
tsa
very
com
mon
type
of
geosp
ati
ala
na
lysi
sm
eth
od
use
dw
ith
soci
alda
ta.
Conservation BiologyVolume 28, No. 6, 2014

Lechner et al. 1501
Stated preferences may also require interpolation to mappreferences in areas where there is no data. This is doneusing a range of statistical methods such as predictive(e.g., Brouwer et al. 2010) (Table 1 & method 3) andKriging (e.g., Campbell et al. 2009) (Table 1 & method 5).
Typology for Assessing SRS Data Uncertainty
We developed a typology for assessing SRS data uncer-tainty by synthesizing insights from the social scienceand spatial science literatures with respect to the rangeof geospatial methods used for deriving these data andintegrating the data within analysis. The typology de-scribes uncertainties associated with: the collation andinterpretation of social data; the projection of social dataspatially; and the integration of elicited SRS data withother data sources such as biophysical data.
The many different forms of uncertainty in the socialsciences have been eloquently categorized in a paperby Haslam and McGarty (2001) into internal and exter-nal methodological uncertainties (Table 2), in additionto statistical uncertainty. Internal methodological uncer-tainty is related to whether an observed effect has beencorrectly measured and interpreted (Hair et al. 2009) anddepends on face validity, content validity, and constructvalidity (Table 2). External methodological uncertaintyarises when researchers are unsure whether results canbe generalized to the wider population of interest. Itrequires a consideration of the sampling strategy, sam-ple size, representativeness of the sample, and associatednonresponse bias. A more detailed discussion of socialsurvey methods uncertainty and methods to address itare in Supporting Information.
When projecting social data spatially, the methodologi-cal uncertainty associated with social surveys can be con-sidered in the same way as data accuracy within spatialmodels in terms of uncertainty propagation. Social surveydata accuracy can be measured as the deviation from thetrue value (e.g., the deviation from the correct value ofWTP estimated for an individual on a property). Data ac-curacy is a general aspect of a suite of uncertainty sourcesknown as data quality (Devillers & Jeansoulin 2010; Shi2010). Data quality considerations include, but are notlimited to: completeness, logical consistency, positionalaccuracy, temporal accuracy, thematic accuracy, cover-age, lineage, accessibility, and interpretability (Aspinall& Pearson 1996; Devillers & Jeansoulin 2010; Shi 2010).Uncertainty associated with data quality has unique char-acteristics when considered in space. For example, aserror is spatially distributed across the landscape, it canmagnify when combined with other data or when used ina model (Congalton 1988; Heuvelink et al. 1989; Gergelet al. 2007).
Sources of uncertainty that are specific only to spa-tial data principally arise from the modifiable areal unit
problem (MAUP) (also known as the zoning effect orscaling problem) and the related ecological inferenceproblem and change of support problem (COSP) (Open-shaw 1984; Gotway & Young 2002) (Table 3). TheMAUP results from the many ways in which nonover-lapping spatial units can be used to divide a study areafor the purposes of analyses such as a raster grid orcensus district boundaries (Openshaw 1984). AlthoughCOSP is a broader term referring to changing the types,size, and shape of the spatial units within any singlestudy, for example, point, lines, areas, and pixel (Dunganet al. 2002; Gotway & Young 2002). The ecologicalinference problem (also known as the ecological fallacy)is a specific case of the COSP that is the result of mak-ing conclusions about individuals based only on analy-sis of aggregated data (e.g., at the district level) (King1997). Whenever social survey data is projected spatiallythe choice of spatial units in terms of their size andshape (e.g., property boundary, grid cell, catchment) andthe relationship with the spatial patterns of the so-cial value or perception being represented will im-pact on spatial analysis and in some cases renderthe outputs meaningless (Openshaw 1984; Jelinski &Wu 1996; Wu et al. 1997; Lechner et al. 2012b).In any single analysis, there will be multiple poten-tial sources of the COSP (which includes the MAUPand the ecological inference problem) and data qual-ity associated uncertainty which together affect bothmodeling and inference undertaken with the data(Gotway & Young 2002). An extended discussion ofCOSP and data quality uncertainty and methods to ad-dress them is in Supporting Information.
When using elicited SRS data for conservation plan-ning, other types of data such as biophysical data (e.g.,land cover and species distributions maps and spatialinformation on threats and costs) are required and allcontain uncertainty. In the case of species’ distributionmodeling, uncertainties originate from both input dataand the process of mapping the species distributions(Elith et al. 2002; Rocchini et al. 2012). Along with SRSdata uncertainty, these other sources of uncertainty needto be addressed when conducting analysis.
Based on the geospatial, ecological, and social scienceliterature we have devised a typology that describes thepropagation and sources of uncertainty resulting fromprojecting elicited SRS data spatially and utilizing it withinan analysis (Fig. 2). Uncertainty first arises in the socialsurvey data due to methodological uncertainty (nonspa-tial uncertainty) (Fig. 2a). This social data can then beused in a broad range of ways to map elicited SRS dataresulting in uncertainty being propagated to other partsof the analysis. The simplest way to use the social data isto convert to a spatial unit based on the geolocation of thesocial data (Table 1 & methods 1, 2, and 5). This resultsin uncertainty taking on a spatial dimension, whereby un-certainty can be treated as classification accuracy (Fig. 2b)
Conservation BiologyVolume 28, No. 6, 2014

1502 Social Data Spatial Uncertainty
Table 2. Types of social survey uncertainty.
Tests to consider Tests to considerType of Means of in social values in stateduncertainty Definition management studies (e.g., PPGIS) preference studies
Internal confidence that theoutput shows what itis believed to show
research design controls,including validitytesting
face validity, contentvalidity, constructvalidity reliability
face validity, content validity,construct validity, preferenceuncertainty
External the confidence in theresults beinggeneralizable
research design controls,including validitytesting
sample strategy and size,representativeness,concurrent validity,predictive validity
preference uncertainty, samplestrategy and size,representativeness, concurrentvalidity, predictive validity,hypothetical bias
Adapted from Haslam and McGarty (2001) (Supporting Information for extended discussion).
Table 3. Types of spatial uncertainty associated with elicited spatially referenced social (SRS) data.
Type of Potential methodsuncertainty Definition Source to consider
Accuracy difference between measuredvalue and true value
social survey methodologicaluncertainty, statistical modeluncertainty
simulate uncertainty in geographic unitsbased on uncertainty bounds from socialsurvey methodology or statistical model;uncertainty quantified with statisticalmodel, for example, standard errors andBayesian approaches; variations includeMonte-Carlo methods, simulating thespatial distribution of uncertainty andlocal versus global sensitivity analysis
Change of supportproblem (COSP)
uncertainty due to the manyways of integrating different
area to point—-ecologicalinference problem
cross-classification with other variables,Quadrat counts
types of spatial data point to area dasymetric mapping, use of areal centroidspoint to surface geostatistical methods such as kriging,
cokrigingarea to area—the modifiable
areal unit problem (MAUP)(e.g., combining multiplespatial data sets)
areal interpolation, incompatible/misalig-ned zones, pixel aggregation, Bayesianareal regression models, multiscalespatial tree models, hierarchical models
area to surface pycnophylactic interpolation
Supporting Information for extended discussion.
(e.g., transcription error). These uncertainties interactwith uncertainty that arises from data quality (e.g., tran-scription error), choice of spatial units, and the methodfor aggregating the data (e.g., average value for a rastercell) (data quality and COSP) (Fig. 2b). Alternatively, so-cial survey data uncertainty can affect the analysis as aninput into a statistical model when using other elicitedSRS data geospatial methods (e.g., Table 1 & methods 3and 4). Regardless of how uncertainty arises in elicitedSRS data (Fig. 2c), it will propagate when combined withother forms of data and potentially interact if that dataalso includes uncertainty (Fig. 2d). Additional error willalso arise in studies that use statistical analyses even ifthe social data is 100% accurate due to sample error,model choice, generalizability, etc. We did not considerthe mechanisms associated with a statistical analysis be-cause these forms of uncertainty are common to mostscientific studies. All the uncertainties associated withthe production and analysis of elicited SRS data will bepresent in the final modeling or mapping output used inconservation planning (Fig. 2e).
Review of Elicited SRS Data Literature
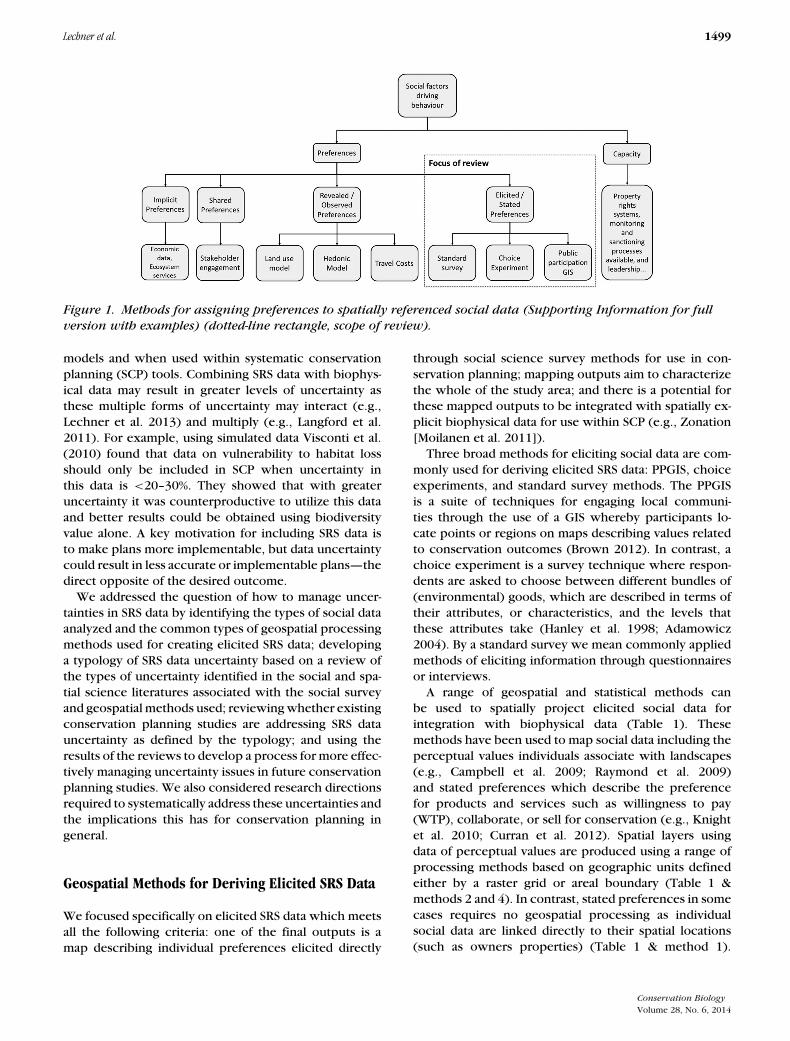
We reviewed a subset of the literature on elicited SRSdata in order to summarize what social data is beingmapped and the geospatial methods used and assesswhether uncertainty is being addressed. We identified16 papers in our systematic review as meeting the crite-ria for elicited SRS data described above from a Web ofScience keywords search (“conservation planning” OR“systematic conservation planning” OR “spatial priori-tization”) AND Topic = (“willingness to sell” OR “will-ingness to participate” OR “willingness” OR “conserva-tion opportunity” OR “social value” OR “preference”)we conducted in October 2013. We also asked partici-pants attending a workshop on conservation opportunityto identify potential papers (Supporting Information forfull description). The studies reviewed included a broadrange of conservation objectives, methods, and environ-ments. Conservation objectives included improving wa-ter quality (Brouwer et al. 2010), managing ecosystemservices (Bryan et al. 2010), and designing protected area
Conservation BiologyVolume 28, No. 6, 2014

Lechner et al. 1503
Figure 2. Conceptual diagram describing the steps in the processing and analysis of elicited spatially referencedsocial (SRS) data and other forms of data (e.g., SDM, species distribution model) and the propagation ofnonspatial methodological uncertainty and spatial uncertainty (COSP, change of support problem; MAUP,modifiable areal unit problem). Uncertainty propagation can be tested in the production of elicited SRS data andfor the outputs of a spatial analysis for conservation planning.
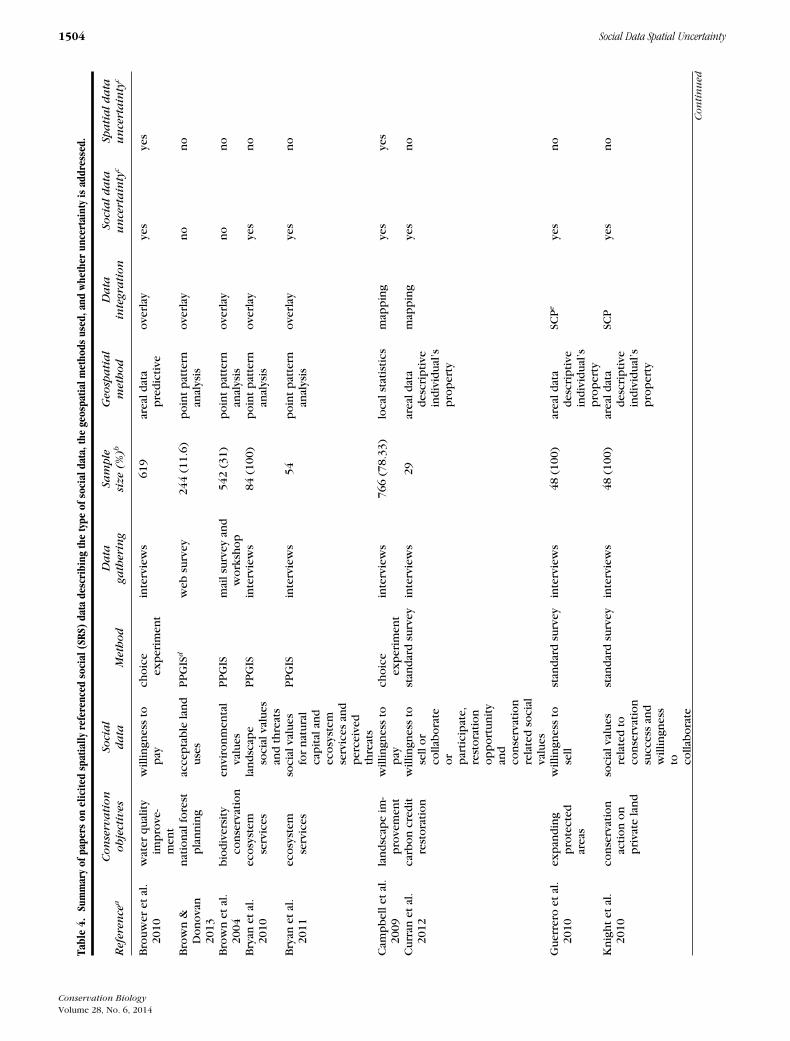
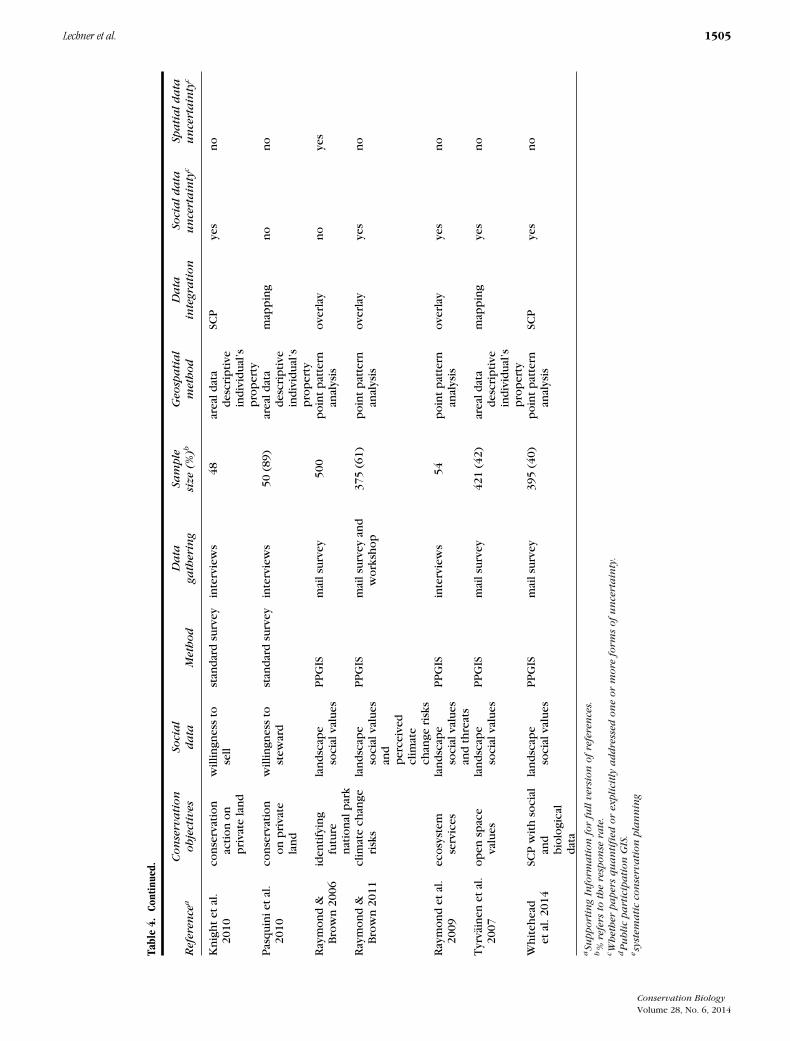
networks (Guerrero et al. 2010) (Table 4) and includeda range of environments including both terrestrial andmarine. Social data were gathered using interviews, mailsurveys, and Web-based surveys with sample sizes rang-ing from 29 (Curran et al. 2012) to 766 individuals(Campbell et al. 2009) (Table 4) and response rates,where reported, (10 of 16 studies) ranged from 11.6%to 100%. The size of the study areas ranged from smalllocal scale (Curran et al. 2012) to country-wide (Campbellet al. 2009).
We categorized the studies into 3 groups based onuse of similar social survey and geospatial methods. Thefirst group was individual property owners, in whichthe likelihood of undertaking a conservation related ac-tion on the respondent’s property was measured directly(Table 4 & Geospatial method–Areal data descriptive in-dividual’s property) based on “willingness to steward”(Pasquini et al. 2010) or “willingness to sell” (Knightet al. 2010). These studies commonly used interviewsurvey techniques with small sample sizes (n = �50)but with large response rates (89–100%), indicating highor complete coverage of the relevant stakeholders. Thesecond group of studies was the choice survey group,which included only 2 studies (Campbell et al. 2009;Brouwer et al. 2010). They both attempted to measure
the likelihood of paying for conservation actions withchoice survey methods. This group included the 2 largestsample sizes (n = �700), which reflects the large datarequirements for this experimental approach. The thirdgroup was the PPGIS group and included 9 out of 16 stud-ies. They measured collective perceptions of biologicalimportance (or value) (Brown et al. 2004; Raymond et al.2009; Whitehead et al. 2014). These studies were com-monly undertaken at the regional scale involving largesample sizes (n = 54–500) with moderate response rates(11.6–100%) and used PPGIS methods (Table 4).
The geospatial methods used in each study were in-fluenced by the method used to gather social data andby the size of the study area because it is impractical forstudies that occur over large areas to sample the totalpopulation. The most common geoprocessing methodwas based on PPGIS (9 out of 16 studies) (Table 4). ThesePPGIS studies assumed that collective measures of com-munity perceptions of biological importance (or value),or threats to values, were directly related to conserva-tion actions. Our review also included 2 examples wherestatistical methods were applied to mapping social data.Brouwer et al. (2010) used a statistical model to assessWTP for water quality improvements for subbasins acrossa river basin, whereas Campbell et al. (2009) used the
Conservation BiologyVolume 28, No. 6, 2014
1504 Social Data Spatial Uncertainty
Tabl
e4.
Sum
mar
yof
pape
rson
elic
ited
spat
ially
refe
renc
edso
cial
(SRS
)da
tade
scri
bing
the
type
ofso
cial
data
,the
geos
patia
lmet
hods
used
,and
whe
ther
unce
rtai
nty
isad
dres
sed.
Con
serv
ati
on
Soci
al
Da
taSa
mple
Geo
spa
tia
lD
ata
Soci
alda
taSp
ati
alda
taR
efer
ence
aobje
ctiv
esda
taM
eth
od
gath
erin
gsi
ze(%
)bm
eth
od
inte
gra
tion
un
cert
ain
tyc
un
cert
ain
tyc
Bro
uw
eret
al.
2010
wat
erq
ual
ity
imp
rove
-m
ent
will
ingn
ess
top
aych
oic
eex
per
imen
tin
terv
iew
s61
9ar
eald
ata
pre
dic
tive
ove
rlay
yes
yes
Bro
wn
&D
on
ova
n20
13
nat
ion
alfo
rest
pla
nn
ing
acce
pta
ble
lan
du
ses
PP
GIS
dw
ebsu
rvey
244
(11.
6)p
oin
tp
atte
rnan
alys
iso
verl
ayn
on
o
Bro
wn
etal
.20
04b
iod
iver
sity
con
serv
atio
nen
viro
nm
enta
lva
lues
PP
GIS
mai
lsu
rvey
and
wo
rksh
op
542
(31)
po
int
pat
tern
anal
ysis
ove
rlay
no
no
Bry
anet
al.
2010
eco
syst
emse
rvic
esla
nd
scap
eso
cial
valu
esan
dth
reat
s
PP
GIS
inte
rvie
ws
84(1
00)
po
int
pat
tern
anal
ysis
ove
rlay
yes
no
Bry
anet
al.
2011
eco
syst
emse
rvic
esso
cial
valu
esfo
rn
atu
ral
cap
ital
and
eco
syst
emse
rvic
esan
dp
erce
ived
thre
ats
PP
GIS
inte
rvie
ws
54p
oin
tp
atte
rnan
alys
iso
verl
ayye
sn
o
Cam
pb
elle
tal
.20
09la
nd
scap
eim
-p
rove
men
tw
illin
gnes
sto
pay
cho
ice
exp
erim
ent
inte
rvie
ws
766
(78.
33)
loca
lsta
tist
ics
map
pin
gye
sye
s
Cu
rran
etal
.20
12ca
rbo
ncr
edit
rest
ora
tio
nw
illin
gnes
sto
sell
or
colla
bo
rate
or
par
tici
pat
e,re
sto
rati
on
op
po
rtu
nit
yan
dco
nse
rvat
ion
rela
ted
soci
alva
lues
stan
dar
dsu
rvey
inte
rvie
ws
29ar
eald
ata
des
crip
tive
ind
ivid
ual
’sp
rop
erty
map
pin
gye
sn
o
Gu
erre
roet
al.
2010
exp
and
ing
pro
tect
edar
eas
will
ingn
ess
tose
llst
and
ard
surv
eyin
terv
iew
s48
(100
)ar
eald
ata
des
crip
tive
ind
ivid
ual
’sp
rop
erty
SCP
eye
sn
o
Kn
igh
tet
al.
2010
con
serv
atio
nac
tio
no
np
riva
tela
nd
soci
alva
lues
rela
ted
toco
nse
rvat
ion
succ
ess
and
will
ingn
ess
to colla
bo
rate
stan
dar
dsu
rvey
inte
rvie
ws
48(1
00)
area
ldat
ad
escr
ipti
vein
div
idu
al’s
pro
per
ty
SCP
yes
no
Con
tin
ued
Conservation BiologyVolume 28, No. 6, 2014
Lechner et al. 1505
Tabl
e4.
Cont
inue
d.
Con
serv
ati
on
Soci
al
Da
taSa
mple
Geo
spa
tia
lD
ata
Soci
alda
taSp
ati
alda
taR
efer
ence
aobje
ctiv
esda
taM
eth
od
gath
erin
gsi
ze(%
)bm
eth
od
inte
gra
tion
un
cert
ain
tyc
un
cert
ain
tyc
Kn
igh
tet
al.
2010
con
serv
atio
nac
tio
no
np
riva
tela
nd
will
ingn
ess
tose
llst
and
ard
surv
eyin
terv
iew
s48
area
ldat
ad
escr
ipti
vein
div
idu
al’s
pro
per
ty
SCP
yes
no
Pas
qu
inie
tal
.20
10co
nse
rvat
ion
on
pri
vate
lan
d
will
ingn
ess
tost
ewar
dst
and
ard
surv
eyin
terv
iew
s50
(89)
area
ldat
ad
escr
ipti
vein
div
idu
al’s
pro
per
ty
map
pin
gn
on
o
Ray
mo
nd
&B
row
n20
06id
enti
fyin
gfu
ture
nat
ion
alp
ark
lan
dsc
ape
soci
alva
lues
PP
GIS
mai
lsu
rvey
500
po
int
pat
tern
anal
ysis
ove
rlay
no
yes
Ray
mo
nd
&B
row
n20
11cl
imat
ech
ange
risk
sla
nd
scap
eso
cial
valu
esan
dp
erce
ived
clim
ate
chan
geri
sks
PP
GIS
mai
lsu
rvey
and
wo
rksh
op
375
(61)
po
int
pat
tern
anal
ysis
ove
rlay
yes
no
Ray
mo
nd
etal
.20
09ec
osy
stem
serv
ices
lan
dsc
ape
soci
alva
lues
and
thre
ats
PP
GIS
inte
rvie
ws
54p
oin
tp
atte
rnan
alys
iso
verl
ayye
sn
o
Tyr
vain
enet
al.
2007
op
ensp
ace
valu
esla
nd
scap
eso
cial
valu
esP
PG
ISm
ails
urv
ey42
1(4
2)ar
eald
ata
des
crip
tive
ind
ivid
ual
’sp
rop
erty
map
pin
gye
sn
o
Wh
iteh
ead
etal
.201
4SC
Pw
ith
soci
alan
db
iolo
gica
ld
ata
lan
dsc
ape
soci
alva
lues
PP
GIS
mai
lsu
rvey
395
(40)
po
int
pat
tern
anal
ysis
SCP
yes
no
aSu
pport
ing
Info
rma
tion
for
full
vers
ion
of
refe
ren
ces.
b%
refe
rsto
the
resp
on
sera
te.
c Wh
eth
erpa
per
squ
an
tifi
edor
expli
citl
ya
ddre
ssed
on
eor
more
form
sof
un
cert
ain
ty.
dP
ubli
cpa
rtic
ipa
tion
GIS
.esy
stem
ati
cco
nse
rva
tion
pla
nn
ing
Conservation BiologyVolume 28, No. 6, 2014
1506 Social Data Spatial Uncertainty
geostatistical Kriging techniques to interpolate betweensampled locations to produce a WTP for landscape im-provement surface.
Social Survey Uncertainty
Two-thirds of the studies reviewed (69%) conductedsome kind of assessment of social data uncertainty(Table 4 & Fig. 2a), however, the type of tests useddiffered between studies. Most commonly, studies withlarge sample sizes (PPGIS group) but low to moderateresponse rate assessed the representativeness of the sam-ple size used. Alternatively, those studies that had smallsample sizes (individual property owners group) but com-plete coverage of the targeted group (e.g., total sample)such as Curran et al. (2012) and Knight et al. (2006)tested for internal methodological uncertainty such asconstruct validity (extent to which a test measures whatit is designed to measure) and reliability. Such analysesenabled the systematic identification of different dimen-sions of conservation opportunity, with the view towardapplying and externally validating them in other studyareas. In these studies there is no need to test for samplebias or representativeness as it is assumed that the totalpopulation has been sampled (e.g., all relevant landhold-ers). These smaller studies also tended to have a largernumber of response variables derived from long question-naires and thus have more options for testing constructvalidity. For example, Knight et al.’s (2010) questionnairehad 165 questions that were then reduced to 12 factors.
The PPGIS and choice survey studies had a greaterrange of uncertainty sources because they did not samplethe total population and because they aggregated dataunlike the individual property owners group. The PPGISand choice survey studies commonly tested for exter-nal methodological uncertainty such as respondent bias.However, they did not test for internal methodologicaluncertainty (such as construct validity), most likely due tothe paucity of response data (e.g., short questionnaires)that is a result of the practical difficulty in gatheringmore data using this method. For example, PPGIS tech-niques are commonly conducted at the regional scaleand are more time consuming because survey respon-dents are asked to plot their values on a map. In contrast,the individual property owners group is likely to be morerobust to internal methodological uncertainty becausethis method commonly uses a total sample and has longerquestionnaires (describing multiple constructs with re-dundant questions for the same construct); however, dueto small sample sizes and small extents this method willhave external methodological uncertainty related to thedifficulty in generalizing outside the study area.
Spatial Uncertainty
Uncertainty associated with the creation of elicited SRSdata is dependent on the spatial data types and process-
ing methods used—specifically point data inputs repre-sented spatially as areal data (Table 1 & methods 2, 4,and 5) and areal data derived from statistical analysis(Table 1 & method 3). For geospatial method 1 (Table 1),individual social data are linked to property locationsand the sources of spatial uncertainty are likely to beinsignificant. In contrast, PPGIS methods often start associal value data associated with a point location, whichare then aggregated to a grid. Each geospatial process hasthe potential for uncertainty (Table 3 & Fig. 2b).
In contrast to social data uncertainty only 2 out of 16studies tested for spatial uncertainty (Table 4). Raymondand Brown’s (2006) PPGIS study assessed differences inthe outcome of their analysis depending on whether avector or raster model was used to aggregate the data—an example of testing for issues resulting from the MAUP(and thus the COSP). Campbell et al. (2009) assessed theerror of the Kriging estimates, a common output pro-duced using this type of analysis. The group individualproperty owners is likely to be relatively unaffected byspatial error such as those associated with the COSP be-cause individual respondents provide information abouttheir own property. The COSP does not pose a problembecause no aggregation takes place, but there is potentialfor data quality uncertainty.
Uncertainty Propagation
No study attempted to understand how the uncertainty inthe SRS data propagated (Fig. 2c & 2d). This would haveaffected all studies to varying degrees due to uncertaintyassociated with combining elicited SRS data (Fig. 2c) withother spatial data (Fig. 2d). In many cases, social data wereintegrated with biophysical data (such as biodiversity sur-rogates) through overlaying both data sets and identifyingpatterns in the overlap between biophysical values andsocial values for conservation. Integration with SCP toolswas undertaken in 4 of the papers reviewed includingone PPGIS study and 3 individual property owners groupstudy (Table 4). In each of these cases uncertainty wasnot tested.
Framework for Managing Uncertainty
Based on the typology of elicited SRS data uncertaintyand the literature review, we propose a framework formore effectively managing uncertainty in the productionand use of elicited SRS data. Our framework describes aprocess that can account for the range of geoprocessingmethods and social data types discussed here, but weacknowledge that the technical methods for the manage-ment of uncertainty is often context specific and datadependent.
Our framework presents 2 possible pathways for ad-dressing uncertainty. The first pathway describes themost common currently used approach for addressing
Conservation BiologyVolume 28, No. 6, 2014

Lechner et al. 1507
Figure 3. Process for addressing uncertainty in elicited spatially referenced social (SRS) data: (a) current methodused in producing elicited SRS data and (b) suggested method for dealing with uncertainty (COSP, change ofsupport problem; MAUP, modifiable areal unit problem).
uncertainty (Fig. 3a), but for the second pathway wepropose a new method based on integrating existinggeospatial methods for addressing social survey uncer-tainty (Fig. 3b). The current standard practice in socialscience is assessing fitness for use for methodologicaluncertainty as opposed to quantifying uncertainty andderiving estimates of its distribution (Fig. 3a). The fitnessfor use method rejects data if not up to a standard. Incases where data are not fit for use, more data are ac-quired or research questions may be abandoned. Even ifsome uncertainty is observed (but not beyond levels thatis considered unusable), the data are, in most cases, usedas if they were 100% accurate (Fig. 3a). The assessmentof the levels of uncertainty that are appropriate is alsogenerally expert based.
There were no examples in the papers we reviewedwhere the uncertainty in the social survey was car-ried over into analysis. Yet, two-thirds of the papersreviewed described some kind of assessment of socialsurvey methodological uncertainty (Table 4). This sug-gests those papers assessed fitness for use but ignoredsocial survey uncertainty when projecting the social dataspatially or when using the projected data in furtheranalysis. Furthermore, the standard method for produc-ing and analyzing elicited SRS data issues in most casesfailed to account for any forms of spatial uncertainty suchas data quality, the COSP, and uncertainty propagation(except for 2 of the papers reviewed).
Our proposed process requires that social surveymethodological uncertainty are quantitative (Fig. 3b)
Conservation BiologyVolume 28, No. 6, 2014

1508 Social Data Spatial Uncertainty
rather than only an assessment of fitness for use. Thiswill require social scientists to build on existing methodsfor assessing fitness for use and explicitly quantify un-certainty. There is a need to derive reasonable estimateson the bounds of uncertainty when using social sciencesurvey methods. As such, social survey uncertainty canbe interpreted as a form of data accuracy that can bequantified and addressed using a number of existingmethods within the spatial sciences such as sensitivityanalysis. Importantly, the quantification of uncertaintyallows us to explicitly account for it in conservation plan-ning (Carvalho et al. 2011; Williams & Johnson 2013) andtherefore provides substantial advantages over the fit foruse approach.
Along with the quantification of social survey methoduncertainty, there is a need to address the COSP becauseall spatial processing methods we identified (especiallyprocessing methods 2–4) (Table 2) were commonly pro-jected spatially with arbitrary geographic units that werenot statistically determined (administrative boundaries,catchment boundaries). Uncertainty can then propagateas a result of projecting the social survey data spatially(Fig. 2 & arrow B) and from combining it with otherdata sets that also contain uncertainty (Fig. 2 & arrowA). Figure 3 suggests that social survey uncertainty needsto be tested in conjunction with the COSP effects asthis form of uncertainty will potentially magnify existinguncertainties. Uncertainty also increases with the numberof input data sets and the complexity of models. Finally,along with the output maps of social values or conser-vation priorities, there needs to be a corresponding mapthat describes the spatial distribution of uncertainty.
Quantifying Uncertainty in Social Data
In the social sciences, no procedures have ever beenagreed upon for measuring or estimating methodologicaluncertainty; however, a lot is known about how to mini-mize methodological uncertainty (see above and Support-ing Information). For example, internal methodologicaluncertainty can be addressed through appropriate vali-dation of measures whereas external methodological un-certainty can be reduced through appropriate samplingand the development of social science theory. Figure 3clearly illustrates the need for the employment of specifictests of internal and external methodological uncertaintyon the social data to derive the quantitative estimatesthat can be assessed within an analysis using accuracyassessment methods. The development of these methodsis a fertile ground for further research and will allowfor the quantification of uncertainty arising from thesesources.
Estimating and Addressing Uncertainty
Depending on the social data, biophysical data, andgeospatial methods, there are numerous approaches for
addressing uncertainty. Methods for addressing specificforms of uncertainty are outlined in Supporting Infor-mation; however, a common method for quantifyingall forms of uncertainty involves testing the contribu-tion of varying model inputs (such as mapped datalayers) to variation in the model output, known as sensi-tivity and uncertainty analysis. These methods can beused for testing all forms of mapping and modelinguncertainty (Crosetto et al. 2000). A common approachfor spatial data is to use Monte Carlo simulation methodswhereby each uncertainty source is treated as having aprobability density function (PDF) with a known meanand variance for each spatial object (e.g., point, pixel orarea), then values are randomly drawing from the PDFand the analysis is rerun with different values for eachspatial object to produce confidence bounds (Burrough& McDonnell 1998). Variations on this method includetesting for the interaction of uncertainty sources (Saltelli& Annoni 2010) and modeling error in more realisticways by incorporating the spatial distribution of error(Congalton 1988; Heuvelink 2002). Such methods couldbe used to develop confidence bounds for social dataprior to integration with biophysical data. The inclusionof quantified social uncertainties through this method(or similar) within elicited SRS data analysis is the fun-damental difference between current approaches usedin the studies we reviewed and our proposed approach(Fig. 3).
Testing for the COSP sensitivity in the creation ofelicited SRS data or combining elicited SRS data withina model can be achieved by simulating multiple zoningand scale configurations. This method is a useful first step;however, it is difficult to test for the COSP in a probabilis-tic way because there are infinite ways to modify spatialboundaries or aggregate data, thus more sophisticatedapproaches may potentially be used. Testing for this kindof uncertainty should be done for most elicited SRS map-ping tasks (except for individual property data) and forall studies that integrate these data with biophysical data.
In many cases, complex methods will be required ifa sensitivity analysis demonstrates high levels of scaledependent uncertainty. Some of these methods for ad-dressing uncertainty are specific to one of the 4 differentgeospatial processing methods and some are more gener-ally applicable. A summary of potential methods that canbe applied for addressing specific kinds of the COSP canbe found in Table 4 and Supporting Information. Thesemethods range from geostatistical treatments (Gotway& Young 2002) to use of cross-classification with othersociodemographic variables (e.g., sex, race) to addressthe ecological inference problem (King 1997).
Implications of Uncertainty
In conservation, decisions need to be made even whenuncertainty is large. Yet, if these uncertainties can be
Conservation BiologyVolume 28, No. 6, 2014

Lechner et al. 1509
quantified, decision theoretic approaches can be used todeal with them. Building on previous enquiry (Burgmanet al. 2005), we argue the explicit treatment of spatialuncertainty in SRS data needs to become routine andshould use the approach outlined in Fig. 3(b) instead ofthe current fitness for use approach (e.g., Fig. 3a). Thechoice of the methods used for including social data andassessing uncertainty within conservation planning willdepend on resources, the complexity of the study area,and its size. However, addressing spatial uncertainty anduncertainty propagation is rarely undertaken and can bechallenging for workers without significant expertise inGIS, statistics, and writing source code (Heuvelink 2002;Devillers et al. 2010). For example, it is rare for a mapto explicitly represent uncertainty in spatial data (Schmitet al. 2006). The difficulty of addressing uncertainty iscompounded by numerous forms of uncertainty that havebeen identified, making it challenging to analyze the con-sequences of each (King et al. 2004; Chen 2008; Devillerset al. 2010; Lechner et al. 2012a).
Uncertainty associated with SRS data should be rigor-ously assessed to ensure that the benefits of includingsocial data into conservation planning outweigh the im-pact of adding additional sources of uncertainty. Existingliterature on SCP indicates that the most variable dataincluded will tend to drive the conservation prioritiesidentified and this is most commonly the socioeconomicdata (Ferraro 2003; Bode et al. 2008). However, giventhat existing uncertainties associated with spatial data asSCP inputs are often not adequately dealt with (Viscontiet al. 2010; Langford et al. 2011), it is important to weighup the benefits and costs of incorporating this uncertainSRS data into conservation planning (Tulloch et al. 2014[this issue]).
Value of information theory can be used to explicitlyevaluate the degree to which the current SRS data (oradditional SRS data) will reduce uncertainty and improveconservation decisions (Raiffa & Schlaifer 2000; Yokota& Thompson 2004; Forsberg & Guttormsen 2006). So-cial data are collected with the expectation they willreduce uncertainty about cost, feasibility, and opportu-nities. However, if cost of collecting that data exceedsthe value of that information because uncertainty levelsare high, it may be better to not invest in that social data.Quantifying uncertainty in SRS data and then undertakinga value of information analysis can help us make this de-cision from a conservation planning perspective. Most ofthe papers in the peer reviewed literature on SRS data aretheoretical in nature, and it is not yet possible to assesswhether the inclusion of social data have made planningmore implementable.
When seeking to apply the uncertainty measurementsderived from the process outlined in Fig. 3(b), conser-vation planners should consider how this uncertaintyintersects with biological priorities. It is useful to con-sider SRS data uncertainty through a framework of error
types analogous to Type I and Type II statistical errors.Type I errors (false positives) occur when SRS data indi-cate that conservation actions are feasible, when in factthey are not. Type II errors (false negatives) occur whenSRS data indicate that conservation actions are not fea-sible, when in fact they are. Uncertainties that result infalse negatives are more costly in terms of unsuccessfulconservation actions, especially in areas of high biologicalpriority. False positives may conversely result in ineffi-cient use of resources. Conservation practitioners shouldtherefore prioritize ground truthing to account for thelikely impacts of these different types of errors and beguided by spatially explicit maps of SRS data uncertainty(Fig. 3b).
It is also important to compare alternative approachesto including the social dimension of conservation plan-ning such as land use modeling and participatoryapproaches (Fig. 1). Participatory approaches to conser-vation planning may explicitly account for social valuesin conservation as a substitute for a spatial analysis wherethe focus is on the decision making process and buildingrelationships rather than a final output from a model.For example, collective bargaining of the final locationof protected areas (e.g., Game et al. 2011) may be amore effective way to ensure protected areas are im-plemented than selecting areas based on their predictedsocial acceptability (e.g., quantifying willingness to pro-tect). However, this type of participatory planning maynot be realistic for larger planning regions, where thenumber and diversity of stakeholders may make it toodifficult to negotiate consensus.
Future Research
The inclusion of elicited SRS data in conservation plan-ning is a new and promising area of research that allowsconservation planners to consider conservation opportu-nity. However, the dynamic nature of social systems, in-cluding their susceptibility to external shocks, can resultin high level of uncertainty in SRS data, as we show here.Although ecological systems are also dynamic, social sys-tems have the potential for very rapid change, for ex-ample, when new information becomes available. Whencombining SRS data and biophysical data, the potential foruncertainty propagation is very real. Failure to explicitlyaccount for this uncertainty could result in erroneousconservation priorities and feasibility of implementationcould be reduced, counter to the desired outcomes frominclusion of the SRS data. Our typology for assessing SRSdata uncertainty and the process we devised for moreeffectively managing uncertainty issues in conservationplanning studies begin to address these concerns. Futureresearch should explicitly consider whether inclusionof elicited SRS data has achieved desired outcomes of
Conservation BiologyVolume 28, No. 6, 2014
1510 Social Data Spatial Uncertainty
making conservation planning more implementable or ifuncertainty outweighs the benefits of including SRS data.
Acknowledgments
This work was supported by the Australian Government’sNational Environmental Research Program throughthe Landscapes & Policy Research Hub and theEnvironmental Decisions Hub. Additional support wasprovided through the ARC Centre of Excellence forEnvironmental Decisions.
Supporting Information
A version of Fig. 1 with examples (Appendix S1), anextended definition of uncertainty (Appendix S2), spatialdata graphical examples for Fig. 2 (Appendix S3), ex-tended discussions of social data uncertainty (AppendixS4) and spatial uncertainty associated with projectingSRS data (Appendix S5), review criteria and methods(Appendix S6), and complete references for Table 4 (Ap-pendix S7) are available on-line. The authors are solelyresponsible for the content and functionality of thesematerials. Queries (other than absence of the material)should be directed to the corresponding author.
Literature Cited
Adamowicz, W. L. 2004. What’s it worth? An examination of historicaltrends and future directions in environmental valuation. AustralianJournal of Agricultural and Resource Economics 48:419–443.
Aspinall, J., and D. M. Pearson. 1996. Data quality and spatial analysis:analytical use of GIS for ecological modelling. Pages 35–38 in M. F.Goodchild, L. T. Steyaert, and B. O. Parks, editors. GIS and environ-mental modelling: progress and research issues. GIS World Books,Fort Collins, Colorado.
Babbie, E. 2007. The practice of social research. Thomson Wadsworth,Belmont.
Bode, M., K. A. Wilson, T. M. Brooks, W. R. Turner, R. A. Mittermeier,M. F. McBride, E. C. Underwood, and H. P. Possingham. 2008.Cost-effective global conservation spending is robust to taxonomicgroup. Proceedings of the National Academy of Sciences 105:6498–6501.
Brouwer, R., J. Martin-Ortega, and J. Berbel. 2010. Spatial preferenceheterogeneity: a choice experiment. Land Economics 86:552–568.
Brown, G. 2005. Mapping spatial attributes in survey research for nat-ural resource management: methods and applications. Society andNatural Resources 18:17–39.
Brown, G. 2012. Public participation GIS (PPGIS) for regional and envi-ronmental planning: reflections on a decade of empirical research.URISA Journal 24:7–18.
Brown, G., C. Smith, L. Alessa, and A. Kliskey. 2004. A comparison ofperceptions of biological value with scientific assessment of biolog-ical importance. Applied Geography 24:161–180.
Brown, G. G., and S. Donovan. 2013. Escaping the national forest plan-ning quagmire: using public participation GIS to assess acceptablenational forest use. Journal of Forestry 111:115–125.
Bryan, B. A., C. M. Raymond, N. D. Crossman, and D. H. Macdonald.2010. Targeting the management of ecosystem services based onsocial values: Where, what, and how? Landscape and Urban Planning97:111–122.
Bryan, B. A., C. M. Raymond, N. D. Crossman, and D. King. 2011.Comparing spatially explicit ecological and social values for natu-ral areas to identify effective conservation strategies. ConservationBiology 25(1):172–181.
Burgman, M. A., D. B. Lindenmayer, and J. Elith. 2005. Managing land-scapes for conservation under uncertainty. Ecology 86:2007–2017.
Burrough, P. A., and R. A. McDonnell. 1998. Principles of geographicalinformation systems. Oxford University Press, Oxford.
Campbell, D., W. G. Hutchinson, and R. Scarpa. 2009. Using choiceexperiments to explore the spatial distribution of willingness topay for rural landscape improvements. Environment and PlanningA 41:97–111.
Carvalho, S. B., J. C. Brito, E. G. Crespo, M. E. Watts, and H. P. Possing-ham. 2011. Conservation planning under climate change: towardaccounting for uncertainty in predicted species distributions to in-crease confidence in conservation investments in space and time.Biological Conservation 144:2020–2030.
Chen, J. 2008. Ecological modelling and perspectives of forest land-scapes. Pages 265–270 in R. Lafortezza, G. Sanesi, J. Chen, and T. R.Crow, editors. Patterns and processes in forest landscapes. Springer,Netherlands.
Congalton, R. G. 1988. Using spatial auto-correlation analysis to explorethe errors in maps generated from remotely sensed data. Photogram-metric Engineering and Remote Sensing 54:587–592.
Crosetto, M., S. Tarantola, and A. Saltelli. 2000. Sensitivity and un-certainty analysis in spatial modelling based on GIS. Agriculture,Ecosystems and Environment 81:71–79.
Curran, P., D. Smedley, P. Thompson, and A. T. Knight. 2012. Mappingrestoration opportunity for collaborating with land managers in acarbon credit-funded restoration program in the Makana Municipal-ity, Eastern Cape, South Africa. Restoration Ecology 20:56–64.
Curtis, A., I. Byron, and J. MacKay. 2005. Integrating socio-economicand biophysical data to underpin collaborative watershed manage-ment. Journal of the American Water Resources Association 41:549–563.
Devillers, R., A. Stein, Y. Bedard, N. Chrisman, P. Fisher, and W. Shi.2010. Thirty years of research on spatial data quality: achievements,failures, and opportunities. Transactions in GIS 14:387–400.
Devillers, R., and R. Jeansoulin. 2010. Fundamentals of spatial dataquality. Wiley, Hoboken.
Dungan, J. L., J. N. Perry, M. R. T. Dale, P. Legendre, S. Citron-Pousty,M.-J. Fortin, A. Jakomulska, M. Miriti, and M. S. Rosenberg. 2002.A balanced view of scale in spatial statistical analysis. Ecography25:626–640.
Elith, J., M. A. Burgman, and H. M. Regan. 2002. Mapping epistemicuncertainties and vague concepts in predictions of species distribu-tion. Ecological Modelling 157:313–329.
Ferraro, P. J. 2003. Assigning priority to environmental policy inter-ventions in a heterogeneous world. Journal of Policy Analysis andManagement 22:27–43.
Forsberg, O. I., and A. G. Guttormsen. 2006. The value of informa-tion in salmon farming. Harvesting the right fish at the right time.Aquaculture Economics and Management 10:183–200.
Game, E. T., G. Lipsett-Moore, R. Hamilton, N. Peterson, J. Kereseka, W.Atu, M. Watts, and H. Possingham. 2011. Informed opportunism forconservation planning in the Solomon Islands. Conservation Letters4:38–46.
Gergel, S., Y. Stange, N. Coops, K. Johansen, and K. Kirby. 2007. Whatis the value of a good map? An example using high spatial resolutionimagery to aid riparian restoration. Ecosystems 10:688–702.
Goldberg, C. S., A. Pocewicz, M. Nielsen-Pincus, L. P. Waits, P. Morgan, J.E. Force, and L. A. Vierling. 2011. Predictions of ecological and socialimpacts of alternative residential development policies to inform
Conservation BiologyVolume 28, No. 6, 2014
Lechner et al. 1511
decision making in a rural landscape. Conservation Letters 4(6):423–432.
Gotway, C. A., and L. J. Young. 2002. Combining incompatible spatialdata. Journal of the American Statistical Association 97:632–648.
Guerrero, A. M., A. T. Knight, H. S. Grantham, R. M. Cowling, andK. A. Wilson. 2010. Predicting willingness-to-sell and its utility forassessing conservation opportunity for expanding protected areanetworks. Conservation Letters 3:332–339.
Hair, J. F., W. C. Black, B. J. Babin, and R. E. Anderson. 2009. Multivariatedata analysis. 7th edition. Pearson Prentice Hall, New Jersey.
Hanley, N., R. E. Wright, and V. Adamowicz. 1998. Using choice ex-periments to value the environment: design issues, current experi-ence and future prospects. Environmental and Resource Economics11:413–428.
Haslam, S. A., and C. McGarty. 2001. A 100 years of certitude? Socialpsychology, the experimental method and the management of sci-entific uncertainty. British Journal of Social Psychology 40:1–21.
Heuvelink, G. B. M. 2002. Analysing uncertainty propagation in GIS:Why is it not that simple? Pages 155–165 in G. M. Foody and P.M. Atkinson, editors. Uncertainty in remote sensing and GIS. JohnWiley & Sons, West Sussex.
Heuvelink, G. B. M., P. A. Burrough, and A. Stein. 1989. Propagation oferrors in spatial modelling with GIS. International Journal of Geo-graphical Information Science 3:303–322.
Jelinski, D., and J. Wu. 1996. The modifiable areal unit problem andimplications for landscape ecology. Landscape Ecology 11:129–140.
King, G. 1997. A solution to the ecological inference problem. PrincetonUniversity Press, Princeton, NJ.
King, G., O. Rosen, M. Tanner, G. King, O. Rosen, and M. A.Tanner. 2004. Ecological inference: new methodological strategies.Cambridge University Press, New York.
Knight, A. T., R. M. Cowling, and B. M. Campbell. 2006. An operationalmodel for implementing conservation action. Conservation Biology20:408–419.
Knight, A. T., R. M. Cowling, M. Difford, and B. M. Campbell. 2010. Map-ping human and social dimensions of conservation opportunity forthe scheduling of conservation action on private land. ConservationBiology 24:1348–1358.
Langford, W. T., A. Gordon, L. Bastin, S. A. Bekessy, M. D. White, and G.Newell. 2011. Raising the bar for systematic conservation planning.Trends in Ecology and Evolution 26:634–640.
Lechner, A. M., K. J. Reinke, Y. Wang, and L. Bastin. 2013. Interactionsbetween landcover pattern and geospatial processing methods: ef-fects on landscape metrics and classification accuracy. EcologicalComplexity 15:71–82.
Lechner, A. M., W. T. Langford, S. A. Bekessy, and S. D. Jones. 2012a. Arelandscape ecologists addressing uncertainty in their remote sensingdata? Landscape Ecology 27:1249–1261.
Lechner, A. M., W. T. Langford, S. D. Jones, S. A. Bekessy, and A. Gordon.2012b. Investigating species-environment relationships at multiplescales: differentiating between intrinsic scale and the modifiableareal unit problem. Ecological Complexity 11:91–102.
Lesslie, R. 2012. Mapping our priorities—innovation in spatial decisionsupport. Pages 156–163 in P. Figgis, J. Fitzsimon, and J. Irving,editors. Innovation for 21st century conservation. Australian Com-mittee for IUCN, Thebarton, South Australia.
Mills, M., R. Pressey, N. Ban, S. Foale, A. Knight, and S. Aswani. 2013.Understanding characteristics that define the feasibility of conserva-tion actions in a common pool marine resource governance system.Conservation Letters 6:418–429.
Moilanen, A., L. Meller, J. Leppanen, A. Arponen, and H. Kujala. 2011.Spatial conservation planning framework and software Zonation.
Version 3.0. User manual. University of Helsinki, Department ofBioscience, Helsinki.
Openshaw, S. 1984. The modifiable areal unit problem. Concepts andtechniques in modern geography 38. Geobooks, Norwich, UnitedKingdom.
Pasquini, L., C. Twyman, and J. Wainwright. 2010. Toward a concep-tual framework for blending social and biophysical attributes inconservation planning: a case-study of privately-conserved lands.Environmental Management 46:659–670.
Polyakov, M., D. J. Pannell, R. Pandit, S. Tapsuwan, and G. Park. 2015.Capitalized amenity value of native vegetation in a multifunctionalrural landscape. American Journal of Agricultural Economics. DOI:10.1093/ajae/aau053.
Raiffa, H., and R. Schlaifer. 2000. Applied statistical decision theory.Graduate School of Business Administration, Harvard University,Cambridge, Massachusetts.
Raymond, C. M., B. A. Bryan, D. H. MacDonald, A. Cast, S. Strathearn,A. Grandgirard, and T. Kalivas. 2009. Mapping community valuesfor natural capital and ecosystem services. Ecological Economics68:1301–1315.
Raymond, C., and G. Brown. 2006. A method for assessing protectedarea allocations using a typology of landscape values. Journal ofEnvironmental Planning and Management 49:797–812.
Raymond, C. M., and G. Brown. 2011. Assessing conservationopportunity on private land: socio-economic, behavioral, andspatial dimensions. Journal of Environmental Management 92:2513–2523.
Rocchini, D., et al. 2012. Uncertainty in ecosystem mapping by remotesensing. Computers and Geosciences 39:145–151.
Saltelli, A., and P. Annoni. 2010. How to avoid a perfunctory sensitivityanalysis. Environmental Modelling & Software 25:1508–1517.
Schmit, C., M. D. A. Rounsevell, and I. La Jeunesse. 2006. The limitationsof spatial land use data in environmental analysis. EnvironmentalScience & Policy 9:174–188.
Shi, W. 2010. Principles of modeling uncertainties in spatial data andspatial analyses. CRC Press, Boca Raton, FL.
Tulloch, A. I. T., V. Tulloch McShane, M. C. Evans, and M. Mills. 2014.Learning from the past to inform the future: how valuable are modelsof management feasibility. Conservation Biology 28: in press.
Tyrvainen, L., K. Makinen, and J. Schipperijn. 2007. Tools for mappingsocial values of urban woodlands and other green areas. Landscapeand Urban Planning 79(1):5–19.
Van Berkel, D. B., and P. H. Verburg. 2014. Spatial quantification andvaluation of cultural ecosystem services in an agricultural landscape.Ecological Indicators 37:163–174.
Visconti, P., R. L. Pressey, M. Bode, and D. B. Segan. 2010. Habitat vul-nerability in conservation planning-when it matters and how much.Conservation Letters 3:404–414.
Whitehead, A. L., H. Kujala, C. D. Ives, A. Gordon, P. E. Lentini, B.A. Wintle, E. Nicholson, and C. M. Raymond. 2014. Integratingbiological and social values when prioritizing places for biodi-versity conservation. Conservation Biology 28(4):992–1003. DOI:10.1111/cobi.12257.
Williams, B. K., and F. A. Johnson. 2013. Confronting dynamics anduncertainty in optimal decision making for conservation. Environ-mental Research Letters 8. DOI:10.1088/1748-9326/8/2/025004.
Wu, J., W. Gao, and P. T. Tueller. 1997. Effects of changing spatial scaleon the results of statistical analysis with landscape data: a case study.Geographic Information Sciences 3:30–41.
Yokota, F., and K. M. Thompson. 2004. Value of information literatureanalysis: a review of applications in health risk management. MedicalDecision Making 24:287–298.
Conservation BiologyVolume 28, No. 6, 2014