Characterization of the Structure and Function of a New Mitogen-activated Protein Kinase (p38beta
11
Characterization of structure and function of the mouse retina using pattern electroretinography, pupil light reflex, and optical coherence tomography Kabhilan Mohan,* , † Matthew M. Harper,* Helga Kecova,* Eun-Ah Ye,‡ Tatjana Lazic,* Donald S. Sakaguchi,* , ‡ Randy H. Kardon* , § and Sinisa D. Grozdanic– CR: BioMed Vision Technologies, Neuroptics Inc. *Iowa City Department of Veterans Affairs Center for Prevention and Treatment of Vision Loss, Iowa City, IA 52246-2209, USA; †Department of Biomedical Sciences, Iowa State University, Ames, IA, USA; ‡Genetics Development and Cell Biology, Iowa State University, Ames, IA, USA; §Department of Ophthalmology and Visual Sciences, University of Iowa, Iowa City, IA, USA; and –Eastern Iowa Veterinary Specialty Center, Cedar Rapids, IA 52404, USA Address communications to: M. Harper and S. Grozdanic Tel.: (319) 339-7151 Fax: (319) 887-4993 e-mails: matthew.harper@va. gov, [email protected] Abstract Objective To perform in vivo analysis of retinal functional and structural parameters in healthy mouse eyes. Animal Studied Adult C57BL/6 male mice (n = 37). Procedures Retinal function was evaluated using pattern electroretinography (pERG) and the chromatic pupil light reflex (cPLR). Structural properties of the retina and nerve fiber layer (NFL) were evaluated using spectral-domain optical coherence tomography (SD-OCT). Results The average pERG amplitudes were found to be 11.2 ± 0.7 lV (P50-N95, mean ± SEM), with an implicit time for P50-N95 interval of 90.4 ± 5.4 ms. Total retinal thickness was 229.5 ± 1.7 lm (mean ± SEM) in the area centralis region. The thickness of the retinal nerve fiber layer (mean ± SEM) using a circular peripapillary retinal scan centered on the optic nerve was 46.7 ± 0.9 lm (temporal), 46.1 ± 0.9 lm (superior), 45.8 ± 0.9 lm (nasal), and 48.4 ± 1 lm (inferior). The baseline pupil diameter was 2.1 ± 0.05 mm in darkness, and 1.1 ± 0.05 and 0.56 ± 0.03 mm after stimulation with red (630 nm, luminance 200 kcd/m 2 ) or blue (480 nm, luminance 200 kcd/m 2 ) light illumination, respectively. Conclusions Pattern electroretinography, cPLR and SD-OCT analysis are reproducible techniques, which can provide important information about retinal and optic nerve function and structure in mice. Key Words: mouse, OCT, pERG, pupil, retina INTRODUCTION Noninvasive functional and structural assays such as electro- retinography (ERG) and optical coherence tomography (OCT) can be utilized in animal models to obtain objective information regarding the status of the retina and optic nerve in vivo. 1–3 These techniques allow repeated analysis without the need to euthanize the animal and can be effec- tively used for longitudinal evaluation of disease progression or treatment efficacy. The function of retinal ganglion cells (RGCs) in rodents can be measured by recording the amplitude and latency of the pattern-evoked electroretino- gram (pERG). 4–12 The pERG response is a result of RGCs depolarization 13,14 with minimal glial cell contributions, 15 which can be abolished by optic nerve transection 16,17 or pharmacological blockade targeting RGC action potential activity. 13 Considering that the electrical response originates from RGCs, pERG has been used to evaluate RGC damage associated with glaucoma and ocular hypertension in human patients 18–20 and in different animal models. 21–23 The chromatic pupil light response (cPLR) analysis is a relatively new diagnostic technique, which may provide information about the quality of rod-cone activity, rod- cone-mediated electrical signal transmission to RGCs and characteristics of an intrinsically photosensitive subpopu- lation of RGCs (ipRGCs) containing the pigment Ó 2012 American College of Veterinary Ophthalmologists Veterinary Ophthalmology (2012) 15, Supplement 2, 94–104 DOI:10.1111/j.1463-5224.2012.01034.x
-
Upload
independent -
Category
Documents
-
view
7 -
download
0
Transcript of Characterization of the Structure and Function of a New Mitogen-activated Protein Kinase (p38beta

Characterization of structure and function of the mouse retinausing pattern electroretinography, pupil light reflex, and opticalcoherence tomography
Kabhilan Mohan,*,† Matthew M. Harper,* Helga Kecova,* Eun-Ah Ye,‡ Tatjana Lazic,* Donald S.Sakaguchi,*,‡ Randy H. Kardon*,§ and Sinisa D. Grozdanic– CR: BioMed Vision Technologies,Neuroptics Inc.*Iowa City Department of Veterans Affairs Center for Prevention and Treatment of Vision Loss, Iowa City, IA 52246-2209, USA; †Department of
Biomedical Sciences, Iowa State University, Ames, IA, USA; ‡Genetics Development and Cell Biology, Iowa State University, Ames, IA, USA; §Department
of Ophthalmology and Visual Sciences, University of Iowa, Iowa City, IA, USA; and –Eastern Iowa Veterinary Specialty Center, Cedar Rapids, IA 52404,
USA
Address communications to:
M. Harper and S. Grozdanic
Tel.: (319) 339-7151
Fax: (319) 887-4993
e-mails: matthew.harper@va.
gov, [email protected]
AbstractObjective To perform in vivo analysis of retinal functional and structural parameters inhealthy mouse eyes.
Animal Studied Adult C57BL/6 male mice (n = 37).Procedures Retinal function was evaluated using pattern electroretinography (pERG)
and the chromatic pupil light reflex (cPLR). Structural properties of the retina andnerve fiber layer (NFL) were evaluated using spectral-domain optical coherencetomography (SD-OCT).
Results The average pERG amplitudes were found to be 11.2 ± 0.7 lV (P50-N95,mean ± SEM), with an implicit time for P50-N95 interval of 90.4 ± 5.4 ms. Total
retinal thickness was 229.5 ± 1.7 lm (mean ± SEM) in the area centralis region. Thethickness of the retinal nerve fiber layer (mean ± SEM) using a circular peripapillary
retinal scan centered on the optic nerve was 46.7 ± 0.9 lm (temporal), 46.1 ± 0.9 lm(superior), 45.8 ± 0.9 lm (nasal), and 48.4 ± 1 lm (inferior). The baseline pupil
diameter was 2.1 ± 0.05 mm in darkness, and 1.1 ± 0.05 and 0.56 ± 0.03 mm afterstimulation with red (630 nm, luminance 200 kcd/m2) or blue (480 nm, luminance200 kcd/m2) light illumination, respectively.
Conclusions Pattern electroretinography, cPLR and SD-OCT analysis are reproducibletechniques, which can provide important information about retinal and optic nerve
function and structure in mice.
Key Words: mouse, OCT, pERG, pupil, retina
INTRODUCTION
Noninvasive functional and structural assays such as electro-retinography (ERG) and optical coherence tomography(OCT) can be utilized in animal models to obtain objectiveinformation regarding the status of the retina and opticnerve in vivo.1–3 These techniques allow repeated analysiswithout the need to euthanize the animal and can be effec-tively used for longitudinal evaluation of disease progressionor treatment efficacy. The function of retinal ganglion cells(RGCs) in rodents can be measured by recording theamplitude and latency of the pattern-evoked electroretino-gram (pERG).4–12 The pERG response is a result of RGCs
depolarization13,14 with minimal glial cell contributions,15
which can be abolished by optic nerve transection16,17 orpharmacological blockade targeting RGC action potentialactivity.13 Considering that the electrical response originatesfrom RGCs, pERG has been used to evaluate RGC damageassociated with glaucoma and ocular hypertension in humanpatients18–20 and in different animal models.21–23
The chromatic pupil light response (cPLR) analysis is arelatively new diagnostic technique, which may provideinformation about the quality of rod-cone activity, rod-cone-mediated electrical signal transmission to RGCs andcharacteristics of an intrinsically photosensitive subpopu-lation of RGCs (ipRGCs) containing the pigment
� 2012 American College of Veterinary Ophthalmologists
Veterinary Ophthalmology (2012) 15, Supplement 2, 94–104 DOI:10.1111/j.1463-5224.2012.01034.x

melanopsin.24–30 Recent reviews have excellentlydescribed the anatomy of ipRGCs and have summarizedtheir role in mediating various functional properties.31–34
Stimulation of the retina with red (630 nm) light activatesstrictly rod-cone-mediated pupil light response, withoutactivation of melanopsin-mediated responses.24 Thedegree of contribution of rods vs. cones depends onthe state of retinal adaptation, the spectral sensitivity ofthe photoreceptors in the species being studied, and thebrightness of the light. The rod-cone-mediated pupilresponse requires six components: (i) normal functioningrods and cones and their respective neurons in the innernuclear layer, (ii) functional and well-organized dendriticarborization of ipRGCs to allow for a rod-cone generatedelectrical response to be transmitted to the ipRGCs thatresults in a generation of PLR responses, (iii) functionalaxons of ipRGCs to transmit the electrical information tothe pretectal brain regions mediating the PLR and phot-opic blink responses, (iv) normal status of the pretectalolivary nucleus as a brain interneuron relay station formediating the PLR to both Edinger-Westphal Nuclei, (v)intact pre- and post-ganglionic parasympathetic nervepathway (oculomotor nerve) as an efferent pathway formediation of PLR response, and (vi) an intact iris sphinc-ter as an effector organ. Stimulation of the retina withbright blue (480 nm) light can activate both a rod-cone-mediated pupil response and a pupil response that is elic-ited by activation of the melanopsin in ipRGCs.3,25,35–37
However, the melanopsin activated pupil response is typi-cally more sustained after light termination.
Spectral-domain optical coherence tomography (SD-OCT) is a high-resolution imaging technique used fordirect in vivo analysis of retina and optic nerve headstructure.38–40 Recent studies have demonstrated thatOCT analysis of retinal thickness provides nearly identi-cal values compared with analysis of the same retinalregions using position-matched histological analysis.41
Different OCT segmentation protocols allow for themeasurement of total retina thickness, photoreceptor layerthickness, and thickness of the retinal nerve fiber layer(RNFL) in different retinal quadrants.42–46 Recent utiliza-tion of OCT technology in rodent models of eye diseaseshas provided an objective measure of retinal structure,which can be used to monitor the structural effects of dis-ease progression or treatment response.45–49
The principal objective of this study was to perform adetailed characterization of RGC functional and structuralparameters with the goal of establishing normative data foradult healthy C57BL/6 mice as a basis for further investi-gations by us and others on the experimental effects of reti-nal and optic nerve disorders and their treatment. In thisstudy, we used pERG and cPLR analyses to evaluate theretinal function, and particularly RGC function, while SD-OCT was used to provide structural information about theretina, photoreceptor layer, and RNFL thickness.
MATERIALS AND METHODS
AnimalsAll animal studies were conducted in accordance with theARVO Statement for the Use of Animals in Ophthalmic andVision Research and had the approval of the Iowa State Uni-versity and VA Medical Center-Iowa City Institutional Ani-mal Care and Use Committees. A total of 37 adult healthymale C57BL/6 mice (8–12 weeks of age, unless otherwisespecified) were used for the purpose of this study.
Pattern electroretinographyPattern-evoked electroretinography (pERG) was used toobjectively measure the function of the RGCs byrecording the amplitude and latency of the pERG wave-form. Mice (n = 37) were anesthetized with 0.8 L/minO2, 0.4 L/min nitrous oxide, and 3.5% halothane. Afteranesthesia induction, the halothane concentration wasdecreased to 1.75% and mice were placed on a stainlesssteel recording table equipped with an internal circulat-ing hot-water-based warming system (maintained at39 �C) to maintain body temperature. The mice werepositioned 20 cm from the stimulus monitor with theirbody angle tilted at 45 degrees to provide direct expo-sure of the stimulus to the visual axis of the recordedeye. The pupil was then dilated using 1% tropicamidesolution (Tropicamide; Falcon Pharmaceuticals, FortWorth, TX, USA). Pattern ERG responses were evokedusing alternating, reversing, black and white verticalstimuli delivered on a monitor (Fig. 1a) with a RolandConsult ERG system (Roland Consult, Brandenburg,Germany). To record the pERG response, commerciallyavailable mouse corneal gold ring electrodes were used(S&V Technologies AG, Hennigsdorf, Germany). A ref-erence needle electrode was placed at the base of thehead, and a ground electrode was placed at the base ofthe tail to complete the circuit. Each animal was placedat the same fixed position in front of the monitor toprevent recording variability because of animal place-ment. Stimuli (9� radius visual angle subtended on fullfield pattern, 1 Hz temporal frequency, 0.05 cycles/degspatial frequency, 97% contrast, 80 cd/m2 monitor lumi-nance, and 200 averaged signals with cut-off filter fre-quencies of 1–30 Hz) were delivered under photopicconditions, because slower stimulation rates in mesopicand scotopic conditions can elicit rod-mediated full fieldERG responses, which can completely conceal thepERG response. Retinal pERG responses were evaluatedby measuring the amplitudes (N35-P50 and P50-N95)and respective implicit times (Fig. 2). Implicit timeswere calculated for N35, P50, and N95 markers, inaddition to the implicit time for N35-P50 and P50-N95components. Seven mice were repeatedly recorded at 3,11, and 15 months of age to determine whether aginghas any effect on pERG amplitudes or implicit times.
m o u s e r e t i n a l g a n g l i o n c e l l f u n c t i o n a n d s t r u c t u r e 95
� 2012 American College of Veterinary Ophthalmologists, Veterinary Ophthalmology, 15, 94–104

Chromatic pupillographyChromatic pupil light reflex (PLR) was characterized inmice (n = 8) using the A2000 COMPUTERIZED PUPILLOMETER
(Neuroptics, San Clemente, CA, USA). The pupillometerconsists of a sensitive pupil tracking software, which can beprogrammed to include various PLR recording routines andcan provide the required red/blue light illumination. Redlight of 630 nm was used to elicit strictly rod-cone-mediatedPLR, as red light of 630 nm wavelength does not activatethe intrinsic RGC photopigment melanopsin (Fig. 5). Bluelight was used to elicit combined responses (rod-coneresponse + melanopsin intrinsic response). The wavelengthof light emitted by the diodes was 622 ± 7 nm for red lightand 463 ± 13 nm for blue light. Red and blue light stimuliwere matched and had illuminance of 1 (0 log units), 4(0.6 log units), 16 (1.2 log units), 63 (1.8 log units), 251(2.4 log units), and 1000 (3 log units) lux. The maximumluminance measured at the position of the mouse eye using aphotometer (J17LumaColor with luminance head modelJ1803; Tektronix, Wilsonville, OR, USA) was 3700 cd/m2
for the illuminance of 1000 lux. The pupil was illuminatedfor a period of 500 ms. All PLR testing routines wererecorded in completely awake mouse without the use of gen-eral anesthetic or sedation. The mice were initially habitu-ated to extensive handling with food rewards, in order forthem to remain calm during recording. The experimentswere then carried out under scotopic conditions with nobackground illumination from the pupillometer. Only the
direct response of the pupil was observed following illumi-nation with red/blue light stimulus. The pupil response wasexpressed as the percent contraction of the pupil frombaseline.
To evaluate pupil responses with much higher light inten-sity, the PLR analysis was performed using a Melan-100instrument (BioMed Vision Technologies, Ames, IA, USA).Similar as before, mice (n = 11) were awake during therecording session and were held still using minimal manualrestraint. Recording sessions in most animals lasted <1 min.The Melan-100 (BioMed Vision Technologies) has twopowerful diode-based light sources with very narrow wave-length bands (630 ± 5 nm for red light, luminance 200 kcd/m2; 475 ± 5 nm for the blue light, luminance 200 kcd/m2).Baseline pupil diameter measurements in mice were taken indarkness prior to illumination using an infrared video cam-era (Sony Handycam, Sony Corporation). Red light stimuliwith 2-s duration were used to illuminate one eye of themouse at a distance of 4 cm from the ocular surface, anddirect pupil responses were recorded from the illuminatedeye with the digital infrared camera. Prior to performingillumination with the blue light, pupils were allowed to com-pletely dilate to the baseline diameter. Captured digitalmovies of pupil responses were analyzed using ADOBE PHOTO-
SHOP (v. 10.0.1; Adobe Systems, Inc., San Jose, CA, USA).Calibrated dot grid with dot sizes of 0.5, 1, 1.5, 2, and 3 mmin diameter were recorded with a camera from the 4 cm dis-tance to calculate the regression equation so calculation ofabsolute pupil diameters from the recorded images could beperformed.
Spectral-domain optical coherence tomographySpectral-domain optical coherence tomography analysis wasperformed on anesthetized mice (n = 22) using a SpectralisSD-OCT (Heidelberg Engineering, Vista, CA, USA) imag-ing system (Fig. 1b), coupled with a 25D lens for mouse ocu-lar imaging (Heidelberg Engineering). Mice wereanesthetized using 2.5% halothane and 100% oxygen mix-ture on a heating pad to maintain body temperature. Pupilswere dilated using a 1% tropicamide solution. The cornea
(a) (b)
Figure 1. (a) Pattern ERG recording in mice. The mouse is positioned on a heated table and placed 20 cm from the stimulating screen. The position
of the table and eye orientation is carefully controlled to provide consistent placement of the animal eye in front of the stimulating monitor. (b) Optical
coherence tomography (OCT) recording in mice. A special 25D lens is attached to the spectral-domain optical coherence tomography Spectralis
system for performing OCT imaging in mouse eyes. Anesthetized mice are kept warm by placement on a heating pad for the duration of the
recording.
Figure 2. Representative mouse pattern electroretinography tracing.
Amplitudes are calculated for N35-P50 and P50-N95 intervals. It is
considered that P50-N95 amplitude represents electrical activity of the
retinal ganglion cell body and dendritic tree as a result of cell membrane
depolarization.
96 m o h a n E T A L .
� 2012 American College of Veterinary Ophthalmologists, Veterinary Ophthalmology, 15, 94–104
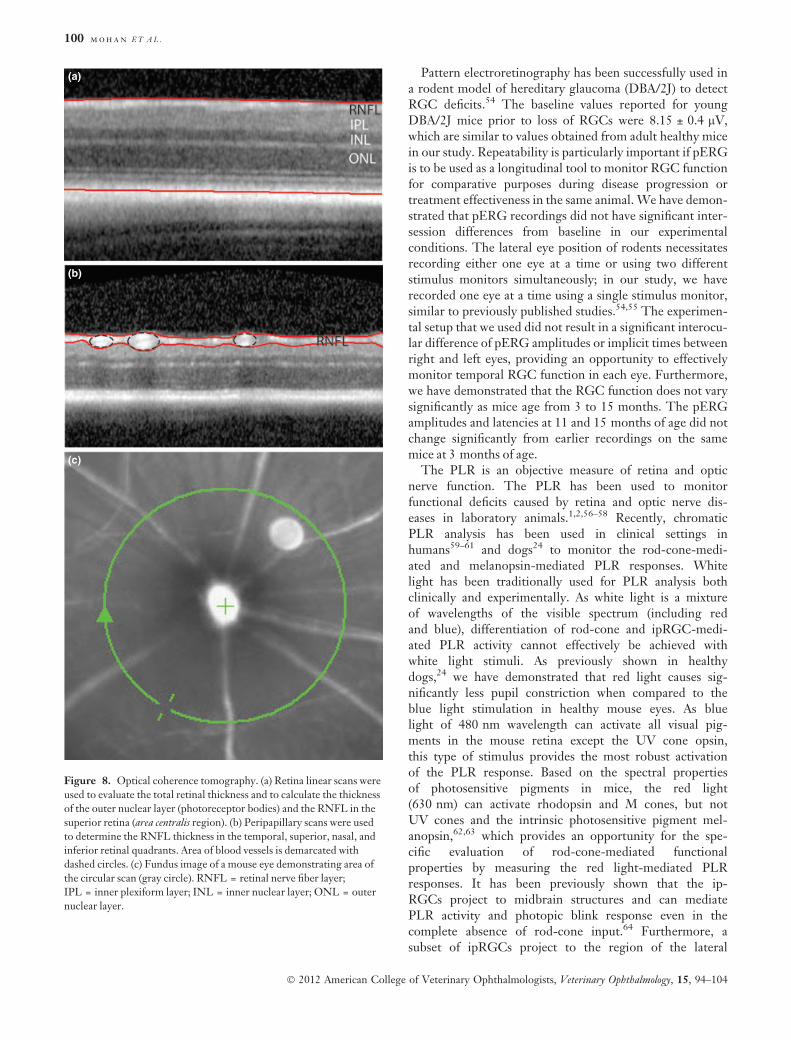
was moisturized with a saline solution, which was appliedevery 20–30 s. Circular scans around the optic nerve regionwere performed to quantify NFL thickness in the temporal,superior, nasal and inferior retinal quadrants. Circular scanswere subsequently analyzed by including or excluding bloodvessels from the RNFL thickness calculation, because bloodvessels in rodents are almost completely embedded in theRNFL50 and are included in automated RNFL measure-ment routines by all commercially available systems. Linearscans were also performed in the superio-temporal region ofthe retina (area centralis) to evaluate total retinal thickness,thickness of the photoreceptor layer, and the RNFL thick-ness. Total of 25 linear scan lines were positioned in thesuperio-temporal retina. The most superior linear scan linewas positioned 2.5–3 mm superior/1.5–2 mm temporal tothe optic nerve head.
Statistical analysisAll statistical analyses were carried out using GRAPHPAD PRISM
5.0 (GraphPad software, San Diego, CA, USA). Paired t-tests, one-way ANOVA with Bonferroni’s post test, or repeatedmeasures ANOVA with Bonferroni’s post test analysis wereused as described in the text. Differences between groupswere considered statistically significant for P < 0.05.
RESULTS
Pattern electroretinographyAverage pERG amplitudes were 9 ± 0.6 lV (N35-P50,mean ± SEM) and 11.2 ± 0.7 lV (P50-N95, Fig. 3a).
Repeated measurement of pERG amplitudes in the samemice (four different recording sessions with a 7 day timeinterval between sessions for the same animal) revealed nosignificant inter-session difference compared with initialbaseline recordings (P = 0.4, Repeated Measures ANOVA
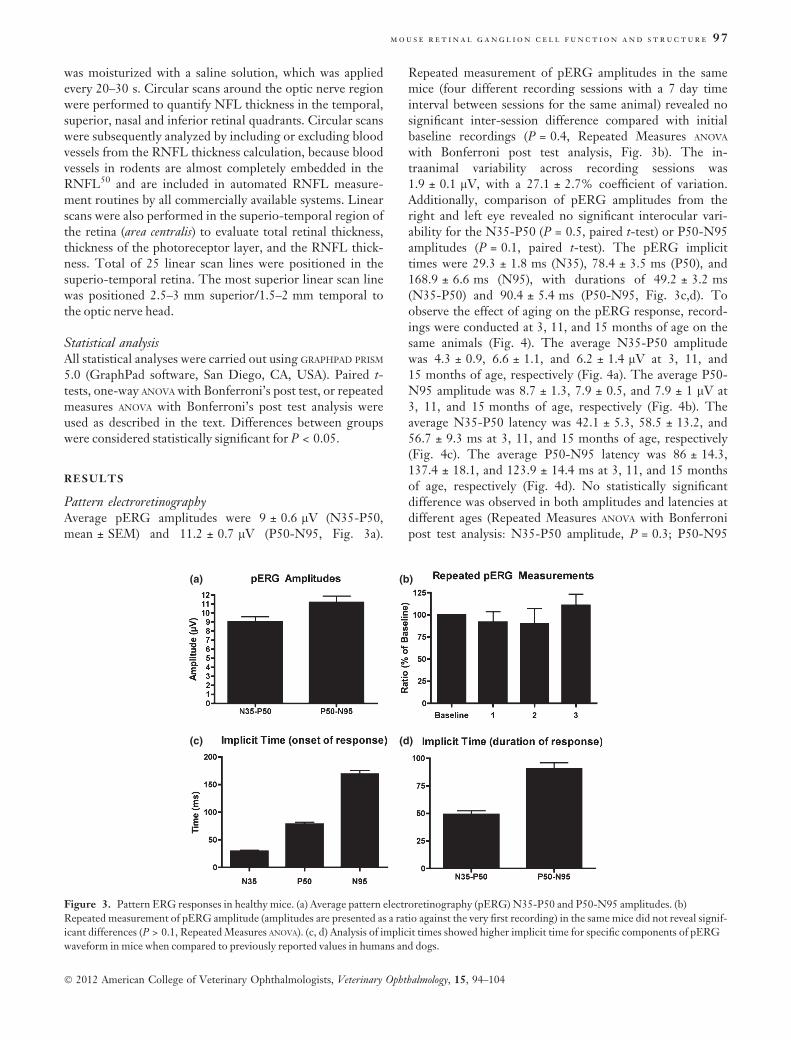
with Bonferroni post test analysis, Fig. 3b). The in-traanimal variability across recording sessions was1.9 ± 0.1 lV, with a 27.1 ± 2.7% coefficient of variation.Additionally, comparison of pERG amplitudes from theright and left eye revealed no significant interocular vari-ability for the N35-P50 (P = 0.5, paired t-test) or P50-N95amplitudes (P = 0.1, paired t-test). The pERG implicittimes were 29.3 ± 1.8 ms (N35), 78.4 ± 3.5 ms (P50), and168.9 ± 6.6 ms (N95), with durations of 49.2 ± 3.2 ms(N35-P50) and 90.4 ± 5.4 ms (P50-N95, Fig. 3c,d). Toobserve the effect of aging on the pERG response, record-ings were conducted at 3, 11, and 15 months of age on thesame animals (Fig. 4). The average N35-P50 amplitudewas 4.3 ± 0.9, 6.6 ± 1.1, and 6.2 ± 1.4 lV at 3, 11, and15 months of age, respectively (Fig. 4a). The average P50-N95 amplitude was 8.7 ± 1.3, 7.9 ± 0.5, and 7.9 ± 1 lV at3, 11, and 15 months of age, respectively (Fig. 4b). Theaverage N35-P50 latency was 42.1 ± 5.3, 58.5 ± 13.2, and56.7 ± 9.3 ms at 3, 11, and 15 months of age, respectively(Fig. 4c). The average P50-N95 latency was 86 ± 14.3,137.4 ± 18.1, and 123.9 ± 14.4 ms at 3, 11, and 15 monthsof age, respectively (Fig. 4d). No statistically significantdifference was observed in both amplitudes and latencies atdifferent ages (Repeated Measures ANOVA with Bonferronipost test analysis: N35-P50 amplitude, P = 0.3; P50-N95
(a) (b)
(d)(c)
Figure 3. Pattern ERG responses in healthy mice. (a) Average pattern electroretinography (pERG) N35-P50 and P50-N95 amplitudes. (b)
Repeated measurement of pERG amplitude (amplitudes are presented as a ratio against the very first recording) in the same mice did not reveal signif-
icant differences (P > 0.1, Repeated Measures ANOVA). (c, d) Analysis of implicit times showed higher implicit time for specific components of pERG
waveform in mice when compared to previously reported values in humans and dogs.
m o u s e r e t i n a l g a n g l i o n c e l l f u n c t i o n a n d s t r u c t u r e 97
� 2012 American College of Veterinary Ophthalmologists, Veterinary Ophthalmology, 15, 94–104
amplitude, P = 0.8; N35-P50 latency, P = 0.5; and P50-N95 latency, P = 0.1).
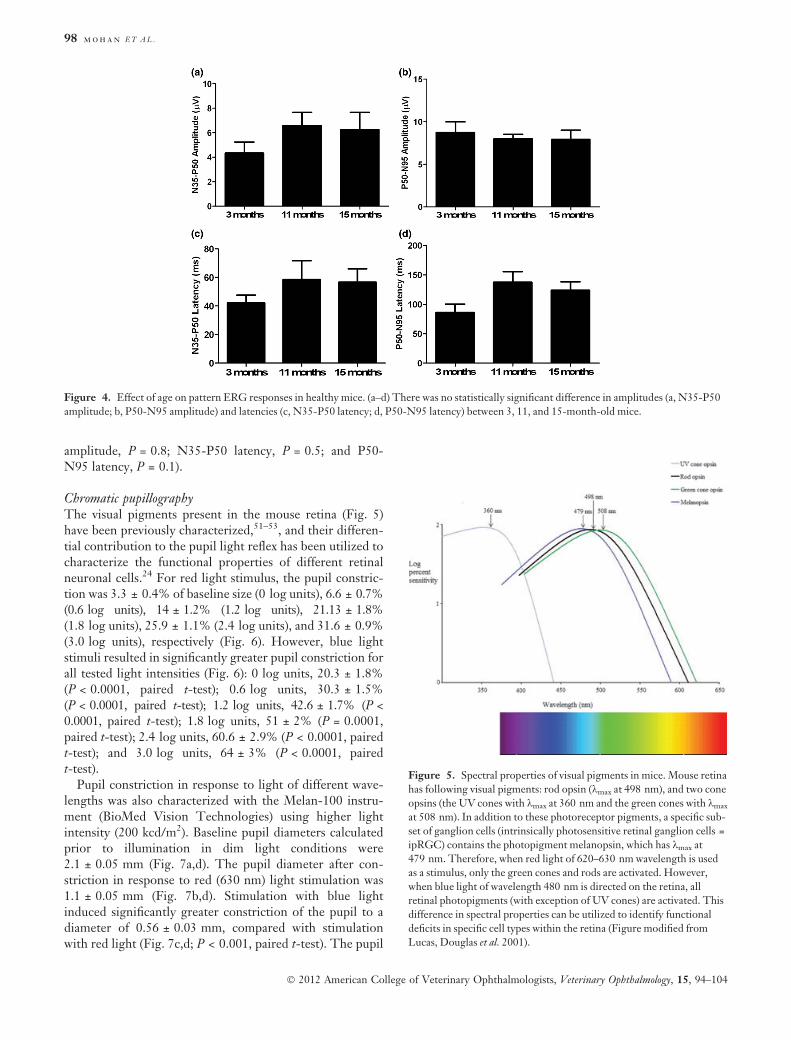
Chromatic pupillographyThe visual pigments present in the mouse retina (Fig. 5)have been previously characterized,51–53, and their differen-tial contribution to the pupil light reflex has been utilized tocharacterize the functional properties of different retinalneuronal cells.24 For red light stimulus, the pupil constric-tion was 3.3 ± 0.4% of baseline size (0 log units), 6.6 ± 0.7%(0.6 log units), 14 ± 1.2% (1.2 log units), 21.13 ± 1.8%(1.8 log units), 25.9 ± 1.1% (2.4 log units), and 31.6 ± 0.9%(3.0 log units), respectively (Fig. 6). However, blue lightstimuli resulted in significantly greater pupil constriction forall tested light intensities (Fig. 6): 0 log units, 20.3 ± 1.8%(P < 0.0001, paired t-test); 0.6 log units, 30.3 ± 1.5%(P < 0.0001, paired t-test); 1.2 log units, 42.6 ± 1.7% (P <0.0001, paired t-test); 1.8 log units, 51 ± 2% (P = 0.0001,paired t-test); 2.4 log units, 60.6 ± 2.9% (P < 0.0001, pairedt-test); and 3.0 log units, 64 ± 3% (P < 0.0001, pairedt-test).
Pupil constriction in response to light of different wave-lengths was also characterized with the Melan-100 instru-ment (BioMed Vision Technologies) using higher lightintensity (200 kcd/m2). Baseline pupil diameters calculatedprior to illumination in dim light conditions were2.1 ± 0.05 mm (Fig. 7a,d). The pupil diameter after con-striction in response to red (630 nm) light stimulation was1.1 ± 0.05 mm (Fig. 7b,d). Stimulation with blue lightinduced significantly greater constriction of the pupil to adiameter of 0.56 ± 0.03 mm, compared with stimulationwith red light (Fig. 7c,d; P < 0.001, paired t-test). The pupil
Figure 4. Effect of age on pattern ERG responses in healthy mice. (a–d) There was no statistically significant difference in amplitudes (a, N35-P50
amplitude; b, P50-N95 amplitude) and latencies (c, N35-P50 latency; d, P50-N95 latency) between 3, 11, and 15-month-old mice.
Figure 5. Spectral properties of visual pigments in mice. Mouse retina
has following visual pigments: rod opsin (kmax at 498 nm), and two cone
opsins (the UV cones with kmax at 360 nm and the green cones with kmax
at 508 nm). In addition to these photoreceptor pigments, a specific sub-
set of ganglion cells (intrinsically photosensitive retinal ganglion cells =
ipRGC) contains the photopigment melanopsin, which has kmax at
479 nm. Therefore, when red light of 620–630 nm wavelength is used
as a stimulus, only the green cones and rods are activated. However,
when blue light of wavelength 480 nm is directed on the retina, all
retinal photopigments (with exception of UV cones) are activated. This
difference in spectral properties can be utilized to identify functional
deficits in specific cell types within the retina (Figure modified from
Lucas, Douglas et al. 2001).
98 m o h a n E T A L .
� 2012 American College of Veterinary Ophthalmologists, Veterinary Ophthalmology, 15, 94–104
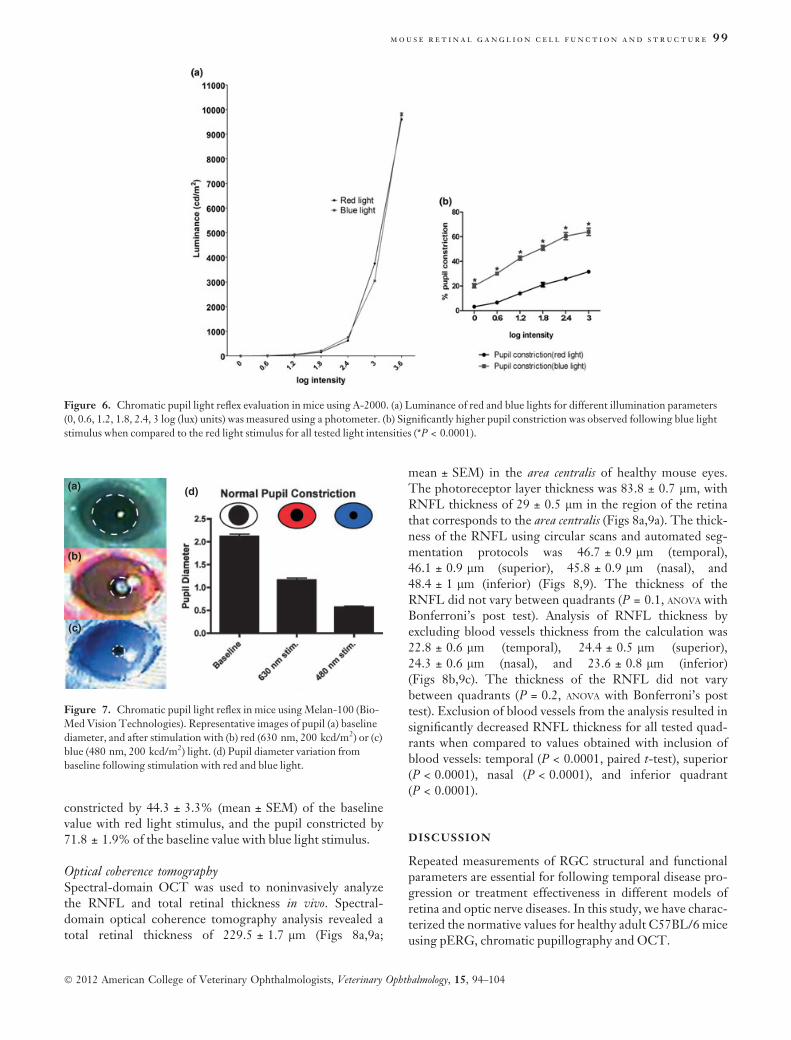
constricted by 44.3 ± 3.3% (mean ± SEM) of the baselinevalue with red light stimulus, and the pupil constricted by71.8 ± 1.9% of the baseline value with blue light stimulus.
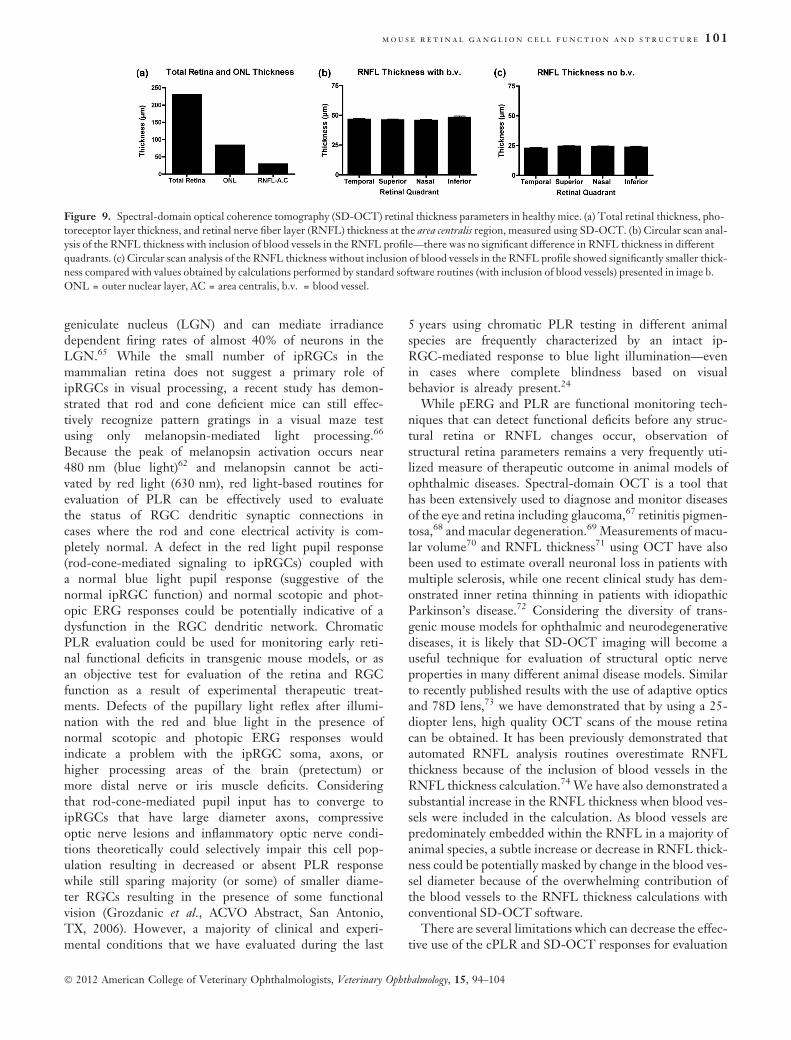
Optical coherence tomographySpectral-domain OCT was used to noninvasively analyzethe RNFL and total retinal thickness in vivo. Spectral-domain optical coherence tomography analysis revealed atotal retinal thickness of 229.5 ± 1.7 lm (Figs 8a,9a;
mean ± SEM) in the area centralis of healthy mouse eyes.The photoreceptor layer thickness was 83.8 ± 0.7 lm, withRNFL thickness of 29 ± 0.5 lm in the region of the retinathat corresponds to the area centralis (Figs 8a,9a). The thick-ness of the RNFL using circular scans and automated seg-mentation protocols was 46.7 ± 0.9 lm (temporal),46.1 ± 0.9 lm (superior), 45.8 ± 0.9 lm (nasal), and48.4 ± 1 lm (inferior) (Figs 8,9). The thickness of theRNFL did not vary between quadrants (P = 0.1, ANOVA withBonferroni’s post test). Analysis of RNFL thickness byexcluding blood vessels thickness from the calculation was22.8 ± 0.6 lm (temporal), 24.4 ± 0.5 lm (superior),24.3 ± 0.6 lm (nasal), and 23.6 ± 0.8 lm (inferior)(Figs 8b,9c). The thickness of the RNFL did not varybetween quadrants (P = 0.2, ANOVA with Bonferroni’s posttest). Exclusion of blood vessels from the analysis resulted insignificantly decreased RNFL thickness for all tested quad-rants when compared to values obtained with inclusion ofblood vessels: temporal (P < 0.0001, paired t-test), superior(P < 0.0001), nasal (P < 0.0001), and inferior quadrant(P < 0.0001).
DISCUSSION
Repeated measurements of RGC structural and functionalparameters are essential for following temporal disease pro-gression or treatment effectiveness in different models ofretina and optic nerve diseases. In this study, we have charac-terized the normative values for healthy adult C57BL/6 miceusing pERG, chromatic pupillography and OCT.
Figure 6. Chromatic pupil light reflex evaluation in mice using A-2000. (a) Luminance of red and blue lights for different illumination parameters
(0, 0.6, 1.2, 1.8, 2.4, 3 log (lux) units) was measured using a photometer. (b) Significantly higher pupil constriction was observed following blue light
stimulus when compared to the red light stimulus for all tested light intensities (*P < 0.0001).
(a)
(b)
(c)
(d)
Figure 7. Chromatic pupil light reflex in mice using Melan-100 (Bio-
Med Vision Technologies). Representative images of pupil (a) baseline
diameter, and after stimulation with (b) red (630 nm, 200 kcd/m2) or (c)
blue (480 nm, 200 kcd/m2) light. (d) Pupil diameter variation from
baseline following stimulation with red and blue light.
m o u s e r e t i n a l g a n g l i o n c e l l f u n c t i o n a n d s t r u c t u r e 99
� 2012 American College of Veterinary Ophthalmologists, Veterinary Ophthalmology, 15, 94–104
Pattern electroretinography has been successfully used ina rodent model of hereditary glaucoma (DBA/2J) to detectRGC deficits.54 The baseline values reported for youngDBA/2J mice prior to loss of RGCs were 8.15 ± 0.4 lV,which are similar to values obtained from adult healthy micein our study. Repeatability is particularly important if pERGis to be used as a longitudinal tool to monitor RGC functionfor comparative purposes during disease progression ortreatment effectiveness in the same animal. We have demon-strated that pERG recordings did not have significant inter-session differences from baseline in our experimentalconditions. The lateral eye position of rodents necessitatesrecording either one eye at a time or using two differentstimulus monitors simultaneously; in our study, we haverecorded one eye at a time using a single stimulus monitor,similar to previously published studies.54,55 The experimen-tal setup that we used did not result in a significant interocu-lar difference of pERG amplitudes or implicit times betweenright and left eyes, providing an opportunity to effectivelymonitor temporal RGC function in each eye. Furthermore,we have demonstrated that the RGC function does not varysignificantly as mice age from 3 to 15 months. The pERGamplitudes and latencies at 11 and 15 months of age did notchange significantly from earlier recordings on the samemice at 3 months of age.
The PLR is an objective measure of retina and opticnerve function. The PLR has been used to monitorfunctional deficits caused by retina and optic nerve dis-eases in laboratory animals.1,2,56–58 Recently, chromaticPLR analysis has been used in clinical settings inhumans59–61 and dogs24 to monitor the rod-cone-medi-ated and melanopsin-mediated PLR responses. Whitelight has been traditionally used for PLR analysis bothclinically and experimentally. As white light is a mixtureof wavelengths of the visible spectrum (including redand blue), differentiation of rod-cone and ipRGC-medi-ated PLR activity cannot effectively be achieved withwhite light stimuli. As previously shown in healthydogs,24 we have demonstrated that red light causes sig-nificantly less pupil constriction when compared to theblue light stimulation in healthy mouse eyes. As bluelight of 480 nm wavelength can activate all visual pig-ments in the mouse retina except the UV cone opsin,this type of stimulus provides the most robust activationof the PLR response. Based on the spectral propertiesof photosensitive pigments in mice, the red light(630 nm) can activate rhodopsin and M cones, but notUV cones and the intrinsic photosensitive pigment mel-anopsin,62,63 which provides an opportunity for the spe-cific evaluation of rod-cone-mediated functionalproperties by measuring the red light-mediated PLRresponses. It has been previously shown that the ip-RGCs project to midbrain structures and can mediatePLR activity and photopic blink response even in thecomplete absence of rod-cone input.64 Furthermore, asubset of ipRGCs project to the region of the lateral
(a)
(b)
(c)
Figure 8. Optical coherence tomography. (a) Retina linear scans were
used to evaluate the total retinal thickness and to calculate the thickness
of the outer nuclear layer (photoreceptor bodies) and the RNFL in the
superior retina (area centralis region). (b) Peripapillary scans were used
to determine the RNFL thickness in the temporal, superior, nasal, and
inferior retinal quadrants. Area of blood vessels is demarcated with
dashed circles. (c) Fundus image of a mouse eye demonstrating area of
the circular scan (gray circle). RNFL = retinal nerve fiber layer;
IPL = inner plexiform layer; INL = inner nuclear layer; ONL = outer
nuclear layer.
100 m o h a n E T A L .
� 2012 American College of Veterinary Ophthalmologists, Veterinary Ophthalmology, 15, 94–104
geniculate nucleus (LGN) and can mediate irradiancedependent firing rates of almost 40% of neurons in theLGN.65 While the small number of ipRGCs in themammalian retina does not suggest a primary role ofipRGCs in visual processing, a recent study has demon-strated that rod and cone deficient mice can still effec-tively recognize pattern gratings in a visual maze testusing only melanopsin-mediated light processing.66
Because the peak of melanopsin activation occurs near480 nm (blue light)62 and melanopsin cannot be acti-vated by red light (630 nm), red light-based routines forevaluation of PLR can be effectively used to evaluatethe status of RGC dendritic synaptic connections incases where the rod and cone electrical activity is com-pletely normal. A defect in the red light pupil response(rod-cone-mediated signaling to ipRGCs) coupled witha normal blue light pupil response (suggestive of thenormal ipRGC function) and normal scotopic and phot-opic ERG responses could be potentially indicative of adysfunction in the RGC dendritic network. ChromaticPLR evaluation could be used for monitoring early reti-nal functional deficits in transgenic mouse models, or asan objective test for evaluation of the retina and RGCfunction as a result of experimental therapeutic treat-ments. Defects of the pupillary light reflex after illumi-nation with the red and blue light in the presence ofnormal scotopic and photopic ERG responses wouldindicate a problem with the ipRGC soma, axons, orhigher processing areas of the brain (pretectum) ormore distal nerve or iris muscle deficits. Consideringthat rod-cone-mediated pupil input has to converge toipRGCs that have large diameter axons, compressiveoptic nerve lesions and inflammatory optic nerve condi-tions theoretically could selectively impair this cell pop-ulation resulting in decreased or absent PLR responsewhile still sparing majority (or some) of smaller diame-ter RGCs resulting in the presence of some functionalvision (Grozdanic et al., ACVO Abstract, San Antonio,TX, 2006). However, a majority of clinical and experi-mental conditions that we have evaluated during the last
5 years using chromatic PLR testing in different animalspecies are frequently characterized by an intact ip-RGC-mediated response to blue light illumination—evenin cases where complete blindness based on visualbehavior is already present.24
While pERG and PLR are functional monitoring tech-niques that can detect functional deficits before any struc-tural retina or RNFL changes occur, observation ofstructural retina parameters remains a very frequently uti-lized measure of therapeutic outcome in animal models ofophthalmic diseases. Spectral-domain OCT is a tool thathas been extensively used to diagnose and monitor diseasesof the eye and retina including glaucoma,67 retinitis pigmen-tosa,68 and macular degeneration.69 Measurements of macu-lar volume70 and RNFL thickness71 using OCT have alsobeen used to estimate overall neuronal loss in patients withmultiple sclerosis, while one recent clinical study has dem-onstrated inner retina thinning in patients with idiopathicParkinson’s disease.72 Considering the diversity of trans-genic mouse models for ophthalmic and neurodegenerativediseases, it is likely that SD-OCT imaging will become auseful technique for evaluation of structural optic nerveproperties in many different animal disease models. Similarto recently published results with the use of adaptive opticsand 78D lens,73 we have demonstrated that by using a 25-diopter lens, high quality OCT scans of the mouse retinacan be obtained. It has been previously demonstrated thatautomated RNFL analysis routines overestimate RNFLthickness because of the inclusion of blood vessels in theRNFL thickness calculation.74 We have also demonstrated asubstantial increase in the RNFL thickness when blood ves-sels were included in the calculation. As blood vessels arepredominately embedded within the RNFL in a majority ofanimal species, a subtle increase or decrease in RNFL thick-ness could be potentially masked by change in the blood ves-sel diameter because of the overwhelming contribution ofthe blood vessels to the RNFL thickness calculations withconventional SD-OCT software.
There are several limitations which can decrease the effec-tive use of the cPLR and SD-OCT responses for evaluation
Figure 9. Spectral-domain optical coherence tomography (SD-OCT) retinal thickness parameters in healthy mice. (a) Total retinal thickness, pho-
toreceptor layer thickness, and retinal nerve fiber layer (RNFL) thickness at the area centralis region, measured using SD-OCT. (b) Circular scan anal-
ysis of the RNFL thickness with inclusion of blood vessels in the RNFL profile—there was no significant difference in RNFL thickness in different
quadrants. (c) Circular scan analysis of the RNFL thickness without inclusion of blood vessels in the RNFL profile showed significantly smaller thick-
ness compared with values obtained by calculations performed by standard software routines (with inclusion of blood vessels) presented in image b.
ONL = outer nuclear layer, AC = area centralis, b.v. = blood vessel.
m o u s e r e t i n a l g a n g l i o n c e l l f u n c t i o n a n d s t r u c t u r e 101
� 2012 American College of Veterinary Ophthalmologists, Veterinary Ophthalmology, 15, 94–104

of the retina and optic nerve status. Mice with severe formsof iris atrophy or prominent intraocular inflammation canhave significantly attenuated PLR responses, while theapplication of topical ocular medications with miotic ormydriatic action can also have a significant effect on the rest-ing pupil diameter and overall pupil motility. Furthermore,CNS and peripheral nerve abnormalities, which can be fre-quently present in different transgenic mouse models affect-ing any of the subthalamic PLR centers or efferent PLRpathway components, can have significant effects on thequality of PLR responses, which may be a potentially limit-ing factor during cPLR testing routines. Similarly, limita-tions in pupil dilatation may have the potential effect on thequality of SD-OCT imaging. Presently, we are developingautomated OCT segmentation software routines that arespecific for mouse retina which are likely to improve furtherthe application of OCT in mouse species.
Detailed in vivo analysis of functional and structural ret-ina and RGC parameters can provide a significant advan-tage during evaluation of transgenic animal models ofhuman ocular and neurodegenerative diseases. Introductionof these techniques may result in a significant accelerationdeveloping new therapeutic strategies, because all observedtechniques are commonly utilized in human patients, whichmay allow for a rapid translation of animal study results tohuman patient population. Considering that the mouse isprobably the most frequent experimental animal speciesencountered by veterinary ophthalmologists during toxicityand clinical safety/efficacy studies, the availability of nor-mative pERG, chromatic PLR, and OCT data may provideuseful information for more specific evaluation of func-tional and structural retinal properties in this particular ani-mal species.
ACKNOWLEDGMENTS
This work was supported by the Department of VeteransAffairs Center for Prevention and Treatment of Vision Loss(CPTVL), VA RRD Grants C3919R and C4702R, IowaCenter for Advanced Neurotoxicology (ICAN), and theNIH (1R01EY019294).
REFERENCES
1. Grozdanic S, Betts DM, Allbaugh RA et al. Characterization of
the pupil light reflex, electroretinogram and tonometric parame-
ters in healthy mouse eyes. Current Eye Research 2003; 26:
371–378.
2. Grozdanic S, Sakaguchi DS, Kwon YH et al. Characterization of
the pupil light reflex, electroretinogram and tonometric parame-
ters in healthy rat eyes. Current Eye Research 2002; 25: 69–78.
3. Grozdanic SD, Matic M, Betts DM et al. Recovery of canine ret-
ina and optic nerve function after acute elevation of intraocular
pressure: implications for canine glaucoma treatment. VeterinaryOphthalmology 2007; 10(Suppl. 1): 101–107.
4. Panagakis E, Moschos M. Pattern ERG changes in suspected
glaucoma. Ophthalmologica 1998; 212: 112–114.
5. Mierdel P, Zenker HJ, Marre E. The pattern ERG in glaucoma:
effect of pattern reversal time. International Ophthalmology 1992;
16: 211–214.
6. Price MJ, Drance SM, Price M et al. The pattern electroretino-
gram and visual-evoked potential in glaucoma. Graefes Archive forClinical and Experimental Ophthalmology 1988; 226: 542–547.
7. van den Berg TJ, Riemslag FC, de Vos GW et al. Pattern ERG
and glaucomatous visual field defects. Documenta Ophthalmologica
1986; 61: 335–341.
8. Papst N, Bopp M, Schnaudigel OE. Pattern electroretinogram and
visually evoked cortical potentials in glaucoma. Graefes Archive forClinical and Experimental Ophthalmology 1984; 222: 29–33.
9. Wanger P, Persson HE. Pattern-reversal electroretinograms in
unilateral glaucoma. Investigative Ophthalmology & Visual Science
1983; 24: 749–753.
10. Porciatti V, Nagaraju M. Head-up tilt lowers IOP and improves
RGC dysfunction in glaucomatous DBA/2J mice. ExperimentalEye Research 2010; 90: 452–460.
11. Nagaraju M, Saleh M, Porciatti V. IOP-dependent retinal gan-
glion cell dysfunction in glaucomatous DBA/2J mice. Investigative
Ophthalmology & Visual Science 2007; 48: 4573–4579.
12. Porciatti V. The mouse pattern electroretinogram. Documenta
Ophthalmologica 2007; 115: 145–153.
13. Viswanathan S, Frishman LJ, Robson JG. The uniform field and
pattern ERG in macaques with experimental glaucoma: removal
of spiking activity. Investigative Ophthalmology & Visual Science
2000; 41: 2797–2810.
14. Miura G, Wang MH, Ivers KM et al. Retinal pathway origins of
the pattern ERG of the mouse. Experimental Eye Research 2009;
89: 49–62.
15. Porciatti V, Ventura LM. Adaptive changes of inner retina func-
tion in response to sustained pattern stimulation. Vision Research2009; 49: 505–513.
16. Maffei L, Fiorentini A, Bisti S et al. Pattern ERG in the monkey
after section of the optic nerve. Experimental Brain Research 1985;
59: 423–425.
17. Mafei L, Fiorentini A. Electroretinographic responses to alternat-
ing gratings before and after section of the optic nerve. Science1981; 211: 953–955.
18. Hull BM, Thompson DA. A review of the clinical applications of
the pattern electroretinogram. Ophthalmic & Physiological Optics:
The Journal of the British College of Ophthalmic Opticians 1989; 9:
143–152.
19. Bach M. Electrophysiological approaches for early detection of
glaucoma. European Journal of Ophthalmology 2001; 11(Suppl. 2):
S41–S49.
20. Ventura LM, Porciatti V. Pattern electroretinogram in glaucoma.
Current Opinion in Ophthalmology 2006; 17: 196–202.
21. Ben-Shlomo G, Bakalash S, Lambrou GN et al. Pattern electro-
retinography in a rat model of ocular hypertension: functional
evidence for early detection of inner retinal damage. Experimental
Eye Research 2005; 81: 340–349.
22. Grozdanic S, Kecova H, Harper MM et al. Functional and struc-
tural changes in a canine model of hereditary primary angle-clo-
sure glaucoma. Investigative Ophthalmology & Visual Science 2010;
51: 255–263.
23. Ofri R, Samuelson DA, Strubbe DT et al. Altered retinal recovery
and optic nerve fiber loss in primary open-angle glaucoma in the
beagle. Experimental Eye Research 1994; 58: 245–248.
24. Grozdanic SD, Matic M, Sakaguchi DS et al. Evaluation of retinal
status using chromatic pupil light reflex activity in healthy and
diseased canine eyes. Investigative Ophthalmology & Visual Science
2007; 48: 5178–5183.
102 m o h a n E T A L .
� 2012 American College of Veterinary Ophthalmologists, Veterinary Ophthalmology, 15, 94–104

25. Kardon R, Anderson SC, Damarjian TG et al. Chromatic pupil
responses: preferential activation of the melanopsin-mediated ver-
sus outer photoreceptor-mediated pupil light reflex. Ophthalmology0161-6420 2009; 116: 1564–1573.
26. Park JC, Moura AL, Raza AS et al. Toward a clinical protocol for
assessing rod, cone, and melanopsin contributions to the human
pupil response. Investigative Ophthalmology & Visual Science 2011;
52: 6624–6635.
27. McDougal DH, Gamlin PD. The influence of intrinsically-photo-
sensitive retinal ganglion cells on the spectral sensitivity and
response dynamics of the human pupillary light reflex. VisionResearch 2010; 50: 72–87.
28. McNeill DS, Sheely CJ, Ecker JL et al. Development of melanopsin-
based irradiance detecting circuitry. Neural Development 2011; 6: 8.
29. Tsujimura S, Ukai K, Ohama D et al. Contribution of human
melanopsin retinal ganglion cells to steady-state pupil responses.
Proceedings Biological Sciences/The Royal Society 2010; 277:
2485–2492.
30. Tsujimura S, Tokuda Y. Delayed response of human melanopsin
retinal ganglion cells on the pupillary light reflex. Ophthalmic &
Physiological Optics: The Journal of The British College of OphthalmicOpticians 2011; 31: 469–479.
31. Benarroch EE. The melanopsin system: phototransduction, pro-
jections, functions, and clinical implications. Neurology 2011; 76:
1422–1427.
32. Markwell EL, Feigl B, Zele AJ. Intrinsically photosensitive mela-
nopsin retinal ganglion cell contributions to the pupillary light
reflex and circadian rhythm. Clinical & Experimental Optometry:Journal of the Australian Optometrical Association 2010; 93:
137–149.
33. Do MT, Yau KW. Intrinsically photosensitive retinal ganglion
cells. Physiological Reviews 2010; 90: 1547–1581.
34. Schmidt TM, Kofuji P. Novel insights into non-image forming
visual processing in the retina. Cellscience 2008; 5: 77–83.
35. Grozdanic SD, Harper MM, Kecova H. Antibody-mediated retin-
opathies in canine patients: mechanism, diagnosis, and treatment
modalities. The Veterinary Clinics of North America. Small Animal
Practice 2008; 38: 361–387. vii.
36. Kankipati L, Girkin CA, Gamlin PD. Post-illumination pupil
response in subjects without ocular disease. Investigative Ophthal-mology & Visual Science 2010; 51: 2764–2769.
37. Zele AJ, Feigl B, Smith SS et al. The circadian response of intrin-
sically photosensitive retinal ganglion cells. PLoS One 2011; 6:
e17860.
38. Kocaoglu OP, Uhlhorn SR, Hernandez E et al. Simultaneous fun-
dus imaging and optical coherence tomography of the mouse ret-
ina. Investigative Ophthalmology & Visual Science 2007; 48:
1283–1289.
39. Fingler J, Readhead C, Schwartz DM et al. Phase-contrast OCT
imaging of transverse flows in the mouse retina and choroid.
Investigative Ophthalmology & Visual Science 2008; 49: 5055–5059.
40. Srinivasan VJ, Ko TH, Wojtkowski M et al. Noninvasive
volumetric imaging and morphometry of the rodent retina with
high-speed, ultrahigh-resolution optical coherence tomography.
Investigative Ophthalmology & Visual Science 2006; 47: 5522–5528.
41. Strouthidis NG, Grimm J, Williams GA et al. A comparison of
optic nerve head morphology viewed by spectral domain optical
coherence tomography and by serial histology. Investigative Oph-thalmology & Visual Science 2009; 29: 29.
42. Wang M, Hood DC, Cho JS et al. Measurement of local retinal
ganglion cell layer thickness in patients with glaucoma using fre-
quency-domain optical coherence tomography. Archives of Oph-
thalmology 2009; 127: 875–881.
43. Abramoff MD, Lee K, Niemeijer M et al. Automated segmenta-
tion of the cup and rim from spectral domain OCT of the optic
nerve head. Investigative Ophthalmology & Visual Science 2009; 50:
5778–5784.
44. Garvin MK, Abramoff MD, Kardon R et al. Intraretinal layer seg-
mentation of macular optical coherence tomography images using
optimal 3-D graph search. IEEE Transactions on Medical Imaging2008; 27: 1495–1505.
45. Kim KH, Puoris’haag M, Maguluri GN et al. Monitoring mouse
retinal degeneration with high-resolution spectral-domain optical
coherence tomography. Journal of Vision 2008; 8: 17–11.
46. Xu J, Molday LL, Molday RS et al. In vivo imaging of the mouse
model of X-linked juvenile retinoschisis with fourier domain opti-
cal coherence tomography. Investigative Ophthalmology & Visual
Science 2009; 50: 2989–2993.
47. Cebulla CM, Ruggeri M, Murray TG et al. Spectral domain opti-
cal coherence tomography in a murine retinal detachment model.
Experimental Eye Research 2010; 90: 521–527.
48. Huber G, Beck SC, Grimm C et al. Spectral domain optical
coherence tomography in mouse models of retinal degeneration.
Investigative Ophthalmology & Visual Science 2009; 50: 5888–5895.
49. Sho K, Takahashi K, Fukuchi T et al. Quantitative evaluation of
ischemia-reperfusion injury by optical coherence tomography in
the rat retina. Japanese Journal of Ophthalmology 2005; 49: 109–113.
50. Connolly SE, Hores TA, Smith LE et al. Characterization of vas-
cular development in the mouse retina. Microvascular Research
1988; 36: 275–290.
51. Bowes C, Li T, Danciger M et al. Retinal degeneration in the rd
mouse is caused by a defect in the beta subunit of rod cGMP-
phosphodiesterase. Nature 1990; 347: 677–680.
52. Lucas RJ, Douglas RH, Foster RG. Characterization of an ocular
photopigment capable of driving pupillary constriction in mice.
Nature Neuroscience 2001; 4: 621–626.
53. Sun H, Macke JP, Nathans J. Mechanisms of spectral tuning in
the mouse green cone pigment. Proceedings of the National Acad-
emy of Sciences of the United States of America 1997; 94:
8860–8865.
54. Porciatti V, Saleh M, Nagaraju M. The pattern electroretinogram
as a tool to monitor progressive retinal ganglion cell dysfunction
in the DBA/2J mouse model of glaucoma. Investigative Ophthal-mology & Visual Science 2007; 48: 745–751.
55. Ben-Shlomo G, Ofri R. Development of inner retinal function,
evidenced by the pattern electroretinogram, in the rat. Experimen-
tal Eye Research 2006; 83: 417–423.
56. Trejo LJ, Cicerone CM. Retinal sensitivity measured by the
pupillary light reflex in RCS and albino rats. Vision Research 1982;
22: 1163–1171.
57. Aleman TS, Jacobson SG, Chico JD et al. Impairment of the
transient pupillary light reflex in Rpe65(-/-) mice and humans
with leber congenital amaurosis. Investigative Ophthalmology &Visual Science 2004; 45: 1259–1271.
58. Whiteley SJ, Young MJ, Litchfield TM et al. Changes in the
pupillary light reflex of pigmented royal college of surgeons rats
with age. Experimental Eye Research 1998; 66: 719–730.
59. Kardon R, Anderson SC, Damarjian TG et al. Chromatic pupill-
ometry in patients with retinitis pigmentosa. Ophthalmology 2011;
118: 376–381.
60. de Zavalia N, Plano SA, Fernandez DC et al. Effect of experi-
mental glaucoma on the non-image forming visual system. Journal
of Neurochemistry 2011; 117: 904–914.
61. Kankipati L, Girkin CA, Gamlin PD. The post-illumination pupil
response is reduced in glaucoma patients. Investigative Ophthalmol-
ogy & Visual Science 2011; 52: 2287–2292.
m o u s e r e t i n a l g a n g l i o n c e l l f u n c t i o n a n d s t r u c t u r e 103
� 2012 American College of Veterinary Ophthalmologists, Veterinary Ophthalmology, 15, 94–104
62. Hattar S, Lucas RJ, Mrosovsky N et al. Melanopsin and rod-cone
photoreceptive systems account for all major accessory visual
functions in mice. Nature 2003; 424: 76–81.
63. Fu Y, Zhong H, Wang M-HH et al. Intrinsically photosensitive
retinal ganglion cells detect light with a vitamin A-based
photopigment, melanopsin. Proceedings of the National Academy of
Sciences of the United States of America 2005; 102: 10339–10344.
64. Hattar S, Kumar M, Park A et al. Central projections of melanop-
sin-expressing retinal ganglion cells in the mouse. The Journal ofComparative Neurology 2006; 497: 326–349.
65. Brown TM, Wynne J, Piggins HD et al. Multiple hypothalamic
cell populations encoding distinct visual information. Journal of
Physiology 2011; 589: 1173–1194.
66. Ecker JL, Dumitrescu ON, Wong KY et al. Melanopsin-express-
ing retinal ganglion-cell photoreceptors: cellular diversity and role
in pattern vision. Neuron 2010; 67: 49–60.
67. Forte R, Ambrosio L, Bonavolonta P et al. Pattern electroretino-
gram optimized for glaucoma screening (PERGLA) and retinal
nerve fiber thickness in suspected glaucoma and ocular hyperten-
sion. Documenta Ophthalmologica 2010; 120: 187–192.
68. Huang Q, Chowdhury V, Coroneo MT. Evaluation of patient
suitability for a retinal prosthesis using structural and functional
tests of inner retinal integrity. Journal of Neural Engineering 2009;
6: 035010.
69. Freeman SR, Kozak I, Cheng L et al. Optical coherence tomography-
raster scanning and manual segmentation in determining drusen vol-
ume in age-related macular degeneration. Retina 2010; 30: 431–435.
70. Burkholder BM, Osborne B, Loguidice MJ et al. Macular volume
determined by optical coherence tomography as a measure of
neuronal loss in multiple sclerosis. Archives of Neurology 2009; 66:
1366–1372.
71. Garcia-Martin E, Pueyo V, Martin J et al. Progressive changes in
the retinal nerve fiber layer in patients with multiple sclerosis.
European Journal of Ophthalmology 2010; 20: 167–173.
72. Hajee ME, March WF, Lazzaro DR et al. Inner retinal layer thin-
ning in Parkinson disease. Archives of Ophthalmology 2009; 127:
737–741.
73. Fischer MD, Huber G, Beck SC et al. Noninvasive, in vivo assess-
ment of mouse retinal structure using optical coherence tomogra-
phy. PLoS One 2009; 4: e7507.
74. Hood DC, Salant JA, Arthur SN et al. The location of the infe-
rior and superior temporal blood vessels and interindividual vari-
ability of the retinal nerve fiber layer thickness. Journal ofGlaucoma 2010; 19: 158–166.
104 m o h a n E T A L .
� 2012 American College of Veterinary Ophthalmologists, Veterinary Ophthalmology, 15, 94–104