Characterization of Cysts Using Differential Correlation Coefficient Values from Two Dimensional...
19
Characterization of Cysts using Differential Correlation Coefficient Values from 2D Breast Elastography: Preliminary Study Rebecca C. Booi, PhD 1,2 , Paul L. Carson, PhD 1,2 , Matthew O’Donnell, PhD 2,3 , Marilyn A. Roubidoux, MD 1 , Anne L. Hall, PhD 4 , and Jonathan M. Rubin, MD, PhD 1 1 Dept of Radiology, University of Michigan, Ann Arbor, MI, USA 2 Biomedical Engineering Dept., University of Michigan, Ann Arbor, MI, USA 3 Department of Bioengineering, University of Washington, Seattle, WA, USA 4 General Electric Health Care, Milwaukee, WI, USA Abstract Though simple cysts are easily identified using sonography, description and management of non- simple cysts remains uncertain. This study evaluated whether the correlation coefficient differences between breast tissue and lesions, obtained from 2D breast elastography, could potentially distinguish non-simple cysts from cancers and fibroadenomas. We hypothesized that correlation coefficients in cysts would be dramatically lower than surrounding tissue because noise, imaging artifacts, and particulate matter move randomly and decorrelate quickly under compression, compared with solid tissue. For this preliminary study, 18 breast lesions (7 non-simple cysts, 4 cancers, and 7 fibroadenomas) underwent imaging with 2D elastography at 7.5 MHz through a TPX (a polymethyl pentene copolymer) 2.5 mm mammographic paddle. Breasts were compressed similar to mammographic positioning and then further compressed for elastography by 1–7%. Images were correlated using 2D phase-sensitive speckle tracking algorithms and displacement estimates were accumulated. Correlation coefficient means and standard deviations were measured in the lesion and adjacent tissue, and the differential correlation coefficient (DCC) was introduced as the difference between these values normalized to the correlation coefficient of adjacent tissue. Mean DCC values in non-simple cysts were 24.2 ± 11.6%, 5.7 ± 6.3% for fibroadenomas, and 3.8 ± 2.9 % for cancers (p < 0.05). Some of the cysts appeared smaller in DCC images than grayscale images. These encouraging results demonstrate that characterization of non-simple breast cysts may be improved by using DCC values from 2D elastography, which could potentially change management options of these cysts from intervention to imaging follow-up. A dedicated clinical trial to fully assess the efficacy of this technique is recommended. Keywords breast; cyst; elastography; elasticity imaging; speckle tracking Corresponding author: Jonathan Rubin, Postal Address: University of Michigan Medical Center, Department of Radiology, B1D502E, Ann Arbor, MI, USA 48109, Email [email protected], Phone: (734) 936-4487. Publisher's Disclaimer: This is a PDF file of an unedited manuscript that has been accepted for publication. As a service to our customers we are providing this early version of the manuscript. The manuscript will undergo copyediting, typesetting, and review of the resulting proof before it is published in its final citable form. Please note that during the production process errors may be discovered which could affect the content, and all legal disclaimers that apply to the journal pertain. NIH Public Access Author Manuscript Ultrasound Med Biol. Author manuscript; available in PMC 2009 January 1. Published in final edited form as: Ultrasound Med Biol. 2008 January ; 34(1): 12–21. NIH-PA Author Manuscript NIH-PA Author Manuscript NIH-PA Author Manuscript
-
Upload
independent -
Category
Documents
-
view
1 -
download
0
Transcript of Characterization of Cysts Using Differential Correlation Coefficient Values from Two Dimensional...
Characterization of Cysts using Differential CorrelationCoefficient Values from 2D Breast Elastography: PreliminaryStudy
Rebecca C. Booi, PhD1,2, Paul L. Carson, PhD1,2, Matthew O’Donnell, PhD2,3, Marilyn A.Roubidoux, MD1, Anne L. Hall, PhD4, and Jonathan M. Rubin, MD, PhD1
1 Dept of Radiology, University of Michigan, Ann Arbor, MI, USA
2 Biomedical Engineering Dept., University of Michigan, Ann Arbor, MI, USA
3 Department of Bioengineering, University of Washington, Seattle, WA, USA
4 General Electric Health Care, Milwaukee, WI, USA
AbstractThough simple cysts are easily identified using sonography, description and management of non-simple cysts remains uncertain. This study evaluated whether the correlation coefficient differencesbetween breast tissue and lesions, obtained from 2D breast elastography, could potentially distinguishnon-simple cysts from cancers and fibroadenomas. We hypothesized that correlation coefficients incysts would be dramatically lower than surrounding tissue because noise, imaging artifacts, andparticulate matter move randomly and decorrelate quickly under compression, compared with solidtissue. For this preliminary study, 18 breast lesions (7 non-simple cysts, 4 cancers, and 7fibroadenomas) underwent imaging with 2D elastography at 7.5 MHz through a TPX (a polymethylpentene copolymer) 2.5 mm mammographic paddle. Breasts were compressed similar tomammographic positioning and then further compressed for elastography by 1–7%. Images werecorrelated using 2D phase-sensitive speckle tracking algorithms and displacement estimates wereaccumulated. Correlation coefficient means and standard deviations were measured in the lesion andadjacent tissue, and the differential correlation coefficient (DCC) was introduced as the differencebetween these values normalized to the correlation coefficient of adjacent tissue. Mean DCC valuesin non-simple cysts were 24.2 ± 11.6%, 5.7 ± 6.3% for fibroadenomas, and 3.8 ± 2.9 % for cancers(p < 0.05). Some of the cysts appeared smaller in DCC images than grayscale images. Theseencouraging results demonstrate that characterization of non-simple breast cysts may be improvedby using DCC values from 2D elastography, which could potentially change management optionsof these cysts from intervention to imaging follow-up. A dedicated clinical trial to fully assess theefficacy of this technique is recommended.
Keywordsbreast; cyst; elastography; elasticity imaging; speckle tracking
Corresponding author: Jonathan Rubin, Postal Address: University of Michigan Medical Center, Department of Radiology, B1D502E,Ann Arbor, MI, USA 48109, Email [email protected], Phone: (734) 936-4487.Publisher's Disclaimer: This is a PDF file of an unedited manuscript that has been accepted for publication. As a service to our customerswe are providing this early version of the manuscript. The manuscript will undergo copyediting, typesetting, and review of the resultingproof before it is published in its final citable form. Please note that during the production process errors may be discovered which couldaffect the content, and all legal disclaimers that apply to the journal pertain.
NIH Public AccessAuthor ManuscriptUltrasound Med Biol. Author manuscript; available in PMC 2009 January 1.
Published in final edited form as:Ultrasound Med Biol. 2008 January ; 34(1): 12–21.
NIH
-PA Author Manuscript
NIH
-PA Author Manuscript
NIH
-PA Author Manuscript
Introduction and LiteratureBreast ultrasound is well respected for its ability to differentiate simple cysts from solid lesionswith 98–100% accuracy (Bassett and Kimme-Smith 1991; Hilton et al. 1986; Jackson 1995;Sickles et al. 1984). For a cyst to be characterized as “simple”, it must exhibit all four of thefollowing criteria: anechoic, well circumscribed, imperceptible wall, and posterior acousticenhancement (Berg et al. 2003; Hilton et al. 1986; Stavros 2004; Venta et al. 1999).Terminology of cysts which meet some but not all of these criteria varies, but includescomplicated cysts, complex cysts, cluttered microcysts, cystic lesions with a thick (perceptible)wall and/or thick (> 0.5 mm) septations which are > 50% cystic, and predominantly solidlesions with eccentric cystic foci (Berg et al. 2003; Mendelson et al. 2001; Stavros 2004; Ventaet al. 1999). The American College of Radiology (ACR) ultrasound breast imaging reportingand data system (BI-RADS) lexicon identifies a “complex cyst” as those cysts which containsome discrete solid component (ACR 2003). The ACR ultrasound BI-RADS system alsodefines “complicated cysts” as containing homogeneous low-level internal echoes and fluid-fluid or fluid-debris levels which can shift as the patient’s position changes (ACR 2003).
Non-simple cysts are common, and the percentage of cysts being classified as “complicated”or “complex” is increasing (Jackson 1990; Parker and Jobe 1993; Stavros 2004; Venta et al.1999). In a recent study, Berg et al. (2003) classified only 11% (16 of 150) of cystic lesions as“simple”. This increase in clinically observed non-simple cysts is at least partly due to the useof high quality ultrasound scanners which can both image small particulate matter and whichcreate artifacts, including reverberations, clutter, and sidelobes, in the cysts (Jackson 1990;Parker and Jobe 1993; Stavros 2004; Venta et al. 1999). An in vitro study by Helvie et al.(1996) reported that cyst fluid almost always exhibited internal echoes when imaged with highquality equipment, demonstrating that cysts are rarely anechoic and thus rarely simple.Therefore, finding a reliable imaging method to differentiate benign non-simple cysts fromsolid lesions is of great clinical importance.
Variability exists in how non-simple cysts should be managed, based on sonographic findings(many have suspicious sonographic appearances which can overlap with appearances of solidmasses), patient risk factors for breast cancer, and patient anxiety, with management optionsincluding 6-month or 1-year imaging follow-up, aspiration, aspiration with possible corebiopsy, and excisional biopsy (Mendelson et al. 2001; Stavros et al. 1995; Venta et al. 1999).Berg et al. (2003) reported a malignancy rate of 23% (18 of 79) for the complex cysts theyimaged that contained some degree of discrete solid components, stating that biopsy would berequired for these lesions. In contrast, the National Comprehensive Cancer Network (NCCN)reports that aspiration is the standard of care for non-simple cysts which do not contain solidcomponents (NCCN 2006). Reports of cysts which do not meet the strict criteria of simplecysts, but do not have a solid component, show very low malignancy rates between 0 – 1.4%(3 of 744 total cysts, or 0.4% on average) (Berg et al. 2003; Buchberger et al. 1999; Kolb etal. 1998; Louie et al. 2003; Venta et al. 1999). This low malignancy rate reveals that non-simplecysts with no solid components could be characterized as probably benign and managed withfollow-up imaging rather than aspiration or biopsy when accurately identified (Berg et al.2003; Venta et al. 1999). It may be possible to circumvent follow-up entirely if these cystscould be characterized with certainty. Because many patients have multiple cysts in each breast,needle aspiration, biopsy, or close follow up cannot be performed on each cyst.
Methods used to improve the characterization of non-simple cysts include decreasing dynamicrange, using tissue harmonic imaging, and using spatial compounding (Berg et al. 2003).Several groups have reported that the presence of internal echoes in a cyst precludes it frombeing classified as “simple”, however echoes which surround the anterior of the cyst are usuallyrecognized as reverberations (Venta et al. 1999). Spatial compounding has been successfully
Booi et al. Page 2
Ultrasound Med Biol. Author manuscript; available in PMC 2009 January 1.
NIH
-PA Author Manuscript
NIH
-PA Author Manuscript
NIH
-PA Author Manuscript
used to reduce speckle and other noise in cysts, but it can also reduce posterior acousticenhancement and its benefits decrease with increasing depth (Merritt et al. 2000).
Ultrasound elastography may prove to be a more viable tool to identify internal echoes createdby noise and artifacts, as well as fluid-debris and particulate matter. Elastography is a diagnosticmethod that evaluates the viscoelastic properties of tissue, as changes in tissue elasticity areusually related to an abnormal, pathological process. During breast elastography, a surrogateto manual palpation, tissue is externally deformed to create internal displacements.Displacements are estimated by tracking speckle movement in the ultrasound images beforeand after compression. The gradient of these displacements in the direction of the compressionis then calculated to create an elastogram which displays the relative induced strain in the imageregion.
Though breast elastography has demonstrated clinical utility in studies by Garra et al. (1997)and Hall et al. (2003), visualization of cysts in elastograms are often difficult. Garra et al.(1997) reported easy visualization of only 37% (3 of 8) cysts in their study, and even whenvisible, those cysts had ill-defined margins. Hall et al. (2003) also noted that because cystsrapidly decorrelate, they can appear relatively stiff or soft in elastograms, often depending onhow much strain is applied. Because the elastogram cannot be reliably used in cystcharacterization, the correlation coefficient derived from elastography could become a valuabletool in differentiating cysts from solid masses.
This study aims to exploit the rapid decorrelation of non-simple cysts observed in elastographyas a way to differentiate them from solid breast lesions. Because cysts are filled with fluid,they contain little speckle which can be tracked for elastography. Thus, the correlationcoefficient in that region will be markedly lower than in the rest of the tissue. One caveat isthat signal from surrounding tissue, including reverberations, clutter, and sidelobes cancontribute to signal in the cyst, increasing the correlation coefficient. Additionally, some breastcancers and fibroadenomas are highly hypoechoic, and the signal-to-noise ratio (SNR) inbreasts is often low. This could cause these lesions to decorrelate as quickly as non-simplecysts even though these lesions contain true speckle. The extent to which non-simple cystsdecorrelate relative to surrounding tissue in comparison with other breast lesions is explored.Whether improved cyst/solid mass differentiation could impact clinical management of non-simple cysts by allowing follow-up imaging rather than intervention is discussed.
Materials and MethodsRecruitment of Human Subjects
This study was approved by the institutional review board and informed consent was obtainedon all human subjects. The study was compliant with the Health Insurance Portability andAccountability Act. Subject confidentiality was protected at all times.
Twenty-six consecutive human subjects were recruited in two groups for participation in thisstudy over a 12 month period (02/01/2006 to 02/01/2007). The first group (N=16) were imagedimmediately before core biopsy with lesions classified as BI-RADS assessment category 4 or5 (ACR 2003). The second group (N=10) were subjects with known, benign lesions, diagnosedfrom previous biopsies (solid lesions) or previous clinical mammograms/ultrasounds (cysts).Participants in this study were required to have had previous clinical mammograms and allsolid lesions were pathologically diagnosed. After imaging, 8 subjects were excluded fromfinal analysis due to limitations introduced by our imaging system or post-processingtechnique, described below. These exclusion criteria will be detailed later in this section forclarity.
Booi et al. Page 3
Ultrasound Med Biol. Author manuscript; available in PMC 2009 January 1.
NIH
-PA Author Manuscript
NIH
-PA Author Manuscript
NIH
-PA Author Manuscript

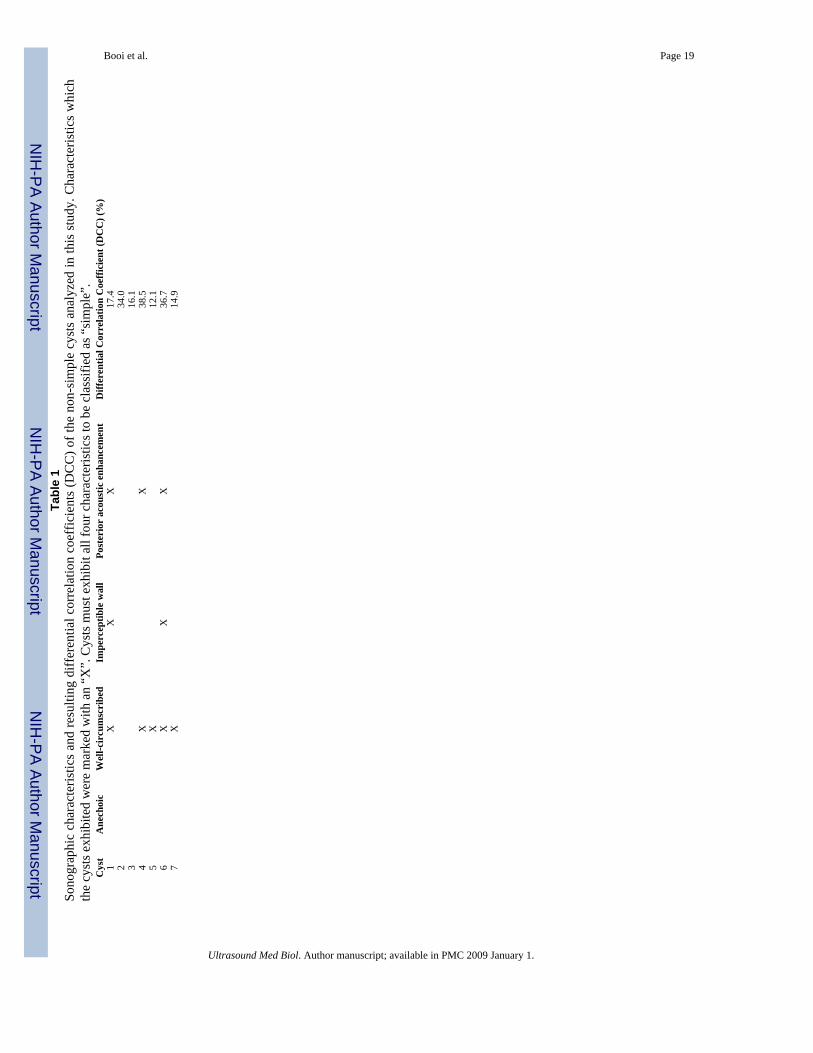
The final 18 lesions comprising the case group were characterized as 7 cysts, 4 cancers, and 7fibroadenomas. Two cancers were diagnosed as invasive ductal carcinomas and two werelobular carcinomas. All cysts were classified as benign and 71% (5 of 7) were managed byprevious mammogram(s) stability with 12-month imaging follow-ups while 29% (2 of 7) wereaspirated. All cysts were classified as “non-simple” based on their sonographic appearance atthe time of imaging because they only met some or none of the requirements for simple cysts(Table 1), but did not have solid components.
Overall, subjects had a mean age of 44.4 ± 7.7 (range 35–66) years. The mean age of womenwith cysts was 48.0 ± 4.8 years, with fibroadenomas was 39.6 ± 3.9 years, and with cancerswas 46.5 ± 13 years.
Lesion depth was measured as the distance from the transducer to the center of the lesion, whenthe breast was under compression. The mean depth of the cyst lesions (26.5 ± 8.0, range 14.5–33.5 mm) was compared with the mean depth of the fibroadenoma lesions (26.7 ± 4.7, range19.5–32 mm) and malignant lesions (24.0 ± 7.2, range 18–32.5 mm).
Lesion diameter was calculated from the grayscale ultrasound image of the compressed breastas the average of the transverse and longitudinal dimensions of the lesion. This measure wasevaluated between cysts (μcysts = 12.0 ± 4.7 mm) and each of the solid lesion groups(μfibroadenomas = 13.0 ± 7.5 mm, μcancers = 9.0 ± 1.2 mm).
Imaging MethodsThe elastography conducted in this study was completed as part of a larger study whichcombines 3D ultrasound and x-ray tomography for improved breast lesion characterization anddiagnosis (Booi et al. 2005; Booi et al. 2007; Kapur et al. 2004).
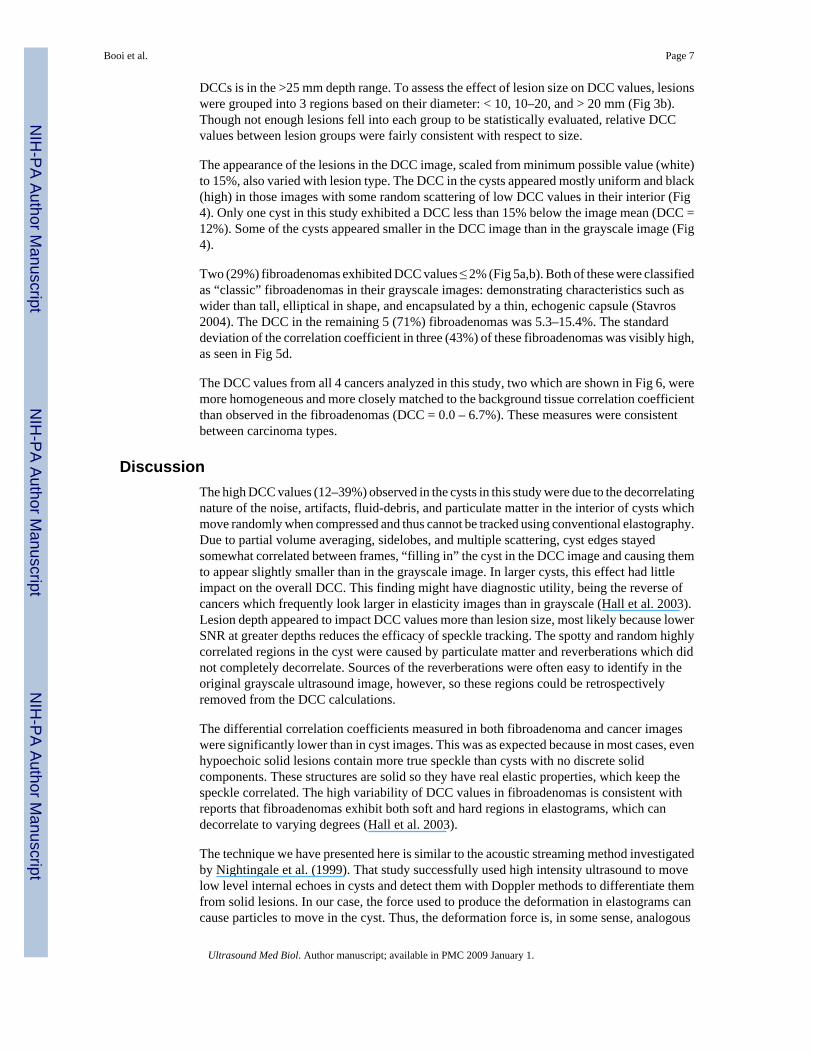
Subjects were seated throughout the entire exam. A radiologist with 16 years of breast imagingexperience initially located the lesions by manually scanning the transducer over the non-compressed breast and obtaining a 3D volume over the region-of-interest (ROI) using grayscalesonographic imaging. This scan was later used to assess the sonographic appearances of thecysts. After initial localization, the subject’s breast was compressed in our mammography-mimicking research device, co-built by General Electric (Schenectady, NY, USA) andUniversity of Michigan researchers (Ann Arbor, MI, USA) in a manner similar to cranial-caudal (CC) mammography and the ultrasound transducer was attached to a holder on the unit(Fig 1a,b). Water was then added to the paddle to acoustically couple between the transducerand paddle. Hairspray (Got2BGlued, Schwarzkopf & Henkel, Irvine, CA, USA) achievedcoupling between the paddle and breast with minimal signal degradation (Sinha et al. 2007).Preload, the amount of compression applied to the breast immediately before elastography wasperformed, was used to minimize chest wall motion in ultrasound images. This did not affectresults because preload effects are a manifestation of the non-linearity of Young’s modulusand cysts are not a continuous medium in the mechanical sense. To further minimize motion,subjects held their breath during scans. All radiofrequency (RF) images were acquired with aLOGIQ 9 ultrasound scanner (GE Healthcare, Milwaukee, WI, USA) using a 1D linear arrayoperating at 7.5 MHz through a TPX (a polymethyl pentene) paddle (speed of sound (c) = 2.22mm/μs) 2.5 mm thick mammographic paddle (Booi et al. 2005;Booi et al. 2007;Kapur et al.2004).
Compression for elastography was induced by automatically raising the lower compressionpaddle, which was mechanically damped to minimize vibration artifacts. This process wassupervised from a nearby computer which communicated through its serial port to a VXMstepper motor controller (Velmex, Bloomfield, NY, USA) connected to the paddle. In thismanner, 90 RF images for 2D elastography were continuously acquired by compressing at 2.5
Booi et al. Page 4
Ultrasound Med Biol. Author manuscript; available in PMC 2009 January 1.
NIH
-PA Author Manuscript
NIH
-PA Author Manuscript
NIH
-PA Author Manuscript
mm/s for up to 2 s and 7% strain. Mean strain was measured as the change in compressed breastthickness after compression divided by the original compressed breast thickness, multipliedby 100. A preliminary experiment was conducted to determine that the differential correlationcoefficient was approximately constant over the optimal strain imaging range, or 0.3–0.6% inthis study. Data were decimated off-line to fall in this range.
2D Correlation-based Speckle TrackingRF images were processed using conventional 2D phase-sensitive speckle tracking algorithms(Kaluzynski et al. 2001; Lubinski et al. 1999). These algorithms estimate tissue motion withcorrelation-based processing in the axial (along the ultrasound beam) and lateral (perpendicularto ultrasound beam) directions.
Calculation of the 2D correlation coefficients for elastography in this study follows. A 2Dcorrelation kernel (spatially equivalent to one speckle spot) is defined around every pixel inthe complex pre-deformation image. The size of the speckle in each direction is determinedfrom the full width at half maximum (FWHM) of the 2D autocorrelation function of the image.Next, the kernel is cross-correlated with the complex post-deformation image. The resultingunit-normalized, complex, cross-correlation coefficient at pixels (x, y) as a function of lags(lx, ly) is described in Equation 1. In this equation, Gt(x, y) is the original pre-deformationimage, Gt+1(x, y) is the post-deformation image, and Wij is a 2D hamming window over the2D correlation kernel.
(1)
To improve SNR, the correlation coefficient was then filtered with a unity gain function
( ), twice the speckle size:
(2)
The 2D displacement vector was then estimated from the peak position of the complexcorrelation function described in Equation 2 in a two step process. First, both axial and lateraldisplacements were determined from the correlation lags which correspond to the maximumvalue of the magnitude of the correlation function. Next, the axial displacement estimate wasrefined using the position of the closest zero-crossing of the phase of the complex correlationfunction. The final outputs of this processing are the lateral displacement u(x, y), axialdisplacement v(x, y), and magnitude of the correlation coefficient |ρ(x, y)|.
Estimated displacements were accumulated over the total deformation range (O’Donnell et al.1994). The final correlation coefficient image was then used to calculate differential correlationcoefficient values.
Calculation of Differential Correlation CoefficientsAfter speckle tracking, the lesion was manually segmented in the grayscale ultrasound image,at least 1 mm within its border to minimize boundary effects and ensure that no outside tissuecontributed to calculated lesion correlation coefficients. Correlation coefficient values in fatand glandular tissue were not independently calculated due to the dependence of depth on thecorrelation coefficient in fat tissue and the lack of sufficient glandular tissue in older breastsfor a reliable measurement. Background tissue was considered to be all tissue in the 4 cm ×
Booi et al. Page 5
Ultrasound Med Biol. Author manuscript; available in PMC 2009 January 1.
NIH
-PA Author Manuscript
NIH
-PA Author Manuscript
NIH
-PA Author Manuscript
3.9 cm (axial × lateral) image outside the lesion ROI. The differential correlation coefficientwas calculated according to:
(3)
where μρ,background is the mean correlation coefficient in the background ROI, and μρ, lesion isthe mean correlation coefficient in the lesion ROI. In order to create DCC images, Equation 3was applied to the correlation coefficient value of each pixel in the final correlation coefficientimage.
Statistical AnalysisDue to the high variability of data included in this study, it could not be assumed that datafollowed a normal statistical distribution. Thus all statistical analysis was conducted using aMann Whitney U-test because of its non-parametric assumptions in its calculations.Additionally, because this study had a small sample size, we chose to report an exact p-valuegiven by the Mann Whitney test, which is based on a finite sample distribution. P < 0.05 wasconsidered to indicate statistical significance. For completeness, we also conducted a 2-samplestudent t-test with unequal variances which confirmed statistical results in all cases. It shouldbe noted, however, that the sample size of the study might be too small to observe somedifferences which may exist.
Exclusion Criteria for Human SubjectsDue to limitations introduced by our imaging methods and post-processing techniques, as wellas pathology results which were only available after recruitment for this study, someexaminations were retrospectively excluded from analysis. Lesions deeper than 4 cm whencompressed were excluded because the SNR at those depths is too low for the speckle trackingalgorithms to work reliably (N=1). Lesions compressed to < 1% total additional strain duringthe exam were also excluded from analysis because the deformation was too small (N=2)(Rubin et al. 2006). Finally, because the goal of this study is to differentiate non-simple cystsfrom solid breast masses, subjects whose pathology results did not characterize their lesionsas a fibroadenoma or cancer and cysts characterized as simple were excluded from final analysis(N=5).
ResultsSubject Population
Age differences between cyst and cancer groups were not statistically significant (P = 0.21),but differences between cyst and fibroadenoma group ages were (P = 0.006). No statisticaldifferences were found between cysts and solid lesion groups regarding lesion depths anddiameters (P ≫ 0.1).
2D ElastographyMean and standard deviation of the DCC between cysts and tissue was 24.2 ± 11.6%, comparedwith 5.7 ± 6.3% (P = 0.002) for fibroadenomas and 3.8 ± 2.9% for cancers (P = 0.006) (Fig 2).Overall, much lower correlations (12–39%) were observed in cysts than in surrounding tissue,as expected. The DCC for each cyst, along with its sonographic characteristics, is listed inTable 1. No cyst exhibited a higher correlation coefficient than the background in this study,though one fibroadenoma did (DCC = −5.6%).
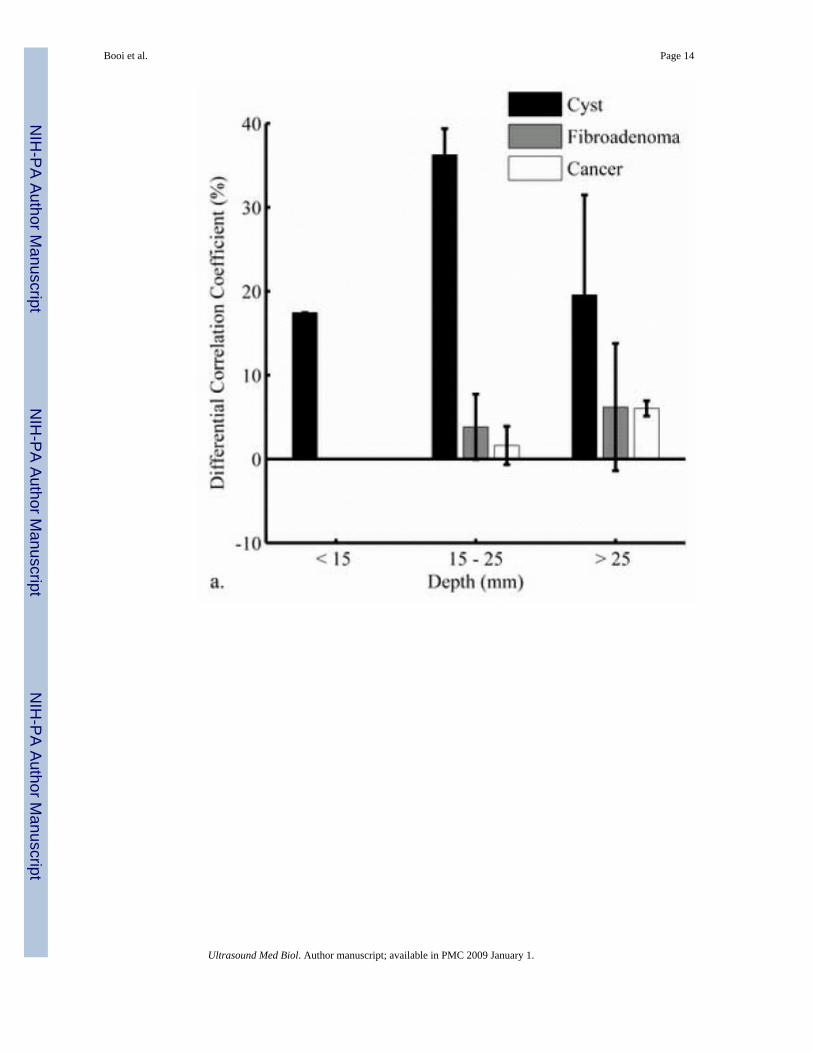
Fig 3a compares DCCs for three depth groups: <15 mm, 15–25 mm, and >25 mm. Though thesize of these sub-groups is too small for statistical comparison, the smallest difference between
Booi et al. Page 6
Ultrasound Med Biol. Author manuscript; available in PMC 2009 January 1.
NIH
-PA Author Manuscript
NIH
-PA Author Manuscript
NIH
-PA Author Manuscript
DCCs is in the >25 mm depth range. To assess the effect of lesion size on DCC values, lesionswere grouped into 3 regions based on their diameter: < 10, 10–20, and > 20 mm (Fig 3b).Though not enough lesions fell into each group to be statistically evaluated, relative DCCvalues between lesion groups were fairly consistent with respect to size.
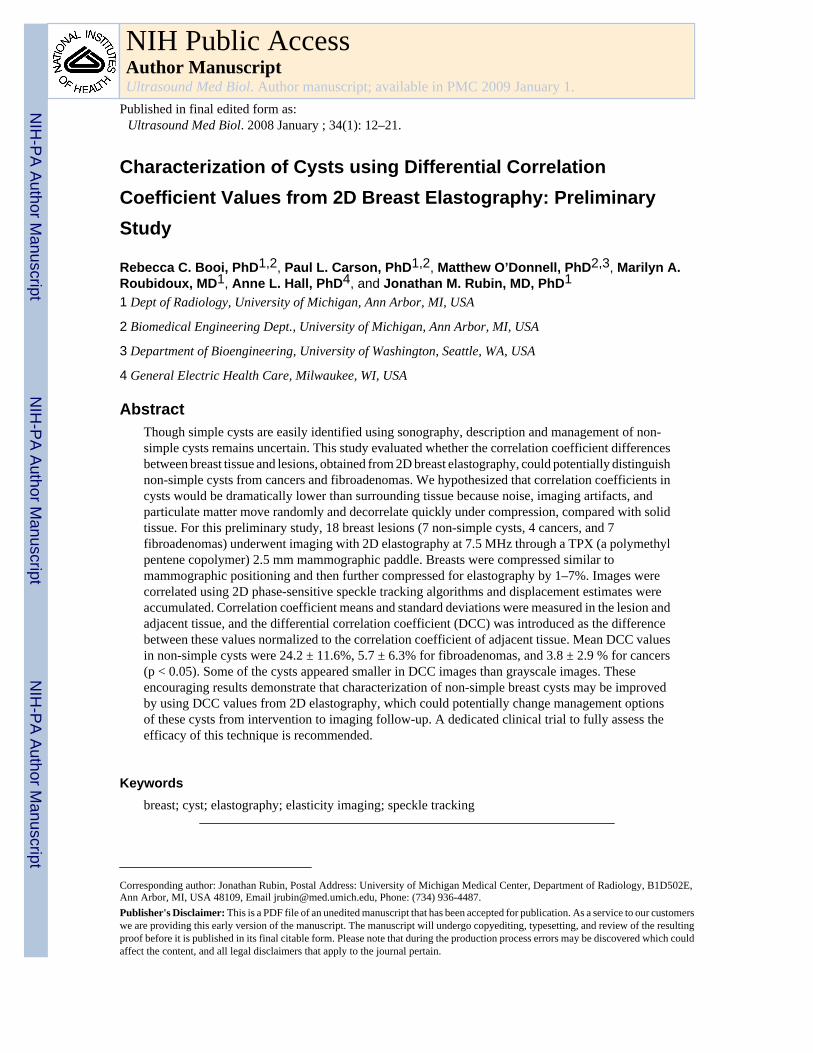
The appearance of the lesions in the DCC image, scaled from minimum possible value (white)to 15%, also varied with lesion type. The DCC in the cysts appeared mostly uniform and black(high) in those images with some random scattering of low DCC values in their interior (Fig4). Only one cyst in this study exhibited a DCC less than 15% below the image mean (DCC =12%). Some of the cysts appeared smaller in the DCC image than in the grayscale image (Fig4).
Two (29%) fibroadenomas exhibited DCC values ≤ 2% (Fig 5a,b). Both of these were classifiedas “classic” fibroadenomas in their grayscale images: demonstrating characteristics such aswider than tall, elliptical in shape, and encapsulated by a thin, echogenic capsule (Stavros2004). The DCC in the remaining 5 (71%) fibroadenomas was 5.3–15.4%. The standarddeviation of the correlation coefficient in three (43%) of these fibroadenomas was visibly high,as seen in Fig 5d.
The DCC values from all 4 cancers analyzed in this study, two which are shown in Fig 6, weremore homogeneous and more closely matched to the background tissue correlation coefficientthan observed in the fibroadenomas (DCC = 0.0 – 6.7%). These measures were consistentbetween carcinoma types.
DiscussionThe high DCC values (12–39%) observed in the cysts in this study were due to the decorrelatingnature of the noise, artifacts, fluid-debris, and particulate matter in the interior of cysts whichmove randomly when compressed and thus cannot be tracked using conventional elastography.Due to partial volume averaging, sidelobes, and multiple scattering, cyst edges stayedsomewhat correlated between frames, “filling in” the cyst in the DCC image and causing themto appear slightly smaller than in the grayscale image. In larger cysts, this effect had littleimpact on the overall DCC. This finding might have diagnostic utility, being the reverse ofcancers which frequently look larger in elasticity images than in grayscale (Hall et al. 2003).Lesion depth appeared to impact DCC values more than lesion size, most likely because lowerSNR at greater depths reduces the efficacy of speckle tracking. The spotty and random highlycorrelated regions in the cyst were caused by particulate matter and reverberations which didnot completely decorrelate. Sources of the reverberations were often easy to identify in theoriginal grayscale ultrasound image, however, so these regions could be retrospectivelyremoved from the DCC calculations.
The differential correlation coefficients measured in both fibroadenoma and cancer imageswere significantly lower than in cyst images. This was as expected because in most cases, evenhypoechoic solid lesions contain more true speckle than cysts with no discrete solidcomponents. These structures are solid so they have real elastic properties, which keep thespeckle correlated. The high variability of DCC values in fibroadenomas is consistent withreports that fibroadenomas exhibit both soft and hard regions in elastograms, which candecorrelate to varying degrees (Hall et al. 2003).
The technique we have presented here is similar to the acoustic streaming method investigatedby Nightingale et al. (1999). That study successfully used high intensity ultrasound to movelow level internal echoes in cysts and detect them with Doppler methods to differentiate themfrom solid lesions. In our case, the force used to produce the deformation in elastograms cancause particles to move in the cyst. Thus, the deformation force is, in some sense, analogous
Booi et al. Page 7
Ultrasound Med Biol. Author manuscript; available in PMC 2009 January 1.
NIH
-PA Author Manuscript
NIH
-PA Author Manuscript
NIH
-PA Author Manuscript
in our method to the radiation force used by Nightingale et al (1999) and is independent ofmechanical index (MI). Our differential correlation coefficient technique may be additionallyefficacious in cysts which contain cells that are too large to be moved solely by the energy ofthe ultrasound beam, such as red blood cells, white blood cells, epithelial cells, and apocrinecells (Stavros 2004).
An additional advantage to this technique is that it should be independent of preload. Thoughtissue elasticity contrast decreases with preload due to the nonlinearity of tissue, the correlationcoefficient in a cyst will be low regardless of preload. Any speckle in a cyst is either noise ormoves randomly when compressed, independent of the level of pre-compression. This canfurther be extended to the true statement that any strain measured in a cyst must be noise.
Recall that conventional speckle tracking algorithms used in elasticity imaging maximizecorrelation coefficient values to estimate displacements after tissue deformation. In this way,differential correlation coefficient values are simultaneously calculated with elastogramswithout additional computations and strain evaluations of solid masses can be complementedwith differential correlation coefficient imaging to determine if a mass is cystic or solid. Sinceclinical machines capable of performing strain imaging in real time are in clinical use (Janssenet al 2007, Thomas et al 2007), differential correlation coefficient images could besimultaneously displayed along with tissue strain in real time.
This preliminary study had several limitations. First, imaging with a mammography-mimicking system limited visualization of breast lesions to the CC view, which some timesincreased the imaging depth of the lesions. Because ultrasound SNR is low in most breastlesions and decreases with depth, low SNR could cause fibroadenomas and cancers to bemistaken for cysts in the ultrasound images, or to be obscured completely. Additionally, lowSNR could dominate decorrelation and greatly increase the DCC in fibroadenomas and cancers.Both of these effects would increase the likelihood of false negatives in this study and weresome times emphasized in this study by imaging through the mammographic paddle ratherthan the position which placed the lesion closest to the transducer. However, use of a horizontalrotational axis as on standard mammographic systems and our combined ultrasound/mammography system or use of free-hand ultrasound, as would generally be done clinically,on a real-time elastography scanner would eliminate this limitation for cases in which the CCmammographic view is not ideal. In addition, freehand scanning would be expected to onlyincrease the amount of available signal in solid masses, thus improving the discriminationbetween cyst and solid beyond what we have detected. In some sense, we have defined a lowerbound for the differentiation between cystic and solid masses.
As a preliminary study, we did not preferentially select any of the lesions for analysis. Butfuture studies could preferentially select human subjects with cancers which are cystic inappearance (round, non-spiculated cancers) and hypoechoic to assess the full utility of thistechnique. Because some complex cysts can have solid components, future studies should alsoaspirate and/or biopsy all cysts after imaging in order to fully understand the DCC values innon-simple cysts with only fluid components versus cysts with mixed fluid/solid components.
In this regard, only two of sever simple cysts in this study were aspirated, and although it hasnot been proven that the remaining five masses were cysts, these masses were deemed benigncysts by our clinical institutional criteria (see Methods section). At our institution, all breastultrasound is performed by breast imaging sub-specialized radiologists, and we believe thismay result in greater specificity or accuracy in determining benign from malignant masses. Inour experience, aspirating these cysts would have needlessly inflicted an interventionalprocedure on these five patients. Further, the five cysts that were not aspirated did not changeover a year’s time. Because these cases had 12 month stability and were classified as benign,
Booi et al. Page 8
Ultrasound Med Biol. Author manuscript; available in PMC 2009 January 1.
NIH
-PA Author Manuscript
NIH
-PA Author Manuscript
NIH
-PA Author Manuscript

they are extremely unlikely (<2% risk) to have solid elements (Crystal et al 2003, Kolb et al1998). . Thus, the technique appears in this very small sample to be able to distinguish clinicallydiagnosed benign complex cysts from malignant masses at our institution. However in othersettings wherein breast ultrasound is performed by technologists, this differential correlationcoefficient imaging can be an independent additional test providing the interpreting radiologistwith greater certainty toward distinguishing a non-simple cyst from a solid mass and mayindeed offer greater accuracy.
In the future, this technique could be applied with 3D elastography, which should further reducethe correlation coefficient in the cysts while maintaining the background correlationcoefficient, causing the overall DCC in cysts to increase. Both the increased kernel size andthe increased scanning time inherent in 3D imaging would contribute to these increased values.
Potential clinical implicationsThe goal of this technique, and of most clinical importance, is whether it can differentiate non-simple cysts from cancerous lesions. This differentiation could result in a reduction of thenumber of cysts that require aspiration or biopsy and could be especially efficacious in womenwith multiple lesions. Coupled with the potential to reduce interventions of benign masses isthe opportunity to reduce costs and times associated with those procedures: because localizedbreast sonography is ¼ the cost of cyst aspiration, this could tremendously reduce clinical costs(Hilton et al. 1986).
Even with a small subject size (N=18), the DCC differences between cysts and cancers arestatistically significant. If a threshold were set based on these values, equal to the mean DCCin the cancer plus three standard deviations, then the cutoff between benign and malignantlesions would be 12.5%. Because the greatest DCC value exhibited by a cancer in this studywas 6.7%, no false-negatives would be created with this technique. Only one cyst fell belowthis threshold (DCC = 12.1%) and though one fibroadenoma in this study fell above thisthreshold (DCC = 15.4%), there are no negative clinical implications of mischaracterizing afibroadenoma as a cyst.
Based on this promising preliminary data which suggests the feasibility of this technique, thisstudy will hopefully lead the way toward larger, dedicated clinical trials. Additional factors ofcyst characterization, such as signal level and increased through-transmission, could becombined with differential correlation coefficient values for improved cyst identification.
SummaryCysts, fibroadenomas, and carcinomas are the most common masses in the female breast andreliable differentiation of these masses is of great clinical importance (Harper 1985; Hilton etal. 1986). The low malignancy rate of non-simple cysts which contain no solid componentssuggest that they can be monitored through 6-month or 1-year follow up imaging studies, ratherthan intervention when reliably characterized (Venta et al. 1999). As the number of non-simplecysts observed clinically continues to increase, non-invasive methods to distinguish these cystsfrom solid breast lesions, including cancers and fibroadenomas, will become increasinglyvaluable.
The goal of this very preliminary study was to demonstrate the potential for using differentialcorrelation coefficients in distinguishing non-simple cysts from solid masses and to discussthe need for such differentiation and the possible clinical impact. Although the numbers in thisstudy are small, the results are consistent with what one would expect from signal processingtheory and continuum mechanics/generalized Hooke’s Law (Hall et al 2003, Chou and Pagano
Booi et al. Page 9
Ultrasound Med Biol. Author manuscript; available in PMC 2009 January 1.
NIH
-PA Author Manuscript
NIH
-PA Author Manuscript
NIH
-PA Author Manuscript
1992). Clearly, a larger, dedicated trial must be conducted to ascertain the fidelity of thistechnique.
The differential correlation coefficient introduced in this study exploits the decorrelating natureof noise, artifacts, and particulate matter found in non-simple cysts to differentiate them fromsolid lesions or non-simple cystic lesions with solid components. Although ultrasound isgenerally excellent for cyst determination, non-simple breast cysts can be difficult to diagnosebecause of exactly these same artifacts, clutter, and particulate matter (Jackson 1990; Parkerand Jobe 1993; Stavros 2004; Venta et al. 1999, Helvie et al 1996).
In contrast, solid tissue components, in solid masses or in cysts with solid components, containtrue speckle which will stay correlated even when external compression is applied. Thistechnique is essentially an independent imaging method for confirming a breast mass is a cyst.Though the sonographic appearance of non-simple cysts can overlap with that of solid breastlesions, the DCC values in cysts are statistically different from solid lesions. Thus, differentialcorrelation coefficient measures have the potential to increase confidence that a lesion is 1) acyst and 2) suggest that a lesion does not contain solid components. Hopefully, after moreextensive investigations, differential correlation coefficient imaging would potentially supportthe conviction that suspicious lesions were indeed cysts, thus possibly reducing aspirations ofnon-symptomatic complicated cysts by changing the management to follow-up imaging.
Acknowledgements
This work was supported in part by NIH Grants R21–CA109440 and RO1–CA91713.
ReferencesAmerican College of Radiology (ACR). Breast imaging reporting and data system (BI-RADS). Reston,
VA: American College of Radiology; 2003.Bassett LW, Kimme-Smith C. Breast sonography. AJR Am J Roentgenol 1991;156:449–455. [PubMed:
1899737]Berg WA, Campassi CI, Ioffe OB. Cystic lesions of the breast: Sonographic-pathologic correlation.
Radiology 2003;227:183–191. [PubMed: 12668745]Booi RC, Carson PL, Erkamp RQ, Xie H, Kapur A, LeCarpentier GL, Roubidoux MA, Fowlkes JB,
O’Donnell M. Applying in vitro elasticity imaging results to optimize in vivo breast lesioncharacterization using a combined 3D ultrasound/digital x-ray system. Proceedings of the IEEEUltrasonics Symposium 2005:727–730.
Booi RC, Krucker JF, Goodsitt MM, O'Donnell M, Kapur A, LeCarpentier GL, Roubidoux MA, FowlkesJB, Carson PL. Evaluating thin compression paddles for mammographically compatible ultrasound.Ultrasound Med Biol 2007;33(3):472–482. [PubMed: 17280765]
Buchberger W, DeKoekkoek-Doll P, Springer P, Obrist P, Dunser M. Incidental findings on sonographyof the breast: clinical significance and diagnostic workup. AJR Am J Roentgenol 1999;173:921–927.[PubMed: 10511149]
Chou, PC.; Pagano, NJ. Elasticity – tensor, dyadic, and engineering approaches. New York: DoverPublications, Inc; 1992. p. 54-60.
Crystal P, Strano SD, Shcharynski S, Koretz MJ. Using sonography to screen women withmammographically dense breasts. Am J Roentgenol 2003;181:177–82. [PubMed: 12818853]
Garra BS, Cespedes EI, Ophir J, Spratt SR, Zuurbier RA, Magnant CM, Pennanen MF. Elastography ofbreast lesions: initial clinical results. Radiology 1997;202:79–86. [PubMed: 8988195]
Hall TJ, Zhu Y, Spalding CS. In vivo real-time freehand palpation imaging. Ultrasound Med Biol2003;29:427–435. [PubMed: 12706194]
Harper, P. Ultrasound mammography. Baltimore: University Park Press; 1985.Helvie MA, Bude RO, Joynt L, Naylor B, Rubin JM. In Vitro Sonographic Evaluation of Aspirated
Hypoechoic and Anechoic Breast Cyst Fluid. Breast Dis 1996;9:15.
Booi et al. Page 10
Ultrasound Med Biol. Author manuscript; available in PMC 2009 January 1.
NIH
-PA Author Manuscript
NIH
-PA Author Manuscript
NIH
-PA Author Manuscript

Hilton SV, Leopold GR, Olson LK, Willson SA. Real-time breast sonography: application in 300consecutive patients. AJR Am J Roentgenol 1986;147:479–486. [PubMed: 3526839]
Jackson VP. The role of US in breast imaging. Radiology 1990;177:305–311. [PubMed: 2217759]Jackson VP. The current role of US in breast imaging. Radiol Clin North Am 1995;33:1167–1170.Janssen J, Schlörer E, Greiner L. EUS elastography of the pancreas: feasibility and pattern description
of the normal pancreas, chronic pancreatitis, and focal pancreatic lesions. Gastrointestinal Endoscopy2007;65:971–978. [PubMed: 17531630]
Kaluzynski K, Chen X, Emelianov SY, Skovoroda AR, O’Donnell M. Strain rate imaging using two-dimensional speckle tracking. IEEE Trans Ultrason Ferroelectr Freq Control 2001;48:1111–1123.[PubMed: 11477770]
Kapur A, Carson PL, Eberhard J, Goodsitt MM, Thomenius K, Lokhandwalla M, Buckley D, RoubidouxMA, Helvie MA, Booi RC, LeCarpentier GL, Erkamp RQ, Chan HP, Fowlkes JB, Thomas JA,Landberg CE. Combination of digital mammography with semi-automated 3D breast ultrasound.Technol Cancer Res Treat 2004;3:325–334. [PubMed: 15270583]
Louie L, Velez N, Earnest D, Staren ED. Management of nonpalpable ultrasound-indeterminate breastlesions. Surgery 2003;134:667–673. [PubMed: 14605628]
Lubinski M, Emelianov S, O’Donnell M. Speckle Tracking Methods for Ultrasonic Elasticity ImagingUsing Short-Time Correlation. IEEE Trans Ultrason Ferroelectr Freq Control 1999;46:82–96.[PubMed: 18238401]
Mendelson EB, Berg WA, Merritt CR. Toward a standardized breast ultrasound lexicon, BI-RADS:ultrasound. Semin Roentgenol 2001;36:217–225. [PubMed: 11475068]
Merritt C, Piccoli C, Forsberg F, Wilkes A, Cavanaugh B, Lee S. Real-time spatial compound imagingof the breast: clinical evaluation of masses (abst). Radiology 2000;217:491–492.
National Comprehensive Cancer Network (NCCN). Breast cancer screening and diagnosis. 2007Nightingale KR, Kornguth PJ, Trahey GE. The use of acoustic streaming in breast lesion diagnosis: a
clinical study. Ultrasound Med Biol 1999;25:75–87. [PubMed: 10048804]O’Donnell M, Skovoroda AR, Shapo BM, Emelianov SY. Internal displacement and strain imaging using
ultrasonic speckle tracking. IEEE Trans Ultrason Ferroelectr Freq Control 1994;41:314–325.Parker, SH.; Jobe, WE. Percutaneous breast biopsy. 1. New York: Raven; 1993. p. 111-114.Rubin JM, Xie H, Kim K, Weitzel WF, Emelianov SY, Aglyamov SR, Wakefield TW, Urquhart AG,
O'Donnell M. Sonographic elasticity imaging of acute and chronic deep venous thrombosis in human.J Ultrasound Med 2006;25:1179–1186. [PubMed: 16929019]
Sickles EA, Filly RA, Callen PW. Benign breast lesions: ultrasound detection and diagnosis. Radiology1984;151:467–470. [PubMed: 6709920]
Sinha SP, Goodsitt MM, Roubidoux MA, Booi RC, LeCarpentier GL, Lashbrook CR, Thomenius K,Chalek CL, Carson PL. Automated ultrasound scanning on a dual modality breast imaging system:coverage and motion issues and solutions. J Ultras Med. in press
Stavros AT, Thickman D, Rapp CL, Dennis MA, Parker SH, Sisney GA. Solid breast nodules: use ofsonography to distinguish between benign and malignant lesions. Radiology 1995;196:123–134.[PubMed: 7784555]
Stavros, AT. Breast Ultrasound. Philadelphia, PA: Lippincott Williams & Wilkins; 2004. Sonographicevaluation of breast cysts; p. 276-350.
Thomas A, Kummel S, Gemeinhardt O, Fischer T. Real-time sonoelastography of the cervix: tissueelasticity of the normal and abnormal cervix. Acad Radiol 2007;14:193–200. [PubMed: 17236992]
Venta LA, Kim JP, Pelloski CE, Morrow M. Management of complex breast cysts. AJR Am J Roentgenol1999;173:1331–1336. [PubMed: 10541113]
Booi et al. Page 11
Ultrasound Med Biol. Author manuscript; available in PMC 2009 January 1.
NIH
-PA Author Manuscript
NIH
-PA Author Manuscript
NIH
-PA Author Manuscript
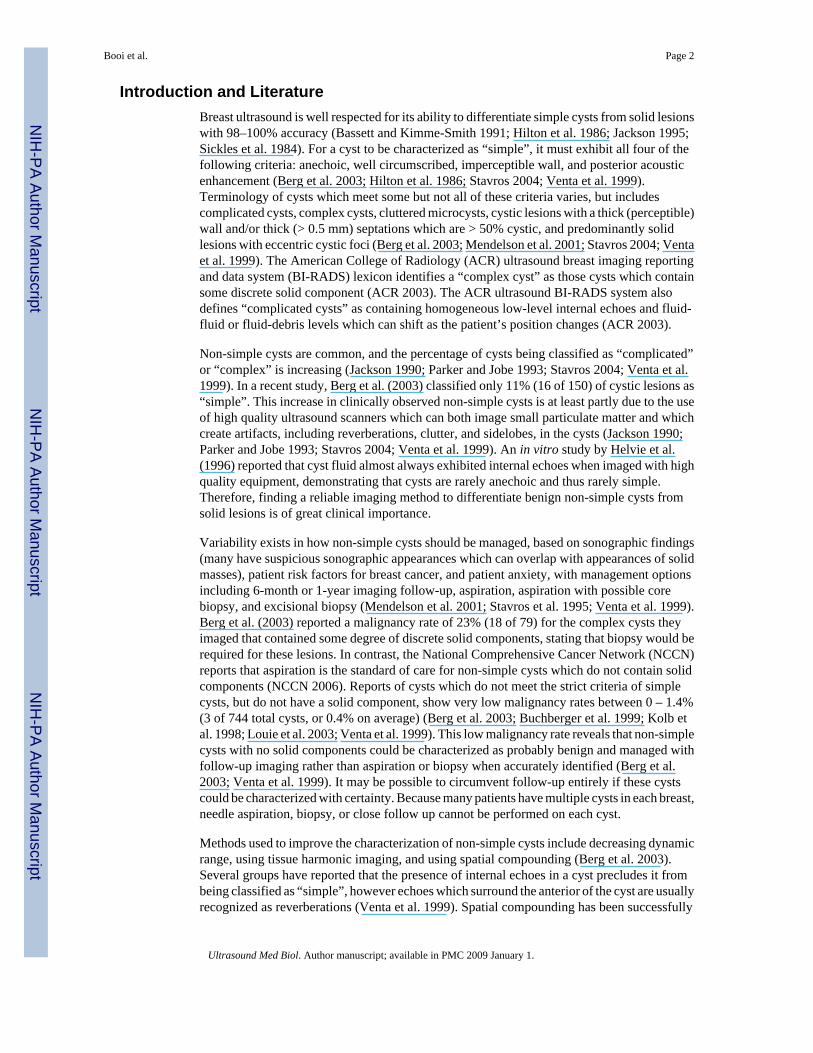
Figure 1.Mammography-mimicking research device (left) and GE LOGIQ 9 ultrasound scanner (right)used in all experiments in this study (a). After moderate pre-compression of the subject’s breast(white arrow) with the TPX (a polymethyl pentene) 2.5 mm thick mammographic paddle (blackarrows) (b), additional compression was induced for elastography via stepper motor control.Water was poured in the paddle to provide acoustic coupling during scans (not pictured).
Booi et al. Page 12
Ultrasound Med Biol. Author manuscript; available in PMC 2009 January 1.
NIH
-PA Author Manuscript
NIH
-PA Author Manuscript
NIH
-PA Author Manuscript
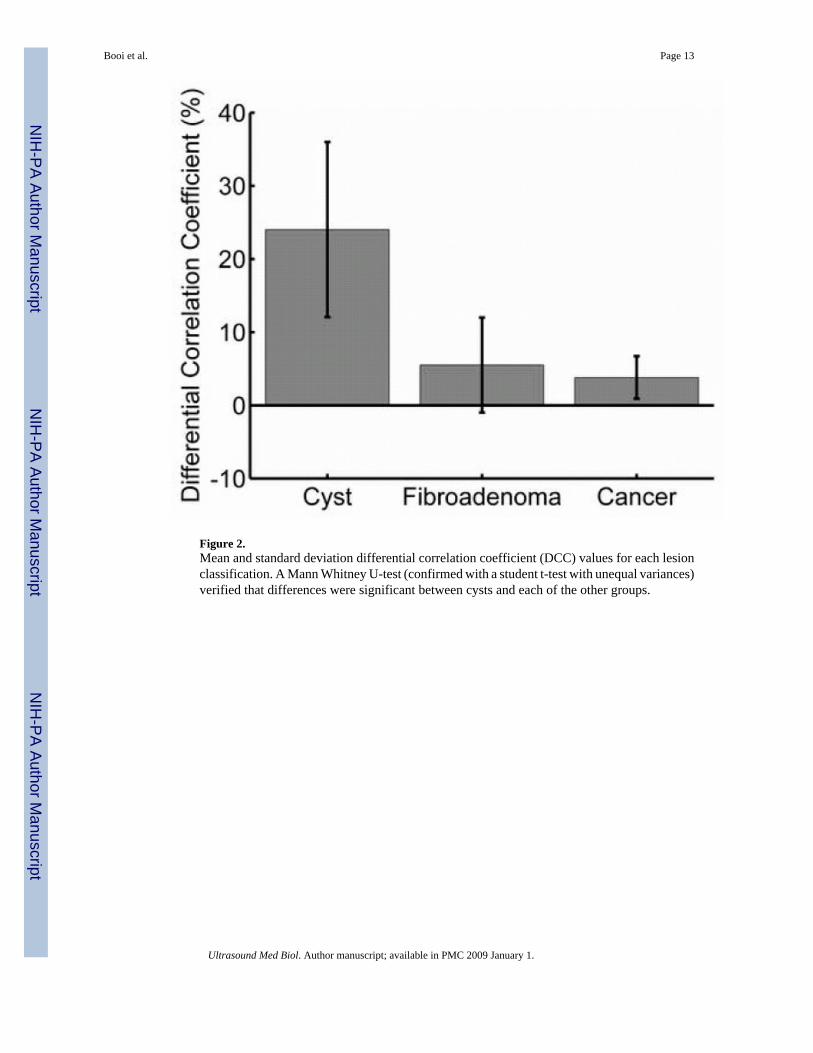
Figure 2.Mean and standard deviation differential correlation coefficient (DCC) values for each lesionclassification. A Mann Whitney U-test (confirmed with a student t-test with unequal variances)verified that differences were significant between cysts and each of the other groups.
Booi et al. Page 13
Ultrasound Med Biol. Author manuscript; available in PMC 2009 January 1.
NIH
-PA Author Manuscript
NIH
-PA Author Manuscript
NIH
-PA Author Manuscript
Booi et al. Page 14
Ultrasound Med Biol. Author manuscript; available in PMC 2009 January 1.
NIH
-PA Author Manuscript
NIH
-PA Author Manuscript
NIH
-PA Author Manuscript

Figure 3.Analysis of differential correlation coefficient (DCC) values grouped according to lesion depth(a) and diameter (b). Statistical comparison was not possible due to the low number of lesionsin each group. The most overlap between lesion types occurred at the greatest depths analyzedin this study, most likely due to the decorrelation being dominated by the low signal-to-noise(SNR) in the lesions. Characterization of small (< 10 mm) lesions may not be adversely affectedby this technique, if partial volume averaging and sidelobe “fill in” do not dominate DCCvalues.
Booi et al. Page 15
Ultrasound Med Biol. Author manuscript; available in PMC 2009 January 1.
NIH
-PA Author Manuscript
NIH
-PA Author Manuscript
NIH
-PA Author Manuscript
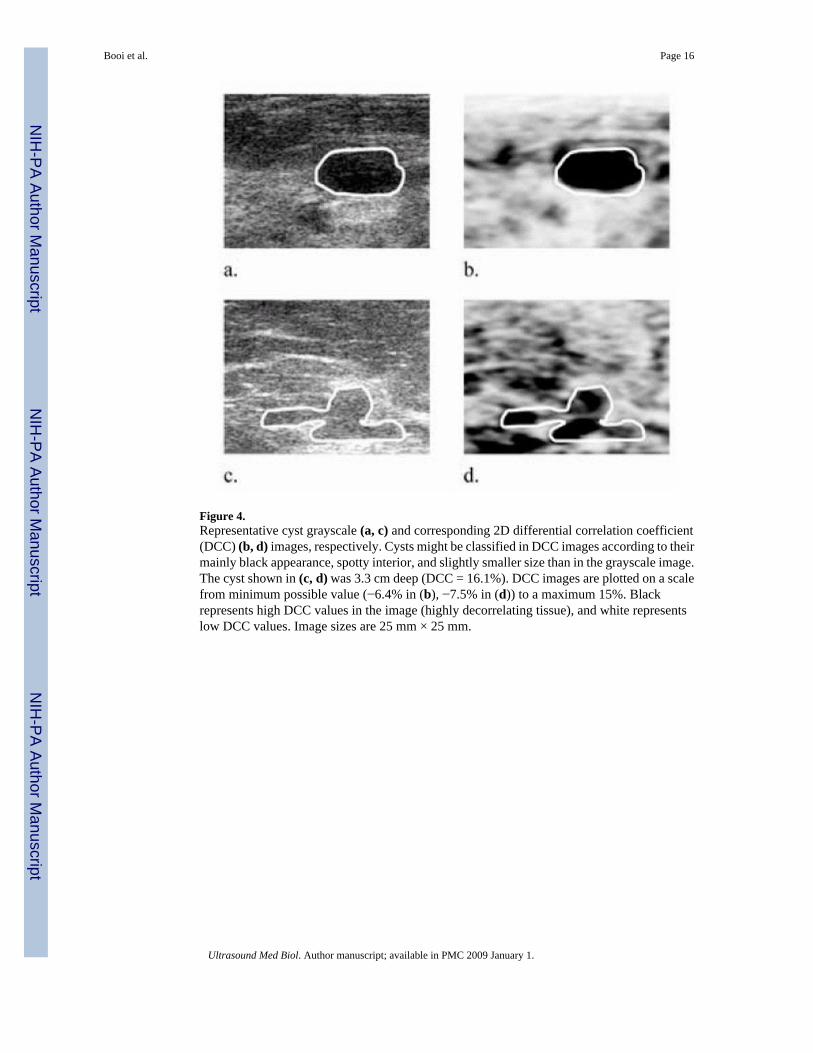
Figure 4.Representative cyst grayscale (a, c) and corresponding 2D differential correlation coefficient(DCC) (b, d) images, respectively. Cysts might be classified in DCC images according to theirmainly black appearance, spotty interior, and slightly smaller size than in the grayscale image.The cyst shown in (c, d) was 3.3 cm deep (DCC = 16.1%). DCC images are plotted on a scalefrom minimum possible value (−6.4% in (b), −7.5% in (d)) to a maximum 15%. Blackrepresents high DCC values in the image (highly decorrelating tissue), and white representslow DCC values. Image sizes are 25 mm × 25 mm.
Booi et al. Page 16
Ultrasound Med Biol. Author manuscript; available in PMC 2009 January 1.
NIH
-PA Author Manuscript
NIH
-PA Author Manuscript
NIH
-PA Author Manuscript

Figure 5.Representative fibroadenoma grayscale (a, c) and corresponding 2D differential correlationcoefficient (DCC) (b, d) images, respectively. Fibroadenomas might be classified in DCCimages according to their lower mean DCC values coupled with high standard deviations. Theclassic fibroadenoma in (a) exhibited a DCC = 3.2% in (b). The fibroadenoma in (c, d)exhibited the greatest DCC by a fibroadenoma in this study (15.4%, depth = 3.1 cm). DCCimages are plotted on a scale from minimum possible value (−7.5% in (b), −9.9% in (d)) to amaximum 15%. Black represents high DCC values in the image (highly decorrelating tissue),and white represents low DCC values. Image sizes are 25 mm × 25 mm.
Booi et al. Page 17
Ultrasound Med Biol. Author manuscript; available in PMC 2009 January 1.
NIH
-PA Author Manuscript
NIH
-PA Author Manuscript
NIH
-PA Author Manuscript

Figure 6.Representative cancer grayscale (a, c) and corresponding 2D differential correlation coefficient(DCC) (b, d) images, respectively. Cancers might be classified in DCC images according toboth their lower mean DCC values and lower standard deviations as evidenced in (b). Thecancer in (d) (DCC = 5.4%) was described clinically as having posterior acoustic enhancement,though it did not meet strict sonographic criteria for a cyst. Pathology results confirmed it wasan invasive ductal carcinoma, Bloom-Richardson grade 2. DCC images are plotted on a scalefrom minimum possible value (−7.5% in (b) and (d)) to a maximum 15%. Black representshigh DCC values in the image (highly decorrelating tissue), and white represents low DCCvalues. Image sizes are 25 mm × 25 mm.
Booi et al. Page 18
Ultrasound Med Biol. Author manuscript; available in PMC 2009 January 1.
NIH
-PA Author Manuscript
NIH
-PA Author Manuscript
NIH
-PA Author Manuscript
NIH
-PA Author Manuscript
NIH
-PA Author Manuscript
NIH
-PA Author Manuscript
Booi et al. Page 19Ta
ble
1So
nogr
aphi
c ch
arac
teris
tics
and
resu
lting
diff
eren
tial c
orre
latio
n co
effic
ient
s (D
CC
) of t
he n
on-s
impl
e cy
sts
anal
yzed
in th
is s
tudy
. Cha
ract
eris
tics
whi
chth
e cy
sts e
xhib
ited
wer
e m
arke
d w
ith a
n “X
”. C
ysts
mus
t exh
ibit
all f
our c
hara
cter
istic
s to
be c
lass
ified
as “
sim
ple”
.C
yst
Ane
choi
cW
ell-c
ircu
msc
ribe
dIm
perc
eptib
le w
all
Post
erio
r ac
oust
ic e
nhan
cem
ent
Diff
eren
tial C
orre
latio
n C
oeffi
cien
t (D
CC
) (%
)1
XX
X17
.42
34.0
316
.14
XX
38.5
5X
12.1
6X
XX
36.7
7X
14.9
Ultrasound Med Biol. Author manuscript; available in PMC 2009 January 1.