Coefficient of Thermal Expansion of RCA Concrete Made by ...
16
applied sciences Article Coefficient of Thermal Expansion of RCA Concrete Made by Equivalent Mortar Volume Sungchul Yang * and Hyewon Lee Citation: Yang, S.; Lee, H. Coefficient of Thermal Expansion of RCA Concrete Made by Equivalent Mortar Volume. Appl. Sci. 2021, 11, 8214. https://doi.org/10.3390/app11178214 Academic Editor: Laurent Daudeville Received: 19 July 2021 Accepted: 31 August 2021 Published: 4 September 2021 Publisher’s Note: MDPI stays neutral with regard to jurisdictional claims in published maps and institutional affil- iations. Copyright: © 2021 by the authors. Licensee MDPI, Basel, Switzerland. This article is an open access article distributed under the terms and conditions of the Creative Commons Attribution (CC BY) license (https:// creativecommons.org/licenses/by/ 4.0/). School of Architectural Engineering, Hongik University, 2639 Sejong-ro, Jochiwon, Sejong 30016, Korea; [email protected] * Correspondence: [email protected]; Tel.: +82-44-860-2561 Featured Application: Coefficient of thermal expansion of RCA concrete prepared by the equiva- lent mortar volume mix design was over 6–7% lower than that of RCA concrete by conventional mix design, at the same RCA replacement ratio. Additionally, it was similar to or 1–2% lower than that of the natural coarse aggregate concrete. Abstract: The present study was conducted to experimentally verify if the coefficient of thermal expansion (COTE) of recycled aggregate concrete is proportional to the volume of the original virgin aggregate in the total recycled aggregate concrete mix. Three types of recycled concrete aggregate (RCA) were crushed from: railroad concrete sleepers; precast (PC) culverts; commercial recycling plant. RCA concretes were mixed using two concrete mixing methods: conventional mix method and equivalent mortar volume (EMV) method. And by varying the replacement ratio, three test series were made. Test results showed that at the same RCA replacement ratio of 68%, the COTE of RCA concrete prepared by the EMV mix design was over 6–7% lower than that of RCA concrete made with the conventional mix method. It was also similar to or 1–2% lower than that of the natural coarse aggregate concrete. This may be because the conventional mix method does not take into account the residual mortar content attached to RCA. This results in a decrease in the volumetric ratio of the original virgin aggregate and a relative increase in the volumetric ratio of the mortar (or cement paste). Keywords: recycled concrete; aggregate; mix proportioning; thermal expansion; mortar 1. Introduction Cracks in concrete structures are caused largely by the load, but they may also be caused by material characteristics such as creep or environmental factors such as temper- ature and humidity. In particular, curling occurs in concrete pavement due to changes of temperature and humidity. In concrete overlay pavement construction, when the two materials have different coefficients of thermal expansion (COTE), delamination may be caused at the interface between existing concrete pavement and overlaying material due to thermal instability [1,2]. To prevent that, the Texas Department of Transportation sets the upper limit of COTE of concrete in its specifications. Continuous reinforced concrete pavement (CRCP) is often adopted as a form of concrete pavement, and the COTE of concrete is known to have an impact on the initial behavior of the CRCP [3]. Since the COTE of river gravel is higher than that of limestone by 30% on average, initial cracking can easily occur in CRCP prepared using river gravel [4]. Due to the recent impact of global warming, blow-up of road pavement is often reported in Korea. The Korean government has promoted for 2 years a study to analyze the causes of blow-up and to prepare countermeasures [5]. As possible causes of blow-up, it is analyzed whether the joint space of 6 m is too wide compared to the current concrete pavement thickness (300 mm) or whether the problem comes from the pavement mix [5,6]. Unfortunately, the efforts made by scholars to apply high-quality recycled aggregates to Appl. Sci. 2021, 11, 8214. https://doi.org/10.3390/app11178214 https://www.mdpi.com/journal/applsci
-
Upload
khangminh22 -
Category
Documents
-
view
2 -
download
0
Transcript of Coefficient of Thermal Expansion of RCA Concrete Made by ...

applied sciences
Article
Coefficient of Thermal Expansion of RCA Concrete Made byEquivalent Mortar Volume
Sungchul Yang * and Hyewon Lee
�����������������
Citation: Yang, S.; Lee, H. Coefficient
of Thermal Expansion of RCA
Concrete Made by Equivalent Mortar
Volume. Appl. Sci. 2021, 11, 8214.
https://doi.org/10.3390/app11178214
Academic Editor: Laurent Daudeville
Received: 19 July 2021
Accepted: 31 August 2021
Published: 4 September 2021
Publisher’s Note: MDPI stays neutral
with regard to jurisdictional claims in
published maps and institutional affil-
iations.
Copyright: © 2021 by the authors.
Licensee MDPI, Basel, Switzerland.
This article is an open access article
distributed under the terms and
conditions of the Creative Commons
Attribution (CC BY) license (https://
creativecommons.org/licenses/by/
4.0/).
School of Architectural Engineering, Hongik University, 2639 Sejong-ro, Jochiwon, Sejong 30016, Korea;[email protected]* Correspondence: [email protected]; Tel.: +82-44-860-2561
Featured Application: Coefficient of thermal expansion of RCA concrete prepared by the equiva-lent mortar volume mix design was over 6–7% lower than that of RCA concrete by conventionalmix design, at the same RCA replacement ratio. Additionally, it was similar to or 1–2% lowerthan that of the natural coarse aggregate concrete.
Abstract: The present study was conducted to experimentally verify if the coefficient of thermalexpansion (COTE) of recycled aggregate concrete is proportional to the volume of the original virginaggregate in the total recycled aggregate concrete mix. Three types of recycled concrete aggregate(RCA) were crushed from: railroad concrete sleepers; precast (PC) culverts; commercial recyclingplant. RCA concretes were mixed using two concrete mixing methods: conventional mix methodand equivalent mortar volume (EMV) method. And by varying the replacement ratio, three testseries were made. Test results showed that at the same RCA replacement ratio of 68%, the COTEof RCA concrete prepared by the EMV mix design was over 6–7% lower than that of RCA concretemade with the conventional mix method. It was also similar to or 1–2% lower than that of the naturalcoarse aggregate concrete. This may be because the conventional mix method does not take intoaccount the residual mortar content attached to RCA. This results in a decrease in the volumetricratio of the original virgin aggregate and a relative increase in the volumetric ratio of the mortar (orcement paste).
Keywords: recycled concrete; aggregate; mix proportioning; thermal expansion; mortar
1. Introduction
Cracks in concrete structures are caused largely by the load, but they may also becaused by material characteristics such as creep or environmental factors such as temper-ature and humidity. In particular, curling occurs in concrete pavement due to changesof temperature and humidity. In concrete overlay pavement construction, when the twomaterials have different coefficients of thermal expansion (COTE), delamination may becaused at the interface between existing concrete pavement and overlaying material dueto thermal instability [1,2]. To prevent that, the Texas Department of Transportation setsthe upper limit of COTE of concrete in its specifications. Continuous reinforced concretepavement (CRCP) is often adopted as a form of concrete pavement, and the COTE ofconcrete is known to have an impact on the initial behavior of the CRCP [3]. Since theCOTE of river gravel is higher than that of limestone by 30% on average, initial crackingcan easily occur in CRCP prepared using river gravel [4].
Due to the recent impact of global warming, blow-up of road pavement is oftenreported in Korea. The Korean government has promoted for 2 years a study to analyzethe causes of blow-up and to prepare countermeasures [5]. As possible causes of blow-up,it is analyzed whether the joint space of 6 m is too wide compared to the current concretepavement thickness (300 mm) or whether the problem comes from the pavement mix [5,6].Unfortunately, the efforts made by scholars to apply high-quality recycled aggregates to
Appl. Sci. 2021, 11, 8214. https://doi.org/10.3390/app11178214 https://www.mdpi.com/journal/applsci
Appl. Sci. 2021, 11, 8214 2 of 16
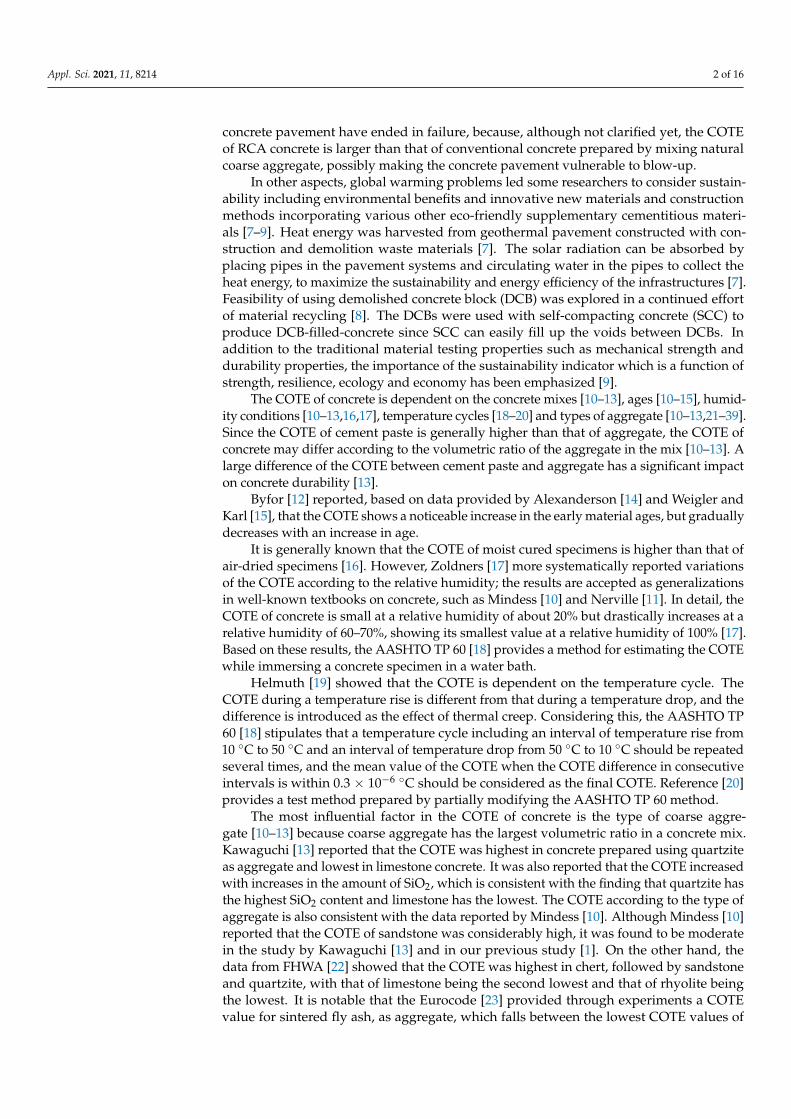
concrete pavement have ended in failure, because, although not clarified yet, the COTEof RCA concrete is larger than that of conventional concrete prepared by mixing naturalcoarse aggregate, possibly making the concrete pavement vulnerable to blow-up.
In other aspects, global warming problems led some researchers to consider sustain-ability including environmental benefits and innovative new materials and constructionmethods incorporating various other eco-friendly supplementary cementitious materi-als [7–9]. Heat energy was harvested from geothermal pavement constructed with con-struction and demolition waste materials [7]. The solar radiation can be absorbed byplacing pipes in the pavement systems and circulating water in the pipes to collect theheat energy, to maximize the sustainability and energy efficiency of the infrastructures [7].Feasibility of using demolished concrete block (DCB) was explored in a continued effortof material recycling [8]. The DCBs were used with self-compacting concrete (SCC) toproduce DCB-filled-concrete since SCC can easily fill up the voids between DCBs. Inaddition to the traditional material testing properties such as mechanical strength anddurability properties, the importance of the sustainability indicator which is a function ofstrength, resilience, ecology and economy has been emphasized [9].
The COTE of concrete is dependent on the concrete mixes [10–13], ages [10–15], humid-ity conditions [10–13,16,17], temperature cycles [18–20] and types of aggregate [10–13,21–39].Since the COTE of cement paste is generally higher than that of aggregate, the COTE ofconcrete may differ according to the volumetric ratio of the aggregate in the mix [10–13]. Alarge difference of the COTE between cement paste and aggregate has a significant impacton concrete durability [13].
Byfor [12] reported, based on data provided by Alexanderson [14] and Weigler andKarl [15], that the COTE shows a noticeable increase in the early material ages, but graduallydecreases with an increase in age.
It is generally known that the COTE of moist cured specimens is higher than that ofair-dried specimens [16]. However, Zoldners [17] more systematically reported variationsof the COTE according to the relative humidity; the results are accepted as generalizationsin well-known textbooks on concrete, such as Mindess [10] and Nerville [11]. In detail, theCOTE of concrete is small at a relative humidity of about 20% but drastically increases at arelative humidity of 60–70%, showing its smallest value at a relative humidity of 100% [17].Based on these results, the AASHTO TP 60 [18] provides a method for estimating the COTEwhile immersing a concrete specimen in a water bath.
Helmuth [19] showed that the COTE is dependent on the temperature cycle. TheCOTE during a temperature rise is different from that during a temperature drop, and thedifference is introduced as the effect of thermal creep. Considering this, the AASHTO TP60 [18] stipulates that a temperature cycle including an interval of temperature rise from10 ◦C to 50 ◦C and an interval of temperature drop from 50 ◦C to 10 ◦C should be repeatedseveral times, and the mean value of the COTE when the COTE difference in consecutiveintervals is within 0.3 × 10⁻⁶ ◦C should be considered as the final COTE. Reference [20]provides a test method prepared by partially modifying the AASHTO TP 60 method.
The most influential factor in the COTE of concrete is the type of coarse aggre-gate [10–13] because coarse aggregate has the largest volumetric ratio in a concrete mix.Kawaguchi [13] reported that the COTE was highest in concrete prepared using quartziteas aggregate and lowest in limestone concrete. It was also reported that the COTE increasedwith increases in the amount of SiO2, which is consistent with the finding that quartzite hasthe highest SiO2 content and limestone has the lowest. The COTE according to the type ofaggregate is also consistent with the data reported by Mindess [10]. Although Mindess [10]reported that the COTE of sandstone was considerably high, it was found to be moderatein the study by Kawaguchi [13] and in our previous study [1]. On the other hand, thedata from FHWA [22] showed that the COTE was highest in chert, followed by sandstoneand quartzite, with that of limestone being the second lowest and that of rhyolite beingthe lowest. It is notable that the Eurocode [23] provided through experiments a COTEvalue for sintered fly ash, as aggregate, which falls between the lowest COTE values of

Appl. Sci. 2021, 11, 8214 3 of 16
marble and limestone. Zhou et al. [24] predicted the COTE of concrete by varying the shapeof aggregate (circle, ellipsoid, square, rectangular) and using a self-consistent method;however, the effect of aggregate shape was found to be almost negligible.
It is particularly known that the COTE of recycled concrete aggregate (RCA) is affectedby not only the type of original virgin aggregate but also by the residual mortar (RM)attached to RCA [1,22–25]. Generally, the COTE value of mortar or RM is higher thanthat of concrete [10,11,13]. Few studies have been conducted to measure the COTE ofRCA, and most previous studies have been focused on concrete pavement [22–39] becausethe application of RCA is mainly concentrated on road applications. Previous reportsshowed that the COTE of RCA concrete generally increases as the replacement ratio of RCAincreases [22,25–31]. However, there have been various other reports recently indicatingthat the COTE of RCA concrete is retained [32–35] or even decreases [36–39] with increaseof RCA replacement ratio.
Hansen [26], ACPA [27] and NCHRPP [28] reported that the COTE of concrete in-creased to 30% with the increase of RCA replacement ratio. The test, performed with corespecimens taken from 5 test sections of the Transportation Departments of four states in theUnited States, showed that the COTE of RCA concrete specimens was retained in 1 sectionbut increased in 4 sections up to 9–23% [29,30]. Sadati and Khayat [31] reported that whenRCA was used at a ratio of 40%, the COTE of the concrete increased to 10%. Because ofthis, paving with RCA concrete by the Transportation Department was discontinued insome states in the United States [29,31]. Our previous study also showed that the COTE ofconcrete with 100% RCA replacement ratio increased by 5–9% in comparison with that ofreference concrete containing natural aggregates [25].
On the contrary, according to Won [32,33], concrete prepared by using RCA at areplacement ratio of 100% in which silicious river gravel was used as the original virginaggregate showed a COTE that was similar to the COTE of the natural aggregate concrete inactual road sites. Khayat and Sadati [34] reported that RCA concrete of which replacementratio was within 15–40% did not show a significant difference in the COTE compared to theconventional concrete. Bekoe et al. [35] also reported that the COTE of concrete preparedby using RCA remained similar at a replacement ratio up to 50%.
On the other hand, Smith [36,37] reported that the COTE decreased by up to 40% asRCA replacement ratio increased by 50%, and explained that the cause of the decrease wasthe use of high-quality RCA (with limestone as the original virgin aggregate). Pickel [38]showed that the COTE is dependent on RCA replacement ratio and the degree of RCAsaturation; when RCA was fully saturated and the replacement ratio was 30%, the COTEof concrete was considerably reduced. According to Wen et al. [39], the COTE of pavementconcrete mix decreased by 10% when RCA replacement ratio was 45% and fly ash wasused at a ratio of 20%.
Therefore, the present study was conducted to show that the COTE of RCA concreteis proportional to the volumetric ratio of the original virgin aggregate in the total mix.Three types of RCA (one crushed from railroad concrete sleepers; one crushed from precast(PC) culverts; and one obtained from a commercial recycling plant) were mixed using twoconcrete mix designs (conventional mix design and equivalent mortar volume (EMV) mixdesign) and by varying the replacement ratio relative to that of natural coarse aggregate,which was used as a reference. The experiment was performed in 3 test series. Even ifthe replacement percentage of natural coarse aggregate with RCA is the same among thecoarse aggregates included in a certain mix, the volumetric ratio of the original virginaggregate is larger in mixes prepared by modified EMV mix design than in those preparedby the conventional ACI mix design method. Therefore, one of the main purposes of thepresent study was to examine the difference of the COTE between the two mixes.

Appl. Sci. 2021, 11, 8214 4 of 16
2. Experimental Program2.1. RCA Productions
Three types of RCA were used in the present study: ‘RR’ from Railway PC sleepers(Figure 1a); ‘RP’ from PC culverts (Figure 1b); and ‘RA’ from the IS recycling plant in Korea.The PC sleepers, having a compressive strength of about 35 MPa, were manufacturedaccording to the Korean Railway Standards [40] by steam curing at a maximum aggregatesize of 20 mm and water-cement ratio of 35% or lower. The PC sleepers were then crushedin a plant into ‘RR’, having a maximum aggregate size of 20 mm. The second type, ‘RP,’was obtained from crushing PC culverts having a maximum aggregate size of 20 mm and acompressive strength of 35 MPa. ‘RA,’ obtained from a recycling plant, was prepared bycrushing old concrete from the same source into a size of 20 mm. It should be noted thatthe old railway PC sleepers were used about for 20 years, while the old PC culverts werelaid out in the open area at best for a year and old concrete structures for ‘RA’ more than20 years.
Appl. Sci. 2021, 11, 8214 4 of 16
2. Experimental Program 2.1. RCA Productions
Three types of RCA were used in the present study: ‘RR’ from Railway PC sleepers (Figure 1a); ‘RP’ from PC culverts (Figure 1b); and ‘RA’ from the IS recycling plant in Korea. The PC sleepers, having a compressive strength of about 35 MPa, were manufac-tured according to the Korean Railway Standards [40] by steam curing at a maximum aggregate size of 20 mm and water-cement ratio of 35% or lower. The PC sleepers were then crushed in a plant into ‘RR’, having a maximum aggregate size of 20 mm. The second type, ‘RP,’ was obtained from crushing PC culverts having a maximum aggregate size of 20 mm and a compressive strength of 35 MPa. ‘RA,’ obtained from a recycling plant, was prepared by crushing old concrete from the same source into a size of 20 mm. It should be noted that the old railway PC sleepers were used about for 20 years, while the old PC culverts were laid out in the open area at best for a year and old concrete structures for ‘RA’ more than 20 years.
Old concrete structures were crushed using a hydraulic breaker, and foreign materi-als such as rail pads and wires in the railway PC sleepers and reinforcing rebars in the PC culverts and other structures were collected by separation. Ton bags of initially crushed RCA were then transported to the recycling plant and treated by four, six, and three ad-ditional crushing process steps (combinations of jaw crusher and impact crusher) for ‘RR’, ‘RP’, ‘RA,’ respectively. Finally, RCA products were obtained. The original coarse aggre-gate sources of the old railway sleepers and the old PC culverts were granite.
(a) Old railway sleepers (b) Old PC culverts
Figure 1. RCA sources.
2.2. Aggregates Properties Table 1 shows the specific gravity, and water absorption of 3 types of RCA, 2 types of
natural coarse aggregate (NCA), and 2 types of fine aggregate. The specific gravity and the water absorption of the RR produced from concrete sleepers were 2.48% and 4.53%, respec-tively, and those of the RP, produced from concrete culvert, were 2.60% and 2.62%, respec-tively, and those of the RA, produced from a plant, were 2.52% and 3.82%, respectively.
Crushed granite was used as NCA; its specific gravity and water absorption were 2.65% and 0.70%, respectively, in test series 1, and 2.71% and 0.37%, respectively, in test series 2. River sand was used as fine aggregate; its specific gravity and water absorption were 2.56, 2.60 and 1.10, 0.95 respectively for fine aggregate 1 and fine aggregate 2. Table 2 provides details of the test series.
Figure 1. RCA sources.
Old concrete structures were crushed using a hydraulic breaker, and foreign materialssuch as rail pads and wires in the railway PC sleepers and reinforcing rebars in the PCculverts and other structures were collected by separation. Ton bags of initially crushedRCA were then transported to the recycling plant and treated by four, six, and threeadditional crushing process steps (combinations of jaw crusher and impact crusher) for‘RR’, ‘RP’, ‘RA,’ respectively. Finally, RCA products were obtained. The original coarseaggregate sources of the old railway sleepers and the old PC culverts were granite.
2.2. Aggregates Properties
Table 1 shows the specific gravity, and water absorption of 3 types of RCA, 2 typesof natural coarse aggregate (NCA), and 2 types of fine aggregate. The specific gravityand the water absorption of the RR produced from concrete sleepers were 2.48% and4.53%, respectively, and those of the RP, produced from concrete culvert, were 2.60%and 2.62%, respectively, and those of the RA, produced from a plant, were 2.52% and3.82%, respectively.
Table 1. Basic RCA properties.
Test Items RR a RP b RA c NCA1 NCA2 Fine Agg1 Fine Agg2
Specific gravity 2.48 2.60 2.52 2.65 2.71 2.56 2.60
Absorption ration (%) 4.53 2.62 3.82 0.70 0.37 1.10 0.95
RMC (%) 39.9 20.0 25.0 - - -
Note: a. The first letter ‘R’ refers to RCA, and the second letter ‘R’ means its production from railway sleepers. b. The first letter ‘R’ refers toRCA, and the second letter ‘P’ means its production from PC culvert. c. The first letter ‘R’ refers to RCA, and the second letter ‘A’ meansgeneral aggregate produced from a plant.

Appl. Sci. 2021, 11, 8214 5 of 16
Crushed granite was used as NCA; its specific gravity and water absorption were2.65% and 0.70%, respectively, in test series 1, and 2.71% and 0.37%, respectively, in testseries 2. River sand was used as fine aggregate; its specific gravity and water absorptionwere 2.56, 2.60 and 1.10, 0.95 respectively for fine aggregate 1 and fine aggregate 2. Table 2provides details of the test series.
Table 2. Concrete mixture designs and material quantities.
Test Series Mix W/C S/a RCA wt %Mix Proportions (kg/m3)
W C S F/A NCA RCA Admixture
1
CNR 0.39 45.3 0 187 480 739 - 894 0 4.80
CRR68 0.39 46.5 68 187 480 739 - 275 575 4.80
CRR33 0.39 45.9 33 187 480 739 - 584 287 4.80
ERR68 0.39 31.9 68 145 373 574 - 397 830 4.99
ERR68-2 0.40 38.9 68 172 428 658 - 335 700 4.79
2
CNP 0.36 39.1 0 158 396 675 44.0 1051 0 2.56
CRP25 0.36 40.4 25 158 396 694 44.0 767 256 2.49
CRP50 0.36 41.7 50 158 396 712 44.0 499 498 2.49
ERP25 0.36 37.0 25 152 380 648 42.3 830 276 2.60
ERP50 0.36 34.6 50 145 363 619 40.3 584 583 2.61
3
CNP 0.36 39.1 0 158 396 675 44 1051 0 2.56
CRP50 0.36 41.7 50 158 396 712 44 499 498 2.49
ERP50 0.36 34.6 50 145 363 619 40.3 584 583 2.61
ERA50 0.36 34.6 50 145 363 619 40.3 584 583 2.61
The thermal treatment method suggested by Juan and Gutierrez [41] was applied tocalculate the RMC value of RCA. The prepared RCA samples were heated in an electricfurnace at 500 ◦C for 2 h, and the heated samples were taken out of the electric furnace andimmersed in ice water to apply a heat shock to separate the mortar. The measurementswere inserted into Equation (1) to calculate the RMC values. The RMC values calculatedfor RR, RP and RA were 39.9%, 20.0% and 25.0%, respectively.
RMC = (WRCA −WOVA)/WRCA × 100 (1)
In Equation (1), WRCA denotes the weight of RCA dried in a dryer after the firstsampling; WOVA is the weight of the original virgin aggregate (OVA) obtained by dryingthe sample in a dryer after removing the RM.
3. Experimental Tests3.1. Mix Design
The experiment was performed using Type I Portland cement, of which the specificgravity and specific surface area were 3.15 and 3380 cm2/g, respectively. The experimentconsisted of 23 test series. In test series 2 and 3, Type C fly ash was added at a ratio of10% relative to the cement. The chemical admixture used in the present experiment wasa polycarboxylate-based air-entraining agent and a water-reducing agent from a SouthKorean vendor (Econex Co., Pyeongtaek, Korea). All the aggregates were prepared undersaturated-surface-dry conditions.
The first mix series consisted of 5 mixes having a compressive strength of 35 MPa,which is the standard for manufacturing railway PC sleepers. The tests were performedusing the ‘RR’ aggregates obtained by crushing old PC sleepers. The mix symbols shownin Table 2 are described below. The first letter ‘C’ means the conventional ACI mix design,and the letter ‘E’ means the EMV mix design. The following letters ‘NR’ mean the crushednatural aggregate used for railway sleepers. As described above, ‘RR’ means RCA produced

Appl. Sci. 2021, 11, 8214 6 of 16
from railway sleepers. CRR68 and CRR33 represent the mixes prepared by respectivelyreplacing 68% and 33% of the total coarse aggregates with the RR recycled aggregates.‘ERR68′ in ERR68 and ERR68-2 means that the mixes were prepared using EMV mix designby replacing 68% of the aggregates with the ‘RR’ recycled aggregates. In addition, ‘-2′ is ascale factor meaning that 1/2 of the RM suggested by the modified EMV mix design wastreated with aggregates, and the remaining 1/2 was considered as mortar [42].
The second mix series consisted of 5 mixes prepared using the ‘RP’ recycled aggregatesproduced from old PC culverts. The conventional ACI mix design and the EMV mix designwere also applied to the second mix series. The CRP and ERP series of mix series 2 wereprepared respectively by using concrete in which the RP recycled aggregate was coatedwith a cement paste dissociation agent for chloride penetration resistance, and concrete towhich cement paste dissociation agent was not applied [43].
The third mix series consisted of 4 mixes. The first three mixes were prepared byapplying the same mix design as in the second mix series, and the fourth was prepared byusing the ‘RA’ recycled aggregate to compare the physical properties between the differenttypes of aggregate.
A pan mixer that allows for mixing at a volume of 60 L was used to perform theexperiment in a laboratory located at Hongik University, Korea. The coarse aggregateand fine aggregate were added to the mixer and mixed together for about 30 s. Then,cementitious materials were further added and stirred for 30 s. After that, admixtures,carefully diluted in water, were added and mixed for 2 min.
3.2. Specimen Preparation
Concrete specimens were prepared using plastic molds and a predetermined consol-idation method [44]. The specimens were demolded after 24 h. All the specimens werecured for at least 1 year before being used in the experiment. The size of the cylindricalspecimens was a base diameter of 100 mm and a height of 200 mm.
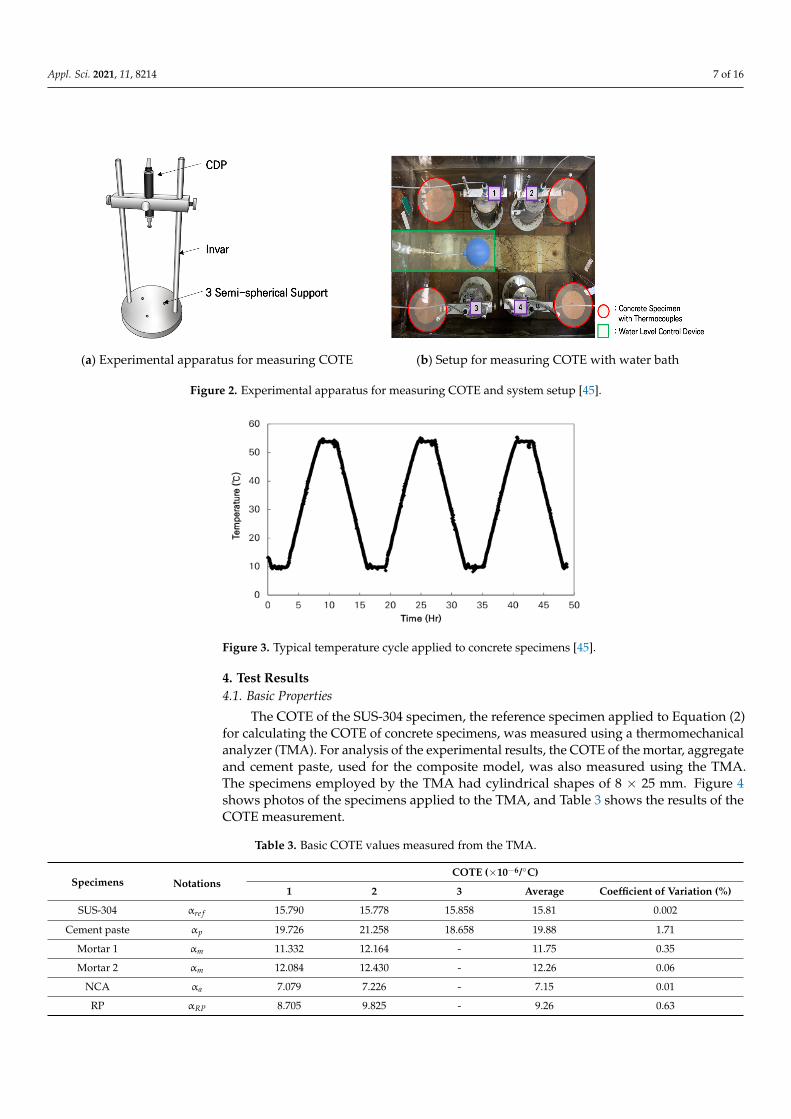
The COTE of the concrete specimens was measured according to the AASHTO TP-60 method using CDP displacement transducer [18]. As shown in Figure 2, an invarmaterial, rarely affected by temperature change, was used as a support frame, and wasmounted on the base plate. The CDP was installed at the top and connected with a datalogger to measure the real-time variation of the length of the specimens depending onthe temperature. Three semispherical supports were arranged on the base plate at equalintervals so that the specimens could be firmly settled. The internal temperature of concretewas controlled by fabricating 4 temperature specimens into which thermocouple wireswere inserted. The temperature specimens were installed at each corner of the water bathand connected to the data logger to measure the real-time temperature. The mean valuesfrom the temperature data were used in the analysis of the specimen temperature. Inaddition, to avoid the effect of vapor on CDP, the lid of the water bath was removed duringthe experimentation. The water level was controlled by applying a water level controldevice to prevent changes of water level in the water bath.
As shown in Figure 3, the water bath temperature was gradually increased from10 ◦C, the initial temperature, to 50 ◦C at 5 h, and kept at 50 ◦C for 3 h. Subsequently, thetemperature was gradually decreased to 10 ◦C over 5 h and kept at 10 ◦C for 3 h. Thistemperature cycle was repeated.
The COTE of the concrete specimens was corrected using SUS-304 as a correction spec-imen. The COTE of the individual concrete specimens was corrected using Equation (2):
αtrue = αnom ± αre f (2)
αtrue: Corrected COTE (×10−6/◦C)αnom: Measured COTE (×10−6/◦C)αref: COTE correction factor calculated from SUS-304 (×10−6/◦C)
Appl. Sci. 2021, 11, 8214 7 of 16
Appl. Sci. 2021, 11, 8214 7 of 16
(a) Experimental apparatus for measuring COTE (b) Setup for measuring COTE with water bath
Figure 2. Experimental apparatus for measuring COTE and system setup [45].
As shown in Figure 3, the water bath temperature was gradually increased from 10 °C, the initial temperature, to 50 °C at 5 h, and kept at 50 °C for 3 h. Subsequently, the temperature was gradually decreased to 10 °C over 5 h and kept at 10 °C for 3 h. This temperature cycle was repeated.
Figure 3. Typical temperature cycle applied to concrete specimens [45].
The COTE of the concrete specimens was corrected using SUS-304 as a correction spec-imen. The COTE of the individual concrete specimens was corrected using Equation (2): = ± (2)
αtrue: Corrected COTE (×10−6/°C) αnom: Measured COTE (×10−6/°C) αref: COTE correction factor calculated from SUS-304 (×10−6/°C)
4. Test Results 4.1. Basic Properties
The COTE of the SUS-304 specimen, the reference specimen applied to Equation (2) for calculating the COTE of concrete specimens, was measured using a thermomechanical ana-lyzer (TMA). For analysis of the experimental results, the COTE of the mortar, aggregate and cement paste, used for the composite model, was also measured using the TMA. The speci-mens employed by the TMA had cylindrical shapes of 8 × 25 mm. Figure 4 shows photos of the specimens applied to the TMA, and Table 3 shows the results of the COTE measurement.
Figure 2. Experimental apparatus for measuring COTE and system setup [45].
Appl. Sci. 2021, 11, 8214 7 of 16
(a) Experimental apparatus for measuring COTE (b) Setup for measuring COTE with water bath
Figure 2. Experimental apparatus for measuring COTE and system setup [45].
As shown in Figure 3, the water bath temperature was gradually increased from 10 °C, the initial temperature, to 50 °C at 5 h, and kept at 50 °C for 3 h. Subsequently, the temperature was gradually decreased to 10 °C over 5 h and kept at 10 °C for 3 h. This temperature cycle was repeated.
Figure 3. Typical temperature cycle applied to concrete specimens [45].
The COTE of the concrete specimens was corrected using SUS-304 as a correction spec-imen. The COTE of the individual concrete specimens was corrected using Equation (2): = ± (2)
αtrue: Corrected COTE (×10−6/°C) αnom: Measured COTE (×10−6/°C) αref: COTE correction factor calculated from SUS-304 (×10−6/°C)
4. Test Results 4.1. Basic Properties
The COTE of the SUS-304 specimen, the reference specimen applied to Equation (2) for calculating the COTE of concrete specimens, was measured using a thermomechanical ana-lyzer (TMA). For analysis of the experimental results, the COTE of the mortar, aggregate and cement paste, used for the composite model, was also measured using the TMA. The speci-mens employed by the TMA had cylindrical shapes of 8 × 25 mm. Figure 4 shows photos of the specimens applied to the TMA, and Table 3 shows the results of the COTE measurement.
Figure 3. Typical temperature cycle applied to concrete specimens [45].
4. Test Results4.1. Basic Properties
The COTE of the SUS-304 specimen, the reference specimen applied to Equation (2)for calculating the COTE of concrete specimens, was measured using a thermomechanicalanalyzer (TMA). For analysis of the experimental results, the COTE of the mortar, aggregateand cement paste, used for the composite model, was also measured using the TMA.The specimens employed by the TMA had cylindrical shapes of 8 × 25 mm. Figure 4shows photos of the specimens applied to the TMA, and Table 3 shows the results of theCOTE measurement.
Table 3. Basic COTE values measured from the TMA.
Specimens NotationsCOTE (×10−6/◦C)
1 2 3 Average Coefficient of Variation (%)
SUS-304 αre f 15.790 15.778 15.858 15.81 0.002
Cement paste αp 19.726 21.258 18.658 19.88 1.71
Mortar 1 αm 11.332 12.164 - 11.75 0.35
Mortar 2 αm 12.084 12.430 - 12.26 0.06
NCA αa 7.079 7.226 - 7.15 0.01
RP αRP 8.705 9.825 - 9.26 0.63

Appl. Sci. 2021, 11, 8214 8 of 16Appl. Sci. 2021, 11, 8214 8 of 16
(a) SUS-304 (b) cement paste
(c) mortar (d) NCA
(e) RP
Figure 4. Cylindrical specimens prepared for TMA.
Table 3. Basic COTE values measured from the TMA.
Specimens Notations COTE (×10−6/°C) 1 2 3 Average Coefficient of Variation (%)
SUS-304 α 15.790 15.778 15.858 15.81 0.002 Cement paste α 19.726 21.258 18.658 19.88 1.71
Mortar 1 α 11.332 12.164 - 11.75 0.35 Mortar 2 α 12.084 12.430 - 12.26 0.06
NCA α 7.079 7.226 - 7.15 0.01 RP α 8.705 9.825 - 9.26 0.63
As pretreatment for analyzing the COTE results of concrete specimens using the com-posite model, mortar specimens were prepared using the mix applied to mix series 1 and the one applied to mix series 2 and 3, and the elastic modulus of the mortar specimens at the age of 28 days was acquired, as shown in Table 4.
Figure 4. Cylindrical specimens prepared for TMA.
As pretreatment for analyzing the COTE results of concrete specimens using thecomposite model, mortar specimens were prepared using the mix applied to mix series 1and the one applied to mix series 2 and 3, and the elastic modulus of the mortar specimensat the age of 28 days was acquired, as shown in Table 4.
Table 4. Elastic modulus of mortar.
Specimens NotationElastic Modulus, GPa
1 2 3 Avg. Coefficient of Variation (%)
Mortar 1 Em 25.3 26.2 26.6 26.0 0.44
Mortar 2 Em 25.1 26.0 25.4 25.5 0.21
4.2. Concrete COTE Test Results
Figure 5a shows the COTE of the concrete specimens of mix series 1. The error bargraph in Figure 5a represents the mean values of the individual. The values for CNR andERR68-2 are the mean of 4 specimens, and the values for the other types of specimens areeach the mean of 3 specimens. The mean CTE of the CNR specimen prepared using thereference natural coarse aggregate was 8.47 × 10⁻⁶/◦C, and the mean COTE values of theCRR68, CRR33, ERR68 and ERR68-2 specimens were 8.91, 8.93, 8.38 and 8.28 × 10⁻⁶/◦C,

Appl. Sci. 2021, 11, 8214 9 of 16
respectively. The error of the reference CNR specimen and ERR68-2 was large in comparisonwith the mean values.
Appl. Sci. 2021, 11, 8214 9 of 16
Table 4. Elastic modulus of mortar.
Specimens Notation
Elastic Modulus, GPa
1 2 3 Avg. Coefficient of Variation
(%) Mortar 1 E 25.3 26.2 26.6 26.0 0.44 Mortar 2 E 25.1 26.0 25.4 25.5 0.21
4.2. Concrete COTE Test Results Figure 5a shows the COTE of the concrete specimens of mix series 1. The error bar
graph in Figure 5a represents the mean values of the individual. The values for CNR and ERR68-2 are the mean of 4 specimens, and the values for the other types of specimens are each the mean of 3 specimens. The mean CTE of the CNR specimen prepared using the reference natural coarse aggregate was 8.47 × 10⁻⁶/°C, and the mean COTE values of the CRR68, CRR33, ERR68 and ERR68-2 specimens were 8.91, 8.93, 8.38 and 8.28 × 10⁻⁶/°C, respectively. The error of the reference CNR specimen and ERR68-2 was large in compar-ison with the mean values.
Figure 5b shows the COTE values relative to the COTE of the reference CNR speci-men. The COTE values of the CRR68 and CRR33 specimens were 5.2% and 5.4% higher, respectively, in comparison with the COTE of the reference specimen. On the contrary, the COTE values of the ERR68 and ERR68-2 specimens were 1.1% and 2.3% lower, respec-tively. Therefore, compared with the CR-mixes prepared by the conventional mix design, the COTE of the ER-mixes was lower by 6–7%.
(a) measured COTE (b) relative COTE
Figure 5. COTE and relative values in test series 1.
Figure 6a shows the mean COTE values of the concrete specimens of mix series 2. The specimens of mix series 2 were prepared using concrete mix that had been used for manufacturing PC culverts, and RP recycled aggregate obtained by crushing old PC cul-verts was applied.
In mix series 2, the mean COTE of the CNR specimen prepared using the reference natural coarse aggregate was 8.54 × 10⁻⁶/°C, and the mean COTE values of the CRP25 and CRP50 specimens, prepared using the conventional concrete mix design and RP at 25% and 50%, were 8.66 and 8.59 × 10⁻⁶/°C, respectively. The COTE values of the ERP25 and ERP50 specimens, prepared by EMV mix design, were coincidently the same at 8.45 × 10⁻⁶/°C. The value of the CNP specimen is the mean of 3 specimens, and the values for the CRP25, CRP50, ERP25 and ERP50 specimens are each the mean of 6 specimens.
Figure 5. COTE and relative values in test series 1.
Figure 5b shows the COTE values relative to the COTE of the reference CNR speci-men. The COTE values of the CRR68 and CRR33 specimens were 5.2% and 5.4% higher,respectively, in comparison with the COTE of the reference specimen. On the contrary, theCOTE values of the ERR68 and ERR68-2 specimens were 1.1% and 2.3% lower, respectively.Therefore, compared with the CR-mixes prepared by the conventional mix design, theCOTE of the ER-mixes was lower by 6–7%.
Figure 6a shows the mean COTE values of the concrete specimens of mix series 2.The specimens of mix series 2 were prepared using concrete mix that had been usedfor manufacturing PC culverts, and RP recycled aggregate obtained by crushing old PCculverts was applied.
Appl. Sci. 2021, 11, 8214 10 of 16
As described above, the CRP and ERP series of mix series 2 were prepared respec-tively by using concrete in which RP recycled aggregate was coated with a cement paste dissociation agent intended for chloride penetration resistance, and concrete to which the cement paste dissociation agent was not applied. Assuming the coating agent did not af-fect the COTE, the COTE of the CRP series and ERP series specimens were each calculated as the mean of 6 COTE values. The errors of the CRP25 and ERP50 specimens were larger than those of the other specimens.
Figure 6b shows the COTE relative to the mean COTE of the reference CNP specimen. The COTE values of the CRP25 and CRP50 specimens were 1.3% and 0.6% higher, respec-tively, than the COTE of the reference specimen. On the contrary, the COTE values of the ERP25 and ERP50 specimens were 1% and 1.1% lower, respectively.
(a) measured COTE (b) relative COTE
Figure 6. COTE and relative values in test series 2.
Figure 7a shows the mean COTE of the concrete specimens of mix series 3. The spec-imens of mix series 3 were prepared using the same PC culvert concrete mix as used in mix series 2, and by adding RA as another recycled aggregate. In mix series 3, the mean COTE of the CNR specimen prepared using the reference natural coarse aggregate was 8.17 × 10⁻⁶ /°C, and the mean COTE values of the CRP50 specimen, prepared by applying the conventional concrete mix design and using 50% RP, and the ERP50, prepared by ap-plying EMV mix design and using 50% RP, were 8.40 and 7.96 × 10⁻⁶/°C, respectively. The mean COTE of the ERA specimens prepared by applying the EMV mix design and using 50% RA was 8.11 × 10⁻⁶/°C.
Figure 7b shows the COTE values relative to the COTE of the reference CNP speci-men. Compared with the COTE of the reference specimen, the COTE of the CRP50 speci-men, prepared by applying the conventional mix design, was 2.8% higher, and the COTE values of the ERP50 and ERA50 specimens, prepared by applying the EMV mix design, were 2.6% and 0.8% lower, respectively.
Figure 6. COTE and relative values in test series 2.
In mix series 2, the mean COTE of the CNR specimen prepared using the referencenatural coarse aggregate was 8.54× 10⁻⁶/◦C, and the mean COTE values of the CRP25 andCRP50 specimens, prepared using the conventional concrete mix design and RP at 25% and50%, were 8.66 and 8.59× 10⁻⁶/◦C, respectively. The COTE values of the ERP25 and ERP50specimens, prepared by EMV mix design, were coincidently the same at 8.45 × 10⁻⁶/◦C.The value of the CNP specimen is the mean of 3 specimens, and the values for the CRP25,CRP50, ERP25 and ERP50 specimens are each the mean of 6 specimens.

Appl. Sci. 2021, 11, 8214 10 of 16
As described above, the CRP and ERP series of mix series 2 were prepared respec-tively by using concrete in which RP recycled aggregate was coated with a cement pastedissociation agent intended for chloride penetration resistance, and concrete to which thecement paste dissociation agent was not applied. Assuming the coating agent did not affectthe COTE, the COTE of the CRP series and ERP series specimens were each calculated asthe mean of 6 COTE values. The errors of the CRP25 and ERP50 specimens were largerthan those of the other specimens.
Figure 6b shows the COTE relative to the mean COTE of the reference CNP specimen.The COTE values of the CRP25 and CRP50 specimens were 1.3% and 0.6% higher, respec-tively, than the COTE of the reference specimen. On the contrary, the COTE values of theERP25 and ERP50 specimens were 1% and 1.1% lower, respectively.
Figure 7a shows the mean COTE of the concrete specimens of mix series 3. Thespecimens of mix series 3 were prepared using the same PC culvert concrete mix as usedin mix series 2, and by adding RA as another recycled aggregate. In mix series 3, themean COTE of the CNR specimen prepared using the reference natural coarse aggregatewas 8.17 × 10⁻⁶ /◦C, and the mean COTE values of the CRP50 specimen, prepared byapplying the conventional concrete mix design and using 50% RP, and the ERP50, preparedby applying EMV mix design and using 50% RP, were 8.40 and 7.96× 10⁻⁶/◦C, respectively.The mean COTE of the ERA specimens prepared by applying the EMV mix design andusing 50% RA was 8.11 × 10⁻⁶/◦C.
Appl. Sci. 2021, 11, 8214 11 of 16
(a) measured COTE (b) relative COTE
Figure 7. COTE and relative values in test series 3.
The CNP, CRP50 and ERP50 specimens of mix series 2 and mix series 3 were each prepared by applying the same mix design, and thus the mean COTE values obtained from the two mix series were calculated and compared, as shown in Figure 8. Compared with the reference CNP specimen, the COTE of the CRP50 specimen, prepared by apply-ing the conventional mix design, was higher by 2.3%, and that of the ERP50 specimen, prepared by applying the EMV mix design, was lower by 0.5% and thus are considered almost the same. Therefore, the results showed that the COTE of RCA concrete specimens prepared by applying the EMV mix design was lower than those of specimens prepared by applying the conventional mix design.
Figure 8. Average relative COTE values from mix series 2 and 3.
4.2.1. Dependence of Total Coarse Aggregate Volume In the present study, both RCA and NCA were based on similar granite aggregates,
and thus the effect of the aggregate type was considered to be negligible. Assuming that concrete comprises coarse aggregate and mortar (water, cement, fine aggregate, air void), it was predicted that the COTE of concrete would increase as the volumetric ratio of mor-tar increased or that the COTE of concrete would decrease as the volumetric ratio of the coarse aggregate increased.
Using Equation (3), the total coarse aggregate volume in the mix was calculated using the data shown in Tables 1 and 2: = × + ×( )× (3)
Figure 7. COTE and relative values in test series 3.
Figure 7b shows the COTE values relative to the COTE of the reference CNP specimen.Compared with the COTE of the reference specimen, the COTE of the CRP50 specimen,prepared by applying the conventional mix design, was 2.8% higher, and the COTE valuesof the ERP50 and ERA50 specimens, prepared by applying the EMV mix design, were 2.6%and 0.8% lower, respectively.
The CNP, CRP50 and ERP50 specimens of mix series 2 and mix series 3 were eachprepared by applying the same mix design, and thus the mean COTE values obtained fromthe two mix series were calculated and compared, as shown in Figure 8. Compared withthe reference CNP specimen, the COTE of the CRP50 specimen, prepared by applying theconventional mix design, was higher by 2.3%, and that of the ERP50 specimen, preparedby applying the EMV mix design, was lower by 0.5% and thus are considered almost thesame. Therefore, the results showed that the COTE of RCA concrete specimens preparedby applying the EMV mix design was lower than those of specimens prepared by applyingthe conventional mix design.

Appl. Sci. 2021, 11, 8214 11 of 16
Appl. Sci. 2021, 11, 8214 11 of 16
(a) measured COTE (b) relative COTE
Figure 7. COTE and relative values in test series 3.
The CNP, CRP50 and ERP50 specimens of mix series 2 and mix series 3 were each prepared by applying the same mix design, and thus the mean COTE values obtained from the two mix series were calculated and compared, as shown in Figure 8. Compared with the reference CNP specimen, the COTE of the CRP50 specimen, prepared by apply-ing the conventional mix design, was higher by 2.3%, and that of the ERP50 specimen, prepared by applying the EMV mix design, was lower by 0.5% and thus are considered almost the same. Therefore, the results showed that the COTE of RCA concrete specimens prepared by applying the EMV mix design was lower than those of specimens prepared by applying the conventional mix design.
Figure 8. Average relative COTE values from mix series 2 and 3.
4.2.1. Dependence of Total Coarse Aggregate Volume In the present study, both RCA and NCA were based on similar granite aggregates,
and thus the effect of the aggregate type was considered to be negligible. Assuming that concrete comprises coarse aggregate and mortar (water, cement, fine aggregate, air void), it was predicted that the COTE of concrete would increase as the volumetric ratio of mor-tar increased or that the COTE of concrete would decrease as the volumetric ratio of the coarse aggregate increased.
Using Equation (3), the total coarse aggregate volume in the mix was calculated using the data shown in Tables 1 and 2: = × + ×( )× (3)
Figure 8. Average relative COTE values from mix series 2 and 3.
4.2.1. Dependence of Total Coarse Aggregate Volume
In the present study, both RCA and NCA were based on similar granite aggregates,and thus the effect of the aggregate type was considered to be negligible. Assuming thatconcrete comprises coarse aggregate and mortar (water, cement, fine aggregate, air void), itwas predicted that the COTE of concrete would increase as the volumetric ratio of mortarincreased or that the COTE of concrete would decrease as the volumetric ratio of the coarseaggregate increased.
Using Equation (3), the total coarse aggregate volume in the mix was calculated usingthe data shown in Tables 1 and 2:
VTCA =WNCA
SGNCA × 1000+
WRCA ×(
1− RMCS
)SGRCA × 1000
(3)
where VTCA is the sum of the volume of natural aggregate ( WNCASGNCA×1000 ) and the volume of
original virgin aggregate (WRCA×(1− RMC
S )SGRCA×1000 ) and where SGNCA and SGRCA are the specific
gravities of natural coarse aggregate and of RCA, respectively; RMC is residual mortarcontent from Equation (2) and ‘S’ is a scale factor, as explained before and in reference [42].
Figure 9 illustrates the quadratic relations of the mean COTE values of the specimensprepared by applying the individual mixes of mix series 1–3 and the volumetric ratio ofcoarse aggregate of the individual mixes. In test series 1, the volumetric ratios of the coarseaggregate of the reference CNR mix and the ERR68 and ERR68-2 specimens of the EMVmix were 0.34, 0.35 and 0.35, respectively. The volumetric ratios of the coarse aggregateof the CRR68 and CRR33 specimens of the conventional mix design were 0.24 and 0.29,respectively. Figure 9a shows that as the total volumetric ratio of the virgin coarse aggregatein the recycled aggregate mix increased, the COTE of concrete specimens decreased with adetermination coefficient of 0.98. As also described in many previous reports, our resultsclearly show that the volumetric ratio of the aggregate is one of the factors influencing theCOTE of concrete specimens.
In test series 2, on the contrary, the volumetric ratios of the coarse aggregate of thereference CNR mix and the ERP25 and ERP50 specimens of the EMV mix were all about0.39. The volumetric ratios of the coarse aggregate of the CRP25 and CRP50 specimens ofthe conventional mix design were 0.36 and 0.34, respectively. As shown in Figure 9b, withthe determination coefficient of 0.95, the COTE of concrete specimens still decreased as thetotal volumetric ratio of the virgin coarse aggregate in the recycled aggregate mix increased.

Appl. Sci. 2021, 11, 8214 12 of 16
Appl. Sci. 2021, 11, 8214 12 of 16
where is the sum of the volume of natural aggregate ( × ) and the volume of
original virgin aggregate (×( )× ) and where and are the specific grav-
ities of natural coarse aggregate and of RCA, respectively; RMC is residual mortar content from Equation (2) and ‘S’ is a scale factor, as explained before and in reference [42].
Figure 9 illustrates the quadratic relations of the mean COTE values of the specimens prepared by applying the individual mixes of mix series 1–3 and the volumetric ratio of coarse aggregate of the individual mixes. In test series 1, the volumetric ratios of the coarse aggregate of the reference CNR mix and the ERR68 and ERR68-2 specimens of the EMV mix were 0.34, 0.35 and 0.35, respectively. The volumetric ratios of the coarse aggregate of the CRR68 and CRR33 specimens of the conventional mix design were 0.24 and 0.29, re-spectively. Figure 9a shows that as the total volumetric ratio of the virgin coarse aggregate in the recycled aggregate mix increased, the COTE of concrete specimens decreased with a determination coefficient of 0.98. As also described in many previous reports, our results clearly show that the volumetric ratio of the aggregate is one of the factors influencing the COTE of concrete specimens.
In test series 2, on the contrary, the volumetric ratios of the coarse aggregate of the reference CNR mix and the ERP25 and ERP50 specimens of the EMV mix were all about 0.39. The volumetric ratios of the coarse aggregate of the CRP25 and CRP50 specimens of the conventional mix design were 0.36 and 0.34, respectively. As shown in Figure 9b, with the determination coefficient of 0.95, the COTE of concrete specimens still decreased as the total volumetric ratio of the virgin coarse aggregate in the recycled aggregate mix increased.
On the other hand, in mix series 3, besides the specimens prepared using the same mix design as used for mix series 2, additional specimens were prepared by applying the RA aggregate and the EMV mix design. Figure 9c shows the experimental results obtained from the specimens as a function of the total coarse aggregate volume. The volumetric ratio of the coarse aggregate was about 0.39 in the reference CNP specimen and in the ERP50 and ERA50 specimens of the EMV mix design. The volumetric ratio of the coarse aggregate of the CRP50 specimen, prepared by the conventional mix design, was 0.34. Fig-ure 9c shows that as the total volumetric ratio of the virgin coarse aggregate in the recycled aggregate mix increased, the COTE of the concrete specimens decreased with a determina-tion coefficient of 0.99. However, it is reported by literature [10–12,21] that the COTE value of concrete is proportional to the volume ratio of total coarse aggregate. Further study is needed to verify if the COTE value of concrete is linear or nonlinear to the volume ratio of total coarse aggregate.
(a) Mix 1 (b) Mix 2
Appl. Sci. 2021, 11, 8214 13 of 16
(c) Mix 3
Figure 9. COTE values in terms of total coarse aggregate volume ratio.
4.2.2. Predicted COTE Values Since concrete is a composite including various materials, the COTE of concrete may
be determined from the COTEs of the individual components. Two models have tradition-ally been presented for this: one is the parallel model; the other is the series model [10]. Hirsh [46] combined the two models and presented the following composite equation: α = (α + α ) + (1 − ) α + α+ (4)
where α , α = COTE of mortar and aggregate, respectively V , V = volume fraction of mortar and aggregate, respectively E , E = elastic modulus of mortar and aggregate, respectively = relative proportions of materials conforming with the upper and lower bound
solution. It should be noted that Hirsh’s model becomes the series model when XX = 1, while
it becomes the parallel model when XX = 0. Tables 3 and 4 summarizes the input variables of the Hirsh model. The elastic moduli
of the CNR, CRR68, CRR33, ER68 and ER68-2 specimens at the age of 28 days in mix series 1 were 27.1, 24.8, 25.8, 26.1 and 26.9 GPa, respectively [42], and those of the CNP, CRP25, CRP50, ERP25 and ERP50 specimens in mix series 2 were 27.7, 27.7, 26.3, 26.4 and 27.2 GPa, respectively [43]. Since the elastic modulus of concrete and that of the mortar used in the present study, as shown in Table 4, were very similar to each other, the parallel part in the Hirsh model was neglected. Therefore, the condition of XX = 1 was applied.
Under the assumption that XX = 1, the input variables in Table 3 were substituted into the Hirsh model to predict the COTEs of the specimens prepared under different conditions; the results of the curve fitting of the COTEs are shown in Figure 10. Figure 10a,c shows that the predicted COTE values fit well to the measured COTE values with determination coefficient of 0.85 and 0.86, respectively by linear relationships in Mix 1 and Mix 3. However, the determination coefficient was lower in mix series 2 than in mix series 1 or 3, because RCA replacement ratios were 33% and 68% in mix series 1 and 25% and 50% in mix series 2. As a result, the distribution of the total coarse aggregate ratio, repre-sented by the x-axis of the plot shown in Figure 9, is closer among the specimens in mix series 2 than in mix series 1. The difference between the predicted values and the meas-ured values may have resulted because the α and α values were obtained using a dil-atometer type TMA, but the COTE value of concrete was obtained under saturated con-ditions in a bath in which RH = 100% according to the AASHTO-TP60.
Figure 9. COTE values in terms of total coarse aggregate volume ratio.
On the other hand, in mix series 3, besides the specimens prepared using the samemix design as used for mix series 2, additional specimens were prepared by applying theRA aggregate and the EMV mix design. Figure 9c shows the experimental results obtainedfrom the specimens as a function of the total coarse aggregate volume. The volumetricratio of the coarse aggregate was about 0.39 in the reference CNP specimen and in theERP50 and ERA50 specimens of the EMV mix design. The volumetric ratio of the coarseaggregate of the CRP50 specimen, prepared by the conventional mix design, was 0.34.Figure 9c shows that as the total volumetric ratio of the virgin coarse aggregate in therecycled aggregate mix increased, the COTE of the concrete specimens decreased witha determination coefficient of 0.99. However, it is reported by literature [10–12,21] thatthe COTE value of concrete is proportional to the volume ratio of total coarse aggregate.Further study is needed to verify if the COTE value of concrete is linear or nonlinear to thevolume ratio of total coarse aggregate.
4.2.2. Predicted COTE Values
Since concrete is a composite including various materials, the COTE of concrete may bedetermined from the COTEs of the individual components. Two models have traditionallybeen presented for this: one is the parallel model; the other is the series model [10].Hirsh [46] combined the two models and presented the following composite equation:
αc = X(αmVm + αaVa) + (1− X)αmVmEm + αaVaEa
VmEm + VaEa(4)
whereαm,αa = COTE of mortar and aggregate, respectivelyVm, Va = volume fraction of mortar and aggregate, respectively

Appl. Sci. 2021, 11, 8214 13 of 16
Em, Ea = elastic modulus of mortar and aggregate, respectivelyX = relative proportions of materials conforming with the upper and lower bound solution.It should be noted that Hirsh’s model becomes the series model when XX = 1, while it
becomes the parallel model when XX = 0.Tables 3 and 4 summarizes the input variables of the Hirsh model. The elastic moduli
of the CNR, CRR68, CRR33, ER68 and ER68-2 specimens at the age of 28 days in mix series1 were 27.1, 24.8, 25.8, 26.1 and 26.9 GPa, respectively [42], and those of the CNP, CRP25,CRP50, ERP25 and ERP50 specimens in mix series 2 were 27.7, 27.7, 26.3, 26.4 and 27.2 GPa,respectively [43]. Since the elastic modulus of concrete and that of the mortar used in thepresent study, as shown in Table 4, were very similar to each other, the parallel part in theHirsh model was neglected. Therefore, the condition of XX = 1 was applied.
Under the assumption that XX = 1, the input variables in Table 3 were substituted intothe Hirsh model to predict the COTEs of the specimens prepared under different conditions;the results of the curve fitting of the COTEs are shown in Figure 10. Figure 10a,c showsthat the predicted COTE values fit well to the measured COTE values with determinationcoefficient of 0.85 and 0.86, respectively by linear relationships in Mix 1 and Mix 3. However,the determination coefficient was lower in mix series 2 than in mix series 1 or 3, becauseRCA replacement ratios were 33% and 68% in mix series 1 and 25% and 50% in mix series 2.As a result, the distribution of the total coarse aggregate ratio, represented by the x-axisof the plot shown in Figure 9, is closer among the specimens in mix series 2 than in mixseries 1. The difference between the predicted values and the measured values may haveresulted because the αa and αm values were obtained using a dilatometer type TMA, butthe COTE value of concrete was obtained under saturated conditions in a bath in whichRH = 100% according to the AASHTO-TP60.
Appl. Sci. 2021, 11, 8214 14 of 16
(a) Mix 1 (b) Mix 2
(c) Mix 3
Figure 10. Predicted COTE values versus measured COTE values in various mixes.
5. Conclusions The present study was conducted to experimentally verify that the COTE of RCA
concrete is dependent on the volume of the original virgin aggregate in the total RCA concrete mix. Three types of RCA (one crushed from railroad concrete sleepers; one crushed from precast (PC) culverts; and one obtained from a commercial recycling plant) were mixed by two concrete mixing methods (conventional mix method and EMV method) and by varying the replacement ratio relative to that of natural coarse aggregate. Three mix series were used in the experiment. The conclusions acquired from the experi-mental results are described below. It should be noted that because of limited test varia-bles and test numbers in this study, further study is needed for the findings of this study to be generalized to other RCA concrete types (i.e., using RCA from other sources, or hav-ing different parameters and exposure conditions). (1) At the same RCA replacement ratio (volumetric ratio of RCA in the total coarse aggre-
gate) of 68%, the COTE of RCA concrete prepared by EMV mix design was over 6–7% lower than that of RCA concrete prepared by conventional mix method, and it was similar to or 1–2% lower than that of the reference natural coarse aggregate concrete.
(2) For RCA concrete prepared by conventional mix method, which does not take into account the residual mortar content (RMC) attached to RCA, the volumetric ratio of the original virgin aggregate was relatively small and the volumetric ratio of the mor-tar (or cement paste) was relatively high, and thus the COTE may have increased.
(3) The COTE of RCA concrete is represented in terms of the volumetric ratio of coarse aggregate of the individual mixes by the best fit quadratic curves. However, further
Figure 10. Predicted COTE values versus measured COTE values in various mixes.

Appl. Sci. 2021, 11, 8214 14 of 16
5. Conclusions
The present study was conducted to experimentally verify that the COTE of RCAconcrete is dependent on the volume of the original virgin aggregate in the total RCAconcrete mix. Three types of RCA (one crushed from railroad concrete sleepers; onecrushed from precast (PC) culverts; and one obtained from a commercial recycling plant)were mixed by two concrete mixing methods (conventional mix method and EMV method)and by varying the replacement ratio relative to that of natural coarse aggregate. Threemix series were used in the experiment. The conclusions acquired from the experimentalresults are described below. It should be noted that because of limited test variables andtest numbers in this study, further study is needed for the findings of this study to begeneralized to other RCA concrete types (i.e., using RCA from other sources, or havingdifferent parameters and exposure conditions).
(1) At the same RCA replacement ratio (volumetric ratio of RCA in the total coarse aggre-gate) of 68%, the COTE of RCA concrete prepared by EMV mix design was over 6–7%lower than that of RCA concrete prepared by conventional mix method, and it wassimilar to or 1–2% lower than that of the reference natural coarse aggregate concrete.
(2) For RCA concrete prepared by conventional mix method, which does not take intoaccount the residual mortar content (RMC) attached to RCA, the volumetric ratioof the original virgin aggregate was relatively small and the volumetric ratio of themortar (or cement paste) was relatively high, and thus the COTE may have increased.
(3) The COTE of RCA concrete is represented in terms of the volumetric ratio of coarseaggregate of the individual mixes by the best fit quadratic curves. However, furtherstudy is needed to verify if the COTE value of concrete is linear or nonlinear to thevolume ratio of total coarse aggregate.
(4) Finally, the predicted COTE obtained by applying the composite series model wasslightly higher than the measured COTE, but the determination coefficient was higherthan usual, indicating that experimental results obtained in this study are reliable.
Author Contributions: S.Y. conceived, designed the experiments, and wrote the paper; H.L. per-formed the experiments; S.Y. and H.L. analyzed the data. Both authors have read and agreed to thepublished version of the manuscript.
Funding: This study was conducted under research Project (21POQW-B152690-03) funded by theMinistry of Land, Infrastructure and Transport (MOLIT) and the Korea Agency for InfrastructureTechnology Advancement (KAIA). The authors would like to thank the members of research team,MOLIT and KAIA for their guidance and supports throughout the project.
Institutional Review Board Statement: Not applicable.
Informed Consent Statement: Not applicable.
Data Availability Statement: Data sharing not applicable.
Conflicts of Interest: The authors declare no conflict of interest.
References1. Kim, J.; Yang, S.; Kim, N. Influencing factor on thermal coefficient of concrete due to aggregate types. Spring Conf. Korea Concr.
Inst. 2003, 15, 249–254.2. Park, J. Mechanical Strength and Durability Tests on Concrete Mixes Using Recycled Aggregates. Master’s Thesis, Hongik
University, Sejong, Korea, 2013.3. McCullough, B.; Dossey, T. Consideration for high-performance of concrete paving: Recommendations from 20 years of field
experience in Texas. Transp. Res. Rec. 1999, 1684, 17–24. [CrossRef]4. Du, L.; Lukefah, E. Coefficient of Thermal Expansion of Concrete with Different Coarse Aggregates. Presented at the Annual
Symposium of the International Center for Aggregate Research, Austin, TX, USA, 12 April 2007.5. Lee, J.; Son, D.; Ryu, S.; Park, Y. A Study on Preventing Methods of Blow-up for Improving Safety on Expressway; KHC-2020-39-534.9607;
Korea Highway Corporation: Gimcheon, Korea, 2020.6. Chhay, L.; Kim, Y.; Lee, S. Evaluation of trigger temperature for concrete pavement growth based on joint movement data. Constr.
Build. Mater. 2021, 278, 121790. [CrossRef]

Appl. Sci. 2021, 11, 8214 15 of 16
7. Arulrajah, A.; Ghorbani, B.; Narsilio, G.; Horpibulsuk, S.; Leong, M. Thermal performance of geothermal pavements constructedwith demolition wastes. Geomech. Energy Environ. 2021, 28, 100253. [CrossRef]
8. Li, J.; Zhang, J.; Ni, S.; Liu, L.; Walubita, L. Mechanical performance and environmental impacts of self-compacting concrete withrecycled demolished concrete blocks. J. Clean. Prod. 2021, 293, 126129. [CrossRef]
9. Hraboa, K.; Lehner, P.; Ghosh, P.; Konecny, P.; Teply, B. Sustainability levels in comparison with mechanical properties anddurability of pumice high-performance concrete. Appl. Sci. 2021, 11, 4964. [CrossRef]
10. Mindess, S.; Young, J.; Darwin, D. Concrete, 2nd ed.; Prentice Hall: Hoboken, NJ, USA, 2003.11. Nerville, A. Properties of Concrete, 4th ed.; John Wiley &Sons, Inc.: Hoboken, NJ, USA, 1996.12. Byfors, J. Plain Concrete at Early Ages; Swedish Cement and Concrete Research: Göteborg, Sweden, 1980.13. Kim, J.; Jook, D.; Choi, J.; Kim, G. State-of-arts of primary concrete degradation behaviors due to high temperature and radiation
in spent fuel dry storage. J. Nucl. Fuel Cycle Waste Tech. 2018, 16, 243–260. [CrossRef]14. Alexanderson, J. Strength Losses in Heat Cured Concrete; Swedish Cement and Concrete Research Institute: Stockholm, Sweden,
1972; p. 135.15. Weigler, H.; Karl, S. Junger Beton: Beanspruchung, Festigkeit, Verformung. Betonwerk Fertigkeit Technik. 1974, 40, 392.16. Khayat, K. Deterioration of lightweight fly ash concrete due to gradual cryogenic frost cycles. ACI Mater. J. 1991, 77, 233–239.17. Zolnders, N. Thermal Properties of Concrete under Sustain Elevated Temperature; SP-25; American Concrete Institute: Detroit,
Michigan, 1971; pp. 1–31.18. AASHTO TP 60-00. Standard Test Method for the Concrete Atmospheric Pressure. In State-of-the-ART, Manual of Concrete Practice;
ACI: Washington, DC, USA, 2000.19. Helmuth, R.A. Dimensional changes of hardened Portland cement pastes caused by temperature changes. In Proceedings of the
Fortieth Annual Meeting of the Highway Research Board, Washington, DC, USA, 9–13 January 1961; Volume 40, pp. 315–366.20. Won, M. Improvements of testing procedures for concrete coefficient of thermal expansion. Transp. Res. Rec. 2005, 1919, 23–28.
[CrossRef]21. Hobbs, D. The dependence of the bulk modulus, Young’s modulus, creep, shrinkage and thermal expansion of concrete upon
aggregate volume concentration. Mater. Const. 1971, 4, 107–114. [CrossRef]22. FHWA. Coefficient of Thermal Expansion in Concrete Pavement Design; ACPT Tech Brief-FHWA-HIE-09-105; U.S. Department of
Transportation; Federal Highway Administration: Washington, DC, USA, 2011.23. Bamforth, P.; Chisholm, D.; Gibbs, J.; Harrison, T. Properties of concrete for Use in Eurocode 2; The Concrete Center: London,
UK, 2008.24. Zhou, C.; Feng, D.; Wu, X.; Cao, P.; Fan, X. Prediction of concrete coefficient of thermal expansion by effective self-consistent
method considering coarse aggregate shape. J. Mater. Civ. Eng. 2018, 30, 04018312. [CrossRef]25. Yang, S.; Lee, H.; Kim, N. Measurement for coefficient of thermal expansion of concretes made with recycled concrete aggregates.
Int. J. Highw. Eng. 2015, 17, 7–16. [CrossRef]26. Hansen, T. Recycled aggregates and recycled aggregate concrete second state-of-the-art report developments 1945–1985. Mater.
Struct. 1986, 19, 201–246. [CrossRef]27. Recycling Concrete Pavement, Concrete Paving Technology; EB-043P; American Concrete Pavement Association: Washington, DC,
USA, 2009.28. NCHRPP Synthesis 435. Reclaimed Asphalt Pavement, Recycled Concrete Aggregate and Construction Demolition Waste. In
Recycled Materials and Byproducts in Highway Applications; Transportation Research Board: Washington, DC, USA, 2013; Volume 6.29. Cuttel, D.; Snyder, M.; Vandenbossche, J.; Wade, M. Performance of Rigid Pavements Containing Recycled Concrete Aggregates,
Transportation Research Record 1574; Transportation Research Board: Washington, DC, USA, 1997.30. Gress, D.; Snyder, M.; Sturtevant, J. Performance of rigid pavements containing recycled concrete aggregates-2006 update. In
Proceedings of the Transportation Research Board 86th Annual Meeting, Washington, DC, USA, 21–25 January 2007; pp. 1–28.31. Sadati, S.; Khayat, K. Field performance of concrete pavement incorporating recycled concrete aggregate. Constr. Build. Mater.
2016, 126, 691–700. [CrossRef]32. Won, M. Performance of Continuously Reinforced Concrete Pavement Containing Recycled Concrete Aggregate; FHWA/TX-01-1753-1
Report; Texas Department of Transportation: Austin, TX, USA, 2001.33. Choi, S.; Moon, W. Performance of continuously reinforced concrete pavement containing recycled concrete aggregate. In
Proceedings of the GeoHunan International Conference, Changsha, China, 9–11 June 2011; pp. 165–172.34. Khayat, K.; Sadati, S. High-Volume Recycled Materials for Sustainable Pavement Construction; RECAST UTC #00046727 Report; U.S.
Department of Transportation: Washington, DC, USA, 2020; Volume I.35. Bekoe, P.A.; Tia, M.; Bergin, M.J. Concrete containing recycled concrete aggregate for use in concrete pavement. Transp. Res. Rec.
2010, 2164, 113–121. [CrossRef]36. Smith, J. Recycled Concrete Aggregate—A Viable Aggregate Source for Concrete Pavements. Ph.D. Thesis, University of Waterloo,
Waterloo, ON, Canada, 2009.37. Smith, J.T.; Tighe, S.L. Recycled concrete aggregate coefficient of thermal expansion: Characterization, variability, and impacts on
pavement performance. Transp. Res. Rec. 2009, 2113, 53–61. [CrossRef]38. Pickel, D. Recycled Concrete Aggregate: Influence of Aggregate Pre-Saturation and Curing Conditions on the Hardened Properties
of Concrete. Master’s Thesis, University of Waterloo, Waterloo, ON, Canada, 2014.

Appl. Sci. 2021, 11, 8214 16 of 16
39. Wen, H.; McLean, D.; Boyle, S.; Spry, T.; Mjelde, D. Evaluation of Recycled Concrete as Aggregate in New Concrete Pavement; WA-RD826.1 Report; Washington State Department of Transportation: Spokane, WA, USA, 2014.
40. KRS TR 0008-15(RR), Pre-Stressed Concrete sleeper. Korean Railway Standards. 2006. Available online: www.kric.go.kr (accessedon 31 August 2021).
41. Juan, M.; Gutierrez, P. Study on the influence of attached mortar content on the properties of recycled concrete aggregate. Constr.Build. Mater. 2009, 23, 872–877. [CrossRef]
42. Yang, S.; Lim, Y. Mechanical strength and drying shrinkage properties of RCA concretes produced from old railway concretesleepers using by a modified EMV method. Constr. Build. Mater. 2018, 185, 499–507. [CrossRef]
43. Yang, S.; Lee, H. Drying shrinkage and rapid chloride penetration resistance of recycled aggregate concretes using cement pastedissociation agent. Materials 2021, 14, 1–18.
44. ASTM C192, Standard Practice for Making and Curing Concrete Test Specimens in the Laboratory; ASTM International: West Con-shohocken, PA, USA, 2012.
45. Lee, H. An Experimental Study on the Thermal Expansion Coefficient and Rapid Chloride Penetration Resistance of RecycledAggregate Concrete. Master’s Thesis, Hongik University, Sejong, Korea, 2021.
46. Hirsh, T. Modulus of elasticity of concrete affected by elastic moduli of cement paste matrix and aggregate. J. Am. Concr. Inst.1962, 59, 427–451.