RCA REVIEW - World Radio History
158
RCA REVIEW a Éeehflieal journa RADIO AND ELECTRONICS RESEARCH ENGINEERING VOLUME VII JUNE 194
-
Upload
khangminh22 -
Category
Documents
-
view
4 -
download
0
Transcript of RCA REVIEW - World Radio History
RCA REVIEW a Éeehflieal journa
RADIO AND ELECTRONICS
RESEARCH ENGINEERING
VOLUME VII JUNE 194

RCA REVIEW GEORGE M. K. BARER CHAS. C. FOSTER, JR.
Manager Business Manager
SUBSCRIPTION: United States, Canada and Postal Union: One Year $2.00, Two Years $3.50, Three Years $4.50
Single Copies: 750 each
Other Countries: One Year $2.40, Two Years $4.30, Three Years $5.70 Single Copies: 85¢ each
Copyright, 1946, by Radio Corporation of America, RCA Laboratories Division
Published quarterly in March, June, September, and December by Radio Corporation of America, RCA Laboratories Division, 30 Rockefeller Plaza, New York 20, N. Y.
Editorial and General Offices: RCA REVIEW, Radio Corporation of America, RCA Laboratories Division, Princeton, New Jersey.
Entered as second class matter April 3, 1946, at the Post Office at New York, New York, under the act of March 3, 1879.
PRINTED IN U.S.A.

RCA REVIEW a technical journal
RADIO AND ELECTRONICS RESEARCH ENGINEERING
Published quarterly by
RADIO CORPORATION OF AMERICA
RCA LABORATORIES DIVISION
in cooperation with RCA COMMUNICATIONS, INC.
NATIONAL BROADCASTING COMPANY, INC.
RCA INSTITUTES, INC.
RCA VICTOR DIVISION
RADIOMARINE CORPORATION OF AMERICA
RCA INTERNATIONAL DIVISION
VOLUME VII JUNE 1946 NUMBER 2
CONTENTS PAGE
Foreword 139
An Experimental Color Television System 141
R. D. KELL, DR. G. L. FREDENDALL, A. C. SCHROEDER, AND R. C. WEBB
Wide Range Loudspeaker Developments 155
DR. H. F. OLSON AND J. PRESTON
A Multi- Channel VHF Radio Communications System 179
J. B. KNOX AND C. H. BRERETON
Luminescence and Tenebrescence as IApppl ed
in Radar 199 H. W.
Frequency Modulation Mobile Radiotelephone Services 240 H. B.
Development of Pulse Triodes and Circuit to give One Megawatt at 600253
Megacycles DR. R. R. LAW, D. G. BURNSIDE, R. P. STONE
AND W. B. WHALLEY
A Method of Measuring the Degree of Modulation of a Television Signal.265 T. J. BUZALSKI
Development of an Ultra Low Loss Transmission Line for Television 272 E. O. JOHNSON
Technical Papers by RCA Authors 281
Contributors to This Issue 284
RCA REVIEW BOARD OF EDITORS
Chairman DR. C. B. JOI.I.IFFE
Executive Vice President in Charge of
RCA Laboratories Division
E. W. ENGSTROM Vice President in Charge of Research
RCA Laboratories Division
D. F. SCHMIT Vice President in Charge of Engineering
RCA Victor Division
I. F. BYRNES Vice President in Charge of Engineering Radiomarine Corporation of America
DR. A. N. GOLDSMITH Consulting Engineer
Radio Corporation of America DR. H. H. BEVERAGE.
Director of Radio Systems Research Laboratory
RCA Laboratories Division
G. L. BEERS Assistant Director of Engineering
in Charge of Advanced Development RCA Victor Division
A. F. VAN DYCK Assistant to the Executive Vice President
in Charge of RCA Laboratories Division
H. B. MARTIN Assistant Chief Engineer
Radiomarine Corporation of America
DR. H. F. OLSON Research Section Head (Acoustics)
RCA Laboratories Division
O. B. HANSON Vice President and Chief Engineer National Broadcasting Company, Inc.
R. R. BEAL Vice President in Charge of Engineering
RCA Communications, Inc. E. A. LAPORT
Chief Engineer RCA International Division
ORRIN E. DUNLAP Director of Advertising and Publicity Radio Corporation of America
DR. V. K. ZWORYKIN Director of Electronic Research Laboratory RCA Laboratories Division
C. W. LATIMER Vice President and Chief Engineer
RCA Communications, Inc. DR. I. WOLFF
Director of Radio Tube Research Laboratory RCA Laboratories Division
R. E. SHELBY Director of Technical Development National Broadcasting Company, Inc.
S. W. SEELEY Manager of Industry Service Laboratory
RCA Laboratories Division
W. F. AUFENANGER Superintendent
RCA Institutes, Inc. Secretary
GEORGE M. K. BAKER Staff Assistant to Executive Vice President in Charge of RCA Laboratories Division
Previously unpublished papers appearing herein may be reprinted, abstracted or abridged, provided credit is given to RCA REVIEW and to the author, or authors, of the papers in question. Reference to the issue date or number is desirable. Permission to quote other papers should be obtained from the publica- tions to which credited.
FOREWORD
THE announcement concerning "TECHNICAL ARTICLES BY
RCA AUTHORS" which appeared on page 135 of the March
1946 issue has been revised in several details, as follows:
(1) It has been found desirable to limit the listing to technical
papers which have actually appeared in printed form in recog-
nized periodicals;
(2) The publication date of RCA REVIEW makes it necessary
that each issue contain a list of papers which were published
in the preceding quarter.
In accordance with the above, the section "TECHNICAL PAPERS
BY RCA AUTHORS" commences with this issue and includes a listing
of papers published between January 1 and March 31, 1946. Any
requests for copies of the papers listed in this section should be
addressed to the periodical concerned. 'No
All inquiries concerning papers published in RCA REVIEW and
any comments or suggestions should be addressed to: Manager, RCA
REVIEW, Radio Corporation of America, RCA Laboratories Division,
Princeton, N. J.
Manager, RCA REVIEW.
139

AN EXPERIMENTAL COLOR TELEVISION SYSTEM* BY
R. D. KELL, G. L. FREDENDALL, A. C. SCHROEDER, R. C. WEBB
Research Department, RCA Laboratories Division, Princeton, N. J.
Summary -A description is given of color television apparatus using an image orthicon in the color camera for direct pickup of studio scenes. A
sequential three -color semi - mechanical system is used. Provision is made for demonstration of color pictures in three dimensions. The associated sound channel is transmitted on the edge of the picture during a portion of the horizontal blanking period.
INTRODUCTION
ATE in 1945 and early in 1946, a series of demonstrations were given of television in color and of television images in three dimensions, also in color. These demonstrations were conducted
to show the status and to point out the problems remaining to be solved
before color television could be considered ready for deiopment as a
service. The remaining problems are such as to require much addi-
tional research and development. However, this article is not concerned
with these aspects of the situation but rather with a description of the system and apparatus used during the demonstrations.
Work on broadcast television was interrupted by the war, but advances in electronic and radio techniques during the war period did
have a direct influence on television, particularly monochrome television.
In order to resume the studies of color television and to evaluate these advances as they applied to television in color, laboratory facilities for research on the various problems involved in the generation, trans- mission and reception of television images in color together with new
studio facilities, new circuits and apparatus were developed and put in operation.
CAMERA STUDIO SETTING
A small studio set was constructed in the laboratory to make pos-
sible small scale productions of colorful program material. The set is shown in Figure 1. Illumination is obtained from an overhead bank of 36 100 -watt fluorescent lamps which provide an incident light of
about 200 foot- candles. Two auxiliary banks of 24 100 -watt lamps
* Decimal Classification: R583
141
142 RCA REVIEW
CAMERA STUDIO
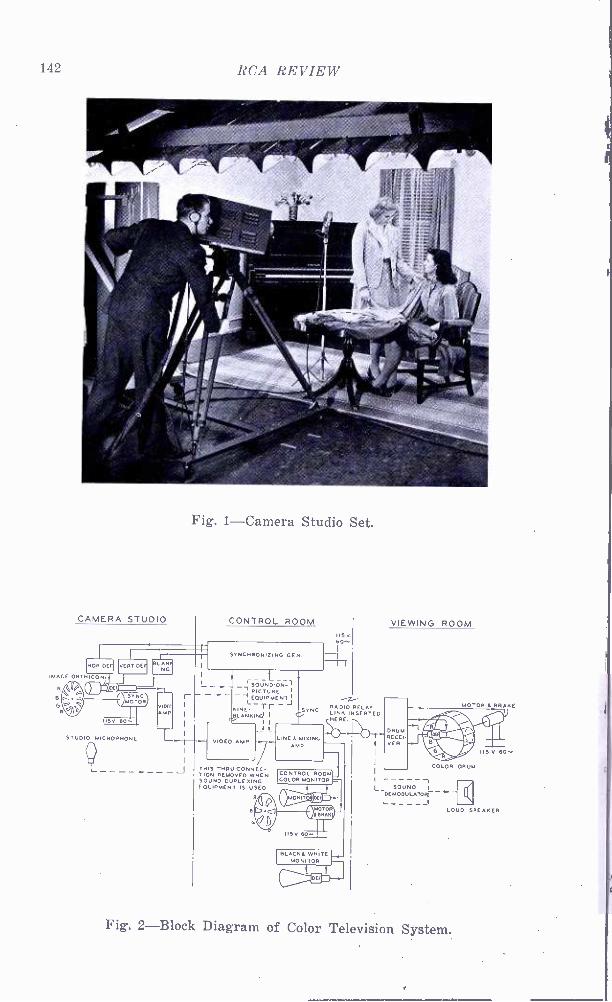
Fig. 1- Camera Studio Set.
CONTROL ROOM
NOR DE MEAT DE
IMAGE ORTHICON
ell WM SYNC
MOTOR B
BL AN I
r VIDEO I
AMP
STUDIO MICROPHONE
SYNCHRONIZING GEN.
I IS V.
60 M
L__ rSOUNDON- - __ , PICTUR I - EQUIPMENT I
L -rr- J MINE- ST
¿LANnINrJ I G I
I. VIDEO AMP
THIS TNRU CONNEC TION REMOVED WHEN SOUND DUPLEXING EQUIPMENT IS USED.
LINEN MIXING AMP
RADIO RELAY LINK INSERTED HERE.
I
CONTROL ROOM COLOR /_ BLACK I WHITE
MONITOR
VIEWING ROOM
DRUM RECEI- VER
MOTOR I BRAKE
I ¡ -- - - --I L, SOUND I
IDEMODULATOIr
LOUD SPEAKER
Fig. 2 -Block Diagram of Color Television System.
COLOR TELEVISION 143
each can be moved about as desired in front of the scene to bring the combined illumination up to more than 400 foot -candles. In order to obtain a more uniform light spectrum, half of the lamps are of the white type and half are of the daylight type. By distributing the lamps uniformly on the 3 -phase 60 -cycle power supply, no difficulty is experi- enced due to the lights operating on alternating current power.
CIRCUITS AND APPARATUS
A complete set of experimental equipment was constructed as shown in the block diagram of Figure 2. The system employs the latest and most suitable devices and circuits which have resulted from many years of extensive research in the field of electronic monochrome television. Added to these electronic components are two mechanically rotated tri -color filters so arranged that when the observer is viewing the picture on the kinescope through a red section of the filter in the receiver, for example, the pickup tube is being exposed to the televised scene through a red section of the filter in the camera. Similarly, when the blue and green filter sections, in turn, are in front of the kinescope, the blue and green sections are correspondingly in front of the pickup tube. The red, blue, and green images are repeated frequently enough so that the three are superimposed by the "persistence 4f ` vision" of the observer, to create the illusion of a single picture in multiple colors."2.3.4.5
The operating standards used are: 120 fields per second, 60 frames 2 to 1 interlaced, 525 lines, 40 single -color fields or 20 interlaced full color pictures per second. The color sequence is red, blue, green. With these operating standards, the resolution obtained with the overall system is about 250 lines.
The apparatus is designed so that by slight modification the trans- mission and reception of color pictures in three dimensions can be demonstrated. For this operating condition, polarizing light filters are incorporated with the rotating color filters at the camera and the kine- scope. Special polaroid spectacles are provided for the observers to enable them to separate the right and left images.
During public demonstrations of the color equipment, when it was necessary to transmit the signal to a point several miles away by means of a microwave relay link, it was found convenient to transmit the asso-
1 J. H. Hammond, U. S. Patent No. 1,725,710. 2 R. D. Kell, U. S. Patent No. 1,748,883. 8 J. L. Baird, British Patent No. 473,323. 4 P. C. Goldmark, J. N. Dyer, E. R. Piore and J. M. Hollywood, "Color
Television, Part I ", Proc. I.R.E., Vol. 30, No. 4, pp. 162 -182, April, 1942. 5 CBS Engineers, "Color Television on Ultra High Frequencies ", Elec-
tronics, Vol. 19, No. 4, pp. 109 -115, April, 1946.
144 RCA REVIEW
ciated sound on the same radio carrier as the picture by means of a time division duplexing circuit.°
CAMERA
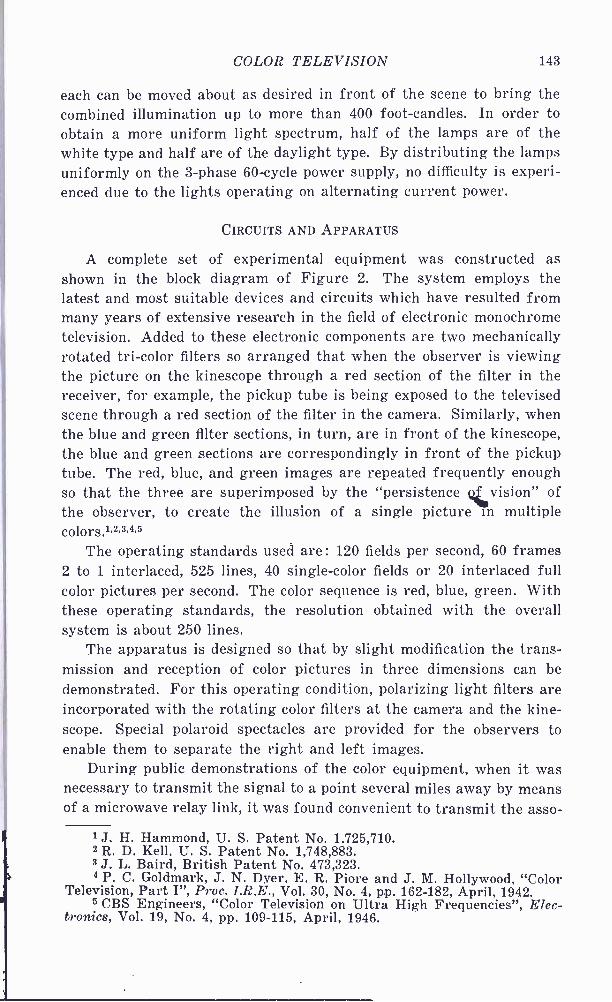
One of the most outstanding new components incorporated in the color system is a special form of the image orthicon.? This camera tube is found to have sufficient sensitivity and a sufficiently uniform spectral response to make possible direct pickup of studio and outdoor scenes having an illumination level of from 150 to 300 foot -candles.
Equalization of the sensitivity of the orthicon to the three colors is accomplished by appropriately masking down the aperture on the filter
Fig. 3- Experimental Color Camera, Left Side.
disc for those colors to which the tube is most sensitive, thus reducing the time devoted to storing charges during those particular color fields. Computation of the degree of masking required is based upon measure- ments of photo- cathode current flowing when the rotating color disc is
6 G. L. Fredendall, Kurt Schlesinger, and A. C. Schroeder, "Transmis- sion of Television Sound on the Picture Carrier ", Proc. I.R.E., Vol. 34, No. 2, pp. 49 -61, Feb., 1946.
7 Albert Rose and P. K. Weimer, "The Image Orthicon, a Sensitive Television Pickup Tube ", presented at the I.R.E. Winter Technical Meeting on January 24, 1946 in New York, N. Y.
COLOR TELEVISION 145
temporarily replaced by individual color filters. The subject for this
test should be a white surface illuminated by the studio lights. After
this first color balance has been obtained with a given camera tube, it is
possible to operate the camera in much the same way as a conventional
photographic camera. For televising scenes under illumination of
different color temperature, the correction is made by the addition
of a correcting filter over the lens.
The camera is used with either a 90 millimeter, f :3.5, or a 50
millimeter, f :1.9, Eastman Ektar lens. Both are color corrected. A
lens aperture of about f :4.5 is required for the illumination present in
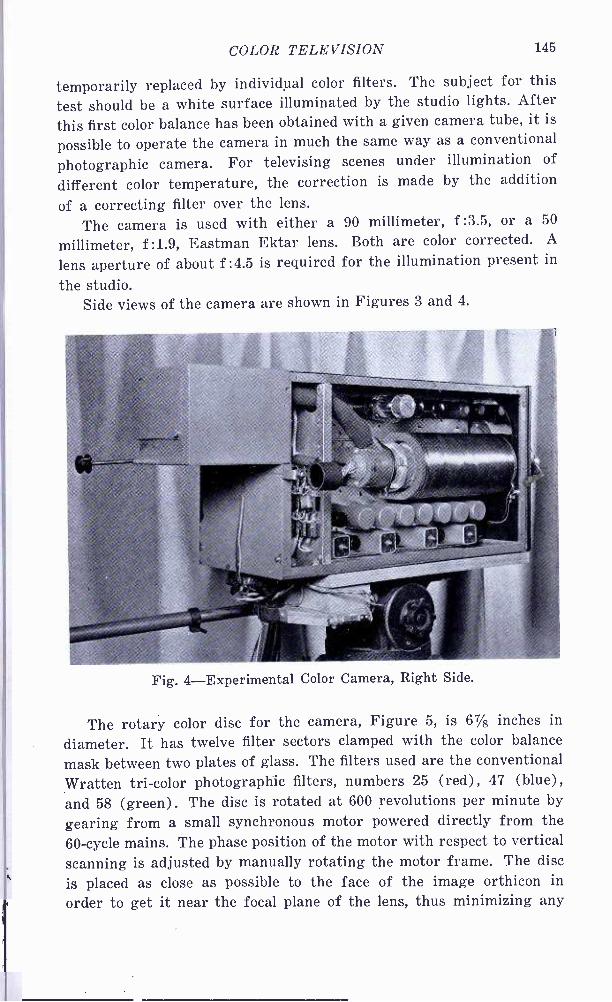
the studio. Side views of the camera are shown in Figures 3 and 4.
Fig. 4- Experimental Color Camera, Right Side.
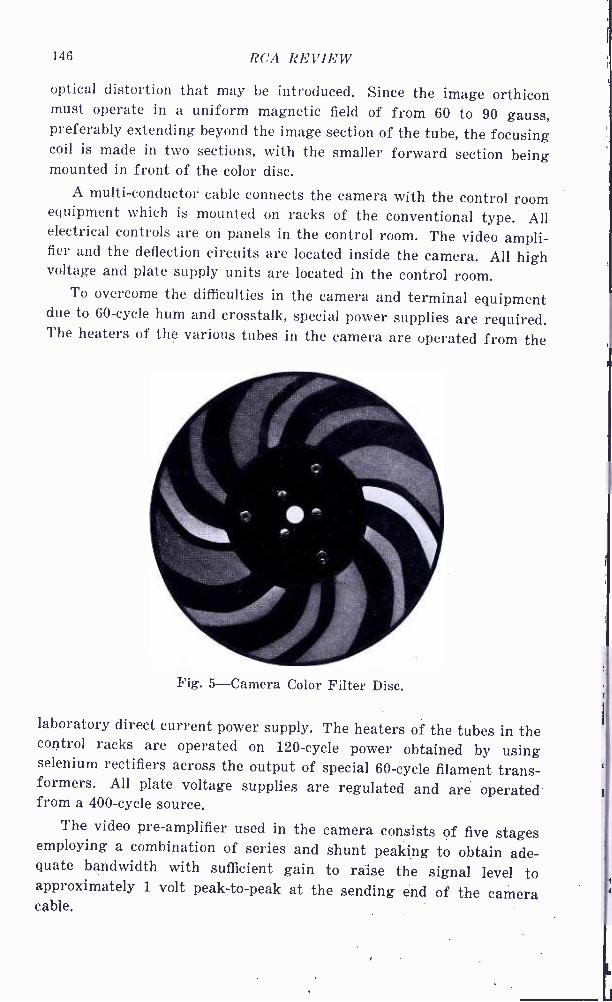
The rotary color disc for the camera, Figure 5, is 67/8 inches in
diameter. It has twelve filter sectors clamped with the color balance
mask between two plates of glass. The filters used are the conventional
Wratten tri -color photographic filters, numbers 25 (red) , 47 (blue) ,
and 58 (green) . The disc is rotated at 600 revolutions per minute by
gearing from a small synchronous motor powered directly from the 60 -cycle mains. The phase position of the motor with respect to vertical scanning is adjusted by manually rotating the motor frame. The disc
is placed as close as possible to the face of the image orthicon in
order to get it near the focal plane of the lens, thus minimizing any
146 RCA REVIEW
optical distortion that may be introduced. Since the image orthicon must operate in a uniform magnetic field of from 60 to 90 gauss, preferably extending beyond the image section of the tube, the focusing coil is made in two sections, with the smaller forward section being mounted in front of the color disc.
A multi- conductor cable connects the camera with the control room equipment which is mounted on racks of the conventional type. All electrical controls are on panels in the control room. The video ampli- fier and the deflection circuits are located inside the camera. All high voltage and plate supply units are located in the control room.
To overcome the difficulties in the camera and terminal equipment due to 60 -cycle hum and crosstalk, special power supplies are required. The heaters of the various tubes in the camera are operated from the
Fig. 5- Camera Color Filter Disc.
laboratory direct current power supply. The heaters of the tubes in the control racks are operated on 120 -cycle power obtained by using selenium rectifiers across the output of special 60 -cycle filament trans- formers. All plate voltage supplies are regulated and are operated from a 400 -cycle source.
The video pre -amplifier used in the camera consists of five stages employing a combination of series and shunt peaking to obtain ade- quate bandwidth with sufficient gain to raise the signal level to approximately 1 volt peak -to -peak at the sending end of the camera cable.
COLOR TELEVISION 147
CONTROL ROOM EQUIPMENT
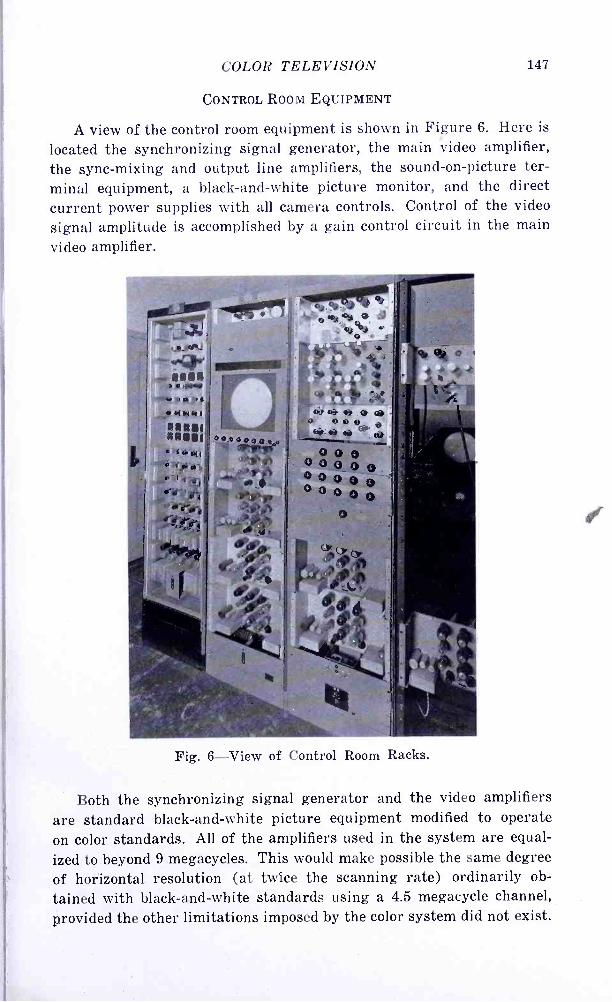
A view of the control room equipment is shown in Figure 6. Here is
located the synchronizing signal generator, the main video amplifier, the sync- mixing and output line amplifiers, the sound -on- picture ter- minal equipment, a black- and -white picture monitor, and the direct current power supplies with all camera controls. Control of the video
signal amplitude is accomplished by a gain control circuit in the main video amplifier.
Fig. 6 -View of Control Room Racks.
Both the synchronizing signal generator and the video amplifiers
are standard black- and -white picture equipment modified to operate on color standards. All of the amplifiers used in the system are equal-
ized to beyond 9 megacycles. This would make possible the same degree of horizontal resolution (at twice the scanning rate) ordinarily ob-
tained with black- and -white standards using a 4.5 megacycle channel, provided the other limitations imposed by the color system did not exist.
148 RCA REVIEW
CONTROL ROOM COLOR MONITOR
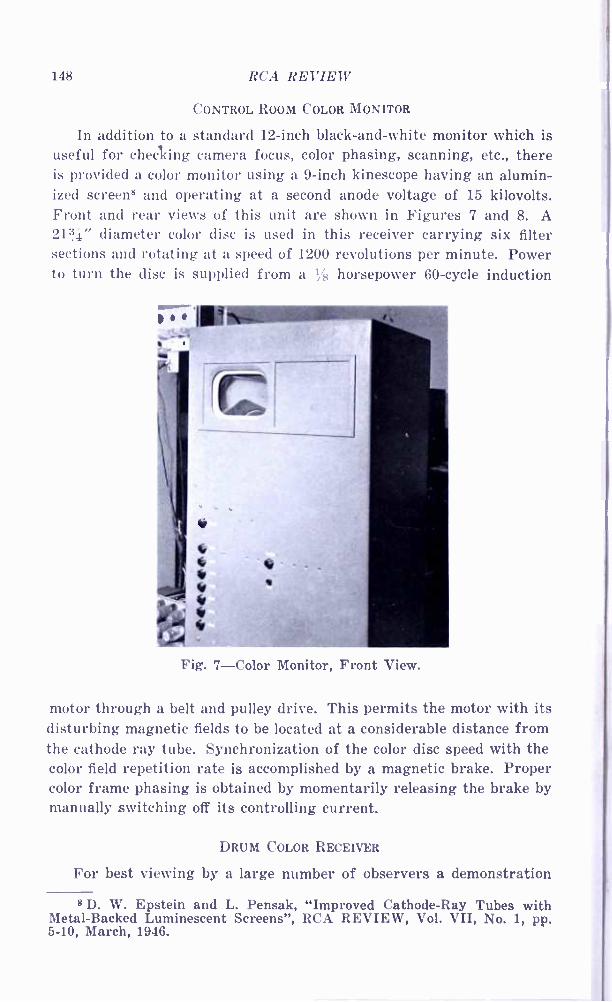
In addition to a standard 12 -inch black- and -white monitor which is useful for checking camera focus, color phasing, scanning, etc., there is provided a color monitor using a 9 -inch kinescope having an alumin- ized screen' and operating at a second anode voltage of 15 kilovolts. Front and rear views of this unit are shown in Figures 7 and 8. A 21: ¡" diameter color disc is used in this receiver carrying six filter sections and rotating at a speed of 1200 revolutions per minute. Power to turn the disc is supplied from a ?is horsepower 60 -cycle induction
Fig. 7 -Color Monitor, Front View.
motor through a belt and pulley drive. This permits the motor with its disturbing magnetic fields to be located at a considerable distance from the cathode ray tube. Synchronization of the color disc speed with the color field repetition rate is accomplished by a magnetic brake. Proper color frame phasing is obtained by momentarily releasing the brake by manually switching off its controlling current.
DRUM COLOR RECEIVER
For best viewing by a large number of observers a demonstration
8 D. W. Epstein and L. Pensak, "Improved Cathode -Ray Tubes with Metal- Backed Luminescent Screens ", RCA REVIEW, Vol. VII, No. 1, pp. 5 -10, March, 1946.

COLOR TELEVISION 149
receiver was built using a 12 -inch, short persistence, aluminized- screen
kinescope operating at a second anode potential of 17 kilovolts. Photo-
graphs of this receiver are shown in Figures 9 and 10.
The rotary color filter is in the form of a large drum, one end of
which is open to allow the kinescope to be supported inside the drum
and at right angles to the axis of the drum by a stationary bracket.
The other end of the drum is closed to provide attachment to the drive
shaft. The periphery of the drum consists of 12 rectangular red, blue,
and green color filter sections clamped in a suitable framework. The
drum is rotated at 600 revolutions per minute, in the direction of ver-
Fig. 8 -Color Monitor, Rear View.
tical scanning and in synchronism with the picture field repetition rate. The mechanical drive for the drum is similar to that used for the disc of the control room color monitor.
To overcome the difficulties due to 60 -cycle interference in various components of the receiver, several precautions are taken. The kine- scope is placed in a large mu -metal shield to protect it from the mag- netic fields of the motor and power transformers. The power supply for the tube plates is obtained from a regulated source. All heater power is obtained from a full -wave selenium rectifier,
150 RCA REVIEW
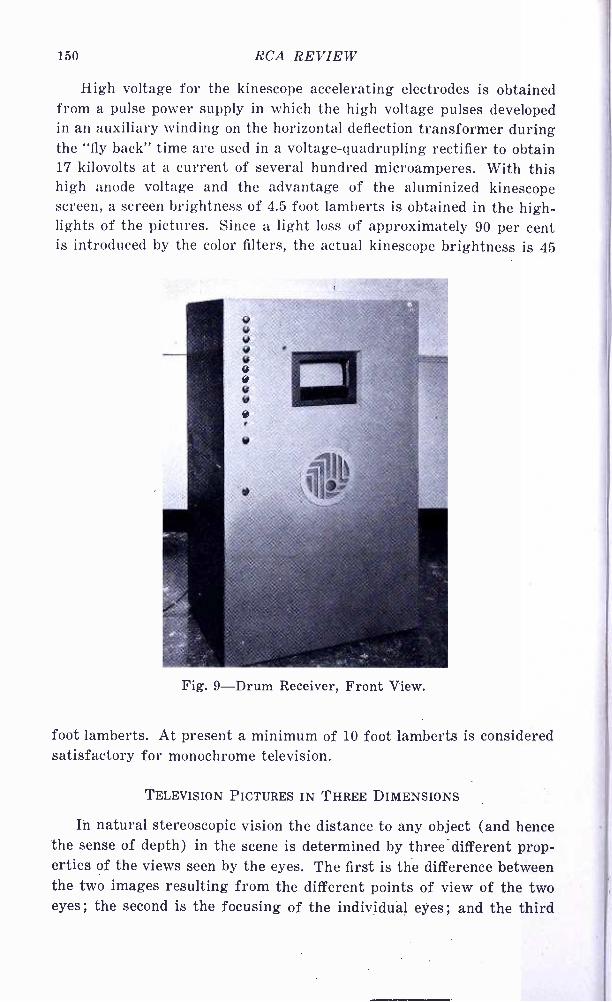
High voltage for the kinescope accelerating electrodes is obtained from a pulse power supply in which the high voltage pulses developed in an auxiliary winding on the horizontal deflection transformer during the "fly back" time are used in a voltage -quadrupling rectifier to obtain 17 kilovolts at a current of several hundred microamperes. With this high anode voltage and the advantage of the aluminized kinescope screen, a screen brightness of 4.5 foot lamberts is obtained in the high- lights of the pictures. Since a light loss of approximately 90 per cent is introduced by the color filters, the actual kinescope brightness is 45
Fig. 9 -Drum Receiver, Front View.
foot lamberts. At present a minimum of 10 foot lamberts is considered satisfactory for monochrome television.
TELEVISION PICTURES IN THREE DIMENSIONS
In natural stereoscopic vision the distance to any object (and hence the sense of depth) in the scene is determined by three different prop- erties of the views seen by the eyes. The first is the difference between the two images resulting from the different points of view of the two eyes; the second is the focusing of the individual eyes; and the third
COLOR TELEVISION 151
is the amount of convergence or toe -in of the two eyes to see a given object in the scene.
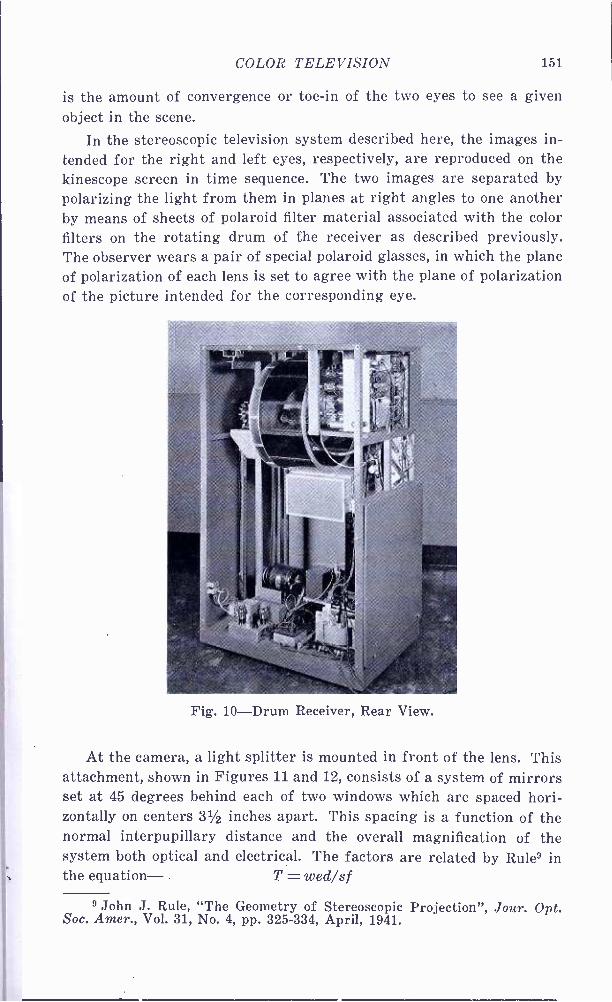
In the stereoscopic television system described here, the images in- tended for the right and left eyes, respectively, are reproduced on the kinescope screen in time sequence. The two images are separated by polarizing the light from them in planes at right angles to one another by means of sheets of polaroid filter material associated with the color filters on the rotating drum of the receiver as described previously. The observer wears a pair of special polaroid glasses, in which the plane of polarization of each lens is set to agree with the plane of polarization of the picture intended for the corresponding eye.
Fig. 10 -Drum Receiver, Rear View.
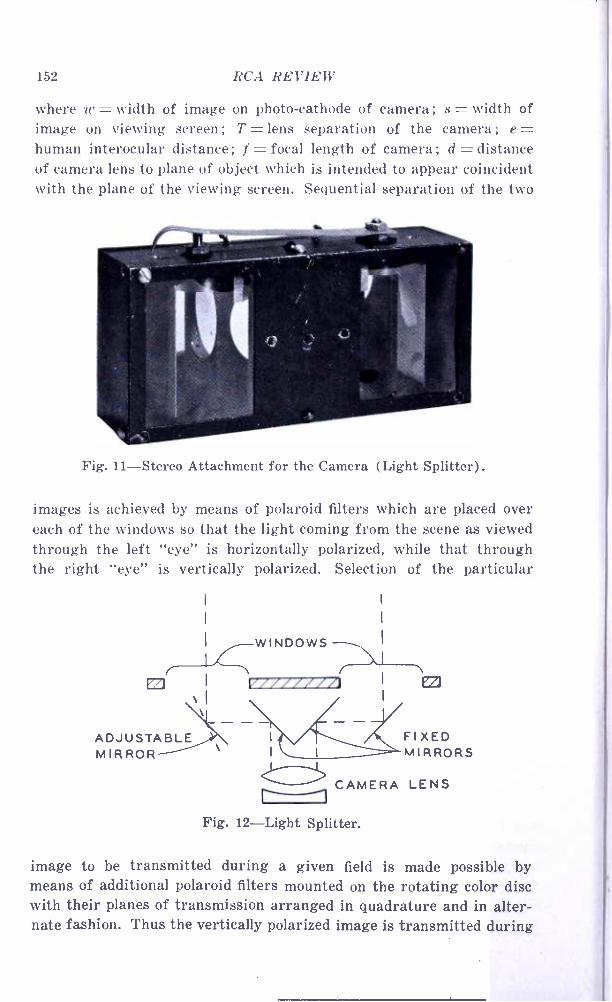
At the camera, a light splitter is mounted in front of the lens. This attachment, shown in Figures 11 and 12, consists of a system of mirrors set at 45 degrees behind each of two windows which are spaced hori- zontally on centers 31/2 inches apart. This spacing is a function of the normal interpupillary distance and the overall magnification of the system both optical and electrical. The factors are related by Rule' in the equation- . T = wed /sf
9 John J. Rule, "The Geometry of Stereoscopic Projection ", Jour. Opt. Soc. Amer., Vol. 31, No. 4, pp. 325 -334, April, 1941.
152 RCA REVIEW
where w = width of image on photo- cathode of camera; s = width of image on viewing screen ; T = lens separation of the camera ; e.= human interocular distance; f = focal length of camera; d = distance of camera lens to plane of object which is intended to appear coincident with the plane of the viewing screen. Sequential separation of the two
Fig. 11- Stereo Attachment for the Camera (Light Splitter).
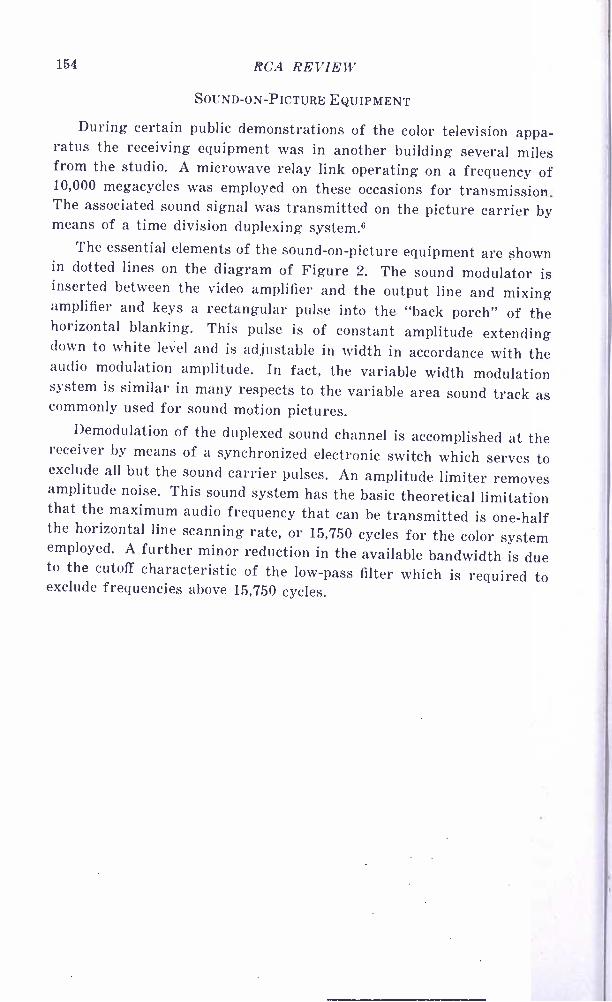
images is achieved by means of polaroid filters which are placed over each of the windows so that the light coming from the scene as viewed through the left "eye" is horizontally polarized, while that through the right "eye" is vertically polarized. Selection of the particular
ADJUSTABLE MIRROR
WINDOWS - .
FIXED KAIRRORS
CAMERA LENS
Fig. 12 -Light Splitter.
image to be transmitted during a given field is made possible by means of additional polaroid filters mounted on the rotating color disc with their planes of transmission arranged in quadrature and in alter- nate fashion. Thus the vertically polarized image is transmitted during

COLOR TELEVISION 153
one field and the horizontally polarized image during the next, the
unwanted image being suppressed by crossed polarization.
The angular setting of one of the mirrors in the light splitter is
adjustable so that the convergence of the camera "eyes" can be set to
bring into register some object near the center of the useful depth of
field. Observation of this point on the screen of the kinescope corre-
sponds to the situation illustrated in Figure 13 (A) . In this case the
object appears to be in the plane of the viewing screen since the angle
of toe -in of the eyes is commensurate with the focal distance. The
image of objects farther away from the camera will not fall at the
same place on the screen, but will be separated horizontally a small
amount, depending upon their position. Thus the horizontally polarized
image intended for the left eye is displaced to the left as indicated in APPARENT IMAGE POSITION
VIEWING SCREEN
H,V i',c, o" I
/
I 11 I I APPARENT
\ 1 /\ IMAGE POS
I \ I I / \
I \ I \ / \ POLAROID / 1 I \ / \\`' LENSES--LLH V1__"1..__iy_-_
L e ® ® L á
OBSERVE A B C EYES
Fig. 13 -The Geometry of Stereo Viewing.
Figure 13 (B) . This condition gives the impression that the object is
behind the screen as a result of the angle that the eyes must take in
order to obtain fusion of the two images. Conversely, objects nearer to the camera are displaced horizontally in the opposite direction on
the screen as shown in Figure 13 (C) and thus appear to the observer to be located in front of the screen.
The optical adjustments of the system can be made to give ortho- stereoscopic pictures only for one viewing distance and screen size. When more than one receiver is to be operated from a given camera, and if different amounts of magnification are to be used, some correc- tion for the depth and perspective distortion can be obtained by key- ing the horizontal positioning circuit field by field thus changing the horizontal displacement of a given object on the screen, and hence its apparent position relative to the observer.
154 RCA REVIEW
SOUND -ON- PICTURE EQUIPMENT
During certain public demonstrations of the color television appa- ratus the receiving equipment was in another building several miles from the studio. A microwave relay link operating on a frequency of 10,000 megacycles was employed on these occasions for transmission. The associated sound signal was transmitted on the picture carrier by means of a time division duplexing system.6
The essential elements of the sound -on- picture equipment are shown in dotted lines on the diagram of Figure 2. The sound modulator is inserted between the video amplifier and the output line and mixing amplifier and keys a rectangular pulse into the. "back porch" of the horizontal blanking. This pulse is of constant amplitude extending down to white level and is adjustable in width in accordance with the audio modulation amplitude. In fact, the variable width modulation system is similar in many respects to the variable area sound track as commonly used for sound motion pictures.
Demodulation of the duplexed sound channel is accomplished at the receiver by means of a synchronized electronic switch which serves to exclude all but the sound carrier pulses. An amplitude limiter removes amplitude noise. This sound system has the basic theoretical limitation that the maximum audio frequency that can be transmitted is one -half the horizontal line scanning rate, or 15,750 cycles for the color system employed. A further minor reduction in the available bandwidth is due to the cutoff characteristic of the low -pass filter which is required to exclude frequencies above 15,750 cycles.
WIDE RANGE LOUDSPEAKER DEVELOPMENTS` BY
H. F. OLSON AND J. PRESTON
Research Department, RCA Laboratories Division, Princeton, N. J.
,Summary -Two unit direct- radiator loudspeakers may be constructed in many different ways. In order to determine some of the characteristics, a number of experimental designs were built and tested. As a result of these experiments, it appeared that the duo -cone loudspeaker, consisting of two coaxial, congruent, separately driven cones, possessed many constructional, theoretical and experimental advantages. Consequently, a detailed theoretical and experimental investigation of the due -cone loudspeaker was carried out to determine the optimum values for the constants of the system from the standpoint of the following characteristics; pressure response, directional pattern, distortion and transient response. The results of these investi- gations are included.
INTRODUCTION
THE almost universal use of the direct -radiator loudspeaker is due to its simplicity of construction, small space requirements and the relatively uniform response frequency characteristic.
Uniform response over a moderate frequency band may be obtained with any simple direct -radiator loudspeaker. However, reproduction over a wide frequency range is restricted by practical limitations. The portion of the speech range required for intelligibility falls in the mid - audio band. The range of the fundamental frequencies of most horn, reed and string instruments also falls within this band. This is rather fortunate because it is a very simple task to build mechanical and acous- tical vibrating systems to cover only this mid -frequency band. The two extreme ends of the audio -frequency band are the most difficult to reproduce with efficiency comparable to the mid -frequency range. In- efficiency at the low frequencies is primarily due to a small radiation resistance. Inefficiency at the high frequencies is primarily due to large mass reactance.
The volume range is another factor involved in sound reproduction. In the middle frequency band the ear has a volume range of a million to one in pressure, or a trillion to one in energy. To build linear repro- ducing apparatus for this tremendous range is practically impossible today. As a matter of fact, it is not practical to reproduce the volume range of all musical instruments.
An increase in the volume and frequency ranges of the loudspeaker
* Decimal Classification : R365.2
155
156 RCA REVIEW
multiplies the problems connected with obtaining the proper directional pattern, low nonlinear distortion and suitable transient response. The directional characteristics of the conventional direct- radiator loud- speaker are quite adequate for the frequency range of the present -day broadcast receivers. However, when the high frequency range is in- creased by one to two octaves, the directional pattern becomes quite narrow and some consideration must be given to this problem. The problem of nonlinear distortion is multiplied several times by the addi- tion of one or two octaves. The additional volume range, of course, complicates the problem of nonlinear distortion. It has been found that poor transient response is not objectionable in the case of a loudspeaker with a limited frequency range -in some cases it actually enhances the reproduction. However, a wide -range high -fidelity loudspeaker should exhibit good transient response. From the above discussion it will be seen that additional volume and frequency ranges increase the complex- ity of the technical problems in loudspeaker design and manufacture.
Wide frequency range, low distortion loudspeakers are required for monitoring in radio and television broadcasting, phonograph and sound motion picture recording and high quality sound systems. The direct radiator loudspeaker is particularly suited for these applications because the acoustic power required is relatively low and the space requirements rather limited.
It is the purpose of this paper to describe the following: the devel- opment work on a wide range direct radiator loudspeaker; the perform- ance of an experimental duo -cone direct -radiator loudspeaker.
TWO -UNIT LOUDSPEAKERS
Two -unit loudspeakers may be constructed in many different ways. In order to determine some of the characteristics, a number of experi- mental designs were built and tested. Some of the theoretical and prac- tical advantages and disadvantages will be described.
The simplest two -unit direct -radiator loudspeaker consists of a small cone unit and a large cone mounted on the front face of a flat baffle as shown in Figure 1. If the response covers the frequency range from 40 to 15,000 cycles the natural overlap region will be somewhere between 1000 and 2000 cycles. A system of the type depicted in Figure 1 consists of a cone fifteen inches in diameter in the low fre- quency unit and two inches in diameter in the high frequency unit. Due to the mounting arrangements of the two units the spacing between the two units in the baffle was fifteen inches. The middle of the overlap region was placed at 1500 cycles. The directional pattern at 1500 cycle$

WIDE RANGE LOUDSPEAKERS 157
C OH.F. UNIT
I L.F.UNIT
rÒ
FRONT VIEW SECTION A -A
Fig. 1 -A coplaner combination of low and high frequency direct- radiator loudspeaker units.
is shown in Figure 2. Complete destructive interference occurs when the distance between the two units is one -half wavelength and odd mul- tiples of one -half wavelength. The type of directional characteristic shown in Figure 2 introduces frequency discrimination for points removed from the axis in a very important frequency band.
o
Oo
Fig. 2 -The directional characteristics in the overlap region of the coplaner combination of low and high frequency direct -radiator loudspeaker units
shown in Figure 1.
158 RCA REVIEW
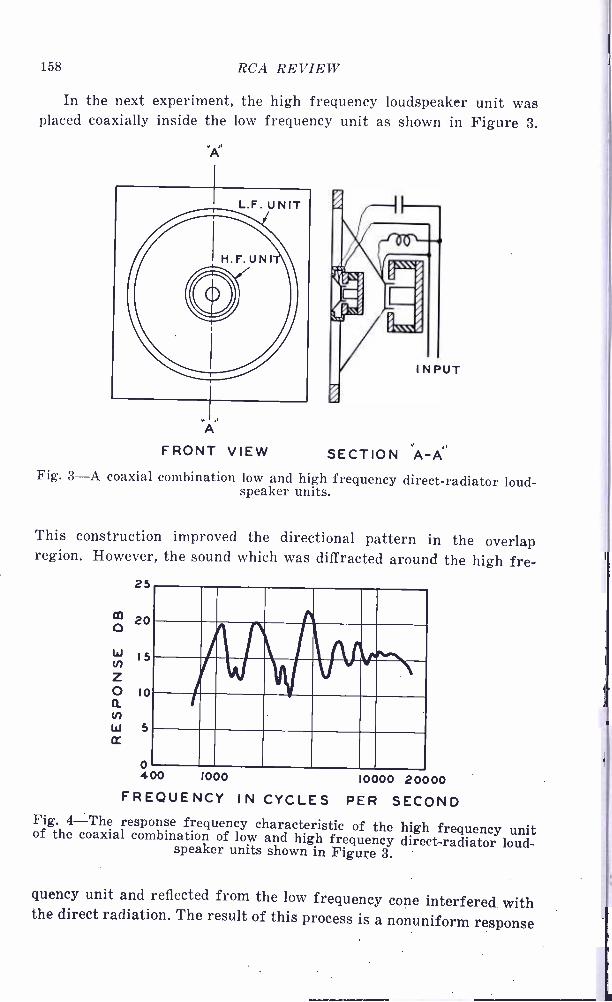
In the next experiment, the high frequency loudspeaker unit was placed coaxially inside the low frequency unit as shown in Figure 3.
A
VIEW SECTION A -A Fig. 3 -A coaxial combination low and high frequency direct -radiator loud-
speaker units.
This construction improved the directional pattern in the overlap region. However, the sound which was diffracted around the high fre-
25
20
15
10
5
o 400 1000 10000 20000
FREQUENCY IN CYCLES PER SECOND Fig. 4 -The response frequency characteristic of the high frequency unit of the coaxial combination of low and high frequency direct -radiator loud- speaker units shown in Figure 3.
quency unit and reflected from the low frequency cone interfered with the direct radiation. The result of this process is a nonuniform response
WIDE RANGE LOUDSPEAKERS 159
frequency characteristic as shown in Figure 4.
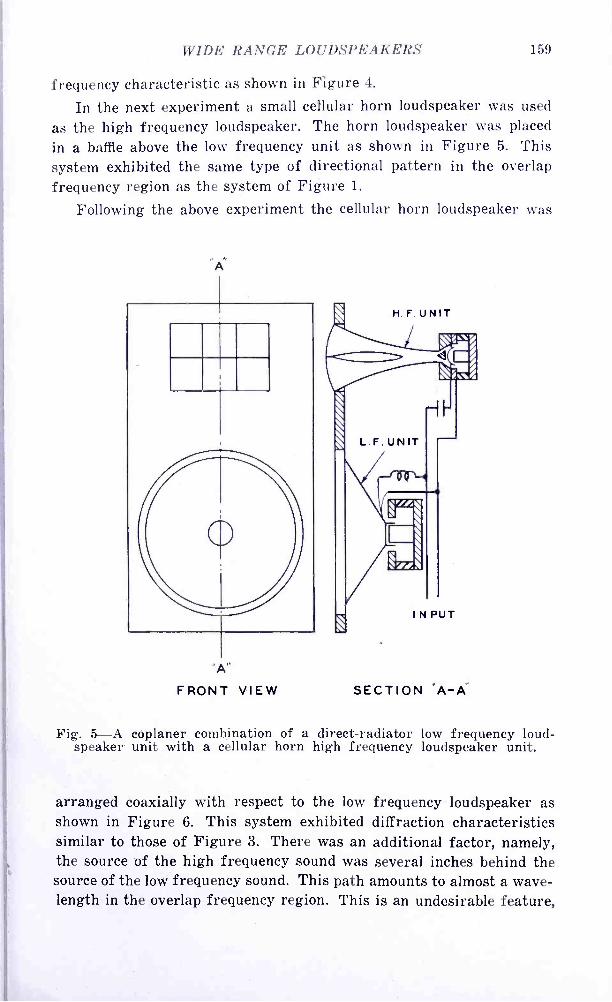
In the next experiment a small cellular horn loudspeaker was used as the high frequency loudspeaker. The horn loudspeaker was placed in a baffle above the low frequency unit as shown in Figure 5. This system exhibited the same type of directional pattern in the overlap frequency region as the system of Figure 1.
Following the above experiment the cellular horn loudspeaker was
A
'A
FRONT VIEW SECTION .A -A
Fig. 5 -A coplaner combination of a direct -radiator low frequency loud- speaker unit with a cellular horn high frequency loudspeaker unit.
arranged coaxially with respect to the low frequency loudspeaker as shown in Figure 6. This system exhibited diffraction characteristics similar to those of Figure 3. There was an additional factor, namely, the source of the high frequency sound was several inches behind the source of the low frequency sound. This path amounts to almost a wave- length in the overlap frequency region. This is an undesirable feature,
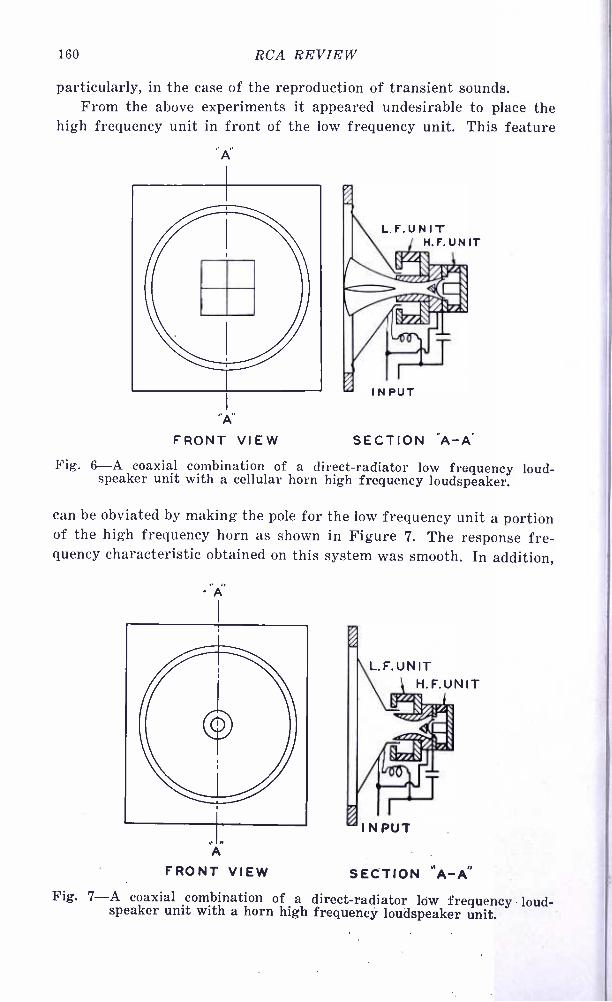
160 RCA REVIEW
particularly, in the case of the reproduction of transient sounds. From the above experiments it appeared undesirable to place the
high frequency unit in front of the low frequency unit. This feature
L.F.UNIT H.F.UNIT
INPUT
FRONT VIEW SECTION A -A.
Fig. 6-A coaxial combination of a direct -radiator low frequency loud- speaker unit with a cellular horn high frequency loudspeaker.
can be obviated by making the pole for the low frequency unit a portion of the high frequency horn as shown in Figure 7. The response fre- quency characteristic obtained on this system was smooth. In addition,
-A
A
FRONT VIEW
L.F.UNIT H.F.UNIT
SECTION .A -A' Fig. 7 -A coaxial combination of a direct -radiator low frequency loud- speaker unit with a horn high frequency loudspeaker unit.

WIDE RANGE LOUDSPEAKERS 161
the directional pattern was acceptable particularly when a wide angle
low frequency cone was used. The difference in path length between the
source of the low and high frequency units was still an undesirable
feature. There is another problem when a horn and direct -radiator loud-
speaker are combined, namely, the difference in efficiency. The efficiency
of a horn loudspeaker is from 10 to 20 decibels greater than the direct
radiator loudspeaker. This means that an attenuation network must be
used with the horn unit to obtain comparable efficiencies and uniform
response from the combination of the two units.
pÁ
L.F. UNIT
A
FRONT VIEW SECTION A -A
Fig. 8-A congruent coaxial combination of low frequency and high fre- quency direct -radiator loudspeaker units.
In the next experiment two cone loudspeaker units were combined
so that the large cone was a continuation of the small cone as shown in
Figure 8. This system has been termed a duo -cone loudspeaker. The
combination system shown in Figure 8 eliminates the path difference
factor because in the overlap region the two cones vibrate together as a single cone.
As a result of the above experiments it appeared that the duo -cone
loudspeaker possessed many constructional, theoretical and experi- mental advantages. In view of this, it was decided to make a detailed investigation of the duo -cone loudspeaker. It is the purpose of the sec-
tions which follow to describe in detail some of the characteristics of the duo -cone loudspeaker.
162 RCA REVIEW
THEORETICAL CONSIDERATIONS
The performance of a direct- radiator loudspeaker may be obtained from theoretical considerations.' Theoretical investigations are useful in determining the dimensions of the units, the masses of the voice coils and cones, the air gap flux, the fundamental resonant frequencies and other relevant factors. Proper evaluation of these factors is important in obtaining a scientifically coordinated loudspeaker system. It is the purpose of this section to outline theoretically the action of the duo -cone loudspeaker consisting of two congruent, coaxial direct -radiator loud- speaker systems.
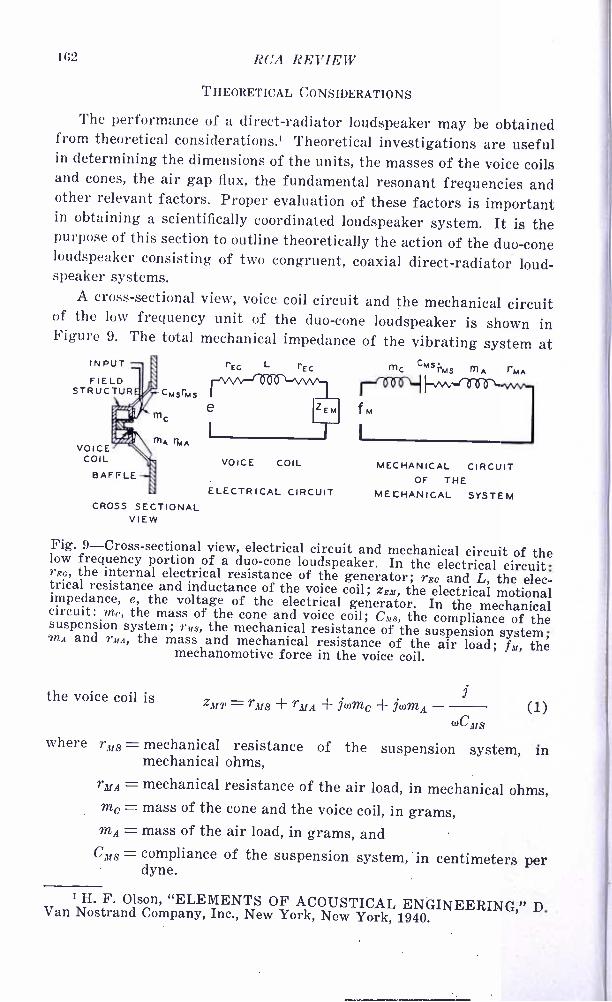
A cross -sectional view, voice coil circuit and the mechanical circuit of the low frequency unit of the duo -cone loudspeaker is shown in Figure 9. The total mechanical impedance of the vibrating system at
INPUT
FIELD STRUCTUR
VOICE COIL
BAFFLE
CMS
mA InA
CROSS SECTIONAL VIEW
rEC
VOICE COIL
ELECTRICAL CIRCUIT
fT1 C CM S¡`M S m( A r M A
VVV --1
fM
MECHANICAL CIRCUIT OF THE
MECHANICAL SYSTEM
Fig. 9- Cross -sectional view, electrical circuit and mechanical circuit of the low frequency portion of a duo -cone loudspeaker. In the electrical circuit: rEG, the internal electrical resistance of the generator; rE0 and L, the elec- trical resistance and inductance of the voice coil; zEM, the electrical motional impedance, e, the voltage of the electrical generator. In the mechanical circuit: mc, the mass of the cone and voice coil; CMS, the compliance of the suspension system; rMs, the mechanical resistance of the suspension system; mnA and rMA, the mass and mechanical resistance of the air load; fM, the mechanomotive force in the voice coil.
the voice coil is j ZMT= rms +rMA + iconic +jwm4 (1)
aems where rMs = mechanical resistance of the suspension system, in
mechanical ohms, rMA = mechanical resistance of the air load, in mechanical ohms, me = mass of the cone and the voice coil, in grams, mA = mass of the air load, in grams, and
CMs = compliance of the suspension system, in centimeters per dyne.
1 H. F. Olson, "ELEMENTS OF ACOUSTICAL ENGINEERING," D. Van Nostrand Company, Inc., New York, New York, 1940.
WIDE RANGE LOUDSPEAKERS 163
Equation (1) may be written as follows:
ZMT = rMS + rMA + 9xMC +9XMA - ixMH (2)
where r,S = mechanical resistance of mechanical ohms,
r1A = mechanical resistance of the
xMC = wmc mechanical reactance
xMA = wmA = mechanical reactance ohms, and
the suspension system, in
air load, in mechanical ohms,
of the voice coil and cone,
of the air load, in mechanical
1 xms = = mechanical reactance of the suspension system,
wCMS in mechanical ohms.
The mechanical resistance and mechanical reactance of the air load may be obtained from Figure 10.
The motional impedance,' in abohms, of the mechanical system is
(Bl) 2
zEM = zMT
(3)
where B = flux density in air gap, in gausses,
l= length of the conductor in the voice coil, in centimeters and
zMT = mechanical impedance of the mechanical system, in mechan- ical ohms.
The efficiency of the loudspeaker is the ratio of the sound power output to the electrical input. The efficiency may be obtained from the voice coil circuit of Figure 9 and expressed as follows,
rEx µ= X 100% rEC + rEM
(4)
where rEE = component of the motional resistance due to the radiation of sound, in abohms,
rEM = total motional resistance, in abohms,
rEC = damped resistance of the voice coil, in abohms.
2 H. F. Olson, "DYNAMICAL ANALOGIES," D. Van Nostrand Com- pany, Inc., New York, New York, 1943.
164 RCA REVIEW
The components rRR and rEM may (2) and (3).
From equations (2), (3) and (4) loudspeaker is
106
W 105 U z
W
5. = 104
10 2 4 8 2 2 4 6 3 2
10 10
FREQUENCY
100
10
8 104
u z
0
be obtained from equations (1),
the efficiency, in per cent, of the
106
Io5
W a
4 2 10
J V
I 103
î 102
102 4 81022 4 81022 4 81042
FREQUENCY
100
0.1 0.1 f 4
602 2 103 I 2 4 8102 2 4 803 2 4 8104 2
FREQUENCY FREQUENCY
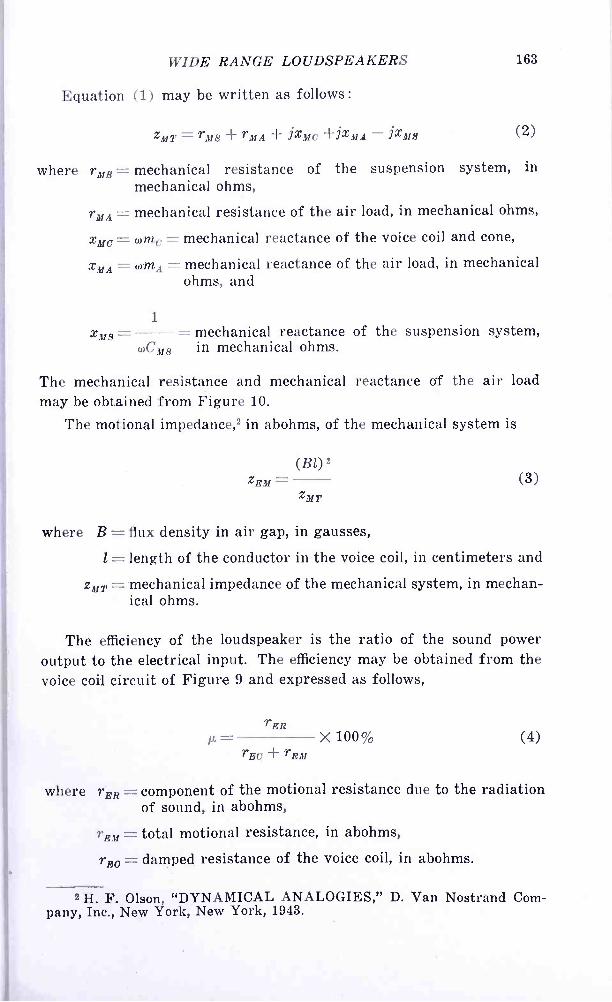
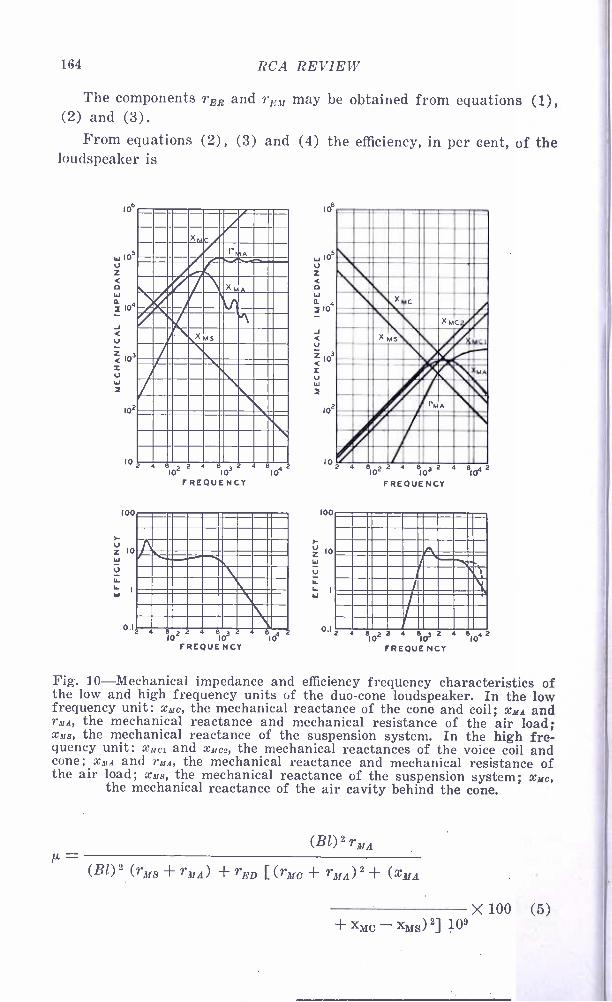
Fig. 10- Mechanical impedance and efficiency frequency characteristics of the low and high frequency units of the duo -cone loudspeaker. In the low frequency unit: xi/0, the mechanical reactance of the cone and coil; xMa and rMA, the mechanical reactance and mechanical resistance of the air load; xMS, the mechanical reactance of the suspension system. In the high fre- quency unit: xMC1. and xM02, the mechanical reactances of the voice coil and cone; xMA and rMa, the mechanical reactance and mechanical resistance of the air load; xMS, the mechanical reactance of the suspension system; xMo,
the mechanical reactance of the air cavity behind the cone.
(B1)2 rmA µ=
(B1)2 (raMS + rMA) -I- rED [ (raM + rasA) 2 -I- (xaM
+ XMC - XMS) 2] 109
X 100 (5)

WIDE RANGE LOUDSPEAKERS 165
Above the fundamental resonant frequency the mechanical reac-
tance due to the suspension system is small compared to the mechanical
reactance of the cone and coil. Since rMA is small compared to xMA and
xmc, equation (5) becomes
(B1)2 rmA X 100
rEC (xMA + xMc) 2 109 (6)
In terms of the resistivity and density of the voice coil, equation
(6) becomes,
B2 rmAmi = X 100 pKr (x mA + xasc) 2
(7)
where ml = mass of the voice coil, in grams,
p = density of the voice coil conductor, in grams per cubic centimeter, and
Kr = resistivity of the voice coil conductor, in ohms per cubic centimeter.
The relation between the efficiency and the ratio of the mass of the coil to the mass of the cone and air load may be obtained from equation (7) . The maximum efficiency occurs when the mass of the cone is equal to the mass of the coil.
The cone diameter of the low frequency unit used in the duo -cone
loudspeaker is 15 inches. The mechanical resistance and reactance characteristics of the elements of the vibrating systems are shown in
Figure 10. For the air load on the large cone it is assumed that it is
mounted in an infinite baffle.
The efficiency in which all the elements of the vibrating system are included may be obtained from equation (5) . The resistance rue due to
the suspension system is also a factor in the efficiency in the region of
resonance. The mechanical resistance, rMs, of the suspension system of
the large cone is 2400 mechanical ohms.
The efficiency characteristic is shown in Figure 10. It will be noted that the efficiency is higher at the resonant frequency. However, when
coupled to a vacuum tube driving system the motional impedance is
also increased which produces the power input to the voice coil. For this reason, the response is not accentuated to the degree depicted by the peak in the efficiency characteristic. It will be seen that the effi-
ciency decreases very rapidly below the resonant frequency. Therefore,
166 RCA REVIEW
in a direct- radiator loudspeaker the response limit at the low frequency end of the frequency range is determined by the resonant frequency of the system.
The motional impedance of a dynamic loudspeaker is given by equa- tion (3) . The normal impedance, in abohms, of voice coil is given by
ZEN = ZEM + ZED
where zEM = motional electrical impedance, in abohms, and
(8)
ZED = electrical impedance of the voice coil in the absence of motion, that is blocked, in abohms.
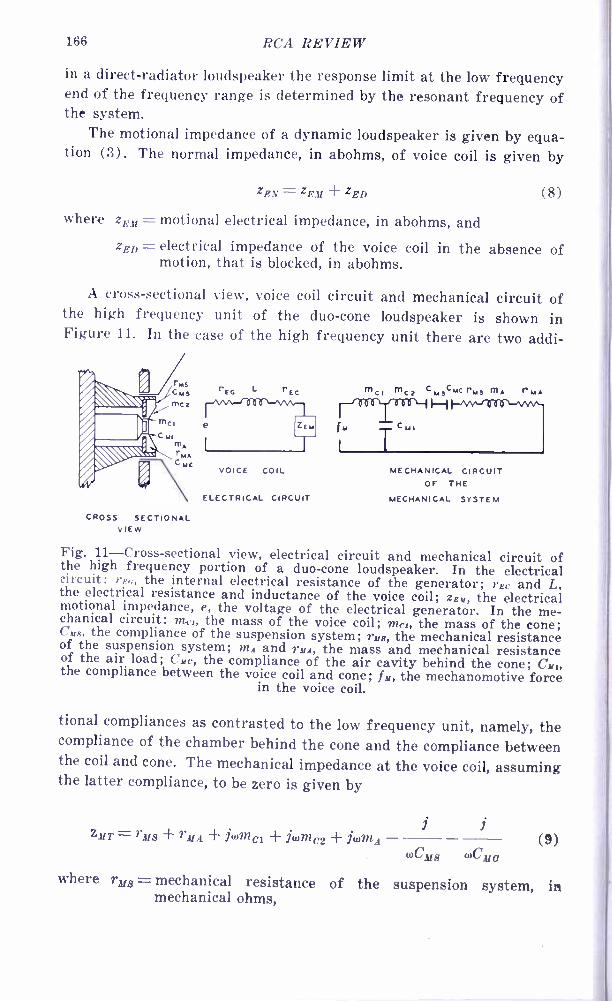
A cross- sectional view, voice coil circuit and mechanical circuit of the high frequency unit of the duo -cone loudspeaker is shown in Figure 11. In the case of the high frequency unit there are two addi-
rEG L "cc
CROSS SECTIONAL VIEW
fu
mCl mC2 CMSCMC PIAS mA rMA
H TCMI
VOICE COIL MECHANICAL CIRCUIT OF THE
ELECTRICAL CIRCUIT MECHANICAL SYSTEM
Fig. 11- Cross- sectional view, electrical circuit and mechanical circuit of the high frequency portion of a duo -cone loudspeaker. In the electrical circuit: rsa, the internal electrical resistance of the generator; rEe and L, the electrical resistance and inductance of the voice coil; zEM, the electrical motional impedance, e, the voltage of the electrical generator. In the me- chanical circuit: mc,, the mass of the voice coil; me,, the mass of the cone; Cg, the compliance of the suspension system; rug, the mechanical resistance of the suspension system; and and ruA, the mass and mechanical resistance of the air load; Cue, the compliance of the air cavity behind the cone; Cr,, the compliance between the voice coil and cone; fu, the mechanomotive force in the voice coil.
tional compliances as contrasted to the low frequency unit, namely, the compliance of the chamber behind the cone and the compliance between the coil and cone. The mechanical impedance at the voice coil, assuming the latter compliance, to be zero is given by
ZmT = rma -1- rlfA + jtumCi ...}. jtumC2 -F jiamd Cms 1.0Cara
(9)
where rim = mechanical resistance of the suspension system, in mechanical ohms,
WIDE RANGE LOUDSPEAKERS 167
rMA = mechanical resistance of the air load, in mechanical ohms,
mC1= mass of the voice coil, in grams,
mC2 = mass of the cone, in grams,
mA = mass of the air load, in grams,
CMS = compliance of the suspension system, in centimeters per dyne, and
Qua = compliance of the air chamber behind the cone, in centi- meters per dyne.
The efficiency, from equations (3), (4) and (9), is
= (BO' rMA
(Bl) 2 (rMC +rDIA) + rED [ (rMC + rMA) 2 +xd1A + xMCl + xMC2
+ XMS - xMC] 109
X 100 (10)
where rms = mechanical resistance of the suspension system, in mechanical ohms,
rMA = mechanical resistance of the air load, in mechanical ohms,
xMA =
xMC1=
xMC2 =
wmA = mechanical reactance of the air load, in mechan- ical ohms,
mC1= mechanical reactance of the voice coil, in me- chanical ohms,
(omc2 =
1
mechanical reactance of the cone, in mechanical ohms,
xms = = mechanical reactance of the suspension system, oCMS in mechanical ohms,
xMC = = mechanical reactance of the air chamber behind WCMC the cone, in mechanical ohms.
1
The cone diameter of the high frequency unit used in the duo -cone loudspeaker is 2 inches. The mechanical resistance and reactance char- acteristics of the elements of the vibrating system are shown in Figure 10. For the air load upon the cone it is assumed that the large cone forms a conical horn. The mechanical resistance of the suspension sys- tem is 3600 mechanical ohms. It will be seen that mechanical reactance due to the air chamber behind the cone is three times the mechanical reactance due to the suspension system. Therefore, in the range where the compliances are the controlling mechanical reactances the compli-
168 RCA REVIEW
ance due to the air chamber is the controlling compliance. This expedi- ent reduces the distortion due to a nonlinearity of the suspension system. The efficiency characteristic is shown in Figure 10. It will be seen that the efficiency falls off about 10,000 cycles. This is due to the fact that the system is mass controlled and the radiation resistance does not increase as the square of the frequency above 10,000 cycles. By introducing a compliance, C111, between the voice coil and cone the effective mass of the system is reduced and uniform efficiency is main- tained to 15,000 cycles as shown by the dotted efficiency characteristic of Figure 10.
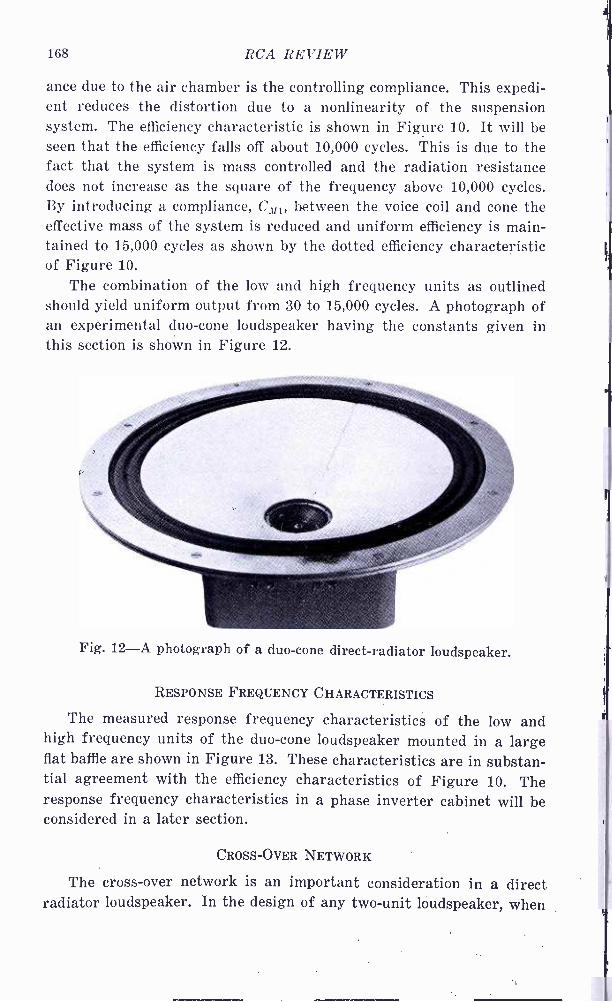
The combination of the low and high frequency units as outlined should yield uniform output from 30 to 15,000 cycles. A photograph of an experimental duo -cone loudspeaker having the constants given in this section is shown in Figure 12.
Fig. 12 -A photograph of a duo -cone direct -radiator loudspeaker.
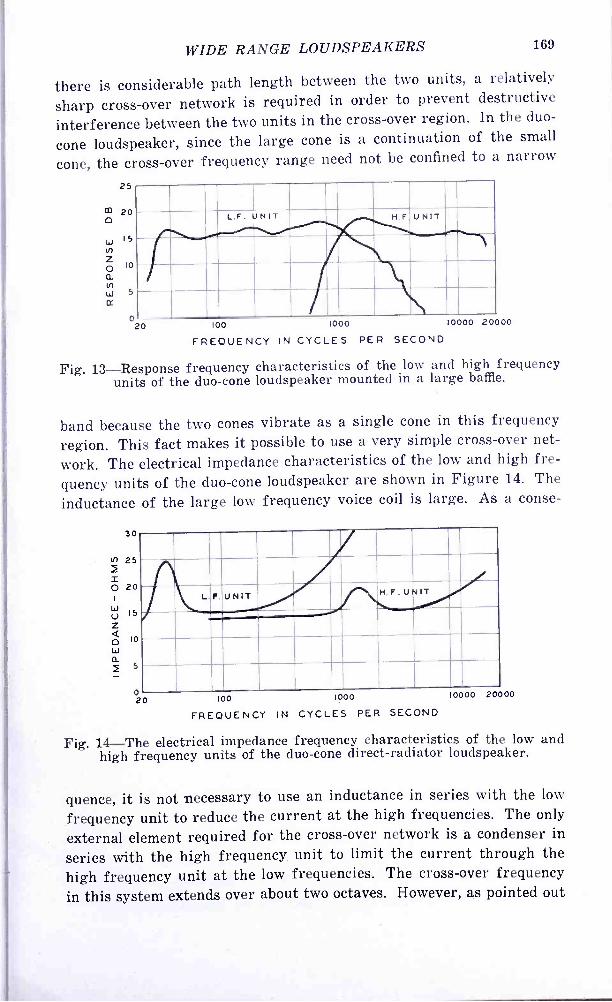
RESPONSE FREQUENCY CHARACTERISTICS
The measured response frequency characteristics of the low and high frequency units of the duo -cone loudspeaker mounted in a large flat baffle are shown in Figure 13. These characteristics are in substan- tial agreement with the efficiency characteristics of Figure 10. The response frequency characteristics in a phase inverter cabinet will be considered in a later section.
CROSS -OVER NETWORK
The cross -over network is an important consideration in a direct radiator loudspeaker. In the design of any two -unit loudspeaker, when
WIDE RANGE LOUDSPEAKERS 169
there is considerable path length between the two units, a relatively
sharp cross -over network is required in order to prevent destructive
interference between the two units in the cross -over region. In the duo -
cone loudspeaker, since the large cone is a continuation of the small
cone, the cross -over frequency range need not be confined to a narrow
25
CD 20 0
15
10
5
L.F. UNIT H.F UNIT
0 20 100 1000
FREQUENCY IN CYCLES PER SECOND
10000 20000
Fig. 13- Response frequency characteristics of the low and high frequency units of the duo -cone loudspeaker mounted in a large baffle.
band because the two cones vibrate as a single cone in this frequency
region. This fact makes it possible to use a very simple cross -over net-
work. The electrical impedance characteristics of the low and high fre-
quency units of the duo -cone loudspeaker are shown in Figure 14. The
inductance of the large low frequency voice coil is large. As a conse-
30
25
20
15
10
5
0 20
L. F. UNIT H.F.0 NIT
100 1000
FREQUENCY IN CYCLES PER SECOND
10000 20000
Fig. 14-The electrical impedance frequency characteristics of the low and high frequency units of the duo -cone direct -radiator loudspeaker.
quence, it is not necessary to use an inductance in series with the low
frequency unit to reduce the current at the high frequencies. The only
external element required for the cross -over network is a condenser in
series with the high frequency, unit to limit the current through the high frequency unit at the low frequencies. The cross -over frequency
in this system extends over about two octaves. However, as pointed out
170 RCA REVIEW
before this is not objectionable because in the overlap region the two cones vibrate as a single cone.
PHASE INVERTER WITH A VARIABLE PORT
The preceding considerations have been concerned with the per - fcrmance of the duo -cone loudspeaker operating in a large flat baffle. The large flat baffle is not a practical mounting arrangement for gen- eral applications. A cabinet is the conventional housing for direct radiator loudspeaker systems. It is the purpose of this section to con- sider a phase inverter type cabinet suitable for the duo -cone loud- speaker.
The term, phase inverter loudspeaker, is used to designate a system consisting of a loudspeaker mechanism mounted in a closed cabinet with an opening or port which augments the low frequency response by the addition of the sound radiated from the port. The reason that the addition of the port augments the low frequency response is because the particle velocity of the air in the port is in phase with the velocity of the cone.
The amount of low frequency accentuation required for a particu- lar condition of reproduction depends upon the program material, the room in which the sound is reproduced, etc. Therefore, it is desirable to provide a variable means for adjusting the low frequency response to a loudspeaker. It is the purpose of this section to describe a phase inverter type cabinet with a variable port.
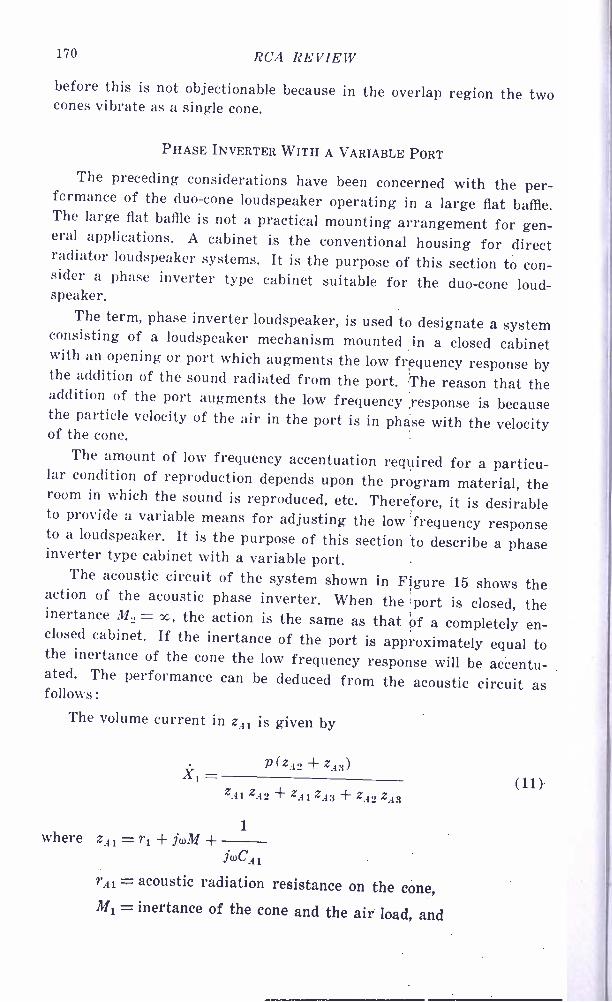
The acoustic circuit of the system shown in Figure 15 shows the action of the acoustic phase inverter. When the port is closed, the inertance M..) = co, the action is the same as that óf a completely en- closed cabinet. If the inertance of the port is approximately equal to the inertance of the cone the low frequency response will be accentu- ated. The performance can be deduced from the acoustic circuit as follows:
The volume current in zA1 is given by
where z41= r1 -{- jwM +
p (zA2 + zita)
zAl zA2 + zAl zA3 + zA2 zA3
1
jwCAI
rA1= acoustic radiation resistance on the cone, M1- inertance of the cone and the air load, and
WIDE RANGE LOUDSPEAKERS 171
CAl = acoustic capacitance of the cone,
1
ZA2 - 9 (0C.42
CA2 = acoustic capacitance of the cabinet volume,
ZA3 = r_42 + ja,M2
rA2 - acoustic radiation resistance of the cone,
FRONT VIEW
M 1 CAI r .:.
ACOUSTIC CIRCUIT
SECTION -A-A.. r4
Fig. 15 -Front and sectional views and the acoustic circuit of the acoustic phase inverter used with the duo -cone loudspeaker. In the acoustic circuit:
CAS and rAl, the inertance, acoustic capacitance and acoustic resistance of air load and cone and coil of the loudspeaker unit; Mf and rAI, the inertance and acoustic resistance of the port; CAI, the acoustic capacitance of the
cabinet volume.
M2 = inertance of the port,
p = AB l i = sound pressure which drives the acoustic system,
B = flux density in the air gap,
l = length of conductor in the air gap,
i = current in the voice coil, and
A = area of the cone.
172 RCA REVIEW
The volume current in zA3 is
X3 = p zA2
°A1 zA2 + ZA1 ZA3 + zA2 zA3
The total power radiated is given by real part of
(12)
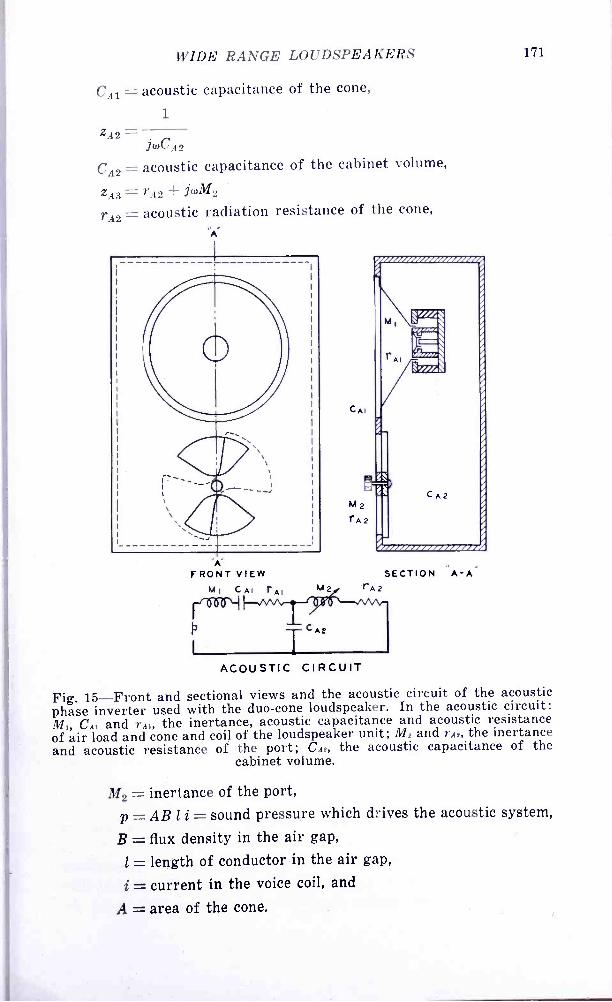
Fig. 16- Photograph of the due -cone direct -radiator loudspeaker mounted in a phase inverter cabinet with the variable port with the grill removed.
P= rA1X12 +rA2X32 (13) Equation (13) shows the effect of the port in altering the response
in the low frequency range. A photograph of the duo -cone loudspeaker mounted in a phase
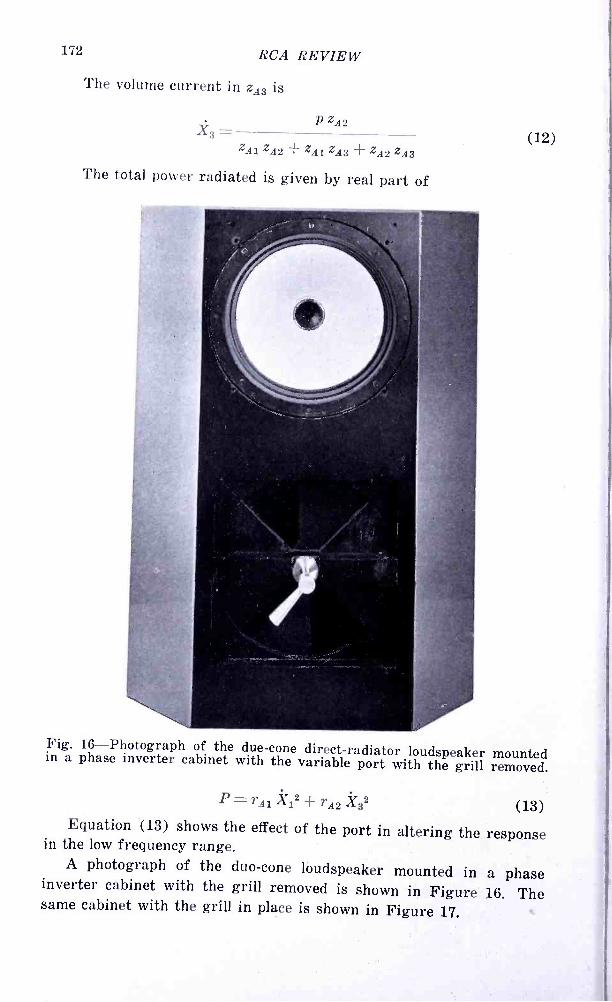
inverter cabinet with the grill removed is shown in Figure 16. The same cabinet with the grill in place is shown in Figure 17.
WIDE RANGE LOUDSPEAKERS 173
The measured response frequency characteristics of the duo -cone
loudspeaker operating in a phase inverter cabinet is shown in Figure
18. These characteristics show the effect of the port opening upon the
response and also show that the response is uniform in the overlap
region.
Fig. 17- Photograph of the complete duo -cone loudspeaker.
DIRECTIONAL CHARACTERISTICS
The directional characteristics of a loudspeaker used for monitoring
and high quality sound reproduction should be substantially indepen-
dent of the frequency over at least a total of 90 °. The directional char-
acteristics of a cone loudspeaker are a function of the frequency. At
the low frequencies where the dimensions are small compared to the wavelength the system is nondirectional. When the dimension of the
174 RCA REVIEW 25
m 20
W 15
Z O io a w W 5 CC
0 20 i00 1000 10000 20000
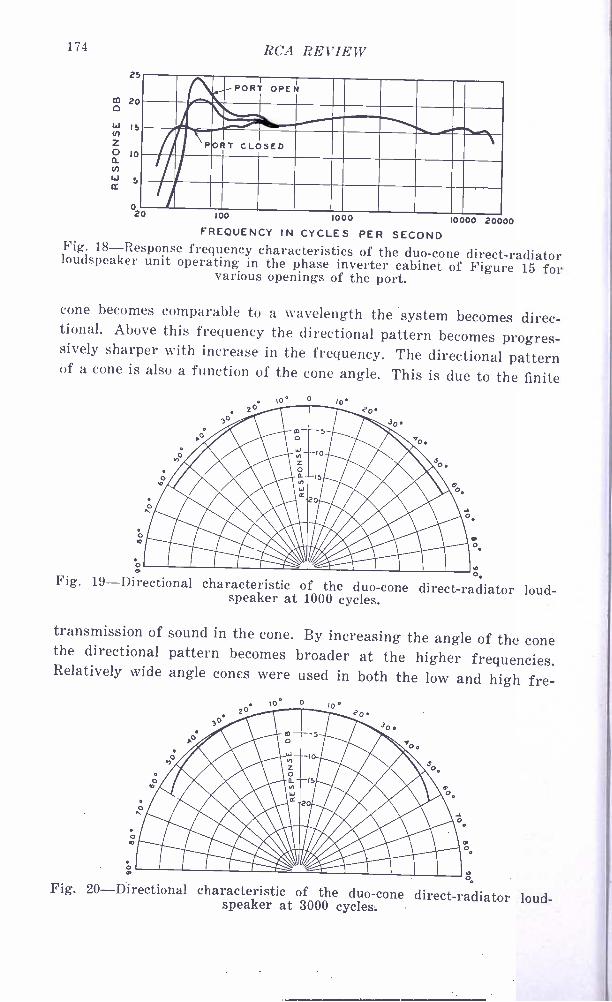
FREQUENCY IN CYCLES PER SECOND Fig. 18- Response frequency characteristics of the duo-cone direct -radiator loudspeaker unit operating in the phase inverter cabinet of Figure 15 for various openings of the port.
cone becomes comparable to a wavelength the system becomes direc- tional. Above this frequency the directional pattern becomes progres- sively sharper with increase in the frequency. The directional pattern of a cone is also a function of the cone angle. This is due to the finite
. 10° 0 /0 20 ?
41IIt `300
Y
@ o.
ti . Fig. 19-Directional characteristic of the duo-cone direct-radiator loud- speaker at 1000 cycles.
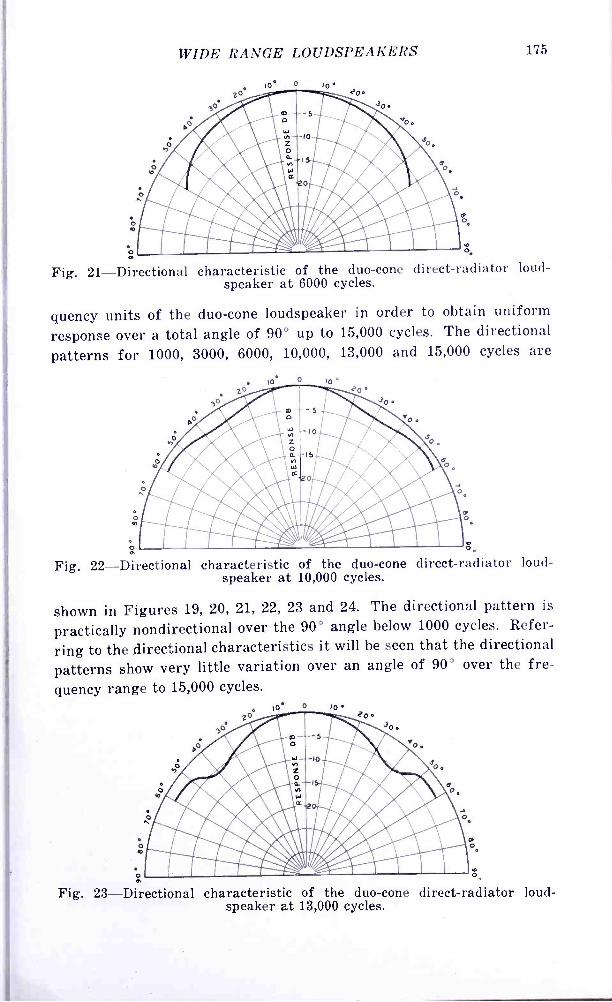
transmission of sound in the cone. By increasing the angle of the cone the directional pattern becomes broader at the higher frequencies. Relatively wide angle cones were used in both the low and high fre-
Fig. 20- Directional characteristic of the duo -cone direct- radiator loud- speaker at 3000 cycles.
WIDE RANGE LOUDSPEAKERS 175
e
Fig. 21- Directional characteristic of the duo -cone direct -radiator loud- speaker at 6000 cycles.
quency units of the duo -cone loudspeaker in order to obtain uniform
response over a total angle of 90° up to 15,000 cycles. The directional
patterns for 1000, 3000, 6000, 10,000, 13,000 and 15,000 cycles are
o e
a
Fig. 22- Directional characteristic of the duo -cone direct -radiator loud- speaker at 10,000 cycles.
shown in Figures 19, 20, 21, 22, 23 and 24. The directional pattern is
practically nondirectional over the 90° angle below 1000 cycles. Refer-
ring to the directional characteristics it will be seen that the directional
patterns show very little variation over an angle of 90° over the fre-
quency range to 15,000 cycles.
o 0
10
Fig. 23- Directional characteristic of the duo -cone direct -radiator loud- speaker at 13,000 cycles.
176 RCA REVIEW
NONLINEAR DISTORTION
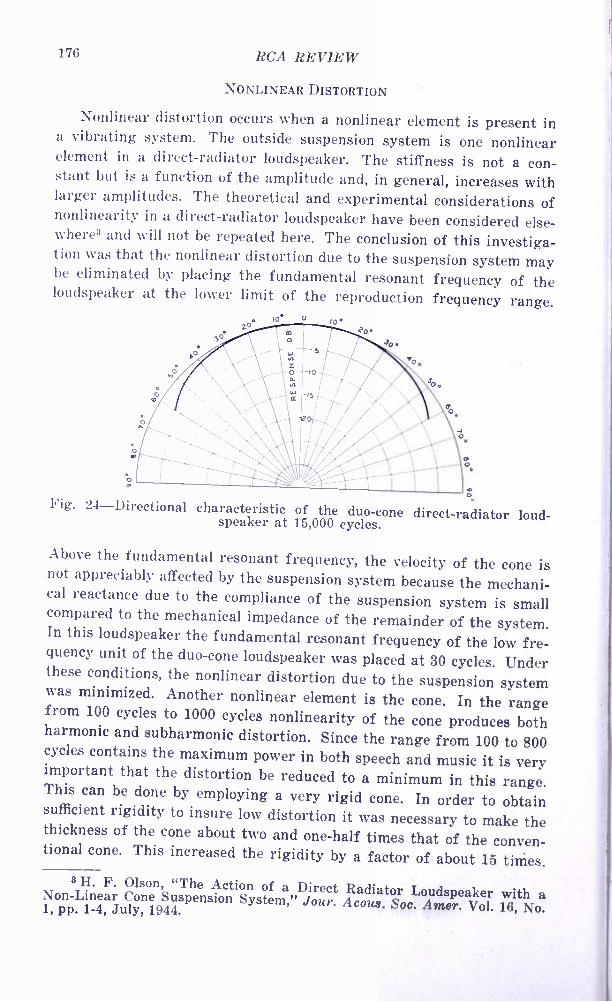
Nonlinear distortion occurs when a nonlinear element is present in a vibrating system. The outside suspension system is one nonlinear element in a direct -radiator loudspeaker. The stiffness is not a con- stant but is a function of the amplitude and, in general, increases with larger amplitudes. The theoretical and experimental considerations of nonlinearity in a direct -radiator loudspeaker have been considered else - where3 and will not be repeated here. The conclusion of this investiga- tion was that the nonlinear distortion due to the suspension system may be eliminated by placing the fundamental resonant frequency of the loudspeaker at the lower limit of the reproduction frequency range.
w o
z0.
Fig. 24- Directional characteristic of the duo -cone direct -radiator loud- speaker at 15,000 cycles.
Above the fundamental resonant frequency, the velocity of the cone is not appreciably affected by the suspension system because the mechani- cal reactance due to the compliance of the suspension system is small compared to the mechanical impedance of the remainder of the system. In this loudspeaker the fundamental resonant frequency of the low fre- quency unit of the duo -cone loudspeaker was placed at 30 cycles. Under these conditions, the nonlinear distortion due to the suspension system was minimized. Another nonlinear element is the cone. In the range from 100 cycles to 1000 cycles nonlinearity of the cone produces both harmonic and subharmonic distortion. Since the range from 100 to 800 cycles contains the maximum power in both speech and music it is very important that the distortion be reduced to a minimum in this range. This can be done by employing a very rigid cone. In order to obtain sufficient rigidity to insure low distortion it was necessary to make the thickness of the cone about two and one -half times that of the conven- tional cone. This increased the rigidity by a factor of about 15 times.
s H. F. Olson, "The Action of a Direct Radiator Loudspeaker with a Non -Linear Cone Suspension System," Jour. Acous. Soc. Amer. Vol. 16, No. 1, pp. 1 -4, July, 1944.
WIDE RANGE LOUDSPEAKERS 177
Inhomogeneity of the flux density through which the voice coil
moves is another source of distortion. This type of distortion can be
eliminated by making the summation of the product of each turn and the flux density associated with that turn independent of the amplitude. This requirement was satisfied by making the voice coil large and slightly longer than the air gap. In order to obtain reasonable efficiency
with the heavy cone it is necessary to employ a heavy voice coil. A
voice coil of 25 grams was used in this loudspeaker which is about 25
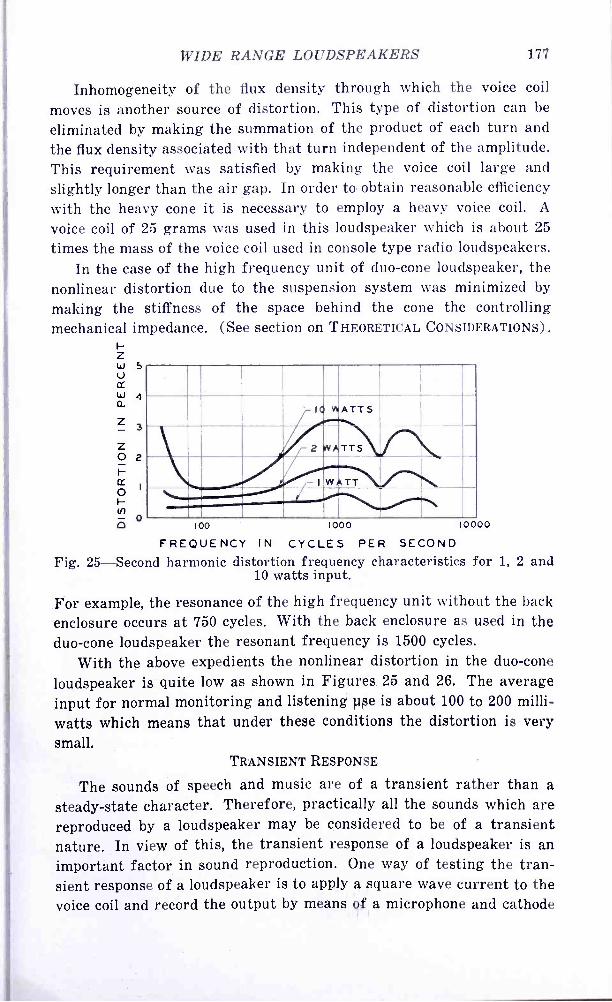
times the mass of the voice coil used in console type radio loudspeakers. In the case of the high frequency unit of duo -cone loudspeaker, the
nonlinear distortion due to the suspension system was minimized by
making the stiffness of the space behind the cone the controlling mechanical impedance. (See section on THEORETICAL CONSIDERATIONS).
5
4
2
o
I ATTS
iiCivrIBM VI /i . - 100 1000 10000
FREQUENCY IN CYCLES PER SECOND
Fig. 25- Second harmonic distortion frequency characteristics for 1, 2 and 10 watts input.
For example, the resonance of the high frequency unit without the back enclosure occurs at 750 cycles. With the back enclosure as used in the duo -cone loudspeaker the resonant frequency is 1500 cycles.
With the above expedients the nonlinear distortion in the duo -cone
loudspeaker is quite low as shown in Figures 25 and 26. The average input for normal monitoring and listening use is about 100 to 200 milli -
watts which means that under these conditions the distortion is very small.
TRANSIENT RESPONSE
The sounds of speech and music are of a transient rather than a steady -state character. Therefore, practically all the sounds which are reproduced by a loudspeaker may be considered to be of a transient nature. In view of this, the transient response of a loudspeaker is an important factor in sound reproduction. One way of testing the tran- sient response of a loudspeaker is to apply a square wave current to the voice coil and record the output by means of a microphone and cathode
178 RCA REVIEW
ray oscillograph. For a test of this type it is very important that the microphone be capable of reproducing square waves. The velocity microphone is a mass controlled system in the frequency range above 15 cycles. Since the driving force is proportional to the frequency, the system can be replaced by a constant driving force and a resistance
5
4
3
2
0
ICI WATTS
2 W TTS I WATT
100 1000 10000 FREQUENCY IN CYCLES PER SECOND
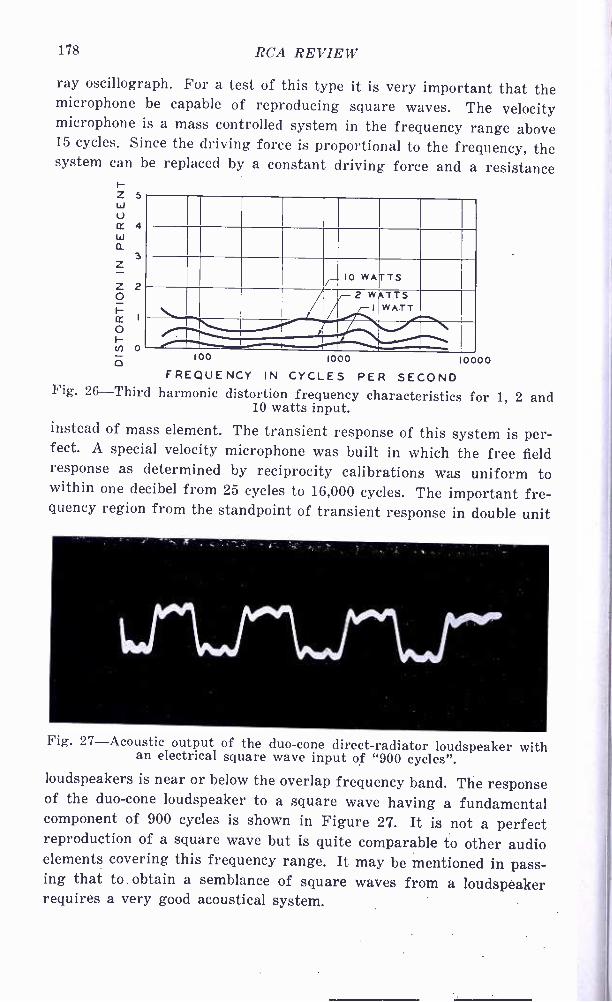
Fig. 26 -Third harmonic distortion frequency characteristics for 1, 2 and 10 watts input.
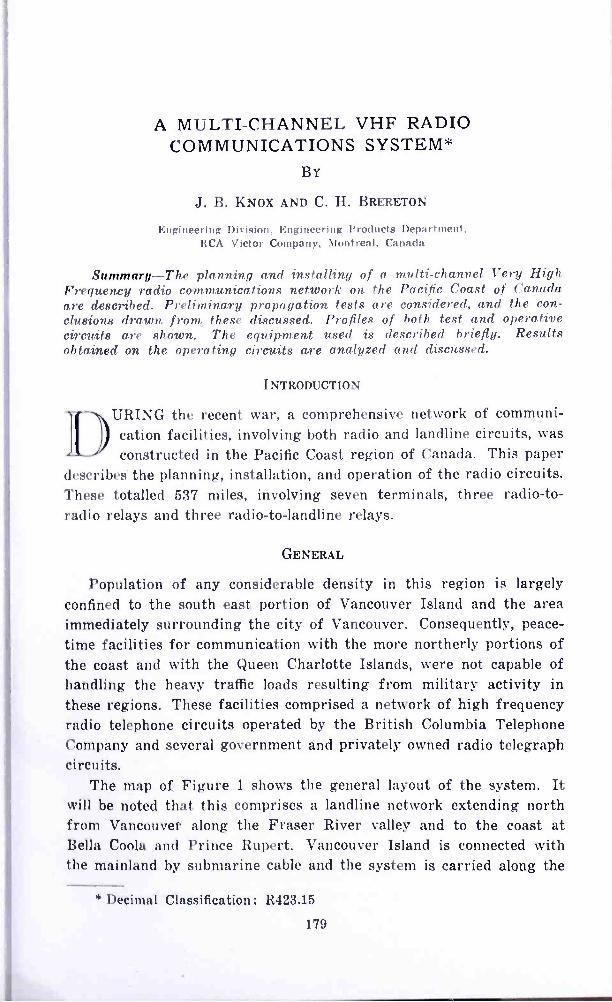
instead of mass element. The transient response of this system is per- fect. A special velocity microphone was built in which the free field response as determined by reciprocity calibrations was uniform to within one decibel from 25 cycles to 16,000 cycles. The important fre- quency region from the standpoint of transient response in double unit
Fig. 27- Acoustic output of the duo -cone direct -radiator loudspeaker with an electrical square wave input of "900 cycles ". loudspeakers is near or below the overlap frequency band. The response of the duo -cone loudspeaker to a square wave having a fundamental component of 900 cycles is shown in Figure 27. It is not a perfect reproduction of a square wave but is quite comparable to other audio elements covering this frequency range. It may be mentioned in pass- ing that to obtain a semblance of square waves from a loudspeaker requires a very good acoustical system.
A MULTI -CHANNEL VHF RADIO COMMUNICATIONS SYSTEM*
BY
J. B. KNOX AND C. H. BRERETON
Engineering Division, Engineering Products Department, RCA Victor Company, Montreal, Canada
Summary -The planning and installing of a multi -channel Very High Frequency radio communications network on the Pacific Coast of Canada are described. Preliminary propagation tests are considered, and the con- clusions drawn from these discussed. Profiles of both test and operative circuits are shown. The equipment used is described briefly. Results obtained on the operating circuits are analyzed and discussed.
INTRODUCTION
DURING the recent war, a comprehensive network of communi- cation facilities, involving both radio and landline circuits, was constructed in the Pacific Coast region of Canada. This paper
describes the planning, installation, and operation of the radio circuits. These totalled 537 miles, involving seven terminals, three radio -to- radio relays and three radio -to- landline relays.
GENERAL
Population of any considerable density in this region is largely confined to the south east portion of Vancouver Island and the area immediately surrounding the city of Vancouver. Consequently, peace- time facilities for communication with the more northerly portions of the coast and with the Queen Charlotte Islands, were not capable of handling the heavy traffic loads resulting from military activity in these regions. These facilities comprised a network of high frequency radio telephone circuits operated by the British Columbia Telephone Company and several government and privately owned radio telegraph circuits.
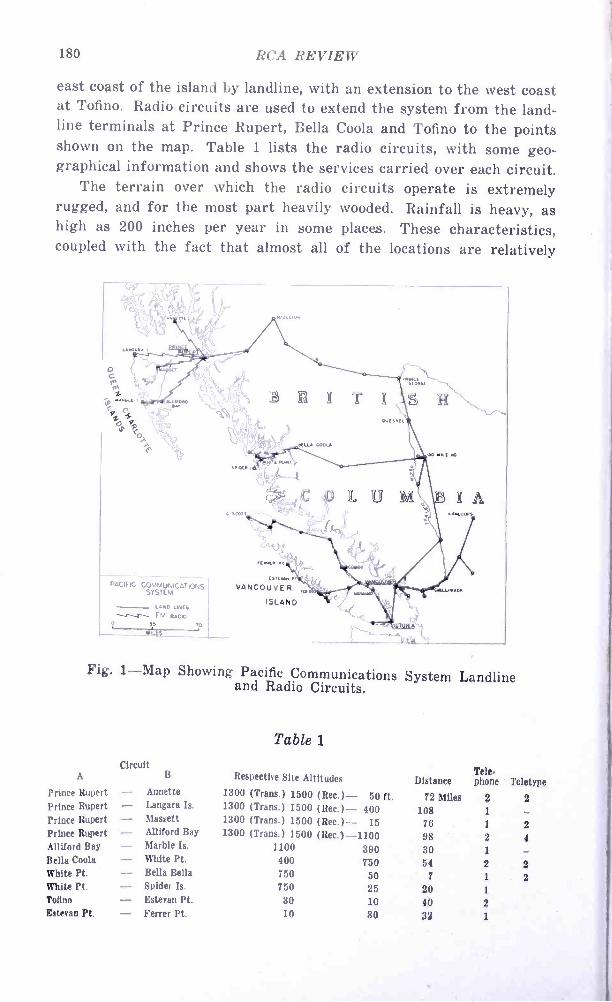
The map of Figure 1 shows the general layout of the system. It will be noted that this comprises a landline network extending north from Vancouver along the Fraser River valley and to the coast at Bella Coola and Prince Rupert. Vancouver Island is connected with the mainland by submarine cable and the system is carried along the
* Decimal Classification: R423.15
179
180 RCA REVIEW
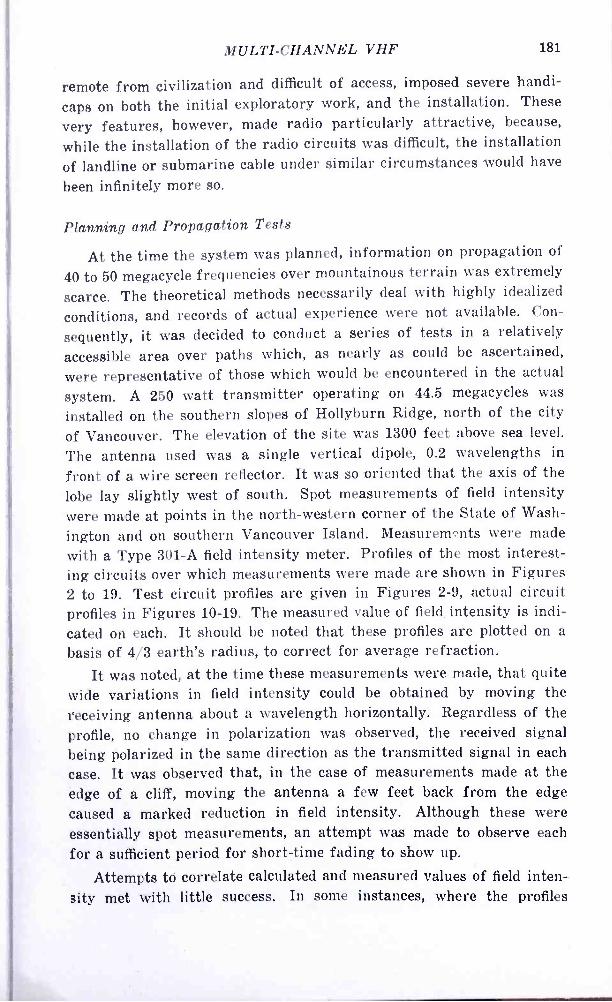
east coast of the island by landline, with an extension to the west coast at Tofino. Radio circuits are used to extend the system from the land - line terminals at Prince Rupert, Bella Coola and Tofino to the points shown on the map. Table 1 lists the radio circuits, with some geo- graphical information and shows the services carried over each circuit.
The terrain over which the radio circuits operate is extremely rugged, and for the most part heavily wooded. Rainfall is heavy, as high as 200 inches per year in some places. These characteristics, coupled with the fact that almost all of the locations are relatively
410,-),P " .ASEL.o.
MiN4[ DL.A.
KU, GAOL
II$
ISO Mill NO
PONT ShU[.
C. SCOTT
PACIFIC COMMUNICATIONS SYSTEM
LAND LINES
F M RADIO O ,5
Srs
L U M \B X A Wl ..N,0,
[STEW.
VANCOUVER
ISLAND
_ 1,V.r
Fig. 1 -Map Showing Pacific Communications System Landline and Radio Circuits.
Circuit A B
Prince Rupert - Annette
Prince Rupert - Langara Is.
Prince Rupert - Massett
Prince Rupert - Alliford Bay
Alliford Bay - Marble Is.
Bella Coola - White Pt. White Pt. - Bella Bella
White Pt. - Spider Is.
Toino - Estevan Pt. Estevan Pt. - Ferrer Pt.
Table 1
Respective Site Altitudes Distance Tele- phone Teletype
1300 (Trans.) 1500 (Bec.)- 50 ft. 72 Miles 2 2 1300 (Trans.) 1500 (Rec.)- 400 108 1 - 1300 (Trans.) 1500 (Bec.)- 15 76 1 2 1300 (Trans.) 1500 (Rec.) -1100 98 2 4
1100 390 30 1 - 400 750 54 2 2 750 50 7 1 2 750 25 20 1
30 10 40 2 10 80 33 1
MULTI- CHANNEL VHF 181
remote from civilization and difficult of access, imposed severe handi-
caps on both the initial exploratory work, and the installation. These
very features, however, made radio particularly attractive, because,
while the installation of the radio circuits was difficult, the installation
of landline or submarine cable under similar circumstances would have
been infinitely more so.
Planning and Propagation Tests
At the time the system was planned, information on propagation of
40 to 50 megacycle frequencies over mountainous terrain was extremely
scarce. The theoretical methods necessarily deal with highly idealized
conditions, and records of actual experience were not available. Con-
sequently, it was decided to conduct a series of tests in a relatively
accessible area over paths which, as nearly as could be ascertained,
were representative of those which would be encountered in the actual
system. A 250 watt transmitter operating on 44.5 megacycles was
installed on the southern slopes of Hollyburn Ridge, north of the city
of Vancouver. The elevation of the site was 1300 feet above sea level.
The antenna used was a single vertical dipole, 0.2 wavelengths in
front of a wire screen reflector. It was so oriented that the axis of the
lobe lay slightly west of south. Spot measurements of field intensity were made at points in the north -western corner of the State of Wash-
ington and on southern Vancouver Island. Measurements were made
with a Type 301 -A field intensity meter. Profiles of the most interest- ing circuits over which measurements were made are shown in Figures 2 to 19. Test circuit profiles are given in Figures 2 -9, actual circuit profiles in Figures 10 -19. The measured value of field intensity is indi- cated on each. It should be noted that these profiles are plotted on a
basis of 4/3 earth's radius, to correct for average refraction.
It was noted, at the time these measurements were made, that quite wide variations in field intensity could be obtained by moving the receiving antenna about a wavelength horizontally. Regardless of the profile, no change in polarization was observed, the received signal being polarized in the same direction as the transmitted signal in each case. It was observed that, in the case of measurements made at the edge of a cliff, moving the antenna a few feet back from the edge caused a marked reduction in field intensity. Although these were essentially spot measurements, an attempt was made to observe each for a sufficient period for short -time fading to show up.
Attempts to correlate calculated and measured values of field inten- sity met with little success. In some instances, where the profiles

182 RCA REVIEW
10 15 20 25 30 35 40 45 50 55 60 MILES
too
ti soo 4i
o
Fig. 2 -Test Profile, Vancouver -Cadboro Point (4/3 Earth's Radius). Measured Field Intensity -100 Microvolts per Meter.
0 5 10 20 25 30 35 40 MILES
Fig. 3 -Test Profile, Vancouver -Mount Douglass (4/3 Earth's Radius). Measured Field Intensity -500 Microvolts per Meter.
5 10 15 20 25 30 35 MILES
Fig. 4 -Test Profile, Vancouver- Ladysmith (4/3 Earth's Radius). Measured Field Intensity -100 Microvolts per Meter.
0 5 10 15 20 25 30 35 40 45 MILES
1500
/0p0 F-
Fig. 5 -Test Profile, Vancouver-- Nanoose (4/3 Earth's Radius), Measured Field Intensity -3 to 4 Microvolts per Meter,
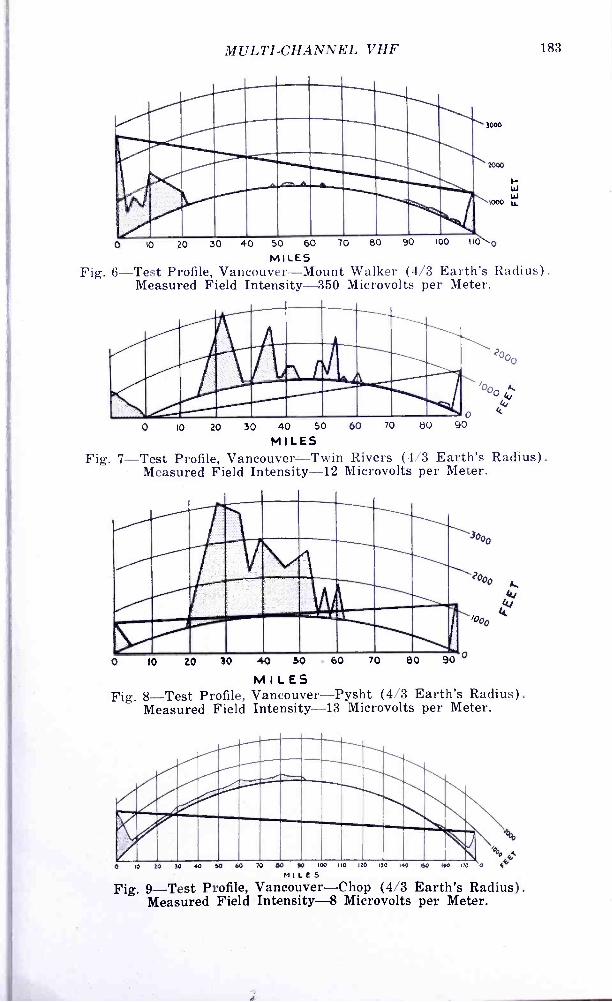
MULTI- CHANNEL VHF 183
3000
20 30 40 50 60 70 80 90 100 110
MILES Fig. 6 -Test Profile, Vancouver -Mount Walker (4/3 Earth's Radius).
Measured Field Intensity -350 Microvolts per Meter.
w 4J
1000 LL
10 20 30 40 50
MILES Fig. 7 -Test Profile, Vancouver -Twin Rivers (4/3 Earth's Radius).
Measured Field Intensity -12 Microvolts per Meter.
70 80 90
0 IO 20 30 40 SO 60
MILES Fig. 8 -Test Profile, Vancouver -Pysht (4/3 Earth's Radius).
Measured Field Intensity -13 Microvolts per Meter.
70 80 o
10 20 30 40 So 60 70 00 90 100 I0 i20 130 1 0 i50 i00 170 0 4+'
MILES Fig. 9 -Test Profile, Vancouver -Chop (4/3 Earth's Radius).
Measured Field Intensity --8 Microvolts per Meter.

184 RCA REVIEW
10 15 20 25 30 35 40
MILES
/300
2000
v, 5p0 4
45 50 55 60 65 70 0
Fig. 10- Profile (4/3 Earth's Radius) of Prince Rupert- Annette Circuit.
0 15 20 25 30 35 40 45 50 55
MILES 60 65
Fig. 11- Profile (4/3 Earth's Radius) of Prince Rupert -Massett Circuit.
// 1\, // uitrn 0 5 10 15 20 25 30 35 40 45 50 55 00 65 70 75 00 85 90 95
MILES
00 4.;
100 105 0 4
Fig. 12- Profile (4/3 Earth's Radius) of Prince Rupert - Langara Island Circuit.
o 5 10 15 20 25 30 35 40 45 50 55 60 65
MILES 70 75 80 85 90 95 0
Fig. 13- Profile (4/3 Earth's Radius) of Prince Rupert - Alliford Bay Circuit.
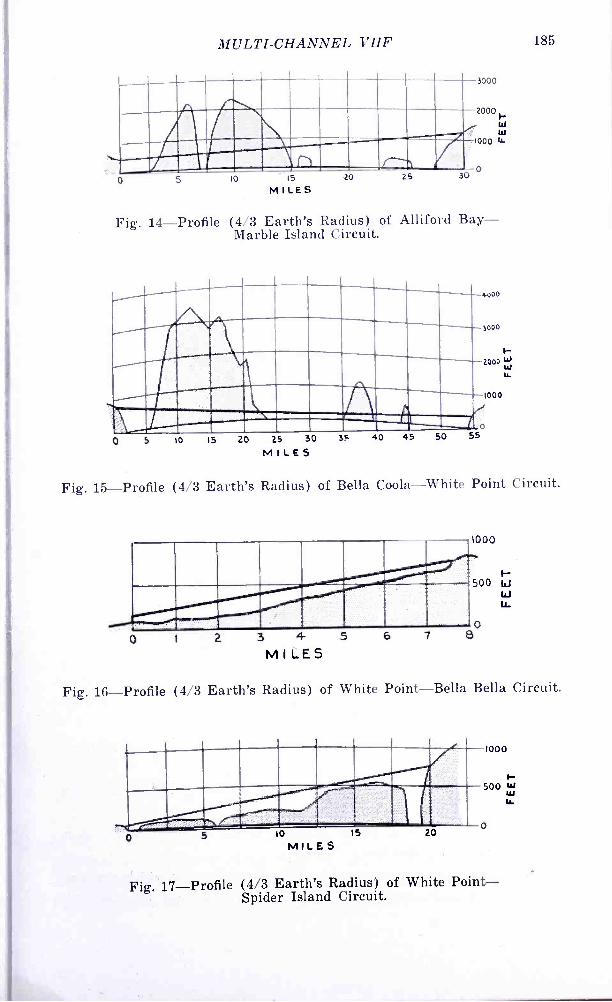
MULTI -CHANNEL VHF 185
F-3000
10 15 20 25
MILES
Fig. 14- Profile (4/3 Earth's Radius) of Alliford Bay - Marble Island Circuit.
IO 15 20 25 30 MILES
3ç 40 45 50 55
Fig. 15- Profile (4/3 Earth's Radius) of Bella Coola -White Point Circuit.
2 3 4- 5
MILES
1000
500 W W
0 6
Fig. 16- Profile (4/3 Earth's Radius) of White Point -Bella Bella Circuit.
1000
500 W
Fig.'1.7- Profile (4/3 Earth's Radius) of White Point - Spider Island Circuit.
W
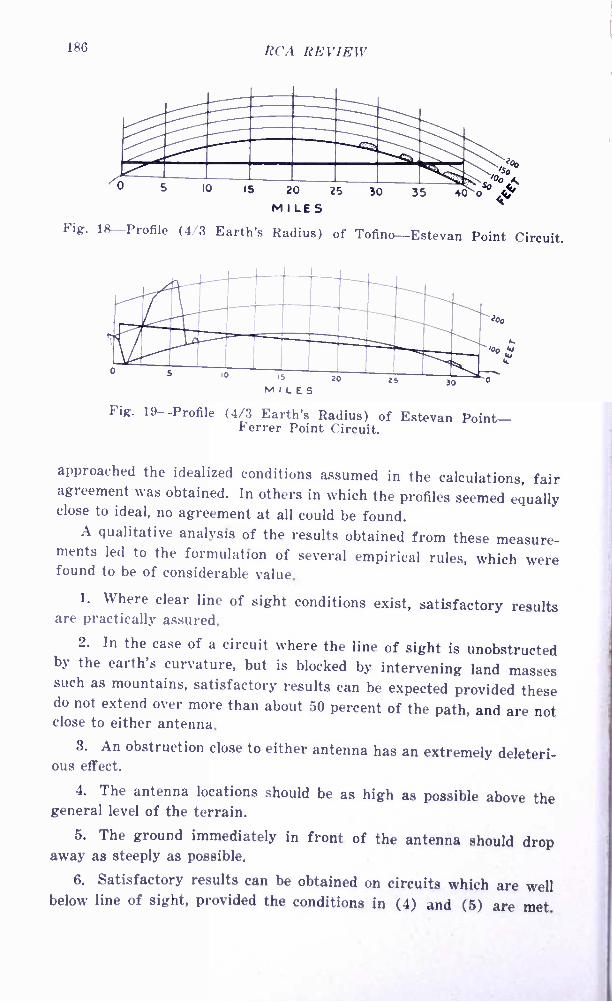
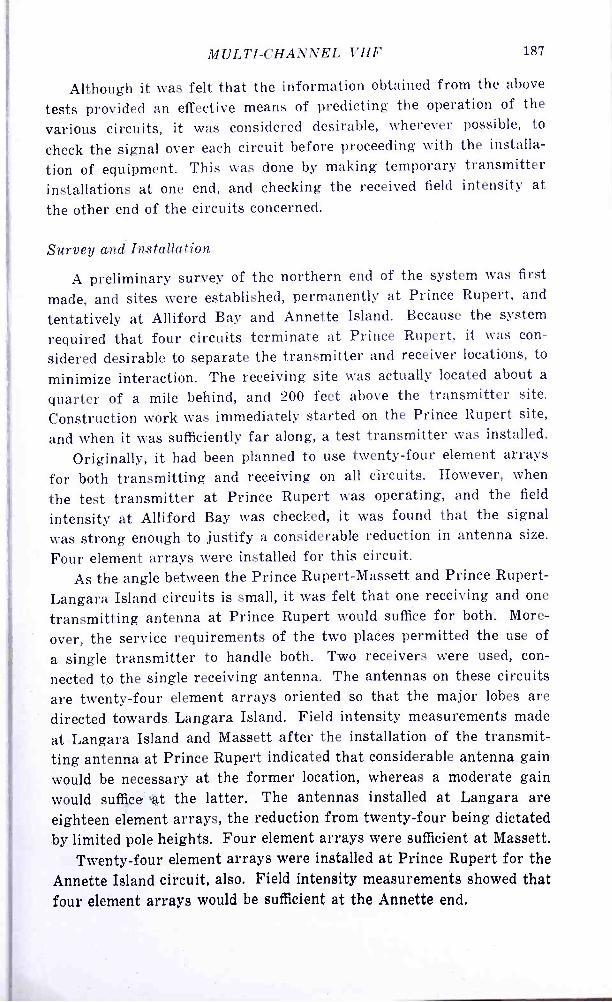
186 RCA REVIEW
5 IO 15 20 25
MILES Fig. 18- Profile (4/3 Earth's Radius) of Tofino -Estevan Point Circuit.
so i°o
30 35 40 o ,
Fig. 19- Profile (4/3 Earth's Radius) of Estevan Point - Ferrer Point Circuit.
approached the idealized conditions assumed in the calculations, fair agreement was obtained. In others in which the profiles seemed equally close to ideal, no agreement at all could be found.
A qualitative analysis of the results obtained from these measure- ments led to the formulation of several empirical rules, which were found to be of considerable value.
1. Where clear line of sight conditions exist, satisfactory results are practically assured.
2. In the case of a circuit where the line of sight is unobstructed by the earth's curvature, but is blocked by intervening land masses such as mountains, satisfactory results can be expected provided these do not extend over more than about 50 percent of the path, and are not close to either antenna.
3. An obstruction close to either antenna has an extremely deleteri- ous effect.
4. The antenna locations should be as high as possible above the general level of the terrain.
5. The ground immediately in front of the antenna should drop away as steeply as possible.
6. Satisfactory results can be obtained on circuits which are well below line of sight, provided the conditions in (4) and (5) are met.
MULTI- CHANNEL VHF 187
Although it was felt that the information obtained from the above
tests provided an effective means of predicting the operation of the
various circuits, it was considered desirable, wherever possible, to
check the signal over each circuit before proceeding with the installa-
tion of equipment. This was done by making temporary transmitter installations at one end, and checking the received field intensity at
the other end of the circuits concerned.
Survey and Installation
A preliminary survey of the northern end of the system was first
made, and sites were established, permanently at Prince Rupert, and
tentatively at Alliford Bay and Annette Island. Because the system
required that four circuits terminate at Prince Rupert, it was con-
sidered desirable to separate the transmitter and receiver locations, to
minimize interaction. The receiving site was actually located about a
quarter of a mile behind, and 200 feet above the transmitter site.
Construction work was immediately started on the Prince Rupert site,
and when it was sufficiently far along, a test transmitter was installed.
Originally, it had been planned to use twenty -four element arrays
for both transmitting and receiving on all circuits. However, when
the test transmitter at Prince Rupert was operating, and the field
intensity at Alliford Bay was checked, it was found that the signal
was strong enough to justify a considerable reduction in antenna size.
Four element arrays were installed for this circuit. As the angle between the Prince Rupert -Massett and Prince Rupert -
Langara Island circuits is small, it was felt that one receiving and one
transmitting antenna at Prince Rupert would suffice for both. More-
over, the service requirements of the two places permitted the use of
a single transmitter to handle both. Two receivers were used, con-
nected to the single receiving antenna. The antennas on these circuits are twenty -four element arrays oriented so that the major lobes are directed towards Langara Island. Field intensity measurements made
at Langara Island and Massett after the installation of the transmit- ting antenna at Prince Rupert indicated that considerable antenna gain would be necessary at the former location, whereas a moderate gain would suffice at the latter. The antennas installed at Langara are eighteen element arrays, the reduction from twenty -four being dictated by limited pole heights. Four element arrays were sufficient at Massett.
Twenty -four element arrays were installed at Prince Rupert for the Annette Island circuit, also. Field intensity measurements showed that four element arrays would be sufficient at the Annette end.
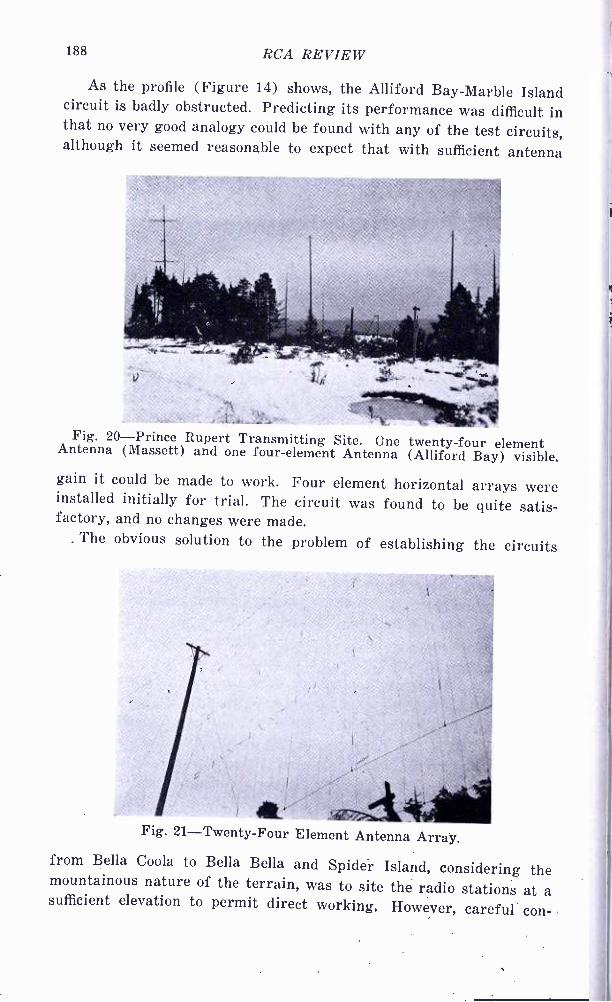
188 RCA REVIEW
As the profile (Figure 14) shows, the Alliford Bay -Marble Island circuit is badly obstructed. Predicting its performance was difficult in that no very good analogy could be found with any of the test circuits, although it seemed reasonable to expect that with sufficient antenna
Fig. 20- Prince Rupert Transmitting Site. One twenty -four element Antenna (Massett) and one four -element Antenna (Alliford Bay) visible.
gain it could be made to work. Four element horizontal arrays were installed initially for trial. The circuit was found to be quite satis- factory, and no changes were made.
. The obvious solution to the problem of establishing the circuits
Fig. 21- Twenty -Four Element Antenna Array.
from Bella Coola to Bella Bella and Spider Island, considering the mountainous nature of the terrain, was to site the radio stations at a sufficient elevation to permit direct working. However, careful con-
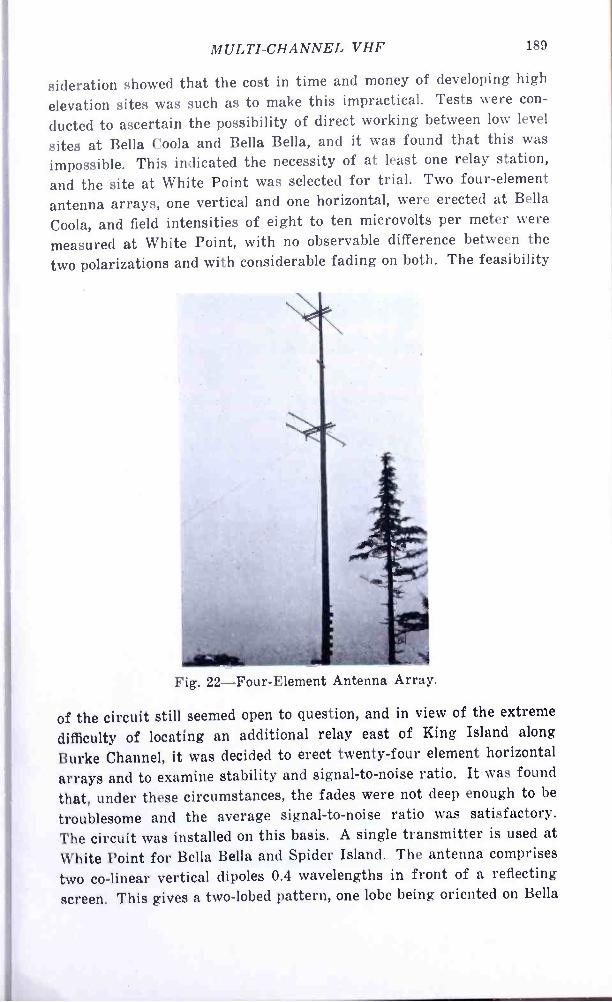
MULTI- CHANNEL VHF 189
sideration showed that the cost in time and money of developing high
elevation sites was such as to make this impractical. Tests were con-
ducted to ascertain the possibility of direct working between low level
sites at Bella Coola and Bella Bella, and it was found that this was
impossible. This indicated the necessity of at least one relay station,
and the site at White Point was selected for trial. Two four -element
antenna arrays, one vertical and one horizontal, were erected at Bella
Coola, and field intensities of eight to ten microvolts per meter were
measured at White Point, with no observable difference between the
two polarizations and with considerable fading on both. The feasibility
Fig. 22- Four -Element Antenna Array.
of the circuit still seemed open to question, and in view of the extreme
difficulty of locating an additional relay east of King Island along
Burke Channel, it was decided to erect twenty -four element horizontal
arrays and to examine stability and signal -to -noise ratio. It was found
that, under these circumstances, the fades were not deep enough to be
troublesome and the average signal -to -noise ratio was satisfactory.
The circuit was installed on this basis. A single transmitter is used at
White Point for Bella Bella and Spider Island. The antenna comprises
two co- linear vertical dipoles 0.4 wavelengths in front of a reflecting
screen. This gives a two -lobed pattern, one lobe being oriented on Bella
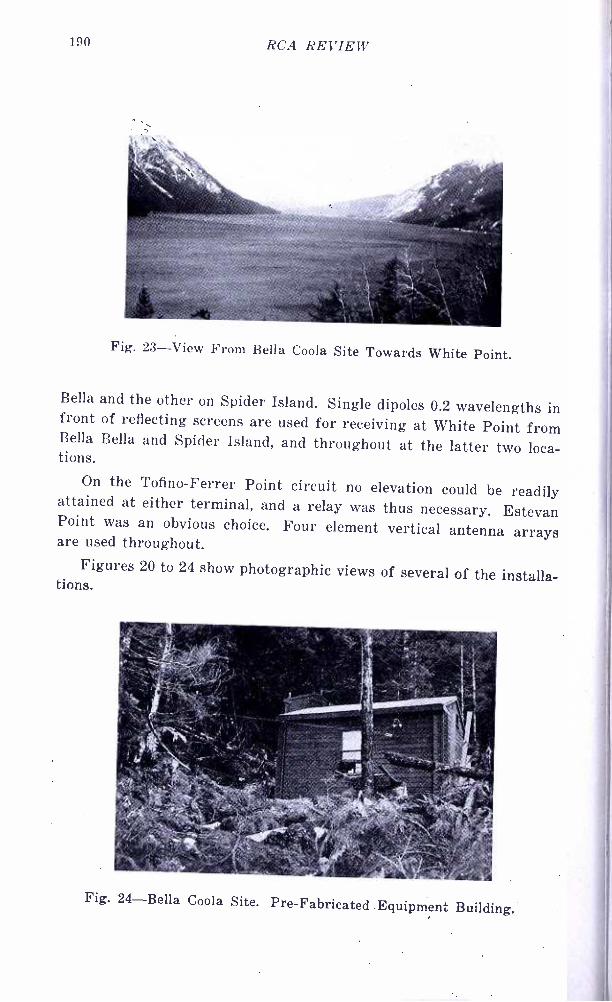
190 RCA REVIEW
Fig. 23 -View From Bella Coola Site Towards White Point.
Bella and the other on Spider Island. Single dipoles 0.2 wavelengths in front of reflecting screens are used for receiving at White Point from Bella Bella and Spider Island, and throughout at the latter two loca- tions.
On the attained at Point was are used th
Figures Hons.
Tofino- Ferrer Point circuit no elevation could be readily either terminal, and a relay was thus necessary. Estevan an obvious choice. Four element vertical antenna arrays roughout.
20 to 24 show photographic views of several of the installa-
Fig. 24 -Bella Coola Site.
. ! rtr.a..reammezsa,>
Pre -Fabricated Equipment Building.
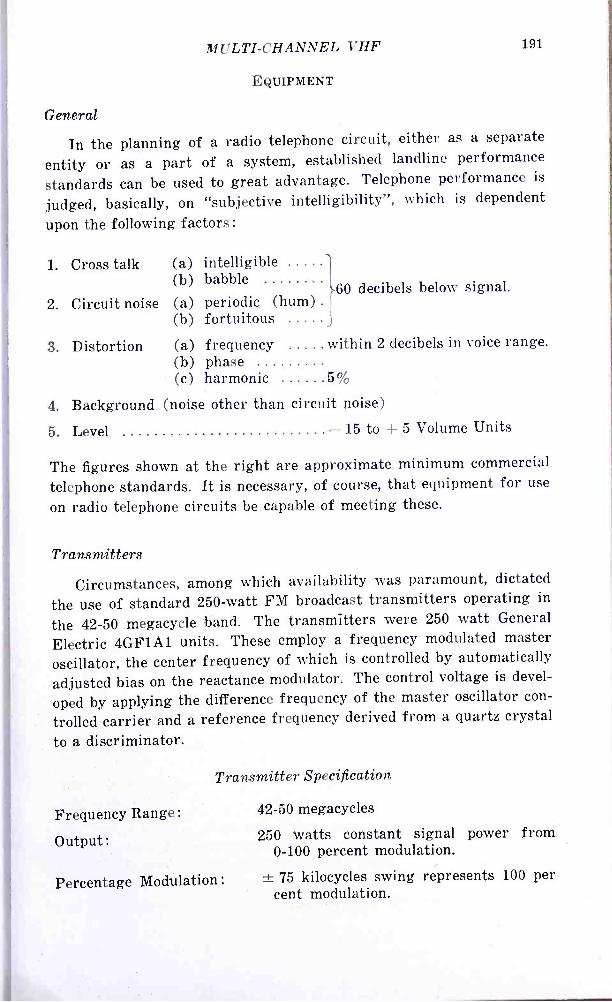
MULTI -CHANNEL VHF 191
EQUIPMENT
General
In the planning of a radio telephone circuit, either as a separate
entity or as a part of a system, established landline performance
standards can be used to great advantage. Telephone performance is
judged, basically, on "subjective intelligibility ", which is dependent
upon the following factors:
1. Cross talk (a) intelligible (b) babble
60 decibels below signal. 2. Circuit noise (a)
(b) periodic (hum) fortuitous
3. Distortion (a) (b)
frequency within 2 decibels in voice range. phase
(c) harmonic 5%
4. Background (noise other than circuit noise)
5. Level - 15 to + 5 Volume Units
The figures shown at the right are approximate minimum commercial
telephone standards. It is necessary, of course, that equipment for use
on radio telephone circuits be capable of meeting these.
Transmitters
Circumstances, among which availability was paramount, dictated
the use of standard 250 -watt FM broadcast transmitters operating in
the 42 -50 megacycle band. The transmitters were 250 watt General
Electric 4GF1A1 units. These employ a frequency modulated master
oscillator, the center frequency of which is controlled by automatically
adjusted bias on the reactance modulator. The control voltage is devel-
oped by applying the difference frequency of the master oscillator con-
trolled carrier and a reference frequency derived from a quartz crystal
to a discriminator.
Transmitter Specification
Frequency Range:
Output :
Percentage Modulation:
42 -50 megacycles
250 watts constant signal power from 0 -100 percent modulation.
± 75 kilocycles swing represents 100 per cent modulation.
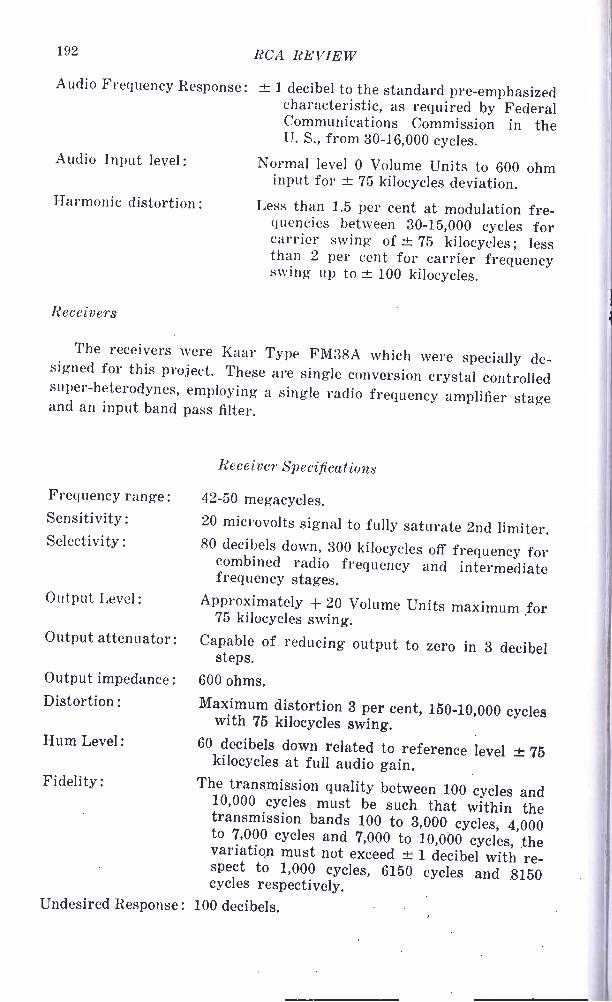
192 RCA REVIEW
Audio Frequency Response :
Audio Input level:
Harmonic distortion :
Receivers
± 1 decibel to the standard pre- emphasized characteristic, as required by Federal Communications Commission in the U. S., from 30- 16,000 cycles.
Normal level 0 Volume Units to 600 ohm input for ± 75 kilocycles deviation.
Less than 1.5 per cent at modulation fre- quencies between 30- 15,000 cycles for carrier swing of ± 75 kilocycles ; less than 2 per cent for carrier frequency swing up to ± 100 kilocycles.
The receivers were Kaar Type FM38A which were specially de- signed for this project. These are single conversion crystal controlled super- heterodynes, employing a single radio frequency amplifier stage and an input band pass filter.
Frequency range: Sensitivity :
Selectivity :
Output Level:
Output attenuator:
Output impedance :
Distortion :
Hum Level:
Fidelity :
Undesired Response :
Receiver Specifications
42 -50 megacycles. 20 microvolts signal to fully saturate 2nd limiter. 80 decibels down, 300 kilocycles off frequency for combined radio frequency and intermediate
frequency stages. Approximately + 20 Volume Units maximum for
75 kilocycles swing. Capable of reducing output to zero in 3 decibel
steps. 600 ohms.
Maximum distortion 3 per cent, 150 -10,000 cycles with 75 kilocycles swing. 60 decibels down related to reference level ± 75 kilocycles at full audio gain. The transmission quality between 100 cycles and 10,000 cycles must be such that within the transmission bands 100 to 3,000 cycles, 4,000 to 7,000 cycles and 7,000 to 10,000 cycles, the variation must not exceed ± 1 decibel with re- spect to 1,000 cycles, 6150 cycles and 8150 cycles respectively. 100 decibels.
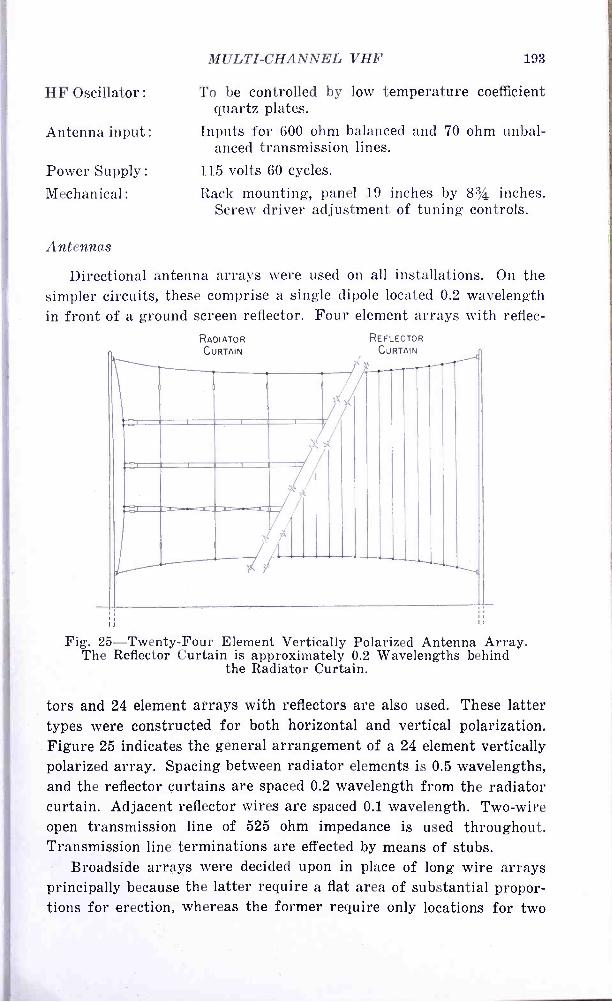
MULTI -CHANNEL VHF 193
HF Oscillator: To be controlled by low temperature coefficient quartz plates.
Antenna input: Inputs for 600 ohm balanced and 70 ohm unbal- anced transmission lines.
Power Supply : 115 volts 60 cycles.
Mechanical: Rack mounting, panel 19 inches by 83/4 inches. Screw driver adjustment of tuning controls.
Antennas
Directional antenna arrays were used on all installations. On the simpler circuits, these comprise a single dipole located 0.2 wavelength in front of a ground screen reflector. Four element arrays with reflec-
RADIATOR CURTAIN
REFLECTOR CURTAIN
i
F - r
..,.- - -.Nu. _.......m.
I(//
-
, {
Fig. 25- Twenty -Four Element Vertically Polarized Antenna Array. The Reflector Curtain is approximately 0.2 Wavelengths behind
the Radiator Curtain.
tors and 24 element arrays with reflectors are also used. These latter types were constructed for both horizontal and vertical polarization. Figure 25 indicates the general arrangement of a 24 element vertically polarized array. Spacing between radiator elements is 0.5 wavelengths, and the reflector curtains are spaced 0.2 wavelength from the radiator curtain. Adjacent reflector wires are spaced 0.1 wavelength. Two -wire open transmission line of 525 ohm impedance is used throughout. Transmission line terminations are effected by means of stubs.
Broadside arrays were decided upon in place of long wire arrays principally because the latter require a flat area of substantial propor- tions for erection, whereas the former require only locations for two
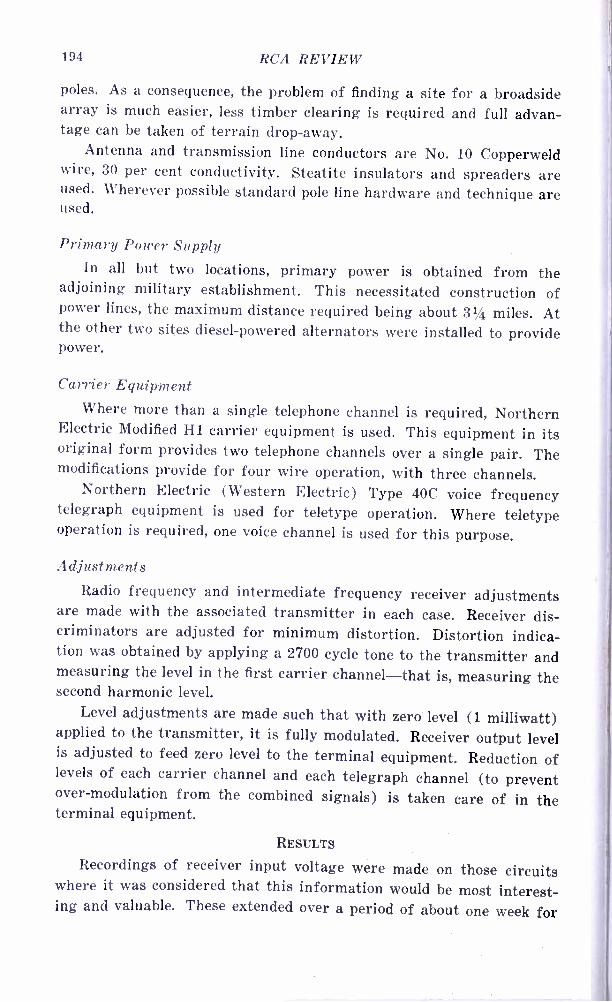
194 RCA REVIEW
poles. As a consequence, the problem of finding a site for a broadside array is much easier, less timber clearing is required and full advan- tage can be taken of terrain drop -away.
Antenna and transmission line conductors are No. 10 Copperweld wire, 30 per cent conductivity. Steatite insulators and spreaders are used. Wherever possible standard pole line hardware and technique are used.
Primary Power Supply In all but two locations, primary power is obtained from the
adjoining military establishment. This necessitated construction of power lines, the maximum distance required being about 31/4 miles. At the other two sites diesel -powered alternators were installed to provide power.
Carrier Equipment Where more than a single telephone channel is required, Northern
Electric Modified H1 carrier equipment is used. This equipment in its original form provides two telephone channels over a single pair. The modifications provide for four wire operation, with three channels.
Northern Electric (Western Electric) Type 40C voice frequency telegraph equipment is used for teletype operation. Where teletype operation is required, one voice channel is used for this purpose.
Adjustments
Radio frequency and intermediate frequency receiver adjustments are made with the associated transmitter in each case. Receiver dis- criminators are adjusted for minimum distortion. Distortion indica- tion was obtained by applying a 2700 cycle tone to the transmitter and measuring the level in the first carrier channel-that is, measuring the second harmonic level.
Level adjustments are made such that with zero level (1 milliwatt) applied to the transmitter, it is fully modulated. Receiver output level is adjusted to feed zero level to the terminal equipment. Reduction of levels of each carrier channel and each telegraph channel (to prevent over -modulation from the combined signals) is taken care of in the terminal equipment.
RESULTS
Recordings of receiver input voltage were made on those circuits where it was considered that this information would be most interest- ing and valuable. These extended over a period of about one week for
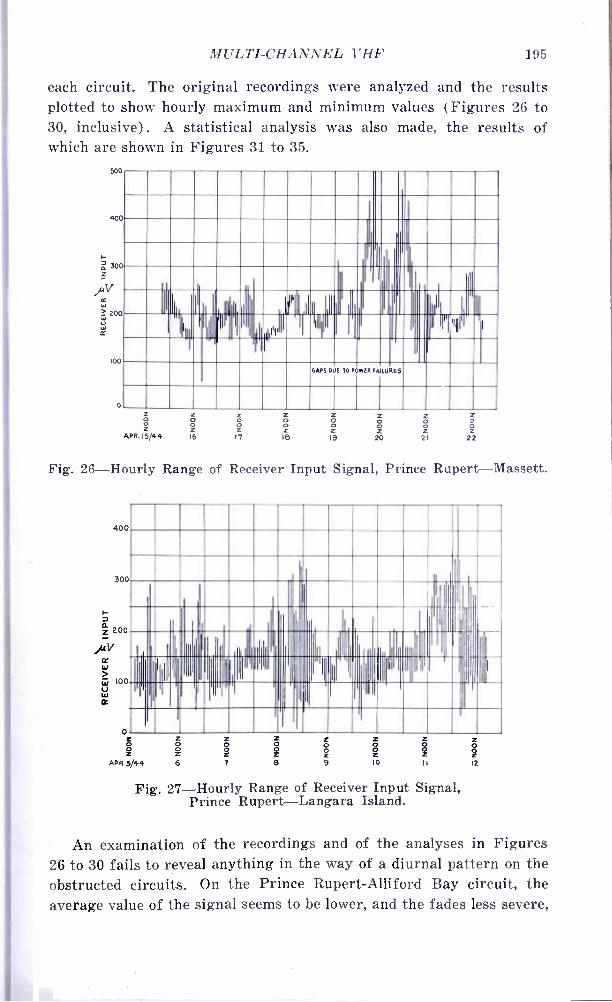
MULTI -CHANNEL VHF 195
each circuit. The original recordings were analyzed and the results plotted to show hourly maximum and minimum values (Figures 26 to 30, inclusive) . A statistical analysis was also made, the results of which are shown in Figures 31 to 35.
500
400
I-
ñ 300 z
1,V w
200 L.
X
100
Pr PI 911
GAUS DUE TO WER FAILURES
Z O O Z
APR.15/44
Z O O Z 16
Z O o Z 17
Z O O Z 16
Z O o Z 19
Z o O Z 20
Z o o Z 2i
Z O O Z
22
Fig. 26- Hourly Range of Receiver Input Signal, Prince Rupert -Massett.
40
3
o
0 , 1
o I
i zo
O O O Z Z Z Z z
Z Z
Z Z z APR 5/44 6 B 10
Fig. 27- Hourly Range of Receiver Input Signal, Prince Rupert -Langara Island.
12
An examination of the recordings and of the analyses in Figures 26 to 30 fails to reveal anything in the way of a diurnal pattern on the obstructed circuits. On the Prince Rupert -Alliford Bay circuit, the average value of the signal seems to be lower, and the fades less severe,
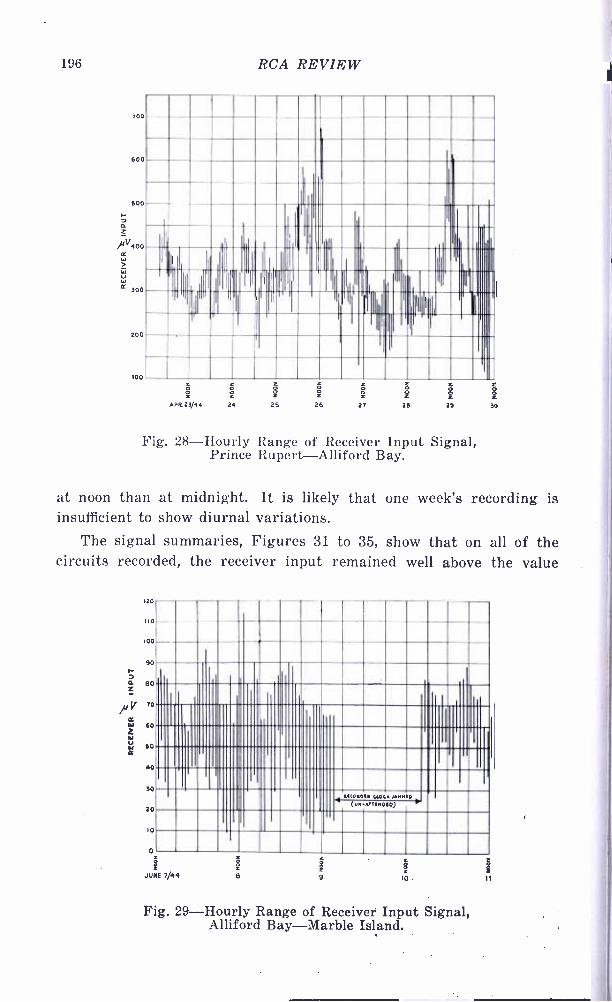
196 RCA REVIEW
700
600
500
n
/4v400 K W 1
U
300
200
100
II
2 L
ADR23/44 24
Z Z L C O Ó Ó
2 C Z O O
= 25 26 27 28 29 60
Fig. 28- Hourly Range of Receiver Input Signal, Prince Rupert -Alliford Bay.
at noon than at midnight. It is likely that one week's recording is insufficient to show diurnal variations.
The signal summaries, Figures 31 to 35, show that on all of the circuits recorded, the receiver input remained well above the value
LD -- iI0
00
90
BO
10
60
60
40
50
L .__-
r
ll(OMOIK CLOCK JAMMID
(ON A7TIKOlD)
10
0 L
99 i L°
JUNE 7/44 8 9 10
Fig. 29- Hourly Range of Receiver Input Signal, Alliford Bay -Marble Island.
11

MULTI- CHANNEL VHF 197
required for full limiter action, 20- microvolts, for all but an extremely small percentage of the time.
In operation, the radio circuits have proven very satisfactory. In comparison with the landline portions of the systems, their perform- ance is decidedly better. A large proportion of the outages on the radio circuits have been due to failure of the power and communication lines leading to the radio stations.
140
130
120
110
100
D 90 d z
uv 80
/ 70
W 1
60 cc
SO
40
30
o
I0
ó z z o° o
z o z i JUl.B/44 9 IO 11 12
Fig. 30- Hourly Range of Receiver Input Signal, Bella Coola -White Point.
ACKNOWLEDGMENTS
The project described herein was the result of the collaborate efforts of the following organizations: the Royal Canadian Air Force, the British Columbia Telephone Company and its associate, the North West Telephone Company, and the RCA Victor Company Limited. Im-
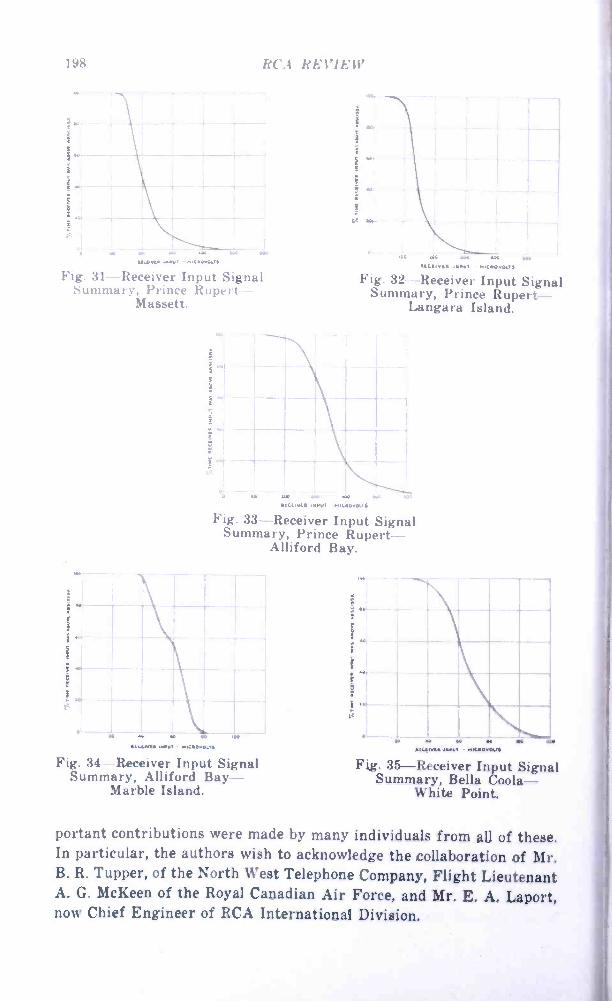
19S RCA REVIEW
pa NcVn .wr -nlorG.f!
í
Fig. 31- Receiver Input Signal Summary, Prince Rupert
Massett.
`
I
. ... ,.. .w .t.. t n . M.CYJVO.ry
Fig. 32- Receiver Input Signal Summary, Prince Rupert -
Langara Island.
aN WAIVER .UI MKOJ.O.tl
Fig. 33- Receiver Input Signal Summary, Prince Rupert -
Alliford Bay.
k K N ltC1.41 W.,f - MKI04ry
Fig. 34- Receiver Input Signal Summary, Alliford Bay -
Marble Island.
t N N M imams 1YO1 MKIOVONI
Fig. 35- Receiver Input Signal Summary, Bella Coola-
White Point.
portant contributions were made by many individuals from all of these. In particular, the authors wish to acknowledge the collaboration of Mr. B. R. Tupper, of the North West Telephone Company, Flight Lieutenant A. G. McKeen of the Royal Canadian Air Force, and Mr. E. A. Laport, now Chief Engineer of RCA International Division.
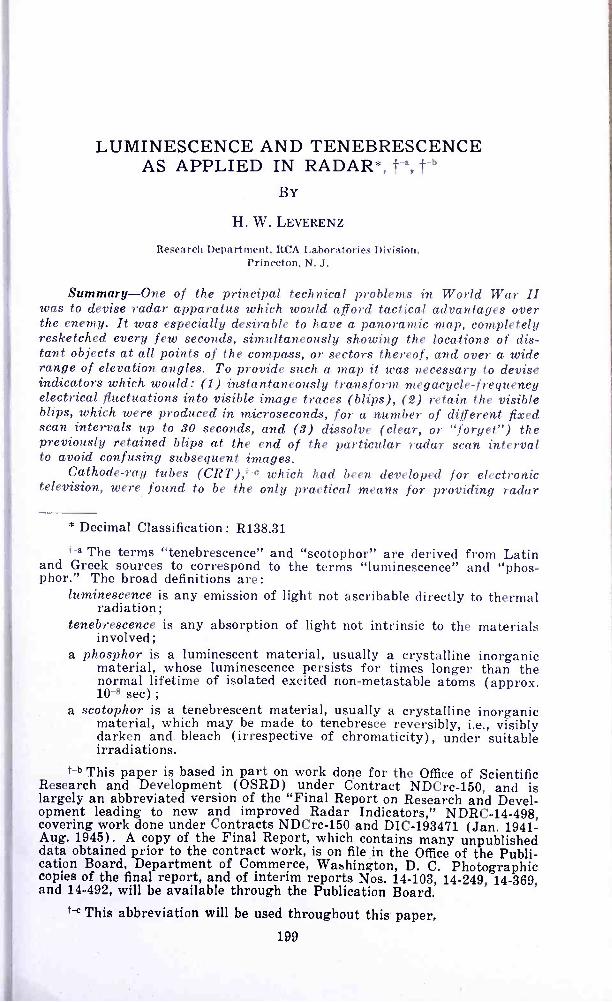
LUMINESCENCE AND TENEBRESCENCE AS APPLIED IN RADAR *,
BY
H. W. LEVERENZ
Research Department, RCA Laboratories Division, Princeton, N. J.
Summary -One of the principal technical problems in World War II was to devise radar apparatus which would afford tactical advantages over the enemy. It was especially desirable to have a panoramic map, completely resketched every few seconds, simultaneously showing the locations of dis- tant objects at all points of the compass, or sectors thereof, and over a wide range of elevation angles. To provide such a map it was necessary to devise indicators which would: (1) instantaneously transform megacycle -frequency electrical fluctuations into visible image traces (blips), (2) retain the visible blips, which were produced in microseconds, for a number of different fixed scan intervals up to 30 seconds, and (3) dissolve (clear, or "forget ") the previously retained blips at the end of the particular radar scan interval to avoid confusing subsequent images.
Cathode -ray tubes (CRT),t-c which had been developed for electronic television, were found to be the only practical means for providing radar
* Decimal Classification: R138.31
t-a The terms "tenebrescence" and "scotophor" are derived from Latin and Greek sources to correspond to the terms "luminescence" and "phos- phor." The broad definitions are:
luminescence is any emission of light not ascribable directly to thermal radiation;
tenebrescence is any absorption of light not intrinsic to the materials involved;
a phosphor is a luminescent material, usually a crystalline inorganic material, whose luminescence persists for times longer than the normal lifetime of isolated excited non -metastable atoms (approx. 10 -8 sec) ;
a scotophor is a tenebrescent material, usually a crystalline inorganic material, which may be made to tenebresce reversibly, i.e., visibly darken and bleach (irrespective of chromaticity) , under suitable irradiations.
t -b This paper is based in part on work done for the Office of Scientific Research and Development (OSRD) under Contract NDCrc -150, and is largely an abbreviated version of the "Final Report on Research and Devel- opment leading to new and improved Radar Indicators," NDRC -14 -498, covering work done under Contracts NDCrc -150 and DIC- 193471 (Jan. 1941 - Aug. 1945). A copy of the Final Report, which contains many unpublished data obtained prior to the contract work, is on file in the Office of the Publi- cation Board, Department of Commerce, Washington, D. C. Photographic copies of the final report, and of interim reports Nos. 14 -103, 14 -249, 14 -369, and 14 -492, will be available through the Publication Board.
t-c This abbreviation will be used throughout this paper. 199
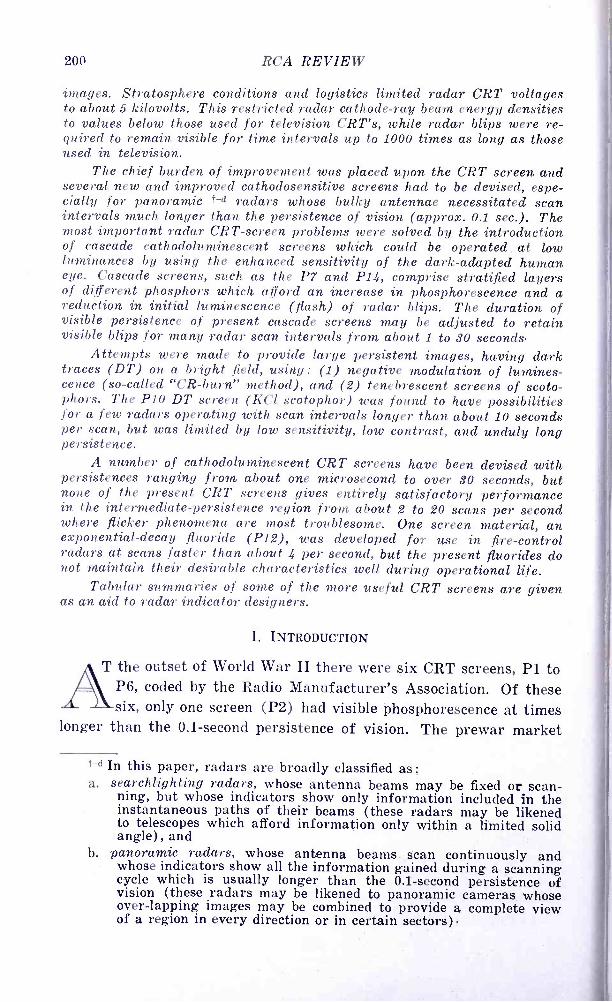
200 RCA REVIEW
images. Stratosphere conditions and logistics limited radar CRT voltages to about 5 kilovolts. This restricted radar cathode -ray beam energy densities to values below those used for television CRT's, while radar blips were re- quired to remain visible for time intervals up to 1000 times as long as those used in television.
The chief burden of improvement was placed upon the CRT screen and several new and improved cathodosensitive screens had to be devised, espe- cially for panoramic t -d radars whose bulky antennae necessitated scan intervals much longer than the persistence of vision (approx. 0.1 sec.). The 'most important radar CRT -screen problems were solved by the introduction of cascade cathodoluminescent screens which could be operated. at low luminances by using the enhanced sensitivity of the dark -adapted human eye. Cascade screens, such as the P7 and P14, comprise stratified layers of different phosphors which afford an increase in phosphorescence and a reduction in initial luminescence (flash) of radar blips. The duration of visible persistence of present cascade screens may be adjusted to retain visible blips for many radar scan intervals from about 1 to 30 seconds.
Attempts were made to provide large persistent images, having dark traces (DT) on a bright field, using: (1) negative modulation of lumines- cence (so- called "CR- burn" method), and (2) tenebrescent screens of scoto- phors. The P10 DT screen (KCl scotophor) was found to have possibilities for a few radars operating with scan intervals longer than about 10 seconds per scan, but was limited by low sensitivity, low contrast, and unduly long persistence.
A number of cathodoluminescent CRT screens have been devised with persistences ranging from about one microsecond to over 30 seconds, but none of the present CRT screens gives entirely satisfactory performance in the intermediate -persistence region from about 2 to 20 scans per second where flicker phenomena are most troublesome. One screen material, an exponential -decay fluoride (P12), was developed for use in fire -control radars at scans faster than about 4 per second, but the present fluorides do not maintain their desirable characteristics well during operational life.
Tabular summaries of some of the more useful CRT screens are given as an aid to radar indicator designers.
I. INTRODUCTION
T the outset of World War II there were six CRT screens, P1 to P6, coded by the Radio Manufacturer's Association. Of these six, only one screen (P2) had visible phosphorescence at times
longer than the 0.1- second persistence of vision. The prewar market
t -d In this paper, radars are broadly classified as: a. searchlighting radars, whose antenna beams may be fixed or scan-
ning, but whose indicators show only information included in the instantaneous paths of their beams (these radars may be likened to telescopes which afford information only within a limited solid angle), and
b. panoramic radars, whose antenna beams scan continuously and whose indicators show all the information gained during a scanning cycle which is usually longer than the 0.1- second persistence of vision (these radars may be likened to panoramic cameras whose over -lapping images may be combined to provide a complete view of a region in every direction or in certain sectors).
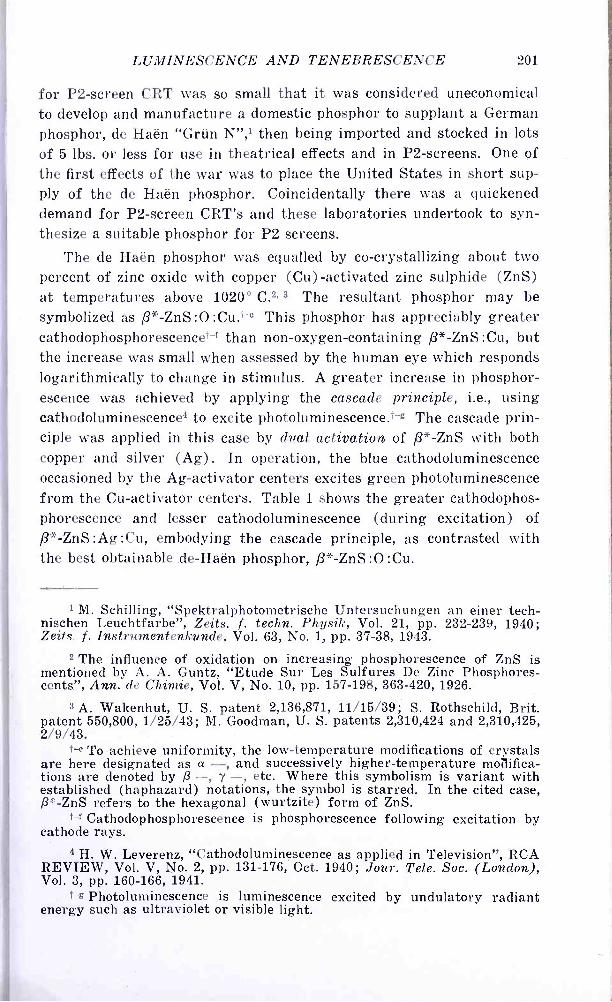
LUMINESCENCE AND TENEBRESCENCE 201
for P2- screen CRT was so small that it was considered uneconomical to develop and manufacture a domestic phosphor to supplant a German phosphor, de Haën "Grün N ",1 then being imported and stocked in lots of 5 lbs. or less for use in theatrical effects and in P2- screens. One of the first effects of the war was to place the United States in short sup- ply of the de Haën phosphor. Coincidentally there was a quickened demand for P2- screen CRT's and these laboratories undertook to syn- thesize a suitable phosphor for P2 screens.
The de Haën phosphor was equalled by co- crystallizing about two percent of zinc oxide with copper (Cu) -activated zinc sulphide (ZnS) at temperatures above 1020° C.2.3 The resultant phosphor may be symbolized as ß* -ZnS :0:Cu.t -e This phosphor has appreciably greater cathodophosphorescencei-e than non -oxygen- containing ß *- ZnS :Cu, but the increase was small when assessed by the human eye which responds logarithmically to change in stimulus. A greater increase in phosphor- escence was achieved by applying the cascade principle, i.e., using cathodoluminescence4 to excite photoluminescence.t-g The cascade prin- ciple was applied in this case by dual activation of ß* -ZnS with both copper and silver (Ag) . In operation, the blue cathodoluminescence occasioned by the Ag- activator centers excites green photoluminescence from the Cu- activator centers. Table 1 shows the greater cathodophos- phorescence and lesser cathodoluminescence (during excitation) of ß *- ZnS :Ag:Cu, embodying the cascade principle, as contrasted with the best obtainable .de -Haën phosphor, ß* -ZnS :0 :Cu.
1 M. Schilling, "Spektralphotometrische Untersuchungen an einer tech - nischen Leuchtfarbe", Zeits. f. techn. Physik, Vol. 21, pp. 232 -239, 1940; Zeits- f. Instrumentenkunde, Vol. 63, No. 1, pp. 37 -38, 1943.
2 The influence of oxidation on increasing phosphorescence of ZnS is mentioned by A. A. Guntz, "Etude Sur Les Sulfures De Zinc Phosphores- cents", Ann. de Chimie, Vol. V, No. 10, pp. 157 -198, 363 -420, 1926.
3 A. Wakenhut, U. S. patent 2,136,871, 11/15/39; S. Rothschild, Brit. patent 550,800, 1/25/43; M. Goodman, U. S. patents 2,310,424 and 2,310,425, 2/9/43.
t-e To achieve uniformity, the low- temperature modifications of crystals are here designated as a -, and successively higher -temperature modifica- tions are denoted by ß -, y -, etc. Where this symbolism is variant with established (haphazard) notations, the symbol is starred. In the cited case, ß* -ZnS refers to the hexagonal (wurtzite) form of ZnS.
t -f Cathodophosphorescence is phosphorescence following excitation by cathode rays.
4 H. W. Leverenz, "Cathodoluminescence as applied in Television ", RCA REVIEW, Vol. V, No. 2, pp. 131 -176, Oct. 1940; Jour. Tele. Soc. (London), Vol. 3, pp. 160 -166, 1941.
t-g Photoluminescence is luminescence excited by undulatory radiant energy such as ultraviolet or visible light.

LOL RCA REVIEW
Table 1.
Cathodophosphorescences of long -persistence zinc sulphides.
Measured By:
Vi} ual 931 Photomultiplier (unfiltered) p )
Phosphorescence Ú
o .= f,i ctla
(t in seconds) Main Aux.
t=0 .25 .5 1 2 4 8 16 20 PA k Peak
ß *- ZnS:Ag:Cu (33 -Z -22) 130 2,920 46 26 16 7.6 4.4 2.5 1.4 1.1 5200 4500
ß* -ZnS :0 : Cu (de Haën) 190 2,850 30 14.5 8.2 4.1 2.3 1.4 .7 .5 5200
Excitation by one second of 6- kilovolts, 4- microamperes per square centimeter cathode ray.
Dual- activation of ZnS :CdS phosphors had previously been proposed to provide a specific white -emitting fast -decay phosphor for television,5 but the cathodoluminescence efficiency (during excitatic n) of such dual-activated phosphors is lower than the efficiency obtainable with a single activator.t-11 This is shown in Figure 1 for Zn ., (86) :CdS :Ag :Cu which is compared with the dual- activated ß* -ZnS :Ag:Cu listed in Table 1.
While the dual- activated ß *- ZnS :Ag :Cu phosphor utilized cascad- ing to achieve improved phosphorescence, the cascade action was not as effective as it would be if the Ag- activator centers alone were excited by cathode rays and the Cu- activator centers were subsequently excited solely by the blue cathodoluminescence from the Ag- activator emission band. A more clear -cut cascading was required to minimize the oft - observed rapid decay of cathodophosphorescence contrasted with the slower decay of photophosphorescence for the same phosphor. This differential effect of corpuscular vs. undulatory excitation energies on the phosphorescences of two typical phosphors is exemplified in Figures
5 A. Wakenhut, Ger. patent 640,056, 12/21/36. t -fl This has been mentioned on Page 142 of reference 4. It is conceivable that improved efficiency during excitation might be obtained from multiple - activation if the different activators occupied structurally dissimilar sites in the crystal. For example, one activator might occupy interstitial sites and another be located in normal (substitutional) sites.
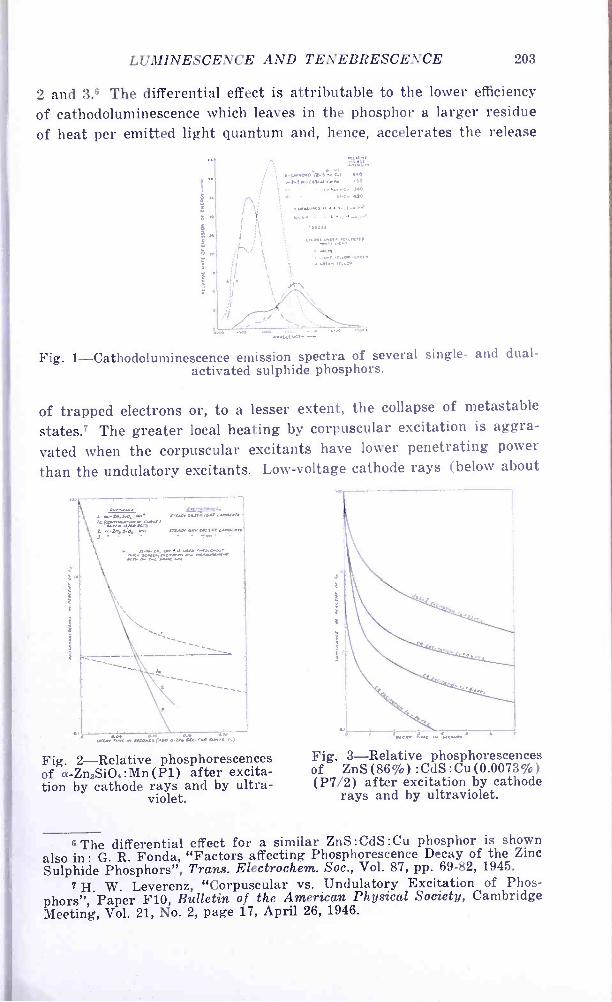
LUMINESCENCE AND TENEBRESCENCE 203
2 and 3.6 The differential effect is attributable to the lower efficiency
of cathodoluminescence which leaves in the phosphor a larger residue of heat per emitted light quantum and, hence, accelerates the release
"
O.DlSMI 5.0 o-lS18,045,..... 'S0
e-aa.C+ l0
Fig. 1- Cathodoluminescence emission spectra of several single- and dual - activated sulphide phosphors.
of trapped electrons or, to a lesser extent, the collapse of metastable
states.' The greater local heating by corpuscular excitation is aggra-
vated when the corpuscular excitants have lower penetrating power
than the undulatory excitants. Low- voltage cathode rays (below about
° ha 5 S t ° ata .a.[ an MCa.0(0a 0.2)4 c .a. 0,.°,.)
Fig. 2- Relative phosphorescences of a- Zn2SiO4 : Mn (P1) after excita- tion by cathode rays and by ultra-
violet.
Fig. 3- Relative phosphorescences of ZnS(86 %) :CdS:Cu(0.0073 %) (P7/2) after excitation by cathode
rays and by ultraviolet.
6 The differential effect for a similar ZnS:CdS:Cu phosphor is shown also in: G. R. Fonda, "Factors affecting Phosphorescence Decay of the Zinc Sulphide Phosphors ", Trans. Electrochem. Soc., Vol. 87, pp. 69 -82, 1945.
7 H. W. Leverenz, "Corpuscular vs. Undulatory Excitation of Phos- phors", Paper F10, Bulletin of the American Physical Society, Cambridge Meeting, Vol. 21, No. 2, page 17, April 26, 1946.
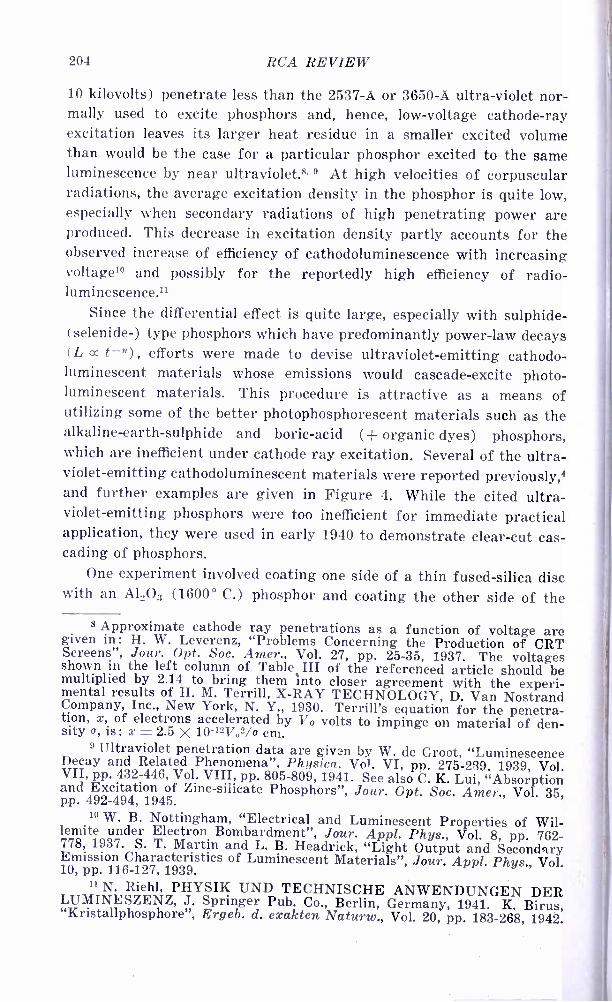
204 RCA REVIEW
10 kilovolts) penetrate less than the 2537 -A or 3650 -A ultra -violet nor- mally used to excite phosphors and, hence, low- voltage cathode -ray excitation leaves its larger heat residue in a smaller excited volume than would be the case for a particular phosphor excited to the same luminescence by near ultraviolet.8. 9 At high velocities of corpuscular radiations, the average excitation density in the phosphor is quite low, especially when secondary radiations of high penetrating power are produced. This decrease in excitation density partly accounts for the observed increase of efficiency of cathodoluminescence with increasing voltage10 and possibly for the reportedly high efficiency of radio- luminescence."
Since the differential effect is quite large, especially with sulphide - (selenide-) type phosphors which have predominantly power -law decays (L « t -"), efforts were made to devise ultraviolet- emitting cathodo- luminescent materials whose emissions would cascade -excite photo - luminescent materials. This procedure is attractive as a means of utilizing some of the better photophosphorescent materials such as the alkaline- earth- sulphide and boric -acid (+ organic dyes) phosphors, which are inefficient under cathode ray excitation. Several of the ultra- violet- emitting cathodoluminescent materials were reported previously,4 and further examples are given in Figure 4. While the cited ultra- violet- emitting phosphors were too inefficient for immediate practical application, they were used in early 1940 to demonstrate clear -cut cas- cading of phosphors.
One experiment involved coating one side of a thin fused -silica disc with an AL,O3 (1600° C.) phosphor and coating the other side of the
8 Approximate cathode ray penetrations as a function of voltage are given in : H. W. Leverenz, "Problems Concerning the Production of CRT Screens ", Jour. Opt. Soc. Amer., Vol. 27, pp. 25 -35, 1937. The voltages shown in the left column of Table III of the referenced article should be multiplied by 2.14 to bring them into closer agreement with the experi- mental results of H. M. Terrill, X -RAY TECHNOLOGY, D. Van Nostrand Company, Inc., New York, N. Y., 1930. Terrill's equation for the penetra- tion, x, of electrons accelerated by Vo volts to impinge on material of den- sity v, is : x = 2.5 X 10⁻¹²V02/u cm. 9 Ultraviolet penetration data are given by W. de Groot, "Luminescence Decay and Related Phenomena ", Physica. Vol. VI, pn. 275 -239, 1939, Vol. VII, pp. 432 -446, Vol. VIII, pp. 805 -809, 1941. See also C. K. Lai, "Absorption and Excitation of Zinc -silicate Phosphors ", Jour. Opt. Soc. Amer., Vol. 35, pp. 492 -494, 1945. 10 W. B. Nottingham, "Electrical and Luminescent Properties of Wil- lemite under Electron Bombardment ", Jour. Appl. Phys., Vol. 8, pp. 762- 778, 1937. S. T. Martin and L. B. Headrick, "Light Output and Secondary Emission Characteristics of Luminescent Materials ", Jour. Appl. Phys., Vol. 10, pp. 116 -127, 1939. 11 N. Riehl, PHYSIK UND TECHNISCHE ANWENDUNGEN DER LUMINESZENZ, J. Springer Pub. Co., Berlin, Germany, 1941. K. Birus, "Kristallphosphore", Ergeb. d. exakten Naturw., Vol. 20, pp. 183 -268, 1942.
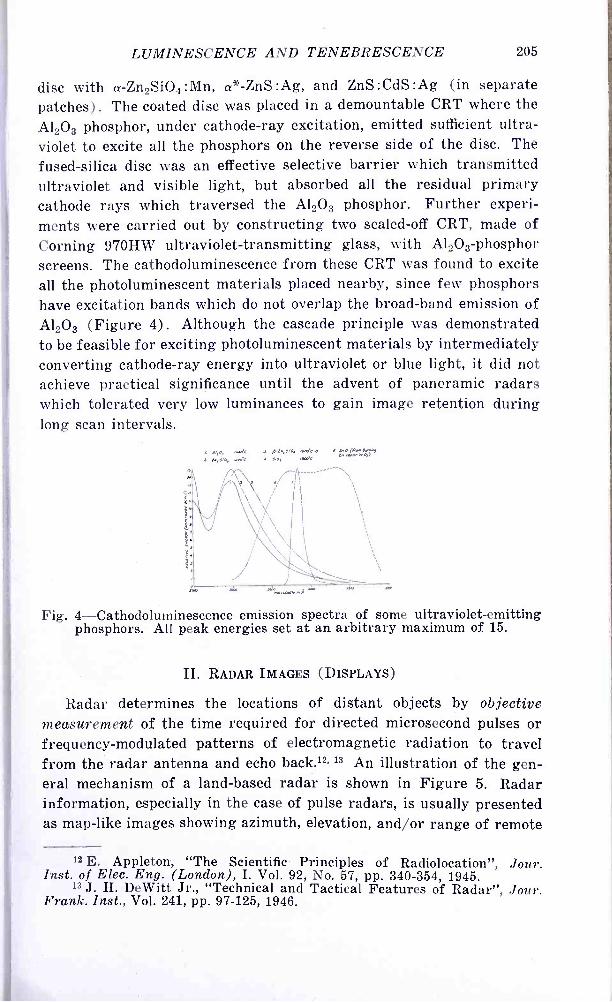
LUMINESCENCE AND TENEBRESCENCE 205
disc with a- Zn2SiO4:Mn, a *- ZnS:Ag, and ZnS:CdS:Ag (in separate patches) . The coated disc was placed in a demountable CRT where the Al2O3 phosphor, under cathode -ray excitation, emitted sufficient ultra- violet to excite all the phosphors on the reverse side of the disc. The
fused -silica disc was an effective selective barrier which transmitted ultraviolet and visible light, but absorbed all the residual primary cathode rays which traversed the Al2O3 phosphor. Further experi- ments were carried out by constructing two sealed -off CRT, made of Corning 97011W ultraviolet- transmitting glass, with Al2O3- phosphor screens. The cathodoluminescence from these CRT was found to excite all the photoluminescent materials placed nearby, since few phosphors have excitation bands which do not overlap the broad -band emission of Al2O3 (Figure 4) . Although the cascade principle was demonstrated to be feasible for exciting photoluminescent materials by intermediately converting cathode -ray energy into ultraviolet or blue light, it did not achieve practical significance until the advent of panoramic radars which tolerated very low luminances to gain image retention during long scan intervals.
Al,o, «os 46.*cc s size
e . .. .. ae n..-a>
í ' \\'\ ,/
I ,,,`\ =q \ i
. .i
l . \ i \' \
Fig. 4- Cathodoluminescence emission spectra of some ultraviolet- emitting phosphors. All peak energies set at an arbitrary maximum of 15.
II. RADAR IMAGES (DISPLAYS)
Radar determines the locations of distant objects by objective measurement of the time required for directed microsecond pulses or frequency -modulated patterns of electromagnetic radiation to travel from the radar antenna and echo back.12, 13 An illustration of the gen- eral mechanism of a land -based radar is shown in Figure 5. Radar information, especially in the case of pulse radars, is usually presented as map -like images showing azimuth, elevation, and /or range of remote
12 E. Appleton, "The Scientific Principles of Radiolocation ", Jour. Inst. of Elec. Eng. (London), I. Vol. 92, No. 57, pp. 340 -354, 1945.
13 J. H. DeWitt Jr., "Technical and Tactical Features of Radar ", Jour. Frank. Inst., Vol. 241, pp. 97 -125, 1946.

206 RCA REVIEW
objects. Interpretation of radar images is a matter of subjective dis- cernment which is accomplished by observers specially trained in the fine art of "blipology." It is apparent from Figure 5, that radar indi- cators must transform objective radar information, gathered and assembled with invisible kinds of energy, into visible maps designed to be most useful to the subjective physiological and psychological proc- esses of the observer.
rr...vrrrrru 44. _. .tnrrrr0 4w.
I .crop ws áry
,wraw
ttnrwx n0 -ro'.r.y .
nr..ó\try - 7 :. in =; í ac mxr.-.. fctrÌ t..tr ru.vawmr
Fig. 5- Schema of radar. The CRT screen transforms objective data
into subjectively perceptible information.
J. W irr JV
to TO TIN PULSES
TIME IN 0.005"
500 - ufl(
IM SEC.
RADAR PULSE
ECHOS
ONE
E
á _TEAT IDEAL DECRY CURVE
EXCITATION (NOT TO
SCALE) ANO MAY OF ARDOR INDICATOR.-
ACTUAL DECRY CURVE TUB! SCREENS.
OTO 10 SECONDS >10 SECONDS-. EXCITATION PERSISTENCE
Fig. 6- Exemplary excitation and decay of a radar CRT screen in
PPI operation.
The energy- versus -time relationships of typical radar pulses and ideal -vs. -real indicator -screen persistence characteristics are sketched in Figure 6. Noise and clutter -E are omitted for simplicity. The time between transmission of a pulse and the reception of its echo is used to determine range ; 10 microseconds corresponding roughly to one mile.
1104040410 Fig. 7 -A nightfighter airplane radar image. Center of image is center of gunfire. Length of simulated wings proportional to nearness of the target.
Several typical radar displays (image types) are shown schemati- cally in Figures 7.and 8. Figure 7 shows a type of searchlighting night - fighter airborne radar image which indicates the position of another plane with reference to the observer's line of flight. When the target
1 t Clutter is a collective term including visible indications of : (1) fixed echos such as ground or sea- returns; (2) countermeasures interferences, such as from "chaff" or "window" (metallised strips dropped from aircraft to obfuscate radar detection in that region) ; and (3) vestigial blips from previous images.

LUMINESCENCE AND TENEBRESCENCE 207
has been brought into the dead -ahead position, the length of the simu-
lated "wings" (proportional to signal strength) indicates relative
nearness. Figures 8 (a) and 8 (b) show the panoramic radial -scan
plan -position- indicator (PPI) which may be displayed as bright traces
(BT) on a dark background or by the opposite effect of dark traces (DT) on a bright background. The radial length normally indicates
range while the angular displacement of the blip from a fiducial direc-
SIGNAL (BLIP)
CENTER AREA IS
GROUND (SEA) RETURN
BT, PPI DT, PPI (a) CASCADE - PHOSPHOR (P7) (b) DARK- TRACE (P10)
(ANGLE = AZIMUTH , RADIUS= RANGE)
BT, TYPE -A SCAN BT, EAGLE SCAN (C)PI OR P7 (d)CASCADE- PHOSPHOR(PI4)
(ABSCISSA= RANGE ABSCISSA= LATERAL DISTANCE)
ORDINATE= SIGNAL STRENGTH) ) (ORDINATE= RANGE /
Fig. 8- Sketches of typical radar images.
tion usually indicates azimuth. Figure 8 (c) shows the searchlighting type -A scan which usually shows range alone, but may be arranged to
indicate elevation angle. In the latter case, the elevation indicator plus
a range -azimuth PPI affords the three -dimensional information which is necessary to locate a distant object in space with range accuracy up
to ± 5 yards (independent of range), and angular accuracy of the order of 3 degrees.T_j Figure 8 (d) shows a panoramic airborne Eagle scan which virtually displays a sector of a PPI scan; more exactly, this is
+ -i Thé angular accuracy in radians is proportional to the wavelength of the radiation (in cm) divided by the diameter (in cm) of the radar "dish" (antenna).
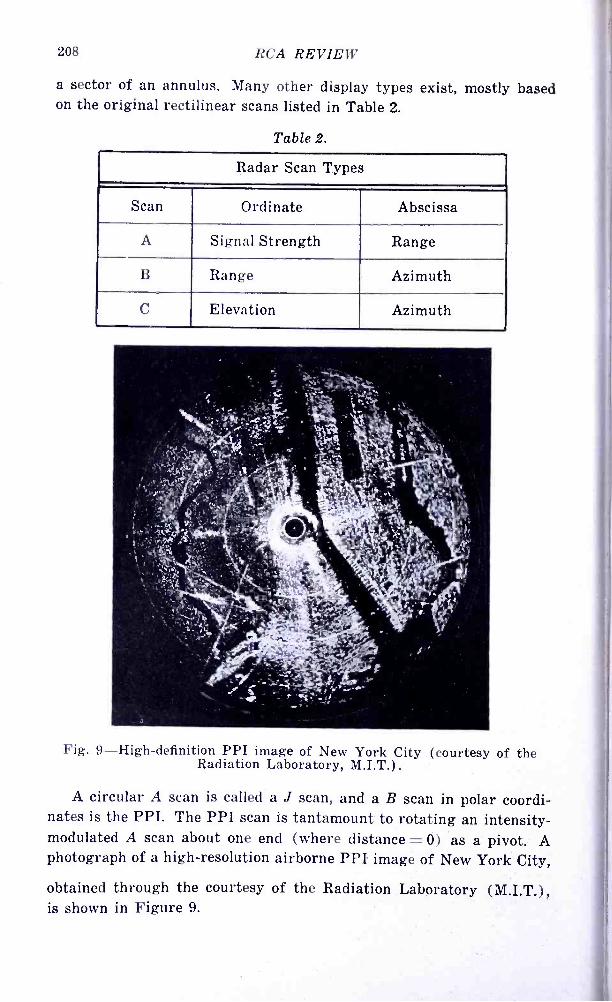
208 RCA REVIEW
a sector of an annulus. Many other display types exist, mostly based on the original rectilinear scans listed in Table 2.
Table 2.
Radar Scan Types
Scan Ordinate Abscissa
A Signal Strength Range
B Range Azimuth
C Elevation Azimuth
Fig. 9- High- definition PPI image of New York City (courtesy of the Radiation Laboratory, M.I.T.).
A circular A scan is called a J scan, and a B scan in polar coordi- nates is the PPI. The PPI scan is tantamount to rotating an intensity - modulated A scan about one end (where distance = 0) as a pivot. A photograph of a high -resolution airborne PPI image of New York City,
obtained through the courtesy of the Radiation Laboratory (M.I.T.), is shown in Figure 9.

LUMINESCENCE AND TENEBRESCENCE 209
III. RADAR CATHODE RAY TUBES
Since radar information is obtained in times reckoned in micro- seconds and must be displayed in maps which are continuously re- sketched in times reckoned in seconds, CRT's (especially high- vacuum CRT's) are the only satisfactory means now available for general indi- cator purposes. This is so because cathode -ray beams are unique in that they may be modulated and deflected, with low power consumption, at megacycle frequencies.
Some pre -war television projection CRT's were operated at 70 kilo- volts with 70 watts of cathode -ray beam power to afford about 2500 footlamberts of screen luminance.14 Airborne radar CRT's were lim- ited to voltages below 5 kilovolts to minimize the bulk of their power supplies and obviate electrical breakdown during non -pressurized stratosphere operation. Higher voltages could have been used in land and ship radars, but it was deemed best to standardize at 5 kilovolts or below to simplify logistics. A minor exception was made in the case of the few P10- screen CRT's which were operated at 9 kilovolts to compensate in part for the relatively inefficient cathodotenebrescence of evaporated KC1 (P10 scotophor) .
The 5- kilovolt "ceiling" on wartime radar CRT's limited their avail- able cathode -ray beam power to values below about 1 watt. Even this low power was turned on only when signal -plus -noise overcame the arbitrarily -controlled grid bias. Since 5- kilovolt cathode rays penetrate less than 0.2 micron (p.) in most phosphors and scotophors, effective use could not be made of the 0.1 -p -thick aluminum film which is incor- porated in some television CRT's. The aluminum film assures full utilization of the applied voltage and reflects all the luminescence in the direction of the observer or projection system.15 -18
In radar, as in television, compromises had to be made between the incompatible demands for small indicators and large images. Large images may be viewed by a number of observers simultaneously, and
14 I. G. Maloff and D. W. Epstein, "Reflective Cptics in Projection Tele- vision", Electronics, pp. 98 -105, Dec., 1944.
15 K. Schlesinger, U. S. patent 2,029,639, 2/4/36. R. R. Law, U. S. patent 2,233,786, 3/4/41; U. S. patent 2,308,563, 12/1/42; J. Kaspar, H. Katz, and E. Stendel, German patent 703,255, 1/30/41; and V. J. Schaefer, U. S. patent 2,374,311, 4/24/45.
16 A. de Quervain, "Ein neuartiger Leuchtschirm fuer Kathodenstrahl - roehren, speziell fuer Fernsehzwecke ", Hoch fr. u. Elektroakustik, Vol. 54, pp. 151 -153, 1939.
17 C. H. Bachman, "Image Contrast in Television ", Gen. Elec. Rev., Vol. 48, No. 9, pp. 13 -19, 1945.
18 D. W. Epstein and L. Pensak, "Improved Cathode -Ray Tubes with Metal- Backed Luminescent Screens ", RCA REVIEW, Vol. VII, No. 1, pp. 5 -11, March, 1946.
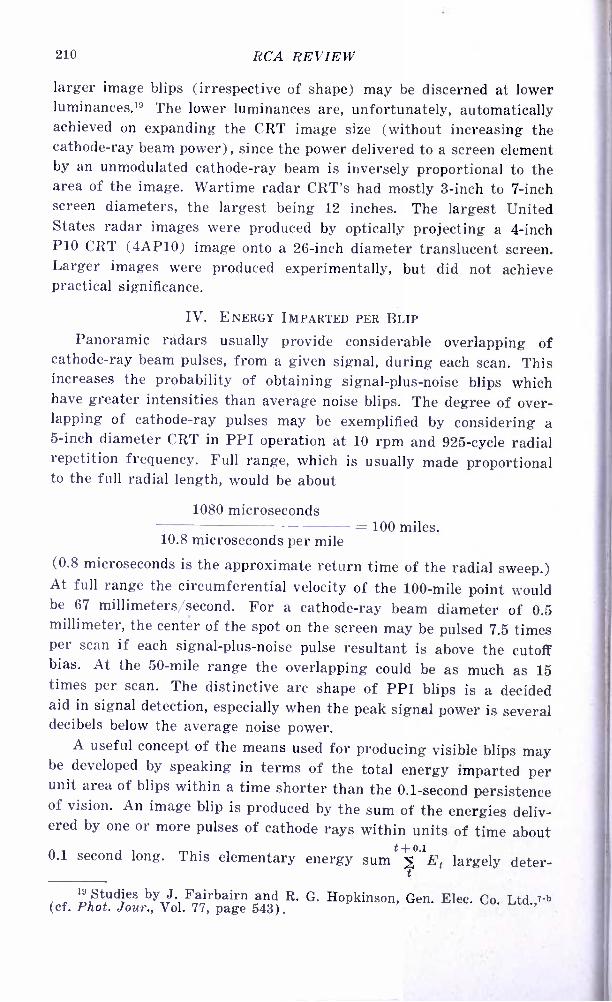
210 RCA REVIEW
larger image blips (irrespective of shape) may be discerned at lower luminances.19 The lower luminances are, unfortunately, automatically achieved on expanding the CRT image size (without increasing the cathode -ray beam power), since the power delivered to a screen element by an unmodulated cathode -ray beam is inversely proportional to the area of the image. Wartime radar CRT's had mostly 3 -inch to 7 -inch screen diameters, the largest being 12 inches. The largest United States radar images were produced by optically projecting a 4 -inch P10 CRT (4AP10) image onto a 26 -inch diameter translucent screen. Larger images were produced experimentally, but did not achieve practical significance.
IV. ENERGY IMPARTED PER BLIP
Panoramic radars usually provide considerable overlapping of cathode -ray beam pulses, from a given signal, during each scan. This increases the probability of obtaining signal -plus -noise blips which have greater intensities than average noise blips. The degree of over- lapping of cathode -ray pulses may be exemplified by considering a 5 -inch diameter CRT in PPI operation at 10 rpm and 925 -cycle radial repetition frequency. Full range, which is usually made proportional to the full radial length, would be about
1080 microseconds = 100 miles.
10.8 microseconds per mile (0.8 microseconds is the approximate return time of the radial sweep.) At full range the circumferential velocity of the 100 -mile point would be 67 millimeters /second. For a cathode -ray beam diameter of 0.5 millimeter, the center of the spot on the screen may be pulsed 7.5 times per scan if each signal -plus -noise pulse resultant is above the cutoff bias. At the 50 -mile range the overlapping could be as much as 15 times per scan. The distinctive arc shape of PPI blips is a decided aid in signal detection, especially when the peak signal power is several decibels below the average noise power.
A useful concept of the means used for producing visible blips may be developed by speaking in terms of the total energy imparted per unit area of blips within a time shorter than the 0.1- second persistence of vision. An image blip is produced by the sum of the energies deliv- ered by one or more pulses of cathode rays within units of time about
t -ß-.o.1 0.1 second long. This elementary energy sum N Et largely deter-
19 Studies by J. Fairbairn and R. G. Hopkinson, Gen. Elec. Co. Ltd.,T -b (cf. Phot. Jour., Vol. 77, page 543).
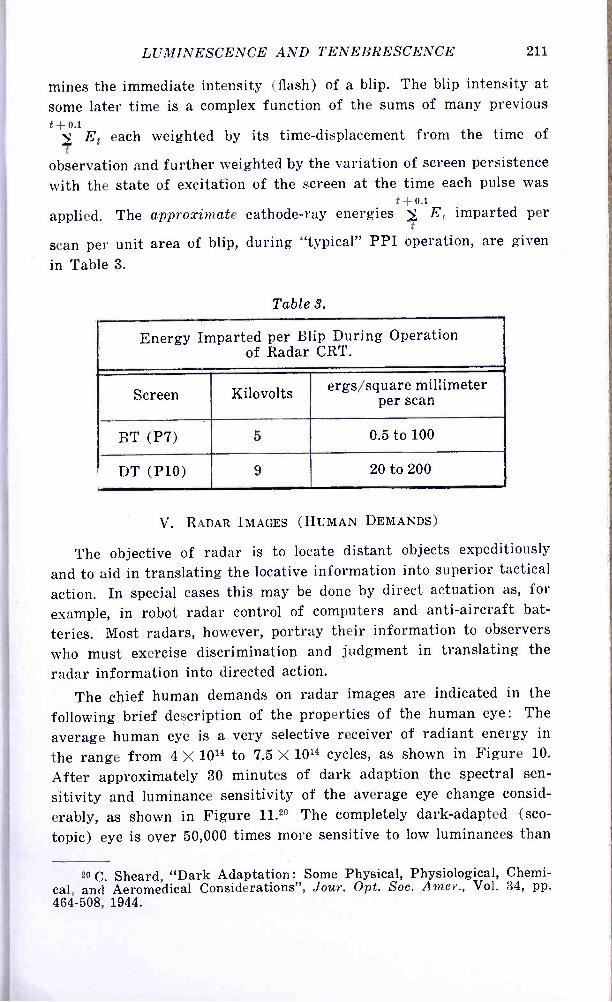
LUMINESCENCE AND TENEBRESCENCE 211
mines the immediate intensity (flash) of a blip. The blip intensity at some later time is a complex function of the sums of many previous t -Fo.i
N Et each weighted by its time -displacement from the time of
observation and further weighted by the variation of screen persistence with the state of excitation of the screen at the time each pulse was
t o.i applied. The approximate cathode -ray energies Et imparted per
t
scan per unit area of blip, during "typical" PPI operation, are given
in Table 3.
Table 3.
Energy Imparted per Blip During Operation of Radar CRT.
Screen Kilovolts ergs /square millimeter per scan
BT (P7) 5 0.5 to 100
DT (P10) 9 20 to 200
V. RADAR IMAGES (HUMAN DEMANDS)
The objective of radar is to locate distant objects expeditiously
and to aid in translating the locative information into superior tactical
action. In special cases this may be done by direct actuation as, for
example, in robot radar control of computers and anti -aircraft bat-
teries. Most radars, however, portray their information to observers
who must exercise discrimination and judgment in translating the
radar information into directed action.
The chief human demands on radar images are indicated in the
following brief description of the properties of the human eye: The
average human eye is a very selective receiver of radiant energy in
the range from 4 X 10¹⁴ to 7.5 X 10¹⁴ cycles, as shown in Figure 10.
After approximately 30 minutes of dark adaption the spectral sen-
sitivity and luminance sensitivity of the average eye change consid-
erably, as shown in Figure 11.20 The completely dark -adapted (sco-
topic) eye is over 50,000 times more sensitive to low luminances than
20 C. Sheard, "Dark Adaptation: Some Physical, Physiological, Chemi- cal, and Aeromedical Considerations ", Jour. Opt. Soc. Amer., Vol. 34, pp. 464 -508, 1944.
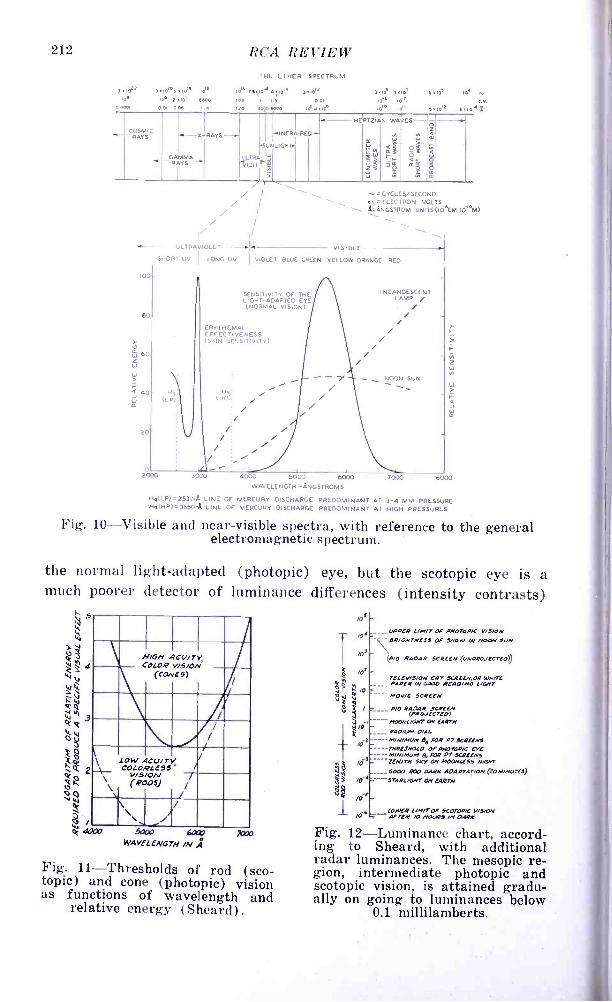
212 RCA REVIEW
10z e
000m
106 1 .106 eeoo
001 ooh
THE ETHER SPECTRUM
0673,1óa 1.l0'4 3u0o/ 103 1
1 4 0.01
1 o aó00 e 18 a.106
3.106 3ne 166 IV 10i0 1Ó'
6 3106 0a ti
e eIo'= 3 uosa
C RAOSYS
MIC
GAMMA
---X-RAYS-
1LTRA-
'SUNLIGHT.
u
INFRARE
HERTZ
."
AN
P
WAVES
I á3 03
ti m
1001-
BO
J 60
Z W
40
20
0 2000 3000
/ /
I/ OLI RA V IO Lt I
SHrT uv ICN,", VV
(
.1.'v10LE1 BLUE GREEN
SENSITIVITY OF T., LIGHT- ADAPTED E +I (NORMAL VISION.
E RY T HEM AL :. FFECTI VENESS CAIN SENSITIVITY)
= CYCLES /SECOND Ro ELECTRON VOLTS A :ANGSTROM VNI TS(IÓkM,10'6M)
VISIBLE
YELLOW ORANGE RED
- -
INCANDESCENT LAMP / /
ON SUN
fr-
4000 5000 6000 7000 8000 WAVELENGTH -ANGSTROMS
H,(LP( = 2537-A LINE OF MERCURY DISCHARGE PREDOMINANT AT 3-4 MM PRESSURE Hq(HP)= 3650-A LINE OF MERCURY DISCHARGE PREDOMINANT AT HIGH PRESSURES
Fig. 10- Visible and near -visible spectra, with reference to the general electromagnetic spectrum.
the normal light- adapted (photopic) eye, but the scotopic eye is a much poorer detector of luminance differences (intensity contrasts)
I
COLOR N/GH AC0/7y
cc, V/S/ON , /A N.
\ \ Low ACU/7y
GOV sRÓñ gs
MI \ \ (Reos) /
\ I \\ / \l -/
.5000 6000 WAVCLENG7H IN .4
7000
Fig. 11- Thresholds of rod (sco- topic) and cone (photopic) vision as functions of wavelength and
relative energy (Sheard) .
roE
/c'
I
/c`
/0K c-- AF7[R LIMIT
iIo(IP! 0.4/ix VIS/ON
_ _UPPER LIMIT OF PNOTOO/C V/!/ON OF SNOW IN NOON SON
(PM RADAR SCREEN (ONPRO/LCT(0))
7LLEV/5 /ON CRT SULLN,OR WAVY PAPER /N GOOD READ /NO L/ON?
--- MOV/L SCRLEN
PIO RADAR SCREEN (PROJECTED)
-_- MOONL/0/? 0V TARTS
___ RAO/4N O/AL ----MN/mum 55 $0.4 P7 SCRLENS
rM¢EJNOLO OfAROTOP/C EYL MN/AWN 9, APR P7 SCRLENS SEN/TN SPY ON MOONKSS MAW?
0000 ROO OARr ADAPTATION (/OM/NUrES) - AARL/y?OV EARTH
Fig. 12- Luminance chart, accord- ing to Sheard, with additional radar luminances. The mesopic re- gion, intermediate photopic and scotopic vision, is attained gradu- ally on going to luminances below
0.1 millilamberts.
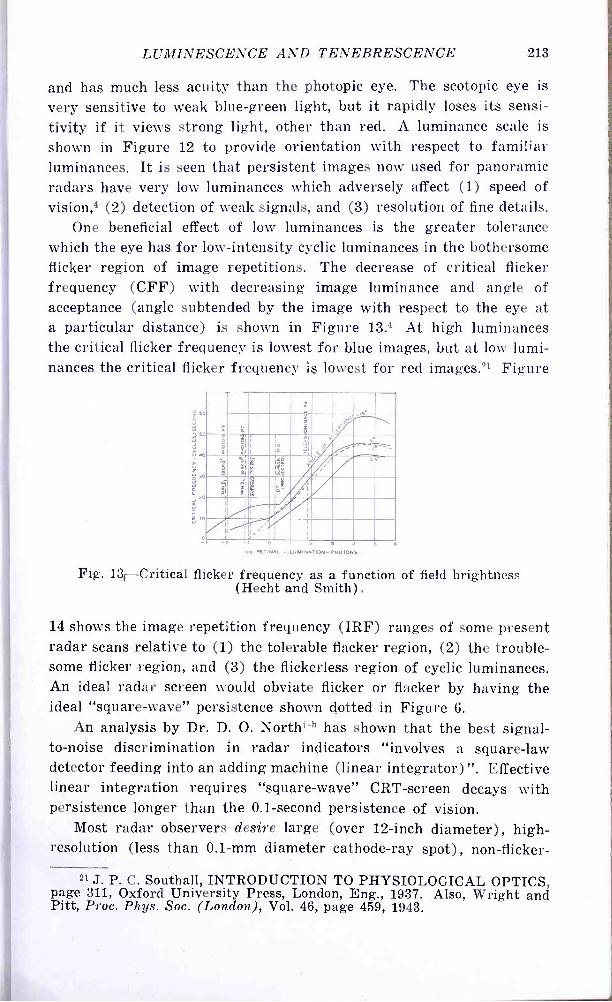
LUMINESCENCE AND TENEBR.ESCENCE 213
and has much less acuity than the photopic eye. The scotopic eye is
very sensitive to weak blue -green light, but it rapidly loses its sensi- tivity if it views strong light, other than red. A luminance scale is
shown in Figure 12 to provide orientation with respect to familiar luminances. It is seen that persistent images now used for panoramic radars have very low luminances which adversely affect (1) speed of vision,' (2) detection of weak signals, and (3) resolution of fine details.
One beneficial effect of low luminances is the greater tolerance which the eye has for low- intensity cyclic luminances in the bothersome flicker region of image repetitions. The decrease of critical flicker frequency (CFF) with decreasing image luminance and angle of acceptance (angle subtended by the image with respect to the eye at a particular distance) is shown in Figure 13.4 At high luminances the critical flicker frequency is lowest for blue images, but at low lumi- nances the critical flicker frequency is lowest for red images.'-1 Figure
ao
e0
40
j 30 O
20
; 10
,_ QA / c_'
Ei
I I WN AP ,
E ° áW I/ o. ]
iI RIVE/ .ndiltill
z 0 2 ] q RETINAL ILLUMINAT ION -PHOTONS
Fig. 13r- Critical flicker frequency as a function of field brightness (Hecht and Smith).
14 shows the image repetition frequency (IRF) ranges of some present radar scans relative to (1) the tolerable flacker region, (2) the trouble- some flicker region, and (3) the flickerless region of cyclic luminances. An ideal radar screen would obviate flicker or flacker by having the ideal "square- wave" persistence shown dotted in Figure 6.
An analysis by Dr. D. O. North -b has shown that the best signal - to -noise discrimination in radar indicators "involves a square -law detector feeding into an adding machine (linear integrator) ". Effective linear integration requires "square- wave" CRT -screen decays with persistence longer than the 0.1- second persistence of vision.
Most radar observers desire large (over 12 -inch diameter), high - resolution (less than 0.1 -mm diameter cathode -ray spot) , non -flicker-
21 J. P. C. Southall, INTRODUCTION TO PHYSIOLOGICAL OPTICS, page 311, Oxford University Press, London, Eng., 1937. Also, Wright and Pitt, Proc. Phys. Soc. (London), Vol. 46, page 459, 1943.
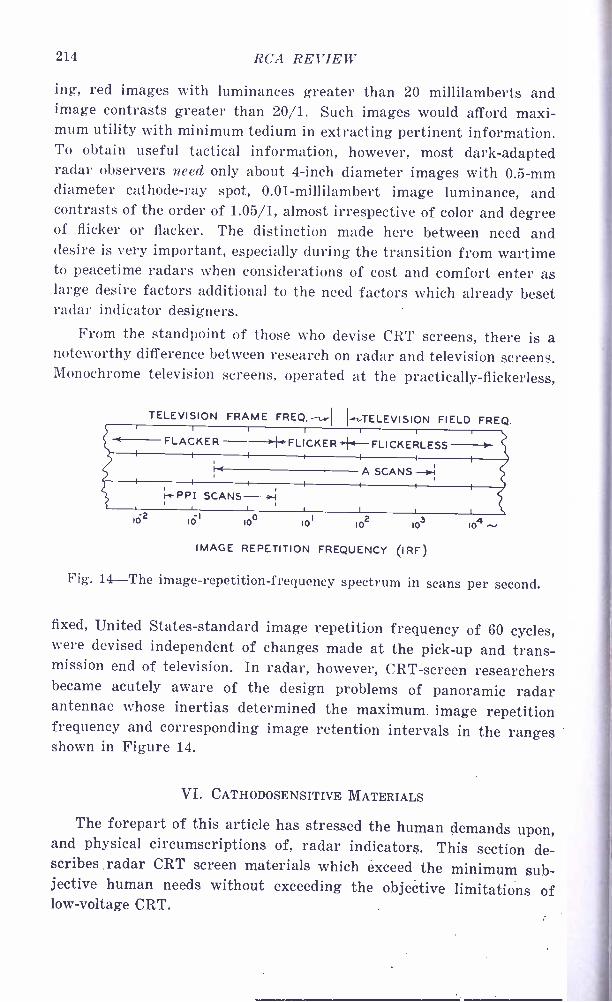
214 RCA REVIEW
ing, red images with luminances greater than 20 millilamberts and image contrasts greater than 20/1. Such images would afford maxi- mum utility with minimum tedium in extracting pertinent information. To obtain useful tactical information, however, most dark -adapted radar observers need only about 4 -inch diameter images with 0.5 -mm diameter cathode -ray spot, 0.01 -millilambert image luminance, and contrasts of the order of 1.05/1, almost irrespective of color and degree of flicker or flacker. The distinction made here between need and desire is very important, especially during the transition from wartime to peacetime radars when considerations of cost and comfort enter as large desire factors additional to the need factors which already beset radar indicator designers.
From the standpoint of those who devise CRT screens, there is a noteworthy difference between research on radar and television screens. Monochrome television screens, operated at the practically -flickerless,
TELEVISION FRAME FREQ. -s.-I (.,.TELEVISION FIELD FREQ.
-FLACKER --{. FLICKER }F-FLICKERLESS-
I A SCANS-s+
if PPI SCANS -.4 10 o io lo' io lo' 10..+
IMAGE REPETITION FREQUENCY (IRO
Fig. 14 -The image- repetition -frequency spectrum in scans per second.
fixed, United States -standard image repetition frequency of 60 cycles, were devised independent of changes made at the pick -up and trans- mission end of television. In radar, however, CRT -screen researchers became acutely aware of the design problems of panoramic radar antennae whose inertias determined the maximum image repetition frequency and corresponding image retention intervals in the ranges shown in Figure 14.
VI. CATHODOSENSITIVE MATERIALS
The forepart of this article has stressed the human demands upon, and physical circumscriptions of, radar indicators. This section de- scribes radar CRT screen materials which exceed the minimum sub- jective human needs without exceeding the objective limitations of low- voltage CRT.
LUMINESCENCE AND TENEBRESCENCE 215
General Means for Making Cathode Ray Energy Visible.
There are many proposed non -luminescence means for converting cathode ray energy into visible image traces. Among the proposals are light valves using : suspensions of opaque plate -like particles," Kerr cells,23 polarizable crystals,24 eidephors,25 intermediate -film tech - i =ryues,26 electrostatic repulsion of fine powers,27 control of critical angle of reflection,28 and scotophors.29 Other general image- forming methods include incandescence under cathode rays30 and electrolytic control of
dyeing.31 Thus far, however, only cathodoluminescence and catho-
22 a. J. S. Donal Jr., "Cathode -Ray Control of Television Light Valves ", Proc. I. R. E., Vol. 31, pp. 195 -208, 1943.
b. J. S. Donal, Jr. and D. B. Langmuir, "A Type of Light Valve for Television Reproduction ", Proc. I. R. E., Vol. 31, pp. 208 -214, 1943.
23 a. D. M. Robinson, "The Supersonic Light Control and its Application to Television with Special Reference to the Scophony Television Receiver ", Proc. I. R. E., Vol. 27, pp. 483 -496, 1939.
b. G. Otterbein, "Supersonic Light Relay in Television ", Elek. Tech. Zeit., Vol. 60, pp. 161 -163, 1939.
24 a. C. Schramm, "Ueber den Elektrooptischen Effekt an Zinkblende ", Ann. d. Physik, Vol. 25, No. 4, pp. 309 -337, 1936.
b. M. von Ardenne, "Practical Construction of Electron -Ray Storage Projection Tubes ", Telégr.- Fernspr.- Funk -u. Fernsehtech., Vol. 28, pp. 26- 27, pp. 180 -184, pp. 403 -409, 1939.
c. D. S. Loewe A. G., Brit. patent 427,092, 4/12/35. 25 a. F. Fischer, et al, "Theoretische Betrachtungen ueber ein neues
Verfahren der Fernsehgrossprojektion ", Schweiz. Arch. Wiss. Techn., Vol. 6, No. 4; Vol. 7, pp. 305 -318, pp. 337 -334; Vol. 8, pp. 15 -28, pp. 135 -143, pp. 169 -178, pp. 199 -212, pp. 299 -307, 1940 -1942.
b. W. Amrein, "Fernsehgrossprojektion ", Schweizer Archiv, Vol. 9, pp. 293 -307, 1943.
26 G. Schubert, et al, "Das Zwischenfilm- Verfahren ", Ferizseh Hausmitt, Vol. 1, No. 3, pp. 129ff, 1932; Vol. 1, No. 4, pp. 42ff, 1933; Vol. 1, No. 5, pp. 29ff, 1934; Vol. 1, No. 6, pp. 49ff, 1935; Vol. 1, No. 6, pp. 201 -210, 1939.
27 a. P. Selenyi, "über die Verwendung der negativen Ladung der Kathodenstrahlen als Schreibmittel in Kathodenstrahloszillographen ", Zeits. f. Physik, Vol. 11 -12, pp. 895 -897, 1928.
b. M. Suzuki and T. Tsuji, "Kathode -Ray Dust Oscillogram, Jour. Inst. Elec. Eng. Japan, Vol. 56, pp. 898 -902, 1936.
28 G. M. Wright, British patent 467,918, 6/23/37.
29 a. E. Goldstein, "Veber die Einwirkung von Kathodenstrahlen auf einige Salze ", Ann. d. Physik und Chemie, Vol. 54, pp. 371 -380, 1895; Vol. 60, pp. 491 -499, 1897.
b. H. Nagaoka and T. Mishima, "Coloration by Kathode Rays ", Inst. Phys. & Chem. Res., Tokyo, Sci. Papers, No. 603, pp. 77 -94, 1935.
c. A. H. Rosenthal, "A System of Large- Screen Television Reception Based on Certain Electron Phenomena in Crystals ", Proc. I. R. E., Vol. 28, pp. 203 -212, 1940.
39 a. R. C. Clinckei and L. J. Davies, British patent 378,397, 8/4/32. b. J. L. Baird, British patent 442,963, 2/17/36. 31 a. V. Bausch, Jr., German patent 591,455, 1/22/34. b. H. Cunningham, U. S. patent 2,012,270, 8/27/35.
216 RCA REVIEW
dotenebrescence have found practical application in radar. Of these, cathodoluminescence is unique in requiring only the primary cathode - ray beam for practical operation over a wide range of image repetition frequencies from about 0.01 to 2000 or more scans per second. The phenomenal scope of phosphors in being able to convert a wide energy range of either corpuscular or undulatory excitants into the 1.5- electron- volt -wide visible region of the spectrum is depicted in Figure 15 (see opposite page.) Cathodotenebrescence is probably the least cumbersome of the other listed possibilities, requiring only a strong extraneous source of light and heat in addition to the primary cathode - ray beam. Present cathodotenebrescent radar CRT screens, however, are limited to image repetition frequencies slower than about 0.1 scan per second and are restricted to land or ship radars where additional bulk and kilowatts of power are not unduly detrimental.
Hypothetical Ideal Performances of Phosphors and Scotophors. Assuming only cathodoluminescent or cathodotenebrescent screens,
it is interesting to calculate some maximum bright -trace luminances or dark -trace contrasts obtainable in hypothetical perfect screens allowing 100 per cent efficiency and ideal square -wave decays lasting exactly one scan interval.
1. Positively - modulated i -k cathodoluminescent (bright-trace) screens. Since 1 erg /second = 10 -' watts = 10 -' X (650 lumens) ,32 and 1 lumen /square millimeter (mm2) = 105 millilambert (mL), then 1 erg /mm2 second = 6.5 mL at 100 per cent efficiency. This may be ex- pressed as
L,= 6.5 Ex /t8 (mL) (1) where L , is the maximum square -wave luminance (in mL),
v-k The light outputs of phosphors may be modulated in the three fol- lowing modes, according to their temperature dependence characteristics of light output (Fig. 15 of reference 4) :
1. Positive modulation of luminescence is the normal increase of lumi- nescence with increasing excitation density at temperatures below the fairly critical temperature (T0) above which the efficiency of luminescence sharply decreases. 2. Negative modulation of luminescence is accomplished by increasing the temperature of an excited phosphor above To and thereby decreasing the luminescence. 3. Positive modulation of incandescence is accomplished by further raising the temperature of the phosphor until incandescence supplants luminescence. Typical temperature- dependence curves of the luminescences of phos- phors are shown in Figures 28 -31. 32 Committee on Colorimetry, Jour. Opt. Soc. Amer:, Vol. 33, pp. 534-
543, 1943, Vol. 34, pp. 183 -218, pp. 245 -266, 1944.
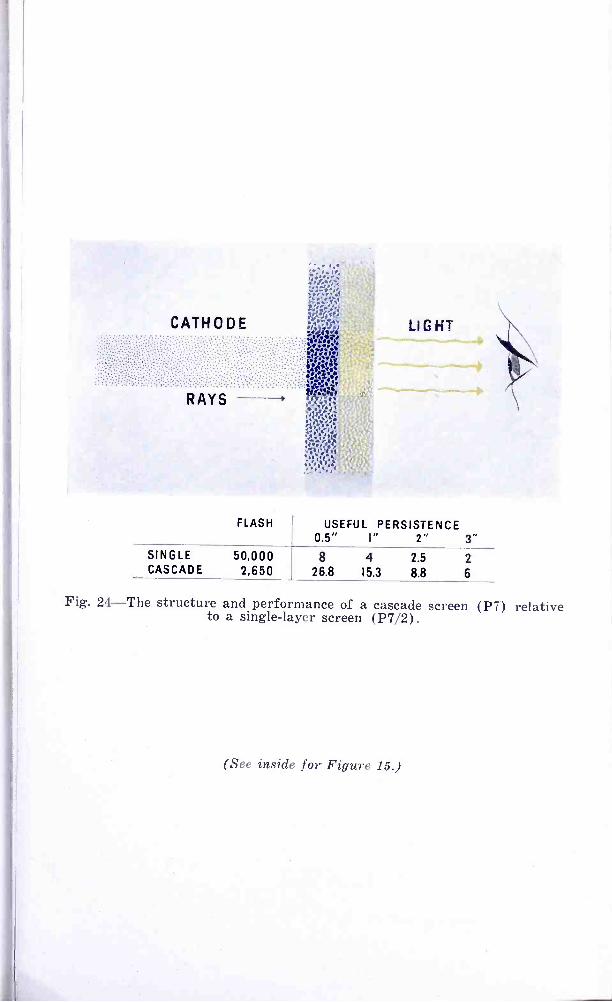
CATHODE
RAYS
LIGHT
FLASH USEFUL PERSISTENCE 0.5" 1" 2" 3"
SINGLE CASCADE
50,000 2,650
8 26.8
4 15.3
2.5
8.8 2
6
Fig. 24 -The structure and performance of a cascade screen (P7) relative to a single -layer screen (P7/2).
(See inside for Figure 15.)
216 RCA REVIEW
dotenebrescence have found practical application in radar. Of these, cathodoluminescence is unique in requiring only the primary cathode - ray beam for practical operation over a wide range of image repetition frequencies from about 0.01 to 2000 or more scans per second. The phenomenal scope of phosphors in being able to convert a wide energy range of either corpuscular or undulatory excitants into the 1.5- electron- volt -wide visible region of the spectrum is depicted in Figure 15 (see opposite page.) Cathodotenebrescence is probably the least cumbersome of the other listed possibilities, requiring only a strong extraneous source of light and heat in addition to the primary cathode - ray beam. Present cathodotenebrescent radar CRT screens, however, are limited to image repetition frequencies slower than about 0.1 scan per second and are restricted to land or ship radars where additional bulk and kilowatts of power are not unduly detrimental.
Hypothetical Ideal Performances of Phosphors and Scotophors. Assuming only cathodoluminescent or cathodotenebrescent screens,
it is interesting to calculate some maximum bright -trace luminances or dark -trace contrasts obtainable in hypothetical perfect screens allowing 100 per cent efficiency and ideal square -wave decays lasting exactly one scan interval.
1. Posit ively - modulated T -k cathodoluminescent (brig ht-trace) screens. Since 1 erg /second = 10 -' watts = 10 -' X (650 lumens) ,32 and 1 lumen /square millimeter (mm2) = 105 millilambert (mL), then 1 erg /mm2 second = 6.5 mL at 100 per cent efficiency. This may be ex- pressed as
L , = 6.5 Ex /t8 (mL) (1) where L , is the maximum square -wave luminance (in mL),
-k The light outputs of phosphors may be modulated in the three fol- lowing modes, according to their temperature dependence characteristics of light output (Fig. 15 of reference 4) :
1. Positive modulation of luminescence is the normal increase of lumi- nescence with increasing excitation density at temperatures below the fairly critical temperature (To) above which the efficiency of luminescence sharply decreases. 2. Negative modulation of luminescence is accomplished by increasing the temperature of an excited phosphor above To and thereby decreasing the luminescence. 3. Positive modulation of incandescence is accomplished by further raising the temperature of the phosphor until incandescence supplants
luminescence. Typical temperature- dependence curves of the luminescences of phos- phors are shown in Figures 28 -31. 32 Committee on Colorimetry, Jour. Opt. Soc. Amer., Vol. 33, pp. 534-
543, 1943, Vol. 34, pp. 183 -218, pp. 245 -266, 1944.
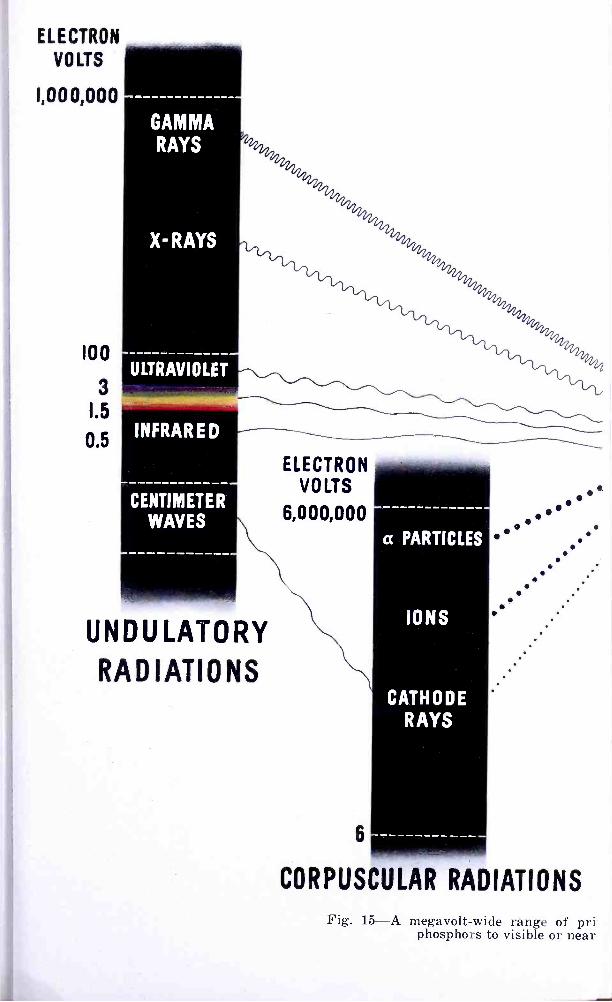
a PARTICLES
IONS
CATHODE RAYS
ELECTRON
VOLTS
1,000,000
I00
3
I.5
0.5
GAMMA RAYS
X- RAYS
ULTRAVIOLET
INFRARED
CENTIMETER WAVES
ELECTRON VOLTS
6,000,000
UNDULATORY
RADIATIONS
6
CORPUSCULAR RADIATIONS
o
Fig. 15 -A megavolt -wide range ut pri phosphors to visible or near
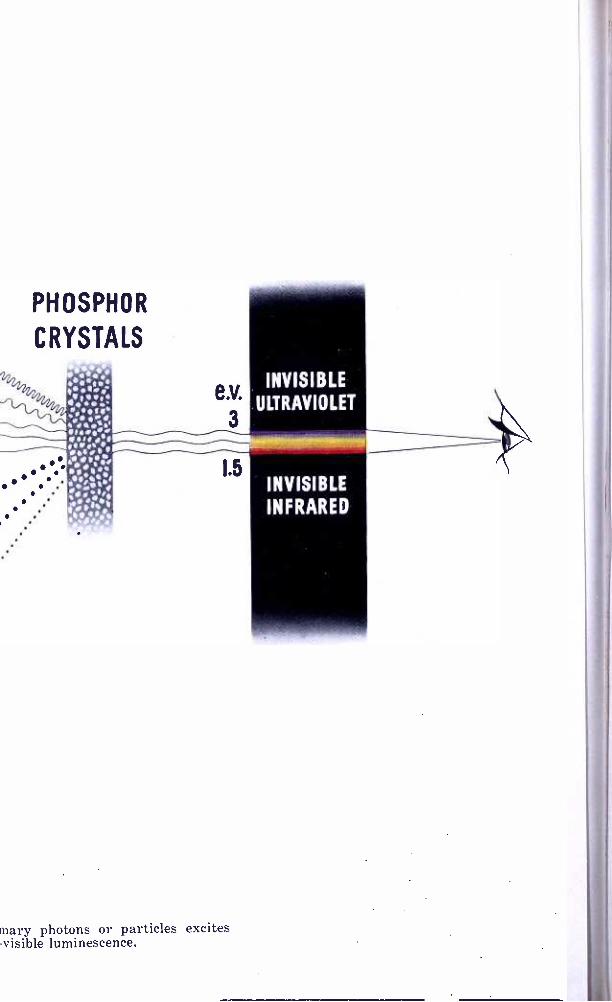
PHOSPHOR
CRYSTALS
INVISIBLE ULTRAVIOLET
INVISIBLE INFRARED
mary photons or particles excites -visible luminescence.
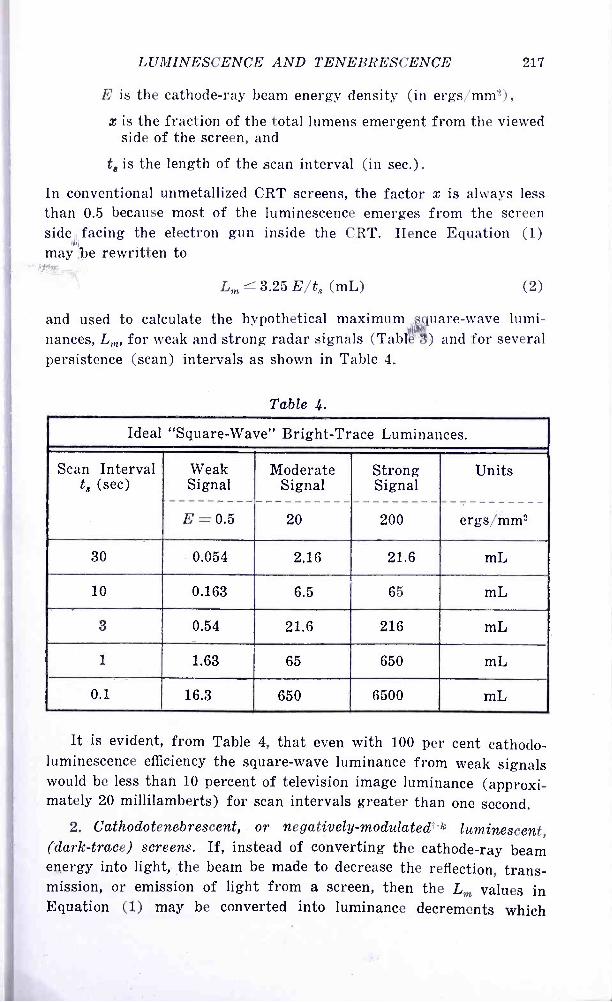
i
LUMINESCENCE AND TENEBRESCENCE 217
E is the cathode -ray beam energy density (in ergs/mm'), x is the fraction of the total lumens emergent from the viewed
side of the screen, and
to is the length of the scan interval (in sec.).
In conventional unmetallized CRT screens, the factor x is always less than 0.5 because most of the luminescence emerges from the screen side,, facing the electron gun inside the CRT. Hence Equation (1) may 3:,e rewritten to
L,n 3.25 E/t8 (mL) (2)
and used to calculate the hypothetical maximum nances, Lm, for weak and strong radar signals (Tabl persistence (scan) intervals as shown in Table 4.
Table 4.
:.
uare -wave lumi- ) and for several
Ideal "Square- Wave" Bright -Trace Luminances.
Scan Interval t3 (sec)
Weak Signal
E = 0.5
Moderate Signal
20
Strong Signal
200
Units
ergs /mm=
30 0.054 2.16 21.6 mL
10 0.163 6.5 65 mL
3 0.54 21.6 216 mL
1 1.63 65 650 mL
0.1 16.3 650 6500 mL
It is evident, from Table 4, that even with 100 per cent cathodo- luminescence efficiency the square -wave luminance from weak signals would be less than 10 percent of television image luminance (approxi- mately 20 millilamberts) for scan intervals greater than one second.
2. Cathodotenebrescent, or negatively- modulatedt-k luminescent, (dark- trace) screens. If, instead of converting the cathode -ray beam energy into light, the beam be made to decrease the reflection, trans- mission, or emission of light from a screen, then the Lm values in Equation (1) may be converted into luminance decrements which
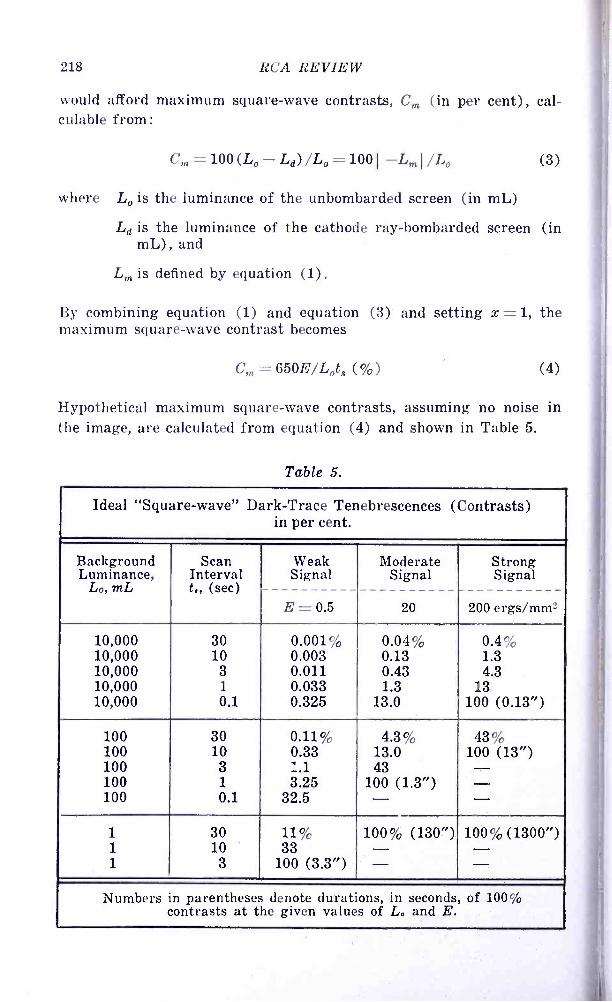
218 RCA REVIEW
would afford maximum square -wave contrasts, C. (in per cent), cal- culable from:
C,,, =100 (Lo - Ld) /Lo =100 I -L,n I /Lo (3)
where Lo is the luminance of the unbombarded screen (in mL)
Ld is the luminance of the cathode ray- bombarded screen (in mL) , and
L. is defined by equation (1).
By combining equation (1) and equation (3) and setting x =1, the maximum square -wave contrast becomes
C,,, = 650E/Lot, (%) (4)
Hypothetical maximum square -wave contrasts, assuming no noise in the image, are calculated from equation (4) and shown in Table 5.
Table 5.
Ideal "Square- wave" Dark -Trace Tenebrescences (Contrasts) in per cent.
Background Scan Weak Moderate Strong Luminance,
Lo, mL Interval t., (sec)
Signal Signal Signal
E = 0.5 20 200 ergs /mm2
10,000 30 0.001% 0.04% 0.4% 10,000 10 0.003 0.13 1.3 10,000 3 0.011 0.43 4.3 10,000 1 0.033 1.3 13 10,000 0.1 0.325 13.0 100 (0.13 ")
100 30 0.11% 4.3% 43% 100 10 0.33 13.0 100 (13 ") 100 3 1.1 43 - 100 1 3.25 100 (1.3 ") - 100 0.1 32.5 - -
1 30 11% 100% (130 ") 100% (1300 ") 1 10 33 - - 1 3 100 (3.3 ") - -
Numbers in parentheses denote durations, in seconds, of 100% contrasts at the given values of L. and E.
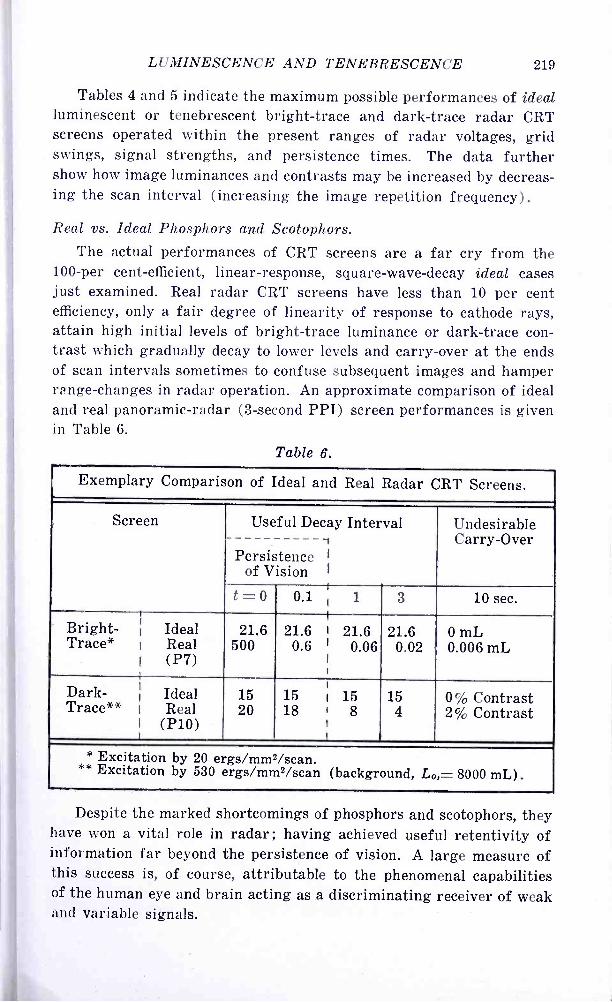
LUMINESCENCE AND TENEBRESCENCE 219
Tables 4 and 5 indicate the maximum possible performances of ideal luminescent or tenebrescent bright -trace and dark -trace radar CRT screens operated within the present ranges of radar voltages, grid swings, signal strengths, and persistence times. The data further show how image luminances and contrasts may be increased by decreas- ing the scan interval (increasing the image repetition frequency) .
Real vs. Ideal Phosphors and Scotophors. The actual performances of CRT screens are a far cry from the
100 -per cent- efficient, linear- response, square- wave -decay ideal cases just examined. Real radar CRT screens have less than 10 per cent efficiency, only a fair degree of linearity of response to cathode rays, attain high initial levels of bright -trace luminance or dark -trace con- trast which gradually decay to lower levels and carry -over at the ends of scan intervals sometimes to confuse subsequent images and hamper range- changes in radar operation. An approximate comparison of ideal and real panoramic -radar (3- second PPI) screen performances is given in Table 6.
Table 6.
Exemplary Comparison of Ideal and Real Radar CRT Screens.
Screen Useful Decay Interval -1
Undesirable Carry -Over
Persistence I
of Vision
t =0 0.1 1 3 10 sec. ' 1
Bright- ¡ Ideal 21.6 21.6 21.6 21.6 0 mL Trace* i Real 500 0.6 0.06 0.02 , 0.006 mL
I (P7) a '
Dark- ¡ Ideal 15 15 i 15 15 0% Contrast Trace ** Real 20 18 8 4 2% Contrast (P10)
* Excitation by 20 ergs /mm2 /scan. ** Excitation by 530 ergs /mm2 /scan (background, Lo,= 8000 mL).
Despite the marked shortcomings of phosphors and scotophors, they have won a vital role in radar; having achieved useful retentivity of information far beyond the persistence of vision. A large measure of this success is, of course, attributable to the phenomenal capabilities of the human eye and brain acting as a discriminating receiver of weak and variable signals.

220 RCA REVIEW
Real Phosphors and Scotophors.
All the efficient CRT screens comprise crystalline inorganic mate- rials whose well -ordered structures, serve as (1) suspensions for a
--01 hi"- 1 MICRON
Fig. 16- Electron micrograph of very fine a- Zn_SiO4:Mn (Special P1).
sparse population of special imperfections which are required to afford visible luminescence or tenebrescence, and (2) efficient means for trans- mitting energy to and from these imperfections. The wide range of appearances and sizes of phosphor crystals is shown in Figures 16
-11h 2.5 MICRONS.
Fig. 17- Photomicrograph of ß * -ZnS :Ag (P7 /1) .
and 17. These micrographs show that phosphor crystals may be pro- duced with dimensions ranging from less than 0.1 micron to over 30
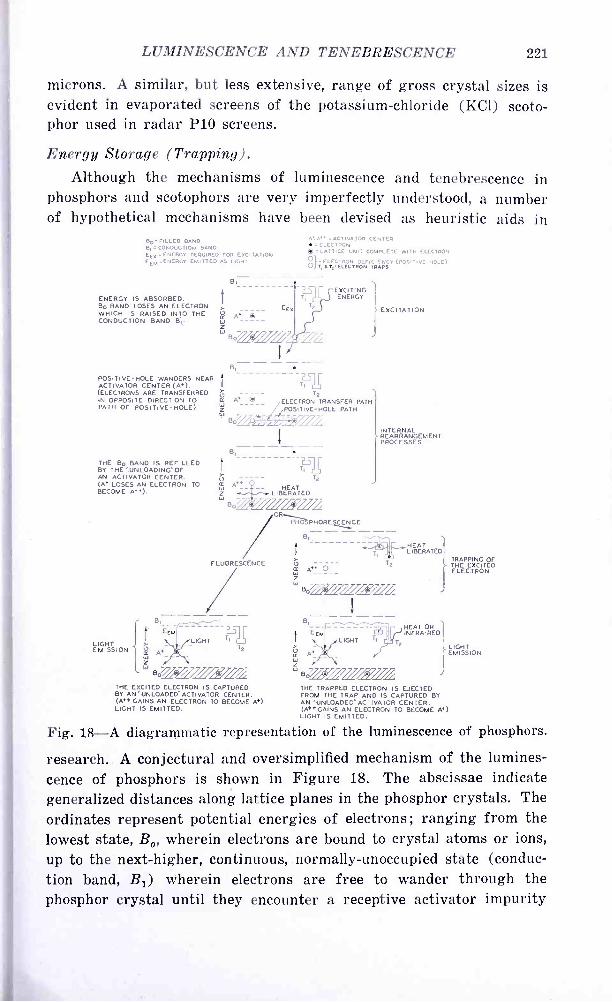
LUMINESCENCE AND TENEBRESCENCE 221
microns. A similar, but less extensive, range of gross crystal sizes is evident in evaporated screens of the potassium -chloride (KC1) scoto- phor used in radar P10 screens.
Energy Storage (Trapping). Although the mechanisms of luminescence and tenebrescence in
phosphors and scotophors are very imperfectly understood, a number of hypothetical mechanisms have been devised as heuristic aids in
BO - FILLED BAND 8, = CONDUCTION BAND EEX = ENERGY REQUIRED FOR EXCITATION EEM=ENERGY EMITTED AS LIGHT
ENERGY IS ABSORBED. Bo BAND LOSES AN ELECTRON WHICH IS RAISED INTO THE CONDUCTION BAND B1.
B,
A
= ACTIVATOR CENTER = ELECTRON
O= LATTICE UNIT COMPLETE WITH ELECTRON
TRON OJ T, 6T 'EL CTRONF ITRAPSY
(POSITIVE-HOLE)
POSITIVE-HOLE WANDERS NEAR fi ACTIVATOR CENTER (AR).
(ELECTRONS ARE TRANSFERRED 6" T2 IN OPPOSITE DIRECTION TO R A+ (: ) ELECTRON TRANSFER PATH PATH OF POSITIVE -HOLE). Z T -HOLE PATH
W BO/ /i - 1L
EXCI TING ENERGY
THE Bo BAND IS REFILLED BY 7HE ".UNLOADING "OF AN ACTIVATOR CENTER. (A+ LOSES AN ELECTRON TO BECOME A + +).
LIGHT EMISSION
W
W Z
B,
EEL.
TI T2
HEAT LIBERATED == OR
PHO PHORECE BI
FLUORESCENCE O +a p 2
LIGHT
Bo1Ly1L/ii.1L THE EXCITED ELECTRON IS CAPTURED BY AN "UNLOADED "ACTIVATOR CENTER. (A ++ GAINS AN ELECTRON TO BECOME A +) LIGHT IS EMITTED.
EXCITATION
INTERNAL REARRANGEMENT PROCESSES
2
W o7Zi=1-= ! B------
I
EE. LIGHT
á W
/r) //% 7// B611J'///J11L
T2
HAT LIBEERATED
HEAT OR INFRARED
THE TRAPPED ELECTRON IS EJECTED FROM THE TRAP AND IS CAPTURED BY AN "UNLOADED "ACTIVATOR CENTER. (A+ +GAINS AN ELECTRON TO BECOME A +) LIGHT IS EMITTED.
TRAPPING OF THE EXCITED ELECTRON
LIGHT EMISSION
Fig. 18 -A diagrammatic representation of the luminescence of phosphors.
research. A conjectural and oversimplified mechanism of the lumines- cence of phosphors is shown in Figure 18. The abscissae indicate generalized distances along lattice planes in the phosphor crystals. The ordinates represent potential energies of electrons; ranging from the lowest state, B0, wherein electrons are bound to crystal atoms or ions, up to the next -higher, continuous, normally-unoccupied state (conduc- tion band, B1) wherein electrons are free to wander through the phosphor crystal until they encounter a receptive activator impurity
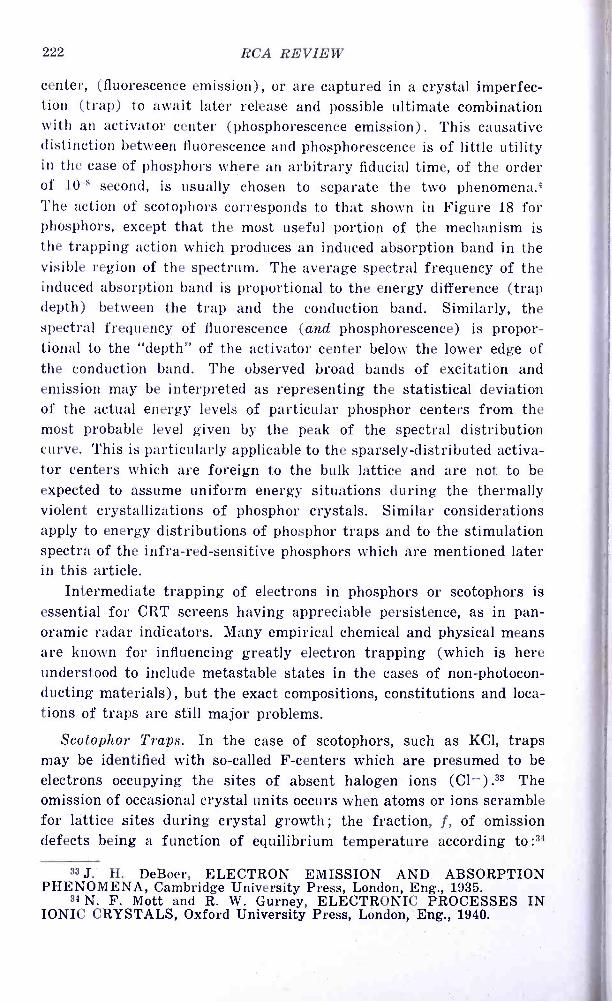
222 RCA REVIEW
center, (fluorescence emission), or are captured in a crystal imperfec- tion (trap) to await later release and possible ultimate combination with an activator center (phosphorescence emission) . This causative distinction between fluorescence and phosphorescence is of little utility in the case of phosphors where an arbitrary fiducial time, of the order of 10 -8 second, is usually chosen to separate the two phenomena.' The action of scotophors corresponds to that shown in Figure 18 for phosphors, except that the most useful portion of the mechanism is the trapping action which produces an induced absorption band in the visible region of the spectrum. The average spectral frequency of the induced absorption band is proportional to the energy difference (trap depth) between the trap and the conduction band. Similarly, the spectral frequency of fluorescence (and phosphorescence) is propor- tional to the "depth" of the activator center below the lower edge of the conduction band. The observed broad bands of excitation and emission may be interpreted as representing the statistical deviation of the actual energy levels of particular phosphor centers from the most probable level given by the peak of the spectral distribution curve. This is particularly applicable to the sparsely- distributed activa- tor centers which are foreign to the bulk lattice and are not to be expected to assume uniform energy situations during the thermally violent crystallizations of phosphor crystals. Similar considerations apply to energy distributions of phosphor traps and to the stimulation spectra of the infra -red -sensitive phosphors which are mentioned later in this article.
Intermediate trapping of electrons in phosphors or scotophors is essential for CRT screens having appreciable persistence, as in pan- oramic radar indicators. Many empirical chemical and physical means are known for influencing greatly electron trapping (which is here understood to include metastable states in the cases of non- photocon- ducting materials), but the exact compositions, constitutions and loca- tions of traps are still major problems.
Scotophor Traps. In the case of scotophors, such as KC1, traps may be identified with so- called F- centers which are presumed to be electrons occupying the sites of absent halogen ions (CI -).33 The omission of occasional crystal units occurs when atoms or ions scramble for lattice sites during crystal growth; the fraction, f, of omission defects being a function of equilibrium temperature according to :34
33 J. H. DeBoer, ELECTRON EMISSION AND ABSORPTION PHENOMENA, Cambridge University Press, London, Eng., 1935.
34 N. F. Mott and R. W. Gurney, ELECTRONIC PROCESSES IN IONIC CRYSTALS, Oxford University Press, London, Eng., 1940.
LUMINESCENCE AND TENEBRESCENCE 223
f = AE-Wo/kT (5)
where A is a constant ( 104 for KC1),
W. is the work required to form a vacant lattice site at T = 0 (in ergs),
(Wo 1.6 X 10 -12 erg for KCl)
k = 1.38 X 10 -16 erg /degree, and T is the equilibrium temperature, in degrees Kelvin.
At temperatures near the melting point of KCl (melting point = 1074 °K), f becomes about 0.2 and it is reasonable to assume that many of the omission defects are frozen -in when KC1 is evaporated and condensed on a cool glass surface as is done in making P10 screens. Hence, one might expect a large number of the 3.2 X 10²² lattice sites /cm3 in P10- screen crystals to be empty, and half of these omission defects are potential F- centers. Calculations from experimental data on the intensity of cathodotenebrescence show that the number of F- centers /cubic centimeter may be of the order of 1018 in P10- screens operated near room temperature.t-b This corresponds to an F- center concentration of about 0.01 per cent which is comparable with the normal activator concentrations in sulphide -type phosphors, but is only about one one -hundredth of the normal activator concentration in silicate- (fluoride -) type phosphors.
The decay of tenebrescence, C, of KCl is a power -law relation of the type:
C = Cot-n (6)
where Co is the tenebrescence or contrast [Equation (3) ] at time t = 0 and n decreases from about 1.5 to less than 0.1 with decreasing temperature or intensity of illumination and with increasing degree of tenebrescence (contrast) .t-1
Phosphor Traps. Phosphors may be broadly classified, according to phosphorescence, as (1) sulphide- (selenide -) type (usually t -n- decay) , and (2) silicate- (fluoride -) type (usually a -t- decay) .7
1. The crystalline state of sulphide -type phosphors markedly affects phosphorescence, as evidenced by the longer and brighter phosphores- cence of ß *- ZnS:Cu (above 1020 °C)35 contrasted with a *- ZnS:Cu
t -1 Measurements by Drs. R. W. Hull, H. J. Kelly, and W. D. Hope of
the Radiation Laboratory (M.I.T.) , as reported in t -b. 35 E. T. Allen & J. L. Crenshaw, "The Sulphides of Zinc, Cadmium, and
Mercury; their Crystalline Forms and Genetic Conditions ", Amer. Jour. of Sei., Vol. 34, pp. 341 -361, 1912.
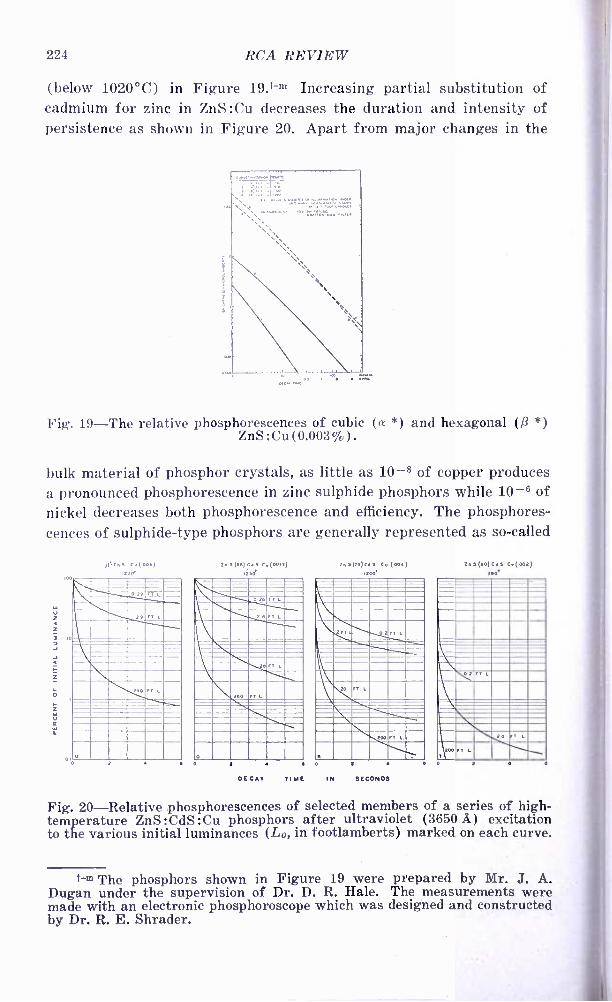
224 RCA REVIEW
(below 1020 °C) in Figure 19.t -Ill Increasing partial substitution of cadmium for zinc in ZnS :Cu decreases the duration and intensity of persistence as shown in Figure 20. Apart from major changes in the
'"' f7;7 ... . .-......- _.. .
Fig. 19 -The relative phosphorescences of cubic (a *) and hexagonal (ß *) ZnS:Cu(0.003 %).
bulk material of phosphor crystals, as little as 10 -8 of copper produces a pronounced phosphorescence in zinc sulphide phosphors while 10 -6 of nickel decreases both phosphorescence and efficiency. The phosphores- cences of sulphide -type phosphors are generally represented as so- called
ioo
10
p::., C.(oo,) ,22d
in3(.C., c (00, i=0
Zn,(A(C., Cu (00. i200*
z FT L
FT L
O
02 FT L
200 FT L.
2 0 2
OECT TIME IN SECONDS
2e 0 (00) C. 0' c. (.002) usó
02 FT L
10 FT L
200 FT L.
0 2
Fig. 20- Relative . phosphorescences of selected members of a series of high - temperature ZnS :CdS :Cu phosphors after ultraviolet (3650 A) excitation to the various initial luminances (Lo, in footlamberts) marked on each curve.
t -m The phosphors shown in Figure 19 were prepared by Mr. J. A. Dugan under the supervision of Dr. D. R. Hale. The measurements were made with an electronic phosphoroscope which was designed and constructed by Dr. R. E. Shrader.
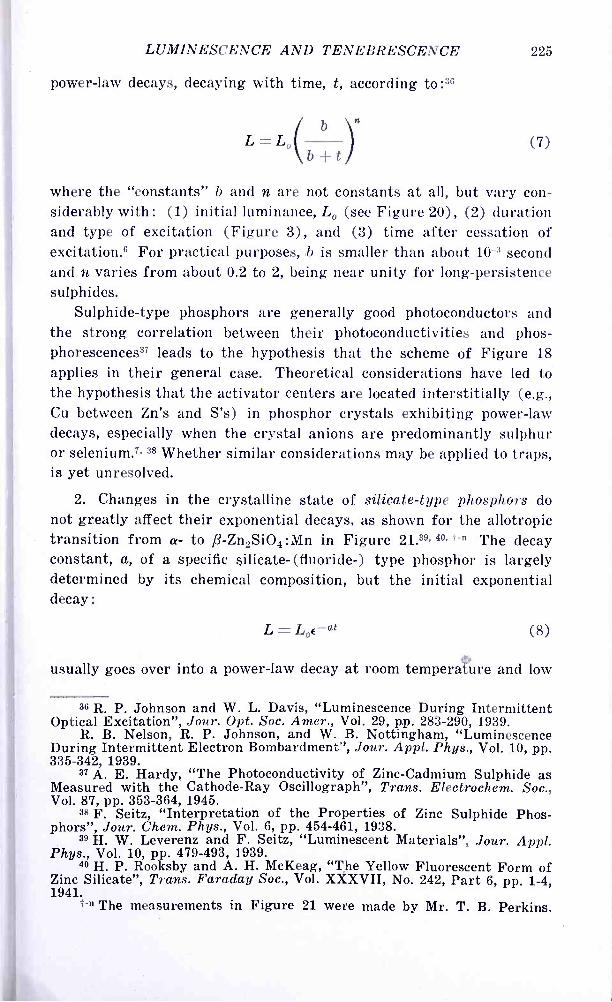
LUMINESCENCE AND TENEBRESCENCE 225
power -law decays, decaying with time, t, according to :36
L = Lo b "
b -- t (7)
where the "constants" b and n are not constants at all, but vary con- siderably with: (1) initial luminance, Lo (see Figure 20), (2) duration and type of excitation (Figure 3), and (3) time after cessation of excitation.° For practical purposes, ,b is smaller than about 10 -3 second and n varies from about 0.2 to 2, being near unity for long -persistence sulphides.
Sulphide -type phosphors are generally good photoconductors and the strong correlation between their photoconductivities and phos- phorescences37 leads to the hypothesis that the scheme of Figure 18 applies in their general case. Theoretical considerations have led to the hypothesis that the activator centers are located interstitially (e.g., Cu between Zn's and S's) in phosphor crystals exhibiting power -law decays, especially when the crystal anions are predominantly sulphur or selenium.7- 38 Whether similar considerations may be applied to traps, is yet unresolved.
2. Changes in the crystalline state of silicate -type phosphors do not greatly affect their exponential decays, as shown for the allotropic transition from a- to ß- Zn2SiO4:Mn in Figure 21.36.4°. t -n The decay constant, a, of a specific silicate - (fluoride -) type phosphor is largely determined by its chemical composition, but the initial exponential decay:
L = Loe-at (8)
usually goes over into a power -law decay at room temperature and low
36 R. P. Johnson and W. L. Davis, "Luminescence During Intermittent Optical Excitation ", Jour. Opt. Soc. Amer., Vol. 29, pp. 283 -290, 1939.
R. B. Nelson, R. P. Johnson, and W. B. Nottingham, "Luminescence During Intermittent Electron Bombardment ", Jour. Appl. Phys., Vol. 10, pp. 335 -342, 1939.
37 A. E. Hardy, "The Photoconductivity of Zinc -Cadmium Sulphide as Measured with the Cathode -Ray Oscillograph ", Trans. Electrochem. Soc., Vol. 87, pp. 353 -364, 1945.
38 F. Seitz, "Interpretation of the Properties of Zinc Sulphide Phos- phors", Jour. Chem. Phys., Vol. 6, pp. 454 -461, 1938.
39 H. W. Leverenz and F. Seitz, "Luminescent Materials ", Jour. Appl. Phys., Vol. 10, pp. 479 -493, 1939.
49 H. P. Rooksby and A. H. McKeag, "The Yellow Fluorescent Form of Zinc Silicate ", Trans. Faraday Soc., Vol. XXXVII, No. 242, Part 6, pp. 1 -4, 1941.
t-n The measurements in Figure 21 were made by Mr. T. B. Perkins.
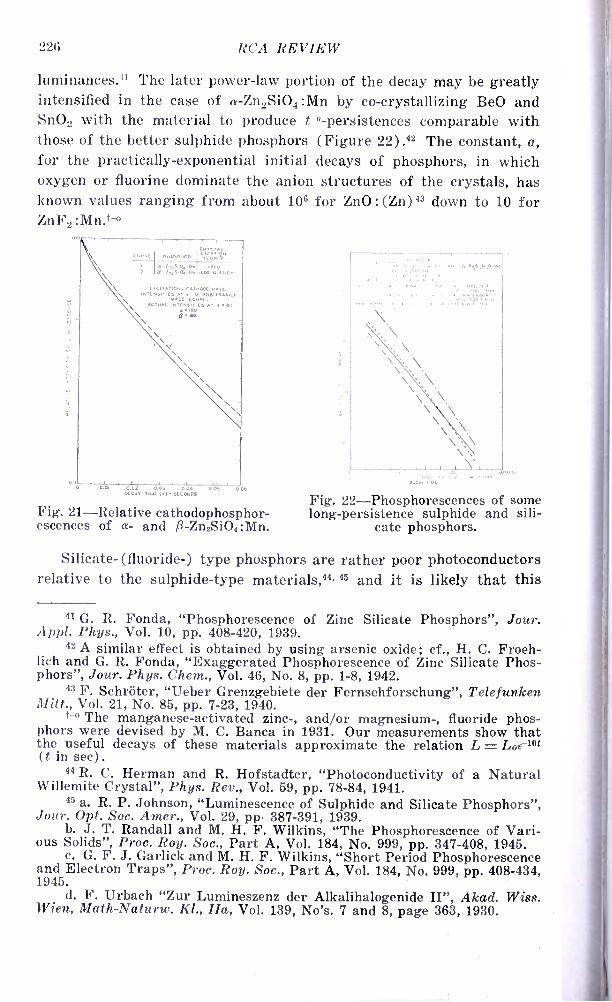
226 RCA REVIEW
luminances.11 The later power -law portion of the decay may be greatly intensified in the case of a- Zn2SiO4:Mn by co- crystallizing Be0 and Sn02 with the material to produce t persistences comparable with those of the better sulphide phosphors (Figure 22).42 The constant, a, for the practically -exponential initial decays of phosphors, in which oxygen or fluorine dominate the anion structures of the crystals, has known values ranging from about 106 for ZnO : (Zn) 43 down to 10 for Zn F2 :Mn.t -°
0 iO
Fig. 21- escences
Piil^LN VC PNOSPHOP I i(MP Q
Fig. 22- long -persistence
some sili-
\\\ \ \ \
\ \ \ \ \ \' \ L.
P-I.50..1 i200 a Q1..50.'.M. i6WOVCr3CN
\ ( CI ATiON CATHODE UAL!.
NT CNSTZES AT l=0 ANBI IPAPILI ADC EOUAL^
ACTUAL NTENSiTiCS T 1=0: 00
p=eo
\
\\\
\
DC4r TiUC'U
Phosphorescences of sulphide and
cate phosphors.
0.03 0.02 0.0) 0.04 0.05 0.06 DECAT TIME (L)- SECONDS
Relative cathodophosphor- of a- and ß- Zn2SiO4:Mn.
Silicate- (fluoride-) type phosphors are rather poor photoconductors relative to the sulphide -type materials,44. 45 and it is likely that this
41 G. R. Fonda, "Phosphorescence of Zinc Silicate Phosphors ", Jour. Appl. Phys., Vol. 10, pp. 408 -420, 1939.
42 A similar effect is obtained by using arsenic oxide; cf., H. C. Froeh- lich and G. R. Fonda, "Exaggerated Phosphorescence of Zinc Silicate Phos- phors", Jour. Phys. Chem., Vol. 46, No. 8, pp. 1 -8, 1942.
43 F. Schröter, "Ueber Grenzgebiete der Fernsehforschung ", Telefunken Mitt., Vol. 21, No. 85, pp. 7 -23, 1940.
t-o The manganese- activated zinc -, and /or magnesium -, fluoride phos- phors were devised by M. C. Banca in 1931. Our measurements show that the useful decays of these materials approximate the relation L = Loi lot (t in sec).
44 R. C. Herman and R. Hofstadter, "Photoconductivity of a Natural Willemite Crystal ", Phys. Rev., Vol. 59, pp. '78-84, 1941.
4' a. R. P. Johnson, "Luminescence of Sulphide and Silicate Phosphors ", Jour. Opt. Soc. Amer., Vol. 29, pp. 387 -391, 1939.
b. J. T. Randall and M. H. F. Wilkins, "The Phosphorescence of Vari- ous Solids ", Proc. Roy. Soc., Part A, Vol. 184, No. 999, pp. 347 -408, 1945.
c. G. F. J. Garlick and M. H. F. Wilkins, "Short Period Phosphorescence and Electron Traps ", Proc. Roy. Soc., Part A, Vol. 184, No. 999, pp. 408 -434, 1945.
d. F. Urbach "Zur Lumineszenz der Alkalihalogenide II ", Akad. Wiss. Wien, Math -Naturw. Kl., lla, Vol. 139, No's. 7 and 8, page 363, 1930.
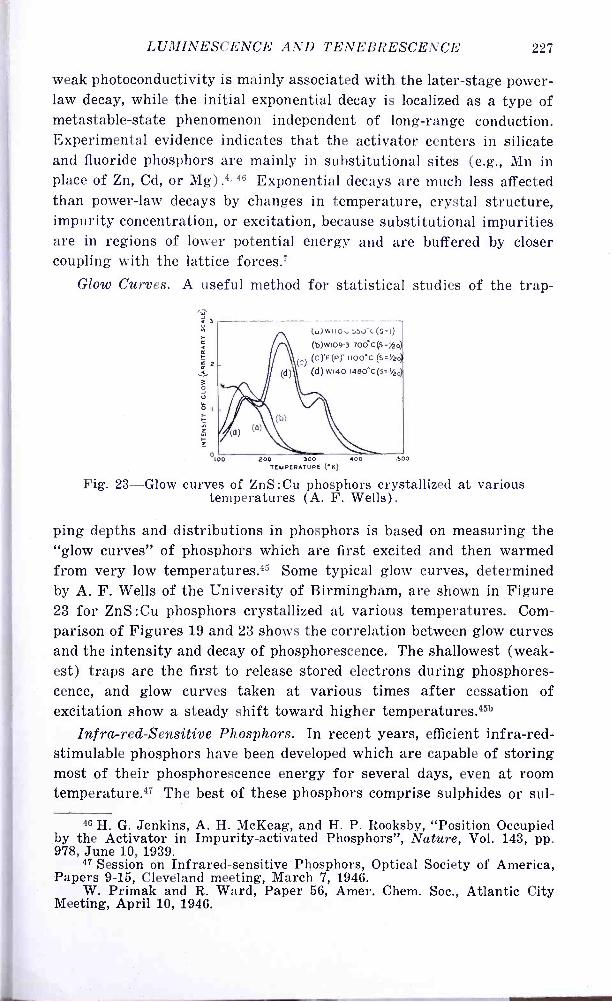
LUMINESCENCE AND TENEBRESCENCE 227
weak photoconductivity is mainly associated with the later -stage power - law decay, while the initial exponential decay is localized as a type of metastable -state phenomenon independent of long -range conduction. Experimental evidence indicates that the activator centers in silicate and fluoride phosphors are mainly in substitutional sites (e.g., Mn in place of Zn, Cd, or Mg) .4, 96 Exponential decays are much less affected than power -law decays by changes in temperature, crystal structure, impurity concentration, or excitation, because substitutional impurities are in regions of lower potential energy and are buffered by closer coupling with the lattice forces.'
Glow Curves. A useful method for statistical studies of the trap-
(a) WIIO `.5J-C(S=1)
(b)W109-3 700. C(S=%20)
(CTF(P)' 1100'C (S=1/20
(d) W140 1480°C(5= 1/2
200 300 400 TEMPERATURE ( *1()
500
Fig. 23 -Glow curves of ZnS : Cu phosphors crystallized at various temperatures (A. F. Wells).
ping depths and distributions in phosphors is based on measuring the "glow curves" of phosphors which are first excited and then warmed from very low temperatures.45 Some typical glow curves, determined by A. F. Wells of the University of Birmingham, are shown in Figure 23 for ZnS : Cu phosphors crystallized at various temperatures. Com- parison of Figures 19 and 23 shows the correlation between glow curves and the intensity and decay of phosphorescence. The shallowest (weak- est) traps are the first to release stored electrons during phosphores- cence, and glow curves taken at various times after cessation of excitation show a steady shift toward higher temperatures.45b
Infra -red- Sensitive Phosphors. In recent years, efficient infra -red- stimulable phosphors have been developed which are capable of storing most of their phosphorescence energy for several days, even at room temperature.47 The best of these phosphors comprise sulphides or sul-
46 H. G. Jenkins, A. H. McKeag, and H. P. Rooksby, "Position Occupied by the Activator in Impurity- activated Phosphors ", Nature, Vol. 143, pp. 978, June 10, 1939.
47 Session on Infrared -sensitive Phosphors, Optical Society of America, Papers 9 -15, Cleveland meeting, March 7, 1946.
W. Primak and R. Ward, Paper 56, Amer. Chem. Soc., Atlantic City Meeting, April 10, 1946.

228 RCA REVIEW
phoselenides of the alkaline -earth elements (Ca,Sr,Ba), activated with samarium (or terbium) and europium (or cerium), and are crystallized with fluxes such as lithium fluoride, calcium fluoride, and alkaline -earth sulphates. This class of materials had its beginnings in the work of Tomaschek,48 Travnicek,4° and Rothschild,50 who demonstrated (1) the enhancement of phosphorescence obtainable by the action of two activators, e.g., the phosphorescence of SrS : Sm is enhanced by addition of Gd or Bi, and (2) the feasibility of using oxysulphides and mixed - cation phosphor bases, e.g., Ca0 :CaS :Sm and CaS :SrS: (-I- activator) in the so- called Lenard phosphors. Subsequent work by Kunz and Urbach brought these phosphors into focus as having possible appli- cability in infra -red detectors,J1 and recent OSRD * -sponsored work by Urbach resulted in the development of two practical materials, which may be denoted in the usual notation as SrS:Sm:Eu and SrS :Sm:Ce.47 These laboratories were apprised of the status of Dr. Urbach's work after the development of SrS:Sm:Eu and then carried out concurrent investigations which showed: (1) partial substitution of S by Se in SrS:Sm:Eu increases the visual efficiency of the material by displacing the emission spectrum nearer the maximum sensitivity of the photopic or scotopic eye, (2) terbium is useful as a "storage agent" in addition to, or in place of, samarium in SrS:Sm:Eu, and (3) these infra -red- stimulable phosphors are excellent phosphorescent materials at tem- peratures between 200° and 500 ° C.47 4' The strong high- temperature phosphorescences of these materials indicates the presence of only deep -lying traps with large (approximately 1- electron -volt) electron binding energies relative to room -temperature kT (see Equation 5) .
The emission -spectrum shift on partially substituting Se for S in SrS : Sm :Eu may be as much as 600A toward the blue (starting at about 6300A peak emission for SrS:Sm:Eu). This spectral shift toward the blue is anomalous in the sense that partial substitution of Se for S in ZnS phosphors causes the emission spectrum to shift toward the red.52
48 R. Tomaschek, "Phosphorescent Properties of Rare Earths in Alka- line Earth Phosphors ", Ann. cl. Physik, Vol. 75, pp. 109 -142, 1924.
49 M. Travnicek, "Phosphorescence of Samarium in Mixed Sulphides and Oxides ", Ann. cl. Physik, Vol. 79, pp. 237 -260, 1926.
59 S. Rothschild, "Sensitized Phosphorescence ", Die Naturwiss., Vol. 20, pp. 850 -851, 1932; Physik. Zeits., Vol. 35, pp. 557 -560, 1934.
51 J. Kunz and F. Urbach, U. S. patent 2,074,226, 3/16/37. * Office of Scientific Research and Development. t -p These particular investigations were carried out under contract
OEMsr -440 between the Office of Scientific Research and Development and the Radio Corporation of America.
52 H. W. Leverenz, "Phosphors Versus the Periodic System of the Elements ", Proc. I. R. E., Vol. 32, pp. 256 -263, 1944.

LUMINESCENCE AND TENEBRESCENCE 229
Recently- announced measurements by Ellickson53 may be inter- preted as showing that the maximum number of traps in an optimally excited and stimulated SrS : Sm : Ce phosphor is about 1017 traps /cubic centimeter. This figure approximates the Sm- activator concentration in the phosphor and is the same magnitude as the maximum concen- tration of F- centers (traps) previously indicated for scotophors. An independent check on these general trapping concentrations is provided by integrating over the phosphorescence curve of a well- excited con- ventional phosphor such as the "optimum" ß* -ZnS :0 :Cu phosphores- cence reported by Schilling' or the continuations of decay curves shown in Figure 20. Using 2.5 electron volts as the average energy for quanta emitted by ß *- ZnS:Cu, then 1 lumerg /square centimeter /second - 6.25 X 10 "/2.5 = 2.5 X 10" quanta /square centimeter, second = 0.067 mL = 2.14 X 10 -5 candle /square centimeter. Dr. L. S. Nergaard has shown that the decay of ß* -ZnS :Cu may be approximated by an expression of the general type:
t 2 -n a loge L = A E to (9)
to
Specifically, when to is arbitrarily set equal to 1 second, Schilling's curve for "optimum" phosphorescence of ß* -ZnS :O :Cu is empirically fitted from 0.1 to 105 second by
L = 1.26 X 10¹³ t--0 286 (0.234 log( r)z quanta /square centimeter /second. (10)
Integration of Equation (10) indicates that about 1015 quanta /square centimeter may be emitted by a good ß *- ZnS:Cu phosphor as phos-
phorescence. Since the effective excited depth of phosphor is usually
less than 0.1 mm (1000, the total volume emission is over 1017 quanta/ cubic centimeter which is reasonably near the general maximum trap- ping concentration of 1018 traps /cubic centimeter. Silicate -, or fluor-
ide-, type phosphors may have "trapping" (metastable- state) concen-
trations as high as 1018 traps /cubic centimeter because their activator concentrations are about 100 times larger than those of sulphide -type phosphors.
Cascade Screens. Returning to the radar -screen problem with real phosphors and scotophors, it is apparent that real materials may be excited to store a maximum of about 1018 quanta of absorption or
53 R. T. Ellickson, "Some Properties of Infra -red -sensitive Phosphors ", paper F7, Bulletin of the American Physical Society (Cambridge meeting), Vol. 21, No. 2, 4/26/46.
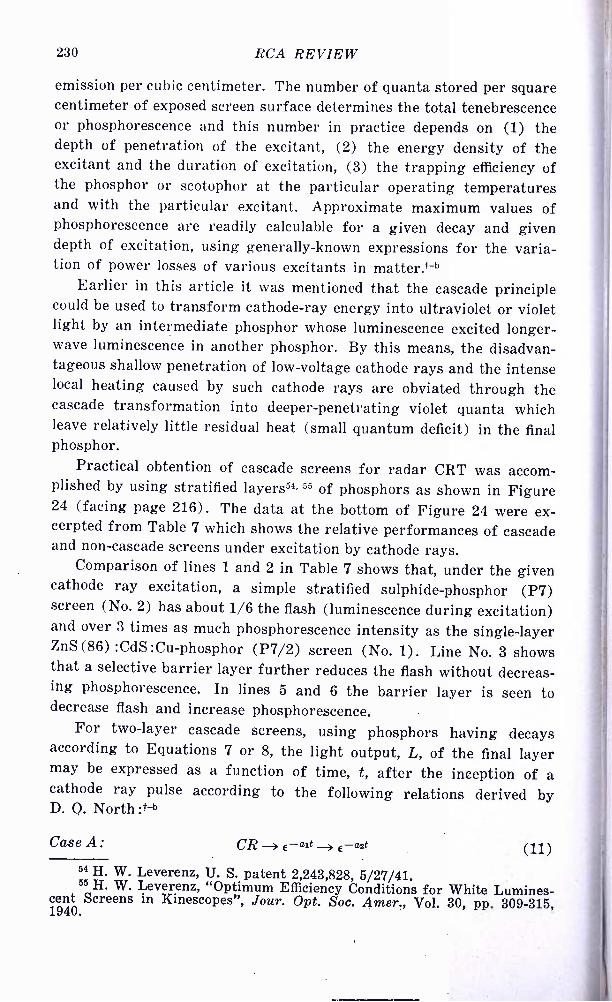
230 RCA REVIEW
emission per cubic centimeter. The number of quanta stored per square centimeter of exposed screen surface determines the total tenebrescence or phosphorescence and this number in practice depends on (1) the depth of penetration of the excitant, (2) the energy density of the excitant and the duration of excitation, (3) the trapping efficiency of the phosphor or scotophor at the particular operating temperatures and with the particular excitant. Approximate maximum values of phosphorescence are readily calculable for a given decay and given depth of excitation, using generally -known expressions for the varia- tion of power losses of various excitants in matter.t-b
Earlier in this article it was mentioned that the cascade principle could be used to transform cathode -ray energy into ultraviolet or violet light by an intermediate phosphor whose luminescence excited longer - wave luminescence in another phosphor. By this means, the disadvan- tageous shallow penetration of low- voltage cathode rays and the intense local heating caused by such cathode rays are obviated through the cascade transformation into deeper -penetrating violet quanta which leave relatively little residual heat (small quantum deficit) in the final phosphor.
Practical obtention of cascade screens for radar CRT was accom- plished by using stratified layers", 55 of phosphors as shown in Figure 24 (facing page 216) . The data at the bottom of Figure 24 were ex- cerpted from Table 7 which shows the relative performances of cascade and non -cascade screens under excitation by cathode rays.
Comparison of lines 1 and 2 in Table 7 shows that, under the given cathode ray excitation, a simple stratified sulphide -phosphor (P7) screen (No. 2) has about 1/6 the flash (luminescence during excitation) and over 3 times as much phosphorescence intensity as the single -layer ZnS(86) :CdS:Cu -phosphor (P7/2) screen (No. 1). Line No. 3 shows that a selective barrier layer further reduces the flash without decreas- ing phosphorescence. In lines 5 and 6 the barrier layer is seen to decrease flash and increase phosphorescence.
For two -layer cascade screens, using phosphors having decays according to Equations 7 or 8, the light output, L, of the final layer may be expressed as a function of time, t, after the inception of a cathode ray pulse according to the following relations derived by D. O. North :t -b
Case A: CR E-ait E-a2t
54H. W. Leverenz, U. S. patent 2,243,828, 5/27/41. 55 H. W. Leverenz, "Optimum Efficiency Conditions for White Lumines- cent Screens in Kinescopes ", Jour. Opt. Soc. Amer., Vol. 80, pp. 309 -315, 1940.
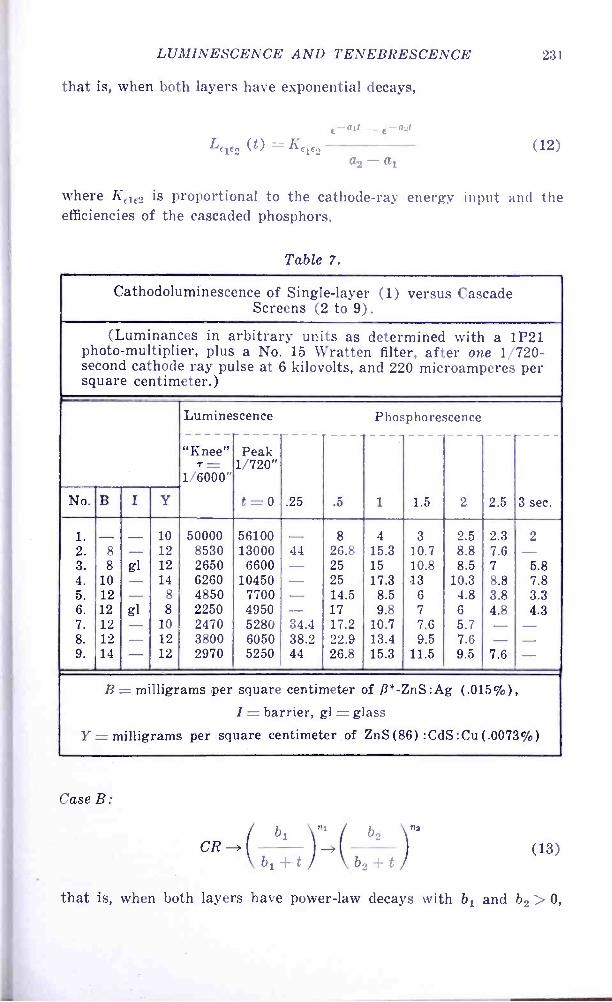
LUMINESCENCE AND TENEBRESCENCE 231
that is, when both layers have exponential decays,
,-air - E -alt
Le1e2 (t) = Ke1e2 (12)
where Ke1e2 is proportional to the cathode -ray energy input and the efficiencies of the cascaded phosphors.
Table 7.
Cathodoluminescence of Single -layer (1) versus Cascade Screens (2 to 9).
(Luminances in arbitrary units as determined with a 1P21 photo -multiplier, plus a No. 15 Wratten filter, after one 1/720 - second cathode ray pulse at 6 kilovolts, and 220 microamperes per square centimeter.)
Luminescence Phosphorescence
"Knee" Peak T - 1/720"
1/6000"
No. B I Y t = 0 .25 .5 1 1.5 2 2.5 3 sec.
1. - - 10 50000 56100 - 8 4 3 2.5 2.3 2
2. 8 - 12 8530 13000 44 26.8 15.3 10.7 8.8 7.6 - 3. 8 gl 12 2650 6600 - 25 15 10.8 8.5 7 5.8 4. 10 - 14 6260 10450 - 25 17.3 13 10.3 8.8 7.8 5. 12 - 8 4850 7700 - 14.5 8.5 6 4.8 3.8 3.3 6. 12 gl 8 2250 4950 - 17 9.8 7 6 4.8 4.3 , . 12 - 10 2470 5280 34.4 17.2 10.7 7.6 5.7 - - 8. 12 - 12 3800 6050 38.2 22.9 13.4 9.5 7.6 - - 9. 14 - 12 2970 5250 44 26.8 15.3 11.5 9.5 7.6 -
f? = milligrams per square centimeter of ß *- ZnS:Ag (.015 %), 1- barrier, gl = glass
Y = milligrams per square centimeter of ZnS (86) : CdS :Cu (.0073% )
Case B:
b2 bl
CR -> b1 -1- t b2 -F- t
(13)
that is, when both layers have power -law decays with b1 and b0 > 0,
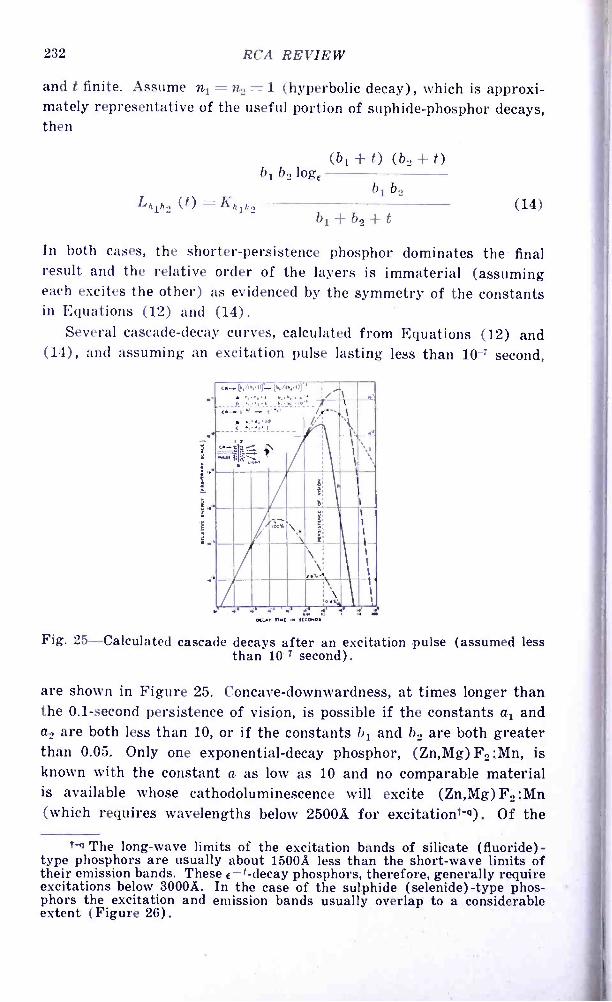
232 RCA REVIEW
and t finite. Assume n1= 722 = 1 (hyperbolic decay), which is approxi- mately representative of the useful portion of suphide -phosphor decays, then
Lhih2 (t) = Kh1h.`
b1 b2 loge ( b1 + t) (b2 + t)
b1 b2
bi+b2+t (14)
In both cases, the shorter -persistence phosphor dominates the final result and the relative order of the layers is immaterial (assuming each excites the other) as evidenced by the symmetry of the constants in Equations (12) and (14).
Several cascade -decay curves, calculated from Equations (12) and (14), and assuming an excitation pulse lasting less than 10 -i second,
<. ,.orYp,,i.,.up" ; ;,.... ..,.
<. , _ ,--.
. .i G1 - }n- Nas. . --
; .-
i. /
%
.
1
?
\\
b
r
/x \ r
1
Ì 1
\ ass-4
I
1
I
I
SIGA TIME I. CACCA»
Fig. 25- Calculated cascade decays after an excitation pulse (assumed less than 10 -7 second).
are shown in Figure 25. Concave -downwardness, at times longer than the 0.1- second persistence of vision, is possible if the constants ai and a2 are both less than 10, or if the constants b1 and b2 are both greater than 0.05. Only one exponential -decay phosphor, (Zn,Mg) F2 :Mn, is known with the constant a as low as 10 and no comparable material is available whose cathodoluminescence will excite (Zn,Mg) F2:Mn (which requires wavelengths below 2500A for excitationt-a) . Of the
t-q The long -wave limits of the excitation bands of silicate (fluoride) - type phosphors are usually about 1500A less than the short -wave limits of their emission bands. These et -decay phosphors, therefore, generally require excitations below 3000A. In the case of the sulphide (selenide) -type phos- phors the excitation and emission bands usually overlap to a considerable extent (Figure 26) .
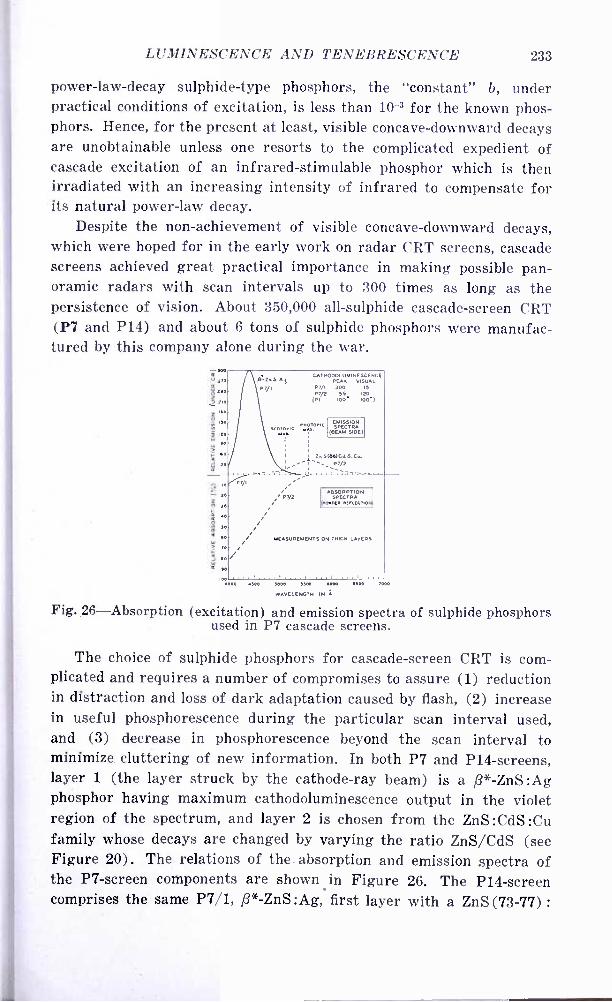
LUMINESCENCE AND TENEBRESCENCE 233
power -law -decay sulphide -type phosphors, the "constant" b, under practical conditions of excitation, is less than 10 -3 for the known phos- phors. Hence, for the present at least, visible concave -downward decays are unobtainable unless one resorts to the complicated expedient of cascade excitation of an infrared -stimulable phosphor which is then irradiated with an increasing intensity of infrared to compensate for its natural power -law decay.
Despite the non -achievement of visible concave -downward decays, which were hoped for in the early work on radar CRT screens, cascade screens achieved great practical importance in making possible pan- oramic radars with scan intervals up to 300 times as long as the persistence of vision. About 350,000 all- sulphide cascade -screen CRT (P7 and P14) and about 6 tons of sulphide phosphors were manufac- tured by this company alone during the war.
5.e
w 15
U ZTO
E 3.0 2
Zle
15
IRR
M W 00
5
O f0
00
00
000 4500 5000 5000 4000
WAVELENGTH IN Á
S-2..5 AS
PT/1
CATHODOLUMIN ESCENCE PEAN VISUAL
PT /I 300 15
P7/2 55 120 (PI 100' me)
xoTOPlc P,".:i.ePlc
2.5(BB)CdS:C.. P7/2
EMISSION SPECTRA
(BEAM SIDE(
/P7/2 AB5ORPTION
oe SPECTRA
INn[ CllO4
MEASUREMENTS ON THICK LAYERS
Fig. 26- Absorption (excitation) and emission spectra of sulphide phosphors used in P7 cascade screens.
The choice of sulphide phosphors for cascade -screen CRT is com- plicated and requires a number of compromises to assure (1) reduction in distraction and loss of dark adaptation caused by flash, (2) increase in useful phosphorescence during the particular scan interval used, and (3) decrease in phosphorescence beyond the scan interval to minimize . cluttering of new information. In both P7 and P14- screens, layer 1 (the layer struck by the cathode -ray beam) is a ß* -ZnS :Ag phosphor having maximum cathodoluminescence output in the violet region of the spectrum, and layer 2 is chosen from the ZnS :CdS :Cu family whose decays are changed by varying the ratio ZnS /CdS (see Figure 20). The relations of the absorption and emission spectra of the P7- screen components are shown in Figure 26. The P14- screen comprises the same P7/1, ß* -ZnS :Ag, first layer with a ZnS (73 -77) :
234 RCA REVIEW
CdS :Cu phosphor in the second layer instead of the ZnS (85 -88) :CdS :
Cu phosphor used in P7 screens. Some CRT manufacturers used a*-ZnS :Ag instead of ß *- ZnS :Ag for layer 1, particularly those whose sulphide -phosphors were purified in alkaline media. It is quite difficult to synthesize an efficient ß* -ZnS :Ag phosphor from ZnS which has acquired oxygen- containing contaminants such as are dissolved off glass and ceramic ware by alkaline solutions. Some of the purity precautions taken in these laboratories have been outlined in other articles.4. 58
Effective barrier layers have not yet been achieved in practical cascade screens, although efforts have been made to coat the ZnS :
CdS :Cu particles with silica57 or silicates." The most promising prac- tical technique appears to be that of applying an intermediate trans- parent evaporated layer of GeO2, ZnF2, ZnS, or the like, by a method similar to that used to apply electron- pervious light- reflecting coatings on present CRT screens.15 -'8
VIII. SUMMARIZED DATA ON PRACTICAL CRT SCREENS
Some approximate general properties of the more useful or poten- tially- useful, CRT screens are given in Table 8. The P8 and P9 screens were United Kingdom (British, Gen. Elec. Co., Ltd.) radar screens which were RMA* -coded for Canadian stand -by during the war. The missing RMA screen, P13, was not included because it has very ineffi- cient cathodoluminescence.4. '52 Before and during the war there was a tendency to call sulphide -plus -silicate screens P4, and all- sulphide screens P6. Recently, the RMA committee on screen nomenclature has designated monochrome -television screens P4, and color -television screens P6, regardless of composition.
The screens in Table 8 are listed in the order of their approximate persistences after low- voltage cathode -ray excitation. It is worth noting that the two dark -trace screens at the right of Table 8 both exhibit decelerated decays as the cathode -ray excitation energy input is increased, while bright -trace phosphor screens generally exhibit accelerated decays with increasing degree of excitation (Figure 20) .
The persistences of "strong" (contrast > 1.5:1) blips on P10 (KCI)
58 H. W. Leverenz, "Phosphors Brighten Radio Future ", Radio Age, Vol. 3, No. 1, .pp. 7 -11, 1943.
57 R. Puleston and S. T. Henderson, British patent. 511,038, 8/8/39; U. S. patent 2,274,163, 2/24/42; (cf. A. Schleede and B. Bartels, U. S. patent 2,117,858, 5/17/38).
58. F. Michelssen, "Einige Gesichtspunkte ueber den Aufbau und Betrieb gasgefuellter Braunscher Roehren fuer Fernsehzwecke ", Hochfr. u. Elek- troak., Vol. 44, pp. 95 -101, 1934. .
* Radio Manufacturers Association.
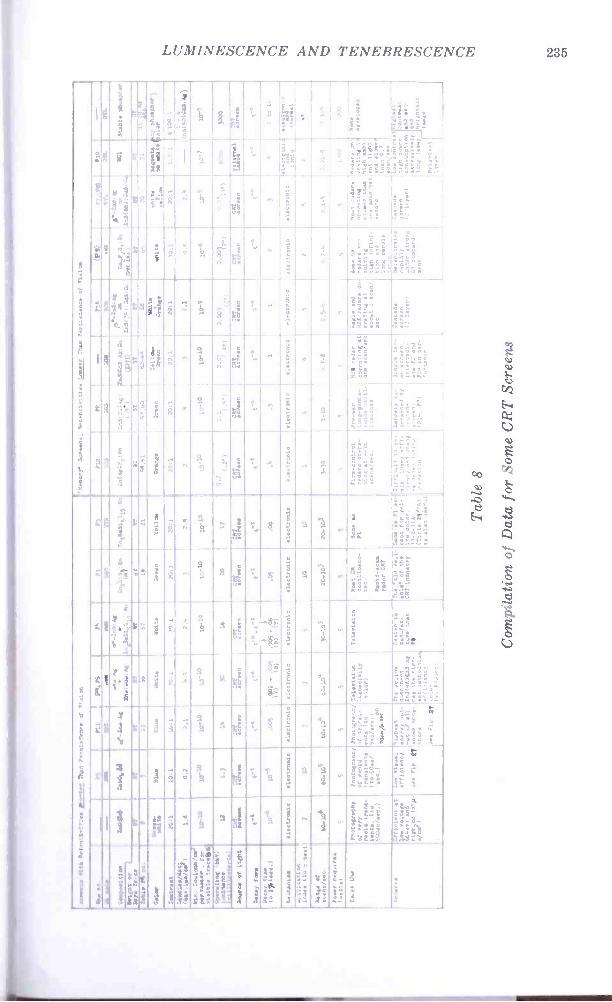
LUMINESCENCE AND TENEBRESCENCE 235
...
iq
:1'
! g
' :.'"
. , " ; ,V ..
I
-
`,..,
..
.,;.,!.,... - ---,,
1.-.... .
1 ,
.-
R
,,..
e ' '
-'-'
-,- . ,
4.1 -°P
A"
1,3 Ae,
,r ;;;
?1- r."7, 2, ...
, .- ..'
' .- ,
. , .
'
,
, ' - g , ^ .
,
271s-
---I--
I rt
.
/ i
.t_..,:,
.1
!it; ;J.' N
.'
f ,..` i
7
"
A t -. zS o .V.,. :, . .,.. . ... ... i'',Z.:.:, 1:""
>:"
,, .
,
2
, ,
..; : NP
,
' -2t.:1
. t., k '',- cr
7°.--
- i
rt 1 . :
_...-
t
ts
1
.
x
1
-------
'1.-
:
K
"
r `
"..: 11 "t,
. ,.., ! -
i g ...- i
-
,
ii
rv..
,,-.
.A,
; A i t1-.
....
'
2., .;
1-..''
ii5r
r1 , . 2 . .,
- t ""
-''. zy.
...-...,
r ^. 9
,..
...;
2 .1
- z,-
.
I 1 a r '
. Zii. r'z
Z
.?, 3
:...!
,t.1
,
- .
1 A..
1-..1. Z 1'
`: li si. . . .3
",?..-114Fi
1X-,. .1.-''
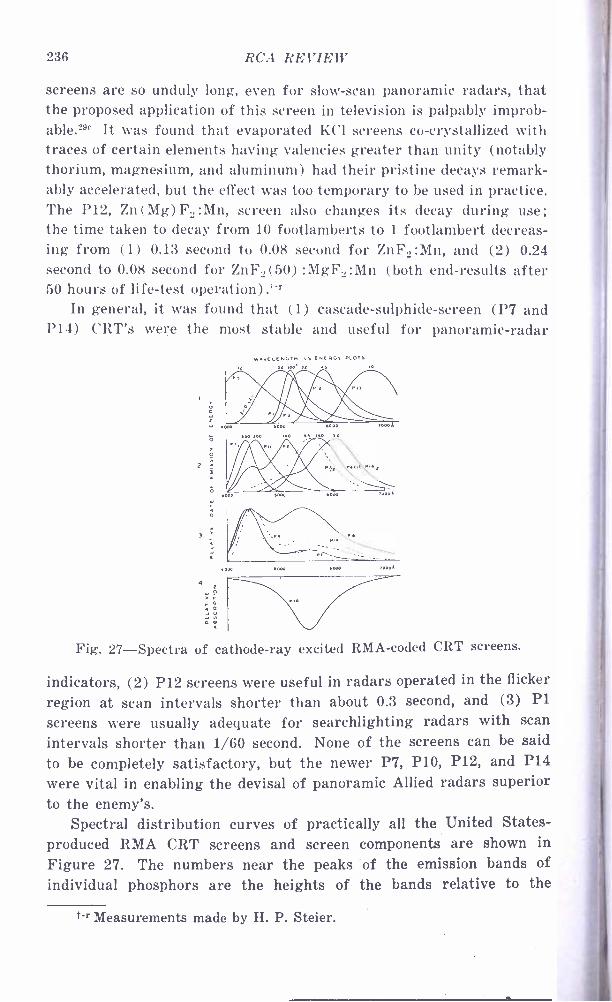
236 RCA REVIEW
screens are so unduly long, even for slow -scan panoramic radars, that the proposed application of this screen in television is palpably improb- able.29c It was found that evaporated KC1 screens co- crystallized with traces of certain elements having valencies greater than unity (notably thorium, magnesium, and aluminum) had their pristine decays remark- ably accelerated, but the effect was too temporary to be used in practice. The P12, Zn (Mg) F; /:Mn, screen also changes its decay during use; the time taken to decay from 10 footlamberts to 1 footlambert decreas- ing from (1) 0.13 second to 0.08 second for ZnF2:Mn, and (2) 0.24 second to 0.08 second for ZnF.(50) :MgF .,:Mn (both end -results after 50 hours of life -test operation) .t -r
In general, it was found that (1) cascade -sulphide- screen (P7 and P14) CRT's were the most stable and useful for panoramic -radar
O
4 Z O
l R O
Q O
WAVELENGTH VS ENERGY PLOTS
at we ai 00
Ia
5000 4000 1000
6000 I000í
Fig. 27- Spectra of cathode -ray excited RMA -coded CRT screens.
indicators, (2) P12 screens were useful in radars operated in the flicker
region at scan intervals shorter than about 0.3 second, and (3) P1
screens were usually adequate for searchlighting radars with scan intervals shorter than 1/60 second. None of the screens can be said to be completely satisfactory, but the newer P7, P10, P12, and P14 were vital in enabling the devisai of panoramic Allied radars superior to the enemy's.
Spectral distribution curves of practically all the United States - produced RMA CRT screens and screen components are shown in
Figure 27. The numbers near the peaks of the emission bands of individual phosphors are the heights of the bands relative to the
t-r Measurements made by H. P. Steier.

LUMINESCENCE AND TENEI3RESCENCE 237
peak of the cathodoluminescence band of Pl which is arbitrarily set equal to 100. Screens with complex spectra, such as the P2, P7, and P14 screens, have phosphorescence colors corresponding to their long - wave bands only, e.g., luminescence of P7 -*phosphorescence given by P7/2. The measurements were made at 6 kilovolts and about 1 micro- ampere per square centimeter of steady cathode ray, using the auto- matic recording spectroradiometer59 or a quartz -optics spectrograph and densitometer.
Temperature- dependence curves of the photoluminescence efficien- cies of some of the more useful phosphors are shown in Figures 28 -31.
In the case of cathodoluminescence, these curves should probably be
shifted about 150 °C to the right to check with tentative measurements made on several of the phosphors in a demountable CRT. Quantitative temperature- dependence curves are of practical importance in deter- mining the optimum operating temperatures of phosphors as well as
their behaviors in negative- modulation ( "CR- burn ") operation. In "CR- burn" operation, one cathode ray source may be used to uniformly excite and elevate the temperature of a phosphor screen while a second cathode ray source produces a modulated scanning beam effectively to "push the phosphor over the brink" of its temperature break -point. Decay of the dark -traces thus formed is a function of the rate of thermal dissipation of the excess heat supplied by the modulated scanning beam. Several experimental two -gun "CR- burn" CRT were made and found to have exceptional luminances and contrasts, but their low sensitivities to weak signals prevented practical application in war- time radars.
The fastest -decay phosphor, ZnO: (Zn), listed in Table 8 is espe-
cially useful for (1) recording very rapid transients,ó0 (2) operation under very low- voltage cathode rays (-- 5 volts), and (3) for trans- forming instantaneous gamma radiation into light suitable for actu- ating a 1P21(S4) or 1P22 (S8) photomultiplier. In this connection, the ß *- ZnS:Ag phosphor has been found quite useful in transforming corpuscular radiations from radioactive materials into light which actuates blue- sensitive photomultipliers.
The data given in this article and in the Final Reportt -b catalogue
69 V. K. Zworykin, "An Automatic Recording Spectroradiometer for Cathodoluminescent Materials ", Jour. Opt. Soc. Amer., Vol. 29, pp. 84 -91, 1939.
80 H. Goldstein and P. D. Bales, "High Speed Photography of the Cathode Ray Tube ", Rev. Sci. Instr., Vol. 17, pp. 89 -96, 1946. R. Feldt, "Photographing Patterns on CRT ", Electronics, pp. 130ff, Feb., 1944. D. F. Winter, "Fast Sweep Synchroscope ", Paper Ll, American Physical Soc., Cambridge meeting, April 26, 1946.
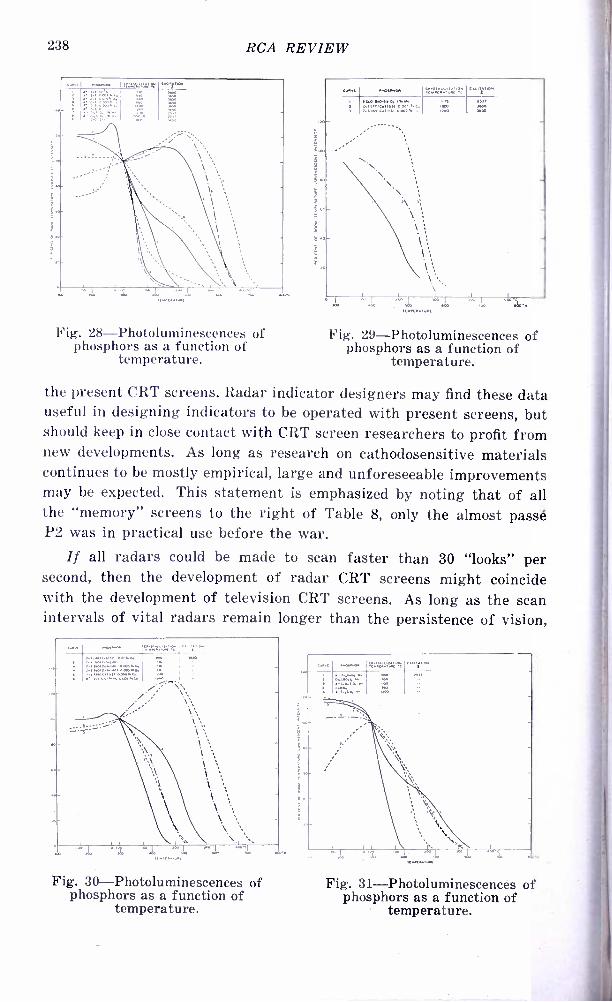
238 RCA REVIEW
'
Fig. 28- Photoluminescences of phosphors as a function of
temperature.
..., .,..
LIOPI
Fig. 29- Photoluminescences of phosphors as a function of
temperature.
the present CRT screens. Radar indicator designers may find these data useful in designing indicators to be operated with present screens, but should keep in close contact with CRT screen researchers to profit from new developments. As long as research on cathodosensitive materials continues to be mostly empirical, large and unforeseeable improvements may be expected. This statement is emphasized by noting that of all the "memory" screens to the right of Table 8, only the almost passé P2 was in practical use before the war.
If all radars could be made to scan faster than 30 "looks" per second, then the development of radar CRT screens might coincide with the development of television CRT screens. As long as the scan intervals of vital radars remain longer than the persistence of vision,
Fig. 30- Photoluminescences of phosphors as a function of
temperature.
Fig. 31- Photoluminescences of phosphors as a function of
temperature.
LUMINESCENCE AND TENEBRESCENCE 239
however, research on new and improved radar indicators should be separately fostered to ensure adequate progress for our changing tactical requirements.
IX. ACKNOWLEDGMENTS
During the course of the NDRC- sponsored research on radar CRT screens we were aided greatly by Drs. L. A. DuBridge, R. F. Bacher, D. H. Ewing, L. J. Haworth, and T. Soller of the Radiation Laboratory, Massachusetts Institute of Technology, who indicated to us the direc- tions in which the work might proceed for maximum tactical benefit. These and many other members of the Radiation Laboratory and of a number of other laboratories, both in this country and in England, cooperated in expediting the attainment of superior radar indicators for Allied use. The British are to be commended particularly for being the first to apply cascade -sulphide and scotophor CRT screens in radar.
Within our research group, S. Lasof, Dr. R. E. Snrader, F. E.
Williams, and E. J. Wood made substantial contributions to the re-
search results herein reported. Further development and practical application of the research findings was done by the phosphor- develop-
ment group (B. E. Artau, supervisor) and CRT -development group (Dr. L. B. Headrick, supervisor) of the Harrison, N. J. and Lancaster, Pa. plants.t-b
Our appreciations are expressed for the helpful administrative aid and encouragement received from Drs. G. R. Shaw and E. A.
Lederer during the early research work at Harrison, N. J. (1941 -42) ,
and from Mr. E. W. Engstrom and Dr. V. K. Zworykin during the
later work at Princeton, N. J. (1943 -1945).
FREQUENCY MODULATION MOBILE RADIOTELEPHONE SERVICES*
BY
H. B. MARTIN
Assistant Chief Engineer, Radiomarine Corporation of America New York, N. Y.
Summary -The proposed use of frequencies in the Very High Frequency ranges of 30 -44 and 152 -162 megacycles for Common -carrier General Mobile Radiotelephone Communication is discussed with reference to propaga- tional and equipment advantages. Consideration is limited to the radio link for vehicular and marine mobile service. Frequency modulation and its advantages for mobile communication are discussed briefly. The use of separate transmitting and receiving frequencies is the basis for all recom- mendations and allocation plans which are traced from their origin by the Radio Technical Planning Board to the most recent Industry suggestions to the Federal Communications Commission. Geographical considerations for service areas of fixed stations are based on Radio Manufacturers Asso- ciation recommendations for transmitter powers, antenna heights, desired and undesired signal levels, etc. The Urban and Highway proposed services, including Marine, are compared on an operational and equipment basis and the most important mobile unit performance requirements are given. References from Radio Technical Planning Board (RTPB), Radio Manu- facturers Association (RMA), Federal Communications Commission (FCC) and technical publications are provided.
THE use of very high frequencies for relatively short range com- munication and broadcast systems was beginning to grow by leaps and bounds during the short period before World War II.
The entry of the United States into the war necessitated the postpone- ment of development work necessary for the commercial utilization of frequencies in this section of the radio spectrum. However, wartime developments for two -way communication by planes, tanks and motor vehicles as well as by surface vessels have greatly aided the design and application engineers in the problems encountered for commercial radiotelephone services. A consideration of all types of services (in- cluding sound broadcasting, television, facsimile and radio relay sys- tems) now using and intending to use frequencies in the very high frequency range (30 -300 megacycles) is considerably beyond the scope of this paper. Only the proposed use of frequencies for Common -carrier General Mobile Radiotelephone Communication in the 30 -44 and 152- 162 megacycle bands by motor vehicles and surface vessels will be considered. This type of service is an arrangement permitting ordinary
* Decimal Classification : R540.
240

FM RADIOTELEPHONE 241
telephone subscribers to communicate, by means of a radio link, with mobile units. Communication of this type is considered to be useful for trucks, taxicabs, ambulances, doctors' cars and public service vehicles as well as surface vessels of various descriptions, including tugboats, ferryboats, lighters, barges, fishing vessels and all kinds of pleasure craft. Public telephone communication with passenger trains and passenger aircraft may eventually fall in the same category.
The use of frequencies in this section of the radio spectrum has many attractive and advantageous features' such as (1) small and effi-
cient antenna systems which also are more easily made directive, if desired (with a resultant which is equivalent to a gain in transmitter power) ; (2) compact and lightweight transmitters and receivers ; (3) reduced levels of natural and man -made interference, permitting com-
paratively low transmitter powers to be used for effective reception with low noise levels ; (4) a relatively high degree of constancy of the re- ceived signal irrespective of secular, diurnal and atmospheric changes and ; (5) a fairly definite limitation of both the service range and the usual interference area due to the absence of sky -wave (as compared to lower frequencies).
In addition to physical, electrical and propagational advantages as outlined above, it is generally agreed' that frequency modulation offers numerous advantages over amplitude modulation. Frequency modula- tion offers the outstanding advantage of being relatively noise free and lends itself to amplitude limiting, which tends to insure a more uni- form volume. Obviously, for "high- fidelity" circuits frequency modula- tion requires considerably more space in the radio spectrum. However, for voice communication, audio frequencies between about 300 and 3000 cycles are adequate. Therefore, the "more- spectrum" disadvan- tage is considered to be justifiable due to the many advantages of frequency modulation since, for good voice transmission and allowing for the same carrier instability, the band occupied is only 3 or 4 times wider than for amplitude modulation.
Field tests$ conducted in 1939 -1940 on 42.6 megacycles conclusively show that the theoretical advantages4 of frequency modulation over
' "Radio at Ultra -High Frequencies," RCA Institutes Technical Press, April, 1940.
2 "Use of Radio Channels in the Independent Telephone Field," Radio Technical Planning Board, Panel 8 Committee 1, Document P8C1- 391 -A, pp. 5 -8, June 23, 1944.
S Raymond F. Guy and Robert M. Morris, "NBC Frequency -Modulation Field Test," RCA REVIEW, Vol. V, No. 2, pp. 190 -225, October, 1940.
4 S. W. Seeley, "Frequency Modulation -Bibliography," RCA REVIEW, Vol. V, No. 4, pp. 468 -480, April 1941.
242 RCA REVIEW
amplitude modulation for noise suppression are not a dream of the mathematician.
To provide two -way communication between land telephone and mobile units, it is considered essential to use different frequencies for transmission from the fixed station and the mobile unit. The use of separate frequencies permits simplification of the fixed station terminal equipment and improves the service which can be rendered. Such a system is known as "duplex" as contrasted to a single frequency or "simplex" system.
A "full- duplex" systems would mean one in which the transmission may proceed in either direction without the use of switching to deter- mine the direction of transmission at any given moment. This is the condition obtained when two parties are conversing over a regular land - telephone circuit, since each may "interrupt" the other at will. A sys- tem providing full -duplex operation is, at present, not feasible, how- ever, due to space limitations on the mobile unit. Obviously, two frequencies and two antennas are the fundamental requirements; but the selectivity of the mobile unit receiver is the stumbling block (as- suming that the fixed station transmitter and receiver antennas could be geographically separated) since the mobile receiver would have to be capable of receiving a relatively weak signal from the fixed station in the presence of the comparatively strong signal from mobile unit trans- mitter.
In the present state of the art, it is necessary to use a "push -to- talk" switch (or voice operated relay) at the mobile unit and let the presence of transmission from the mobile unit switch (by means of relays) the fixed station terminal facilities. Thus, the fixed station transmitter is prevented from being turned on by the voice of the land - line subscriber when the mobile unit is talking and the fixed station receiver output is fed into the land -line. In effect, the mobile unit can "interrupt" the land -telephone.
An alternate method, which has been used to some extent and is being considered for these new common -carrier general mobile serv- ices, allows the fixed station transmitter to "re- radiate" the incoming signal from the mobile unit. This system requires that the fixed station receiver be unaffected by radiation from the fixed station transmitter. This may be accomplished by either adequate separation of the fre- quencies in the duplex system (with required receiver selectivity) or physical separation of the fixed station transmitting and receiving
s W. R. Young, "Committee on Emergency Services, Transmitter Sec- tion, RMA Engineering Department- Appendices 1, 2 and 3," February 3, 1946.
FM RADIOTELEPHONE 243
antennas or a combination of both. Such a system is subject to the criticism that it reduces privacy to the extent that an eavesdropper may hear both sides of the conversation by listening to the fixed station transmitter.
For either of the fixed station systems as discussed above (land - line switching by mobile transmitter or re- radiation of mobile unit transmission) it is obviously desirable to have as much separation as possible between the two frequencies of the duplex channel. This mat- ter has had the cognizance of all reports and recommendations of the Radio Technical Planning Board2' 6, 7 and Radio Manufacturers Asso- ciations, 8.9 in their attempts to aid the Federal Communications Corn - mission in the matter of frequency allocations for the new communica- tion bands.
The original Bell Telephone System Plane for Highway and Urban services recommended a total of 110 duplex channels, 16 of which were for Highway and the remainder (94) for Urban services. All of the frequency blocks specified were in the range of 108 -129 megacycles which was considered necessary for integration with other services, either existing or proposed, but which was at variance with the ulti- mate decision to place the Highway and Urban services in the ranges 30 -44 and 152 -162 megacycles, respectively.
The above proposal contemplated two types of service, namely :
Highway two -way service on a message basis to and from vehicles on or near main trunk highways and Urban two -way service to and from vehicles operating in or close to cities or towns. Either type of service could, it was planned, be operated on a one -way or paging basis only. This would eliminate the need for a transmitter in the vehicle and, for certain purposes, would be adequate.
Contrasting the two systems, the Highway service would be chiefly of value to salesmen, heavy trucks, buses, construction crews, etc., and the Urban service would be useful to doctors, delivery trucks, taxicabs, ambulances, etc.
The Highway proposal contemplated the assignment of 8 frequen- cies for fixed -mobile communication within a radius of 10 miles so that
6 Austin Bailey, "Report of the Subcommittee on Common Carrier Gen- eral Mobile Radiotelephone Service," RTPB Document P13C8- 488 -A.
7 "Common- carrier General Mobile Radiotelephone Service," Brief in Behalf of RTPB Panel 13 Committee 8, P13C8- 677 -A, FCC Docket 6651.
e "Minimum Number of Channels -Part II, Radiotelephone," RTPB Document P8C2- 500 -A, July 26, 1944 and Supplement Document P8- 498 -A, September 19, 1944.
9 "Summary of Existing and Proposed Allocations in Range 30 -40 MC," RMA Engineering Department, March 12, 1946.
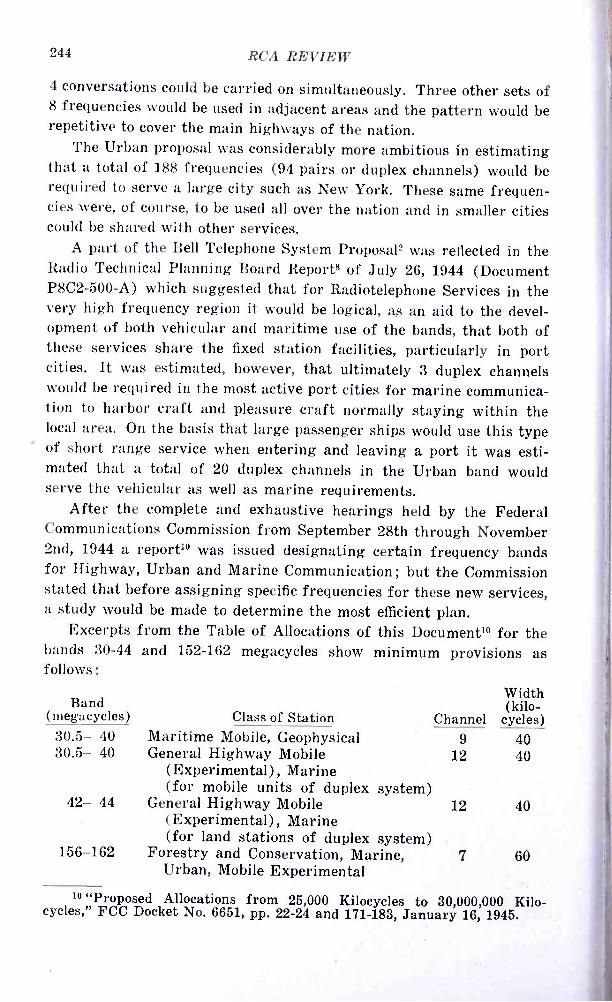
244 RCA REVIEW
4 conversations could be carried on simultaneously. Three other sets of 8 frequencies would be used in adjacent areas and the pattern would be repetitive to cover the main highways of the nation.
The Urban proposal was considerably more ambitious in estimating that a total of 188 frequencies (94 pairs or duplex channels) would be required to serve a large city such as New York. These same frequen- cies were, of course, to be used all over the nation and in smaller cities could be shared with other services.
A part of the Bell Telephone System Proposal= was reflected in the Radio Technical Planning Board Reports of July 26, 1944 (Document P8C2- 500 -A) which suggested that for Radiotelephone Services in the very high frequency region it would be logical, as an aid to the devel- opment of both vehicular and maritime use of the bands, that both of these services share the fixed station facilities, particularly in port cities. It was estimated, however, that ultimately 3 duplex channels would be required in the most active port cities for marine communica- tion to harbor craft and pleasure craft normally staying within the local area. On the basis that large passenger ships would use this type of short range service when entering and leaving a port it was esti- mated that a total of 20 duplex channels in the Urban band would serve the vehicular as well as marine requirements.
After the complete and exhaustive hearings held by the Federal Communications Commission from September 28th through November 2nd, 1944 a report10 was issued designating certain frequency bands for Highway, Urban and Marine Communication; but the Commission stated that before assigning specific frequencies for these new services, a study would be made to determine the most efficient plan.
Excerpts from the Table of Allocations of this Document10 for the bands 30 -44 and 152 -162 megacycles show minimum provisions as follows :
Band (megacycles)
30.5- 40 30.5- 40
42- 44
156 -162
Class of Station Maritime Mobile, Geophysical General Highway Mobile
(Experimental), Marine (for mobile units of duplex system)
General Highway Mobile (Experimental), Marine (for land stations of duplex system)
Forestry and Conservation, Marine, Urban, Mobile Experimental
Channel 9
12
Width (kilo-
cycles) 40 40
12 40
7 60
10 "Proposed Allocations from 25,000 Kilocycles to 30,000,000 Kilo- cycles," FCC Docket No. 6651, pp. 22 -24 and 171 -183, January 16, 1945.
FM RADIOTELEPHONE 245
In a further and final Federal Communications Commission Re-
lease" dated May 17, 1945 provision was made for 20 duplex channels in the band 30 -44 megacycles to be classed as General Highway Mobile (12 each for common carrier vehicles and fixed stations and 4 each for trucks and buses) . The 12 duplex channels are also to serve marine needs, although 10 frequencies (shared) for Maritime Mobile in the band 30 -40 megacycles and 5 frequencies (shared) in the band 42 -44 megacycles are indicated. In the band 152 -162 megacycles, 8 channels are specified for Maritime Mobile and 24 for Urban Mobile (which will include marine as well as vehicular units) .
At the request of the Federal Communications Commission, Industry (represented by the Radio Manufacturers Association and Radio Tech- nical Planning Board bodies) has formulated new recommendations for specific assignment patterns in the subject very high frequency band. An assignment pattern for the 152 -162 megacycle band was much easier to produce than one for the 30 -42 megacycle band since the use of the higher band, to date, has been only experimental and since the Rail- roads have already received their allocation of 60 channels in the top section of the 152 -162 megacycle band, as shown in a later tabulation.
Considerable study5 was made by the Engineering Department of the Radio Manufacturers Association which assumed the following:
(1) Frequencies near 150 megacycles, using frequency modulation. (2) Three types of stations:
(a) motor vehicle equipment, using a quarter -wave whip an- tenna with an effective height of 6 feet and with 50 watts antenna power.
(b) fixed stations for small communities (10,000 population or less) using half -wave dipoles 100 feet above ground and with 50 watts antenna power.
(c) fixed stations for large communities using half -wave dipoles 300 feet above the ground and with 250 watts an- tenna power.
(3) Service area based on minimum signal of 20 microvolts. (4) Undesired signal for small and large communities 2 and 5
microvolts, respectively (when desired signal is 20 microvolts) .
(5) The use of alternate channels12 i.e., with the center frequencies 120 kilocycles apart and, for systems in the same area (such as New York City and Newark, N. J.) the use of double -alternate channels (center frequencies 240 kilocycles apart) .
11 "FCC NEWS RELEASE NO. 80302" dated May 17, 1945. 12 "Committee on Emergency Servizes, RMA Engineering Department,"
October 12, 1945.
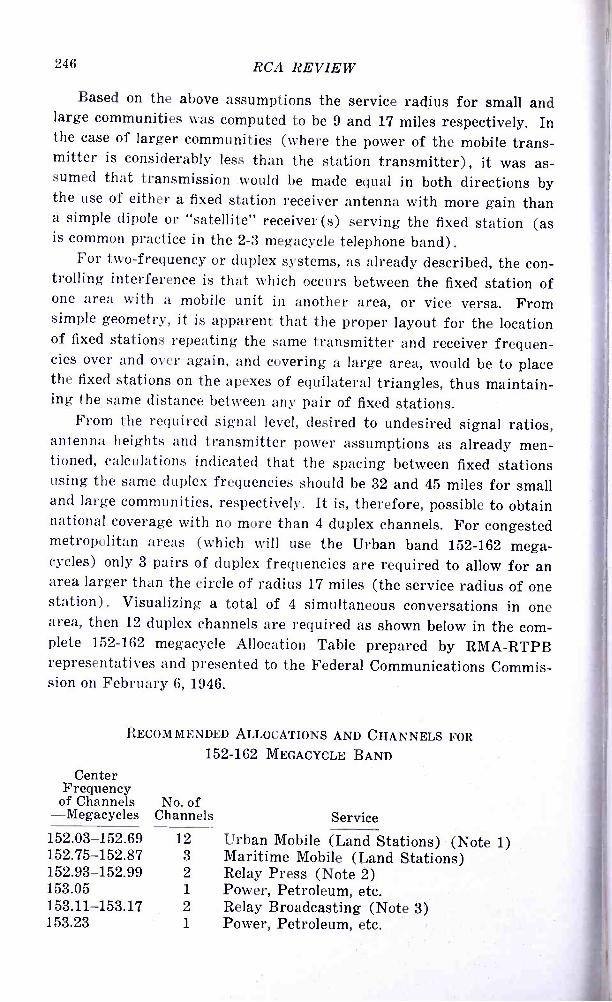
246 RCA REVIEW
Based on the above assumptions the service radius for small and large communities was computed to be 9 and 17 miles respectively. In the case of larger communities (where the power of the mobile trans- mitter is considerably less than the station transmitter), it was as- sumed that transmission would be made equal in both directions by the use of either a fixed station receiver antenna with more gain than a simple dipole or "satellite" receiver (s) serving the fixed station (as is common practice in the 2 -3 megacycle telephone band) .
For two -frequency or duplex systems, as already described, the con- trolling interference is that which occurs between the fixed station of one area with a mobile unit in another area, or vice versa. From simple geometry, it is apparent that the proper layout for the location of fixed stations repeating the same transmitter and receiver frequen- cies over and over again, and covering a large area, would be to place the fixed stations on the apexes of equilateral triangles, thus maintain- ing the same distance between any pair of fixed stations.
From the required signal level, desired to undesired signal ratios, antenna heights and transmitter power assumptions as already men- tioned, calculations indicated that the spacing between fixed stations using the same duplex frequencies should be 32 and 45 miles for small and large communities, respectively. It is, therefore, possible to obtain national coverage with no more than 4 duplex channels. For congested metropolitan areas (which will use the Urban band 152 -162 mega- cycles) only 3 pairs of duplex frequencies are required to allow for an area larger than the circle of radius 17 miles (the service radius of one station). Visualizing a total of 4 simultaneous conversations in one area, then 12 duplex channels are required as shown below in the com- plete 152 -162 megacycle Allocation Table prepared by RMA -RTPB representatives and presented to the Federal Communications Commis- sion on February 6, 1946.
RECOMMENDED ALLOCATIONS AND CHANNELS FOR
152 -162 MEGACYCLE BAND
Center Frequency
of Channels -Megacycles
No. of Channels Service
152.03- 152.69 12 Urban Mobile (Land Stations) (Note 1) 152.75- 152.87 3 Maritime Mobile (Land Stations) 152.93 - 152.99 2 Relay Press (Note 2) 153.05 1 Power, Petroleum, etc. 153.11- 153.17 2 Relay Broadcasting (Note 3) 153.23 1 Power, Petroleum, etc.
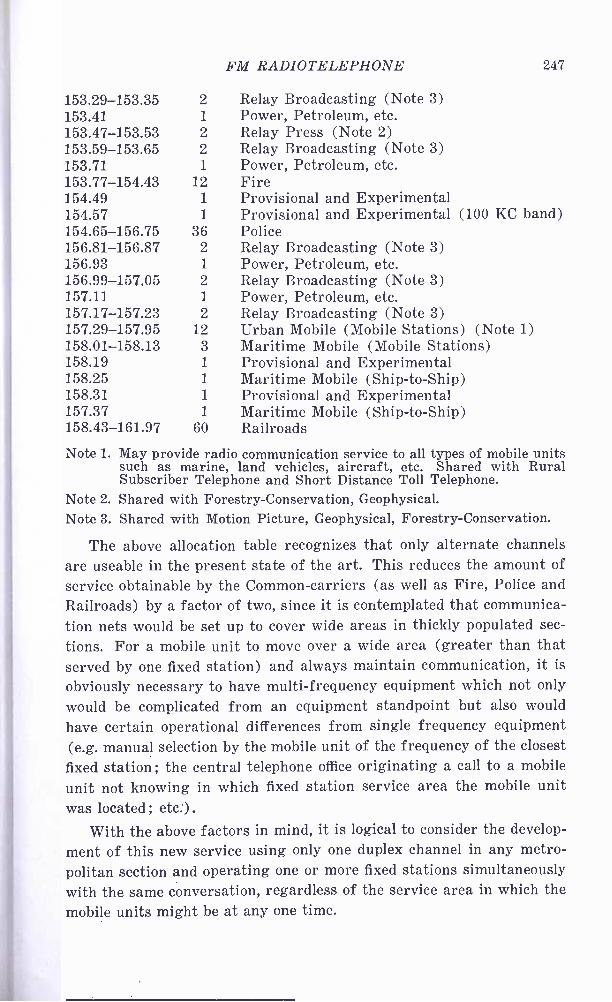
FM RADIOTELEPHONE 247
153.29- 153.35 2 Relay Broadcasting (Note 3) 153.41 1 Power, Petroleum, etc. 153.47- 153.53 2 Relay Press (Note 2) 153.59 -153.65 2 Relay Broadcasting (Note 3) 153.71 1 Power, Petroleum, etc. 153.77- 154.43 12 Fire 154.49 1 Provisional and Experimental 154.57 1 Provisional and Experimental (100 KC band) 154.65- 156.75 36 Police 156.81-456.87 2 Relay Broadcasting (Note 3) 156.93 1 Power, Petroleum, etc. 156.99- 157.05 2 Relay Broadcasting (Note 3) 157.11 1 Power, Petroleum, etc. 157.17 -157.23 2 Relay Broadcasting (Note 3) 157.29- 157.95 12 Urban Mobile (Mobile Stations) (Note 1) 158.01- 158.13 3 Maritime Mobile (Mobile Stations) 158.19 1 Provisional and Experimental 158.25 1 Maritime Mobile (Ship -to -Ship) 158.31 1 Provisional and Experimental 157.37 1 Maritime Mobile (Ship -to -Ship) 158.43- 161.97 60 Railroads
Note 1. May provide radio communication service to all types of mobile units such as marine, land vehicles, aircraft, etc. Shared with Rural Subscriber Telephone and Short Distance Toll Telephone.
Note 2. Shared with Forestry- Conservation, Geophysical. Note 3. Shared with Motion Picture, Geophysical, Forestry- Conservation.
The above allocation table recognizes that only alternate channels are useable in the present state of the art. This reduces the amount of service obtainable by the Common -carriers (as well as Fire, Police and Railroads) by a factor of two, since it is contemplated that communica- tion nets would be set up to cover wide areas in thickly populated sec-
tions. For a mobile unit to move over a wide area (greater than that served by one fixed station) and always maintain communication, it is
obviously necessary to have multi- frequency equipment which not only
would be complicated from an equipment standpoint but also would
have certain operational differences from single frequency equipment (e.g. manual selection by the mobile unit of the frequency of the closest
fixed station ; the central telephone office originating a call to a mobile
unit not knowing in which fixed station service area the mobile unit was located; etc.) .
With the above factors in mind, it is logical to consider the develop-
ment of this new service using only one duplex channel in any metro- politan section and operating one or more fixed stations simultaneously with the same conversation, regardless of the service area in which the mobile units might be at any one time.
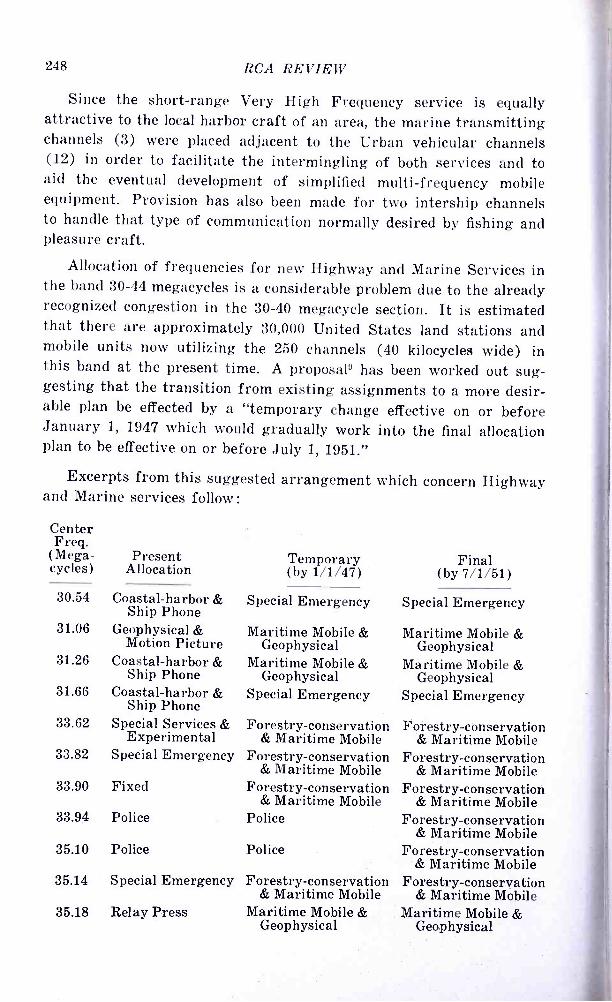
248 RCA REVIEW
Since the short -range Very High Frequency service is equally attractive to the local harbor craft of an area, the marine transmitting channels (3) were placed adjacent to the Urban vehicular channels (12) in order to facilitate the intermingling of both services and to aid the eventual development of simplified multi- frequency mobile equipment. Provision has also been made for two intership channels to handle that type of communication normally desired by fishing and pleasure craft.
Allocation of frequencies for new Highway and Marine Services in the band 30 -44 megacycles is a considerable problem due to the already recognized congestion in the 30 -40 megacycle section. It is estimated that there are approximately 30,000 United States land stations and mobile units now utilizing the 250 channels (40 kilocycles wide) in this band at the present time. A proposal9 has been worked out sug- gesting that the transition from existing assignments to a more desir- able plan be effected by a "temporary change effective on or before January 1, 1947 which would gradually work into the final allocation plan to be effective on or before July 1, 1951."
Excerpts from this suggested arrangement which concern Highway and Marine services follow:
Center Freq.
(Mega- cycles )
30.54
31.06
31.26
31.66
33.62
33.82
33.90
33.94
35.10
35.14
35.18
Present Allocation
Coastal- harbor & Ship Phone
Geophysical & Motion Picture
Coastal- harbor & Ship Phone
Coastal- harbor & Ship Phone
Special Services & Experimental
Special Emergency
Fixed
Police
Police
Special Emergency
Relay Press
Temporary (by 1/1/47)
Special Emergency
Maritime Mobile & Geophysical
Maritime Mobile & Geophysical
Special Emergency
Forestry- conservation & Maritime Mobile
Forestry- conservation & Maritime Mobile
Forestry- conservation & Maritime Mobile
Police
Police
Forestry- conservation & Maritime Mobile
Maritime Mobile & Geophysical
Final (by 7/1/51)
Special Emergency
Maritime Mobile & Geophysical
Maritime Mobile & Geophysical
Special Emergency
Forestry- conservation & Maritime Mobile
Forestry -conservation & Maritime Mobile
Forestry -conservation & Maritime Mobile
Forestry- conservation & Maritime Mobile
Forestry- conservation & Maritime Mobile
Forestry- conservation & Maritime Mobile
Maritime Mobile & Geophysical
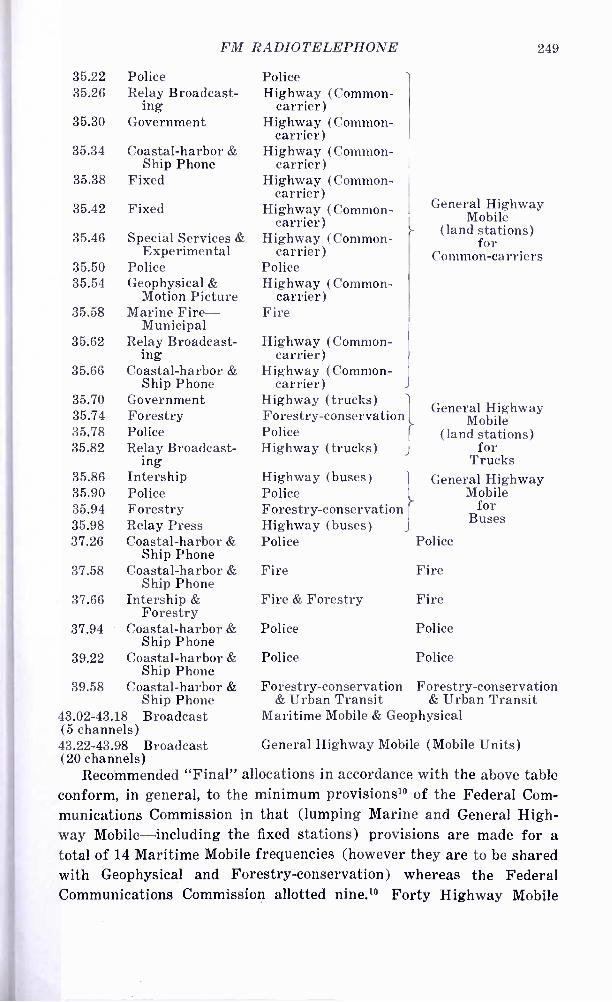
35.22 35.26
35.30
35.34
35.38
FM RADIOTELEPHONE
Police Police Relay Broadcast-Highway (Common -
ing carrier) Government Highway (Common-
carrier) Coastal- harbor & Highway (Common -
Ship Phone carrier) Fixed Highway (Common -
carrier)
249
35.42
35.46
Fixed
Special Services & Experimental
Highway (Common - carrier)
Highway (Common - carrier)
General Highway Mobile
(land stations) for
Common -carriers 35.50 Police Police 35.54 Geophysical &
Motion Picture Highway (Common-
carrier) 35.58 Marine Fire - Fire
Municipal 35.62 Relay Broadcast-
ing Highway (Common -
carrier) 35.66 Coastal- harbor &
Ship Phone Highway (Common -
carrier) 35.70 35.74
Government Forestry
Highway (trucks) Forestry- conservation General Highway
Mobile 35.78 Police Police (land stations) 35.82 Relay Broadcast-
ing Highway (trucks) for
Trucks 35.86 Intership Highway (buses) General Highway 35.90 Police Police Mobile 35.94 35.98
Forestry Relay Press
Forestry- conservation Highway (buses)
for Buses
37.26 Coastal -harbor & Police Police Ship Phone
37.58 Coastal- harbor & Fire Fire Ship Phone
37.66 Intership & Fire & Forestry Fire Forestry
37.94 Coastal- harbor & Police Police Ship Phone
39.22 Coastal- harbor & Police Police Ship Phone
39.58 Coastal- harbor & Forestry- conservation Forestry- conservation Ship Phone & Urban Transit & Urban Transit
43.02 -43.18 Broadcast (5 channels) 43.22 -43.98 Broadcast
Maritime Mobile & Geophysical
General Highway Mobile (Mobile Units) (20 channels)
Recommended "Final" allocations in accordance with the above table conform, in general, to the minimum provisions10 of the Federal Com- munications Commission in that (lumping Marine and General High- way Mobile -including the fixed stations) provisions are made for a total of 14 Maritime Mobile frequencies (however they are to be shared with Geophysical and Forestry -conservation) whereas the Federal Communications Commission allotted nine." Forty Highway Mobile
250 RCA REVIEW
frequencies are recommended (including fixed stations for Common - carrier, buses, trucks and all types of mobile units (whereas the Fed- eral Communications Commission allotted only twenty -four.'°
As in the case in the 152 -162 megacycle band, it is intended that in port cities, the marine traffic be handled by the same shore (fixed) station used for the vehicular trade. Also, in common with the 152 -162 megacycle band, to provide continuous communication along highways, it is necessary, according to the studies made,5' 6 to stagger fixed sta- tions in an equilateral triangle arrangement requiring 4 different duplex channels which can be repeated over and over again. Thus, for highway coverage, the 12 duplex channels will provide for 3 separate and simultaneous conversations in any one area.
This raises the questions of equipment and operational complica- tions similar to those discussed for the Urban (152 -162 megacycle) service. However, for highway service, no compromise can be made if communication is to be accomplished from any point along a highway. This means that 30 -44 megacycle vehicular equipment must be multi- channel and arrangement must be made for the moving vehicle to shift transmitting and receiving frequencies as it moves from the service area of one fixed station to another and also to advise the closest fixed station of its arrival in the area. Presumably, fixed stations would advise central offices concerned so that a call originating at a central office could be routed to the correct fixed station. Communication orig- inating from the vehicle would not be as involved, however, since by
shifting to the correct duplex channel for the local area (a choice of 1
of 4) the vehicle could originate a call immediately -if the channel was not already in use.
It is understood that plans are being made for 30 -44 megacycle net- works to include New York -Buffalo (via Albany) , Cleveland- Cincinnati, Chicago -St. Louis and Boston -New York. Experimental vehicular
equipment will, no doubt, be capable of operation on only one duplex
channel and coverage will not be complete from any highway point but the initial application of radio for this service will, most certainly,
prove to be (in the phraseology of the Federal Communications Com-
mission) in the category of "interest, convenience and necessity" for the public.
Applications are now on file13 for Urban service for a number of
cities and this service is expected to develop rapidly during the coming
year. Three types of services are planned13, namely: (1) a general
2 -way telephone service between any telephone and any mobile unit,
13 "Mobile Radio Service," Electronic Industries, pp.. 84 -85, April, 1946.
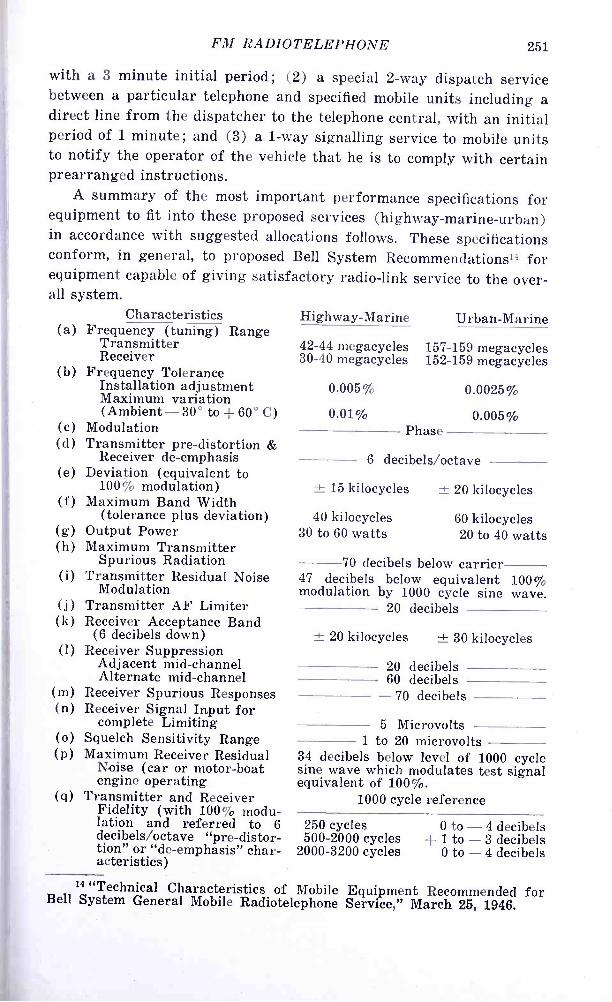
FM RADIOTELEPHONE 251
with a 3 minute initial period; (2) a special 2 -way dispatch service between a particular telephone and specified mobile units including a direct line from the dispatcher to the telephone central, with an initial period of 1 minute; and (3) a 1 -way signalling service to mobile units to notify the operator of the vehicle that he is to comply with certain prearranged instructions.
A summary of the most important performance specifications for equipment to fit into these proposed services (highway- marine -urban) in accordance with suggested allocations follows. These specifications conform, in general, to proposed Bell System Recommendations" for equipment capable of giving satisfactory radio -link service to the over- all system.
(a)
(b)
(c) (d)
(e)
(f)
(g) (h)
(i)
(j) (k)
(1)
(m) (n)
(o) (p)
Characteristics Frequency (tuning) Range
Transmitter Receiver
Frequency Tolerance Installation adjustment Maximum variation (Ambient -30° to + 60° C)
Modulation Transmitter pre- distortion &
Receiver de- emphasis Deviation (equivalent to
100% modulation) Maximum Band Width
(tolerance plus deviation) Output Power Maximum Transmitter
Spurious Radiation Transmitter Residual Noise
Modulation Transmitter AF Limiter Receiver Acceptance Band
(6 decibels down) Receiver Suppression
Adjacent mid -channel Alternate mid -channel
Receiver Spurious Responses Receiver Signal Input for
complete Limiting Squelch Sensitivity Range Maximum Receiver Residual
Noise (car or motor -boat engine operating
(q) Transmitter and Receiver Fidelity (with 100% modu lation and referred to 6 decibels /octave "pre- distor- tion" or "de- emphasis" char- acteristics)
Highway- Marine
42 -44 megacycles 30 -40 megacycles
0.005%
0.01%
Urban -Marine
157 -159 megacycles 152 -159 megacycles
Phase
0.0025%
0.005%
6 decibels /octave
± 15 kilocycles
40 kilocycles 30 to 60 watts
± 20 kilocycles
60 kilocycles 20 to 40 watts
70 decibels below carrier 47 decibels below equivalent 100% modulation by 1000 cycle sine wave.
20 decibels
± 20 kilocycles ± 30 kilocycles
20 decibels 60 decibels
70 decibels
5 Microvolts 1 to 20 microvolts
34 decibels below level of 1000 cycle sine wave which modulates test signal equivalent of 100 %.
1000 cycle reference
250 cycles 500 -2000 cycles
2000 -3200 cycles
0 to -4 decibels + 1 to -3 decibels
0 to -4 decibels
14 "Technical Characteristics of Mobile Equipment Recommended for Bell System General Mobile Radiotelephone Service," March 25, 1946.
252 RCA REVIEW
In addition to the above, in order to agree with fixed station plans, mobile equipment should be designed to use the two -tone audio fre- quency selective system15, instead of a loudspeaker, for the indication of incoming calls. This system has been used for several years to call individual mobile units on Harbor, Inland Waterways and Great Lakes vessels.1e
15 C. N. Anderson and H. M. Pruden, "Radiotelephone System for Har- bor and Coastal Services," Proc. I.R.E., Vol. 27, No. 4, pp. 245 -253, April, 1939.
16 H. B. Martin, "Great Lakes Radiotelephone Service," RCA REVIEW, Vol. III, No. 3, July, 1939.

DEVELOPMENT OF PULSE TRIODES AND CIRCUIT TO GIVE
ONE MEGAWATT AT 600 MEGACYCLES*
BY
R. R. LAW, D. G. BURNSIDE, R. P. STONE, W. B. WHALLEY
Research Department, RCA Laboratories Division, Princeton, N. J.
Summary -The work here described was done for the Army' and Navy to develop high -power air -cooled pulse triode transmitting tubes and circuits. The A -2231 tube developed during the course of this project readily provides 500 kilowatts peak power at 600 megacycles with a duty cycle of 0.1 per cent. In the push -pull oscillator described herein, two of the tubes easily give a peak power of one megawatt. At this power level the operation is stable and the frequency may be varied throughout the 560 -640 megacycle tuning range with no tendency toward sparkover. By ganging together the cathode and anode tuning controls, it has been possible to accomplish tuning with a single electric motor which may be remote controlled. These same principles of tuning might be employed to cover a much wider range.
I. INTRODUCTION
BOUT Pearl Harbor time the need arose for pulse radar appa- ratus of the greatest possible power to operate at the higher frequencies. As part of their general program to stimulate
work along many frontiers, the Army and Navy encouraged the devel- opment of tubes and circuits to make possible a one megawatt 1200 megacycle pulse triode radar transmitter. At that time, the proposal to develop triodes to give this power at this frequency was most vision- ary. Conventional ultra- high- frequency tubes3 of the period employed planar electrodes with circular symmetry and the cathode area which could be usefully employed at higher frequencies was limited by varia- tions in electric field across the cathode surface. However, by employing the elongated -electrode -principle previously developed and operating in a mode such that the electric field would be uniform along the length of the electrodes, there was promise of a practical solution to this problem.
In theory, the elongated -electrode -principle would make it possible to increase the cathode area indefinitely were it not for the possibility
* Decimal Classification: R351 X R339.2. ' U. S. Signal Corps Contract W- 3434 -sc -326. 2 Naval Research Laboratory Contract 173s -4815. 3 E. D. McArthur, "Disk -Seal Tubes ", Electronics, Vol. 18, No. 2, pp.
98 -102, February, 1945.
253
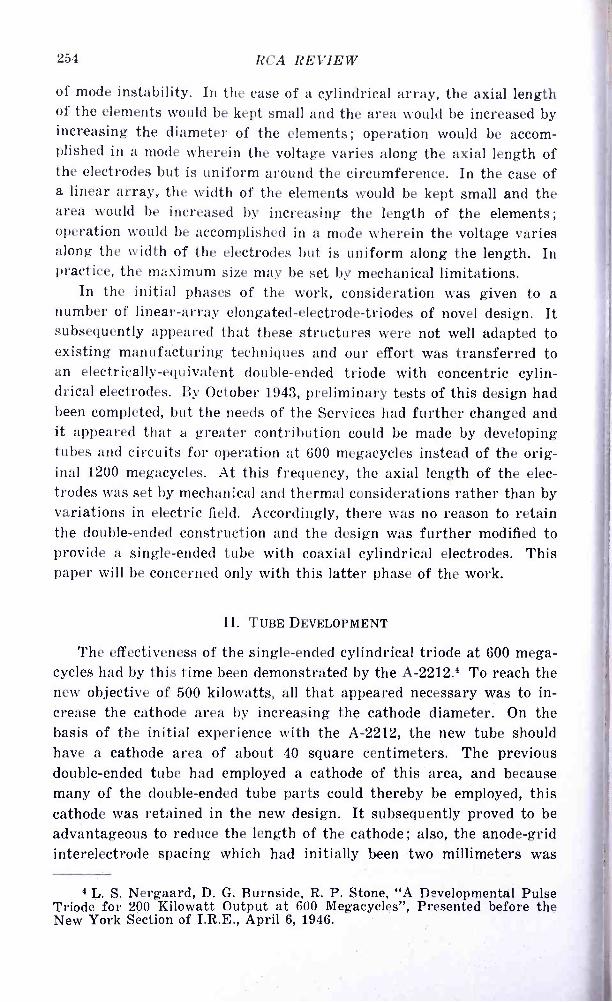
254 RCA REVIEW
of mode instability. In the case of a cylindrical array, the axial length of the elements would be kept small and the area would be increased by increasing the diameter of the elements ; operation would be accom- plished in a mode wherein the voltage varies along the axial length of the electrodes but is uniform around the circumference. In the case of a linear array, the width of the elements would be kept small and the area would be increased by increasing the length of the elements; operation would be accomplished in a mode wherein the voltage varies along the width of the electrodes but is uniform along the length. In practice, the maximum size may be set by mechanical limitations.
In the initial phases of the work, consideration was given to a number of linear -array elongated -electrode- triodes of novel design. It subsequently appeared that these structures were not well adapted to existing manufacturing techniques and our effort was transferred to an electrically -equivalent double -ended triode with concentric cylin- drical electrodes. By October 1943, preliminary tests of this design had been completed, but the needs of the Services had further changed and it appeared that a greater contribution could be made by developing tubes and circuits for operation at 600 megacycles instead of the orig- inal 1200 megacycles. At this frequency, the axial length of the elec- trodes was set by mechanical and thermal considerations rather than by variations in electric field. Accordingly, there was no reason to retain the double -ended construction and the design was further modified to provide a single -ended tube with coaxial cylindrical electrodes. This paper will be concerned only with this latter phase of the work.
II. TUBE DEVELOPMENT
The effectiveness of the single -ended cylindrical triode at 600 mega- cycles had by this time been demonstrated by the A- 2212.4 To reach the new objective of 500 kilowatts, all that appeared necessary was to in- crease the cathode area by increasing the cathode diameter. On the basis of the initial experience with the A -2212, the new tube should have a cathode area of about 40 square centimeters. The previous double -ended tube had employed a cathode of this area, and because many of the double -ended tube parts could thereby be employed, this cathode was retained in the new design. It subsequently proved to be advantageous to reduce the length of the cathode; also, the anode -grid interelectrode spacing which had initially been two millimeters was
4 L. S. Nergaard, D. G. Burnside, R. P. Stone, "A Developmental Pulse Triode for 200 Kilowatt Output at 600 Megacycles ", Presented before the New York Section of I.R.E., April 6, 1946.
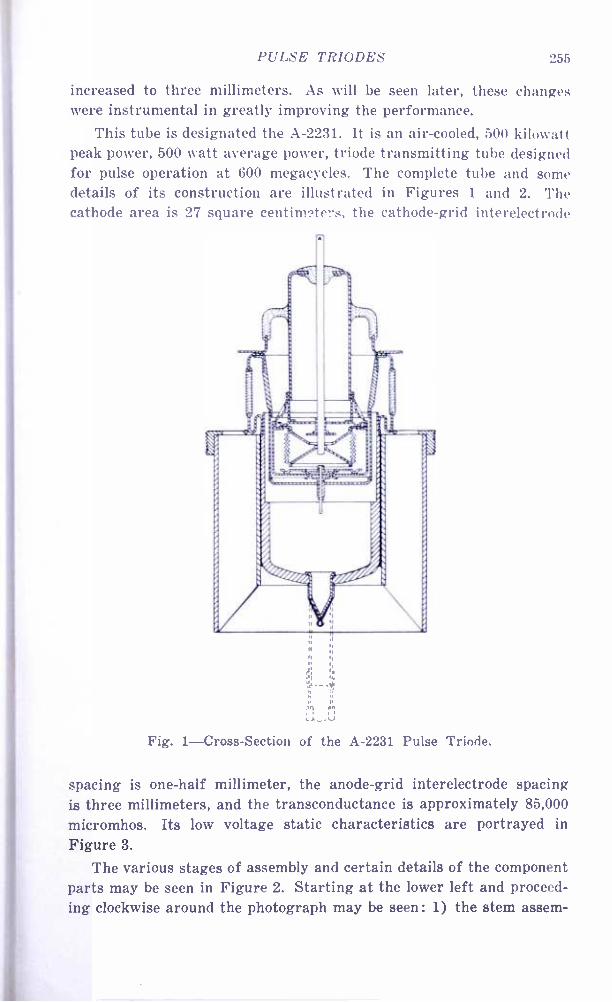
PULSE TRIODES 255
increased to three millimeters. As will be seen later, these changes were instrumental in greatly improving the performance.
This tube is designated the A -2231. It is an air -cooled, 500 kilowatt peak power, 500 watt average power, triode transmitting tube designed for pulse operation at 600 megacycles. The complete tube and some details of its construction are illustrated in Figures 1 and 2. The cathode area is 27 square centimeters, the cathode -grid interelectrode
Fig. 1- Cross -Section of the A -2231 Pulse Triode.
spacing is one -half millimeter, the anode -grid interelectrode spacing is three millimeters, and the transconductance is approximately 85,000
micromhos. Its low voltage static characteristics are portrayed in Figure 3.
The various stages of assembly and certain details of the component parts may be seen in Figure 2. Starting at the lower left and proceed- ing clockwise around the photograph may be seen: 1) the stem assem-
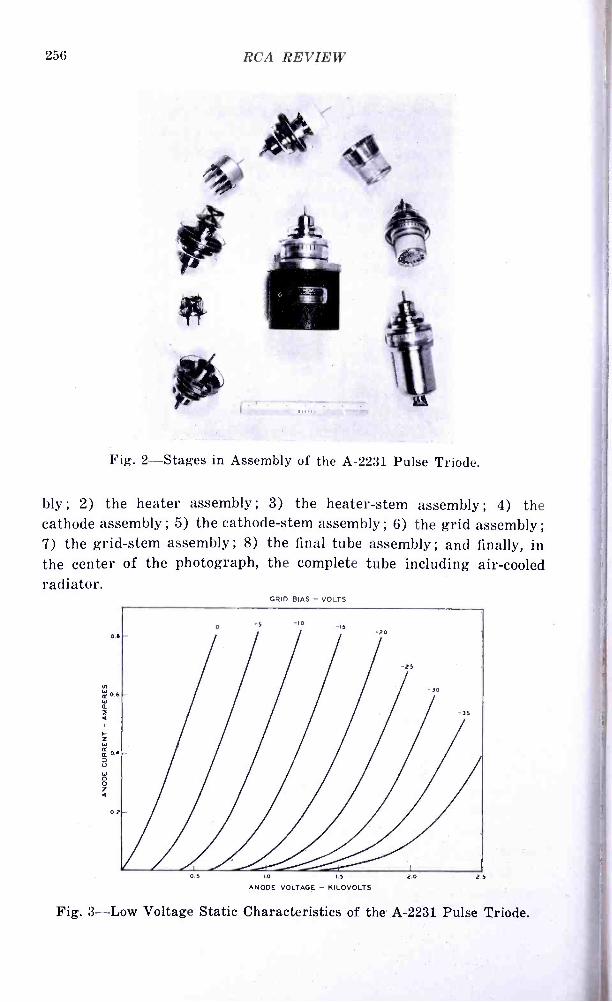
256 RCA REVIEW
Fig. 2- Stages in Assembly of the A -2231 Pulse Triode.
bly; 2) the heater assembly; 3) the heater -stem assembly; 4) the cathode assembly; 5) the cathode -stem assembly; 6) the grid assembly; 7) the grid -stem assembly; 8) the final tube assembly; and finally, in the center of the photograph, the complete tube including air -cooled radiator.
GRID BIAS - VOLTS
-5 -10 -15
-20
t5
05 1.5
ANODE VOLTAGE - KILOVOLTS
2.0 2.5
Fig. 3 -Low Voltage Static Characteristics of the A -2231 Pulse Triode.

PULSE TRIODES 257
The heater consists of twelve helical strands of 0.005 inch diameter tungsten wire suspended between tantalum supports. The heavy wires to be seen in the heater assembly serve only to align the heater until it is mounted on the stem. The heater circuit is from the central pin to the cathode support. A heater power of 120 watts, 16 amperes at 7.5 volts, is required.
The grid consists of 180 wires of 0.007 inch diameter platinum -clad- molybdenum5 spot welded to a nickel grid cap and heavy copper grid support cone. In the early designs, a relatively thin copper -plated -steel grid support cone was employed, but in an effort to provide better grid cooling, the heavy copper cone was substituted. As may be seen in the photograph, the grid wires are slightly twisted. Inasmuch as the grid surface is cylindrical, each individual wire has a slight outward bulge. This was found to be very important in practice. In the initial stages of development straight wires were used and many cathode -grid shorts resulted from wires inadvertently bowed inward. This circumstance is aggravated by the fact that if one of the wires is bowed inward more than its neighbors it will receive more than its proportionate share of the current and will become hotter and bow inward still farther.
Although there were miscellaneous mechanical problems and diffi- culties with cathode poisoning, the real obstacle was that of grid emis- sion. It was relatively easy to build tubes that would give 500 kilo- watts or even 700 kilowatts peak power at low duty, but as the average power was increased grid emission set in causing the efficiency and peak output to drop off.
To improve grid cooling, the grid was shortened and a massive copper grid flange and support cone were adopted. This provided a continuous heavy copper heat conducting path from the base of the grid wires to the external circuit. Unfortunately the elements required to provide flexibility between the glass and this massive copper grid flange led to low efficiency, possibly because of a shift in the position of the current maximum.
At this same stage in the development, circuit flashover in the anode cavity was also a serious problem. Although individual tubes could be tested in the pressurized circuit, it was undesirable that the final unit should operate under pressure. A major improvement was required. In the two -tube circuit, a pair of the original tubes gave 700 kilowatts before circuit sparkover, whereas a pair of the newer massive -grid- flange tubes was limited to about 500 kilowatts. Examination of the circuit flashover problem revealed that the radio -frequency voltage at
5 G. A. Espersen, "Fine Wires in the Electron -Tube Industry ", Proc. I. R. E., Vol. 34, No. 3, pp. 116 -120, March, 1946.
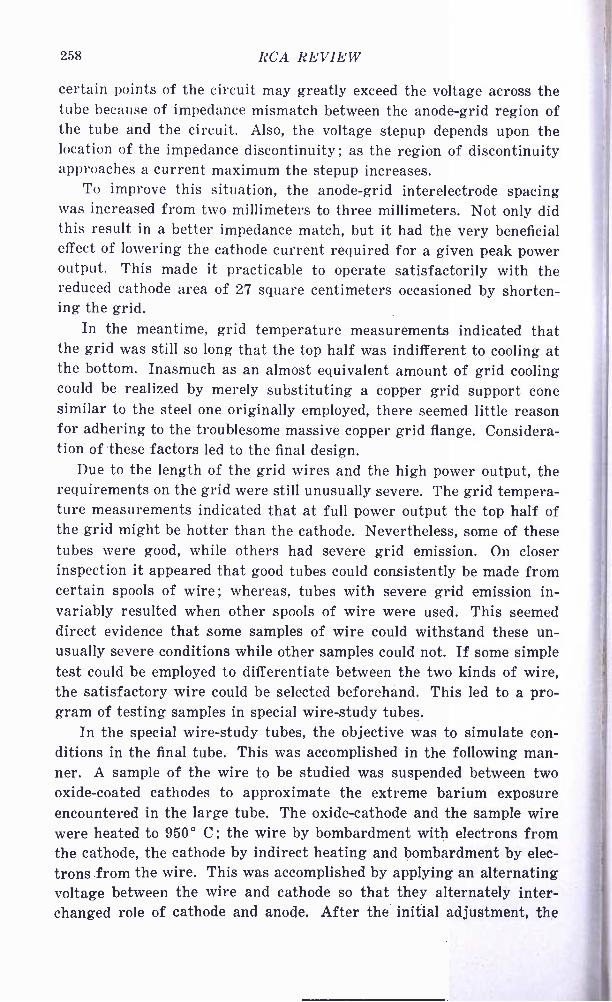
258 RCA REVIEW
certain points of the circuit may greatly exceed the voltage across the tube because of impedance mismatch between the anode -grid region of the tube and the circuit. Also, the voltage stepup depends upon the location of the impedance discontinuity ; as the region of discontinuity approaches a current maximum the stepup increases.
To improve this situation, the anode -grid interelectrode spacing was increased from two millimeters to three millimeters. Not only did this result in a better impedance match, but it had the very beneficial effect of lowering the cathode current required for a given peak power output. This made it practicable to operate satisfactorily with the reduced cathode area of 27 square centimeters occasioned by shorten- ing the grid.
In the meantime, grid temperature measurements indicated that the grid was still so long that the top half was indifferent to cooling at the bottom. Inasmuch as an almost equivalent amount of grid cooling could be realized by merely substituting a copper grid support cone similar to the steel one originally employed, there seemed little reason for adhering to the troublesome massive copper grid flange. Considera- tion of these factors led to the final design.
Due to the length of the grid wires and the high power output, the requirements on the grid were still unusually severe. The grid tempera- ture measurements indicated that at full power output the top half of the grid might be hotter than the cathode. Nevertheless, some of these tubes were good, while others had severe grid emission. On closer inspection it appeared that good tubes could consistently be made from certain spools of wire ; whereas, tubes with severe grid emission in- variably resulted when other spools of wire were used. This seemed direct evidence that some samples of wire could withstand these un- usually severe conditions while other samples could not. If some simple test could be employed to differentiate between the two kinds of wire, the satisfactory wire could be selected beforehand. This led to a pro- gram of testing samples in special wire -study tubes.
In the special wire -study tubes, the objective was to simulate con- ditions in the final tube. This was accomplished in the following man- ner. A sample of the wire to be studied was suspended between two oxide -coated cathodes to approximate the extreme barium exposure encountered in the large tube. The oxide -cathode and the sample wire were heated to 950° C; the wire by bombardment with electrons from the cathode, the cathode by indirect heating and bombardment by elec- trons from the wire. This was accomplished by applying an alternating voltage between the wire and cathode so that they alternately inter- changed role of cathode and anode, After the initial adjustment, the
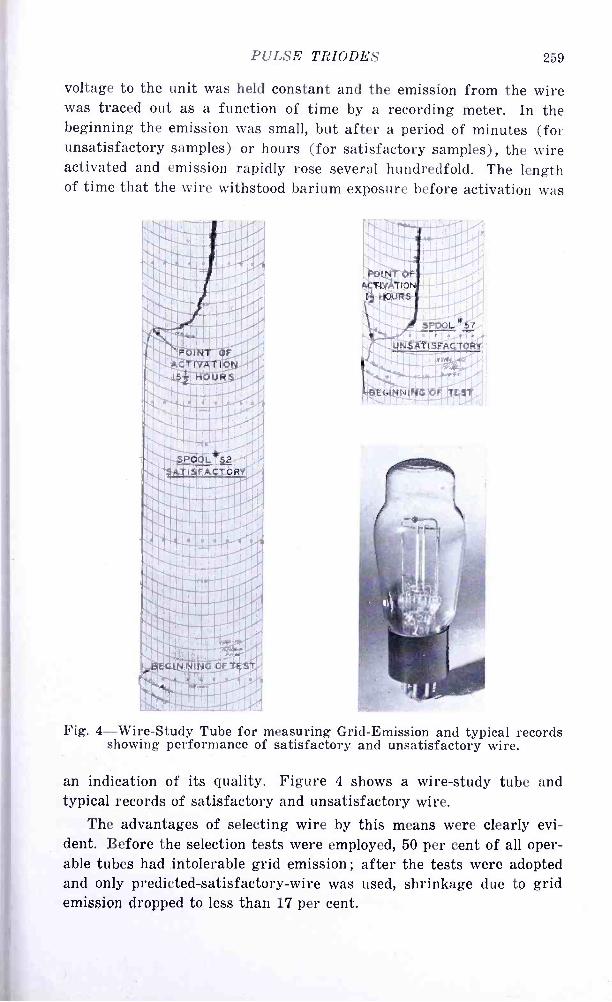
PULSE TRIODES 259
voltage to the unit was held constant and the emission from the wire was traced out as a function of time by a recording meter. In the beginning the emission was small, but after a period of minutes (for unsatisfactory samples) or hours (for satisfactory samples), the wire activated and emission rapidly rose several hundredfold. The length of time that the wire withstood barium exposure before activation was
POINT OF ACTIVATION 15z HOURS
, POINT OF ACTIVATION
HOURS
(EGINNIN6
S?OOL #57
UNSATISFACTORY
Fig. 4- Wire -Study Tube for measuring Grid -Emission and typical records showing performance of satisfactory and unsatisfactory wire.
an indication of its quality. Figure 4 shows a wire -study tube and typical records of satisfactory and unsatisfactory wire.
The advantages of selecting wire by this means were clearly evi- dent. Before the selection tests were employed, 50 per cent of all oper- able tubes had intolerable grid emission; after the tests were adopted and only predicted- satisfactory -wire was used, shrinkage due to grid emission dropped to less than 17 per cent.
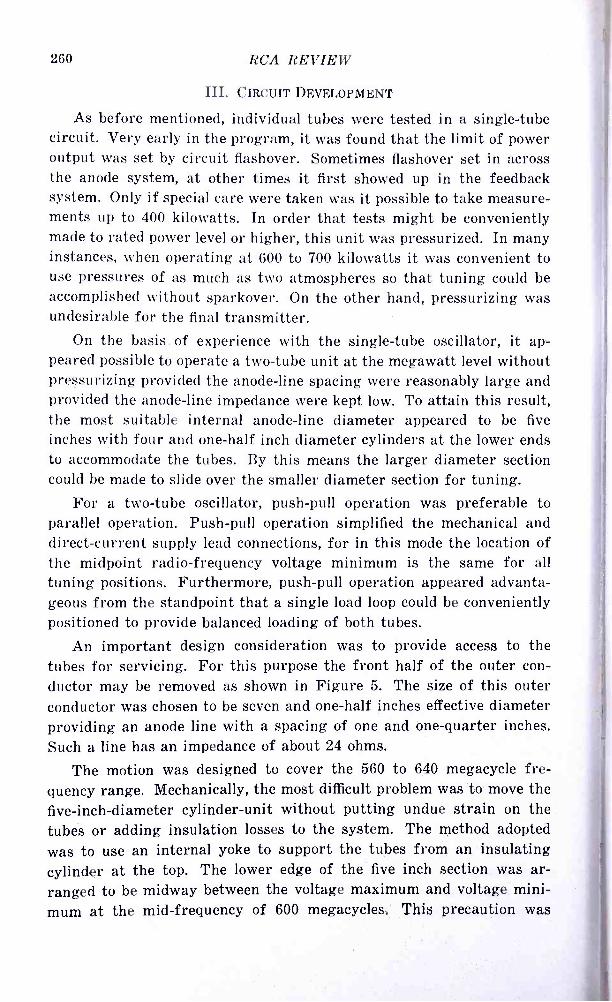
260 RCA REVIEW
III. CIRCUIT DEVELOPMENT
As before mentioned, individual tubes were tested in a single -tube circuit. Very early in the program, it was found that the limit of power output was set by circuit flashover. Sometimes flashover set in across the anode system, at other times it first showed up in the feedback system. Only if special care were taken was it possible to take measure- ments up to 400 kilowatts. In order that tests might be conveniently made to rated power level or higher, this unit was pressurized. In many instances, when operating at 600 to 700 kilowatts it was convenient to use pressures of as much as two atmospheres so that tuning could be accomplished without sparkover. On the other hand, pressurizing was undesirable for the final transmitter.
On the basis . of experience with the single -tube oscillator, it ap- peared possible to operate a two -tube unit at the megawatt level without pressurizing provided the anode -line spacing were reasonably large and provided the anode -line impedance were kept low. To attain this result, the most suitable internal anode -line diameter appeared to be five inches with four and one -half inch diameter cylinders at the lower ends to accommodate the tubes. By this means the larger diameter section could be made to slide over the smaller diameter section for tuning.
For a two -tube oscillator, push -pull operation was preferable to parallel operation. Push -pull operation simplified the mechanical and direct -current supply lead connections, for in this mode the location of the midpoint radio -frequency voltage minimum is the same for all tuning positions. Furthermore, push -pull operation appeared advanta- geous from the standpoint that a single load loop could be conveniently positioned to provide balanced loading of both tubes.
An important design consideration was to provide access to the tubes for servicing. For this purpose the front half of the outer con- ductor may be removed as shown in Figure 5. The size of this outer conductor was chosen to be seven and one -half inches effective diameter providing an anode line with a spacing of one and one- quarter inches. Such a line has an impedance of about 24 ohms.
The motion was designed to cover the 560 to 640 megacycle fre- quency range. Mechanically, the most difficult problem was to move the five -inch -diameter cylinder -unit without putting undue strain on the tubes or adding insulation losses to the system. The method adopted was to use an internal yoke to support the tubes from an insulating cylinder at the top. The lower edge of the five inch section was ar- ranged to be midway between the voltage maximum and voltage mini- mum at the mid -frequency of 600 megacycles. This precaution was
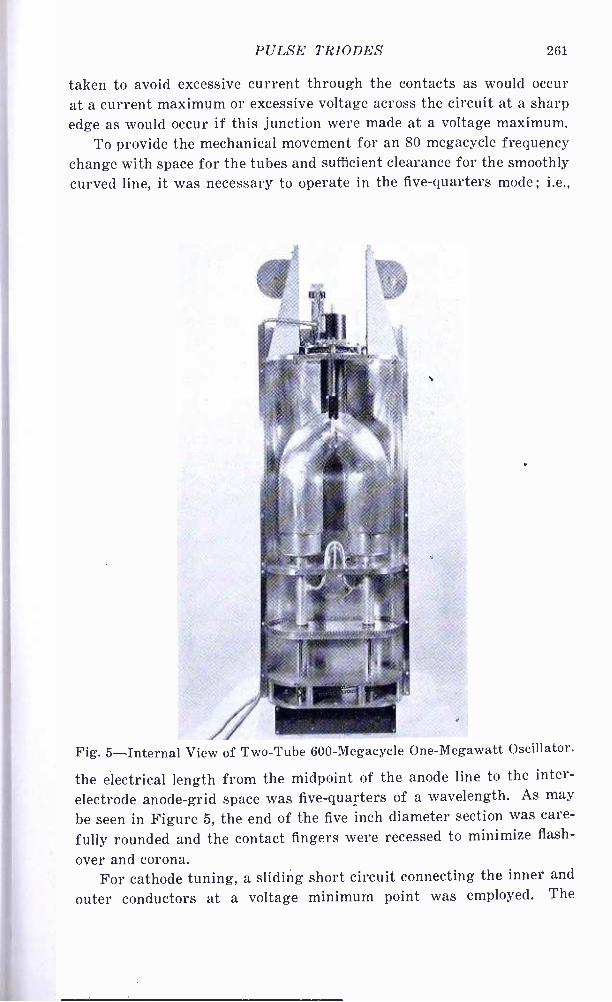
PULSE TRIODES 261
taken to avoid excessive current through the contacts as would occur at a current maximum or excessive voltage across the circuit at a sharp edge as would occur if this junction were made at a voltage maximum.
To provide the mechanical movement for an 80 megacycle frequency change with space for the tubes and sufficient clearance for the smoothly curved line, it was necessary to operate in the five- quarters mode; i.e.,
Fig. 5- Internal View of Two -Tube 600- Megacycle One -Megawatt Oscillator.
the electrical length from the midpoint of the anode line to the inter -
electrode anode -grid space was five -quarters of a wavelength. As may
be seen in Figure 5, the end of the five inch diameter section was care-
fully rounded and the contact fingers were recessed to minimize flash-
over and corona. For cathode tuning, a sliding short circuit connecting the inner and
outer conductors at a voltage minimum point was employed. The

262 RCA REVIEW
details of this part of the circuit may also be seen in Figure 5. The minimum operating line length was three -quarters of a wavelength since the tubes had an internal cathode -grid effective length of more than one -quarter wavelength at 600 megacycles. Condensers in the inner conductors made it possible to supply bias by external resistors.
During the course of the development, various feedback systems were examined. The first arrangement used a tuned loop common to the anode and cathode sections. Tuning was accomplished by an exter- nal stub. Various sizes of loops were tried, but none of them were as satisfactory as the untuned cathode -to- cathode loop shown in Figure 5. This untuned cathode -to- cathode loop had been previously developed by Dr. L. S. Nergaard for the A- 2212.4 This loop provided the same degree of feedback as the tuned loop; it practically eliminated the prob- lem of sparkover to the grid flange; and finally, it did away with one tuning control.
The load is coupled to the anode section of the oscillator by a loop adjacent to the grid flange. Care was taken to place this loop sym- metrically with respect to the ends of the anode line so as to equalize the load on the two tubes. This portion of the load line may be seen just behind the feedback loop in Figure 5. Other features of the load line and matching stubs may be seen in Figure 6. Because of the high voltage at the one megawatt level, it was desirable to use a three inch diameter load line.
Measurements of anode and cathode tuning indicated that the tun- ing of these systems was collinear within 2 per cent which was within the tolerance of the cathode tuning requirements. By using the proper gear ratio it was possible to combine the anode and cathode drive. A motor with speed rheostat and reversing switch makes it convenient to operate with remote control. This motor and the common driveshaft may also be seen in Figure 6.
IV. PERFORMANCE OF TUBES AND CIRCUIT
The performance of the final unit is indicated in Figure 7. This data was taken with a pulse length of 5.5 microseconds and a repetition rate of 180 pulses per second which corresponds to a duty cycle of 0.1 per cent. No change in performance was observed at lower duty cycles. Efficiency is defined as the ratio of peak power output to peak power input; the peak power input is defined as the product of anode voltage and anode current less the power loss in the 2.75 ohm cathode bias resistor.
This plot shows how the various factors depend upon anode voltage as anode voltage alone is varied. It will be observed that the peak

PULSE TRIODES
Fig. 6- External View of Two -Tube 600 -Megacycle One -Megawatt Oscillator.
c.
o
ANODE OR CATHODE CURRENT- AMPERES N
° ° ° ó og ó o o o 0
p PEAK POWER OUTPUT - MEGAWATTS O 0 0
W N N o
W 0 0 V P Ó N
o o O
f I I
r
Z {
0
g 4, 9ry00
OOcG g. >.`F A4,
OwFg , 4,l
1
o O
EFFICIENCY PERCENT
263
Fig. 7- Performance of Two -Tube 600 -Megacycle One- Megawatt Oscillator.

264 RCA REVIEW
power output increases almost as the five -halves power of the voltage while the cathode and anode current increase approximately as the three -halves power of the voltage. The peak power output reaches 1.1 megawatts at 14 kilovolts. Inasmuch as the duty cycle is 0.1 per cent, this corresponds to an average power of 1.1 kilowatts.
The fact that the plot of cathode current and anode current remain parallel and that the efficiency continues to rise with increased voltage and output is particularly significant. Even a trace of grid emission would manifest itself by lowering efficiency, while heavier grid emis- sion would give rise to disproportionally larger anode current at higher power levels.
The stability of the unit is demonstrated by the fact that the fre- quency may be varied throughout the 560 to 640 megacycle tuning range with no tendency toward sparkover at the maximum power level. No variation in performance was observed over this range. If the mechanical design were such as to permit greater motion of the adjust- able elements, the tuning range could undoubtedly be extended.
Tests of individual tubes in the single -tube circuit were run at 710 megacycles. The performance at this frequency was indistinguishable from that obtained in the 560 to 640 megacycle range. Preliminary tests indicate that these tubes will perform well at 1200 megacycles.

A METHOD OF MEASURING THE DEGREE OF MODULATION OF A TELEVISION SIGNAL*
BY
T. J. BUZALSKI
Engineering Department, National Broadcasting Company, Inc. New York, N. Y.
Summary -A method of measuring the degree of modulation on a stand- ard television, signal is described. The double sideband output of the trans mitter energizes a linear diode monitor, the output of which contains direct current component in addition to the visual signal. Means are pro. vided to interrupt this composite signal periodically by short -circuiting the diode output load impedance for a brief interval, thus establishing a refer- ence zero signal. The resultant modified signal, including the zero reference level, may be observed by means of a. cathode ray oscilloscope capable of handling only alternating current signals. The trace on the face of the oscilloscope will contain all of the information required to measure the degree of modulation attained.
INTRODUCTION
THE need for determining the degree of modulation which was attained on the signal radiated by a television transmitter was apparent very soon after experiments were begun with televi-
sion transmission. Most of the modulation monitoring methods which were developed for sound broadcasting were not applicable to tele- vision broadcasting. The method of measuring the degree of modula- tion by observing the carrier frequency envelope on a cathode -ray oscilloscope was applicable to television provided that the information given by the trace was properly interpreted. The current television standards require that the carrier envelope achieve maximum ampli- tude at the peak of the synchronizing signal and that this maximum amplitude shall be independent of light and shade in the picture signal. As a consequence of this method of operation, the peak carrier envelope amplitude becomes a constant, whereas the average carrier envelope amplitude becomes a variable dependent upon the content of the picture signal. Therefore, modulation measurements under existing standards for television transmission must be made in terms of the peak carrier envelope amplitude, in contrast to sound broadcasting practice, wherein such measurements would be referred to the constant which in that case would be average carrier envelope amplitude.
When the radio frequency envelope of the visual transmitter was
* Decimal Classification: R254.1.
265
266 RCA REVIEW
monitored on a cathode -ray oscilloscope, the operators were in a position to assert with confidence that the signals being radiated were in accord- ance with the current standards. This method was reasonably satisfac- tory, but the location of the cathode -ray oscilloscope was determined by the probable accuracy of results rather than by operating convenience. The cathode -ray oscilloscope, a relatively expensive piece of equipment, was made unavailable for other purposes when frequent monitoring of the radio frequency envelope was considered necessary. A more expedi- ent method of obtaining the information offered by the cathode -ray oscilloscope envelope monitoring method had been sought for some time.
An article by A. W. Russell' suggested the use of a vibrating switch to "preserve the direct current level in oscillograph amplifiers." While the usefulness of this method in studying the operating characteris- tics of many vacuum tube circuits was immediately evident, its applica- tion to the measurement of modulation was not conceived until several months had elapsed. During the course of the experimenting which fol- lowed, the switching mechanism which was used became identified as the "Vibroswitch."
A diode rectifier, which derived its signal from the coaxial radio frequency transmission line between the transmitter and the vestigial sideband filter, has been used for many years as a radio monitor. The quality of the picture was observed on a kinescope while the wave form and amplitude of the composite signal were observed on a cathode ray oscilloscope as a regular operating procedure. The "Vibroswitch" was applied to the diode monitoring system.
THEORY
The circuit diagram of the diode rectifier, "Vibroswitch," and cathode ray oscilloscope arrangement is shown in Figure 1. When the circuit constants have been properly chosen, the instantaneous potential difference developed across the diode load impedance Ze is substantially proportional to the instantaneous carrier envelope amplitude. In a con- stant peak carrier amplitude system of modulation (direct current transmission), which is currently standard for television, the peak carrier amplitude is attained during the synchronizing pulse interval. The minimum carrier amplitude occurs when a maximum white signal is present. If the modulation were complete during a given maximum white interval, the concurrent instantaneous carrier envelope amplitude would be zero, and as a result the concurrent instantaneous potential
1 A. W. Russell, "Preserving the D. C. Level in Oscillograph Ampli- fiers," Electronic Engineering, Vol. XV, No. 175, page 173, Sept., 1942.
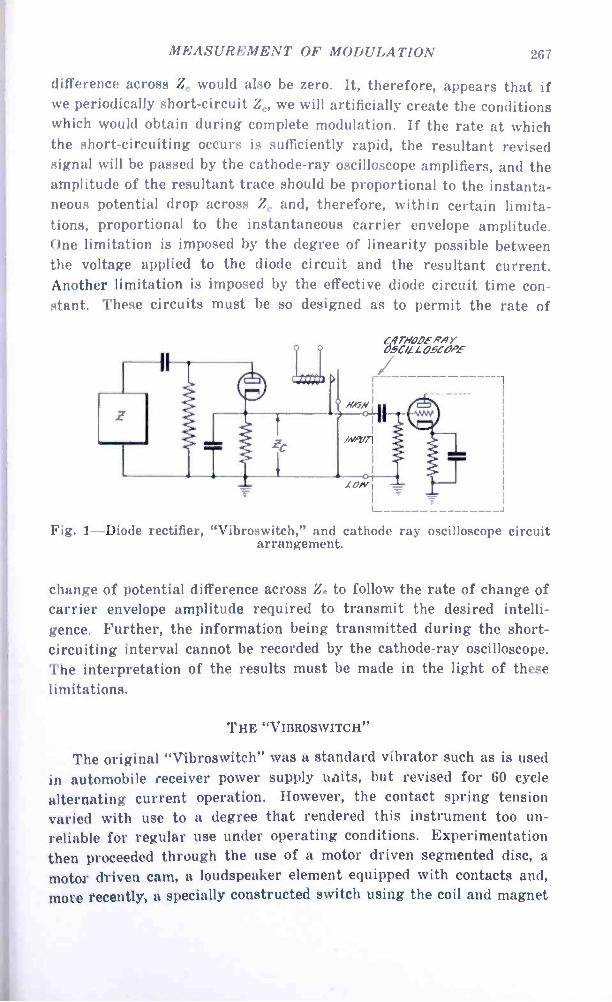
MEASUREMENT OF MODULATION 267
difference across Ze would also be zero. It, therefore, appears that if we periodically short- circuit Ze, we will artificially create the conditions which would obtain during complete modulation. If the rate at which the short- circuiting occurs is sufficiently rapid, the resultant revised signal will be passed by the cathode -ray oscilloscope amplifiers, and the amplitude of the resultant trace should be proportional to the instanta- neous potential drop across Ze and, therefore, within certain limita- tions, proportional to the instantaneous carrier envelope amplitude. One limitation is imposed by the degree of linearity possible between the voltage applied to the diode circuit and the resultant current. Another limitation is imposed by the effective diode circuit time con- stant. These circuits must be so designed as to permit the rate of
Cif MODE RAY 05C/LL05COPE
---------- NA';,N
-..
o
/N/V71
L0/VI
J
Fig. 1 -Diode rectifier, "Vibroswitch," and cathode ray oscilloscope circuit arrangement.
change of potential difference across Z. to follow the rate of change of carrier envelope amplitude required to transmit the desired intelli- gence. Further, the information being transmitted during the short - circuiting interval cannot be recorded by the cathode -ray oscilloscope. The interpretation of the results must be made in the light of these limitations.
THE "VIBROSWITCH"
The original "Vibroswitch" was a standard vibrator such as is used in automobile receiver power supply units, but revised for 60 cycle
alternating current operation. However, the contact spring tension varied with use to a degree that rendered this instrument too un- reliable for regular use under operating conditions. Experimentation then proceeded through the use of a motor driven segmented disc, a
motor driven cam, a loudspeaker element equipped with contacts and,
more recently, a specially constructed switch using the coil and magnet
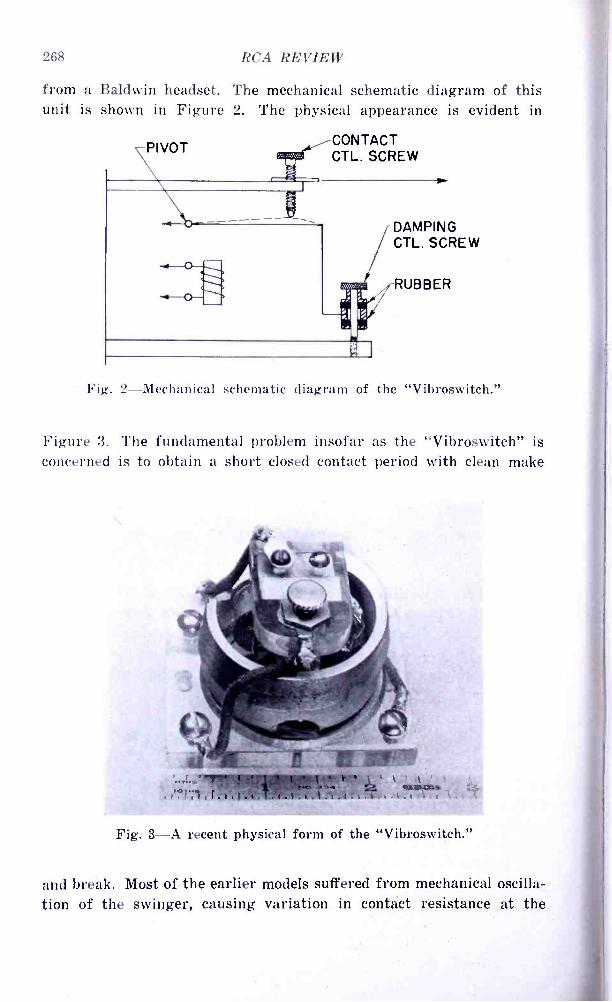
268
from a Baldwin headset. unit is shown in Figure
RCA REVIEW
The mechanical schematic diagram of this 2. The physical appearance is evident in
CONTACT CTL. SCREW
/ DAMPING CTL. SCREW
RUBBER
Fig. 2- Mechanical schematic diagram of the "Vibroswitch."
Figure 3. The fundamental problem insofar as the "Vibroswitch" is concerned is to obtain a short closed contact period with clean make
Fig. 3 -A recent physical form of the "Vibroswitch."
and break. Most of the earlier models suffered from mechanical oscilla- tion of the swinger, causing variation in contact resistance at the
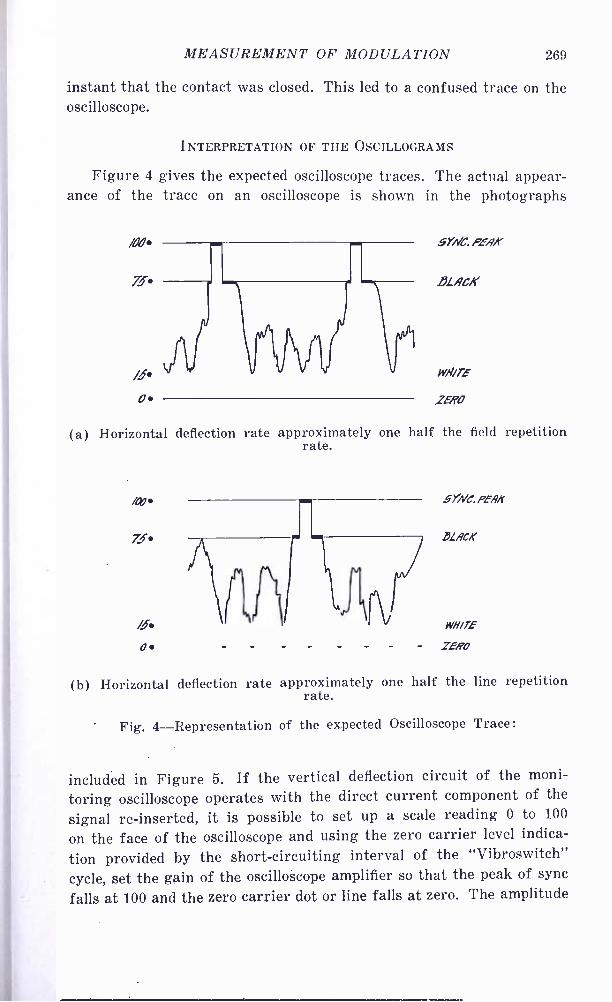
MEASUREMENT OF MODULATION 269
instant that the contact was closed. This led to a confused trace on the oscilloscope.
INTERPRETATION OF THE OSCILLOGRAMS
Figure 4 gives the expected oscilloscope traces. The actual appear- ance of the trace on an oscilloscope is shown in the photographs
WRITE
ZERO
(a) Horizontal deflection rate approximately one half the field repetition rate.
7.S
fi
/5 0
v
5YWC. PEf!/(
13LACK
WHITE
- ZERO
(b) Horizontal deflection rate approximately one half the line repetition rate.
Fig. 4- Representation of the expected Oscilloscope Trace:
included in Figure 5. If the vertical deflection circuit of the moni-
toring oscilloscope operates with the direct current component of the
signal re- inserted, it is possible to set up a scale reading 0 to 100
on the face of the oscilloscope and using the zero carrier level indica-
tion provided by the short -circuiting interval of the "Vibroswitch"
cycle, set the gain of the oscilloscope amplifier so that the peak of sync
falls at 100 and the zero carrier clot or line falls at zero. The amplitude
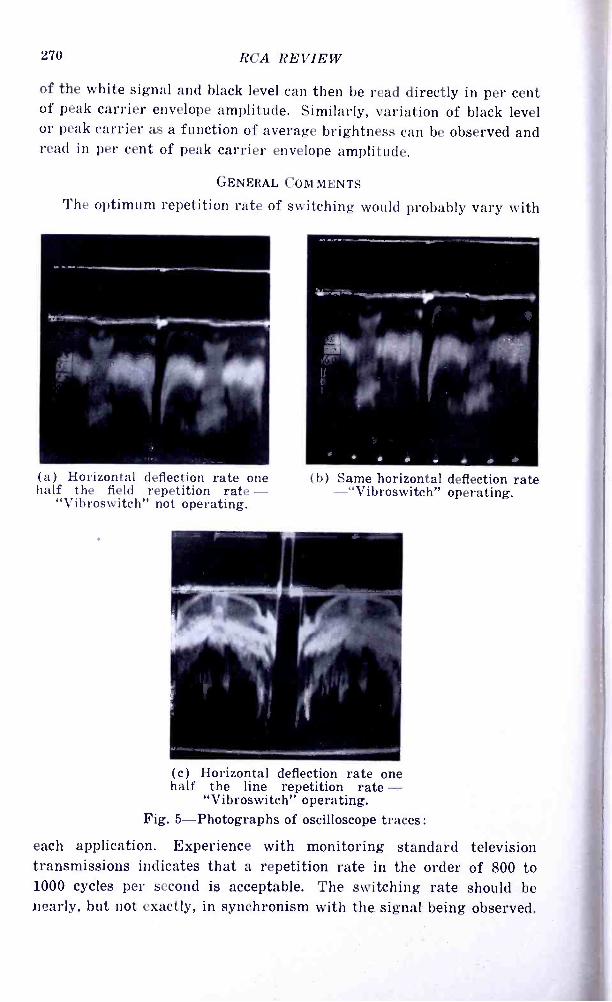
270 RCA REVIEW
of the white signal and black level can then be read directly in per cent of peak carrier envelope amplitude. Similarly, variation of black level or peak carrier as a function of average brightness can be observed and read in per cent of peak carrier envelope amplitude.
GENERAL COMMENTS
The optimum repetition rate of switching would probably vary with
(a) Horizontal deflection rate one half the field repetition rate -
"Vibroswitch" not operating.
(b) Same horizontal deflection rate -"Vibroswitch" operating.
(c) Horizontal deflection rate one half the line repetition rate -
"Vibroswitch" operating. Fig. 5- Photographs of oscilloscope traces:
each application. Experience with monitoring standard television transmissions indicates that a repetition rate in the order of 800 to 1000 cycles per second is acceptable. The switching rate should be nearly, but not exactly, in synchronism with the signal being observed.

MEASUREMENT OF MODULATION 271
The mark or short -circuiting interval should be short, perhaps on the order of 10 per cent, but long enough so that there can be no doubt that the circuit has been fully discharged and that a positive mark is evi- dent at the zero carrier level. The cathode ray oscilloscope amplifiers must be linear over a sufficient swing to pass the composite signal without compression.
Measurements of black level in per cent of peak carrier envelope amplitude, white signal in per cent of peak carrier envelope amplitude, and variation of black level as a function of average brightness using the "Vibroswitch" technique have been checked against the envelope cathode ray oscilloscope method. The results of the two methods were found to be in substantial agreement.
This device permits measurements on low power equipment which would not provide sufficient voltage to deflect the plates of an envelope cathode ray oscilloscope directly.
ACKNOWLEDGMENT
The actual device described herein is the result of the work of many engineers who have been associated with the author. Their contribu- tions have been directly responsible for the processing of an "idea" into a practical and useful tool.

DEVELOPMENT OF AN ULTRA LOW LOSS TRANS- MISSION LINE FOR TELEVISION':
BY
E. O. JOHNSON
Engineering Department, RCA Victor Division, Camden, N. J.
Summary -The development of a low loss 300 -ohm parallel wire poly- ethylene dielectric transmission line is described. Loss curves, as well as a photograph of a production run sample of the line, are included.
INTRODUCTION
TRANSMISSION lines for use on home television receiver in- stallations have been very unsatisfactory to date primarily because of their very high losses. In addition to the high signal
attenuation these lines have had many other undesirable characteris- tics.
Twisted Pair Lines
Transmission line losses in twisted pair lines have been so great that installation men have recommended installing television receivers on top floors in buildings so as to shorten the transmission line and thereby improve the signal intensity by eliminating as much of the transmission line loss as possible. It was not uncommon to find a receiver installation within a mile of the transmitting antenna that did not have sufficient signal to override the local noise level. Two such installations recently investigated had transmission lines 600 and 400 feet in length and attenuations of 400 to 1 and 275 to 1 respectively. Each of these installations was less than a mile from the transmitting antenna and there was not enough signal to operate the receivers satis- factorily due to the long length of high loss transmission line used. Typical line losses varied from 5 to 12 decibels per 100 feet at 50 mega- cycles.
The manufacture of transmission lines has involved many different operations with a resultant high cost. Typical construction is as follows :
(a) Small gauge copper wire is tinned so as to prevent corrosion from the various compounds in the wire covering.
* Decimal Classification: R320.41.
272
TRANSMISSION LINE 273
(b) The small tinned copper conductors are twisted forming a flex- ible stranded conductor.
(c) The stranded conductor is rubber covered.
(d) Two of the stranded rubber covered conductors are twisted together.
(e) The twisted pair is rubber covered. (On the less expensive lines this operation is omitted.)
(f) A cotton braid is placed over the line to prevent the rubber from deteriorating in the sunlight.
(g) The line is given an impregnating dip in an asphaltic com- pound for weatherproofing.
Coaxial Lines
Coaxial cables and twin coaxial cables having medium loss charac- teristics have been available for some time. However, the cost of these lines has been so high as to prohibit their general use on home televi- sion receiver installations. One example is a twin coaxial cable having a loss of 1.4 decibels per 100 feet at 50 megacycles and selling for $1.25 per foot. The average home receiver installation requires 70 feet of transmission line, thus making a total cost of $87.50 for the transmis- sion line alone. Therefore, practically all of the home receiver installa- tions have been made with one of the twisted pair lines.
DEVELOPMENTAL SPECIFICATIONS OF LINE
The developmental problem was to produce a line that did not have the undesirable characteristics previously enumerated. The following developmental specifications were established.
(a) Low Loss -Loss should be less than any twisted pair of coaxial transmission line available in the pre -war period for the re- ceiver installation. 1 decibel per hundred feet at 50 megacycles was set as the goal.
(b) Low Cost -The manufacturing cost of the line should be very low to permit the installation of both the receiver and antenna in the most desirable locations. A goal of six cents a foot list price was established.
(c) Weather Resistance -The average life of transmission lines used in the pre -war period was very low. In a few months the cotton braid failed and the sunlight hardened the rubber cover- ing which cracked and permitted the absorption of moisture
274 RCA REVIEW
with a resultant increase in line losses. A minimum life of five years was desired for the new line.
(d) Deterioration Due to Heat -The asphaltic impregnating com- pounds used on the cotton braided lines softened and came off on the hands, clothing, woodwork, furniture and rugs in hot weather. The elimination of this undesirable characteristic was of primary importance.
(e) Flexibility at Low Temperatures -The asphaltic impregnating compounds used on the cotton braided lines hardened in cold weather and movement on the line during installation, or by the wind after installation, caused the line to crack and break the cotton fibers in the braid. This soon resulted in failure of the line insulation. The new line should be flexible under all temperature conditions.
DEVELOPMENT OF THE LINE
Work was begun to develop a transmission line meeting the specifi- cations outlined above. A thorough check was made on all available transmission lines to determine what might be done to reduce their electrical loss.
With a parallel wire type of transmission line the loss varies in- versely with impedance (See Figure 1). If such a transmission line has an impedance of 72 ohms and a loss of 6 decibels per hundred feet at 50 megacycles and the wires are separated far enough to produce an impedance of 144 ohms, the loss will decrease to 3 decibels per hundred feet at 50 megacycles or one half of its original value. It was thought that a high impedance transmission line of the conventional twisted pair type could be produced which would meet the specifications. How- ever, it was found that the maximum improvement that could be obtained by increase in impedance was about 2:1.
(1) Dielectric
Along with the work on conventional transmission lines, one manu- facturer developed a parallel wire transmission line with a spun glass woven web. This line had excellent low loss characteristics which met the loss specifications. However, the line was very hygroscopic and required impregnation. Eventually several good weather - proofing com- pounds were found which did not increase the line loss appreciably. The cost of this line however did not meet the tentative specifications.
Prior to the war, research work was done by this company on some relatively high impedance parallel wire transmission lines insulated
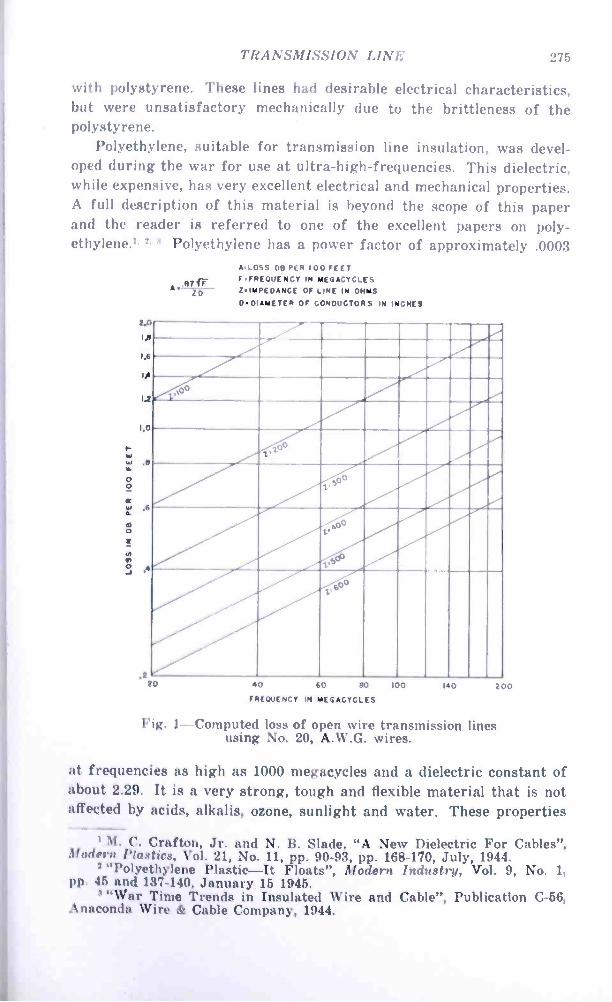
TRANSMISSION LINE 275
with polystyrene. These lines had desirable electrical characteristics, but were unsatisfactory mechanically due to the brittleness of the polystyrene.
Polyethylene, suitable for transmission line insulation, was devel- oped during the war for use at ultra -high -frequencies. This dielectric, while expensive, has very excellent electrical and mechanical properties. A full description of this material is beyond the scope of this paper and the reader is referred to one of the excellent papers on poly- ethylene. 2.3 Polyethylene has a power factor of approximately .0003
A.B7fF ID
ALOSS OB PER 100 FEET FFREOUENCY IN MEGACYCLES Z IMPEDANCE OF LINE IN OHMS
D DIAMETER OF CONDUCTOR S IN INCHES
2.0
1.2
1.6
IA
1.2
I.0
.0
6
.4
.2 20 40 60 BO 100
FREQUENCY IN MEGACYCLES
140 200
Fig. 1- Computed loss of open wire transmission lines using No. 20, A.W.G. wires.
at frequencies as high as 1000 megacycles and a dielectric constant of about 2.29. It is a very strong, tough and flexible material that is not affected by acids, alkalis, ozone, sunlight and water. These properties
' M. C. Crafton, Jr. and N. B. Slade, "A New Dielectric For Cables ", Modern Plastics. Vol. 21, No. 11, pp. 90 -93, pp. 168 -170, July, 1944.
2 "Polyethylene Plastic -It Floats ", Modern Industry, Vol. 9, No. 1, pp. 45 and 137 -140, January 15 1945.
"'War Time Trends in Insulated Wire and Cable ", Publication C -56, Anaconda Wire & Cable Company, 1944.
276 RCA REVIEW
make it an outstanding dielectric for use at high- and ultra- high -fre- quencies. Several experimental lines were made of both twisted pair and parallel wire types. Measurements and field tests on these samples indicated a line could be constructed using polyethylene as the dielec- tric that would meet the specifications.
(2) Line Conductors
The conductor should be stranded to give the required flexibility and prevent breakage during use. The choice of conductor size is a compromise between mechanical strength, line loss and cost. Past experience on transmission lines proved that seven strands of No. 28 AWG would meet the structural requirements. A conductor of this size was also found to be satisfactory from the standpoint of line loss and cost. In the past transmission lines have had the copper conductors tinned because the bare copper wire was attacked by the various com- pounds in the insulating materials. Polyethylene is very inert and con- tains nothing that will react on copper, therefore bare copper con- ductors can be used. This is a fortunate condition because a lower loss line is obtained at reduced cost. At 100 megacycles the radio frequency currents are all on the outer surface of the conductors. As a matter of fact, the skin depth at this frequency is only .00067 inches. This means that with tinned wire most of the current is flowing in the tin surface layer, and since tin is a poorer conductor than copper the line loss is increased. The reduction in cost is an important item since the cost of the tin is saved as well as the expense of the tinning operation.
(3) Line Impedance
The development of the transmission line departs radically from past practices in connection with its surge impedance. Most of the transmission lines used in conjunction with television receivers have had surge impedances of between 70 and 125 ohms. A resonant dipole in free space has an impedance of approximately 72 ohms, therefore a 72 -ohm line gives the best transfer of power when it is desired to receive signals on but one frequency. The problem of receiving tele- vision signals on a number of television bands is an entirely different problem. If a one -half wave dipole is designed to be resonant at 50 megacycles and used as an antenna, it will have an impedance of approx- imately 72 ohms at 50 megacycles and an impedance of about 2000 ohms at 100 megacycles. If a reflector is used in connection with this dipole the antenna's impedance can be as low as 200 ohms. Therefore the antenna's impedance may vary from some 20 ohms to 2000 ohms.
TRANSMISSION LINE 277
If a fixed antenna is to be used to cover a two -to -one or greater frequency range, it is desirable to use a line having an impedance such as to provide a maximum amount of energy over the desired frequency band. The line impedance would then be something less than one half the difference between the lowest and highest value of impedance, probably near 600 ohms. The actual value of optimum impedance is a complex affair and dependent upon many things such as the frequency response of the antenna, type of antenna load, impedance of antenna load, loss characteristics of the trasmission line, and other factors. It is sufficient to say here that the value of impedance would in all cases be many times higher than 72 ohms or the impedance of transmission lines used in the past. From an electrical viewpoint the line impedance should be high and probably between 300 to 600 ohms with the higher value of impedance favored, because the line loss is inversely propor- tional to its impedance for any given set of conditions.
There are, however, other considerations which have a bearing on line impedance. The line should be of such a size that standard hard- ware equipment can be used for the installation of the line. Standard bakelite screw eyes have a 9/16" hole. This type of screw eye has been produced by various manufacturers for years.and represents a standard transmission line support. The outside dimensions of the line should not be greater than 9/16" if standard hardware equipment is to be used. With seven strands No. 28 AWG conductors this will limit the line impedance to a maximum value of about 400 ohms.
The amount of polyethylene used in a web line construction is ap- proximately proportional to the square of the conductor spacing. If the web spacing is doubled the thickness of the web must also be doubled to maintain good mechanical design and have the web of suffi- cient thickness that the line cannot be crushed by the hands during installation and use. The use of a minimum amount of polyethylene favors lower line impedance.
The line impedance therefore should be approximately 300 to 400 ohms, with the cost favoring the lower value and the line losses favor- ing the higher value. A folded dipole antenna has an impedance of 288 ohms and was a deciding factor in choosing a line impedance of 300
ohms as the best value to give an ultra low loss transmission line for a minimum cost. The folded dipole is useful in receiving signals in a relatively narrow frequency band and provides a higher signal level than is obtained from simple wide band antennas.
The 300 -ohm line used in connection with a half wave dipole gives a broad frequency response and permits multi -channel reception with- out cutting the antenna elements or changing their spacing as has been
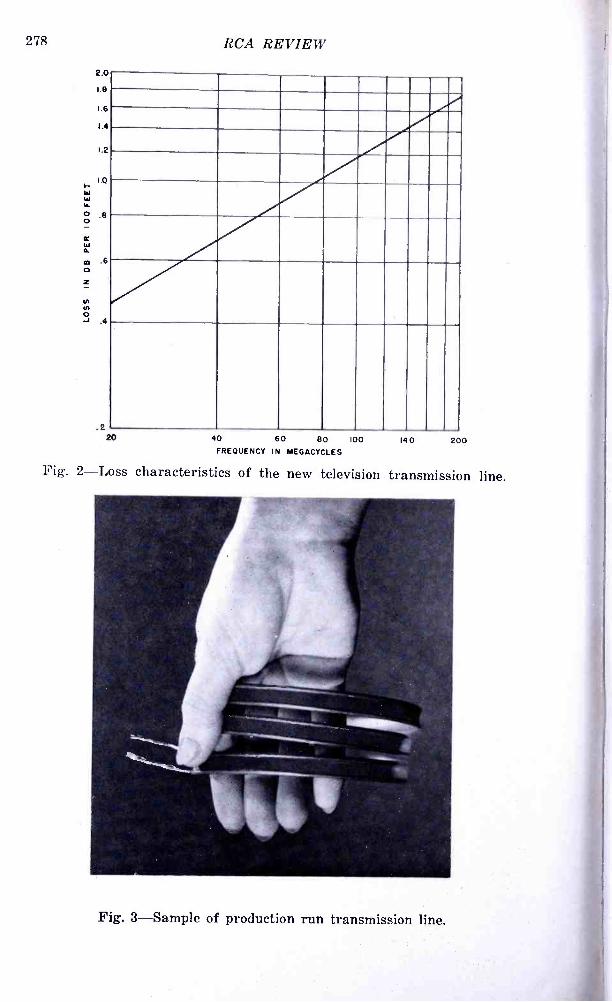
278 RCA REVIEW
2.0
1.9
1.6
1.4
1.2
1.0
.2 20 40 60 80 100
FREQUENCY IN MEGACYCLES
140 200
Fig. 2 -Loss characteristics of the new television transmission line.
Fig. 3- Sample of production run transmission line.
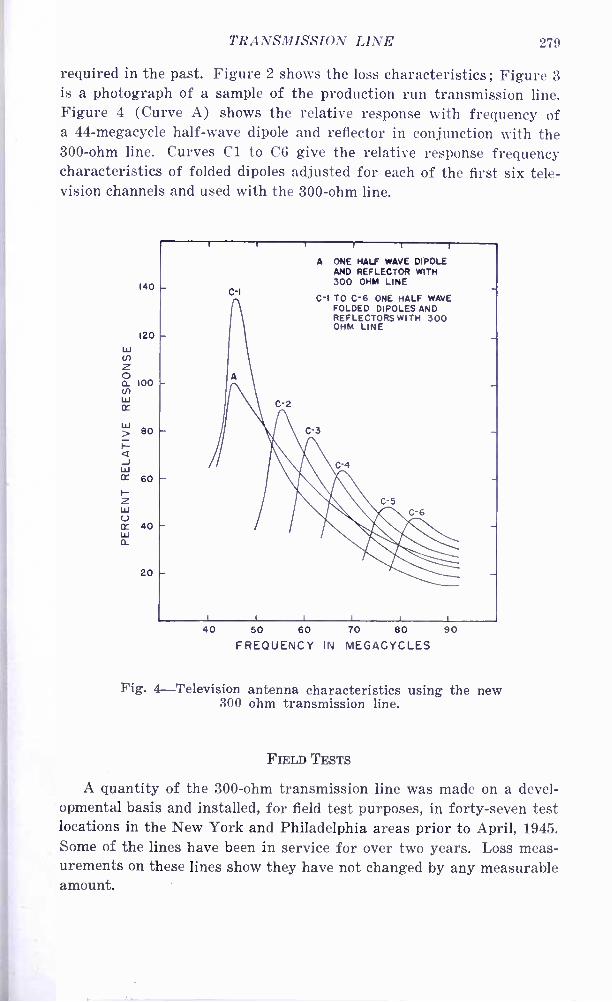
TRANSMISSION LINE 279
required in the past. Figure 2 shows the loss characteristics ; Figure 3 is a photograph of a sample of the production run transmission line. Figure 4 (Curve A) shows the relative response with frequency of a 44- megacycle half -wave dipole and reflector in conjunction with the 300 -ohm line. Curves Cl to C6 give the relative response frequency characteristics of folded dipoles adjusted for each of the first six tele- vision channels and used with the 300 -ohm line.
140
120
w
z o a 100
w Cr
j 80
H Q J w Cr 60 H z w V Cr 40 w a
20
C-I
A ONE HALF WAVE DIPOLE AND REFLECTOR WITH 300 OHM LINE
C-I TO C-6 ONE HALF WAVE FOLDED DIPOLES AND REFLECTORS WITH 300 OHM LINE
40 50 60 70 80 90 FREQUENCY IN MEGACYCLES
Fig. 4- Television antenna characteristics using the new 300 ohm transmission line.
FIELD TESTS
A quantity of the 300 -ohm transmission line was made on a devel- opmental basis and installed, for field test purposes, in forty -seven test locations in the New York and Philadelphia areas prior to April, 1945. Some of the lines have been in service for over two years. Loss meas- urements on these lines show they have not changed by any measurable amount.
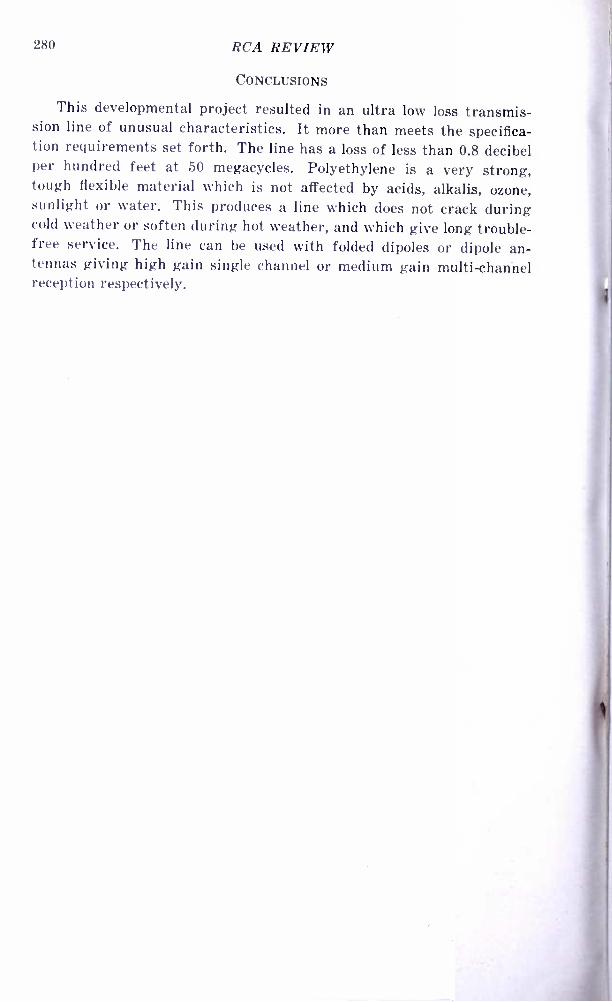
280 RCA REVIEW
CONCLUSIONS
This developmental project resulted in an ultra low loss transmis- sion line of unusual characteristics. It more than meets the specifica- tion requirements set forth. The line has a loss of less than 0.8 decibel per hundred feet at 50 megacycles. Polyethylene is a very strong, tough flexible material which is not affected by acids, alkalis, ozone, sunlight or water. This produces a line which does not crack during cold weather or soften during hot weather, and which give long trouble - free service. The line can be used with folded dipoles or dipole an- tennas giving high gain single channel or medium gain multi -channel reception respectively.

TECHNICAL PAPERS BY RCA AUTHORS-¡-
First Quarter, 1946
Any requests for copies of papers listed herein should be addressed directly to the publication to which credited.
F. G. Albin, "Intermodulation Distortion of Low Frequencies in Sound Film Recording ", Jour. Soc. Mot. Pic. Eng., January, 1946.
J. J. Alesi, "Gimbels and RCA Test Intra -Store Television ", Broadcast News, January, 1946.
J. B. Atwood -see H. O. Peterson, "Observations and Comparisons on Radio Telegraph Signaling by Frequency Shift and On -Off Keying ".
A. Badmaieff, "Push -Pull Frequency Modulated Circuit and Its Application to Vibratory Systems ", Jour. Soc. Mot. Pic. Eng., January, 1946.
R. F. Baker -see J. Hillier, "On the Improvement of Resolution in Electron Diffraction Cameras ".
G. L. Beers, "Radio -1945 ", American Year Book, 1946.
G. L. Beers and B. E. Shackelford, "Radio : Scientific Developments ", Ency- clopedia Brittanica Year Book, 1946.
G. L. Beers and B. E. Shackelford, "Television : United States ", Encyclo- pedia Brittanica Year Book, 1946.
R. A. Bierwirth -see G. H. Brown, "Radio- Frequency Dehydration of Penicillin Solution ".
W. H. Bohlke and N. M. Brisbin, "Practical Aspects of Television ", RCA Rad. Serv. News, February, 1946.
H. A. Brelsford, "Measurement of Small Running Torques with a Driving - Type Dynamometer ", Product Eng., February, 1946.
M. M. Brisbin -see W. H. Bohlke, "Practical Aspects of Television ".
G. H. Brown, R. A. Bierwirth and C. N. Hoyler, "Radio- Frequency Dehy- dration of Penicillin Solution ", Proc. I. R. E., February, 1946.
I. F. Byrnes, "Merchant Marine Radar ", RCA REVIEW, March, 1946.
J. L. Ciba, "Multi -Unit Construction -A Feature of New FM Transmitters ", Broadcast News, January, 1946.
D. R. Crosby and C. H. Pennypacker, "Radio- Frequency Resistors as Uni- form Transmission Lines ", Proc. I. R. E., February, 1946.
J. B. Epperson, "The 77 -D Polydirectional Microphone ", Broadcast News, January, 1946.
t Report all corrections or additions to RCA REVIEW, Radio Corporation of America, RCA Laboratories Division, Princeton, New Jersey.
281
282 RCA REVIEW
D. W. Epstein and L. Pensak, "Improved Cathode -Ray Tubes with Metal - Backed Luminescent Screens ", RCA REVIEW, March, 1946. F. C. Everett, "Range Prediction Chart for FM Stations ", Broadcast News, January, 1946 (Reprinted from Communications, November, 1945).
D. Ewing -see P. J. Herbst, "The Teleran Proposal ". W. J. Frantz, "The Transmission of a Frequency -Modulated Wave Through a Network ", Proc. I. R. E., March, 1946. G. L. Fredendall, K. Schlesinger, and A. C. Schroeder, "Transmission of Television Sound on the Picture Carrier ", Proc. I. R. E., Febru- ary, 1946.
C. N. Gillespie, "Compensating Amplifier ", Electronics, March, 1946. H. E. Goldstine -see H. O. Peterson, "Observations and Comparisons on Radio Telegraph Signaling by Frequency Shift and On -Off Keying ".
G. E. Hansell -see H. O. Peterson, "Observations and Comparisons on Radio Telegraph Signaling by Frequency Shift and On -Off Keying ".
H. E. Haynes, "Integrating Meter for Measurement of Fluctuating Volt- ages", Jour. Soc. Mot. Pic. Eng., February, 1946. P. J. Herbst, I. Wolff, D. Ewing and L. F. Jones -"The Teleran Proposal ", Electronics, February, 1946.
E. W. Herold, "Local Oscillator Radiation and Its Effect on Television Pic- ture Contrast ", RCA REVIEW, March, 1946.
J. Hillier and R. F. Baker, "On the Improvement of Resolution in Electron Diffraction Cameras ", Jour. Appl. Phys., January, 1946. C. N. Hoyler -see G. H. Brown, "Radio- Frequency Dehydration of Penicillin Solution ".
H. M. Hucke, "Radar in Aviation ", Radio Age, January, 1946. R. Hutchens, "RCA Time -Division Multiplex ", Relay, February, 1946. L. F. Jones, "The Story of Teleran ", Radio Age, January, 1946. L. F. Jones -see P. J. Herbst, "The Teleran Proposal ".
R. D. Kell and G. C. Sziklai, "Image Orthicon Camera ", RCA REVIEW, March, 1946.
A. B. Liebscher, "Volt Ohmyst Prepared for F -M Requirements ", RCA Rad. Serv. News, February, 1946.
D. G. C. Luck, "An Omnidirectional Radio Range System -Part III ", RCA REVIEW, March, 1946.
R. W. Masters, "The Super Turnstile ", Broadcast News, January, 1946. W. J. Morlock, "Technical Progress in Sound Equipment ", American Year Book, 1946.
H. F. Mickel, "RCA Micro -Wave Relay System ", Broadcast News, January, 1946.
R. J. Newman, "New FM Transmitters ", Broadcast News, January, 1946. H. F. Olson, "Gradient Microphones ", Jour. Acous. Soc. Amer., January,
1946.
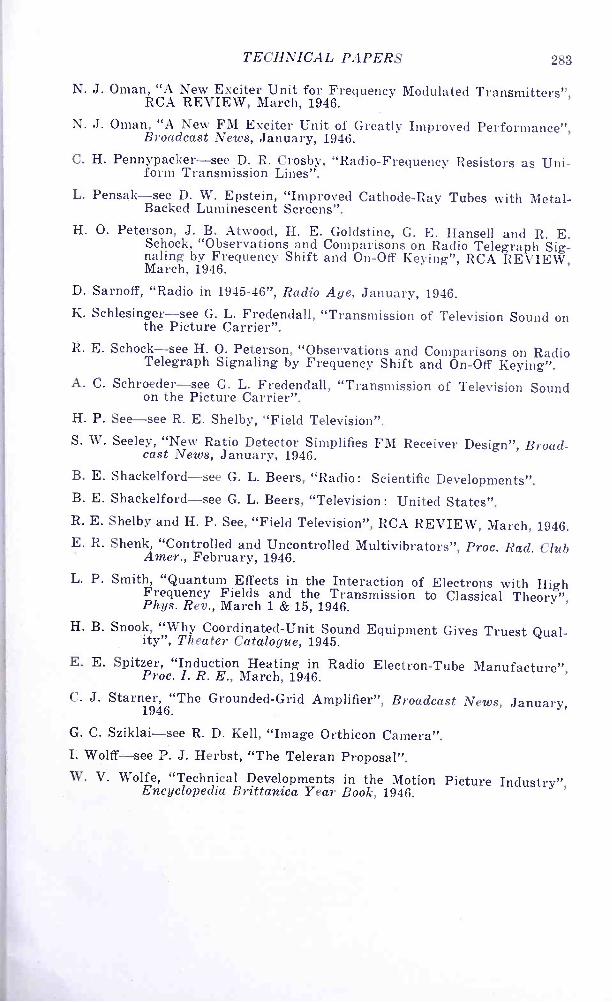
TECHNICAL PAPERS 283
N. J. Oman, "A New Exciter Unit for Frequency Modulated Transmitters ", RCA REVIEW, March, 1946.
N. J. Oman, "A New FM Exciter Unit of Greatly Improved Performance ", Broadcast News, January, 1946.
C. H. Pennypacker -see D. R. Crosby, "Radio- Frequency Resistors as Uni- form Transmission Lines ".
L. Pensak -see D. W. Epstein, "Improved Cathode -Ray Tubes with Metal - Backed Luminescent Screens ".
H. O. Peterson, J. B. Atwood, H. E. Goldstine, G. E. Hansel] and R. E. Schock, "Observations and Comparisons on Radio Telegraph Sig- naling by Frequency Shift and On -Off Keying ", RCA REVIEW, March, 1946.
D. Sarnoff, "Radio in 1945 -46 ", Radio Age, January, 1946.
K. Schlesinger -see G. L. Fredendall, "Transmission of Television Sound on the Picture Carrier ".
R. E. Schock -see H. O. Peterson, "Observations and Comparisons on Radio Telegraph Signaling by Frequency Shift and On -Off Keying ". A. C. Schroeder -see G. L. Fredendall, "Transmission of Television Sound
on the Picture Carrier ".
H. P. See -see R. E. Shelby, "Field Television ".
S. W. Seeley, "New Ratio Detector Simplifies FM Receiver Design ", Broad- cast News, January, 1946.
B. E. Shackelford -see G. L. Beers, "Radio : Scientific Developments ". B. E. Shackelford -see G. L. Beers, "Television: United States ". R. E. Shelby and H. P. See, "Field Television ", RCA REVIEW, March, 1946. E. R. Shenk, "Controlled and Uncontrolled Multivibrators ", Proc. Rad. Club Amer., February, 1946.
L. P. Smith, "Quantum Effects in the Interaction of Electrons with High Frequency Fields and the Transmission to Classical Theory ", Phys. Rev., March 1 & 15, 1946.
H. B. Snook, "Why Coordinated -Unit Sound Equipment Gives Truest Qual- ity ", Theater Catalogue, 1945.
E. E. Spitzer, "Induction Heating in Radio Electron -Tube Manufacture ", Proc. I. R. E., March, 1946.
C. J. Starner, "The Grounded -Grid Amplifier ", Broadcast News, January, 1946.
G. C. Sziklai -see R. D. Kell, "Image Orthicon Camera ". L Wolff -see P. J. Herbst, "The Teleran Proposal ".
W. V. Wolfe, "Technical Developments in the Motion Picture Industry ", Encyclopedia Brittanica Year Book, 1946.
-y- ._
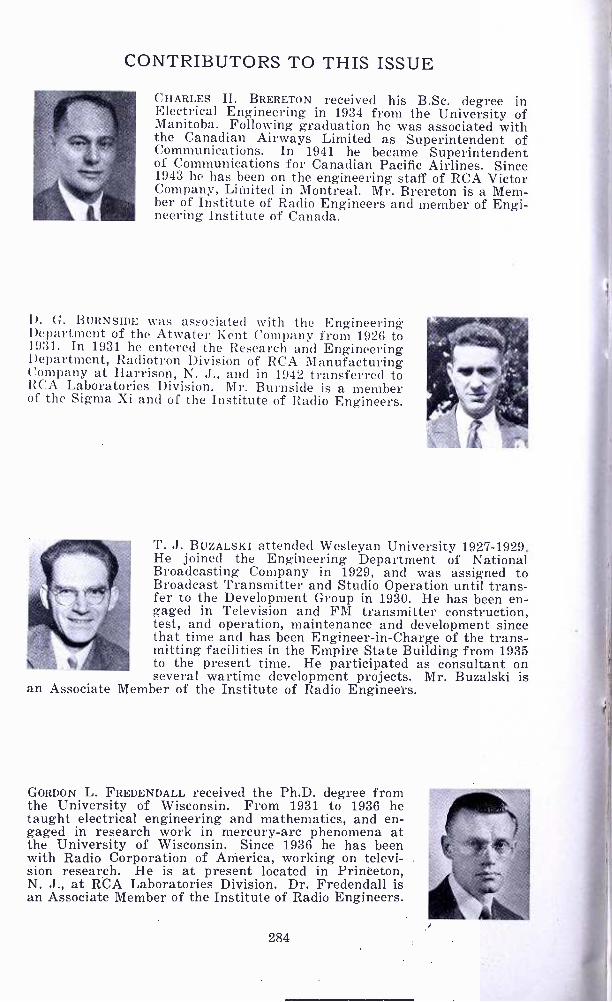
CONTRIBUTORS TO THIS ISSUE
CHARLES II. BRERETON received his B.Sc. degree in Electrical Engineering in 1934 from the University of Manitoba. Following graduation he was associated with the Canadian Airways Limited as Superintendent of Communications. In 1941 he became Superintendent of Communications for Canadian Pacific Airlines. Since 1943 he has been on the engineering staff of RCA Victor Company, Limited in Montreal. Mr. Brereton is a Mem- ber of Institute of Radio Engineers and member of Engi- neering Institute of Canada.
D. G. BURNSIDE was associated with the Engineering Department of the Atwater Kent Company from 1926 to 1931. In 1931 he entered the Research and Engineering Department, Radiotron Division of RCA Manufacturing Company at Harrison, N. J., and in 1942 transferred to RCA Laboratories Division. Mr. Burnside is a member of the Sigma Xi and of the Institute of Radio Engineers.
an Associate
T. J. BUZALSKI attended Wesleyan University 1927 -1929. He joined the Engineering Department of National Broadcasting Company in 1929, and was assigned to Broadcast Transmitter and Studio Operation until trans- fer to the Development Group in 1930. He has been en- gaged in Television and FM transmitter construction, test, and operation, maintenance and development since that time and has been Engineer -in- Charge of the trans- mitting facilities in the Empire State Building from 1935 to the present time. He participated as consultant on several wartime development projects. Mr. Buzalski is
Member of the Institute of Radio Engineers.
GORDON L. FREDENDALL received the Ph.D. degree from the University of Wisconsin. From 1931 to 1936 he taught electrical engineering and mathematics, and en- gaged in research work in mercury -arc phenomena at the University of Wisconsin. Since 1936 he has been with Radio Corporation of America, working on televi- sion research. He is at present located in Princeton, N. J., at RCA Laboratories Division. Dr. Fredendall is an Associate Member of the Institute of Radio Engineers.
284
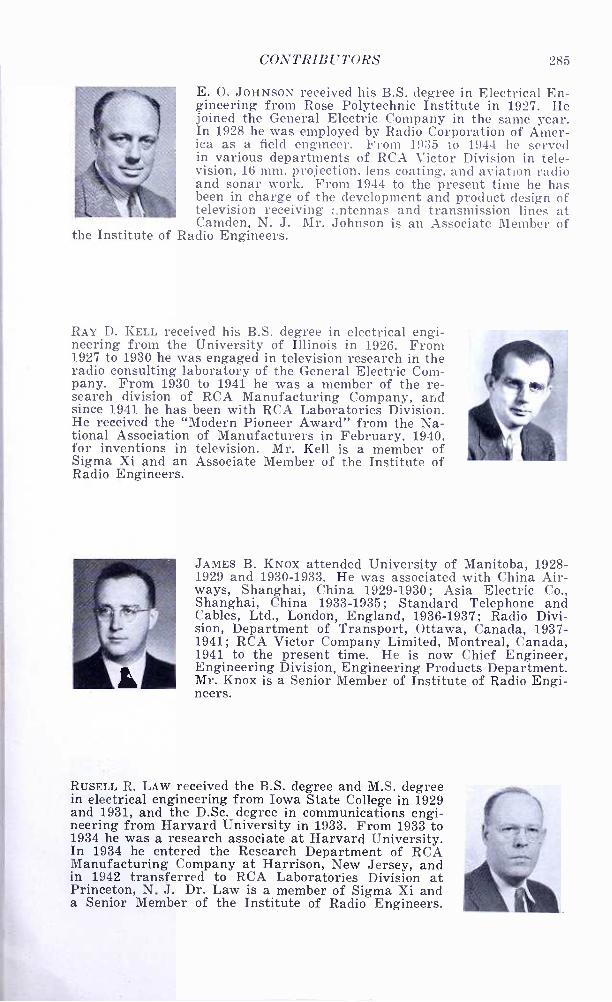
CONTRIBUTORS 285
E. O. JOHNSON received his B.S. degree in Electrical En- gineering from Rose Polytechnic Institute in 1927. He joined the General Electric Company in the same year. In 1928 he was employed by Radio Corporation of Amer- ica as a field engineer. l!'rom 1935 to 1944 he served in various departments of RCA Victor Division in tele- vision, 16 mm. projection, lens coating, and aviation radio and sonar work. From 1944 to the present time he has been in charge of the development and product design of television receiving ;_ntennas and transmission lines at Camden, N. J. Mr. Johnson is an Associate Member of
the Institute of Radio Engineers.
RAY D. KELL received his B.S. degree in electrical engi- neering from the University of Illinois in 1926. From 1927 to 1930 he was engaged in television research in the radio consulting laboratory of the General Electric Com- pany. From 1930 to 1941 he was a member of the re- search division of . RCA Manufacturing Company, and since 1941 he has been with RCA Laboratories Division. He received the "Modern Pioneer Award" from the Na- tional Association of Manufacturers in February, 1940, for inventions in television. Mr. Kell is a member of Sigma Xi and an Associate Member of the Institute of Radio Engineers.
JAMES B. KNOX attended University of Manitoba, 1928- 1929 and 1930 -1933. He was associated with China Air- ways, Shanghai, China 1929 -1930; Asia Electric Co., Shanghai, China 1933 -1935; Standard Telephone and Cables, Ltd., London, England, 1936 -1937; Radio Divi- sion, Department of Transport, Ottawa, Canada, 1937- 1941; RCA Victor Company Limited, Montreal, Canada, 1941 to the present time. He is now Chief Engineer, Engineering Division, Engineering Products Department. Mr. Knox is a Senior Member of Institute of Radio Engi- neers.
RUSELL R. LAW received the B.S. degree and M.S. degree in electrical engineering from Iowa State College in 1929 and 1931, and the D.Sc. degree in communications engi- neering from Harvard University in 1933. From 1933 to 1934 he was a research associate at Harvard University. In 1934 he entered the Research Department of RCA Manufacturing Company at Harrison, New Jersey, and in 1942 transferred to RCA Laboratories Division at Princeton, N. J. Dr. Law is a member of Sigma Xi and a Senior Member of the Institute of Radio Engineers.
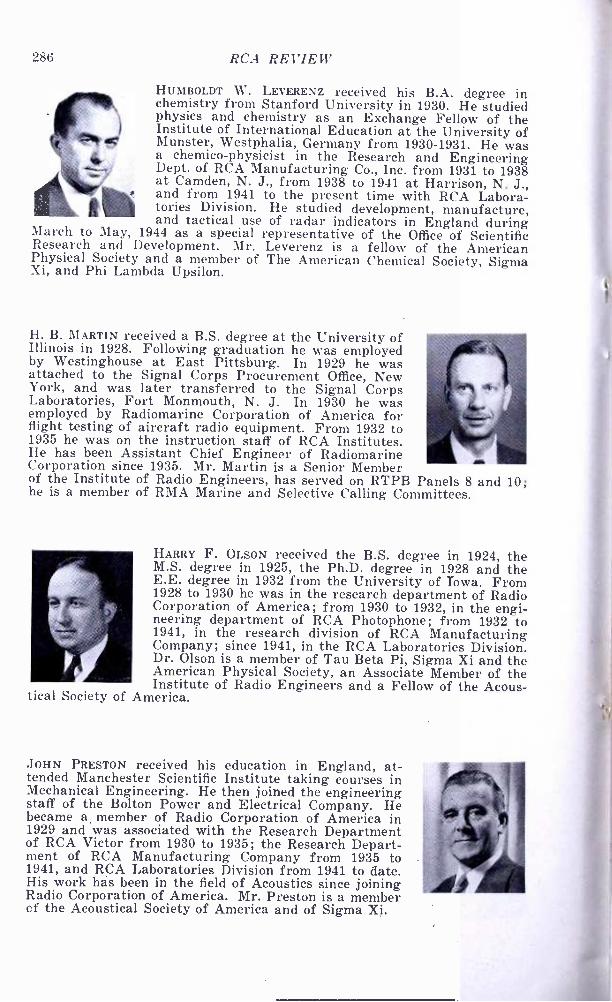
286
March to
RCA REVIEW
HUMBOLDT W. LEVERENZ received his B.A. degree in chemistry from Stanford University in 1930. He studied physics and chemistry as an Exchange Fellow of the Institute of International Education at the University of Munster, Westphalia, Germany from 1930 -1931. He was a chemico -physicist in the Research and Engineering Dept. of RCA Manufacturing Co., Inc. from 1931 to 1938 at Camden, N. J., from 1938 to 1941 at Harrison, N. J., and from 1941 to the present time with RCA Labora- tories Division. He studied development, manufacture, and tactical use of radar indicators in England during
May, 1944 as a special representative of the Office of Scientific Research and Development. Mr. Leverenz is a fellow of the American Physical Society and a member of The American Chemical Society, Sigma Xi, and Phi Lambda Upsilon.
H. B. MARTIN received a B.S. degree at the University of Illinois in 1928. Following graduation he was employed by Westinghouse at East Pittsburg. In 1929 he was attached to the Signal Corps Procurement Office, New York, and was later transferred to the Signal Corps Laboratories, Fort Monmouth, N. J. In 1930 he was employed by Radiomarine Corporation of America for flight testing of aircraft radio equipment. From 1932 to 1935 he was on the instruction staff of RCA Institutes. He has been Assistant Chief Engineer of Radiomarine Corporation since 1935. Mr. Martin is a Senior Member of the Institute of Radio Engineers, has served on RTPB Panels 8 and 10; he is a member of RMA Marine and Selective Calling Committees.
tical Society
HARRY F. OLSON received the B.S. degree in 1924, the M.S. degree in 1925, the Ph.D. degree in 1928 and the E.E. degree in 1932 from the University of Iowa. From 1928 to 1930 he was in the research department of Radio Corporation of America; from 1930 to 1932, in the engi- neering department of RCA Photophone; from 1932 to 1941, in the research division of RCA Manufacturing Company; since 1941, in the RCA Laboratories Division. Dr. Olson is a member of Tau Beta Pi, Sigma Xi and the American Physical Society, an Associate Member of the Institute of Radio Engineers and a Fellow of the Acous-
of America.
JOHN PRESTON received his education in England, at- tended Manchester Scientific Institute taking courses in Mechanical Engineering. He then joined the engineering staff of the Bolton Power and Electrical Company. He became a member of Radio Corporation of America in 1929 and was associated with the Research Department of RCA Victor from 1930 to 1935; the Research Depart- ment of RCA Manufacturing Company from 1935 to 1941, and RCA Laboratories Division from 1941 to date. His work has been in the field of Acoustics since joining Radio Corporation of America. Mr. Preston is a member cf the Acoustical Society of America and of Sigma Xi.
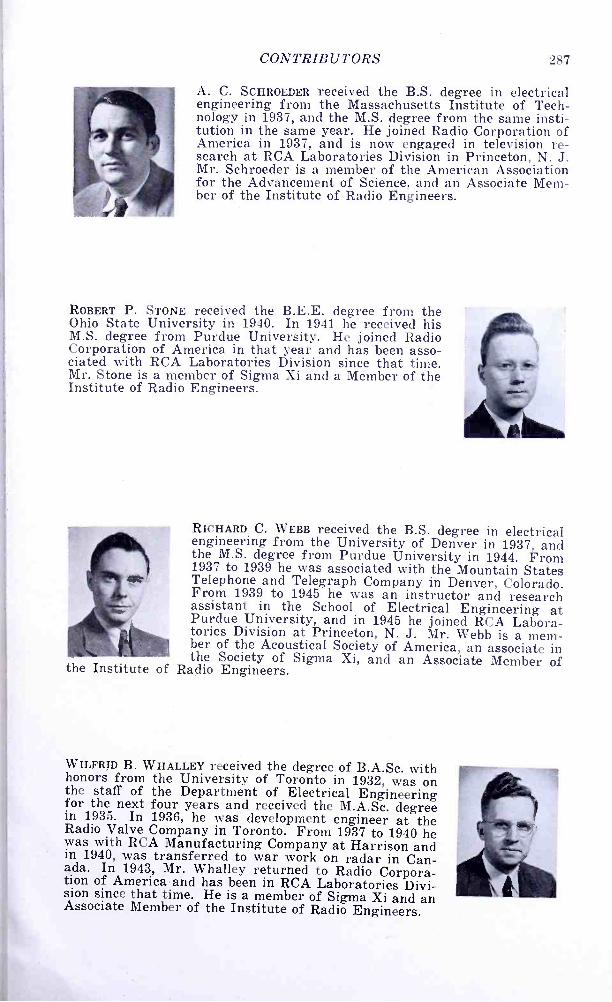
CONTRIBUTORS 287
A. C. SCHROEDER received the B.S. degree in electrical engineering from the Massachusetts Institute of Tech- nology in 1937, and the M.S. degree from the same insti- tution in the same year. He joined Radio Corporation of America in 1937, and is now engaged in television re- search at RCA Laboratories Division in Princeton, N. J. Mr. Schroeder is a member of the American Association for the Advancement of Science, and an Associate Mem- ber of the Institute of Radio Engineers.
ROBERT P. STONE received the B.E.E. degree from the Ohio State University in 1940. In 1941 he received his M.S. degree from Purdue University. He joined Radio Corporation of America in that year and has been asso- ciated with RCA Laboratories Division since that time. Mr. Stone is a member of Sigma Xi and a Member of the Institute of Radio Engineers.
the Institute of
RICHARD C. WEBB received the B.S. degree in electrical engineering from the University of Denver in 1937, and the M.S. degree from Purdue University in 1944. From 1937 to 1939 he was associated with the Mountain States Telephone and Telegraph Company in Denver, Colorado. From 1939 to 1945 he was an instructor and research assistant in the School of Electrical Engineering at Purdue University, and in 1945 he joined RCA Labora- tories Division at Princeton, N. J. Mr. Webb is a mem- ber of the Acoustical Society of America, an associate in the Society of Sigma Xi, and an Associate Member of Radio Engineers.
WILFRID B. WHALLEY received the degree of B.A.Sc. with honors from the University of Toronto in 1932, was on the staff of the Department of Electrical Engineering for the next four years and received the M.A.Sc. degree in 1935. In 1936, he was development engineer at the Radio Valve Company in Toronto. From 1937 to 1940 he was with RCA Manufacturing Company at Harrison and in 1940, was transferred to war work on radar in Can- ada. In 1943, Mr. Whalley returned to Radio Corpora- tion of America and has been in RCA Laboratories Divi- sion since that time. He is a member of Sigma Xi and an Associate Member of the Institute of Radio Engineers.