Review - World Radio History
168
MCB Review "s. March 1974 Volume 35 No. 1 RCARCI .35(1) 1164 (1974)
-
Upload
khangminh22 -
Category
Documents
-
view
1 -
download
0
Transcript of Review - World Radio History
MCB Review
"s.
March 1974 Volume 35 No. 1
RCARCI .35(1) 1164 (1974)

RCA Review, published quarterly In March, June, September and December by RCA Research and Engineering, RCA Corporation, Princeton, New Jersey 08540. Entered as second class matter July 3, 1950 under the Act of March 3, 1879. Second-class postage paid at Princeton, New Jersey, and at additional mailing offices. Effective Jan. 1, 1971, subscription rates as follows: United States and Canada: one year $6.00, two years $10.50. three years $13.50; In other countries, one year 56.40, two years $11.30, three years $14.70. Single copies (except for special issues) up to live years old $3.00.

Review
Contents
A technical Journal published quarterly by RCA Research and Engineering in cooperation with the subsidiaries and divisions of RCA.
3 Control of Blooming in Charge-Couped Imagers W. F. Kosonocky, J. E. Carnes, M. G. Kovac, P. Levine, F. V. Shallcross, and R. L. Rodgers
25 Intermodulation Distortion in Resistive Mixers Stewart M. Perlow
48 Review of Gas -Breakdown Phenomena Induced by High Power Lasers I. P. Shkarofsky
An Introduction to the Science and Technology of Liquid Crystals
79 Introduction E. B. Priestley and P. J. Wojtowicz
81 Liquid Crystal Mesophases E. B. Priestley
94 Structure -Property Relationships in Thermotropic Organic Liquid Crystals Aaron W. Levine
105 Introduction to the Molecular Theory of Nematic Liquid Crystals P. J. Wojtowicz
118 Generalized Mean Field Theory of Nematic Liquid Crystals P. J. Wojtowicz
132 Hard Rod Model of the Nematic-Isotropic Phase Transition Ping Sheng
144 Nematic Order: The Long Range Orientational Distribution Function E. B. Priestley
155 Technical Papers
158 Patents
161 Authors
March 1974 Volume 35 Number 1

RCA Corporation
Robert W. Sarnoff Chairman of the Board and Chief Executive Officer A. L. Conrad President and Chief Operating Officer
Editorial Advisory Board
Chairman, J. A. Rajchman RCA Laboratories
A. A. Ahmed Solid State Division E. D. Becken RCA Global Communications G. D. Cody RCA Laboratories A. N. Goldsmith Honorary Vice President N. L. Gordon RCA Laboratories G. B. Herzog RCA Laboratories J. Hillier RCA Research and Engineering E. O. Johnson International Licensing J. Kurshan RCA Laboratories C. H. Lane Electronic Components D. S. McCoy Consumer Electronics H. F. Olson RCA Laboratories K. H. Powers RCA Laboratories R. E. Quinn RCA Laboratories P. Rappaport RCA Laboratories L. A. Shotliff International Licensing T. O. Stanley RCA Laboratories F. Sterzer RCA Laboratories J. J. TIetjen RCA Laboratories W. M. Webster RCA Laboratories
Secretary, Charles C. Foster RCA Laboratories
Editor Ralph F. Ciaf one
Associate Editors
W. A. Chisholm RCA Limited (Canada) M. G. Gander RCA Service Company W. O. Hadlock RCA Research and Engineering D. R. Higgs Missile and Surface Radar Divisicn W. A. Howard National Broadcasting Company C. Hoyt Consumer Electronics E. McElwee Solid -State Division C. A. Meyer Electronic Components M. G. Pietz Government and Commercial Systems C. W. Sall RCA Laboratories I. M. Seldeman Astro -Electronics Division R. N. Hurst Communications Systems Division
© RCA Corporation 1974 All Rights Reserved Printed in USA
2 RCA Review Vol. 35 March 1974

Control of Blooming in Charge -Coupled Imagers*
W. F. Kosonocky, J. E. Carnes, M. G. Kovac,** P. Levine, and
F. V. Shallcross
RCA Laboratories, Princeton, N. J. 08540
R. L. Rodgers 111
Electronic Components, Lancaster, Pa.
Abstract-Four approaches are described for controlling blooming in charge - coupled imagers. They are based on (a) an operational method that localizes blooming by accumulation regions around each sensing ele-
ment, (b) static anti -blooming structures involving polysilicon blooming barrier gates, (c) dynamic anti -blooming structures employing ion -
implanted blooming barriers, and (d) dynamic structures employing stepped -oxide blooming barriers. Experimental results are presented for charge -coupled area imagers with localization of blooming by the
accumulation mode and for charge -coupled line imagers with types (c) and (d) dynamic blooming controls.
1. Introduction
While silicon -based imaging devices are not subject to material damage
in the presence of optical overloads such as that experienced by earlier types of targets, the silicon devices do suffer from the spreading of overload -generated charge into adjacent regions. The phenomenon is
called "blooming" and is especially objectionable in devices with high
* Except for the new data on the operation of the 256 X 160 charge - coupled imager, the experimental results described in this paper were presented at the 1972 IEEE International Electron Devices Meeting, Wash., D.C., Dec. 4-6, 1972, under the title "Dynamic Range and Blooming Control in Charge -Coupled Imagers."
* Presently with Dytron, Inc., Waltham, Massachusetts 02154.
RCA Review Vol. 35 March 1974 3
sensitivity, since normal light sources become very large optical over- loads in a low -light -level environment.
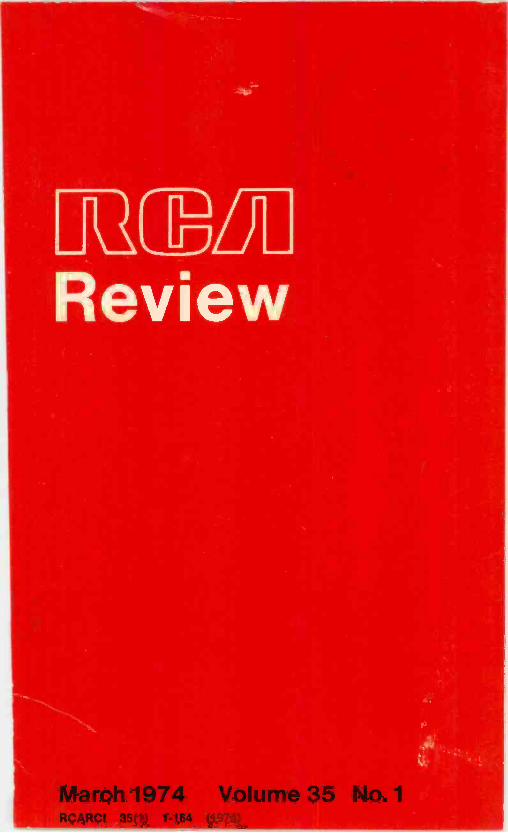
The effect of blooming on the operation of a charge -coupled imager is demonstrated in Fig. 1. The photographs shown here are detected by a 256 x 160 three-phase vertical frame transfer CCI.' The top
(a)
(b) Fig. 1-T.V. pictures detected with 3 -phase 256 X 160 charge -coupled image
sensor. (a) a nonblooming picture. (b) The girl is holding a lighted match that results in blooming.
photograph shows a scene with no optical overload. The blooming in the lower photograph results from turning on an essentially point - light -source overload. The white region in the photograph covers an area that is considerably larger than the light source. The excess charge first spreads along the vertical lines. But under very intense overload it will also reach to the output register and produce a bloom- ing in the horizontal direction. This clearly demonstrates the objec- tionable nature of blooming in a charge -coupled imager.
To make charge -coupled imagers capable of operation without blooming in the presence of large optical overloads, several methods of blooming control have been proposed and tested. The first technique is an operational one requiring no special structure within the CCI itself. It consists of holding one or two phases of the device in accumulation during light integration, and will be referred to as the
4 RCA Review Vol. 35 March 1974

CONTROL OF BLOOMING
accumulation mode. The tests indicate this mode is useful in partially localizing blooming due to moderate optical overloads.
To obtain more effective control of blooming, several anti -blooming structures incorporated in CCI's have been proposed and test devices
fabricated. These involve diffused bus drain lines adjacent to each
CCD channel, which are used to remove optical -overload -generated
charge before it can spread to adjacent locations. The various tech-
OAI
A2
BI 95B2
4c1
Oc2
BLOOMING DRAIN BUS
L
{BLOOMING BARRIER CHANNEL STOP
CHANNEL STOP
PHOTO SENSITIVE AREA
TEMPORARY STORAGE AREA
RESET
I OUT -I i
d j 1
` 1 1
OUT -2
Fig. 2-Schematic of a 2 -phase frame -transfer charge -coupled imager with blooming control.
niques differ in their method of producing a channel -confining barrier that controls the flow of charge into the blooming buses. The three basic categories involve barriers created by (1) field -shield gates. (2) diffused or ion -implanted channel regions, and (3) stepped -oxide chan- nel stop regions. These three types of anti -blooming structures can
be incorporated in the vertical frame -transfer CCI's very simply by
placing the blooming drains in the channel stop regions between the adjacent CCD channels of the photosensitive area, as shown in Fig. 2. The maximum optical overloads that can be tolerated are limited in this case by the smearing effect, which occurs during the frame transfer time when the charge pattern is shifted from the photo- sensitive area to the temporary storage area. To avoid blooming as
RCA Review Vol. 35 March 1974 5
well as smearing, one must incorporate optical shuttering during frame transfer or use a design of charge -coupled imager that has separate photosensitive elements scanned by nonilluminated charge - coupled registers.
2. Methods of Blooming Control
2.1 Accumulation Mode-An Operational Method of Blooming Control
As mentioned, one method of limiting blooming control in an illumin- ated register device, the accumulation method. is an operational method that does not require any additional structure to he built into the
SIOz -(
INTENSE OPTICAL
SIGNAL
Si la)
SURFACE ICI
POTENTIAL ¡ - DEP
ACC
SURFACE
POTENTIAL
DEP
DIFF.
Icl
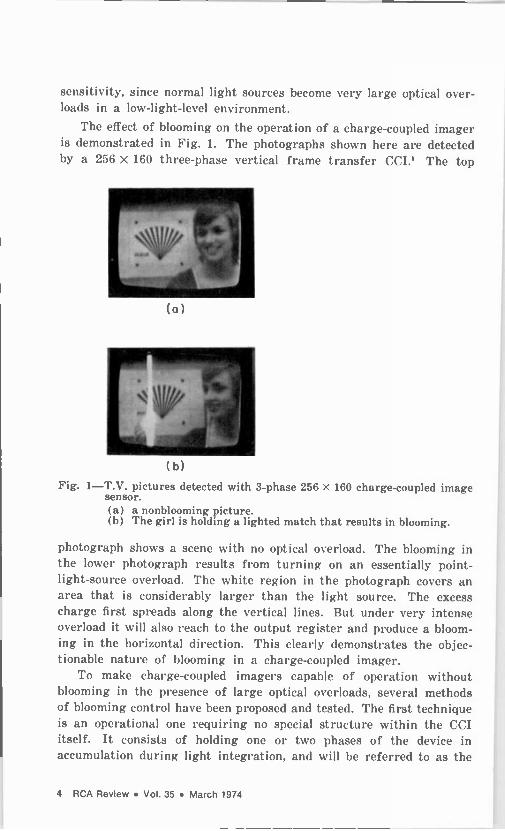
Fig. 3-Normal and accumulation modes of operation of charge -coupled imager. (a) Cross-sectional view of three-phase CCD, (b) illustrating the normal mode of operation, and (c) the accumulation mode of operation for blooming control.
sensor. The concept of the accumulation mode is illustrated in Fig. 3 for the case of a three-phase CCD with diffusion channel stops. The standard mode and the accumulation mode are illustrated in the two surface protential diagrams. In the "standard mode" of operation, all three of the phases are biased into slight depletion. and in addition, the #2 electrodes are biased so as to form deep depletion regions for the collection of photogenerated carriers. In the case of an intense optical overload, the photogenerated carriers will fill up the wells and then spill down the channel into adjacent cells.
In the accumulation mode, the #1 and #3 electrodes are biased so that the underlying interface is in accumulation. This establishes a barrier and prevents the excess minority carriers from spilling freely
6 RCA Review Vol. 35 March 1974

CONTROL OF BLOOMING
down the channel, since they will tend to recombine with holes in the accumulation regions.
2.2 Static Blooming Control
The operation of anti -blooming structure in which polysilicon tield- shield channel stop gates are used to form the barriers between the illuminated CCD channels and the blooming bus drains is illustrated in Figs. 4 and 5. A CCI with two-phase polysilicon-aluminum gate charge -coupling structure is shown in this example. Fig. 4(a) shows
POLYSIL ICON
BLOOMING BARRIER GATE
CCD CHANNEL
(a)
ALUMINUM OR
POLYSILICON GATE
CHANNEL OXIDE
BLOOMING BUS
DIFFUSIONS
SURFACE POTENTIAL OF SURFACE POTENTIAL OF ONE
FULL WELL SPILLING OF THE TRANSFER GATES CHARGE TO THE BLOOMING PREVENTING THE BLOOMING BUS DIFFUSIONS OF CHARGE ALONG THE
CCD CHANNEL
//./ / FULL
WELL' / /
SURFACE POTENTIAL OF AN EMPTY WELL
(b)
Fig. 4-Cross-sectional view perpendicular to charge flow of static bloom- ing control structure using polysilicon field shield gates (a) and resulting surface potential (b). (Note: as shown by the dotted lines, the blooming barrier potential determines the size of the well.)
a cross-section of the CCD channel perpendicular to charge flow. The
polysilicon blooming barrier gate is connected to an external bias that allows control of the barrier between the actual channel and the n+ diffusion used as the sink. The surface potential diagram is shown in
Fig. 4(b). We refer to this method as the "static barrier" method
because the blooming barrier can be set and controlled independently
RCA Review Vol. 35 March 1974 7

of the phase clock voltages. The potential well is two dimensional- having four sides to it. The dashed line shows the surface potential of the transfer gates adjusted to prevent the blooming of charge along the channel. The potential of the blooming barrier set by the poly - silicon electrode is slightly lower than the barrier set by the transfer gate. Thus, the excess charge will spill from the full well into the n+ blooming bus before it can spill down the channel. The cross-section of the structure along the channel and the potential profile ís shown in Fig. 5. As shown here, the potential along the blooming barrier must always be below the highest barrier of the two-phase transfer electrodes in order to permit sideways spillage of the excess charge signal.
1-1
INTENSE OPTICAL SIGNAL
@-2 4)-1
flrtiglir/J1 SURFACE POTENTIAL -
FULL WELL
$-2
ALONG BLOOMING BARRIER
ALONG CCD CHANNEL
(o)
(b)
Fig. 5-Longitudinal cross section of structure shown in Figure 4(a) and resulting surface potential along the CCD channel during the optical integration time (b).
From Fig. 5(b) it is apparent that if the blooming barrier surface potential remains unchanged during the charge read-out period, loss of charge from the transferring packets into the blooming bus can occur. Thus, the optimum performance of this type of blooming control requires that the voltage applied to the blooming barrier gate during read-out be different from that applied during the integration period.
The independent control of the blooming barrier potential in the case of the static anti -blooming structure can, however, be used to provide an electronic shutter action. In this case, during the first part of the optical integration time, the blooming barrier is
8 RCA Review Vol. 35 March 1974

CONTROL OF BLOOMING
adjusted so that all of the detected charge is removed by the n+ blooming drains. No charge is collected during this time and the effective integration time is reduced. The application of a large positive potential to the blooming drain diffusion will also control the sensitivity of the CCD sensor if the optical image is introduced on the back side of the substrate. This type of sensitivity control, however, is not very effective for radiation in the long wavelength region of the silicon absorption spectrum. Finally, the blooming control scheme illustrated in Figs. 4 and 5 does not require much more additional processing than structures employing the polysilicon guard rings for channel stops.' The blooming bus diffusion can be made at the same time as the normal source and drain diffusions for the CCI array.
2.3 Dynamic Blooming Control Methods
Unlike the static method (just described), which allows control of the blooming harrier height by an external voltage, the dynamic methods use the interaction of the phase voltage and an ion -implanted region or a stepped -oxide structure to determine the barrier.
a. Ion -implanted Blooming Barrier
The construction and operation of a CCI with a dynamic anti -blooming structure employing ion -implanted blooming barriers is illustrated in
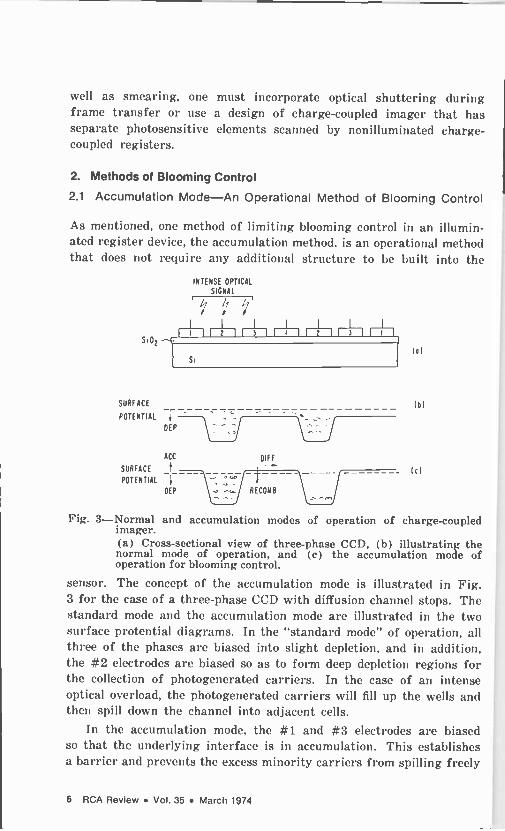
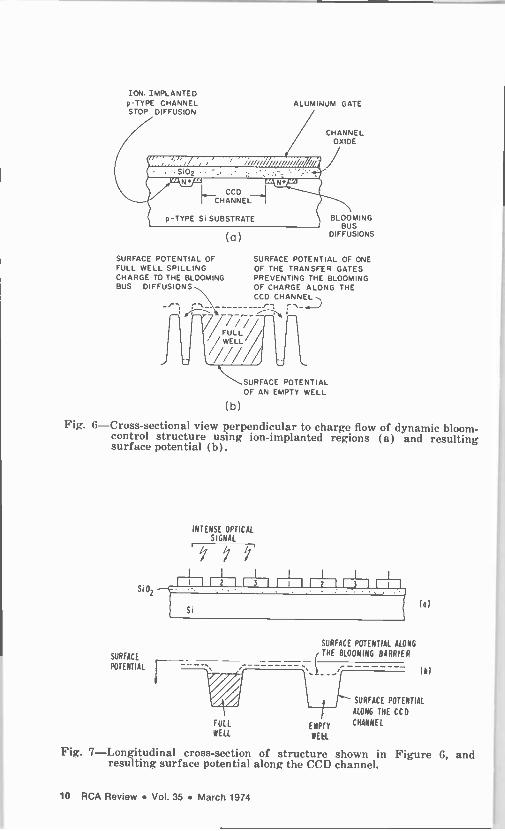
Figs. 6 and 7 for the case of a three-phase aluminum gate CCI with diffusion channel stops. The cross-sectional view of illuminated regi- ster perpendicular to the charge flow is shown in Fig. ti(a). If this device did not have the blooming control feature, heavily doped 11+
diffused channel stops would define the channel. In the structure shown here, the diffused channel stop is replaced by an ion -implanted region and an 11+ blooming bus. For a p -type substrate in the range of 10'* to 10'5 cm -3, a typical implant level would be in the 1016 cm -3
range. The spilling of the excess charge due to an optical overload into the blooming bus drains as illustrated by the surface potentials in Fig. 6(b). Note that the top dashed line shows the surface potential of one of the transfer gates that prevents the blooming of charge along the CCD channel.
The self-limiting action of the dynamic blooming method is illus- trated in Fig. 7 which shows the cross-section of the structure and the surface potential profile along the CCD channel. Note that unlike the previously described static blooming control (see Fig. 5[b]) the blooming harrier potential (shown as dashed line) depends on the gate voltage and dips to a minimum value at the storage -well locations. When a well fills up due to intense optical overload, the surface poten-
RCA Review Vol. 35 March 1974 9
ION. IMPLANTED p -TYPE CHANNEL STOP DIFFUSION
p -TYPE Si SUBSTRATE
SURFACE POTENTIAL OF FULL WELL SPILLING CHARGE TO THE BLOOMING BUS DIFFUSIONS
U
(a)
ALUMINUM GATE
CHANNEL OXIDE
BLOOMING BUS
DIFFUSIONS
SURFACE POTENTIAL OF ONE OF THE TRANSFER GATES PREVENTING THE BLOOMING OF CHARGE ALONG THE CCD CHANNEL
FULL / WELL' / /!!//
\SURFACE POTENTIAL OF AN EMPTY WELL
(b)
Fig. 6-Cross-sectional view perpendicular to charge flow of dynamic bloom - control structure using ion -implanted regions (a) and resulting surface potential (b).
INTENSE OPTICAL SIGNAL
÷I 41 EH 41 I±1
Si (o)
SURFACE POTENTIAL ALONG
SURFACE THE BLOOMING BARRIER
POTENTIAL
FULL
WELL EMPTY
WELL
SURFACE POTENTIAL
ALONG THE CCD
CHANNEL
Fig. 7-Longitudinal cross-section of structure shown in Figure 6, and resulting surface potential along the CCD channel.
10 RCA Review Vol. 35 March 1974

CONTROL OF BLOOMING
tial at the location rises only to the point where it meets this minimum
surface potential along the blooming barrier.
The expected values of surface potentials for one specific anti -
blooming structure with ion -implanted barriers is shown in Fig. 8.
xox=22001
6 8 V., - V" (VI
vz
S MAX
*DEPLETION LAYER THICKNESS =035µm
I I I
10 12 14
Fig. 8-Surface potentials as function of gate voltage for a dynamic anti - blooming structure with ion -implanted channel stops.
The upper curve represents the surface potential in the channel for
substrate doping of 2 x 10'5 cm-"; the lower curve is the surface potential in the ion -implanted barrier region approximated by a 0.35µm
thick layer with doping of 2 x 1010 cm -3. The knee in the bottom
curve corresponds to the point where the ion -implanted region is com-
pletely depleted. Assuming the clock voltages vary between V, and V.,.
V represents the difference between the barrier potential in the CCD channel under the transfer gates with clock \oltage V, and the minimum blooming barrier potential under the storage gate with clock
voltage V,. Ilowever, if the clock voltage excursion (V.,'- V,) is
made to exceed the knee of the bottom curve, the resulting potential difference JV' and the maximum charge stored tends to become inde-
pendent of the value V_' similar to the operation of a CCD with an
ion -implanted barrier.'
b. Stepped -oxide blooming barrier
A second type of dynamic method of blooming control in illuminated registers is the stepped -oxide -barrier -method. This type of anti -bloom-
ing structure is most compatible with two-phase polysilicon-aluminum
RCA Review Vol. 35 March 1974 11

gate construction, and this type of device was therefore used to demon- strate its operation. Experimental results for such line sensors ate presented in Sec. 3.3. The construction and the operation of this type of structure is shown in Figs. 9, 10, and 11. The operation of
SiO
' ` CC
CHANNEL
N -TYPE S i SUBSTRATE I -. 1016 cm -t
SURFACE POTENTIAL OF
FULL WELL SPILLING CHARGE TO THE BLOOMING BUS
lo)
POLY -Si GATE
BLOOMING
BUS
DIFFUSIONS
SURFACE POTENTIAL OF ONE
OF THE TRANSFER GATES PREVENTING BLOOMING ALONG THE CCD CHANNEL
--
FLL A -- WELL
lb SURFACE POTENTIAL
OF AN EMPTY WELL
Fig. 9-Cross-sectional view perpendicular to charge flow of dynamic blooming control structure using stepped -oxide blooming barriers (a) and resulting surface potential (b)
this dynamic anti -blooming structure with stepped -oxide blooming barrier is similar to the ion -implanted case, except for additional con- straints required to satisfy the two-phase operation. As shown in Fig. 9 the ion -implanted regions have been replaced by stepped -oxides with thickness X0 as compared to the thickness of X, of CCI) channels under the polysilicon gates. The charge -coupling structure and the surface potential profile along the CCD channel is shown in Fig. 10. Fig. 11 shows the expected surface potential variations as a function of gate voltage for an n -type substrate with doping density of 10" 1
type of structure is shown in Figs. 9, 10, and 11. The operation of cm -3 and oxide thicknesses X1 = 1000A, X2 = 2000A, and X3 = 2400A. The thickness of the channel oxides X1 and X3 under the polysilicon and the aluminum gates, respectively, were chosen for
12 RCA Review Vol. 35 March 1974

CONTROL OF BLOOMING
INTENSE OPTICAL SIGNAL
I I
c!) -I 4)-2
xl< X2<x3
SURFACE POTENTIAL
IA -2
ALONG BLOOMING BARRIER
(o)
(b)
ALONG CCD CHANNEL
Fig. 10-(a) Longitudinal view of structure shown in Fig. 9 and (b) resulting surface potential along the CCD channel.
optimum two-phase operation for a substrate doping' of 10"cm-a.
The blooming barrier oxide under the polysilicon gates (X_ - 2000A)
was chosen so that the maximum charge signal that could be stored is
slightly smaller (by _IV") than the full well. This requires that
h,<X2<X3.
20
16
12
B
4
POLY SILICON POLYSILICON
GATES ((000111 / GATES (2000,x) (BLOOMING BARRIER) (CHANNEL)
VI V2
-AV= I0V - ALUMINUM GATES(2400A) (CHANNEL)
5 IO 15 20 25 GATE VOLTAGE (V)
Fig. 11-Surface potentials as function of gate voltage for a dynamic anti - blooming structure with stepped -oxide blooming barrier.
RCA Review Vol. 35 Marci 1974 13

3. Experimental Results
3.1 Operational Mode
Operational blooming control was tested on a 256 X 160 element, three- phase, charge -coupled imager having illuminated registers and frame storage. A schematic of this device is given in Fig. 12. Charge was
ABB
TII
VII te
29
mez
30
mh N
CGS
STD
Ea
STS
t;a CC2
L
, Ly
SUB
22
i IT1-IT -=_rm
r .
-- 1 1
CGT CG6
mCzm BBI 882
mes
0B)
CGS
G<
YSIA
YDI
902
Your
932
Fig. 12-Schematic of the 256 X 160 element charge -coupled image sensor.
collected during the optical integration period under phase A2. The area under phase Al and phase A3 were accumulated during the inte- gration period. The accumulated areas electronically extend the channel stops around each image storage cell preventing a free flow of any excess detected charge along the vertical registers. During the vertical blanking time, the charge pattern was transferred to the opaqued "B" storage register. The image is transferred, one line at a time, into the output register.
14 RCA Review Vol. 35 March 1974

CONTROL OF BLOOMING
The effectiveness of this method was demonstrated by placing a
shiny chrome ball in a scene illuminated by a bright light two feet
from the ball and to the left of the scene. Fig. 13 shows a comparison
of the results with and without the operational accumulation method
of blooming control. Without the control, the characteristic vertical
blooming stripe is present. With blooming control, very little blooming
I i
P
Normal Mode
Low Blooming Mode
Fig. 13-256 X 160 element CCD image sensor operating in normal mode and with operational blooming control. Object is a chrome ball illuminated by a bright light two feet to the left of the scene.
is present. The specular overload in this highlight was greater than
10 times the maximum signal capability. Another, more recent, ex-
ample of the effectiveness of the operational method for blooming
control is shown in Fig. 14. Here, a fluorescent lamp represents an
excessive optical overload.
RCA Review Vol. 35 March 1974 15

L-7
w
'i *41
-r
Fig. 14-256 X 160 element CCD image sensor operating (top) in normal mode and (bottom) with operational blooming control. A fluor- escent lamp causes the optical overload.
3.2 Three -Phase Line Sensor with Ion -Implanted Blooming Barriers
The dynamic blooming control approach was demonstrated with both three-phase and two-phase line sensors. A photomicrograph of a 130 stage, three-phase, illuminated register CCD with ion -implanted bloom- ing barriers is shown in Fig. 15.
The test structure employs 0.2 -mil (5µm) -wide aluminum gates with 0.1 -mil gaps. The 1 -mil -wide channel has n+ diffused antibloom- ing buses on each side, separated from the channel by 0.3 mil (8µm) ion -implanted blooming barrier regions. The samples have been made on 5-8 ohm -cm, (100) oriented, p -type silicon wafers.
The ion implantation was carried out through the channel oxide
16 RCA Review Vol. 35 March 1974

CONTROL OF BLOOMING
BLOOMING
S BUS -I
G -I G-2 3 S-2
1211 ..j"; ,I 2 r r,, ... 0..4.....
.;
1)-2
BLOOMING
BUS -2
Fig. 15 -130 -stage, three-phase register with dynamic blooming control (ion -implanted barriers).
- .,
D-2
D -I
G -5
\ G-3 G-4
using 100-keV boron ions with a dose of either 7 x 10¹¹ or 1.4 X
1012cm-2. To avoid channel effects, the implantation was performed at an angle of 7° to the wafer normal. Under these conditions, for the smaller dose, the maximum implanted boron concentration was calculated to be 3 X 10'6cm-3, occurring at a depth of 0.12 µm into the silicon. The concentration was calculated to fall to 1 x 1015cm-3 at 0.37 µm into the silicon. The calculated implant distribution before and after anneal is shown in Fig. 16.
Measurements of the threshold voltages in MOS test devices on
N(cm 7)
Ix10
6 AFTER ANNEAL '110(15
b(15 MIN. 1050°C)
W\o '
AS IMPLANTED
0.2 X(µm)
0.4
Fig. 16-Calculated implant distribution before and after anneal.
RCA Review Vol. 35 March 1974 17

the chips indicated that compared to devices without implanted channels those with implanted channel regions had thresho ds shifted approximately in proportion to the implant dosage; substrate doping had little effect on the amount of shift. The observed shifts for a
7 x 10"cm-2 dose were 2.1 V for a substrate doping of 2 x 10'5cm-3 and 2.3 V for a doping of 5 x 10''cm-3. For a 1.4 X10'2cm-2 dose,
the shift Naas 3.9 V on a 5 x 1014cm-3 substrate. Channel oxides were 2200 ± 200 A thick. We have also built a similar line -scan device that has the standard diffused channel stops instead of the ion -implanted
IX
10
t
100 X
A B
I IX
10 X
IOO X
Fig. 17-Line scan pictures taken with devices similar to those shown in Figure 15: (A) without blooming control and (B) with blooming control.
barriers and the n+ blooming buses. Fig. 17 shows line -scan pictures obtained with each of these devices. The column of photographs on
the left is for the line scanner with no blooming control. Electronic scan was in the horizontal direction, mechanical scan was in the ver- tical. At the top left is a picture produced with the illumination adjusted so that the highlights are just saturating. Next is a picture produced by cutting a slit in a neutral density filter (O.D. = 1). The incident illumination was increased to again bring the highlights in
18 RCA Review Vol. 35 March 1974

CONTROL OF BLOOMING
the filtered regions just into saturation. Therefore, the highlights in
the diagonal slit are overloaded by 10 X. At the bottom is a photo-
graph similar to the above, except the O.D. of the neutral -density
filter was 2. Therefore, highlights in the slit are now at 100 x satura-
tion. The blooming is apparent. The column of photographs on the right shows the results of the
same series of experiments carried out using the device shown in Fig. 15. The highlights in the slit were at 10 X and 100 X, respectively.
The control of blooming is evident. In both cases the integration period was 5 cosec and the readout
was at 200 KHz giving an integrate -time to clock -period ratio of 103
so that optical smear was not a problem.
1
G -I 4)-21Si1
/ 4)-11A11
G-4 ---I I- 5 m i l s
, O-2
S-2 BLOOMING BUS
Fig. 18 -128 -stage, two-phase register with dynamic blooming control step- ped -oxide barrier).
3.3 Two -Phase Line Sensors with Stepped -Oxide Blooming Barriers
The dynamic blooming control with stepped -oxide blooming harrier was studied with 64- and 128 -stage, two-phase polysilicon-aluminum- gate, p -channel registers. The 64 -stage registers had 5 -mil (0.13 mm)
wide channels, and the 128 -stage registers were made with 0.5 mil
(13 µm) wide channels. The photomicrographs of the 128 -stage are
shown in Fig. 18. These devices were made on 0.5 to 1.0 ohm -cm. n -
type silicon substrates with (100) orientation. The gate structure for both types of devices have the same width. The different channel
widths were obtained by changing only the channel stop mask. As
can be noted in Fig. 18, the blooming bus diffusion surrounds the entire device. These devices were fabricated following our previously described procedure for two-phase polysilicon-aluminum gate CCD's.4
However, the p+ diffusion masks were modified so that the p+ bloom -
RCA Review Vol. 35 March 1974 19

ing bus diffusion was placed 0.3 mil (8 µm) inside the field oxides on both sides of the CCD channel. Also the thick field oxide was replaced by an oxide with thickness X., = 2000A under the polysilicon gates in the field regions outside of the CCD channel_ In the channel region the oxides under the polysilicon and aluminum gates were grown to X, = 1000A and X3 = 2400A, respectively.
We have also constructed 2 -phase line sensors with dynamic (step- ped -oxide barrier) blooming control with blooming barrier oxide X2 = 3000A, which was larger than the channel oxide under the aluminum gates (X3 = 2400A). This was done to check if there might be a re- duction in transfer efficiency in devices with oxide thickness X2 < X3. The tests showed that in the case of the devices having oxide thick- nesses X2 > X3, as expected, the blooming control requires special gate biasing during the optical integration period. We have also found that the transfer efficiencies ín both types of devices were not affected by the presence of the anti -blooming structure and were consistent with our standard 2 -phase registers.'
ft :1.0 NH*
FRAME TIME: 10 ms
PERT SCALE : 0.5 v /dir HORG. SCALE: IOµs/dir
LIEU _own to)
ILLUMINATION
71i XI
iii:--1 -t 11ii e (ol
ILLUMINATION
X10
Fig. 19-Output signal of 64 -stage, two-phase register with no blooming control.
A comparison of the operation of two similar 64 -stage, illuminated register CCD's with and without blooming control is made in Figs. 19 and 20. The detected output of the 64 -stage register with no blooming control is shown on the left Fig. 18. The top photographs shows the output signal obtained when the intensity of a light spot was adjusted to just give a saturated signal. The bottom photo shows the results of a 10 x optical overload. The carriers have spread in both directions and caused severe blooming. These results can be compared with those obtained on a similar 64 -stage device with anti -blooming structure
20 RCA Review Vol. 35 March 1974

CONTROL OF BLOOMING
fc=1.0 MHR
FRAME TIME 16 ms
VERT SCALE. 0.5 V/dír
HORI. SCALE =10µs/div
lal NO ILLUMINATION
Ibl ILLUMINATION
XI
Cc)
ILLUMINATION
X 1
Fig. 20-Output signal of device similar to that of Figure 19, but with dynamic blooming control (stepped -oxide barrier).
shown in Fig. 20. The tesis shown in these two figures were made
by projecting an optical signal formed by an illuminated slit. To
obtain even higher local contrast, an optical slit was painted on another
64 -stage device with anti -blooming structure. Light was then pro-
jected on the device. The results of this test are shown in Fig. 21. In
the top photo the light incident on the slit was adjusted to just
l,, ° 'r W! --,--- i st _ I V 0 lL
. =
lams
2/-71
SUBST. BIAS '+5V PHASE CLOCK = 10 V
fc=1.0 MHz
FRAME TIME:16 ms
VERT. SCALE 0.5 V/div
MOR!. SCALE 10ms/dir
la) ILLUMINATION
XI
IbI ILLUMINATION
X10
lc) ILLUMINATION
X100
Fig. 21-Output signal of 2 -phase register with dynamic blooming control (stepped -oxide barrier) illuminated through a slit painted on the register.
RCA Review Vol. 35 March 1974 21

produce saturation. It was then adjusted to give a 10 x and 100 X
overload. As can be seen in waveforms in Fig. 21, the edges of the painted slit were not completely straight and abrupt so skirts can still be seen on the envelope. Also the region on the left in Fig. 21(c) was beyond the opaque ink and was picking up scattered light. The frame time was 16 msec and readout was at 1MHz. The confinement of the spot is evident.
B
Ix
HIGHLIGHTS IN DIAGONAL LINE ARE 10X OVERLOAD
HIGHLIGHTS IN DIAGONAL LINE ARE IOOX OVERLOAD
Fig. 22-Line scanned pictures using 128 -stage, two-phase CCD with step- ped -oxide antiblooming structure.
Line scanned pictures were made with a 128 -stage 0.5 -mil (13 µm) wide version of this two-phase device. These results are shown in Fig. 22. The highlights in the diagonal are at 1 x, 10 x and 100 x saturation for this photograph. Readout was at 200 khlz and integra- tion time was 5 cosec. The containment of excess carriers is again evident.
4. Summary and Conclusions
In summary, charge -coupled image sensors are capable of low light level operation, and therefore it is desirable to have methods for con- trolling the large overloads that frequently occur in low level scenes and in scenes with specularly reflecting objects. Various methods of
22 RCA Review Vol. 35 March 1974

CONTROL OF BLOOMING
blooming control have been investigated and the following conclusions
can be made. The accumulation mode is an operational 'Aay of limiting blooming
and, although it does not completely eliminate blooming, this mode of
operation can reduce it without requiring any additional structure.
The static blooming control using polysilicon blooming barrier gates is compatible with devices made with polysilicon field shield
construction. The independent control of the blooming barrier in this
method permits blooming control only during the optical integration
time. With this type of anti -blooming construction, the charge -coupled
imager with illuminated registers can be operated with some degree
of electronic shutter action. A more effective electronic shutter opera-
tion can only be achieved in charge -coupled imagers designed with
separate photosensor elements that are scanned by non -illuminated
charge -coupled registers.
i)ynamic methods of blooming control, where the barriers are estab-
lished by the interaction of the clock voltages with either an ion -
implanted region or a stepped -oxide region. are applicable to most
charge -coupling structures. The tested devices operating with dynamic
blooming control showed containment of 10 x and 100 x optical over-
loads. Higher overload containment is possible, but test equipment
limitations prevented obtaining this information optically. However,
electrical input tests indicate that overloads of 105 should pose no
problem. The tests of line sensors with dynamic blooming control
demonstrate that the presence of the dynamic blooming barriers does
not reduce the transfer efficiency of these devices.
The maximum optical overload that can be tolerated by frame trans-
fer charge -coupled imagers with illuminated registers is limited by
smearing effects during the transfer of the detected image from the
photosensitive area to the temporary storage area. The smearing
effects increase in direct ratio to the size of the optical overload.
Therefore, for maximum protection against smearing due to large
optical overloads, a mechanical or electro -optic shutter should be used
or the charge -coupled imager should be constructed using separate
photosensor elements that incorporate some form of blooming control
and are scanned by non illuminated charge -coupled registers.
The selection of the method to be used in a particular device will
be governed in large part by other system requirements and design
objectives, as well as preference for device construction. In any event,
the existence of these alternative approaches to blooming control
serves to enhance the range of possible applications for charge -coupled
imaging.
RCA Review Vol. 35 March 1974 23

Acknowledgments
This work was partially supported by the Naval Electronic Systems Command under Contract N0039 -73-C-0014. The authors would also like to thank B. F. Williams for many stimulating discussions con- cerning the control of blooming in charge -coupled imagers, E. C. Douglas for ion -implanting the test devices, W. S. Romito for fabrica- tion of the two-phase devices, and V. L. Frantz for fabrication of the three-phase devices.
References:
M. G. Kovac, F. V. Shallcross, W. S. Pike, P. K. Weimer, "Design, Fabrication, and Performance of a 128 x 160 Element Charge -Coupled Image Sensor," CCD Applica- tions Cont. Proc., pp. 37-42, Sponsored by Naval Electronics Laboratory Center, San Diego, Calif., Sept. 18-20, 1973. 2 W. F. Kosonocky and J. E. Carnes, "Design and Performance of Two -Phase Charge - Coupled Devices with Overlapping Polysilicon and Aluminum Gates," Technical Digest, 1973 International Electron Devices Meeting, pp. 123-125, Dec. 3-5, 1973, Washington, D.C. 3 R. H. Krambeck, R. H. Walden, and K. A. Pickar, "A Doped Surface Two -Phase CCD," Bell Syst. Tech. J., Vol. 51, No. 8, p. 1849, Oct. 1972. 4 W. F. Kosonocky and J. E. Carnes, "Two -Phase Charge -Coupled Devices with Over- lapping Polysilicon and Aluminum Gates," RCA Review, Vol, 34, p. 164, March 1973.
24 RCA Review Vol. 35 March 1974
Intermodulation Distortion in Resistive Mixers
Stewart M. Perlow
RCA Laboratories, Princeton, N. J. 08540
Abstract-This paper discusses the relationship between the nonlinear gain characteristic of a resistive mixer and intermodulation distortion. The analysis is divided into two distinct parts. First, a generalized equiva- lent circuit that is valid for large signals or small signals is derived. The purpose of the development used is to show in progressive steps the effects of the higher -order terms of the diode expansion. Once the generalized equivalent circuit is obtained, impedance -matching criteria are developed for optimum power -matching conditions. The second part of the analysis is a study of the series representation of the non-
linear gain equation obtained from the generalized equivalent circuit. The final result is an equation that predicts the amplitude of the inter - modulation distortion at any of the intermodulation frequencies.
Introduction
Knowledge of the intermodulation distortion of an amplifier or con- verter is important because it is a measure of the fidelity of the device. The fidelity of an amplifier or frequency converter is described by the linearity of its gain characteristic. The gain is essentially constant over a certain range of input levels, but deviates greatly from linearity once a particular level is exceeded. This deviation from linearity is
known as gain saturation, and operation in this region is characterized by a severely distorted reproduction of the input. Gain saturation and
RCA Review Vol. 35 March 1974 25
noise figure are the upper and lower limits of dynamic range. In many applications, especially where high-level signals are to be processed, gain saturation is a much more important specification than noise figure.
If two or more signals are applied to the input of an amplifier or converter and are of sufficient level to cause gain saturation, the nonlinear gain characteristic produces nonlinear distortion that con- sists of mixing of the input signals. The resulting output contains, in addition to the original signals, responses at e\eiy sum and differ- ence frequency. In the case of two signals of frequencies f1 and f.: applied to an amplifier, the output contains every frequency cor- responding to (m + 1) fi -±- mf._ and (m + 1) f2 ± mf1. where m is any positive integer. That is, the output spectrum consists of equally spaced frequency responses, where the spacing is the difference be- tween the two original frequencies. The output of a frequency con- verter would consist of the same spectrum, except that the center is shifted by the frequency of the local oscillator or pump source. The amplitude of the output at these intermodulation frequencies is de- termined by the degree of gain saturation. Therefore, the amount of intermodulation distortion. as determined by a trio -tone test, is a very convenient criterion for specifying the upper limit of dynamic range or the linearity of an amplifier or converter.
The purpose of this analysis is to obtain a complete equivalent circuit for a resistive mixer diode in terms of diode parameter IP,,, and the voltage levels present at the diode terminals. The complete equivalent circuit arri\ed at is easily adaptable for small- or large - signal analysis and is also reducible to an equivalent circuit for a square -law diode.
The analysis is carried out on a large -signal basis by assuming that three sinusoidal voltages (the signal, the local oscillator, and the intermediate frequency) are across the diode terminals. The expo- nential equation for the diode current is then expanded in a power series. The equivalent circuit is obtained using only the first two terms of the series. This is the case for a true square -law diode. Using this equivalent circuit for the diode in a mixer circuit, the gain equation is derived and is shown to exhibit saturation even though the diode is square law.
The effect of the other terms in the expansion, usually known as the diode nonlinearities, on the equivalent circuit and on predicted gain are then investigated. The final equivalent circuit obtained is perfectly general for any diode exponent and for any voltage level at the diode terminals. It leads to specific values needed for signal, load,
26 RCA Review Vol. 35 March 1974

INTERMODULATION DISTORTION
and local -oscillator resistances for optimum matching; and it also
predicts the changes in resistance levels as the voltage levels are
changed. Using the equivalent circuit. the gain equation of the resistive -
mixer diode is obtained, and an intermodulation analysis is performed.
This analysis is based on the use of the envelope gain characteristics
of the complete device for a single input signal, rather than the diode
1-V characteristic. Intermodulation distortion is then predicted on the
basis of applying more than one signal to the device, where the
separation between the signal frequencies is much smaller than either
signal frequency. Intermodnlation distortion for any particular operat-
ing power level is then predicted.
Power Series Representation
The diode current is related to the voltages at the diode terminals by
i = lsnt(e°v - 1), [1]
where isst is the reverse saturation current. Expanding this equation
in a series results in
[. (ay)"=1snt ( =1 n!
[2]
The desired voltages across the diode terminals are those .due to
the signal, local oscillator, and intermediate frequency output. The
expression for the diode terminal voltage, is therefore,
y = Vs cos (wst -I- Os) -}- V, cos ((opt -F Op) + Vo cos (wvt + 00) [3]
where the subscript s indicates the signal frequency, p the pump or
local oscillator frequency, and o the output intermediate frequency.
The sinusoids may be expressed in exponential form:
where
v = (v8eiw,t v8>:-e_;w.,t)
(Zveiwt + vo.,`e- [4 I
Vs ve-- - eie«
2
RCA Review Vol. 35 March 1974 27

Va vR = *-e-;e8
2
Each term of the expansion contains a power relation of the diode terminal voltage. In general, when v is raised to a power, the result is a sum of sinusoids of several frequencies. Since the only frequencies of interest are those specified in Eq. 13], it is assumed that the appropriate filters will be added to the circuit to eliminate all the undesired frequencies. The actual calculations, although algebraically simple, are quite tedious and will not be listed here. The resulting expressions for v raised to a power are shown in Table 1, where only the three frequencies of interest remain. The relationship between these three frequencies is:
6)p = 61 + 6)8.
Table I-Expressions for Diode Terminal Voltage v Raised to a Power for w w and m.
Term Amplitude Phase Signal Frequency to.
v v2
v3
v4
V, V. V
3 -V.(V,2+2V.2+2V"-) 4
3 - V.V ( V.2 -I- V,;= + 2V.-) 2
9.
9. - 0 Pump Frequency w
v
vz
v3
v4
V V. V.
3 - V(V"- + 2V.2 + 2V0.1) 4
3 - V,V.(V,2 + V.' + 2V2) 4
OP
O.-
Output Intermediate Frequency w.
v
41-
v3
v4
V. V V.
3 - V. ( V .= + 2V;= + 2V.2) 4
3 - VV (V;= + V,= + 2V02) 4
9.
28 RCA Review Vol. 35 March 1974

INTERMODULATION DISTORTION
It is interesting to note that in order to have information trans- lated from the signal to output frequencies, the only term required is
the squared term. Thís, of course, ís the simplest form of mixer-the square -law mixer. Considering an idealized square -law diode of this type, Eq. 2 becomes
(aV)2 2=/sat
IaV+ Zl [51
The meaning of the term "square -law diode" should be clarified.
In common useage, when one refers to a square -law diode, it means
that the voltages across the diode terminals are small enough to render negligible the third- and higher -order terms in the expansion. How-
ever, if the voltage is increased to high signal levels, these terms must be considered, and the nature of the response is completely changed. The square -law diode in this discussion refers to a diode characteristic whose expansion ends with the squared term for any terminal voltage,
be it large or small. The reason for this clarification is that if one is
talking about a diode that is square law for small voltages only, it is
expected that when a large signal is used saturation and intermodula- tion distortion will occur. It will he shown that a mixer using a true square -law diode saturates as well and some degree of intermodulation is always present. The following analysis holds for the true idealized
square -law diode. Substituting Eq. [4] into Eq. [5] and collecting similar frequency
terms results in the diode currents
Zo = alsat(vo + avavp)
Zp = alast(vp + avova*)
is= alsat(vs + avovp*),
[6]
where the total diode current is
f i = ioeimot + ioe-iwot + ipeimot + ye-iwst + iaeim.,t + is*e-im.t, [7]
Equivalent Circuit and Gain Equation for Square -Law Diode
Using Eq. [7] and the mixer circuit shown in Fig. 1 results in the following circuit equations:
Grovo = a`jaetvavp+ [ ó]
RCA Review Vol. 35 March 1974 29

iyp = GTvvn + a218ntvovs% [9]
Zqs = GTsva + a'2Isntvovpr,
where ¡PP and sources, i.e.,
tu8
[10]
represent the local -oscillator and signal current
Fig. 1-Mixer circuit.
18p
Re (iy = Re (peiwPi)-tit4pt+e)
2
= Iypcos (wpt + Bsp)
and the conductances G are
Gro=al sat +GL
[11]
[12a]
Grp = aIsat + Gyp [12b1
GT8 = alt + Gy8 [12c]
It is noted that the units of a are (volts) -1, and the units of Isnt are amperes, thus making a!s t an equivalent conductance.
With Eqs. 18], 19], and 1101, it is very easy to develop an equivalent circuit for the square -law diode that holds for both small and large signals. This circuit is shown in Fig. 2. The voltage gain of the circuit is the transfer function v0/v8. Using Eq. [8] and solving for the gain
vo a2l8nt -= VP.
v8 GTo [13]
30 RCA Review Vol. 35 March 1974

INTERMODULATION DISTORTION
Eq. [8] and I9] are now solved simultaneously to obtain vp as a
function of the pump source and signal. Substituting into Eq. 1 13]
results in
SIGNAL
PUMP
vo
vo GToGTp 1 1+ agsotvs 2/(GToGTp) ]
a21snt ZDP
2 it a ¡sat VO Vp
2 a 'sat `Is `lp
2 -1E
a sat `lolls
Í
L Fig. 2-Equivalent circuit of a square -law diode.
01'
where
vo Ao
v8 1 + (A028)2
a2/sat Ao =
iDP
GToGTp
4 a süC- Al2 =
GToGTp
[141
IF
[15]
RCA Review Vol. 35 Marcn 1974 31

The gain has thus been shown to be a function of the signal level. It is this factor that produces saturation; as the signal level is in- creased, the gain begins to drop off. The saturation level, i.e., the point at which the maximum output occurs, is reached when the product (A1v8)2 is unity. The gain is never truly a constant; for small values of signal voltage, however, the (.41v8)2 term may be considered negligi- ble compared to unity, and the gain can be considered a constant. The value the gain assumes for small signals is, therefore, Ao, the small signal gain.
These results are important because the idealized square -law diode mixer does indeed saturate if the local oscillator level is held constant.
The physical reason for this saturation is interesting. It occurs because, as the signal power is increased, the signal voltage rises causing mismatches in both pump and output circuit, which in turn produces a mismatch in the signal circuit. This mismatch reflects the incident signal power.
This can be seen by solving Eqs. [8] and [9] simultaneously for the pump -circuit input conductance:
ZgP a4/..t2 GinP=-= Grp + 1 v81
vP Gro [16]
As the signal voltage increases, the pump circuit conductance is changed, thus reflecting the incident pump power. Similarly, the signal -circuit input conductance depends on the pump voltage developed across the diode:
a 2 a aet Gin8=GT8+ IvPI2
GTO
[17]
Since the pump circuit conductance has changed, vP will change. thus changing the signal -circuit input conductance. Even in this idealized case of a square -law mixer, these interactions are extremely complex, because all the terminal voltages interact with one another due to the dependence of input conductances on terminal voltage.
Effect of Third -Order Term on Equivalent Circuit
For diodes other than the true square -law type, other terms in the series expansion must be taken into account. The effect of these terms
32 RCA Review Vol. 35 March 1974
INTERMODULATION DISTORTION
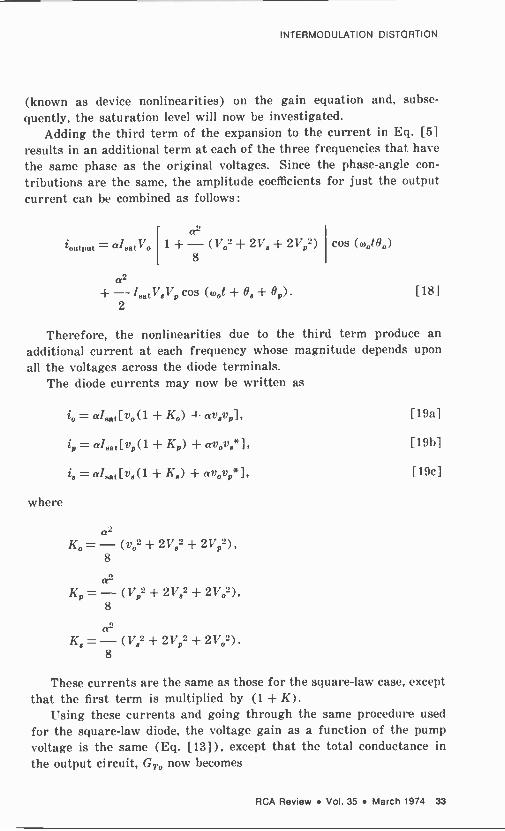
(known as device nonlinearities) on the gain equation and, subse- quently, the saturation level will now be investigated.
Adding the third term of the expansion to the current in Eq. [51
results in an additional term at each of the three frequencies that have
the same phase as the original voltages. Since the phase -angle con-
tributions are the same, the amplitude coefficients for just the output current can be combined as follows:
¡output = alsntVo a2
1 +-(Vo'-}-2V8+2Vp2) 8
a2
+ - loot V817p cos (mot + s + Bp)
2
cos (w,,t90)
[18]
Therefore, the nonlinearities due to the third term produce an
additional current at each frequency whose magnitude depends upon
all the voltages across the diode terminals. The diode currents may now be written as
where
Zo = aluot[vo(1 + Ko) + amp], [19a]
Zp = alaotl vp(1 + Ap) + avov8jr], [19h]
Z8 = a18t [ v8 (1 K8 ) + avovp" ] , [19c1
Ko =- evo" + 2V82 + 2Vp2), 8
a2 Kp=-(Vp=+2V8=+2Vo'),
8
a2 K8=-(V8-'+2Vp''+2Vo=).
8
These currents are the same as those for the square -law case, except that the first term is multiplied by (1 + K).
Using these currents and going through the same procedure used
for the square -law diode, the voltage gain as a function of the pump voltage is the same (Eq. [131), except that the total conductance in
the output circuit, GTo now becomes
RCA Review Vol. 35 March 1974 33

Gro= «lsat (1 + Ko) + GL. [20a
That is, the fixed conductance the diode presents, al eat, is multiplied by (1 + K). The fixed portion of the diode conductance has now become a function of the voltage levels (magnitudes) at the diode terminals, which was not so for the square -law case.
Vp Y5
c !Gat (I+Ks)
a2 ISO}Vs Vp
Fig. 3-Equivalent circuit of a diode using three terms in series expansion.
Similarly, the fixed conductances presented by the diode in the local oscillator and signal circuits become
GTp = ala:i t(1 + 117p) + G, [ 20b j
GTs = a/sat(1 + KA) + GpB. [20c]
The gain equation is in exactly the same form as for the square -law case, but with the new values of GTo and Grp replacing the original values. Note that the small -signal gain Ao and the saturation level coefficient Al2 are no longer fixed quantities but are now dependent on the diode terminal voltages. This is one of the principal differences between the square -law diode and non -square -law diode. A more de- tailed examination of this difference and the effect of pump power level on gain and intermodulation distortion will he made later.
The new equivalent circuit is shown in Fig. 3.
34 RCA Review Vol. 35 March 1974

INTERMODULATION DISTORTION
Effect of Fourth -Order Term on Equivalent Circuit
The effect of the fourth term of the expansion on the gain equation is found by adding it to the current and deriving the gain equation in the same manner as used previously. The resulting diode currents are
jo = al.et[vo(1 + Ko) + av8v7,(1 + L0)],
ip = al8s,[vp(1 + K,,) + avovs* (1 + I,p) ],
ZB=alest [vs (1 + K8) +avovp+'"(1 + L8)],
[21a]
[21b]
[21c]
where
a2 l.a=-(V82+Vp2+2Vo2),
8
a2
Lp=-(V82+Vo2+2Vp2), 8
a2 L8=-(Vó +Vp2+2V82).
8
The effect of adding the fourth term is to change the equivalent - circuit current sources. The new equivalent circuit is shown in Fig. 4.
In general, the odd -order power terms change the equivalent -circuit diode conductances, while the even -order power terms change the equivalent -circuit current generators. It should be pointed out that the terms of the expansion also add de currents to the sinusoidal currents. These de currents are functions of the voltage levels at the diode terminals. Because of this, the de bias will change with changes in signal and local oscillator input level.
The voltage gain expression for this case is of exactly the same form as the two previous cases. However, Ao and A, have again changed.
Complete Equivalent Circuit
Now that the effect of both the third- and fourth -order terms have been seen, generalizations as to the effect of all higher -order terms can be made. The voltage -gain expression always remains in the form of
RCA Review Vol. 35 March 1974 35
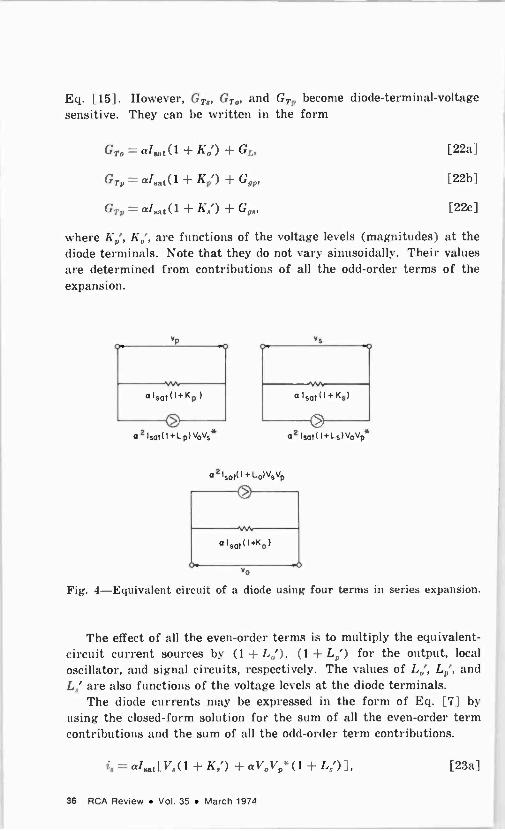
Eq. [15]. However, Gra, Gro, and Grp become diode -terminal -voltage sensitive. They can be written in the form
Gro = alat(1 + K0') + GL, [22a]
Grp = a/eat(1 + Kr') + G910 [22h]
Grp = alsat(1 + Ks') + Go, [22c]
where Kr', K0', are functions of the voltage levels (magnitudes) at the diode terminals. Note that they do not vary sinusoidally. Their values are determined from contributions of all the odd -order terms of the expansion.
a 215010 + LP) VOVs* 02 'sat( I+L s)VOVp*
a 21,t(1 + L O) VS Vp
vo
Fig. 4-Equivalent circuit of a diode using four terms in series expansion.
The effect of all the even -order terms is to multiply the equivalent - circuit current sources by (1 + Log, (1 + Lp') for the output, local
oscillator, and signal circuits, respectively. The values of Lo', Lp , and Lx' are also functions of the voltage levels at the diode terminals.
The diode currents may be expressed in the form of Eq. [7] by using the closed -form solution for the sum of all the even -order term contributions and the sum of all the odd -order term contributions.
is= aloat[Vx(1 + Ks') + aVoVp* (1+ 1.89], [23a]
36 RCA Review Vol. 35 March 1974
INTERMODULATION DISTORTION
where
ip = a/Ee, [ Vp (1 + h p' ) + aV oV } (1 + Lin], [23b]
i0= a1,:at[V0(1 + Ko') 1 aVBVp(1 + L.9], [23c]
11 (aV,) 1 + Ká = 2 1s(aVp)1o(a`o),
aV 11(aVp)
1+ Kp' = 2 10(aVe)10(aVo), aV
11(a170) 1+ Ko = 2 lo(aVp)lo(aV ),
aVo
1+LA'=21o(aVe)
1 + I,p' = 21o(aVp)
1 + Lá = 21o(aVo)
I1(aVp) I1(seV0)
aV aV 11(aVA) 11(aVo)
aV a Vo
I1(aVp) I, ((rya)
aVp al/8
Io(aV) and I1(aV) are modified Bessel functions of the first kind. Their values may be easily determined from Bessel function tables for any specified value of (aV).
Note that for small voltages (i.e., Ve, Vp, and V. all approaching zero), the higher -order terms of the original expansion, Eq. 121, are negligible, and mixer operation is square -law. It is therefore expected that these currents would be reduced to the square -law currents, Eq. [7]. This is true, since, as the voltages approach zero,
lim I1 v -.o
(aV) 1
aV 2 [24]
lim 1o(aV) = 1. 125] v -.o
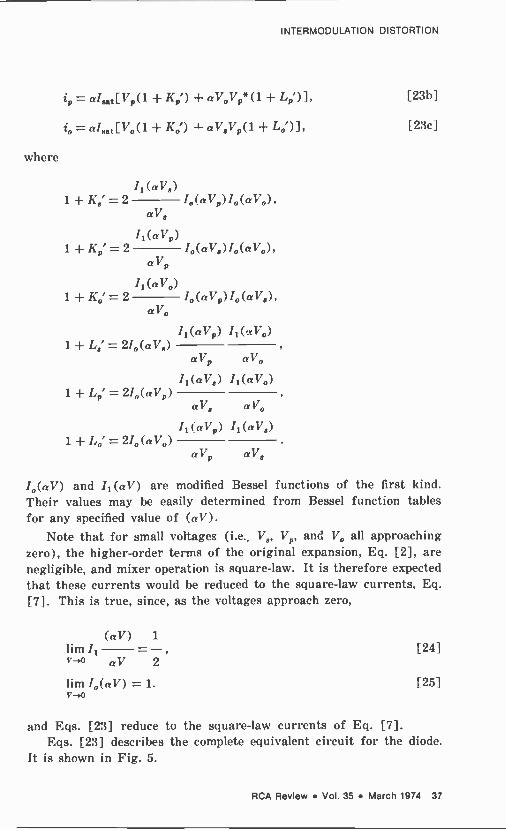
and Eqs. 1231 reduce to the square -law currents of Eq. [7]. Eqs. [23] describes the complete equivalent circuit for the diode.
It is shown in Fig. 5.
RCA Review Vol. 35 March 1974 37

Impedance -Matching Criteria
For optimum power -matching conditions, the source and load impedance should be matched to the input impedance of the appropriate circuit. Since these input impedances depend on the magnitudes of the voltages at each port, the circuits must be rematched for any change in voltage
SIGNAL
4a 2i
PUMP
a 21sa
I
I,(a Vs) Ii(a VD) 0(a V )
o a Vs a VD
1
I( a V ) I,( a VD) I,(a Vo)v v o s a,Vp a Vo o p
IF
I( a V I,( a Vs) I ( a Vo) v v
o D aVs avo o D
L
GS =2 Itt I,(aVs)Io(aVD)lo(aVo)
GP =2 lv I (aVD)lo(a Vs) lo( ayo)
D
Gá 2lV' I(a V0)10 (a V, )10(aVD )
o
Fig. 5-Complete equivalent circuit of diode.
levels if optimum matching is to be achieved. Using the equivalent circuit, the required source and load conductances are found to be
where
Gp=G9 V 1
I, (aVp)
Io(aVp)
Ii(aVp)
J
lz GL= G.'
Y
1
Io (a Vp )
/sat G8 = 2 - I1 (aVR)/o(aVp)Io(aVo),
Vs
[26a]
[26b]
[27a]
38 RCA Review Vol. 35 March 1974
INTERMODULATION DISTORTION
lent Gó = 2 -I1(aVo)Io(aV8)I0(aV0).
Vo
[27b]
For small voltage levels, these conductances approach the values for the square -law diode, that is,
GL- Gga- GDp- aleat [28]
The optimum matching conditions for the square -law diode thus require equal conductances for the two sources and the load. For a typical diode with an a of 20 and 'sat of 10 x 10-6, the source and load impedances are 5000 ohms.
For a real mixer this case is quite unlikely, since the conversion efficiency is related to the pump power, which is usually made large to keep the efficiency as large as possible. to (aVP) is therefore not equal to unity and must appear in the equation. This case, in which aVe and all() are considered much smaller then aVP. is the real small -signal case. It is the one used for small -signal analysis of the resistive mixer.
For these conditions, V8 and Vo approach zero; and the required source and load conductances GPe and GL become
gPe = aleet\/ ó2(aVP) - Ii-(aVP), [29a]
gL = a/eetV ó2(«VP) - [29b]
where a small letter g is used to indicate values associated with the small -signal case.
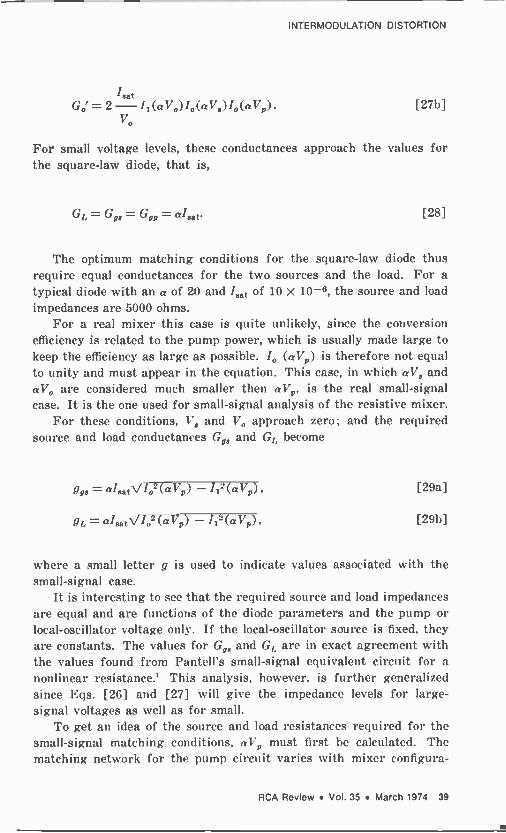
It is interesting to see that the required source and load impedances are equal and are functions of the diode parameters and the pump or local -oscillator voltage only. If the local -oscillator source is fixed, they are constants. The values for Goo and GL are in exact agreement with the values found from Pantell's small -signal equivalent circuit for a nonlinear resistance.' This analysis, however, is further generalized since Eqs. [26] and [27] v ill give the impedance levels for large - signal voltages as well as for small.
To get an idea of the source and load resistances required for the small -signal matching conditions, aVP must first be calculated. The matching network for the pump circuit varies with mixer configura -
RCA Review Vol. 35 March 1974 39

tion. For single -diode mixers the pump may be either loosely or tightly coupled to the diode, depending upon the requirements for isolating the pump circuit from the antenna. For this example let it be assumed that the diode pump impedance is about 100 ohms. The pump voltage with 1 mw of pump power is therefore
PpRp vp = = 0.316 volts.
2
N Q W
U W
DIODE EXPONENT z SIGNAL LEVEL- a VS
Fig. 6-Variation in input and output impedance as a function of signal voltage amplitude.
Therefore,
aV = 6.32,
lo(aVp) = 88,
I1(aVP) = 81.
The small -signal input and output impedance is therefore
1
rya= rL = = 116 ohms. alaatVlo"(aVp) - 1121aVp)
40 RCA Review Vol. 35 March 1974
INTERMODULATION DISTORTION
If the signal level is appreciable, then its effect on the small -signal conductances must also be considered:
11(aVa) Goa= !!aa 2 1a(aV0),
aVa
11(aVo) GL = gL 2 10(aV8).
aVo
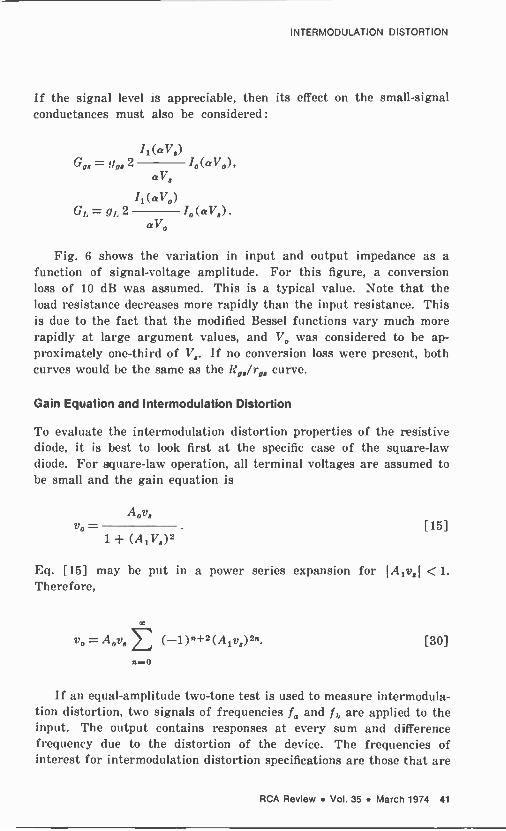
Fig. 6 shows the variation in input and output impedance as a function of signal -voltage amplitude. For this figure, a conversion loss of 10 dB was assumed. This is a typical value. Note that the load resistance decreases more rapidly than the input resistance. This is due to the fact that the modified Bessel functions vary much more rapidly at large argument values, and Vo was considered to be ap- proximately one-third of Va. If no conversion loss were present, both curves would be the same as the Rua/r, curve.
Gain Equation and Intermodulation Distortion
To evaluate the intermodulation distortion properties of the resistive diode, it is best to look first at the specific case of the square -law diode. For square -law operation, all terminal voltages are assumed to be small and the gain equation is
Aova y.= [15]
1 + (A1V8)2
Eq. [15] may be put in a power series expansion for IALvsI < 1.
Therefore,
110 = Aova (-1)n+2(A,va)2n. [30]
n=0
If an equal -amplitude two-tone test is used to measure intermodula- tion distortion, two signals of frequencies fa and f,, are applied to the input. The output contains responses at eery sum and difference frequency due to the distortion of the device. The frequencies of interest for intermodulation distortion specifications are those that are
RCA Review Vol. 35 March 1974 41
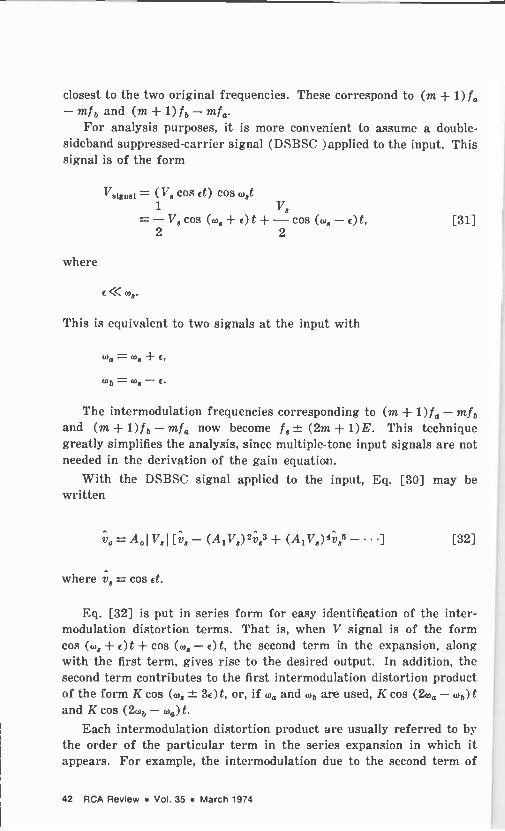
closest to the two original frequencies. These correspond to (m + 1)f. - mfb and (m+l)fb-mía.
For analysis purposes, it is more convenient to assume a double- sideband suppressed -carrier signal (DSBSC )applied to the input. This signal is of the form
Vaignnt = (V8 cos Et) cos wet 1 V8 =- V8 cos (w8 + E) t + - cos (w8 - E) t, 2 2
where
E< W8.
This is equivalent to two signals at the input with
wa=w8+E,
wb=w8-E.
[31]
The intermodulation frequencies corresponding to (m + 1)f. - mf b
and (m -}- 1) fb - mfa now become f8 ± (2m -E- 1)E. This technique greatly simplifies the analysis, since multiple -tone input signals are not needed in the derivation of the gain equation.
With the DSBSC signal applied to the input, Eq. [30] may be written
vo = A0117.1[;. - (A1V8)2v83 + (A1178)4v8% - . . .] [32]
where v8 = cos Et.
Eq. [32] is put in series form for easy identification of the inter - modulation distortion terms. That is, when V signal is of the form cos (0)8 + E)t -}- cos (ws - E) t, the second term in the expansion, along with the first term, gives rise to the desired output. In addition, the second term contributes to the first intermodulation distortion product of the form K cos (w8 ± 3E)t, or, if (t) orb are used, K cos (2wa - orb) t and K cos (20,1,- wa)t.
Each intermodulation distortion product are usually referred to by the order of the particular term in the series expansion in which it appears. For example, the intermodulation due to the second term of
42 RCA Review Vol. 35 March 1974
INTER MODULATION DISTORTION
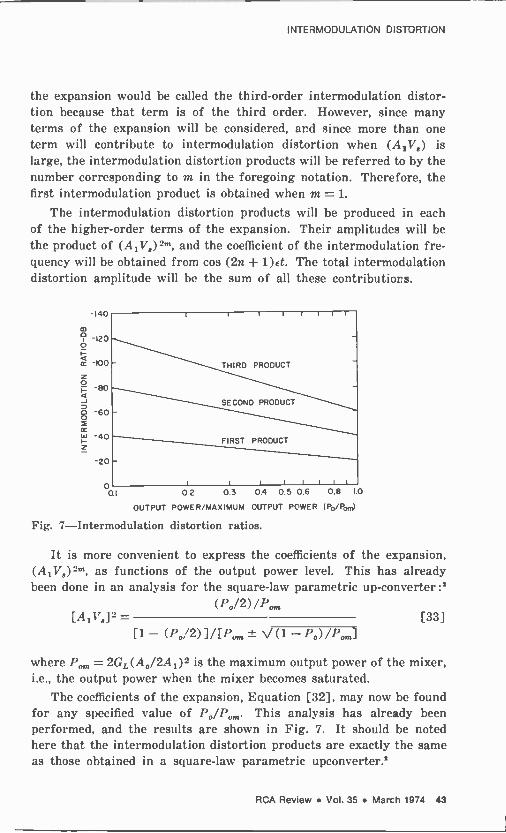
the expansion would be called the third -order intermodulation distor- tion because that term is of the third order. However, since many terms of the expansion will be considered, and since more than one term will contribute to intermodulation distortion when (A1V8) is large, the intermodulation distortion products will be referred to by the number corresponding to m in the foregoing notation. Therefore, the first intermodulation product is obtained when m = 1.
The intermodulation distortion products will he produced in each of the higher -order terms of the expansion. Their amplitudes will be the product of (Ai 178)2m, and the coefficient of the intermodulation fre- quency will be obtained from cos (2n + 1)Et. The total intermodulation distortion amplitude will be the sum of all these contributions.
-140
-120
-100
-80
-60
-40
-20
o 0.1
THIRD PRODUCT
SECOND PRODUCT
FIRST PRODUCT
I
0.2 0.3 0.4 0.5 0.6 0.6 1.0
OUTPUT POWER/MAXIMUM OUTPUT POWER (Po/Port)
Fig. 7-Intermodulation distortion ratios.
It is more convenient to express the coefficients of the expansion, (A,VR)2 as functions of the output power level. This has already been done in an analysis for the square -law parametric up -converter :2
(P0/2) /Pon, [33] [A1173]2 =
[1 - (Po/2)]/[Pp,n± V(1 -Pa)/Pon,]
where Pon, = 2GL(A0/2A1)2 is the maximum output power of the mixer, i.e., the output power when the mixer becomes saturated.
The coefficients of the expansion, Equation [32], may now be found for any specified value of Po/Pon. This analysis has already been performed, and the results are shown in Fig. 7. It should be noted here that the intermodulation distortion products are exactly the same as those obtained in a square -law parametric upconverter.2
RCA Review Vol. 35 March 1974 43
Examination of Eq. [32] shows that the intermodulation distor- tion ratio, which is the ratio of the intermodulation distortion product to the desired output, is a function of the magnitudes of coefficient of each term in the expansion, while the term multiplying the whole series, Aovo, determines the output level.
The definition of Po,n given is mathematical with respect to its derivation. It is interesting to get a physical concept of this very important quantity. As defined, Pom is
Ao 2
Pont = 2GL C2A1
[34]
Substituting the values from Eqs. [12] and [15] into Eq. [341 re- sults in
1 i2 1
Porn 2 G [35]
This result shows that Po, is proportional to the pump power, i.e.,
1
Porn = - Pp 4
The plots shown in Fig. 7 may be written in analytic form as
[36]
Po IMRm(dB) = m 2 (dB) - 19.51. I. [37]
Porn
Therefore, the first intermodulation distortion product ratio is
Po IMR1(dB) = 2 - - 19.5. [38]
Pom
Since Porn is proportional to Pp, Eq. [36], it is easily seen that an increase in pump power will decrease the intermodulation distortion. If the pump power is increased by 1 dB, the intermodulation distortion ratio is decreased by 2 dB. The intermodulation distortion in a resistive mixer can, therefore, be reduced by increasing the pump power; for every 1 -dB increase in pump power. the intermodulation distortion ratio is decreased by two decibels.
44 RCA Review Vol. 35 March 1974

INTERMODULATION DISTORTION
It is sometimes more convenient to express the intermodulation distortion ratio in terms of the input power rather than the output power. In this form, the maximum signal power for a specified amount of intermodulation distortion is easily determined. For output powers up to 60% of Poo,. the ratio of output power to input power is ap- proximately equal to the small -signal power gain Ao2. The maximum error is about 2 dB when Po"Po,,, = 0.6. The conversion efficiency of most resistive mixers is approximately -6 dB, or
Po 1 Po -- - if - 0.6. Pa 4 Poo,
Under the conditions of Eq. [39] and using Eq. [36],
Po P8 Po -=- if - 0.6. Pom Pp Pont
[39]
[40]
Therefore, for all practical purposes, Po/Poo, may be replaced by P8/Pp. Eq. [38] may now be rewritten
Pe
IDIR1(dB) = 2 - (dB) - 19.5. Pp
Experimental Results
[41]
Intermodulation distortion tests were made on several types of mixers. The test results for a balanced mixer are shown in Fig. 8.
Fig. 9 contains experimental test values along with a plot of Eq. [41] for two different types of mixers. Four different values of pump power were used for each mixer. The measured values agree excellently with the theoretical values. The maximum deviation in intermodulation distortion ratio is only 4 dB.
Conclusions
Gain saturation and intermodulation distortion occur even when an ideal square -law diode is used in a mixer circuit. This is due to the dependence of the current flowing in the input circiut of the diode on
the output or intermediate -frequency voltage, Eq. [7]. It is for this reason that, if the output voltage is left out of the analysis, a square -
RCA Review Vol. 35 March 1974 45

80
70
60
50
40
30
20
10 -25
Fig. 8-Intermodulation
-5 0
SIGNAL INPUT -DBM
distortion ratio in balanced
5
mixer.
law diode mixer will not exhibit gain saturation or intermodulation distortion.
The analysis presented herein produces a complete equivalent circuit of a diode mixer. The equivalent circuit is completely general
-70
-80
-50
-40
-30
-20
10
0 0 001 0.01
o m
o Y THEORETICAL PLOT) IMRI=2 PS/Pp (dB) 19.5
MIXER A
TEST POINTS
Pp= Imw
o Pp=2mw
A Pp= 5mw
O Pp= ISmw
MIXER B
TEST POINTS
o P=2mw n Pp=5mw
o P= 15mw
0.1 I.0
o o
Ó
SIGNAL POWER/PUMP POWER (PS/Pp)
Fig. 9-Experimental test values for two different mixers compared to theoretical values (Eq. [41]).
46 RCA Review Vol. 35 March 1974

INTERMODULATION DISTORTION
and can be reduced to the equivalent circuit of an ideal square -law
diode or to a small- or large -signal equivalent circuit. Using this circuit to derive the gain equation of the mixer results in the prediction of
intermodulation distortion ratios as a function of the output power/ maximum -output power or signal power/pump power. The equation expressing this relationship is
Po P. I1IR, (dB) = 2 - (dB) - 19.5 = 2 - (dB) - 19.5. [42]
Porn pp
This is exactly the same equation that has been derived for the para- metric upper sideband upcon'erter.2
The intermodulation analysis was carried out by using the envelope
gain characteristic of the complete mixer for a single input signal rather than the diode I -V characteristic. A double-sideband suppressed -
carrier signal was used on the input, which is equivalent to a two-tone test with the difference between the two signal frequencies much
smaller than the signal frequencies themselves. This technique greatly simplifies the analysis since multiple -tone input signals are not needed in the derivation of the gain equation.
Since the analysis was performed assuming a wideband frequency - response characteristic, any inherent reduction of bandwidth at the output of the mixer may be taken into account by simply subtracting from Eq. [42] the attenuation (in dB) at the intermodulation fre- quencies due to the bandpass characteristic.
Eq. [42] also shows that increasing the pump power will decrease the intermodulation distortion. A 1 -dB increase in pump power de-
creases the intermodulation distortion ratio by 2 dB.
Bibliography:
R. H. Pantell, "General Power Relationships for Positive and Negative Nonlinear Resistive Elements," Proc. IRE, Vol. 46, p. 1910, Dec. 1958. 2 S. M. Perlow and B. S. Perlman, "A Large Signal Analysis Leading to Intermodulation Distortion in Abrupt Junction Varactor Upconverters," IEEE Trans. MTT, Vol. MTT-13, No. 6, p. 820, Nov. 1965. J P. Torrione and S. Yuan, "Multiple -Input Large Signal Mixer Analysis," RCA Rev., Vol. 26, p. 276, June 1965. 4 L. Becker and R. L. Ernst, "Nonlinear -Admittance Mixers," RCA Rev., Vol. 25, p. 662, Dec. 1964.
RCA Review Vol. 35 March 1974 47

Review of Gas -Breakdown Phenomena Induced by High -Power Lasers -11*
I. P. Shkarofsky
RCA Limited, Ste. Anne de Bellevue, Quebec
Abstract-This review concerns high -power laser interaction with gaseous media leading to breakdown. Laser -induced gas breakdown, the mech- anisms involved, and experimental data are summarized. CO2 lasers and atmospheric breakdown are of particular interest here. Phenom- ena related to discharges maintained, guided, or controlled by lasers are Included. Finally the dynamics of a laser -induced breakdown spark and the expansion waves possible are outined.
1. Gas Breakdown
1.1 Concepts
If radiation intensity exceeds a certain threshold value, the medium can break down. The transmitted radiation is then greatly attenuated, and this can severely affect the use of high -power laser beams.
* Two additional papers in this series, "Review of High -Power Laser Damage to Materials" and "Review of Industrial Applications of High - Power Laser Beams", are planned for future issues of RCA Review.
48 RCA Review Vol. 35 March 1974

HIGH -POWER LASERS
The field of gas breakdown by lasers is still not completely under- stood even though hundreds of papers have been published in the last five years. Studies have been made of the threshold dependence on pressure, wavelength, t.pe of gas, and pulse duration as well as the properties, development, and decay of the spark. For the sake of brevity, we will consider here mainly results for CO, lasers. The dis- cussion follows that of Alcock,' DeMichelis,2 and Raizer3 (Ref. [3'j
contains a bibliography of papers up to May 1968).
The two mechanisms generally invoked to explain the breakdown phenomenon are illustrated in Fig. 1 (after Bunkin and Prokhorov4; also given in Alcock').
Ithr
Multiphoton Process
o
In Multiphoton Inverse Bremsstrohlung Cascade
Proces
we
s
Tor T t
Fig. 1-Predicted variation' of threshold intensity with pulse duration
The first mechanism is the multiphoton ionization process, and it is important only at low pressures and in the case of extremely short (subnanosecond) pulses. In this process, an atom absorbs a number of photons, leading directly to ionization or to excitation followed by photo -ionization. Although the cross section for this mechanism is extremely small, nonetheless the process depends strongly on intensity as 1". Here. n is the number of photons absorbed, equal to the integral part of 1 + E,/lit, where E, is the ionization energy and h is Planck's constant. This mechanism may also supply the initial electrons, especially if any impurity with a low ionization potential is present. The intensity breakdown threshold has a very weak dependence on pressure as p-'i". For very short pulses, when there isn't enough time for an avalanche type of breakdown to develop, the multiphoton process is operative. The multiphoton effect is the high -frequency version of the tunnel effect in which one electron is extracted from an atom by a static or low -frequency field; the two effects are limiting cases of the
RCA Review Vol. 35 March 1974 49
same process. Some modifications of this picture arise due to the possible existence of local fields exceeding the average field; the strong electric field acts to smear out the atomic upper levels and to affect the atomic intermediate levels. All of these factors tend to decrease the breakdown field, as compared to values computed without these cor- rections.
In the opposite limit, at high pressures and long pulse lengths, the second mechanism of cascade ionization dominates. A few initial electrons in the illuminated region, upon colliding with the heavy particles, gain energy from the em wave by inverse bremsstrahlung, until they attain an energy sufficiently high to induce ionization. This is a cascade process that continues until a sufficient number of electrons are produced, leading to breakdown in the focal region. The dotted line in Fig. 1 indicates the dependence that the breakdown threshold \could have were the cascade process also operative at shorter pulse durations. The solid curve, however, shows the actual variation in the transition region, where a third process, called avalanche multiphoton inverse bremsstrahlung, is thought to operate. That is, an initial elec- tron can absorb several photons simultaneously in the presence of the high laser intensity. The electron energy thus increases more rapidly until, when it is sufficiently high, ionization ensues. Repetition leads to avalanche. One can also have in the transition region an alternative process, whereby the electron energy in a very strong field need only increase sufficiently for excitation of the atom, which subsequently becomes rapidly ionized by absorbing only a few quanta.
Within the cascade ionization regime, if na is the initial electron density and n1 is the final density at breakdown, we have
n1 = noev,t = no2k or k = ln(nf/na)/ln2 = 1.441n(nyno), [1]
where k is the number of generations in the cascade and y, is the ionization frequency. For example, for no = 106 and n, = 10'`' cm -3, we have k 43. The above presumes that no losses occur. More ac- curately, with particle loss,
dn/dt = (vi - va) n - C-'2(Dn) - f3n2 [2]
has to be solved, where rQ is the attachment frequency, D is the diffu- sion, and 13 is the recombination coefficient. The rate of energy (c) gain by electrons is given by
d¿ e2E2rmevert
dt -tn G.,2 + v2etr) [3]
50 RCA Review Vol. 35 March 1974

HIGH -POWER LASERS
where E,.,,,s is the rms electric field of the laser, related to intensity I by
Erms = (I/Eoc) r/2 = 19.41 P/=, [4]
and E is in V/cm and / in W/cni'. Also yen, is the effective electron- heavy-particle collision frequency, c is the velocity of light, e is the electron charge, and m is its mass. Offsetting this energy gain are possible losses due to elastic and inelastic collisions, energy losses that are, however, often unjustifiably neglected.
To achieve breakdown, we require that the gain given in Eq. [3] within the pulse time rp be greater than kEr, where Er is the ionization energy. In the absence of particle and energy losses, this reduces to the threshold condition :
In = eGmCkEl (v2erf + 0,2)
e2rprefr [5]
Thus for short pulses the breakdown condition actually depends on the energy flux. Irp (measured in J/cm2), in the absence of losses. If
"err, which is so at atmospheric pressure, /,,, « r-'err « p-1. If very
> w, which occurs at very high pressure, Ite « ,'err « p. The longest pulse duration for which Eq. [5] is valid is determined
by the loss times. In air, attachment is a major loss process. Diffusion can also be important for long pulses, in which case
Ith « r-2efr « p-2
A first -order correction is to replace the factor k in Eq. [5],
C D rp k - k - -+va/,
1= 1n2
[6]
[7]
where A is the diffusion length a/2.4 and a is the spot radius. Energy losses due to both elastic and inelastic collisions also should
be considered. In weaker fields, the electron may lose energy to excita- tion much more often than to the occasional ionization. We see that if D or va are important, i.e., if rp is greater than the loss time, the breakdown depends on I,,, (measured in W/cm2) and 7 is not of concern.
Recently Canavan et al' at AFWL have performed a numerical solu- tion of the energy distribution in clean air in order to predict break -
RCA Review Vol. 35 March 1974 51

down thresholds for the CO., laser. Electrons are produced by impact ionization and lost by attachment to 02 molecules. The inverse bremsstrahlung absorption by electrons, stimulated emission upon col- lisions, and excitation of vibrational and electronic states are included. Their predictions for standard temperature and pressure air (see Fig. 2) show a breakdown requirement of 10 J/cm2 for very short pulses (less than 10 us) and a threshold of 4 x 10⁹ W/cm2 for CW or for pulses greater than 0.1 msec. When r < 10-8 sec, the energy lost to
l011
1010
: \ \ \ \. \\
3XI019cm 3
3x1018cm 3
3X1017cm 3
\\ . \ \ .. \ 10 B .......i . ,,,.d .......I ....1 .. ,I áw1 , ..w'
10-10 10-9 10-8 10-7 10-6 ,10-5' 10-4'10-3 10-2
PULSE LENGTH (sec)
Fig. 2-Air breakdown flux for 10.6 pm laser radiation as a function of pulse length for various final electron densities indicated in the figure.
excitation is small compared to that invested in ionization. Longer pulses waste an increasing fraction of the absorbed energy in excita- tion until, eventually, the decreased ionization rate balances the attach- ment losses, giving the constant I,,, condition independent of Tp.
Fig. 1 indicates that the shortest pulse duration for Eq. [5] to be operative is r-* where`
Weft (hm) 2 [8]
where e2E2/n 0,2 (for w > vefr) is the average energy of the elec- trons.
In the transition region, the multiphoton inverse bremsstrahlung process has a threshold given by°
lu,` = ea7ncfii2(04/(e2) [91 '
The transition region lies between r`T and Tcr, where
52 RCA Review Vol. 35 March 1974
HIGH -POWER LASERS
Ter kE,(i'err1) [10]
If T < Ter, the multiphoton process is presumed to operate, since colli- sional processes are too infrequent. Typically, for ruby laser radiation, TK is 0.3 us and Ter is 10 ps.
Anomalous results (see Sec. 1.2) have been observed that do not fit into the above picture. One of the main anomalies is the observed
dependence of breakdown intensity on spot diameter. Further mechan-
isms, in addition to the various particle and energy losses mentioned
above, are then postulated to explain some of these effects. These are:
(a) Particulate matter in the focusing region that provides the initial electrons.
(b) Atomic -excitation with resonant -radiation trapping. At some
stage during the ionization process, electrons can create excited neutral particles. The excited atoms lose energy by radiation. For large focal spots, this radiation can be reabsorbed leading to a lower threshold breakdown.
(c) Self -focusing. The excited atoms have a polarizability much
higher than the unexcited particles and this gives rise to an
increase in the refractive index and to self -focusing. After some plasma is formed, the radial plasma displacement produces a central minimum in electron density or to a further increase in refractive index and further self -focusing.
(d) Superelastic collisions in rare gases at low pressure. (e) Intense stimulated Raman scattering, which causes an energy
loss.
1.2 Experimental Results
Table l gives experimentally observed values for laser breakdown of atmospheric air at various wavelengths."'
Pressure Dependence
The breakdown threshold varies as p-1 for cascade ionization (see
Eq. 151) when w> Veil and as p-2 with diffusion or attachment losses.
Minck10 investigated this dependence in No. H_., IIe, and Ar for pres-
sures between 0.3 and 100 atm using a ruby laser (3-5 Mw, 25 us). For the molecular gases. the decrease of threshold with pressure was
less steep than for the rare gases. Gill and Dougal" did a similar investigation of ruby laser (30 Mw. 50 ns) threshold versus pressure between 7-200 atm and found minima in Ar, N_, and He at pressures above 100 atm. Theory predicts a minimum when v,.r¡ w.
For CO laser radiation, the minimum pressure for breakdown
RCA Review Vol. 35 March 1974 53

usually occurs at less than 45 atm and furthermore the threshold values are much lower (see Table 1). Experimental results are shown in Fig. 3(a) for Xe'B, in Fig. 3(b) for Ar,10 19 and in Fig. 3(c) for H2, N2, Ar, and He20 breakdown, all showing minima (except for H2) in thresholds. The results of Generalov et al" were produced by a Q -switched CO2 laser of 10 kW peak, 0.3-1.5 µs and 50-250 pps, focused
Table 1 -Laser Breakdown Thresholds in Air
Laser Wave- length
(p)
Focal Spot Diam. (pm)
Pulse Duration
(ns)
Threshold Ref. W/cm2 or
J/cm2
10.6 - less than lns 10J/cm2 [5] (theory) 10.6 - greater than 10-'s 4 x 10° W/cm2 [5] (theory) 0.694 200 30 5 X 10¹⁰ [6] 1.06 200 10 0.3J (9 X 10¹⁰ W/cm2) 7] 0.53 200 7.7 0.5J (2 X 10" W/cm2) [7] 1.06 - 0.01 5 x 10³ J/cm2 8] 0.694 - 0.05 1.5 X 10" [9] 0.694 200 0.02-0.1 3.5 x 10¹² [10] 0.694 17 0.02-0.1 1.5 X 10" [10] 1.06 50 1.6 1012 [11] 1.06 50 40 6 X 10" [11] 1.06 500 1.6 or 40 4 X 10¹⁰ [11]
10.6 100 200 3 X 10° 12] 10.6 300 300 109 [12] 0.347 28 8 1.3 X 10¹¹ [13] 0.347 100 8 5 X 10¹⁰ [13 0.694 60 10 1.3 X 10" [13]
10.6 - 200 2 X 10⁹ [14] 10.6 76 160 7 X 10⁹ [15] 10.6 152 160 2.5 x 100 [15] 10.6 228 160 1.3 X 10⁹ [15]
to an 80 -µm -diameter spot. In IIe, they found that the threshold in- creased noticeably with increasing purity of the gas. Their results are compared by Alcock' with those of Smith" in Ar. Smith's work was done with a CO2 laser of 100 kW and 0.2 µs, and he found it necessary to pre -ionize the gas. Pre -ionization, providing a 1011 cm -3 electron density, was obtained from a do discharge with 2 cm electrode spacing in atm Ar. Without pre -ionization, no breakdown occurred even at 109W/cm2. As compared to 1.06-µm radiation, the threshold for 10.6 µm is about 1000 times less. The results by Hill et alR° in Fig. 3(c) are obtained with a TEA CO2 laser (1 Mw, 200 ns, 100 µm diameter spot). Except for H. no pre -ionization is needed for the various gases. Be- tween 250 and 3000 Tory, they find a pressure dependence as p-1 for Ar and He, whereas for N2 and H2 the dependences are as p-2!3 and p-1/3, respectively. They note that recombination loss is appreciable at
54 RCA Review Vol. 35 March 1974

HIGH -POWER LASERS
I , MW/cm2
200
150
100
50
00
E,105 V/cm
2.7
2.3
1.9
1.5
o o o
0 o
0 0
1
0 0 0 o o
5 10 15 20 25
109
5
2
108
5
o o R
o
P, atm
(a)
x - Smith o - Generalov et.al.
cP
I 5 10 15 20
PRESSURE (atm)
(b)
O Hydrogen Nitrogen
A Argon O Helium
4,41
,.,,.1 . , ..,.,1 , , ,
103 104
PRESSURE (Torn)
(c)
Fig. a-Gas breakdown thresholds as a function of pressure at 10.6 µm radiation: (a) in xenon after Generalov et al,1e (b) in argon after Generalov et al1e and Smith,'s and (e) in various rare and mole- cular gases after Hill et a1.Y0
RCA Review Vol. 35 March 1974 55
higher pressures in Ar. At 1 atm the threshold 'is an order of magni- tude higher than predicted by simple cascade theory, suggesting another electron loss process such as production of excited states. In molecular gases, vibrational excitation also causes deviations from simple cascade theory. Cohn et al21 have investigated the threshold conditions with a TEA CO2 laser (0.9 J, 200 ns. 10'0 W/cm2) for He and Ar breakdown in the presence of a magnetic field (up to 8.7 teslas) directed along the laser propagation direction. The theoretical variation of v,,ff/(v2,,ff +o,hh") (with orb = eB/m, B being the magnetic field) can explain the experimental results semiquantitatiN ely. No pre -ionization was re- quired, although particulate impurities may have been present.
The threshold for breakdown in a mixture of Ar and He at 80 atm was investigated by Mulchenko and Raizer22 using both an Nd and a ruby laser. Pure Ne has a higher breakdown threshold than pure Ar. Howe\er, a minute addition of Ne to Ar sharply decreases the break- down threshold using the Nd laser but not with the ruby laser. No satisfactory explanation could be gi'en. (It would be very interesting to repeat this experiment with a CO: laser.) With addition of a small amount of Ar to Ne, the threshold is again decreased sharply with the Nd laser but much less noticeably with the ruby laser. This is explained in terms of the greater probability of two -photon absorption of excited Ne atoms for ruby radiation as compared to 1.06-µm radiation.
Although the transition through r,,,. in Fig. 1 has been observed' in nitrogen at about 0.26 atm with a 50 ps ruby laser, DeWhurst et al,2° using an Nd laser, have not observed such a transition in the rare gases. The threshold keeps on increasing in Ar as the pressure is decreased. Superelastic collisions are invoked to explain this result.
Dependence on Pulse Duration Although Eq. [5] predicts a rP-r behavior on pulse duration, experi- ments by Belland et al" find an intensity ratio of only about 3, instead of 25, as r, is changed from 40 to 1.6 ns; in addition, they find a decrease in threshold as the spot size is increased. They attribute these effects to self -focusing of the laser radiation.
Further evidence of self -focusing was obtained by interferograms,41 with 10 us ruby pulses in atmospheric air breakdown, which showed filaments several 100 µm long and a diameter about 10 µm, or 0.1 times the beam size. Additional plasma blobs were generated successively at intervals of 200-400 µm as the plasma advanced at a rate of 4 x 107 cm/sec towards the laser. Similarly, Bunkin et al1Ó observed, with 20-100 picosecond ruby laser pulses, discrete breakdown regions sepa- rated by 1.5-2 mm in the focal region in air breakdown, with points as
56 RCA Review Vol. 35 March 1974
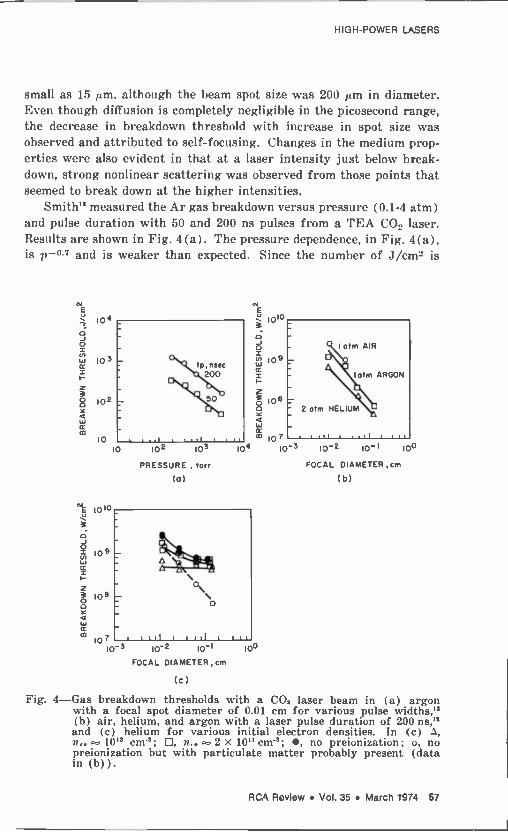
HIGH -POWER LASERS
small as 15 µm, although the beam spot size was 200 µm in diameter. Even though diffusion is completely negligible in the picosecond range, the decrease in breakdown threshold with increase in spot size was observed and attributed to self -focusing. Changes in the medium prop- erties were also evident in that at a laser intensity just below break- down, strong nonlinear scattering was observed from those points that seemed to break down at the higher intensities.
Smith12 measured the Ar gas breakdown versus pressure (0.1-4 atm) and pulse duration with 50 and 200 ns pulses from a TEA CO, laser. Results are shown in Fig. 4(a). The pressure dependence, in Fig. 4(a), is p-0.7 and is weaker than expected. Since the number of J/cm2 is
104
103
102
10
É 10 10
o J o
109
2
108 0
W 2 107
10 102 103
PRESSURE , torr
(a)
lo -a 10-2 10-I
FOCAL DIAMETER, cm
(c)
N E
1010
o - J o -
109
_ - \ latm ARGON
ó108 _ 2 atm HELIUM
Y -
W ce a] 107 , . it! .,el l , ,,
104 10-3 10-2
100
I otm AIR
10-I
FOCAL DIAMETER,cm
(b)
100
Fig. 4-Gas breakdown thresholds with a CO. laser beam in (a) argon with a focal spot diameter of 0.01 cm for various pulse widths,1P (b) air, helium, and argon with a laser pulse duration of 200 ns,12 and (c) helium for various initial electron densities. In (c) n 10" cm3; , n.. a 2 X 10" cm -a; O, no preionization; o, no preionization but with particulate matter probably present (data in (b)).
RCA Review Vol. 35 March 1974 57
proportional to ry, it appears that 1 (in W/cm2) is independent of ry. This points towards a balance between energy absorption and energy loss for pulses longer than 50 ns in Ar. Sec. 1.1 shows that such a behavior can be expected at longer pulse lengths.
Dependence on Spot Size It was found25 that the breakdown threshold intensity decreases as the spot size increases. Such an effect is contradictory to Eq. [51, but would arise if diffusion effects were important. However, the observa- tions encompassi0 subnanosecond pulses, which are so short that there is no time for diffusion to operate. The decrease of gas -breakdown threshold with increasing beam diameter has significant hearing on the propagation of high -power pulsed CO_ radiation.
Smith12 has also performed measurements on the CO., laser break- down dependence on the focal diameter in air, Ar, and He. Results are shown in Fig. 4(b). He states that air can be broken down if some contaminant is present. but dry nitrogen doesn't breakdown even at 1010 W/cm2. Both Figs. 4(a) and 4(b) indicate an electron loss mechanism. 1lowe\er, Smith claims that this is not diffusion, since Fig. 4(b) doesn't show a a\-2 variation but rather a A-1 variation. for focal diameters greater than 10-2 cm as used in these experiments. diffusion times are too long and can he neglected. He ascribes the loss process as due to atomic -excitation resonant -radiation trap- ping, discussed at the end of the previous subsection. A different explanation is given by Canavan et al5 and Marquet et al14. They ascribe the observed dependence on spot size to the presence of particulate contaminants, viz., on the probability of finding within the focal volume a particle that is sufficiently large to produce the initial plasma.
Marquet et al19 also use a TEA laser (3 J, 3 X 10⁸ \V peak) for air breakdown experiments. For sery clean air, no breakdown occurs even at 1010 W/cm2, agreeing with Smith. For ordinary air containing micron dust particles, the threshold is 2 x 100 W/cm2 (see Table 1). With 20-µm particles dropped in, the threshold can be reduced to 108 W,'cni=. The breakdown threshold over the 0.4-1 atm range varies as p-2/3 for ordinary air.
Preionization can provide an important source of initial electrons for gas breakdown as found by Smith. Recently, controlled experi- ments on the effect of pre -ionization were performed by Brown and Smith2ó with CO., TEA laser striking pure IIe (no particulates) at atmospheric pressure. An afterglow in the medium provided a con- trolled level of 1010-10'3 cm -3 pre -ionization. Fig. 4(c) shows the breakdown threshold versus spot size for various pre -ionization levels
58 RCA Review Vol. 35 March 1974
HIGH -POWER LASERS
and includes the data for IIe shown in Fig. 4(b). With a high initial electron density (about 1013 cm -3), the threshold is much lower than without pre -ionization and it doesn't show any spot -size dependence. This is because at these high densities, the diffusion process is ambi- polar and the diffusion time consequently is long, even though the spot diameter is small. On the other hand, at lower initial densities, and for focal diameters smaller than the Debye length, free electron diffusion occurs with a resultant dependence on focal size. The data taken from Fig. 4(b), showing a volume dependence for large focal volumes, is now ascribed to the presence of particulate matter.
A complementary experiment using UV as a pre -ionization source \vas reported by Robinson," also using a TEA CO; laser (200 µm diameter) to break down Ar gas at pressures between 100-600 Torr. The UV source is a spark discharge that can be positioned 3.8-12.7 cm away from the laser focal region. He finds as well that with fresh gas, breakdown is much harder than in a gas in which ionization is once achieved. In the presence of UV, a lowering of the threshold is observed, the degree increasing with decreasing distance between the UV source and the focal region and with decrease in pressure. UV - initiated electrons seem to exist even 1 ms after the UV pulse, since threshold lowering is still observed then. Besides Ar, the lowering is also found in No and He but not in CO_, air, and a laser mixture of CO., He, and N:. This is attributed to the presence of dust particles in the latter gases, which provide more initial electrons than the UV source.
More recent results for breakdo\\ n with a CO_ laser (0.26 J, 0.16 µs, 1010 W peak) are reported by Chan et al.'s They measure breakdown as a function of pressure between 0.3 and 13 atm and for various spot sizes. The gases used are Ar, Ne, He, O_, and air. Results are shown in Figs. 5(a -d) and 6. Breakdown is defined by them as the intensity providing breakdown for 50% of the shots (rather than 1% as defined by Smith and coworkers) after ionization is once initiated. Clean unused gases are much more difficult to break down. Their results are fitted (not shown in the figures here) with an approximate theory that includes various particles and energy -loss mechanisms. Even for large beam spots, some loss process is found to occur. Energy losses due to inelastic collisions are important, especially for the molecular gases. In atomic gases, the decrease in threshold with pressure be-
comes less rapid as the focal volume becomes larger. Since it never decreases as rapidly as p-2, free electron diffusion is not the only loss mechanism. Inelastic collisions are also important for the inert gases. In all gases, the threshold is observed to decrease as the focal volume
RCA Review Vol. 35 March 1974 59
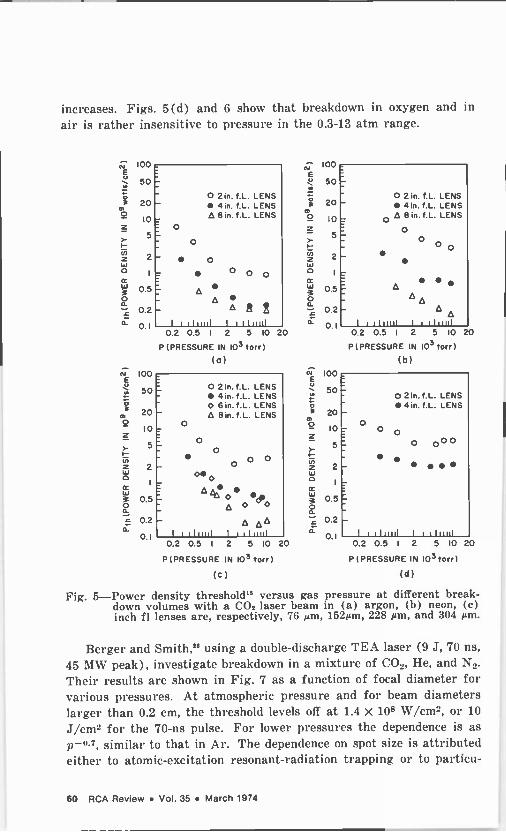
increases. Figs. 5(d) and 6 show that breakdown in oxygen and in
air is rather insensitive to pressure in the 0.3-13 atm range.
loo
50
20
10
5
2
0.5
0.2
0.1
100
50
20
10
5
2
0.5
0.2
0.1
O
O
O 2in. f.L. LENS 41n. f.L. LENS
A 8In. f.L. LENS
o O O O
A A
A >!
1 1)uul I 111u111 0.2 0.5 I 2 5 10 20
P (PRESSURE IN 103 torn
(a)
0 2 in. f.L. LENS 4in.f.L. LENS
O 6in.f.L. LENS A 8 in. f.L. LENS
o O.O
AA:0 CO/ A O O
_ A AA
I I,lu/el I telnLl 0.2 0.5 1 2 5 10 20
P (PRESSURE IN 103 torn
(C)
loo
50
20
10
5
2
1
0:5
0.2
0.1
0 2 in. f.L. LENS 4in. f.L. LENS
0 A 8 in. f.L. LENS
o
O O O
A AA
A A
I i 1luui I 1 1lnul
100
50 1-
20r
0.2 0.5 I 2 5 10
P ( PRESSURE IN 103 torr (b)
20
O 10,_ o 5_ 0 000
2 _
0 2 in. f.L. LENS 4 in. f.L. LENS
0.5
0.2
0.1
O
1 111;;;11 I e eluul 0.2 0.5 1 2 5 10 20
P ( PRESSURE IN 103 torn
(d)
Fig. 5-Power density threshold15 versus gas pressure at different break- down volumes with a CO. laser beam in (a) argon, (b) neon, (c) inch fl lenses are, respectively, 76 µm, 152µm, 228 pm, and 304 pm.
Berger and Smith,R" using a double -discharge TEA laser (9 J, 70 ns,
45 MW peak), investigate breakdown in a mixture of CO.,, He, and N.. Their results are shown in Fig. 7 as a function of focal diameter for various pressures. At atmospheric pressure and for beam diameters larger than 0.2 cm, the threshold levels off at 1.4 X 10⁸ W/cm2, or 10
J/cm2 for the 70-ns pulse. For lower pressures the dependence is as p-", similar to that in Ar. The dependence on spot size is attributed either to atomic -excitation resonant -radiation trapping or to particu-
60 RCA Review Vol. 35 March 1974

loo
50
20
HIGH -POWER LASERS
o
O 21n f.L. LENS 4in.f.L. LENS
0 61n. f.L. LENS
NE IO
5
o 0 0 0 0
ó 2
oaóoa 0.5
0.2
0.1 I liud iI 1111 0.2 0.5 I 2 5 10 20
P(PRESSURE IN 103torr)
Fig. 6-Breakdown threshold" in air with a CO2 laser beam. Conditions as in Fig. 5.
late matter. If the mixture is ionized as in a lasing medium, they estimate that the threshold is reduced to 5 J/cm2, giving the threshold formula 5p-0.7. This sets an upper limit on the operating pressure of pulsed CO_ lasers. The laser output however increases with p.. They estimate that in a lasing mixture, the laser saturation flux varies as 0.5p in J/cm2. Combining these two formulas yields the maximum operating pressure in CO2 lasing media for given extraction efficiencies. This pressure lies in the 2-4 atm range.
In the same work, Berger and Smith also give experimental values on breakdown thresholds of atmospheric air versus pulse duration for various spot diameters. Results are shown here in Fig. S. The 45° lines only apply if the threshold is above its minimum value of 10 J/cm2.
10
5
0.02 0.05 0.1 0.2 0.5 10
FOCAL DIAMETER,cm
Fig. 7-Breakdown threshold28 with a CO2 laser in a 5:1:1 mixture of He:N2:CO2 at 1, 2, and 3 atm.
RCA Review Vol. 35 March 1974 61
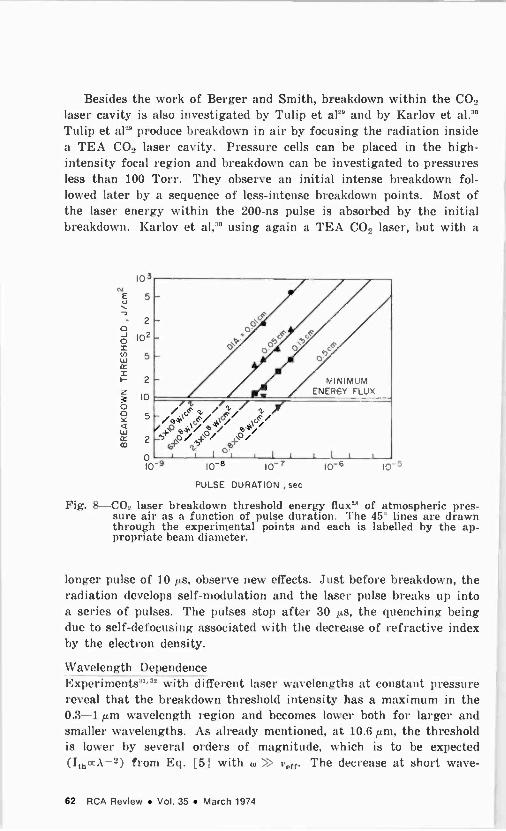
Besides the work of Berger and Smith, breakdown within the CO: laser cavity is also investigated by Tulip et ally and by Karlov et al.10
Tulip et a12° produce breakdown in air by focusing the radiation inside a TEA CO., laser cavity. Pressure cells can be placed in the high - intensity focal region and breakdown can be investigated to pressures less than 100 Torr. They observe an initial intense breakdown fol- lowed later by a sequence of less -intense breakdown points. Most of the laser energy within the 200-ns pulse is absorbed by the initial breakdown. Karlov et al,30 using again a TEA CO., laser, but with a
103
"E
2 o Jo 102 x N 5 w cc x I- 2
10 o F / ti
5 -/q4\ t,F/\c/ G / ° 9,411/e
m2 o / y{?o/ .4>°/ 6 Ó
0 , 1 I 1 t
10-9 10-8 10-7 10-8 10-5
PULSE DURATION , sec
MINIMUM ENERGY FLUX
t l t
Fig. 8-CO2 laser breakdown threshold energy flux" of atmospheric pres- sure air as a function of pulse duration. The 45° lines are drawn through the experimental points and each is labelled by the ap- propriate beam diameter.
longer pulse of 10 ps, observe new effects. Just before breakdown, the radiation develops self -modulation and the laser pulse breaks up into a series of pulses. The pulses stop after 30 µs, the quenching being due to self -defocusing associated with the decrease of refractive index by the electron density.
Wavelength Dependence Experiments"." with different laser wavelengths at constant pressure reveal that the breakdown threshold intensity has a maximum in the 0.3-1 µm wavelength region and becomes louver both for larger and smaller wavelengths. As already mentioned, at 10.6 µm, the threshold is lower by several orders of magnitude, which is to be expected (I,«,\-2) from Eq. [5] with °, » vol. The decrease at short wave -
62 RCA Review Vol. 35 March 1974
HIGH -POWER LASERS
lengths however disagrees with the theory for cascade ionization. Multiphoton ionization is also ruled out because of the strong pres- sure dependence that is observed. No satisfactory explanation exists, although a mechanism has been suggested for the situation where electron excitation of atoms is an important energy -loss mechanism. There is a possibility that this loss is reduced at shorter wavelengths due to more rapid multiphoton ionization from excited states.
Alcook et al" also observe a similar decrease upon comparing wave- lengths of ruby and 0.347 µm radiation used to break down air, CH, and I)_. In II_, however, an increase in threshold is found at low pressure. They also observe in IL, and CII4 a pronounced knee in the pressure dependence above atmospheric. This is attributed to loss of incident radiation liy intense stimulated Raman scattering. Men- nicke" also finds that the Raman process is operative in the initial phase of breakdown of III, Do, and No solid targets.
2. Additional Laser Breakdown Situations
In this section we discuss three additional breakdown situations in - vol ing lasers. The first concerns discharges maintained by lasers, the second is discharges guided by lasers, and the third is spark gaps controlled by lasers.
2.1 Discharge Maintained by Lasers
A discharge ignited by some other means (e.g.. another laser) can be maintained by a laser whose intensity is weaker than the break- down threshold and with the plasma positioned in the laser's focal region. A cw CO0 laser has been shown' capable of maintaining a continuous discharge. The initial breakdown of the gas can be accomplished with another pulsed CO., laser.
Generalov et al" investigate "optical discharges" in Xe and Ar at pressures of 1-45 atm maintained by 40-250W of cw CO., laser power. They observe a conical glow region along the diverging cone of the beam, and the discharge stability is associated with this geometry. The conical glow represents a "combustion wave," propagating from the breakdown point to an outer stationary position towards the laser,
here the intensity is too low to maintain the discharge. With 40 W cw power maintaining a 6.5-atm Xe discharge, the plasma velocity decreases rapidly from 103 cm/sec to zero in this cone. With increas- ing power at a given pressure, the discharge increases in size. At a given laser power, there are upper and lower pressure limits for
RCA Review Vol. 35 March 1974 63

which a stable horizontal discharge exists. The energy input by the laser should balance losses due to heat conduction and radiation. At relatively low pressures (about 1-2 atm) heat conduction losses prevail and depend little on pressure. Since laser energy absorption increases with pressure, threshold power decreases as the pressure increases. Between 10 and 25 atm, the threshold is independent of pressure, since radiation losses are balanced here. For still higher pressures, there is a limit on the stability possible with a horizontal beam due to convective effects. With a vertical beam position, no upper limit is observed, even up to 45 atm. although occasional "tongues" of flame occur in the 30-45 atm range, again associated with convective flow. Generalov et al also measure an average trans- mission of 40% of the laser energy, which corresponds to an optical thickness of the plasma approximately equal to unity. For 250-W laser input in Ar gas, the electron density at 2 atm is 3.5 X 1017 cm -3 and about 5 X 1017 cm -3 in the 4-16 atm range. The electron tem- perature is about 23,400 °K at 2 atm and decreases to 15,000 at 4 atm and 13,000°K at 16 atm. To a first approximation, the gas temperature is about the same.
Moody3s also investigates a cw discharge in Ar ignited by a pulsed CO_ laser and maintained by a cw CO.. laser. They measure an increase in the breakdown threshold field of the pulsed beam when the cw laser field is on. The change in threshold depends on gas pressure and on cw power. At 1 atm with 324 W of cw power, the threshold is increased by 38%. They suggest that this effect occurs because the cw field is heating the neutral atoms within the break- down volume and, thereby, lowering their number density. This results in a lower electron-neutral collision frequency and in a higher break- down threshold (see Eq. [5]).
Similar studies to those of Generalov et al" were performed by Franzen.36.37 He uses a TEA CO_, laser to pre -ionize Ar gas and a cw CO_ laser to maintain the plasma. (His breakdown threshold values36 in Ar with the TEA laser itself are similar to those of Chan et al's shown in Fig. 5(a).) CW breakdown36 is obtained in Ar at 4.4 atm with 150 W cw power (TEMI1 mode), and it is necessary to decrease the focal half -angle, 0, to less than 5 mrad. This corresponds to a cw intensity of 2 x 10" W/cm2 as compared to the breakdown threshold of 4.2 x 10⁸ W/cm- for the TEA laser by itself, i.e., about two orders of magnitude less intensity. A conical discharge region is found to exist, whose luminosity increases with cw power. At 300 W input, the pressure could be reduced to 2.4 atm before extinction occurs. Spatial extents of a few millimeters with a continuum emission peaked
64 RCA Review Vol. 35 March 1974

HIGH -POWER LASERS
in the UV are typical plasma characteristics. In later work", Franzen uses a cw laser operating in the TEM..° mode to maintain the plasma but finds that successful ignition depends on the energy of the pulsed TEA CO., laser. Too high a pulse energy fails to ignite the continuous plasma, the optimum energy being less than 40 mJ, or near the break- down threshold value for the pulsed laser itself. Ignition failure at high energies is attributed to electron density reduction caused by a plasma expanding too rapidly. Values for the threshold cw power necessary to maintain the discharge in various gases (Xe, Kr, Ar, Ne, He, and N,) are given, and generally lie between 1.5 x 10⁶ and 1.2 x 10⁷ «'/cm- for pressures between 4 and 12 atm, respectively. For 280 W input, the lowest pressure could be reduced below 1 atm only in Xe. Plasmas are more easily obtained in the noble gases with the lowest ionization potentials.
Continuous plasmas sustained by lasers may have important im- plications. If a plasma exists, such as that produced by laser break- down of targets, then further propagation to the target may be severely hampered by the 100 -fold lower threshold of laser intensity that can maintain this plasma. On the other hand, if a high -tempera- ture and high -density cw plasma is desired, this can be obtained, as described, with relatively low laser input power.
2.2 Discharges Guided by Lasers
A high -voltage electrical breakdown streamer (or ionizing potential wave) can be induced to travel through the atmosphere along a path traversed beforehand by a high -power laser pulse. The laser can either generate an ionization breakdown tail" or it can produce a thermal rarefraction channel'° In the former case, the trail lifetime is short, since it is limited by electron recombination. In the latter case, the rarefraction channel decays much more slowly via thermal conduction and convection. By arranging for the laser channel to be in contact with a high -voltage electrode, a breakdown streamer can be initiated that will subsequently travel in this same channel.
Consider first the laser ionization trail. Using an Nd-glass laser'' 86 .J, 2.2 GW, 35 ns, 1011 W/cm-, 0.38 cm diam.), a 350 kV streamer is made to propagate 28 cm along a laser trail in a straight path, rather than the crooked one it would follow if unguided. The gap between electrodes is 63 cm in this case and the discharge is fired 40 µs after the laser pulse. The streamer propagates by means of ioniza- tion axalanche processes starting at its tip where the diameter is small and the electric field is intense. The streamer tends to follow the laser
RCA Review Vol. 35 March 1574 65

trail within which the cascade ionization process is more rapid or ef- ficient. Where the laser intensity is lower, the discharge assumes an
irregular path. The streamer velocities for 300 kV are between 105
and 10° cm 'sec. The a\ erage electric field required to produce the interelectrode discharge is reduced from 7.3 to 5.5 kV/cm. Luminous beads from optical breakdown sometimes appear along the guided path.
The work on the thermal rarefraction channel in air was ac-
complished'° with a CO_ laser. Air absorbs a significant fraction of the 10.6-µm laser energy passing through it. It is heated rapidly and consequently expands, generating a transient low pressure cylinder through which the electrical streamer can travel. In the experiment, air is doped with ammonia to produce stronger laser absorption. A
50-75 «' CO_ laser, with a pulse width of 0.15 sec, is made to traverse a 50 -cm air column vertically, in order to minimize convective effects. The absorbed energy is about 5.I. The high -voltage pulse is applied just prior to the laser termination. With 112 -kV pulse and 10% ammonia, the arc discharge is guided without irregularities through 12.7 cm. With 15% ammonia and a laser pulse width of 0.3 sec, the absorbed energy is about 11 J and the arc length is extended to 14 cm.
Potential applications" include electrical energy transmissioi, im- proved devices for controlling and studying natural lightning, noel techniques for use with high -voltage power sources, and the establish- ment of antenna -like regions for communication purposes.
2.3 Spark Gaps Controlled by Lasers
Even below the breakdown threshold intensity, laser radiation focused
between electrode gaps can trigger sparks at high speed over modest distances and at relatively high average fields (greater than 1.5 x 10; V/cm). This provides an inherently safe, simple, high -current, and high -voltage ns switch. Additional advantages are (a) no elec-
trical coupling between laser trigger and high -voltage gap, (b) the capability of splitting the laser beam in order to trigger multigaps synchronously, and (c) jitters of the order of only 1 ns and formative time lags less than that observed in electrical triggering. For high - voltage gaps, the breakdown is attributed to ionization avalanche
streamers. For low -voltage gaps (below 2kV but sufficient laser power to form a plasma) ultraviolet emission from the plasma plays a role
in reducing the formation time lag between laser firing and the spark discharge.
66 RCA Review Vol. 35 March 1974
HIGH -POWER LASERS
Pendleton and Guenther" use a ruby laser (80 MW, 10'' \\ /cm-, 10 ns half width) to trigger a gap whose spacing is 0.4-1.5 cm and study the time delay between laser pulse and current gap How. Delay times less than 10 ns are observed in SF,; at atmospheric pressure. The delay varies inversely with electric field, gas pressure, and focal - point distance from the anode surface. Results are also obtained for N., and air at vary ing pressures between 100 and 1400 Torr. Further works are reported by Guenther and Bettis" and Guenther and McKnight." Akmanov et al`s use a UV laser beam at 0.265 µm (4th harmonic of Nd laser) with 10 ns pulse duration and 3 X 10⁸ W/cm" to break down an air gap of 1 cm. The breakdown voltage is 13 kV instead of 17 kV, which it would be without the laser. Also th, laser energy density would have to be at least 100 times higher without the applied voltage. Vladimirov et al' investigate the resistence charac- teristics of the laser spark gap. A ruby laser (7 MW, 15 ns) is used by Khan and Walsh'° to trigger various gases. Faster switching, viz., a lesser delay time, is observed by using O., or air instead of N_, or by increasing the amount of Ar added to N. Other efforts in this field, to name a few more, are those of Klewe et al,7° Schmitter. "
Pillsticker," and I)e Whurst et al. 0 Pillsticker°J finds that it is bene- ficial to admit the laser beam to the gap through a hole in one of the electrodes in order for the beam to be parallel to the electric field direction. This provides a high \clue of the first Townsend coefficient. A high pressure is desirable in the gap and the laser pulse should be short. De Whurst et alS° investigate picosecond triggering with a 7-ps mode -locked Nd glass laser. They obtain formati\e time delays of the order of 1 us. They attribute the few electrons present before ava- lanche to thermoionic emission from the cathode within the focal area.
At Ilydro-Quebec (IREQ), a ruby laser is being used to test extra - high voltage circuit breakers for high -voltage transmission lines.* An Nd-glass laser (30 J,25 ns) will also be used to trigger a series of spark gaps with voltages up to 1.51IV and with rated interrupting capacitors up to 6 X 1070 volt-amperes.t
3. Dynamics of the Laser Spark
3.1 Spark Parameters
Starting with the classic works of Ramsden and Da\ ies" and Ramsdell and Savic,"2 there have been a multitude of experiments and interpre- tations on the dynamics of the laser spark.
Laser Weekly, p. 6, June 18, 1973. f Laser IVeeklpy, P. 4, June 11, 1973.
RCA Review Vol. 35 March 1974 67
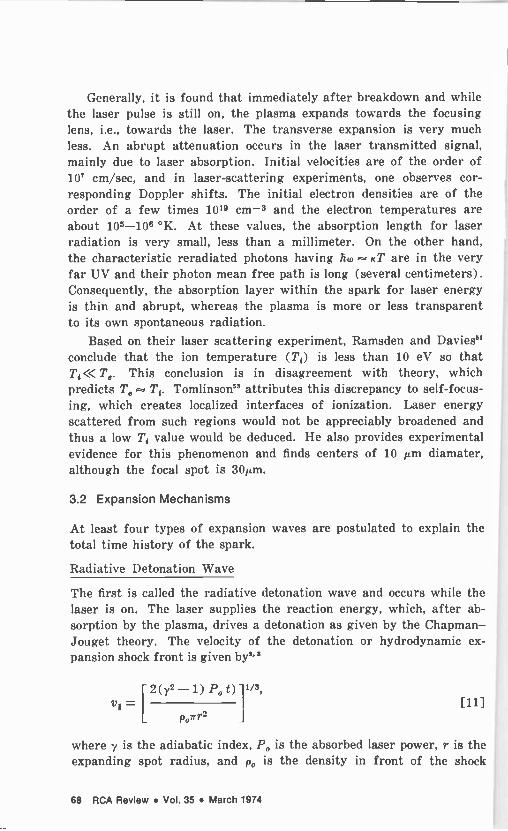
Generally, it is found that immediately after breakdown and while the laser pulse is still on, the plasma expands towards the focusing lens, i.e., towards the laser. The transverse expansion is very much less. An abrupt attenuation occurs in the laser transmitted signal, mainly due to laser absorption. Initial velocities are of the order of 10' cm/sec, and in laser -scattering experiments, one observes cor- responding Doppler shifts. The initial electron densities are of the order of a few times 1019 cm -3 and the electron temperatures are about 105-106 °K. At these values, the absorption length for laser radiation is very small, less than a millimeter. On the other hand,
the characteristic reradiated photons having ho, KT are in the very far UV and their photon mean free path is long (several centimeters). Consequently, the absorption layer within the spark for laser energy is thin and abrupt, whereas the plasma is more or less transparent to its own spontaneous radiation.
Based on their laser scattering experiment, Ramsden and Davies" conclude that the ion temperature (Ti) is less than 10 eV so that T;«Te. This conclusion is in disagreement with theory, which predicts Te T. Tomlinson" attributes this discrepancy to self -focus- ing, which creates localized interfaces of ionization. Laser energy scattered from such regions would not be appreciably broadened and thus a low T, value would be deduced. He also provides experimental evidence for this phenomenon and finds centers of 10 p.m diamater, although the focal spot is 30p.m.
3.2 Expansion Mechanisms
At least four types of expansion waves are postulated to explain the total time history of the spark.
Radiative Detonation Wave
The first is called the radiative detonation wave and occurs while the laser is on. The laser supplies the reaction energy, which, after ab-
sorption by the plasma, drives a detonation as given by the Chapman- Jouget theory. The velocity of the detonation or hydrodynamic ex- pansion shock front is given by'' 3
2(y2- 1) Pot)11/3, = lL J!
Po'n.)2
where y is the adiabatic index, Po is the absorbed laser power, r is the ;
expanding spot radius, and Po is the density in front of the shock .
68 RCA Review Vol. 35 March 1974
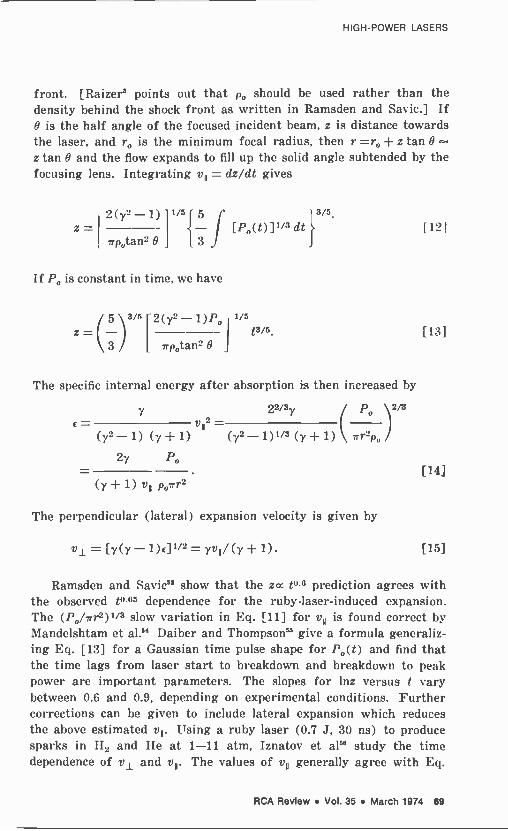
HIGH -POWER LASERS
front. [Raizer' points out that po should be used rather than the density behind the shock front as written in Ramsden and Savic.] If 6 is the half angle of the focused incident beam, z is distance towards the laser, and ro is the minimum focal radius, then r =ro + z tan 9
z tan B and the flow expands to fill up the solid angle subtended by the focusing lens. Integrating vl = dz/dt gives
2( y_ - 1) t /L 5 z [Po(t)]/3dt(apotan2
B 3 .
If Po is constant in time, we have
5 3/'' 2(y2-1)Po 1/.,
3 ) ( irpotan2 B
jz = ( t3/6
[12J
[13]
The specific internal energy after absorption is then increased by
22/3y Po 2/3
= v11°= (y2-1) (y+ 1) (y2-1)'/3 (y+1) 7rr2p0
2y Po [14J
(y 1) vll polrr2
The perpendicular (lateral) expansion velocity is given by
vi = [y(y -1)6P/2 = yvll/ (y + 1). [15]
Ramsden and SavicS' show that the z« tO a prediction agrees with the observed tO-6° dependence for the ruby -laser -induced expansion. The (Po/ar2)'/3 slow variation in Eq. [11] for vl1 is found correct by Mandelshtam et al» Daiber and Thompson" give a formula generaliz- ing Eq. [13] for a Gaussian time pulse shape for Po(t) and find that the time lags from laser start to breakdown and breakdown to peak power are important parameters. The slopes for lnz versus t vary between 0.6 and 0.9. depending on experimental conditions. Further corrections can be given to include lateral expansion which reduces the above estimated vu. Using a ruby laser (0.7 .1. 30 ns) to produce sparks in H., and He at 1-11 atm, Iznatov et al study the time dependence of vl and vu. The values of v11 generally agree with Eq.
RCA Review Vol. 35 March 1974 69
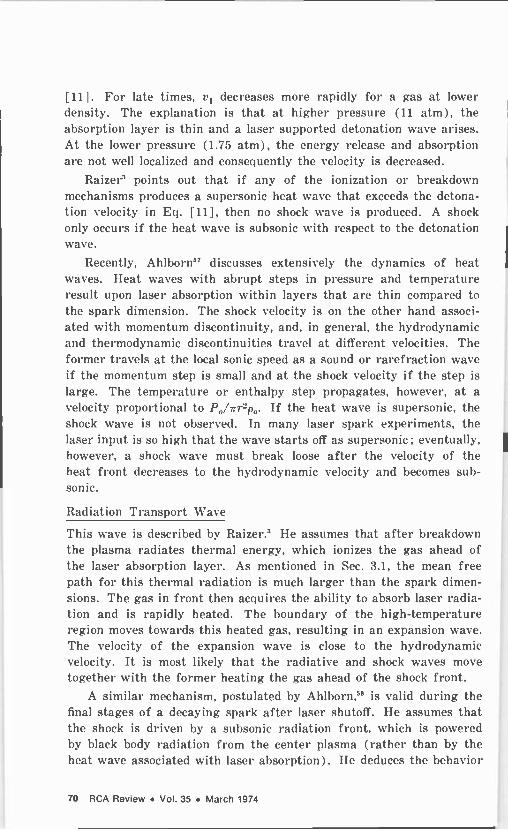
[11]. For late times, vii decreases more rapidly for a gas at lower density. The explanation is that at higher pressure (11 atm), the absorption layer is thin and a laser supported detonation wave arises. At the lower pressure (1.75 atm), the energy release and absorption are not well localized and consequently the velocity is decreased.
Raizer3 points out that if any of the ionization or breakdown mechanisms produces a supersonic heat wave that exceeds the detona- tion velocity in Eq. [11], then no shock wave is produced. A shock only occurs if the heat wave is subsonic with respect to the detonation wave.
Recently, Ahlborn" discusses extensively the dynamics of heat waves. Heat waves with abrupt steps in pressure and temperature result upon laser absorption within layers that are thin compared to the spark dimension. The shock velocity is on the other hand associ- ated vs ith momentum discontinuity, and, in general, the hydrodynamic and thermodynamic discontinuities travel at different velocities. The former trasels at the local sonic speed as a sound or rarefraction wave if the momentum step is small and at the shock velocity if the step is
lrge. The temperature or enthalpy step propagates, however, at a
velocity proportional to Po/err-p.. If the heat wave is supersonic, the shock wave is not observed. In many laser spark experiments, the laser input is so high that the wave starts off as supersonic; eventually, however, a shock wale must break loose after the velocity of the heat front decreases to the hydrodynamic velocity and becomes sub- sonic.
Radiation Transport Wave
This wave is described by Raizer.3 IIe assumes that after breakdown the plasma radiates thermal energy, which ionizes the gas ahead of the laser absorption layer. As mentioned in Sec. 3.1, the mean free path for this thermal radiation is much larger than the spark dimen- sions. The gas in front then acquires the ability to absorb laser radia- tion and is rapidly heated. The boundary of the high -temperature region moves towards this heated gas. resulting in an expansion wave. The velocity of the expansion wave is close to the hydrodynamic velocity. It is most likely that the radiative and shock waves move together with the former heating the gas ahead of the shock front.
A similar mechanism, postulated by Ahlborn 58 is valid during the final stages of a decaying spark after laser shutoff. He assumes that the shock is driven by a subsonic radiation front, which is powered by black body radiation from the center plasma (rather than by the heat wave associated with laser absorption). He deduces the behavior
70 RCA Review Vol. 35 March 1974
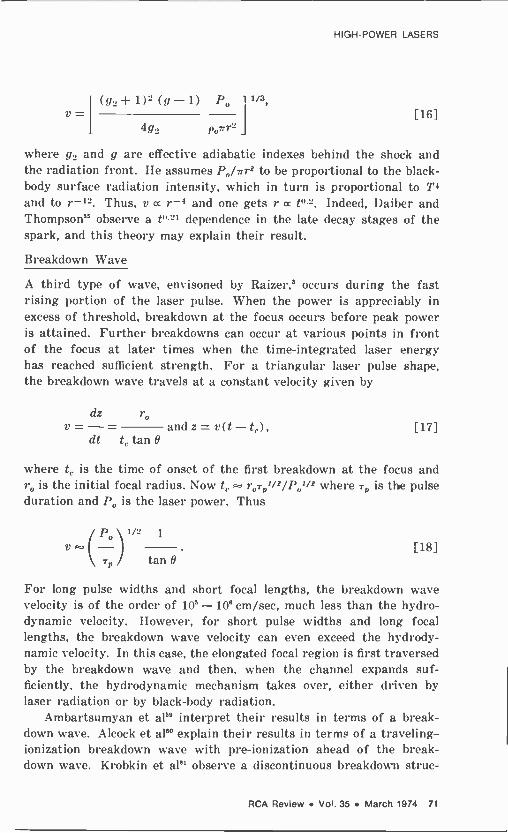
HIGH -POWER LASERS
í(g2+1)
(g- I)
P. -11/3,
v 4g2 P°7r r2
[16]
where y.. and y are effective adiabatic indexes behind the shock and the radiation front. IIe assumes I'°/7r2 to be proportional to the black- body surface radiation intensity, which in turn is proportional to T4
and to r-'-. Thus, y « r-4 and one gets r « t".2. Indeed, Daiber and Thompson" observe a t"=1 dependence in the late decay stages of the spark, and this theory may explain their result.
Breakdown Wave
A third type of wave, envisoned by Raizer,' occurs during the fast rising portion of the laser pulse. When the power is appreciably in excess of threshold. breakdown at the focus occurs before peak power is attained. Further breakdowns can occur at various points in front of the focus at later times when the time -integrated laser energy has reached sufficient strength. For a triangular laser pulse shape, the breakdown wave tra'.els at a constant velocity given by
dz r° v=-- and z = v(t - te), dt tr tan B
[17]
where t, is the time of onset of the first breakdown at the focus and r° is the initial focal radius. Now to roTp'/2/I'°'i2 where Tp is the pulse duration and P. is the laser power. Thus
P 0
1%=
V - Tp
1
tan B
[18]
For long pulse widths and short focal lengths, the breakdown wave velocity is of the order of 105- 108 cm/sec, much less than the hydro- dynamic velocity. Iloweer, for short pulse widths and long focal lengths, the breakdown wave velocity can even exceed the by drody- namic velocity. In this case, the elongated focal region is first traversed by the breakdown wave and then, when the channel expands suf- ficiently, the hydrodynamic mechanism takes over, either driven by laser radiation or by black -body radiation.
Ambartsumyan et al" interpret their results in terms of a break- down wave. Alcock et a180 explain their results in terms of a traveling - ionization breakdown wave with pre -ionization ahead of the break- down wave. Krobkin et alR1 observe a discontinuous breakdoNs n struc-
RCA Review Vol. 35 March 1974 71
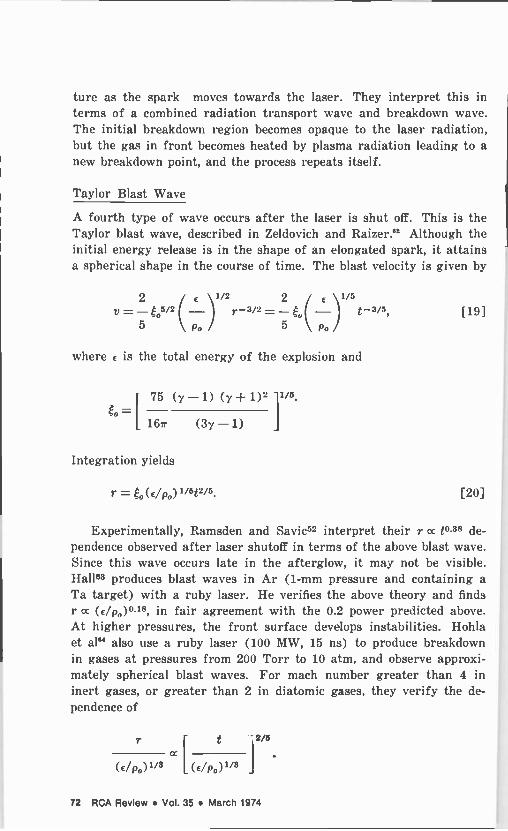
ture as the spark moves towards the laser. They interpret this in terms of a combined radiation transport wave and breakdown wave. The initial breakdown region becomes opaque to the laser radiation, but the gas in front becomes heated by plasma radiation leading to a new breakdown point, and the process repeats itself.
Taylor Blast Wave
A fourth type of wave occurs after the laser is shut off. This is the Taylor blast wave, described in Zeldovich and Raizer Rz Although the initial energy release is in the shape of an elongated spark, it attains a spherical shape in the course of time. The blast velocity is given by
2 e 1/2 2 e
1/5
V = -105/2 (- r-3/2 _ - (- 5o \ Po 5 \ Po
where e is the total energy of the explosion and
o = I 75 (y-1) (y+1)2 11/5.
167r (3y-1)
Integration yields
r = So (e/Po) 1/5t2/á,
[19]
[20]
Experimentally, Ramsden and Savic52 interpret their r « 0.38 de- pendence observed after laser shutoff in terms of the above blast wave. Since this wave occurs late in the afterglow, it may not be visible. Hall83 produces blast waves in Ar (1 -mm pressure and containing a Ta target) with a ruby laser. He verifies the above theory and finds r « (e/p0)°18, in fair agreement with the 0.2 power predicted above. At higher pressures, the front surface develops instabilities. Hohla et al64 also use a ruby laser (100 MW, 15 ns) to produce breakdown in gases at pressures from 200 Torr to 10 atm, and observe approxi- mately spherical blast waves. For mach number greater than 4 in inert gases, or greater than 2 in diatomic gases, they verify the de- pendence of
T
GI Po) 1/3
t 2/á ¢
L(E/Po)1/3
72 RCA Review Vol. 35 March 1974
HIGH -POWER LASERS
Adopting a value of y = 5/3 provides better agreement than y = 7/5. However, the predicted velocity is much too low for still later times. When the mach number is less than 2, the velocity barely falls below the sound velocity of the undisturbed gas.
At McGill! University, Lee and KnystautasRS apply the possibility of spherical blast wave formulation with lasers to ignition of chemically reactive gases and subsequent combustion. The laser spark is a perfect point energy source, free of contamination and heat transfer complica- tions. They use a 120 MW, 10 ns ruby laser with a focal spot of 120 or 240 µm. Ignition is obtained in both nondetonable gases (propane -air or acetylene -oxygen -nitrogen mixtures) at atmosphere pressure or detonable gases (acetylene -oxygen mixture) at 20 --120 Torr initial pressure. In the latter, a metal rod is used to produce some initial photoelectrons. No laser energy absorption is found before breakdown. The blast wave dynamics are influenced by the ratio of the laser spark energy to the total energy released by chemical reactions at any in- stant of time. For short times after ignition, this ratio is much greater than one and the r « t2/5 blast wave variation applies. For long times, the ratio is less than unity, and the energy released by chemical reaction dominates the shock motion, which then changes to a Chapman-.Iouguet detonation wave. It is found that for nondetonable gases, the effect of chemical reactions has negligible influence on the shock or blast wave motion. The reaction front then decouples rapidly from the shock. For detonable mixtures, there exists a critical energy above which direct initiation of a spherical detonation wave occurs. This critical laser energy varies inversely with the initial pressure of the mixture. For energies well above critical, the reaction and shock waves decouple, but close to critical the decoupling is fol- lowed by the re-establishment to a spherical detonation wave.
3.3 Results with TEA CO2 Lasers
We will now discuss results obtained with TEA CO., lasers. Prior to breakdown with a TEA CO_, laser (0.5 MW), Isenor and Richardson" observe luminesence in molecular gases (50 - 1000 Torr pressure) that absorb 10.6 µm radiation. The luminescence is characteristic of the molecular spectra of the dissociation products and is therefore as- sociated with the dissociation of the molecules before ionization.
George et al" use a repetitive TEA CO2 laser (1 - 2MW, 0.25 J, 12 pps) and investigate the first 15 µs of the laser produced spark. At 0.4 as after breakdown, they find that the plasma is comprised of a dense hot core and a tenuous outer shell. The expansion energy seems
RCA Review Vol. 35 March 1974 73
to have been dissipated by this time and the spark is virtually at a standstill.
Marquet et al", using a TEA laser, observe a plasma lasting for about 10 µs. For a laser input flux of 2 x 10⁹ W/cm2, the initial front velocity is 1.6 x 106 cm/sec, consistent with that expected from a laser - supported detonation wave model. After laser shut-off, a blast wave propagates out to a distance of 0.5 cm.
New effects are observed by Gravel et al,fi8 who investigate sparks in various gases at pressures of 100 Torr to 1 atm with a TEA CO.. laser having 0.1 - 0.6 J and 1 MW peak power. They find the existence of a filament that increases rapidly in length as the pressure is reduced towards the breakdos n threshold. After breakdown, the plasma ex- pands towards the laser at a velocity of 3 x 108 cm/sec. By the end of the initial 400-ns laser spike, the velocity is 106 cm/sec. Following this. the 5-1ts tail of the laser pulse does not appear intense enough to support further expansion, and the luminosity regresses rapidly back towards the focal point. Eventually, the plasma becomes trans- parent and breakdown occurs again near the focus. After 1.5 µs, the strong absorption of the laser results in the production of shock waves which now travel both in the forward and backward directions.
Offenberger and Burnettf9 produce breakdown in H.. at 50 - 700 Torr pressure with a TEA single -mode CO._ laser (10 MW peak, 5 X 10⁹ W/cm2). At pressures above 100 Torr, the spark moves preferentially towards the focusing lens. This motion is consistent with the existence of a breakdown wave (Eq. [171) during the rising portion of the laser pulse, followed by a laser -supported detonation wave (Eq. [11]). The predicted breakdown velocity is 4 x 107 cm/sec while that observed is 3 x 107 cm/sec at 150 Torr. At higher pressures (200 -700 Torr) and at later times during the decay, they observe a second luminous front that propagates hack towards the focal point, similar to that found by Gra\el et al.88 They explain this as due to the creation of two oppositely directed shocks by the pressure and density discon- tinuities during the spark decay. At low pressures, below 100 Torr, two luminous fronts are observed, one propagating backward towards the focusing lens and the other moving in the forward direction. The former correlates well with a laser supported detonation wave (Eq. [111) and the latter is associated with incomplete laser absorption in the backward wave.
The above experiments were performed with TEA CO., lasers hav- ing a characteristic pulse comprised of an initial spike several hund- red ns in width followed by a long tail of several µs. In contrast, MacPherson and Grael11 use an actively -mode -locked TEA CO_ laser
74 RCA Review Vol. 35 March 1974

HIGH -POWER LASERS
having a train of pulses 3rs half -w idth separated by 25 ns. Some pulses have up to 3 -5 MW peak power. Initial breakdown is produced in air at an estimated threshold of 8 x 10⁶ V/cm or 1.7 x 10¹¹ W/cm2. After breakdown, the laser transmitted energy is sharply reduced. They observe a sequence of breakdown points whose positions move from the focus towards the laser during the first half of the pulse train; later the points regress towards the focus. As compared to their work with the normal pulsed TEA laser,ó8 the present initial expansion, because of the short pulse length, is more like a blast -wave than a wage driven by laser radiation. Nonetheless, the present initial velocity (6 x 10s cm/sec) is comparable, because of the higher peak power in the mode locked laser. They do not find an exact t2/5 varia- tion (Eq. [20]) as expected for a blast wave. These results are com- pared with those of Wang and Davis' ho use a mode -locked Nd-glass laser. Wang and Davis observe the initial migration towards the laser and it follows a t2,5 blast wa\e dependence, but they do not observe the later return of the breakdown points towards the focus.
4. Summary
We have reviewed gas breakdown phenomena that occur at high in- cident laser powers. The breakdown mechanisms are expounded and experimental results on the threshold dependences on pressure. pulse duration, spot size and wavelength are summarized. Plots of results derived with CO, lasers are given. Additional breakdown interactions are then discussed, such as discharges maintained, or guided, or con- trolled by lasers. A final subsection considers the dynamics of the laser spark, namely four types of expansion waves, and recent results with TEA CO, lasers. Much of the phenomena inlolved still remain to be clarified.
Acknowledgment
This work was sponsored in part M the Defence Research Establish- ment Valcartier, Quebec. under DSS Contract Serial No. 2GR1-0325. DSS File No. 03GR.CD7020421.
References:
' A. J. Alcock. "Recent Developments in Laser Induced Gas Breakdown," NRC Report, Ottawa, presented at Symp. on High Power Molecular Lasers, Laval Un., Quebec City (1972). 2 C. DeMichelis, "Laser Induced Gas Breakdown: a Bibliograpichal Review," J. Ouant. Electronics, Vol. QE -5, p. 188 (1969). J Yu. P. Raizer, "Breakdown and Heating of Gases Under the Influence of a Laser Beam," Soy. Phys. Uspekhi, Vol. 8, p. 650 (1966).
RCA Review Vol. 35 March 1974 75

4 F. V. Bunkin and A. M. Prokhorov, "Polarization, Matiere et Rayonnement," Socleté Francaise de Physique, Paris, Presses Un. de France, p. 157 (1969). 5 G. H. Canavan, W. A. Proctor, P. E. Nielsen, and S. D. Rockwood, "CO2 Laser Air Breakdown Calculations," paper J3 presented at 7th Int. QE Conf., Montreal, May (1972). 6 P. Nelson, P. Veyrie, M. Berry and Y. Durand, "Experimental and Theoretical Studies of Air Breakdown by Intense Pulse of Light," Physics Lett., Vol. 13, p. 226 (1964). ' S. A. Akhmarov, A. I. Kovrygin, M. M. Strukov and R. V. Khokhlov, "Frequency Dependence of the Threshold of Optical Breakdown of Air," JETP Lett., Vol. 1, p. 25 (1965).
A. J. Alcock and M. C. Richardson, "Creation of a Spark by a Single Subnanosecond Laser Pulse," Phys. Rev. Lett., Vol. 21, p. 667 (1968). 9I. K. Krasyuk, P. P. Pashinin and A. M. Prokhorov, "Investigation of Breakdown in Nº Under the Influence of a Picosecond Ruby Laser Pulse," JETP Lett., Vol. 9, p. 354 (1969). 10 F. V. Bunkin, I. K. Krasyuk, V. M. Marchenko, P. P. Pashinin and A. M. Prokhorov, "Structure of a Spark Produced by a Picosecond Laser Pulse Focused in a Gas," Soy. Phys. JETP, Vol. 33, p. 717 (1971). " P. Belland, C. De Michelis and M. Mattioli, "Self -Focusing in Laser Induced Gas Breakdown," Optics Comm., Vol. 4, p. 50 (1971). 12 P. C. Smith, "Gas Breakdown Dependence on Beam Size and Pulse Duration with 10.6 p Wavelength Radiation,"' Appl. Phys. Lett., Vol. 19, p. 405 (1971). 13 A. J. Alcock, K. Kato and M. C. Richardson, "New Features of Laser -Induced Break- down in the Ultraviolet," Optics Communications, Vol. 6, p. 342 (1972). 14 L. C. Marquet, R. J. Hull and D. E. Lencioni, "Studies in Breakdown in Air Induced by a Pulsed CO2 Laser," paper J2 presented at 7th QE Conference, Montreal (1972). Also D. E. Lencioni, "The Influence of Dust on 10.6 pm Laser -Induced Air Breakdown," Appl. Phys. Lett., Vol. 23, p. 12 (1973). 15 C. H. Chan, C. D. Moody and W. B. McKnight, "Significant Loss Mechanisms in Gas Breakdown at 10.6 p," J. Appl. Phys., Vol. 44, p. 1179 (1973). 16 R. W. Minck, "Optical Frequency Electrical Discharges in Gases," J. Appl. Phys., Vol. 35, p. 252 (1964). 17 D. H. Gill and A. A. Dougal, "Breakdown Minima Due to Electron -Impact Ionization in Super -High Pressure Gases Irradiated by a Giant -Pulse Laser," Phys. Rev. Lett., Vol. 15, p. 845 (1965). 18 H. A. Generalov, V. I. Zimakov, G. I. Kozlov, V. A. Masyukov and Yu. P. Raizer, "Gas Breakdown Under the Influence of Long -Wave Infrared Radiation of a CO2 Laser," JETP Lett., Vol. 11, p. 228 (1970). 19 D. C. Smith, "Gas Breakdown with 10.6 p Wavelength CO2 Laser Radiation," J. Appi. Phys., Vol. 41, p. 4501 (1970). 20 G. A. Hill, D. J. James and S. A. Ramsden, "Breakdown Thresholds in Rare and Molecular Gases Using Pulsed 10.6 pm Radiation," J. Phys. D, Appl. Phys., Vol. 5, p. L97 (1972). 21 D. R. Cohn, C. E. Chase, W. Halverson and B. Lax, "Magnetic -Field -Dependent Breakdown of CO2-Laser-Produced Plasma," Appl. Phys. Lett., Vol. 20, p. 225 (1972). 22 B. F. Mulchenko and Yu. P. Raizer, "Laser Breakdown of Mixtures of Neon with Argon and the Role of Photoionization of Excited Atoms," Soy. Phys. JETP, Vol. 33, p. 349 (1971). 23 R. J. De Whurst, G. J. Pert, S. A. Ramsden, "Breakdown in Gases with a Mode - Locked Train and Single Picosecond Light Pulses at 1.06 pm," Proc. 10th Int. Conf. on Phen. in Ionized Gases, Oxford, Vol. 1, p. 220 (1971). 24 M. C. Richardson and A. J. Alcock, "Interferometric Observation of Plasma Filaments in a Laser -Produced Spark," Appl. Phys. Lett., Vol. 18, p. 357 (1971). 25 A. J. Alcock, C. DeMichelis and M. C. Richardson, "Breakdown and Self -Focusing Effects in Gases Produced by Means of a Single -Mode Ruby Laser," J. Ouant. Elec., Vol. QE -6, p. 622 (1970). 26 R. T. Brown and D. C. Smith, "Laser -Induced Gas Breakdown in the Presence of Preionization," Appl. Phys. Lett., Vol. 22, p. 245 (1973). 27 A. M. Robinson, "Laser -Induced Gas Breakdown Initiated by Ultraviolet Photoioniza- tion," Appl. Phys. Lett., Vol. 22, p. 33 (19/3). 28 P. J. Berger and D. C. Smith, "Gas Breakdown in the Laser as the Limitation of Pulsed High -Pressure CO2 Lasers," Appl. Phys. Lett., Vol. 21, p. 167 (1972). 29J. Tulip, K. Manes and H. J. Seguin, "Intracavity Radiation Induced Air Breakdown in a TEA CO2 Laser," Appl. Phys. Lett., Vol. 19, p. 433 (1971). 30 N. V. Karlov, V. M. Komissarov, G. P. Kuzmin and A. M. Prokhorov, "Effect of Plasma Mirror in the Breakdown of Air in a CO2 Laser Cavity," JETP Lett., Vol. 16, p. 65 (1972). 3'H. T. Buscher, R. G. Tomlinson and E. K. Damon, "Frequency Dependence of Optically Induced Gas Breakdown," Phys. Rev. Lett., Vol. 15, p. 847 (1965). 32 A. J. Alcock, C. De Michelis and M. C. Richardson, "Wavelength Dependence of Laser -Induced Gas Breakdown Using Dye Lasers," Appl. Phys. Lett., Vol. 15, p. 72 (1969).
76 RCA Review Vol. 35 March 1974

HIGH -POWER LASERS
33 H. Mennicke, "Observation of Nigh -Order Stimulated Raman-P.ntistckes Radiation and Its Role in the Initial Phase c4 Plasma Production b,/ Lasers," Max -Plan is Inst.
Report IPP IV/40, July (1972). J4 N. A. Generalov, V. P. Zimakov, G. I. Kozlov, V. A. Mesyukov and Yu. P. Raizer, "Experimental Investigation of a Continuous Optical Discharge," Soy Phys. JETP, Vol. 34, p. 763 (1972). 35 C. D. Moody, "Effects of CW Rower on the Pulsed Gas Breakdown Threshold in Argon at 10.6 u Radiation," App. Phys. Lett., Vol. 22, p. 31 (1973). J6 D. L. Franzen, "CW Gas Breakdown in Argon Using 10.6 pm Laser Radiation,' Appl. Phys. Lett., Vol. 21, p. 62 (1972). J7 D. L. Franzen, "Continuous Laser -Sustained Plasmas," J. Appl. Phys., Vol. 44, p.
1727 (1973). 38 J. R. Vaill, D. A. Tidman, T. D. Wilkerson and D. W. Koopman, "Propagat on of
High -Voltage Streamers Along Lasar-Induced Ionization Trails," Appl Phys Lett., Vol. 17, p. 20 (1970). 39 D. W. Koopman and T. D. Wilkerson, "Channeling of an Ionizing Elect-ical Steamer by a Laser Beam," J. Appl. Phys., Yol. 42, p. 1883 (1971). 40 K. A. Saum and D. W. Koopman, "Discharges Guided by Laser -Induced Rare- faction Channels," Phys. Fluids, Vol. 15, p. 2077 (1972). 41 W. K. Pendleton and A. H. Guenther, "Investigation o a Laser Triggered Spark Gap," Rev. Sci. Inst., Vol. 36, p. 15z5 (1965). 42 A. H. Guenther and J. R. Bettis, "Laser Triggered Meg avolt Switching," J. Quant. Elec., Vol. QE -3, p. 581 (1967). 43 A. H. Guenther and R. N. McKnight, "A Laser Triggered 50 pps High Voltage Switch with Nanosecond Jitter," Proc. IEEE Vol. 55, p. 1504 (1967). 44 A. G. Akmanov, L. A. Rivlin and V. S. Shildyaev, "Opticalli Initiated Directed Electric Breakdown in Air," JETP Lett., Vol. 8, p. 258 (1968). 45 V. I. Vladimirov, G. M. Malyshev, G. T. Razdobarin and V. V. Semenov, 'Invest gation of an Electric Discharge Across a Laser Spark," Sov. Phys. Tech. Phys., Vol. 14, p.
677 (1969). a6 S. H. Khan and D. Walsh, "Effect of Various Gases on Formative Times of Laser - Triggered Spark Gaps," Electronics Letters, Vol. 6, p. 551 (-970). s.7 R. C. Klewe, M. B. C. Quigley ar d B. A. Tozer, "Space. Charge Injection. r, New
Technique for Studying Nonuniform Field Breakdown Phenomena," Appl. Phys. Lett., Vol. 15, p. 155 (1969). 48 K. H. Schmitter, "Funkenstrecker mit Optischer Triggerung," Laser and anew. Strahltech. No. 3, p. 9 (1970). 49 M. Pillsticker, "Effects of Optical Components on the Triggering of Spark Gat by a
Laser Beam," (in German), Inst. fur. Plasmaphys., Garching, Report IPP 4/102 t- 972); "Laser Triggered High -Voltage Spark Gaps," Int. Symp. uber Hochspannungstelhnik Proc., pp. 619, 626, Munchen, March 9-14 (1972). 50 R. J. De Whurst, G. J. Pert and S. A. Ramsden, "Picosecond Triggerinc of a aser- Triggered Spark Gap," J. Phys. D, Ap3I. Phys., Vol. 5, p. 97 (1972). 51 S. A. Ramsden and W. E. R Davies. "Radiations Scaaered 'rom the Plasma Pro:uced by a Focused Ruby Laser Beam," Phys. Rev. Lett., Vol. 13, p. 227 (1964). 52 S. A. Ramsden and P. Savic, "A Radiative Detonation Model for the Develownent of a Laser Induced Spark in Air," Na-ure, Vol. 203, p. 1217 (1964). 53 R. G. Tomlinson, "Scattering and Beam Trapping in Laser Produced Plasmas in
Gases," J. Quant. Elec., Vol. QE -5, p. 591 (1969). 54 S. L. Mandelshtam, P. P. Pashinin, A. V. Prokhindeev, A. M. Prokhoro-, and 14. K
Sukhodrey, "Study of the Spark Procuced in Air by Focused Laser Rad ation," Sov.
Phys. JETP, Vol. 20, p. 1344 (1965). 55 J. W. Daiber and H. M. Thompsci, "Laser Driven Detrnation Waves in Gases," Phys. Fluids, Vol. 10, p. 1162 (1967). 56 A. B. Iznatov, I .1. Komissarova, G. V. Ostrovskaya and L. L. Shapiro, ' Hologrs phic Studies of a Laser Spark. Ill Spark is Hydrogen and Helium " Soy. Phys. Tech. Phys.,
Vol. 16, p. 550 (1971). 57 B. Ahlborn and J. D. Strachan, "Dynamics of Step Heat Waves in Gases and Plas-
mas," Can. J. Phys., Vol. 51, p. 1416 (1573). 58 B. Ahlborn, "Decaying Laser Sparks," Phys. Lett., Vol. 40A p. 289 (1972..
59 R. V. Ambartsumyan, et al., "Heatirg of Matter by Focused Laser Radiation," Soy,
Phys. JETP, Vol. 21, p. 1061 (1965). 60 A. J. Alcock, C. De Michelis, K. Hsmal and B. A. Tozer, 'Expansion Mechanism in
a Laser Produced Spark," Phys. Rev. Lett., Vol. 20, p. 1095 (1968). 61 V. V. Krobkin, et al., "Investigatior of the Air Spark Produced by Focused Laser
Radiation, Ill," Soy. Phys. JETP, Vol. 2E p. 79 (1968). 62 Ya. B. Zeldovich and Yu. P. Raizer, "Physics of Shock Wakes and High--emper3ture Hydrodynamic Phenomena," Academic Press, N. Y., Vol. 1, pp. 93-99 (19E7).
63 R. B. Hall, Laser Production of Bias' Waves in Low Pressu,e Gases," J. Appl. Fkys.,
Vol. 40, p. 1941 (1969).
RCA Review Vol. 35 March 1974 77

6° K. Hohla, K. Büchl, R. Wienecke and S. Witkowski, "Eaergiebestimmung der Stoswelle eines Laserinduzierten Gasdurchbruchs," Zeiis. fur Naturf., Vol. 24a, p. 1244 (1969). 65 J. H. Lee and R. Knystautas, "Laser Spark Ignition of Chemically Reactive Gases," AIAA J., Vol. 7, p. 312 (1969). 66 N. R. (senor and M. C. Richardson, "Dissociation and Breakdown of Molecular Gases by Pulsed CO2 Laser Radiation," Appl. Phys. Lett, Vol. 18, p. 224 (1971). 67 E. V. George, G. Bekefi and B. Yaakobi, "Structure of the Plasma Fireball Produced by a CO2 Laser," Phys. Fluids, Vol. 14, p. 2708 (1971). 65 M. Gravel, W. J. Robertson, A. J. Alcock, K. Büchl and M. C. Richardson, "Forward Going Filament in Sparks Induced by 10.6 µ Laser Radiation," Appl. Phys. Lett., Vol. 18, p. 75 (1971). 69 A. A. Offenberger and N. H. Burnett, "CO2 Laser -Induced Gas Breakdown in Hydro- gen," J. Appl. Phys., Vol. 43, p. 4977 (1972). 70 R. W. MacPherson and M. Gravel, "Sequential Dielectric Breakdown of Air by the Focused Radiation from a Mode Locked CO2 TEA Laser," Optics Comm., Vol. 4, p. 160 (1971). 7' C. C. Wang and L. I. Davis Jr., "New Observations of Dielectric Breakdown in Air Induced by a Focused Nd Glass Laser with Various Pulse Widths," Phys. Rev. Lett., Vol. 26, p. 822 (1971).
78 RCA Review Vol. 35 March 1974

An Introduction to the Science and Technology of Liquid Crystals
E. B. Priestley and Peter J. Wojtowicz
RCA Laboratories, Princeton, N. J.
The liquid crystalline state of matter was discosered in 1888 by the Austrian botanist F. Reinitzer and named in 1889 by the German physicist O. Lehmann. Although sometimes considered laboratory curiosities, liquid crystals are quite common; it is estimated that. about one of every 200 organic materials exhibits liquid crystalline behavior. Scientific interest in these mesogenic materials grew steadily from their discovery by Reinitzer until about 1930, and then began to wane. In the early 1960's renewed interest developed in liquid crystalline phases and at present there is a strong resurgence in all aspects of liquid -crystal research. This renewed interest occurred, in part. be-
cause liquid crystals represent interesting systems in which important phase transitions and critical phenomena can be studied. The major impetus, however, is undoubtedly the wide variety of applications in
which liquid crystals have been found useful. Early applications of liquid crystals utilized the optical properties of cholesterics for tem- perature and pressure sensing. From an applications standpoint, cur- rent interest centers principally around the use of nematic, cholesteric, and smectic liquid crystals in a variety of display, optical, and storage devices.
At present, the liquid -crystal activity at the RCA Laboratories is
quite extensive, ranging from basic research to device engineering.
RCA Review Vol. 35 March 1974 79

Some time ago, therefore, a weekly study seminar on the subject of liquid crystals was instituted. It was our original intention that this seminar would stimulate increased interaction among individuals from different disciplines who share a common interest in liquid crystals. The resulting series of lectures are being published in the RCA Review beginning with this issue. We believe these lectures will serve as a useful primer in both the science and technology of liquid crystals for those using or contemplating the use of liquid crystals in practical devices. The series is intended to be a tutorial introduction to the subject and, as such, is not meant to be a review of the field of liquid crystals. Thus, no attempt has been made to include exhaustive com- pilations of literature references.
Included in this issue are introductions to the basic physics and chemistry of liquid crystals, introductions to the molecular theory of nematics, and a discussion of the experimental determination of the degree of order in nematics. Subsequent lectures, which will appear in future issues, will focus on the phenomenological theories of liquid crystals; their optical, electrical, and electro -optic properties; and the applications of liquid crystals in devices.
80 RCA Review Vol. 35 March 1974
Liquid Crystal Mesophases
E. B. Priestley
RCA Laboratories, Princeton, N. J. 08540
Abstract-The concept of a mesophase is discussed and liquid crystals are shown to be ordered fluid mesophases. Thermotropic and lyotropic liquid crystals are differentiated. Particular attention is given to the nature of the molecular ordering in the various liquid -crystal meso - phases. Polymorphism is defined and several examples are considered. Finally, some of the consequences of simultaneous liquid -like and solid -like behavior in a single phase are discussed qualitatively.
1. Mesophases
Everyday experience has led to universal familiarity with substances that undergo a single transition from the solid to the isotropic liquid phase. The melting of ice at 0°C to form liquid water is perhaps the most common such phase transition. There are, however, many organic materials that exhibit more than a single transition in passing from solid to liquid, thereby necessitating the existence of one or more intermediate phases. It is not surprising that the molecular ordering in these intermediate phases, known as "mesophases", lies between that of a solid and that of an isotropic liquid. The partial ordering of the molecules in a given mesophase may be either trans- lational or rotational, or both. Clearly, translational order can be realized regardless of molecular shape, whereas rotational order has
RCA Review Vol. 35 March 1974 81

meaning only when the constituent molecules are nonspherical (elon- gated). Thus, there is good reason to expect molecular structure to be an important factor in determining the kind and extent of ordering in any particular mesophase.
Two basically different types of mesophases have been observed. First, there ale those that retain a 3 -dimensional crystal lattice, but are characterized by substantial rotational disorder (i.e. disordered crystal mesophases), and second, there are those with no lattice, which are therefore fluid, but nevertheless exhibit considerable rotational order (i.e., ordered fluid mesophases). molecular structure is in fact important and, generally speaking, molecules comprising one of these two types of mesophase are distinctly different in shape from molecules comprising the other. Indeed, with the possible exception of some polymorphous smectic materials, there are no known substances that show both disordered crystal and ordered fluid mesophases.
1.1 Disordered Crystal Mesophases
Disordered crystal mesophases are known as "plastic crystals".' In most cases plastic crystals are composed of "globular" (i.e. essentially spherical) molecules. for which the harriers to rotation are small rela- tive to the lattice energy. As the temperature of such a material is raised, a point is reached at which the molecules become energetic enough to overcome these rotational energy barriers, but not sufficiently energetic to break up the lattice. The result is a phase in which the molecules are translationally well ordered but rotationally disordered, i.e., a disordered, or plastic crystal. Further increase in the tempera- ture will result eventually in the molecules becoming energetic enough to destroy the lattice, at which point a transition to the isotropic liquid occurs. Perhaps the most striking property of plastic crystal meso - phases is the ease with which they may he deformed under stress. It is this softness or "plasticity" that gives these mesophases their name.
A detailed discussion of plastic crystals is outside the scope of this lecture. However, those interested in pursuing the subject further are directed to Ref. [1] which provides an excellent elementary review of the properties of plastic crystals.
1.2 Ordered Fluid Mesophases
Ordered fluid mesophases are commonly called "liquid crystals"' and are most often composed of elongated molecules. Li these mesophases, the molecules show some degree of rotational order (and in some cases
82 RCA Review Vol. 35 March 1974

MESOPHASES
partial translational order as well) even though the crystal lattice has been destroyed. Lack of a lattice requires that these mesophases be fluid: they are, however, ordored fluid phases. It is this simultaneous possession of liquid -like (fluidity) and solid-lhke (molecular order) character in a single phase that makes liquid crystals unique and gives rise to so many interesting properties.
In what follows, the various ordered fluid mesophases are described, with particular attention being given to the nature of the molecular ordering in each case. Also, some of the consequences of simultaneous liquid -like and solid -like behavior in a single phase are discussed qualitatively. Later lectures will deal at length with many subjects we can consider only briefly here.
2. Types of Liquid Crystals
Two types of liquid crystal mesophases must he differentiated, viz. thermotropic and lyotropic. Thermotropic liquid crystals are of in- terest both from the standpoint of basic research and also for applica- tions in electro -optic displays, temperature and pressure sensors. etc. Lyotropic liquid crystals, on the other hand, are of great interest biologically and appear to play an important role in lip ing systems.
2.1 Thermotropic Liquid Crystals
The term "thermotropic" arises because transitions involving these mesophases are most naturally effected by changing temperature Ala- terials showing thermotropic liquid crystal phases are usually organic substances with molecular structures typified by those of cholesteryl nonanoate and N-(p-methoxybenzylidene)-p'-nbutylaniline (MBBA) shown in Fig. 1. Axial ratios of 4-8 and molecular weights of 200-500 gm/mol are typical for thermotropic liquid crystal mesogens. In this type of liquid crystal, every molecule participates on an equal basis in the long range ordering.
2.2 Lyotropic Liquid Crystals
Solutions of rod -like entities in a normally isotropic solvent often form liquid -crystal phases for sufficiently high solute concentration. These an isotropic solution mesophases are called "lyotropic liquid crystals".°" Although the rod -like entities are usually quite large compared with typical thermotropic liquid -crystal mesogens, their axial ratios are seldom greater than -15. Deoxyribonucleic acid (DNA), certain viruses (e.g., tobacco mosaic virus (TMV)), and many synthetic poly -
RCA Review Vol. 35 March 1974 83

peptides all form lyotropic mesophases when dissolved in an appropriate solvent (usually water) in suitable concentration. The conformation of most of these materials is quite temperature sensitive, i.e. the rods themselves are rather unstable with respect to temperature changes. This essentially eliminates the possibility of thermally inducing phase transitions involving lyotropic mesophases. A more natural parameter which can be varied to produce such transitions is the solute concen- tration. The principal interaction producing long range order in lyo-
tropic liquid crystals is the solute-solute interaction; solute-solvent interactions are of secondary importance. To a good approximation, then, only the rod -like entities (solute) participate in the long range ordering.
CH3 (CH2)\Ci0
lc
CHOLESTERYL NONANOATE
CH.O
(o)
CHN 9
N -(P -METHOXY BENZYLIDENE )-P'- BUTYLANILINE (MBBA)
(b)
Fig. 1-Examples of molecular structures that give rise to thermotropic mesophases.
3. Classification According to Molecular Order
With the distinction between thermotropic and lyotropic mesophases in
mind, we proceed to the classification of these mesophases using a
scheme based primarily upon their symmetry. This scheme, first pro- posed by Friedel in 1922,'° distinguishes three major classes-the nematic, the cholesteric, and the smectic.
3.1 Nematic Order
The molecular order characteristic of nematic liquid crystals is shown
84 RCA Review Vol. 35 March 1974

MESOPHASES
schematically in Fig. 2. Two features are immediately apparent from the figure:
(1) There is long range orientational order, i.e., the molecules tend to align parallel to each other.
(2) The nematic phase is fluid, i.e., there is no long range correla- tion of the molecular center of mass positions.
In the state of thermal equilibrium the nematic phase has symmetry co/mm and is therefore uniaxial. The direction of the principal axis fi (the director) is arbitrary in space.
Fig. 2-Schematic representation of nematic order.
3.2 Chlosteric Order
Fig. 3 shows the equilibrium structure of the cholesteric phase. As in the nematic phase, lack of long range translational order imparts fluidity to the cholesteric phase. On a local scale, it is evident that cholesteric and nematic ordering aie very similar. However, on a larger scale the cholesteric director fi follows a helix of the form
n, = cos (qoz ¢) n = sin (qoz -}- 4)
n,=0
where both the direction of the helix axis z in space and the magnitude of the phase angle 4 are arbitrary. Thus the structure of a cholesteric liquid crystal is periodic with a spatial period given by
RCA Review Vol. 35 March 1974 85

r L-
Igel
The sign of qo distinguishes between left and right helicies and its magnitude determines the spatial period. When L is comparable to optical wavelengths, the periodicity results in strong Bragg scattering of light. If the wavelength of the scattered light happens to be in the visible region of the spectrum, the cholesteric phase will appear brightly colored.
/ %// ///// //%/ / \\\\\ \\ ih, \\\\\\ \\ \\\\\\\
Fig. 3-Schematic representation of cholesteric order.
It is interesting to note that a nematic liquid crystal is really nothing more than a cholesteric with q0 = 0 (infinite pitch). In fact, the two are subclasses of the same family, the distinction being whether the equilibrium value of qo is identically zero, or finite. If the constituent molecules are optically inactive, i.e., are superimposable on their mirror image, then the mesophase will be nematic. If, on the other hand, the constituent molecules are optically active, i.e., are not superimposable on their mirror image, then the mesophase will be cholesteric (except if the molecule and its mirror image are present in precisely equal amounts, i.e. a "racemic" mixture, in which case the mesophase will again be nematic).
Finally, a comment on nomenclature is in order. Cholesteric liquid
86 RCA Review Vol. 35 March 1974

MESOPHASES
crystals get their name historically from the fact that the first materials that were observed to exhibit the characteristic helical structure were esters of cholesterol. It would he useful to continue identifying as "cholesteric" those mesophases whose constituent mole-
cules are derivatives of cholesterol, and to use the term "chiral nematic" to identify mesophases formed by optically active, non -
steroidal molecules.
3.3 Smectic Order
As many as eight smectic phases have been tentatively identified; however, except for three that have been reasonably well characterized, considerable uncertainty still exists about the exact nature of the molecular ordering in these phases.
We will discuss only the three best understood smectic phases, the smectic A, C, and B phases. All three appear to have one common feature, viz. one degree of translational ordering, resulting in a layered structure. As a consequence of this partial translational ordering, the smectic phases are much more viscous than either the nematic or cholesteric phase.
Smectic A Order
Within the layers of a smectic A mesophase the molecules are aligned parallel to the layer normal and are uncorrelated with respect to center of mass position, except o\ er very short distances. Thus, the layers ate individually fluid, with a substantial probability for inter -layer diffusion as well. The layer thickness, determined from x-ray scatter- ing data, is essentially identical to the full molecular length. At thermal equilibrium the smectic A phase is optically uniaxial due to the infinite -fold rotational symmetry about an axis parallel to the layer normal. A schematic representation of smectic A order is shown in
Fig. 4(a).
Smectic C Order
Smectic C order is depicted in Fig. 4(b). X-ray scattering data from several smectic C phases indicates a layer thickness significantly less than the molecular length. This has been interpreted as evidence for a uniform tilting of the molecular axes w ith respect to the layer normal. The fact that the smectic C phase is optically biaxial is further evidence in support of a tilt angle. Tilt angles of up to 45° have been
RCA Review Vol. 35 March 1974 87
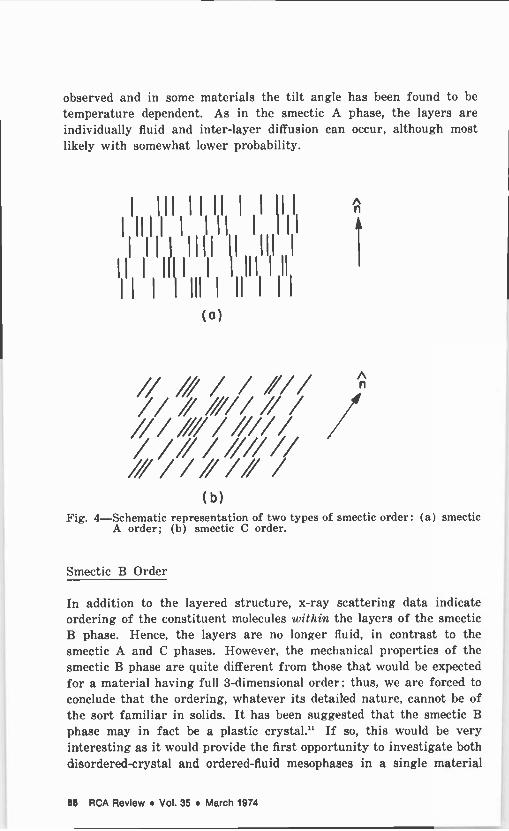
observed and in some materials the tilt angle has been found to be temperature dependent. As in the smectic A phase, the layers are individually fluid and inter -layer diffusion can occur, although most likely with somewhat lower probability.
IIII111111III ñ
lllll l III I I
I III IIII li III I
II I II I I III I II
I I I III I II I I I
(a) 1
// /// / / /// / ///,///// ///////////// / / // / //// // ////////// / (b)
Fig. 4-Schematic representation of two types of smectic order: (a) smectic A order; (b) smectic C order.
Smectic B Order
In addition to the layered structure, x-ray scattering data indicate ordering of the constituent molecules within the layers of the smectic B phase. Hence, the layers are no longer fluid, in contrast to the smectic A and C phases. However, the mechanical properties of the smectic B phase are quite different from those that would be expected for a material having full 3 -dimensional order; thus, we are forced to conclude that the ordering, whatever its detailed nature, cannot be of the sort familiar in solids. It has been suggested that the smectic B
phase may in fact be a plastic crystal." If so, this would be very interesting as it would provide the first opportunity to investigate both disordered -crystal and ordered -fluid mesophases in a single material
88 RCA Review Vol. 35 March 1974
MESOPHASES
(for any polymorphous smectic substance having a smectic B phase). This model is not the only one possible for the smectic B phase, how-
ever. It could also be that this phase is composed of a collection of 2 -dimensional solid layers coupled by very weak forces, such that the layers could slip over one another quite easily." Although, in principle. these two models are experimentally distinguishable, there are no data that differentiate between them at present. Smectic B phases can be either biaxial or uniaxial depending upon whether or not there is a finite tilt angle of the sort discussed above.
4. Polymorphºsm in Thermotropic Liquid Crystals
Many thermotropic materials have been observed to pass through more than one mesophase between the solid and isotropic liquid phases. Such materials are said to be "polymorphous". One can predict the order of stability of these mesophases on a scale of increasing tem- perature simply by utilizing the fact that raising the temperature of any material results in progressive destruction of molecular order. Thus, the more ordered the mesophase, the closer in temperature it lies to the solid phase. From the description of the various types of order given in Sec. 3, we can immediately draw the following conclusions:
(1) For a material having nematic and smectic trimorphous phases, the order of mesophase stability with increasing temperature will be solid -* smectic B -* smectic C - smectic A -* nematic -a isotropic This order of stability is in complete agreement with experimental observation.
(2) For a material having nematic and/or smectic phases, but not all those listed in (1), the order of stability can be obtained from that shown in (1) by simply deleting those phases not present. This is also confirmed experimentally.
For materials having both cholesteric and smectic mesophases, the order is identical to that shown in (1) except the word "nematic" is replaced by "cholesteric". The following have been experimentally observed:
(a) solid -- cholesteric - isotropic
(b) solid -* smectic A -* cholesteric -º isotropic.
(3)
Finally, we note that there are no known examples of polymorphism involving both nematic and cholesteric mesophases (recall the dis-
RCA Review Vol. 35 March 1974 89
cussion of molecular symmetry in Sec. 3.2). Of course, in the presence of an external electric or magnetic field, a cholesteric liquid crystal can be forced into a nematic structure. Such field induced distortions have been studied extensively.
5. Molecular Structure of Thermotropic Mesogens
At present there is no way of predicting with certainty whether or not a given molecule will exhibit liquid -crystal mesophases. However, the presence of common structural features in the majority of thermo- tropic liquid -crystal mesogens makes possible certain generalizations regarding the types of molecules most likely to show liquid -crystalline behavior. The two structural features that appear essential are (1) the constituent molecules must be elongated and (2) they must be rigid. It should be borne in mind that these are only generalizations, and exceptions do exist.
We have already encountered one group of structurally related compounds that often form liquid -crystal phases, viz. the substituted cholesterols. It is evident from Fig. 1(a) that these molecules are elongated and quite rigid, thereby satisfying the two criteria above. As mentioned earlier, all mesophases produced by molecules of this type have finite pitch due to the optical activity of the parent cholesterol molecule.
As a second group, we consider molecules whose structures can be represented schematically as
ISUBSTITUENT AROMATIC GROUP LINKAGE GROUP
AROMATIC GROUP SUBSTITUENT
with n = 0, 1, or 2. Many of these molecules exhibit nematic and smectic mesophases and, if optically active, may give rise to chiral nematic mesophases. It is apparent even from this crude representa- tion that the requirement of elongated molecules is satisfied by this structure. The need for rigidity is satisfied, in general, by restricting the linkage groups to those containing multiple bonds. Fig. 5 shows three nematogenic molecules that serve to illustrate the structure for n = 0, 1, and 2, respectively. In the p-pentyl-p'-cyanobiphenyl (PCB) molecule, the biphenyl is considered as a single aromatic group. Thus n = 0, there are no linkage groups, and the substituents are -05H11 and -CN. The p-azoxyanisole (I'AA) molecule illustrates the case for n = 1. Its two phenyl aromatic groups are linked by an azoxy group
90 RCA Review Vol. 35 March 1974
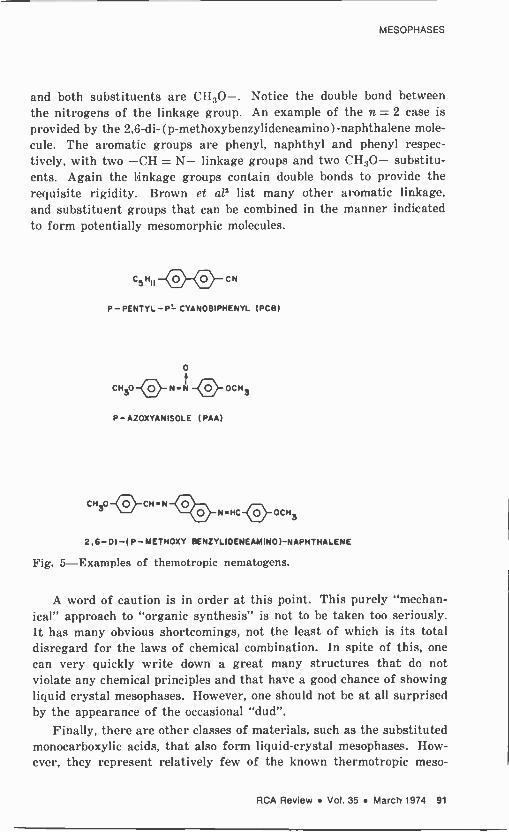
MESOPHASES
and both substituents are CHsO-. Notice the double bond between the nitrogens of the linkage group. An example of the n = 2 case is provided by the 2,6-di-(p-methoxybenzylideneami no) -naphthalene mole- cule. The aromatic groups are phenyl, naphthyl and phenyl respec- tively, with tINo -CH = N- linkage groups and two CI130- substitu- ents. Again the linkage groups contain double bonds to provide the requisite rigidity. Brown et ale list many other aromatic linkage, and substituent groups that can be combined in the manner indicated to form potentially mesomorphic molecules.
0 0 CN
P-PENTYL-P'-CYANOBIPHENYL (PCB)
o
t CH30-O-NÑ-ONOCH3
P- AZOXYANISOLE (PAA)
CH30-4 U rCH.N NHC-( O }-OCH3
2,6-DI-(P-METHOXY BENZYLIOENEAMIINO)-NAPHTHALEAE
Fig. 5-Examples of themotropic nematogens.
A word of caution is in order at this point. This purely "mechan- ical" approach to "organic synthesis" is not to be taken too seriously. It has many obvious shortcomings, not the least of which is its total disregard for the laws of chemical combination. In spite of this, one can very quickly write down a great many structures that do not violate any chemical principles and that have a good chance of showing liquid crystal mesophases. However, one should not be at all surprised by the appearance of the occasional "dud".
Finally, there are other classes of materials, such as the substituted monocarboxylic acids, that also form liquid -crystal mesophases. How- ever, they represent relatively few of the known thermotropic meso -
RCA Review Vol. 35 March 1974 91

gens. For more details concerning the relationship of molecular struc- ture to liquid crystallinity and for a discussion of these other classes of mesomorphic materials, the reader is referred to the following lecture12 and references therein.
6. Properties of Ordered Fluid Mesophases
The combination of molecular order and fluidity in a single phase results in several remarkable properties unique to liquid crystals. By now, it is quite evident that the constituent molecules of liquid crystal mesophases are structurally very anisotropic. Because of this shape anisotropy, all the molecular response functions, such as the electronic polarizability, are anisotropic. The long range order in the liquid - crystal phases prevents this molecular anisotropy from being com- pletely averaged to zero, so that all the macroscopic response functions of the bulk material, such as the dielectric constant, are an isotropic as well. We have, therefore, a flexible fluid medium whose response to external perturbations is anisotropic.
Consider the dielectric tensor Eao. In the uniaxial nematic phase (chosing the z-axis parallel to the nematic axis), has the form
CEl
o
0/ EQ = O El 0
l) EII
with an anisotropy defined by = - El. Here En and El refer to the dielectric constant parallel and perpendicular to the nematic axis, respectively. The response of a nematic liquid crystal to an external electric field depends on both the sign and magnitude of SE. If -SE is positive, the lowest energy state in the presence of the field will be that in which the nematic axis lies parallel to the field. For a negative _se, the lowest energy state will be that in which the nematic axis is perpendicular to the field. Due to the fluid nature of the phase, the field strength necessary to cause such realignment of the nematic axis is not very large. This ability to control the orientation of the nematic axis by means of weak external fields is the basis for several applications of nematic liquid crystals in optical display devices.
Cholesteric liquid crystals have also been put to practical use. In this case, it is primarily the sensitivity of the pitch to changes in temperature, pressure, etc. that are of interest. Recall that when the pitch of a cholesteric is equal to an optical wavelength, Bragg scatter- ing occurs. It is evident that by choosing a cholesteric of appropriate pitch, changes in temperature and pressure can be monitored by means
92 RCA Review Vol. 35 March 1974

MESOPHASES
of the accompanying color change of the material. Cholesteric liquid
crystals are especially useful in applications where large -area tem-
perature or pressure profiles must he determined. Largely because of their high viscosity, smectic liquid crystals have
not come into widespread use. While it seems unlikely they will he
useful in any application where speed of response is important, they
may be \ aluable as storage media."
References:
J. G. Aston, "Plastic Crystals," in Physics and Chemistry of the Organic Solid State, pp. 543-583, ed. by D. Fox, M. M. Labes, and A. Weissberger, Interscience Pun., N.Y.,
N.Y. (1963). 2 G. H. Brown, J. W. Doane, aid V. D. Neff, A Review of the Structure and Physical Properties of Liquid Crystals, CRC Press, Cleveland, Ohio (1971). 7 G. Durand and J. D. Litster, "Recent Advances in Liquid Crystals," in Annual Reviews of Materials Science, Vol. 3, pp. 269-292, ed. by R. A. Huggins, Annual Reviews, Inc., Palo Alto, Calif. (1973).
I. G. Chistyakov, "Liquid Crystals," Sov. Phys. Usp., Vol. 9, p. 551 (1967).
5 A. Saupe, "Recent Results in the Field of Liquid Crystals," Angew. Chem. Int. Ed.
(English), Vol. 7, p. 97 (1968). ° G. W. Gray, Molecular Structure and the Properties of Liquid Crystals, Academic Press, N.Y., N.Y. (1962).
A. S. C. Lawrence, "Lyotropic Mesomorphism in Lipid -Water Systems," Mol. Cryst. Liquid Cryst., Vol. 7, p. 1 (1969). s P. A. Winsor, "Binary and Multicomponent Solutions of Amphiphilic Compounds," Chem. Rev., Vol. 68, p. 1 (1968). 9 P. Ekwall, L. Mandell, and K. Fontell, "Solubilization in Micelles and Mesophases and the Transition from Normal to Reversed Structures," Mol. Cryst. Liquid Cryst., Vol. 8, p. 157 (1969).
G. Friedef, "Les états Mésomorphes de la Matiére," Ann. de Physique, Vol. 18, p.
273 (1922). " P. G. de Gennes, "Some Remarks on the Polymorphism of Smectics," Mol. Cryst. Liquid Cryst., Vol. 21, p. 49 (1973). tZ A. W. Levine, "Structure -Property Relationships in Thermotropic Liquid Crystals," RCA Rev., Vol. 35, No. 1, p. 94 (1974). 13 F. J. Kahn, "IR -Laser -Addressed Thermo -Optic Smectic Liquid -Crystal Storage Dis- plays," Appl. Phys. Lett., Vol. 22, p. 111 (1973).
RCA Review Vol. 35 March 1974 93

Structure -Property Relationships in Thermotropic Organic Liquid Crystals
Aaron W. Levine
RCA Laboratories, Princeton, N. J. 08540
Abstract-The literature of organic liquid crystals is briefly surveyed from the viewpoint of the relationships between chemical structure and meso - phase stability.
Introduction
The phenomenon of thermotropic liquid crystallinity has been known' at least since 1888. Since the early observations by Reinitzer'2 and Lehmann' of unusual melting behavior in certain organic compounds, mesogenic compounds have been both actively sought and incidentally discovered. Several relatively recent discoveries4-9 have shown the technological utility of organic mesophases. Substantial impetus has thus been provided for the systematic investigation of the relation- ships between molecular structure and liquid crystallinity.
The literature of organic liquid crystals has been reviewed several times.10-" Reviews of those properties and compounds usable in some electro -optical devices have also appeared.14 The intention of this paper is to present a brief summary of thermotropic mesophasic behavior in organic compounds as related to molecular structure. Recent activity in this field will be indicated in an attempt to show current trends in theory and experimentation. The cited reviews1s and the more recent symposia reprints and abstracts are commended to the interested readers.
94 RCA Review Vol. 35 March 1974
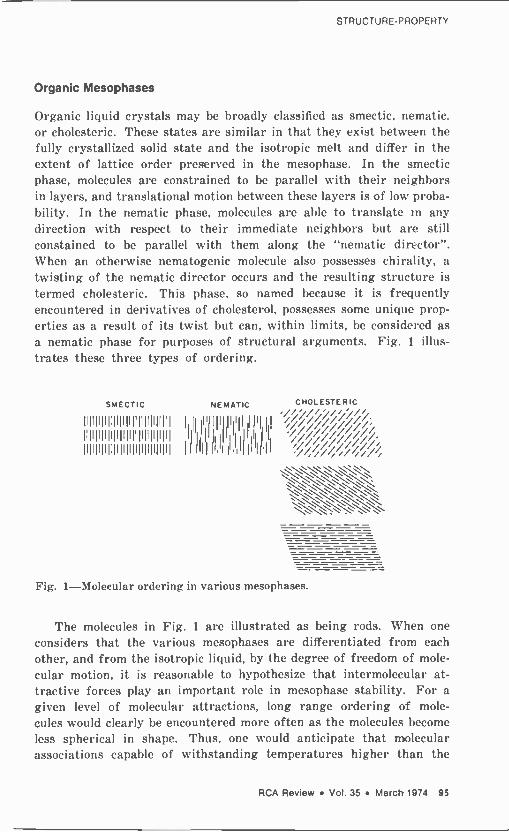
STRUCTURE -PROPERTY
Organic Mesophases
Organic liquid crystals may be broadly classified as smectic, nematic. or cholesteric. These states are similar in that they exist between the fully crystallized solid state and the isotropic melt and differ in the extent of lattice order preserved in the mesophase. In the smectic phase, molecules are constrained to be parallel with their neighbors in layers, and translational motion between these layers is of low proba- bility. In the nematic phase, molecules are able to translate in any direction with respect to their immediate neighbors but are still constained to be parallel with them along the "nematic director". When an otherwise nematogenic molecule also possesses chirality, a twisting of the nematic director occurs and the resulting structure is
termed cholesteric. This phase, so named because it is frequently encountered in derivatives of cholesterol, possesses some unique prop- erties as a result of its twist but can, within limits, be considered as a nematic phase for purposes of structural arguments. Fig. 1 illus- trates these three types of ordering.
SME CT IC
Illll1l1l:l1l1l1lililil1l1l1l
IililillUlilliUUIiUIUI UUIiI1Gl1l1l1l1l1l1l1l1lil
NEMATIC CHOLESTERIC
Il I l l i l i
,///% IIfl1
+I,li
11II IIII lII
1
11111111
I
II
I 11 ¡; iIII iiiií
Fig. 1-Molecular ordering in various mesophases.
The molecules in Fig. 1 are illustrated as being rods. When one considers that the 'arious mesophases are differentiated from each other, and from the isotropic liquid, by the degree of freedom of mole-
cular motion, it is reasonable to hypothesize that intermolecular at- tractive forces play an important role in mesophase stability. For a given level of molecular attractions, long range ordering of mole- cules would clearly be encountered more often as the molecules become less spherical in shape. Thus, one would anticipate that molecular associations capable of withstanding temperatures higher than the
RCA Review Vol. 35 March 1974 93

crystalline melting point, i.e., mesophases, would be more frequently observed for molecules of rod -like shape. In addition to a molecular shape that is considerably longer than it is wide (linear molecules), mesophasic thermal stability is favored by molecular rigidity, per- manent dipoles within the molecules, and a high level of molecular polarizability. Nearly all mesogenic compounds contain multiple bonds along their long axes, aromatic nuclei, and either polar or long -chain terminal groups.
DIPOLAR
O
0
CH3
CH3 CH=N - -C,H9
O 0
H C=C
COOH
N=CH
MESOMORPHIC
LINEAR
CH=N
,COOH =C
POLARIZABLE
OCH3 O -N=CH oOCH3
NOT MESOMORPHIC
Fig. 2-Some examples of mesogenic and non-mesogenic compounds illus- trating some general structural requirements.
Fig. 2 illustrates these points with some well-known mesogens and closely related compounds whose melting behavior is normal. Note that, in this paper, the term melting point is used to refer to the solid-to-mesomorphic (or isotropic) transition while the abbreviations C, S, N, Ch, and I will be used when referring to transitions involving the crystalline, smectic, nematic, cholesteric, and isotropic states, respectively. Thus, the melting point of a nematogen refers to the C -N transition while N -I will describe the nematic clearing transition.
General Structural Features of Mesogens u
The vast majority of compounds exhibiting liquid crystalline prop- erties may be regarded as possessing a central linkage and end groups (structure 1). When the central linkage is small, such as -C=N- or
aromatic nuclei are nearly always present. Mesogens con- taining both carbocyclic and heterocyclic aromatic residues are known
96 RCA Review Vol. 35 March 1974

STRUCTURE -PROPERTY
Terminal Group Central Group 0)-- Terminal Group
Structure 1
and, in a sufficiently long molecule, substitution other than at para positions is permissible. Central groups that require no highly polariz- able aromatic residues are exemplified by the .15 -steroid ring system and the carboxylic acid dimers. Fig. 3 shows the more common central linkages.
,o HO..
-COM OC -CN=CN- -C3C-
ocid dimer olefin ocetylen
CNs
C
-CH=N- -CN=N- 1 O
Gs -steroidoxomefhin nitrore (Schiff's bosel
-N=N-
oxo
-N#N- -C-C- ` 1
0 O
o[osy ester
Fig. 3-Common central linkages of mesogenic compounds of Structure 1.
Terminal groups Nary widely in chemical nature. Fig. 4 presents those most frequently encountered. The terminal group frequently determines which mesophase will be observed. This will be discussed in detail in the section on homologous series.
Effects of Structure on Mesophase Thermal Stability
Of the transitions observed upon melting a liquid crystalline material, the melting point is least correlated with molecular structure. This is so because the thermal stability of the solid state is principally in- fluenced by attractive forces in the crystal lattice. Since these short- range associations are only secondarily related to molecular structure, the melting point is not usually influenced in an obvious manner by molecular structure.
The forces responsible for the mesophase, however, are primarily dipole -dipole (both permanent and induced) and dispersion forces, which, since the molecules in the mesophase or melt are free to rotate.
HCA Review Vol. 35 March 1974 97

should be correlated with molecular structure. If the mesophase is to survive a vibrational excitation that has already exceeded the lattice energy, intermolecular polar attractions are required. In the follow- ing considerations, the mesomorphic thermal stability will be used to compare the relative efficiency' of various structures in stabilizing a
mesophase. It is important to understand that we are refering here to the maximum temperature at which a particular liquid crystalline
CH3-(CH2)- ALKYL- MAY BE BRANCHED
RO- ALKYLOXY; ALSO INTERNAL ETHERS
O II
RO -C- CARBOALKOXY
0 I I
R- C -0- ALKYLCARBOXY
0 II
R -O -C -O- ALKYLCARBONATO
F, C1 , Br, I HALOGEN
- CN CYANO
- NO2 NITRO
R2N - AMINO R MAY BE H
Fig. 4-Common terminal groups of mesogenic compound of Structure 1.
behavior is observed (i.e., the S -N, S -I, N -i, S -Ch, and Ch -I transi- tions). Thermal stability is not to be confused with the mesomorphic range, which is the difference between the isotropic transition and melting temperatures.
For a mesophase to obtain, it is generally necessary that the ter- minal groups of the molecules contain permanent dipoles. For example, the N -I transition of 4-octyloxybenzoic acid" is some 40° higher than that of 4-nonylbenzoic acid" despite the essentially equivalent size of the two molecules. Similarly, the 4-alkoxy-4'-cyanobiphenyls form substantially more stable mesophases than 4-alkyl-4'-cyanobiphenyls." Polarity of the termini, however, frequently gives rise to very strong intermolecular attractions. In such cases, the melting points of the compound may be raised so high that the mesophase cannot survive.
98 RCA Review Vol. 35 March 1974
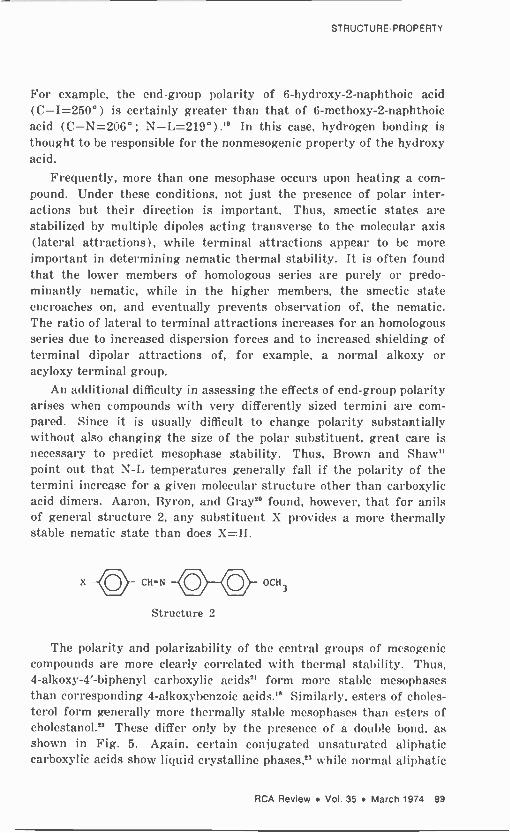
STRUCTURE -PROPERTY
For example, the end -group polarity of 6-hydroxy-2-naphthoic acid (C-I=250°) is certainly greater than that of G-methoxy-2-naphthoic acid (C-N=206°; N-L=219°).1° In this case, hydrogen bonding is
thought to be responsible for the nonmesogenic property of the hydroxy acid.
Frequently, more than one mesophase occurs upon heating a com- pound. Under these conditions, not just the presence of polar inter- actions but their direction is important. Thus, smectic states are stabilized by multiple dipoles acting transverse to the molecular axis (lateral attractions), while terminal attractions appear to be more important i determining nematic thermal stability. It is often found that the lower members of homologous series are purely or predo- minantly nematic, while in the higher members, the smectic state encroaches on, and eventually prevents observation of. the nematic. The ratio of lateral to terminal attractions increases for an homologous series due to increased dispersion forces and to increased shielding of terminal dipolar attractions of, for example, a normal alkoxy or acyloxy terminal group.
An additional difficulty in assessing the effects of end -group polarity arises when compounds with very differently sized termini are com- pared. Since it is usually difficult to change polarity substantially without also changing the size of the polar substituent, great care is necessary to predict mesophase stability. Thus, Brown and Shaw" point out that N -L temperatures generally fall if the polarity of the termini increase for a gixen molecular structure other than carboxylic acid dieters. Aaron, Byron, and Gray" found, however, that for anils of general structure 2. any substituent X provides a more thermally stable nematic state than does X=11.
- CH=N O O Structure 2
0Cu3
The polarity and polarizahility of the central groups of mcsogenic compounds are more clearly correlated with thermal stability. Thus. 4-alkoxy-4'-biphenyl carboxylic acids" form more stable mesophases than corresponding 4-alkoxyhenzoic acids.' Similarly. esters of choles- terol form generally more thermally stable mesophases than esters of cholestanol." These differ only by the presence of a double bond, as shown in Fig. 5. Again, certain conjugated unsaturated aliphatic carboxylic acids show liquid crystalline phases," while normal aliphatic
RCA Review Vol. 35 March 1974 93

acids are not mesogenic. For compounds based on central linkages that allow approximate linearity, such as azo or azomethine, mesophase thermal stability generally increases with increasing polarity or polar- izability of the central linkage. Thus, N,N'-diarylazo nematogens clear some 9° higher than corresponding Schiff bases."a Oxidation of both classes of compounds (to azoxy and nitrone, respectively) raises the N -L points by substantial amounts.
HO
CHOLESTEROL
EPICHOLESTANOL
HO H
HO
H
CH3 R
H
CHOLESTANOL
CAPROSTANOL
Fig. 5-Ring structures for steroid derivatives discussed in text.
When the central linkage does not provide a linear molecule, how- ever, mesophase stability suffers. 11lesophases exhibited by derivatives of phenyl benzoate, for example, are generally some 35° less stable than those of correspondingly substituted azobenzenes.29 The effect of linearity, or at least planarity, of molecules on mesophase stability is further evidenced on comparison of trans-4-alkoxycinnamic acids" and trans-stilbenes2° with their corresponding cis isomers, which demon- strates that severely nonlinear molecules shoe no mesomorphic prop- erties. Again, derivatives of epicholestanol22 and caprostanol (Fig. 5) are not known to be mesogenic.
The geometrical anisotropy of mesogenic compounds is certainly their most obvious common feature. Since lateral attractions play an important role in mesophase formation and stability, the effect of molecular breadth has been studied rather extensively. Generally, smectic states suffer more from molecular broadening than do nematics.
100 RCA Review Vol. 35 March 1974
STRUCTURE -PROPERTY
Of course, when a substituent is added that changes both molecular breadth and dipole attractions, a balancing of forces is observed, as in the 5-substituted-ti-alkoxy-2-naphthoic acids'° where broadening is partially attenuated due to molecular geometry. Even mole unusual is the effect of addition of a 3 -nitro group to 4 -amino -4' nitro-p- terphenyl which causes liquid crystallinity by changing terminal -group interactions.27 A similar effect is known for stilbene derivatives" and several examples of Schiff bases exhibiting increased nematic thermal stability as a result of 2 -hydroxylation have been reported.29 By com- paring the thermal stabilities of the cholesteric phase of 2-, 4-, and 2,
4 -substituted benzoate esters of cholesterol, a marked effect of broaden- ing is seen.R2'30 This is perhaps surprising considering the size and conformations of these compounds.
As the previous discussion has indicated. despite the intuitive feel- ing that mesophase thermal stability should he correlated with chemical structure, the correlations are less than crystal clear. When large changes are made in the structure of a molecule in order to study polar effects, for example. other changes frequently occur that reinforce or counterbalance the particular effect under study. Even so small a
change as reversing the termini of 4.4'-disubstituted benzylideneani- lines causes some drastic changes in melting behavior.2''"
Homologous Series
One of the more common types of recent investigation into structure - property relationships has been the synthesis of groups of molecules differing from one another only by the number of methylene groups in a terminal substituent. There appear to be two principal motiva- tions for this type of study. First, the search for technologically use- ful liquid crystals is usually directed toward materials of specific nematic temperature ranges. The present lack of ability to predict such ranges, coupled with the usual availability of general syntheses for homologous series, often makes this type of investigation fruitful. To date, few, if any, pure liquid crystals have been found that are usable in display applications. Thus, all device manufacturing utilizes mixtures of mesogenic compounds. In many cases, these mixtures are based on homologous series in order to obtain eutectic mixtures or to guard against deleterious effects of material instabilities such as Schiff base trans-substitution.'2
The second reason for studying homologous series is more funda- mental. Most structure -property studies involving changes in polarity of groups, polarizability, and molecular geometry, require substantial
RCA Review Vol. 35 March 1974 101

differences to be present among a collection of compounds. It is true, for example, that a methyl, a cyano, and a nitro terminal group impart very different polarity to a given molecule. The fact that these groups are also quite different in size and shape, however, makes interpreta- tion of structural effects difficult. In proceeding along an homologous series, only very small changes are made at each step. It is thus hoped that more specific conclusions would he possible when the effects on mesophase behavior are correlated with molecular size and shape.
It was Gray who first recognized10 that if the temperatures of a mesophase-to-isotropic transition were plotted against the length of the hydrocarbon chain being homologated, a smooth curve could be drawn through the points. The same seemed true for mesophase-to- mesophase transition temperatures. Of some seventy series available at that time, seven general types of curves were found that could be used to correlate all of the series. The curves differ from one another in significant ways but some general conclusions are possible as enume- rated below. It should be noted that subsequently reported homologous series" also can be correlated by one or another of the general curves of Gray, although, again, substantial differences in detail of the fit among series that fit the same curve type are seen.
(1) The mesophase-to-isotropic transition temperature usually falls with increasing chain length. A few exceptions to this rule are known among compounds containing a biphenyl moiety which, due to substitution, is restricted from adopting a coplanar conformation. When the two aromatic nuclei are not coplanar, it is possible for the termini of one molecule to interact strongly with one of the rings of another molecule, causing additional attractions and a more thermally stable nematic state as the terminus grows in length. A similar argu- ment has been proposed for the appearance of mesomorphism in cer- tain Schiff bases."
(2) When more than one mesophase is possible, the smectic state increases in thermal stability, at the expense of the nematic or choles- teric phase, as chain length increases. It is often seen that, while the lower homologues are purely nematic, the higher are purely smectic and the intermediate homologues exhibit both mesophases.
(3) Single smooth curves are usually not available to fit all of the points. It is most often found that transition temperatures for compounds with an odd number of carbon atoms in the chain are correlated by one smooth curve, while homologues with even numbers of carbon atoms fit another smooth curve. The transition temperature difference between adjacent odd and even members of the series may be only a few degrees or several tens of degrees depending on the
102 RCA Review Vol. 35 March 1974

STRUCTURE -PROPERTY
particular series and the length of the chain. The odd and even curves frequently converge at chain lengths of 8-10 carbon atoms but this is not a necessary condition. This so-called "odd -even effect" is usually justified in terms of a variation in conformation and, there- fore, attractive forces as the methylene chain grows.
Summary
Organic compounds that form mesophases upon melting are charac- terized by being long, narrow, linear molecules. Both permanent dipoles and polarizable moieties are required. The thermal stability of the mesophase or mesophases formed depends in large measure on subtle structural, steric, and electronic effects in the central and ter- minal groups. Structure -property relationships have been investigated by systematic variation in polarity, polarizability, molecular size, and nature of the central linkage and termini. Some general principles have evolved hut the field must not yet be considered fully understood.
References:
1 F. Reinitzer, Monatsh., Vol. 9, p. 421 (1888). 2 F. Reinitzer, Ann. Physik., Vol. 27, p. 213 (1908). 7 O. Lehmann, Ber., Vol. 41, p. 3774 (1908). " G. H. Heilmeier, L. A. Zanoni, and L. A. Barton, "Dynamic Scattering: A New Electro - optic Effect in Certain Classes of Nematic Liquid Crystals," Proc. IEEE, Vol. 56, p. 1162 (1968).
G. H. Heilmeier, J. A. Castellano, and L. A. Zanoni, Mot. Cryst. Liq. Cryst-, Vol. 8, p. 293 (1969).
G. H. Heilmeier and J. E. Goldmacher, "A New Electric Field Controlled Reflective Optical Storage Effect in Mixed Liquid Crystal Systems," Proc. IEEE, Vol. 57, p. 34 (1969).
G. H. Heilmeier and J. E. Goldmacher, "Electric -Field -Induced Cholesteric-Nematic Phase Change in Liquid Crystals," J. Chem. Phys., Vol. 51. p. 1258 (1969). 6 M. Schadt and W. Helfrich, "Voltage Dependent Optical Activity of a Twisted Nematic Liquid Crystal," Appl. Phys. Lett., Vol. 18, p. 127 (1971). 9 F. J. Kahn, "IR -Laser -Addressed Thermo -Optic Smectic Liquid Crystal Storage Dis- plays," Appl. Phys. Lett., Vol. 22, p. 111 (1973). 1O G. W. Gray, Molecular Structure and the Properties of Liquid Crystals, Academic Press, N. Y., N. Y. (1962). 11 G. H. Brown and W. G. Shaw, "The Mesomorphic State Liquid Crystals," Chem. Rev., Vol. 57, p. 1049 (1957). 12 A. Saupe, "Recent Results in the Field of Liquid Crystals," Angew. Chem. (Inter- national Ed. in English), Vol. 7, p. 97 (1968). 13 G. H. Brown, J. W. Doane, and V. D. Neff, A Review of the Structure and Physical Properties of Liquid Crystals, CRC Press, Cleveland, Ohio (1971).
" J. A. Castellano, "Liquid Crystals for Electro -Optical Application," RCA Rev., Vol. 33, p. 296 (1972); L. T. Creagh, "Nematic Liquid Crystal Materials for Displays," Proc. IEEE, Vol. 61, p. 814 (1973). 15 See, e.g., P.. S. Porter and J. F. Johnson, Eds., Ordered Fluids and Liquid Crystals, Amer. Chem. Soc., Wash., D.C. (1967); G. H. Brown, 3. J. Diene, and M. M. Labes, Eds., Liquid Crystals, Gordon and Breach, N. Y., N. Y. (1966); J. F. Johnson and R. S. Porter, Eds., Liquid Crystals and Ordered Fluids, Plenum Press, N. Y., N. Y. (1970). 16 G. W. Gray and B. Jones, "The Mesomorphic Transition Points of the p-n-Alkoxy- benzoic Acids," J. Chem. Soc., p. 4179, Part IV 1953.
RCA Review Vol. 35 March 1974 103

17 C. Weygand and R. Gabler, Z. Phys. Chem. (Leipzig), Vol. 46B, p. 270 (1940). 1° G. W. Gray, K. J. Harrison, and T. W. Nash, Abstracts of the 166th Natl. Meeting of the A.C.S., Chicago, 1973, (Abstract Coll -142). 19 G. W. Gray and B. Jones, "Mesomorphism and Chemical Constitution. Part IV," J. Chem. Soc., p. 236, Part 11955. 20 See Ref. (10), p. 183. 21 G. W. Gray, B. Jones, and F. Marson, "Mesomorphism and Chemical Constitution. Part VIII." J. Chem. Soc., p. 393, Part 11957. 22 C. Wiegand, Z. Naturforsch, Vol. 4b, p. 249 (1949). 23 W. Maier and K. Markau, Z. Phys. Chem. (Frankfort), Vol. 28, p. 190 (1961). 24 L. K. Knaak, H. M. Rosenberg, M. P. Serve, "Estimation of Nematic-Isotropic Points of Nematic Liquid Crystals," Mol. Cryst. Liq. Cryst., Vol. 17, p. 171 (1972). 25 G. W. Gray and B. Jones, "Mesomorphism and Chemical Constitution. Part II," J. Chem. Soc., p. 1467, Part 11 1954. 26 W. R. Young, A. Aviram, and R. J. Cox, Angew. Chem. (International Ed. in English), Vol. 10, p. 410 (1971) and references therein. 27 P. Culling, G. W. Gray, and D. Lewis, "Mesomorphism and Polymorphism in Simple Derivatives of p-Terphenyl," J. Chem. Soc., p. 2699 (1960). ZO R. J. Cox, "Liquid Crystal Properties of Methyl Substituted Stilbenes," Mol. Cryst. Liq. Cryst., Vol. 19, p. 111 (1972). Z9 I. Teucher, C. M. Paleos. and M. M. Labes, "Properties of Structurally Stabilized Anil - Type Nematic Liquid Crystals," Mol. Cryst. Liq. Cryst., Vol. 11, p. 187 (1970). JO See Ref. (10), p. 194. J1 H. M. Rosenberg and R. A. Champa, "The Effect on Thermal Nematic Stability of Schiff's Bases Upon Reversal of Terminal Substituents," Mol. Cryst. Liq. Cryst., Vol. 11, p. 191 (1970). 32 H. Sorkin and A. Denny, "Equilibrium Properties of Schiff -Base Liquid -Crystal Mix- tures," RCA Rev., Vol. 34, p. 308 (1973). 37 See, e.g., the following papers in Mol. Cryst. Liq. Cryst.: J. A. Castellano, M. T. McCaffrey, and J. E. Goldmacher, "Nematic Materials Derived from p-Alkylcarbonato-p- Alkoxyphenyl Benzoates," Vol. 12, p. 345 (1971); R. D. Ennulat and A. J. Brown, "Meso- morphism of Homologous Series," Vol. 12, p. 367 (1971); G. W. Gray and K. J. Harrison, Vol. 13, p. 37 (1971); M. J. Ratuse and R. A. Sorel, "Carbonate Schiff Base Nematic Liquid Crystals: Synthesis and Electro -optic Properties," Vol. 18, p. 95 (1972); M. T. McCaffrey and J. A. Castellano, "The Mesomorphic Behavior of Homologous p-Alkoxy- p'-Acyloxyazoxybenzenes," Vol. 18, p. 209 (1972); and C. S. Oh, "The Effect of Hetero- cyclic Nitrogen on the Mesomorphic Behavior of 4-Alkoxybenzylidene-2'-alkoxy-5'- aminopyridenes," Vol. 19, p.95 (1972). J4 V. I. Mlnkin, Y. A. Zhdanov, E. A. Madyantzeva, and Y. A. Ostroumov, "The Problem of Acoplanarity of Aromatic Azomethines," Tetrahedron. Vol. 23, p. 3651 (1967); also more recent calculations by H. B. Burgi and J. D. Dunitz, "Molecular Conformity of Benzylideneanilines," Rely. Chim. Acta, Vol. 54, p. 1255 (1971).
i
104 RCA Review Vol. 35 March 1974
Introduction to the Molecular Theory of Nematic Liquid Crystals
Peter J. Wojtowicz
RCA Laboratories, Princeton, N.J. 08540
Abstract-This lecture presents a simple phenomenologically derived theory of the nematic liquid crystal phase. The problem is treated as an order -disorder phenomenon, the symmetry and structure of the nematic state being used to identify the natural order parameter. The statistical mechanics is performed in the mean field approximation. The thermo- dynamics of the nematic phase and its transformation to the isotropic liquid are computed. The theory is compared to previous calculations and is also found to be in qualitative agreement with experiment.
1. Introduction
In this lecture we consider the very simplest approach to the molecular theory of liquid crystals. We shall approach the theory phenome- nologically, treating the problem of the existence of the nematic phase as an order -disorder phenomenon. Using the observed symmetry of the nematic phase we shall identify an order parameter and then attempt to find an expression for the orientational potential energy of a molecule in the nematic liquid in terms of this order parameter. Such an expression is easily found in the mean field approximation. Once this is accomplished, expressions for the orientational molecular distribution function are derived and the thermodynamic functions simply calculated. The character of the transformation from nematic liquid crystal to isotropic fluid is then revealed by the theory, and the nature of the fluctuations near the transition temperature can be explored.
RCA Review Vol. 35 March 1974 105
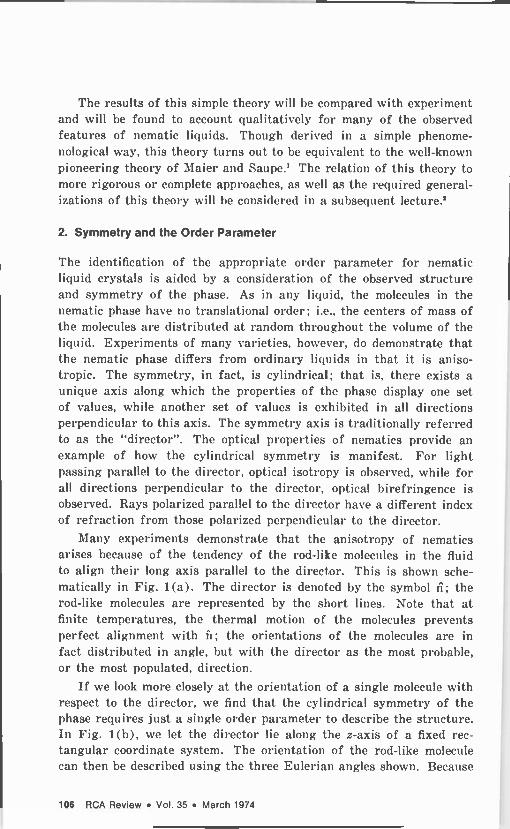
The results of this simple theory will be compared with experiment and will be found to account qualitatively for many of the observed features of nematic liquids. Though derived in a simple phenome- nological way, this theory turns out to be equivalent to the well-known pioneering theory of Maier and Saupe.' The relation of this theory to more rigorous or complete approaches, as well as the required general- izations of this theory will be considered in a subsequent lecture.2
2. Symmetry and the Order Parameter
The identification of the appropriate order parameter for nematic liquid crystals is aided by a consideration of the observed structure and symmetry of the phase. As in any liquid, the molecules in the nematic phase have no translational order; i.e., the centers of mass of the molecules are distributed at random throughout the volume of the liquid. Experiments of many varieties, however, do demonstrate that the nematic phase differs from ordinary liquids in that it is aniso- tropic. The symmetry, in fact, is cylindrical; that is, there exists a unique axis along which the properties of the phase display one set of values, while another set of values is exhibited in all directions perpendicular to this axis. The symmetry axis is traditionally referred to as the "director". The optical properties of nematics provide an example of how the cylindrical symmetry is manifest. For light passing parallel to the director, optical isotropy is observed, while for all directions perpendicular to the director, optical birefringence is observed. Rays polarized parallel to the director have a different index of refraction from those polarized perpendicular to the director.
Many experiments demonstrate that the anisotropy of nematics arises because of the tendency of the rod -like molecules in the fluid to align their long axis paralle to the director. This is shown sche- matically in Fig. 1(a). The director is denoted by the symbol fi; the rod -like molecules are represented by the short lines. Note that at finite temperatures, the thermal motion of the molecules prevents perfect alignment with fi ; the orientations of the molecules are in fact distributed in angle, but with the director as the most probable. or the most populated, direction.
If we look more closely at the orientation of a single molecule with respect to the director, we find that the cylindrical symmetry of the phase requires just a single order parameter to describe the structure. In Fig. 1(h), we let the director lie along the z-axis of a fixed rec- tangular coordinate system. The orientation of the rod -like molecule can then be described using the three Eulerian angles shown. Because
106 RCA Review Vol. 35 March 1974
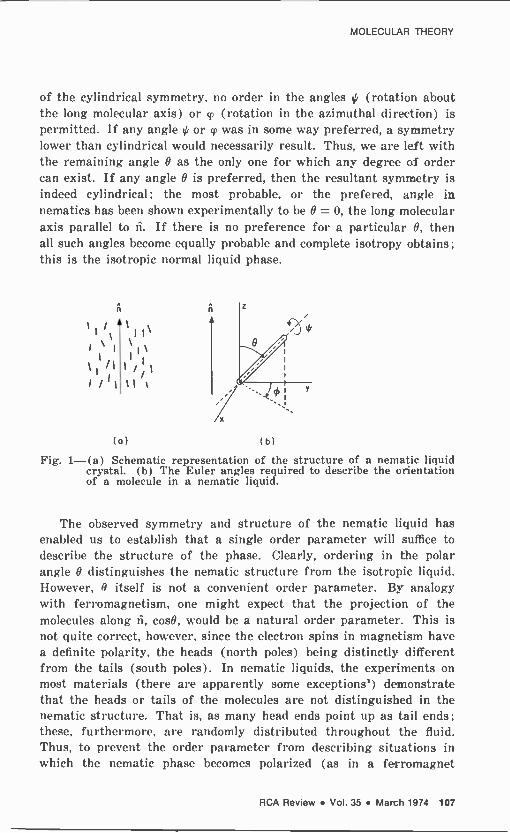
MOLECULAR THEORY
of the cylindrical symmetry, no order in the angles W (rotation about the long molecular axis) or cp (rotation in the azimuthal direction) is permitted. If any angle ' or cp was in some way preferred, a symmetry lower than cylindrical would necessarily result. Thus, we are left with the remaining angle 9 as the only one for which any degree of order can exist. If any angle 9 is preferred, then the resultant symmetry is indeed cylindrical; the most probable, or the prefered, angle in nematics has been shown experimentally to be B = 0, the long molecular axis parallel to ii. If there is no preference for a particular 9, then all such angles become equally probable and complete isotropy obtains; this is the isotropic normal liquid phase.
(o) (b)
Fig. 1-(a) Schematic representation of the structure of a nematic liquid crystal. (b) The Euler angles required to describe the orientation of a molecule in a nematic liquid.
The observed symmetry and structure of the nematic liquid has enabled us to establish that a single order parameter will suffice to describe the structure of the phase. Clearly, ordering in the polar angle O distinguishes the nematic structure from the isotropic liquid. However, 0 itself is not a convenient order parameter. By analogy with ferromagnetism, one might expect that the projection of the molecules along ñ, cos9, would be a natural order parameter. This is not quite correct, however, since the electron spins in magnetism have a definite polarity, the heads (north poles) being distinctly' different from the tails (south poles). In nematic liquids, the experiments on most materials (there are apparently some exceptions') demonstrate that the heads or tails of the molecules are not distinguished in the nematic structure. That is, as many head ends point up as tail ends; these, furthermore, are randomly distributed throughout the fluid. Thus, to prevent the order parameter from describing situations in which the nematic phase becomes polarized (as in a ferromagnet
RCA Review Vol. 35 March 1974 107
polarized with north poles up) we will use cos20 rather than cos° to describe the structure. But now we must realize that it is not the instantaneous value of cos28 for a given molecule that we need. Rather, we desire the average value of cos20, < cos20 >, averaged over all molecules in the liquid. When all the molecules are fully aligned with ñ, all O = 0 and < cos20 > = 1. On the other hand, if the molecules are randomly distributed in direction, all values of O are equally likely and < cos20 > = 1/3.
By tradition, the order parameter in any order-disorder problem is always taken such that it is unity in the perfectly ordered phase and vanishes for the completely disordered phase. Examination of the average values described above shows that the proper order parameter for the nematic liquid crystal is
1
<P2>=-(3<cos2°>-1). 2
[1]
Clearly, < P_ > = 1 for the completely ordered nematic phase and < P2 > = 0 for the disordered isotropic phase. The symbol < P2 > is used for the order parameter because we recognize the particular com- bination in Eq. [1] to be the second -order Legendre polynominal, P2(cos°) = (3cos20 - 1)/2. We will continue to use this symbol in this lecture and in the next' for its clarity when considering generaliza- tions to the present theory. In the original theory' as well as in much of the literature, the symbol S is used to represent < P2 >. Values of < P2 > between 0 and 1 describe degrees of ordering intermediate between completely isotropic and completely ordered. It is the task of order-disorder theory to (a) determine the temperature dependence of < P., >, (b) calculate the thermodynamic and other properties in terms of < P2 >, and (c) demonstrate the precise way in which the transformation from finite < P2 > to zero order occurs. We will now examine these questions.
3. The Molecular Potential
The stability of the nematic lequid crystal results from interactions between the constituent molecules. Without going into their nature at this time, it is clear that there must exist interactions that cause the molecules to prefer to align parallel to each other (and to the mean direction of alignment, the director). In the spirit of the mean field aproximation, we can attempt to mimic these intermolecular interactions with an effective single -molecule potential function V.
108 RCA Review Vol. 35 March 1974
MOLECULAR THEORY
The potental V must have the correct orientation dependence; that is,
it should be a minimum when the molecule is parallel to the director (parallel to the average direction of all the other molecules it interacts with) and a maximum when the molecule is perpendicular to this preferred condition. As we have seen above, the angular dependence of -P_(cos 9) = -(3 cost B - 1)/2 is sufficient for this purpose. The potential V representing the field of intermolecular interaction forces should, furthermore, be a minimum when the phase is highly ordered and should vanish when the phase becomes disordered. Thus. V should be proportional to the degree of order, < P. >. Finally, V should contain a factor v to describe the overall strength of the intermolecular interactions; the differences between various materials will be ac-
counted for by allowing the strength y to vary from one substance to another. Putting all the above together we arrive at mean field
approximation to the orientational potential energy function of a
single molecule:
V(cos 9) =-vP2(cos9) <P_>. [2]
By mean field approximation we mean that the interactions between individual molecules are represented by a potential of average force, ignoring the fact that the individual behaviors and interactions of molecules can be widely distributed about the average. This theory therefore ignores fluctuations in the short-range order (mutual align- ment of two neighboring molecules) ; the results of the theory will
then only be approximate in so far as near -neighbor fluctuation effects have been neglected in the derivation of V, as well as in subsequent calculations. The strengths and weaknesses of the mean field approxi- mation are particularly well documented in the case of magnetism;° similar considerations will apply to the case of nematic liquid crystals.
4. The Orientational Distribution Function
Having derived an approximate expression for the potential energy of a single molecule in the nematic phase, we can now obtain the orienta- tional distribution function. This function, which shall be denoted by p(cos 9), describes how the molecules are distributed among the possible directions about the director; it gives the probability of find- ing a molecule at some prescribed angle O from ti. With this function we can compute the average alues of various quantities of interest pertaining to the nematic phase.
The rules of classical statistical mechanics give the orientational distribution function in terms of the potential function V as:
RCA Review Vol. 35 March 1974 109
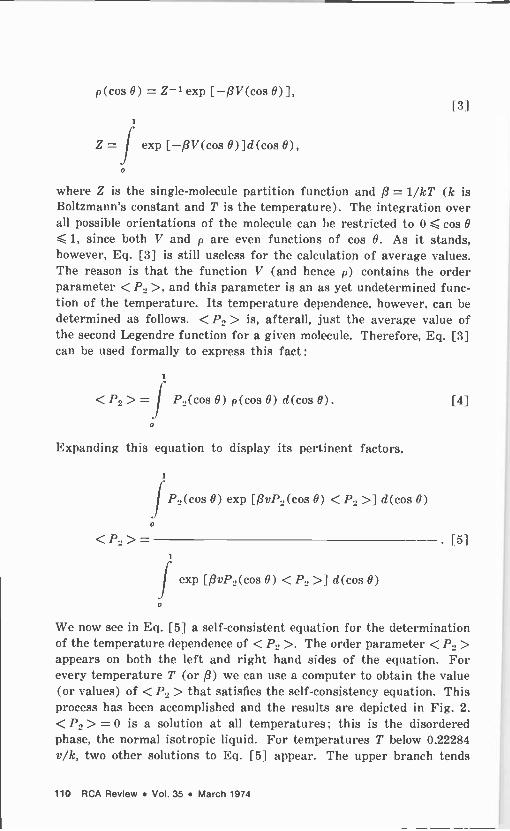
p(cos 9) = Z-1 exp [-/3V(cos 0)1, [3]
i
Z = exp [-f3V(cos 0)]d(cos 0),
o
where Z is the single -molecule partition function and R = 1/k?' (k is Boltzmann's constant and T is the temperature). The integration over all possible orientations of the molecule can he restricted to 0 S cos O
S 1, since both V and p are even functions of cos 0. As it stands, however, Eq. [31 is still useless for the calculation of average values. The reason is that the function V (and hence p) contains the order parameter < P, >, and this parameter is an as yet undetermined func- tion of the temperature. Its temperature dependence, however, can be determined as follows. < P_ > is, afterall, just the average value of the second Legendre function for a given molecule. Therefore, Eq. [3] can be used formally to express this fact:
1
< P2 > = I P0(cos 0) p(cos 0) d(cos 0).
0
Expanding this equation to display its pertinent factors,
/ P2(cos 9) exp [pvP.,(cos 0) < P. >] d(cos 9)
1
iexp [/3v1'2(cos 0) < P, >] d(cos 9)
o
[4]
. [5]
We now see in Eq. [5] a self -consistent equation for the determination of the temperature dependence of < P, >. The order parameter < P_ > appears on both the left and right hand sides of the equation. For every temperature T (or (3) we can use a computer to obtain the value (or values) of < P2 > that satisfies the self -consistency equation. This process has been accomplished and the results are depicted in Fig. 2.
< P_ > = 0 is a solution at all temperatures; this is the disordered phase, the normal isotropic liquid. For temperatures T below 0.22284 v/k, two other solutions to Eq. [5 j appear. The upper branch tends
110 RCA Review Vol. 35 March 1974

MOLECULAR THEORY
to unity at absolute zero and represents the nematic phase, i.e., all molecules trying to align with the director. The lower branch tends to -1/2 at absolute zero and represents a phase in which the molecules attempt to line up perpendicular to the director without azimuthal order. This phase also has cylindrical symmetry but has not yet been seen experimentally. That it ever will is rather unlikely, since we will see later on that it is unstable with respect to the parallel -aligned nematic phase. In the temperature range where Eq. [5] provides three solu- tions, we require a criterion to determine which one of the three possi- bilities actually exists. The laws of thermodynamics provide that the observed solution, the stable phase, will be that one having the minimum free energy.
1.2
10
e
6
4
(P2%
or -
-2r
----------------
Te = 0.22019
0 .02 04 06 08 .10 J2 14, 16 1,8 .20 .22 .24 kT/v
Fig. 2-Temperature dependence of the order parameter obtained from solving the self -consistency Equation, Eq. [5]. The stable equilib- rium solutions are shown as the solid lines.
5. Thermodynamics of the Nematic Phase
The derivation of the free energy from the orientational distribution function is straightforward. The free energy F is given by E -TS, where E is the internal energy and S the entropy. The energy is com- puted by taking the average value of the potential,
1 1
E _ -N < V > _ -N / V(cos B) p(cos B) d (cos 0). [6] 2 2
o
RCA Review Vol. 35 March 1974 111

The factor N comes in because we are dealing with a system of N molecules. The factor 1/2 is required to avoid counting intermolecular interactions twice (pair interactions have been approximated by a single molecule potential V). The entropy is computed by taking the average value of the logarithm of the distribution function:
N S=-Nk<1np>=-<V>+NklnZ,
T [7]
where the quantities on the extereme right hand side have been defined in Eqs. [6] and [3]. Combining Eqs. [6] and [7],
1
F=-NkTln7,--N<V>. 2
[8]
At first sight this equation seems unusual with the presence of the second term. The necessity for its existance can be verified im- mediately in two ways. If we take the derivative (aF/a < P_ >) r and set it equal to zero we regain Eq. [5], the self consistency equa- tion for < P2 >. Thus, as required by thermodynamics, the self - consistent solutions to our problem must be those that represent the extrema of the free energy. Another verification of the correctness of Eq. [8] comes from forming the derivative [dpF/d/3]. Again, as required by thermodynamics, Eq. [6] for the internal energy results. The reason for the appearance of the second term in Eq. [8] is the replacement of pair interactions by temperature -dependent single molecule potentials.'
The free energy for each of the three branches of the order para- meter, Fig. 2. is computed from Eq. [8] by successive substitution of the three different values of < Po > for each T. The free energy for the < P_ > = 0 branch is constant with T and equal to zero. The free energy of the negative < Po > branch is negative but small in mag- nitude. The free energy for the positive < P, > branch is negative (with magnitude larger than that for the negative < P2 > hranch) up to a temperature of 0.22019 v/k. The remainder of the positive < Pa > branch has positive values of F. Thus the stable phases to be observed are as follows: from T = 0 to T = 0.22019 v/k the nematic phase is stable. The order parameter decreases from unity to a minimum value of 0.4289 at T = 0.22019 v/k. For temperatures above 0.22019 v/k the isotropic phase with vanishing order parameter is stable (the stable phases are shown as the solid lines in Fig. 2). At To= 0.22019 v/k we
112 RCA Review Vol. 35 March 1974
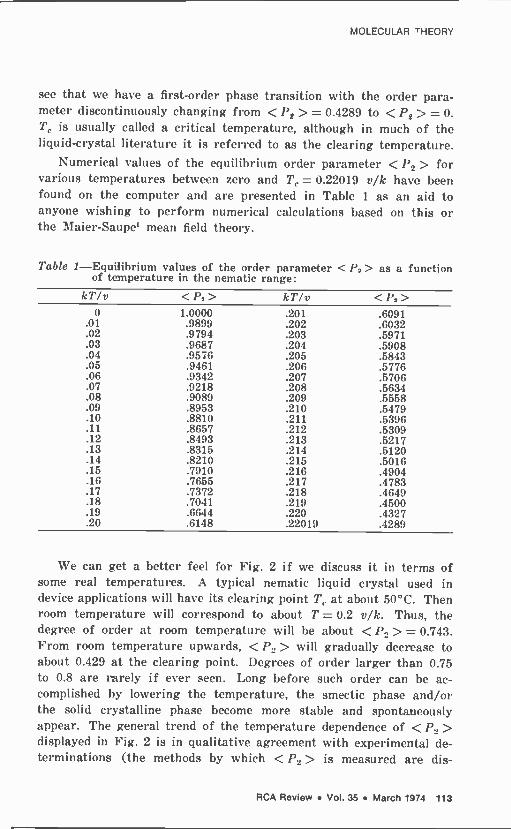
MOLECULAR THEORY
see that we have a first -order phase transition with the order para- meter discontinuously changing from <P, > = 0.4289 to <P, > = 0. T, is usually called a critical temperature, although in much of the liquid -crystal literature it is referred to as the clearing temperature.
Numerical values of the equilibrium order parameter < P2 > for various temperatures between zero and Tc = 0.22019 v/k have been found on the computer and are presented in Table 1 as an aid to anyone wishing to perform numerical calculations based on this or the Maier-Saupe' mean field theory.
Table 1 -Equilibrium values of the order parameter < P2> as a function of temperature in the nematic range:
kT/v < P. > kT/v < P_ > 0 1.0000 .201 .6091
.01 .9899 .202 .6032
.02 .9794 .203 .5971
.03 .9687 .204 .5908
.04 .9576 .205 .5843
.05 .9461 .206 .5776
.06 .9342 .207 .5706
.07 .9218 .208 .5634
.08 .9089 .209 .5558
.09 .8953 .210 .5479
.10 .8810 .211 .5396
.11 .8657 .212 .5309
.12 .8493 .213 .5217
.13 .8315 .214 .5120 .14 .8210 .215 .5016 .15 .7910 .216 .4904 .16 .7655 .217 .4783 .17 .7372 .218 .4649 .18 .7011 .219 .4500 .19 .6644 .220 .4327 .20 .6148 .22019 .4289
We can get a better feel for Fig. 2 if we discuss it in terms of some real temperatures. A typical nematic liquid crystal used in device applications will have its clearing point T, at about 50°C. Then room temperature will correspond to about T = 0.2 v/k. Thus, the degree of order at room temperature will be about < Po > = 0.743. From room temperature upwards, < P..> will gradually decrease to about 0.429 at the clearing point. Degrees of order larger than 0.75 to 0.8 are rarely if ever seen. Long before such order can be ac- complished by lowering the temperature, the smectic phase and/or the solid crystalline phase become more stable and spontaneously appear. The general trend of the temperature dependence of <P, > displayed in Fig. 2 is in qualitative agreement with experimental de- terminations (the methods by which < P., > is measured are dis-
RCA Review Vol. 35 March 1974 113

cussed by E. B. Priestley in a separate lecture in this series). A more detailed comparison for several real materials is deferred to the next lecture.'
The first -order phase transition at T is very much like the phase transition corresponding to the melting of a solid into its liquid phase. That is, discontinuities in the volume, the internal energy (latent heat), and the entropy of the system are observed. The present theory can- not account for the small volume changes seen at Tc, since no distance (volume) dependence of the potential V was assumed. We have neglected this aspect in the present exercise, since the volume changes actually observed over the short nematic ranges of most materials are not very significant; theories that include the volume dependence are available in the literature.'''
The latent heat of the transition from nematic to isotropic liquid can he calculated from Eq. [6] and the fact that < P_ > changes from 0.4289 to zero at T0:
2 E (Tr.) = 0.830 T° cal 'mol. [9]
The entropy of the transition can be computed from the formula _SS = ,E/TC so that
.1S(Tc) = 0.830 cal/mol°K. [10]
The entropy change is a measure of the change in order at Tr and conveniently comes out of the theory as a number without any para- meters to be found or adjusted. First, we note that this is a very small entropy change. Typical entropy changes for solid to liquid transitions of similar organic materials run around 25 cal/mol°K. Thus, the nematic phase at T, contains only a very slight amount of order, certainly a lot less than a crystalline solid. The smallness of S(Te) is, of course, in keeping with the fact that the nematic phase possesses order in only a single degree of freedom, the O angle of the indiN idual molecules. Secondly, we can compare Eq. [10] with some experimental results; the agreement is quite satisfactory for such a simple theory. As an example,' the series of homologous 4,4'-d-n-alkoxyazoxyhenzenes from methyl to decyl displays entropy changes in the range from 0.3
to 1.9 cal/mol°K, with most values being around 0.6 to 0.8.
The results obtained here and in the previous several sections are completely equivalent to the mean field theory derived by Maier and Saupe;' Eqs. [2]. [3], [5], and [8] are identical to those presented in
this classic series of papers. Their approach is, of course, more systematic than presented here, and the volume dependence of the
114 RCA Review Vol. 35 March 1974
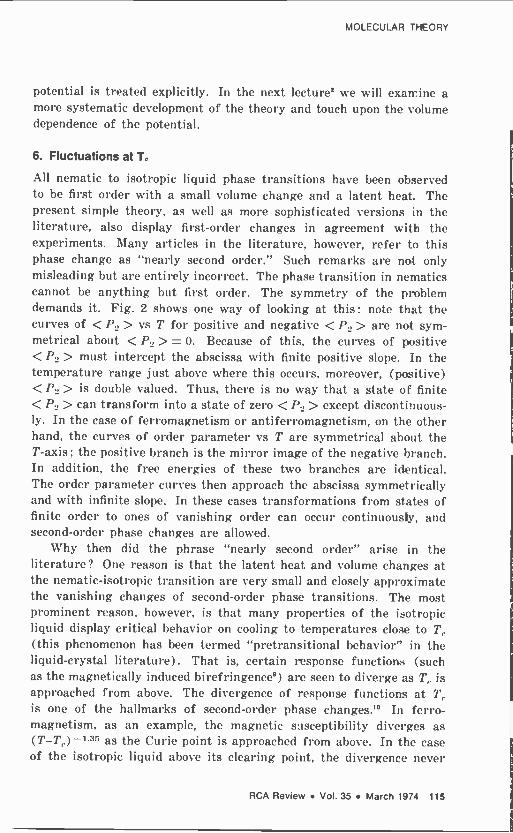
MOLECULAR THEORY
potential is treated explicitly. In the next lecture` we will exarrine a more systematic development of the theory and touch upon the volume dependence of the potential.
6. Fluctuations at Te
All nematic to isotropic liquid phase transitions have been observed to be first order with a small volume change and a latent heat. The present simple theory, as well as more sophisticated versions in the literature, also display first -order changes in agreement with the experiments. Many articles in the literature, however, refer to this phase change as "nearly second order." Such remarks are not only misleading but are entirely incorrect. The phase transition in nematics cannot be anything but first order. The symmetry of the problem demands it. Fig. 2 shows one way of looking at this: note that the curves of < P2 > vs T for positive and negative < P, > are not sym- metrical about < I'., > = O. Because of this, the curves of positive < Po > must intercept the abscissa with finite positive slope. In the temperature range ,just above where this occurs, moreover, (positive) < P., > is double valued. Thus, there is no way that a state of finite < P., > can transform into a state of zero < Po > except discontinuous- ly. In the case of ferromagnetism or antiferromagnetism, on the other hand, the curves of order parameter vs T are symmetrical about the T -axis; the positive branch is the mirror image of the negative branch. In addition, the free energies of these two branches are identical. The order parameter curves then appoach the abscissa symmetrically and with infinite slope. In these cases transformations from states of finite order to ones of vanishing order can occur continuously, and second -order phase changes ate allolsed.
Why then did the phrase "nearly second order" arise in the literature? One reason is that the latent heat and volume changes at the nematic-isotropic transition are very small and closely approximate the vanishing changes of second -order phase transitions. The most prominent reason, however, is that many properties of the isotropic liquid display critical behavior on cooling to temperatures close to T,.
(this phenomenon has been termed "pretransitional behavior" in the liquid -crystal literature). That is, certain response functions (such as the magnetically induced birefringence') are seen to diverge as Tr is approached from above. The divergence of response functions at T,.
is one of the hallmarks of second -order phase changes.10 In ferro- magnetism, as an example, the magnetic susceptibility diverges as (T-T,.)-1.35 as the Curie point is approached from above. In the case of the isotropic liquid above its clearing point, the divergence never
RCA Review Vol. 35 March 1974 115

actually occurs; the first -order phase change to the nematic phase
takes place just a few degrees before. Thus the origin of the remark "nearly second order".
Now, critical behavior and the divergence of response functions are not usually seen at first -order phase transitions. No pretransi- tional behavior is observed in any of the properties of a liquid about to freeze into its crystalline solid. Why then is there pretransitional behavior at the nematic-isotropic transition? 1\Iy own feeling is that the responsible factor is the small entropy of transition, _SS, Eq. [10]. The divergence of response functions occur because of the presence of fluctuations. If in a disordered phase a fluctuation occurs such that a
very small region of the material rearranges itself into a locally highly ordered structure, that region will have an enhanced response to some external stimulus; the corresponding response function will therefore increase in magnitude. If the fluctuations occur to a very great extent (as they do when second -order phase transitions are approached) then the response functions diverge. It is the small _SS
for nematics (compared to the ,S of the melting/freezing transition) that permits a substantial amount of fluctuations, giving rise to pre - transitional behavior.
We can make this somewhat more quantitative. According to Landau and Lifshitz," the probability of a fluctuation whose change in entropy (order) is is proportional to exp (is/k) ; here .1s is not the molar entropy of the transition, the of Eq. [10], but the entropy of ordering of a small region of the material. If this small region contains n molecules (which order to a degree normally dis- played by a nematic just at T ), then _Ss can be related to .1S, and the probability of such a fluctuation becomes proportional to
exp (-n_SS/R), [11]
where R is the universal gas constant. The negative sign appears because _Ss describes fluctuations from disordered to ordered states while _SS is concerned with the transition from ordered to disordered phases. Consider now a fluctuation in which ten molecules in the isotropic phase get together and become as ordered as the nematic phase at or near its Tc. We find from Eqs. [10] and [11] that the probability of occurrence of such a fluctuation is proportional to about e-4. For a fluctuation in liquid in which ten molecules get together and become as ordered as the crystalline solid, on the other hand. Eq. [11] plus the observation that SS 25 cal/mol°K give the proba- bility as -e-125. Thus we see that a significant fluctuation in the
116 RCA Review Vol. 35 March 1974
MOLECULAR THEORY
ordering of ten molecules is -e120 more probable just above the iso- tropic-nematic transition than it is just above a typical freezing point. This, then, is why pretransitional behavior is observed in nematics but not in the case of crystalline solids.
References:
W. Maier and A. Saupe, Z. Naturforschg., Vol. 14a, p. 882 (1959) and Vol. 15a, p. 287 (1960). 2 P. J. Wojtowicz, "Generalized Mean Field Theory of Nematic Liquid Crystals," RCA Rev., Vol. 35, No. 1, p. 118 (1974). J R. Williams, "Optical -Rotary Power and Linear Electro -Optic Effect in Nematic Liquid Crystals of p-Azoxyanlsole," J. Chem. Phys., Vol. 50, p. 1324 (1969) and D. Meyerhofer, A. Sussman, and R. Williams, "Electro -Optic and Hydrodynamic Prop- erties of Nematic Liquid Films with Fiee Surfaces," J. Appl. Phys., Vol. 43, p. 3685 (1972). 4 J. S. Smart, Effective Field Theories of Magnetism, W. B. Saunders Co., Philadelphia, Pa. (1966). a E. R. Callen and H. B. Callen, "Anisotropic Magnetization," J. Fhys. Chem. Solids, Vol. 16, p. 310 (1960). 6 S. Chandrasekhar and N. V. Madhusudana, "Molecular Statical Theory of Nematic Liquid Crystals," Acta Cryst., Vol. A27, p. 303 (1971). 7 R. L. Humphries, P. G. James, and G. R. Luckhurst, J. Chem. Soc., Faraday Trans. II, Vol. 68, p. 1031 (1972). e G. H. Brown, J. W. Doane and D. D. Neff, A Review of the Structure and Physical Properties of Liquid Crystals, p. 43, CRC Press, Cleveland, Ohio (1971). c T. W. Stinson and J. D. Litster, "Pretransitional Phenomena in the Isotropic Phase of a Nematic Liquid Crystal," Phys. Rev. Lett., Vol. 25, p. 503 (1970). 10 H. E. Stanley, Introduction to Phase Transitions and Critical Phenomena, Oxford University Press, N.Y., N.Y. (1971).
1 L. D. Landau and E. M. Lifshitz, Statistical Physics, p. 344, Pergamon Press Ltd., London (1958).
RCA Review Vol. 35 March 1974 117

Generalized Mean Field Theory of Nematic Liquid Crystals
Peter J. Wojtowicz
RCA Laboratories, Princeton, N. J. 08540
Abstract-This lecture considers a systematic approach to the molecular theory of nematic liquid crystals. A completely general form of pairwise inter- action potential is assumed and expanded in a series of appropriate spherical harmonics. Averages of the expanded pair potential are taken to obtain a generalized version o` the single -molecule potential functions in the mean field approximation. The results are compared to previous simpler theories and to a variety of experimental observa- tions.
1. Introduction
In the previous lecture' we examined a simple version of the molecular theory of nematic liquid crystals. The problem was treated as an order -disorder phenomenon with the solution based on a phenome- nologically derived single -molecule orientational potential. The results of this development were found to be equivalent to the well known mean field theory of Maier and Saupe.2
In this lecture we will consider a more systematic approach to the molecular theory of the nematic state. In deriving the theory we will follow the development of Humphries, James, and Luckhurst.3 We start with a completely general pairwise intermolecular interaction potential. After expanding in a series of appropriate spherical har- monics we will systematically average the pair -interaction potential to
118 RCA Review Vol. 35 March 1974
MEAN FIELD THEORY
obtain a generalized version of the single -molecule potential function in the mean field approximation. The Maier-Saupe theory= will result from the retention of only the first term in the generalized potential. More general versions of the theory result from the inclusion of higher -order terms. In the final sections of the lecture we will discuss the volume dependence of the interaction potential, examine the rea- sons why higher -order terms in the potential appear to be required. and consider the agreement between the theory and Various experi- ments.
2. The Pair Interaction Potential
The stability of the nematic liquid -crystal phase arises from the existence of strong interactions between pairs of the constituent molecules. As in normal liquids, the potential of interactions will have attractive contributions to provide the cohesion of the fluid, and re- pulsive contributions which pi event the interpenetration of the mole- cules. In the case of the rod -like molecules of nematics, however, these interactions are highly anisotropic. That is, the forces acting between such molecules depend not only on their separation but also, and most importantly, on their mutual orientations. From the symmetry and structure of the nematic phase, we see that the rod -like molecules in fact interact in a manner that favors the parallel alignment of neigh- boring molecules.
A complete understanding of the nature of the intermolecular interactions is not available. The precise mathematical form of the pair potential is not known. In the absence of such detailed informa- tion, we proceed by assuming a perfectly general form for the pair potential and then deriving the theory systematically from it.
Many coordinates are required to describe the orientation dependent interaction between a pair of asymmetric molecules. Fig. 1(a) depicts the situation; in addition to the parameter r which gives the separation of the centers of gravity, we require the three Eulerian angles of each of the two molecules. Since in nematics there appears to be no order- ing of the molecules about their long axes, we can eliminate the angles ¢; by assuming the molecules to be axially symmetric. The angles 0,
and (1); can then be considered as polar angles with the intermolecular vector r as the common polar axis. The intermolecular pair potential V12 is then a function of five coordinates:
V12 = V(r, O. OD B_,, 02). f17
RCA Review Vol. 35 March 1974 119

Pople' has demonstrated a very powerful expansion for the pair potential between axially symmetric molecules:
V12 = 47r UL1L2m(r)YLlm(Br> 1)YLm`(B2, 42)1 [2] L1Lym
where the 17,, (0, 0) are the usual spherical harmonics. For axially symmetric molecules and for the coordinates defined in Fig. 1(a), the potential V1Y really depends only on r, 01, 02, and the combination 1 + 4)2; thus, the appearance of only a single m index in Eq. [2].
II I e,
(o)
4'2
(b)
Fig. 1-The coordinate systems required to describe the interaction between two asymmetric molecules: (a) the intermolecular vector r is the mutual polar axis and (b) the director ñ is the polar axis for each molecule.
This expression is particularly convenient, because (a) it separates the distance and orientation dependencies of the potential and (b) the coefficients of the expansion, the UL1L2m(r), are found" to decrease rapidly with increasing L1 and L2. If the molecules have reflection symmetry (or if we assume that we can neglect the ordering of heads and tails of the molecules), then only terms with even L1 and L2 are required in Eq. [2].
3. The Mean Field Approximation
A rigorous molecular theory of a fluid system based on a pairwise interaction potential as complicated as Eq. [2) is impossibly difficult. A simple but adequate approach is to derive a theory in the mean field approximation. That is, we derive a single molecule potential that serves to orient the molecule along the symmetry axis (the director) of the nematic phase. The single -molecule potential represents (ap- proximately) the mean field of intermolecular forces acting on a given molecule. Mean field theories have been found capable of describing the qualitative behavior of many different cooperative phenomena. The
120 RCA Review Vol. 35 March 1974

MEAN FIELD THEORY
theories are not quantitatively correct, however, since intermolecular short-range order and fluctuation effects are neglected. The properties of mean field theories in the case of magnetism have been described by Smart .°
In order to derive a mean field approximation to the potential, we first have to express V12 in terms of a polar coordinate system based on the director, ii, as the polar axis. The coordinate axes for the molecules 1 and 2 must be rotated from that shown in Fig. 1(a) to that shown in Fig. 1(b). The primed angles now describe the orienta- tions of the molecules with respect to the new rotated coordinate system. Mathematically, the rotation of the coordinate axes transforms the spherical harmonics into the form
YLm (B, Y ) _ DpmLYLp(B', '), [3] /
where the PpmL are the elements of the Wigner rotation matrices.' In the new coordinate system V12 assumes the form
V12 4' r, LUL1L:m(r)YL1p(B1',
<kg YL2q'(B2'+02') (1),,Li)(1),L2)". L,L2m pq
[4]
To obtain the single molecule potential V1 in the mean field ap- proximation, it is necessary to take three successive averages of the function V17. First, we average over all orientations of the inter- molecular vector r. Next, we average V10 over all orientations of molecule 2. Finally, we average V12 over all values of the inter- molecular separation r. The combination of these three averaging processes provides us with the potential energy of a given single molecule as a function of its orientation with respect to the director. This potential energy, moreover, is that experienced by the molecule when subjected to the average force fields of neighboring molecules, each averaged over all its possible positions and orientations-thus the descriptive phrase, "mean field approximation".
The averaging of V12 over all orientations of the intermolecular vector r has an influence only on the Wigner rotation matrices:
< (DpmL,) (I4mL2)* SL1L,2Spg(2L + 1)-1, [5]
where < > denotes the average alue and the SA1 are the usual Kron- icker delta functions. The simple result expressed ill Eq. [5] is valid
RCA Review Vol. 35 March 1974 121
only if the distribution function for the intermolecular vectors is spherically symmetric. Since the symmetry of the nematic phase is cylindrical, this result will only be an approximation. A somewhat different expression obtains if the cylindrical symmetry is taken into account:3 we will return to this point later. Use of Eq. [5] in taking the first average of V gives
< Vis>= ULL,n(r)(2L+1)-IYLp(B1',0r')YLp.,,(0:s02') Linn [g]
The averaging of < V1_ > over all orientations of molecule 2 has influence only on the spherical harmonics in
27 n
< YLp * (°2', 02') > = f YLpT ( B,'. : ) PI (02') s i n 0,'d B_4s',
[7] o o
where pi(0._) is the orientational molecular distribution function that describes how molecule 2 is distributed among all possible directions about the director (this function has been described in the previous lecture' and will be considered further below). Because of the cylindrical symmetry of the nematic phase, pi can be a function only of the polar angle O; no ( dependence is permitted. Then, since pi is not a function of 4,', the ¢2' integrals vanish except for p= 0 and
C
1 + < YLpº:(e-' 4)4)2927, > = Spe <PL.>,
471.
1
< 1'L > = f PL (cos gm (cos 0) d (cos 0),
o
[8]
[9]
where the PL are the Lth order Legendre polynomials and where Eq. [9] is the Lth generalization of < P2 >, the order parameter for the nematic phase (as described in Ref. [1]). Use of Eqs. [8] and [9] in taking the average of < V1_ > yields
«V1_»= ULL,,,(r)PL(cos01') <PL>. Ln,
[10]
The averaging of «V1_» over all values of the intermolecular
122 RCA Review Vol. 35 March 1974
MEAN FIELD THEORY
separation r has influence only on the U(r):
1
«< UL/.m(r)»>=- ULLm(r)n..(r)dr. n
Here n_(r) is the molecular distribution function for the separation of pairs of molecules and n is the number density of molecules in the fluid. Use of Eq. [11] in taking the average of «1:12» gives
«V»_><ULL,(r) >PL(cos01') <PL>. [12] Lm
This is just the desired single -molecule potential in the mean field approximation; we will write it as
Vi (cos0) _ UL < PL > PL(cos 0), [13]
UL = < ULLm (r) > m
where we have dropped the subscript and prime on the 9. Going back to the discussion following Eq. [2], we assume no preference between the heads and tails of the molecules and restrict the L sum in Eq. [13] to even values of L. The L = 0 term, moreover can be discarded, since it is merely an additive constant. The first few terms of Eq. [13] are then
V 1(cos 9) = U, < P2> P_ ( cos 0 ) + U., < P., > P4 ( cos 9 )
+Ua<P>Pa(CosO) + [14]
As shown in Ref. [3], if the true cylindrical symmetry of the distribu- tion function for the orientation of the intermolecular vector were taken into account, terms proportional to
< UL,L._m(r) > (PL, < P/.. > + PL_ < >) [15]
would also appear in the single molecule potential V1. If only the first term in Eq. [14] is retained, we obtain the mean field theory of Maier and Swipe' and the equivalent theory of the previous lecture' (y = -U0). Since the original expansion on which V, is based (Eq. [2] )
converges rapidly, retention of only the first term in V, should provide a good approximation to the theory. Comparison with experiment
RCA Review Vol. 35 March 1974 123

shows that this is indeed the case. The necessity for including higher - order terms is quite apparent in some of the experiments, however, and we will examine this point shortly.
4. Statistical Thermodynamics
As described in the previous lecture,' the orientational distribution function corresponding to the single -molecule potential has the form
Pi (cos B) - Z,-1 exp [-f3V1(cos B)], [16]
Z1 = / exp [-/3V1(cos B) ]d(cos B),
where Z1 is the single molecule partition function and /3 = 1/kT (k is Boltzmann's constant and T the temperature). The integration over all possible orientations of the molecule can be restricted to 0 5 cos O
1, since V1 and pi are even functions of cos 6. Again, as it stands, Eq. [16] is not complete and not yet useful in computing average values. V1 does after all contain the as yet unknown averages, < PL >. The self -consistent determination of the temperature dependence of the < PL > is realized by combining their definition (Eq. [9]) with Eq. [16] :
PL(cosB) exp [-pV1 (cos B)]d(cosB)
o
<PL>- [17] ]
Iexp [-/3171(cos B)]d(cos B)
There is one such self -consistency equation for each term L included in the potential V,, Eq. [13]. In each of these equations one of the < PL > appears on the left-hand side, and all the included < PL > appear in the integrals on the right-hand side. The simultaneous solution of these equations yields the temperature dependence of all the < PL > originally included in the potential V1. In particular, the solution for < P2> gives the temperature dependence of the tradi-
124 RCA Review Vol. 35 March 1974
MEAN FIELD THEORY
tional order parameter of the nematic phase. One of the solutions provided by the set of equations, Eq. [17], is < PL > = 0, all L; this is the isotropic normal liquid. To find which of all the possible solu-
tions is the physically observed stable solution, we must compute the free energy and determine the solution giving the minimum free energy.
The internal energy, entropy, and free energy are obtained in
exactly the same way as computed in the simpler theory of the previous lecture:
1 1
E=-N<V,>=-N UL<I'L>2, J 2 2 i
N S=-Nlc<Inp1> =-'UL<P>2+N1, In Z1, J
T a
1
h'=-NkTInZr--NEUL<PL>2. 2 L
.Just as in the case of the simpler theory,' the free energy is found to include additional terms beyond the usually expected lnZ, term. The form is correct, however, and arises because we have approximated the action of the pair potential V1., by the temperature -dependent single -molecule potential 1'r. Note that setting the partial derivatives (DP -7D < PL >)T, r.r. to zero regains the required self -consistency equations. Eq. 117]. Furthermore, testing Eqs. [18] and [20], we
see that they do satisfy the required thermodynamic identity, E
= (dfF,dp)
5. Nature of the Parameters UL
The main physics of the problem, the character of the intermolecular interactions, is contained in the parameters U,, of the one molecule
potential V,. In spite of their central importance in the theory, how-
ever, not all that much is known about their magnitude or volume
dependence. Several attempts to estimate their properties have been
made, but very little in the way of definitive results has been obtained. What is usually done in practice is to treat the U, as simple volume -
dependent functions with constants determined fitting the theory to experimental results.
The first attempt to elucidate the nature of the intermolecular forces in nematics was performed by Maier and Saupe.2 They did a
RCA Review Vol. 35 March 1974 125

calculation of the London dispersion forces (induced dipole-induced dipole) expected between asymmetric molecules. Since the polariza- bilities of elongated molecules are anisotropic, the interactions involv- ing these polarizabilities must likewise be anisotropic. Indeed, Maier and Saupe found (within their approximations) an attractive inter- action between pair of molecules that led to the form
A Vr --<P_>P,(cosB).
V2 [21]
Thus, U. is determined from these calculations to be of the form -A/V-, where A is a constant to be determined from experiment and V is the mean molecular volume. The particular volume dependence should not be surprising; the potential of dispersion forces (whether between symmetric or asymmetric molecules) is expected to depend on the intermolecular separation as r-6. On the average, then, this translates into the above V-2 dependence.
Chandrasekhar and Madhusudanae have also considered the calcu- lation of the coefficients U,,Teyuired in V,. The first contribution that these authors examined was the permanent dipole-permanent dipole forces. These were shown to vary as r-3 and provided a V-1 de- pendence to U1. It was shown however, that this term vanished when the pair potential Vr_ is averaged over a spherical molecular distribu- tion function. The authors thus discard this term and provide further arguments for its neglect based on the empirical result that permanent dipoles apparently play a minor role in providing the stability of the nematic phase. The second contribution considered was the dispersion forces based on induced dipole-induced dipole interactions and induced dipole-induced quadrupole interactions. As mentioned above, the first of these gives a V-2 dependent contribution, while the second provides a contribution depending on V-8/3. The final contribution considered was the repulsive forces that arise from the mutual impenetrability of the molecules. Assuming (by analogy with the behavior of the better understood, more simple molecules) that the repulsive potential varies as r-12, this mechanism provides a contribution to the Ur, that varies as V-4. All these contributions were then lumped together and an average volume dependence was assumed; the authors chose to allow the Ur, to have a V-2 dependence.
Humphries, .James, and Luckhurst3 in their development of the mean field theory decided to allow each of the U,, to have the same volume dependence, V-7, w here y is a parameter to be determined by
126 RCA Review Vol. 35 March 1974
1
MEAN FIELD THEORY
fitting theory to experiment. The use of an arbitrary parameter y
gives great latitude in reproducing experimental results and much success can be expected. The procedure is, however, dangerous. In the first place, the use of y in the theory provides still another adjust- able parameter; with enough adjustable parameters. of course, any experimental observation can be reproduced (but without learning any physics). Second, the introduction of an arbitrary V-Y dependence can lead to abuses. There is one instance in the literature where experimental data was force fit using a value of y equal to 10. Cer- tainly, we know of no substantial attractive intermolecular potential that varies as strongly as r-30.
Great care should be used in choosing and using various forms for the UL in Eq. [13]. The simplest (and possibly least controversial) procedure is to assume that the lit are simply constants independent of the volume and to restrict the fitting of theory to experiment to a
narrow range of temperature near T. Since the volume changes are small over a short temperature interval, the approximation of constant Ub will be quite adequate and will keep the use of the theory simple and straightforward. The region near Te, moreover, is the most interesting; it is here that < P.,> has its strongest temperature de-
pendence.'
6. The Need for Higher Order Terms in V,
As stated in Sec. 3, the retention of only the first term in Eq. [14] leads to the mean field theory of Maier and Swipe' and the equivalent theory of the previous lecture.' This version of the theory has been
shown to provide a good qualitative picture of the nematic phase and its transition to the isotropic liquid. What, then, is it about the ex- perimental facts that indicate the necessity of higher order terms in V1?
In Fig. 2 we display (schematically) the comparison of several experiments with the mean field theory, including only the term in U2.
We use T - T,, as the abscissa, so that the two materials depicted can he conveniently compared on the same graph. The dashed line is the theoretical curve computed from the mean field theory using only the term in U.,. We note that there is a striking difference in the proper- ties of the two materials. PAA (para-azoxyanisole) and PAP (para- azoxyphenetol). We note further that the simple theory cannot ac- count for the order parameter of either material. Fig. 2 is, in fact, clear evidence for the necessity of higher -order terms in the potential. That the two substances have different values of T, must mean that
RCA Review Vol. 35 March 1974 127

the interaction potentials differ by at least a multiplicative constant. However, the fact that the order parameter of PAP is everywhere larger than that of PAA cannot be explained by allowing the interac- tions to differ only by a multiplicative constant. Such a large differ- ence in the values of < P.,> can only be accounted for by assuming that the potentials are in some essential way different in the two materials. This difference must be a difference in both the sign and magnitude of the higher -order terms in V1.
LO
.9
8
<P2>
7
6
.5
4
PAA
PAP
3 l I 1 I I
-40 -30 -20 -f0 0 T-Tc
Fig. 2-Schematic representation of the temperature dependence of the order parameter for PAA and PAP. The dotted line is the result of the simple mean field theory.
The mean field theory with higher -order terms included is capable of reproducing the experimental data of Fig. 2. The addition of the term in Ua, Eq. 1141, is found to be sufficient.' The data on PAP can be accounted for by ha\ ing U, +0.12 U9. while the data on PAA are fit by assuming U., -0.19 U.,. In the case of PAP, Ua adds to the ordering effects of U., and < P,> is raised above that predicted by the simple theory. In the case of PAA, on the other hand, U4 decreases the ordering effects of the U, term and a lowered < Po > results. Similar results on these two materials have also been reported by Chandrasekhar and Madhusudana.8
The most dramatic evidence that the interaction potential must be quite complicated comes from recent experiments by Jen. Clark, I'ershan, and Priestley10 on MBBA (N-(p'-methoxybenzylidene)-p-n butylaniline). Using the Raman scattering technique these authors were able to determine the temperature dependences of both < P..> and < P4 >. The experimental data are shown (with their error bars)
128 RCA Review Vol. 35 March 1974

MEAN FIELD THEORY
as the dots in Fig. 2. As is readily apparent, the value of < P4 > be- comes quite small and then turns negative (!) just before the transi- tion temperature is reached. The simple version of the mean field theory is just not capable of handling this situation; the mean field theory with U2 only is represented by the solid lines. Note in par- ticular that < P4 > is predicted to remain positive right up to the transition point. The addition of the term in U4 does not help very much; the dashed lines represent the results10 of the theory with U4
-0.55 U2. While < P_ > has been brought into agreement with ex- periment, < P4 >, though reduced in magnitude, still remains quite positive.
The physical meaning of a negative < P., > has been discussed by Jen et al.10 These authors have demonstrated that a negative < P, > implies the existence of a broad orientational distribution function p1 (cos 0), Eq. [16]. In the simple mean field theory (U2 term only), the distribution function is sharply peaked at B =0; that is, the probability of locating a molecule whose long axis is at an angle 9
with respect to the director is extremely high for angles near zero and quite small when the angle 0 becomes appreciable. In the case of DIBBA, however, the probability for finite angles is almost as high as for 0 = 0. It therefore follows that the interaction potential V, re- quired to describe the behavior of DIBBA must be of a form which (at high temperatures at least) provides a very shallow minimum at O = 0 and/or subsidiary minimum at some finite angle. In attempting to reproduce the experimental results shown in Fig. 3, P. Sheng and I have tried numerous potential functions that have this feature and that are compatible with the systematic development, Eqs. [14] and [15]. In addition to terms in U., and U.,, Eq. [14], we have also in- cluded terms in (< P2 > P,± < P4 > P2), Eq. [ 15]. Though it has been possible to reduce the magnitude of < P4 > drastically, the de- sired behavior as depicted in Fig. 3 has not been obtained.
Our most promising attempt at describing the experiments on DIBBA was realized by using the following single molecule potential:
V, (COS 0)=U<P2>P._(cos0) +U'<f>f(cos0), f (cos 0) = 1'2(cos 0) - 2P4(cos 0) -I- Pe(cos 0).
[22]
This potential is obtained by taking very special combinations of terms from both Eqs. [14] and [15.] This combination was purposely chosen so that the part in U' gave a strong minimum in orientational potential energy at an angle far from the director (0 = 52°, in fact). Even with
RCA Review Vol. 35 March 1974 129

this potential function (specifically engineered to give the desired result) we were unsuccessful in explaining the data on MBBA. For certain values of U'/U we did get negative values of < P4 > of the right magnitude allright; it just happened, however, that the nematic phase became unstable with respect to other more complex structures. The molecular origin of the negative < P4 > thus remains a mystery.
.7
.6
.5
.4
.3 v
á .2
0.3 35
(P2)
MBBA
I 1 1 l l 30 25 20 15 10 5
Tc -T o
Fig. 3-Temperature dependence of the parameters < P_ > and < P. > for the compound MBBA (data of Ref. [101). The lines are theoretical curves described in the text.
A final comment. It may be that the source of the negative <P4> is not to be found in a complicated form of the potential V1 but in improving the mean field theory itself. As is well known from studies of other cooperative phenomena, the mean field theory is only a first approximation and theories that attempt to include short-range order and fluctuation effects always show great improvements in reproducing the details of experiments. Accordingly P. Sheng and I" have derived a theory of the nematic phase based on the well known "constant coupling" theory of ferromagnetism (see Ref. [6]). Though short -
130 RCA Review Vol. 35 March 1974

MEAN FIELD THEORY
range order is explicitely included and pair -potential functions in- cluding terms through P4 (cos B,_) have been used, the temperature dependence of < P4 > for MBBA has not been realized. The explana- tion of the negative < P4 > in 1IBBA, therefore, constitutes one of the outstanding theoretical problems of the nematic liquid -crystal state.
References:
' P. J. Wojtowicz, "Introduction to the Molecular Theory of Nematic Liquid Crystals," RCA Rev., Vol. 35, No. 1, p. 105, March 1974 (this issue). 2 W. Maier and A. Saupe, Z. Naturforschg., Vol. 14a, p 882 (1959), and Vol 15a, p. 287 (1960). J R. L. Humphries, P. G. James and G. R. Luckhurst, "Molecular Field Treatment of Nematic Liquid Crystals," J. Chem. Soc., Faraday Trans. II, Vol. 68, p. 1031 (1972). 4 J. A. Pople, "The Statistical Mechanics of Assemblies of Axially Symmetric Molecules. I. General Theory," Proc. Roy. Soc., Vol. A221, p. 498 (1954). 5 J. R. Sweet and W. A. Steele, "Statistical Mechanics of Linear Molecules. I. Potential Energy Functions," J. Chem. Phys., Vol. 47, p. 3022 (1967). a J. S. Smart, Effective Field Theories of Magnetism, W. B. Saunders Co., Phila., Pa. (1966). 7 M. E. Rose, Elementary Theory of Angular Momentum, J. Wiley and Sons, N. Y., N. Y. (1957). ° S. Chandrasekhar and N. V. Madhusudana, "Molecular Statistical Theory of Nematic Liquid Crystals," Acta Cryst., Vol. A27, p. 303 (1971). ° G. R. Luckhurst, unpublished notes. 10 S. Jen, N. A. Clark, P. S. Pershan, and E. B. Priestley, "Raman Scattering from a Nematic Liquid Crystal: Orientational Statistics," Phys. Rev. Lett., Vol. 31, No. 26, p. 1552 (1973).
P. Sheng and P. J. Wojtowicz, to be published.
RCA Review Vol. 35 March 1974 131

Hard Rod Model of the Nematic-Isotropic Phase Transition
Ping Sheng
RCA Laboratories, Princeton, N. J. 08540
Abstract-A classical gas of hard rods can exhibit a first -order transition from the isotropic phase to the anisotropic phase as the density is increased. A qualitative discussion of the physics of this phenomenon is followed by a derivation of the Onsager equations, which give a mathematical formulation of the problem when the density is low. The Onsager equations are solved in a simplified model for illustration.
Introduction
In the previous papers we have seen how an anisotropic, attractive interaction between the molecules of the form P.,(cos Os,) can give rise to a first -order nematic-isotropic phase transition. The origin of the anisotropy lies in the fact that almost all the liquid -crystal molecules are elongated, rod -like, and fairly rigid (at least in the central portion of the molecule) . It is clear, however, that besides the anisotropic attractive interaction there must also be an anisotropic steric inter- action that is due to the impenetrability of the molecules.
It is natural to ask what effect, if any, the steric interaction might have on the nematic-isotropic phase transition. Onsager recognized that a system of hard rods, without any attractive interaction, can have a first -order transition from the isotropic phase to the anisotropic phase as the density is increased.1-5 To see how this can come about, we note that in a gas of hard rods there aie two kinds of entropy. One is the entropy due to the translational degrees of freedom, and the other is the orientational entropy. In addition, there is a coupling
132 RCA Review Vol. 35 March 1974

HARD ROD MODEL
between these two kinds of entropy that can be described as follows. When two hard rods lie at an angle with respect to each other, the excluded volume (the volume into which the center of mass of one molecule cannot move due to the impenetrability of the other molecule) is always larger than that when the two hard rods are parallel. This fact can easily be illustrated in two dimensions. For simplicity let us take two lines of length L. When they are perpendicular to each other, the excluded area is L2. When they are parallel, the excluded area vanishes. This is shown in Fig. 1. It is only a short step to
EXCLUDED AREA
EXCLUDED AREA = 0
Fig. 1-Excluded area of two lines. In (a), the excluded area between two perpendicular lines is indicated by shade. In (b), the lines are parallel, and the excluded area is zero.
visualize the same situation in three dimensions where the excluded area is now replaced by excluded volume. The importance of excluded volume is that the translational entropy favors parallel alignment of the hard rods because this arrangement gives less excluded volume and, therefore, more free space for the molecules to jostle around. However, parallel alignment represents a state of low orientational entropy. Therefore, a competition exists between the tendency to maximize the translational entropy and the tendency to maximize the orientational entropy.
In the limit of zero density the tendency to maximize the orienta- tional entropy always wins because each molecule rarely collides with another molecule, and the gain in excluded volume due to parallel align- ment would only be a minimal addition to the already large volume of space within which each molecule can move about. When the density is increased, however, the excluded volume effect becomes more and more important. We know that in the limit of tight -packing density, the hard rods must he parallel. A transition between the isotropic and the an isotropic states therefore must occur at some intermediate den- sity. But this kind of general argument cannot tell us whether the transition is smooth or abrupt. To be more precise, we will derive the Onsager equations and actually solve them in a simplified case.
RCA Review Vol. 35 March 1974 133

2. Derivation of Onsager Equations
Consider a classical system of N hard rods in a volume V. The parti- tion function Z, including the angular part, is
Z(N,V,kT)
X f.
pi"
1 f dNpedNpydNpodNedNONI
ph" (poi - poi cos B{)2
N!heN
f . . fd3Nxd3Np exp
p.zi + pyi2 + p t
+ 211 211 sin29i
+ v,j(x,9,ip) i<i
/kT } [1] + 212
+ 2m /
Here k is the Boltzmann constant, T is the temperature, h is Plank's constant, 9, 4,, . are the usual Euler angles (following the notation used in Goldstein, Classical Mechanics), pe, p1,, p,, are the canonical conjugate angular momenta, 1 /, are the two principal moments of inertia of a rigid rod, m is the mass of the rod, /41 is the interparticle steric interaction, and py, pv, p, are the linear momenta of the hard rod. The kinetic energy part of the integral can be immediately integrated. Integration over the translational momenta yields a term (27rmkT)3N/2. Integration over the angular momenta gives a term
N
(2,r11`/27r/2)N TI sin 0, i=1
Since nothing in the integrand depends on this angle can also he integrated to yield (27r)N. Grouping the constants and combining the
N H sin 9i i= 1
factor with d- O yields
Z(N,V,kT) = (2r, )N(27r112/31,1/3kT)3N/"(27rmkT) aN/Q
N!haN
N
X f . . dNcos9dN¢ f. .f d3Nxexp {-E vii/kT
134 RCA Review Vol. 35 March 1974

HARD ROD MODEL
1 N vir - 1...! N!tiN\3`'
dNRd3Nx exp J r<i kT
[2]
where 77 = h3/[kT/12/3 (27r12)1/3]3/2 is a dimensionless constant (h = h/27r), A = h/V27rmkT is the thermal wavelength, and f2 is the solid angle. The angular integrals in Eq. [2] can be approximated to arbi- trary accuracy by summations in the following manner. Divide the unit sphere into K cells, each containing a solid angle _Ito. The orientational distribution of the rods is specified by the integers N4, which give the number of rods oriented in the direction of ath angular cell. The angular integrals can then be replaced by sum over all the possible partitions {N1, N2, ... Na, ... NR} with N1 + N2 + ... + NK = N, multiplied by a factor [Z'!/ (N1 !N2! ... NK!)] for the number of times the partition {N1, .... NK} has been counted in the angular in- tegrals';
Z (N, V, kT) = 1 N! (_5(o)N
Nrr/ sÁ3N Na NI! rNo! r.NN r
N vli X I . . .
dsgx exp F
-<5 kT
= Z ({i\'a}, N, V, kT) ,
{Na}
where Z ((NJ, N, V, kT) = (_1(,))K
(3a)
[3b]
,N ) . . . f d.srx emp {-EN
kT} .,INA3N 11 (N ..r)
a=1
Let us pick the maximum term in the summation
Z({Na},N,V,kT) and label it Z({Na})ma:
{Na}
Since the summation can have at most NK terms, we have the follow- ing inequality:
Z({Na})max < Z(N, V, kT) < N1rZ ({Na})mas [4]
RCA Review Vol. 35 March 1974 135
Taking the logarithm and dividing through by N, we have
1 1 1 -In Z ({Na})n,ax <- (In Z < - ln Z ({Na})I,az, K In N). [5] N N N
As N--> oo, the term (InN)/N approaches zero and (lnZ)/N can be exactly replaced by [In 7,({Na})1110/N. Therefore, our task can be re- duced to the calculation of Z ({Na}, N, V, kT) as long as we remember to maximize the result with respect to {Na} afterwards.
Now Z ({Na}, N, V, kT) can be put in the following form:
1 (,a,) N f [d3Nx
N vij
- Z ({Na}, N, V, kT) = I . . . exp { kT
II (Na') a=1
) N N i) =
1 la f . . .
Il d3Nx exp - v [g] K J {<j kT
?jNA.3N 11 (Na!) a=1
Define .I = exp {- vi;/(1 T)} - 1. With vii denoting the steric repulsion,(1)4;has the value zero when the two molecules are not in contact but takes the value -1 when the center of mass of one mole- cule enters the "excluded volume" of two hard rods. With this defini- tion of 4 we can rewrite the integrand as
N vii N N N II exp - -= ft (1 + (1,ii) = 1 + E (1)ii -l- E `Dii (Din, i- . . . [7]
i<i kT i<i i<j i<j i<n,
The first term represents the behavior of the ideal gas, and the second term is the first -order correction to this behavior due to steric repulsion between the molecules. If we limit ourselves to densities that are not too high, we can neglect higher -order terms, which rep- resent the effects of excluded volume between more than two molecules. With this crucial approximation, we have
Z ({Na}, N, V, kT) - (,a,)N 1 N
t Á3N [VN+VN-Eiid3xid3x N j]
II Ni a=1
136 RCA Review Vol. 35 March 1974

HARD ROD MODEL
(_(1)NVN 1 1 1 N J'
_ [1+--E J 'NJ d3xsi]. .iiNA3N
K V 2 i#! H (Na!)
a=1
[8]
We note that <Dii depends on the relative separation xii and the relative orientation between two molecules. Therefore, a better way to label the indices should be áa0 (xii), where a and / denote the angular orientations of the two molecules and xi1 the relative separation be- tween their centers of mass. The summation over i and j can be rewritten as
N
E fDa6(xii)d3xi! = E Na(Nd -sap)' cDa6(x)d3x. [9] #i a,19=1
As N-* oo, the Sag term can he neglected. The integral of (1)ap(x) is just the negative of excluded volume Vafiex. Z({Na}, N, V, kT) is now in the form
Z({Na}, N, V, kT) = (.501)NVN 1 1 K
1 - -E NaN0V sex [ 10] ?iN,\3^' K Na! 2V Q43=1
II 6=1
Taking the logarithm, dividing by N, and using Sterling's approxima- tion InNa! - NalnNa, we obtain
In [7. ({Na}, N, V, kT) ] (M V K Na Na Na =ln r -In-+-InN)
N ,i\3 z=í(N N N 1 N2 K Na Ns
+-bl 1--Z--V4es. N 2V a.s N N
G5(0V N = In -
1i A3 N
r_5(0) L'-
ln,iA3 N
- In
K a Na y -In- +lnf 1- aJ N N
in[
K Na Na E -In-+lnf 1 a=1 N N lL
N2 it Na
2V a.d N N
NtiNaNp ---- Va 2V a.e N N
CAW) K Na Na p K Na No E-ln---E -- VaoeL .
v,\3p a=1 N N 2 g.a N N
RCA Review Vol. 35 March 1974 137
Here p - N/V is assumed to be small.
Let us define an angular distribution function f such that Na = N f (f1a) (..w). Substituting Na/N by f (12a) and making the replacement
E (a,) -> df2 ,
a '
we can put Eq. [11] in the form
1
-1nZ((Na), N. V, l;T) = -In r2aap - di2f (12) In f (9) N
I 2J-
P / di2df2'f(9)f (i2') Vex .(9-12').
The second term on the right-hand side orientational entropy, and the third ter excluded volume. In order to maximize the we will use the Euler-Lagrange equation wants to maximize the integral
b
dy 1[d(x)]=¡F(d,-,xl dx
dx / a
[12]
of Eq. [12] represents the m represents the effect of right hand side of Eq. [12],
. This equation says if one
by varying the function y(x), the correct y(x) must satisfy the equation
DF d aF = O.
ap dx /dd\ a -
dx
If in addition y(x) must satisfy the normalization condition
b
fy (x) dx = 1, then the equation for y(x) becomes
a
138 RCA Review Vol. 35 March 1974
HARD ROD MODEL
aF d aF
ay dx
Cdy\ a -
dx
v=0,
where y is the Lagrange multiplier. Applying the Euler-Lagrange equation to Eq. [12] gives
lnf(S2) +1 -}-v+pf(SY)VeZ (12-52') dSY=0. [13]
Eqs. [12] and [13] are the Onsager equations. In principle, Eq. [13] can be solved to get Mu) as a function of p and y. The quantity y is then determined by the normalization condition J f (12)dí2 = 1. When there is more than one solution to Eq. [131, the results must be put into Eq. [12] in order to select the one solution that maximizes the right-hand side of Eq. [12]. Label that solution f°(9). The free energy is then
F = In Ik3p +. dS2f°(S2) lnf°(U) + - / I NkT 2
dS2dp'f°(u) f°(129 Vex'(f2 - Si'). [14.[
Other thermodynamic quantities can be obtained directly from Eq. [14].
3. Solution of Onsager Equations in a Simplified Case
In practice, Eq. [13] is a nonlinear integral equation and its exact solution in the general case is difficult. Therefore, we will solve the Onsager equations in a very simplified case. Let us constrain the hard rods to point in only three orthogonal directions, say x, y, and z. Choose z as the preferred direction. If the fraction of hard rods pointing in the x-diiection is r, the same fraction should point in the y -direction, since x and y directions are equivalent by uniaxial sym- metry of the nematic phase. The fraction pointing in the z -direction is then 1 - 2r. The order parameter
1
S -f P2 (cos B) f (cos B) d (cos 9)
-1
RCA Review Vol. 35 March 1974 139
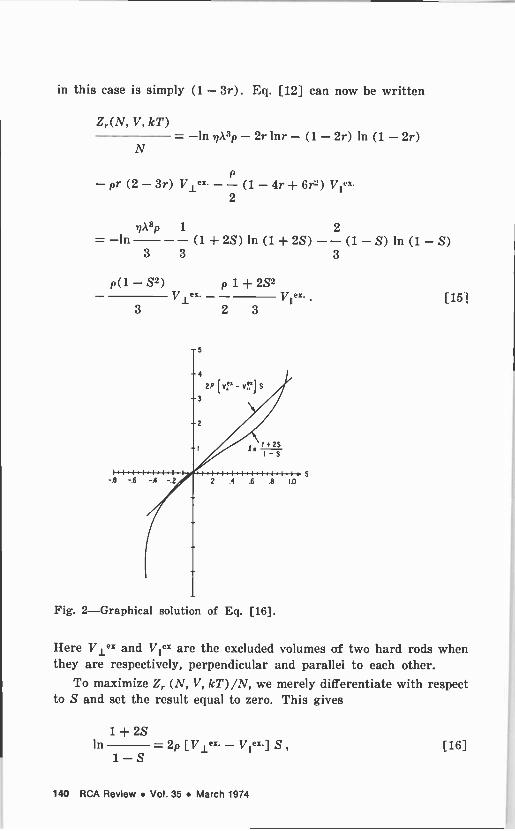
in this case is simply (1 - 3r). Eq. [12] can now be written
Z,.(N, V, kT)
N = -In y\3p - 2r lnr - (1 - 2r) In (1 - 2r)
p - pr (2 - 3r) V1ex. - - (1 - 4r + 6r2) 2
,]\3p 1 2 = -In - - (1 + 2S) In (1 + 2S) -- (1 - S) ln(1-S)
3 3 3
p(1 - S'=) p 1 + 2S2 V1ex. - - j/iiex.
3 2 3
Fig. 2-Graphical solution of Eq. [16].
[151
Here V1ex and Viiex are the excluded volumes of two hard rods when they are respectively, perpendicular and parallel to each other.
To maximize Z,. (N, V, kT)/N, we merely differentiate with respect to S and set the result equal to zero. This gives
1 + 2S ln = 2p [Vlex. - Vuex.] S,
1-S [16]
140 RCA Review Vol. 35 March 1974

HARD ROD MODEL
which is the equivalent of Eq. [13]. In order to calculate Vex., we will
take the rods to have the shape of rectangular parallelepiped with length L and width I). Then
z jlle:.=(4+2D-I-2
L) D2L =(4+21+ 1 170,
Viie= = 8D2L = SV° ,
1.0
0.75
0.50
0.25
o
-0.25
-0.50
9 Í 1.39 2 3 4 5 6
P (vt - Ve+]
Fig. 3-Solution of Eq. [16] as a function of p[V^a - ViitN]. Dark lines indicate the branch that maximizes the right hand side of Eq. [15].
7 B 9 10
where V° = D2L is the volume of a parallelepiped and 1= L/I) is the ratio of length to breadth. Eq. [16] can be solved graphically by
plotting the right- and left-hand sides on the same graph and locating the points of intersection. This is shown in Fig. 2. The results are displayed in Fig. 3 as a function of p[Vlex. - Viiex.] Dark lines indi- cate the stable solution. Label these values of S by So(p). The free energy is
F ¡ N.g \3 1
= In - (1 + 2S0(p)) 'In (1 + 2S0(p)) NkT r 3V 3
2 + - (1 -S°(p))In (1 - So(p))
3
NV. 1 - (S°(p))- 1
+ 2 V
f 3
(l+ d
-2 +2I. [18]
RCA Review Vol. 35 March 1974 141

P Vo
kT
ANISOTROPIC PHASE
= 5
AP=.07 AS = .6443
ISOTROPIC PHASE
f
2 2.1 2.2
V
N V°
2.3 2.4 2.5
Fig. 4-Reduced pressure PV.,/kT plotted as a function of reduced volume V/VoN for 1=5.
The pressure is obtained by differentiating F with respect to V:
PV0 DF
kT kT 317VVN ± 2( °Nl r¡ P))- 1 - 21-F 2 l . [19]
In Figs. 4 and 5, reduced pressure PV°/kT is plotted versus reduced volume V/V°N for two values of 1. It should be noted that there is a
PV0
kT
.45
.44
.43
.42
.41
.40
( = 10
áP = .15
AS : .7361
ANISOTROPIC PHASE
:
ISOTROPIC PHASE
45 5.0 5.5
V
N V°
6.0 6.5
Fig. 5-Reduced pressure PV./kT plotted as a function of reduced volume V/VoN for 1= 10.
142 RCA Review Vol. 35 March 1974

HARD ROD MODEL
van der Waals loop in each curve. Using the standard Maxwell
equal-area construction, we obtain the magnitudes of density and order parameter discontinuities (Sp and _SS) across the transition. Their values are typically ,Sp - 0.1 and _IS - 0.7, which are close to the results obtained by the variational solution of the exact Onsager equations. Ilow well do these values agree with the experimental results? Typical experimental \alues for _sp and are - .01 and .4, respectively. Therefore, there exists a large discrepancy between the theoretical predictions and the experimental results.
What went wrong? The answer probably lies in the neglect of short-range order. In real liquid crystals there are short-range at- tractive interactions that favor parallel alignment of the molecules. This means that parallel molecules prefer to lie close to each other and form "bundles". In this kind of configuration, a molecule would most probably interact with those molecules pointing in similar orien- tations, thus reducing the excluded -volume effect. A lattice -gas model
calculation' that includes the short-range anisotropic attractive inter- action as well as the steric repulsion has shown that "bundling" would indeed soften the isotropic-anisotropic phase transition and de- crease the values of _Sp and _IS. Therefore, the joint consideration of short-range order and steric repulsion seems to be the direction for improving the hard -rod model.
References:
L. Onsager, "The Effects of Shapes on the Interaction of Colloidal Particles," Ann. N.Y. Acad. Sol., Vol. 51, p. 627 (1949). 2 R. Zwanzig, "First -Order Phase Transitions in a Gas of Long Thin Rods," J. Chem. Phys., Vol. 39, p. 1714 (1963). J P. J. Flory, "Phase Equilibriums in Solutions of Rodlike Particles," Proc. Roy. Soc. (London), Vol. A234, p. 73 (1956). 4 E. A. DiMarzio, "Statistics of Orientation Effects in Linear Polymer Molecules," J. Chem. Phys., Vol. 35, p. 658 (1961). S G. Lasher, "Nematic Ordering of Hard Rods Derived from a Scaled Particle Treatment," J. Chem. Phys., Vol. 53, p. 4141 (1970). 6 R. H. Fowler, Statistical Mechanics, p. 62, Cambridge University Press, Cambridge, England (1966). 7 P. Sheng, "Effects of Bundling in a Lattice Gas Model of Liquid Crystals," J. Chem. Phys., Vol. 59, p.1942 (1973).
RCA Review Vol. 35 March 1974 143

Nematic Order: The Long Range Orientational Distribution Function
E. B. Priestley
RCA Laboratories, Princeton, N. J. 08540
Abstract-This lecture presents a detailed discussion of the long range orienta- tional distribution function for the nematic phase. It is shown that experiments measure moments of this distribution function rather than the distribution function itself. Both microscopic and macroscopic definitions of nematic order are discussed and the relationship between them is derived for the case of rigid rod -like molecules. Experimental measurements of the order are described and data from a number of experiments is presented.
1. Introduction
In the third lecture of this series' the existence of the nematic phase was presented as an example of an order disorder phenomenon. The symmetry and structure of the nematic phase were used to identify the natural order parameter <P0 (cos 9)>, where PO (cos 0) is the second Legend re polynomial and the angular brackets denote a statis- tical average over the orientational distribution function f (cos 0) . The orientational potential energy of a single molecule was shown, in the mean field approximation, to be
V (cos 8) = -v <P2 (cos B)> P2 (cos B) [1]
where y is a number that scales with the strength of the intermole- cular interaction. Using the rules of classical statistical mechanics, the theoretical orientational distribution function p(cos 0) was given
144 RCA Review Vol. 35 March 1974

NEMATIC ORDER
in terms of the mean field potential V (cos B) as
with
p (cos 0) = 7, exp [-/3V (cos 0) ] [2]
Z =' exp [-f3 V (cos 0) ] d (cos 0) .
In Eq. [2] Z is the single -particle partition function and /3 = 1JkT, where lc is Boltamann's constant and T is the absolute temperature.
It is important at this point to distinguish between f (cos 0) and p (cos 9). Given that the nematic phase is truly uniaxial, f (cos 0) completely describes the long range orientational molecular order and therefore can be regarded as the exact or true single -particle distribution function. On the other hand, p (cos 0) is a theoretical approximation to f (cos 8). The extent to which it represents a good approximation depends upon how closely V (cos 0) approximates the true potential of mean torque.
There is an obvious motivation for determining as much as pos- sible experimentally about f (cos 0) ; it describes the long range orientational ordering of the molecules which, of course, is the single feature that distinguishes the nematic phase from the isotropic phase. The average values of various quantities of interest pertaining to the nematic phase could be computed if f ( cos 0) were known with precision.
2. The Orientational Distribution Function
The main question we want to answer in this lecture is "What do experiments tell us about the orientational distribution function?". To answer this question it is instructive to expand f (cos 8) in a formal mathematical sense as=
21 -I- 1
f (cos .0) _ <Pi (cos 0)> P1 (cos 0), even 2
[3]
where the Ps (cos 0) are the Ph even order Legendre polynomials. Notice that the expansion has the correct symmetry and that f (cos 9) is normalized. The coefficients <P, (cos 0)> are defined by
RCA Review Vol. 35 March 1974 145

<P1 (cos B)> = I
I'1 (cos 0) f (cos 0) d (cos 0). [4]
Explicitly, the first three coefficients are
<Pa (cos B)> = 1,
1
<P., (cos 0)> = - (3 <cos2 0> - 1), [5] 2
1
<P4 (cos B)> = - (35 <cos4 0> - 30 <cos2 0> -{- 3). 8
There is no practical experimental means of measuring f (cos 0) directly. Rather, individual experiments each detect some property of the nematic phase averaged over f (cos 0). Thus, experiments are sensitive to f (cos B) only through its infinence on these averaged properties. The most commonly measured such property is the tem- perature dependence of <cos20> and, hence, the temperature depend- ence of the order parameter <P2 (cos 0)>. Recent measurements of <cos40> as a function of temperature for two nematic materials' have permitted the evaluation of <P4(cos 0)> over the entire nematic temperature range as well. Therefore, the answer to the question posed at the beginning of this section is that experiments measure the coefficients in the expansion off (cos 0), (Eq. [3]). In other words, experiments measure different moments of the orientational distribu- tion function. These experimentally determined moments can be used to evaluate truncated series approximations to f (cos 0). It is convenient to label these approximate distribution functions as fN (cos 0) where N is the Roman numeral corresponding to the number of terms retained in the truncated series.
In the discussion so far, the constituent molecules of the nematic phase have been assumed to be representable by simple rigid rods so as to make the definition of a molecular axis unambiguous. The order parameter <P., (cos O)> has been defined from a microscopic point of view by treating it as a statistical average of individual molecular behavior. In most cases this is an adequate description since real nematogens most often do behave like simple rigid rods. However, if the molecules do not behave like simple rigid rods, this microscopic description of order is no longer adequate and we must find some other
146 RCA Review Vol. 35 March 1974
NEMATIC ORDER
means for specifying the degree of order. For this, we turn to a con- sideration of macroscopic response functions of the nematic phase and show how a suitable order parameter can be defined using these response functions.
3. Macroscopic Definition of Nematic Order
In deriving a macroscopic order parameter, we will use the diamagnetic susceptibility as an example. However, any other macroscopic property, e.g., refractive index or dielectric response, could be used as well.
Consider the relationship between magnetic moment M and magnetic
field 11
Ma = Xafillry, a,13 = x.J,z [6]
Xa$ represents the (43 -component of the diamagnetic susceptibility
tensor X and, for static fields, Xa$ = »a. In Eq. [6], the summation convention over repeated indices is implied. For the uniaxial nematic
phase, we can write x in the diagonal, but completely general form
0 o ,
XII
[7]
where Xii and xi refer to the susceptibility parallel and perpendicular
f-1 to the symmetry axis, respectively. x itself is not a useful order para- meter because it does not vanish in the isotropic phase, but has the value
1
X=-(2X1+Xii 3
1
= )(vr' 3
H
[8]
However, if we extract the anisotropic part of X, viz xa defined by
1
Xaad = Xa9 Xyy 80, 3
[3]
RCA Review Vol. 35 March 1974 147

which does vanish in the isotropic phase, we can use it to define a suit- able order parameter.
Combining Eqs. [7] and [9] we find for the nematic phase
2 /-1/2 0 0
xa= x 100 -1/20 0 ,
3 [10]
where -Ix = Xii - xi It should be noted that xa is temperature de-
pendent because the magnitude of .fix is temperature dependent. If we denote the maximum possible diamagnetic anisotropy (i.e., the anisotropy for a perfectly ordered nematic phase) as (_5x)Q181, we can define the desired order parameter as
fa6 Q.0=
2 (-)() max
Notice that Q0 has values between 0 (isotropic phase) and 1 (per- fectly ordered nematic phase) and that it has been derived without any assumption about molecular rigidity. Qap is a valid measure of the order for any nematic liquid crystal. As mentioned earlier, Qalg
could have been defined in terms of the anisotropy in any other macro- scopic response function.
One might wonder if there is any relationship between Q,, and
<P_ (cos 9)>. Indeed, in nematic phases whose constituent molecules can be approximated by simple rigid rods, these two measures of the long range order are related. The next section deals explicitly with this relationship.
4. Relationship Between Microscopic and Macroscopic Order Parameters
The diamagnetic susceptibility / of a single rod -like molecule can be described by two parameters In and /l, representing the molecular response to a magnetic field applied parallel and perpendicular to the molecular axis, respectively. In tensor notation the magnetic sus- ceptibility of the molecule is given by 0. l 0
0 0 /u [12]
148 RCA Review Vol. 35 March 1974

NEMATIC ORDER
To find the macroscopic diamagnetic anisotropy we first rotate by an arbitrary rotation R(0, 8, 'If), 95, 8, and ¢ being the Euler angles of the rotation, and then perform a statistical average. In a uniaxial nematic, the angles ¢ and 0 are isotropically distributed so averages over them can be carried out explicitly. The orientational distribution function f (cos 0) describes the distribution of the angle 8, and averages over 8
are designated by angular brackets. From the general formalism for rotation of second rank tensors'
it can be shown that
1 1
xt11OT =- (2C1 -I- ) -- (ii -Z1) [3(1 -cose 0) cos 20- (3 cose 0-1)]. 3 6
and [13] 1 1
SszROT = - (2Z1 +) + - (Id - Z1) (3 cost 0-1) ,
3 3
where Z;JROT are components of the rotated molecular diamagnetic sus- ceptibility tensor. The macroscopic diamagnetic anisotropy is then
-sx = N [<Sz_BOT> [14]
where N is the number of molecules per cubic centimeter. Taking the averages of the ,i1tOT and substituting into Eq. [14] gives
=N (Y-g) <P, (COS 0)>. [15]
But N (In- t1) is simply the macroscopic diamagnetic anistrnpy of the perfectly ordered nematic phase, i.e.,
(-1x)max = N (In - Zl). [16]
Thus,
= < h2(cOs 8) >. [17]
Combining Eqs. [101, [11]. ard [ 17] yields
-1/2 0 0
Qap _ <P2 (cos 0)> 0 -1/2 0 [18] 0 0 1
for a nematic liquid crystal composed of rod -like molecules.
RCA Review Vol. 35 March 1974 149

As noted at the beginning of Section 3, Qnr can be defined equally well in terms of other macroscopic response functions such as the
dielectric tensor e . However, a theoretical relationship between ,e
(macroscopic measure of the order) and <P2 (cos O)> (microscopic measure of the order) cannot be derived in the absence of certain ques- tionable assumptions. This inability to establish a rigorous relationship analogous to Eq. [14] between the dielectric anisotropy ,e and the polarizability a{j results from complicated depolarization effects caused by the relatively large near -neighbor electrostatic interaction. Never- theless, it has been established empirically' that the analog of Eq. [17] does hold, i.e., the macroscopic anisotropy does scale directly with the microscopic order parameter <P2 (cos B)>. Consequently, electrical and optical anisotropy measurements continue to he used to measure <P2 (cos 9)> in nematics composed of rod -like molecules, even though theoretical justification for this is presently lacking.
5. Experimental Measurements
Various experimental methods have been used to examine molecular ordering in nematic liquid crystals'. All the methods fall into one of two groups-those that measure the anisotropy in some macroscopic response function and those that measure <P. (cos O)> directly. As we have already seen, those in the first group also permit a determina- tion of <P2 (cos 8)> because of equations analogous to Eg. [17] that relate the macroscopic anisotropy to the microscopic order. In general, there is quite good agreement among the various measures of <P2 (cos 8)> for materials that have been studied by one or more methods from each group, indicating that nematogenic molecules can be approximated rather well by hard rods. We turn now to a brief description of the various experimental techniques and refer the in- terested reader to more detailed discussions in each instance.
5.1 Measurements of <P2(cosO)> Based on Macroscopic Anisotropies
Little need be said concerning this type of order parameter deter- mination. It is evident from Eq. [17] that the only requirement in evaluating <P2 (cos O)> from macroscopic anisotropy measurements is a knowledge of the maximum possible magnitude of the anisotropy being measured. Clearly, this is the anisotropy that would be measured in a perfectly ordered nematic phase and can be obtained by means of a little algebra from the crystalline anisotropy. Diamagnetic, dielectric, and optical anisotropy measurements have been used extensively to
150 RCA Review Vol. 35 March 1974

NEMATIC ORDER
determine the temperature dependence of <P., (cos O)> for a variety of nematic liquid crystals. Further details about the conduct of these experiments and analysis of the data can be found in References [6] and [7].
5.2 Measurements of <P2(cosO)> Based on Microscopic Anisotropies
In this section we group techniques that sense the anisotropy, in various properties of individual molecules as opposed to those discussed above, which sense bulk anisotropies. It is impossible to measure the anisotropy of a single molecule in a nematic phase; rather, these tech- niques measure the statistical average (both temporal and spatial) of the molecular anisotropy. The averaging process results in the mea- sured anisotropy being proportional to <P2, (cos 9)> for most of these techniques. For the technique based on Raman scattering measure- ments, the anisotropy is related to both <P2 (cos O)> and <P4(cos B)>.
(a) Magnetic Resonance Techniques
An excellent review of magnetic resonance methods has been given recently by Brown et al.' We simply point out that, for molecules hav- ing nuclei with spin / = 1/2 (such as H), the dipole -dipole splitting in the NIIIR spectrum of the nematic phase, due to a proximal pair of such nuclei in the same molecule, is proportional to <P. (cos 9)>. In addition, for molecules having nuclei with spin I 1 (such as I) and 1I,\ ), the quadrupole splitting can be used to determine <P2 (cos 9)>. Finally, anisotropy in the Zeeman and hyperfine splitting observed in the EPR spectrum of free radicals dissolved in nematic liquid crystals also allows one to determine the order parameter, assuming the para- magnetic guest aligns sympathatically with the host nematic material.
(b) Raman Scattering Technique
Details of the Raman scattering technique have been published else- where.' Successful utilization of the technique requires the existence of a (preferably) strong, narrow, anisotropic Raman line associated with an identifiable vibration of the nematogen. It is straight- forward to show that the anisotropy in the Raman scattering from such a vibration observed in the laboratory frame of reference con- tains information about the statistical averages <P_ (cos 9)> and <P4 (cos O)>. This unique feature of the Raman technique, viz. the ability to determine <P4> as well as <P2>, stems from the fourth rank tensor nature of the scattering interaction.
RCA Review Vol. 35 March 1974 151
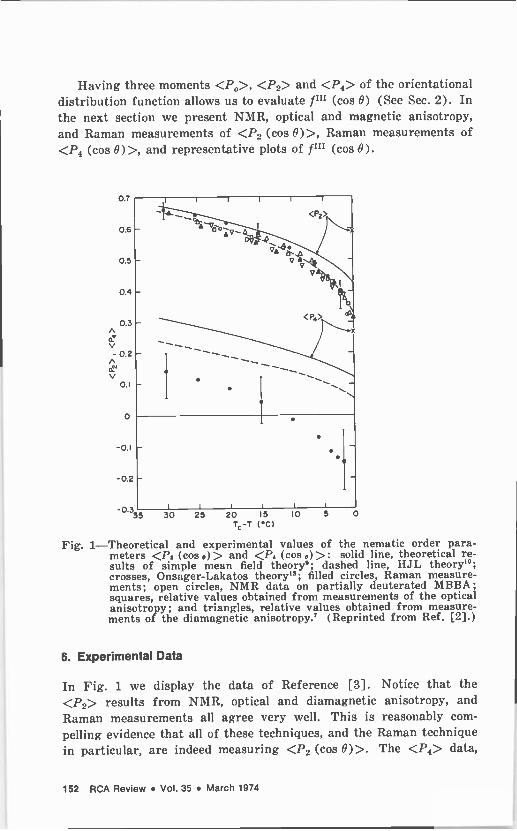
Having three moments <P0>, <P2> and <P4> of the orientational distribution function allows us to evaluate fm (cos B) (See Sec. 2). In the next section we present NMR, optical and magnetic anisotropy, and Raman measurements of <P2 (cos H)>, Raman measurements of <P4 (cos O)>, and representative plots of f" (cos B).
-0.335 3I 1 1 1
0 25 20 15 10 5
Tc-T (C)
Fig. 1-Theoretical and experimental values of the nematic order para- meters <P, (cos o)> and <P. (cos e)>: solid line, theoretical re- sults of simple mean field theory'; dashed line, HJL theory10; crosses, Onsager-Lakatos theory"; filled circles, Raman measure- ments; open circles, NMR data on partially deuterated MBBA; squares, relative values obtained from measurements of the optical anisotropy; and triangles, relative values obtained from measure- ments of the diamagnetic anisotropy.' (Reprinted from Ref. [2].)
6. Experimental Data
o
In Fig. 1 we display the data of Reference [3]. Notice that the <P,> results from NMR, optical and diamagnetic anisotropy, and Raman measurements all agree very well. This is reasonably com-
pelling eN idence that all of these techniques, and the Raman technique in particular, are indeed measuring <P2 (cos O)>. The <P4> data,
152 RCA Review Vol. 35 March 1974

NEMATIC ORDER
which come only from the Raman measurements. are seen to become negative near the nematic-isotropic phase transition. The physical meaning and implications of negative <P4> have been discussed by .Ien et al' and by P. Wojtowicz° in the fourth lecture of this series.
3.0
2.4
0.6
o
-0.3 1.0
)1
o o
o o
o °o
00
Tc-T 25°C
OOp0 o
o 0
o o °
Tc-T =2°C
0
0000000 , I
oo .
0.8 0.6 0.4 cos B
0.2 10 0.8 0.6 0.4 cos B
0.2 o
Fig. 2-Plot of the theoretical and experimental truncated orientational distribution function fill (cos 0); solid line, HJI, theory;10 circles, Raman measurements. (Reprinted from Ref. [2].)
Fig. 2 shows a plot of f"I (cos 9) for two temperatures using the experimental Raman values of <PO> and <P,> in Eq. [31. For com- parison, we also plot f"' (cos 9) for the same two temperatures using values of <PU> and <P4> calculated from the IIumphries-James- Luckhurst model°10 after the parameters were adjusted to obtain good agreement with the <P.,> data. Note that f"' need not he positive definite because of truncation errors. The principal result to see in Fig. 2 is that the molecules have a stronger tendency to be tipped away from the nematic axis than is predicted by mean field theory. This tendency is strongest near the nematic-isotropic phase transition. In addition to mean field theories, other statistical mechanical models of nematic ordering have been developed. In particular there is the Onsager model"1z for the ordering of a system of hard rods as a function of density. Using this model, Lakatos" has recently cal- culated values of <Ps (cos 9)> for all 1. In Fig. 1 we also show these results for <P..> and <P.1> at the transition density. The ratio of <P4>/<P_> as a function of <1'.,> is essentially the same as that calculated from mean field theory and it also disagrees with the ex- perimental results.
There has been considerable speculation'° regarding the origin of
RCA Review Vol. 35 March 1974 153

the discrepancy between experiment and mean field theory. As of this writing, that discrepancy remains unexplained, though extensive work is underway on both the experimental and theoretical fronts in an attempt to better understand the exact nature of nematic ordering and the single -particle orientational distribution function f (cos B).
References:
1 P. J. Wojtowicz, "Introduction to the Molecular Theory of Nematic Liquid Crystals," RCA Rev., Vol. 35, p. 105, March 1974 (this issue). 2 E. B. Priestley, P. S. Pershan, R. B. Meyer, and D. H. Dolphin, "Raman Scattering from Nematic Liquid Crystals. A Determination of the Degree of Ordering," Vijnana Parished Anurandhan Patrike, Vol. 14, p. 93 (1971). J Shen Jen, N. A. Clark, P. S. Pershan, and E. B. Priestley, "Raman Scattering from a Nematic Liquid Crystal: Orientational Statistics," Phys. Rev. Lett., Vol. 31, p. 1552 (1973); E. B. Priestley and P. S. Pershan, "Investigation of Nen-atic Ordering Using Raman Scattering," Mol. Cryst. Liquid Cryst., Vol. 23, p. 369 (1973); and E. B. Priestley and A. E. Bell (to be published). 4 E. B. Priestley and P. J. Wojtowicz, unpublished results. 5 N. V. Madhusudana, R. Shashidhar, and S. Chandrasekhar, "Orientational Order in Anisaldazine in the Nematic Phase," Mol. Cryst. Liquid Cryst., Vol. 13, p. 61 (1971). 6 A. Saupe and W. Maier, "Methods for the Determlnaticn of the Degree of Order in Nematic Liquid -Crystal Layers," Z. Naturforschg., Vol. 16a, p. 816 (1961). 7 G. Sigaud and H. Gasparoux, J. Chem. Phys. Physicochim. Biol., Vol. 70, p. 669 (1973); I. Haller, "Elastic Constants of the Nematic Liquid Crystalline Phase of p-Methoxybenzylidene-p-n-Butlylaniline (MBBA)," J. Chem. Phys., Vol. 57, p. 1400 (1972); P. I. Rose, Fourth International Liquid Crystal Conf., Kent State University, Kent, Ohio, 1972 (to be published) see also Ref. (5).
G. H. Brown, J. W. Doane, and V. D. Neff, A Review of the Structure and Physical Properties of Liquid Crystals, The CRC Press, Cleveland, Ohio (1971). 9 P. J. Wojtowicz, "Generalized Mean Field Theory of Nematic Liquid Crystals," RCA Rev., Vol. 35, p. 118, March 1974 (this issue). 10 R. L. Humphries, P. G. James, and G. R. Luckhurst, "'Molecular Field Treatment of Nematic Liquid Crystals," J. Chem. Soc. Faraday Trans. li, Vol. 68, p 1031 (1972). 11 L. Onsager, "The Effects of Shapes on the Interaction of Colloidal Particles," Ann. N.Y. Acad. Sci., Vol. 51, p. 627 (1949). 12 P. Sheng, "Hard Rod Model of the Nematic-Isotropic Phase Transition," RCA Rev., Vol. 35, p. 132, March 1974 (this issue). 13 K. Lakatos, J. Status Phys., Vol. 2, p. 121 (1970).
154 RCA Review Vol. 35 March 1974

Recent Papers by RCA Authors
Listing is alphabetical by name of primary author. For copies of reprints, the reader should contact the publication directly.
A. Akselrad, R. E. Novak, and D. L. Patterson, "New Si -Based Garnet Films for Magnetic - Bubble Devices with Magneto -optic Applications," 19th Conf. Magnetism and Magnetic Materials, Boston, Mass., Nov. 1E, 1973. M. P. Bachynski, "The Need for Leadership in Science and Techonolgy," IEEE Inter- national Electrical and Electronics Conf., Toronto, Oct. 1973. D. Balzer and A. C. Belsley, "Ascent Phase and Orbital Correction Propulsion Module," AIAA 9th Propulsion Conf., Las Vegas, Nev., Nov. 7, 1973 D. L. Balzer, "Block 5D Ascent Phase Propulsion System," 1973 JANNAF Propulsion Mtg.; Chem. Fropulsion Information Agency J., Las Vegas, Nev., Nov. 6-8, 1973. R. A. Bartolini, N. Feldstein, and R. J. Ryan, "Replication of Relief -Phase Holograms for Prerecorded Video," J. Electrochem. Soc., Vol. 120, No. 10, p. 1408, Oct. 1973. O. E. Bessette, "A High Capacity, High Data Rate Instrumentation Tape Recording System," International Telemetering Conf. Proc., Wash-, D.C., Vol. 9, p. 74, Oct. 9-11, 1973. P. J. Bird, "Modular Switching Approach for Local and Remote Subscribers," National Telecommunications Conf. Proc., Atlanta, Ga., Nov. 28, 1973. B. F. Bogner, "Ultra Lightweight Stripline RF Manifold," 11th Electrical and Electronic Insulation Conf. Proc., Chicago, III., Oct. 3, 1973. A. Bloom and R. A. Bartolini, "A New Volume Phase Hologram Recording Medium," Optical Soc. Amer. Ann. Meeting, Rochester, N.Y., Oct. 1973. B. F. Bogner, "Conformal Arrays Come of Age," Microwave J., Oct. 1973. J. H. Bowen, M. E. Breese, V. A. Mikenas, and M. Weiss, "Analytic and Experimental Techniques for Evaluating Transient Thermal Characteristics of Trapatt Diodes," IEEE International Electron Devices Mtg., Wash., D.C., Dec. 3-5, 1973. J. M. Cies, "Combined Modal and Analog Vibration Analysis," 44th Shock and Vibra- tion Symo., Symp. Bulletin, Houston, Texas, Dec. 4-7, 1973. R. S. Crandall, "Collective Modes of a Two -Dimensional Wigner Crystal," Phys. Rev. A, Vol. 18, No. 4, p. 2136, Oct. 1973. G. W. Cullen, M. T. Duffy, and C. C. Wang, "Materials Integration Through Hetero- epitaxial Growth on Insulating Substrates," Electrochem. Soc., 3rd International Conf. on CVD, Boston, Mass., Oct. 7-12, 1973. B. J. Curtis and J. P. Dismukes, "An Investigation cf Convective Effects in a Barrel Reactor," 4th International Conf. on Chemical Vapor Deposition, Boston, Mass., Oct. 7-12, 1973. W. Czaja, C. F. Schwerdtfe5er, "Evidence for Electron -Hole -Droplet Formation in AgBr," Swiss Phys. Soc. Mtg., Lugano, Switzerland, Oct. 19-20, 1973. J. Danko, M. Hecht, and T. Altman, "Geometric Corrections-Constant Resolution Processor," Management and Utilization of Remote Sensing Data, Amer. Soc. of Photogrammetry, Síoux Falls, S.D., Oct. 30, 1973. J. G. Davy, and J. J. Hanak, "RF Bias Evaporation (Ion Plating) of Nonmetal Thin Films," 29th Amer. Vacuum Soc. Symp., New York, Oct. 1973.
RCA Review Vol. 35 March 1974 155

D. A. DeWolf, "Strong Irradiance Fluctuations in Turbulent Air: Spherical Waves," J. Optical Soc. Amer., Vol. 63, No. 10, p. 1249, Oct. 1973. J. P. Dismukes, J. Kane, B. Binggeli, and H. P. Schweizer, "Chemical Vapor Deposition of Catholdoluminescent Phospor Layers," 4th International Conf. on Chemical Vapor Deposition, Boston, Mass., Oct. 7-12, 1973. J. P. Dismukes and J. Kane, "Evaluation of an Organometallic Approach to Garnet Chemical Vapor Deposition," 4th International Conf. on Chemical Vapor Deposition, Boston, Mass., Oct. 7-13, 1973. T. J. Faith, and A. F. Obsenschain, "Temperature, Illumination, and Fluence Depen- dence of Current and Voltage in Electron Irradiated Solar Cells," IEEE Photovoltaic Specialists Conf., Proc., Palo Alto, Calif., Nov. 11-13, 1973. A. H. Firester, M. E. Heller, and J. P. Wittke, "Inexpensive Laser Mirrors," Amer. J. Phys., Vol. 41, p. 1202, Oct. 1973. J. Gerber, J. P. Dismukes, and R. J. Ulmer, "Chemical Vapor Deposition of Cath- odoluminescent Phosphor Layers of Y2O3:Eu (Red) and La2O2S:Pr (Green) on TV Glass, Quartz, and Sapphire," 4th International Conf. on Chemical Vapor Deposition, Boston, Mass., Oct. 7-12, 1973. J. I. Gittleman, and B. Abeles, "Blocking Temperature Effects in Fine Nicker Particles," 18th Conf. on Magnetism and Magnetic Materials, Boston, Mass., Nov. 13-16, 1973. J. L. Greyer, "Possibilities for a New Compatible Quadruplex Video Recording Forman," 114th Conf. SMPTE, New York, Oct. 18, 1973. H. M. Gurk, "The Need for More Information and Less Data," Management and Utilization of Remote Sensing Data, Amer. Soc. of Photogrammetry, Sioux Falls, S.D., Oct. 29 -Nov. 2, 1973. J. J. Hanak, "Automation of the Search for Electronic Materials by Means of Cosput- tering," 1973 International Conf. on Sputtering and Its Applications, Montpellier, France, Oct. 2-5, 1973. G. Harbeke, "Anisotropic Exciton Polaritons," Swiss Physical Soc. Mtg., Lugano, Switzerland, Oct. 19-20, 1973. W. I. Harrington and R. E. Honig, "Ion Scattering Spectrometry Below 10 key," 144th Mtg. Electrochem. Soc., Boston, Mass., Oct. 7-12, 1973. M. Hecht and S. Henry, "Two -Dimensional Interpolative Compressor," Management and Utilization of Remote Sensing Data, Amer. Soc. of Photogrammetry, Sioux Falls, S.D., Oct. 30, 1973. R. Hirota, "Exact Three-Soliton Solution of the Two -Dimensional Sine -Gordon Equa- tion," Phys. Soc. of Japan Mtg., Keio Univ., Japan, Nov. 22-25, 1973. R. Hirota, "Higher Conservation Laws of the Toda Lattice," Physical Soc. of Japan Mtg., Keio Univ., Japan, Nov. 22-25, 1973. R. Hirota and K. Suzuki, "Theoretical and Experimental Studies of Lattice Solitons in Nonlinear Lumped Networks," Proc. IEEE, Vol. 61, No. 10, p. 1483, Oct. 1973. H. O. Hook, "The Capabilities and Limitations of Photolithography and Other Non - Electron -Beam Lithography," 20th National Vacuum Soc. Symp., New York City, Oct. 9-13. 1973. C. R. Horton, "User -Oriented Image Data Cartridge Recording System," Proc. Inter- national Telemetering Conf., Vol. 9, p. 86, Wash., D.C., Oct. 9-11, 1973. D. H. Hurlburt, "Multistrip Coupled Acoustic Surface Wave Filters," IEEE Ultrasonics Symp., Monterey, Calif., Nov. 1973. H. Kiess, "Charge Carrier Transport in ZnO," 2nd International Conf, on Electro - photography, Wash., D.C., Oct. 24-27, 1973. R. Klein, "On the Interpretation of Phonon Transport Theory for Structural Phase Transitions," Swiss Phys. Soc. Mtg., Lugano, Switzerland, Oct. 19-20, 1973. H. Kressel and M. Ettenberg, "Electro- and Photoluminescence of GaAS:Ge Prepared by Liquid Phase Epitaxy," Appl. Phys. Lett., Vol. 23, No. 9, p. 511, Nov. 1, 1973. H. Kressel, C. J. Nuese, and I. Ladany, "Luminescence from Ino.sGao.sP Prepared by Vapor -Phase Epitaxy," J. Appl. Phys., Vol. 44, No. 7, p. 3266, July 1973. B. J. Levin and G. Weidner, "A Distributed Pin Diode Phaser for Millimeter Wave- lengths," Microwave J., Vol. 16, No. 11, p. 42, Nov. 1973. A. F. Martz, "Can Taped ERTS Data by Previewed?" Management and Utilization of Remote Sensing Data, Amer. Soc. Photogrammetry, Sioux Falls, S.D., Oct. 29 -Nov. 2, 1973. R. J. McIntyre, "Factors Affecting the Ulitmate Capabilities of High -Speed Avalanche Photodiodes and a Review of the State -of -the -Art," International Electron Devices Conf., Wash., D.C., Dec. 1973. D. Meyerhofer, "Holographic and Interferometric Viewing Screens," Appl. Opt., Vol. 12, No. 9, p. 2180, Oct. 1973. B. P. Miller, G. A. Beck, and J. M. Barletta, "ERTS Two -Inch RBV Camera Performance Characteristics," AIAA J. Spacecraft and Rockets, Oct. 1973. L. S. Napoli, J. J. Hughes, W. F. Reichert, and S. Jolly, "GaAs FET for High -Power Amplifiers at Microwave Frequencies," 1973 National Telecommunications Conf., Atlanta, Ga., Nov. 26-28, 1973.
156 RCA Review Vol. 35 March 1974
J. Newman, "The Growing Importance of Costs and Ways to Maintain Cost Control on a Large Program in Today's Competitive Environment," Proc. 21st Joint Engineering Management Conf., Oct. 25-26, 1973. F. H. Nicoll, "Intense Recombination Radiation and Room Temperature Lasing in CdS Excited by High Voltage RF Current Pulses," Appl. Phys. Lett., Vol. 2, No. 8, p. 465, Oct. 15, 1973. M. Schlesinger and N. Feldstein, "Electron Microscope Investigations of Chemical Catalytic Systems for Plating onto Dielectric Substrates," Electrochem. Soc. Mtg., Boston, Mass., Oct. 7-12, 1973. D. L. Staebler, "Volume Holography, Science, and Application," 2nd International Conf. on Electrophotography, Wash., D.C. Oct. 24-27 1973. H. Staras, R. J. Klensch and J. Rosen, "A Microwave Automatic Vehicle Identfiica- tion System," IEEE Electrical and Electronics Conf., Chicago, Ill., Oct. 2, 1973. R. A. Sunshine and N. Goldsmith, "Use of the Infrared Sensitivity of the Silicon Vidicon to Diagnose Semiconductor Problems," IEEE 1973 Northeast Electronics Research and Eng. Mtg., (NEREM), Nov. 12-14, 1973. C. R. Thompson, "An Ultra -High Rate Digital Tape Recorder for Spacecraft Applica- tions," International Telemetering Conf., Proc., Vol. 9, p. 220, Oct. 9-11, 1973. C. R. Thompson, "A 40 MHz Multitrack Tape Recorder for Earth Observation Satellites," International Telemetry Conf., Wash., D.C., Oct. 9-11, 1973. M. Toda, S. Tosima, E. Shima, and T. Iwasa, "Variable Delay Devices Using Ferro - elastic and Ferroelectric Crystal Gd2(MoO4)3," IEEE Trans. Sonics and Ultrasonics, Vol. SU -20, No. 4, p. 376, Oct. 1973. J. L. Vossen, G. L. Schnable, and W. Kern, "Processes for Multilevel Metallization," Amer. Vacuum Soc. Material Symp., New York City, Oct. 9-12, 1973. A. L. Waksberg, "A Comparative Evaluation Between Internal External Polarization Modulation of Lasers," IEEE J. Quant. Electron., Vol. 9. No. 11, Nov. 1973. A. Waksberg, "Corrections to FM Laser Noise Effects on Optical Doppler Radar Systems," IEEE Trans. Aerospace and Electron. Systems, Vol. 9, No. 3, July 1973. C. P. Wen, Y. S. Chiang, A. F. Young and A. Presser, "High -Frequency Election Con- ductivity Mobility in Vapor -Base Homoepitaxial Silicon," Appl. Phys. Lett., Vol. 23, No. 7, p. 390, Oct. 1, 1973. R. K. Whener, "Soft Acoustic Modes in Elastic Layers with Electrostatic Surface Forces," Swiss Phys. Soc. Mtg., Lugano, Switzerland, Oct. 19-20, 1973.
HCA Review Vol. 35 March 1974 157
Patents Issued to RCA Inventors Fourth Quarter, 1973
October
P. R. Ahrens High Voltage Regulator (3,767,960) J. F. Alves III Push -Pull Darlington Amplifier with Turn -Off Compensation (3,764,929) T. G. Athanas and A. A. Anastasio Method of Making Beam Leads for Semiconductor Devices (3,765,970) P. K. Baltzer Radiation Resistant Lithium Ferrite Cores (3,767,581) R. L. Barbin Cathode -Ray Tube with Shadow Mask Having Random Web Distribution (3,766,419) R. A. Bartolini and D. Karlsons Reduction of Non -Linear Spatial Distortion in Holo- graphic System Employing Different Wavelengths for Recording and Playback (3,- 763,311) O. Ben-Dov Circularly Polarized Antenna (3,765,023) S. L. Bendell and C. A. Johnson Automatic Iris Control (3,767,853) R. F. Buntschuh and H. G. Rouland Rate Aided Ranging and Time Dissemination Receiver (3,769,589) T. W. Burrus Blanking Circuits for Television Receivers (RE27793) T. H. Campbell, P. Schnitzler, and L. J. West Lattice Network Using Distributed Im- pedance Transmission Lines (3,768,047) D. J. Carlson and J. B. George Circuit for Transmitting Digital Signals to Conventional Television Receiver (3,766,313) S. B. Deal Cathode -Ray -Tube -Yoke Combination with at Least Two Spaced Bodies of Organic Thermoplastic Material Therebetween and a Method of Making Said Com- bination (3,764,740) E. H. Del Rio and D. F. Pothier Self -Cleaning Read Head (3,763,352) M. Ettenberg and V. M. Cannuli Method for Epitaxially Growing Layers of a Semi- conductor Material from the Liquid Phase (3,767,481) B. F. Floden Film Handling Apparatus (3,765,586) P. Foldes Wideband Hybrid System (3,768,043) G. S. Gordon Method of Preventing Inoperation of a Component by Loose Particles of Material (3,765,941) F. B. Griswold Phase Measuring System (3,764,903) F. B. Griswold Analog Phase Tracker (3,769,602) S. E. Harrison and J. E. Goldmacher Direct Print -Out Photographic Optical Record- ing Media Comprising a Rhodamine Dye (3,767,408) D. G. Herzog and C. W. Reno Optical Data Transmission System Employing Polariza- tion -Shift, Multiple -Cavity Laser (3,766,393) R. A. Ito Communications Between Central Unit and Peripheral Units (3,766,530) L. B. Juroff Remote Control System for a Television Receiver (3,769,588) H. Kressel and H. Nelson Method of Forming Region of a Desired Conductivity Type in the Surface of a Semiconductor Body (3,762,968) R. D. Larrabee Method for Fabrication of Polycrystalline Films (3,767,462) D. W. Luz Instant -On Circuitry for AC/DC Television Receivers (3,767,967) R. J. Mason and N. R. Landry Waveguide Assembly Including a Toroid Having Di- electric Material Therein (3,768,040)
158 RCA Review Vol. 35 March 1974

J. J. McArdle and R. L. Rauck High Voltage Hold Down Circuit (3,767,963) R. S. Mezrich Enhanced Readout of Stored Holograms (3,767,285) M. N. Norman Blanking Circuits for Television Receivers (3,763,315) P. E. Norris and J. M. Shaw Method of Making MOS Transistors (3,766,637) R. L. Pryor Multifunction Full Adder (3,767,906) M. J. Shilling Interference Suppression Circuit (3,763,396) M. J. Shilling and E. Peak Interference Suppression Circuits (3,763,395) T. F. Simpson Color Image Reproducing Apparatus (3,767,845) S. A. Steckler Direct -Coupled Triggered Flip -Flop (3,767,943) J. A. Tourtellot Automatic Record Changer (3,762,723) C. L. Upadhyayula and B. S. Perlman Temperature Compensation of Transferred Elec- tron Amplifiers (3,768,029) E. J. Von Makkay and J. J. Pesce Cutting Pliers (3,763,560) H. R. Warren Slant Track Rotating Head Recorder -Reproducer System for Selective Retention of Special Information (3,766,328) P. K. Weimer Digital and Analog Data Handling Devices (3,763,480) L. J. West Transmission Line Using a Pair of Staggered Broad Metal Strips (3,769,617) H. E. White Linearity Correction Circuit for a Cathode Ray Tube (3,763,393)
November
J. J. Amodei and D. L. Staebler Process for Fixing Holographic Patterns in Electro - Optic Crystals and the Crystals Produced Thereby (3,773,400) D. S. Bond Apparatus and Method for the Automatic Navigation of a Sailing Vessel (3,771,483) T. J. Brady Cathode Ray Display Intensity Control Circuit (3,775,637) J. G. Butler and A. Mack Universal Data Quality Monitor (3,771,059) D. J. Carlson Modulator System (3,775,554) R. J. Clark Multiple Terminal Display System (3,774,158) R. E. Ernst and S. Yuan Microwave Double Balanced Mixer (3,772,599) R. A. Gange Light Modulator (3.772,612) P. J. Griffin Metal Mask Screen for Screen -Printing (3,769,908) B. A. Hegarty and L. H. Trevail High Heat Dissipation Solder-Reflow Flip Chip Tran- sistor (3,772,575) R. H. Hughes In -Line Electron Gun (3,772,554) S. W. Kessler, Jr. and R. F. Keller Method of Making a Electrically -Insulating Seal Between A Metal Body and a Semiconductor Device (3,769,688) H. B. Law Method for Making an Image Screen Structure for an Apertured-Mask Cathode -Ray Tube Using a Mask Having Temporary Apertures (3,770,434) F. J. Marlowe and C. M. Wine Electron Beam Addressable Memory System (3,774,116) W. E. Martin Apparatus for Remotely Measuring the Temperature and Emissivity of a Radiant Object Independent of the Object's Radiant Surface Property (3,770,973) J. F. Schanne and F. G. Nickl Article Identification Apparatus (3,770,944) I. Shidlovsky Cathodochromic Image Screen and Method for Preparing Cathodochromic Sodalite for Said Image Screen (3,773,540) W. I. Smith Dual Channel Balanced Line Type Modulator (3,772,601) W. I. Smith Balanced Line Type Pulser Circuit (3,772,613) D. F. Wright and R. A. Rubenstein Braking Arrangement Which Includes Hydraulic Pump (3,771,919)
December
A. F. Arnold Multilayer Heat Sink (3,780,795) V. Auerbach Controllable Heat Pipe (3,776,304) G. A. Cutsogeorge Voltage to Pulse Width Converter (3,781,870)
RCA Review Vol. 35 March 1974 159

E. B. Davidson Stabilized Photoresist Composition (3,776,736) W. J. Hannan Gated Holographic Coding System for Reducing Alignment Requirements (3,778,128) A. G. Lazzery Damping Means for Ultrasonic Transmitters (3,777,700) A. F. McDonie, R. D. Faulkner and J. L. Rhoads Non-Thermionic Electron Emissive Tube Comprising a Ceramic Heater Substrate (3,777,209) P. B. Pierson Digitally Variable Delay Time System (3,781,722) E. C. Ross Storage Circuit Using Multiple Condition Storage Elements (3,781,570) R. A. Shahbender Method of Making a Magnetic Recording Head (3,777,369) R. L. Spalding Electron Gun and Method of Assembly (3,777,210) H. Staras and J. Shefer Harmonic Radar Detecting and Ranging System for Automotive Vehicle (3,781,879) D. H. Vilkomerson Holographic Memory with Light Intensity Compensation Means (3,781,830) A. Waksberg and J. I. Wood Automatic Optical Bias Control for Light Modulators (3,780,296) R. Williams Apparatus for and Method of Reproducing an Electrostatic Charge Pattern (3,776,639) C. M. Wright Keyboard Encoder (3,778,815)
160 RCA Review Vol. 35 March 1974
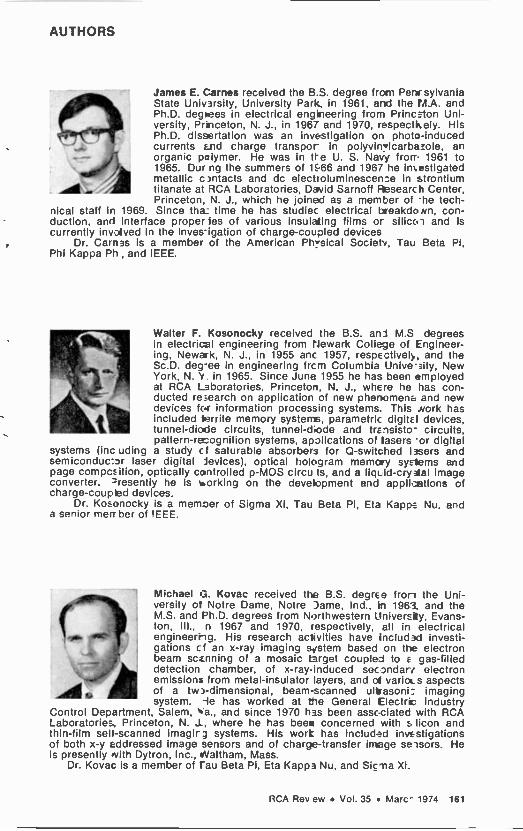
AUTHORS
James E. Carnes received the B.S. degree from Penr sylvania State University, University Park, in 1961, and the M.A. and Ph.D. degrees in electrical engineering from Princaton Uni- versity, Princeton, N. J., in 1967 and 1970, respectkely. His Ph.D. dissertation was an investigation on photo -induced currents and charge transpor In polyvin Icarbazole, an organic pclymer. He was in tte U. S. Navy from 1961 to 1965. Dur ng the summers of 1166 and 1967 he investigated metallic c ,ntacts and dc electroluminescence in strontium titanate at RCA Laboratories, David Sarnoff Research Center, Princeton, N. J., which he joined as a member of -he tech-
nical staff in 1969. Since tha_ time he has studiec electrical breakdown, con- duction, and interface proper ies of various insulating films or silicoi and is currently invdved in the investigation of charge -coupled devices.
Dr. Carnes is a member of the American Phwsical Societc, Tau Beta PI, Phi Kappa Ph and IEEE.
p` York, N. Y. in 1965. Since June 1955 he has been employed at RCA Laboratories, Princeton, N. J., where he has con- ducted research on application of new phenomena and new devices for information processing systems. This work has included 'write memory systems, parametric digital devices, tunnel -diode circuits, tunnel -d ode and transisto- circuits, pattern-reognition systems, applications of lasers -or digital
systems (inc uding a study cf saturable absorbers for Q -switched I Hers and semiconduc:Dr laser digital ievices), optical hologram memory systems and page compcsition, optically controlled p-MOS circu ts, and a liquid -crystal Image converter. resently he Is working on the development and appll.tIons of charge -coupled devices.
Dr. Kosonocky is a member of Sigma Xi, Tau Beta Pi, Eta Kappa Nu, and a senior mein her of IEEE.
Walter F. Kosonocky received the B.S. and M.S degrees '+r . in electrical engineering from Newark College of Engineer-
ing, Newark, N. J., in 1955 anc 1957, respectively, and the v'. Sc.D. deg-ee in engineering frcm Columbia University, New
Michael G. Kovac received th_e B.S. degree Iron the Unl- ti versity of Notre Dame, Notre Dame, Ind., in 1963, and the
M.S. and Ph.D. degrees from Northwestern University, Evans- ton, Ill., n 1967 and 1970, respectively, all in electrical
1.yw o engineering. His research activities have includ4d investi- gations cf an x-ray imaging system based on the electron beam scanning of a mosaic target coupled to a gas -filled detection chamber, of x -ray -induced secondari electron emissions from metal -insulator layers, and d various aspects of a two-dimensional, beam -scanned ult.asoni: imaging system. -le has worked at tie General Electric Industry
Control Department, Salem, s'a., and since 1970 has been associated with RCA Laboratories` Princeton, N. L, where he has been concerned with s licon and thin-film sell -scanned imagir3 systems. His worL has included investigations of both x -y addressed image sensors and of charge -transfer irnege sensors. He is presently with Dytron, Inc., .Naltham, Mass.
Dr. Kovac is a member of Tau Beta Pi, Eta Kappa Nu, and Siena Xi.
RCA Rev ew Vol. 35 Marc- 1974 161
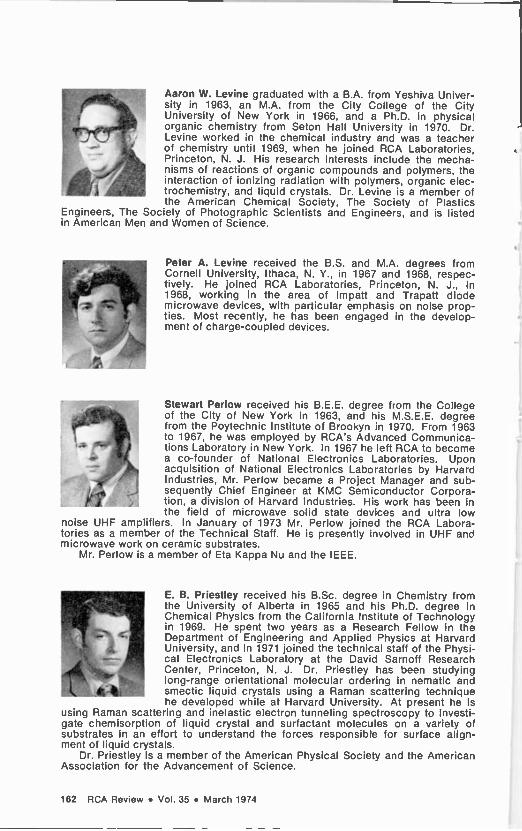
Aaron W. Levine graduated with a B.A. from Yeshiva Univer- sity in 1963, an M.A. from the City College of the City University of New York in 1966, and a Ph.D. in physical organic chemistry from Seton Hall University in 1970. Dr. Levine worked in the chemical industry and was a teacher of chemistry until 1969, when he joined RCA Laboratories, Princeton, N. J. His research interests include the mecha- nisms of reactions of organic compounds and polymers, the interaction of ionizing radiation with polymers, organic elec-
b, r trochemistry, and liquid crystals. Dr. Levine is a member of the American Chemical Society, The Society of Plastics
Engineers, The Society of Photographic Scientists and Engineers, and is listed in American Men and Women of Science.
Peter A. Levine received the B.S. and M.A. degrees from Cornell University, Ithaca, N. Y., in 1967 and 1968, respec- tively. He joined RCA Laboratories, Princeton, N. J., In 1968, working in the area of lmpatt and Trapatt diode microwave devices, with particular emphasis on noise prop - ties. Most recently, he has been engaged in the develop- ment of charge -coupled devices.
Stewart Perlow received his B.E.E. degree from the College of the City of New York in 1963, and his M.S.E.E. degree s from the Poytechnic Institute of Brookyn in 1970. From 1963 to 1967, he was employed by RCA's Advanced Communica-
- tions Laboratory in New York. In 1967 he left RCA to become a co-founder of National Electronics Laboratories. Upon acquisition of National Electronics Laboratories by Harvard
I Industries, Mr. Perlow became a Project Manager and sub- sequently Chief Engineer at KMC Semiconductor Corpora- tion, a division of Harvard Industries. His work has been in the field of microwave solid state devices and ultra low
noise UHF amplifiers. In January of 1973 Mr. Perlow joined the RCA Labora- tories as a member of the Technical Staff. He is presently involved in UHF and microwave work on ceramic substrates.
Mr. Perlow is a member of Eta Kappa Nu and the IEEE.
E. B. Priestley received his B.Sc. degree in Chemistry from the University of Alberta in 1965 and his Ph.D. degree in Chemical Physics from the California Institute of Technology in 1969. He spent two years as a Research Fellow in the Department of Engineering and Applied Physics at Harvard University, and in 1971 joined the technical staff of the Physi- cal Electronics Laboratory at the David Sarnoff Research Center, Princeton, N. J. Dr. Priestley has been studying long-range orientational molecular ordering in nematic and
.1111 - smectic liquid crystals using a Raman scattering technique he developed while at Harvard University. At present he is
using Raman scattering and inelastic electron tunneling spectroscopy to investi- gate chemisorption of liquid crystal and surfactant molecules on a variety of substrates in an effort to understand the forces responsible for surface align- ment of liquid crystals.
Dr. Priestley is a member of the American Physical Society and the American Association for the Advancement of Science.
11
162 RCA Review Vol. 35 March 1974
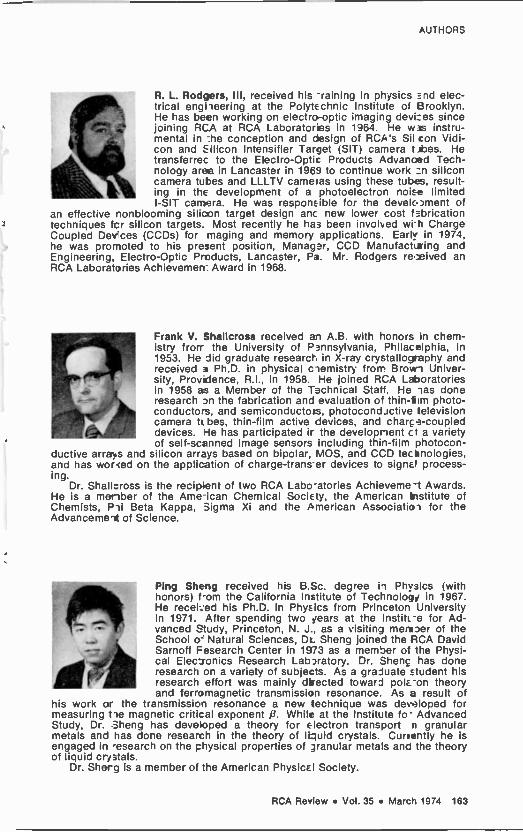
AUTHORS
R. L. Rodgers, III, received his :raining in physics and elec- trical engineering at the Polytechnic Institute of Brooklyn. He has been working on electro -optic imaging devices since joining RCA at RCA Laboratories in 1964. He w3S instru- mental in :he conception and design of RCA's Sil con Vidi- con and Silicon Intensifier Target (SIT) camera tubes. He transferrec to the Electro -Optic Products Advanced Tech-
' nology area in Lancaster in 1969 to continue work =n silicon camera tubes and LLLTV cameras using these tubes, result- ing in the development of a photoelectron noise limited I -SIT camera. He was responsible for the develcDment of
an effective nonblooming silicon target design anc new lower cost fabrication techniques fcr silicon targets. Most recently he has been involved wi-h Charge Coupled Dev'ces (CCDs) for maging and memory applications. Early in 1974, he was promoted to his present position, Manager, CCD Manufacturing and Engineering, Electro -Optic Products, Lancaster, Pa. Mr. Rodgers remived an RCA Laboratories Achievemen: Award in 1968.
d . ;. t ;. '_
Frank V. Shallcross received an A.B. with honors in chem- istry frorr the University of Pennsylvania, Philacelphia, in 1953. He did graduate research in X-ray crystallography and received a Ph.D. in physical chemistry from Brown Univer- sity, Providence, R.I., in 1958. He joined RCA Laboratories in 1958 as a Member of the Technical Staff. He has done
'' research on the fabrication and. evaluation o' thin-film photo- conductors, and semiconductors, photocondJctive television camera tubes, thin-film active devices, and chard -coupled '( . devices. He has participated it the development ct a variety
` of self -scanned image sensors including thin-film photocon- ductive arrays and silicon arrays based on bipolar, MOS, and CCD technologies, and has wor<ed on the application of charge-trans-er devices to signal process- ing.
Dr. Shall=ross is the recipient of two RCA Labo-atories Achieveme-t Awards. He is a menber of the Ame-ican Chemical Society, the American Institute of Chemists, Pin Beta Kappa, Sigma Xi and the American Association for the Advancement of Science.
Ping Sheng received his B.Sc. degree in Physics (with honors) f-om the California Institute of Technology in 1967. He received his Ph.D. in Physics from Princeton University in 1971. After spending two years at the Instituee for Ad- vanced Study, Princeton, N. J., as a visiting merrroer of the . School or Natural Sciences, Dr. Sheng joined the RCA David
r...ea Sarnoff Fesearch Center in 1973 as a member of the Physi- cal Elec7onics Research Laboratory. Dr. Shenc has done
1/11 research on a variety of subjects. As a graduate student his
4./»_ ' research effort was mainly directed toward pola-on theory and ferromagnetic transmission resonance. As a result of
his work or the transmission resonance a new technique was developed for measuring tie magnetic critical exponent i8. While at the Institute fo- Advanced Study, Dr. Sheng has deveoped a theory for Electron transport n granular metals and has done research in the theory of liquid crystals. Currently he is engaged in research on the physical properties of 3ranular metals and the theory of liquid crystals.
Dr. Sherg is a member of the American Physical Society.
RCA Review Vol. 35 March 1974 163
Issie P. Shkarofsky graduated in 1952 from McGill University, Montreal with a B.Sc. degree and first class honours in physics and mathematics. In the fo lowing year, 1953, he
n obtained his M.Sc. degree, conducting his research at the Eaton Electronics Research Laboratory, McGill University, in the fields of microwave optics and antennas. He then joined the microwave tube and noise group at the Eaton Electronics Research Laboratory, McGill University, and received his Ph.D. degree in 1957 with a thesis on modulated electron beams in space -charge -wave tubes and klystrons. After graduation, he joined the Research Labratory of RCA Lim-
ited, Montreal, where he has participated in research on microwave diffraction, millimeter waves, obstacle gain, laser applications, electromagnetic wave inter- action with plasmas, plasma kinetics, and plasmas in space. In 1973 he became a R&D fellow at the RCA Research and Development Laboratories, presently in the Physical Electronics Laboratory. In the field of plasma and space studies his particular interest has been in the following topics: plasma transport co- efficents, collisional effects in plasmas (slightly, partially and strongly ionized), Boltzmann and Fokker -Planck theory and appropriate expansions, bremsstrah- lung, magnetohydrodynamics, re-entry plasma physics, generalized Appleton- Hartree equation for the ionosphere, laboratory simulation of geophysical phenomena such as the interaction between the solar wind and the magneto- sphere and the sheaths around satellites, cyclotron harmonic resonances and related dispersion effects, diagnostics of plasmas by laser scattering, nonlinear mixing of plasma modes, the accuracy of Langmuir probes on satellites, VLF sheath admittance of antennas in the ionisphere, high power laser interaction with matter, turbulence and fusion.
Dr. Shkarofsky is a member of the Canadian Association of Physicists, of the American Physical Society, the American Geophysical Union, and of the National Research Council Advisory Committee on Physics. He is a professeur invité du Centre de Recherche INRS-Energie, Un. du Québec, and he is also the co -leader of the Task Force on Toroidal Machines for Project Fusion Canada.
Peter J. Wojtowicz received his B.Sc. degree in chemistry (with highest honors) from Rutgers University in 1953. He received his M.S. in chemistry in 1954 and his Ph.D. in
1 _ physical chemistry in 1956 from Yale University. He was a National Science Foundation Predoctoral fellow while at Yale, 1953-56. His thesis was concerned with the statistical mechanics of the order -disorder phenomenon in solids and the theory of molten salts and fluid mixtures. Dr. Wojtowicz joined the RCA Laboratories in 1956. He is a Member of the Technical Staff of the Physics and Chemistry of Solids Group of the Physical Electronics Research Laboratory. During
1966-67 he was acting head of the General Research Group. His research effort while at RCA has been directed chiefly toward the theory of magnetic materials including the quantum and statistical mechanics of the thermal, structural, and magnetic properties of these substances. This work included the theory of the cooperative Jahn -Teller effect, the statistical mechanics of magnetic interactions and phase transitions, the theory of magnetic semiconductors, the theory of granular ferromagnetic metals, and the theory of the application of ferrites and garnets to various magnetic devices. He is currently engaged in the theory of liquid crystals and liquid -crystal phase transformations. Dr. Wojtowicz is the recipent of two RCA Laboratories Achievement Awards for the years 1962 and 1966. He is a fellow of the American Physical Society and a member of Sigma Xi and Phi Beta Kappa.
164 RCA Review Vol. 35 March 1974
!
STATEMENT OF OWNERSHIP Statement of Ownership, Management and Circulation (Act of October 23, 1962, Section 4369, Title 39, United States Code.)
1. Date of filing: October 19, 1973. 2. Title of publication: RCA REVIEW. 3. Frequency of Issue: Quarterly. 4. Location of known office of publication: RCA Laboratories, Princeton, New Jersey, 08540. 5. Location of headquarters or general business offices of the publishers: RCA Laboratories, Princeton, New Jersey, 08540. 6. Names and addresses of Publisher and Editor: Publisher, RCA Laboratories, Princeton, New Jersey, 08540; Editor: R. F. Ciafone, RCA Laoora- tories, Princeton, New Jersey, 08540. 7. Owner: RCA Corporation. 30 Rockefeller Plaza, New York, New York, 10020; Merrill, Lynch, Pierce, Fenner 8 Smith, 70 Pine Street, New York, New York, 10005; Cudd 8 Company, c/o Chase Manhattan Bank, 1 Chase Manhattan Plaza, New York, New York, 10005; Martin B. Seretean, c/o Coronet Industries, Box 1248, Dalton, Georgia, 30720; Burl Jackson Bandy, c/o Coronet Industries, Box 1248, Dalton, Georgia, 30720; TNOM 8 Com- pany, P.O. Box 577 Central Station, St. Louis, Missouri, 63188.
I certify that the statements made by me above are correct and complete.
Ralph F. Ciafone, Editor

1


![ESOPS] - World Radio History](https://static.fdokumen.com/doc/165x107/631e25131aedb9cd850f9e54/esops-world-radio-history.jpg)