
The geology and genesis of high-grade hematite iron ore deposits
Upload
independentCategory
view
0download
0
rticles is
as a functionEPLS and
Journal of Colloid and Interface Science 280 (2004) 417–430www.elsevier.com/locate/jcis
Characterization of colloidal hematite particle shape anddispersion behavior
S. Manickavasagama, C. Saltiela,∗, Herbert Giescheb
a Synergetic Technologies, Inc., One University Place, Suite D210, Rensselaer, NY 12144, USAb NYSCC at Alfred University, 2 Pine Street, Alfred, NY 14802, USA
Received 13 April 2004; accepted 5 August 2004
Available online 11 September 2004
Abstract
An elliptically polarized light scattering (EPLS) technique for the size and shape characterization of ellipsoidal hematite papresented. The hematite particles are synthesized by aging aqueous FeCl3 or Fe(NO3)3 solutions at 100◦C. Different reaction conditionscreate particles of aspect ratios between 1 (spherical) and 8 (elongated). Cross-sectional diameter and aspect ratio are observedof reaction (aging) time. Growth of the elongated particles, as well as their fractal aggregation behavior, is characterized usingcomparisons are made with photon correlation spectroscopy and TEM measurements. 2004 Elsevier Inc. All rights reserved.
Keywords:Light scattering; Fractal; Hematite; Shape characterization
en-andcelly,pa-i-di-en
tionMiee
dualer ofoidsely
toim-the
cip-re
gree
be-
mi-allyssedresdi-a-mi-p-rynticles
in-
1. Introduction
On-line characterization of colloidal particles in suspsion has long been focused on determination of sizesize distribution—critical parameters that strongly influenprocess efficiency and product quality. Almost universaparticle sizing instruments rely on a one-dimensionalrameter for size characterization. The size and size distrbution is expressed in terms of an “effective” sphericalameter based on the physical principle of the measuremtechnique. For example, particle size and size distribubased on static light scattering almost always employsor Fraunhofer theories[1], both of which assume that thparticles are spherical.
One-dimensional size descriptions are advantageousto their simplicity of measurement and analysis. Sphericsize equivalents, however, can be misleading for a numbclasses of aspherical particles, such as elongated ellipscylinders, or platelets. Simply put: they do not accurat
* Corresponding author.E-mail address:[email protected](C. Saltiel).
0021-9797/$ – see front matter 2004 Elsevier Inc. All rights reserved.doi:10.1016/j.jcis.2004.08.031
t
e
,
reveal key particle geometric parameters. This inabilitycharacterize elongation using current techniques is anportant shortcoming in several industries. For example,strength and porosity of gypsum is influenced by the preitation conditions and different precipitation conditions afound to yield different particle shapes[2]. The optical prop-erties of pigment particles are also affected to a large deby their size and/or shape[2]. Controlled crystal orientation(or shape) is a key factor that determines the anistropichavior of certain magnetic materials[2].
Identification of agglomerates of particles and deternation of their structure (size and shape) is also a criticimportant aspect of particle characterization not addreby the “effective” sphere approach. Agglomerate structucan be aspherical, particularly those with low fractalmension[3] (as formed during diffusion limited aggregtion [4]). The presence of agglomerates can lead tocrostructural defects[5] and to undesirable material proerties[6], and makes identification of true particle size vedifficult. Agglomerate identification is especially importain the processing of nanophase materials, where parthave a strong tendency to agglomerate due to strong

418 S. Manickavasagam et al. / Journal of Colloid and Interface Science 280 (2004) 417–430
ofnlyof
an
arti-lome oave
mi-her-,her-ng:inggth,
lightnvoainsl-veare
odsrticledi-
--ary,as-
nd aereas-
als caentti-
ooter-
o-fel-ine
tionof
nec-gesc-idal
ar-peof
entnt ra-e ofandde-
an betion
on)
m-
-es,
dedthe-ship
inand
fthect ra-
ly
-h ofre-erag-dld
terparticle attractive forces. A thorough understandingcolloidal dispersion behavior and stability control can obe achieved through robust andaccurate characterizationkey physical parameters that describe agglomerate sizestructure.
There has been growing interest in nonspherical pcle characterization in severaldisciplines, including materiascience, atmospheric science, remote sensing, astronand biomedicine. These areas represent a wide rangparticle length scales. Consequently, electromagnetic wscattering techniques (which range from the X-ray tocrowave wavelengths) have been in the forefront of aspical particle characterization research[7]. Fundamentallyaspherical particle characterization is similar to that of spical particle characterization using static light scatteri(1) algorithm development for determining light scattersignatures, as a function of scattering angle, wavelenand optical properties; (2) measurement of scatteredintensities at several scattering angles; and (3) decolution, where experimental signatures are matched agtheoretical and numerical predictions generated by the agorithm. Given the complexities of electromagnetic wainteraction with aspherical particles, numerical methodsalmost always employed. A number of numerical methhave been developed to study electromagnetic wave–painteractions for irregularly shaped particles (e.g., discretepole[8], control volume[9], and T-matrix[10]). While algo-rithm development is maturing quickly, little has been published regarding deconvolution development since: (1) deconvolution algorithms are generally considered proprietand (2) development of hardware capable of discerningpherical particle shapes is complex and has not yet fouwidespread commercial outlet. Unlike the “effective” sphbased static light scattering methods, determination ofpherical geometric parameters requires a scattering signthat is sensitive to shape. Such shape-sensitive signalbe achieved by modulating the polarization of the incidand scattering light—the trick is determination of the opmal polarization set[11]. Using elliptically polarized lightscattering (EPLS), this has been shown for fractal-like sagglomerates[12] and agglomerated, fractal-like agglomates of nanoscale titanium[13].
In this paper we investigate the use of elliptically plarized light scattering for determination of the shape oelongated particles and their dispersion behavior. Usinglipsoidal hematite particles as a model system, we examthe evolution of particle size and shape during precipita(in situ) under various reaction conditions. The resultsthese measurements are furthercompared with transmissioelectron microscopy (TEM) and photon correlation sptroscopy (PCS). Our goal is to respond to the challenpresented in[14,15]—the development of improved charaterization tools and methodologies for nanoscale colloparticles.
d
y,f
-t
n
2. Materials and methods
2.1. Elliptically polarized light scattering
The light scattered from small particles or groups of pticles contain significant information about particle shaas well as their size. In particular, the polarization statescattered light is sensitive to the polarization of the incidlight and the scattering angleθ . Our interest, determinatioof ellipsoidal size (cross-sectional diameter) and aspectio, is best achieved by examining the polarization statscattered light for a range of incident polarization statesscattering angles. The particle light scattering signaturependencies on polarization state and scattering angle csuccinctly expressed by considering the general polarizastates of incident and scattered light (elliptical polarizatiand their relationship.
The intensity and state of polarization of light is copletely specified by the four-element Stokes vectorK [1],
(1)K = [I Q U V ]T,
whereI represents the total intensity,Q the difference between the horizontally and vertically polarized intensitiU the difference between the+45◦ and −45◦ intensities,V the difference between the right-handed and left-hancircularly polarized intensities, and T represents the mamatical transpose operation on the vector. The relationbetween the Stokes vector of incident lightKi and that ofscattered lightKs can be expressed in terms of the 4× 4Mueller scattering matrix [S(θ)]:
(2)(Ks) = [S(θ)
](Ki) =
S11 S12 S13 S14S21 S22 S23 S24S31 S32 S33 S43S41 S42 S34 S44
(Ki).
Scattering from a cloud of spherical particles will resultseveral symmetries: (1) The upper-right and lower-left helements are zero; (2)S11 = S22 and S33 = S44; and (3)S12 = S21 andS34 = −S43. Importantly, the asphericity othe particles (e.g., their aspect ratio) is proportional todifferences between the diagonal elements; as the aspetio increases,S11 − S22 andS33 − S44 increase.
The scattering matrixS(θ) for a suspension of randomoriented particles can be expressed as[16]
(3)[S(θ)] = 1/(kr)2
S11 S12 0 0S12 S22 0 00 0 S33 S340 0 −S34 S44
,
wherek = 2π/λ is the wave number (λ is the effective wavelength of light in the scattering media, i.e., the wavelengtthe incident light divided by the real part of the index offraction of the media) andr is the distance from the centof the particle to the light detector. If the particles areglomerated (effectively forming a large, irregularly shapeparticle), Eq.(3) holds for the agglomerates just as it wou
S. Manickavasagam et al. / Journal of Colloid and Interface Science 280 (2004) 417–430 419
nc-e.es,ringles
ea-nce
pri-Theedis
ivethe-ofthe
thearesgthi-
yl di-the
arearearti-nd-cles
the
rti-gon a
g arter-andtheers,na-tion
Then ther or
retheirnt in
ck-n aon
athwoize
entr-
s sit-areon
for primary particles. Each of the matrix elements is a fution of the scattering angleθ and particle size and shapA distribution of different size particles, or agglomeratwill have a characteristic scattering matrix at each scatteangle location. Similarly, a mix of small and large particwill have a characteristic scattering matrix profile.
The structure of agglomerates can be examined by msuring the scattering matrix elements since the interferepatterns of the scattered radiation from the individualmary particles depend strongly on the scattering angle.wave vector,q = 4πλ−1 sin(θ/2), acts as a probe of thagglomerate structure. Primary particles separated by atance less than 1/q scatter in phase, resulting in constructinterference. When the size of the radius of gyration ofagglomerate is below the length scale 1/q , the measured radiation intensity is proportional to the square of the sumthe scattering masses (or number of particles). Above1/q region, scattering is incoherent and the intensity ofscattered radiation is proportional to the sum of the squof the individual scattered masses. Conversely, if the lenscale 1/q is below the size of the primary particle, the incdent light beam sees only the smooth surfaces of the primarparticles and not the agglomerate structure. The fractamension of the agglomerate structure can be found ifscattered signatures follow the power law relation[17]
(4)S11 − S12 ∼ q−Df
in the regime whererp < 1/q < Rg (rp = primary particleradius andRg = radius of gyration—these parameterscommonly defined for spherical primary particles, wenot aware of any definitions for elongated or aspherical pcles); i.e., the relation is valid for wave numbers correspoing to length scales larger than the diameter of the partiand smaller than the size of the agglomerates.S11 − S12, of-ten referred to as the agglomerate structure function, is
-
scattered light component when the incident light is vecally polarized[8]. Df can easily be determined by findinthe slope of the measured scattering matrix elementslog–log plot ofS11 − S12 vs q .
2.2. EPLS experimental system configuration andoperation
Polarization state modulation is performed by placinseries of polarizers and retarders (half-wave and quawave plates) between the light source and the particlesbetween the particles and a light detector. By adjustingorientation of the optical axes of the polarizers and retardmany different angular variations of the scattered light sigtures of the particles can be obtained, enabling determinaof each of the six unique scattering matrix elements.magnitude of the elements of these matrices depends oorientation of the corresponding optical element (retardepolarizer).
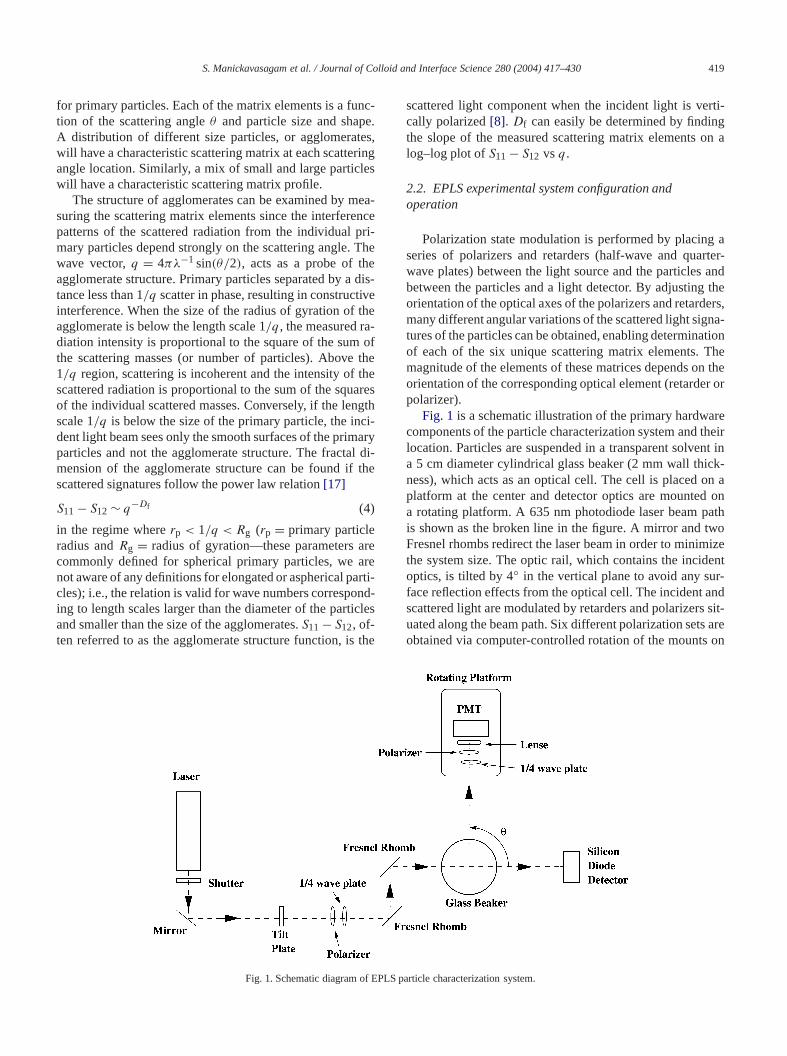
Fig. 1 is a schematic illustration of the primary hardwacomponents of the particle characterization system andlocation. Particles are suspended in a transparent solvea 5 cm diameter cylindrical glass beaker (2 mm wall thiness), which acts as an optical cell. The cell is placed oplatform at the center and detector optics are mounteda rotating platform. A 635 nm photodiode laser beam pis shown as the broken line in the figure. A mirror and tFresnel rhombs redirect the laser beam in order to minimthe system size. The optic rail, which contains the incidoptics, is tilted by 4◦ in the vertical plane to avoid any suface reflection effects from theoptical cell. The incident andscattered light are modulated by retarders and polarizeruated along the beam path. Six different polarization setsobtained via computer-controlled rotation of the mounts
Fig. 1. Schematic diagram of EPLS particle characterization system.
420 S. Manickavasagam et al. / Journal of Colloid and Interface Science 280 (2004) 417–430
ultiglesro-ch
as ater-
10
e
tion
was-er-om-s
onµm
8rac-sc-rea
sure
-t ra-
pledsig-riza
l sizeas
al
ce-
,e-of
S.ach
-sed
Af-ndzes)
er-ples
ack-ere
r-emalln,ne
ce-
i-ylon-al
M-ions” atr-coldCl9
ssionLlt-ndatedrt ofer-yther
tru-the
ppednel
tst 3
which the retarders and polarizers are seated. Photomplier tube (PMT) measurements at different scattering anare accomplished by controlling the movement of thetating platform via the data acquisition software for eapolarization set. Data acquisition is thus programmedmulti-angle/multi-polarization scanning device. The scating angle detection range is preprogrammed to scan fromto 162◦ in increments of 4◦. Variations inθ from 10 to 162◦correspond to a length scaleq−1 = 38–436 nm. The entirsystem is optically sealed to eliminate stray light.
2.3. Deconvolution
The procedures used in this study for sample preparayield ellipsoidal shaped hematite particles[18,19]. Conse-quently, a large database of scattering matrix elementscreated from detailed computersimulations of light scattering from ellipsoidal particles. The simulations were pformed on a 16 node IBM RS6000 SP parallel supercputer using a T-matrix method[10]. The database containthe scattering matrix profiles (scattering anglesθ = 0–180◦in increments of 2◦) for particle cross sections (basedthe midpoint of the particle) between 50 nm and 2(in increments of 50 nm), with aspect ratios from 1 to(in integer increments) for each size. The complex reftive index of the hematite,m = n + ik, values are taken an = 3.0 [20] andk = 0.001, and the real part of the refrative index of water, the suspension media, is 1.33. Theserefractive index values are also used for the PCS meaments.
The deconvolution scheme determines the volume fraction in terms of both particle cross section and aspectio, i.e., a three-dimensional plot is created for each samanalysis. The deconvolution scheme is an iterative methothat minimizes the differences between the measurednals and the equivalent database entries. Since six polations are used in the measurement, the two-dimensionaanalysis cycles through all sixpolarizations. In addition,plot of log(S11 − S12) vs log(q) for each sample determinethe existence of fractal-like agglomerates and their fractdimension.
2.4. Preparation of ellipsoid hematite particles
2.4.1. Cl9 seriesThe particles are synthesized by following a pro
dure previously reported by Matijevic and Scheiner[18].A 0.28 M stock solution of FeCl3 (A.C.S. reagent gradeAldrich Chemical Co., Milwaukee, WI, USA) was prpared and filtered through a 0.2 µm nylon filter. Aliquotsthe FeCl3–stock solution, distilled water, and HCl (A.C.reagent grade, Aldrich Chemical Co.) were added to refinal concentrations of 0.09 M FeCl3 and 0.01 M HCl. Several 20 ml samples of this solution were then stored in cloPyrex test tubes and “aged” at 100±1◦C in a forced air oven
-
l-
-
(Despatch 16307A, Despatch, Minneapolis, MN, USA).ter specific time intervals the test tubes were removed aquenched under cold water, which essentially stops (freethe precipitation reaction.
Some initial light scattering measurements were pformed on samples at that stage, but the quenched samshowed significant agglomeration caused by the high bground electrolyte concentration. Hence the samples wfurther “cleaned” by repeatedcentrifugation and redispesion in water. An Intertest E-50/2001-E centrifuge syst(Intertest Corp., Fremont, CA, USA) with a DuPont SorvHB-6 rotor (E.I. du Pont de Nemours and Co., WilmingtoDE, USA) was used. Typically the centrifugation was dofor 10 min at 10,000 rpm (approximately 16,000g max.).
2.4.2. Cl1, Cl2, Cl3 seriesThese particles were synthesized by following a pro
dure previously reported by Ozaki et al.[19]. A 0.28 M stocksolution of FeCl3 (A.C.S. reagent grade, Aldrich Chemcal Co.) was prepared and filtered through a 0.2 µm nfilter. Aliquots of the FeCl3–stock solution, distilled water, and NaH2PO4 (A.C.S. reagent grade, Aldrich ChemicCo.) were added to reach final concentrations of 0.02FeCl3 and 0.1, 0.2, and 0.3 M NaH2PO4 (respectively series 1 through 3). Several 20 ml samples of these solutwere then stored in closed Pyrex test tubes and “aged100± 1◦C in a forced air oven. After specific time intevals the test tubes were removed and quenched underwater. The same cleaning procedures performed for thesamples were used for the Cl1, Cl2, and Cl3 samples.
2.5. Supportive characterization
2.5.1. Transmission electron microscopy (TEM)Particle size and shape were observed using transmi
electron microscopy (TEM) (JEOL TEM 2000 FX, JEOUSA Inc., Peabody, MA, USA) using an acceleration voage of 120 kV. Drops of the “cleaned” (centrifugation aredispersion in water) samples were placed on carbon cocopper grids (SPI Supplies, West Chester, PA, USA). Pathe liquid drained off on the side of the grid into an undlying filter paper or evaporated when the grids were brieflplaced in vacuum. The grids were then coated with anolayer of carbon to increase the stability.
2.5.2. Photon correlation spectroscopy (PCS)The BI-90Plus particle size analyzer (Brookhaven Ins
ments Corp., Holtsville, NY, USA) was used to measureparticle size in the cleaned samples. The unit was equiwith a 25 mW 679 nm laser and a BI-9000AT 510 chancorrelator.
The cleaned samples were further diluted (to reach counrates of 200 to 300 kcps) and briefly sonicated. At learepeat runs of 3 min were performed for each sample.
S. Manickavasagam et al. / Journal of Colloid and Interface Science 280 (2004) 417–430 421
.
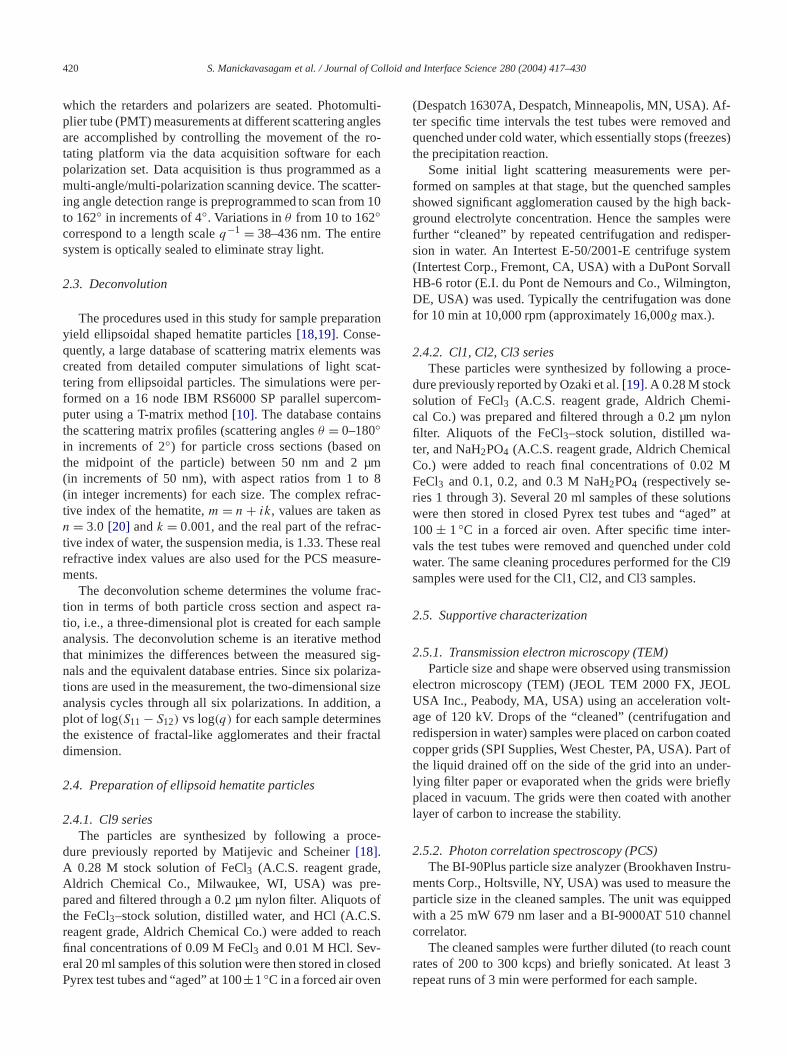
(a) Aggregated (b) Dispersed
Fig. 2. Volume percentage expressed as functions of size and aspect ratio for the pre- and post-centrifuged Cl9-1 sample. Presence of agglomerated particles isevidenced by the presence of large cross-section particles in the originalsamples, while few large cross section particles are shown in the centrifuged samples
chedarti-notre-the
hatpar-thethect
own
oreme-Thed)thll asss-tios
in--uresost
sionof
-rti-
drti-methedi-
gedheseen-daluear-ins
eenbutu-ure
t ra-edoss
on-tionn forthear to
3. Results and discussion
3.1. Cl9 series
Initial EPLS measurements on the samples as quenindicated a large degree of agglomeration and a useful pcle size or shape interpretation of the primary particles isrevealing. However, the cleaning step (centrifugation anddispersion) is able to reverse the agglomeration and showsamples with their primary particles. It should be noted tthe centrifugation is not used to discard any precipitatedticles, but rather it removes remaining electrolyte fromsolution and thus helps to prevent agglomeration due toinitially higher ion concentration in the solution. The effeof cleaning on the Cl9-1 sample is shown inFig. 2(which isdiscussed below); all other data in this publication are shfor “cleaned” samples only.
The Cl9-1 sample was aged for 38 h 23 min at 100◦C.Figs. 2a and 2bdisplay EPLS characterization results fthe original and centrifuged samples, respectively. Volumpercent is plotted as functions of two geometric paraters: (1) cross-sectional diameter and (2) aspect ratio.particle size distribution of the original (not centrifugesolution in Fig. 2a shows a combination of particles wilarge cross-sectional diameters (550–700 nm) and smapect ratio (1–4) combined with particles of small crosectional diameter (100–200 nm) and large aspect ra(4–8). The power-law plot of this sample (not shown)dicated a fractal dimension of 2.8. Given the high fractal dimension, representing very compact agglomerate structthe group of high cross-sectional diameter particles m
-
,
probably represents compact agglomerates. This concluis confirmed upon examination of the TEM micrographpost-centrifuged particles (seeFig. 5c), which shows a combination of compact clusters of elongated ellipsoidal pacles with individual particles.Fig. 2b (solution measureafter centrifugation), on the other hand, shows few pacles with large cross-sections and a much larger volupercent of smaller cross-sectional particles—indicatingbreak-up of agglomerates into individual particles. In adtion, there was no indication of agglomerates in centrifusamples based on fractal analysis (presented below). Tresults provide some indication of the efficiency of the ctrifugation process for obtaining a well-dispersed colloisolution. (A note of caution: differentiation between trresults and numerical artifacts is problematic with all pticle size deconvolution schemes—ours is no different. Bwith very small volume percentages (less than∼3%) are al-ways suspect. Deconvolution that includes iteration betw6 polarizations helps to minimize numerical artifacts,they may not be eliminated entirely. Minimization of nmerical artifacts is a topic that will be addressed in a futstudy.)
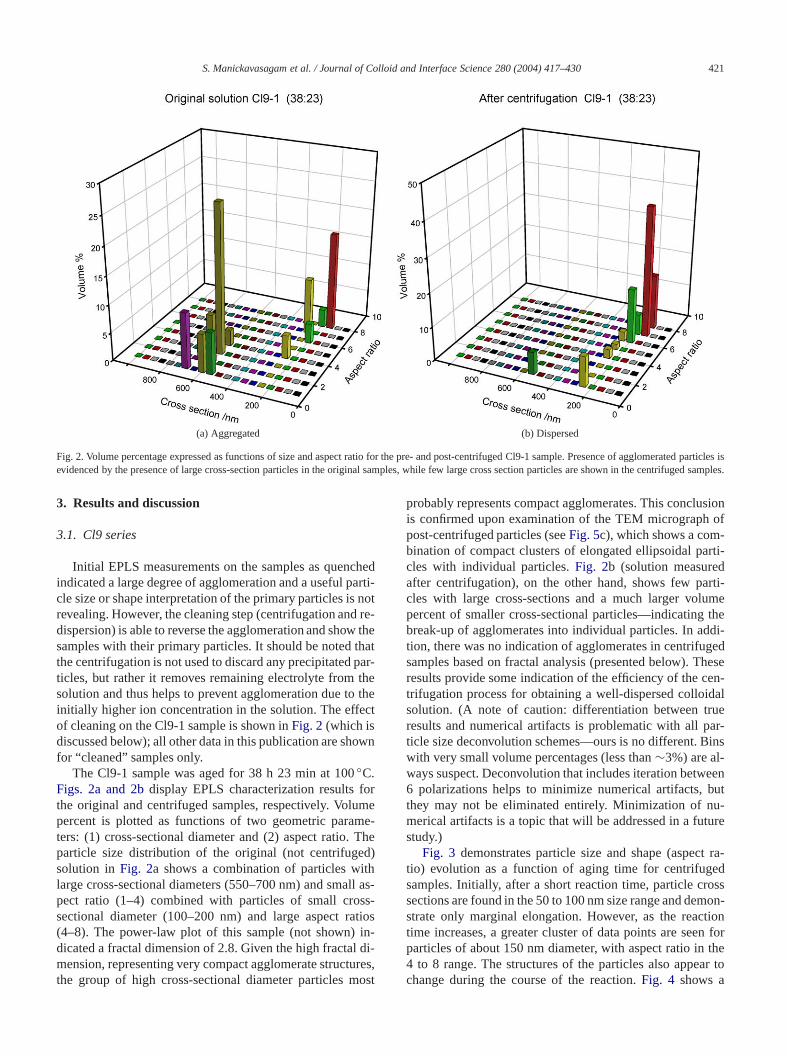
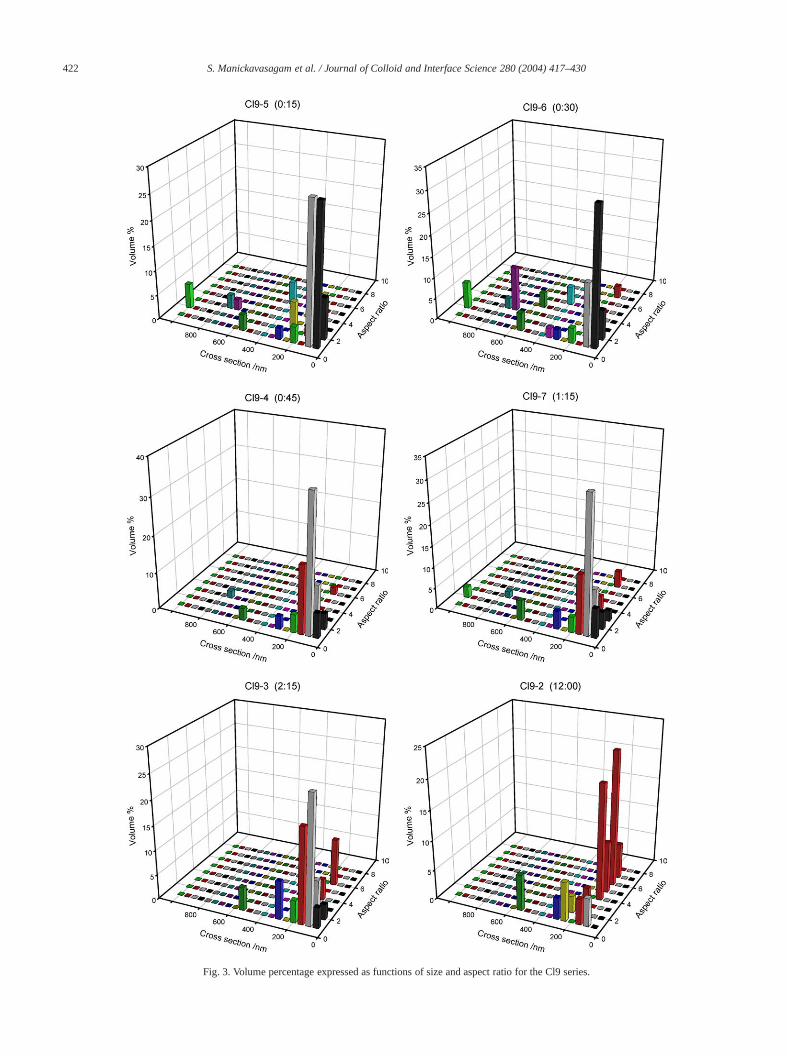
Fig. 3 demonstrates particle size and shape (aspectio) evolution as a function of aging time for centrifugsamples. Initially, after a short reaction time, particle crsections are found in the 50 to 100 nm size range and demstrate only marginal elongation. However, as the reactime increases, a greater cluster of data points are seeparticles of about 150 nm diameter, with aspect ratio in4 to 8 range. The structures of the particles also appechange during the course of the reaction.Fig. 4 shows a
422 S. Manickavasagam et al. / Journal of Colloid and Interface Science 280 (2004) 417–430
Fig. 3. Volume percentage expressed as functions of size and aspect ratio for the Cl9 series.

S. Manickavasagam et al. / Journal of Colloid and Interface Science 280 (2004) 417–430 423
entsnts,rterlo-
gedent,rva-ikethersbe
gre-
hekingm-ese
n ad-e-e
arsbe-ringtionson
iclebutom
l3sizetual
be-nm
av-3.
to
Fig. 3. (Continued.)
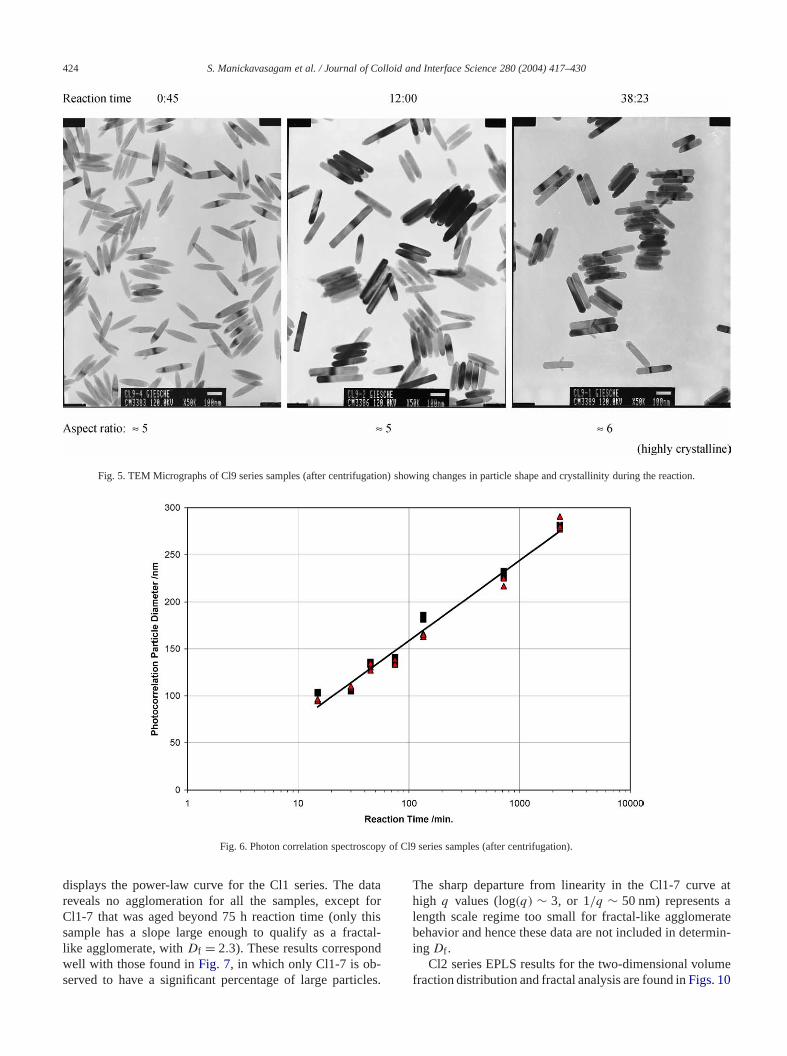
plot of the difference between the scattering matrix elemS11−S12 vsq (note, these are obtained from measuremenot deconvolution results). The very low slopes at shoreaction times indicate that primary particles do not aggmerate to form fractal-like structures. In the samples abeyond 12 and 38 h reaction the curves are quite differwith much larger slopes. However, because of the cuture in these lines, there is no solid indication of fractal-lagglomerates (the power law requires straight lines inlog(S11 − S12) vs log(q) graph). Rather, the curve appeamore indicative of larger, solid particles. This effect cancorrelated with TEM micrographs, as demonstrated inFig. 5.The shape of the individual particles, as well as their ag
gation behavior, is changing with reaction time. Initially tprimary particles have a more ellipsoidal shape and stacis not pronounced. However, after 12 h reaction time, copact bundles of parallel-aligned particles are formed. Thcompact bundles are not fractal-like agglomerates.
Photon correlation spectroscopy (PCS) was used as aditional technique to follow particle growth during the prcipitation reaction.Fig. 6is a plot of the average particle sizversus reaction time for two consecutive tests (squares= 1sttest, triangles= 2nd test). The average particle size appeto grow exponentially in time. The size data comparisontween EPLS, TEM, and PCS correlate quite well considethe fact that each technique uses quite different assumpto derive a “particle size.” PCS, for example, is basedparticle diffusion behavior to calculate the average partsize—obviously larger than the diameter of an ellipsoidsmaller than ellipsoid length when compared with data frTEM micrographs.
3.2. Cl1 through Cl3 series
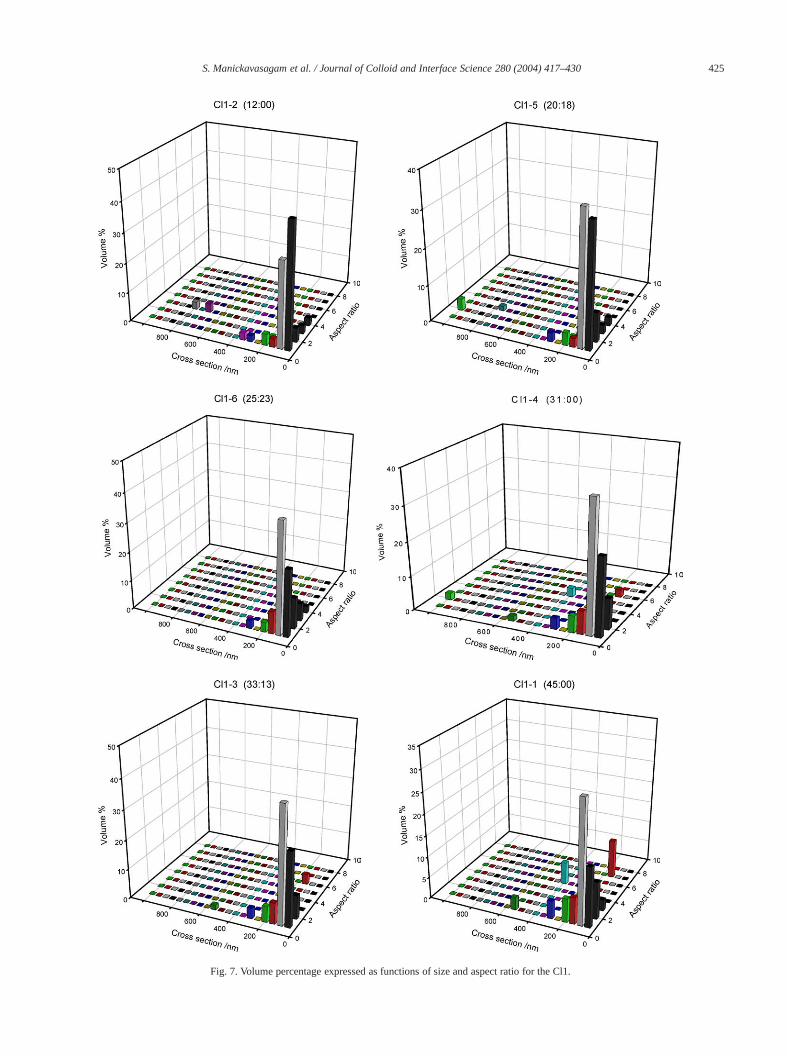
Compared with the Cl9 samples, the Cl1 through Csamples contained hematite particles that are smaller inand less elongated. It also took much longer for the acprecipitation reaction to occur.Fig. 7 contains the EPLSresults for Cl1. The average particle cross section istween 50 and 100 nm, slightly increasing toward 100as the reaction proceeds. The elongation of the particlesis also not very pronounced, as one can see from theerage aspect ratio, which shifts slightly from 1 to 2–The transmission electron micrograph shown inFig. 8 con-firms this observation, showing ellipsoidal particles of 50100 nm diameter with an aspect ratio of 2 to 2.5.Fig. 9
Fig. 4. Fractal analysis of Cl9 series samples. Small slopes and curved lines indicate no fractal-like agglomerate structures. Reaction time (h:min) is listed inthe parentheses in the legend.
424 S. Manickavasagam et al. / Journal of Colloid and Interface Science 280 (2004) 417–430
Fig. 5. TEM Micrographs of Cl9 series samples (after centrifugation) showing changes in particle shape and crystallinity during the reaction.
Fig. 6. Photon correlation spectroscopy of Cl9 series samples (after centrifugation).
atafor
thisctal-nd
cles
atae-
me
displays the power-law curve for the Cl1 series. The dreveals no agglomeration for all the samples, exceptCl1-7 that was aged beyond 75 h reaction time (onlysample has a slope large enough to qualify as a fralike agglomerate, withDf = 2.3). These results correspowell with those found inFig. 7, in which only Cl1-7 is ob-served to have a significant percentage of large parti
.The sharp departure from linearity in the Cl1-7 curvehigh q values (log(q) ∼ 3, or 1/q ∼ 50 nm) representslength scale regime too small for fractal-like agglomeratbehavior and hence these data are not included in determining Df .
Cl2 series EPLS results for the two-dimensional volufraction distribution and fractal analysis are found inFigs. 10
S. Manickavasagam et al. / Journal of Colloid and Interface Science 280 (2004) 417–430 425
Fig. 7. Volume percentage expressed as functions of size and aspect ratio for the Cl1.

426 S. Manickavasagam et al. / Journal of Colloid and Interface Science 280 (2004) 417–430
ethe
on iwer
tri-
y-the
eters-l-
pect
these,
re-izemi-htlythe
Fig. 7. (Continued.)
and 11, respectively.Fig. 10 shows most particles in thsample with large cross-sectional diameters—indicatingpresence of agglomerates. The agglomerate conclusivalidated inFig. 11, where each data curve obeys the polaw (Df varying between 1.5 and 2.0). BothFigs. 10 and 11indicate no significant change over time in either size disbution or fractal dimension.
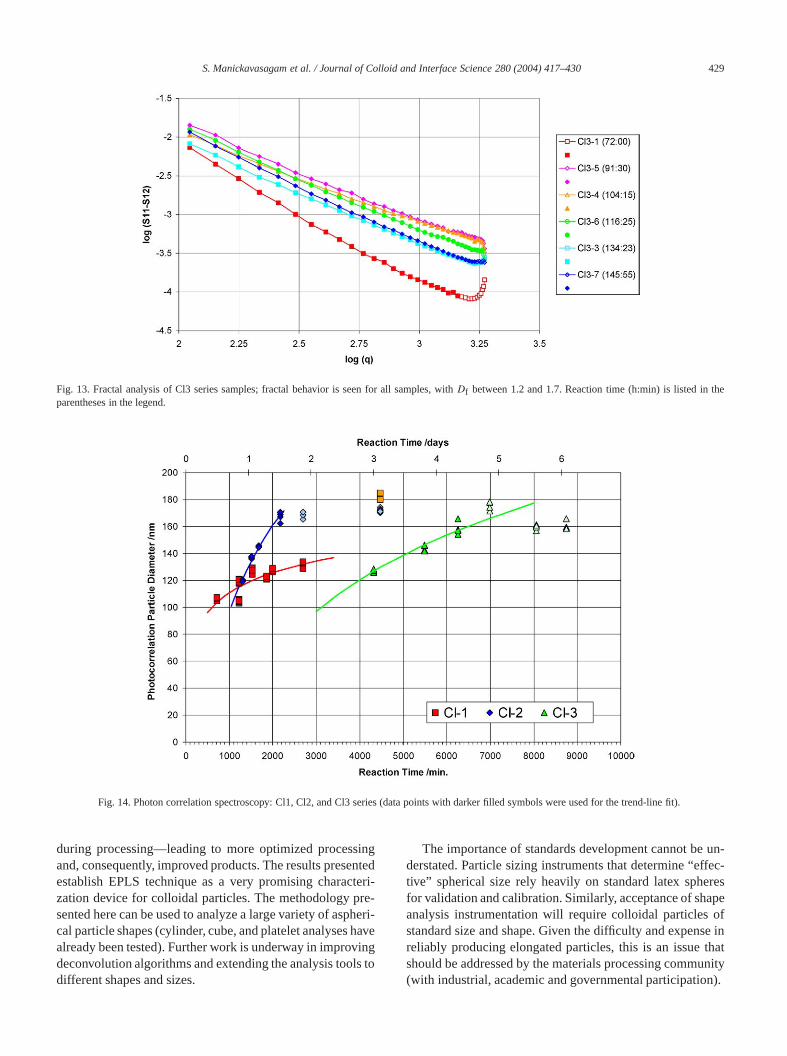
Figs. 12 and 13display size distribution and fractal analsis results for the Cl3 series. Similar to the Cl2 series, allresults show the presence of large cross-sectional diamThese results, combined with the fractal analysis results, indicate the presence of agglomerates. Fractal dimension va
s
.
Fig. 8. TEM micrographs of Cl1 (33:13) after centrifugation showing asratios roughly between 2 and 2.5.
ues for the Cl3 series are slightly lower than those inCl2 series (Df between 1.2 and 1.5), corresponding to loo“stringy” agglomerate structures.
Fig. 14shows photon correlation spectroscopy (PCS)sults for series Cl1, Cl2, and Cl3. The final particle scorrelates quite well with the data seen on the TEMcrographs and EPLS results. The Cl1 series show sligsmaller average particle size (100–140 nm) compared to
e
Fig. 9. Fractal analysis of Cl1 series samples; only the Cl1-7 sample displays fractal-like behavior, withDf = 2.3. Reaction time (h:min) is listed in thparentheses in the legend.
S. Manickavasagam et al. / Journal of Colloid and Interface Science 280 (2004) 417–430 427
Fig. 10. Volume percentage expressed as functions of size and aspect ratio for Cl2 series. Presence of agglomerated particles is evidenced by the presence oflarge cross-section particles.
areandies,nd
ntizem-
-ure-icletion: Cl9on)tionm-M)
blyvia
Cl2 and Cl3 series (100–170 nm). These comparisonsconsistent with EPLS results, which also show the Cl2Cl3 series with longer aspect ratios. As with the Cl9 serthere is an initial logarithmic correlation between size areaction time.
4. Summary and conclusions
An elliptically polarized light scattering measuremetechnique is presented which provides: (1) particle sanalysis as a two-dimensional distribution, and (2) agglo
erate structure analysis in terms of fractal dimension. Employing hematite as a model system, a series of measments are performed to examine the evolution of partsize and shape during precipitation under various reacconditions. Four separate hematite systems are studied(highly elongated and well dispersed after centrifugatiand Cl1–Cl3 (less elongated, with variable agglomeracharacteristics). The results ofthese measurements are copared with those of transmission electron microscopy (TEand photon correlation spectroscopy (PCS).
Initially samples were not well dispersed, most probadue to dissolved ions in the original solution. Cleaning

428 S. Manickavasagam et al. / Journal of Colloid and Interface Science 280 (2004) 417–430
ted
Fig. 11. Fractal analysis of Cl2 series samples; fractal-like behavior is observed for all samples, withDf between 1.45 and 1.90. Reaction time (h:min) is lisin the parentheses in the legend.Fig. 12. Volume percentage expressed as functions of size and aspect ratio for Cl3 series.
nfor
icleserega-,
tem,the
tio of
canvior
centrifugation removed those ionsenabling the preparatioof relatively stable suspensions. The reaction conditionthe Cl-9 series produced highly elongated hematite partwith aspect ratios between 4 and 8. Longer aging times wshown to lead to highly crystalline samples (greater elontion). The presence of NaH2PO4 in samples from the Cl-1
Cl-2, and Cl-3 series probably acted as a pH-buffer syswhich resulted in slower reaction rates. Consequently,evolving particle shape was not as elongated (aspect ra2 to 2.5).
Determination of size and shape is a valuable tool thathave a significant impact on understanding material beha
S. Manickavasagam et al. / Journal of Colloid and Interface Science 280 (2004) 417–430 429
the
Fig. 13. Fractal analysis of Cl3 series samples; fractal behavior is seen for all samples, withDf between 1.2 and 1.7. Reaction time (h:min) is listed inparentheses in the legend.Fig. 14. Photon correlation spectroscopy: Cl1,Cl2, and Cl3 series (data points with darker filled symbols were used for the trend-line fit).
ingnteteri-re-herveing
ls to
un-fec-res
apeofse inthatunity
during processing—leading to more optimized processand, consequently, improved products. The results preseestablish EPLS technique as a very promising characzation device for colloidal particles. The methodology psented here can be used to analyze a large variety of aspcal particle shapes (cylinder, cube, and platelet analyses haalready been tested). Further work is underway in improvdeconvolution algorithms and extending the analysis toodifferent shapes and sizes.
d
i-
The importance of standards development cannot bederstated. Particle sizing instruments that determine “eftive” spherical size rely heavily on standard latex sphefor validation and calibration. Similarly, acceptance of shanalysis instrumentation will require colloidal particlesstandard size and shape. Given the difficulty and expenreliably producing elongated particles, this is an issueshould be addressed by the materials processing comm(with industrial, academic and governmental participation).

430 S. Manickavasagam et al. / Journal of Colloid and Interface Science 280 (2004) 417–430
I-micd.
by
n,
tific,
id
New
n-
4.–
sc.
cm80–
69–
egel,
68.
at-
23.2
ace
Acknowledgments
The financial support through NSF SBIR contract DM0222536 and support from the Center of Advanced CeraTechnology at Alfred University is gratefully acknowledge
References
[1] C.F. Bohren, D.R. Huffman, Absorption and Scattering of LightSmall Particles, Wiley, New York, 1983.
[2] Y. Arai, Chemistry of Powder Production, Chapman & Hall, Londo1996.
[3] T. Vicsek, Fractal Growth Phenomena, second ed., World ScienSingapore, 1999.
[4] C.G. Bushell, Y.D. Yan, D. Woodfield, J. Raper, R. Amal, Adv. ColloInterface Sci. 95 (2002) 1–50.
[5] M.N. Rahaman, Ceramic Processing and Sintering, Dekker,York, 1995.
[6] I. Stamenkovic, Mater. Chem. Phys. 23 (4) (1989) 389–407.[7] M. Mischenko, J.W. Hovenier, L.D. Travis, Light Scattering by No
spherical Particles, Academic Press, New York, 1999.
[8] E.M. Purcell, C.R. Pennypacker, Astrophys. J. 186 (1973) 705–71[9] M.F. Iskander, H.Y. Chen, J.E. Penner, Appl. Opt. 28 (1989) 3083
3091.[10] M.I. Mischenko, L.D. Travis, D.W. Mackowski, J. Quant. Spectro
Radiat. Transfer 55 (1996) 535–575.[11] R. Govindan, S. Manickavasagam, M.P. Menguc, in: M.P. Mengu
(Ed.), Radiative Transfer: Proceedings of the International Symposiuon Radiative Heat Transfer, Begell House, New York, 1996, pp. 2295.
[12] M.P. Menguc, S. Manickavasagam, Int. J. Eng. Sci 36 (1998) 151593.
[13] C. Saltiel, S. Manickavasagam, Q. Chen, L.S. Schadler, R.W. SiM.P. Menguc, J. Nanopart. Res., in press.
[14] C. Saltiel, H. Giesche, J. Nanopart. Res. 2 (3) (2000) 325–326.[15] A. Jillavenkatesa, J.F. Kelly, J. Nanopart. Res. 4 (5) (2002) 463–4[16] H.C. van de Hulst, Light Scattering by Small Particles, Dover, New
York, 1981.[17] T. Freltoft, J.K. Kjems, S.K. Sunha, Phys. Rev. B Condens. M
ter 33 (1) (1986) 269–275.[18] E. Matijevic, P. Scheiner, J. Colloid Interface Sci. 63 (1978) 509–5[19] M. Ozaki, S. Kratohvil, E. Matijevic, J. Colloid Interface Sci. 10
(1984) 146–151.[20] M. Kerker, P. Scheiner, D.D. Cooke, J.P. Kratohvil, J. Colloid Interf
Sci. 71 (1979) 176–187.
Copyright © 2022 FDOKUMEN