Characteristics of the Galileo probe entry site from Earth-based remote sensing observations
42
Characteristics of the Galileo l’robe Entlry Sitle from . Eart)h-13asd Remote Sensing (lbsmwat)ions (JI(I]III S. 01(011*”, l]lclIdarI h’1. l’isllm”’ i”, SalalI ‘1’. Ste\vdrt”’7, ,low I,liis 01ti7 ”:{. Lfilc)la hlarillova4, Sasl Ia }Iil]klcvt’:’, l’iswwtiat}ifilt Kris]tllarlt’6, hlila]l h1aw]]ovict7, ,lclcI Ia ‘I’osic+ ’7, AI Idrcas ‘l’~ioltis+’fi S(q)t (’lllt )(’1 11, 1997
-
Upload
independent -
Category
Documents
-
view
0 -
download
0
Transcript of Characteristics of the Galileo probe entry site from Earth-based remote sensing observations
Characteristics of the Galileo l’robe Entlry Sitle from.Eart)h-13asd Remote Sensing (lbsmwat)ions
(JI(I]III S. 01(011*”, l]lclIdarI h’1. l’isllm”’ i”, SalalI ‘1’. Ste\vdrt”’7, ,low I,liis 01ti7 ”:{.Lfilc)la hlarillova4, Sasl Ia }Iil]klcvt’:’, l’iswwtiat}ifilt Kris]tllarlt’6, hlila]l h1aw]]ovict7,
,lclcI Ia ‘I’osic+ ’7, AI Idrcas ‘l’~ioltis+’fi
S(q)t (’lllt )(’1 11, 1997

1
A}wtractlkirttbtmd otmrvaticnls indicate that t}le Galileo l’rol)c mitered a 5-/f III Ilot s~)ot. a regi{)ll
of uIIusual clarity aIId dr.yll(’ss. ‘1’llis feature Ivas iIi tllc ]jrocess of evolving I)otll to a larger sizeaIId lower atmosj)lwic o~mcity wlIcl I t}ic l’mljc mlterd olI 19!35 1 kIce IIll)er 7. ‘1’lIe }’rol)c e]ltermlt llc at lrlos~)llcrc SOIIICI 600 - 120(1 k]ll Ilortll of tllc sout,llcrll Imulldary c)f tile not s])ot, dcfilld l)y a4.78-/1111 olmrwd lmigllt lIcxs tc][ll)erat urc ,grcater i hall 240 Kclvills. ‘1’llis was S011}(” 60[) kill Southof tll(’ Cclltu of tllc not S])(It, wlIcrc ttlc atl[losl)}leric tra]is![lissioll was slightly IIigllcr. aIId tllcatlllosl)lmic dec l iv i ty .3 fw lmm’Ilt lower. ‘J’lIerc is a stlo]lg correlatio!l of 5-//Ill flux }vitll {J53-11111 reflectivity i)ut a weak OIIe with 410-11111 rcflmtivity. ‘1’11[’~risit)l[’allcl Ilcar-illfrard rdlwtivitiesof not sl)ots are rc]lialkal)ly silllilar. CV(’11 for a variety of fcatllres ~~’itll divergent 5-/I III ettlissio]w.Z()xlal strllctll[csi tktll('t r(J~)c)sililcri( tctll])crat\llcf i('l(lllca It]lel'rc) l)(`(`llt rysitew('r(ll()t corrdatedu’it]l tllc ]ocatioll of [J-/llIl IIot sj)ots l)ut lllovc:d tit sl)ecd clos(’r to ttlc ilLtcrllal mtatio]i Iatc of tlte])laIIct. ‘J\c)])os])llt~ricwa\’r cmhd at tlw l’rolwultry latitudcslmvs littlc(t)lI[’latic)]l to tllc [b~lnl}Iot sl)ot \\ra\’ccll:ila(tcI(OItiz ct u/. 1997). Stlatc)s})ll(’] i(tt’1[l})(’ratlllc! sclc)lit)t silc)~t’allysig[lificalltstrl]cturc owr 5-/I III n o t sl)ots it) gcII(,ral or t]Ic 1)101)(” elitry s i t e s]wcificaliy. l~utllrc :itlalysis o ftlw tllmltml strudurd ill colljullc~ioll wit]] I[li(l-itlfrarcd datasc](sitiw to cloud o]mity will furtlwrclmladuizc tllc tr[)]ms~)}mic clouds as w’(JII as mtc IId our telll~maturc IIIa}H to dqwr Icw,ls.
I N T R O D U C T I O NI,oIIg l)eforett~carrivalc~ftl(c ~;alilcc)s])a((’craft itl tlIe vicit[ity of JulJitcr, tl[e viil(lcof rc~llcjte
seIlsirlg of t}lc ~’ro})c mltry site was rccogllizcd. lk:s~)itc tile disparity of tlLc spatial scales satlll]ldt)y in situ vs. rcIIlcJt(:s cIlsiIlge xl)cliltl(:[lts, acc)IIl])arisc)It c) ftlIctw(J sets c) fclatarctIlailL(~ cltllclI\c)ststraigtltforwarcl Ineatls to g(nleralizc l’rolw cx~wiI[lcllt rcsu[ts to tile ~)laIlct as a wlIole. ‘I’l Iis i s~mrticularly true lmause Jul)itcr’s atmos]]ller(: is vorty i~]llc)]i]c)g[’Ilcc)~]s. Su(:l I a coltl])ariwl woulda l so ])rovidc a Ittcasurc of grouIid truth agai Ilst wllicll tllc atlllos~jllcric ~)rO1wrties retrieved frox]lremote sensing imtrul[l(!]lt data Iniglit tw C.om])ard.
A detaild s[:q~l(:llcc ofc)l)scrvatioIlsl)y the f;alilccJ ()rlJiterre IIlotese tlsi[lgi] lstrllrIleIlts\ \'(rw~)laIIIIcd for t}}(: tiIn(> of tll(: dcsccllt of tllc 1’Io1)c into ,lu])itcr’s at~IIos~)licle. A systelII of cart,ll-l)asc:d c)l)scrvatic~Ilal s(l])l)c~lt wasalsc)c stal)lisll(?(lit l(~r(l(lrt( )sLl])])lcIIlcxlt tlwsl)acccraft da ta . ‘lllIerelatively low’ tclecc)l[iI II(lllicati(jIls rate of tllc orl)itcr, ~)recludi[lg direct traIIstnissioIt of tl[e datat o tlie cart}t, togctlw wit]) liInitd s])acc 0 1 1 tlm ta]m rccordm, liluitd tlw s~mtial coverage o ftlw atlrm})llcrc. ‘1’llcrcforc, tlic cflcct o f IIlore distaIIt ~)lwmlncula , SUC}I W X)lla] U’;LVCS W’]1OX’
itlflumlce cxt OIdd to t]i(’ l)rolw mltry site, w o u l d I)(! nlissd t)y the Orbiter l)ut Ilot by ot)sfvwrsOIL tlIcI cartll. Eartli-l)ascd faciliti(!s cou ld also su])]jl(nI)(~Ilt tlIc N’avdrm,gt}I coverage of tllc Orbitmillstrulll(!llts tllc!l[dv[!s. IJor cxaltl~)lc, tlw 7.8-//1II CII,I s~mtral cunissiol] t~alld, used t o ddcrl[lilwt]l(’ ]()-lll~)aI' St I~t[)S~)]lCIiC t(`Ill])(!I`at llI'C!S (sw IortoII C/ u/. ]()()()), WWSIIOt O\HNVat)lUWith tllCC]IOS(’11oll)itf:]i[lstl~ll[lcllts, t)ut it ~~ascjl)sclialjlc’flc)ltl tlwcwtl[. Eartit-t)asd c)llscr\’at ic)]ls~)]()\ricl( ’cl theoIIly ~IImIIS to track tlw mo]utio]l of tlw fmturc if)to wllicll tllc l)rdwmltcrd. Jlll)itcr was hcadillgto\ VilI’(lSS olaI’CO IljllIl(”ti[)Ildt t]l(, ti[[l(’ cJftllc l) Iol)(’c Iltry, allclcatlI-l)asccl c)l)scr\'ati()lls \\'('recliflic(lltas .lll~)it(>I V.’iLS Only 9C’ f[olrl tll(! S1111.
‘ ] ’]1(’ aIloIIN{kJllS ~)(!~laViO1’ of t}l(’ ta])(’ I’(’(:d(’l SllOrt]~ ]K!fol’(” alliVal at .]ll])it(’I’ ])1’OIll])td t]l(!
C;alil(’01’loj(’et” IIot tor[lIl tllct:t])(,l(’((}r(ielat tLll(l(llillg,t ll(!illiti al:i])l)xc)acll to.lul)itm, itlcludillgtlic til[t(’ of l)mtw clltry. ‘I’l Ic su~)])ort of tllc cartll-lmed ol)s[’lt’atic)llal ~)m&raIII tlllls gaild f a rlIIor(” Sigllifi Ciill W tlIal I allyOIIc coul~l Ilaw> illia~ilid olIly a few’ IIlolltlls ~mi{-m to tll[’ l’rotw elltry.
‘1111(1 ])rolw (vlt(wd a r(!]ativoly ck!ar aTId dry area o f tlm atlImsl)]mx! kllowll a s a 5-11111 ]mts])ot, a ])rol[lilwlt feature rcl)rcsclltiIIg a relatively rau: set of attIL(]s\)lLcric coI](litiolls 011 tllc ~)lallct(orto~, rt 01. 1!)96). II! additio]lj tll(~l’lot)rl)(’gar[ tcl][[akf’direct {)l)s(’ri’at io]lsc)~llya f(crclcsce~]clillgto tl]e wO.4.-1HU J) ICSSIII’C l(Iw1. ‘~’llis was l)cl(~w ;itlllosl)llc~ic Ievcls ex~wctd to coIltaiIl significantCIOU(l aIId liaw layers (SN! tllc I)ricf slll[l~li:irics of llistoriml c}lalactt’rizatic)lls of tllc Yfcrtical clolidstruct~irc ill tlw rc~mrts trj tlw the N’q)ldo][wtm (ATE1’) twir[i, lhgmtt d al. this issue, aIId tlm Nd11’Iux l{adioIIlctm (NTIJI{) tratll, Srol[lovsky c1 al. tliis isslic , :is ufcll as a review of illforl[latio~l li~) totll:it diitct)ylVest ct al. (1986)). ‘J’lIlis, tll('cl(`t(:lIll itlatic)]lc) ftlic~) rc)]Jerticsc) ftllc)scc) vI'rlyiIlglayerswwul(l also ])rovidc illforIllatioIl to ttle I’rol)r iIl\’[’sti&:iti(}]ls to assess tllci[itifl(lt!ltccc)lt alta]ysisof tllcN’l+;}’artd NF1{ data, iIt])art ici]la]t ()cc)III1)lctctl le])ict\]r~'c) ftllcN} 13-l[:\'[:lcl ollclc) lilyillcc)Iill) lctc!lydctmnitd t)y LIIcse two ilwtruIliellts.
SOIIIC lncasurc~[lcllt,s o f Ju~)iter 711CTC ]tladc :illllost silllultancoiis With tile titllc o f the l’rollcclttry, dm[)ite tllc ~JIOXilIiit.V to tllc!surl. ‘J1lIe ])roxi]tlity to tile SUII oftcIi colIll)roInisd tlic cluality oftile aIlgillar resolutiml ad also tllc iivailat)le wavclctlgtl( range. For cxat[il)le, tlw NASA lnfrad~’(!lcscc)~Je Facility (ll{rllP) llsccla ])oly])rc)l)yl(~ ll(:sllect cc)v(:rillg tlleclitirc l]ritllary l)crlilittilLg altllostIIO riidiatiml slmtwvird of 5 /1111. 'l'llis ])rclc('cl [Ir(:als(] r('cl{tcccl sill)stal)tially tl]esigIlal tolloiscratioof tllc olmrviitio Ils. ‘1’llerfore, w cx])crilli(’lltml with alt(!niativc a~)~maclm to study ttic I’ES,ill(:luditl~ a titlicwisc litlcar iIitwlmlatimi of data takml tmfore and after tlie tiIIic of the l)rolm cvltryald a study of aldogwis r(!gio]w.
3
Ill this paper we will address these issum, refilling our iuitial atlalysis (ortoll C{ al. 1996) oftlm ]mopcrtics of the atmmphcrc as thq relate to ald supplmvmt the m!asurcmcuts nbadc t )y t hcGdilm I’rolm.MORPHOLOGY OF THE PROBE ENTRY SITE REGION OVER TIME
A long time series of itnagm of ,Ju})itcr ill tile 5-ItlIL mrilldow is dcscritwd by Ortiz et al. (1997).‘1’lmc d a t a are dmniuatml I)y olm!rvatiolls ][ladc witlt the 4.78-11111 narmv-l):itld filter used withthe facility near-illfrarcd calucra, NSF{~Ah!J, at t hc NASA Illframi ‘Jklescopc l’acilit.v (I lU’F) attllc sutllltiit of h4auna Kca (Raylm ct al. 1993). Figure 1 illustrate tllc! c]m~lgiug lImIJlmlogy oftllc 5-~/111 hot sl)ot t}mt evolved iuto tile l’rolw etltry site (1’lX). }Ve will IIm]cefcmtll refer to thisfeat urc as tllc I’J2S liot s])c)t. l’lic 18 ]Mlicls ill Fix. 1 were select cd frol[l 64 sq)arat e i]na~es wllic}ltracked this feat urc Imt wcmi 1995 hladl slid 1997 August. ‘J’his data set. dcscrilwd lIIUCII IImrefully l)y Ort ix ct al. (1 997), is l)art of all cvcti larger data set takcll t)y 11~1’1~ stafF OIL a regular basisill sul)lmrt of tile Galileo Illissioll wllc]i hTSl{l; Ah!J }vas SCIIWIUINI for olwrvat ions of ally kiud.
2’lLc first images ill this data set (Fig. 1 ) slmv tlic ])rcsclm of a lmt slmt at the I’ES, at t}lcl)c!gillnitl~ of our data set, assul[litlg that tlw sImts WCM all Ilmiug eastward at almut 1(I3 IiI/SNrc!lativc to Systell] 111 (Ortiz et al. 1997). FroltL hlay to AuSust, 1995, the I’NS lmt slmt a])l)cars tonave sl)lit several til[m. I)urit}g SUCII q)isodcsj our a~)])roacll to tracking tllc fkat ure was to l[mtclltlw .gcvmal ~)llasc sImd of all the .5-IIuI hot slmts with ms~)[!ct to Systcm 111. lti 1995 $.q)t cnnlmr,tll[! I’M }Iot slmt sinus to have IIm@ with allotllcr not slmt and s~)lit agai]i shortly afterward.At tlw twgi~lning of what wc ]aigjit call its “life cycle”, i.e. Imtwmu 1995 Oct. 3 and Oct. 13, tlw]Iot s])ot lc-cmcrgcd as a slllall wedge slla])c c~wlvillg illt,o a larger comma slla~m, \vit IL a l)ri.qllt,I)ut sIrMll routlcl core alld a sniall “ t a i l ” . ‘llII(!IL, a tralwicllt filalllctlt-like lllorl)llology a])]mar~!d,:~ft C1’ wllicll it evolved into a “ll]ature ])llasc” w}m) tlie slmt c o v e r s an area of a fcw degrees iulol)gitude and liad a tail tilted N30C’. Sutmqumltly, it reaclml i ts most ildmwc state, flattclli[l~and cx})alidill.g e]mltiou sly. l’llc 1 ‘1’;S l)ot sl)ot rel[laillcd ill t Ilis flat mq)hology for soIiIc t ilne,tt])~)loxit[l;itely 1995 NTOVf’lIIl)m tllroupjl 1996 .lllly. P’ollowitlg t h i s , i t I)egall its “lift’ C.VCIC” again,assunli]].q a sl]lall wedge slla])[:, followt!d t)y a mnma slla]m. No “lust ure l)llase” a])] reared duringtllc Cy(”le Imfore Iwgi[lllillg agaili as a s[]lall fmtllre ill 1996 l)cccl[lt)el. Its 1997 cvolutioli illcludcsa “lIlat UN’ ~)llasr”, accordi~lg to our ~[lost rcw]lt ol)s(,rvat io~]s ill August (1’ig. 1).
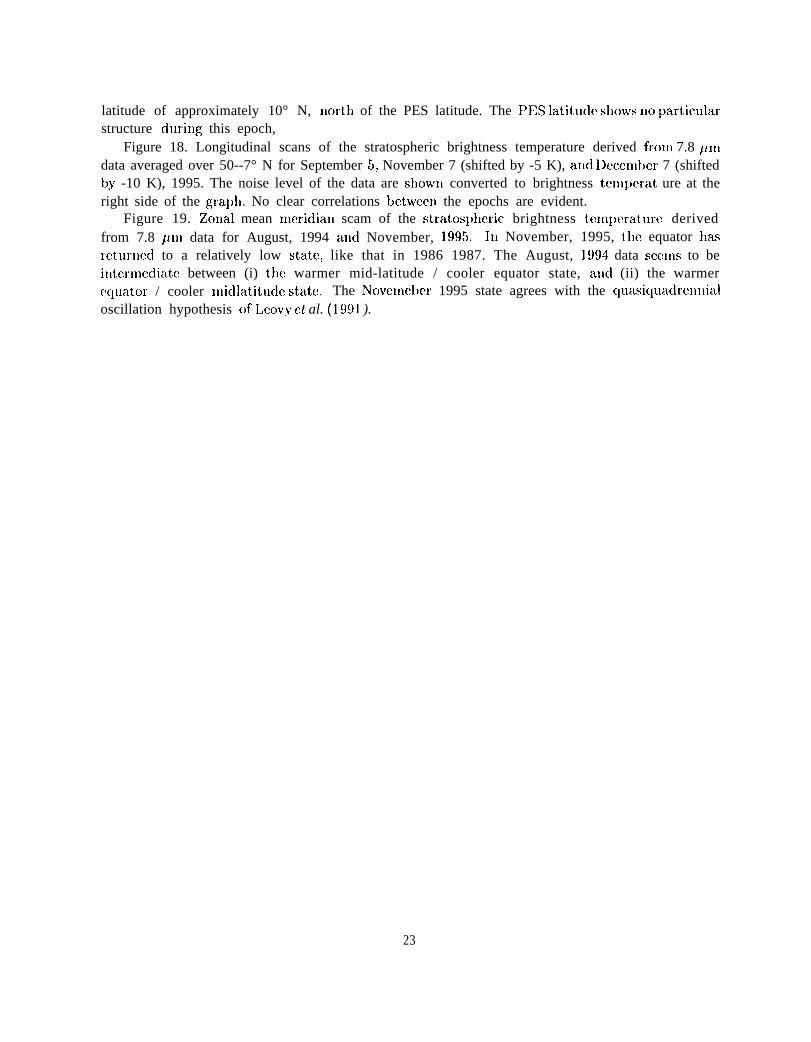
Awolll])allyillg, its ][lc)l~)llc)logical evolution WYW regtllar variatio~)s of tile ilhuisity of tllc liots])ot mf(:r til]le. ~’llc 1)14X not S})ot al)])carcd t (1 I)riglltc]l aftw its 1995 Octolm life cycle t)(!gall. Itl)rigllte[ld again a few winks after tile l’rol)c e]ltly. ‘1’IIc evollltio]l of tile 1’1’;S not s])ot intensityis slmvll ill Fig. 2, usillg tllc full sd of illlagm fmlll wllidl Fig. 1 was I)uilt. For this 1)101, theillte~lsity lias lmcll avma@ over a regio]l SC’ ill lollgit udc and l)y 6“ ill latitude, around tile I’1’;Slmlgit udc-sllifted locat io]l. IIllages wit]l tlkc ]’NS liot s~)ot el[littil]g a t an allglc greater tllall 600(C:lllissiotl angle cosilm, p > 0.5) were rejdd. ‘lllIC slNxd uscd to kw:l) tllc s})ot ccnltcrd was tied toa value which varied slowly wit]) tillle. WC USN] 103.5 in/s for tllc l)c:riod 1995 hlarcll - I )em]nl)er,102.5 ]N/s from 1996 Jalluary - May, 101.5 111/s frolll 1996 JUIIC - l)cn:l[]l)cr alLd 100.5 ~ii/s from1997 January - July, as those ~)rovidd a Imt Iuat,dl wit}] tile l)llase sI)eds of all obsmved 5-j~tnhot s~ds arouud tllc Circumfwmce of the ])la]wt.
‘1’lic u~)])cr ,ga])]l i]) Irig. 2 wm ]uade usit]g tile col]l])letc set of calibratd ilnages, wlwreas tllcl)ottolt~ gra]jh lias I)cwn made witli a IIIOIC restrictive II cutofl (0.4) and also using all alternativemcalis of absolute calibration, scaling tlw total coulits ill a region 600 l)y 1600 arould tllc ccnltc!r oftlw clisk. This assutncs that the lmightlms of Imarly the wILo1(! disk does ~lot cllal+y! sigtlificautlyill tillm, which is Ilot strictly truf!. For tllc 10wCI gra])l), ww llavc illcludml tllc radial]cc at tllc date
4

of probe entry although the spatial rcsolutiol] of this image was worse tllall tile rest of tlic il[lages.For that image aloue, WC mauual]y calculated the total flux withiu a Iargcr area. T1lc error Imrof tllc radia~lce at tile time of cntxy lkas Im:l ca lcu la ted by using scw[!ral sy:ltlwtic a])crturcs ofdiffcrcut sizes. Forth crcst of the]} oints, t}leerrors llavol)cell ~ssigllcd as20%oftlIeir l)riglItlless.The overall shapes of both curves agree rcasonat)ly well, althcmgh the maxilna are IIigller for tllcfirst calibration method.
Figure 2 shows that the 1’I+X tmi.glltlms reaclwd its maximum witllill 2 mmtlis after Imcdwc~ltry, a brightness equivalmt to a tcm~)erature arc)uud 255 K, altlmugh tlw core of tl~e I’JM Imts[)ot must have rcachcd higher tmpcratums, as we arc ])lottiug averages within au area 8° by 6°vridc. TILC peak te!lll)cratures wc call dct[!ct froul tl]c ground are very scnlsitiv[! to secilig variatioxls,which limits our slJatial resolution. With these caveats itl miud, the highest 4.78-pul Iwiglltllcsstcl~ll)crat(lrcw rcl~avc:c \’c:robscrvcclat tilel’ESllc)ts~)cJtw’as265 K (().54 W/1n2/llu)/sr). coillcirlcutwith the tium of Inaximum s})atially averaged intelwity. WC Ilotc that tllcse i[llagm wwrc oftenaccom]lanied h-y ol)servatious of stellar standard stars wliicll, in tile future, \vill aIlow us to v[!rifytllc:s[\ a])~)alclltlyl argc\’ariatiorlsw’itll till] [! fc)rc)l)sc:rt’ati[) lls unvig[lctted by tlw telcscopc dome, atleast 30 days frolllsolarc o]lj~lt]ctic)1i.THEPIKOBE ENTRY SITE AT TIME OF ENTRY
]Ic’causemuc]l al~alysis oft]lc I'rcJl)[: data cI[:~)c!lc{s ()1 LcJlll` dctcrI[li[iatic) r1t~tat t~lcl’1’o})celltc]’ec]a 5-/1111 })ot s~)ot, wc ttloug]lt i t wise to verify this collclusiol) and luakc i~lI1]rc)\~etlt(?llts to o u rorigiIlal estimates of its location witllill tile ]Iot sl)ot. While it Was crucial to deterlllillillg tlw]mq)hology aud radimwtry of 5-1111] IIot s]mts (see almvc and Ortiz et al. 1997), the hTSIWAMillstrulncllt was suscc])til)le to saturat, ion duriligtllc tilllc of tile Galileo I’rol)c Clltry Im.ausc of tileitlltllcllsc l)ackgmllld noise added l)y tllc ~)oly])ro~lylctlc safety scrccl) in the o~)tical ])atJ1. \Vc IIadl)ettcls llcccssi [llagillg. l~l])itcrm ritlial )rc)a(lcr4 .8(}-~lllL (Nf-l)atld) filtcron tltehlI}{A(;2 i11str[l11~cl~t(} Iofflrlal]u ci 01, 1993) illc:arlyI)[!ct\ll~l)er, 1995, a t tll[ttilll[c )ftli[:l 'rol)c:[ :lltly,;i [lcIivitlltlleJt~tl’ro~)ulsion lJalmatoly ’s Mlltl JIN illstrlllllcllt (ltcsslcx ct (L1. 199-1) ill early .l:lllllary, 1996. I]otll o ftlwsc illstruilimlt,s wm! lnuch lcsssmlsitive ill tlw 5-puI region aud had deqm electronic wells thanhTSFCAh4. As a result, tl]ey wwc HIUCI1 l(:ssscl]siti~’c to saturation).
As exl)lai~lwl I)y Ortoll ct al. (1996), Iiiakitlg accurate cstilnatcx of tllc lmsitioll of tile l’ro})eretry site (1’13S) witllill the Lpm ]Iot s]mt is colnplicated I)y tile low al)gular resolution of thehfllt A~2 h4-l)and iuiagcs takm duritlg the CI)OCII of the I’rot)e mitry. ‘1’liis is sitnl)ly a]] illllerclltl)rol)lelu associated w’itllc)l)s[’r~~ itlgsc)closc totllesllll, coml)licated l)y tl~c high atteuuatioll of thesafety screml which required cuumlativc itltegratioll tilnes of tells c)f sccollds. F’]or col[l~)arisoll,NTSFWAM culnulativc ilitcgratio]i tiuw is *2-sccoIId, using only ilnagm with tlm higlmt q u a l i t yseciug. Our aItcrnativc cstolnatc of the cwtry ]mitioll assu]ncd that tlm 5-pIII feature was stableill size and locatio~l tmtwcc;l late Novmnl)cr of 1995 atd late Jat)uar.v of 1996. ‘1’lJe I)FX not s])ota])]marcd to Iw stable and roughly constaut ill sin ald shalw I)etwc!crl tllc two $~~n] olmrvationsmade at the hTASA IR1’F witlmut tlm safety scrcwll ill late Novemlwr of 1995 aud lat c .Jauuary of1996, cwwn though its twi.ghtncss increased subst alltially (Fig. 1). [;oulpariug the! l~omillal clkrylatitude aud longitude of the 1’1;S wit]] the morl)llology ald position of the 5-HIn slmt iutcrpolatcdbctwcwu these two dates aI)lwared to be a rcasouablc first-order approach to overcomitlg the dele-terious effects of the rec]ucc!d seeing whik’ the Saf{:ty screen w a s used wit~l the telf%co])c!. Figure3 shows that such au iuterpolatiou in tilnc is fully collsistcllt with the actual Otmrvatiolls c)f the5-I/In hot s])ot associated w’itll tllc 1’F,S duriug tlLis time. T’lIc I’ES 5-11111 liot s~)ot did not uudrngos])littjiug or migration with res]mt to a largely col Lstallt local eastward flow’ with rcsl)cct to Systelll
5
111.Figure 4 indicates the nominal I)ES location on th(! 5-pm hot spot. WC note that thesr iln+y+
(and those ill Fig. 3) have bccni furth(!r ])mcesscd thatl ttle ec]uivalmlt images clis~)layed ill IJig. 2 ofortcm et al. (1996). First, rather that) usixlg the best image made on each date, several lligl]-qualityimages were selected for averaging froln a 2-mir~ute time ititmval to minimize blurring t)y ]jlalwtaryrotation. SoInc additional care was takm to o~)timize tllc assulnl)tions almut tlic sceillg futlctiollused itl image restoration (see Ortiz c1 al. 1997, for details of this l)roccss). If u’e ado])t t IIc crit criollof Ortiz et al. (1997) that hot s~)ot rcgiolls arc defined by thermal radiances wit Ii all equivakvltl)riglltllms tmlrmaturc greater tllall 240 Kclvilwl tl[cll t)otll tile 1995 NovcIIIl)er and 1996 Januaryiltlagcs and, logically, the interpolated inlagc imllwdiately confirlll that, tlm 1’ES was, illdccd. locatedinside tllc $pm not s])ot. Usirlg this critcriolll a~ld kq)ing in l[lilld that, tllc size of a ])ixcl ill t lICSCcylitldrical ma~)s is just, cwcr 600 klnl tile 1’ES a~qwared to I)c close to tllc southern tmuldary of ttie5-p hot s~mt, with the soutlmm edge located tmtw[!cw 600 atd 1200 km (i.e. 1 atld 2 ~)ixels) away.Fbr tllc Novcmlmr i~tlagc, tile l)oundary w’as ~vitllill 600 kln (1 ~)ixd) south, and for tllc .Ialiuaryillmge it was 1800-2100 km (2 -3 ~)ixc!ls) sout]l. We catl say that the 1’1;S \vas something like 3000klil (and certaiuly mom t]iall 1200 kill) south of the northm] Imulldary of the feature. altlmuglltlw assuln~)tioxl that WC call predict tlm morp]mlogy of the highly evolving, nortlwnl boutldar.y oft l~c l)ot s~mt Iy timmvisc linear itltcr])olatioll is somwhat sus~mct. 1’l)c ullccrtait)ty of this I)osit ionis dol[lillatml l)y tflc geometric calil)ratiol) of these itnagcs, all all~ular si~e wllicli is cquivalellt to670 kill wIN]] ~)rc)jc!ct cd on the disk at the I’IM - not, far froln the value of tlm s])at ial resolution.‘J’llis value rq)rcsmlts 1 statldard dcviatiou, ald it is all ilnlmvcmnlt over the mtilnatcs of ortollcf CII. ( 1996): tllc cover of tllc 1996 hlay 10 issue of Scic7tce SIIOWS a 2 sta!ldard deviatic)ll circleart)utld t]w I’ES. l’llis cstilnatc was made cm t]m t)asis of (1) rqmducibilit<y of the I’FX geollletryfor several other days wit][ sinli]ar quality secittg itl NovczIIber, and (2) cstin)ates of tl]c intrinsicIltlccrtaillty c)f fitting tllc sllar~) 5-I/In lillll) of tllc ])la~mt uudcr collditio]ls of 0.3 - 0.5 arcscc seeing,cllitraCt t’IiSt ic of t II(’ act ual olmrvitlg cc)llditiolls.
‘1’lw 4.78-~/111 l)ri~lltness t(!]n~)c!raturc of tlw PES is measured as 248.6 K, with 1(!ss than 0.31{ variations wit}lil[ 1200 km east of west. ‘l’l[is value is ititcr])olat cd bc!twccll 242.8 K ill 1995hrove~lll)cr and 260.3 K in 1996 January. It is co~lsistclltly 0.5° (1 ~)ixcl) sout 11 of t]lc I)riglltcst areaof tlw feature w’}licll is a])~mxilllatcly 1 Kclvitl IIigllcr ill lmightmss tcm~maturc.THE PROBE ENTRY SITE IN THE VISIBLE
Figure 1 of Ortoll ct al. (1996) slIows tlw I’ES with res]mt to olmrvations of rcfl[!ctcd sunlightill rcd a~)d ~]car-i~lfrared wavelcllgtlls takel[ froll~ ol)servations at l’ic-du-hlidi otxwrvatory ali{l tlicSwrcdis]l Solar lklcsco~)c. W]lilc collsistcllt with tilt! 1’1’;S hcirlg loca ted inside a rcgio]t of lowerreflectivity t,lla!l tile surroundil)gs, tll[!se ililagcs, takcvl withit) a fmv days of the l’rolm clltry tilm,suflm siloilar secillg degradation as for tllc 5-~/IrI images. lJ1\likc tt~c $~~m images, ilow(!w!r. t,l]eie ism IIigll mltrast associatc!d W’itl] tile hot slmt wl]icll allows a rot)ust image restoration algorithm tolW al)ljlied (SCC tllc dcscril)tio~l ill ortiz cl al. 1 997). ‘lllllls, wllilc 1.58-~1111 il[la.ges w(!rc also takeno~) Novemlwr 21, 19951 ad .Jamary 23, 1996, they do not ])rovidc a lmttcr desniptioll of the darkeraltwdo associated with tllc entry site. ‘1’llcreforc, we dcciclcd tc) cxamillc coln])arisolls I)ctwecnl tllc1 ‘ES hot s]mt at 4.85 pm and tllc higllcst ~)ossil)lc sj)at ial rcsolut ion obscrvat ions ill tlw ‘%isil)lc”rallgc from the Wide-Field / I’lallctary {;atncra (WI’’/~2)2) 011 the IIubble S1)acc ‘1’CICSCOIW.
lf’c examined t~le I’HS not sl)ot using WF/1’(;2 at wavc]cmgths sllortu~ard of ] ~lm during ])m’iodst)otll before alld aftc!l tllc I)rol)e entry: 1995 March 5, 1995 Octolm 4 and 5, 1996 May 14, aud 1996June 27. The 199.5 October atld 1990 June data were taken within 24 hours of 1 W1’F NSIWAM
6
observations (Table 1). ‘I1lw I’ES lmt slmt lIM CVOIVWI little in t}lis sliort ti~ne sI)an, a]lowitlg directcomparisons of the morphology in the two wavelength regitncs to be made. ‘1’iie 11S1’ il[lagcs werecalibratt!d using the procedures discussed by West et al. (1994), and wc adopt a N5%, error level,which is supported by ~hanover et al. (1996). III order to facilitate illtercolll])arisc)ll of tlte filteredphotometry of the various hot spot regicmsl wc solved for tllc codlicicnts of a Milll~aert futlctiollwhich was applied to the observed data. The data were then adjusted from obscrvatiollal values ofthe emiss ion and incichmt sunlight, angle cositles, p and po, rml)ectivelyl that ranged froln ().55 to0.95, to a common value of 0.70. For the 953-ntll data, t h[! sum of the values of t hc ~)ow’crs usedfor p and I1O ill the hflillllaert function were sig[lificalltly ]ess successful if t]lcir sutl) was fixed tou]lity than for a higlwr va]uc, so we ado~)ted ttlc latter. We acfo~jt,ecl these adjusted values for alldiscussicnls of the 11S’1’ data on the l’1; S.
Figures 5 ald 6 l)lot the correlation between the 4.78-11111 radiallcc ald tlle reflect i~’ity frolll tile953-l I1n and 410-nm filtms, reprt!scmtin.g the md]mints of the “visible” sl)cctra for tllc 1995 Octol)crald 1996 June data, respectively. ~)lcarly three is a ciass of cold ]millts at 4.78 ~inl, wit II radianmless t ]lan 0.07 W/m2/ster/pnl (224 K bright Iless t cml)erat ure), ~]articularly ]mmitm]t ill t lW 1995Octotm data set, rel)resentitlg a wide range of relatively IIigh ref]ectivitics at lmtll 953 nnl and4 1 0 lI1n. ~’hese ]mints corrcs[)olld to regiolw ill tllc lower half of tllc images, which arc ~x)rtiollsof tlm F,quatorial Rcgioll. Regiom with higher 4.78 -p III radiatmx are clearly correlated ~vitli lower953-11111 reflectivity, so that our 240-Kelvil~ I)riglitll(!ss tellll)eraturt! critericjll (0.18 MT/ln2/ster/~~111)corres])olkds to l/F < 0.60. For a givml 4.78-~~m radiance, tlw slmead of l/P values at 953 llm is().05 or lCSS for 1995 octolm and 4.08 for 1996 JUIIC W1lCII tllc grou~ld-t)ased secillg was Imorcr.
011 the otlwr hand, the correlation t)etwml 4.7tL~1111 radiances and 410-lltu reflectivity calllmtI)( IIt’arly so well csta})lislled. ‘J’lle almlutc correlatioli co(!flicients are 0.501 less, and t lIc s~)rradof I/IJ \Talues for a giv[:ll 4.78-pm radial)cc is N().2O at best.
l’igurc 7 and 8, ~)lot titlg t}lc reflectivity as a fullctiou of latitude at tllesc two wravclrll~ths, offersc)~ll(~ c]arificat iol]. I$or I)ot}l cl)oclls of ol)scrvatiol), tllc 1’1’;S i s a distillct ft’aturc at 953 11111, t)lltlNUCI1 lCSS so at 410 ]lm. As a distinct featllrc, tlw 1’NS has Iimcll low(!r contrast at 410 11111, andits llortl]erll Imulldary lllerges with tllc lowrcr reflectivity of tllc Nort 11 F,qllatorial I\clt at lli~llcrliit it Ud[’S.
J}’(’ ~lotc that tllc rc!flcctivity of tllc 1’II;S latit Nde, 6.5° NT, is l)riglltcr tllalI tile darkest ])art of tile1’1;S, a dcgrm or two Imrth, l)y oJIly 0.03 or less at 95311111. q’lle 410-11111 reflectivity of tlw l’~S is0.04-0.05 larger ovx!r tllc sa~[lc distance. Figures 9 ald 10 slmv the s]wctruln of tlw ]’NS and tlw(Iarkest areas of tile I’ES feature (as I[lmsurccl at 953 l)lt~), res~)cctively, as a fu[lctio]l of titl~c. }YeIlotc that tllc Ieficctivities do not vary Itluch over tillm, coln])arcd wit]) the m rors of lll(:asllr[:ltl(’llt(with tllc l)ossil)l(! mce~jtion c)f tll{ 555-IIIil poitk i~l 1995 h4arcll). A coln])arisoll of tllc two figuresalso shows that the small differences in 1/}” Imtweml 6.5° N and tlm “center” of the feature al)~)arcntill Figs. 7 and 8, are generally true for the other olmrvatimls, as well. Figul e 11 shows a similars])cctrum for a 5-j~llI ilot sl)ot SOIIIC 40° away il] lollgitudc. Its silllilarity to Figs. 9 alld 10 is also~)crsuasive that the “visual” reflection s~)ectrulll of all hot, spots is very similar.CLOUD PROPERTIES AT 5-pn~ HOT SPOTS AND THE PROBE ENTRY SITE
A major examination of cloud ~)ro~)erties at tltc 1 ‘ES atld co:ll~jarisoll with other 5-1{111 ]lot s~mtsis givel) by Stewart et al. (1997), based ON a detailed al~alysis of near-infrared data from tlw NASAIIWF. l)y usitlg a sit@e-scattmillg cloud inversion tecll]lique, they are able to retrieve the verticalcloud structure witl]out any a priori assuml]tiol]s atmut tile cloud levels. They detf!ct t IIrec cloudlevels throughout tllc northern Equatorial Zone (HZ) and sc)utllerll North Equatorial I)elt (NEI]s):
7

a thin stratospheric haze layer distributed ~ 20 mhar, an up~wr tropos])heric cloud l)ased t)etwwcll350 and 460 mbar, and a lower tropospheric cloud with an effective cloud top betwcml 1.5 and 3.0bar. The up~m two cloud layers arc o~)t,ically tliill at 2.0 pIIl, with o~)tical depths of SO.01 and-0.5 reslmctively.
Stewart et al. (1997) find that the u~)]wr trol)osplleric cloud is very holuogeneous throughouttllc north equatorial rc.gion, includillg several hot s~mts and ])lumes. There art! only slight differencesill cloud elevation and opacities betwc!ell IIot s~)ots alld their surrounding regions, implying that ataltitudes greater than tllc l-bar level, J]ot s~)cis are not significantly different than t}le rest of tllcW and NEBs. These results are consistent with a study using 11ST data at 893 aucl 953 nm ty~hanover et al. (1997). TIIc!y fourld only a 20% cliffcrence ill olJacity betwecll hot s~)ots ald ~)lumesat the ]mobe entry latitude iu the u])])er tro])os~)lwric cloud layer.
Further cwidcnm of the relative llol[iogc!llc!ity of this cloud layer is tile visible slwct ra of 5-~~mnot s])ots. Altl~ougIl tile mor~)llology and 5-~~m radiance of tile I’13S hot s~mt charlged cc)]isidm-ablyi~l 1995 alld 1996 as dmcril)ed ill ~)rcwious scctiolls, tile visible sl)ectrum did not. 111 this wavelcl@hrange, there is little variability ill tile sj)ectra over timo aud also betwcell the PES IIot sl)ot and itscom]~anion hot, s~~ot. This analysis su~~~mrts our a~)~)roacl~ of using analogous regions in the studyof t]le UI)I)[!I” tro]msl)]mric cloud ill t]lc I’ES l!ot s~)ot.
There is a difference, however, ill the alm]ute opacity of the upper trolms])lleric cloud betweenvisil)le atld h’]]{ olmrvatio]ls, All o])tical dcq)tll of 6.0 at ~900 lltll is required for not s~)ots ill themodel ]nmcnted by [;hanover et al. (1997). Tlm shar~) dmwase in o~)acity between the visible andNlfi im])ly that the cloud particles ill this layer are very small, r < lpm. Such slnall ])articlesIIave CMIIY a sl[lall illfluence in tile atl]ml)lleric ol)acity at 5 pm and the slight dccrcasc in o~)acityovel hot sl)ots cantiot lm tllc sole lnccllallism responsible for the strong 5-pm radiation through hotS])ot s.
I’revious work, sulllmarized itl West et al. (1986), suggest that the lower tropos~)lleric cloud is]tlort! lleterogclimus t Ilall t 11(, uIJ]wr t ro~)osl)lleric cloud and Iliay ~)la.y a larger role in tlie dyllattlicsof IIot, s]mts. Stewart CL al. (1997) corrot)orate this lly~mtl]csis, but the interaction I)etween thesetwo cloud layers ill tll[! forlllatioll of a 5-I~In hot s])ot is Ilot yet understood. q’he up~wr tro])ospllericlayer will Ilot I)lay a sigllifica[lt role IIIIICSS it colltaitls a large ~mrticle comlmnent as suggrstcd t)yVoyager Ifil S observations (~arlsml rt al. 1993). l+llr~lmr constraints OH the role of each cloud levelltlay lw lllade tjy olmrvatiolls at lc)IIger wavelengths wllic]l will tw extrcl[mly useful itl ~movidillgmllst,raillts o~l the extemt of tllc distril.lutiou of large particks itk tlm clouds.
}Iascd on t hc cloud model ]wcselkccl itl Stewart et al. (1997), tllc upper tro])osl)heric cloud maynave beml out of reach ly tile Galileo Ilej)llclolncter ex~)erilnellt wllicll did I]ot lmgill Illcasurenlcnltsllnt il tlm 0.4-l~ar level. lJnfortunately, the o~)tical lmo])erties of the particles ill this layer remaillImorly cllaracterizcd. Extellsio~l of clc)ud l]lod(!]s devclcqmi ill the NJ]{ towards shorter wavelengthscalllmt t)e dmle ill a straightforward ~[lalltl(!r t)ecause tile o~)tical ]mo~)erties of the cloucl particlesis coln])licated by tile ])rc!scnce of cl]roltlo~)ilcms. OIm a robust vertical cloud model is compiled,close exaloinatioll of the ~)ro~)erties of this cloud layer itl tllc visible may Jwoceed with fewer free])aranleters.TEMPERATURE FIELD AT 5-pm HOT SPOTS AND THE PROBE ENTRY SITE
We derived troposl)heric temperature nlaps from thermal infrared data to look for connectionslwtwccm the tem~wrature field iu the up])er tro])osphmc and the hck s~)ots analogous to the PESIIot, slmt. Tile tro])osl)heric teml)erature fields were derived from thermal il(frared data acquiredat the NASA II{TF. Data reported here were gathered in three epochs. The first epocli was in
8
1995 NovemLer, prior to t II(! Probe ent r-y, the second in 1995 December cwerla~q~illg wit II t IIe t illwof Probe entry, and the third in 1996 January, a~qmoximately one month after the l’rohc entry.The data for November and Ikmmtmr of 1995 were acquired with the MIftAC2 imaging itlfraredcamera while the 1996 January data were acquired with the MIRLIN itnagit~g iufrared camera. 710retrieve temperatures, we used MIRAC2 data taken at wavelengths of 13.3, 17.4, 17.8, and 20.6-pmand MI RI,lN data taken at wavelengths of 17.9, 18.7, and 20.8-pm.
The data consist of full-disk images through discrete, broad-band (NO.5 1.5 pm widths) filters.Standard mid-infrared data reduction techniques were followed to produce the itldividual images.‘1’hc radiance from Jupiter was separated from the emission of the terrestrial sky by subtractionof sllort-tm-m sky variations at high frequency using the telescope secondary to provide successiveimages of the object and the sky (“chopping”). Longer-term drifts of the sky or tehmopc emissivitywmw removed by additional sul)traction of a similar “chopped” pair with the telescope pointed atthe nearby sky (“nodding” ). Such images from the INI’F with MI I{AC2 have been published fromthe CI)CJC}I of the Shoemaker-I,evy 9 impact with Jul)iter (C)rton et al. 1995). Obscrvillg conditions,coml)illcd with the need to use a solar shielcl ill lhxemhcr resulted in a signal-to-noise ratio ofal)out 80-100 l)er pixel for the individual il]lagcs. Ckmditions were better in Novmcber, resultingill a SNI{ of al)out 150 for it]dividual il~lagm. lnlagcs ill .Jamary nave a SNR of about 40.
q’}w data were al)solutc]y calilmated using ol)servations of o Boo taken duriug each epoch withtllr same ol)servi[lg mctlmd. IIowcver, star data were not available OX1 each day ill a given epocli.l$~lml same-day st,al data were not availal)lc within an e])ochl Jcwiau images taken on a day ~~itllstars were first calit)rated to fc)rltl a reference set. Ju])it,er data from other days in tile satnc t!l)ocilwere calil)rated against tlie referellcc set I)y doing a least squares fit between c(!ntral nleridiall scamof each iltlagc, averaged over 10° of longitude. TIN uncalibrated image was then scaled to thercfcrellce ilnage, l)asccl olL the ce]ltral llleridian fit. For days wllerc stellar rcfcrellce llleasurelnmtswmc made. al)solutc calibration is within 10% of the radiance ex])ected from estimates based on\’oJa~cr 11/1S llcn’t}l/sollt}l stall data for tllcsc sall]c wavclmlgtlls. ~’lLc relative calitjratioll teclitliquelilnits our sensitivity to tml])erature perturt)atiom and wave-like structure on spatial scales on tileorder of one-third of the planetary circulnfcretlce (wavenul[lber 3 or lower), W’liicll is Ii]ucll largert hall I’ES not sImt s~latial scales.
After calibratio!l the data were cylindrically ]mojected ontc) an even, 10 x 1°, grid. For these])rojectiolls, we used Jul)itcr’s Systelll-111 rotation rate for lcmgitudinal placement. T}le rotatio~lrate of the tlmmal structures have l)ecn ol)served to I)e very close to the System-111 rate, ~10 ms e e- 1 (see l)mning cl al. 1989, 1997, ort,on et al. 1994, Magalllaes et al., 1989, 1990). The rotatio~lrate of tllc thermal features is also i]de]mlldent of latitude. We have therefore added all availal)lelnal)s in a given ei)och together, .strictly ill Systelll 111, tc) forlll a co!nl)osite map with the bestl)ossil)le loll.gitudina] coverage. ‘J’l)c sluall rotation rates of the features with res~)ect to Systmn 111only results in drifts of approximately 260 km over three days, the typical span of our observatione~mchs, well below our diffraction-limited spatial scale of N12400 km. The slow rotation rate wasalso confimled by examining regions of overla])])ing longitudes from maps on different days. In theoverlapping regions, the longitudinal structure was aligned in System III, as exl)ected. We showthe com~)osite map for the 250-ml)ar l)ressure level for I)ecember, 1995 in Figure 12.
I’he choice of wavekvi?;ths was made to salnple the spectrum where it is dolllillated by thecollisioll-illcl uced ol)acity of Hz, and it was modeled by an appropriate combination of 1]2-112 and112-lle collision-induced al)sor~)tion (I;irnl)aum et al. 1996). Our filter selection provicles sensitivityto tcxn]matures in a pressure ra]~gc lmtwcctl about 250 atld 400 mbars. We choose tile non-
(J

linear weighted- Chatlirlc techtl ique (Cha}]ine 1970) for its ease of implcmcmtat ion and ml)ust nesswith a data set whm! obse rva t ions at. a]] fi]ters is omasiona]]y not available at each ]Joillt OILthe planet. As significant. time separated successive images at different wavclen@s, t hc datawere combined by first projecting them onto a cylindrical coordinate system with equal latitudeand longitude grid j)oints. The observational data for each grid point (latitude, longitude ~)air),consisting of wavelength, brightness tem~wraturcl awl emission auglc, was asseulbled from thevarious cylindrically lJrojectcd images. ‘1’lw atmosphere was not sounded dcxqwr t hall 316-lulmrpressure, as the influmlce of a cloud of N113 par~iclm (e.g. (Irtc)n ct a/. 1982; Gicra.scl] ei al.1986) could have an important effect at this dc~)th, atld we were not yet ]mcparcd to sci)aratcthe temperature slid cloud opacity fields from each other at the titnc of this writing. I)ata weretaken only from positions on the ]Janct where the emission angle was greater thau p 4.40, as ourdiffraction-limitecl atlgular rcsolutioli would coml)ilw the illflumce of cold space any c.loser to tllcI)lanctary liml).
The set of temperatures retrieved from each of the three observing C1)OCIIS was collll)i[led i[ltoa single tcm~wraturc mar) which c}laractcrizcs tlc e~mc}i as a whole. g’llc I’ES (t3.5° N latitude,5°W longitude, System III) on 1995 Ihmmtwr 7 is, in fact, covered by these ma~)s. Using thesecom]msite ma~)s, we can examine tlm tropospheric temlmraturc field over the PW3 hot spot, asWC]], and examine otlmr hot, spots at the same latituclc. Wililc the longitude of tlw l’IH hots~mt is covered t)y the m a p s , tlwrc can lje no direct correlation l)etwcml a given tml}mrature
J1’itllill a single day, thestrllcture and a $llm hot spot lwcausc of very diffcrel~t rotation rates.$pm hot, s])ots will drift approximate 7° with rcslmt to Systcm 111 (Ortiz d al, 1997), while thetempmaturc structure rmnains e,ssmlt ially uumovcd. q’hc fact that there is no nmasurable differencelmtwcm the tropos~kric temperature it~side and outside of hot sl)ots was also noted by Orton ct al,(1997) for Galileo I’lloto],olarillleter Radiometer (1’PR) cx~mimcnt mcmsumnmts of tlw 250-ml,artcllllwrature of a rcgioll which included a 5-~lltl IIot Slmt.
‘l’lie tcln])e,rature structure in tllc stratos~~llere was cliaracterized l)y a sill,glc set of olmrvat ionssaml)]illg tlm strong Z/4 fundalncntal I)and of C}14, a vcrt ically well mixed gas. These wc!re madem’itll a circular- varial)lc filter at a l)ositioll of 7.85 ~lm, with a 2,5% full-widtll at IIalf lllaxilliuln.‘1’liesc obscrvatiolisl vert ical ly we]] scparatwl fro!n tl[c u~)~mr tro~)os~)llerc, allowwd us to derivetemlmraturcs at the 10-mbar km], usitlg a tcm]mrat urc ]mrturbat ion tecliniquc similar to the oneused by Orton et al. (1991) to detmnim stratosl)lwric tmnlwraturcs froln raster scans of Ju~)iterInacle with a discrctc flltcr c~!ntcred at 7.8 IIu1. For the 1995 l)m.cml)cr and 1996 .Jatluary C]) OCIN,otmrvations at 7.85 ~inl were so severely attenuated by tllc polylmpylmw covm that w~c chose onlyto aualim t]le data as longitude stalls at tl)c PI+X latitude. Wc cxaluitlc in greater detail tile 1995NC)vclll~)er illlages at 7.85 ~~111, a]so ,lladc wit,}, M11{AC2. ~’lICSC! arc S} IOWrll ill ~igllr~ ] ’ 7 .
MTC ~lavc ~xalllill~d tllc lollgitudina] structure of tile trol)os~jheric tmpwaturc fidd at the P~S
latitude. The PIN latitude is at tlm southmm edge of tlm well defined warm axisymmctric bandknown as the North Equatorial Belt (NEI1). We extracted a longitudinal strip covering 5-7° Nlatitude. At the time of tile obsm-vatiorls, Jupiter sul)tmldml approximately 31.5 arc-seconds. Tcle-scopc aperture and our wavelength led to a diffraction-limited angular resolution corresponding to-10° of Jovian latitude or longitude at the sul)-~~artll I)oitlt. Ilecause of the large diffraction limit,our longitude scam at 6° N are not com])lctely indc]mldmt of the maiu NIW longitude structure.The equator was relatively free! of longitudinal st ruct urc at the t imc of the observations. ‘1’husour PES-latitude scan is a combination of the true, latitudinally unrescdvcd structure at 5-7° Nlatitude, as well as the prominent NEl\ structure and sulIcluecl equatorial structure. g’o reduce the

effects of systematic errors induced by indcpendmt tcnlperaturc sounding for each disk, the conl-posite longitudinal scans were produced as tmnperaturc residual scans separately for each disk mapand then placed into their proper longitudinal locations. Ovcrlap regions were averaged togetherafter removal of the background temperature level. The conlposite longitudinal scans for the threeepochs are shown for the 250-nlbar level and the 31 tl-mbar level in Figs. 13 and 14, respectively.
Overlapping coverage between days in an individual data set confirms that the longitudinalstructure rotates close to the Systen]-111 rate, The tcnl~}oral evolution and significant, longitudinalgaps prevent a meaningful derivation of tile rotation rates on time scales lwt wcen t lw e~~ochs, w]lichpotentially could measure values as small as those previously reported (Ihning et al. 1989, 1997,Orton et al. 1994, Magalhaes et al., 1989,1990). our large diffraction limit does not allow us toconstrain the rotation rates from data within an sillglc epoch meaningfully. SoIne structures at the31 Gmhar level semi tc) l)e stahlc hctwem the 1995 Decxunher and 1996 January scans, while othersclearly change or drift.
The limited data sets did not allow for conl~dete longitudinal coverage in any of tlie CI)OCIIS. Tl}elarge gaps lead us to choose to the Ijollll)-llc)r&[lalizccl ]mriodogram (PIcss et d., 1 992) for tllc wavecontent search. The Imnl) ]wriodogram tccl~niquc was developed for finding’; the l)ower spmtra ofulwvenly spaced data. Its advantage in our application is that, it weights the data m a pm-pointlmsis instead of the l)er-interval I)asis of tile Fourier tcwl]nique, This greatly reduces t hc ul~dcsiralJlceffects of the windowi~i.q functio]l, com]~ared to normal Fourier techniques. The I,ond) ])criodo~ranltecl~tlique finds the normalized power as a function of wavenundwr essentially by fitting a series ofsines and cosines tc) the data. ‘1’hc results of t}lis wlalysis for the 250-ml)ar level and the 316-mbarlevel are shown ill Figures 15 alld 16, res~mt ivcly. The normal i~,ation in the tec]llliquc ~)roduccs])owcr levels corresponding to the ]wohal)ility that a given feature could he ]nwducect by random,IIorlnally distritmtmt noise. The confidence levels are shown on the plots as a false alarn~ prol)al)ilityIxmwr lcwe.1 ill figures 14 and 15.
Our stratos~~lleric n~al), Fig. 17, snows lncridiollal str[lct ure sinlilar to the tropos~)hww. IlOthstratosldiere and troposphere are warnlcr over mid-latitudes. llowevcr, t]l~ stratosl)llcric tCl[l~K?t’a-
ture maxima are located further frolu the cquatorl and at the I]ES latitude, the stratosplmre showsvery little structure down to our noise! linlit. Again, our analysis is limited hy tclesco])c diffraction,aud longitudinal scans at the PES latitude arc a convolution of the real structure and that atsurrounding latitudes. We have produced lcmgitude scans fron~ our tropospheric data similar tothose from our tro~)osphcric data. We have produced longitudinal scans frcm data from Septcnll)cr5, N’ovembcr 7, and Ihxmtwr 7, 1995, wliicll are slmvn ill Fig. 18. Error I)ars for each scan, basedon the signal-to-noise ratio of the intensity data, are shown in tcnllwrature units for each scan nearthe right hand edge of the plot.
For comparisons with longer-term data sets, wc produced zonally averaged lncridional scansfrom the NTovend)er, 1995, stratospheric tenlperat ures, which have the best signal-to-noise ratio.The November, 1995 meridional scan is l)lotted in Fig. 19 with a similar scan made from August,1994 stratospheric data (Orton et a/ 1995). The difference hctwecm the two is n~arked hy (a) a])rominel~t change showing UI) as a warming of the equatorial region, or) which is su~wrimposed(h) a seasonally forced hemispherical asymmetry. Them is strong evidence for the latter over a10-year history covering most of a Jovian year (Orton ct al. 1991). I,covy ct al. (1991) suggestedthat Jupiter’s equatorial stratosphcr(! may undergo a ‘(quasiquadrennial oscillatio~l’) (QQO) whichwould be responsible for a similar quasi-periodic variation also observable in the 10-year study ofstratospheric ten]] )erat urm. The relative amplitudes of the equatorial and mid-latitude tcn~per-
11

at ures Noveudm, 1995, comrwwd with 15 months previous to that time arc consist rllt hot hmorphology and phmiug with their hyq)othesis.D I S C U S S I O N
Our iutention iu these studies is to compare cart h-based relnote-smsing charact crizat ionsthe PES with Galileo observations. This is made diffhwlt, however, becausr of the mwlution
iu
ofof
the I’ro})e entry site 5-pnl hot s~)ot iu br ightness hctwc!cu the two poiuts (] 995 hTovmltm’ and199G Jauuary) where we have some rcasonaldc confidcum in the atwcdutc ~ adialm calil)rat ion.It is possible that the evolution of the hot s~)ot was not siul~)ly linear iu tium The ul)~x’rn~ostmeasurements iu the $pm chanue] (chatlml C) of the Net Flux Radiomc!tcr (hTFR) are equivalentto a 255 K briglitucss temperature, t)ut they are twlow tile 450-n~t)ar level c l o u d (Sromovsky[!/ al. 1997). A best guess for the I)rightmss tcnnpcrature at tile top of atums])hcrc is 23(J K
(A. 11. Collard, ~wrs. comm. ), but this value de])ends on the properties of the hT113 cloud atmwthis up]mmost observation ~)oiut which are derived fronl the aualysis of the attmuatiou of solarladiation in the NFR sllort-wra~’clc~lgtll chanucls. Furthermore, the brightness teru]mrat ure for the})mad NFR Cl~allncl C filter (Fig. 3 of Sromovsky et al. 1997) must also bc converted to thenarrower 4.78-pm filter (Fig. 1 of ortiz c1 al. 1997), using a spectral modd. On face value,?mwmwr, the relatively low brightmss temperature might IN iuterpretod as implyiug that the $pu]lwi~llt clling of the PES bctwcm Novenll)er ald Jauuary did uot occur uuiformly iu time I)ut moreslowly through lkxwmbcr. We will also investigate th[! quality of our highly attenuated t)road-baud4.8-jJ~u ot)servatioll of .lur)iter aud 0 1100 I)y MIRAC2 for t}le ohsmviug r u u in early lkcemlw,] (J{)~, (,0 d~t(;r]~]i,]r ~,]1~(,1,~~ it could ~)~ USCd to verify this im~)licat,ion.
11) com~)ariug our results witli Galileo ortjiter olm?rvations, our closest aualog to tllc I’ES is the(; 1 orl)it ‘(} I(YJ’hfiAl’” observation by the Near ll~frared Mapping Spectrometer (NIMS). This IIots~)ot revcalcxt higher 5-Ilm intensities thau ally otl)cr region ot)servcd by NIMS through t lie G7 orl)itill A~]ril. 1997 (Iloos-Scrot,e et cd. 1997). This feature is, itl fact, tllc PES hot spot ill a later ~mrtiol~of its “lllaturc” l)lLase, idmt,ical to tlw fmturw snow Il as “1996 .luIIc” in Figs. 6, 8 atld 10. Altho[ig]tollr 4.78-/1111 nlcasuretucuts of tliis not s])ot were lower resolution thal) either the 1995 Novclul)cror 1996 January il[lag(!s USCCJ to inter] )olat,e to tllc Prolw clltry tiluc (Fig. 4), our ~)cak I]rig}lt Ilesstcrn]wrat, urcs (242 K) arc consistent, witJL its h4ay - .June t)rigllt, ness history (Fig. 2) as a slowlydilllnlil~~ feature. l’llis briglitums telu]wraturc is lower tl~all the 248 K PES 4.7ti-~ilti t)riglltlwsstcm~wrature we estimated for ttw tituc of clltry, aIid we Iilust co~lc]udc tha t the tllc ‘t1107’h4AT””feature is more o~)aquc than the I’13S at t}lis wavelmgtll. Further co!nl)licatitl.g the issuf! is thatfact that. NJMS did not recover the lJart of this ol}scrvatioll ill tllc hot spot at 6.5° N latit udc. WCcau, l~owwwr, cxatui~le the atnmsr)lleric characteristics recovered by Iloos-%rote et al. ( 1997) fro)llNIMS c)l)smvatious at an cquivakmt distauce (600 - 1200 klu) from the I}ortt]crll bol]lldary of tllc“IIorJ’hfAl”” feature, a k)catioll whicl), similar to tllc PES (Fi~. 4), is witlliil 600- 1200 km oftllc location of tllc peak 5-I~nl radiance. These are xnucl] closer to tl]e prol)erties tllcy derived forthe muter of the hot, spot thau derived for their ‘(t)ordcr” saull~lc. hlvell more confidcl)cc ill thiss t a t e m e n t call tm gmcrated by ~lotillg ttiat for lwth tile I’ES aud ttle “HOTMAP”, otmmval)leconditions are relatively uniform within N1OOO kul of tile ccntcn-. By this aualogy, amt consideringthat the I’ES hot spot could have hem even brighter at 5 pm, we would conc]udc that iu the modelof lioos-%rote et al. (1 997), the midclle cloud trausmittauce could be 0.62 or more, water vaporwould he 0.09% of saturation or less, aud approximately the same vertical n~ixiug ratio of ammoniagas as modeled t)y Sromovsky ct al. (1996). This analogy deserves much further scrutiuy in thefuture. We will he searching the NIMS data set for subsequent orl)its for t)ettcr matches between
12

our deduced 5-pnl propert ics of the PES and those of various hot spots examiucd hy hTIMS, Wewill also extend the analysis of the observations to shorter wavelengths.
A comparison between 11ST and NIhKS observations of reflected sunlight also confirms a slowchange of I/F over the same spatial scales. Iu fact, the various comparison of the visual observationsin Figs. 5 - 10 shows several things releva!lt to characterizing observable cond it ions at the PES.Tllc time variations of the short-wavehmgth ( “sul)nlicron’) ) reflectivity of tile I’ES hot s~)ot are farsmaller than the variations of the 4.78-pm radiance apparent iu Fig. 2. ‘1’hc reflectivity of theatmosphere at precisely 6.5° N is slightly, but consistently higher than the center of the hot spotfeature (some 600- 1200 kni distaut), so that small perturt)atiom to models using observations ofhot spot, centers to cl~aracterize conditions at the Pmbc entry site might be necessary. The relativeinvariance of the reflectivity across this ~)art c)f tile s~)ectrutn with time plovides sollle assurancethat the s~)ectrunl showl] in Fig. 7 is likely to characterize the PES at the time of entry to withinthe 5% uncertainties of the absolute calibration, combimd with the additional uucert aiut i(?s shcnvIli~l tile figure. It is more likely that tl]e ])rol)erties of clouds toward the louger wave.lcl@lls are])art ici~)atirlg in the definition of hot s])ots as unique features on the planet, tllan arc pro~)ert ies oftllc clollcls at shorter wavelengths.
The reason that hot s~)ots are better defined iu the “red” than the “blue” could be related tot lle hypothesis that ouly diffcrmces in a larger-part iclc population are involved ( c..q, West et al.1986). on tile other baud, the effects of a large ]Jarticle population ap~)ear to Im ncgligil)le ONtllrsc snort waveleI@hs (Irwitl ct al. 1997). The other possibility is that different coln~x)sit io~ls of~)art iclcs with diffc!rellt sitlg]e-scattering altx?do ill the visildc slmtra are illvo]ved. These particlescould lx: a chrolnophorc co~nl)omwt as suggested by the blue color of hot spots ill tlw visit)le (e.g.hi;. 6).
J$Te IIavc not mlgaged ill further elucidation of cloud pro]wrtics from visible refl!ctivitim or5-I/11~ t hcrmal radiances at this time, as there arc a Iluul]xx of lllissiug pieces of information. (hit!of tl)e lJrolJlelm with using olmnwatiolls from tile 5-~~In s~mctral region alol[e to elucidate tllc cloudst rat igral)l]y is t hc dcgmeracy of cloud models. !l’llis radiation can be influenced by atmos])hericI)articulates down through tile 6-l)ar level (e.g. Irwin ct al. 1997, I{oos-Serotc ct cd. . 1997).Jtlc IIave made olmrvatiolls of thermal radiation at 8.57 pm, which is between strong I)atlds ofgasm)us al)sor])t io]t I)y Inetllallc and amlnol~ia aucl smlsitivc to cloud ~]art icles dowlt to tlm 1 -ba rhe]. including the analysis of data sets at 8.57 IIIU taken in 1995 November aud 1996 June willdet erlnine the optics] thickness of the u~qmr-level clouds i~l the coutext of the retrimwd tempcrat urestructures l)rcscntcd here. This will allow a sq)aratiox) t)etweml cloud influences al)ovc and Mowthe l-ljar level.
111 tllc visil)le region, atl exteIlsioxl of tlIe Inoclels ~~rescmtcd l)y Stewart cl al. (1997) call be madeusing the 11 S’3’ data showu earlier. A separation between the effects of cloud optical de])th anda]t)d) must ~)e made, however, iIl order tc) resolve which of thin! possibilities is responsible for thewidely acknowlcxlgcd unique color of the hot s~)ots (e.g. Rogers 1995). III order to do this, 11ST(and other) iltlagillg observations of not s~)ots at different elnission augles arc required, exter]ciin.gtll(’ tyl)e of work to other wavelcn@l)s Iwgun by Cllanover ct al. (1997). A rot)ust cloud modelIllust be developed over a large range of wavelengths to overcome the question of ulliqucmss.
Closely related to the issue of cloud formation is the distribution of ammonia gas. If the ul)pcrtropospheric cloud presented in Stewart et al. (1997) is the main ammonia cloud at the condensationlevel, the ammonia mixing ratio is oIIly a few ])ercent of solar throughout the equatorial region.Cc)llard ct al. (1997) detcrIniIIed that the equatorial rc.gioll is depleted ill water relative to solar
13
abundances by fitting spectra taker] wit]! tllc CSHEI,I, spectrograph at tile I [{TF. Tilese resultsimply that the entire equatorial region may be depleted in volatiles. Thus the abundances iu hotspots may not be as unique as originally thought. A very dry downdraft would not be a necessaryex~)latlation for hot spot abundances relative to their immediate surroundings. These analyses willalso be performed at regions of expected u])wellitlg at +30° latitude where O]IC would be xuorcsensitive to the deep abu~ldaucm of volatilcs.
Another issue is whether temperatures are systematically different at hot s~)ots, as indicators ofdynamic activity. Examination of the zonal mean properties of Jupiter’s atmosphere has cstablisllcda genera] anti-correlation betwccu the dark, visible belts and the ‘(bright”, warnl zollal therlna]structure (e.g. C~icrasch et al. 1986). This .gelleral anticorre]atioll also extends to the 5-I~nl structureill tllc zonal average, m well. OIi tllc other bald, ally rclationshil) between the zonal variability oftropospheric temperatures a]ld 5-pm radiances, if there is one, remains to be established. Whethertjotll arc related to SOIIIC sort of wave ~)llello]nctia is tile most compelling possibility. Examinatioxlof the longitudinal] tropos~)heric temperature scam at the P13S latitude, Figs. 13 and 14, show thatcollsideral)le longitudillal structure is SCW[] in all tilree C1)OCIIS and both pressure levels. on tllcot ]Icn’ hand, no clear, single wavcnulnt)ers arc evident,. T]le predominant wa~rc!llumhcrs observed illtile 5 pm data arc wavenumbers 8, 9, ancl 10 (Ortiz et al. 1997). They re~)ort a strong wavel~umlm-10 for their Jat]\lary-I)ccellll~[!r, 1995, data and a strong wavmutnlxx 8 with a weaker wavcnulubcr9 feat urc for tile JaIlllar~~-Scl)teltll)cr, 1996 ~)eriod. At the 250-ml)ar and 31 6-ml)ar levels, Figs. 15and 16, wc fltid Ilo sigllificatlt ~waks ill tl]c range 8 10 for November, 1995. For I~ccclllbm, 1995 wcdo fi]ld a weak wavellunlbcr 10 ])cak at tile 316 mbar level, like ortiz et al. 1997, but without anyanalogous ]mak at the 250-ml)ar kwcl. Colltrastillg this, the wavenumber-8 feature shows UI) onlyat tllc 250-ml)ar lCVC1 for Ihxell]l)er, 1995, and llot the 316-mbar kwel. Itl agrecnlellt wit.tl Ortizr( fit. 1997, the January, 1996 clata do show a w~avelluxntm-8 feature. However, the w’avellutllber-8featllrc is Ilot ])urc, atld collsidcral)le lJower is ]Jrcscllt in lnany other wavcnumhcrs. TIIC dis~)arityi~l t lLc roiat iol] rat es l)[!twecll tllc t,rc)~wsj)llcric tllcrl[lal f ea tu res atld tile $)l!t] ILot sl)ots and tllcvery IIarrow confillelncnt of tllc 5-~/in not s])ots does Ilot suggest a common ori,gil].
l)clllill~ et al. (1997) llav(! s u g g e s t e d ttlat tllc tro~)os~)llcric tllcrlual strl:cturcs ;llay lm mani-festat iol]s of vertically ])ro~)agatillg Hossl)y waves. Our lack of firm rotation rates for tlic tilmmalst, ruct ures ~)revellts a direct, coml)arisoll with tllcir lly~jotllesis. IIlstcadj ilcrc wc Ilote t lle charact-eristics of tll[! tllerlnal structures as a futlctioll of our three e~)ochs and two ~)ressur[! lCVCIS. Atl)otll ])ressurc levels, all three e])oclls sliow significant features at wavcllut:lbcrs 3 and 5 6. At ottlerw’avellultllms, there are collsidcvahlc differcllcc!s lmtweell tile e])ocils and the two I)rcssurc levels.‘1’11[’ 1995 l)ecenllmr data at th[! 316-lul)ar level si]ow ~)caks at wavmultlbms of 10 12 and 15 withI1O sitllilar structures secul at tile 250-ml)ar level. Contrastitl,g t}lis are tt]c w’avcxlunltwr 11 and 17])caks seen at both ~)ressure ]cvels ill tlic 1996 January data. Since our tro~)os~)h(!ric temlmratureret rievals were limited to two lcx!ls, we ca~lt]ot [!stal)lisll a trclld with de])th of tile wavcnutubers~)ectruln.
Focusi)lg on tile 250-mbar level, tile I)ccenlber, 1995 and January, 1996 spectra nave a peakat wavclnlmbcr 8 while the Novcmlmr, 1995 data do not. interpretations c)f these changes musthe rc!conciled with the lack of clear-period features aud the ]ongitudina] gar)s, particularly forNovember, 1995. It is ])ossihle that the structures respollsib]e for the wavenunlber-8 feature are~)rcscnt only in the longitudes satn~)led ill I)eceluber, 1995, and January, 1996, but not Noveml)er,1995. ‘1’his contrasts with tile 316-ml)ar s])ectrul[) wllcre only January, 1996, SIIOWS a significantwavcmlllll)er-8 peak. F,vell within these limit aticms there is considerable change in the wavenumber
14
content of the longit uctinal profiles lwtwecn the three epochs of ot jservat ion.There seems to be no predictability in tin)e or pressure. Some wavenumber peaks are stable
fronl epoch to epoch, but only at a single pressure. Some of the epochs, like .January, 1996, showa large degree of similarity between the two pressure levels while others, like IJecemtwr, 1995, arevery different at the two presure levels. Clearly, more analysis of these phenon[ena over longer andshorter time scales is needed as wall as accouutillg for cloud effects.
Our stratospheric maps have much lower signs]-to-noise than our tropospheric lllal)s. Conse-quently, we extracted longitudinal scans at the PES latitude hut did not complete a wave analysis,Exanlining the longitudinal scans, Fig. 18, the coml)ination of relatively low signal-to-noise andapparent evolution of the longitudinal structure leads to 110 olwious correlations from epoch toe~)och. Orton et al. (1994) tentatively identified the rotation rates of the stratosl)hmic features asthe same as those of troposl)hcric tempcraturw features. While the eye can find possible correlationsusing -5.5 111 sfm- 1 (Orton et al. 1994), the correlations are Ilot robust. ‘1’hus WW do not at this timeassign a rotation rate to tllc longitudinal structure. Without, a well defiued rotation rate, wc areunable to associate or dissociate the stratcqhric structures from the $ptn hot spots in general ort,hc I’ES hot spot specifically.
]t is ckar that much remains to ~m dolm in Corrc]atin.g the zonal wave structure ai)~w.arirlgill our data with tlw vertical waves SCCIJ ill the lower stratos])herc and uIJp{!r troposphere of tl~cAtnlosrdmic Structure Instrutncnt (ASI) results (e.g. Fig. 3 of Stiff et al. 1997). It is tempting,for example, to interpret tlw ol)posite signs of tile thermal waves near the 5° longitude of the l’ESat t hc 250- and 31 Gnlbar levels (Fig. 13 and 14) as a zonal manifestation of the waves seen atthis level ill their ])lot of vertical tcnlperaturc structure. Ilowcvcr, such a comparison should hedolw in tlw context of a mode] of the ll])warcl-]~ro])agatillg wave, coupled with a radiative transfersilllulat ioll of tt]c outgoing radiation wliicli can dctcrmim whether such waves are dct cctal)lc overtllc vertical llcigllt of tllc wcig}ltin.g ful!ction.
‘J’llis is also true of tl~c stratos~jllcre. Wllilc it is teln~)tilig, 011 impaction of the 20-lul)ar local}mak of the temlwraturc profile (Fig. 3 of Stiff ci al. 1997), to assume that it likely correspondstc) a ~wak of lo-nd)ar ec~uatoria] teln]jcraturcs, our otmrvations show that the op]msite is true.Again, a thorough simulatiotl of tllc upwe]ling 7-11111 C114 emission from tile stratos~}lm-e Inust I)cdollc to dctcrnline ttw likelihood that tllc vertical wave structure that we scc is associated with theQQO mechanism ~mposcd Iy I,covy cf al. (1991). A model is also required to determine whetherthese wravcs arc connected to the tropospheric waves and to clucidatc whether, for examplq theI{ossl)y-waves of the hypothesis for the NW] hoi slmts of Ortiz ct aL (1997) could I)c related tothe vertically propagating waves mcdcd I)y Inodc] of Ihming et al. (1997).
ACKNOWI,EDGENfENTSWC thank the staff of the NASA Infrared ~’elcscope Facility for their tireless su~q)ort, with
s~w.cial thanks to tclesco])c c)~)crators I)avid Grit]), Will iam Golisch, and Char]cs Kaminski formaking many of the service observations, together with John Spencer au(t John Stansberry formaking additional ol)scrvations of Ju])iter during their own lo-intensive runs. We arc also gratefulto the sup])ort of William Hoffmann, Aditya Dayal, and Joseph Hera for the use of and help ino~mrating the MIRAC2 insttumcnt, ald to Michael Rcsslcr for the use of and help in c)~jcrating thehIIIU,IN iustrumcnt. Several others helped during ol)servilig runs, including A. James Friedson,Padma Yanamandra-k’ishcr and Jay Cogucn. WC arc grateful for hcl~) and useful conversations withl{cta Bmlm, Nancy Cllanover, Jim 1+’riedso~l, Kathy Rages, Amy Simon, John ‘Ilaugcr, and Robertwest,, Carol I,ac}lata at t]l[: J I>], p]lotc)gral)~lY c;roul) d~s~rves special t]lanks for hcr l)reparat ion
15

of the color graphics it] their final form. q’his work was supported by the c;alik!o nlissiorl, by theSpace Telescope Science Institute which is operated by the Association of U1[iversities for l{esearchin Astronomy, and by research grants from NASA’s I ~latwtary At mosphcres discipline to t IN JetPropulsion Laboratory, California Institute of Technology,
16
REFERENCESAtrcya, S. K. Atll~os~Jllercs at~d IolloslJllcres oftllc Clutcrl'lallets arid Their Satellites. S~)ringer-
Vmlag, New York and Berlili, 1986.Atreya, S. K. and P. NT. Romani. in Plamtary Meteorology (G. E. IIunt, ed. ) Cambridge Univ.
Press, 17-68, 1985.13aines, K., et al. Quasi-Rat~don~ Narrow-Band h40del Fits to Near-lnfrarcd I,mv-1’cml)crat urc
I,aboratory Methane Spectra and Derivecl llxl~ol~el~tial-S~llll Absorption Coefficients. J. Geophgs.Res., 98, 5517-5529, 1993.
Ilanficld, D., et al. 2 pnl S~)cctro~)llotollletry of Jovian Stratospheric Aerosols - ScatteringOpacities, Vertical Distributions, and Wind S])eeds. ]cams, 121, 389-410, 1996.
G. 13irnhaum, A. Borysow, and G. S. Orton. Collision-induced al)sor~]tiori of H2-112 and 112-Hcin the rotational and fundauie[ltal band for planetary applications. Ica7w 123, 4 - 22, 1996.
Bjoraker, G. L, H. 1’. Larson, and V. G. Kunde. TIw al)undancc ald distribution of water va~)orin Jupiter’s atmosl)lwrc. Astrophys. J. 311, 1058-1072, 1980..
Carlsm, Il. E., W. B. Rossow, aud S. G. Orton. Cloud microphysics of the giant }~lancts. J.Atmosldm-ic Sci. 45, 2055-2081, 1988.
Chahine, M. T. inverse prot)lems in radiative trausfer: Determination of atmos])llcric ]Jaranle-ters. J. Atmos. SCZ. 27’, 960-967, 197(1.
Chanowr, N. J., Kuehu, 1).h4.,, llanficld, 1)., L40n:ary, q’., Ilecbe, R. F., liaincs, K.11., NTicholsol\,1’.1)., Sitnon, A. A., h4urrcJl, A.S. Aljsolute Reflectivity S1)mtra of Jul]itcr: 0.253.5 h4icrolnetersjlmr’us 121, 351-360, 1996.
Chanovcr, N. J., Kuchn, D.h4., Beebe, R.F. Vertical Structure of JulJiter’s AtmoslJlcrc at theGalilcw Prolx I’M ry IJatitudc. Icarus, in p7ws, 1997.
Collard, A.I>., 1,. A. Sromovsky, G .1,. I]joraker, G.S. Orton. The Deep Jovial] Water Al)undancefrom Remote and in Situ Olmvwations. l).A. A .S., 29, 1006, 1997.
l)elGcllio, A. 1). Moist cc)lwmtiol\ atld tllc vertical st ructllre al~d water al)ulidatlce of ,lu~)iter’satmosphere, Icarus 84, 29-53, 1990.
I)cming, D., M..]. L4uttltna, F. lk~)cllak, 1). JeI~nings, T. Kostiuk, G. \Vicdemann, R. I,ocwen-st,cin, J. Piscitelli. A search for 1)-Mode Oscillatiorls of Jupiter: Serend ipt ious olmrvatiolls ofNonacoustic Thmtla] Wave Structure. Ast?’ophys. J. 3’13’, 456 467, 1989.
I)mning, D., I). Rcutm, D. Jellnillgs, G. I]joraker, G. h4cCahe, K, Fast, G. Wiedemann. 01)-scrvations and Analysis of I,ollgitudillal Tlmmal Waw!s OIL Ju])itcr. lcarus 126, 301-312, 1997.
Hoffmann, W. I+’., G. G. Fazio, K. Shivanandan, J. I,. Hera and I,. K. Deutsctl. MIRAC, aMid infrared Array Camera for Astronomy. 111 I?ljrared Detectors and l?~.$fvu~~~e?~tafio?~, Ed. A. M.J%UJ[W, PI’OC. SPIE 1946, 449, ] 993.
Irwin, P. G. J., A. L. Weir, S. Smith, F. W. Taylor, A. L. Lambert, S. B. Calcutt, R. W.Carlsorl, K. Baines, P. Drossart, T]]. Encrellaz, M. l{oos-%rote. Cloud structure a~ld atmosl)hericcom~)osition of Jupier retrieved from Galileo NTIh4S Real-time Spectra J. Geophys. Res., 1997.
Magalhaes, J. A., A. L. Weir, 1’. J. Gicn-asclll B. J. Co)lrath, S. S. I,eroy. Nahrc 337, 444-447,1989
Magalhaes, J. A., A. L. Weir, P. J. Gierasch, B. J. Conrath, S. S. Leroy. Zonal motic)]~ andstructure itl Jupiter’s u~)])er trol)os~)hcre fron~ Voyager infrared atld imaging observations. lcarws88, 39-72, 1990.
Gierasch, I’. J., J. A. Magalhaes, and Il. J. Conrath. Zonal mean pro~)erties of Jupiter’s u]q)ertroposphere from Voyager infrared obscrvatiolls. Icarus 67, 456-483, 1986.
17

ortiz, J. L., G. S. Orton, S. T. Stewart, 1]. h4. Fisher. Time Evolutioll allcl I,oxlgituditla]Persistence of 5-pin Hot Spots at the Galileo l’robe Iktry Latitude. J. Gfophys. Rcs., 1997.
Orton, G. S., A. J. Friedson, J. Caldwell, H. H. IIaulmel, K. 11. Baiues, J. l’. 13mgstralll, T. Z.Martin, M. E. Malcom, R. A. West, A. ‘l’. Tokuuaga, 1). M. (lriep, W’. F. Golisch, C. I). Kaminsky,R. Haron and M. Shure. Thermal maps of Jupiter: Spatial organization ald time de~)eudeuce ofstratos~dleric temperatures, 1980 1991. Scicnm 252, 537-542, 1991.
Orton, G., A.J. Friedson, P.A. ~analllandra-Fis] ler ,, J . Caldwcll, 11.11. }Iaulxncl, K.11. Baiues,J.”]’. Hergstralh, T.Z. Martill, R.A. West, G.J. Veeder Jr.,11.K. I,ynch, R. Russel, h4.l!. hfalcolul,W.F. (;olisc}l, L).hf. Griej), (3.1). Kamiuski, A.T. l’okutlaga, 1 . Iierbst, h!. Sllurc. S~)atial or-gaiuization and Time I)e~)eldencc! of Ju])iter’s 2’ro~)osl)}leric TemlJeraturm, 1980-1993. Science26fi, 625631, 1994.
Ortoli, G., M. A’llcarn, K. llaiues, D. I)emiug, 1’. l)owlillgl J. Go.gueu, C. Griffith. 11. Hattllue].W. IIoffulanu, D. Huuteu, D. Jewitt, T. Kostiuk, S. Miller, K. Nell, K. Zahnle, N. Achilleos, A.l):iyal, I,. l)eutsc%, 1+’. EslJcnlak, 1’. Esterlc, J. Fricdsoll, K. Fast, J. ]Iarriugtoll, J. Ilora, Ii. .Josc1)ll,1). Kelly, R. Knacke, .J. Lacy, C. Lissc, J. Raylier, A. S1)rague, hl. Shure, K. Wells, I’. Yanamandra-1+’isllcn-, 1). Zil)oy, G. Ijjorakcr, 1). Iluhl, l$J. Golisc.h, 1). Grie]), C. Kamiuski, C. Ardcll, A. Cllaikill,J . Goldsteiu, 1). Gilmore, G . Fazio, T . Kanatuori, 1]. l,aml T . I,iveugood, hl.-h4. hIacI,ow, hf.hflarlcy, T. Momary, 1). Robertson, l). Romani, J. S1)itale, hl. Sykes, J. Teunysoll, 1). Welluitz, atldS.-tlr. Yillg. The AIASA lufrared l’elescope Facility il~vestigatioll of Comet Shoemaker-I,cvy 9 audits collision with Jul)itcr. Science 267, 1277 - 1282, 1995.
Ortoll, G., J. 1,. Ortiz, K. Ilaines, G. IIjoraker, U. Carselky, F. Colas, D. Dcming, 1’. l)rossart, E.Ila])])a, J. l+’ri[!dson, J. Gogueu, W. Golisch, 1). C;riq), C. Hernandez, W. Hoffulallll, D. .]cnuiugs,C. Ka~lli[lski. J. Kuhu. 1’. Laques, S. I,imaye, 11. Lin, J. I,ecacheux, T. hiartiu, G. hIcCabe, ‘1’.h~olllary, 1). l’arkcr. Ii. l’uetter, h!. Rmslm, G. lleyc!s, 1’. Sada, J. Spencer, J. S1)it ale, S. Stewart,J. Varsik. .J. t$’arcll, \iT. Wild, I’. Ya~~at~~atl(lra-Fisller, A. I)ayal, 1,. lkutsch, G. Rwio, ax]cl J. Hera.I ‘](lir[li~iary ]{( ’suits of EaItlI-Ihscd Olmrvatiol]s of t llc Galileo I’IoI)c F,~lt ry Sit c. .$cie?~cc 2 7 2 ,
W - 84[), 1996.
or(o~l, G . , “1’. N4artill, 1 ’ . ‘1’atnl)~)ari. 0 . IJicl)aclc, 11. Fisllcr, J . Friedsc~ll, h4. ]icsslcr, 1{.~:illa]!l:t~lclla-~ isll(~r. K. Baitlcs, IL. West, I,. Travis, S. Stewart, 11. Peiris, E. h’oc I)obrca, S.Ilillkley, V’. Goliscll. 1). Griel), and C . Kanliuski. Atuw~Awric struclure of Ju~)iter from radio-Illet ric olm!rvatiolls of tile Galileo I’llc)tc)l)c)lari lll(:ter-I{acl iollleter (1’1’1{) and ancillary cartll-t)aseclol~scrvat io!~s. lJIL1l ATrLCT. Asbon. Sot. 29, 1005, 1997.
l)ress, \tT. 11., JIT.T. Vcttmlillg, 11.F. Flalillery. N71711c7icYd Rwipics in C, Caullmidgy lJxliversity1 ‘ress, New’ J’ork , New’ York, 19$)2.
llay]lm, J., h4. Sllllre, I).\$’. “lbo]ney, 1’. Ollaka. A. lkllault, \tT. Stahltmrgc[l D. M’atalmlw, K.Criez. 1,. Rolwrtsou, 1). Cook ald ht. Kidger J’roe, SI’IE 19j6, 490, 1993.
l{cssler, M. E., h4. W. Werner, J. Vail Clcve, J., aud 11. A. Chou. ‘Ile JPI, Ikw])-Well h4id-1 IIfrared Array Camera”. ]n lnjmrcd A stm?lomy ulith A nays: The N e x t G’cncmtiort, Ed. Ianh4cI,eau, Eqwimcntal ASfTOTLOTUY, 3, 277, 1994.
Rogms, J. H. The giant planet Jul)iter. Camhriclge University Press. Camlwidge, lJK. 1995.Roos-Serote, M., P. 13rossart, Th. Ihcrenzz, I?. l,ellouch, R. W. Carlson, K. Ii. Haiues, I,.
Kam]), 1{. Mchhuau, aud G. Orton, S. Calcutt, P. lrwiu, F. ‘1’aylor and A. Weir. A n a l y s i s o fJu])iter NFB hot spots in the 4- 5 pm ralge from Galileo/NIMS observations: llleasurenlellts ofW’atc!rl alnmonia and cloud opacity. ~. 6’eophys. lies., 1997.
%iff, A., D. B. Kirk, T. C. D. Kniglltj I,. A. l’ouug, F. S. Miles, E. Vellkatapatlly, J. D. h4ihalov,
18

R. C. Blanchard, R E. Young, and G. Schubert. Thermal structure of JuIJitcr’s u~)~wr atnlos~)llerederived from the Galileo Probe. ScZencc 276, 102-104.
Smith, P. H. and M. G. Tomasko. Photonwtry and polarin~etry of Jul)itcr at large l)}lasc [email protected] Polarimetry of the south tropical zone, scmth equatorial belt, and the polar regions from t]wPioneer 10 and 11 missions. Icarus 58, 35-73. 1984.
Sromovsky, L. A., F. A. Best, A. D. Collard, P. M. Fry, 11. E. Rcvercolnl), l{. S. Frecdtnan, G.O-ton, J. Hayden. Preliminary results of the Gailco Net Flux Radionker 13xl)crimmt. Science 272,851-854, 1996.
Sromovsky, L. A., A. D. Collard, 1’. hJ Fry, G. S. Orton, hf. T. I,mtnon, h4. G. Tolllasko, atld1{. F. Frecdulan. Galileo Probe mcasurenwnt.s of thermal and solar radiation fluxes ill th[! Jovianatnlosj)here. J. Geophys. I/es., 1997 .
Stewart, S. T., G. S. (h-toll, B. h4. Fisher, K. 11. Ilaiucs. ‘1’hc Cloud Structure of tlw JovianNTortll Equatorial ZO]IC: Context of the Galik:o l’robe 13ntry I,at it ucle. subnlit tcd to .7. G’mph?ys.Rcs. -ml?lcts, 1997.
Vasavada, A. }{., A. P. lllgcrsoll, 1). I)atkficldl h4. I]cll, 1’. J. Gicrasclll and h4. J. S. Ilelton.Galileo imaging of Jupiter’s atmos~)hcrc: ‘1’hc Great I/cd Spot, equatorial rcgioll, aml IJ’llit{! ovals.Icarus. Sul)mitted. 1997.
\~Tciclcllscllillil~g, S. .1. and J. S. l,ewis. Atluosl)llcric ald C1OUCI structure of t IIc .lcwiall ])lallcts.I(nl”’ll<~ 20, 465-476, 1973.
West, 1{. A., 1). F. Strobcl, L4. G. gbmasko. Clouds, Aerosols, and l’llotocl~t~lllistry iu theJovian Atnms])lmw lcarus 63, 161-217, 1986.
\f’est, l{. A. N. Karkoschka, A. J. FricdsoIl, h4. Scylmur, K. 11. Ilainm, 11. 11. Ilal[lt[d. ltnl)actdcl)ris ])artic]cs in .Ju])iter’s stratosl)hmc!. SCZC7LCC 267, 129& ]301, ]995.
19

TABLES
Table 1: 11 S1- lRTF coincident observations
HST date HST time I R 1 l ’ d a t e – IIITFtinle A tin)e A longitude-([IT) (h:m:s) (w’)—— .—— ——.— —. _. —.— — .—. —.
1995 March 10 20:39:16 1995 March 05:06:30 + 15:32:46 + 3.19
1996 June 27 03:07:16 1996 June 26 07:18:18 - 19:48:58 - 4.07_— .. ——— — -— —— —-— _——
20

FIGURE CAPTIONSFigure 1. History of the 5-Iml hot spot into which the Galileo Protwmtered. Each panel is
extracted from a cylindrical map created from an image of Jupiter at 4.78 pnl (see orLiz et al. 1997.this issue). The apparent bright ness variations illustrate the observed variations of the absoluteradiance of the hot spot, as deduced by ortiz et al. (1997). The itnages are centered at 6.5°N~)lanetocentric latitude, and a longitude moving 99 to 103 m/s faster than the System-l]] rot at ionrate, as described by Ortiz et al. Tile scale c)f each panel is 15° latitude by 29° longitude.
Figure 2. Radiance of the Probe entry site $pnl hot spot as a function of tinw. These weremeasured from the 4. 78-pnl inlagcs, a subset of which are shown in Figure 1. ‘The lower Kraph wasmade with a more restrictive set of criteria relative tc) the upper graph, as explained in the text.
Figure 3. Comparison of tilnmvise-interpolated 4.78-pin NSFCAM images of the PES hotspot from outside the tinlc interval whm the polyprol}ylenc safety screen was required to the1995 Dccend)er 7 tinw of tho Galileo l’rol]c entry aud the 1996 January 4 follow-ul) observation.Inter]) elation was done Iiucarly in time a~ld using tllc absolutely calibrated images, although tilefeatures shown am scaled to the brightest pixel in each I)anel i[l the top row. The Second level showsinterpolated NSFCAM images, comwlved wit]] a sccillg function that matched inlages of stars madeon 1995 lkmmd~er 7 aud 1996 January 4, using the M1RAC2 and MIRLIN instruments. res~)ectively.Ilotll of these sets of data were also made at the II{TF wit]l tllc polyl)rol)ylelle safety screcll. q’lIcthird lCVC1 shows the actual observations :nadc hy tile hlIRAC2 aud MIRLIN instruments. Ilmauscthe filter functions are slightly different (M1RAC2 and hll R,LIhT observing through a slightly broaderl)audwidt,h), tile MIRAC2 and Ml IU,IN itna.gcs were scaled to the relatively constant radiance itl tllccolder Equatorial Zone in the NSFCAN4 images. g’he lower pane] displays the differences hctweent,lw actual observations aud t}ic convolved aud inter~)olated iulagcs on the same absolute l)rightncssScak.
1+’igurc 4. l,ocation of tllc I’robe entry site in t}le 5-pnL not s])ot. The images are taken fronl theu~j~mr ~m]icl of Irig. 3 atld, again, scald to tllc I)rig}ltcst ~)ixel in cacll image. A si~~gle l“xl 0 p ixe l i sused to del~otc the t3.5° N planetoceutric latitude of the Probe entry, and a 1.5° lo~)gitudc (3-l] ixcl)extent de])icts the longitudinal extmt of the I’robe entry path, starting from 350 ktn ahovc theI-l)ar hwel to the l-bar level and dm])er (as iu Figs 1 aud 2 of Orton et al., 1996).
Figure 5. Comparison) of 4.78-pn~ radiance m[!asured I)y NSFCAM at the IRTF with 953-nnIal]d 41 O-ntn radiance measurcci IJY tllc 11ST I’lalictary Camera for the 1995 October eI)och shown inTal)]c 1. The 10° latitude by 20” longitude region centerecl on the feature at 6.5 ‘N lJlanctocentriclatitude are slIou’11 iu tllc u~)pcr two lJal]els. TIIC UI)]WY paml is an enhanced color composite takeufrom cylindrical projections of 11ST 1’C itnagcs. ‘The ]~anel t)emath it is the same region taken fromau I1{TF NSFCAh4 4.78-~~nl itnagc. A larger region covcrcd I)y this itnage is sliown ill Fig. 1. Thelovmr two panels shcnv the correlation Iwtween the 4.78-Iml thermal radiauce and the reflectivity.The HST itnage has been shifted in longitude to Illatc}l the motion of the hot spot during the shorttinlc separation between tllc two sets of olwervations (Table )). Note that the PES not sl)ot is inatl “early” and .geograIhically small stage of development. The colored curves in the correlationplots are linear regressiol~ fits to the data, cxcludillg points with 4.78-pIN radiance Icss than 0.06N7/1112/ster/?rzulll. The correlation coefiicieut for the 953-nnl vs. 4.78-II radiance is 0.66 and forthe 410-nm w 4.78-~~ln radiance is 0.41, in tile negative sel~se.
Figure 6. Comparison of 4.78-pm radiance measured by NSF’CAM at the lRTF with 953-nnIand 410-nnl radiance measured by the HS’I’ l)lauetary Camera for the 1996 Juue epoch shown inTable 1. The panels cxwresl)ond to theil countcr[)arts iu Figure 5, exce~)t that tl~e HSq’ images are
21

fronl the WF iustrurnent. We note that tlm PES not s[mt is iu a “mature” pham of ctcvclol)mcutcompared with 1995 (lctober. ‘1’l]c lower resolution of the NSFCAhl ituage, compared with 1995october is the rwsult of poorer atmospheric sewing conditions. ‘1’llc correlation cocfliciellt for tile953-llm vs. 4.78-II radiaucc is 0.91 aud for tile 41 O-X1111 m 4.7&p111 radiatm is 0.52, ill t lle negativesense.
Figure 7. Comparison of latitudinal depcndeuce of 953-ntn aud 410-l~uI reflectivity, taken fromcy]iudrical projections of HS’T images from 1995 October, as shown iu the upper two ])allcls. Theregion shown is the saulc as iu Figure 5. Tl)e arrow iudicatcs the longitude frolll which tile gra~)llof reflectivity vs. latitude is takm in the bottom paucl.
Figure 8. Comparison of latitudinal dcpcndencc of 953-nul aud 410-nul reflectivity, takell froxucylindrical projections of HST iulagcs from 1996 June, as shown iu the upper two ~)alwls. Theregion shown is the saulc as iu Figure 6. q’l)e arrow has the same meauiug as iu Fig. 7.
Figure 9. Com])arison of s])cctral reflectivity of t]le I’ES for tlIe various epochs of IISql obser-vations. The observed reflectivity has becu adjusted to eulission aud illcidcnt augles of 45° each.The rcffectivitic!s are takm from exactly 6.5° N plauctocentric latitude aud a 10 spau of longit uclcceutered ou the P13S (e.g. Figs. 5- 8). The error bars represent a combination of the variat~ce oft hc measured I/F values and the propagation of uucmtaint ics of the Mintlacrt cocflic.icnts used toadjust to a common geometry. Not showN is a -J5Y0 uucertaiuty iu the absolute calit)ration aflectiugall ttm data. Note that the 893-llul poiut is iuftueuced by a strol]g al)sorption baud of gaseous CH4.
Figure 10. Comparison of s])ectral reflectivity of the PES not spot, celltel for the various epc)cllof HST obsmvat,ions. The ~)lot is identical to Fig. 9, except that the latitude froul which tlm datawere taken was chosm as that in which the “rc!d” reflectivity was a miuimum, e.g. 7.0° N iu 1995Ott (Fig. 7) aud 7.5°N in 1996 JLIIIC (Fig. 8).
Figure 11. Com~mrison c~f s~)ectral reflectivity tlm center of auothcr 5-pul hot spot some 40°ill latitude away from the I’13S hot s~)ot for tlic various e])ocl) of 11ST ol)st!rvatiolls. Tile l)lot isc)tllcrw’ise idelltical to Fig. 10.
Figure 12. Cyliuctrical projection map of the tro])os])lleric temperature at the 250-ml)ar pressurelcw!l for Decetulwr, 1995. ‘1’hc I’ES latitude is at tile soutllmn edge of tlw bright NIIII.
Figure 13. Lougitudi]la] teu]l)eraturc profile of the 250-mt)ar pressure level at 5 7° N. ‘1’heprofile for Novemt)cr 1995 was shifted UI) by 2 Kelvius and the Jauuary 1996 profik was shifteddown by 2 Kelvim for clarity. The profiles have t)een smoothed with slidiug; 7° boxcar avcra.giug.The error for the temperature retrievals are +0.05 K for hTovemt)er, 1995, :E(). 1 K fox lhxcl]llx!r,1995, aud +0.25 K for Jauuary, 1996, as showli by tllc siuglc error har at 20° W for eac]l epoch.
Figure 14. I.on.git udiual tcl[l~mrature ~)rofilc of tile 31 6-ml)ar ~Jrcssurc level at 5 7° N. Tllc~)rofile for Ncwcmtm’ 1995 was shifted UI) t)y 2 Kclvills a~ld the Jauuary 1996 profile was shiftedclown I)y 2 Kclvins for clarity. q’he ])rofil[!s have I)CWII sulootllc!d with slidiug 7C’ boxcar avcragiug.‘] ’he error for the temperature retrievals are +0.05 K for N’ovemtwr, 1995, EEO. 1 K for I)ecemtmr,1995, aud +0.25 K for Jauuary, 1996,as shown by the siu.g]c error bar at 20° W for cacll e~)och. Asex~)ected, tile amplitudes of the })erturbations decreases with depth.
Figure 15. LomtL normalized periodogratn s]wctruu~ of the lougitudiualthe 2.50-mbar level.
Figure 16. Lomb normalized periodogratu spectrum of the ]ougitudiualthe 316-mt~ar level.
Figure 17. Cyliudrica] project iou map of the stratosl)hmic brightness temperature derivecl from7.8 pIII data for November, 1995. The t)right NEII t)aud showiug iu the stratosphere starts at a
structure at 5-7° N at
structure at 5-7° N at
22
latitude of approximately 10° N, nort,l) of the PES latitude. The PIN latitucle S11OWS no ~)articularstructure during this epoch,
Figure 18. Longitudinal scans of the stratospheric brightness temperature derived from 7.8 ~fmdata averaged over 50--7° N for September 5, November 7 (shifted by -5 K), and Ilecember 7 (shiftedby -10 K), 1995. The noise level of the data are shown converted to brightness tempcrat ure at theright side of the gra])h. No clear correlations betweeu the epochs are evident.
Figure 19. Zonal mean meridiau scam of the stratos[)heric brightness tellllJcraturc derivedfrom 7.8 pm data for August, 1994 and November, 1995. It~ November, 1995, the equator has,returned to a relatively low state, like that in 1986 1987. The August, 1994 data seelus to beilltmmediate between (i) the warmer mid-latitude / cooler equator state, alId (ii) the warmer(!quator / cooler midlatitude state. The Novemeber 1995 state agrees with the clllasicl~laclrclltlialoscillation hypothesis of Leovy et al. (1 991 ).
23

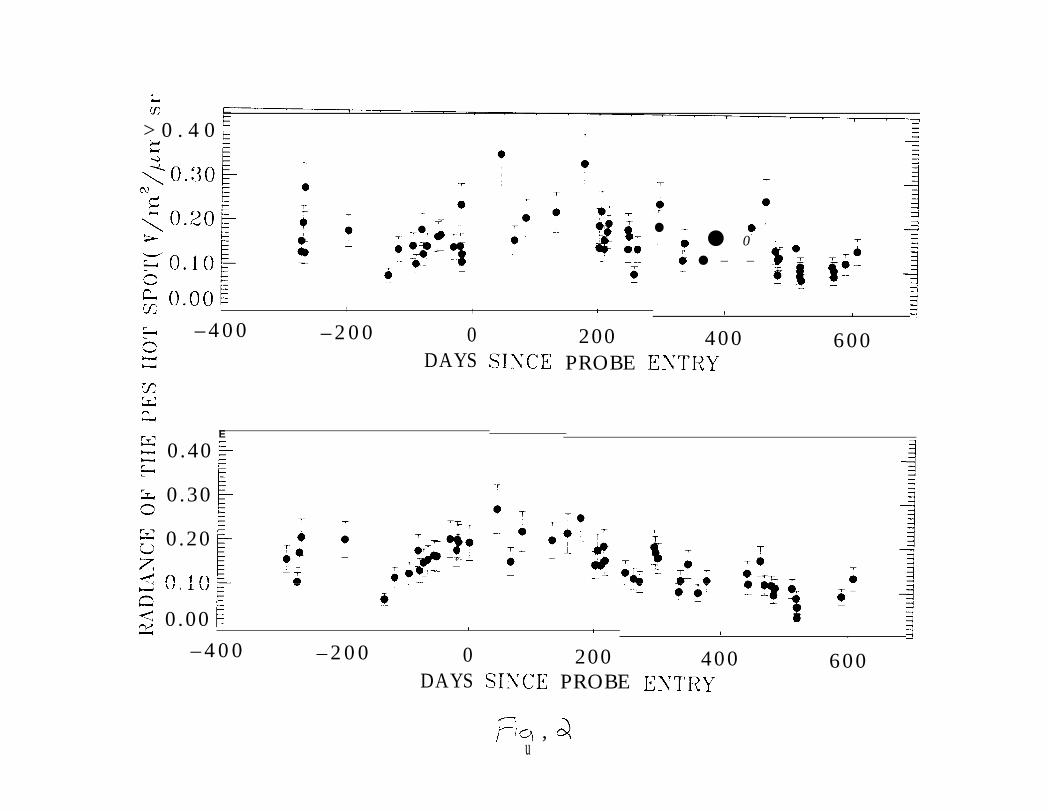
> 0 . 4 0
<0.20
t-J
‘i=-
m
0.00E , , 1
– 4 0 0 – 2 0 0 0DAYS
E
0.40
0.30
0.20
() ~~.
0 .00
7
*
●-— ;
*—
0● 0
● – –
f ! 3
200 400 600PROBE EYTRY
-1
-1
, f
– 4 0 0 – 2 0 0 0DAYS
1 , =1200
SIYCE PROBE
plq , du
400 600EXTRY

.-’_

10
5
15 10 5 0 355
1995 Nov 21
1995 Dec 7
1996 Jan 22
LONGITUDE (“W, System III)

1995 October
.——.. ——.—. .-— ———-— —~—-~
[
~oyo -
0 . 1 0 -
(),0() :___ –
0.50
o.30~-● 953 nm
&● a4
●●
.--—. ——.. . -—-.- - - - - -
——- .
10.:10--
(),20 “
L0.10 -
0 . 0 0 - - - - - -
0, :]0
0,60 0.’70 0.s0
—.-. ——— —T.– r- . - r. - . – – r - r — - r-. .—. —-—.—. - — – - - - - -
,– —----
.—
..— .— -.
●
●
✍✎✎✎✎����✎��✎ ✎ ✎ ✎ ✎ ✎ ✎ ✎ ✎ ✎ ✎ ✎ ✎ ✍ ✍� �✍✍ L –—. - –-—-
0,10 0 .50
00 {)()
-—=— ...
-..- .-.
0.60 ().70
.
1996 June
[ “~——- .-— T — -—— . . r—r—.
().:30.— .——- ——
● 6” , ~6- ●
● 1, 953 nm _~o~() ●
O.1O‘% .
8 4*0.00 .>. .____ .A.A. -.. . . . . . . . . . . . . . . . . . ..-L
—
—=—--–.
(), 30 ().-1 o 0.’70 0.s0 0 .90
. .. . ----—— -.--—.—7–.--.-.—. -. . , -, ! . . . ---- --- --—-z– —-—
0.00 E.-. -0.1
-.. — .. —.. —. . . . . . . . . . . . . . .._. -. bA-- —— . . . - - - . — — — .
o,~ 0.3 0.4 0.5 0.6 0.;
lIF

95311111
41O nln
~ -T —,.—.7 –
2
0.6 F ‘*--H-”-:0.5 K —
—\~~-~
~ 41011111L....&. L—–..–—--—- ––- ~ . ~ 1 . . ..L .– ———L. .—–.- . –
2 4 6 8 10
Planctocmtric I.atitudc
‘/

0.8[;::= r T -T --T.-.7
1 -’\\0.7 -. .
[.
k
1-LL
0.31.
r– , ,, ,, T
-..
\
/-.
“-N “
0.6 p“-, . /\.
\ ““””””’‘.. /“ --”-”- /i‘“\“--- . ..
‘\....-+’% ‘i* 95.3 1111)
- - - - ’ - ” ’ ‘“-’ -’ ‘- -110 111}1\ -]% _.&-
2’” 4“’”6’’’ 5 ” - ”-1-,-i
io’

1-
---r
●
r-,,:,!
,.‘r I
1 1 ’ ”,-- ,..--T—,__r.
4 a]
—L-+-..1 - L-*0
w 00 6
000?+
00w
00C9
00d+
00M
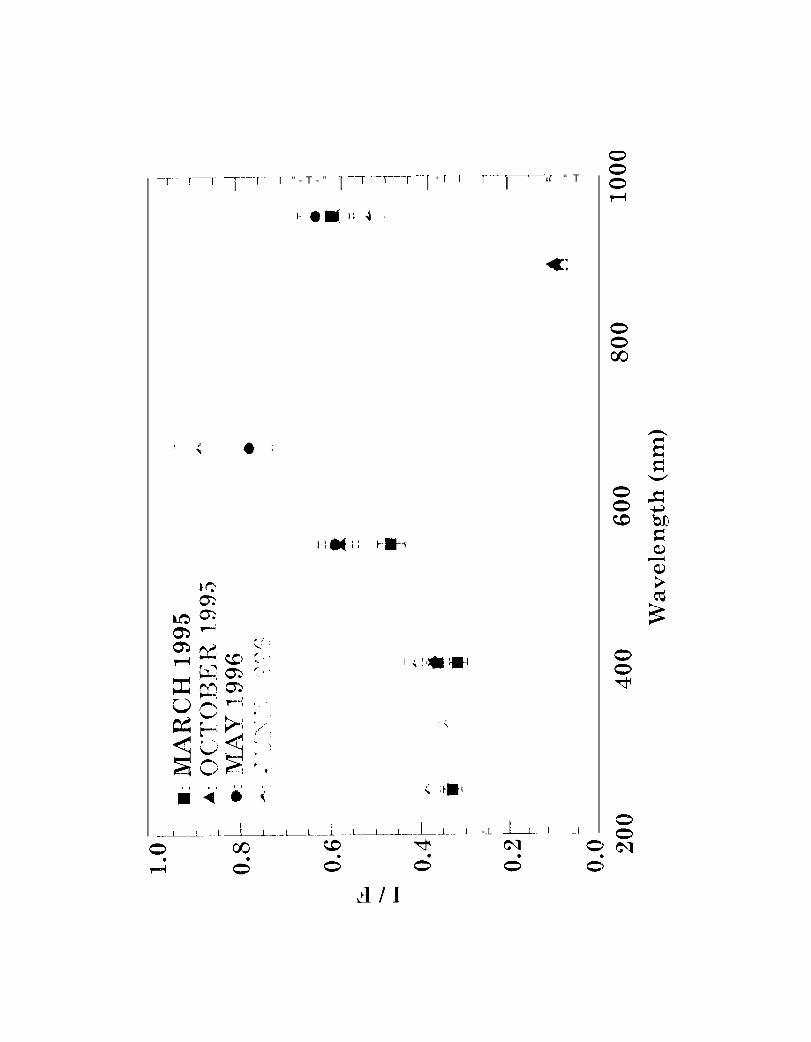
“-r
L
~_-.-_--_.T “ - T - ” “~ ‘T ‘--T----F ‘“l ‘- I ‘-l-
t+
$4
r-i
.-——I
-.L
l “ “ T
-L-L~ . . ..L
L!I/I

‘—-7
D+b._LL--L----
o m● ●
?4 o
t
:.%,
1L...-L –.
v
o
I* :
L -.-L
~:
L..--L-Cx
o
L.~.
00
000!-4
o0w
o0C9
o0*
o0m
L!I/l

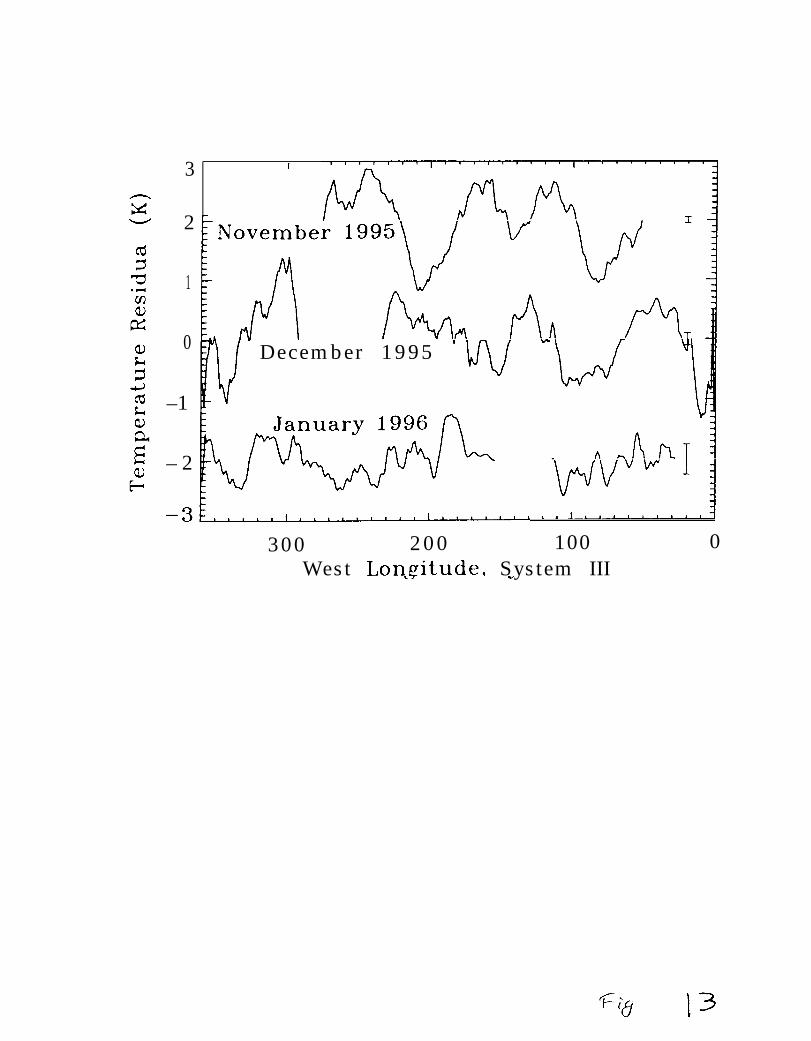
3
2
1
0
–1
– 2
1
ENovembe
December 1995
–3F1Ltj1111111Lil,,,, Ii,+300 2 0 0 100 0
West Lonpitude, System IIIu “

Q L I 1 I -1
Cd
La)a
November 1995~=V-V ‘w I
1
I December
o
–1
– 2
– 3
E-1-
lh‘WV“VW
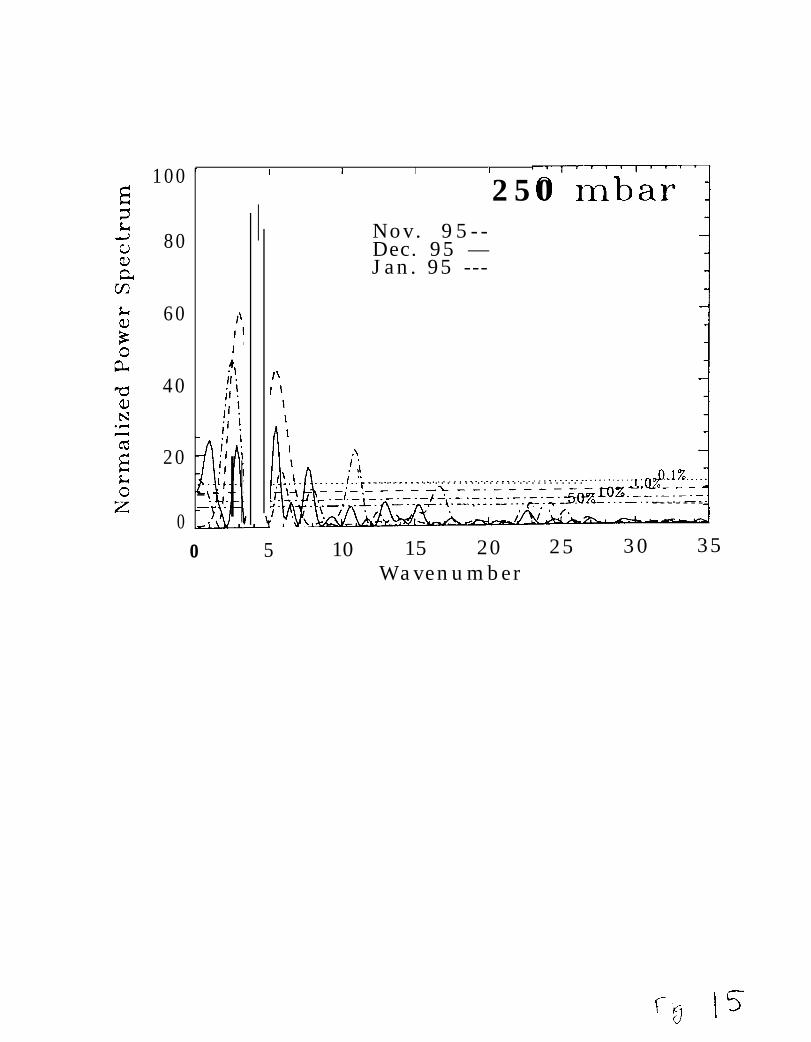
100
80
60
40
20
0
Nov. 95--Dec. 95 —Jan. 95 ---
A 1
I ,\
, I 1 I I
““72 5 0 mbar
— [&,.xii:::--------- --=-li..` . . . . . . . . . . . . . . . . . . . . . . . . . . . . . . . . . . . . . ..~&..l %....~l_:. TL:. _.:. _/ L.–. –._.. .._..:p”.;”mLq.~= - - - - - - -
‘\’
o 5 10 15 20Wavenumber
25 3 0 35
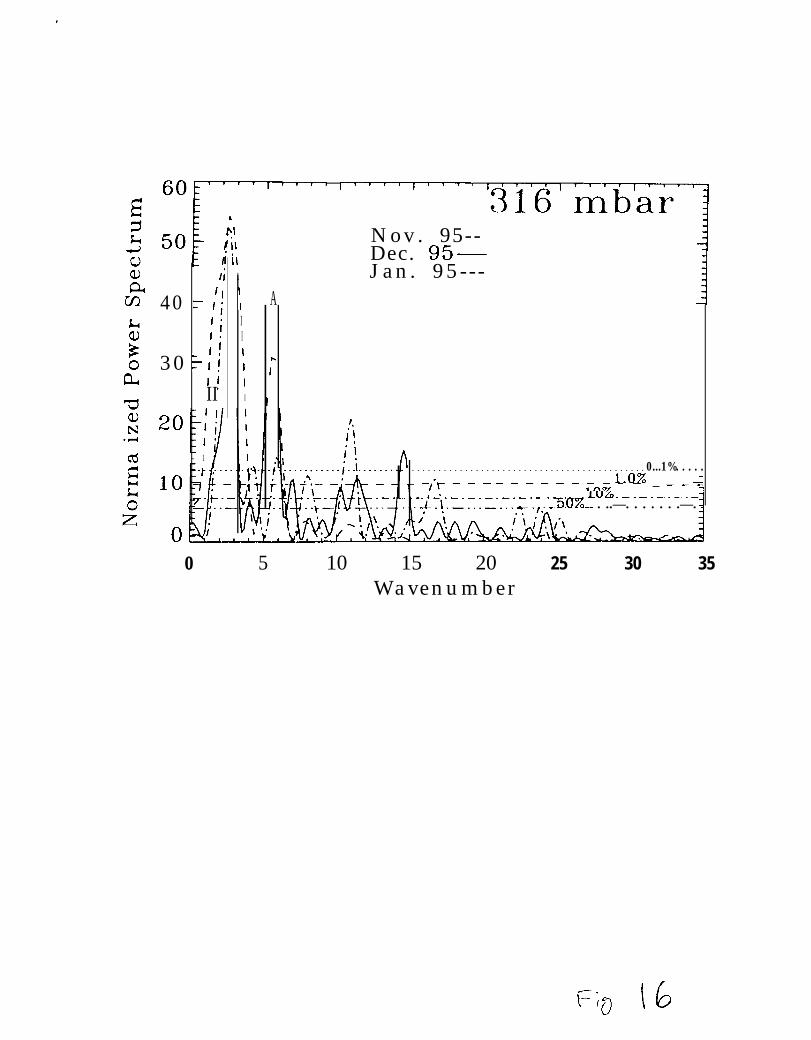
.
60~rrr P’’’WII ‘316’ rnii]i-1-
Nov. 95--Dec. 95—Jan. 95---
A i
t /l ‘1Ii 1
40 = /’; ‘1~i I
I,i
3 0 + ; ,-1! III I I
- I. . . . . . . . . . . . . . . . . . . . . . . . . . . . . . . . . . . . . . . . . . . . 0...1%. . . . ._,”r_–– –––––––_Lwo _ __=
‘J~\--_—~I~--~T-–-– . ..—. . . . . . .—.
o 5 10 15 20 25 30 35Wavenumber


CD
,
0a““-T ‘1 —
it
o++ml
xo4
I
0
I
“b.
o Huu
IE‘a)
om (/2
CA
om+
1 ,

>
104
152 “
150 -
148 -
146 “
144—
l“
November-\ ./.,
“\\‘\‘\
1995
i-.\.
\-/.-.L /‘\\ /’ .\
i /’ ‘i,i \/,\./.August 19 4 i \. . . .\ -. >-/~’ I/’
– 5 0 o 50Latitude