Geoprobe Membrane Interface Probe (MIP)
53
1 Standard Operating Procedure Membrane Interface Probe (MIP) Geoprobe ® Membrane Interface Probe (MIP) Standard Operating Procedure Technical Bulletin No. MK3010 PREPARED: May 2003 REVISION IV: March 2021
-
Upload
khangminh22 -
Category
Documents
-
view
0 -
download
0
Transcript of Geoprobe Membrane Interface Probe (MIP)

1 Standard Operating Procedure Membrane Interface Probe (MIP)
Geoprobe® Membrane Interface Probe (MIP)
Standard Operating Procedure
Technical Bulletin No. MK3010
PREPARED: May 2003
REVISION IV: March 2021

2 Standard Operating Procedure Membrane Interface Probe (MIP)
Copyright © 2021 by Kejr, Inc. ALL RIGHTS RESERVED.
Geoprobe® and Geoprobe Systems®, and Direct Image® are registered trademarks of Kejr, Inc., Salina, Kansas
No part of this publication may be reproduced or transmitted in any form or by any means, electronic or
mechanical, including photocopy, recording, or any information storage and retrieval system, without written permission from Kejr, Inc.

3 Standard Operating Procedure Membrane Interface Probe (MIP)
1.0 Objective This document serves as the standard operating procedure for use of the Geoprobe Systems® Membrane Interface Probe (MIP) used to detect volatile organic compounds (VOCs) at depth in the subsurface.
2.0 Background 2.1 Definitions
Geoprobe®: A brand name of high quality, hydraulically powered machines that utilize both static force and percussion to advance sampling and logging tools into the subsurface. The Geoprobe® brand name refers to both machines and tools manufactured by Geoprobe Systems®, Salina, Kansas. Geoprobe® tools are used to perform soil core and soil gas sampling, groundwater sampling and testing, soil conductivity and contaminant logging, grouting, and materials injection. *Geoprobe® is a registered trademark of Kejr, Inc., Salina, Kansas. Membrane Interface Probe (MIP): A system manufactured by Geoprobe Systems® for the detection and measurement of volatile organic compounds (VOCs) in the subsurface. A heated probe carrying a semi-permeable membrane is advanced to depth in the soil. VOCs in the subsurface diffuse across the membrane, enter a carrier gas stream, and are swept to gas phase detectors at ground surface for measurement.
2.2 Discussion
The MIP is an interface between contaminates in the soil and the detectors at ground surface. It is a mapping tool used to find the depth at which the contamination is located but is not used to determine concentration of the compound. Two advantages of using the MIP are that it detects contamination in situ and can be used in all types of soil conditions. The MIP is a logging tool used to make continuous measurements of VOCs in soil. Volatile compounds outside the probe diffuse across a membrane and are swept from the probe to a gas phase detector at ground surface. A log is made of detector response versus probe depth. In order to speed diffusion, the probe membrane typically is heated to approximately 121°C. (Refer to Figure 2.1). Along with the detection of VOCs in the soil, the MIP also measures both electrical conductivity and hydraulic profiling of the soil to give a probable lithology and permeability of the subsurface. Simultaneous logs of soil electrical conductivity and hydraulic profiling are recorded along with the VOC detector responses.
Figure 2.1: Diffusion across the membrane

4 Standard Operating Procedure Membrane Interface Probe (MIP)
Electrical Conductivity
The electrical conductivity measurement is accomplished by using a dipole measurement
arrangement at the end of the MIP probe. The field instrument induces a current across the
electrical dipole and probe shell as it penetrates the soil. The system measures electrical current
and voltage and from these parameters, calculates electrical conductivity. Higher electrical
conductivity is typically representative of finer grained sediments, such as silts and clays, while
sands and gravels have distinctively lower conductivities. Ionic contaminants in the soil or pore
fluids will increase the measured
conductivity.
Interpretation of electrical conductivity
(EC) logs comes with field experience. It is
very important that soil core samples are
taken to confirm lithologic changes as
each EC log is unique per site. As a
generalization, a high conductivity
reading indicates a smaller grain size and
a low conductivity reading indicates a
larger grain size (See Fig. 2.2).
Figure 2.2: Generalized Electrical Conductivity Readings
The subsurface electrical conductivity response is comprised primarily of the soil mineralogy but is
also influenced but the conductance of the pore fluids. This is discussed further in section 3.0.
Hydraulic Profiling Tool (HPT)
Hydraulic profiling of the subsurface occurs as water is injected out of an injection screen in the
side of the probe (above and opposite of the MIP membrane). Water is injected at a set flow rate
and the controller varies the pressure required to inject the water at the rate initially set. Soils
comprised of sands and gravels require very little pressure to inject this water while those with
increasing silt and clay particles require more pressure to inject water at the set flow rate.

5 Standard Operating Procedure Membrane Interface Probe (MIP)
3.0 Interferences of MIP, EC, and HPT
3.1 Detector saturation may require a short period of time for the detector to return to baseline after a log has been performed in higher concentrations. The MIP system can be used in free product environments with the operator monitoring and making the necessary adjustments to the detector and software gain/attenuation settings to account for the higher voltage readouts.
3.2 The MIP system can be operated in a wide range of contaminant concentrations from low dissolved phase (<0.50ppm) to free phase contaminant levels. While performing the log and during the removal of the tool string from the ground, contaminants can absorb onto the surface of the membrane and trunkline material causing elevated detector baseline signals. It is very important that the probe and trunkline system is clean enough to see the low concentrations typically used in the chemical response test. Not adequately decontaminating the probe prior to performing a response test can either elevate the concentration of the standard causing an inaccurate high response to the specific concentration of standard that was prepared for the test as well as a high detector background can mask the response that comes through from the chemical response test.
3.3 Electrical conductivity can provide false positives or higher than expected readings when the soil is impacted by ionic brines (chloride, nitrate) originating from, but not limited to seawater, salt storage, remediation injection fluids, agriculture, and mining practices. Encountering metallic objects in the subsurface can also result in extremely high EC readings.
3.4 Some silt and clay soils will not have the typical ionic composition that an operator may be used to for similar soils. This can result in lower than expected electrical conductivity readings and perhaps cause misidentification of the associated soil zone based on typical response of a courser grain material. This can occasionally be found in clays that have had the minerals leached out or in intermixed silt-sand zones. In these cases, focus must be given to the injection pressure readings from the HPT sensor for permeability.
3.5 Some clay soils will be able to grate through the HPT screen during probe advancement and cause a blockage within the HPT screen that results in an unrecoverable high pressure.

6 Standard Operating Procedure Membrane Interface Probe (MIP)
4.0 Tools and Equipment The following equipment is needed to perform and record MIP logs. Basic MIP system components are listed in section 4.1 and shown in Figure 4.1. Refer to Appendix VI for a detailed illustration of the GC1000 setup configuration. Appendix VII shows the common MIP probe tool string diagrams. There may be more required tools as determined by your specific model of Geoprobe® direct push machine. 4.1 Basic MIP System Components
Description Quantity Material Number Field Instrument, 120V (Model FI6000) ............................................. -1- .............................. 213940
Field Instrument, 220V (Model FI6003) .............................................. * ............................... 213941
MIHPT Acquisition Software ............................................................... -1- ............................. 1300060
MIP Controller, 120V (Model MP6505) .............................................. -1- .............................. 214137
MIP Controller, 220V (Model MP6507) ............................................... * ............................... 214139
HPT Flow Module, 120V (Model K6300) ............................................ -1- .............................. 214091
HPT Flow Module, 220V (Model K6303) ............................................. * ............................... 214093
Gas Chromatograph, 120V with PID, FID and XSD ............................. -1- .............................. 213946
Gas Chromatograph, 220V with PID, FID and XSD .............................. * ............................... 213947
MIHPT Probe, 1.75 inch ...................................................................... -2- .............................. 226720
MIHPT Probe, 2.25 inch ...................................................................... ** .............................. 214117
1.75 Connection Tube ........................................................................ -2- .............................. 219594
MIHPT Trunkline 100 ft. ............................................................... (optional) ........................ 214113
MIHPT Trunkline 150 ft. ..................................................................... -2- .............................. 214114
MIHPT Trunkline 200 ft. ............................................................... (optional) ........................ 214115
Agilent ADM 1000 Digital Flow Meter ................................................ -1- .............................. 600227
Hydrogen Gas Regulator..................................................................... -1- .............................. 600137
Nitrogen Gas Regulator ...................................................................... -1- .............................. 600175
Vertical Gas Bottle Rack ..................................................................... -1- .............................. 214121
HPT Reference Tube 1.75 in HPT Probe ............................................. -1- .............................. 212689
HPT Reference Tube 2.25 in HPT Probe ............................................. ** .............................. 211762
MIP Service Kit .................................................................................... -1- .............................. 214142
HPT Service Kit .................................................................................... -1- .............................. 205599
Stringpot, 100-inch ............................................................................. -1- .............................. 214227
Stringpot Ground Plate ....................................................................... -1- .............................. 220775
Stringpot Cordset, 65-feet (19.8 m) ................................................... -1- .............................. 202884
Drive Cushion (GH60) ......................................................................... -1- .............................. 204278
Rod Wiper, 1.25/1.5” Rods ................................................................. -1- .............................. 600341
Rod Wiper Weldment ......................................................................... -1- .............................. 204387

7 Standard Operating Procedure Membrane Interface Probe (MIP)
4.2 Optional Accessories Description Quantity Material Number Heated Trunkline Controller, 120V (Model MP7000) ........................ -1- .............................. 214147
Heated Trunkline Controller, 220V (Model MP7003) ......................... * ............................... 214148
MIP Heated Trunkline 100 ft. ....................................................... (optional) ........................ 214150
MIP Heated Trunkline 150 ft. ............................................................. -1- .............................. 214151
MIP Heated Transfer Line 8 ft. ........................................................... -1- .............................. 214149
MIP Breakout Connection Panel. ....................................................... -1- .............................. 211100
MIP/HPT Drive Head 1.5in. rods ......................................................... -2- .............................. 203794
Slotted 1.5” Drive Cap, Threadless ..................................................... -2- .............................. 206609
MIP Probe, 2.25 inch .......................................................................... ** .............................. 214152
2.25 Connection Tube ........................................................................ ** .............................. 219455
2.25 Inch Water Seal Drive Head ........................................................ ** .............................. 212089
2.75 Inch Water Seal Drive Head ........................................................ ** .............................. 209796
Slotted 2.25” Drive Cap ...................................................................... ** .............................. 211798
Roll-out Rod Rack (30-1.5in rods). ...................................................... -1- .............................. 213627
Benchtop Instrument Rack ................................................................. -1- .............................. 230892
Water Transport System. ................................................................... -1- .............................. 203450
Stringpot Mounting Bracket (6600/7700) .................................... (optional) ........................ 202947
Stringpot Mounting Bracket (78 Series) ............................................. -1- .............................. 209511
Stringpot Foot Bracket (6600/7700) ............................................ (optional) ........................ 201816
Stringpot Foot Bracket (78 Series) ...................................................... -1- .............................. 209533
Stringpot Piston Weight ..................................................................... -1- .............................. 214225
*Use in place of 120V components if desired.
**Use in place of 1.75-inch probe and components if desired.

8 Standard Operating Procedure Membrane Interface Probe (MIP)
Figure 4.1: MIP System Components
MIHPT Probe MIHPT Trunkline
(carrier gas tubing, Water
injection line and electrical
conductors) connects the
MIP probe with the surface
instruments
Truck mounted roll out rod
rack for drive rods. The
Trunkline is thread
through all rods
Gas Chromatograph with
Gas Phase Detectors
i.e. PID, FID and XSD
Depth Measuring
Stringpot*
*For mounting of the
Stringpot onto the direct
push machine see Fig. 6.1B

9 Standard Operating Procedure Membrane Interface Probe (MIP)
4.3 MIHPT Instrumentation Setup
FIG. 4.2 Instruments Typically Required for MIP Operation
4.3.1 Detector System (Fig. 4.2A): Laboratory grade, gas phase detectors are needed for the detection of VOCs in the carrier gas stream. Detectors are typically mounted on a gas chromatograph. Figs. 4.3 and 4.4 show a GC configured with an XSD, FID and PID however, other model gas chromatographs and detectors can be used with the MIP system.
4.2.1a XSD Controller (Fig 4.2B): for the detector heater circuit and signal amplification and output of the XSD
4.3.2 Laptop computer (Fig 4.2C) with Direct Image acquisition and viewing software installed
4.3.3 Field instrument (Fig. 4.2D): The primary purpose of this component is to acquire analog data from the MIP probe, MIP and HPT controllers and detector system in real time. The data saved by the acquisition system are: depth; soil EC; rate of probe penetration into the subsurface; temperature of the probe; flow and pressure of the carrier gas supply at the flow controller; and four possible gas phase detector inputs. The primary components of the field instrument include:
4.3.3a Circuitry for the EC system. A voltage output of 0.75VAC is used to measure electrical conductance of the soil. The input connections for EC are located on the rear of the Field Instrument. 4.3.3b Universal serial bus (USB) output connection located on the rear of the field instrument to communicate with the acquisition software on a laptop computer. 4.3.3c Global positioning system connections for acquiring latitude and longitude locations of logging location and storage of this data directly to the log file.
F
B
a c
C
D
E A

10 Standard Operating Procedure Membrane Interface Probe (MIP)
4.3.4 MIP Controller (Fig 4.2F): The MIP controller is used to control the gas flow delivered to the membrane cavity and the voltage delivered to the heater block and EC dipole electrode. The primary features of the MIP controller include: 4.3.4a Primary pressure regulator to control the pressure of carrier gas to the flow regulation circuit of the MIP controller. 4.3.4b An electronic or mass flow controller (Fig 4.2a) is used to regulate the flow of carrier gas through the MIP system. The flow rate is typically set to 25-40 ml/min with a MIP pressure reading of 10PSI (~70kPa) while operating the MIP. 4.3.4c Temperature controller (Fig. 4.2c) regulates the voltage supplied to the heater block to maintain an elevated temperature in the subsurface. The temperature controller has two outputs on a liquid crystal display (LCD). The top output is the temperature of the membrane in the heater block. The bottom output is the set temperature of the controller; the manufacturer sets this temperature at 121°C [250°F]. 4.3.4d Analog signal input from the detector system. The analog outputs from the gas phase detectors are connected to the controller for conversion to digital formats to be transferred to the data acquisition system.
4.3.5 HPT Controller (Fig. 4.2E): The HPT controller is the pump and flow control for the injection of a set flow of water for the hydraulic profiling system. The controller also monitors in the instrument the pressure required to injection the set flow of water (line pressure). The controller also powers and reads the data from the downhole HPT pressure transducer.
4.4 MIP DETECTOR SYSTEM USED FOR ANALYTE DETECTION
4.4.1 Detector System—Laboratory grade, gas phase detectors are needed for the detection of volatile organic contaminants within the continuous carrier gas stream. Detectors are typically mounted on a gas chromatograph. Figs. 4.3 and 4.4 show a typical detector setup using a PID, FID and XSD detector, however, different models of GCs and detectors can be used with a MIP system. The use of multiple detectors is helpful for identifying classes of volatile compounds, not individual volatile compounds. Certain detectors may be operated in series for the detection of different contaminant types. A brief discussion of commonly used detectors with the MIP system is provided.
FIG. 4.3 Gas Chromatograph with Gas Phase Detectors FIG. 4.4 Detectors (A) XSD, (B) FID, (C) PID
4.4.1.1 Photo Ionization Detector (PID)—The PID (Fig 4.4C) uses ultraviolet radiation to ionize molecules in the effluent of the MIP carrier gas stream for analyte detection. The PID is a non-destructive detector and can therefore be used in series with other detector types. A gas dryer should be used on the carrier gas
A B C

11 Standard Operating Procedure Membrane Interface Probe (MIP)
before entering the PID. For a compound to be detected by a PID the chemical must have an ionization potential below that of the PID lamp excitation energy which is commonly 10.6eV. The PID in the MIP system is generally used for detection of aromatic hydrocarbons such as benzene and toluene and double bonded chlorinated compounds such as trichloroethylene and perchloroethylene. 4.4.1.2 Flame Ionization Detector (FID)—The FID (Fig 4.4B) uses a hydrogen/air flame to produce ions and electrons that can conduct electricity through the flame. A potential is applied across the burner tip and the collector electrode. The resulting current is then amplified and recorded. The FID is most often used for the detection of petroleum hydrocarbons such as butane, heptane and octane, but also may be used to detect methane from landfill gases or leaks of natural gas from storage reservoirs. The FID also may be used for the detection of chlorinated VOCs when present at high concentrations or as free phase DNAPL. 4.4.1.3 Halogen Specific Detector (XSD) – The XSD (Fig 4.4A) reactor assembly is typically operated at 1,100oC [2,012°F] in an oxidative state that converts halogenated organics into free halogen atoms. These halogen atoms are adsorbed onto the activated platinum surface of the detector probe assembly resulting in an increase thermionic emission. This emission current comprised of free electrons, negative and positive ions provides a corresponding voltage that is measured via an electrometer circuit in the detector controller. The XSD is a destructive detector used for the detection of total halogenated VOCs in the MIP system. The XSD provides a relatively consistent response to analyte mass regardless of the number of halogenated (typically chlorinated) atoms are bonded on the molecule and provides a significant working range of detection for these compounds.
Note: Refer to the manufacturer’s manual for specific settings and gas flows of the PID, FID and XSD MIP detectors.
4.5 MIP TRUNKLINE
Standard MIP/MIHPT trunklines operate at ambient temperatures to transport analytes to the surface detectors
through gas line tubing.
4.5.1 Tubing is used for the gas lines to supply a continuous flow of inert carrier gas to sweep behind the membrane. Two tubes are used in the standard MIP and MIHPT trunklines (Fig. 4.5): a Teflon supply tube brings clean carrier gas from the MIP controller source to the membrane and PEEK (polyether ether ketone) tubing returns the carrier gas from the membrane to the gas phase detectors at the surface. PEEK tubing is used as the return line due to is lower sorptive capacity for many VOC analytes. If using the heated trunkline system, both gas lines are constructed from stainless steel tubing.
Figure 4.5 MIHPT Trunkline

12 Standard Operating Procedure Membrane Interface Probe (MIP)
5.0 Quality Assurance/Quality Control
Quality assurance (QA) testing must be performed on each probe sensor before and after each log to validate that the equipment is able to generate good data. The QA tests on the MIHPT tool includes chemical response tests (Section 5.1.3) which ensure that the probe membrane, trunkline and detectors are capable to providing ample signal over baseline noise to a known chemical standard at specific concentrations. The electrical conductivity (EC) sensor is tested using an EC dipole test (Section 5.2) with low and high readings typical to EC values of the soil. The HPT sensor and screen are tested using the HPT reference test (Section 5.3) which confirms the sensors ability to accurately measure a 6in (15cm) column of water and provides an accurate measurement of atmospheric pressure.
Quality control (QC) is performed during and after each log is generated. Log QC will answer the following questions to ensure that the data is good and makes sense:
1. Does the log look correct? Is there anything seen in the log that would make you suspect that the system wasn’t working correctly, ie. a loss of temperature or gas pressure of the system. Are there straight lines in the data? That is typically abnormal.
2. Response consistency? As more logs are completed do they show general consistency of EC, HPT and contaminant response? Review logs in cross section with DI Viewer (Appendix A.5.3).
3. Repeatablity? Replicate logs may be run every 10 to 20 locations to verify repeatability. 4. Are my lithogy changes consistant with physical soil cores? Take continuous or discreet
confirmation soil samples to confirm your lithogy changes in EC. 5. Do the MIP detector responses make sense for expected contaminants. Verify the specific
contaminants and concentrations by collecting groundwater and/or soil samples for lab analysis.
5.1 MIP Chemical Response Test:
Chemical response testing is an important quality assurance measure used to validate each log by proving the integrity of the detector system. During the chemical response test, the operator introduces working standards (a known site contaminant of concern) at known concentrations to the membrane for a set time of 45 seconds which should match the membrane exposure (residence) time of the probe at each sampling interval. Two acceptable methods of introducing the working standard to the membrane are shown in Figures 5.4 and 5.5.
Typically, a site contaminant of concern is used in MIP chemical response tests. This may include but is not limited to Benzene, Toluene, Trichloroethylene or Perchloroethylene. The stock standard (section 5.1.1) should be made up from one of these or an appropriate chemical.
Multilevel response testing using 3 concentration levels (Fig. A.1.1 & A.1.2) is strongly recommended to be performed at least daily on the initial response test by field operators. Concentrations may include a 1, 5, and 25ppm level of a compound of interest however these concentrations may be varied depending on the compound(s) and concentration level of interest. A minimum of a single concentration level must be run between each MIP log location.
Performing multiple levels – one near the detection limit and others spaced 5x to 10x from each other will improve industry wide MIP data quality. It will prove that the system produces an increased signal for increasing concentrations and makes the data more defensible. This is not to be interpreted as a calibration. A single level response test of a site contaminant of concern is the required minimum test that must be performed between logs.

13 Standard Operating Procedure Membrane Interface Probe (MIP)
It is also recommended that to use a MIP detector system (PID and/or XSD) onsite it must be able to maintain adequate response of a 1ppm standard (Benzene or Trichlorethylene) throughout the project (discussed further in Section 5.1.5). If this is not possible then system maintenance must be performed until an adequate response is achieved. Maintenance tips are proved in Section 5.1.7. 5.1.1 Preparation of the Stock Standard
Preparation of the stock standard is critical to the final outcome of the concentration to be placed into the testing cylinder. There are two acceptable methods for making the stock standards. The following items are required for preparing the stock standard:
• Neat sample of the analyte of interest (i.e.: Benzene, Toluene, TCE, PCE, etc.) purchased from a chemical vendor
• Microliter syringes (recommended: 25L, 100L and a 500L or 1,000L syringes).
• 25-mL or 50-mL Graduated cylinder
• Several 40-mL VOC vials with labels
• 25mL Methanol
• Analytical balance (1mg precision-minimum) (optional – method 2))
• 25mL volumetric flask (optional – method 2)
First method for making MIP stock standards: 1. The total volume of methanol and the compound added should equal 25mL. 2. Pour methanol into graduated cylinder to the 23.5-24mL mark, the volume depends upon
the compound density (Table 5.1). 3. Pour the methanol from the graduated cylinder into a 40mL VOC vial. 4. Add the appropriate volume of desired neat
analyte into 40mL VOC vial containing methanol. The required volume of neat analyte for seven common compounds is listed in Column 3 of Table 5.2. The equation in table 5.1 shows how to calculate the appropriate neat analyte volume for other compounds of interest given the appropriate density.
5. Label the vial with the name of the stock standard (i.e. Benzene, Toluene, TCE, PCE), concentration (50mg/mL), date created, and created by (your name or initials).
6. Stock standards need to be kept cold in a refrigerator, freezer or on ice to ensure they can last up to one month otherwise they should be made up more frequently as often as every 2 days. The more volatile the compound the quicker it will lose its concentration.
Stock Standard Calculations
25mL (mostly methanol) 50mg/mL final Stock Std. Concentration 25mL x 50 mg/mL = 1,250mg (total weight of analyte required) 1,250mg x 1/density of analyte = amount of neat material to be placed with methanol to make up 25mL total volume
Example: Preparation of 50mg/mL Benzene standard.
1,250mg x 1/0.8765mg/L = 1,426L
Use approximately 1,426L of neat Benzene in 23.5mL of Methanol to get a 50mg/mL stock standard.
Table 5.1: Stock Standard Preparation Calculations

14 Standard Operating Procedure Membrane Interface Probe (MIP)
Compound
Density (mg/L) Volume (L) of Neat Standard
Required to prepare Stock Standard (25mL)
Benzene 0.876 1,426
Toluene 0.867 1,442
Xylenes 0.860 1,453
Methylene Chloride 1.335 936
Carbon Tetrachloride 1.594 784
Chloroform 1.480 845
Trichloroethylene 1.464 854
Perchloroethylene 1.623 770 Table 5.2: Density and required volumes of neat (pure ~100%) compounds used to make a
50mg/mL stock standard into 25ml of methanol
Second method for making MIP stock standards: 1. Add 15-20mL of methanol into a clean 25mL volumetric flask. 2. Place volumetric flask on an analytical balance and tare the balance (set weight to 0mg). 3. Add desired compound to the volumetric flask until the weight reaches 1,250mg. 4. Add methanol to the volumetric flask until the bottom of the meniscus reaches the 25mL
mark. 5. Pour the contents of the volumetric flask into a 40mL vial. This is your stock standard.
5.1.2 Preparation of Working Standards
The following items are required to perform response testing:
• Microliter syringes (recommended to have: 10, 25, 100 & 500mL syringes).
• Freshly made 50ml/ml Stock standard
• Testing cylinder made from a nominal 2-in. PVC pipe with a length of 24 in. or 40ml vial
• 0.5 L plastic beaker or pitcher
• Supply of fresh water, 500mL needed per test
• 40 ml vials
• Stopwatch
Table 5.3: Volumes of stock standard final concentrations Figure 5.1: Working standard
and dilution factors when added to 500mL water.
Volume of 50mg/ml
Stock Standard (L) Final
Concentration
mg/L = ppm
Dilution Factor
5 0.5 100,000x
10 1.0 50,000x
50 5.0 10,000x
100 10. 5,000x
200 20. 2,500x

15 Standard Operating Procedure Membrane Interface Probe (MIP)
Note: When using the inverted vial method, multilevel working standards can be made up at the
beginning of the day and placed into labelled 40mL vials with no headspace. These vials must
then be placed in a refrigerator or in a cooler on ice to use when needed.
5.1.3 Performing the Chemical Response Test
Figure 5.2: DI Acquisition Response Test Screen
1. Begin a new log in the DI-Acquisition software and proceed to the response test screen. The
detector signals should be stable before proceeding with the test.
2. Measure out 500mL of tap or distilled water in a graduated beaker.
3. Using Table 5.3, determine the desired volume of stock standard to place into the 500ml measured
volume of water to make up the working standard.
4. If the detector baselines have been monitored while
the standard was being prepared select “Clear
Response Test”.
5. When ready with the working standard prepare to run
the response test by exposing the membrane to the
working standard. Two acceptable methods are to
pour the standard into a nominal 2-inch x 24-inch
steel or PVC pipe and insert the probe into the tube
(Fig. 5.4) and the other method is to pour the working
standard into a 40ml/vial and invert the vial onto the
membrane (Fig. 5.5).
6. Start the response test by clicking on the “Run
Response Test” button (Fig. 5.2) and immediately
expose the MIP membrane to the test solution Figure 5.3: Running the Chemical Response Test
(Figures 5.4 or 5.5).

16 Standard Operating Procedure Membrane Interface Probe (MIP)
7. Leave the membrane exposed to the test solution for 45 seconds. This time is to be equal to the
membrane exposure (resonance) time at each depth interval during probe advancement.
8. Starting the response test time file as the membrane is exposed to the test solution allows the trip
time (Section 5.1.4) to be easily calculated by when response begins to climb which is approximately
50seconds in Fig. 5.3.
9. Fresh working standards need to be made for each test; they cannot be reused. Standards can be
premade and put into 40ml vials with no headspace and placed on ice. These can be used
throughout the day.
10. After the response has come through the detectors and adequate detector response is seen the
operator may select “next” to move to the EC QA test.
Acceptable methods for performing the MIP Chemical Response Test
Figure 5.4 Probe immersed in steel or Figure 5.5: 40ml vial of working
PVC pipe containing working standard standard inverted onto membrane
5.1.4 Determination of Contaminant Trip Time:
Response testing also enables the operator to measure the chemical trip time which needs to be
entered into the MIP software to accurately plot the contaminants depth position. The trip time
is the time it takes for the contaminant to travel through the trunkline from the membrane to
the detectors. The contaminant trip time is influenced primarily by trunkline length and carrier
gas flow rates as well as the contaminant makeup specifically boiling point. The chemical
response trip time can be determined from
the results on the Pre-Log Response Test.
Using Fig. 5.6 the Benzene trip time (TT)
would be approximately 55 seconds. This
response test would need to have been
started right when the chemical used in the
response test was exposed to the membrane.
Additional response test graph examples are
found in Appendix I.
Figure 5.6: 5ppm Benzene on PID
TT

17 Standard Operating Procedure Membrane Interface Probe (MIP)
5.1.5 Appropriate Chemical Response Test Concentrations and Response
As stated in section 5.1, the preferred response test method for operators to perform between
borings is the multiple level response tests. The first concentration should be at or near the
system detection limit with additional concentrations spaced out from there i.e. 1, 5, 25ppm. As
stated in Section 5.1.7, a minimum response expected should be a 5:1 ratio of response to
baseline noise should be expected for a 1ppm of Benzene or TCE on the PID and/or the XSD. A
single level response test is the minimum required test that must be performed.
The compound used in a chemical response test should be the site contaminant of concern or
similar which will give you the most accurate trip time and response magnitude for that
chemical type. If the site objective is to delineate the extent of a dry cleaner plume, then the
operator should use PCE for the response tests at the lowest possible concentrations ~1ppm or
less. If the site objective is to delineate the extent of the petroleum plume from a gas station,
then the operator should use one of the BTEX compounds or a gasoline mixture at or near the
reporting limit. If the site objective is to map out a plume source and high contaminant
concentrations are expected, the response tests should be run at higher concentrations such as
10ppm-25ppm. This should reduce the possibility of trunkline/membrane carryover masking the
chemical response tests.
Figure 5.7 shows a benzene
response over baseline on the PID
of approximately 12,500V on a
2.5ppm standard for a
5,000V/1ppm. Figure 5.8 shows
TCE responses over baseline on the
XSD of 33,000V on a 5ppm
standard for approximately a
6,500V/1ppm response.
Figure 5.7: 5ppm Benzene Figure 5.8: 5ppm TCE on the PID on the XSD

18 Standard Operating Procedure Membrane Interface Probe (MIP)
5.1.6 MIP Detection Limits
Detection limits for the MIP detector system is specific to each system and is influenced by detector age, level of maintenance, membrane wear and the age and condition of the trunkline. When the trunkline is repeatedly subjected to high level contaminates it will affect its performance. As VOC contaminants are transported through the Trunkline, portions may cold trap on the inner walls of the trunkline creating a coating (phase) that can affect the ease of transport of subsequent analytes. A phase can cause an increase in trip time as well as suppressed signal.
Method detection limits (MDL) for MIP are considered as a response 5x signal over baseline noise (Fig. 5.2) (Appendix I). This response level should provide an adequate signal to noise ratio able to be maintained throughout a project day.
Figure 5.9: Detection limit = 5x signal > baseline noise
PID FID XSD
Methane N/A 0.25-2.5% N/A
Benzene 0.25-2.5 2.5-25 N/A
Toluene 0.4-4.0 4.0-40 N/A
Perchloroethylene/Trichloroethylene 0.25-2.5 2.5-25 0.2-2.0
Chloroform/1,1,2-Trichloroethane N/A 2.5-25 0.2-2.0 Table 5.4: MIP Detection Limits (values are in ppm except for methane which is in %)
The detection limits in Table 5.4 have a range listed due to the variability in system performance
due to the factors listed in the paragraphs above. Not all systems will have the same achievable
detection limits. The first number that is listed is what a detector system should be able to
detect if well maintained and is what every operation should strive for.
If the desired detection limit for a particular project falls below reasonable responses for
standard MIP and all applicable maintenance has been performed on the detector system, an
operator may choose to add a Low level MIP controller (pulse flow controller) to their system.
Adding a pulse flow controller can improve signal to noise ratios and the lower the detection
limits 10x below the standard MIP detection limits. See the Low-Level MIP SOP.
5.1.7 Minimum Acceptable MIP Response Test Levels and Maintenance Tips
Geoprobe Systems specifies the following guidelines as minimum MIP response test values for
performing MIP logging.
Detector systems can vary in the level of response for a given chemical concentration as listed in
section 5.1.6. However, it should be expected that the detector system would be able to
provide at least a 5:1 signal to noise ratio (see Appendix I) for 1ppm of Benzene or TCE. Other
compounds or concentration may be performed at the client requests however they may have
19 Standard Operating Procedure Membrane Interface Probe (MIP)
different response magnitudes and signal to noise ratios at 1ppm. These specifications are
required with operation of the PID and XSD (ECD or DELCD as well as alternative halogen
detectors). The FID is a less sensitive detector typically used as a confirmation detector and one
used for mapping natural gas components.
If the minimum response test levels are not achievable or throughout the day or project the
detector sensitivity falls below these levels, the operator must stop and perform maintenance
on the system (See Appendix I) to enhance the sensitivity of the detectors.
It is wise for the MIP operator to monitor the detector response heights from the chemical response
tests to evaluate membrane performance (see Appendix II). With increased membrane footage,
detector response will fall off indicating that it is time to change the membrane. It may be possible
to rejuvenate a MIP membrane by scrubbing with a wire brush.
5.2 EC Dipole Test
On the FI6000 and the DI-Acquisition software the EC dipole test
screen (Fig. 5.10) will open after the chemical response test is
completed. When ready place the low (brass) side of the EC Dipole
test jig (Fig. 5.10) between the EC dipole and body of the probe and
start the low level test, hold for 5 sec until the system captures the
data (Fig. 5.11). Repeat for the high (stainless steel) EC test. These
tests should result in readings of 55mS/m and 290mS/m + 10% or
similar low and high EC reading probe dependent. Figure 5.10: EC Dipole Test Jig
Figure 5.11: EC Dipole Test QA Screen

20 Standard Operating Procedure Membrane Interface Probe (MIP)
If the EC readings do not pass, the DI Acquisition (FI6000) software will prompt the user to proceed
through a series of troubleshooting tests (Fig. 5.12). These tests will check the EC calibration (Fig. 5.13)
to determine if the reason EC Test loads have failed was an issue internal to the FI6000 or if it is external
in the trunkline-probe circuit. From here the operator should have an idea where to focus their
attention to fix the problem.
Figure 5.12: Failed EC Dipole Test Error Screen Figure 5.13: EC Calibration Check
5.3 HPT Reference Test
Reference testing is done to ensure that the HPT pressure sensor is in working order and to
evaluate the condition of the HPT injection screen. The HPT reference test calculates
atmospheric pressure which is required to obtain static water level readings and to determine
the estimated K values for the log in our post log processing software the DI Viewer.
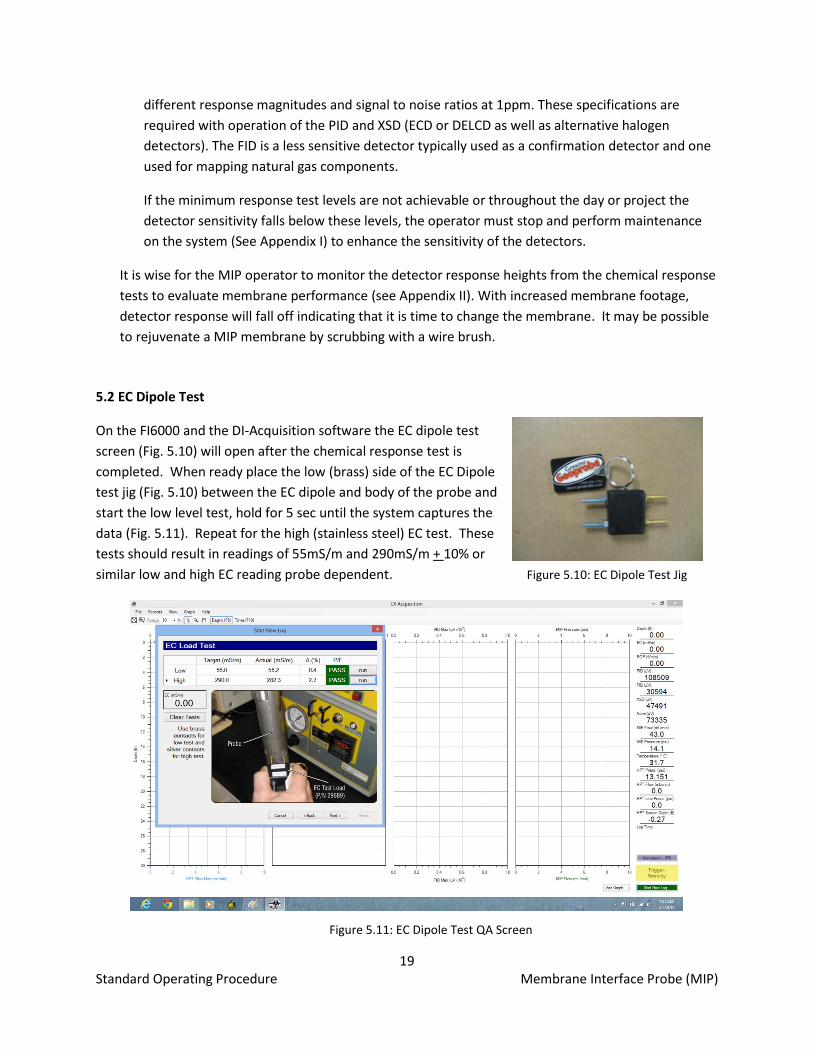
Each HPT sensor is individually calibrated and comes with a calibration sheet (Fig. 5.14) which
has calibration values that must be entered into the DI Acquisition software with the HPT
sensor serial number (Fig 5.13).
21 Standard Operating Procedure Membrane Interface Probe (MIP)
Fig. 5.13: HPT Sensor with Serial Number Fig. 5.14: HPT Sensor Calibration Sheet
Fig. 5.15: HPT Sensor selection and adding a new sensor calibration
In the DI Acquisition software when starting a new log and select No when asked if you want use the
parameters used in the previous log (rod and stringpot length, HPT sensor serial number). Now the
ability to add a new HPT sensor serial number and calibration is open when the “Sensor Configuration”
(Fig. 5.15) screen opens. Select “Edit Sensors” then “(new)” and then enter the serial number of the HPT
sensor which is printed on the sensor (Fig. 5.13) and then enter your x1 and x0 values into the
calibration tabs from the calibration sheet (Fig. 5.14). After the values have been entered verify the
correct HPT sensor serial number is selected under “HPT Sensor” on the “Sensor Configuration” screen.
Now you can proceed to the HPT reference test.

22 Standard Operating Procedure Membrane Interface Probe (MIP)
HPT Reference Test Procedure
1. Connect a clean water source to the HPT
controller and turn on the pump.
2. Allow water to flow through the system long
enough so that no air remains in the trunkline or
probe (air in the system can cause inaccurate flow
and pressure measurements).
3. Insert the probe into the HPT reference tube and
allow the water to flow out the valve adjusting the
flow rate to between 200-300ml/min (Fig. 5.14).
Ensure that the reference tube is close to vertical.
4. With a stable pressure reading and the water
flowing out of the valve select “capture” - bottom
with flow (Fig. 5.15) Figure 5.14: HPT Reference Test Setup
5. Close the valve and allow the water to overflow the top of the tube. When the pressure
stabilizes select “capture” - top
with flow.
6. Shut off the water flow. When the
pressure stabilizes select “capture”
- top flow = 0.
7. Open the valve and allow the
water to drain out. When the
pressure stabilizes select “capture”
- bottom flow = 0.
Figure 5.15: HPT Reference Test Screen
The HPT reference test reading flow = 0 is the true test of the condition of the pressure
sensor and is the only sensor test to have a pass/fail reading on it. Ideally, the pressure
difference between the top and bottom values will be 0.22 psi (1.52kPa). Typical pressure
readings of the sensor will be in the 12PSI-15PSI (83kPa-104kPa) range.

23 Standard Operating Procedure Membrane Interface Probe (MIP)
6.0 Equipment Preparation for Site Work
One of the biggest issues to providing high quality MIP service and logs with any specific MIP system is
inadequate project preparation and system review as well as too heavy of a workload which reduces the
ability to perform needed maintenance. Also inexperienced operators that are not allowed the time
required to practice and stay familiar with the equipment which reduces their ability to fully understand
the steps of troubleshooting.
When a MIP system is stored for a period of time between projects, operators must review the
equipment and give it a full system checkup which includes checking detector gas flow rates, running
response chemical response tests with known chemicals at concentrations at or near required site
detection limits. This needs to be performed 1-2 weeks in advance of project work so there is time to
obtain required supplies that might be needed for proper operation. A final checkout needs to be
performed within 7 days of the project. If the MIP site contaminant of concern is an obscure chemical
not normally tested for the operator should run some of that chemical for response tests to confirm it
can be detected and to determine reasonable detection limits. The operator should be able to supply
the consultant with pre-project performance data of all sensor information to be performed at the site
which might include EC, MIP chemical response tests, and HPT reference test information.
If a MIP system is scheduled on a long job or has a number of jobs strung together it is in the best
interest of the MIP service company to schedule a maintenance day at least every 3 weeks to allow the
operator time to go through system and service the components that need attention. This will help to
be able to keep to system performing well for the company and their clients. Pre project performance
must still be able to be produced.
New operators will always be needed as the MIP community continues to grow; however, it is
imperative that operators who are running the MIP systems on their own have been properly trained by
experts from their own company or at Geoprobe Systems® headquarters. An inadequately trained
operator who faced difficulties onsite and does not understand the system and how to properly
troubleshoot will quickly bring frustration upon themselves, their company and clients. It is important
that each operator is properly trained and spends consistent time with the equipment and the software.
Whenever possible new operators of the equipment should run under the guidance of a mentor “MIP
specialist.”

24 Standard Operating Procedure Membrane Interface Probe (MIP)
6.1 Stringpot
The stringpot is used to record the depth of the log. Technically a string potentiometer, it houses a given
length of cable (100in (2.54m)) and a potentiometer which compares the resistances of the wires within
the stringpot to determine how much cable is deployed and the rate at which it is recoiled. The operator
will record the length of rod used in the software. This allows the stringpot to keep track of probe
advancement and an accurate depth positioning of the probe. The stringppot is typically placed on the
ground and the cable is attached to a moving part of the hammer (Fig.6.1).
Figure 6.1: The Stringpot Used to Track Probe Depth A) Stringpot assembly. B) Anchoring the stringpot at ground
surface and attaching the string to the sliding hammer carriage on the mast of the direct push machine to track
depth as the probe is advanced into the subsurface.

25 Standard Operating Procedure Membrane Interface Probe (MIP)
7.0 MIHPT Field Operation
1. Power on the generator. 2. Open the gas cylinders that will be used for the MIP system (i.e. nitrogen, hydrogen, air, etc.). 3. Power on the GC and detectors and allow them to warm up (min. 20 minutes) to set
temperature. 4. Power on the MIP and HPT controllers, field instrument and laptop computer. 5. Check the trunkline supply and return flows (return should be within 3ml/min of supply) of the
system and MIP pressure set to 10PSI (70kPa). The MIP system should be operated at ~10Psi (70kPa) regardless of TL length or flow rate. Compare these numbers to previous work.
6. Start the Acquisition software and start a new log. 7. Record the system parameters in a field notebook (i.e. MIP flow, pressure, trip time, detector
baseline voltages). 8. Perform the multilevel chemical response tests (Section 5.1.2) and record the height of the peak
responses and the trip time into a field notebook. Refer to Figure 5.1.4 and Appendix I and II. 9. Perform the EC dipole test (Section 5.2) and the HPT Reference Test (Section 5.3) and finish
setting up the log. 10. Place the stringpot on the ground and attach the stringpot cable to a moving part of the direct
push machine (Fig 6.1).
NOTE: Do not allow the stringpot cable to snap back into the stringpot housing at a high rate of speed. This will ultimately damage the stringpot transducer.
11. Place the drive cushion onto the probing machine head. 12. Place a slotted drive cap to the MIP drive head. 13. Place the rod wiper on the ground and insert the point of the MIP probe into rod wiper opening. 14. Start the HPT water flow if running MIHPT.
Note: It is important that there is always water flowing when the probe is moving to avoid soil
particles from moving through and plugging up the screen.
15. Align the probe exactly straight using a level and advance the probe to the starting depth: MIP membrane even with the ground surface.
16. Click the trigger button in the lower right-hand corner of computer screen. (The Trigger label
will flash and the background will change from yellow to green).
17. Standard advancement the probe is at a rate of 1ft/min meaning: advance 1 ft (30 cm) in 15 seconds and then hold at depth for 45 seconds, then advance to the next depth interval (1 foot) over 15 seconds and wait for 45 seconds. Do this until the predetermined log depth or until refusal is attained. Continuous advancement the MIP probe is not recommended as this will significantly raise the detection limits over published limits of the tool since the material contact time and heating is drastically reduced. Data collected by this method is not directly comparable to data collected by the standard advancement rate previously discussed. If insisting to operate the tool in a continuous push the chemical standards should be exposed to the membrane for 2 seconds instead of 45 as the up-hole response test should mirror the exposure time in the subsurface.
NOTE: If the there is a loss in MIP pressure or temperature during the logging process, stop and evaluate the problem using the troubleshooting guide located in Appendix IV.
26 Standard Operating Procedure Membrane Interface Probe (MIP)
NOTE: Refusal is attained when it takes longer than 1 minutes of continuous hammering to advance the probe one foot. This is the maximum time to reach one foot of probe travel.
18. Perform an HPT dissipation test (Section 7.1) in a zone of higher permeability indicated by lower
HPT pressure if you are operating the MIHPT probe.
19. When the MIP log is complete, turn the trigger off and slowly return the stringpot cable into the stringpot housing.
20. Turn off the heater switch to the probe during tool string retraction so no as few contaminants as possible are diffused through the membrane and into the trunkline during retraction.
21. Raise the probe foot of the direct push machines foot assembly and place the rod wiper weldment under the foot assembly to keep it in place during rod retraction.
22. Pull the probe rod string using either the Geoprobe® rod grip pull system or a slotted pull cap. 23. When the MIP probe reaches the surface, clean the probe and membrane well with a
detergent/water mix and rinse off well. 24. Now turn the probe heat back on to back off the membrane. Make sure the probe membrane
and trunkline are clean of contaminants and the detector baselines are stable prior to running a post log response test. View the detector activity in the response test screen.
25. When the baselines are stable run a post log response test. These response test results should be written down in the field notes and compared to the initial test. This system check ensures the data for that log is valid.
26. When using the FI6000, the data will be saved into your designated folder on your laptop in a compact .zip file. Data from the MIP log can now be graphed and printed using the DI-Viewer software (Appendix V).
7.1 Performing an HPT Dissipation Test
At least one dissipation test must be performed in order to calculate the static water level,
estimated K and groundwater specific conductance readings from the HPT log. Dissipation tests
need to be performed below the water table and are best in zones of high permeability where the
injection pressure can dissipate off quickly once the flow is shut off. The following are the steps for
running an HPT Dissipation test.
1. Stop in a zone of higher permeability which is indicated by lower HPT inject pressure.
2. Switch the DI Acquisition display view from the depth screen to the time screen by pressing the
F10 key (F9 and F10 toggle between the depth and time screen of the acquisition software).
3. The screen will be grayed out which means that the data up to that point has not been saved.
Select “Start Dissipation Test” which will turn the screen from gray to a white background
indicating that you are now saving the time data.
Now shut the pump switch off and when the line pressure reaches zero, turn the flow valve off.
4. The HPT Pressure will begin to drop (dissipate the hydrostatic increase) and allow it to stabilize
so very little visible drop in pressure is seen. When the pressure has fully dissipated turn the

27 Standard Operating Procedure Membrane Interface Probe (MIP)
flow valve and the pump switch back on. When the flow and pressure are reestablished select
“End Dissipation test.”
5. Select F9 to return to the depth screen and advancing the tool into the ground.
Note: Performing a dissipation test in zones of higher permeability may only take 60 seconds or
so but if the HPT pressure was higher to start with it may take a long time up to several hours to
dissipate off to equilibrium. Therefore, targeting the most permeable zone to perform the
dissipation tests is most desirable.
Figure 7.2: HPT Dissipation Test Screen.
Figure 7.1: EC and HPT Pressure Graphs
The dissipation test shown in Figure 7.2 was performed in the lower pressure zones located at 39.5’ of
the log shown in Figure 7.1. With HPT sands and gravels are indicated by lower injection pressure which
is primarily seen below 35’ in the above log. The dissipation test in Figure 7.2 shows a higher pressure at
the start of the test which falls off which is a result of shutting off the water flow. A good dissipation test
will run for a period of time approximately 30-60seconds at a stabilized pressure and then turn the
water flow back on during the saved log.

28 Standard Operating Procedure Membrane Interface Probe (MIP)
7.2 Detector Gain/Software Attenuation Changes
7.2.1 Detector Gain/Software Attenuation Changes will need to be made during MIP logging
due to the advancement of MIP probes into very high VOC concentration zones. If the detector
gains are not adjusted the detector signals climbing to the point of saturation or “peak clipping.”
(Figs. 7.3 and 7.4) This occurs because the GC or detector system has a limited signal output
range (window). What that output range is varies depending upon the GC model or detector
controller.
FIG. 7.3 Example MIP Log with clipped FID Peak FIG. 7.4 Example of Peak Clipping (A) and
proper Gain/Attenuation
adjustments (B)
Note: Typical signal output limits are 0-5 VDC for SRI and Shimadzu GC models and 0-1 VDC for
OI XSD and HP/Agilent GCs.
7.2.2 To be able to observe the actual response beyond the maximum output signal in high
response areas, the detector gain must be adjusted down to medium or low which divides the
signal output by an attenuation factor. That attenuation factor must be entered into the
software (signal multiplier) to properly readjust the signal. (Figure 7.4). The gain or range setting
for various model detector and GC systems along with their corresponding attenuation factor
(multiplier) are listed in Table 7.1.
7.2.3 Gain/Attenuation adjustments can be made prior to beginning the log by following the
settings listed in Table 7.1. Adjustments can also be made during the logging process.
Peak Signal Clipped Size Output Peak Window
Peak Gain Signal Peak Peak
Size Adjust Output Out Attenuation Window Readjustment
FID peak response has been clipped or “flat lined”
A
B

29 Standard Operating Procedure Membrane Interface Probe (MIP)
7.2.4 During the logging process as the probe is advanced into higher concentration
petroleum hydrocarbon soils the operator (if using an SRI GC) will need to adjust the GC gain on
the PID and probably the FID from a setting of high to medium which divides the detector
signals by a factor of 10 on the PID and 20 on the FID. This reduction in the signal can be seen in
the software both in the digital display as well as on the time graph. If the attenuation factor is
set into the software before the detector gain is adjusted down a false positive spike will be
recorded in the log.
7.2.5 After the signal has been reduced the operator will then need to select the attenuation
tab (F5) in the DI Acquisition software and input a multiplier of 10 for the PID and a multiplier of
20 the FID if both gain switches were changed to the medium setting. The baseline will now
return to a similar level as it was before the change and now has a maximum ceiling height of
50VDC instead of 5VDC.
HP GC* Range
DI Acq. Attenuation
Factor
SRI Gain PID & FID
DI Acq. Attenuation
Factor
OI XSD Gain
DI Acq. Attenuation
Factor
0 1 High PID/FID - 1 High (100) 1
1 2 Medium PID-10 / FID-20 Medium (10) 10
2 4 Low PID-100 / FID-200 Low (1) 100
3 8
4 16
5 32 Table 7.1: GC Gain/Range Settings and Associated Software Attenuation Factors.
*- The detectors on the HP GC can have attenuation settings up to a range of 7 on the GC
corresponding to an acquisition software multiplication value of 128.

30 Standard Operating Procedure Membrane Interface Probe (MIP)
APPENDIX I
Evaluating Typical Response Test Data
Acceptable Chemical Response Tests
As listed in Section 5.1.5 and 5.1.6 the Chemical response test should result in a detector signal
to baseline noise ratio is >5:1 for 1ppm Benzene, TCE or similar on PID and/or XSD if applicable.
What corrective actions can you take to improve your detector system response?
• Changing MIP membrane (see Appendix III).
• Making a fresh chemical stock standard (see section 5.1.1). It does not take long for a volatile
chemical standard to lose the original concentration.
• Make sure your TL pressure is not above 10PSI (70kPa) if it is lower the flow rate to reach the
10PSI (70kPa) level. If your pressure was already at that level, decrease the carrier gas flow
another 5ml/min to lower the pressure in the trunkline even more if other fixes do not improve
response. If this is corrective action is taken the operator must update the system trip time
which has changed.
• Performing detector maintenance
o Cleaning or replacing the PID bulb
o Cleaning or replacing the XSD probe assembly or reactor core
o Checking and adjusting detector gas flows - especially in the FID.
• Replacing the trunkline or switching return gas lines. An old trunkline can be a source of
contaminant phase buildup. This will reduce detector sensitivity by causing contaminant
dispersion in the trunkline which results in reduced response levels as well as delayed trip times.

31 Standard Operating Procedure Membrane Interface Probe (MIP)
Figure A.1.1: Chemical Response Test: Benzene 0, 1, and 5ppm on PID and FID
Benzene ppm
0 1 5
PID
FID
XSD
System Parameters:
MH6534 @ 121oC and used membrane
150’ Trunkline: N2 Carrier Flow 30ml/min and Pressure of 10.7PSI
XSD Temperature of 1,100oC
Detector Response (V) to Benzene
PID FID XSD
BL Noise 3,000 300 600
Blank (0ppm) 7,000 300 600
1ppm 30,000 500* n/a
5ppm 143,000 2,400* n/a *Below MDL
Standards exposed to the membrane at time 0, 100, 210sec

32 Standard Operating Procedure Membrane Interface Probe (MIP)
Figure A.1.2: Chemical Response Test: Trichloroethylene 1, 5 and 25ppm on PID, FID and XSD
Trichloroethylene ppm
1 5 25
PID
FID
XSD
System Parameters:
MH6534 @ 121oC and used membrane
150’ Trunkline (TL): Pressure – 10.9PSI Flow 30ml/min of Nitrogen
XSD Temperature of 1,100oC
Detector Response (V) to TCE (Trichloroethylene)
PID FID XSD
BL Noise 3,000 300 600
1ppm 15,000 300* 5,000
5ppm 41,000 300* 23,000
25ppm 185,000 1,600 131,000 *Below MDL
Standards exposed to the membrane at time 0, 125 and 260sec.
33 Standard Operating Procedure Membrane Interface Probe (MIP)
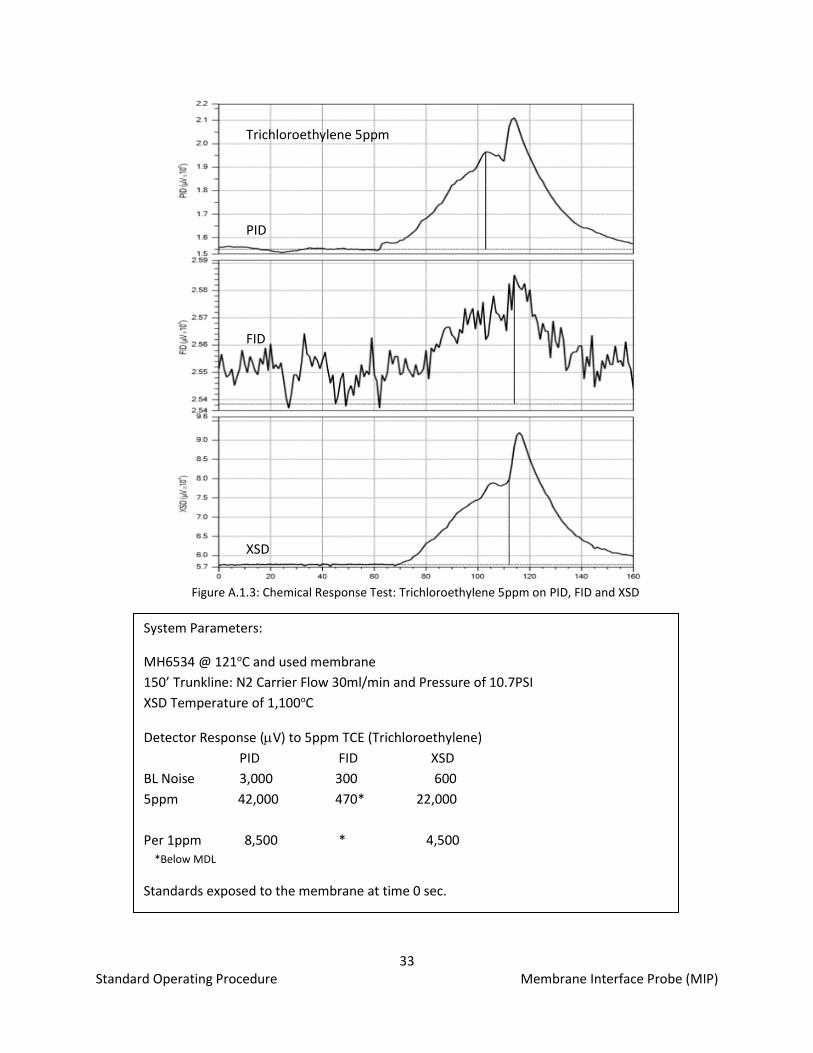
Figure A.1.3: Chemical Response Test: Trichloroethylene 5ppm on PID, FID and XSD
Trichloroethylene 5ppm
PID
FID
XSD
System Parameters:
MH6534 @ 121oC and used membrane
150’ Trunkline: N2 Carrier Flow 30ml/min and Pressure of 10.7PSI
XSD Temperature of 1,100oC
Detector Response (V) to 5ppm TCE (Trichloroethylene)
PID FID XSD
BL Noise 3,000 300 600
5ppm 42,000 470* 22,000
Per 1ppm 8,500 * 4,500 *Below MDL
Standards exposed to the membrane at time 0 sec.

34 Standard Operating Procedure Membrane Interface Probe (MIP)
Figure A.1.4: Chemical Response Test: 2x Butane response on the PID, FID and XSD
System Parameters:
MH6534 @ 121oC and used membrane
150’ Trunkline: N2 Carrier Flow 30ml/min and Pressure of 10.7PSI
Detector Response (V) to Butane
PID FID XSD
BL Noise 3,000 300 600
Butane (Avg) 1,300,000 3,900,000 n/a *Below MDL
Butane exposed to the membrane for 5 seconds each time with 5 seconds between events at the
start of the test.
Butane can be used to verify the performance of the FID however it is not recommended to be the
only chemical used in a response test unless the site contaminant of concern is natural gas (methane).

35 Standard Operating Procedure Membrane Interface Probe (MIP)
APPENDIX II
Membrane Performance Control Charts
Response Tests using TCE
Pre/Post Log Log ID: PID Response XSD Response Log Membrane
Response Test 2.5ppm 2.5ppm Footage Footage
Pre-Log MIP01 45,100 65,100 27 0
Pre-Log MIP02 38,600 70,400 27 27
Pre-Log MIP03 21,250 38,200 27 54
Pre-Log MIP04 20,000 38,100 36 81
Pre-Log MIP05 34,900 54,200 41 117
Pre-Log MIP06 25,800 40,400 37 158
Pre-Log MIP07 33.750 45,100 37 195
Pre-Log MIP08 34,800 48,200 37 232
Pre-Log MIP09 31,000 49,600 36 270
Post-Log MIP09 29,400 42,700 306
Table A.2.1: Chart of the MIP-response test data for a membrane versus log footage on the membrane.
Figure A.2.1: Graph of the membrane response shown in Table A.2.1.
-
10,000
20,000
30,000
40,000
50,000
60,000
70,000
80,000
0 27 54 81 117 158 195 232 270 306
Mic
rov
olt
Resp
on
se
Membrane Footage
Membrane Response Over Time
PID 2.5 ppm
XSD 2.5 ppm

36 Standard Operating Procedure Membrane Interface Probe (MIP)
APPENDIX III
Replacing a Membrane on the MIP Probe
A probe membrane is considered in good working condition as long as two requirements are met: 1. Adequate signal response is achieved during the chemical response tests to see the required
detection limits. 2. The difference between the supply and return flow has not increased by more than 3mL/min from
the original settings. (A digital or bubble flow meter should always be kept with the system).
If either one of these requirements are not met, a new membrane must be installed as follows.
1. Turn the heater off and allow the block to cool to less than 50° C on the control panel readout. 2. Clean the entire heating block with water and a clean rag to remove any debris. 3. Dry the block completely before proceeding. 4. Remove the membrane using the membrane wrench (Fig. A.3.1). Keep the wrench parallel to the
probe while removing the membrane to ensure proper engagement with socket head cap screw.
NOTE: Do not leave the membrane cavity open for extended periods. Debris can become lodged in the gas openings in the plug.
5. Remove and discard the copper washer as shown in Figure A.3.1. Each new membrane is accompanied by a new copper washer. Do not reuse the copper washer.
6. Clean the inside of the membrane socket with a Q-tip and methanol removing dirt and debris that will be present.
7. Insert the new copper washer around the brass plug making sure that it sits flat on the surface of the block.
8. Install the new membrane by threading it into the socket. Thread the membrane into the socket by hand, do not use the membrane wrench until the membrane is nearly all the way threaded. Use the membrane wrench to tighten the membrane to a snug fit. Do not over-tighten.
9. Turn the carrier gas on and leave the heater off. Apply soapy water to the membrane and surrounding area to check for leaks. If bubbles form in the water around the edges of the membrane or in the wrench holes use the membrane wrench to further tighten the membrane.
10. Use a flow meter to check carrier flow. The difference between the supply flow from the MP6505 and the return flow from the trunkline
should be less than 3ml/min. Record the values in a field notebook.
Figure A.3.1: Unthread the membrane from the probe block and make sure the copper washer is also removed and replaced with the membrane.

37 Standard Operating Procedure Membrane Interface Probe (MIP)
APPENDIX IV
Troubleshooting Guide
Loss of Pressure 1-2 PSI
➢ If the pressure loss has been gradual see if the MIP supply flow has gradually dropped over the course of the log. This can happen if the MIP controller has a mass flow controller (MFC). The MFC flow can drop when significant changes in temperature as well as changes in the upstream pressure. If you observe a gradual drop of both MIP pressure and flow. To resolve this, increase the mass flow controller to bring the supply flow back to its original set point. This issue is assuming there is no change in the variation of supply and return flow of the Trunkline.
➢ Punctured membrane: Are there any obvious holes in the membrane with bubbles streaming out of them? Replace membrane.
➢ Membrane leaking out of the face – heavy frothing or streaming of bubbles on membrane face but no obvious punctures in membrane. With the heat off, place your thumb over the membrane, if the pressure goes back up to the gas pressure prior to the boring the pressure and flow loss is due to a leak in at the membrane face. Replace the membrane.
➢ Swagelok fitting connecting one of the trunkline gas lines to stainless steel gas line of the probe is loose. Check with soapy water, if bubbles build, fix by slowly tighten the gas line 1/16” nut to the probe.
➢ If the nuts on the Trunkline are tight on the gasline fitting of the probe but there is bubbling around the gas lines coming out of the probe there could be a crack in the braze of the gas line fitting. You will need to replace the probe and the leaking probe will need to be returned to the manufacturer.
➢ Examine for cuts, kinks & cracks in the length of the observable gas line. Expect to see bubbling when MEOH or soapy water is placed on it. Cut gas line prior to this and replace nut and ferrule and reconnect onto the probes steel gas line connection.
➢ Broken gas line somewhere else up the trunkline. Confirmed when trunkline connections are removed from the probe and close coupled. The carrier gas supply and return should be within 2ml/min, if it is >5ml/min first check with soapy water at the connecting nuts and exposed gas line then look for cuts in throughout the trunkline and see if they will show bubbles with soapy water placed on them. If this is observed, you will likely need to change the trunkline.
Loss of Pressure >5 PSI
➢ Large puncture in membrane. Either visible puncture or observable streaming bubble when soapy water or methanol placed on membrane. Replace membrane.
➢ Loosen the 1/16” Swagelok nut on gas line. Check and carefully tighten. ➢ Broken gas line in the probe. Compare the supply versus return flow values (should < 2/ml/min) of
trunkline connected with the probe and with a close coupled trunkline. If close coupled supply/return flow is good but connected to the probe shows a big leak, there is a break is in the probe. This may be seen with soapy water placed on the edges of the heater block or on the top of the probe where the connections come out. If this produces bubbles it confirms a broken internal line or connection point. Replace the probe.

38 Standard Operating Procedure Membrane Interface Probe (MIP)
DI Acquisition - Flash Warnings: The DI acquisition system, operated with the FI6000 field instrument, will flash a large warning screen – MIP pressure out of Range - to the operator if the probe pressure (PSI) changes over 1 PSI from the initial starting MIP pressure of the log. This alerts the operator that something in the system has changed and the operator can take the necessary precautions for a punctured membrane, broken gasline or a plug in the system.
Increase in Pressure (clearing a blockage)
➢ After setting the mass flow, an increase of more than 3 PSI over the original set pressure indicates a potential blockage, especially if you can verify that the pressure first dropped a 2-5 PSI prior to rising toward 20PSI.
• Shut off the Nitrogen carrier gas flow ASAP. Do this by turning off the black regulator knob on the MIP controller or removing the carrier gas supply line from the breakout panel or the back of the MIP controller.
• Remove the tools from the ground.
• Look for a hole in the membrane and water or dirt got into the up-hole gas line just behind the membrane.
• Remove connection tube and membrane.
• Remove the trunkline gas lines from the top of the probe. Take note of which one had the gas flow coming out because this is the line that will be plugged.
• Look for any obvious particles in either holes behind the membrane or in the gas line at the top of the probe. If any are evident attempt to remove them.
• Take the return gas line at the surface and connect it to the supply gas connection on the breakout panel or on the back of the MIP controller.
• Place the probe end of this line into a jar of methanol to see if the line is clear which is evident by streaming bubbles. If there are no bubbles, increase the flow to try to expel the blockage. If this does not work, you may need to cut back the trunkline.
• To clear out the probe take a 5 ml plastic syringe (or a 3-foot section of Teflon/PEEK gas line will work) filled with methanol and attempt to inject through the plugged gas line at the top of the probe. If it clears it will shoot the methanol in an arcing stream out one of the ports in the plug that sits behind the membrane.
• The probe must be dried of the methanol which can be accelerated by heating the probe. Don’t reconnect the trunkline to the detectors until you are sure the blockage is clear and the methanol is out of the system.
• If the blockage cannot be cleared a new probe or trunkline will need to be connected.
Blinking Temperature Light
➢ If the temperature light on the MP6505 begins blinking in an unreadable number, it means that there is an open thermocouple in the system.
• To complete the log in progress, replace the thermocouple for the trunkline with a thermocouple wire and twist-tie the wires together. This will fool the system to thinking there is continuity of the thermocouple wire and allow you to finish a log. The probe will continually heat set up this way and if left on when out of the ground it will overheat. When the log is complete, remove the tricked thermocouple and remove tools from the ground.

39 Standard Operating Procedure Membrane Interface Probe (MIP)
When you have the probe out of the ground, replace the thermocouple as follows.
• Remove the connection tube from the probe.
• Check the crimp connections of the thermocouple wires from the trunkline to the probe. ▪ If one of the crimp connections has broken, then strip back the wire on both sides of the
thermocouple – probe and trunkline ends and reconnect in a new crimp connection and see if the probe temperature comes back.
▪ If the thermocouple connection is good, the thermocouple wire in the probe has likely broken. Cut off the crimp connections of the thermocouple wires between the probe and the trunkline Check the resistance between the red and yellow thermocouple wires coming out of the probe. A resistance reading of approximately 40ohms indicates that the thermocouple is good reconnect. If they are open (O.L.) or megaohms then the leads are broken on the thermocouple. Replace the thermocouple.
➢ To check the trunkline thermocouple wires, measure each wire from top to bottom. The resistances will be different between the two-colored wires but should be somewhere approximately 50 ohms – 150ohms for the length of the trunkline. The resistances will also increase with an increase in trunkline length.
• If they are open (no resistance) then there is a break in the trunkline. Replace the trunkline.
Blinking temperature readout or Spiking in the Pressure and/or Temperature Data
➢ If spikes show up in the temperature or pressure data especially when related to hammer strikes it is
likely an intermittent break in the thermocouple connection. Spiking of the temperature may reach single point readings of 250oC (or drop to 0oC) in the data but may not be visible when watching the temperature display on the MIP controller.
• When you check the resistance between the two thermocouple wires they may check out at approximately 40 ohms, however there likely is an intermittent break in the wire.
• Replacing the thermocouple should eliminate the pressure and temperature data spikes.
Probe Not Reaching Temperature
➢ If the heater light is on but the temperature seems low (<100oC with a set point of 120oC) a heater may have broken in the probe.
• Check the resistance of the heater wires. ▪ If a heater is broken the resistance will be over 40 ohms. The probe needs to be replaced. ▪ Two good heaters will read approximately 22 ohms on the MH6534 and MH8530.
- Check to see if the thermocouple has pulled of few inches out of the probe.
• If the thermocouple duct has broken and pulled back away from the probe, the probe will need to be replaced and rebuilt.
• A thermocouple can unscrew and vibrated loose out of the thermocouple duct connection if it is not secured with shrink tubing or electrical tape. Reseated back into the leur-lock connection and secure. When the thermocouple pulls away from the probe it measures the probe temperature in the wrong location.

40 Standard Operating Procedure Membrane Interface Probe (MIP)
Flash Warning: The DI acquisition system, operated with the FI6000 field instrument, will flash a large warning screen – Temperature out of Range - to the operator if the temperature goes outside of a set range from the setpoint temperature of 121oC. This alerts the operator that something in the system has failed and the operator can take the necessary precautions for a broken probe heater or thermocouple problem. MIHPT Warnings:
• Temperature Out of Range
This occurs when the temperature goes <80oC or >150oC. These issues would typically be due to either a thermocouple wire break or a loss in a probe heater.
• MIP Pressure out of Range When the MIP pressure increases or decreases by 1 psi (7kPa) or more this alarm will flag the operator. This pressure change would be due to either a leak or a plug of the gas lines.
• Probe Moving with HPT Flow = 0
If there is a positive rate of push (ROP) and HPT flow is zero and HPT line pressure is also ~0 then this alarm will alert the operator. If there is no HPT flow out the screen and no pressure built up at the screen (unable to inject due to tight clays) then it is possible for soil particles to grate through the HPT screen and plug the HPT water line. This may be due to an operator not turning the flow switch back on after a dissipation test or running out of water in the supply tank.
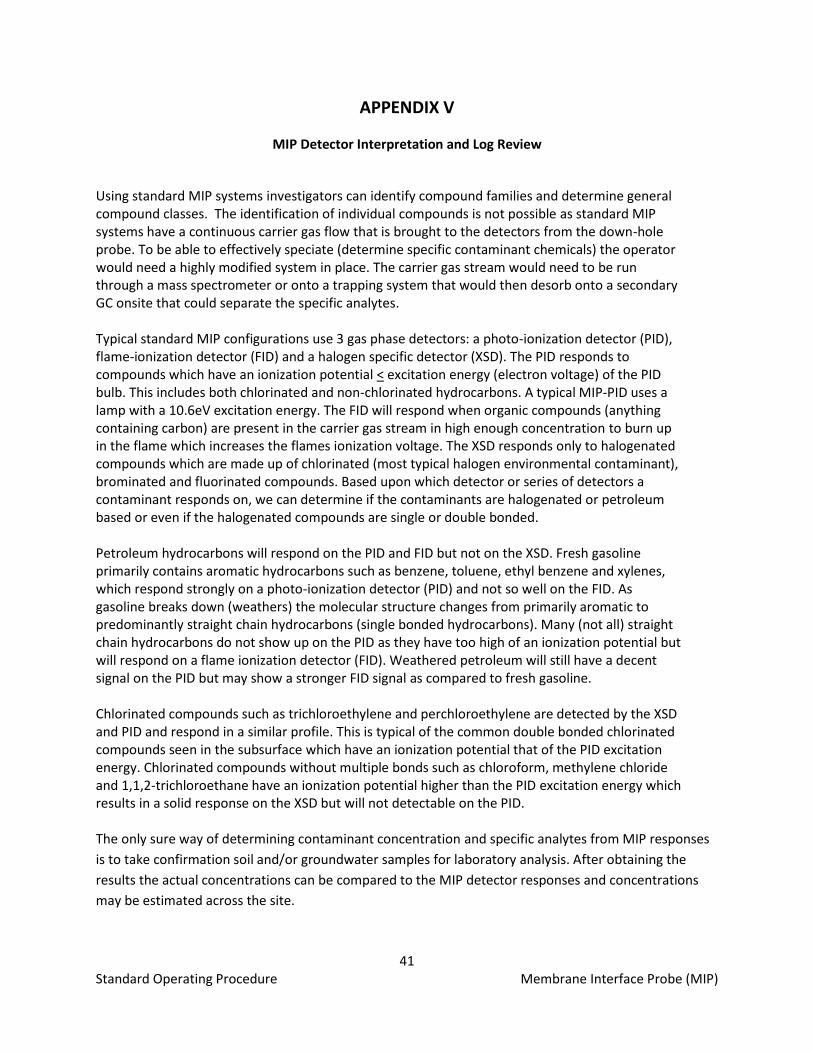
41 Standard Operating Procedure Membrane Interface Probe (MIP)
APPENDIX V
MIP Detector Interpretation and Log Review
Using standard MIP systems investigators can identify compound families and determine general compound classes. The identification of individual compounds is not possible as standard MIP systems have a continuous carrier gas flow that is brought to the detectors from the down-hole probe. To be able to effectively speciate (determine specific contaminant chemicals) the operator would need a highly modified system in place. The carrier gas stream would need to be run through a mass spectrometer or onto a trapping system that would then desorb onto a secondary GC onsite that could separate the specific analytes. Typical standard MIP configurations use 3 gas phase detectors: a photo-ionization detector (PID), flame-ionization detector (FID) and a halogen specific detector (XSD). The PID responds to compounds which have an ionization potential < excitation energy (electron voltage) of the PID bulb. This includes both chlorinated and non-chlorinated hydrocarbons. A typical MIP-PID uses a lamp with a 10.6eV excitation energy. The FID will respond when organic compounds (anything containing carbon) are present in the carrier gas stream in high enough concentration to burn up in the flame which increases the flames ionization voltage. The XSD responds only to halogenated compounds which are made up of chlorinated (most typical halogen environmental contaminant), brominated and fluorinated compounds. Based upon which detector or series of detectors a contaminant responds on, we can determine if the contaminants are halogenated or petroleum based or even if the halogenated compounds are single or double bonded. Petroleum hydrocarbons will respond on the PID and FID but not on the XSD. Fresh gasoline primarily contains aromatic hydrocarbons such as benzene, toluene, ethyl benzene and xylenes, which respond strongly on a photo-ionization detector (PID) and not so well on the FID. As gasoline breaks down (weathers) the molecular structure changes from primarily aromatic to predominantly straight chain hydrocarbons (single bonded hydrocarbons). Many (not all) straight chain hydrocarbons do not show up on the PID as they have too high of an ionization potential but will respond on a flame ionization detector (FID). Weathered petroleum will still have a decent signal on the PID but may show a stronger FID signal as compared to fresh gasoline. Chlorinated compounds such as trichloroethylene and perchloroethylene are detected by the XSD and PID and respond in a similar profile. This is typical of the common double bonded chlorinated compounds seen in the subsurface which have an ionization potential that of the PID excitation energy. Chlorinated compounds without multiple bonds such as chloroform, methylene chloride and 1,1,2-trichloroethane have an ionization potential higher than the PID excitation energy which results in a solid response on the XSD but will not detectable on the PID. The only sure way of determining contaminant concentration and specific analytes from MIP responses
is to take confirmation soil and/or groundwater samples for laboratory analysis. After obtaining the
results the actual concentrations can be compared to the MIP detector responses and concentrations
may be estimated across the site.

42 Standard Operating Procedure Membrane Interface Probe (MIP)
MIHPT Log Example 1
Figure A.5.1: An MIHPT log with the graphs left to right: electrical conductivity, HPT Pressure (primary
axis) Absolute Piezometric Pressure (secondary axis), detectors (PID, FID and XSD), Estimated K, probe
temperature and trunkline gas pressure (primary axis) and Trunkline flow rate (secondary axis).
The above log shows contamination from 24ft to 30ft bgs. The main detector response is on the PID and
FID with minimal response if any on the XSD (Halogen Specific Detector). This indicates that the main
contaminant would not contain halogenated (Cl-, Br-, Fl-) atoms, but would likely be hydrocarbon based.
The contaminants are present in the higher electrical conductivity/higher HPT pressure formations
which typically indicates slit-clay formations and zones of contaminant storage. The contaminant is also
present in the transition to lower electrical conductivity and lower HPT pressure from 27ft to 30ft bgs.
This transition indicates a change to a zone of higher permeability likely a sandy formation. The red dot
at 24 ft on the HPT piezometric graph indicate the static groundwater level based upon inground HPT
dissipation tests which are indicated below that by the black triangles at 32ft and 39ft bgs. The
contaminant is likely mobile under the clays and would also be a zone of long-term back diffusion in the
sands. The most permeable zone is from 28ft to the end of the log as indicated by the EC, HPT and
Estimated K graphs. MIP flow and pressure look good with no indication of any leak in the gas line
system. The MIP pressure is good except for a spike in the temperature data at 13ft which could
indicate a broken thermocouple which was fixed before log continuation.

43 Standard Operating Procedure Membrane Interface Probe (MIP)
MIHPT Log Example 2
Figure A.5.2: An MIHPT log with the graphs left to right: electrical conductivity, HPT Pressure (primary
axis) Absolute Piezometric Pressure (secondary axis), detectors (PID, FID and XSD), Estimated K, probe
temperature and trunkline gas pressure.
The above log shows contamination from 12ft to 16ft bgs. All three detectors (PID, FID and XSD) show
significant response with the same profile. This indicates that the main contaminant would contain
halogenated (Cl-, Br-, Fl-) atoms, and since it is responding on the PID as well it would have an ionization
potential below that of the PID lamp excitation energy. The contaminant would likely be a double
bonded halogenated – most common environmental contaminants include: perchloroethylene,
trichloroethylene, dichloroethylene. In this log there is some movement of the electrical conductivity
(EC) however it is operating at a low scale and it is challenging to have great confidence of lithological
transition zones based upon the EC alone. We must use both the EC and HPT relying more heavily on the
HPT to determine our zones of permeability. The contaminant is present in the lower HPT pressure
formations which typically indicates slit-clay formations and zones of contaminant storage. The
contaminant is also present just below the transition from lower HPT pressure above 13ft bgs. Which
could indicate the ability to back diffuse out of the storage and into the mobile phase. The red dot at 5
ft on the HPT piezometric graph indicate the static groundwater level based upon inground HPT
dissipation tests which are indicated below that by the black triangles at 8.5ft bgs. The contaminant is
likely stored in the clays but could provide long-term back diffusion up into the sands. The most
permeable zone is from 5ft to 13ft as indicated by the HPT and Estimated K graphs. MIP flow and
pressure look good with no indication of any leak in the gas line system. The MIP pressure and
temperature look good.

44 Standard Operating Procedure Membrane Interface Probe (MIP)
MIHPT Log Example 3 Cross section
Figure A.5.3: A cross section of EC (Primary axis) and MIP-PID (secondary axis)
Here is an MIHPT cross section displaying and overlay of EC and PID response. Each log is approximately
30ft apart. The cross section shows similarity between the formation and how it changes with distance.
This is part of the log QC that is performed through out the day/project as logs are created – are there
similarities as well as differences in what is seen, and does it make sense?
The log on the left is nearest to the source of the contaminant as the PID response displays the largest
magnitude response and is the closest to the surface or the source of the release. As we move away
from the source the initial detector responses begin closer to the water table (known from other logs
and HPT dissipation test data not displayed here). We can also see as we move from left to right in this
cross section that the final transition from silt/clay to sand move up in the profile from as deep as
approximately 40 ft in the first log to approximately 28ft in the log on the right. We can also see that
the contaminant has transitioned from being held up in a slay to being present in the mobile sandy
aquifer in the final log.
EC/PID Max

45 Standard Operating Procedure Membrane Interface Probe (MIP)
APPENDIX VI
GC1000 Configuration and Operating Parameters
GC1000 Configuration
SRI310 GC with PID, FID & OI Analytical XSD
(all standalone detectors)
Flows:
TL Carrier (N2): 40ml/min (MIP pressure = 10PSI)
Detector split 50:50 – 20ml/min-XSD
20ml/min-FID
Nafion Dryer (installed in GC Oven)
80ml/min (2x carrier flow rate)
Figure A.6.1: GC1000: SRI 310GC with XSD Controller
A built in air compressor is split underneath the GC between the XSD & FID. The XSD & FID air supply is
controlled through the GC air pressure screw control on front of GC and with different airline sizes and
lengths to provide 250ml/min to the FID and 30 ml/min to the XSD.
Detectors front of GC to back: XSD, FID & PID
SRI 310 GC Detector 1 position – XSD
(not controlled by GC)
SRI 310 GC Detector 2 position – FID
SRI 310 GC Detector 3 position – PID
Nafion dryer installed inside GC oven
GC Oven set to 40oC – 130oC max temp.
Figure A.6.2: GC Detectors – left to right - XSD, FID, PID
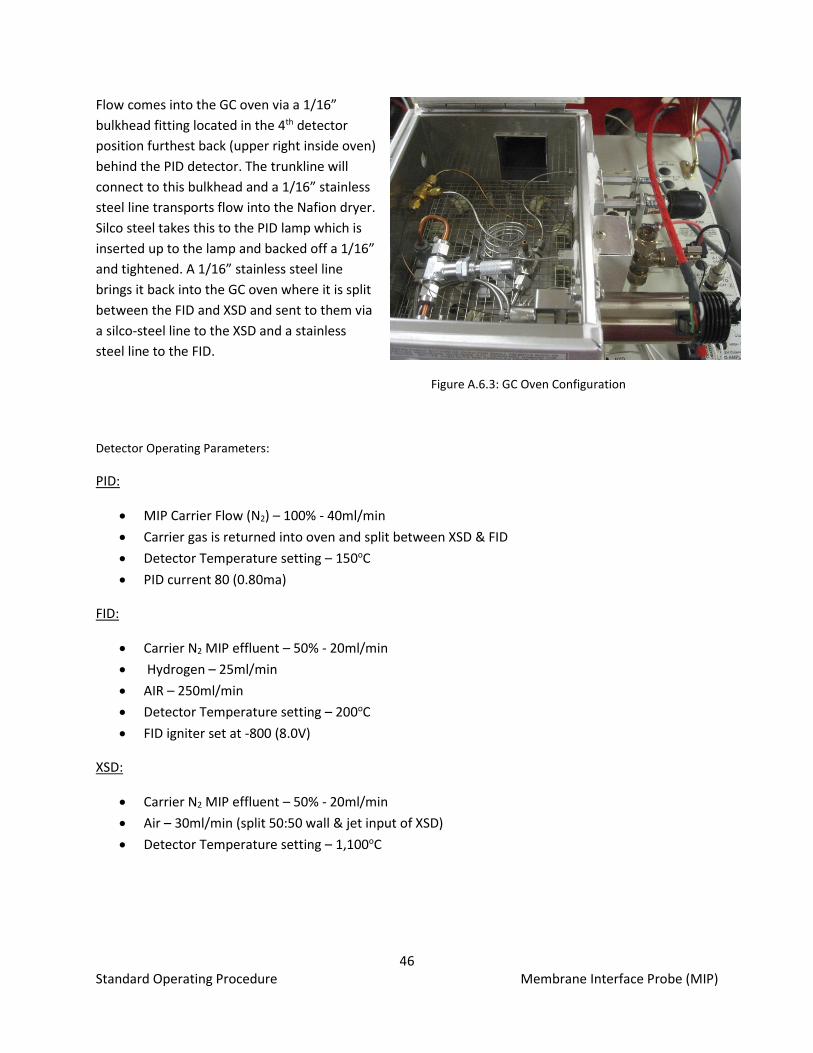
46 Standard Operating Procedure Membrane Interface Probe (MIP)
Flow comes into the GC oven via a 1/16”
bulkhead fitting located in the 4th detector
position furthest back (upper right inside oven)
behind the PID detector. The trunkline will
connect to this bulkhead and a 1/16” stainless
steel line transports flow into the Nafion dryer.
Silco steel takes this to the PID lamp which is
inserted up to the lamp and backed off a 1/16”
and tightened. A 1/16” stainless steel line
brings it back into the GC oven where it is split
between the FID and XSD and sent to them via
a silco-steel line to the XSD and a stainless
steel line to the FID.
Figure A.6.3: GC Oven Configuration
Detector Operating Parameters:
PID:
• MIP Carrier Flow (N2) – 100% - 40ml/min
• Carrier gas is returned into oven and split between XSD & FID
• Detector Temperature setting – 150oC
• PID current 80 (0.80ma)
FID:
• Carrier N2 MIP effluent – 50% - 20ml/min
• Hydrogen – 25ml/min
• AIR – 250ml/min
• Detector Temperature setting – 200oC
• FID igniter set at -800 (8.0V)
XSD:
• Carrier N2 MIP effluent – 50% - 20ml/min
• Air – 30ml/min (split 50:50 wall & jet input of XSD)
• Detector Temperature setting – 1,100oC

47 Standard Operating Procedure Membrane Interface Probe (MIP)
APPENDIX VII
MIP Tool Configurations
A7.1 MIHPT – MH6534 (1.5 in. / 1.75 in. system)
Running MIP without HPT
• To run MIP without HPT, you need to plug off the HPT port on the probe and use the tools
above or substitute with the following:
• No HPT sensor is required and can be removed from the tool connection section.
• MIP only trunkline: 100 ft. (204077), 150 ft. (202570), or 200 ft. (2204655)
• A yellow water seal (207773) would be used with the MIP only yellow trunkline.

48 Standard Operating Procedure Membrane Interface Probe (MIP)
A7.2 MIHPT – MH8530 (2.25 in. System)
Running MIP without HPT
• To run MIP without HPT, you need to plug off the HPT port on the probe and use the tools
above or substitute with the following:
• No HPT sensor is required and can be removed from the tool connection section.
• MIP only trunkline: 100 ft. (204077), 150 ft. (202570), or 200 ft. (2204655)
• A yellow water seal (207773) would be used with the MIP only yellow trunkline.
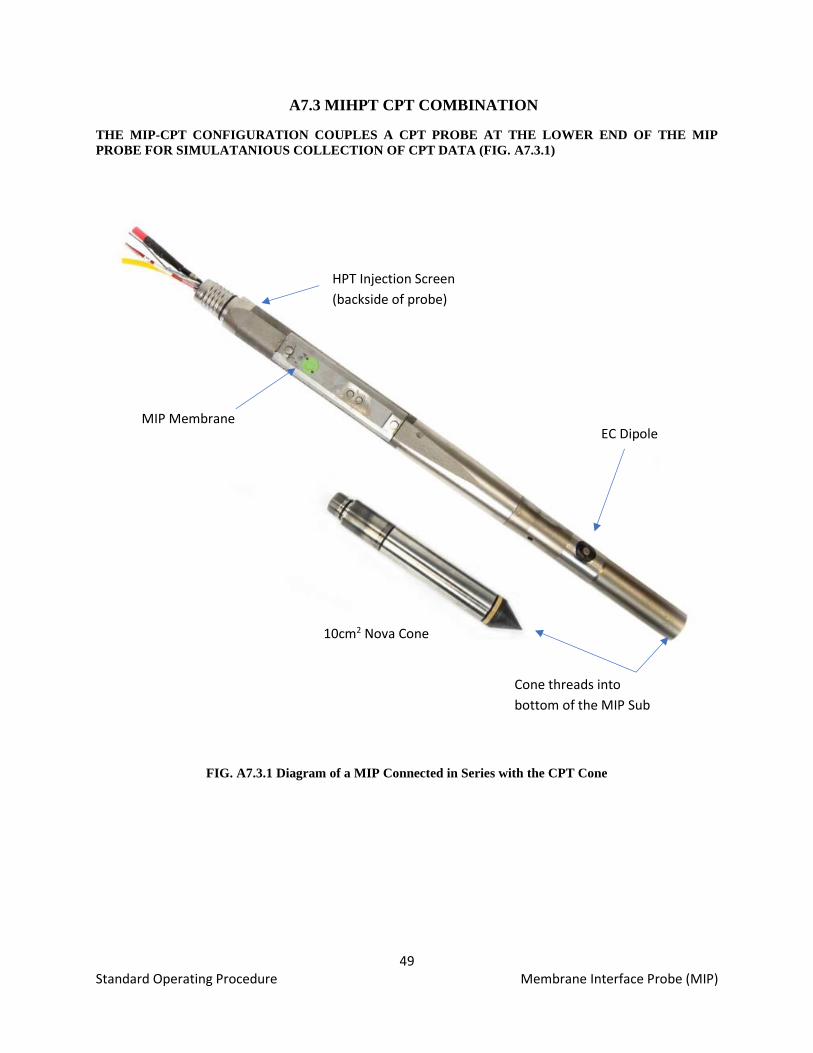
49 Standard Operating Procedure Membrane Interface Probe (MIP)
A7.3 MIHPT CPT COMBINATION
THE MIP-CPT CONFIGURATION COUPLES A CPT PROBE AT THE LOWER END OF THE MIP
PROBE FOR SIMULATANIOUS COLLECTION OF CPT DATA (FIG. A7.3.1)
FIG. A7.3.1 Diagram of a MIP Connected in Series with the CPT Cone
EC Dipole
10cm2 Nova Cone
MIP Membrane
HPT Injection Screen
(backside of probe)
Cone threads into
bottom of the MIP Sub

50 Standard Operating Procedure Membrane Interface Probe (MIP)
A7.4 MIP HEATED TRUNKLINE
THE HEATED TRUNKLINE (HTL) SYSTEM ALLOWS THE MIP OPERATOR TO OPERATE A MIP TRUNKLINE AT AN
ELEVATED TEMPERATURE (TYPICALLY SET TO 100°C [212°F]).
A7.4.1 Elevated trunkline temperatures accelerate analyte mobility through the trunkline and resulting
in reduced trunkline carryover affects and better-defined contaminant mapping.
A7.4.2 Elevated trunkline temperatures make MIP logging during the colder winter months easier by
reducing the possibility of moisture condensing in the carrier gas stream which can result in gas line
blockages and negatively impacting the gas phase detectors.
A7.4.3 The heated trunkline gas lines are constructed out of stainless steel tubing.
A7.4.4 The HTL system includes the special trunkline for MIP logging (only), a heated transfer line which
extends the heated element from the top of the trunkline to the detector system and a specific controller
which manages the temperature of the heated elements (Fig. A7.4.1).
FIG. A7.4.1 Heated Trunkline System Components
A7.5 LOW LEVEL MIP
THE LOW-LEVEL MIP CONFIGURATION ADDS AN ADDITIONAL CONTROLLER (FIG. A7.5.1 AND A7.5.2) TO THE
STANDARD MIP CONFIGURATION WHICH ALLOWS FOR LOWER SYSTEM DETECTION LIMITS TO BE ACHIEVED.
A7.5.1. All of the carrier gas lines for the trunkline and detector system are connected to the low-level
controller for continued management and direction of the gas flow streams (Fig. A7.5.1)
A7.5.2 The low-level MIP controller (Fig. A7.5.2) regulates the carrier gas flow to the MIP trunkline and
probe in a repetitive stop-start fashion. This allows contaminants to build up in concentration behind the
membrane in the probe when no carrier gas flow is moving through the trunkline. When the carrier flow
restarts, it sweeps the contaminant “slug” to the surface detectors.

51 Standard Operating Procedure Membrane Interface Probe (MIP)
A7.5.3 The low-level MIP has separate nitrogen flow paths for the trunkline carrier and for the
detectors. A sample valve system allows clean carrier gas to be sent the gas phase detectors maintaining
stable detector baselines during the time the trunkline flow is shut off and being reestablished
A7.5.4 The low-level controller will improve the detector response of any MIP system it is installed with
by at least 10 times (Fig. A7.5.3). Specific detection limits are determined by the condition of the specific
MIP system it is installed with but is capable of reaching detection limits well below 100ppb of TCE or
Benzene in LL-MIP chemical response tests.
A7.5.5 The system can be installed into any MIP or MIHPT system regardless of which MIP trunkline or
gas phase detectors are used.
A7.5.6 For additional information see the Low-Level MIP standard operating procedure.
FIG. A7.5.1 Low Level MIP System Configuration FIG. A7.5.2 Low Level MIP Controller
FIG. A7.5.3 Comparison of 500ppb TCE
XSD response performed by standard MIP
and Low-Level MIP
GC Detector
System
Field
Instrument
MIP
Controller Low Level
Controller
Trunkline
Supply and Return
Gas Lines
Carrier Gas to
Detectors
Standard Low Level
MIP MIP

52 Standard Operating Procedure Membrane Interface Probe (MIP)
A7.6 DIRECT IMAGE GROUTING SUB
THE DIRECT IMAGE GROUTING SUB ALLOWS FOR ABANDONMENT OF ANY DIRECT IMAGE LOG (HPT, MIHPT OR
OIHPT) BORING IMMEDIATELY AFTER LOG COMPLETION.
A7.6.1 The grouting sub (Fig A7.6.1) can only be used with the
5.72cm [2.25in.] tooling configurations.
A7.6.2 This is a winged sub that installs above the tools connection
tube (Fig. A7.6.2) and allows a 5.72cm [2.25in.] direct image boring to
be pressure tremie grouted from the bottom up immediately after
completion of the log.
A7.6.3 The grouting of the borehole is done per D5299,
using an approved high-pressure low volume grout machine.
FIG. A7.6.2 Grouting Sub 5.72 cm [2.25 in.] Tool String Diagram
FIG. A7.6.1 Grout Sub 5.72cm [2.25in.]
used for immediate direct image log
borehole abandonment

53 Standard Operating Procedure Membrane Interface Probe (MIP)
A DIVISION OF KEJR, INC.
-Corporate Offices- 1835 Wall Street • Salina, KS 67401 1-800-436-7762 • Fax 785-825-2097
www.geoprobe-DI.com