Entry Level Certificate in Hospitality and Catering (Entry 3)

Universities, Entry and Growth
Martin Carree*, Antonio Della Malva* and Enrico Santarelli**
* Maastricht University and **Università di Bologna
Draft prepared for the ERSA Conference 2010 in Jönköping
May, 2010
Abstract
In this study we explore the extent to which entrepreneurship represents an effective mechanism to transform academic knowledge in economic growth. Specifically, we evaluate how three academic activities, teaching, research and IPR management, affect entry in the manufacturing sector and economic performance in 103 Italian provinces (NUTS3) between 2001 and 2006. For this purpose, we distinguish two main contributions of academic activitiesto local economies. Firstly, academic outputs can foster the entry of new ventures because the spillover of academic knowledge is at least partially captured as new companies. Secondly, academic knowledge can be exploited by new ventures and established firms and hence spur economic growth. We implement a recursive model where economic growth and entry are mutually reinforcing phenomena. Our findings show that academic outputs do not promote higher entry as entry seems to depend mainly on the presence of an existing industrial base. Rather, universities provide local entrepreneurs with knowledge of high economic potential. New ventures in high-tech manufacturing that have access to knowledge from scientificallyproductive universities positively influence growth. These findings support the thesis that new ventures are an effective vehicle to bring relevant knowledge to the market place.

1. Introduction
How does knowledge spur growth? Theories of endogenous growth have tended to use
the informational characteristics of knowledge as introduced by Arrow (1962) to explain
endogenous growth trajectories (Romer, 1986; Lucas, 1988). According to these theories, the
sole generation of knowledge would spur growth because such knowledge is only partially
appropriable and it spills over to third parties that would in turn use it to generate new
knowledge and useful ideas. Although these theories have predicted general patterns of
growth, they fail in explaining the several “paradoxes” that are recently crowding decision-
makers’ agendas. Some scholars have proposed that it is not investments in knowledge per se
that spur growth and thus competitiveness; rather the critical facet of the process of
knowledge generation is the commercialization of the results stemming out of the knowledge
produced (Acs et al., 2007; Audretsch and Keilbach, 2008). These authors posit the existence
of a “knowledge filter” between the investments in knowledge and their economic
exploitation. Such a filter results from the inherent peculiarities of knowledge, as opposed to
information. Knowledge generating activities produce uncertain economic results; they are
associated with high degrees of asymmetries between inventors and potential exploiters.
Finally, high uncertainty and high asymmetries foster high transaction costs for transferring
knowledge among economic agents (Audretsch, 2007). These characteristics are even more
emphasized when knowledge is generated in academic laboratories. A strand of literature in
the sociology and economics of science has stressed how the incentive system in place in the
academic community would rarely lead scientists to produce findings of immediate industrial
application (Dasgupta and David, 1994; Stephan, 1996). The recent involvement from
universities in technological development has shown that whenever academic findings show
potential technological applications, they are at an early stage of development and tend to
serve several industrial purposes (Colyvas et al., 2002; Jensen and Thursby, 2001).
In such a context, entrepreneurship is seen as the main mechanism that ensures the
flow of radical knowledge in the economy and eventually its economic exploitation
(Audretsch, 1995; Klepper and Sleeper, 2005; Schumpeter, 1934). Schumpeter (1934) was the
first to propose the notion that new and independent ventures bear the main responsibilities in
the process of economic growth through innovations, something he defined as “creative
destruction”. The main rationale underlying this argument is that large players would oversee
promising ventures because locked in existing products (Christensen, 1997; Hill and
Rothearmel, 2003).

In this study we explore the extent to which entrepreneurship represents an effective
mechanism to transform academic knowledge into economic growth. Specifically, we
evaluate the contribution of three academic activities, viz. teaching, research and IPR
management, to economic performance in 103 Italian provinces between 2001 and 2006. For
this purpose, we distinguish two main contributions of universities to local economies. Firstly,
academic outputs can facilitate the entry of new ventures as the spillover of academic
knowledge is at least partially captured as new companies. Secondly, academic knowledge
can be exploited by new ventures and established firms and hence spur economic growth. We
implement a recursive model where economic growth and entry are mutually reinforcing
phenomena. Our findings show that academic outputs do not promote higher entry. Rather,
entrepreneurial opportunities have larger importance for growth when they have access to
knowledge from scientifically productive universities.
The study is organized as follows. In Section 2 we present the existing literature on the
importance of academic activities for growth and the relevance of new ventures and existing
companies in appropriating and economically exploiting academic outputs. Section 3
introduces the estimation strategy and describes the variables used. Section 4 presents and
discusses the estimation results. Finally, Section 5 concludes, summarizing the main results in
the paper.
2. Academic Knowledge, Diffusion and Growth
2.1 Universities and Economic Growth
The role of modern higher education institutions (universities henceforth) in the
economic performance of firms, sectors, regions and countries has several facets.
Traditionally established with the aim of educating civil servants for the newly created
European states, universities have embraced a second mandate of institutionalizing the
production of fundamental knowledge. The two activities – teaching and basic research –
have been complemented by the more recent entrepreneurial attitude of academic
organizations engaging in research collaborations with private parties through licensing,
sponsored research and new venture creations (Etzkowitz and Leyersdorf, 1998).
Education is maybe the oldest contribution of academic activities to economic growth.
It is usually associated with the formation of higher levels of human capital, expressed as the
development and refinement of specific individual knowledge and capabilities. The increase
in human capital enables individuals to perform higher value-added tasks more efficiently and

quickly, which translates in higher productivity of labour and capital (Becker, 1964; Barro,
1991; Lucas, 1988). Moreover, students have been found to be one the main channels of
knowledge transmission to the industry (Nelson and Wright, 1992; Murnmann, 2003).
According to the authors, students have represented a critical conduit of the latest techniques
and theoretical know-how from academic laboratories to the corporate ones in the chemical,
mining and pharmaceutical industry. Also in the case of biotechnology, even more than by
direct R&D expenditures firm performance has been driven by the supply of highly skilled
graduates in life sciences, which has eased both the adoption of new process technologies and
the commercialization of new products (Patel et al., 2006).
Secondly, universities are the most prominent producers of fundamental knowledge.
Knowledge has been largely understood as one of the main drivers of economic growth. The
theories of endogenous growth built upon the informational characteristics of knowledge as
introduced by Arrow (1962) suggest that the generation of knowledge would enhance the
production of more efficient processes and products and hence it would spur growth (Romer,
1986). However, scholars in the economics of technical change have long focused their
attention to research and development activities (R&D henceforth) performed in corporate
laboratories to explain technology-driven growth. Indeed, knowledge produced in academic
laboratories is of somewhat different nature. Academic scientists pursue research goals which
are informed by their personal curiosity and by the reward system in the academic
community, based on peer recognition rather than on monetary compensations (Merton,
1973). Hence, academic findings rarely have immediate industrial applications. Rather, they
expand the theoretical pool of knowledge from which technical advances of commercial value
can be built upon. See Sanders (2007) for an endogenous growth model built precisely on this
notion of scientists expanding the available pool of entrepreneurial opportunities. Adams
(1990) shows that between 1949 and 1983 it took around 20 years for scientific advancements
to be absorbed and exploited by industries and thus led to productivity growth.
Thirdly, the time lag of academic knowledge to result in economic gains has shortened
in the last three decades or so. Three main facts highlight this convergence between science
and technology: a) the higher productivity of corporate R&D led by the increasing
pervasiveness of scientific approaches in corporate R&D as opposed to trial-and-error
methods (Arora and Gambardella, 1994); b) the rise of new science-based sectors in which the
innovation process depends mostly on developments arising from academic R&D, i.e. ICT
and Biotechnology, as key sectors in industrialized countries (Zucker et al, 1998a; Pisano,
2006) and c) the increasing involvement of universities in commercialization activities such

as sponsored research, technology licensing and equity positions in academic spinoffs (Fuller,
1990; Di Gregorio and Shane, 2002; Henderson et al., 1998).
Notwithstanding the increasingly relevance of universities in technological progress,
and leaving for the moment aside the discussion on whether universities should target more
vocational or conceptual education (Kruger and Kumar, 2004), the transfer of technologies to
the industry have several hindrances which result from the inherent peculiarities of
knowledge, as opposed to information. Knowledge generating activities produce uncertain
economic results; they are associated with high degrees of asymmetries between inventors
and potential exploiters. Finally, high uncertainty and high asymmetries spur transaction costs
for transferring knowledge among economic agents (Audretsch, 2007). These characteristics
are even more prominent for knowledge generated in academic laboratories. According to a
burgeoning body of literature in the economics and management of technology transfer,
academic technologies are mainly at an early stage of development, general in purpose,
characterized by high uncertainty about their effective applications, and demand further
development efforts from the buyers and inventors to be commercialized (Colyvas et al.,
2002; Jensen and Thursby, 2001; Jensen et al., 2003).
2.2 Diffusion of Academic Knowledge: Users and Location
2.2.1 New Ventures and Established Firms
In the context of academic knowledge and technical solutions, one line of reasoning
points to entrepreneurship as the main mechanism that ensures the flow of them in the
economy and eventually its economic exploitation (Acs et al., 2005; Audretsch, 1995;
Klepper and Sleeper, 2005). Several explanations in the literature suggest that new ventures
are more likely to embark in the risky activity of bringing to the market radical new
technologies, as the ones developed in academic laboratories, than established firms. New
products or solutions are often rejected by the latter as they already enjoy rents from market
power; furthermore incumbents are organized in order to commercialize existing technologies
being already embedded in established networks of customers and suppliers (Christensen,
1997; Hill and Rothearmel, 2003). Hence, new ventures are fitter to transform knowledge
with high economic impact. Evidence on the critical role of new ventures in exploiting radical
academic technologies is supported by the case of the electronics industry (Bania et al., 1993)
and for biotechnology (Zucker et al. 1998a). However, systematic evidence on this topic has

concluded that academic R&D exerts only a modest effect on the entry of new firms in the
proximity of research universities.
A second line of arguments points to established firms as better endowed to absorb
academic knowledge and exploit it commercially. The ability of firms to absorb knowledge
from external sources ultimately depends on their investments in knowledge creation (Cohen
and Levinthal, 1990; Cassiman and Veugelers, 2002). Whereas the existence of sunk
investments such as dedicated human and/or physical capital might restrict the range of
acquirable knowledge (corporate myopia), it shortens the time to market of new products and
processes embedding the newly acquired knowledge. In addition, established actors possess
the necessary capabilities to market new processes and products as they can benefit from an
existing customer base. Finally, incumbents are expected to show some degrees of internal
organizations, which facilitate the hiring of higher-educated personnel and hence the transfer
of knowledge through human capital (Piva et al., 2005).
2.2.2 Location and other factors
Theory and evidence agree on the limited spatial reach of knowledge spillovers, both
in case of a start-up or an established company (Jaffe, 1989). The spillover of academic
knowledge through new ventures is likely to be spatially bounded. Irrespective of the mode of
commercialization, new ventures exploiting knowledge developed in academic laboratories
are likely to locate nearby the main source of expertise (the inventors). In addition, academic
entrepreneurs choose to locate at commuting distances from the university as they prefer
retaining the academic employment (Shane, 2004). More systematically, there exists a
positive relation between academic R&D spending and entry of new ventures (Bania et al.,
1993; Harhoff, 1999; Woodward et al., 2006). By the same token, when incumbents are
interested in investing in the acquisition of academic knowledge, it is also likely that they will
be at close distances from the university, as the commercial development of academic
knowledge demands strong commitment and involvement from the holder of the tacit
knowledge (Agrawal, 2006; Jensen et al., 2003; Wright, 2002). Hence, for the transaction to
be successful, incumbents prefer neighbouring universities (Mansfield and Lee, 1996).
In addition to geographical distance, necessary to ease personal contacts and thus
effective transfer of tacit knowledge, some other considerations have to be made. A first issue
concerns the quality of the knowledge to be transferred. The interest in the role of academic
R&D as driver of growth through entry draws largely on the examples of ICT and Biotech in
California and Massachusetts, which host some of the most prolific scientific universities

worldwide (Saxenian, 1994). The link between the quality of research outputs and the
likelihood of generating technologically useful knowledge has received empirical support
from a burgeoning body of literature in the field of technology transfer. This literature has
fleshed out that highly productive scientists are also those who engage in technological
developments: they manage contractual agreements with industrial partners, engage in
consulting relationships and fund companies (Agrawal and Henderson, 2002; Azoulay et al.,
2009; Di Gregorio and Shane, 2003; Zucker et al., 1998b). Abramovsky et al. (2007) conduct
a systematic exploration of the determinants of location and entry of corporate R&D and
quality of academic research in Great Britain. The authors show that top-quality research in
Chemistry is related to entry in the pharmaceutical industry, whereas lower tier departments
in other disciplines seem to have more relevance in location decisions of other R&D-
performing firms.
A second concern about the effective contribution of academic research to economic
growth stresses the role of university policies in commercialization issues. Faculty in
universities that openly oppose any involvement in commercialization activities might exert
little if any influence on the transfer of academic knowledge (Owen-Smith and Powell, 2001;
Feldman and Desroches, 2003). Feldman and Desroches (2003) provide a detailed case of
how the “reluctance to allow commercial interests to influence faculty research agendas and
an abhorrence to engage in activities that might involve proprietary restrictions on knowledge
dissemination” at the John Hopkins University, despite its scientific eminence, slowed down
the emergence of a high-technology cluster in the Baltimore area.
3. Estimation strategy
The main goal of this study is to evaluate the contribution of a range of academic
outputs to economic performance. For this purpose, we distinguish two main contributions of
universities to local economies: universities can facilitate the diffusion of knowledge through
the entry of new ventures and established firms. Theory and empirical evidence suggest that
new ventures are more likely to introduce novel solutions in the marketplace than their
established counterparts. However, established firms appear better at absorbing knowledge
from academic laboratories.
We firstly aim to measure empirically the relevance of university outputs in the
determination of business entry. Secondly, we assess the contributions of established

companies and new ventures in contributing to economic growth. For this purpose, we
estimate two models:
a) Entry (i,t) = f (Growth (i,t-1); University(i,t); Z (i,t))
b) Growth (i,t) = g (Entry (i,t); University(i,t); Established(i,t); W (i,t))
where Z is a set of structural characteristics that can potentially determine the rate of
entry in the manufacturing sectors and W is a set of additional explanatory factors affecting
growth. Equation (a) and equation (b) are recursively related: new ventures promote growth
and growth encourages potential entrepreneurs.
3.1 Universities and Entry
In order to test whether the presence of universities facilitate the entry of new ventures
in the marketplace, we model entry as a function of several outputs of academic activities, the
presence of science parks and other control factors in the province. All measures are reported
between 2001 and 2006, unless stated differently.
We measure entry rate in two ways. In a first specification, we use the gross number of
new registrations in the manufacturing sector each year (t ranging between 2001 and 2006)
divided by the total labour force in the province (i indicates the 103 provinces).
1) E(i,t) = new registrations (i,t) / Labor(i,t)
In a second specification, we employ the net number of new businesses registered in
each year calculated as follows
2) e(i,t) = (new registrations (i,t) – cancelations (i,t)) / (Labor(i,t))
Moreover, entry in some sectors can rely on academic activities to a greater extent. We
thus differentiate entry in high-tech entry and in low-tech entry (according to their R&D
intensity), as it presumably reflects the extent to which economic activities depend on external
knowledge sources, i.e. universities1. Entry in the high-tech sectors encompasses new
registrations in the sectors of Electric and Electronic Equipments, Chemicals, Automotive and
Machinery. It represents 16.6% of all new registrations during the period of analysis, ranging
between 3.6% and 38.7% in the provinces. We denote the entries in the remaining sectors as
low-tech. They represent the bulk of the Italian manufacturing sector: on average 81.8% of all
1 We follow the sectors aggregation used in EUROSTAT. Although four classifications are proposed – high,
medium high, medium-low and low tech – we grouped the first two in high-tech and the remaining in low-tech.

companies operate in these sectors, ranging from 59% to 92.3% across provinces. Gross and
net entry in low-tech and high-tech manufacturing is defined as the following
3) HT_E(i,t) = high-tech new registrations (i,t) / Labor(i,t)
4) LT_E(i,t) = low-tech new registrations (i,t) / Labor(i,t)
5) ht_e(i,t) = (high-tech new regs (i,t) – high-tech cancelations(i,t)) / (Labor(i,t))
6) lt_e(i,t) = (low-tech new regs (i,t) – low-tech cancelations(i,t)) / (Labor(i,t))
Information about entry in Italian provinces was retrieved from the database
Movimprese, provided by UnionCamere, the Italian Association of Chambers of Commerce.
It contains yearly new registrations and cancellations at each provincial chamber of
commerce. Data are further organized per 2-digit NACE sector.
As reported above, the relationship between entry and economic growth is recursive.
We hence include the growth rate as explanatory variable (GROWTH (i,t-1)). It is lagged by
one year as it is assumed that the decision to start a business and the start-up date can take
some time due to the fulfilling of logistic and bureaucratic obligations.
We control for entry in the previous year (E (i,t-1)). This variable serves two main
purposes. Firstly, we partially avoid problems of omitted variables as some areas can support
a more favorable environment to venture creations that we cannot control for. Secondly, entry
and exit represent two processes that characterize disequilibria in the number of firms a can
sustain. The adjustment to the equilibrium number is partial over time and hence some
provinces that are undergoing a similar process can witness persistent entry (Carree and Turik
(1999).
Three indicators of academic outputs are included in the analysis. First, we measure
the educational mandate of universities as the share of Science and Technology (S&T)
graduates over the local population (STUDS). Information on the number of students was
retrieved from the statistical office of the Ministry of Higher Education and Research2. It
reports the number of graduates from each university, the faculty, the location of the teaching
activities and whether the students attained vocational education. We retrieved data on
graduates in 2000 (excluding vocational degrees) and aggregated according to the location of
2
www.mur-statistica.it
the university which issued the degree. Indeed, over the last two decades larger institutions
have delocalized teaching activities in adjacent provinces to meet the local demand for
education.
The second measure of academic output is related to scientific research (PUBS). We
accounted for the internationally recognized scientific production in Science and Technology
fields. Data about scientific production was collected by Breno et al. (2002) and provided by
the Institute for Scientific Information (ISI). The authors reported all articles between 1985
and 1999 with at least one author affiliated to Italian universities. Data were then aggregated
at provincial level, when necessary. The long timeframe aims at considering the potentially
useful accumulated stock of scientific knowledge produced by institutions. Moreover, it
discerns between those institutions that obtain the legal status of universities in the late 1990s
and universities with longer tradition. Finally, we divided the number of ISI publications by
the number of researchers in science and technology disciplines at Italian universities in 2000.
Thirdly, the technological activity of universities is included (UNI_PATS). We used
the share of national patent applications from universities between 1995 and 2000 over the
total provincial patenting activity in the same years. Information about university patenting
was obtained from Patjunkie, a web-based patent search engine realized by the Bologna
University based research group IRIS3. We are aware that this measure is strongly biased
downward as Italian academic professors tend to leave ownership of their inventions to
companies (Lissoni et al., 2007). Although information regarding the patenting activities of
academic inventors is available, focusing on academic inventors would raise problems of
localization of technological activities as academic inventors are mobile during their careers;
we thus avoid some inconveniences due to the gathering procedure.
Last, we include a dummy for the presence of science parks in the province. Science
parks differ from other measures listed above as they are usually set up by local governments.
They have been found to provide a nurturing environment for business ventures and value
adding services to clients (Mian, 1996). The location of science parks was retrieved from the
web site of the Italian Association of Technology and Science Parks (APTSI).
The reader might have noticed that the variables concerning academic outputs are time
invariant and measured in the pre-sample period. This choice is twofold. First of all, academic
outputs hardly vary significantly over time. Larger universities issue more degrees than
3
http://www.evpat.net/patjunkie/search.asp

smaller ones and the number of degrees remains quite stable; scientific production is rather
consistent over short time periods. On the other hand, technological production in academic
laboratories is subject to high levels of disturbance in the short run. Secondly, for academic
knowledge to bear its economic fruits, it needs to diffuse. It is reasonable to consider a quite
long time frame between the generation of academic knowledge and its economic
implications.
Other factors encouraging entry are the presence of agglomeration economies
(AGGLO), the presence of business services (BUS_SER) and the quality of road
infrastructures (INFRA).
Agglomeration economies can arise both from specialization of regions in some
specific industries (Marshall-Arrow-Romer hypothesis) or from diversification of the
economic activities (Jacob hypothesis). By the same token, they can signal concentration of
economic activities and subsequent high competition both upstream and downstream. We
measure agglomeration economies as the number of manufacturing establishments per 1000
employees (Movimprese). In an alternative specification, we differentiate between
agglomerations of high-tech manufacturing (AGGLO_HT) and of low-tech manufacturing
(AGGLO_LT) where we account for establishments in the high-tech and low-tech
manufacturing sector respectively. Business Services (BUS_SER) is measured as the share of
the workforce in the business service sector (ISTAT). They can advice companies in a variety
of issues ranging from the credit and real estate to the legal, fiscal and marketing domain.
Finally, the quality of infrastructures is crucial to ease accessibility to suppliers, markets and
other sources of information. We use an index of road infrastructures developed by the Istituto
Tagliacarne and UnionCamere in 2000 (INFRA). We exclude railway transportation as they
only account for a small fraction of passengers and freighting.
We hence estimate the following equations:
a.1) E (i,t) = a1 + b11*Growth (i,t-1) + b12*E (i,t-1) + b13*Studs(i) + b14*Pubs(i) +
b15*Uni_Pats(i) + b16*Sc_Park (i) + b17*Agglo (i,t-1) + b18*Bus_Ser (i,t-1) +
b19*Infra(i) + 1(i,t)
a.2) HT_E (i,t) = a2 + b21*Growth (i,t-1) + b22*E (i,t-1) + b23*Studs(i) + b24*Pubs(i) +
b25*Uni_Pats(i) + b26*Sc_Park(i) + b27*Agglo_LT (i,t-1) + b28*Agglo_HT (i,t-1)+
b29*Bus_Ser (i,t-1) + b20*Infra(i) + 2(i,t)

a.3) LT_E (i,t) = a3 + b31*Growth (i,t-1) + b32*E (i,t-1) + b33*Studs(i) + b34*Pubs(i) +
b35*Uni_Pats(i) + b36*Sc_Park(i) + b37*Agglo_LT (i,t-1) + b38*Agglo_HT (i,t-1) +
b39*Bus_Ser (i,t-1) + b30*Infra(i) + 3(i,t)
a.4) e (i,t) = a4 + b41*Growth (i,t-1) + b42*E (i,t-1) + b43*Studs(i) + b44*Pubs(i) +
b45*Uni_Pats(i) + b46*Sc_Park (i) + b47*Agglo (i,t-1) + b48*Bus_Ser (i,t-1) +
b49*Infra(i) + 4(i,t)
a.5) ht_e (i,t) = a5 + b51*Growth (i,t-1) + b52*E (i,t-1) + b53*Studs(i) + b54*Pubs(i) +
b55*Uni_Pats(i) + b56*Sc_Park(i) + b57*Agglo_LT (i,t-1) + b58*Agglo_HT (i,t-1) +
b59*Bus_Ser (i,t-1) + b50*Infra(i) + 5(i,t)
a.6) lt_e (i,t) = a6 + b61*Growth (i,t-1) + b62*E (i,t-1) + b63*Studs(i) + b64*Pubs(i) +
b65*Uni_Pats(i) + b66*Sc_Park(i) + b67*Agglo_LT (i,t-1) + b68*Agglo_HT (i,t-1) +
b69*Bus_Ser (i,t-1) + b60*Infra(i) + 6(i,t)
3.2 Universities, Entry and Growth
Equation (b) tests for the contribution of the measures of academic output to economic
growth. As we highlighted in section 2, two main mechanisms ensure the flow of academic
knowledge to the economy: new ventures and established companies. We hence model
growth as function of entry in the same year, of the size of manufacturing workforce, the
same set of academic outputs as reported in Equation (a) and their interaction with entry and
the manufacturing workforce.
We employ two measures of economic growth. The first one (GROWTH) reflects the
overall economic performance of a local economy and it is calculated as the relative rate of
growth of value added or of employment per province
7) ∆VA(i,t) = (VA (i,t) – VA (i,t-1)) / VA(i,t-1)
8) ∆EMP(i,t) = (EMP (i,t) – EMP (i,t-1)) / EMP(i,t-1)
The second dependent variable represents a crude approximation of the
competitiveness of the manufacturing industry and it is measured as the relative rate of
growth of value added or employment restricted to the manufacturing and mining sector per
province (ISS_GROWTH).
9) ∆VA_ISS(i,t) = (ISS_VA(i,t) – ISS_VA(i,t-1)) / ISS_VA(i,t-1)
10) ∆EMP_ISS(i,t) = (EMP_ISS(i,t) – EMP_ISS(i,t-1)) / EMP_ISS(i,t-1)

We include the one-period lagged dependent variable to account for cumulative
causations.
We use the gross rate of entry in the manufacturing sector (Ei,t) to accommodate for
the direct effects of the entrepreneurial activities in the province to economic growth in the
short run4. In a second specification of the same equation, we distinguish between high-tech
entry rates (HT_E) and low-tech entry rate (LT_E)5. Entry is calculated as in 1), 3) and 4).
Regional industrial structure can affect the growth rate of local economies and the extent to
which agglomeration economies emerge. We use three measures to account for the industrial
composition of the regional economies and its innovativeness. The manufacturing sector is
the most likely sector to benefit from scientific and technical advancements and translate them
in economic growth in the short run. The presence of the manufacturing sector (ISS) is
measured as the share of the labor force in the industry sector (source: ISTAT). Furthermore,
the ability of the latter to absorb and exploit external knowledge ultimately depends on its
current innovative performance (Cohen and Levinthal, 1990). We hence control for the degree
of innovativeness of the manufacturing sector (PAT_ISS). It is defined as the number of
national patents granted per 1000 employees in the industry sector and it is lagged of one year
(source: UMBI). The presence of the business service sector indicates the level of
development of the manufacturing sector and the existence of agglomeration economies due
to diversification. We include the share of workforce employed in the business service sector
(BUS_SER).
Measures of university presence have been already presented in the previous section.
We will briefly describe their implications for growth. The share of S&T graduates per
resident provides a measure of the relevance of student population in a local economy
(STUDS). There are at least two effects of the presence of large teaching universities with
respect to growth. First of all, large portions of students per resident population can hamper
economic growth as their spending power may be limited as compared to workers. Secondly,
they signal the extent to which high-quality human capital is present in the province: the
hiring of graduates from local companies can result in higher productivity growth. However, 4 See Fritsch and Muller (2004) for a summary of direct and indirect effects of entry on economic growth.
According to the authors, entry of new business adds new capacities to the existing ones and hence causes
current increases in employment.
5 Unlike in the Equation (a), where we have used both gross and net entry rates, we here focus only on the gross
entry. The reason is that we use also interaction terms of entry with measures of academic activities. Interacting
net entry would lead to results of difficult interpretation as it is made of two components: gross entry and exit.
this effect is mediated by the ability to absorb the human capital by a local industrial base. To
control for the latter, we interact STUDS with our measure of entry (E). We do not expect the
latter variable to have an influence on economic growth as new ventures may prefer to hire
experienced workers to make use of their social capital.
The scientific productivity of the academic personnel (PUBS) may represent a proxy
of the quality of the knowledge produced in academic laboratories. However, the implications
for growth remain unclear. Scientific productivity has been found to be a good predictor of
technological solutions as theoretical advancements might either improve existing
technologies or require new ones to tackle new scientific challenges (Franzoni, 2007). For
academic knowledge to translate in economic growth it needs to be brought to the
marketplace. We hence interact PUBS and E to control for the diffusion of scientific
knowledge. We expect new ventures to introduce solutions of greater economic impact when
compared to established companies.
Given the limited extent of the direct involvement by universities in IPR-related
issues, it can hardly have a direct effect on growth (UNI_PATS). However, technological
activities at academic laboratories may indicate the orientation of academic research towards
industrial applications and the propensity to collaborate with external partners. This can turn
be beneficial for established companies and new ventures unaffected by institutional frictions.
We control for these effects with two variables resulting from the interaction between
UNI_PATS and ISS and UNI_PATS and E.
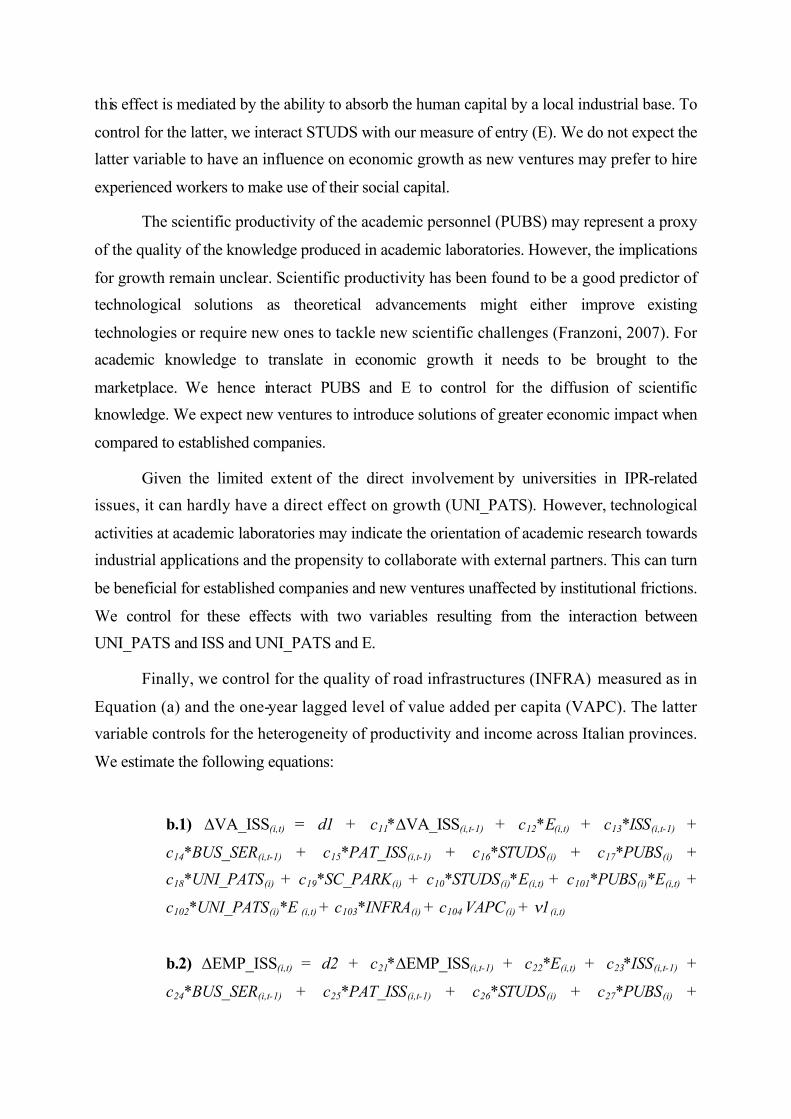
Finally, we control for the quality of road infrastructures (INFRA) measured as in
Equation (a) and the one-year lagged level of value added per capita (VAPC). The latter
variable controls for the heterogeneity of productivity and income across Italian provinces.
We estimate the following equations:
b.1) ∆VA_ISS(i,t) = d1 + c11*∆VA_ISS(i,t-1) + c12*E(i,t) + c13*ISS(i,t-1) +
c14*BUS_SER(i,t-1) + c15*PAT_ISS(i,t-1) + c16*STUDS(i) + c17*PUBS(i) +
c18*UNI_PATS(i) + c19*SC_PARK(i) + c10*STUDS(i)*E(i,t) + c101*PUBS(i)*E(i,t) +
c102*UNI_PATS(i)*E (i,t) + c103*INFRA(i) + c104 VAPC(i) + 1(i,t)
b.2) ∆EMP_ISS(i,t) = d2 + c21*∆EMP_ISS(i,t-1) + c22*E(i,t) + c23*ISS(i,t-1) +
c24*BUS_SER(i,t-1) + c25*PAT_ISS(i,t-1) + c26*STUDS(i) + c27*PUBS(i) +

c28*UNI_PATS(i) + c29*SC_PARK(i) + c20*STUDS(i)*E(i,t) + c201*PUBS(i)*E(i,t) +
c202*UNI_PATS(i)*E (i,t) + c203*INFRA(i) + c204*VAPC(i) + 2(i,t)
b.3) ∆VA(i,t)) = d3 + c31*∆VA(i,t-1) + c32*E(i,t) + c33*ISS(i,t-1) + c34*BUS_SER(i,t-1) +
c35*PAT_ISS(i,t-1) + c36*STUDS(i) + c37*PUBS(i) + c38*UNI_PATS(i) +
c39*SC_PARK(i) + c30*STUDS(i)*E(i,t) + c301*PUBS(i)*E(i,t) +
c302*UNI_PATS(i)*E(i,t) + c303*INFRA(i) + c304*VAPC(i) + 3(i,t)
b.4) ∆EMP(i,t)) = d4 + c41*GROWTH(i,t-1) + c42*E(i,t) + c43*ISS(i,t-1) +
c44*BUS_SER(i,t-1) + c45*PAT_ISS(i,t-1) + c46*STUDS(i) + c47*PUBS(i) +
c48*UNI_PATS(i) + c49*SC_PARK(i) + c40*STUDS(i)*E(i,t) + c401*PUBS(i)*E(i,t) +
c402*UNI_PATS(i)*E (i,t) + c403*INFRA(i) + c404*VAPC(i) + 4(i,t)
Table 1 presents the descriptive statistics for the two sets of equations that we
estimate. The upper part presents the dependent variables of both sets of equations, whereas
the bottom part presents the independent variables.

Table 1: Summary Statistics for equation a.1 - a.6 and equation b.1 – b.4
Equation Variable Obs Mean Std. Dev. Min MaxDependent
Entry E 618 1.381 0.711 0.490 9.931
HT_E 618 0.222 0.108 0.029 0.771
LT_E 618 1.159 0.673 0.389 9.578
e 618 -0.345 0.422 -2.112 1.389
ht_e 618 -0.025 0.109 -0.579 0.464
lt_e 618 -0.299 0.372 -1.981 1.197
Growth D_va_iss 618 0.020 0.049 -0.117 0.214
D_emp_iss 618 0.004 0.037 -0.112 0.155
D_va 618 0.044 0.031 -0.049 0.142
D_emp 618 0.013 0.023 -0.066 0.103
Independent
Entry E (t-1) 618 1.419 0.650 0.493 8.060
HT_E (t-1) 618 0.232 0.110 0.035 0.771
LT_E (t-1) 618 1.188 0.610 0.389 7.680
e (t-1) 618 -0.276 0.406 -2.037 1.389
ht_e (t-1) 618 -0.015 0.108 -0.579 0.464
Lt_e (t -1) 618 -0.242 0.357 -1.902 1.197
Agglo (t-1) 618 31.847 8.902 15.893 88.197
Agglo_ht (t -1) 618 5.685 1.985 1.883 13.240
Agglo_lt (t-1) 618 26.161 8.241 11.835 81.381
Entry & Growth Student_pop 618 0.711 1.080 0.000 5.471
Publ_prof 618 2.035 3.048 0.000 20.547
Uni_pats 618 0.001 0.002 0.000 0.011
Sc_park 618 0.233 0.423 0.000 1.000
Infra 618 1.057 0.381 0.529 2.406
Bus_serv (t-1) 618 0.118 0.025 0.063 0.230
L_vapc (t -1) 618 3.893 0.112 3.561 4.149
Growth D_vaiss (t-1) 618 0.024 0.054 -0.117 0.225
D_empiss (t-1) 618 0.004 0.041 -0.116 0.155
D_va (t-1) 618 0.047 0.031 -0.049 0.142
D_emp (t-1) 618 0.013 0.024 -0.066 0.103
ISS (t-1) 618 0.218 0.095 0.060 0.442
Pat_iss (t-1) 618 0.127 0.073 0.000 0.623
4 Results
4.1 Entry
Table 2 reports the results for the set of entry equations. The first three columns show
the estimations for gross entry; the second set of three columns reports the coefficients for net
entry. Column 1 refers to gross entry in the whole manufacturing sector, whereas column 2
and 3 consider gross entry in high and low tech manufacturing, respectively. Column 4
reports the estimation results for net entry in the whole manufacturing sector and column 5

and 6 again refer to high and low tech manufacturing. The postulated model has better
explanatory power when we deal with gross entry, as it explains between 70.2% and 87.5% of
the variation in gross entry in the manufacturing sector across 103 provinces between 2001
and 2006. The proportion of the explained variance drops to 36.3% - 40.9% in the models
with net entry as dependent variable.
The coefficient of the lagged value added growth variable is negative, but not
significant at a 5% significance level. Provinces which experience higher growth rate in value
added might witness lower gross entry in the manufacturing sector. However, from column 2
and 3 we observe that this result is driven by the lower entry in the lower-tech manufacturing,
whereas high-tech is not sensitive to growth. When we then move to columns 4, 5 and 6,
where net entry is considered, the effects of economic growth on entry vanish.
The amount of science and technology graduates has no effect on entry, irrespective of
the correction for exit and the technological intensity of the sectors. The intensity of research
activities in science and technology disciplines does not lead to higher entry – column 1 to 3.
However, from columns 4 to 6 we can deduce that higher scientific productivity is associated
to higher net entry, hence lower exit rates. Surprisingly to a certain extent, the low-tech
sectors benefit the most from it. The involvement of universities in formal IPR management
goes along with lower gross and net entry rates. New ventures in high-tech suffer more
severely from higher university IPR involvement, their coefficients being the most significant.
To conclude with the university related measures, science parks neither support nor hinder
entry. It points to the marginal role of universities in the explaining higher entry rate. This
result is consistent with previous evidence that rather pointed to some specific circumstances
that led some universities play a pivotal role in the creation of new sectors. Entry is not
sensitive to traditional academic activities such as teaching and research; the new
entrepreneurial mandate of universities on the opposite seems not to promote entry, not even
in high-tech. It suggests that strategies based on proprietary approaches to intellectual
management might restrain the flow of critical knowledge to the economy and its exploitation
through ventures.

Table 2: Results for equation a.1 - a.6: Entry in the Manufacturing sector
Dependent Variable Gross Entry Net Entry
Total High Tech Low Tech Total High Tech Low Tech
l_vapc (t-1) 0.0233 -0.0024 0.1132 -0.2813 0.0258 -0.2329
(0.258) (-0.083) (1.182) (-1.840) (0.495) (-1.573)
Growth (t-1) -0.7017 0.0116 -0.5676 0.089 0.0248 -0.0211
(-1.901) (0.116) (-1.696) (0.168) (0.200) (-0.043)
E (t-1) 0.9316***
(8.082)
HT_E (t-1) 0.5649*** -0.3173
(6.771) (-1.550)
LT_E (t-1) 0.0147 0.9872***
(1.509) (8.251)
E (t-1) 0.3592***
(5.472)
ht_e (t-1) 0.5791*** -0.0019
(7.177) (-0.015)
lt_e (t-1) -0.0011 0.3335***
(-0.096) (4.771)
Infra -0.0116 0.0133 -0.0002 -0.0177 0.0126 -0.0268
(-0.437) (1.944) (-0.011) (-0.576) (1.272) (-0.992)
Bus_serv (t-1) 0.4154 0.0972 0.6126 -0.1706 0.1369 -0.3282
(1.307) (1.038) (1.867) (-0.266) (1.000) (-0.551)
Agglo (t-1) 0.0062** -0.0109***
(2.123) (-4.858)
Agglo_HT (t-1) 0.0155*** 0.0075 -0.0081 -0.0029
(4.168) (0.882) (-1.650) (-0.341)
Agglo_LT (t-1) -0.0004 0.0056 0.0004 -0.0120***
(-0.523) (1.488) (0.664) (-3.866)
student_pop -0.0006 -0.0045 -0.0009 -0.0085 -0.0038 -0.0055
(-0.085) (-1.392) (-0.129) (-0.720) (-1.037) (-0.585)
publ_prof -0.0029 0.0000 -0.0025 0.0039 0.001 0.0029
(-1.563) (0.005) (-1.493) (1.396) (0.640) (1.326)
uni_pats 0.064 -0.021 -0.0893 -0.7612 -0.1148 -0.7146
(0.211) (-0.192) (-0.353) (-1.445) (-1.004) (-1.404)
sc_park -0.0057 -0.0077 -0.0118 -0.021 -0.0102** -0.0095
(-0.416) (-1.705) (-0.922) (-0.788) (-2.008) (-0.384)
Time Dummies Included Included Included Included Included Included
N 618 618 618 618 618 618
R-squared 0.8642 0.7027 0.8752 0.3679 0.4093 0.3628
Significance at the 1% and 5% level is indicated by *** and **, respectively. Standard errors are robust to heteroskedasticity and clustered around provinces.
The lagged dependent variables indicate the magnitude of the partial adjustment
process an industry undergoes. According to Carree and Thurik (1999), the size of the
coefficient indicates the speed of adjustment. We can observe that sectors in high-tech
manufacturing are subjected to higher adjustment processes, whereas the low-tech
manufacturing, despite higher gross entry rates, could be considered mature to some extent.
The agglomeration of manufacturing activities in the provinces favors the entry of new
ventures, suggesting the existence of positive externalities due to economic specialization.

This effect is particularly significant for high-tech sectors – column 2. However, higher
concentrations of manufacturing activities are also associated to higher exit – column 4 to 6.
Net entry appears negatively affected by the agglomeration of manufacturing activities,
indicating the presence of congestion costs or a more developed labor market which raises
opportunity costs for unsuccessful entrepreneurs. This effect is especially marked in the low-
tech industries. Therefore, entrepreneurs in high-tech sectors benefit the most from the
concentration of manufacturing activities as it eases the dissemination of tacit knowledge and
hence widens the range of commercial opportunities.
The presence of business services in the province does not impact entry at aggregated
levels. Finally, the quality of road infrastructure is never significant; nevertheless, the fact that
it is only positive for high-tech sectors might signal that knowledge-based opportunities are
better captured in well connected locations.
4.2 Growth
Table 3 reports the results for the growth equations in the Industry sector. The first
section illustrates the estimates for the growth rate in value added; the second section reports
the results for the growth rate of employment. We consider entry in the whole manufacturing
sector in columns 1 and 4, whereas we only consider high-tech entry in column 2 and 5;
finally, columns 3 and 6 take into account low-tech entry.
The model has limited explanatory power. The explained variation in the value added
growth equations are in the magnitude of about 15%, whereas we can explain about 7% of the
variation of the employment growth in the manufacturing sector.
Provinces with an overwhelming presence of manufacturing activities witness lower
economic performances. However, the innovative intensity of the manufacturing activities
improves the economic performances of the manufacturing sector. This effect vanishes when
we deal with the growth rate of employment. Finally, the presence of business services does
not affect the growth rate of local economies. These results do not come as a surprise. During
the period under analysis the whole manufacturing sector has undergone a severe crisis caused
by the introduction of the Euro. The industrial districts, the core of the Italian manufacturing
sector, have lost the advantage of operating in international markets with an undervalued
currency.

Table 3: Regression results for equation b.1 and b.2: Growth in the Manufacturing sector
Value Added Growth ISS Employment Growth in ISS
l_vapc (t-1) 0.0083 0.0109 0.0061 -0.0149 -0.0139 -0.0175
(0.427) (0.580) (0.306) (-0.870) (-0.818) (-0.999)
D_VAINDSS (t-1) 0.0421 0.0423 0.0464
(1.063) (1.065) (1.174)
D_EMPINDSS (t-1) 0.0902** 0.0923** 0.0942***
(2.299) (2.346) (3.650)
iss (t-1) -0.0845*** -0.0883*** -0.0810*** -0.0307 -0.045*** -0.033 **
(-3.514) (-4.203) (-3.481) (-1.893) (-3.009) (-1.835)
pat_iss (t-1) 0.0735*** 0.0677** 0.0699*** 0.0164 0.0136 0.0134
(2.76) (2.525) (2.649) (0.567) (0.468) (0.476)
Bus_serv (t-1) -0.1717 -0.2143 -0.1829 -0.0913 -0.1295 -0.0895
(-1.387) (-1.712) (-1.436) (-1.119) (-1.606) (-1.151)
Infra -0.0106** -0.0103** -0.0102** -0.0048 -0.0058** -0.0049
(-2.574) (-2.451) (-2.483) (-1.648) (-1.991) (-1.679)
student_pop -0.0120 -0.0062 -0.0071 -0.0041 -0.006 -0.0101
(-1.852) (-1.438) (-1.056) (-0.777) (-1.587) (-1.811)
publ_prof -0.0044** -0.0043** -0.0027 -0.0009 -0.0011 0.0012
(-2.074) (-2.311) (-1.573) (-0.610) (-0.604) (0.791)
uni_pats 5.6883 4.8592*** 1.0373 -1.2011 3.375 2.2245
(1.932) (2.848) (0.528) (-0.820) (1.721) (0.668)
sc_park 0.0119** 0.0126** 0.0120** 0.0051 0.006 0.0037
(2.232) (2.403) (2.225) (1.519) (1.728) (1.104)
E -0.0043 -0.0027
(-1.561) (-1.845)
E*Studenpop 0.0059 0.0003
(1.357) (0.073)
E*Publ_Prof 0.0030** 0.001
(2.418) (1.097)
E*Uni_Pats -4.1526 1.3491
(-1.659) (1.416)
HT_E -0.0129 0.016
(-0.902) (1.218)
HT_E*Student_pop 0.0125 0.011
(0.908) (0.917)
HT_E*Publ_Prof 0.0147*** 0.005
(2.831) (1.048)
HT_E*Uni_Pats -21.3338 -14.196
(-1.814) (-1.438)
LT_E -0.0045 -0.0016
(-1.374) (-0.660)
LT_E*Student_pop 0.0023 0.0055
(0.398) (1.201)
LT_E*Publ_Prof 0.0023 -0.0005
(1.774) (-0.365)
LT_E*Uni_Pats -0.657 -1.6865
(-0.355) (-0.722)
Time Dummies Included Included Included Included Included Included
N 618 618 618 618 618 618
R-squared 0.1564 0.1551 0.1507 0.0689 0.0723 0.0673
Significance at the 1% and 5% level is indicated by *** and **, respectively. Standard errors are robust to heteroskedasticity and clustered around provinces.
Only companies in the high-tech sectors have witnessed an increase in value added
after 2001 (Amil et al., 2007). However, the results from the second column indicate that

these gains did not reflect in faster employment growth. Indeed high-tech companies have
downsized their personnel during the same years, suggesting the implementation of
outsourcing strategies (Amil et al., 2007).
The measures of academic activities suggest that manufacturing companies located in
provinces with large universities have not enjoyed faster growth rates. On the contrary, these
results indicate that the growth of value added has slowed down in those provinces hosting
scientifically productive universities (Publ_Prof). The technical orientation of academic
research appears to affect value added growth positively and significantly only when we
account for entry of new ventures in the high-tech sector. However, the effect weakens
sensibly when we measure employment growth, although it remains positive. Science and
technology parks have a positive impact on the rate of growth of value added in the
manufacturing sector. This effect however is no longer significant when we look at the
employment growth, with the partial exception of the case when we consider high-tech entry.
The entry of new ventures in the manufacturing sector does not affect the growth rate
of sector’s value added; the same holds for the sectoral employment growth rate. When we
turn our attentions to the interacted variables, we note that the entry of manufacturing firms in
provinces with scientifically productive universities is associated with faster growth in the
sector value added. From columns 2 and 3 it emerges that this result is especially relevant
when high-tech entry is considered. This effect is no longer in place when we consider entry
in provinces with large universities or technologically active ones. If the growth of value
added is sensitive to entry to some extent, employment growth seems to be unaffected by the
entry of new production capacities.
Table 4 reports the results for the growth rate of value added and employment for the
total economy of the province. The results resemble to a large extent those regarding the
growth rate of manufacturing. As for the manufacturing sector, the regressions for value
added growth show better goodness of fit, with values of the R-squared around 52%, than
those for employment growth that are around 13%. We will mention here only the differences
with the previous estimates. Provinces with higher than average value added per capita grow
at faster rate. The same does not hold for employment growth. Whereas patenting was found
to spur value added growth in manufacturing significantly, it does not affect total value added
growth as the tertiary sector, which does not make use of patents, represent the largest share
of the Italian economy.

Table 4: Regression results for equation b.1 and b.2: Growth in Italian Provinces
Value Added Growth Employment Growth
l_vapc (t-1) 0.0439*** 0.0386*** 0.0443*** -0.0014 -0.0019 -0.001
(4.437) (4.015) (4.366) (-0.141) (-0.198) (-0.092)
D_VAINDSS (t-1) 0.0009 0.0031 0.0026
(0.023) (0.083) (0.068)
D_EMPINDSS (t-1) 0.1518*** 0.1547*** 0.1561***
(3.086) (3.166) (3.164)
iss (t-1) -0.0459*** -0.0422*** -0.0443*** -0.0038 -0.0061 -0.0046
(-4.028) (-3.764) (-4.007) (-0.347) (-0.515) (-0.442)
pat_iss (t-1) 0.0053 0.0046 0.0066 0.0035 0.0057 0.0045
(0.473) (0.383) (0.557) (0.231) (0.359) (0.293)
Bus_serv (t-1) -0.037 -0.0438 -0.0442 0.0084 0.0026 0.0059
(-1.089) (-1.207) (-1.324) (0.228) (0.075) (0.166)
Infra -0.0015 -0.0014 -0.0015 0.0014 0.0013 0.0013
(-0.694) (-0.603) (-0.691) (0.59) (0.546) (0.542)
student_pop 0.0039 -0.0006 -0.0008 0.0038 0.0014 -0.0008
(1.362) (-0.225) (-0.204) (1.197) (0.779) (-0.318)
publ_prof -0.0033*** -0.0016** -0.0020 -0.001 0 -0.0001
(-5.018) (-2.010) (-1.905) (-1.076) (-0.003) (-0.091)
uni_pats -3.3608*** -1.5298 0.3264 -3.3660** -1.4943 -0.6669
(-2.973) (-1.682) (0.131) (-2.054) (-1.642) (-0.412)
sc_park 0.0035 0.0028 0.0027 0.0023 0.0018 0.0019
(1.937) (1.53) (1.453) (1.373) (1.074) (1.126)
E 0 -0.0008
(0.032) (-0.940)
E*Studenpop -0.0050** -0.0042
(-2.236) (-1.945)
E*Publ_Prof 0.0025*** 0.0009
(6.122) (1.512)
E*Uni_Pats 2.8430*** 2.7037**
(3.164) (2.071)
HT_E -0.002 0.0044
(-0.191) (0.371)
HT_E*Student_pop -0.0089 -0.0134**
(-0.762) (-2.046)
HT_E*Publ_Prof 0.0067*** 0.0012
(2.993) (0.631)
HT_E*Uni_Pats 9.8744 7.7259
(1.59) (1.455)
LT_E 0.0006 -0.0004
(0.314) (-0.358)
LT_E*Student_pop -0.0018 -0.0009
(-0.482) (-0.435)
LT_E*Publ_Prof 0.0020** 0.0003
(2.422) (0.703)
LT_E*Uni_Pats -0.2943 0.5407
(-0.118) (0.35)
Time Dummies Included Included Included Included Included Included
N 618 618 618 618 618 618
R-squared 0.5215 0.5175 0.516 0.1361 0.1326 0.1304Significance at the 1% and 5% level is indicated by *** and **, respectively. Standard errors are robust
to heteroskedasticity and clustered around provinces.
The same conclusion can be drawn for the presence of science and technology parks
as they mainly provide services to manufacturing companies. A large recourse to IPRs from
universities is associated to lower growth in value added growth and eventually in

employment growth. Whenever we consider high-tech and low-tech entry, however, the
results are no longer significant. An extensive use of IPRs can indicate a strict control of
universities on the commercial activities of their faculty, which happen mainly through
informal contacts. Like for the manufacturing growth estimations, new ventures contribute to
the growth rate of value added when they are in the vicinity of prolific scientific departments.
This contribution is stronger when new ventures are in high-tech sectors. We also observe that
entry in provinces with technologically oriented universities is associated with faster rates of
growth in value added and employment. As for the use of IPRs, it vanished when we use
entry in high-tech and low-tech separately.
5. Conclusions
We have explored the different roles of modern universities and their implications for
entry and growth. We have postulated that knowledge produced in universities can affect the
competitiveness of the local manufacturing sector and the whole economy conditional on
being exploited by local companies. The results of the paper are two-fold.
Firstly, new ventures do not represent an effective means of appropriating academic
knowledge spillovers: higher measures of graduates, scientific productivity and patenting
activities do not promote higher entry rates. Rather, entry is largely explained by the presence
of a large manufacturing base and disequilibria in the supply side of the manufacturing sector.
We also find some evidence for the presence of diseconomies of agglomeration for the low-
tech manufacturing sector.
Secondly, universities dedicated exclusively to teaching mansions could ultimately
suffocate local economies as they would specialize in the provision of services for students. It
is rather the involvement of scientific personnel in the production of knowledge that enables
entrepreneurs to bring to the market place ideas and solutions with non-negligible economic
impacts. This finding is further corroborated by the fact that high-tech entrants benefit the
most from the production and diffusion of open knowledge. The recourse to legal protections
over academic inventions is shown to be effective for improving the competitiveness of the
manufacturing sector; however, it has detrimental implications for the whole economy.

To conclude, knowledge spillovers from universities do not lead to higher entry. They
rather lead to better entry as they provide local entrepreneurs with ideas that translate in
higher economic performance. Not surprisingly, the traditional activity of production of
knowledge has the highest impact on the competitiveness of the local industry. Furthermore,
new ventures in the high-tech manufacturing sectors are found to benefit more than their low-
tech counterparts.
6. References
1. Abramovsky, L; Harrison, R and Simpson, L, 2007. "University Research and the Location of Business R&D," Economic Journal, vol. 117(519), pages C114-C141.
2. Acs, Z J; Audretsch, D B; Braunerhjelm, P and Carlsson, B, 2004. "The Missing Link: The Knowledge Filter and Entrepreneurship in Endogenous Growth," CEPR Discussion Papers 4783.
3. Adams, J D, 1990. “Fundamental stocks of knowledge and productivity growth”, Journal of Political Economy, Vol. 98(4); pages 673-702
4. Agrawal, A, 2006. “Engaging the Inventor: Exploring Licensing Strategies for University Inventions and the Role of Latent Knowledge”, Strategic Management Journal, Vol. 27(1), pages 63-79
5. Agrawal, A; Henderson, R, 2002. “Putting Patents in Context: Exploring Knowledge Transfer from MIT”, Management Science, Vol. 48 (1), pages. 44-60.
6. Amil, D; Giannoplidis, A and Lipp-Lingua, C, 2007. “Evolution of high-technology manufacturing and knowledge-intensive services”, Statistics in Focus, Department of Industry, Trade and Service 68/2007, EUROSTAT.
7. Arora A., Gambardella A., 1994. “The changing technology of technological change: general and abstract knowledge and the division of innovative labour”, Research Policy, Vol. 23; pages 523-532
8. Arrow, K, 1962. "Economic Welfare and the Allocation of Resources for Innovation", in Nelson, editor, The Rate and Direction of Inventive Activity.
9. Audretsch, D B, 1995. "Innovation and Industry Evolution", MIT Press.10. Audretsch, D B, 2007. “Entrepreneurship capital and economic growth”, Oxford
Review of Economic Policy, 2007, vol. 93(1), pages 63-78.11. Audretsch, D B; Keilbach, M, 2008. “Resolving the knowledge paradox: Knowledge-
spillover entrepreneurship and economic growth”, Research Policy, Vol. 37(10), pages 1697-1705
12. Azoulay, P; Ding, W; Stuart, T, 2009, “The Effect of Academic Patenting on the Rate, Quality, and Direction of (Public) Research Output”, Journal of Industrial Economics, Vol. 57(4), pages 637-676,
13. Bania, N; Eberts, R W and Fogarty, M S, 1993. "Universities and the Startup of New Companies: Can We Generalize from Route 128 and Silicon Valley?," The Review of Economics and Statistics, vol. 75(4), pages 761-66.
14. Barro, R J, 1991. “Economic growth in a cross section of countries”, Quarterly Journal of Economics, Vol. 106, pages 407-443.
15. Becker, G, 1964. “Human capital: a theoretical and empirical analysis, with special reference to education”, New York, Columbia University Press.

16. Breno E; G. A. Fava; V. Guardabasso, M. Stefanelli, 2002. “Scientific Research in Italian Universities : an Initial Analysis of the Citations in the ISI Data Bank”, CRUI, Roma
17. Callaert, J., Van Looy, B., Verbeek, A., Debackere, K., Thus, B., 2006. “Traces of prior art: An analysis of non-patent references found in patent documents”, Scientometrics, 69: 3–20.
18. Carree, M.A.; A.R. Thurik ,1999. “Carrying capacity and entry and exit flows in retailing”, International Journal of Industrial Organisation, Vol. 17(7), pages 985-1007.
19. Cassiman B; R Veugelers, 2002. "R&D Cooperation and Spillovers: Some Empirical Evidence from Belgium", American Economic Review, Vol. 92(4), pages 1169-1184
20. Christensen, C M, 1997. “The Innovator’s dilemma: when new technologies cause great firms to fail”, Harvard Business School Press.
21. Cohen, W. M. and D.A. Levinthal (1990) “Absorptive Capacity: A New Perspective on Learning and Innovation”, Administrative Science Quarterly, vol. 35, 128-152.
22. Colyvas, J; Crow, M; Gelijns, A; Mazzoleni, R; Nelson, R R; Rosenberg, N and Sampat, B N. 2002, “How Do University Inventions Get Into Practice?”, Management Science, Vol. 48(1), pages 61-72.
23. Dasgupta P. and P. David (1994), "Toward a new economics of science", Research Policy, 23, 487 - 521.
24. Di Gregorio, D.; Shane, S, 2003. “Why do some universities generate more start-ups than others?”, Research Policy, vol. 32; pages 209-227.
25. Etzkowitz, H., 1998, “The norms of entrepreneurial science: cognitive effects of the new university-linkage”, Research Policy, Vol. 27, pp. 823-833.
26. Feldman, M P; P Desrochers, 2003. "Research Universities and Local Economic Development: Lessons from the History of Johns Hopkins University." Industry and Innovation, Vol. 10, pages 5-24.
27. Franzoni C., 2009. "Do scientists get fundamental research ideas by solving practical problems?," Industrial and Corporate Change, Vol. 18(4), pages 671-699.
28. Fuller I., 1990. “Universities as engines of R&D-based economic growth: they think they can”, Research Policy, Vol. 19, pages 335-348.
29. Jensen, R A; Thursby, M C, 2001, "Proofs and Prototypes for Sale: The Licensing of University Inventions," American Economic Review, vol. 91(1), pages 240-259.
30. Jensen, R A; Thursby, J G and Thursby, M C, 2003, "Disclosure and licensing of University inventions: 'The best we can do with the s**t we get to work with'," International Journal of Industrial Organization, vol. 21(9), pages 1271-1300.
31. Harhoff, D, 1999. “Firm Formation and Regional Spillovers - Evidence from Germany”, Economics of Innovation and New Technology, Vol.8 (1-2), pages 27-55
32. Henderson R., Jaffe A. B. and Trajtenberg M., 1998. “Universities as a source of commercial technology: A detailed analysis of university patenting 1965-88”, TheReview of Economics and Statistics, Vol. 80, pages 119-132.
33. Hill, C W L, Rothaermel, F T, 2003. “The performance of incumbent firms in the face of radical technological Innovation”, Academy of Management Review, vol.28 (2), pages 257-274.
34. Klepper, S; Sleeper, S, 2005. “Entry by spinoffs”, Management Science, Vol. 51(8), pages 1291-1306.
35. Krueger, D.; Kumar, K.B., 2004. ”Skill specific rather than general education: a reason for US–Europe growth differences?”, Journal of Economic Growth, 9: 167–207

36. Jaffe A, 1989. “Real Effects of Academic Research”, American Economic Review, Vol. 79, pages 957-970.
37. Lissoni F., Llerena P, McKelvey M and Sanditov B, 2008. “Academic patenting in Europe: new evidence from the KEINS database”, Research Evaluation, Vol. 17(2), pages 87-102.
38. Lucas, R E., 1988. “On the mechanics of economic development”, Journal of Monetary Economics, vol. 22 (1), pages 3-42.
39. Mansfield, E. and Lee, J.Y., 1996. “The modern university: contributor to industrial innovation and recipient of industrial R&D support”, Research Policy, vol. 25, 1047–1058.
40. Merton, R K, 1973. “The Sociology of Science: Theoretical and Empirical Investigations” Edited by N W Storer. Chicago: University of Chicago Press.
41. Mian, S A, 1996. “Assessing value-added contributions of university technology business incubators to tenant firms”, Research Policy, Vol. 25; pages 325-335.
42. Murmann, J P, 2003. “Knowledge and competitive advantage, the coevolution of firms, technology and national institutions”, Boston: Cambridge University Press.
43. Nelson R R; G Wright, 1992. “The rise and fall of American technological leadership: the postwar era in historical perspective”, Journal of Economic Literature, Vol. XXX; pages 1931-1964.
44. Owen-Smith J. and Powell W. W., 2001. “To patent or not: Faculty decisions and institutional success at technology transfer”, Journal of Technology Transfer, vol. 26, pages 99-114.
45. Patel, P.; A. Arundel; M. Hopkins, 2008. ”Sectoral Innovation Systems in Europe: Monitoring, Analysing Trends and Identifying Challenges in Biotechnology”, Europe Innova, Sector Report.
46. Pisano, G., 2006. “Science Business: The Promise, the Reality and the Future of Biotech”. Boston: Harvard Business School Press.
47. Piva M; Santarelli E; Vivarelli M, 2005. "The skill bias effect of technological and organizational change: Evidence and policy implications," Research Policy, Vol. 34(2), pages 141-157.
48. Romer, P M, 1986. "Increasing Returns and Long-run Growth", Journal of Political Economy, vol. 94(5), pages 1002-37.
49. Sanders, M, 2007. “Scientific Paradigms, Entrepreneurial Opportunities and Cycles in Economic Growth”, Small Business Economics 28(4), pages 339-354.
50. Saxenian, A, 1994. “Regional Advantage: Culture and Competition in Silicon Valley and Route 128”, Harvard University Press.
51. Shane, S, 2004. “Academic Entrepreneurship: University Spinoffs and Wealth Creation”, Aldershot, UK: Edward Elgar.
52. Schumpeter, J A, 1934. “The Theory of economic development”, New Brunswick, NJ: Transaction Publishers.
53. Stephan, P, 1996. “The Economics of Science”, Journal of Economic Literature, Vol. XXXIV, pages 1199-1235.
54. Woodward, D P; Figueiredo, O and Guimaraes, P, 2006. “Beyond the Silicon Valley: University R&D and high-technology location”, Journal of Urban Economics, vol. 60 (1), pages 15-32.
55. Zucker, L G; Darby, M R and Brewer, M B, 1998 (a). "Intellectual Human Capital and the Birth of U.S. Biotechnology Enterprises," American Economic Review, vol. 88(1), pages 290-306.
56. Zucker, L G; Darby, M R and Armstrong, J, 1998 (b). "Geographically Localized Knowledge: Spillovers or Markets?," Economic Inquiry, vol. 36(1), pages 65-86.

Copyright © 2022 FDOKUMEN