Chapter one - SUST Repository
78
1 Chapter one
-
Upload
khangminh22 -
Category
Documents
-
view
2 -
download
0
Transcript of Chapter one - SUST Repository

1
Chapter one

2
Chapter one
1.1 Introduction
Measuring of entrance and exit dose is most important in radiation therapy because of
the effect of radiation in the skin of the patient, and Prediction of skin reactions
requires knowledge of the dose at various depths in the human skin. Using thermos
luminance dosimeters (TLD) of different thicknesses, the dose can be extrapolated to
the surface and interpolated between the different depths.
The thermo-luminescent (T.L.) phosphoric material such as LiF(Mg, Cu and P) which
are usually named (TLD100H) has shown great interest of scientists in the field of
radiation dosimetry due to its very favorable dosimetric characteristics (Fung 2004).
This material was first introduced in the powder form by Nakajima et al. in 1978 then
the development continued and commercialized in 1990 as LiF:Mg.Ti (TLD100) and
the LiF(Mg,Cu,P) T.L. phosphors which are tissue-equivalent. The TLD100H is
considered as outperforms due to its ver y higher sensitivity, by a factor of greater
than 25, and a dose detection threshold of less than 1 mGy (Moscovitch 1999).
Therefore TLD has been used in the field of radiation dosimeter and correlation of
dose to biological effects (Ayad 2000).
One of the most promising realms being under focused by scientists in the
nanocomposites materials which have many applications in the field of medical
engineering, electronics, electrochemical, biosensors, radiation
detection/measurements and optical/display systems that is for their wide range of
absorption frequencies and ultra fast response behaviors (1). Nanocomposites martials
categorized under nanotechnology which can be defined as the science dealing with
the construction and use of functional structures designed form atomic or molecular

3
scale which at least one characteristic dimension measurement in nanometers
(Kensuke et al.,2000;Carl, 2002).
All metallic nanoparticles (Gold, Silver, Platinum…etc) exhibit unusual electrical,
magnetic, optical and electrochemical properties due the near-free conduction
electrons, which are depend on their size, surface Plasmon, surface free energy and
surface area, as well as on the surrounding dielectrics (Stakeev and Kustov, 1999).
The resent studies on polymer/silver nanocomposites revealed that the prosperities of
silver within it is composites answer many potential applications in optical
waveguides, optical switches, molecular identification, oxidative catalysis,
antimicrobial effects, etc.
These mentioned properties are dependent on the particle size, shapes and the method
of composites synthesis. Varieties of synthesis method have been developed,
including reduction from metallic salts, ultrasonic irradiation technique, ion
implantation, and thermal process and microwave technique. The synthesis of silver
nanocomposites by using γ- irradiation has been mentioned by Ali et al., (2007). The
radiation measurements in this study will be depend on the optical density
measurement and optical absorbance measurement using optical densitometer and
UV- visible spectroscopy accordingly. Also the radiation effect on the Silver/ PVA
composites will be shown out of SEM studies. The expected x-ray or γ exposure on
the silver/PVA composites film will be as color change to yellow or golden due to
presence of silver while the expected change on PVA will be as degradation of the
PVA chain.
4
1.2 problem of the study
The following study will help to establish a local in vivo dosimeter system to measure
the entrance and exit dose with local available materials in Sudan radiotherapy
centers. Also the private clinics lacking the frequent radiation exposure assessment
tools, hence it will be as a fast, easy and cheap assessment tool with a presence of
densitometer which is the cheapest equipment used in the radiation exposure
assessment.
1.3 Significant of the study
Ionizing radiation has significant capabilities to induce chemical and physical change
in the exposed materials. Studied on irradiated polymers show many advantage of
induced radiation changes on which can be quantify and qualify to deduce the amount
of radiation dose and exposure. This method relative to other methods such as film
badge is so simple and easy. The advantage includes no developer, no fixer, no other
effecting factors, the process occurred at a solid-site condition, fast method and
inexpensive, environmental friendly and controllable acquisition (6).
1. 4 Scope of the study
Ionizing radiation has significant capabilities to induce chemical changes in the
exposed materials.
So the following study will highlights and shows the exposure dose based on the
PVA/Ag composites change due to irradiation by using densitometer and UV- visible
spectroscopy.

5
1.5 Hypothesis of the study
The researcher expect that Sudanese radiation therapy centers have high exposure
dose to the skin of the patients during treatment with radiation which is un-
compatible with the policy of radiation therapy system. Also there is lack in the
facilities for assessment and measuring the in vivo dosimetry especially entrance and
exit dose.
1.6 Objectives of the study
To measure entrance and exit dose to the patients during radiotherapy
treatment.
To evaluate the PVA/Ag composites film as measuring tool in radiotherapy
especially in in-vivo dosimetry depending on optical density or absorption
coefficient.
To identify the radiation effect on the PVA/Ag composites film.
To compare the PVA/Ag composites film exposure data with TLD.
To determine the absorption coefficient of the phantom depending on the
entrance and the exit dose.
1.7 Thesis outline
The backbone of the following thesis will be formed of fivechapter. Chapter 1 will
deal with the general introduction about the research background, scope of the study,
problem statement, Hypothesis of the study and the objectives of the study. Chapter 2
will deal with literatures review cover the theoretical background and previous
studies. Chapter 3 will deal with the methodology of the study, including materials,
samples preparation, equipment and measurement. Chapter 4 will cover the results.
And chapter 5 will cover discussion, conclusion, recommendations, references and
the researcher bio data.

6
Chapter Two

7
Chapter two
Literature Review
2.1 Theoretical background
2.1.1 Ionizing radiation
Ionizing radiation is a broad energetic spectrum of electromagnetic waves or high
velocity atomic or subatomic particles. The radiation can be categorized according to
their ability to ionize the media. Non-ionizing radiation is electromagnetic radiation
that does not have sufficient energy to remove an electron of the atom. The various
types of non-ionizing radiation are ultra violet (UV), visible light, infrared (IR),
microwaves (radio and television), and extremely low frequency (ELF, or as they
called EMF or ELF-EMF). Ionizing radiation is electromagnetic radiations, such as
X-rays, γ-rays and charged particles (electrons, α-particles and β-particles) which
possess sufficient energy to ionize an atom by removing at least an orbital electron.
According to the 1996 European Guideline of the European Atomic Energy
Community (EURATOM), electromagnetic radiation with a wavelength of 100 nm or
less is considered as ionizing radiation which is corresponds to ionizing potential of
12.4 eV or more (Smith, 2000). The ionization potential is dependent on the
electronic structure of the target materials and generally in the order of 4 – 25 eV.
The International Commission of Radiation Units (ICRU) has subdivided the ionizing
radiation into direct and indirect ionizing radiation, based on the mechanisms by
which they ionized the atom. Direct ionizing radiations are fast charged particles,
such as alpha particles, electrons, beta particles, protons, heavy ions, and charged
mesons, which transfer their energy to the orbital electron directly and ionize the
atom by means of Columbic force interactions along their track. Indirect ionizing
radiations are uncharged quantum, such as electromagnetic radiations (X-rays and γ-

8
rays), neutrons, and uncharged mesons, which undergo interactions with matter by
indirectly releasing the secondary charged particles which then take turn to transfer
energy directly to orbital electrons and ionize the atom. Some properties of ionizing
radiation are shown in Table 2.1
Table 2.1 shows the properties of different ionizing radiation
Characteristics Alpha Proton Beta or
electron
Photon
Neutron
Symbol 4
2 or He+2
p1
1or H
+ e1
or β γ- or X-rays n1
0
Charge +2 +1 -1 Neutral Neutral
Ionization Direct Direct Direct Indirect Indirect
Mass (amu) 4.00277 1.007276 0.000548 - 1.008665
Velocity (m/s) 6.944 x10⁶ 1.38 x10
7 2.82 x10
8 2.998 x10
8 1.38 x10
7
Speed of light 2.3% 4.6% 94% 100% 4.6%
Range in air 0.56 cm 1.81 cm 319 cm 820 m 39.25 cm
1 atomic mass unit (amu) = 1.6 x 10⁻²⁷
kg.
Speed of light c = 3.0 x 10⁸ m/sec.
2.1.2 Radiation sources
The sources of ionizing radiation can be divided into two categories namely as natural
and man-made sources. The first natural sources are cosmic radiation which is the
radiation coming from outside our solar system as positively charged ions (protons,
alpha, heavy nuclei) and interact with atmosphere to produce secondary radiations
such as x-rays, muons, protons, alpha particles, pions, electrons and neutrons. The
second natural sources are external terrestrial sources which represent the radioactive
materials found naturally in the earth crust, rocks, water, air and vegetation. The
9
major radionuclides found in the earth crust are Potassium-40, Uranium-235, and
Thorium-210.The main sources of man-made radiations that expose the public are in
the form of medical diagnostic X-ray, radiation therapy, nuclear medicine and
sterilization. The common radioactive sources are 131
I, 99m
Tc, 60
Co, 192
Ir, 90
St and
137Cs. Other man-made sources exemplar in occupational and consumption products
that originated in mines, combustible fuel (gas, coal), ophthalmic glasses, televisions,
luminous, watch’s dial (tritium), X-rays at the airport (scanner), smoke detectors
(Americium-241) and fluorescent lamp starters, nuclear fuels, nuclear accidents and
nuclear weapons. The yield of artificial sources is represented either as quantum in X-
rays and γ- rays or as high energy particles such as beta particles (β), alpha particles
(α), neutrons and electrons (Smith, 2000). Most of the types of radiation source
discussed above are used in medicine, industry, and research. Today the most
common radiation sources used is 60
Co, which is an artificial source of γ radiation and
linear accelerators for photon and electron beams having potential energy ranging
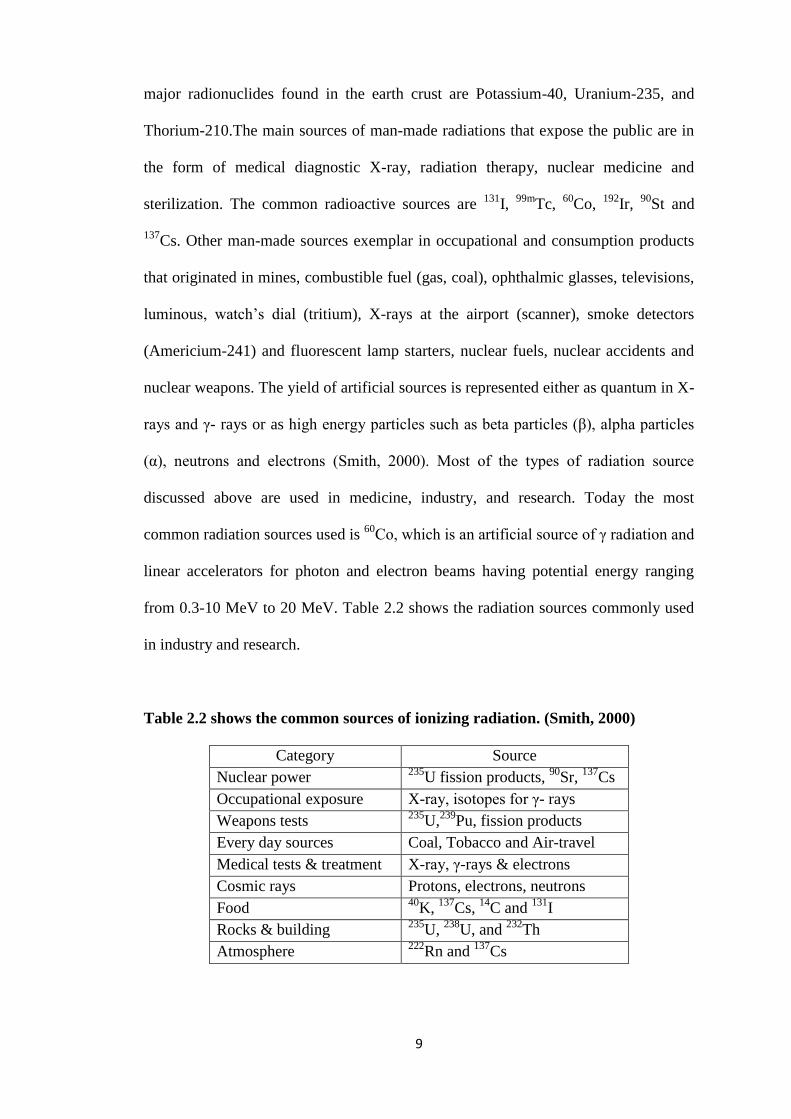
from 0.3-10 MeV to 20 MeV. Table 2.2 shows the radiation sources commonly used
in industry and research.
Table 2.2 shows the common sources of ionizing radiation. (Smith, 2000)
Category Source
Nuclear power 235
U fission products, 90
Sr, 137
Cs
Occupational exposure X-ray, isotopes for γ- rays
Weapons tests 235
U,239
Pu, fission products
Every day sources Coal, Tobacco and Air-travel
Medical tests & treatment X-ray, γ-rays & electrons
Cosmic rays Protons, electrons, neutrons
Food 40
K, 137
Cs, 14
C and 131
I
Rocks & building 235
U, 238
U, and 232
Th
Atmosphere 222
Rn and 137
Cs
10
2.1.3 γ- radiation sources
γ-rays are produced by the nuclear transitions that occur within the nuclei of
radioactive elements. The emitted photons are mono-energetic with specific energy to
the isotope from which they originate. By far the most commonly employed
radioactive isotope for γ-rays is cobalt-60 (60
Co), an isotope with a half-life of 5.272
years. 60
Co emits two γ-photons of equal intensity at 1.17 and 1.33 MeV. It is
produced in nuclear reactors by a neutron-capture reaction involving 59
Co. Due to the
long half-life, high penetrating power and ease of production, 60
Co sources have
become sources of choice in both industrial and research institutions. The activity of
the sources prepared in nuclear reactors can be made high up to 40 Ci/g (1.5 TBq/g),
however sources with activity from 1 to 5 Ci/g are typically common for use. Over
80% of the 60
Co produced world-wide is manufactured by the Canadian company,
Ontario Hydro and marketed by another Canadian company, MDS Nordion.
60Co radioisotope decays to stable nickel-60 by a nuclear transition (β-decay) in
which a neutron is converted into a proton via the emission of a β-particle with
energy of 312 keV and two γ-photons, one of 1.17 MeV and another of 1.33 MeV.
The decay scheme of this isotope is illustrated in Figure 2.1 (Choppin et al., 1995;
Attix, 1986).

11
Figure 2.1 Decay scheme of Co60 radioisotope which ends by Nicle-60 stable.
Another frequently used γ-ray source is cesium-137, a fission product from
nuclear reactors. The energy of the emitted photon is 662 keV and the half-life is
30.17 years. Nuclear reactors themselves are potential sources of γ-rays.
2.1.4 γ-radiation interaction with matter
When photons of γ-radiation interact with matter, they undergo attenuation and hence
lose their energy and intensity by the process of photoelectric absorption, Compton
inelastic scattering, pair production, and Rayleigh elastic scattering (Evan, 1952).
2.1.5 Photoelectric absorption
Absorption of γ-rays occurs when the γ-ray photon is absorbed by an electron
resulting in ejection of the electron from the inner shell of the atom and ionization of
atom take place. Subsequently, the ionized atom returns to the neutral state with the
emission of characteristic X-ray of the atom shown in Figure 2.2. This subsequent
emission of lower energy photons is generally absorbed and does not contribute to (or
hinder) to the secondary ionization. Photoelectron absorption is the dominant process
for γ-ray absorption up to energies of about 500 keV. The photoelectric absorption
process predominates for photons in the low energy range between 10 keV and 200
60Co − 0.312 MeV
γ1- 1.17 MeV
γ2- 1.33 MeV
60Ni
(< 1%) − 1.491 MeV

12
keV. This is the phenomenon explained by Einstein in 1905, in which an incident
photon gives up all its energy h to a bound electron, usually K shell (90%), where
subsequently part of the energy is used to overcome the electron binding energy BE
and the extra energy is converted as kinetic energy KE of the photoelectron. This can
be expressed in equation (1.1).
BEh K E (2.1)
The atom that is left in an excited state will emit fluorescent x-rays or Auger
electrons. The characteristic X-rays may escape especially for high-energy photons
and high atomic number of absorbing material unless the absorber is thick enough to
stop the γ-rays. The ranges of the Auger electrons are short and locally absorbed. The
cross-section for photoelectric effect in K shell of an atom with atomic number Z for
photon energy h is given by equation (2.2), from which we could deduce that the
photoelectron absorption is dominant for atoms of high atomic numbers and for
photon of low energy..
7 / 22 5
00 44 2
137K
m c Z
h
(2.2)
where2
00 r and 2 2 15
0 0/ 2.818 10r e m c m
is the classical electron radius, m0 is
the rest mass of electron and c is the speed of light. m0c2 is the rest energy of the
recoil electron, according to mass-energy equation proposed by Einstein in 1905 in
the relativity theory.

13
Figure 2.2 Schematic diagram of photoelectric absorption of γ-radiation
resulting in ejection of orbital electron from L shell leading to ionization process
of an atom.
2.1.6 Compton Scattering
Compton scattering process also known as an incoherent scattering, occurs when the
incident photon ejects free or weakly bonded electron from an atom and a photon of
lower energy is scattered from the atom. Relativistic energy and momentum are
conserved in this process and the scattered γ-ray photon has less energy and therefore
greater wavelength than the incident photon shown in Figure 2.3. Compton scattering
is important for low atomic number specimens. At energies of 100 keV - 10 MeV the
absorption of radiation is mainly due to the Compton effects (McGervey, 1983). The
change in wavelength of the scattered photon is given by equation (2.3)
'
' (1 cos )o
o
c c h
mc
(2.3)

14
where λ is the wavelength of the incident photon, the wavelength of the scattered
photon, m is the mass of the electron and the angle of scattering for the photon. On
rearranging, the above equation we got the following equation (1.4)
1 (1 cos )
hhv
(2.4)
Where is the ratio of the energy of the photon to the rest energy of the electron i.e.
2
0/ cmhv . The kinetic energy T for the recoil electron is given by equation (1.5)
(1 cos )
1 (1 cos )T hv
(2.5)
And the scattering angle of the electron is given by equation (1.6)
1
cot (1 ) tan2
(2.6)
Figure 2.3 Schematic diagram of Compton scattering for γ-radiation
resulting in ionization and scattering of the incident photon with less energy
15
2.1.7 Pair Production
The production of a positive and negative electron pair (pair production) is a process
that can take place in the vicinity of the nucleus field of an atom or an electron field.
Absorption of photons through the mechanism of pair production can occur when the
energy of an incident photon is greater than twice the rest mass of an electron, i.e.
2m0c2 = 1.022 MeV (Johns and Cunningham, 1983). During pair production
interactions, a photon has its energy converted to an electron–positron pair. The
positron so produced interacts with matter by ionizing and exciting atoms through the
same processes as electrons, thus losing energy and being brought to rest. At this
point, the positron combines with an electron in an annihilation process producing
two photons with energy equal to 0.511 MeV as shown in Figure 2.4.
Pair production is an absorption process in which a photon in the field of nucleus
produces an electron-positron pair, where the total kinetic energy is equal to the
energy of photon minus the rest energy of the two particles, which have been created
as shown in equation (2.7), thus the photon energy must be greater than 1.02 MeV for
the interaction to take place. The electron and positron do not necessarily receive
equal energy, but their average energy is given by equation (2.8).
)()( 2
0_
2
0 TcmTcmh (2.7)
2
022.1
hT MeV (2.8)
The cross-section of the pair production in the field of nucleus is given by equation
(2.9)
27
2182ln
9
28
137
12
0
22
0cm
hZrPP (2.9)
The triplet production process is similar but the interaction takes place with one of the
atomic electrons which receives sufficient energy to be set free. It occurs when the
16
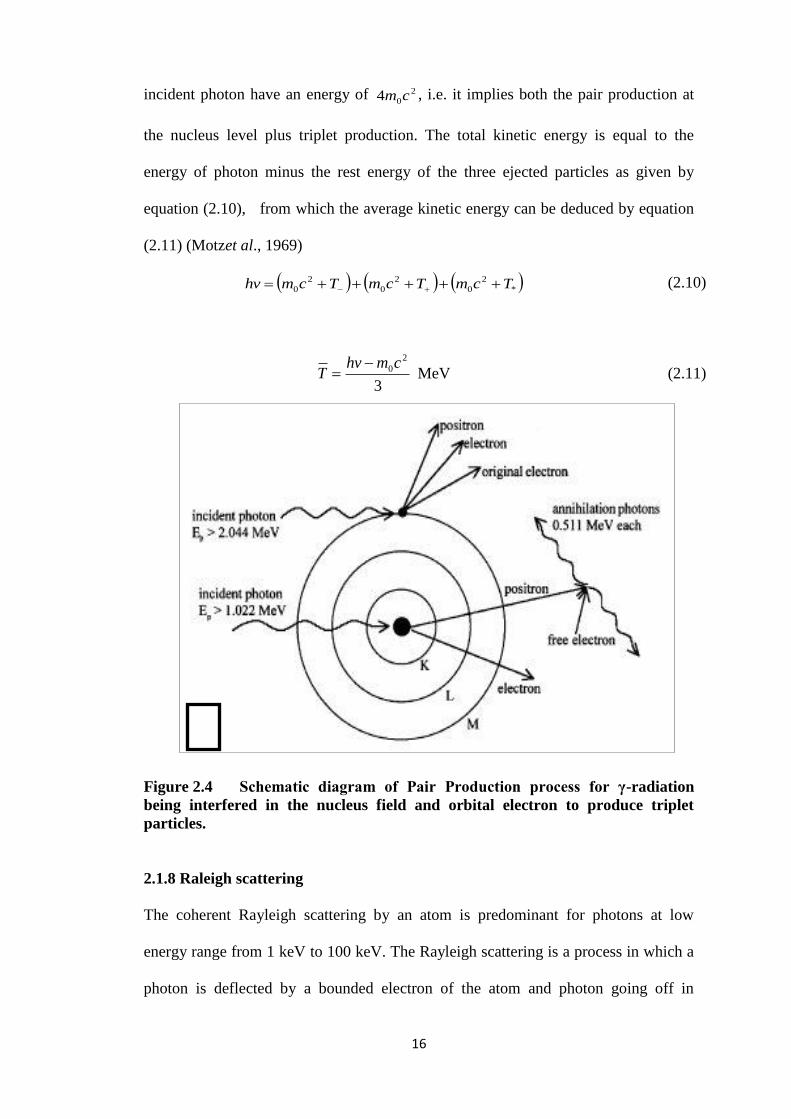
incident photon have an energy of 2
04 cm , i.e. it implies both the pair production at
the nucleus level plus triplet production. The total kinetic energy is equal to the
energy of photon minus the rest energy of the three ejected particles as given by
equation (2.10), from which the average kinetic energy can be deduced by equation
(2.11) (Motzet al., 1969)
*
2
0
2
0
2
0 TcmTcmTcmhv (2.10)
3
2
0cmhvT
MeV (2.11)
Figure 2.4 Schematic diagram of Pair Production process for γ-radiation
being interfered in the nucleus field and orbital electron to produce triplet
particles.
2.1.8 Raleigh scattering
The coherent Rayleigh scattering by an atom is predominant for photons at low
energy range from 1 keV to 100 keV. The Rayleigh scattering is a process in which a
photon is deflected by a bounded electron of the atom and photon going off in

17
different directions with no loss in energy. The atomic system may recoil as a whole
under impact without the atom being ionized or excited. The probability of this
process is large only for low energy photons and high atomic number material. The
differential cross-section of the coherent scattering of photon at deflection angle by
a bounded electron is given by equation (2.12)
d
Z
ZFrd coh
222
0
),,(cos1
2
1 (2.12)
whereF(α,ɵ,Z) is the atomic form function which varies from zero at large angle to Z
at the smaller angle.
2.1.9 -ray attenuation coefficients
In general the characteristic of radiation interaction with matter is that each individual
photon is absorbed or scattered from the incident beam in a single event. The photon
number removed ΔI is proportional to the thickness traveled through x and the
initial photon number I0, i.e. oI I x , where, is a constant proportionality
called the attenuation coefficient. In this case, upon integrating, we have the
following equation (2.13)
x
oI I e
(2.13)
The attenuation coefficient is related to the probability of interaction per atom, i.e. the
atomic cross section σa is given by equation (2.14)
a AN
A
(2.14)

18
WhereA is the mass number and NA the Avogadro’s number (6.022 x 10²³
mol/1),
Table 2.3 briefly summarized the entire γ-radiation photon interactions with their
possible energies required to initiate the reactions (Smith, 2000; Siegbahn, 1965).
Table 2.3 The different types of γ-radiation interactions with mater.
(Siegbahn, 1965).
Process Type of
interaction
Other names Approximate E of
Maximum
importance.
Z dependence
Photoelectric
Scattering from
electrons
coherent
Incoherent
Pair Production
Pair production
Delbruk
scattering
With bonded
electrons, all E
given to electron
With bond
atomic electron,
with free
electrons
With bond
atomic electron,
with free
electrons
In Coulomb
field of Nucleus
In coulomb field
of electron &
nucleus
Rayleigh electron,
resonance scattering,
Thomson scattering
Compton scattering
Elastic Pair
production
Triplet production
inelastic pair
production. Nuclear
potential scattering
Dominant at low E
(1-500) KeV, cross
section decrease as E
increase
<1MeV and greatest
at small angles.
Independent of
energy
<1MeV least at small
angle.
Dominate in region
of 1 MeV, decreases
as E increase
Threshold ~1MeV,
E> 5MeV. Increase
as E increase.
Threshold at 2 MeV
increases as E
increases.
Real Max >
imaginary, below 3
MeV(both increase
as E increases)
Z3
Z2, Z
3
Z
Z
Z
Z2
Z
Z4
2.1.10 γ-radiation interaction with molecules
The essence of -radiation interaction with molecules and change the physical and
chemical characteristics of the formed compound is ascribed to the amount of energy
being transferred, which will create ion, free radicals and excited molecule. Such
interaction process is termed ionization and excitation of the molecules, which can
cause chemical changes to the irradiated molecule. This is due to the fact that all
19
binding energy for organic compound in the range of 10 – 15 eV. In case of low
transferred energy by photon, the molecule undergoes excitation state before
returning to the rest state by emitting X-ray photons or break down to release free
radicals which in turn undergoes polymerization.
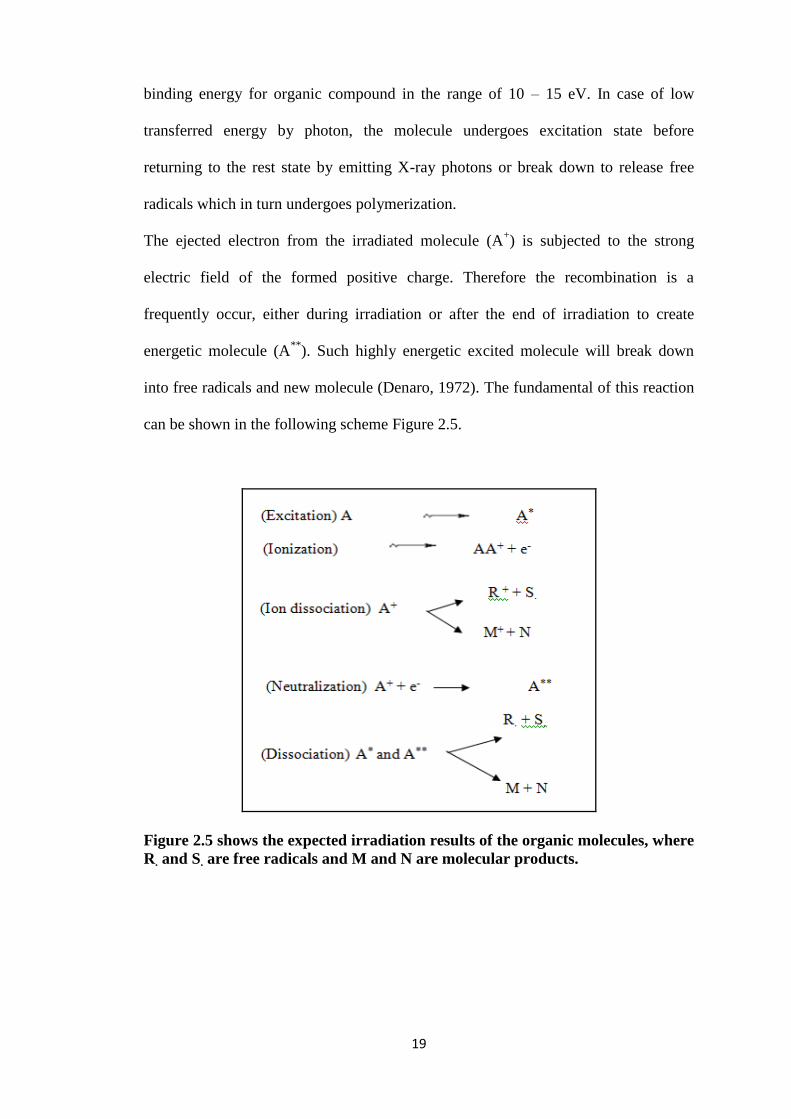
The ejected electron from the irradiated molecule (A+) is subjected to the strong
electric field of the formed positive charge. Therefore the recombination is a
frequently occur, either during irradiation or after the end of irradiation to create
energetic molecule (A**
). Such highly energetic excited molecule will break down
into free radicals and new molecule (Denaro, 1972). The fundamental of this reaction
can be shown in the following scheme Figure 2.5.
Figure 2.5 shows the expected irradiation results of the organic molecules, where
R. and S. are free radicals and M and N are molecular products.

20
2.1.11 Polymer
Polymer is a Greek word contain of two word poly +mer and they mains many parts,
polymer is a large molecule, or macromolecule, composed of many repeated subunits.
Because of their broad range of properties (Painter et al 1997), both synthetic and
natural polymers play an essential and ubiquitous role in everyday life. (McCrum et al
1997), Polymers range from familiar synthetic plastics such as polystyrene to natural
biopolymers such as DNA and proteins that are fundamental to biological structure
and function. Polymers, both natural and synthetic, are created via polymerization of
many small molecules, known as monomers. Their consequently large molecular
mass relative to small molecule compounds produces unique physical properties,
including toughness, viscoelasticity, and a tendency to form glasses and semi
crystalline structures rather than crystals.
2.1.12 Polymer properties
Polymer properties are broadly divided into several classes based on the scale at
which the property is defined as well as upon its physical basis. (S.A. Baeurle, 2009).
The most basic property of a polymer is the identity of its constituent monomers. A
second set of properties, known as microstructure, essentially describe the
arrangement of these monomers within the polymer at the scale of a single chain.
These basic structural properties play a major role in determining bulk physical
properties of the polymer, which describe how the polymer behaves as a continuous
macroscopic material. Chemical properties, at the nano-scale, describe how the chains
interact through various physical forces. At the macro-scale, they describe how the
bulk polymer interacts with other chemicals and solvents.
2.1.13 Polymerization
Radiation polymerization is a process in which the free radicals interact with the
unsaturated molecules of a low molecular unit known as monomer to form high
21
molecular mass polymer or even with different monomers to produce crosslink
polymer. The formed polymer can be in different forms called homopolymer and
copolymer depending on the monomer compositions link together.
Radiation-induced polymerization process can be achieved in different media
whether it is liquid or solid unlike the chemical polymerization which can only
accomplished in aqueous media. It is also temperature independent. Radiation
polymerization often continues even after removing away from the radiation source.
Such condition is known as post-polymerization (Lokhovitsky and Polikarpov, 1980).
Since radiation initiation is temperature independent, polymer can be polymerized in
the frozen state around aqueous crystals. The mechanism of the radiation induced
polymerization is concerning the kinetics of diffusion-controlled reactions and
consists of several stages: addition of hydroxyl radicals and hydrogen atoms to
carbon-carbon double bond of monomer with subsequent formation of monomer
radicals; addition of hydrated electrons to carbonyl groups and formation of radical
anion of a very high rate constant and the decay of radicals with parallel addition of
monomer to the growing chain.
2.1.14 Cross linking
The process of crosslink occurs due to interaction between two free radical monomers
which combine to form intermolecular bond leading to three dimensional net of cross
linked highly molecular polymer, more likely dominate in unsaturated compound or
monomer. The cross linked polymer show strong mechanical strength and high
thermal resistance.

22
2.1.15 Radiation grafting
Radiation grafting is a process in which active radical sites are formed on or near the
surface of an exciting polymer, followed by polymerization of monomer on these
sites. Grafting is accompanied by homopolymerization of the monomer; the material
to which the monomer is grafted is described as the backbone, trunk or support.
Radiation grafting is used to modify the polymers texture such as film, fibers, fabrics
and molding powders.
The process of grafting can be expressed as follow; suppose the polymer A is exposed
to γ-rays, thus the active free radical sites A* created randomly along the polymer
backbone chain, this free radical initiate a free radical on the monomer B then
undergoes grafting polymerization at that active sites. The extension of the attached
monomer B upon the base polymer A is termed as the degree of grafting DOG which
refers to the mass of the grafted polymer as a percentage of the mass of the original
base polymer. Such process can be expressed in schematic Figure 2.6.
Figure 2.6 shows the schemes for grafting process for polymer A with monomer
B using γ-radiation.
23
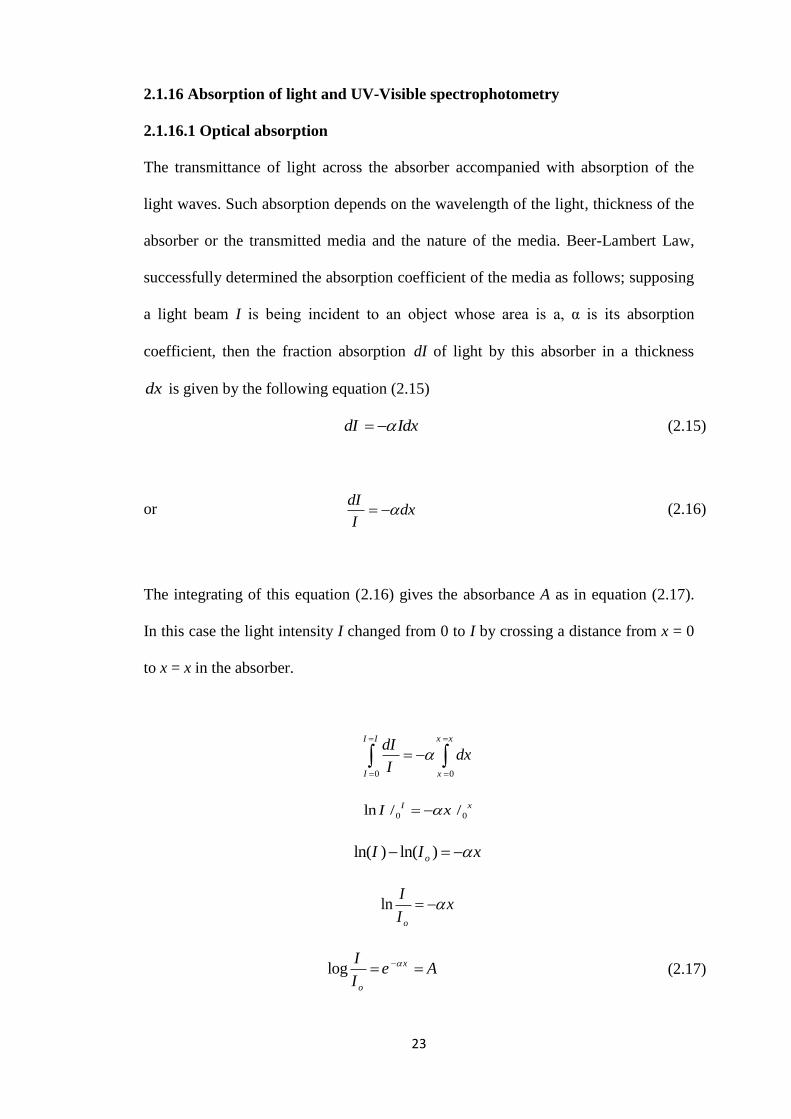
2.1.16 Absorption of light and UV-Visible spectrophotometry
2.1.16.1 Optical absorption
The transmittance of light across the absorber accompanied with absorption of the
light waves. Such absorption depends on the wavelength of the light, thickness of the
absorber or the transmitted media and the nature of the media. Beer-Lambert Law,
successfully determined the absorption coefficient of the media as follows; supposing
a light beam I is being incident to an object whose area is a, α is its absorption
coefficient, then the fraction absorption dI of light by this absorber in a thickness
dx is given by the following equation (2.15)
dI Idx (2.15)
or dI
dxI
(2.16)
The integrating of this equation (2.16) gives the absorbance A as in equation (2.17).
In this case the light intensity I changed from 0 to I by crossing a distance from x = 0
to x = x in the absorber.
0 0
I I x x
I x
dIdx
I
0 0ln / /I xI x
ln( ) ln( )oI I x
lno
Ix
I
log x
o
Ie A
I
(2.17)

24
From equation (2.17) of absorbance A, the absorption coefficient α can be deduced in
equation (2.18).
1
logo
I
Ix
e
e A
x
(2.18)
As the value of AI
I
0
log and e is 2.303, then the absorption coefficient can be
given by equation (2.19)
2.303 A
x
(2.19)
Where x is the distance crossed by the light or can be the sample thickness in case of
UV-visible spectroscopy. The corrected absorption value known as the molar
absorptivity (ε) is used for the comparison between different spectra of different
compounds and can be expressed by the following equation:
A
cl (2.20)
Where A = absorbance, c = sample concentration in moles/liter and l = path length
through the cuvette in cm.
2.1.16.2 Mechanism of absorption process
The absorption processes of microwaves in polymer, generally accompanied with
energy reduction in the transition wave. Such reduction is due to the optical
absorption constant of the media which come in the range of 105 – 10
6 cm
-1
(Richard, 1988). The variation of the absorption on the transition involves a photon
only (direct transition), or that involves both a photon and a phonon (indirect

25
transition). As the photon energy drops below the band gap energy, the absorption
constant decreases by many orders of magnitude.
The energy levels are created if imperfections are present in the polymers. They lie in
forbidden gap. At energy less than the band gap energy it is still possible to excite
electrons to the conduction band from imperfection levels occupied by electrons.
Electrons also can be excited from the valence band to unoccupied imperfection
levels. Each process will give rise to optical absorption. When the photon energy is
less than the energy required to make a transition from the imperfection level to one
of the bands, this absorption in turn comes to an end. The corresponding absorption
constant may have values as high as 103 cm
-1 for very high imperfection densities,
but in general is considerably less. Absorption of photons by free carriers, cause a
transition to higher energy states within the same band or to higher bands. This
process can occur over a wide range of photon energies. It involves the absorption of
both photons and phonons since both energy and k must be changed in the transition.
There is also an optical absorption due to free carriers acting collectively as a kind of
electron gas, which is known as plasma resonance absorption.
2.1.16.3 Absorption edge
The transition of electrons between the valence and conduction bands in the polymers
start at the absorption edge which refer to the minimum or threshold energy at which
the absorption coefficient started. The transition is called direct if it is extreme occur
due to direct absorption of the incident photonic energy, or can be indirect transition
in case of phonon assisted initiation. Mostly all the materials have discriminated
absorption edge and the energy gapEg, which related to their chemical properties,
hence such criteria can be utilized as a fingerprint in materials characterization (Tauc,
1974).

26
The absorption constant α(ν) within the range of ~1 cm-1
up to 104 cm
-1, is described
by the following equation (2.21)
0( ) exp
e
h
E
(2.21)
Where, the energy (Ee) is the absorption edge in eV.
2.1.16.4 Optical band gap
At high enough absorption levels (α 104 cm
-1), the absorption constant v)
commonly take place as frequency dependence from which the band gap energy
between the conductive band CB and the valence band VB can be deduced,
depending on Mott and Davis (1979) which is applicable for UV-spectrum. It
correlates between energy band gap Eg and the absorption coefficient α(ν)hν of the
composites as in the following equation (2.22)
( ) ( )m
gh B h E (2.22)
Where hν is the energy of the incidence photon, h is the Planck constant, Eg is the
optical band gap energy, B is a constant known as the disorder parameter which is
dependent on composite composition and independent to photon energy. Parameter m
is the power coefficient with the value that determined by the type of possible
electronic transitions, such as direct allowed and indirect allowed (Tauc, 1974). The
direct transition is the transition of electron from the band i via k band to the final
conduction band f by the transition-dipole moments and the electric fields at the
surface, while the indirect transition the incident photon is absorbed in the substrate
followed by scattering of a photo-excited electron trapped into the intermediate state k
band then transfer to final band f, as being illustrated in Figure (2.7). All the electrons
of the valence band can connect to the empty states of the conduction band by

27
indirect transition process; however phonons, could also participate in the transition
process (Pankove, 1971).
Figure 2.7 Schematically illustrates the sequence of direct electronic
transitions from the initial state i to the final state f, or by an indirect process in
which the intermediate state k is populated by scattering and relaxation of
‘‘hot’’ electrons, which are photo-excited in the substrate.
2.1.16. 5 UV-Visible absorption spectrophotoscopy
The following Figure (1.8) explains the UV-visible spectroscopy principle, in which a
beam of light from a UV-visible light source is separated into its component
wavelengths by a prism or diffraction grating. Each monochromatic (single
wavelength) beam in turn is split into two equal intensity beams by a half-mirrored
device. One beam for the sample (colored magenta), passes through a small
transparent container (cuvette) as a sample chamber. The other beam, for reference
(colored blue), passes through an identical cuvette. The intensities of these light
beams are then measured by electronic detectors and compared. The intensity of the

28
reference beam, with no light absorption, is defined as I0 and the intensity of the
sample beam is defined as I. Over a short period of time, the spectrometer
automatically scans all the component wavelengths in the manner described. The UV
region scanned is normally from 200 to 400 nm, and the visible portion is from 400 to
800 nm (Whiffen, 1971).
If the sample compound does not absorb light of a given wavelength then I = I0.
However, if the sample compound absorbs light then I is less than I0, and this
difference may be plotted on a graph versus wavelength, as shown on the right.
Absorption may be presented as transmittance (T = I/I0) or absorbance (A= log I0/I). If
no absorption has occurred, T = 1.0 and A= 0. Most spectrometers display absorbance
on the vertical axis, and the commonly observed range is from 0 (100%
transmittance) to 2 (1% transmittance). The wavelength of maximum absorbance is a
characteristic value, designated as λ max.
Different compounds have very different absorbance. The reference absorption
intensity for the system is based on a completely transparent standard compound
(non-absorbing). The most commonly used compounds are water, ethanol, hexane
and cyclohexane. The compounds with double or triple bonds and heavy atoms are
generally avoided, because the absorbance of a sample will be proportional to its
molar concentration in the sample cuvette.

29
Figure 2.8 Schemes for UV-visible spectroscopy principle and steps of taking
the spectra.

30
2.2 previous studies
The following part deals with the previous studies concerning the utilization of PVA
hybridized with silver nitrate (AgNO3), in the field of radiotherapy as radiation
detector and dosimeter, in these view considerable studies have been introduced:
Karthikeyan, (2005) has been prepared Ag–Polyvinyl alcohol (Ag–PVA) films, and
the influence of annealing time upon the variation ofcluster size has been analyzed
using optical absorption, emission and Fourier-transform infrared (FTIR) spectra.
Measurements of optical spectra show that the surface Plasmon resonance lays
around 420 nm, and confirm the growth of Ag clusters. Measurements of FTIR
spectra were carried out to identify the role of chemical interface damping
whichinfluenced the broadening of the absorption band. The emission peak was
observed at 540nm for clusters which wereannealed for 1 min as well as 2 min.
The optical absorption spectra of Ag–PVA films annealed at 120 oC at different time
duration as shown in Fig. (2.9). All the spectra show the presence of a peak around
420 nm; this peak is characteristic of silver’s SPR. While increasing the annealing
time duration the peak intensity also increases, and correspondingly the FWHM
becomes lesser. This clearly indicates that while increasing the time duration the
mean size of Ag cluster formed also increases. At the same time, a red shift of the
peak maximum and a noticeable broadening have been observed for the 10, 15 and 30
min annealed films.

31
Figure 2.9 optical absorption spectra of Ag-PVA film annealed at 120C0at
different duration.
Aleksandra et al, (2007) were prepared the Ag-PVA nanocomposites with different
contents of inorganic phase by reduction of Ag+ ions in aqueous PVA solution by
gamma irradiation followed by solvent evaporation. Optical properties of the
colloidal solutions and the nanocomposite films were investigated using UV–vis
spectroscopy, and the result showed an absorption beak at 420 nm corresponding to
PVA/Ag film after irradiation with three difference particle size, as shown in Fig.
(2.10):

32
Fig.2.10 Absorption spectra of primary Ag colloid(a), corresponding Ag-PVA
nanocomposite film (b), and colloid obtained after dissoluation of Ag-PVA
nanocomposite film(c).
Structural characterization of the Ag nanoparticles was performed by SEM and XRD.
Interaction of the Ag nanoparticles with polymer matrix and the heat resistance of the
nanocomposites were followed by IR spectroscopy and differential scanning
calorimetry (DSC) analysis. IR spectra indicated that Ag nanofiller interact with PVA
chain over OH groups. The changes of heat resistance upon the increase of the
content of inorganic phase are correlated to the adsorption of polymer chains on the
surface of Ag nanoparticles.
Zidan, (1999) prepared Polyvinyl alcohol films, with various AgNO3 filler mass
fractions ( ≤ 5%), The structural and morphological variations, due to filling and UV-
irradiation, were investigated using differential scanning calorimetry (DSC), UV/VIS
optical absorption spectroscopy, X-ray diffraction and scanning electron microscopy
(SEM). Two different crystalline phases (one is due to the PVA matrix and the other

33
is attributed to the PVA/Ag+ chelates) were detected besides the PVA amorphous
phase, for the non-irradiated and the UV-irradiated (for 2, 4 and 6 h) films as shown
in Figures (2.11), (2.4) and (2.12).
Figure.2.11 the UV/VIS optical absorption spectra after IT 2 h for film of AgNo3
filled with PVA system.
Figure.2.12 the UV/VIS optical absorption spectra after IT 4 h for film of AgNo3
filled with PVA system.

34
Figure.2.13 the UV/VIS optical absorption spectra after IT 6 h for film of AgNo3
filled with PVA system.
The PVA–Ag+ chelates disappeared at 2 h UV-irradiation. It is implied that the
structural morphology changes vastly due to the changes in filling level and/or UV-
irradiation time. The observed morphological patterns were discussed.
Other study carried out by Kron et al, (1996), in which they said: that if LiF TLD
chips of three different thicknesses (0.230, 0.099 and 0.038 g.cm-2) are exposed in
the same radiation field it is possible to extrapolate their dose reading to an
infinitesimal thin detector size. They used this TLD extrapolation technique to
determine the entrance and exit surface dose on a solid water phantom in various
photon beams of radiotherapy treatment units. Both build-up and build-down effect
could be assessed in dose measurements for telecaesium and megavoltage X- ray
beams from a medical linear accelerator while a rapid dose fall-off was observed at
the phantom surface in a 120 kVp beam due to electron contamination from the lead
glass treatment cone. One of the major advantages of the TLD extrapolation

35
technique is that the dose can be interpolated and extrapolated for all vital structures
within the first millimeter of the skin.
Mutahir et al, (2011), stated the International Commission of Radiological Units
(ICRU) sets a tolerance of ±5 % on dose delivery, with more recent data limiting the
overall tolerances to ±3 %. One of the best methods for accurate dose delivery and
quality check is in vivo dosimetry, while radiotherapy is performed. The present
study was carried out to test the applicability of diodes for performing in vivo
entrance dose measurements in external photon beam radiotherapy for pelvic tumors
and its implementation as quality assurance tool in radiotherapy. During November
2007 to December 2009, in 300 patients who received pelvic radiotherapy on a
multileaf-collimator-assisted linear accelerator, the central axis dose was measured by
in vivo dosimetry by p-Si diodes. Entrance dose measurements were taken by diodes
and were compared with the prescribed dose. Totally 1000 calculations were
performed. The mean and standard deviation between measured and prescribed dose
was 1.26 ± 2.8 %. In 938 measurements (93.8 %), the deviation was <5 % (1.36 ±
2.9%); in 62 measurements (6.2 %) the mean deviation was >5 % (5.51 ± 2.3 %).
Larger variations were seen in lateral and oblique fields more than anteroposterior
fields. For larger deviations, patients and diode positional errors were found to be the
common factors alone or in combination with other factors. After additional
corrections, repeated measurements were achieved within tolerance levels. This study
showed that diode-detector-based in vivo dosimetry was simple, cost–effective,
provides quick results and can serve as a useful quality assurance tool in radiotherapy.
The data acquired in the present study can be used for evaluating output calibration of
therapy machine, precision of calculations, effectiveness of treatment plan and patient
setup.

36
Farhat et al, (2011) were measured the entrance and exit dose for patient treated for
head and neck tumors. The target absorbed dose was determined from the exit and
entrance dose measurement. Twenty patients were evaluated. The results were
compared to the calculated values and the midline dose was determinate and
compared with the prescribed dose. 80 entrance doses and 80 exit doses
measurements were performed. The average difference from expected values was
1.93% for entrance dose (SD 1.92%) and 0.34% for exit dose (SD 4.1%). The target
absorbed dose differed from prescribed dose values by 2.94% (1.97%) for the results
using the Noël method and 3.34% (SD: 2.29%) with the Rizzotti method. The total
uncertainty budget in the measurement of the absorbed entrance and exit dose with
diode, including diode reading, correction factors and diode calibration coefficient, is
determined as 3.02% . Simple in vivo dose measurements are an additional safeguard
against major setup errors and calculation or transcription errors that were missed
during pre-treatment chart check.
Tung et al, (2004) they carried out the following measurements using Diode and
thermo-luminescencedosimeter (TLD) for linear accelerators of 6 MV photon beams.
ESTRO in vivo dosimetry protocols were followed in the determination of midline
doses from measurements of entrance and exit doses. Of the fields monitored by
diodes, the maximum absolute deviation of measured midline doses from planned
target doses was 8%, with the mean value and the standard deviation of -1.0and 2.7%.
If planned target doses were calculated using radiological water equivalent
thicknesses rather than patient geometric thicknesses, the maximum absolute
deviation dropped to 4%, with the mean and the standard deviation of 0.7 and 1.8%.
For in vivo dosimetry monitored by TLDs, the shift in mean dose remained small but
the statistical precision became poor.

37
Most relevant study was introduced by Mohammed et al, (2011) they said that for the
wider interested applications of polymer hybridized metal nanoparticles composites,
poly vinyl-alcohol /silver nanoparticles composites in a form of a film was prepared
by in situ irradiation doping technique up to 50 kGy. The effect of radiation upon the
composites resulted in reducing the silver ions into black metallic silver, so the
general film color changed from white to golden-yellow then black color at 50 kGy as
shown in Figures (2.13) and (2.14):
Figure 2.14 shows the color change of PANI nanoparticles polymerized by
radiation doping at different doses in PVA blend for 28.6%-AniHCl monomer.
The picture of the un-irradiated film was taken on a white background.
10.0 kGy
00.0 kGy
20.0 kGy
30.0 kGy
50.0 kGy
40.0 kGy
38
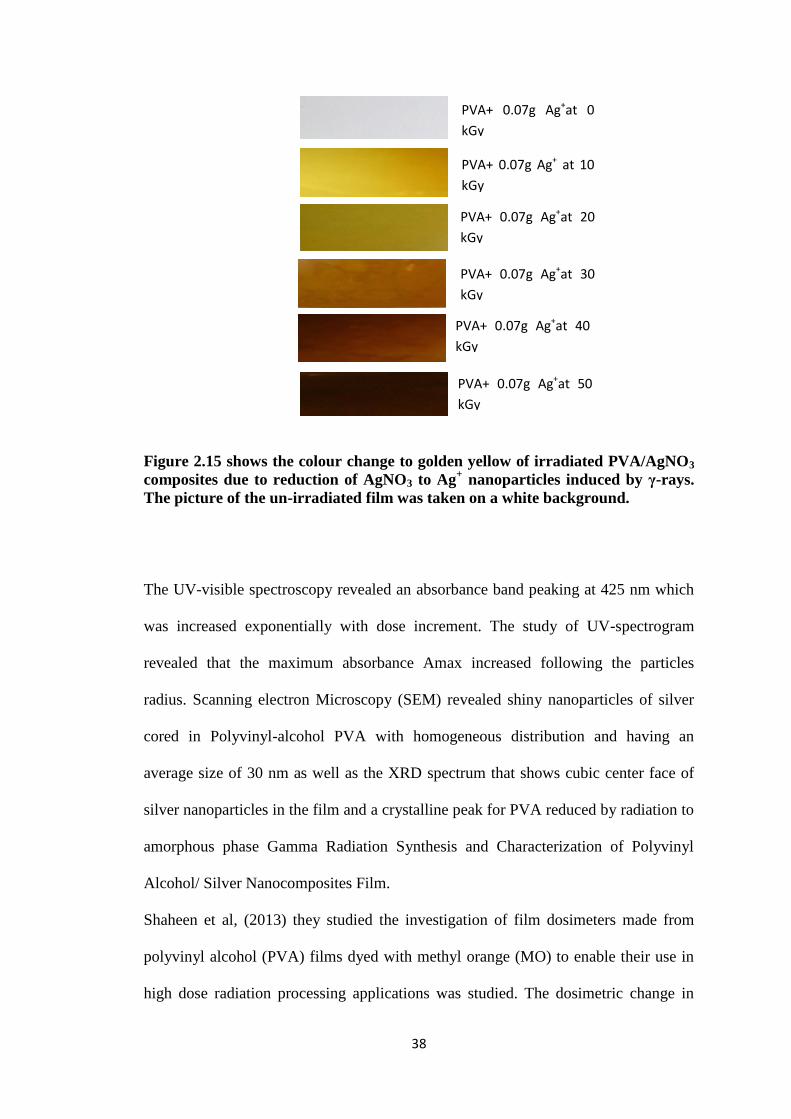
Figure 2.15 shows the colour change to golden yellow of irradiated PVA/AgNO3
composites due to reduction of AgNO3 to Ag+ nanoparticles induced by γ-rays.
The picture of the un-irradiated film was taken on a white background.
The UV-visible spectroscopy revealed an absorbance band peaking at 425 nm which
was increased exponentially with dose increment. The study of UV-spectrogram
revealed that the maximum absorbance Amax increased following the particles
radius. Scanning electron Microscopy (SEM) revealed shiny nanoparticles of silver
cored in Polyvinyl-alcohol PVA with homogeneous distribution and having an
average size of 30 nm as well as the XRD spectrum that shows cubic center face of
silver nanoparticles in the film and a crystalline peak for PVA reduced by radiation to
amorphous phase Gamma Radiation Synthesis and Characterization of Polyvinyl
Alcohol/ Silver Nanocomposites Film.
Shaheen et al, (2013) they studied the investigation of film dosimeters made from
polyvinyl alcohol (PVA) films dyed with methyl orange (MO) to enable their use in
high dose radiation processing applications was studied. The dosimetric change in
PVA+ 0.07g Ag+ at 10
kGy
PVA+ 0.07g Ag+at 0
kGy
PVA+ 0.07g Ag+at 20
kGy
PVA+ 0.07g Ag+at 30
kGy
PVA+ 0.07g Ag+at 40
kGy
PVA+ 0.07g Ag+at 50
kGy

39
these films at pre and post irradiation was studied spectrophotometrically. Radiolytic
bleaching was observed in PVA aided films exposed with Cs137 -source in dose
range of 100-200kGy. The effects of pH, dye concentration and film thickness on the
radiation response of the film dosimeters were discussed. The stability of MO-PVA
films before and after exposure of radiation was also examined at ambient
temperature and was found to be higher for long times at pre and post irradiation
stages.
They found that the optical absorption spectra of un irradiated and irradiated films
were measured in the wavelength range of 300-800nm using a UV/VIS
spectrophotometer. The absorption spectra of these un irradiated films show a main
absorption band in the visible region peaking at 488nm (max) for MO-PVA as
shown in the Fig (2.15).
Figure 2.16 shows absorption spectra of unirradiated and irradiated MO-PVA
films to different absorbed doses.

40
Mohammad et al, (2013) they studied the effects of gamma irradiation on absorption
properties of Carbol Fuchsin (CF) with crystal violet dyed Polyvinyl Alcohol (PVA)
blended for possible use in dosimetry and measurement of radiation dose in gamma
rays have been studied using UV-Visible spectrophotometer method. The films were
irradiated to accumulated doses from (10 to 70) Gy using Co60 gamma ray source at
a constant dose rate. The absorption spectra were measured using UV-Visible
Spectrophotometer in the wave length range (200 to 900) nm, resulting in a decrease
of the absorbance at 560 nm band peak with increasing dose. Regarding to the IR
transmittance it’s appearing that for the samples with crystal violet the band at 1716
divided two small bands which become obvious for the irradiated one which indicate
also the effect of gamma doses. In this study, the less Full Width at Half Maximum
(FWHM), the better is the dosimeter. The FWHM due to sharpness in the band peak
and this is useful for determine the fine dosimeter.
In this study, the poly vinyl alcohol based films containing carbolfuchsin and crystal
violet dyes after irradiation with gamma ray that radiation induced bletching of these
films can be used for dosimetry when this films ex- posed to accumulated doses from
(10 to 70 Gy) in wave length range (200 to 900) showed an absorption band at 560
nm. The fitting of the dose-response curves y = ax + b resulted in a linear relationship
between dose and net absorbance change. The full width at half maximum (FWHM)
in two films which decreased with increasing doses due to sharpness in the band
peak. The FWHM can be used to determine any films exposed to high doses and it is
used for determining the better dosimeter. Smaller FWHM value resolution enables
the system to more clearly separate the peaks within a spectrum.
Ramnani et al, (2007) they have been synthesized Silver clusters on SiO2 support
using Co60
gamma radiation, the irradiation of Ag+ in aqueous suspension of SiO2 in
the presence of 0.2 moldm_3 isopropanol resulted in the formation of yellow

41
suspension. The absorption spectrum showed a band at 408nm corresponding to
typical characteristic surface plasmon resonance of Ag nanoparticles. The effect of
Ag+ concentration on the formation of Ag cluster indicated that the size of Ag
clusters vary with Ag+ concentration, which was varied from 4-10-4 to 5-10-3
moldm-3. The results showed that Ag clusters are stable in the pH range of 2–9 and
start agglomerating in the alkaline region at pH above 9. The effect of radiation dose
rate and ratio of Ag+/SiO2 on the formation of Ag clusters have also been
investigated. The prepared clusters have been characterized by X-ray diffraction
(XRD) and transmission electron microscopy (TEM), which showed theparticle size
of Ag clusters to be in the range of 10–20 nm, as shown in Figure (2.16).
Figure.2.17 shows the gamma radiation – induced formation of Ag on SiO2 at
various radiationdoses: (a) 0 kGy, (b) 0.12 kGy, ( c) 0.24 kGy, (d) 0.36kGy, (e)
0.54 kGy, (f) 0.66 kGy, and (g) 0.78 kGy.
Zidan, (2002), prepared PVA films with various filling levels of CrF3 and MnCl2.
ESR and UV/VIS optical analysis were used to shed more light on the structural
modification that occur due to filling with different levels and/or UVirradiation. The
42
ESR analysis revealed that the spin configuration of CrF3, MnCl2, and CoBr2-filled
PVA are different. The filling level dependence of ESR parameters was discussed.
The UV-VIS spectral analysis for pure PVA shows absorption bands at 265 and 280
nm, which were assigned to the presence of carbonyl groups. The addition of CrF3
led to the appearance of another bands at 418 and 596 nm. The filling level and/or
UV irradiation have no effect on the position of absorption bands but the intensity of
these bands has been changed. The addition of MnCl2 led to a new band at about 350
nm due to charge transfer transition. The ligand field parameters and optical energy
gaps can be calculated and discussed. The results of optical and ESR analysis
indicated that the Cr3 - or Mn2are present in its octahedral symmetrical form within
the PVA Matrix. SEM micrographs of CrF3 filled PVA is discussed.
Ultraviolet-Visible (UV/VIS) absorption spectra of unirradiated and irradiated
samples were carried out in the wavelength range from 200–900 nm as shown in Fig.
(2.17) and (2.18).

43
Figure. 2.18 Shows the UV/VIS absorption spectra for films of CrF3- filled PVA
system before UV- irradiation.
Figure. 2.19 shows the UV/VIS absorption spectra for films of CrF3- filled PVA
system after UV- irradiation.

44
Chapter Three

45
Chapter three
Methodology 3.1 Tools and equipment
3.1.1 Polyvinyl alcohol (PVA)
PVA is one of the important polymer binder and available in the form of powders,
fibers and films. It can be obtained from poly (vinyl acetate) (PVAc) by esterification
and has distinct crystallinity. The polymer has intermolecular chin of 2.5 Ǻ and
consists of 1,3 glycol linkages, in which all hydroxyl groups are arranged along the
same side of the chain (Sakurada, 1985). These in turn account for the mechanical
strength and strong interactions between different chains. The unit cell of PVA
consists of two monomer units of vinyl alcohol (CH2CHOH) (Bunn, 1948) as in
Figure 3.1.
Figure 3.1 Chemical structure of poly(vinyl alcohol) (PVA) monomer.
PVA is glassy and does not dissolve in water at room temperature unless the ester
groups of PVAc are cleaved to a hydroxyl content of 87-89%. It dissolves easily at
temperature above glass-transition temperature, Tg ranging from 60 to 90 oC. It is
non-ionic vinyl polymer, tough with film forming capacity due to hydrogen bonding
(Ravve, 2000), fibres and tubes forming capability and highly resistant to
hydrocarbon solvents (Molyneux, 1983). It is highly resistive to electrical
conductivity with low dielectric loss. Its electrical conductivity and charge storage
capability can be significantly influence by doping with suitable impurities (Nagaraja,
et al., 2002). Due to biocompatibility, PVA has been used in medical devises,
materials for drug delivery system, carrier for cell signaling, sizing, adhesives,
emulsification and bio-separation membranes (Yano, et al., 2003).

46
3.1.2 Silver Nitrate (AgNO3):
Silver nitrate is a chemical compound with a chemical formula AgNO3 shown in
Figure 3.2. This nitrate of silver is the light sensitive ingredient in photographic film
and is a corrosive compound. Soluble silver salts tend to be very toxic to bacteria and
other lower life species. The compound notably stains the skin giving a blackening
colour which is made visible after exposure to sunlight. Silver nitrate is one of the
significant compounds in the field of industries due to its potential characteristics
such as wider response to electromagnetic radiations i.e. optical properties in addition
to electronic, magnetic and catalysis (Wang and Toshima, 1997). It has been used in
wider applications as conductive ink, thick film pastes, adhesive for electronic
compounds (Lin and Wang, 1996) and photonic and photographic applications (Jin et
al., 2001). The characteristics of silver nitrate are has a molecular weight of 169.87,
boiling point 444 oC, melting point 212
oC as crystal structure rhombic, decomposed
by heat to give Ag, NO2 and O2.
Figure 3.2 The chemical structure of the silver nitrate compound.

47
3.1.3 60Co teletherapy unit:
3.1.4 The source
The 60
Co source is produced by irradiating ordinary stable 59
Co with neutron in a
reactor. The nuclear reaction can be represented by 59
Co (n,γ) 60
Co.
The 60
Co source, usually in the form of a solid cylinder disc or pallets, is contained
inside stainless capsule and sealed by welding. The double welded seal is necessary to
prevent any leakage of the radioactive material. The 60
Co source decay to 60
Ni with
the emission of β particles (Emax = 0.32 Mev) and two photons per disintegration of
energies 1.17 and 1.33 Mev, these two photons constitute the useful treatment beam.
The β particles are absorbed in the cobalt metal and the stainless-steel capsules
resulting in the emission of bremstrung x-ray and small amount of characteristic x-
ray.
A typical teletherapy60
Co source is a cylinder of diameter ranging from 1.0 to 2.0
cmand is positioned in the cobalt unit with its circular end facing the patient. The fact
thatthe radiation source is not a point source complicates the beam geometry and
gives rise towhat is known as the geometric penumbra.
3.1.5 Source Housing
The housing for the source is called the source head (Fig. 3.3). It consists of a steel
shell filled with lead for shielding purposes and a device for bringing the source in
front of anopening in the head from which the useful beam emerges. Also, a heavy
metal alloy sleeve is provided to form an additional primary shield whenthe source is
in the of position. A number of methods have been developed for moving the source
from the off positionto the on position. These methods have been discussed in detail
by Johns and Cunningham(10). It will suffice here to mention briefly four different
mechanisms: (a) the sourcemounted on a rotating wheel inside the source head to
carry the source from the offposition to the on position; (b) the source mounted on a
heavy metal drawer plus its abilityto slide horizontally through a hole running
through the source head-in the ON position the source faces the aperture for the
treatment beam and in the OFF position the source moves to its shielded location and
a light source mounted on the same drawer occupies theon position of the source; (c)
mercury is allowed to flow into the space immediately belowthe source to shut off the

48
beam; and (d) the source is fixed in front of the aperture and thebeam can be turned
on and off by a shutter consisting of heavy metal jaws. All of the above mechanisms
incorporate a safety feature in which the source is returned automatically tothe off
position in case of a power failure.
Figure. 3.3 shown the cobalt-60 machine that used to irradiate the films
3.1.6 Beam Collimation
A collimator system is designed to vary the size and shape of the beam to meet the
individualtreatment requirements. The simplest form of a continuously adjustable
diaphragmconsists of two pairs of heavy metal blocks. Each pair can be moved
independently toobtain a square or a rectangle-shaped field. Some collimators are
multivane type, i.e.,multiple blocks to control the size of the beam.
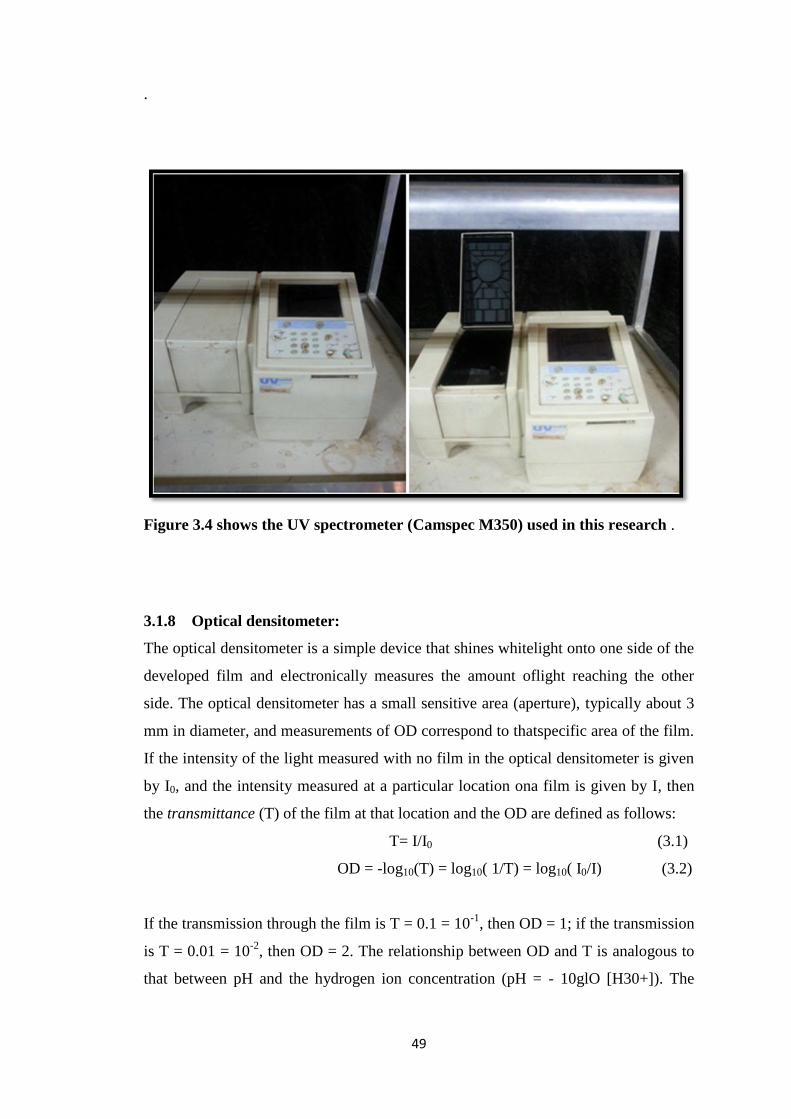
3.1.7 UV-Visible spectroscopy:
The UV visible spectroscopy version M350 Double Beam Scanning
Spectrophotometer and model (Camspec M350) used in this research as shown in
Figure (3.4), has a High performance, double beam optical system, Ultra stable,
simultaneous reference subtraction, Range: 190 to 1100nm, and ability to move
filter, lamp change points Comprehensive scanning, concentration and kinetics
modes and Multi-component analysis - up to 8 components
49
.
Figure 3.4 shows the UV spectrometer (Camspec M350) used in this research .
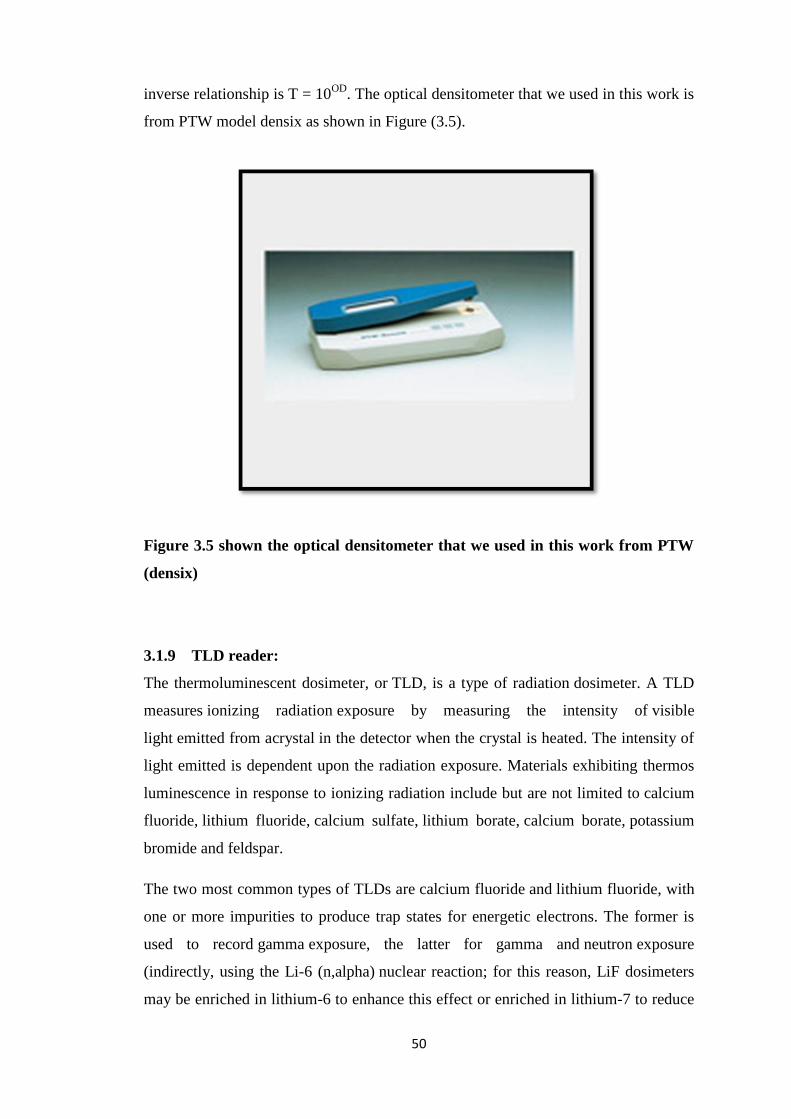
3.1.8 Optical densitometer:
The optical densitometer is a simple device that shines whitelight onto one side of the
developed film and electronically measures the amount oflight reaching the other
side. The optical densitometer has a small sensitive area (aperture), typically about 3
mm in diameter, and measurements of OD correspond to thatspecific area of the film.
If the intensity of the light measured with no film in the optical densitometer is given
by I0, and the intensity measured at a particular location ona film is given by I, then
the transmittance (T) of the film at that location and the OD are defined as follows:
T= I/I0 (3.1)
OD = -log10(T) = log10( 1/T) = log10( I0/I) (3.2)
If the transmission through the film is T = 0.1 = 10-1
, then OD = 1; if the transmission
is T = 0.01 = 10-2
, then OD = 2. The relationship between OD and T is analogous to
that between pH and the hydrogen ion concentration (pH = - 10glO [H30+]). The
50
inverse relationship is T = 10OD
. The optical densitometer that we used in this work is
from PTW model densix as shown in Figure (3.5).
Figure 3.5 shown the optical densitometer that we used in this work from PTW
(densix)
3.1.9 TLD reader:
The thermoluminescent dosimeter, or TLD, is a type of radiation dosimeter. A TLD
measures ionizing radiation exposure by measuring the intensity of visible
light emitted from acrystal in the detector when the crystal is heated. The intensity of
light emitted is dependent upon the radiation exposure. Materials exhibiting thermos
luminescence in response to ionizing radiation include but are not limited to calcium
fluoride, lithium fluoride, calcium sulfate, lithium borate, calcium borate, potassium
bromide and feldspar.
The two most common types of TLDs are calcium fluoride and lithium fluoride, with
one or more impurities to produce trap states for energetic electrons. The former is
used to record gamma exposure, the latter for gamma and neutron exposure
(indirectly, using the Li-6 (n,alpha) nuclear reaction; for this reason, LiF dosimeters
may be enriched in lithium-6 to enhance this effect or enriched in lithium-7 to reduce

51
it). As the radiation interacts with the crystal it causes electrons in the crystal's atoms
to jump to higher energy states, where they stay trapped due to intentionally
introduced impurities (usually manganese or magnesium) in the crystal, until heated.
Heating the crystal causes the electrons to drop back to their ground state, releasing
a photon of energy equal to the energy difference between the trap state and the
ground state. The electrons can also drop back to ground state after a long period of
time; this effect is called fading and is dependent on the incident radiation energy and
intrinsic properties of the TLD material. As a result, each material possesses a limited
shelf life after which dosimetric information can no longer be obtained. This varies
from several weeks in calcium fluoride to up to two years.
It can be used both for environmental monitoring and for staff personnel in facilities
involving radiation exposure, among other applications. The TLD reader sued in this
research was PCL3 from PTW, The PCL3 is an automatic reader to measure
accumulated dose signals from thermos luminance dosimeters. Up to 80 detectors can
be evaluated in one cycle. The detectors are stored in a magazine, automatically
processed and loaded into a second magazine. TL chips of 4.5 mm diameter and 0.8
mm thickness and TL powder are preferably used, alternatively TL rods and TL films
are suitable. The detectors are heated by contact. The heating temperature of
maximum 600 °C is controlled automatically with an accuracy of better than 1%. The
measuring range covers seven decades with a linear response of up to 12 Gy using
standard TLD material and up to 500 Gy using material LiF:Mg,Ti. The background
reading is corrected automatically before starting each measurement. An internal
reference light provides for automatic calibration of the photomultiplier. The dose
reading can be calibrated in the radiation units Gy, Sv, rem or rad or in the unit C
(electrical charge). The PCL3 system is prepared for TLD evaluation under nitrogen
atmosphere. The modular cabinet design of the device presents very easy access to
the mechanical and electronic components for maintenance and repair. A computer
software for control and evaluation is included in the standard package.

52
Figure 3.6 shown the TLD reader system (PCL3 from PTW) used in this
research
3.2 Method:
3.2.1 Preparations of PVA/AgNo3 composite sample films
The PVA stock was supplied by SIGMA (Mw = 72,000 g/mol, 99 – 100%
hydrolyzed). The PVA solutions were made by dissolving 3.00 g PVA powder in 100
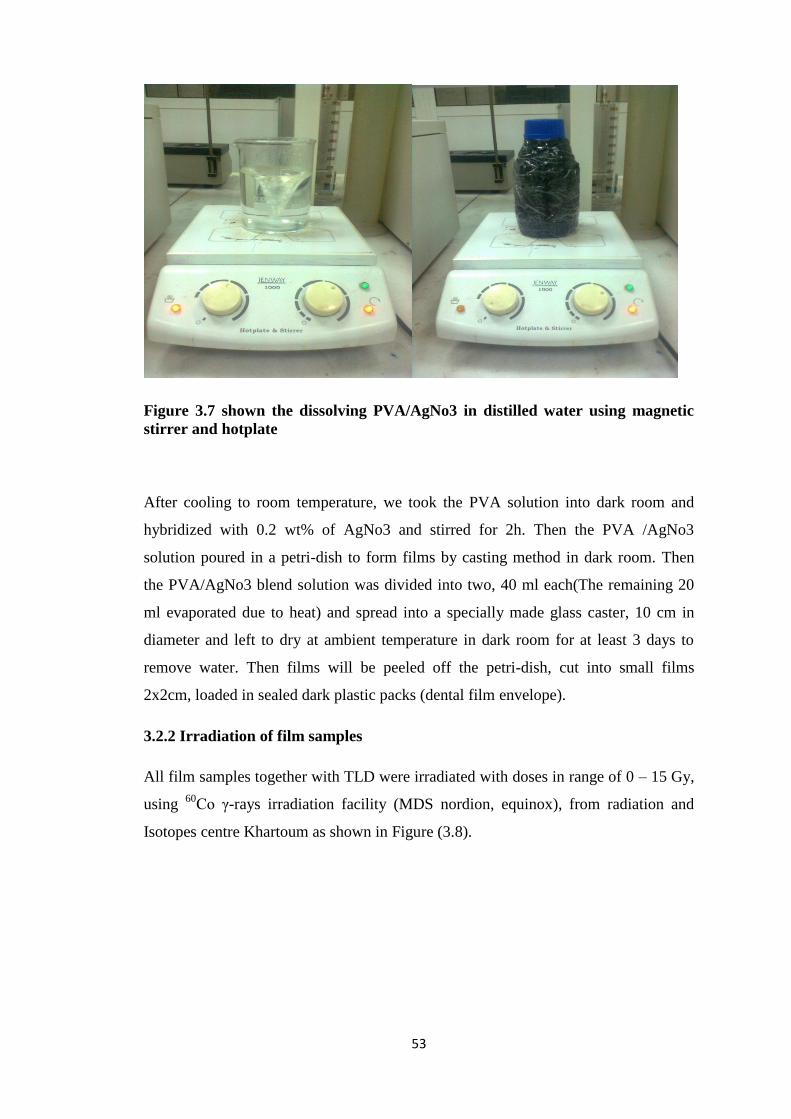
ml distilled water at temperature of 80 oC on a beaker as shown in Figure (3.7). The
solution was magnetically stirred throughout at that temperature for 3 hours and then
left to cool at room temperature.
53
Figure 3.7 shown the dissolving PVA/AgNo3 in distilled water using magnetic
stirrer and hotplate
After cooling to room temperature, we took the PVA solution into dark room and
hybridized with 0.2 wt% of AgNo3 and stirred for 2h. Then the PVA /AgNo3
solution poured in a petri-dish to form films by casting method in dark room. Then
the PVA/AgNo3 blend solution was divided into two, 40 ml each(The remaining 20
ml evaporated due to heat) and spread into a specially made glass caster, 10 cm in
diameter and left to dry at ambient temperature in dark room for at least 3 days to
remove water. Then films will be peeled off the petri-dish, cut into small films
2x2cm, loaded in sealed dark plastic packs (dental film envelope).
3.2.2 Irradiation of film samples
All film samples together with TLD were irradiated with doses in range of 0 – 15 Gy,
using 60
Co γ-rays irradiation facility (MDS nordion, equinox), from radiation and
Isotopes centre Khartoum as shown in Figure (3.8).

54
Figure 3.8 shown the films position during irradiation by 60
Co teletherapy
machine.
The samples stick at the Perspex phantom on the entrance and exit area of the
radiation beam; the diameter of the Perspex phantom is 40x40cm with 10cm
thickness, the films were embedded at right angle to direction of the radiation beam
as shown in Figure (3.8).
The dose rate on the exact date of measurement July 27, 2012 was 1.35 Gy/min. The
new dose rate was calculated based on the half-life, T1/2, of the source, i.e. the
elapsed time in which the activity of the source reduced by half, is equal to 5.27 years
by the equation (3.3)
)/( /
..
210 2ln exp TtDD (3.3)
Where .
0D is the dose rate at time t = 0. In May 2005, the dose rate of the source was
calibrated using Ferrous Sulphate dosimeter. Fricke dosimeter was then irradiated in
the calibrated beam to the doses that the solution is well characterized. The dosimeter
was read using UV-Vis spectrophotometer to measure the absorbance of FeSO4 at the
wavelength of 304 nm. The deviation of the current value to standard value is of main
interest for chamber stability and is maintained to within 1%. The deviation was
calculated using the following equation (3.4).
)25(007.01
1075.20
2
CT
ADeviation
(3.4)

55
where ∆A is the changing absorbance, T is the temperature in Celsius. Response of
Fricke dosimeter was compared to the secondary standard chamber and the
consistencies of by these methods were maintained to be less than 3%. The solution
was then sent for standardization using gamma chamber and also for calibration of
routine dosimeter. The routine check source measurements were performed every
three months in order to assess the long term stability of the reference standard
chamber.

56
Chapter Four

57
Chapter four
Results
The following chapter deals with highlighting of prepared PVA\AgNO3 composites
films and their relevant characterization after irradiation with doses in the range of
radiotherapy together with utilization in radiation dose measurement with comparison
with TLD.
4.1 Color formation change
Figure 4.1 shows the change in the measured parameters for the studied samples
due to amount of doses.
4.2 UV-visible spectrometer
0
0.5
1
1.5
2
2.5
190 240 290 340 390 440 490 540 590 640
En
tran
ce A
bso
rpti
on
(a u
)
1 Gy2 Gy
4 Gy
6 Gy
8 Gy
10 Gy
12 Gy
15 Gy
Figure 4.2 shows the UV-spectrum for PVA\AgNO3 film receiving γ-radiation
dose 1-15 Gy as entrance applied dose.
0 1 2 4 6 8 10 12 15
58
0
0.2
0.4
0.6
0.8
1
1.2
1.4
1.6
1.8
2
190 240 290 340 390 440 490 540 590
l nm
Exi
t A
bso
rpti
on (
a u
)
1 Gy
2 Gy
4 Gy
8 Gy
10 Gy
6 Gy
12 Gy
15 Gy
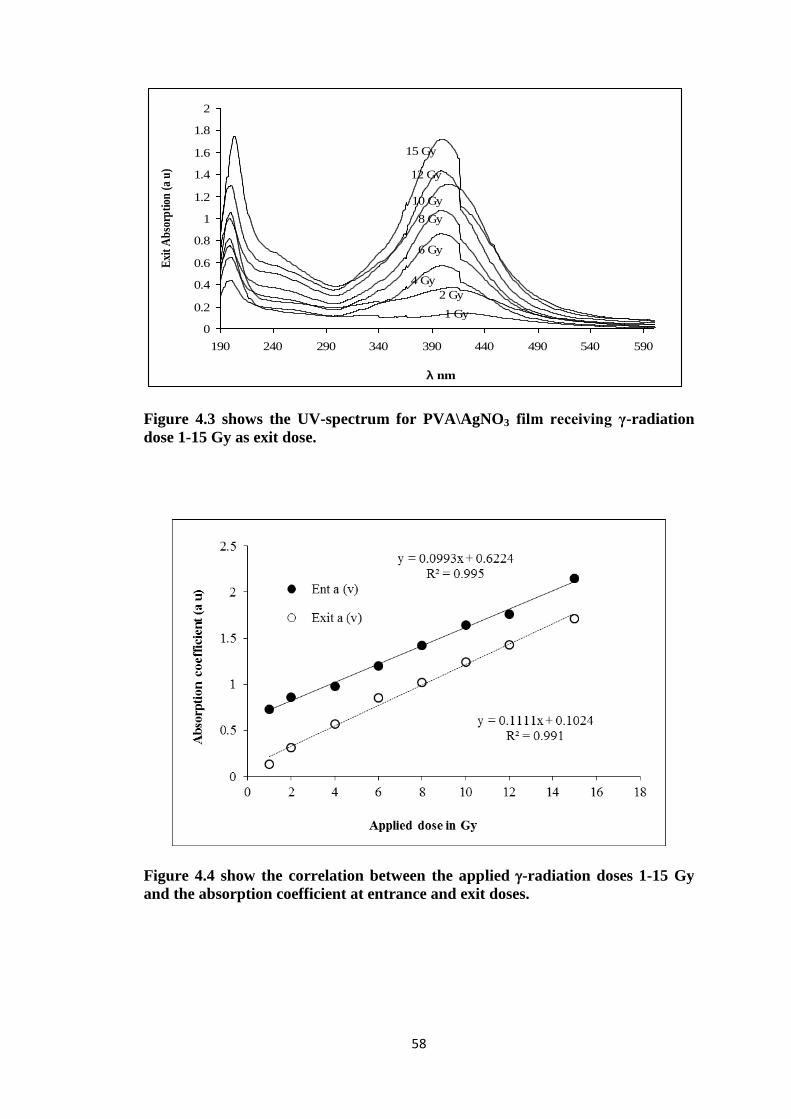
Figure 4.3 shows the UV-spectrum for PVA\AgNO3 film receiving γ-radiation
dose 1-15 Gy as exit dose.
Figure 4.4 show the correlation between the applied -radiation doses 1-15 Gy
and the absorption coefficient at entrance and exit doses.

59
4.3 Optical density:
Figure 4.5 shows the correlation between dose in Gy and the relevant optical
density in (a. u).
60
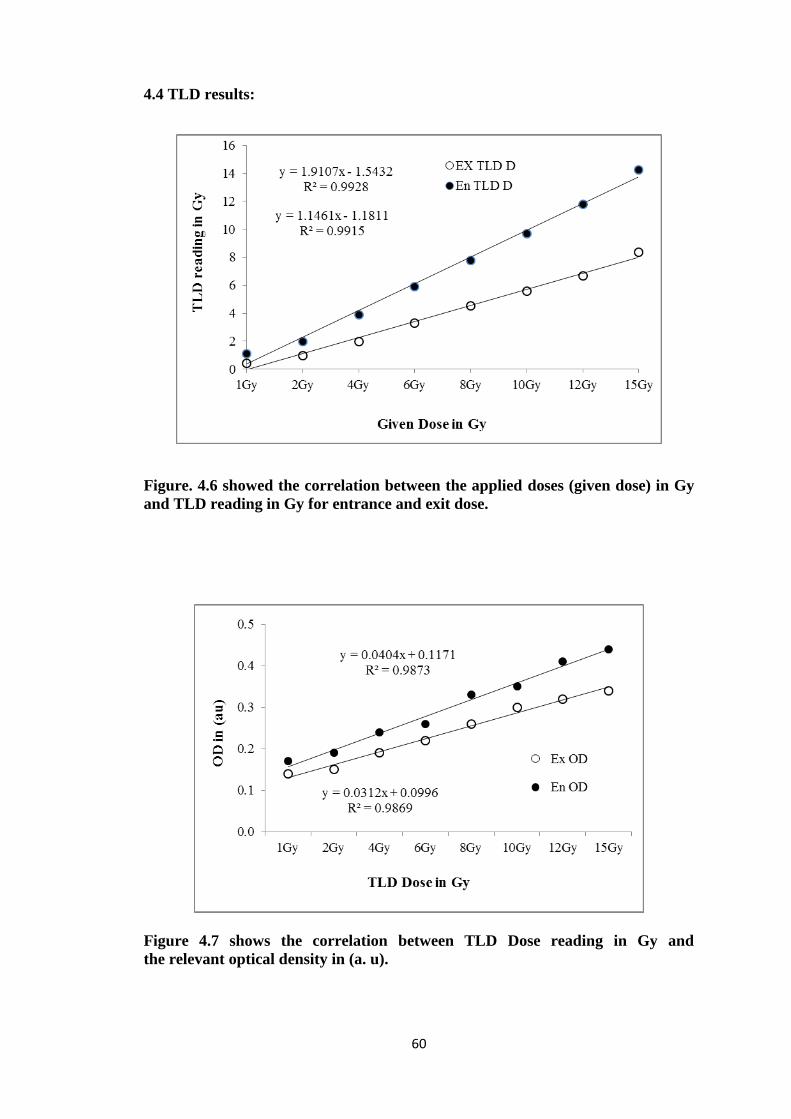
4.4 TLD results:
Figure. 4.6 showed the correlation between the applied doses (given dose) in Gy
and TLD reading in Gy for entrance and exit dose.
Figure 4.7 shows the correlation between TLD Dose reading in Gy and
the relevant optical density in (a. u).

61
Figure 4.8 shows the correlation between the absorption in Gy and the
attenuation coefficient

62
Chapter Five

63
Chapter five
Discussion, Conclusion and recommendations
5.1 Discussion
The following part is deal with result discussion as appear in chapter four:
Figure (4.1) shows the colour change of the irradiated films receiving different
radiation doses (1, 2, 4… 12 and 15 Gy). The color changed from white (un-irradiated
film) then to light yellow, golden then to brown and dark brown following the
increment of radiation dose. Such color change has been reported by (Vladimir et al,
2012) and it was due to reduction of Ag+ by the formed reducing species as hydrated
electron (eaq), hydrogen atom radical (Ho) and hydroxyl radical (OH
o). Same study
has been reported by Ramnani et al, (2007) and Mohammed et al, (2011, 2013).
Also figure 4.2 shows the UV-spectrum for PVA\AgNO3 films after irradiation with
γ-radiation receiving same doses in figure (4.1). It showed that the irradiated films
having absorption band peaking at the wavelengths 200 and 410 nm which are related
to criteria of the pure PVA and PVA/AgNO3 respectively. The absorption bands
increased following the radiation dose increment, such phenomena has been stated by
Mohammed et al and Ramnani et al. The absorptions in figure (4.2) is related to the
applied doses at the entrance of the radiation field, therefore they showed more
prominent peaks than in figure (4.3) which is related to the absorption at exit site of
radiation beam.
The figure 4.4 shows the correlation between the applied γ-radiation doses 1-15 Gy
and the absorption coefficient at λ =200 and λ =410 nm for both entrance and exit
doses. It showed that the absorption coefficient is increase linearly with increasing of
applied dose based in the following equation and

64
for entrance and exit dose respectively, where y refers to the absorption in (au) and x
refers to the dose in Gray (Gy) with a correlation coefficient ; indicating
the sensitivity of the composite film to radiation which in turn showed the possibility
of using such types of film as radiation detector and personal dosimeter after suitable
build in an electronic circuit.
Figure 4.5 shows the correlation between applied dose in Gy and the relevant optical
density in a u, for entrance and exit doses in the range of 1-15 Gy at a peak of 200
and 410nm. It shows that there is a linear proportional correlation between the two
parameters (dose in Gy and optical density) in the absorption band of 200 and 410
nm, however the relation of absorption in the range of 410 nm is strong as: ,
for entrance and exit doses ; which ascribed to the sensitivity of the silver to radiation
and further more encouraging the application of PVA/Ag film as a radiation detector
or monitoring based on optical density change. The correlation could be fitted to the
equation of the following form: and for entrance
and exit doses respectively, where y refers to optical density and x refers to the
applied dose in Gy.
The figure 4.6 shows showed the correlation between the applied doses (given dose)
in Gy and TLD reading in Gy for entrance and exit dose. It has been noticed that: the
average entrance dose was 7.06± STD 4.7 Gy while the exit dose was 3.98± STD
2.8Gy in average i.e. the average absorption between entrance and the exit was 3.08 ±
STD 1.9 Gy, such result confirming the accuracy of TLDs in measurement of the
doses at entrance and exit of the phantom.
The figure 4.7 shows the correlation between TLDs dose reading in Gy and
the relevant optical density a.u for entrance and exit doses in the range of
1.1-14.26 Gy at a peak of 200 and 410 nm. It shows that there is a linear
proportional correlation between the two parameters in the absorption band
of 200 and 410 nm however the relation of absorption in the range of 410nm
is strong as R2 =0.987 for both entrance and exit dose which ascribed to the

65
sensitivity of the silver to radiation and further more encouraging the
application of PVA/Ag film as a radiation detector or monitoring based on
optical density change. And the correlation could be fitted to the equation of
the following form: y = 0.04x + 0.117 and y= 0.031+ 0.099 for entrance and
exit dose respectively, where y refers to optical density and x refers to the
applied dose in Gy Mohammed et al, (2013) and Mohammed et al, (2011).
Such equation (entrance dose) could be utilized to take the synthesized films
as personal dosimeters in x-ray clinics at rural areas where the TLD reader is
not available, depending on the optical density change.
In figure 4.8 the correlation between the dose absorption in Gy and the
attenuation coefficient was appear . It has been deduced that: the
attenuation coefficient of the phantom determined based on the exponential
law, which is equal to 0.1 in average, such result is agreed with the
manufacture of tissue equivalent materials which is equal to 0.14, Hill et al,
(2008). And the relationship could be fitted in the following exponential
equation: y = 0.083e-0.09x
, where y refers to Attenuation coefficient and x
refers to radiation absorption in Gy.

66
5.2 conclusions
According to the analyzed results of the following experimental, the researcher could
conclude that:
The PVA\Ag composites films have been synthesized using controlled
temperature and casting method.
The irradiation of the films with gradation induces obvious color change from
white (un-irradiated film) then to light yellow, golden then to brown and dark
brown following the increment of radiation dose.
The irradiated films showed absorption band peaking at the wavelengths 200
and 410 nm and the intensity of peaks in proportional increment with radiation
dose.
The absorption coefficient was increased in linear form following the
increment of of applied dose based in the following equation
and for entrance and exit dose respectively,
where y refers to the absorption in (au) and x refers to the dose in Gray (Gy).
The correlation coefficient indicating the sensitivity of the
composite film to radiation which in turn showed the possibility of using such
types of film as radiation detectors or personal dosimeter..
There is strong correlation between the applied dose and the optical density as
, and the equation could be fitted in the following equations:
and for entrance and exit doses
respectively, where y refers to optical density and x refers to the applied dose
in Gy.
The average entrance dose was 7.06± STD 4.7 Gy while the exit dose was
3.98± STD 2.8Gy in average, and the average absorption between entrance
and the exit was 3.08 ± STD 1.9 Gy.
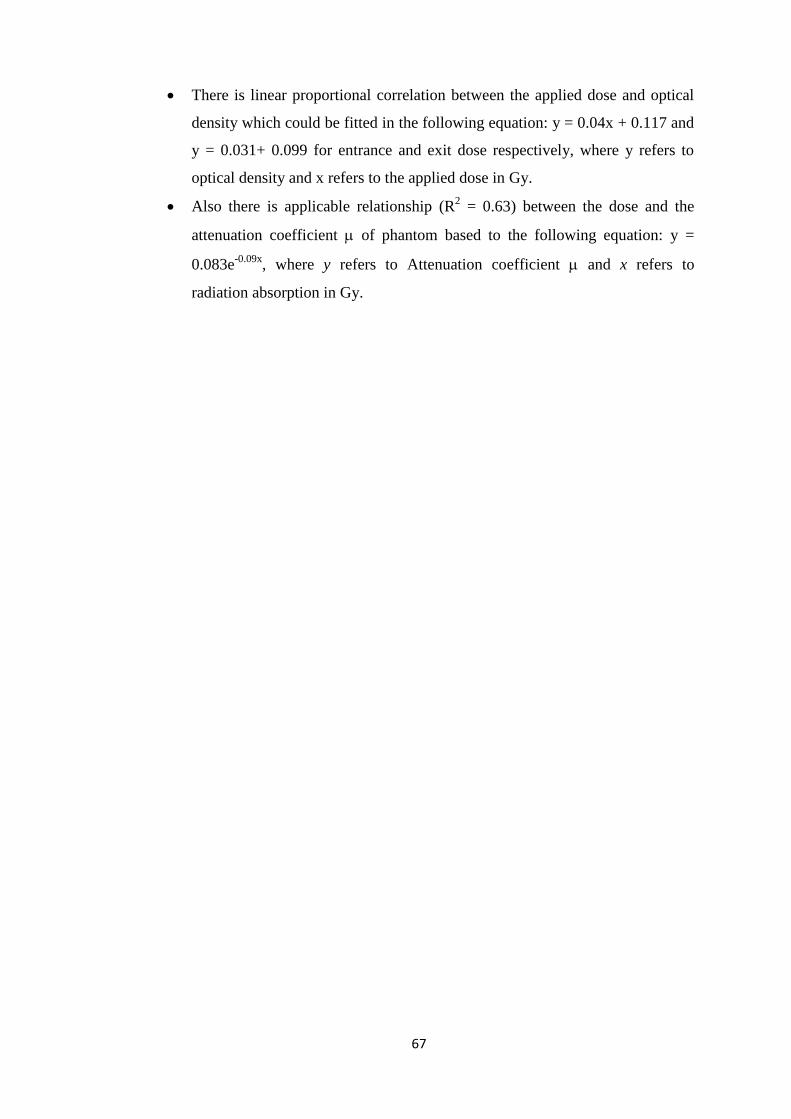
67
There is linear proportional correlation between the applied dose and optical
density which could be fitted in the following equation: y = 0.04x + 0.117 and
y = 0.031+ 0.099 for entrance and exit dose respectively, where y refers to
optical density and x refers to the applied dose in Gy.
Also there is applicable relationship (R2 = 0.63) between the dose and the
attenuation coefficient of phantom based to the following equation: y =
0.083e-0.09x
, where y refers to Attenuation coefficient and x refers to
radiation absorption in Gy.

68
5.2 Recommendations
This research could consider an initial step for measuring radiation in radiotherapy
department, accordingly we recommend by the following recommendations:
PVA/Ag composite films can be used as a local tool for in vivo dosimeter
system to measure the entrance and exit dose in radiotherapy centers in Sudan
because of its good result, fast, easy and cheap assessment tool.
Further work is needed to support this research especially for measuring
absorbed dose at deference depths in radiotherapy using PVA/Ag composite
film.
We recommend using modern techniques to synthesize the PVA/Ag film with
suitable envelope.
The color change of the films could be utilized as light filters and the surface
Plasmon resonance could be utilized as local in vivo irradiation therapy as
well as in signal magnification in case of Raman scattering.
Radiation therapy phantom could be developed from such composites
(PVA\Ag) for dose histogram, mapping, and simulation.
Further work is needed to know how the film thickness is affecting by the
radiation dose.

69
References
Aleksandra N. Krkljes, Milena T. Marinovic -Cincovic, Zorica M. Kacarevic-
Popovic, Jovan M. Nedeljkovic (2007)Radiolytic synthesis and characterization of
Ag-PVA nanocomposites, European Polymer Journal 43 (2007) 2171–2176.
Ali Z.I., Hossam M. Said and H.E. Ali. (2006), "Effect of electron beam irradiation
on the structural properties of poly(vinyl alcohol) formulations with
triphenyltetrazolium chloride dye (TTC)". Radiation Physics and Chemistry, Vol. 75
(1), Pp. 53–60.
Attix, Frank Herbert. 1986. Introduction to Radiological Physics and Radiation
Dosimetry. John Wiley & Sons, Inc. USA.
B. Karthikeyan (2005) Spectroscopic studies on Ag–polyvinyl alcoholnanocomposite
films, Physica B 364 (2005) 328–332.
Bunn, C.W. 1948. Crystal structure of polyvinyl alcohol. Nature 161: 929-933.
Carl, C. Koch. 2002. Nanostructured Materials-Processing Properties and Potential
Applications. Carl C. Koch., NY.
Choppin, G., Rydberg, J ., Liljenzin, J O. 1995. Theory and applications
radiochemistry and nuclear chemistry. 2 nd. Ed. Oxford. London: 175-180.
C. J. Tung1, H. C. Wang, S. H. Lo, J. M. Wu and C. J. Wang (2004) in vivo
dosimetry for external photon treatments of head and neck cancers by diodes and
TLDs, Radiation Protection Dosimetry (2004), Vol. 111, No. 1, pp. 45–50.
Denaro, A. R. and Jayson, G. G. 1972. Fundamental of radiation chemistry.
Butterworths, London.
Duch M. A, Ginjaume M, Chakkor H. Ortega X, Jornet N, Ribas M. (1998). Thermo-
luminescence dosimetry applied to in-vivo dose measurements for total body
irradiation techniques. Radiotherapy and oncology Vol. 47 (3), P: 319-324.

70
Evans, R. D. 1952. The Atomic Nucleus. McGraw-Hill, New York.
Farhat (2011), In vivo dosimetry for head and neck carcinoma: determination of
target absorbed dose from entrance and exit absorbed dose measurements, The
European Physical Journal Applied Physics / Volume54 / Issue 01 / April 2011.
H. M. Zidan (2002), Electron Spin Resonance and Ultraviolet Spectral Analysis of
UV-Irradiated PVA Films Filled with MnCl2 and CrF3, Physics Department, Faculty
of science at Damietta, Mansoura University, P.O. 34517, New Damietta, Egypt .
H.M. Zidan (1999), effect of AgNO3 filling and UV-irradiation on the structure and
morphology of PVA films, Polymer Testing 18 (1999) 449–461.
http://en.wikipedia.org/wiki/Thermoluminescent_dosimeter.
http://plc.cwru.edu/tutorial/enhanced/FILES/polymers/intro.htm.
http://www.camspec.co.uk/m350.htm.
http://www.ptw.de/pcl3_automatic_tld_reader.html.
ICRU (1976), Determination of absorbed dose in a patient irradiated by beams of x
or gamma rays in radiotherapy procedures. ICRU report 24, Bethesda, Maryland.
Jin R, Cao Y, Mirkin C A, Kelly K L, Schatz G. C. and Zheng J. 2001. Photo induced
conversion of silver nanospheres to nanoprisms. Science 294, 1901-1908.
Kalef-Ezra J. A, Boziari A, Litsas J, TsekerisPkoligliatis T. (2002).
Thermoluminescence dosimetry for quality assurance in radiotherapy.Radiat Prot.
Dosim; Vol. 101 (1-4), P: 403-405.
Kerluke, D. R. and Cheng, S. 2002. Electron Beam Processing for Automotive
Composite Applications, Proceedings of the 2nd Annual Automotive Composites
Conference and Exposition of the Society of Plastics Engineers.

71
Khanna, P.K., Narendra Singh, ShobhitCharan, A. KasiViswanath. (2005).
"Synthesis of Ag/polyanilinenano composite via an in situ photo-redox mechanism".
Materials Chemistry and Physics Vol. 92, P: 214–219.
Kron.T, P.M. Ostwald, C.S.Hamilton and J.W.Denham (1996) TLD Extrapolation
Measurements for Entrance and Exit Dose in Radiotherapy RadiatProt Dosimetry
(1996) vol. 66 (1-4): p 323-326.
Kumar R, Prasad R, Vijay Y K, Acharya N K, Verma K C and Udayan De. (2003),
"Ion beam modification of CR-39 (DOP) and polyamide nylon-6
polymers".Nucl.Instrum.Methods B 212 221. Vol. 212, P: 221–227.
Lei, Zhongli and Fan Youhua. (2006), "Preparation of silver nanocomposites
stabilized by an amphiphilic block copolymer under ultrasonic irradiation". Material
letters, Vol. (60), pp. 2256-2260.
Lin, J. C., C. Y. Wang. 1996. Effects of surfactant treatment of silver powder on the
rheology of its thick-film paste. Material Chemical Physics 45: 136-144.
Lokhovitsky, V.I. and V.V. Polikarpov. 1980. Technology of radiation emulsion
polymerization. Atomizdat, Moscow-Russia.
McGervey, J., 1983. Introduction to Modern Physics, second ed., Academic Press,
New York.
Mohamad El-Saied El-Nagdy, Mohamad Rabeaa El-Saadany, Antar El-Saied
Mohamad (2013), Dose Response and FWHM Properties of Dyed Poly Vinyl
Alcohol-Irradiated with Gamma-Rays, Open Journal of Polymer Chemistry, 2013, 3,
39-42.
Mohammed A. Ali Omer, Mohamed E M, Gar-elnabi, Alyaa, H. Ahmed,
GhadaAbakerEidam and Nasr Aldeen N. Khidir. (2013), Radiochemical Properties of
Irradiated PVA\AgNO3 Film by Electron Beam. International Journal of Science and
Research (IJSR), India Online, Vol. 2 (9), P: 361-364.

72
Mohammed A. Ali Omer, Saion E., Gar-elnabiM. E. M., Balla E. A. A., DahlanKh.
M., and Yousif Y. M. (2011), Gamma Radiation Synthesis and Characterization of
Polyvinyl Alcohol/ Silver Nano Composites Film. J. Sc. Tech, Vol. 12 (1), P: 104-
110.
Molyneux., 1983. Water Soluble Synthetics Polymers: Properties and Behavior.
Vol.1. CRC. Press. USA.
Monti, O, L. A, J.T. Fourkas, D. J. Nesbitt. (2004), Diffraction-Limited Photo
generation and Characterization of Silver Nanoparticles. Journal of Physical
Chemistry B, Vol. 108, P: 1604-1612.
Moscovitch M.1999. personnel dosimetry using LiF:Mg,Cu,P. Radiation protection
dosimetry 85 (1-4): 49-56.UNSCEAR, 1962.P.389.
Mott, N., F. and Davis E.A. 1979. Electronic Process in Non-crystalline Materials,
2nd. Edition. Clarendon Press, Oxford, UK.
Motz, J. W., H. A. Olsen, H. W. Koch. 1969. Pair production by photons, Review.
Model Physics 41: 581-639.
Mutahir Tunio, Mansoor Rafi, Shoukat Ali, Zaeem Ahmed, Asad Zameer, Altaf
Hashmi and Syed A. Maqbool (2011) In vivo dosimetry with diodes in a radiotherapy
department in Pakistan,RadiatProt Dosimetry (2011) vol. 147 (4):p 608-613.
Nagaraja, N., Subba Reddy, C.V. Sharma, A. K. Narasimha Rao, V. V. R. 2002. DC
conduction mechanism in polyvinyl alcohol film doped with potassium thiocyanate.
Journal of power source 112: 326-330.
Omer M. A. A. Saion E. Gar-elnabiM. E. M., Balla E. A. A. Dahlan Kh. M. Yousif
Y. M. (2011), Gamma Radiation Synthesis and Characterization of Polyvinyl
Alcohol/ Silver Nano Composites Film, J.Sc. Tech 12. (1) 2011.

73
Painter et al 1997, Paul C.; Coleman, Michael M. (1997). Fundamentals of polymer
science : an introductory text. Lancaster, Pa.: Technomic Pub. Co. p. 1. ISBN 1-
56676-559-5.
Pankove, J.I., 1971. Optical Processes in Semiconductors. Dover Publications Inc.
N.Y. 1-127.
Ramnani .S.P. Jayashri Biswal, S. Sabharwal (2007), Synthesis of silver nanoparticles
supported on silica aerogel using gamma radiolysis, Radiation Physics and Chemistry
76 (2007) 1290–1294.
Ravve, A. 2000. Introduction and physical properties of polymer, Principles of
Polymer Chemistry, 2nd. edition, New York: Kluwer Academic/Plenum.
R.F. Hill, S. Brown, C. Baldock, (2008), Evaluation of the water equivalence of solid
phantoms using gamma ray transmission measurements, Radiation Measurements 43
(2008) 1258 – 1264.
Rizk R. A. M., A. M. Abdul-Kader, M. Ali and Z. I. Ali.(2008). "Influence of ion-
beam bombardment on the optical properties of LDPE polymer blends". J. Phys. D:
Applied Phys. Vol. 41, P: 1-5.
S.A. Baeurle (2009). "Multiscale modeling of polymer materials using field-theoretic
methodologies: a survey about recent developments". Journal of Mathematical
Chemistry 46 (2): 363–426. doi:10.1007/s10910-008-9467-3.
Saxena, S.K. polyvinyl alcohol (PVA), Chemical and Technical Assessment (CTA)
61st JECFA, (2004).
Siegbahn, K., 1965. Alpha, Beta and Gamma Ray Spectroscopy, North-Holland,
Amsterdam, Netherlands.

74
Shaheen Akhtar, Taqmeem Hussain, Aamir Shahzad, Qamar-ul-Islam, Muhammad
Yousuf Hussain and Nasim Akhtar, (2013), Radiation Induced Decoloration of
Reactive Dye in PVA Films for Film Dosimetry, Journal of Basic & Applied
Sciences, 2013, 9, 416-419.
Smith, F., A. 2000. A Primer in Applied Radiation Physics. World Scientific
Publishing Co. Pte. Ltd.
Stakheev A.Y., Kustov L.M. (1999). Effects of the support on the morphology and
electronic properties of supported metal clusters; modern concepts and progress in
1990s. Applied Catalysts, A188: 3-7
Swinnen A, Verstraete J, Huyskens DP, (2004). Feasibility study of entrance in-vivo
dose measurements with mailed thermo-luminescence detectors; Radiotherapy and
Oncology, Vol. 73 (1): 89-96.
Tauc, J., 1974. Amorphous and Liquid Semiconductors. Plenum Press. New York. 1-
196.
Venables K, Miles E, Aird E, Hoskin P. (2004).The use of in-vivo thermo-
luminescent dosimeters in the quality assurance program for the START breast
fractionation trial. Radiotherapy and Oncology Vol. 71, P: 303–310.
Vladimir Agabekov, NadezhdaIvanova, ViacheslavDlugunovich, and Igor
Vostchula."Optical Properties of Polyvinyl Alcohol FilmsModified with Silver
Nanoparticles".Hindawi Publishing Corporation, Journal of Nanomaterials, Vol.
(2012), pp. 1-5, (2012).
Wang, Y., N. Toshima 1997. Preparation of Pd-Pt Bimetallic Colloids with Controllable
Core/Shell Structures. J. Phys. Chem. B 101: 5301-5306.
Whiffen, D. H. 1971. Spectroscopy, 2nd. edition. Longman Group Ltd.

75
Yano, S., Kurita K., Lwata K., Furukawa T., Kodomari M. 2003. Structure and
properties of poly(vinyl alcohol)/tungsten trioxide hybrids. Polymer 44: 3515-3522.
Zhu X R. (2000), Entrance dose measurements for in-vivo diode dosimetry:
Comparison of correction factors for two types of commercial silicon diode detectors,
Journal of applied clinical medical physics, Vol. 1 (3), P: 100-107.

76
Appendix A
TLD reading for entrance and exit dose
G.D in Gy TLD En in Gy TLD Ex in Gy
1 1.1 0.403
2 1.98 0.966
4 3.91 1.98
6 5.90 3.29
8 7.79 4.55
10 9.69 5.60
12 11.81 6.67
15 14.26 8.35

77
Appendix B
Applied dose for each film and optical density for entrance and exit dose
Applied Dose Entrance (OD) Exit (OD)
1Gy 0.17 0.14
2Gy 0.19 0.15
4Gy 0.24 0.19
6Gy 0.26 0.22
8Gy 0.33 0.26
10Gy 0.35 0.30
12Gy 0.41 0.32
15Gy 0.44 0.34

78
Appendix C
The correlation between the applied γ-radiation doses 1-15 Gy and the
absorption coefficient at entrance and exit doses
Applied dose in
Gy
Entrance absorption
coefficient
exit absorption
coefficient
1 0.73 0.134
2 0.86 0.31
4 0.98 0.569
6 1.20 0.853
8 1.42 1.02
10 1.64 1.24
12 1.76 1.43
15 2.15 1.71