Changing sediment dynamics due to natural reforestation in the Dragonja catchment, SW Slovenia
12
Changing sediment dynamics due to natural reforestation in the Dragonja catchment, SW Slovenia S.D. Keesstra a,b, ⁎, O. van Dam b , G. Verstraeten c , J. van Huissteden b a Land Degradation and Development Group. Wageningen University, Droevendaalsesteeg 4, 6700AA, Wageningen, The Netherlands b Department of Environmental Geo-Sciences, Vrije Universiteit, De Boelelaan 1085, 1081 HV, Amsterdam, The Netherlands c Physical and Regional Geography Research Group, Katholieke Universiteit Leuven, Celestijnenlaan 200E, Box 2409, B-3001 Leuven, Belgium abstract article info Article history: Received 18 March 2008 Received in revised form 20 February 2009 Accepted 23 February 2009 Keywords: Dragonja Slovenia Hillslope erosion Land use change Natural reforestation WATEM/SEDEM Under the influence of socio–economic changes in many regions in Europe, a trend of decreasing agricultural activity has been observed since the Second World War. The resulting reforestation profoundly changes water and sediment supply to river channels, deposition rates on the floodplains and erosion rates on the hillslopes. We studied these changes in the 91 km 2 Dragonja catchment in southwestern Slovenia. With the spatially distributed erosion and sediment delivery model WATEM/SEDEM, the hillslope sediment delivery to the river channel was calculated on the basis of parameters (soil and precipitation parameters, a DEM and land use) measured in the field and laboratory in 2002 and land use maps based on aerial photographs from 1954, 1975, 1985 and 1994. For two independent calibrations WATEM/SEDEM modelled a sharp decline of 69% in total hillslope sediment delivery from 1954 to 2002. As the sub-catchments Rokava and Upper-Dragonja did not reforest in the same way, the sediment yield response is different as well. Separate calculations show the same reduction (45%) in sediment yield from 1954 to 1975. After 1975 the sediment yield was stable in the Rokava sub-catchment. In the Upper-Dragonja the trend continued, to a total reduction of 76% of sediment outflow since 1954. The sources of fine sediment were determined by analysing the hysteresis of the discharge waves, and the suspended sediment texture. The sediment that leaves the catchment originates from three sources: hillslopes, erosional bedrock banks and sedimentary riverbanks. The analysis of the suspended sediment texture suggests that during a discharge wave the suspended sediment originates predominantly from the hillslopes. During low stage the sparse sediment in the water column largely originates from large bedrock banks. The sedimentary riverbanks are not an important source of suspended sediment. © 2009 Elsevier B.V. All rights reserved. 1. Introduction The effects of deforestation and intensification of agricultural land on erosion (e.g. Singh, 1999), nutrients (e.g. Lenhart et al., 2003), slope stability (Vanacker et al., 2003) and soil properties (e.g. Varela et al., 2001) have been studied widely. However the effects of reforestation have received much less attention. Under the influence of socio– economic changes in many regions in Europe a trend of decreasing agricultural activity is seen. This trend induces either planned reforestation or nature development in catchments, or unplanned land abandonment and natural reforestation. This reforestation profoundly changes water and sediment supply to the rivers, the deposition rate on the floodplains and the erosion rate on the valley slopes. As a result, fluvial dynamics and fluvial morphology have changed (e.g. Piégay et al., 2004; Lièbault et al., 2005; Keesstra, 2007). Most of these studies qualitatively link observed changes in land use with observed changes in fluvial morphology. However, quantitative estimates of changes in water and sediment fluxes are not readily available. Nevertheless, it is well known that geomorphic response to disturbances like land use change, are non-linear (e.g. Schumm, 1974; Phillips, 2003). As a result, most case-studies do not provide sufficient information to identify threshold conditions of land use change that trigger changes in river morphology. The application of spatially distributed erosion and sediment delivery models that are able to simulate the impact of changing land use patterns on sediment fluxes could provide a means to quantify these dynamics. Although erosion modelling in a similar setting, in terms of climate and geomorphology, has been performed before (e.g. Martínez-Casasnovas and Sánchez- Bosch, 2000; Erskine et al., 2002), in most instances the input Catena 78 (2009) 60–71 ⁎ Corresponding author. Land Degradation and Development Group. Wageningen University, Droevendaalsesteeg 4, 6700AA, Wageningen, The Netherlands. E-mail address: [email protected] (S.D. Keesstra). 0341-8162/$ – see front matter © 2009 Elsevier B.V. All rights reserved. doi:10.1016/j.catena.2009.02.021 Contents lists available at ScienceDirect Catena journal homepage: www.elsevier.com/locate/catena
-
Upload
independent -
Category
Documents
-
view
0 -
download
0
Transcript of Changing sediment dynamics due to natural reforestation in the Dragonja catchment, SW Slovenia
Catena 78 (2009) 60–71
Contents lists available at ScienceDirect
Catena
j ourna l homepage: www.e lsev ie r.com/ locate /catena
Changing sediment dynamics due to natural reforestation in the Dragonja catchment,SW Slovenia
S.D. Keesstra a,b,⁎, O. van Dam b, G. Verstraeten c, J. van Huissteden b
a Land Degradation and Development Group. Wageningen University, Droevendaalsesteeg 4, 6700AA, Wageningen, The Netherlandsb Department of Environmental Geo-Sciences, Vrije Universiteit, De Boelelaan 1085, 1081 HV, Amsterdam, The Netherlandsc Physical and Regional Geography Research Group, Katholieke Universiteit Leuven, Celestijnenlaan 200E, Box 2409, B-3001 Leuven, Belgium
⁎ Corresponding author. Land Degradation and DevUniversity, Droevendaalsesteeg 4, 6700AA, Wageningen
E-mail address: [email protected] (S.D. Keesstr
0341-8162/$ – see front matter © 2009 Elsevier B.V. Adoi:10.1016/j.catena.2009.02.021
a b s t r a c t
a r t i c l e i n f oArticle history:Received 18 March 2008Received in revised form 20 February 2009Accepted 23 February 2009
Keywords:DragonjaSloveniaHillslope erosionLand use changeNatural reforestationWATEM/SEDEM
Under the influence of socio–economic changes in many regions in Europe, a trend of decreasing agriculturalactivity has been observed since the Second World War. The resulting reforestation profoundly changeswater and sediment supply to river channels, deposition rates on the floodplains and erosion rates on thehillslopes. We studied these changes in the 91 km2 Dragonja catchment in southwestern Slovenia.With the spatially distributed erosion and sediment delivery model WATEM/SEDEM, the hillslope sedimentdelivery to the river channel was calculated on the basis of parameters (soil and precipitation parameters, aDEM and land use) measured in the field and laboratory in 2002 and land use maps based on aerialphotographs from 1954, 1975, 1985 and 1994. For two independent calibrations WATEM/SEDEM modelled asharp decline of 69% in total hillslope sediment delivery from 1954 to 2002.As the sub-catchments Rokava and Upper-Dragonja did not reforest in the same way, the sediment yieldresponse is different as well. Separate calculations show the same reduction (45%) in sediment yield from1954 to 1975. After 1975 the sediment yield was stable in the Rokava sub-catchment. In the Upper-Dragonjathe trend continued, to a total reduction of 76% of sediment outflow since 1954.The sources of fine sediment were determined by analysing the hysteresis of the discharge waves, and thesuspended sediment texture. The sediment that leaves the catchment originates from three sources:hillslopes, erosional bedrock banks and sedimentary riverbanks.The analysis of the suspended sediment texture suggests that during a discharge wave the suspendedsediment originates predominantly from the hillslopes. During low stage the sparse sediment in the watercolumn largely originates from large bedrock banks. The sedimentary riverbanks are not an important sourceof suspended sediment.
© 2009 Elsevier B.V. All rights reserved.
1. Introduction
The effects of deforestation and intensification of agricultural landon erosion (e.g. Singh,1999), nutrients (e.g. Lenhart et al., 2003), slopestability (Vanacker et al., 2003) and soil properties (e.g. Varela et al.,2001) have been studied widely. However the effects of reforestationhave received much less attention. Under the influence of socio–economic changes in many regions in Europe a trend of decreasingagricultural activity is seen. This trend induces either plannedreforestation or nature development in catchments, or unplannedland abandonment and natural reforestation. This reforestationprofoundly changes water and sediment supply to the rivers, the
elopment Group. Wageningen, The Netherlands.a).
ll rights reserved.
deposition rate on the floodplains and the erosion rate on the valleyslopes. As a result, fluvial dynamics and fluvial morphology havechanged (e.g. Piégay et al., 2004; Lièbault et al., 2005; Keesstra, 2007).Most of these studies qualitatively link observed changes in land usewith observed changes in fluvial morphology. However, quantitativeestimates of changes in water and sediment fluxes are not readilyavailable. Nevertheless, it is well known that geomorphic response todisturbances like land use change, are non-linear (e.g. Schumm, 1974;Phillips, 2003). As a result, most case-studies do not provide sufficientinformation to identify threshold conditions of land use change thattrigger changes in river morphology. The application of spatiallydistributed erosion and sediment delivery models that are able tosimulate the impact of changing land use patterns on sediment fluxescould provide a means to quantify these dynamics. Although erosionmodelling in a similar setting, in terms of climate and geomorphology,has been performed before (e.g. Martínez-Casasnovas and Sánchez-Bosch, 2000; Erskine et al., 2002), in most instances the input

61S.D. Keesstra et al. / Catena 78 (2009) 60–71
parameters are not as detailed or not available for the wholecatchment. Furthermore, modelling the response of hillslopes interms of erosion due to reforestation has not been undertaken before.
We therefore analysed and modelled changes in hillslope erosionin the 91 km2 Dragonja drainage basin in southwestern Slovenia,which has experienced an important increase of (mostly broad-leaved) forest following several decades of depopulation (Fig. 1). Priorto reforestation, the catchment was severely eroding. With the returnof the forest, profound changes in the flow regime and themorphology of the main river have taken place. Between 1954 and2001 a gradual reduction in average annual and dry-weather flows(3.5% and 10% per year, respectively), and a 68% decrease in channelwidth in the middle reaches have occurred (Keesstra et al., 2005).
Both the reduced water and sediment flow rates pose a potentialthreat to the continued functioning of wetland reserves near theoutlet of the drainage basin and limit the possibilities for renewedagricultural development in the area. In addition, a significant changein river channel morphology has been observed, which greatly
Fig. 1. The study area: the Dragonja catchment, Southwestern Slovenia (45°28′N
influences the aquatic habitat of the Dragonja River. In 2004, theDragonja valley has obtained a Natura-2000 status (EuropeanCommission, 2000); the management of the catchment according tothe Natura-2000 directives will require sound information on thehydrological, geomorphological and ecological functioning of the area.
The aims of this study are to reconstruct the change in sedimentdynamics due to the reforestation of the Dragonja catchment based onmeasurements. Secondly, we aimed to model the sediment dynamicsfor the period 1954 to 2002 and calibrate the model outcomes withfield measurements.
The sediment yield of a catchment provides useful informationabout the net erosion intensities within catchments (Walling,1994), whereas changes in sediment dynamics and sediment yieldmay reflect the impact of land use changes. However, historicalsediment data are usually not available. To make comparisonsbetween the current and historical sediment dynamics, thehistorical situation needs to be derived from proxy records.These proxies can be sediment accumulations on the floodplain
, 13°35′E). The black dots indicate the location of the precipitation gauges.
62 S.D. Keesstra et al. / Catena 78 (2009) 60–71
or in reservoirs, or estimations of the suspended sedimentconcentrations. It is also possible to use a sediment deliverymodel that has been tested in a similar setting. Within this paper, adual approach has been followed: results obtained with a testedmodel are compared with limited observational data on sedimentdelivery.
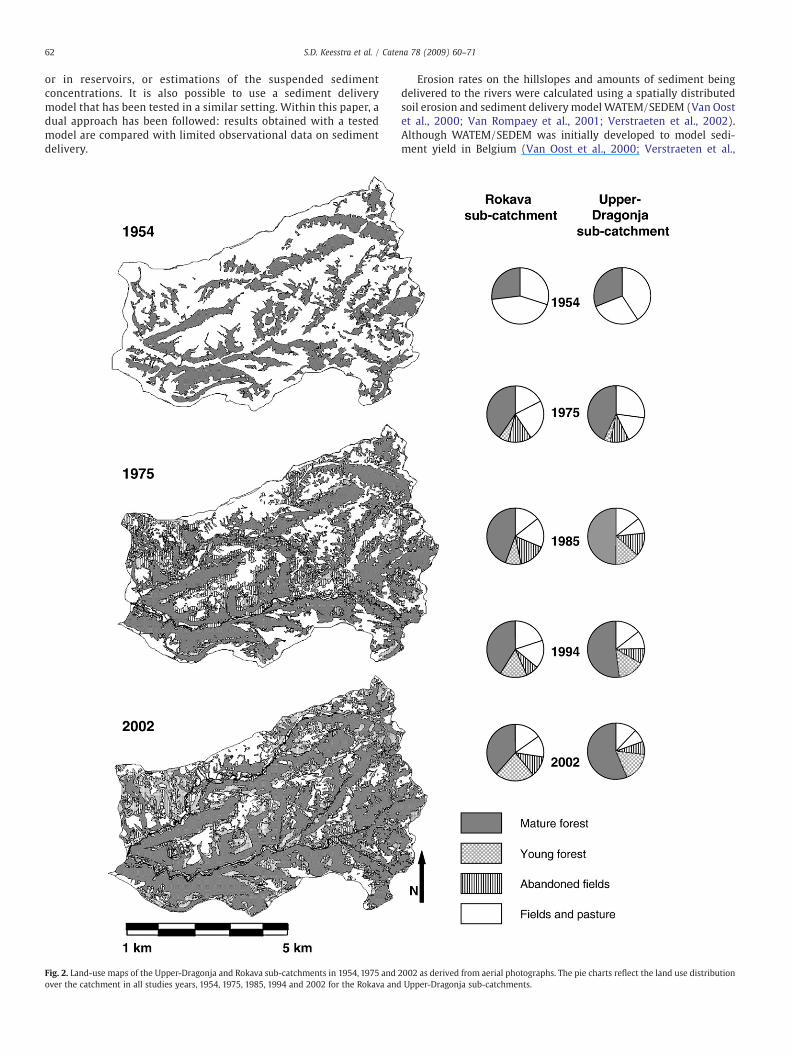
Fig. 2. Land-use maps of the Upper-Dragonja and Rokava sub-catchments in 1954, 1975 andover the catchment in all studies years, 1954, 1975, 1985, 1994 and 2002 for the Rokava and
Erosion rates on the hillslopes and amounts of sediment beingdelivered to the rivers were calculated using a spatially distributedsoil erosion and sediment delivery model WATEM/SEDEM (Van Oostet al., 2000; Van Rompaey et al., 2001; Verstraeten et al., 2002).Although WATEM/SEDEM was initially developed to model sedi-ment yield in Belgium (Van Oost et al., 2000; Verstraeten et al.,
2002 as derived from aerial photographs. The pie charts reflect the land use distributionUpper-Dragonja sub-catchments.

63S.D. Keesstra et al. / Catena 78 (2009) 60–71
2002), and tested widely for NW- and Central Europe (Van Rompaeyet al., 2001, 2003), it also proofed to be fairly accurate underMediterranean climatic conditions (Italy, Van Rompaey et al., 2005;SW-Australia, Verstraeten et al., 2007). Despite relatively weakprediction capabilities in mountain conditions, the model workedwell for catchments with steep slopes but relative little heightdifferences, such as many of the tested Italian catchments (VanRompaey et al., 2005). Given the similarity of the Dragonjacatchment (this study), with many of those Italian catchments, webelieve that the WATEM/SEDEM is also suitable to be applied to theDragonja catchment.
2. Study area
The Dragonja catchment is situated in the southwestern part ofSlovenia. The river is 30 km long and the catchment is approximately91 km2 (Fig. 1). The elevation of the drainage basin ranges from 400mat the headwaters to sea level at the river mouth. The Dragonjadebouches into the Adriatic Sea. The upstream part of the DragonjaRiver consists of two sub-catchments, the Dragonja sub-catchment(32 km2) and the Rokava sub-catchment (20 km2). The geology of thecatchment is largely uniform and is composed of sub-horizontal togently north dipping Eocene flysch, consisting of highly calcareoussoft silt and clay stone with sandstone layers up to 1.5 m thickness(Melik, 1960; Orehek, 1972). Long flat ridges and plateaus characterizethe overall morphology of the catchment with steep slopes at themargins of the valleys. The soil is mostly a carbonate rendzina, withthe exception of the valley floors, where a fluvial soil (Geološki zavodSlovenije, 2003) has developed. On places where a sandstone layer isvery close to the surface, a brown eutric soil has developed. All soilsare highly calcareous (Zupancic and Pric, 1999). The thickness of thesoils varies from more than 1 m on the plateau to zero on the slopes,partly as a result of erosion associated with former agriculturalactivities.
Fig. 3. Examples of the mapped land uses, Fields (A), aband
The regional climate can be classified as sub-Mediterranean. Theaverage annual temperature is 14 °C at the coast and 10 °C in theeastern part of the catchment. The absolute temperature varies from−10 °C to 35 °C (HMZ, 2003; Ogrin, 1995).
At the outlet the hydrological record from 1960 to 2002 places the1, 10 and 50-year recurrence interval floods at 30, 70 and 105 m3 s−1
respectively (Keesstra, 2006).Over the last 55 years important changes in land use have
occurred. After the Second World War socio–economic changes inthe region caused depopulation. The population dropped from6000 in 1940 to 3000 in 2000, resulting in large-scale abandonmentof agricultural fields, which slowly changed into a mature forest(Keesstra and van Dam, 2002). After abandonment, these fieldsgradually reverted to mixed deciduous forest dominated by oak(Quercus pubescens), hornbeam (Carpinus orientalis croaticus) and ashtrees (Fraxinus ornus) (Keesstra, 2006). Due to the natural reforesta-tion from 1950 until 1975, the river has narrowed and incised into itsformer bed thus creating a terrace, which now stands 1.5 m above thecurrent river. After 1975 the process of narrowing and incisionintensified due to an increase of mature forest, forming a secondterrace that stands 0.5 to 1.0 m above the current river (Keesstra et al.,2005).
3. Methods
3.1. Suspended sediment yield and hydrological parameters
To obtain the current hydrological and sediment dynamicssituation we monitored the discharge and suspended sedimentconcentration during an intensive field period (October 2000 untilSeptember 2004). At the outlets of the two main tributaries, theRokava and the Upper-Dragonja River (Fig. 1) the water stages weremeasured every 10 min (using a Diver pressure gauge [Van EssenDiver] and pressure transducer gauges [Druck Ltd. PDCR-830]). These
oned fields (B), young forest (C) and mature forest (D).

64 S.D. Keesstra et al. / Catena 78 (2009) 60–71
stages were converted to discharges with use of constructed stagedischarge curves. At the same locations, suspended sediment wassampled with an ISCO water-sampler (Elscolab 6712 portablesampler), which was programmed to take samples during stormevents at every 5 cm rise or fall in streamwater level. However, due tofrequent malfunctioning of the instruments only 13 events weresampled, resulting in a total of 178 and 167 processed samples for theRokava andUpper-Dragonja branches, respectively. At the outlet of thestudy area (Pod Kaštel, Fig. 1) daily discharge was measured by theSlovene Hydrological Survey from 1960 till 2002 (HZM, 2003).Suspended sediment concentrations were derived from 18 samples,which were manually taken during three peak events. At otherlocations, such as small tributaries and gullies, suspended sedimentwas sampled occasionally during high stages.
Suspended sediment concentrations were obtained by evaporat-ing the sample on a stove, weighing the residue and dividing theresult by the original sample volume (usually 0.5 l) (cf. Steegen et al.,2001). This method was more accurate than filtering as the dissolvedmatter content is negligible. The texture of forty of the collectedsuspended sediment samples was measured (see section on K-factorfor texture measurement methodology). Suspended sedimenttransport was computed by combining the information on sedimentconcentrations and discharge. To estimate the annual suspendedsediment discharge over the period 1960–2002, the currentsuspended sediment concentrations were used, together with thedaily discharge data measured at the outlet. The samples weredivided into low flow samples and high flow samples. The high flowsamples are classified as direct runoff or quick flow (group A inFig. 7). The rest of the runoff (group B and C in Fig. 7) was grouped aslow flow. These measurements give an average suspended sedimentload of 0.05 g l−1 for low flow (b0.7 m3 s−1), and 1.2 g l−1 for highflow (N0.7m3s−1). The value of 0.7m3s−1 dischargewas determinedas the average value of the flex points (which is the knick-point in thereceding discharge limb) of the discharge waves in 2002. Theseconcentrations are used to calculate the total sediment discharge atthe outlet in 2002.
3.2. Land-use changes
The land use was derived from geo-corrected, digitized aerialphotographs taken in 1954, 1975, 1985 and 1994. The situation for
Fig. 4. Schematic diagram of th
2002 was mapped during a field survey and digitized afterwards. Theaerial photographs were digitised and the land use was simplified intofour categories: fields, abandoned fields, young forest and matureforest (Figs. 2 and 3). These categories were easily distinguishable onthe aerial photographs. During the field survey a further distinctionwas made between fields (mostly vineyards) and pasture. However,from an erosional point of view, there is no clear distinction betweenthese two land-use categories. In this region it is customary to ploughalso the pastures once a year, which is similar for vineyards that areclassified as fields. Therefore, the erosional qualifications of pasturesare similar to fields. The quality of the aerial photographs taken in1954 was poor. Therefore the only reliable distinction that could bemade was forest versus non-forest. Since the abandonment of theagricultural lands only started around 1950, it is assumed that in 1954the land uses could be divided into fields and mature forest. Theanalysis was only done for the Upper-Dragonja and Rokava catch-ments, because in the Lower Dragonja catchment the reforestation isnot as evident.
3.3. Erosion and sediment delivery model (Fig. 4)
3.3.1. IntroductionThe change in erosion and hillslope sediment delivery as a result
of the land use changes in the catchment was simulated with themodel WATEM/SEDEM (Van Oost et al., 2000; Van Rompaey et al.,2001; Verstraeten et al., 2002). WATEM/SEDEM is a spatiallydistributed model to simulate erosion and deposition by water andtillage processes in a two-dimensional landscape. Unlike moresophisticated dynamic models, WATEM/SEDEM focuses on thespatial, and less on the temporal, variability of relevant parameters.As such, WATEM/SEDEM allows the incorporation of landscapestructure or the spatial organisation of different land units and theconnectivity between them. In order to avoid major problems withrespect to the spatial variability of parameter values and uncertaintyof parameter estimates, WATEM/SEDEM is a simple topography-driven model (Fig. 4).
3.3.2. Erosion rate moduleWATEM/SEDEM first calculates mean annual hillslope erosion rates
(E; ton ha−1y−1) using an adapted version of the Revised Universal Soilloss equation or RUSLE (Renard et al., 1997) for 2D-landscapes.
e used model procedure.

Fig. 5. Soil map of the Rokava and Upper-Dragonja catchment (Geološki zavod Slovenije, 2003).
65S.D. Keesstra et al. / Catena 78 (2009) 60–71
Therefore the module for the calculation of the erosion rates needs thesame input parameters: R — (rainfall–runoff) factor, K — (soilerodibility) factor, LS2D (2D length–slope) factor, C — (cropping) factorand P — (conservation practices) factor:
E = R⁎K⁎LS2D⁎C⁎P ð1Þ
The rainfall–runoff factor (R) depends on both the amount andintensity of the precipitation. It is important to use continuous data todetermine this factor. However, detailed precipitation data were onlymeasured since October 2000 on seven locations in the catchmentwith tipping bucket systems (Fig. 1). The R-factor was derived fromthe tipping bucket data of the years 2000 to 2003, using the proceduredescribed in the RUSLE handbook (Renard et al., 1997).
The soil erodibility-factor (K)mainly depends on soil texture and soilorganic matter content, whereas soil structure and permeability play aminor role. In this study, we estimated K (kg m2 ha m−2 MJ−1mm−1)using the following formula (Renard et al., 1997):
K = 2:1⁎10−4 12− OMð ÞM1:14 + 3:25 s−2� �
+ 2:5 p−3� �h i
= 759
Where: OM=organic matter content (%); M=texture product:% silt⁎(% silt+% sand); s=structure class and p=permeability class.The required input parameters were collected during field andlaboratory research.
A total of 105 sampleswere taken spread over the various land usesand soil types. On each site the soil profile and the structure of the soilwas described. These point data were extrapolated to the entirecatchment with the use of the Slovene Soil map (Fig. 5). Texture
Table 1Cropping factor per land use (after Wischmeier and Smith, 1978; Renard et al., 1997;Dissmeyer and Foster, 1980).
Land use C-factor
Fields and pasture 0.271Abandoned fields 0.015Young forest 0.020Mature forest 0.050Bad lands 0.900River bed 0.950
analysis was done with a Laser Particle Sizer (A22, Fristch; Konert andVandenberghe, 1997). The usual HCl was not added to the sediment,since that would dissolve parts of the sediment itself. The organicmatter content was analysed by loss on ignition at 500°C.
We used the soil type as a lead for the K-factor distribution. Thevalue of the K-factor for each sample was calculated from themeasured properties. The sample sites were plotted on the soil map(Geološki zavod Slovenije, 2003; Fig. 5) and the values of K wereaveraged for each soil type. This resulted in values for the K-factor foreach soil type (Table 2).
A 2D length and steepness of slope factor (LS2D) takes into accountflow convergence and is calculated from a 20 m resolution DEM usinga multiple flow algorithm to assess the unit contributing areaaccording to Desmet and Govers (1996). The DEM was obtainedafter interpolation between contour lines that were digitised fromscanned topographical mapswith scale 1:5000 and contour interval of5 m.
The cropping-factor (C) is directly derived from land use. The C-values for the various land use categories were derived from standardhandbook tables (Table 1, Wischmeier and Smith, 1978; Dissmeyerand Foster, 1980; Renard et al., 1997). The land use is the only factordetermining the erosion rate that has changed significantly. This isreflected in different C-value maps for the various time periods. Tomodel the effect of the changed land use on hillslope sedimentdelivery, all other factors were kept constant in all runs.
The conservation practices factor (P) was not taken into account.Some localized terraces are present on steep slopes, but they usuallyare very narrow and are similar in size as the pixels used in themodelling, and could therefore not be represented in the model.Furthermore, a large part of these terraces is not well maintained andhas thus lost most of their conservation value (Table 2).
Table 2K-factor for soil types in Dragonja catchment (Renard et al., 1997).
Soil type K-factora
Carbonate rendzina on flysch 0.0206Eutric brown soil 0.0258Fluvial soil on carbonate alluvium 0.0354Ploughed soil on flysch 0.0232
akg.h/MJ.mm.

Fig. 6. Triplot of the texture of suspended sediment samples superimposed on soilsamples taken all over the catchment. Circles indicate rough groups of the same texture.Group A represents samples taken during high flow, group B during falling stageintermediate flow and group C during low flow.
Fig. 7. Idealised discharge wave with sediment groups indicated by A: undilutedsediment from the hillslopes, with high concentrations of suspended sediment load(SSL). B: sorted (finer) sediment from the hillslopes due to incapable transport, withintermediate concentrations of SSL. C: Sediment from bedrock banks, with very lowconcentrations of SSL.
66 S.D. Keesstra et al. / Catena 78 (2009) 60–71
3.3.3. Transport capacity moduleAfter calculating the erosion rate on the hillslopes, the eroded
sediment is routed along the runoff pattern towards the river, takinginto account the local transport capacity (TC) of each pixel. Transportcapacity is proportional to the potential of concentrated flow erosion(Ec) by a transport capacity coefficient
ktcð Þ : TC = ktc:Ec ð2Þ
If the local TC is smaller than the sediment flux (Ec), sedimentdeposition is modelled. When the sediment reaches the river, it isdirectly delivered to the most downstream end of the river link. Thisimplies that bank erosion or floodplain deposition is not taken intoaccount within the model. The transport capacity coefficient (ktc)needs to be calibrated for various land use categories by comparingpredicted with observed values of sediment yield for variouscombinations of ktc.
3.3.4. Model calibrationThe required transport capacity coefficient (ktc) needed for the
WATEM/SEDEM runs vary between different land use categories Eq.(2). However, this value needs to be calibrated first. Land use wassubdivided into four categories, whereby it is assumed that the firstcategory (forest, beginning forest and abandoned fields) has a low, andthe second category (fields) has a high ktc-value. There are notsufficient data available to calibrate the high and low transport capacitycoefficients separately. Therefore, only one ktc-value was changed andthe other was calculated using a fixed ratio of high ktc divided by lowktc-values. For central Belgium (Verstraeten et al., 2006; Verstraeten,2006), the ratio between the ktc for cropland and the ktc for non-eroding surfaces equals 3.3. For Italy, this ratio varies between 2.2 and3.8 for non-mountainous and mountainous catchments, respectively(Van Rompaey et al., 2005). We therefore chose an intermediate valueof 3.3 for the ratio between both ktc-values.
To calibrate ktc, two independent calibrations were performed: thefirst calibration was done by comparing the results obtained withmodel runs using the land use map of 2002 with the estimated totalsediment outflow from the catchment in 2002 (Qsed). A secondcalibrationwas performed with the sedimentation rates on the lowestterrace (0.5 m above the current river). Floodplains and low terracesact as a sink of sediment where it is (temporary) stored (cf. Walling etal., 1996). Many researchers have estimated conveyance losses, i.e. the
percentage of sediment that reaches the river channel, but isdeposited on a floodplain or terrace. Trimble (1981, 1999) states that20 to 30% of hillslope sediment delivery is stored in the valleys of theupstream tributaries with catchment areas similar to that of theDragonja sub-catchments. Also Walling and Quine (1993; 23%), Fryirsand Brierley (2001; 32%), Lambert and Walling (1987; 28%)Verstraeten et al. (2007., 38%) and Walling (1999; 40%) have foundpercentages of the same order of magnitude. Although not all of thereferenced catchments are entirely similar to our catchment, webelieve that we can use these numbers for calibration as our main goalis to calculate a relative decrease in the sediment produced, not theabsolute values of sediment delivery. The model was run for both 20%and 30% conveyance loss.
The amount of sediment deposited in the valleys was derived fromcorings and geomorphological mapping. The thickness of thesediment cover on the terraces was inferred from the corings. Thearea of the terraces was estimated with the geomorphologicalmapping. The age of the terraces was known from previous research(Keesstra, 2007). Therefore, the amount of sediment accumulated onthe terraces each year can be derived. The total area of this terrace inthe Rokava catchment is 9 ha, which corresponds to 450 t y−1 ofsediment deposited on this terrace since 1975, and an averagesedimentation rate 0.75 cm y−1 from 1975 till 2002 was estimated(Keesstra, 2007).
This sedimentation rate together with the percentages of con-veyance losses inferred from literature as stated above, allows us tocalibrate the modelled sediment yield. The model has the assumptionthat all sediment entering the channel is transported to the outletimmediately.
The river in themodel is one pixel wide (20m), whereas the actualriver is between 5 and 10 mwide. Moreover, most floodplain and lowterraces liewithin one pixel width. All sedimentation in this area is notmodelled and is part of the outflow in the model results. Thedeposition on higher floodplain lies outside of the 20 m zone and istherefore modelled and not used for calibration.
Because the percentage of sediment stored in the valleys and theamount of sediment deposited each year in these valleys is known, it ispossible to calibrate the modelled outflow by changing the transportcapacity coefficient. After determining the ktc coefficient for thecalibration year (2002), it was kept constant for all other runs of themodel in order to make sure that changes in hillslope sedimentdelivery represent the impact of land use changes.
4. Results
4.1. Suspended sediment yield and hydrological parameters
The sediment that leaves the catchment originates from threesources, the hillslopes, the erosional cliffs and the channel (incision

Fig. 8. Land use distributions for 1954, 1975 and 2002, divided in slope classes as derived from aerial photographs. Pie charts shows the distribution of the slope classes.
67S.D
.Keesstraet
al./Catena
78(2009)
60–71

Table 3Results of theWATEM/SEDEMmodel runswith several calibrations and for the separatesub-catchments.
Year 1954 1975 1985 1994 2002 Reduction insediment outflowfrom 1954 to 2002
Literature conveyance losses:20% (ton ha−1y−1)
32.5 17.6 13.5 14.0 11.2 66%
Literature conveyance losses:30% % (ton ha−1y−1)
21.2 7.7 6.1 7.0 5.8 72%
Calibrated with sedimentdischarge (Qsed) (ton ha−1y−1)
10.2 4.3 3.5 4.0 3.3 67%
Rokava (calibrated with Qsed)(ton ha−1y−1)
9.2 5.1 4.7 5.2 4.3 53%
Dragonja (calibrated with Qsed)(ton ha−1y−1)
10.7 3.8 2.7 3.2 2.6 76%
68 S.D. Keesstra et al. / Catena 78 (2009) 60–71
and bank erosion). Analysis of the suspended sediment texture is usedto determine the importance of these sources during the dischargewave.
The suspended sediment texturewas comparedwith the texture ofthe soil samples taken throughout the catchment (Fig. 6). The samplesof the suspended sediment are much more variable than the soilsamples and can be divided into three groups. One group consisted ofsediment with similar texture as the slope samples (group A), onesimilar to slope texture but depleted from sand (group B) and onerelative coarse group with dominantly fine sands (group C).
When the texture results of the suspended sediment samples arecompared to the discharge height during sampling (Figs. 6 and 7), thelowstage samples predominantly showafine-grained texture (group B),the high stage samples have a texture similar to the texture of the slopes(group A) and the middle stage samples predominantly have a relativecoarse texture (group C) (Figs. 6 and 7).
The suspended sediment samples were also used to calculate thehillslope sediment delivery from the catchment, which resulted in anestimation of 3.3 t ha−1y−1. This gives us an idea of the order ofmagnitude of the current hillslope sediment yield.
In order to estimate the amount of sediment generated in earlieryears we took samples from small ephemeral tributaries draining sub-catchments with high (similar to the situation in 1960) percentages offields. From the field observations and the literature (Rijsdijk andBruijnzeel, 1990; Russell et al., 2001) it is known that agricultural land(mostly vineyards) provides more sediment (fines) to the river thanforested areas. Surface erosion on the forested slopes in the area isconsidered minimal. These small tributaries show an averagesuspended sediment load of 2.7 g l−1. This concentration is used as
Fig. 9. Absolute (left) and relative (right) decrease in modelled hillslope sediment deliverydeposited in the river plain or with estimated hillslope sediment delivery at the river outle
the average suspended sediment concentration during peak flows in1960. We assumed the base flow concentration to have stayed,because the hillslopes do not contribute to the sediment load duringbase flow. For each year in the period 1960 to 2002 the average flexpoint of the discharge waves in that year (HMZ, 2003) wasdetermined. All discharge above this averaged flex point dischargerate was multiplied with the suspended sediment concentrationcalculated for that specific year.
4.2. Land use changes
In 1954 the majority of the two sub-catchments, Upper-Dragonjaand Rokava catchment, was used for agriculture. In the Upper-Dragonja catchment only 29% of the area was forested, of which alarge part was located on the steepest slopes. In general, the largestchange in land use occurred between 1954 and 1975. However, also inthe period 1975 to 1985 a clear decrease of agricultural land occurred.After 1985 land use did not change much (Fig. 8). During the fieldsurvey in 2002 we observed that some of the abandoned fields wereused again for agriculture. This suggests that at present thereforestation has come to a halt.
Furthermore, important differences exist between the Upper-Dragonja and the Rokava catchments. A large part of the Rokavacatchment is still under agriculture. Only 61% of the area was forested(young and mature forest) in 2002 as opposed to 73% in the Upper-Dragonja catchment. The reason for this difference is the morefavourable geographical position of the Rokava catchment to thecoastal cities and the gentler slope (see pie charts in Fig. 8). TheUpper-Dragonja catchment was always less intensely used foragriculture than the Rokava catchment, even on the flatter parts ofthe catchment. For instance, on the unfavourable slope class of 13–25%, 6% of the Rokava catchment is used for agriculture, while this isonly 3% in the Upper-Dragonja catchment in 2002 (Fig. 8).
4.3. Model results
The calculated R factor for the year 2002 was extremely high(0.538 MJ mm m−2.ha−1y−1) for the other available years the R-factor was around 0.3. As this is a more realistic number, we used 0.3for all other WATEM/SEDEM runs.
The two independent calibrations were used to estimate thechange in hillslope sediment delivery from the catchment over theperiod 1954 till 2002 in five time steps: 1954, 1975, 1985, 1994 and2002. With the conveyance loss calibration (30% of the sediment isdeposited in the valley), the hillslope sediment delivery in theDragonja catchment in 2002 equals 5.8 t ha−1y−1. The amount ofsediment deposited in the valley was inferred from ceasium-137
(HDS) for the different calibration methods: with 20 or 30% of the sediment outflowt (Qsed)) and for the separate sub-catchments Rokava and Upper-Dragonja.

69S.D. Keesstra et al. / Catena 78 (2009) 60–71
based deposition rates and geomorphological mapping. With thesame input parameters the hillslope sediment delivery modelled for1954 is 21.2 t ha−1y−1, which means a reduction of 72% in hillslopesediment delivery over the period 1954 and 2002. When thecalibration is done with the calculated annual sediment discharge in2002, i.e. 3.3 t ha−1y−1, the hillslope sediment delivery modelled for1954 is 13.9 t ha−1y−1, a reduction of 76% when the yields of 1954 iscompared to 2002 (Table 3, Fig. 9 A, and 10).
The sediment outflow calculated with the conveyance losscalibration is always higher than the calculations with the sedimentdischarge in 2002. It is not clear, however, whether the estimatedconveyance losses are estimated too low (i.e. more than 30% ofhillslope derived sediment is deposited in the floodplain), or that themeasured hillslope sediment delivery for 2002 is lower than the long-term average hillslope sediment delivery. As a result of the used
Fig. 10. Spatial patterns of net erosion rates for 1954, 1975 and 2002 obtained with WATEM
calibrations, the range in hillslope sediment delivery is large. Never-theless, the relative hillslope sediment delivery reduction is consistentto be around 70% for all calibrations. Separate calculations for the sub-catchments Rokava and Upper-Dragonja show a reduction of 45% inthe hillslope sediment delivery in the period 1954 to 1975 for theRokava catchment (Table 3). After 1975 the hillslope sedimentdelivery stayed more or less stable. In the Upper-Dragonja the largestchange occurred in the period 1954 to 1975 also. But in this catchmentthe decrease in sediment outflow continued, making the totalreduction 76% of the sediment outflow in 1954 (Fig. 9 B).
5. Discussion and conclusions
The change in land use over the period 1954 to 2002 had asignificant impact on the erosion of the hillslopes in the Dragonja
/SEDEM when calibrated with the amount of suspended sediment discharged in 2002.

70 S.D. Keesstra et al. / Catena 78 (2009) 60–71
catchment. In 1954, the majority of the catchment was used foragriculture. In general, the most important land-use changes occurredbetween 1954 and 1975. The decrease in agricultural land continuedin a lesser degree between 1975 and 1985, when the reforestationstabilised. In the Rokava catchment, a larger part of the catchment isstill in agricultural use because of its more favourable geographicalposition to the coastal cities and the gentler slope. Only 61% of the areais forested (young andmature forest) in 2002 as opposed to 73% in theUpper-Dragonja catchment.
In some other catchments in the Mediterranean area the source ofthe hillslope sediment delivery is predominantly line erosion such asgullies and rills (cf. Poesen and Hooke, 1997; Vandekerckhove et al.,2001; Ries and Marzolff, 2003). However, in the Dragonja catchmentthis is not the case. The texture of the suspended sediment dependedon the flow stage (Figs. 6 and 7). We attribute this dependency to thefollowing process. During a flood wave, large amounts of sediment aredetached by rainfall from the slopes. At the beginning of the flowwave, slightly sorted and finer sediment is discharged together withthe accumulated sediment at the base of the erosional cliffs (Group B,Figs. 6 and 7). At peak discharge, the hillslope sediments enter theriver without sorting (Group A). When rainfall stops and dischargestarts to drop, the sediment flow retards and larger particles deposit inthe channels. Sediment discharged during this part of the dischargewave will therefore be relatively fine (Group B, Figs. 6 and 7). Duringlow stage all available fine material has already flushed throughsystem. The sediment still available to the river is the sediment fromthe erosional cliffs, which consist of sand, silt and claystone. Thesediment delivered by the cliffs has therefore a wide range in texture.This sediment is transported in very low concentrations during baseflow and also during the beginning of the next flood wave (Group C,Figs. 6 and 7). Some samples of intermediate flow are relatively coarse(Fig. 6). These samples were taken during the rising limb of thedischarge wave and therefore partly consist of the material deliveredby the erosional cliffs.
These results suggest that the largest sediment contributors arethe hillslopes, which provide sediment due to rainfall-inducederosion. The sedimentary riverbanks also contribute their sedimentto the river during high stage river flow, because the predominanterosion process is undercutting by river flow. The supply of sedimentto the river from large erosional cliffs along the river is largelyindependent from rainfall, as rock fall processes are more important.The total amount of sediment supplied by these erosional cliffs is thusof minor importance compared to the amount of sediment comingfrom the hillslopes (Keesstra et al., 2005). However, at low flow, whenthe input from the hillslopes is diminished, the relative importance ofthis sediment source is high. This is also evident when the colour ofthe suspended sediment is evaluated. The low flow samples tend to begreyer, the colour of the bedrock, where the high flow samples isbrownish, similar to the soil on the slopes. The bedrock debris consistsof coarser material, which is reflected in Group C (Fig. 6). Also duringdeposition of the sediment on the floodplain, sorting may have takenplace. The coarsest sediment settles out of the water column first andthe finest sediment fraction is transported away. Based on theseconclusions that the majority of the hillslope sediment deliveryoriginates from the hillslopes, we argue that the use of the WATEM/SEDEM model is warranted for the Dragonja catchment, as it modelssediment delivery from hillslopes only.
A consideration during the modelling was the determining of therainfall–runoff factor (R). The long-term precipitation data show a 19%decrease in precipitation from 1961 to 2000. Despite this observation,we do not have sufficient information that indicates that this trend issignificant and therefore we assumed a constant R-factor because aminor change in the R-factor has a considerable impact on the modeloutput of total sediment production. Nevertheless, it is possible thatthe R-factor was significantly higher in 1954, whichmeans the erosioncould be underestimated in the model runs. Our model simulations
thus only show the potential impact of land use changes on hillslopesediment delivery, regardless of any climatic change that might haveoccurred.
For a Mediterranean environment the model was tested in Italy(Van Rompaey et al., 2005), but the information on the catchmentsstudied in that study is much coarser than the detailed informationavailable for the Dragonja drainage basin. The hillslope sedimentdelivery of these Mediterranean catchments are very diverse. Forcatchments similar in size and landuse to the Dragonja catchment,yields range from 0.2 t ha−1y−1 (Italy, Van Rompaey et al., 2005) to1750 t ha−1y−1 (Amore et al., 2004).
Even with our detailed measurements there was insufficientinformation on hillslope sediment delivery data available to calibrateWATEM/SEDEM such that it models the exact levels of hillslopesediment delivery. With the available data we could estimate a rangeof the absolute value of the hillslope sediment delivery. It ranged from32.5 to 10.2 t ha−1y−1 in 1954 to 11.2 to 3.3 t ha−1y−1 in the year2002 (Table 3). However, when we look at the relative changes inhillslope sediment delivery due to land use change, we can state thatthose can be predicted well. For several calibration runs WATEM/SEDEMmodelled a decline of approximately 70% in sediment deliveryto the river over the period 1954 – 2002.
Separate calculations for hillslope sediment delivery reductionswere done for both the Rokava and Upper-Dragonja sub-catchments.The Rokava sub-catchment showed a reduction of 45% in the hillslopesediment delivery in the period 1954 to 1975. After 1975, the hillslopesediment delivery stayed more or less stable. For the Upper-Dragonjasub-catchment, the largest change occurred in the period 1954 to 1975also. However, in this sub-catchment the decrease in sedimentoutflow continued, making the total reduction 76% of the sedimentoutflow in 1954 (Fig. 8).
The differences in reforestation in these two sub-catchments aredue to differences in the geology (Rokava sub-catchment has lessrelief) and the more favourable topographical setting of the Rokavamakes it more accessible from the nearby city of Koper.
When the decrease in discharge is compared to the decrease insuspended sediment load, a significantly larger decrease was observedin sediment load (85%) than in discharge (75%). Especially after 1975the difference in decrease is evident, which coincides with a newincision phase in the morphology of the channel (Keesstra et al., 2005).Associated with these changes is the strong relation (R2=0.7) betweenthe percentage of fields in the catchment and the discharge at the outletof the catchment. The discharge decreases with less agriculture,indicating the effect of increased evapotranspiration due to moretrees and shrubs. Similar results of the relation between forest densityand discharge were involved to explain changes in river activity andmorphology during the Late Glacial times (Vandenberghe, 1995).
Acknowledgements
I would like to thank Lidija Globevnik for lending me the aerialphotographs of 1954 and 1994 and for helping us with arranging thepermits for the fieldwork. Christiaan van der Tol and Gregor Petkovšekare thanked for their efforts collecting some of the suspendedsediment samples.
References
Amore, E., Modica, C., Nearing, M.A., Sontoro, V.C., 2004. Scale effect in USLE and WEPPapplication for soil erosion computation from three Sicilian basins. Journal ofHydrology 293, 100–114.
Desmet, P.J.J., Govers, G., 1996. A GIS-procedure for automatically calculating the USLELS factor on topographically complex landscape units. Journal of Soil and WaterConservation 51, 427–433.
Dissmeyer, G.E., Foster, R.F., 1980. A Guide for Predicting Sheet and Rill Erosion on ForestLand. USDA-Forest Service, Atlanta, Georgia, USA.
Erskine, W.D., Mahmoudzadeh, A., Myers, C., 2002. Land use effects on sediment yieldsand soil loss rates in small basins of Triassic sandstone near Sydney, NSW, Australia.Catena 49 (4), 271–287.

71S.D. Keesstra et al. / Catena 78 (2009) 60–71
European Commission, 2000. Managing Natura 2000 Sites, The Provisions of Article 6 ofthe ‘Habitats’ Directive 92/43/CEE. DG Environment.
Fryirs, K., Brierley, G.J., 2001. Variability in sediment delivery and storage along rivercourses in Bega catchment, NSW, Australia: implications for geomorphic riverrecovery. Geomorphology 38 (3–4), 237–265.
Geološki zavod Slovenije, 2003. Geološke karte Slovenije 1:100 000, Ljubliana.HMZ, 2003. Klimatografija Slovenije. Hydrometerorological Institute of Slovenia,
Ljubljana.Keesstra, S.D., 2006. Impact of Natural Reforestation on the Hydrology, Geomorphology
and Sediment Budget of the Dragonja River, SW Slovenia. PhD Thesis, VrijeUniversiteit, Amsterdam, 188 pp. (http://www.falw.vu.nl/images_upload/F8F6500C-9F54-B447-F1B06B33E73580D4.pdf).
Keesstra, S.D., 2007. Impact of natural reforestation on floodplain sedimentation in theDragonja basin, SW Slovenia. Earth Surface Processes and Landforms 32, 49–65.
Keesstra, S.D., van Dam, O., 2002. Changing sediment generation and supply in theDragonja catchment, SW Slovenia. In: Leuven, R.S.E.W., van Os, A.G., Nienhuis, P.H.(Eds.), NCR-days 2002, Current Themes in Dutch River Research. NetherlandsCentre for River Studies, Wageningen, pp. 114–116.
Keesstra, S.D., van Huissteden, J., Vandenberghe, J., van Dam, O., de Gier, J., Pleizier, I.D.,2005. Evolution of themorphology of the river Dragonja (SW Slovenia) due to land-use changes. Geomorphology 69, 191–207.
Konert, M., Vandenberghe, J., 1997. Comparison of laser grain size analysis with pipetteand sieve analysis: a solution for the underestimation of the clay fraction.Sedimentology 44, 523–535.
Lambert, C.P., Walling, D.E., 1987. Floodplain Sedimentation — a preliminary investiga-tion of contemporary depositionwithin the lower reaches of the River Culm, Devon,UK. Geografiska Annaler Series a-Physical Geography 69 (3–4), 393–404.
Lenhart, T., Fohrer, N., Frede, H.G., 2003. Effects of land use changes on the nutrientbalance in mesoscale catchments. Physics and Chemistry of the Earth, Parts A/B/C28 (33–36), 1301–1309.
Lièbault, F., Gómez, B., Page, M., Marden, M., Peacock, D., Richard, D., y Trotter, C.M.,2005. Land-use change, sediment production and channel response in uplandregion. Rivers Research and Applications 21, 739–756.
Martínez-Casasnovas, J.A., Sánchez-Bosch, I., 2000. Impact assessment of changes inland use/conservation practices on soil erosion in the Penedès–Anoia vineyardregion (NE Spain). Soil and Tillage Research 57 (1–2), 101–106.
Melik, A., 1960. Slovensko Primorje. Slovenska matica, Ljubljana.Ogrin, D., 1995. The climate of Slovene Istria. Knjižnica Annales, Koper, p. 381.Orehek, S., 1972. Eocenski flis Pivske kotline in Brkinov. VI Kongres geologa SFRJ Zagreb,
pp. 253–270.Phillips, J.D., 2003. Sources of nonlinearity and complexity in geomorphic systems.
Progress in Physical Geography 27, 1–23.Piégay, H., Walling, D.E., Landon, N., He, Q., Liébault, F., Petiot, R., 2004. Contemporary
changes in sediment yield in an alpine mountain basin due to afforestation (theupper Drôme in France). Catena 20, 183–212.
Poesen, J.W.A., Hooke, J.M., 1997. Erosion, flooding and channel management inMediterranean environments of southern Europe. Progress in Physical Geography21, 157–199.
Renard, K.G., Foster, G.R., Weesies, G.A., McCool, D.K., Yoder, D.C., 1997. Predicting soilerosion by water: a guide to conservation planning with the Revised Universal SoilLoss Equation (RUSLE). USDA, Agriculture Handbook No 703. Agricultural ResearchService, U.S. Dept. of Agriculture, Washington D.C., p. 404.
Ries, J.B., Marzolff, I., 2003. Monitoring of gully erosion in the Central Ebro Basin bylarge-scale aerial photography taken from a remotely controlled blimp. Catena 50,309–328.
Rijsdijk, A., Bruijnzeel, L.A., 1990. Erosion, sediment yield and land-use patterns in theupper Konto watershed East Java, Indonesia. Konto River Project No. 18, vol. II. VrijeUniversiteit, Amsterdam, pp. 49–55.
Russell, M.A., Walling, D.E., Hodgkinson, R.A., 2001. Suspended sediment sources in twosmall lowland agricultural catchments in the UK. Journal of Hydrology 252, 1–24.
Schumm, S.A., 1974. Geomorphic Thresholds and Complex Response of DrainageSystems, in Fluvial Geomorphology (Edited by M. Morisawa) Publications in
Geomorphology, SUNY Binghamton, New York, p. 299–310. Reprinted 1981, Allenand Unwin, London.
Singh, R.B., 1999. Land use/cover changes, extreme events and ecohydrologicalresponses in the Himalayan region. Hydrological Processes 12 (13–14), 2043–2055.
Steegen, A., Govers, G., Takken, I., Nachtergaele, J., Poesen, J., Merckx, R., 2001. Factorscontrolling sediment and phosporus export from two Belgian agriculturalcatchments. Journal of Environmental Quality 30, 1249–1258.
Trimble, S.W., 1981. Changes in sediment storage in the Coon Creek Basin, Driftless area,Wisconsin. Science 214, 181–183.
Trimble, S.W., 1999. Decreased rates of alluvial sediment storage in the Coon Creek basinWisconsin, 1975–93. Science 285, 1244–1246.
Vanacker, V., Vanderschaeghe, M., Govers, G., Willems, E., Poesen, J., Deckers, J., DeBievreet, B., 2003. Linking hydrological, infinite slope stability and land-use changemodels through GIS for assessing the impact of deforestation on slope stability inhigh Andean watersheds. Geomorphology 52 (3–4), 299–315.
Vandenberghe, J., 1995. Timescales, climate and river development. Quaternary ScienceReviews 14 (6), 631–638.
Vandekerckhove, L., Muys, B., Poesen, J., De Weerdt, B., Coppé, N., 2001. A method fordendrochronological assessment of medium-term gully erosion rates. Catena 45,123–161.
Van Oost, K., Govers, G., Desmet, P.J.J., 2000. Evaluating the effects of landscapestructure on soil erosion by water and tillage. Landscape Ecology 15 (6), 1–6.
Van Rompaey, A., Verstraeten, G., Van Oost, K., Govers, G., Poesen, J., 2001. Modellingmean annual sediment yield using a distributed approach. Earth Surface Processesand Landforms 26, 1221–1236.
Van Rompaey, A., Krasa, J., Dostal, T., Govers, G., 2003. Modelling sediment supply torivers and reservoirs in Eastern Europe during and after the collectivisation period.Hydrobiologia 494 (1–3), 169–176.
Van Rompaey, A., Bazzoffi, P., Jones, R., Montanarella, L., 2005. Modelling sedimentyields in Italian catchments. Geomorphology 65 (1–2), 157–169.
Varela, M.E., Blas, E.D., Benito, E., 2001. Physical soil degradation induced bydeforestation and slope modification in a temperate–humid environment. LandDegradation & Development 12 (5), 477–484.
Verstraeten, G., 2006. Regional scale modeling of sediment fluxes with SRTM elevationdata. Geomorphology 81, 128–140.
Verstraeten, G., Van Oost, K., Van Rompaey, A., Poesen, J., Govers, G., 2002. Evaluating anintegrated approach to catchment management to reduce soil loss and sedimentpollution through modelling. Soil Use and Management 19, 386–394.
Verstraeten, G., Poesen, J., Gillijns, K., Govers, G., 2006. The use of riparian vegetatedfilter strips to reduce river sediment loads: an over-estimated control measure?Hydrological Processes 20, 4259–4267.
Verstraeten, G., Prosser, I.P., Fogarty, P., 2007. Predicting the spatial patterns of hillslopesediment delivery to river channels in the Murrumbidgee catchment, Australia.Journal of Hydrology 334 (3–4), 440–454.
Walling, D.E., 1994. Measuring sediment yield from river basins, In: Lal, R. (Ed.), SoilErosion Research Methods, edn. Soil and Water Conservation Society, Ankeny, IA,pp. 39–80.
Walling, D.E., 1999. Linking land use, erosion and sediment yields in river basins.Hydrobiologia 410, 223–240.
Walling, D.E., Quine, T.A., 1993. Using chernobyl-derived fallout radionuclides toinvestigate the role of downstream conveyance losses in the suspended sedimentbudget of the River Severn, United-Kingdom. Physical Geography 14 (3), 239–253.
Walling, D.E., He, Q., Nicholas, A.P., 1996. Floodplains as suspended sediment sinks. In:Anderson, M.G., Walling, D.E., Bates, P.D. (Eds.), Floodplain Processes. Wiley,Chichester, pp. 399–440.
Wischmeier, W.H., Smith, D.D., 1978. Predicting rainfall erosion losses: a guide toconservation planning. USDA Agricultural Handbook 537. Agricultural ResearchService, U.S. Dept. of Agriculture, Washington D.C.
Zupancic, N., Pric, S., 1999. Calcium distribution in soils and stream sediments in Istria(Croatia) and the Slovenian littoral. Journal of Geochemical Exploration 65,205–218.