
The Maintainenance of Gottscheerish in Slovenia, Austria, Germany, Canada and the USA (English)
Upload
khangminh22Category
view
0download
0
31.1.2018
1
Rezultati modela vodne bilance za Slovenijo
Water balance simulation results for the whole country of Slovenia
mGROWA-Slovenia
Peter Frantar Jure JermanFrank Herrmann Zlatko MikuličMišo Andjelov Anže MedvedMojca Dolinar Marjan BatRenato Bertalanič Florjana UlagaDamijana Gartner Jure JerovšekAndreja Sušnik Damjan DvoršekGregor Gregorič Jure CedilnikSašo Petan Mira KoboldJože Guši Miklavčič Jože UhanPetar Hitij Frank Wendland
Kazalo
1. Uvod
2. mGROWA v Evropi
3. Modelski pristop mGROWA in razvojni pristop za Slovenijo
4. Rezultati mGROWA za obdobje 1981-2010
5. Projekcije možnega vpliva podnebnih sprememb na vodno bilanco v Sloveniji
6. Zaključek, sklepi in nadaljevanje…

31.1.2018
2
mGROWA v Evropi
mGROWA applications in Europe
Frank Wendland
• Tetzlaff, B., Andjelov, M., Kuhr, P., Uhan, J. & Wendland, F. (2015): Model-based assessment of groundwater recharge in Slovenia.- Environmental Earth Sciences 74, 6177–6192
• Andelov, M., Kunkel, R., Uhan,J. & Wendland, F. (2014): Determination of nitrogen reduction levels necessary to reach groundwater quality targets in Slovenia.- Journal of Environmental Sciences 29-9, 1806-181
GROWA-SIregionalni model
letnevodne bilance
regionalni modeltransporta nitrata v
tla in podzemno vodo
GROWA&DENUZ&WEKU-SI
mGROWA-SIregionalni model
dnevnevodne bilance
10 years collaborationAgencija RS za okolje – Forschungzentrum JÜLICH
2008 2009 2010 2011 2012 2013 2014 2015 2016 2017 2018

31.1.2018
3
Geographical overview of established mGROWA modelling activities since 2011
North-Westernof Jordan
Pinioscatchment(Greece)
Izmit baycatchment(Turkey)
Ergenecatchment(Turkey)
Slovenia
Riu Mannucatchment(Italy)
Thau lagooncatchment(France)
North Rhine-Westphalia
Lower Saxony
Metropolitan area of Hamburg
Alentocatchment(Italy)
Central Europe
MediterraneanMiddle East
Mecklenburg-West Pomerania
Rhineland-Palatinate
Weser catchment
Metropolitan area of Hamburg (BMBF, 2011-2015):− Crop-specific irrigation need− Indicators for assessing climate change impact on
sustainability of groundwater-supplied irrigation
Lower Saxony (LBEG, NLWKN, since 2011):− Usable groundwater quantities− Ensemble simulations for identifying mechanisms of
climate-induced temporal shifts of the groundwater recharge period
North Rhine-Westphalia (LANUV, since 2011):− Usable groundwater quantities − Climate change impact on groundwater− Implementation into the nutrient model chain
RAUMIS – mGROWA – DENUZ – WEKU for implementation of EU-WFD and EU-NiD
Erftverband (regional water board, since 2011):− Intercomparison of groundwater recharge (models)
Weser catchment (BMBF, since 2017):− Assessing pathways for inputs of micro-plastics
Rhineland-Palatinate, Mecklenburg-West-Pomerania (MUEEF, LUNG, since 2017/18):− Implementation into the nutrient model chain
RAUMIS – mGROWA – DENUZ – WEKU for implementation of EU-WFD and EU-NiD
Specific research priorities in different
model areas (Germany)

31.1.2018
4
Thau lagoon catchment (EU-FP7, 2011-2015):− Multi-model-ensemble for projecting climate change
impacts on water resources and droughts− Influence of different soil parameter sources (soil maps
vs. remote sensing) on groundwater recharge
Izmit bay catchment (EU-FP7, 2011-2015):− Multi-model-ensemble for projecting climate change
impacts on water resources and droughts
Riu Mannu catchment (EU-FP7, 2011-2015):− Influence of root zone characteristic in climate impact
studies with relation to groundwater recharge
Pinios catchment (cooperation since 2012):− Routing of in-situ groundwater recharge from recharge
areas to managed aquifers− Climate change impacts on groundwater recharge of
overused aquifers− Parameter assessment in groundwater recharge areas
Alento catchment (DAAD, planned):− Parameter assessment in groundwater recharge areas
Ergene catchment and North-Western of Jordan (cooperation since 2014):− Drought indices− Quantification of water resources
Slovenia (ARSO, since 2015):− Initial implementation of the mGROWA snow module− Influence of snowpack on temporal and spatial patterns of
groundwater recharge
Specific research priorities in different
model areas(Europe, Mediterranean)
Peer reviewed mGROWA publications (since 2013)Herrmann F, Hübsch L, Elbracht J, Engel N, Keller L, Kunkel R, Müller U, Röhm H, Vereecken H, Wendland F. Mögliche Auswirkungen von Klimaänderungen auf die Grundwasserneubildung in Niedersachsen. Hydrologie und Wasserbewirtschaftung 2017; 61: 245-261. DOI: 10.5675/HyWa_2017,4_3
Herrmann F, Baghdadi N, Blaschek M, Deidda R, Duttmann R, La Jeunesse I, Sellami H, Vereecken H, Wendland F. Simulation of futuregroundwater recharge using a climate model ensemble and SAR-image based soil parameter distributions — A case study in an intensively-used Mediterranean catchment. Science of The Total Environment 2016; 543: 889-905. DOI: 10.1016/j.scitotenv.2015.07.036
Ehlers L, Herrmann F, Blaschek M, Duttmann R, Wendland F. Sensitivity of mGROWA-simulated groundwater recharge to changes in soil andland use parameters in a Mediterranean environment and conclusions in view of ensemble-based climate impact simulations. Science of The Total Environment 2016; 543: 937-951. DOI: 10.1016/j.scitotenv.2015.04.122
Herrmann F, Kunkel R, Ostermann U, Vereecken H, Wendland F. Projected impact of climate change on irrigation needs and groundwaterresources in the metropolitan area of Hamburg (Germany). Environmental Earth Sciences 2016; 75. DOI: 10.1007/s12665-016-5904-y
La Jeunesse I, Cirelli C, Aubin D, Larrue C, Sellami H, Afifi S, Bellin A, Benabdallah S, Bird DN, Deidda R, Dettori M, Engin G, Herrmann F, Ludwig R, Mabrouk B, Majone B, Paniconi C, Soddu A. Is climate change a threat for water uses in the Mediterranean region? Results from a survey at local scale. Science of The Total Environment 2016; 543: 981-996. DOI: 10.1016/j.scitotenv.2015.04.062
Panagopoulos A, Arampatzis G, Tziritis E, Pisinaras V, Herrmann F, Kunkel R, Wendland F. Assessment of climate change impact in thehydrological regime of River Pinios Basin, central Greece. Desalination and Water Treatment 2016; 57: 2256-2267. DOI: 10.1080/19443994.2014.984926
Herrmann F, Keller L, Kunkel R, Vereecken H, Wendland F. Determination of spatially differentiated water balance components includinggroundwater recharge on the Federal State level – A case study using the mGROWA model in North Rhine-Westphalia (Germany). Journal ofHydrology: Regional Studies 2015; 4: 294-312. DOI: 10.1016/j.ejrh.2015.06.018
Kreins P, Henseler M, Anter J, Herrmann F, Wendland F. Quantification of Climate Change Impact on Regional Agricultural Irrigation andGroundwater Demand. Water Resources Management 2015; 29: 3585-3600. DOI: 10.1007/s11269-015-1017-8
Herrmann F, Chen S, Heidt L, Elbracht J, Engel N, Kunkel R, Müller U, Röhm H, Vereecken H, Wendland F. Zeitlich und räumlich hochaufgelöste flächendifferenzierte Simulation des Landschaftswasserhaushalts in Niedersachsen mit dem Model mGROWA. Hydrologie und Wasserbewirtschaftung 2013; 57: 206-224. DOI: 10.5675/HyWa_2013,5_2
Herrmann et al. Influence of snowpack on spatiotemporal patterns of groundwater recharge at the state level: Submission to Hydrology and Earth System Sciences or Water
Frantar et al. Regional patterns and water resources availability in Slovenia. Submission to Journal of Hydrology: Regional Studies or Water

31.1.2018
5
mGROWA modelski pristop in razvoj za Slovenijo
mGROWA modelling approach and specific developments for the country of Slovenia
Frank Herrmann
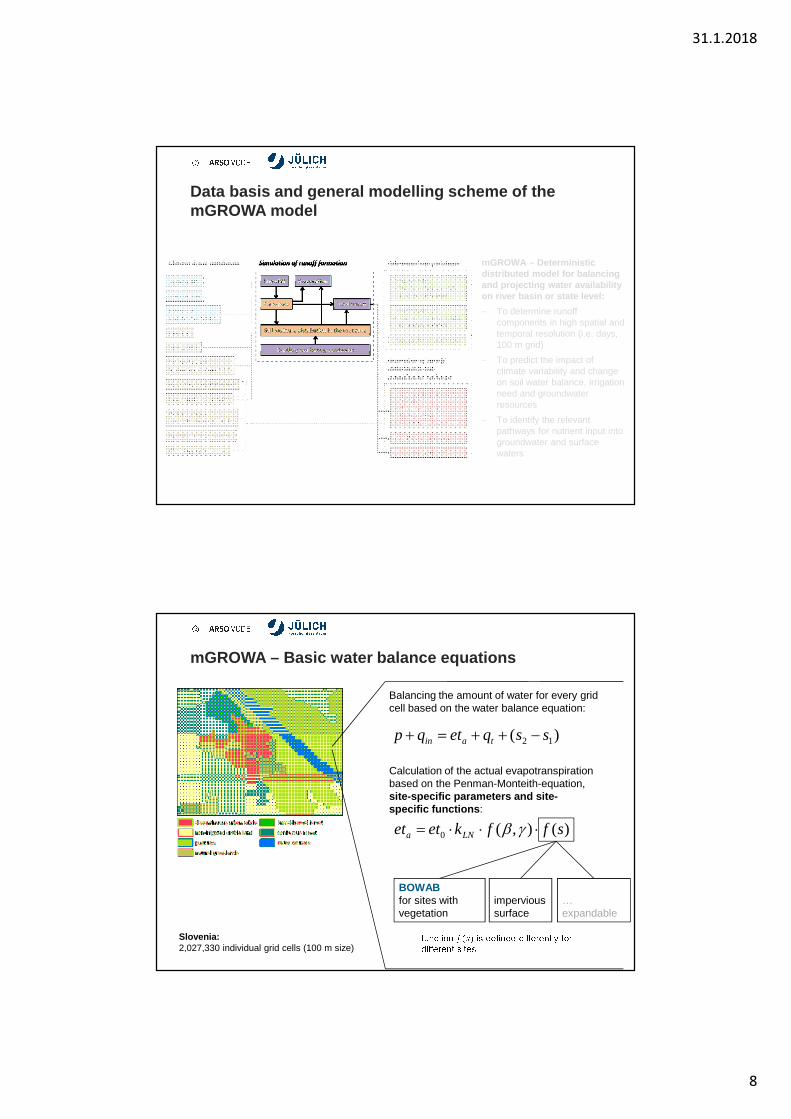
Data basis and general modelling scheme of the mGROWA model
mGROWA – Deterministic distributed model for balancing and projecting water availability on river basin or state level:
− To determine runoff components in high spatial and temporal resolution (i.e. days, 100 m grid)
− To predict the impact of climate variability and change on soil water balance, irrigation need and groundwater resources
− To identify the relevant pathways for nutrient input into groundwater and surface waters
Sources: ARSO - Slovenian Environment Agency, European Environment Agency (EEA), Biotechnical Faculty - Universityof Ljubljana, Surveying and Mapping Authority of the Republic of Slovenia (GURS), Geological Survey of Slovenia (GeoZS), Slovenian Ministry of Agriculture, Forestry and Food (MKGP) + various literature sources
31.1.2018
6
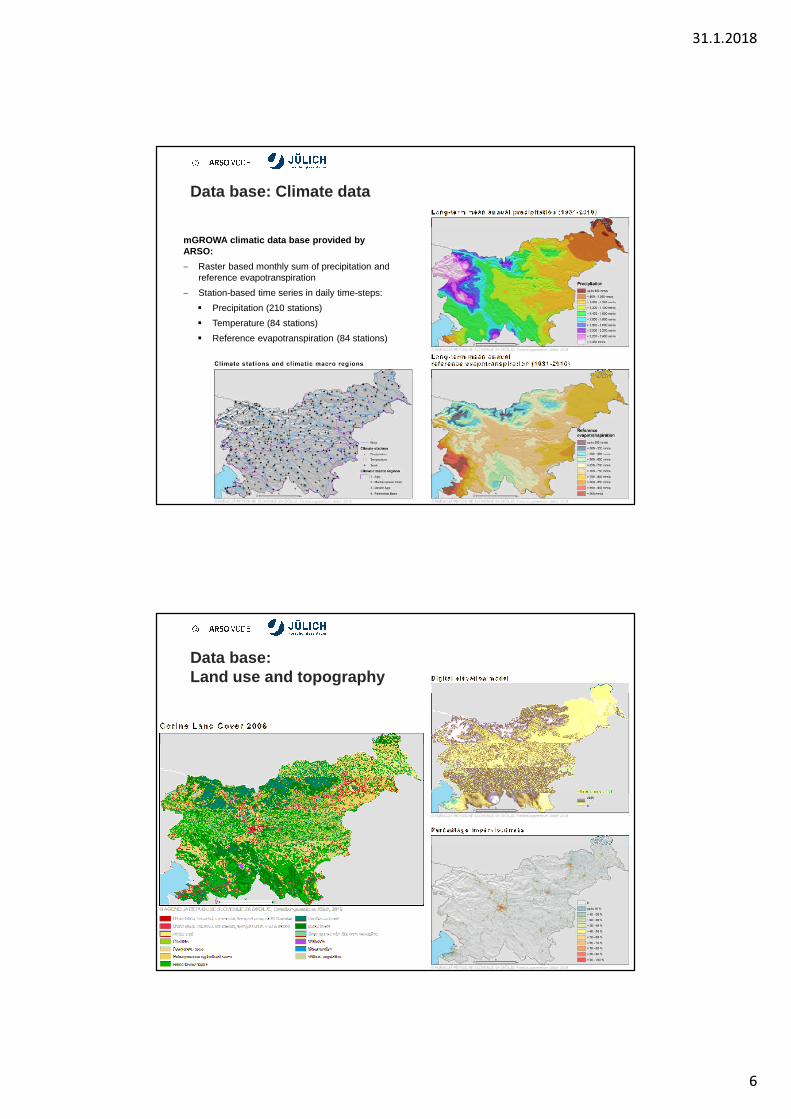
Data base: Climate data
mGROWA climatic data base provided by ARSO:
− Raster based monthly sum of precipitation and reference evapotranspiration
− Station-based time series in daily time-steps:
� Precipitation (210 stations)
� Temperature (84 stations)
� Reference evapotranspiration (84 stations)
Data base: Land use and topography

31.1.2018
7
Data base: Soil map > 10,000 soil profile descriptions
Data base: Hydrogeological map
Tetzlaff, B., Andjelov, M., Kuhr, P., Uhan, J., Wendland, F., 2015. Model-based assessment of groundwater recharge in Slovenia. Environmental Earth Sciences , 74(7): 6177-6192. DOI: 10.1007/s12665-015-4639-5
31.1.2018
8
Data basis and general modelling scheme of the mGROWA model
mGROWA – Deterministic distributed model for balancing and projecting water availability on river basin or state level:
− To determine runoff components in high spatial and temporal resolution (i.e. days, 100 m grid)
− To predict the impact of climate variability and change on soil water balance, irrigation need and groundwater resources
− To identify the relevant pathways for nutrient input into groundwater and surface waters
mGROWA – Basic water balance equations
)( 12 ssqetqp tain −++=+
)(),(0 sffketet LNa ⋅⋅⋅= γβ
Balancing the amount of water for every grid cell based on the water balance equation:
Calculation of the actual evapotranspiration based on the Penman-Monteith-equation, site-specific parameters and site-specific functions :
BOWAB for sites with vegetation
impervious surface
… expandable
Slovenia: 2,027,330 individual grid cells (100 m size)

31.1.2018
9
Soil water content simulation in daily time steps
1,1,1,1,1 pann qetp −−+=+ θθ
2,2,1,2,2,1 papnn qetq −−+=+ θθ
3,3,2,3,3,1 papnn qetq −−+=+ θθ
4,4,3,4,4,1 papnn qetq −−+=+ θθ
5,5,4,5,5,1 papnn qetq −−+=+ θθ
- Automated structuring of grids displaying vegetation in variable soil layers (at present 5 layers, 3 dm thickness each).
- Automated Parameterization of model layers based on mapped soil profiles (determination of „effective field capacity, field capacity, etc.)
1. Determination of p and et02. Determination of irrigation need
depending on soil moister content in the root zone (optional)
3. Calculation of capillary rise rate depending on soil moisture tension
4. Calculation of actual evapotranspiration depending on soil moisture and rooting depth.
5. Calculation of the percolation water rates between the 5 individual layers and out of the root zone (simplified overflow model)
6. Re-calculation of water balance per layer
( )( ) 11max1, )( ASetppeta ⋅⋅−−= θ
22max2, )(S Aeteta ⋅⋅= θ
33max3, )(S Aeteta ⋅⋅= θ
44max4, )(S Aeteta ⋅⋅= θ
55max5, )(S Aeteta ⋅⋅= θ
2,aet
1,aet
3,aet
4,aet
5,aet
p
)(θnS Disse-function (Water content)
Maximal evapotranspiration
Rooting depth factor (0…1)
cketfet ⋅⋅= 0max ),( γβSchichtA
−≤=sonstFK
FKfürqp
11
111,
0
θθ
−≤=sonstFK
FKfürqp
22
222,
0
θθ
−≤=sonstFK
FKfürqp
33
333,
0
θθ
−≤=sonstFK
FKfürqp
44
444,
0
θθ
−≤=sonstFK
FKfürqp
55
555,
0
θθ
1,pq
2,pq
3,pq
4,pq
5,pq
Percolation water rate per cell and day=
Total runoff per cell
0),( etf ⋅γβ
crq
irr
mGROWA – New implementation of snow storage
��� = ��� · �� · �����Evaposublimation
� ��� =� + ���� −
2 · ����
Snowfall
)( 12 ssqetqp tain −++=+
The storage term comprises:
− Snow storage
− Soil water storage
Balancing the amount of water for every grid cell based on the water balance equation:
(taken over from WaSiM-ETH)
���� = �� · − � �Melting and refreezing
���� � = �� · ������ � + ���� �Solid and liquid water storage of the snowpack
Surplus melt water is running off ���
Landscape with snow cover
[Snow water equivalent]

31.1.2018
10
24
− Zonal estimation of air temperature lapse rates (i.e. relation between temperature and ground elevation)
− Interpolation of temperature fields based on observed station-based temperature values and the estimated lapse rates
− Calculation of snowfall from precipitation and temperature fields, i.e. separation into rain and snow
− Calculation of evaposublimation from snowpack using distributed evaposublimation-factors
− Calculation of snow melting using the temperature-index approach and distributed degree-day factors
− Calculation of refreezing of liquid water (snowpack metamorphism)
− Recalculation of liquid and solid water content in the snowpack
− If liquid water content exceeds the liquid water storage capacity of the snowpack, then snowmelt runoff is calculated and separated into a surface and a subsurface part
Tmin Tmax
Alp
s
D
inar
icA
lps
Med
iterr
anea
nB
.P
anno
nian
B.
1971-01-01
-6.7 K/1000 m -5.8 K/1000 m
-4.7 K/1000 m -3.7 K/1000 m
-6.0 K/1000 m -7.7 K/1000 m
-7.0 K/1000 m -4.9 K/1000 m
Snowpack simulation in daily time steps
New snow water equivalent
Snowpack water equivalent
Runoff
Surplus water in soil
2012−11 2012−12 2013−01 2013−02 2013−03 2013−04 2013−05 2013−06
Temperature (min & max)
Example – Site in high altitudes of the Alps in 2013

31.1.2018
11
Data basis and general modelling scheme of the mGROWA model
mGROWA – Deterministic distributed model for balancing and projecting water availability on river basin or state level:
− To determine runoff components in high spatial and temporal resolution (i.e. days, 100 m grid)
− To predict the impact of climate variability and change on soil water balance, irrigation need and groundwater resources
− To identify the relevant pathways for nutrient input into groundwater and surface waters
Site characteristics that determine groundwater recharge in mGROWA
Dominating site condition in Slovenia

31.1.2018
12
Distributed BFI values in Slovenia
Tetzlaff, B., Andjelov, M., Kuhr, P., Uhan, J., Wendland, F., 2015. Model-based assessment of groundwater recharge in Slovenia. Environmental Earth Sciences , 74(7): 6177-6192. DOI: 10.1007/s12665-015-4639-5
High BFI values >0.6:
− Mainly unconsolidated rock areas in the lowlands
− The groundwater path is the dominant runoff pathway
− High water storage capacity of aquifers
Moderate BFI values 0.6 .. 0.4:
− Mainly karstified rock areas
− Aquifers show spatially highly varying permeabilities
− The subsurface path is the dominant runoff pathway but composed of fast and slow portions (short and long residence times)
− Short-term storage capacity for fast sub-surface runoff is high and the long-term storage capacity for slow components is low
Low BFI values <0.4:
− Mainly fractured rock areas
− Direct runoff (overland flow, interflow) is the dominant runoff pathway
− Low water storage capacity of aquifers
��� = ������ ���������� � �������
Rezultati mGROWA v obdobju 1981-2010
mGROWA results for the reference period 1981-2010
Peter Frantar, Gregor Gregorič

31.1.2018
13
mGROWA – Overview of grid output
Groups Quantities Temporal resolution Symbol
General water balance
Total evaporation Monthly & daily eta
Total runoff (formation) Monthly & daily q
Inflow over system boundaries consisting of capillary rise from shallow groundwater and vaporised water from free water surfaces
Monthly e
Snowpack
New snow water equivalent Monthly & daily nswe
Evapo-sublimation from snow surface Monthly es
Snowpack water equivalent Daily spwe
Storage statistics
Number of days in which snowpack is present Month ... Decades spd
Number of days with soil water deficit above a threshold Month ... Decades ndswd
Maximum number of consecutive days with soil water deficit above a threshold
Month … Decades mdswd
Irrigation Cumulated irrigation need according to crop-specific irrigation rules Monthly mi
mGROWA – Overview of grid output
Groups Quantities Temporal resolution Symbol
Runoff components & balances
Net total runoff (total runoff minus inflow over system boundaries) Monthly qn
Climatic water balance Monthly cwb
Runoff from snowpack (snowmelt) Monthly & daily qsp
Runoff from impervious surfaces (e.g. paved areas in cities) Monthly qu
Runoff from artificial drainage systems in agriculture Monthly qad
Direct runoff (including surface runoff) Monthly qd
Net groundwater recharge Monthly qrn
Identification of groundwater recharge
Proportion of groundwater recharge in total runoff Monthly bfi
Site characteristic that determine groundwater recharge Monthly scc
31.1.2018
14
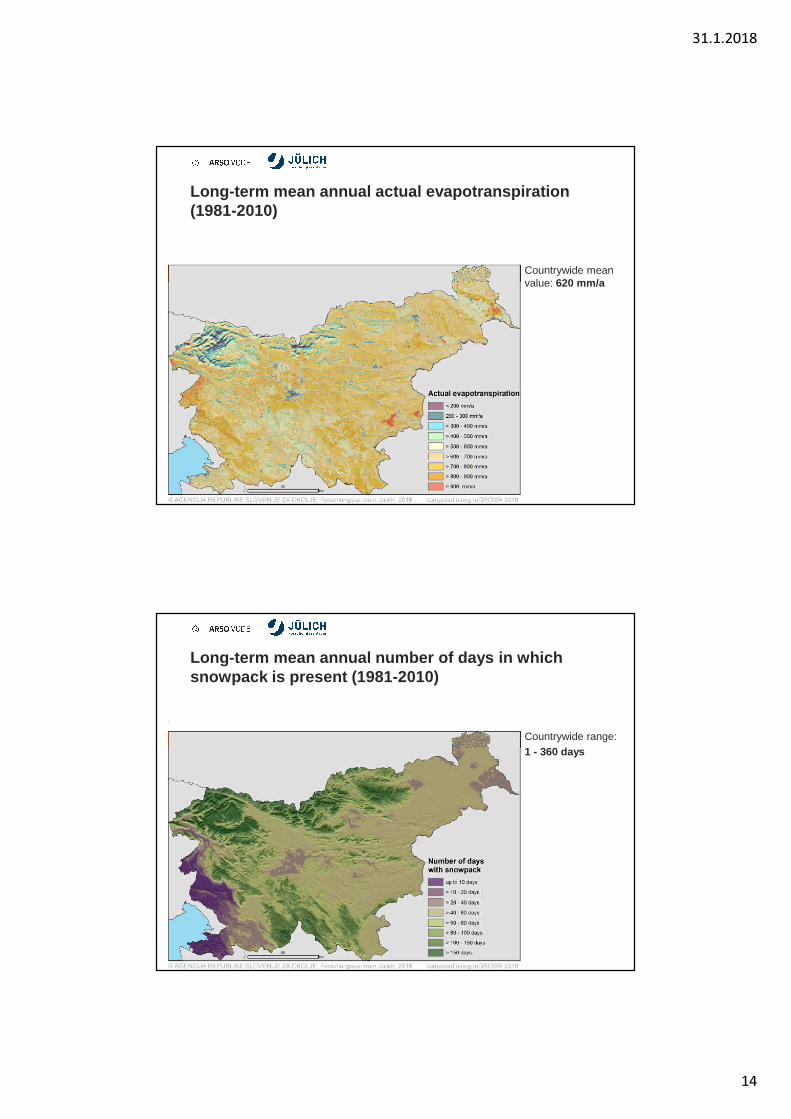
Countrywide meanvalue: 620 mm/a
Long-term mean annual actual evapotranspiration(1981-2010)
Countrywide range: 1 - 360 days
Long-term mean annual number of days in which snowpack is present (1981-2010)

31.1.2018
15
Countrywide meanvalue: 790 mm/a
Long-term mean annual total runoff (1981-2010)
Countrywide meanvalue: 305 mm/a
Note: Countrywide mean of groundwater recharge calculated with GROWA (1971-2000) was 304 mm/a
Long-term mean annual groundwater recharge(1981-2010)

31.1.2018
16
Countrywide mean of arable land: 39 days
Long-term mean number of days with soil moisture de ficitabove 60 % during summer half-year (1981-2010)
Countrywide mean of arable land: 16 days
Long-term mean number of days with soil moisture de ficitabove 80 % during summer half-year (1981-2010)

31.1.2018
17
Evaluation of model performance on the country-leve l
Observed
Sim
ulat
ed
Evaluation data basis:
− 419 Stations in Slovenia with the information snowpack or no snowpack
Long-term mean annual number of days with snowpack (1981-2010)
Mediterranean Basin Alps Dinaric Alps Pannonian Basin
No significant tendency to over- or underestimation in Alps, Dinaric Alps and Pannonian Basin
Evaluation of model performance on the country-leve l
Evaluation data basis:
− 77 streamflow records
− Comparison of long-term mean annual values
− Very good match of observed and simulated total runoff on the country-level
− Very slight tendency to underestimation indicated by PBIAS = 3%
Total runoff (1981-2010)

31.1.2018
18
Evaluation of model performance on the country-leve l
Groundwater recharge (1981-2010)
Evaluation data basis:
− 62 streamflow records
− Calculation of “observed” base flow using the methods of Wundt (unconsolidated rock zones) and Demuth (soil rock zones)
− Good match of calculated base flow and simulated groundwater recharge on the country-level
− Slight tendency to underestimation indicated by PBIAS = 9 %
Interannual variability of total runoff
0
200
400
600
800
1000
1200
1400
Total runoff / Skupni odtok – Slovenia [mm]

31.1.2018
19
Interannual variability of groundwater recharge
0
50
100
150
200
250
300
350
400
450
500
Groundwater recharge / Napajanje podzemne vode – Slovenia [mm]
Interannual variability of groundwater recharge in t he Murska kotlina groundwater body

31.1.2018
20
Interannual variability of number of days with soil moisture deficit above 60 % during summer half-year
Interannual variability of number of days with soil moisture deficit above 80 % during summer half-year

31.1.2018
21
Influence of snowpack on runoff formationSava Dolinka – Kranjska Gora
Snow module deactivated
Snow module activated
Snowpack water equivalent
Annual cycle of snow cover:Long-term mean monthly number of days in which snowpack is present (1981-2010)

31.1.2018
22
Annual cycle of Groundwater recharge:Long-term mean monthly groundwater recharge (1981-2 010)
Runoff formation in winter 2010/2011
November December January
April
March
February

31.1.2018
23
Runoff formation in summer 2011
May June July
October
September
August
Groundwater recharge in winter 2010in % of longterm mean 1981-2010
November December January
April
March
February

31.1.2018
24
May June July
October
September
August
Groundwater recharge in summer 2011in % of longterm mean 1981-2010
Progression of precipitation, snowpack, soil water deficit and groundwater recharge within the year 20 11
31.1.2018
25
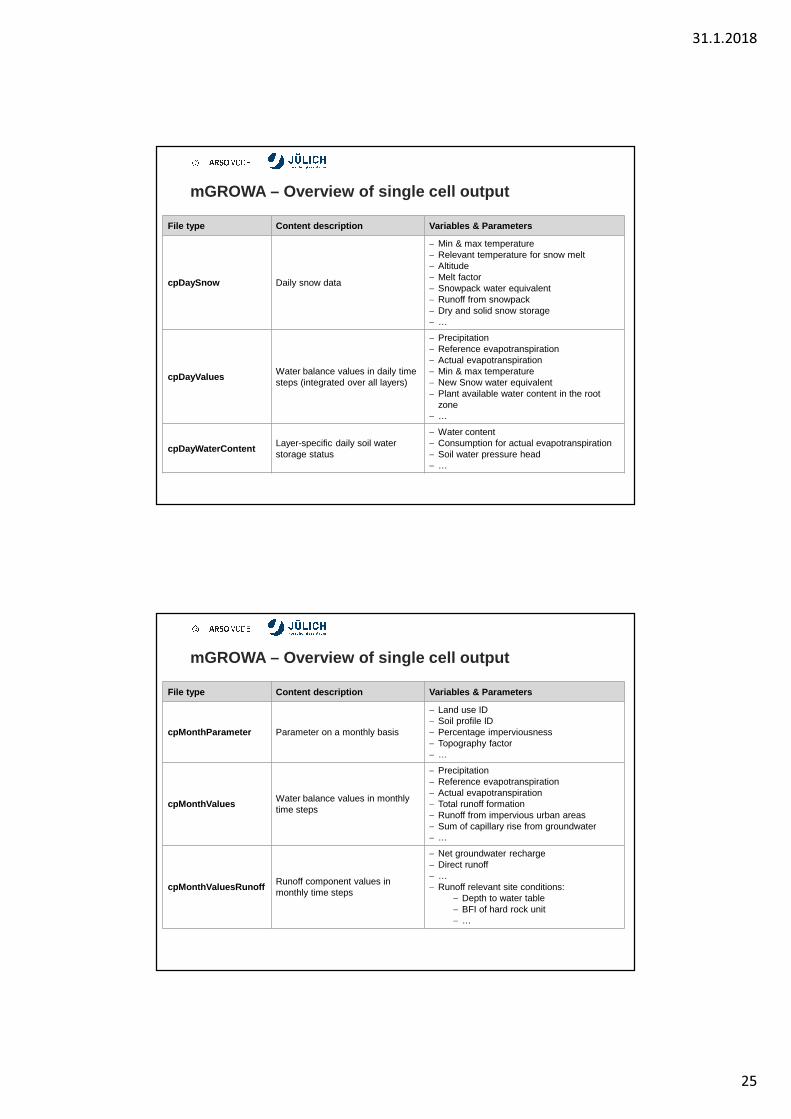
mGROWA – Overview of single cell output
File type Content description Variables & Parameters
cpDaySnow Daily snow data
− Min & max temperature− Relevant temperature for snow melt− Altitude− Melt factor− Snowpack water equivalent− Runoff from snowpack− Dry and solid snow storage− …
cpDayValuesWater balance values in daily timesteps (integrated over all layers)
− Precipitation− Reference evapotranspiration− Actual evapotranspiration− Min & max temperature− New Snow water equivalent− Plant available water content in the root
zone− …
cpDayWaterContentLayer-specific daily soil water storage status
− Water content− Consumption for actual evapotranspiration− Soil water pressure head− …
mGROWA – Overview of single cell output
File type Content description Variables & Parameters
cpMonthParameter Parameter on a monthly basis
− Land use ID− Soil profile ID− Percentage imperviousness − Topography factor− …
cpMonthValuesWater balance values in monthly time steps
− Precipitation− Reference evapotranspiration− Actual evapotranspiration− Total runoff formation− Runoff from impervious urban areas− Sum of capillary rise from groundwater− …
cpMonthValuesRunoffRunoff component values in monthly time steps
− Net groundwater recharge− Direct runoff− …− Runoff relevant site conditions:
− Depth to water table− BFI of hard rock unit− …

31.1.2018
26
mGROWAexampleof single celloutput
Agricultural site in the east of Slovenia
year 1994
mGROWAexampleof single celloutput
Agricultural site in the east of Slovenia
2010 (wet year)

31.1.2018
27
mGROWAexampleof single celloutput
Agricultural site in the east of Slovenia
2003 (dry year)
mGROWA single column model (SCM) setup
Motivation:
Agrometeorologicalapplications are typically limited to single field setups ofcrop/soil combinations withnear/on-field meteorologicalmeasurements.
Calibrated model is needed fordrough aftermath studies as well as for irrigationoptimization and forecasting

31.1.2018
28
mGROWA single column model (SCM) setup
Solution:
A program was created to prepare small input rasters withone calculation point.
Input: single station data time series, single soil profile
Output: control point (cp) file Program Create.R
Soil profile
Meteo station data
Small sythetic raster layers
mGROWA SCM examples

31.1.2018
29
mGROWA SCM examples
ax1.legend()
mGROWA SCM examples
ax1.legend()

31.1.2018
30
mGROWA SCM examples
ax1.legend()
mGROWA SCM future work:
ax1.legend()
GROWA SCM daily update
Interface to agromet/phenologicaldatabase

31.1.2018
31
Projection of possible climate change impact on the water balance in Slovenia
Mojca Dolinar
Scenariji vplivov podnebnih sprememb na vodno bilanco Slovenije
• Climate mitigation(Paris agreement)
• Population growth
GHG scenarios
4 GHG scenarios (IPCC):Representative Concentration Pathways – RCP

31.1.2018
32
• 6 regional Climate models, RCP4.5 in RCP8.5• Spatial resolution: ~ 14 km• Temporal resolution: day• Input in mGROWA model:
– Minimum, maximum and mean daily temperature – Precipitation– Reference evapotranspiration
Scenarios for future water balance
Future projections of mean temperature

31.1.2018
33
Future projections of precipitation
Future projections of reference evapotranspiration

31.1.2018
34
Annual time series for 6 RCM (RCP4.5)
Groundwater recharge change (RCP4.5)
zima pomlad poletje jesen
2011
–204
020
41–2
070
2071
–210
0
-100 -50 -25 -10 10-200 25 50 100 200 300 mm

31.1.2018
35
Groundwater recharge change (RCP4.5)G
WR
ano
mal
y(m
m)
• 6 Regional Climate Models• Spatial average for Slovenia
Groundwater recharge change (RCP4.5)
31.1.2018
36
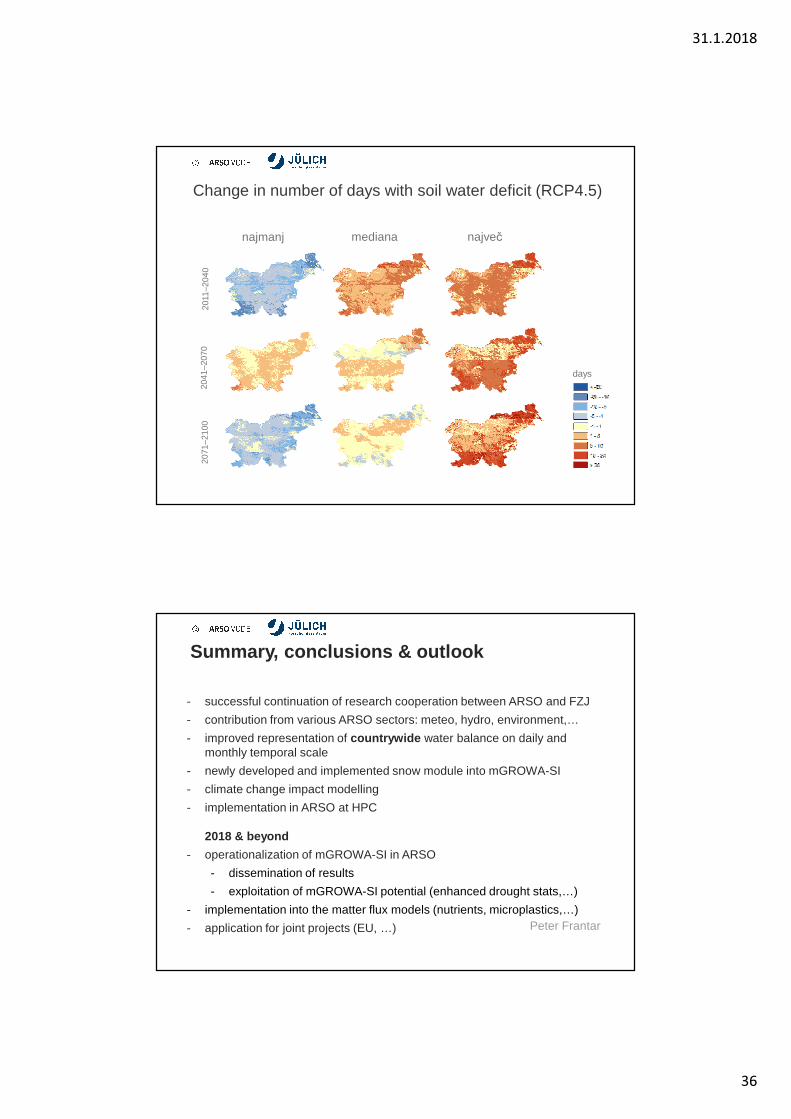
najmanj mediana največ
2011
–204
020
41–2
070
2071
–210
0Change in number of days with soil water deficit (RCP4.5)
days
Summary, conclusions & outlook
Peter Frantar
- successful continuation of research cooperation between ARSO and FZJ
- contribution from various ARSO sectors: meteo, hydro, environment,…
- improved representation of countrywide water balance on daily and monthly temporal scale
- newly developed and implemented snow module into mGROWA-SI
- climate change impact modelling
- implementation in ARSO at HPC
2018 & beyond
- operationalization of mGROWA-SI in ARSO
- dissemination of results
- exploitation of mGROWA-SI potential (enhanced drought stats,…)
- implementation into the matter flux models (nutrients, microplastics,…)
- application for joint projects (EU, …)

31.1.2018
37
Thanks for your attention !
Copyright © 2022 FDOKUMEN