The productivity of firms in transition: the case of slovenia and macedonia
55
11th CONFERENCE OF THE INTERNATIONAL ASSOCIATION FOR THE ECONOMICS OF PARTICIPATION (IAFEP) ‘PARTICIPATION WORLD-WIDE’ Katholieke Universiteit Brussel – K.U.B. (Catholic University of Brussels) Brussels 4-6 July 2002 THE PRODUCTIVITY OF FIRMS IN TRANSITION: THE CASE OF SLOVENIA AND MACEDONIA Janez Prasnikar (University of Ljubljana, Slovenia) Will Bartlett (School for Policy Studies, University of Bristol, UK Polona Domadenik Faculty of Economics, University of Ljubljana, Slovenia Verica Hadzi Vasileva Markovska Ernst & Young, Skopje, Macedonia 1 3
Transcript of The productivity of firms in transition: the case of slovenia and macedonia

11th CONFERENCE OF THE INTERNATIONAL ASSOCIATIONFOR THE ECONOMICS OF PARTICIPATION (IAFEP)
‘PARTICIPATION WORLD-WIDE’
Katholieke Universiteit Brussel – K.U.B. (Catholic University of Brussels)
Brussels4-6 July 2002
THE PRODUCTIVITY OF FIRMS IN TRANSITION: THE CASE OF SLOVENIA AND MACEDONIA
Janez Prasnikar(University of Ljubljana, Slovenia)
Will Bartlett(School for Policy Studies, University of Bristol, UK
Polona DomadenikFaculty of Economics, University of Ljubljana, Slovenia
Verica Hadzi Vasileva MarkovskaErnst & Young, Skopje, Macedonia
1 3

2 3

THE PRODUCTIVITY OF FIRMS IN TRANSITION: THE
CASE OF SLOVENIA AND MACEDONIA1
Janez Prasnikar
Faculty of Economics, University of Ljubljana, Ljubljana, Slovenia
E-mail: [email protected]
Will Bartlett
School for Policy Studies, University of Bristol, Bristol, United Kingdom
E-mail: [email protected]
Polona Domadenik
Faculty of Economics, University of Ljubljana
Kardeljeva ploscad 17
1000 Ljubljana, Slovenia
E-mail: [email protected]
Verica Hadzi Vasileva Markovska
Ernst & Young, Skopje, Macedonia
E-mail: [email protected]
1 This research was undertaken with support from the European Union’s Phare ACE Programme 1997. The
contents of the publication are the sole responsibility of the authors and in no way represent the views of the
Commission or its services. The authors would like to thank Jan Svejnar, Trajko Slaveski, Milica Uvalic,
Mirella Damiani and Marko Pahor for their useful comments on a previous version of the paper.
3 3

The suggested running head: THE PRODUCTIVITY OF FIRMS IN TRANSITION
THE PRODUCTIVITY OF FIRMS IN TRANSITION: THE CASE
OF SLOVENIA AND MACEDONIA
Abstract
In the paper we investigate how the chosen privatisation method affects the
productivity of firms in the period after privatisation in two countries whose firms
operated in a similar decentralised economy before privatisation based on the self-
management of employees in socially-owned firms. In this context, the choice for
internal privatisation model might be seen as the logical continuation of developing
firm as an internal organisation. In both countries, artificially created external owners
with wrong incentives represent big problem also five years after privatisation has
been completed. On the other hand, Slovenia and Macedonia represent two countries
that followed different reforming path in transition period. Despite their common ruts,
the studied economies operated in varying stable environment. The analysis showed
that in the case of Macedonia the average factor productivity was falling in the whole
period compared to the year 1994. Moreover, the differences between firms that
chose internal or external privatisation method became smaller. In the case of
Slovenian firms the analysis did not point to any significant differences in total factor
productivity between different group of firms or different years under study. It is
clearly evident that the corporate governance issue remains one of the key problems in
both countries, even after privatisation.
4 3

Journal of Economic Literature Classification Numbers: C23, D24, P52
5 3

1. INTRODUCTION
Internal ownership emerged as a parallel way of privatisation in many
transitional countries. In some countries like Poland and Hungary, internally-owned
firms have developed in a spontaneous process that began with decentralised socialist
reforms. Internal ownership was enforced as a prevailing method of privatisation in
Russia where they had no significant experience with a decentralised economy under
communism. Analysts recognise this as a key reason for the Russian economy’s slow
transformation together with the low utilisation of production capacities, property
theft, cash-flow exploitation for personal purposes and the development of mafia and
clan management (Frydman et al., 1996, Brown, Earle, 2000, Kuznetsov, Muravyev,
2001)2.
Unlike Russia and other countries of the former Soviet Union, the Yugoslav
socialist system experimented with different forms of a decentralised economy, based
on the self-management of employees in socially-owned firms. After the 1960s, the
Yugoslavs allowed considerable enterprise autonomy and decentralised decision-
making accompanied by export incentives for firms, great reliance on Western
technology and the establishment of significant joint-venture partnerships with
Western firms. In the area of enterprise policies and regulations, one could observe a
sudden convergence of the centrally planned and decentralised systems3. A study of
productivity in the 1975-1979 period showed that the problems of Yugoslav self-
2 Other empirical studies of firm behaviour in transition countries mostly stress the advantages of external, especially foreign, over internal ownership (Estrin, 2001).
3 For more on this, see Prasnikar, Svejnar (1988).
6 3

managed firms might stem more from the misallocation of resources than productive
inefficiency (Prasnikar, Svejnar, Klinedinst, 1992).
The possibility to take advantage of the internal organisation4 based on the
already achieved market orientation of firms after the disintegration of former
Yugoslavia has stimulated policy-makers in the newly emerging states to offer various
models of internal privatisation as possible ways of transforming social capital. In
Slovenia and Macedonia, two new states emerging after the disintegration of former
Yugoslavia and which relatively successfully avoided war and took their first steps
towards a market economy and private property at the beginning of the nineties,
internal buy-outs of firms became the most widely used method of privatisation.5 In
Slovenia, most firms chose internal buy-out as the method of privatisation. However,
the privatisation legislation compulsorily prescribed the combination of voucher and
buy-out privatisation. Besides internal, external ownership was also formed
represented by authorised investment and state funds as the most important groups of
4 Bajt stressed that employees were the true economic owners of Yugoslav firms. Social property was in a legal sense the property of everyone and no one. In an economic sense, the property and its operating results (usus fructus) was managed and disposed of by the employees (Bajt, 1992).
5 Employees in some other states of former Yugoslavia also enjoyed a favourable position in the privatisation process. In the Federal Republic of Yugoslavia, the Act on Ownership Transformation (1997) permitted firms to distribute for free 60% of the shares to employees, former employees and pensioners (Babic, 2001). In Croatia, the Privatisation Law passed in 1992 and revised two years later offered special discounts to employees and retired workers. The data on ownership structures in 2000 reveal that 36% of firms’ shares are on average owned by internal owners (Cuckovic, 2001). In Bosnia and Herzegovina, the privatisation process was designed separately in both entities of the Federation of BiH and Republika Srbska. In both, the focus was mostly on voucher privatisation. With few exceptions, workers received no special treatment. (Prasnikar et al, 2001)
7 3

external owners.6 In Macedonia, the prevailing internal ownership resulted from
experimenting with different privatisation models after no strategic buyers for the
majority of big and middle-sized firms were found. If the policy-makers wanted to get
rid of the responsibility for their operation, they were forced to carry out internal
buy-outs of firms.
In the paper we investigate how the chosen internal buy-out approach as the
prevalent privatisation method affects the productivity of firms in the post-
privatisation period. Our study contributes to the existing literature on firms’
performances in transition in at least three ways. First, in the paper the productivity
of internally- and externally-owned firms is compared in the two countries whose
firms operated in a similar decentralised economy before privatisation. In those
circumstances, the choice of an internal privatisation model might have depended on
the advantages of the evolutionary development and formation of the firm as an
internal organisation. A firm that successfully operated in a competitive environment
before privatisation might have chosen the internal buy-out method of privatisation to
avoid any shocks caused by privatisation to external owners. Moreover, the decision
for external ownership has not automatically been followed by a firm’s more efficient
operation. Stiglitz (1999) argued that the long agency chains implicit in mass
privatisation are unlikely to stimulate appropriate corporate governance. Our analysis
of the 130 biggest Slovenian firms in the 1994-1998 period confirms exactly this
6 The 1992 Privatisation Law allocated 20 percent of a firm’s shares to insiders (workers), 20 percent to the Development Fund that auctioned the shares off to authorised investment funds, 10 percent to the National Pension Fund, and 10 percent to the Restitution Fund. In addition, in each enterprise the workers' council or board of directors (if one existed) was empowered to allocate the remaining 40% of company shares for sale to insiders (workers) or outsiders (through a public tender). Based on the decision on the allocation of this remaining 40 percent of shares, firms can be classified as being privatised to insiders (the internal method) or outsiders (the external method). Externally owned firms are also the firms that chose some other form of privatisation that led to prevalent external ownership, like for example the sale of a firm or part of it to foreigners.
8 3

aspect of privatisation. Dispersed ownership and the erroneous incentives of external
owners, authorised investment funds and state funds, introduced artificially by the
Privatisation Law still represent problems in Slovenian firms five years after
privatisation has been completed. (Gregoricˇ, Prasˇnikar, Ribnikar, 2000). A similar
problem, external owners with the wrong incentives, is evident in the case of
subsidiary firms in Macedonia. Those “spin-off” firms are mostly owned by “parent”
firms that were privatised internally. The extremely rich database of Macedonian
firms allowed us to analyse the productivity of these firms relative to other groups of
firms owned by other external and internal groups of owners.
Secondly, Macedonia and Slovenia have applied different reform policies in the
post-privatisation period. Slovenia is one country to have successfully introduced
Type I reforms (macroeconomic stabilisation, price liberalisation, reduction of direct
subsidies, break-up of SOEs and the mono-bank system, adequate foreign trade and
competition policies), but is still late in implementing Type II reforms including the
establishment and enforcement of a market-oriented legal system and accompanying
institutions and further (in-depth) development of a commercial banking sector and
capital and labour market regulations. After the Privatisation Law was passed,
Slovenia established a system of privatisation based on firms’ initiatives and the
transparent operation of regulatory institutions (Privatisation Agency, Development
Fund). Although some reforms were carried out too slowly, Slovenia in the past
decade has successfully led a policy of establishing the necessary conditions for a
small open economy’s development. On the contrary, the Macedonian transition path
in the nineties could be described as a zigzag development. First, it took some time for
the country to get over the shock of disintegration of former Yugoslavia. Then an
extensive programme of stabilisation together with the World Bank and the IMF was 9 3

prepared. In the meanwhile, the Macedonian government introduced several market
reforms but they were not carried out consistently. For example, in the studied 1994-
1999 period the strategy of privatisation was changed several times leading to a lack of
transparency and poor examination of the process. Some firms were split up, some
simply disappeared and many others operated at a loss. Commercial banks that
should have started the process of getting rid of bad loans simply continued the
“unhealthy” policy of giving loans to firms in trouble. Thus, banks remained the most
important source of soft budget constraints (Drummond, 2000). Macedonia also
became a very important trade network for supplying Kosovo and Serbia, mostly
based on the development of an informal economy and war profiteering. NATO’s
attacks on Serbia in 1999 significantly weakened the Macedonian economy. Our paper
examines the productivity of firms in the two countries, which carried out pro-reform
policies with different levels of success. Despite their common roots, the privatised
firms in both countries operated in varying stable environments.
Thirdly, it is often argued that foreign firms possess more technological know-
how and expertise and that makes them more efficient compared to domestic firms
(e.g. Djankov and Hoekman, 1999, Estrin 2001). Slovenia and Macedonia have had
relatively low levels of foreign direct investment in the post-privatisation period
compared to other transition countries.7 The main reasons cited for this in Slovenia
have been the small potential market and insufficient policy of attracting foreign
capital. In order to protect its exchange rate, the Bank of Slovenia introduced stringent
7 In Slovenia foreign direct investment in 1994 amounted to USD 131 million, USD 183 million in 1995, USD 188 million in 1996 and USD 340 million in 1997, the highest value in the whole transition period. In 1998, it dropped to USD 250 million and USD 144 million in 1999. In the same period, FDI in Macedonia amounted to USD 19.1 million in 1994, USD 8.4 million in 1995, USD 7.2 million in 1996, USD 30.9 million in 1997, USD 112.3 million in 1998 and USD 35.6 million in 1999.
10 3

capital controls which virtually wiped off all the remaining foreign capital (Rojec et al.,
2000). In Macedonia, the small potential market, unfriendly and unstable environment
as well as the lack of good firms suitable for acquisition have been listed as the main
reasons for the modest extent of foreign direct investment (Markovska, 2001). In both
countries, the transformation of ownership represents the main part of existing foreign
investments. The transformation of joint ventures established under the previous
system and the selling off firms to foreign investors in the privatisation process are
the most important determinants of foreign investment in Slovenia. IBM Slovenia was
established through the splitting up of the joint venture between Intertrade ITS (a firm
privatised by the Slovenian privatisation law) and IBM (USA). On the other side,
Kirkwood (USA) became the prevalent owner in Kolektor Idrija when it bought Kautt
& Bux (Germany) during its bankruptcy. Kautt & Bux and Kolektor had established a
joint-venture firm in the previous system. Danfos Cˇrnomelj and Sava-Tires were
established when the big Slovenian firms Gorenje Velenje and Sava Kranj sold off part
of their production to foreign buyers in the process of privatisation.
In Macedonia, foreign direct investment has mostly involved acquisitions of
firms that have competitive advantages by world standards (paper for cigarettes,
gypsum – Radika Debar, gas – Tehnogas), produce highly-demanded products
(breweries, cement and tobacco factories) or have developed successful co-operation
with foreign partners under the previous system (shoe-making, textiles, transport)
(Markovska, 2001). In our paper the differences in the efficiency of foreign- versus
domestic-owned firms will be focused on. As the Slovenian sample embraces only big
and medium-sized firms (with more than 200 employees), there are not many foreign-
owned firms listed in the data. They were put into the group of prevalent external
ownership when we analysed firm groups according to prevalent ownership criteria 11 3

and in the group of other firms when we used a more detailed ownership structure. In
the Macedonian sample, we kept firms with prevalent foreign ownership as a separate
group enabling us to study the difference in the efficiency of this group compared to
other groups of firms.
In the next section the main steps involved in the pro-reform development of
both countries are described. Data are presented in the third section, while the fourth
section presents the results of empirical testing. At the end, we set out our
conclusions and the policy implications supported by the study.
1. PRO-REFORM DEVELOPMENT IN SLOVENIA AND MACEDONIA IN
THE NINETIES
2.1. Slovenian transition8
The Slovenian transition of the 1990s was characterised by a gradual approach
to a market economy (Mencinger, 2000). The most important reforms were
stabilisation of the economy, liberalisation of trade and increased market competition.
Price stabilisation was primarily achieved through restrictive monetary and fiscal
policies that brought inflation down from 21.5% per month in October 1991, when
Slovenia launched its new currency, to an annual rate of about 6%-7% in the late
nineties. The country adopted a policy of a dirty (managed) flexible exchange rate.
Although the proximate target for the exchange rate had not been declared, the Bank of
8 Due to space limitations, we provide only a brief account of the key features of the Slovenian transition. For a more detailed account, see e.g., EBRD (2000).
12 3

Slovenia decided to issue its own short-term bills in order to sterilise the effect on
money circulation caused by foreign exchange purchases. This policy stayed in effect
until 1999. Real appreciation of the tolar, the Slovenian national currency, was less
intense thereby relieving the worsening situation in the trade sector. Slovenia
minimised or even abolished duties on imported industrial products (Pavlicˇ, 1996)
that, together with small business sector development led to higher competitiveness in
the home market. (Bartlett, Prasnikar, 1994) All of these factors, plus the tightening of
budget constraints, improved the competitive position of Slovenian enterprises.
Foreign capital and foreign direct investment did not play any significant role in
Slovenia in the nineties.
At the micro level, in 1993 the government rehabilitated the commercial bank
sector with losses being written off against capital, and the non-performing loans of
the two largest banks being replaced by long-term bonds of the Agency for Bank
Rehabilitation. As a result, the two banks came under state ownership, their operating
costs started to fall, profitability increased and the regulatory conditions set by the
Bank of Slovenia were met. The two banks are now ready for privatisation.9
As in many other transition economies, interest rates were kept high by the
central bank’s policy, limited competition in the banking sector and low domestic
savings, while problems of asymmetrical information between bankers and managers
contributed to credit rationing at the level of firms.10 In this context, it is worth noting
that since its inception the Bank of Slovenia has been strict in enforcing regulations,
9 As of January 2001 there were thirty-three banks operating in Slovenia. Except for the two largest banks, all of them were in private hands. Twelve banks had foreign shareholders and in seven of them the share of foreign capital exceeded 20 percent. The market share of the 5 largest banks was about 60 percent. Not all of the banks had equal operating licenses, with the limitations on banking operations reflecting their capitalisation and other factors.
10 See e.g. Bole’s analysis (1999) based on the theoretical framework of Stiglitz and Weiss (1981).
13 3

thus forcing commercial banks to be more careful in screening credit applications by
firms. The result of these factors and the fact that banks are mainly faced with short-
term deposits on the liability side was the limited financing of firms by domestic
banks throughout the 1990s. In 1994, for instance, Slovenian commercial bank loans
amounted to 23.2% of GDP, while by 1996 they had dropped to a mere 14.5% of
GDP.11
The part played by the newly established Ljubljana Stock Exchange in
supplying and allocating capital was also limited. With very few issues of securities,
the primary capital market almost did not exist, while the secondary market lacked
liquidity. Share prices have been falling recently. Due to the fact that external financing
is bounded, the investment activity of the firms mostly depends on the ability to
generate internal funds (Domadenik, Prasnikar, Svejnar, 2001).
The corporate ownership and governance issues we explore in this paper were
strongly influenced by the 1993 Privatisation Law. As already stated, former socially-
owned enterprises were privatised using a combination of voucher and buy-out
methods. As shown by Gregoricˇ, Prasˇnikar, Ribnikar (2000), the ownership
structure in privatised Slovenian firms still reflects the chosen privatisation model and
is dispersed among authorised investment funds, state funds, other non-financial
enterprises, employees, former employees and retired people. Only recently, a
consolidation of ownership has begun via intensive processes of mergers and
acquisitions by domestic firms.
In terms of wage setting, Slovenia has had a layered system of agreements
11 For comparison, in 1994 the ratio of bank loans to GDP reached 95% in the Czech Republic, 63% in Hungary, 33% in Poland, and 13% in Russia. By 1996, the corresponding percentages were 75, 27, 20, and 13. The range of ratios observed in developed market economies is between 120% and 130% (see Meyendorff and Snyder, 1997).
14 3

since 1990 that permit wages to vary between firms and defy government attempts to
reign in real wage growth. In August 1990 an “umbrella” general collective agreement
was signed between the Slovenian Chamber of Commerce and Industry (representing
all employers) and the Trade Union Organisation (representing all workers). This
agreement set initial wages for each category of workers and was supplemented by
industry-specific agreements that effectively converted the initial wages in the
umbrella agreement into minimum wages at the level of industries. Moreover, at the
firm level the union and management bargained in the context of the firm’s annual plan
to further adjust the industry-level wages. The multi-layer bargaining structure
resulted in wage dispersion, rapid wage growth and attempts by the government to
limit these tendencies.12
Slovenia’s economic performance during the 1990s was relatively successful.
Mirroring the situation in the other transition economies, Slovenia experienced a
period of economic decline in 1990-92. Thereafter, growth resumed with GDP
increasing by 2.8% in 1993, 5.3% in 1994, 4.1% in 1995 and 3.5% in 1996. In the
1997-2000 period, Slovenia saw average growth of GDP above 4%. After experiencing
hyperinflation when still part of Yugoslavia in the late 1980s and early 1990s,
Slovenia imposed macro-stabilisation measures and consistently reduced inflation to
one of the lowest levels observed in the transition economies. Hence, while retail
prices increased by 207.3% in 1992, the increases gradually fell to 21.0% in 1993 and
12 Wages grew faster than productivity in 1993 and 1994. Due to this, in 1994 the government started considering the acceptability of an Israeli-type social agreement that would limit wage increases and link them to productivity growth. However, the agreement was not strictly followed, real wages continued to grow and exceed productivity in 1995, especially in the 1996 election year. In July 1997, a new collective agreement was signed for the non-government (business) sector, but no social agreement was reached that year. Paradoxically, this ‘breakdown in negotiations’ prevented the government agencies and firms increasing their wages and, in 1997 and 1998, real wages growth finally fell behind productivity increases. In 1999 the growth of real wages again grew faster than productivity growth.
15 3
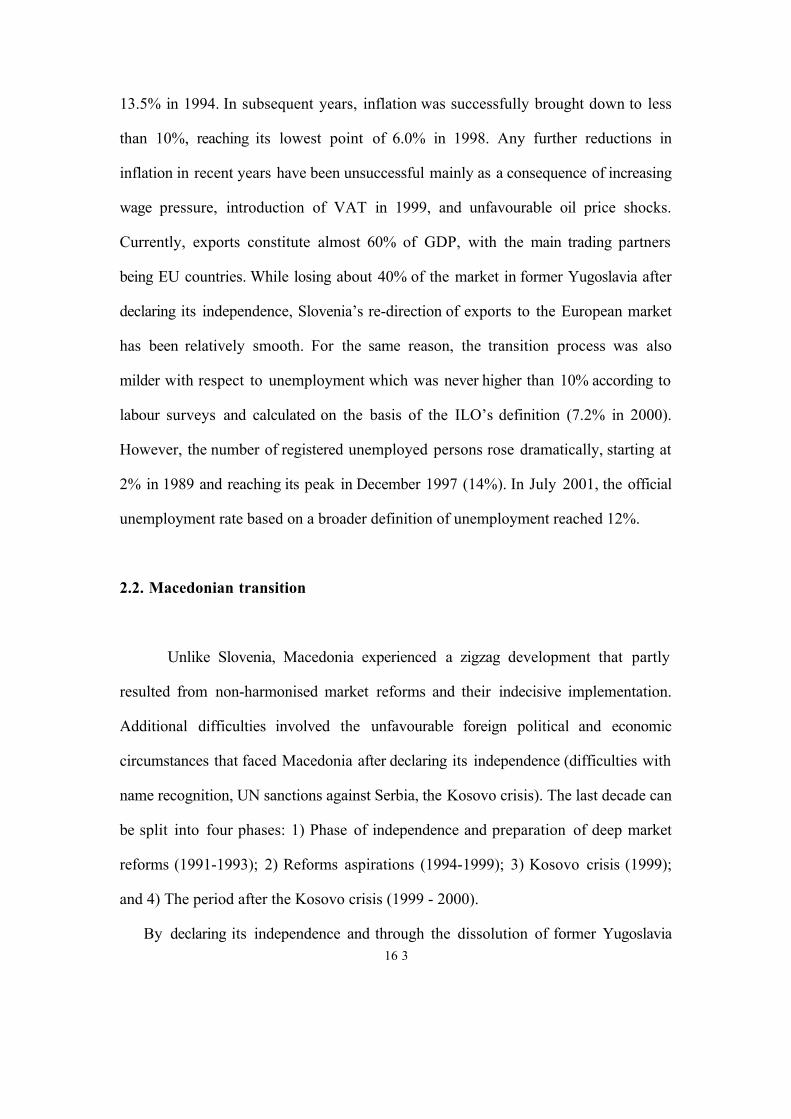
13.5% in 1994. In subsequent years, inflation was successfully brought down to less
than 10%, reaching its lowest point of 6.0% in 1998. Any further reductions in
inflation in recent years have been unsuccessful mainly as a consequence of increasing
wage pressure, introduction of VAT in 1999, and unfavourable oil price shocks.
Currently, exports constitute almost 60% of GDP, with the main trading partners
being EU countries. While losing about 40% of the market in former Yugoslavia after
declaring its independence, Slovenia’s re-direction of exports to the European market
has been relatively smooth. For the same reason, the transition process was also
milder with respect to unemployment which was never higher than 10% according to
labour surveys and calculated on the basis of the ILO’s definition (7.2% in 2000).
However, the number of registered unemployed persons rose dramatically, starting at
2% in 1989 and reaching its peak in December 1997 (14%). In July 2001, the official
unemployment rate based on a broader definition of unemployment reached 12%.
2.2. Macedonian transition
Unlike Slovenia, Macedonia experienced a zigzag development that partly
resulted from non-harmonised market reforms and their indecisive implementation.
Additional difficulties involved the unfavourable foreign political and economic
circumstances that faced Macedonia after declaring its independence (difficulties with
name recognition, UN sanctions against Serbia, the Kosovo crisis). The last decade can
be split into four phases: 1) Phase of independence and preparation of deep market
reforms (1991-1993); 2) Reforms aspirations (1994-1999); 3) Kosovo crisis (1999);
and 4) The period after the Kosovo crisis (1999 - 2000).
By declaring its independence and through the dissolution of former Yugoslavia 16 3

Macedonia lost more than 60% of its markets and inherited high inflation that reached
86% per month in April 1992 in the period of achieving monetary independence. In
May 1993 the Macedonian central bank carried out monetary reform, when its
independence together with instruments for more efficient market supervision over
money supply (abolition of “easy” loans) and open market operations came into
effect. At the end of 1993 the Macedonian government with the help of the IMF and
the World Bank began to carry out an extensive stabilisation programme. That
programme was based on restrictive monetary policy, strict fiscal discipline, a policy
of a managed floating exchange rate (the Macedonian denar was tied to the German
mark) and wage control. At the same time, reforms were carried out of the fiscal
system, deregulation of trade exchange and foreign investments, price liberalisation,
reforms of banking sector and important structural reforms (privatisation of socially-
owned firms, SME development, restructuring of firms with high debts, reform of
infrastructural firms). Those reforms were carried out gradually.13 The biggest
problems emerged with transformation of the banking sector, where commercial banks
failed to switch their operations away from giving loans to firms already in debt,
increasing the current account deficit (USD 222 million in 1995 and USD 309 million
in 1996) and the high unemployment rate (36% in 1997). Despite that, some
promising results were achieved in the 1996-1999 period: inflation dropped to 2.6% in
1996 and even deflation occurred in 1998 and 1999, the fall in GDP stopped and
started to rise after 199614 and the budget deficit dramatically dropped, turning into a 13 For example, reform of foreign trade was accomplished under new laws on foreign trade and duties in 1996. Since 2000, foreign investors have had the same status as domestic ones, and in some areas they have more favourable treatment, enjoying some tax and duty holidays (for more on the reforms, see Markovska, 2001).
14 1.2% growth of GDP in 1996, 1.4% in 1997, 2.9% in 1998 and 2.7% in 1999 is mostly due to construction, communication and trade industry development, especially because of the SME sector’s growth. The growth of industry production was negative in the whole period studied.
17 3
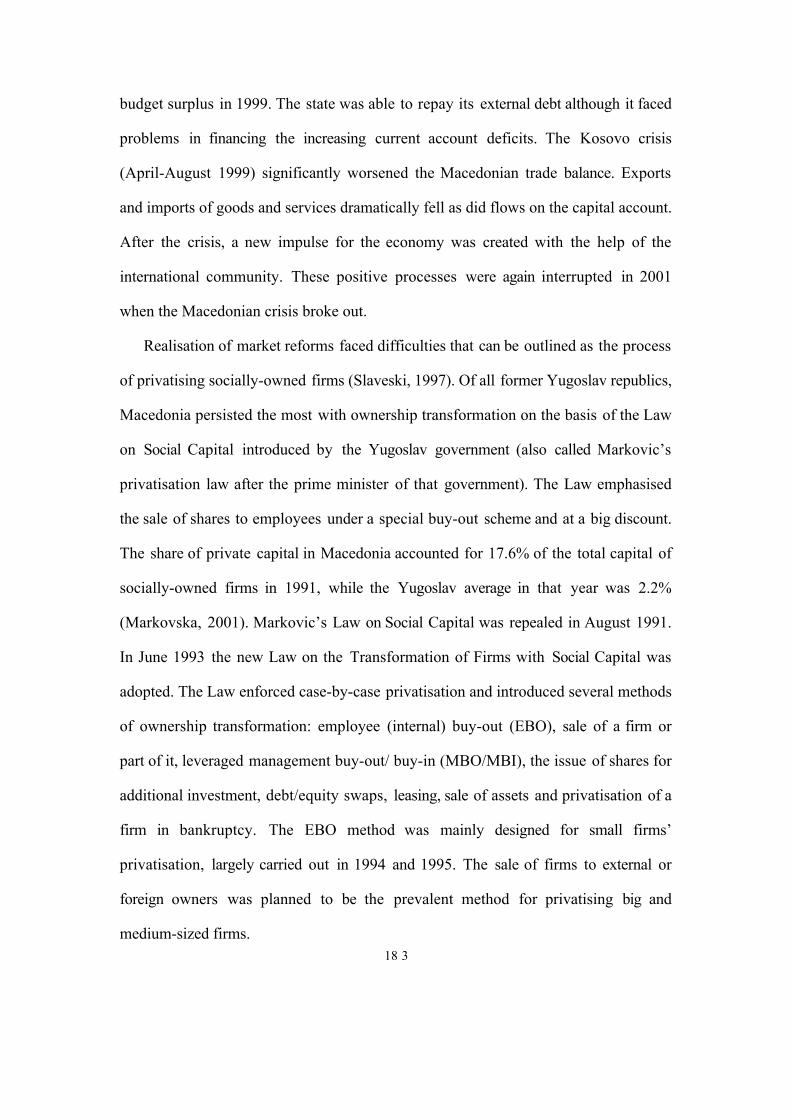
budget surplus in 1999. The state was able to repay its external debt although it faced
problems in financing the increasing current account deficits. The Kosovo crisis
(April-August 1999) significantly worsened the Macedonian trade balance. Exports
and imports of goods and services dramatically fell as did flows on the capital account.
After the crisis, a new impulse for the economy was created with the help of the
international community. These positive processes were again interrupted in 2001
when the Macedonian crisis broke out.
Realisation of market reforms faced difficulties that can be outlined as the process
of privatising socially-owned firms (Slaveski, 1997). Of all former Yugoslav republics,
Macedonia persisted the most with ownership transformation on the basis of the Law
on Social Capital introduced by the Yugoslav government (also called Markovic’s
privatisation law after the prime minister of that government). The Law emphasised
the sale of shares to employees under a special buy-out scheme and at a big discount.
The share of private capital in Macedonia accounted for 17.6% of the total capital of
socially-owned firms in 1991, while the Yugoslav average in that year was 2.2%
(Markovska, 2001). Markovic’s Law on Social Capital was repealed in August 1991.
In June 1993 the new Law on the Transformation of Firms with Social Capital was
adopted. The Law enforced case-by-case privatisation and introduced several methods
of ownership transformation: employee (internal) buy-out (EBO), sale of a firm or
part of it, leveraged management buy-out/ buy-in (MBO/MBI), the issue of shares for
additional investment, debt/equity swaps, leasing, sale of assets and privatisation of a
firm in bankruptcy. The EBO method was mainly designed for small firms’
privatisation, largely carried out in 1994 and 1995. The sale of firms to external or
foreign owners was planned to be the prevalent method for privatising big and
medium-sized firms. 18 3

Since the privatisation process had failed to attract much attention of foreign
investors, the Macedonian government introduced the process of “accelerated
privatisation” in 199515. Most medium-sized and big firms were privatised in 1995
using internal buy-out (especially management buy-out –MBO) as the prevalent
method under special buy-out conditions (payment for shares within 5 years with a 2-
year grace period before the first instalment). Thus, internal buy-outs became the
most widely used method of ownership transformation in Macedonia. The prevalent
external ownership mostly came about in three different ways. First, the privatisation
law automatically acknowledged the ownership of firms domiciled in former Yugoslav
republics over their business units in Macedonia. Second, firms with huge losses were
mostly privatised by debt-to-equity swaps of banks and the state and the leasing out
of assets. Third, some firms were sold off to foreign investors. In order to accelerate
buy-outs by foreign investors, direct sale as a new method of privatisation was
introduced in 1999. Firms were able to negotiate their sale directly with a strategic
partner if it considered it would be better not to publicly disclose the negotiations. In
2000 this privatisation model was once again retired because its use was considered
non-transparent. A very common method of privatisation in Macedonian reality was
the establishment of “spin-off” or subsidiary firms. However, those firms, among
other things, also provided re-employment possibilities for unemployed workers.
Since their owners, the ‘parent’ firms, chose either the prevalent internal or external
method of privatisation it is extremely difficult to classify the resulting subsidiary
firms in one group or another.
15 This privatisation was mainly enforced by the World Bank that conditioned the use of FESAC (Financial and Enterprise Sector Adjustment Credit) on the accelerated accomplishment of the privatisation of big- and medium-sized firms. Loans were approved to the Macedonian government in 1995 for restructuring 23 firms with the highest debts and for banking sector restructuring.
19 3

3. THE DATA
The Slovenian sample encompassed 126 enterprises in the 1996-1998 period that
were privatised between 1993 and 1995. They are large- and medium-sized Slovenian
firms for which data on ownership changes are available in the observed period. In
1998, those firms generated 15 percent of the total income and employed 16 percent
of all employees of Slovenian firms registered at the Slovenian Agency for Payments.
A list, description and yearly summary statistics of the variables are found in
Table 1. Variables are measured in constant prices from 1996. As is evident from the
figures, the typical firm cut the number of its employees from 550 in 1996 to 520 in
1998. Capital stock (tangible assets in constant prices from 1996) rose by 2.3% per
year on average. The typical firm had average value added of SIT 1.51 billion in 1996
and SIT 1.7 billion in 1998 in constant 1996 prices. Average value added per worker
grew from SIT 4.98 million in 1996 to SIT 5.68 million in 1998 (average growth of
4.5% per year), while the average capital-to-labour ratio rose by 2.5% per year.
The average ownership share of internal owners (employees, managers, retired
employees) dropped insignificantly in the period under study from almost 38% in
1996 to 37.04% in 1998. The average share of employees fell from 24.86% to 22.87%,
while the managers’ share rose on average from 1.81% to 2.78%. In the same period,
the average share of state funds went from 23.85% to 17.82%, but on the other side
the investment funds’ share increased from 14% to 17.88% on average. Other non-
financial firms, including foreign owners, also significantly increased their share in the
20 3

typical firm from 10.74% to 17.31%16, whereas the average ownership share of banks
remained the same (1.3%).
In Table 2 firms are divided according to the method of privatisation of the
prevalent externally and internally privatised firms. This classification enabled us to
compare Slovenian firms directly with the Macedonian sample. However, this dataset
starts earlier, in 1994, so by using internal versus external classification we are able to
study a longer period. Although some firms in the sample were privatised in 1995, we
assume that all firms knew at least two years in advance which method of
privatisation they would use. In order not to lose observation for the year when a firm
was not officially private, we extrapolated backwards the privatisation outcome
(internal or external privatisation).
As evidenced in Table 2, firms that chose the prevalent external privatisation
method were on average bigger than those applying the internal privatisation method.
The values of tangible assets for representative firms of those two groups confirm the
fact that firms chose external privatisation if the capital value was too big to privatise
internally (Prasnikar, Svejnar, 1998). The average value added per worker grew by an
average of 2.4% in the first, externally privatised group of enterprises and by 2.6%
per year in the second group. Similarly, the average capital-to-labour ratio rose by
1.2% in the first and by 2% per year in the second group.
The summary statistics of the Macedonian data are presented in Table 3. The
group of enterprises which was the basis for our statistical analysis consisted of 1,167
enterprises, for which we had their financial statement data for most years in the
16 The main reason for increased average level of shares owned by non-financial firms lies in the process of acquisitions. Investment funds increased their shares through a portfolio widening strategy in big- and middle-sized firms in order to control them. State funds presumably follow the strategy of ownership concentration in some specific firms and this led to a smaller average share in the ownership structure of the firms studied (Gregoricˇ, Prasˇnikar, Ribnikar, 2000; Pahor, Ferligoj, Prasˇnikar 2000).
21 3

period 1994-1999. The group includes firms from all industries of the Macedonian
economy that were subject to privatisation, except for agriculture.
Unfortunately, due to inconsistencies in the data we have to exclude many
enterprises. Thirty-six dropped out of the sample because they were liquidated early
in the privatisation process. Around 200 enterprises had missing data in one or more
of the relevant years. We further downsized the sample by about 500 firms that had
no consistent data series for the period analysed (negative or zero values of fixed
capital, equity, value added, employment…). Moreover, Macedonia had undergone a
process of enterprise restructuring which led to the creation of new smaller enterprises
(“spin-offs”) out of bigger, non-efficient and usually loss-making companies with the
result that no consistent data series could be extracted for this group of restructured
enterprises.
The final sample for our analysis consists of 370 companies. Firms are divided
into several groups according to privatisation method chosen:
1. Employee buyouts (EMPLBUY) are presented through 91 enterprises in the
sample. As seen from Table 3, on average those firms are small and exclusively
purchased by their employees, and this outcome was intentional;
2. 187 enterprises ended up as being majority owned by the existing management and
employees (INT-other). They were in most cases the only bidders in response
to the tender involved, otherwise open to all investors. Those firms on average
belong among the bigger firms in the Macedonian economy according to value
of their tangible assets, number of employees or value added.
3. 16 firms were acquired by foreign investors (FOREIGN). By size, this group is
similar to the previous one, but the typical firm reported higher value added
per worker with a lower capital-to-labour ratio. 22 3
4. 36 enterprises are owned by companies domiciled in former Yugoslav republics
(EX-YU). The representative firm in this group employed only 10 workers in
1999, but reported a relatively high value of tangible assets. In terms of value
added per worker and the capital-to-labour ratio, the typical firm in this group
outperformed those of all other groups.
5. 8 enterprises are owned by other outside buyers, mainly banks, and other firms
that received their shares through debt-to-equity swaps. The typical firm
reported a high capital-to-labour ratio. The figures reveal a unique trend of
increasing value added per employee throughout the period studied compared
to other groups of firms.
6. 22 enterprises are subsidiaries of some other privatised enterprises. Those firms
were smaller compared to the average values of other groups in our sample.
The first two groups of firms represent firms with prevalent internal
ownership, while the next three groups are firms with prevalent external ownership.
As already mentioned in Section 2, firms from the last group cannot be classified as
either prevalent internally- or externally-owned firms. Consequently, we put them
together with group 517 to form the group of firms referred to as OTHERS.
Companies in our sample represent 34.2% of all privatised companies in
Macedonia that submitted financial statements to the Payment Operations Service in
1999. They employed 65.5% of all employees in this group of companies and their
fixed assets account for 36.4% of all long-term assets of privatised companies in 1999.
I. RESULTS
17 In group 5 we only have 8 firms and it does not make sense to keep it as a separate group as it is irrelevant to test any hypotheses on such a small sample.
23 3

We estimate a standard log-linearised Cobb-Douglas production function
augmented with ownership variables, or
yit = ?0 + ?1 lit + ?2 kit + ?3OWNER1it + ?4OWNER2it + ?5OWNER3it
+_6’(YEARt)+ _7’(INDi) + ?i + ?it
(1)
where Y stands for log real value added, l stands for log employment, k stands for log
of real capital (proxied by the book value of fixed capital). Subscript i refers to firm i
and t refers to year. In order to control for heterogeneity across different ownership
structure, we augmented the standard production function with variables that measure
the influence of different ownership groups in firms (OWNER1, OWNER2 and
OWNER3) on productivity. The specification (1) allows us to either test the
differences between insider, outsider and mixed owned firms or an even more detailed
structure could be used. YEAR is the vector of annual dummy variables, IND is the
vector of industry dummy variables, derived as a first-digit NACE code, and (?i + ?it)
residuals.
Tables 4 and 5 report the basic estimation of productivity for Slovenian
enterprises using the detailed ownership structure in the 1996-1998 period, comparing
different groups of firms according to their ownership structure. We introduced
ownership variables that measure the share of external owners (privatisation funds-
FUNDS, other firms-FIRMS and others-MISCEL), while the control group of owners
24 3

is represented by internal owners (workers, managers and retired workers). Tables 6, 7
and 8 are based on the majority ownership principle (internal versus external
ownership) in order to compare them with Macedonian estimates where we only have
data on the majority owners. Tables 9-11 deal with the estimations of the
productivity of Macedonian firms. It is deemed that the majority ownership principle
holds for the whole period even if a firm was privatised later in the observed period.
We expect that a firm knew in advance what pattern of privatisation it would select.
This is important in the Macedonian case where the lion’s share of privatisation was
finished in 1994 and 1995.
We report four estimating techniques in Table 4, the results being based on
simple OLS estimations, then the fixed effects, between effects and the random effects
estimator. The Hausman test rejects random effects in favour of fixed effects
indicating possible misspecification of conventional random-effects model. The test
implies that in the survey important individual effects are present and correlated with
the explanatory variables. What is striking not only in this case, but also in other fixed
effects estimations of total factor productivity for Slovenian enterprises, is the low
estimated value of coefficients for capital and labour. This is often the case in
production function estimations because of fixed assets and labour under-utilisation18.
However, in the Slovenian case there probably is an additional reason for this. If the
fixed effects model yields unbiased estimates on the assumption of a correct model
specification, some unobserved time-invariant firm-level factors, not captured by
regression analysis, explained the heterogeneity of the dependent variable across firms.
In the case of production function estimates, the quality of management could play a
significant role in efficiency variations between firms. Calculated differences or 18 See Jeferson, Rawski, Li, Yuxin (2000).
25 3

deviations from group means on which the fixed effects method is based have very
low values for most of the studied firms in the period because selected variables
(labour, capital and value added) for one firm over the years did not change much.
Hence, the basic variations are in fact between firms and probably resulted from a
fixed, unobservable, firm-level characteristic, managerial “know-how”, and acts as a
“permanent” factor of differences between firms. The result is not surprising if we
recall that the Slovenian economic transition to capitalism was driven on by the most
successful managers who gained their knowledge during market socialism. Since the
Communist Party abolished limits on the process of hiring managers in the 80s,
capable managers accomplished the market restructuring of those firms faster than
others. We thus decided to add between-effects estimations to our tables because the
differences among firms in managerial “know-how” could be an important factor in
explaining the different efficiency levels between firms in the period studied. Firms
that operated in extraction, mining and the manufacturing of food, textile and leather
products’ industries and were 100% owned by internal owners (workers, managers
and retired workers) served as the control group.
The data in Table 4 do not confirm the dominant behaviour of external owners.
If a firm primarily owned by internal owners changed its ownership to 100% external
(investment and state funds, other firms and others) in the studied period, average
productivity would even fall according to the OLS estimation.
In Table 5 we report estimates from a model that allows the coefficients for
labour and fixed assets to vary across the four types of ownership. As in Table 4,
firms owned by insiders serve as a base. Labour and fixed asset coefficients multiplied
by different ownership variables enabled us to test if there are any differences in the
partial elasticity of value added with respect to labour and capital compared to the 26 3

control group. Except for the unconvincing case of miscellaneous firms, there is no
sign of the increased total factor productivity of firms with external owners compared
to the base group of firms during the observed period.
However, we can ignore changes in ownership in the period studied and test
the differences in productivity between two groups of firms which chose either the
prevalent external or internal model of privatisation.19 The results, reported in Tables
6-8, are similar to those in the previous paragraph. The dummy variable that measures
the selection of the external privatisation method (EXT) is not significant in any
model, as seen in Table 6. Experimenting with interaction did not yield any better
results. Pooled OLS and fixed effects models in Table 7 reported higher total
productivity for those firms that chose the external privatisation method compared to
the control group of internally privatised firms in the studied period. But the high
estimated partial elasticity of value added with respect to labour and capital for
externally privatised firms in the fixed effects model is questionable because the low
estimations of elasticity for the control group probably resulted from the low
variability of data within one firm. In the case of pooled OLS, the differences between
the studied groups became much lower. Total productivity analysis, based on yearly
data and presented in Table 8, reports the significantly higher efficiency of externally
privatised firms only at the beginning of the period under study. After that, the
differences between the groups are no longer significant.
On the basis of our analysis the hypothesis of statistically significant
differences in productivity between those firms that chose internal versus those firms
that chose the external privatisation method was not confirmed consistently by the
19 This simplification is not questionable because the ownership structure of privatised Slovenian firms in 2000 still reflected the privatisation model chosen, as reported in Gregoricˇ, Prasˇnikar, Ribnikar (2000).
27 3

various estimating methods. Moreover, we could not accept the hypothesis that there
were significant differences between firms with different ownership structures.
As we already mentioned, Tables 9-11 present the estimated productivity of
Macedonian firms. The firms are divided according to their prevalent privatisation
method in several groups, as discussed in the previous section. The random-effects
estimates again appear to be significantly biased with high probability. On the other
hand, the fixed effects estimates eliminate the dummy variable by definition, so we
cannot infer any possible effects of different privatisation methods on average
productivity. The pooled OLS estimation reports that firms privatised to other
internal owners, foreign owners and owners from former Yugoslavia had higher average
productivity than the control group of firms (EMPLBUY – employee buy-out
privatisation method). Especially those firms owned by the last two groups
(FOREIGN and EXYU) exhibited much higher productivity compared to other
groups. Surprisingly, year dummy variables are negative and statistically significant in
the pooled OLS, fixed and random effects models, meaning that average productivity
in Macedonian firms fell throughout the studied period.
The fixed effects model in Table 10 does not reveal any statistically significant
differences in total productivity between firms with a different privatisation method
in the period under study. The differences are significant in the case of the OLS model.
According to that, foreign-owned firms increased their total factor productivity
compared to the control group, while those firms owned by ex-Yugoslav firms
decreased it. The more detailed analysis of total productivity, based on year-by-year
estimations and reported in Table 11, shows that firms privatised internally had very
similar total factor productivity throughout the period. Foreign-owned firms at the
beginning of the period were more efficient than the control group, but the differences 28 3

are not significant in the later years. Firms owned by ex-Yugoslav firms lost in
efficiency at the beginning of the period but substantially increased it in the last two
years compared to all other groups of firms. However, coefficients on the interactions
are not significant in all cases.
I. CONCLUSIONS
Productivity analyses of Macedonian and Slovenian privatised firms in the
post-privatisation period can be summed up in two conclusions. First, Macedonian
firms operated in a very turbulent environment characterised by inconsistent economic
policy measures and unfriendly foreign circumstances throughout the period under
study. Average factor productivity was falling in the whole period compared to the
base year of 1994. Moreover, differences in productivity between firms that chose the
external or internal privatisation methods became smaller, although some positive
trends might be present (firms owned by ex-Yugoslav firms). Slovenian firms operated
in a more stable business environment. The analysis did not point to any significant
differences in total factor productivity between different groups of firms or different
years under study. Second, the corporate governance issue remains one of the key
problems in Slovenian and Macedonian firms, even after privatisation.
One reason for the insignificant differences in productivity between firms with
prevalent internal or external privatisation methods in Slovenia might originate from
the “deformed” ownership structure. That is the outcome of the privatisation process
and may be characterised by dispersed ownership where usually the three biggest
owners (investment and state funds, other firms etc) do not hold the majority of
shares (Gregoric, Prasnikar, Ribnikar, 2000). Therefore, the corporate governance 29 3

problem exists in both internally- and externally-owned firms. Authorised investment
and state funds with agreements on selling shares and their price limit the operation of
the secondary capital market. The sale price of shares jumps the moment signals
indicating important ownership share purchases are sent. An efficient and liquid
capital market is needed to allow the formation of an adequate ownership structure.
However, it is difficult to predict who might be adequate owners of Slovenian firms.
Complete opening up of the financial market in Slovenia, the transformation of
privatisation investment funds into open-end funds, investment companies and
financial holdings and the withdrawal of state funds from Slovenian companies are
necessary conditions for this.
Macedonia’s privatisation is usually characterised by non-transparency and
inconsistency, which was also observable in our dataset. For various reasons we had
to eliminate many observations. Massive organisational modifications meant many
firms simply disappeared, some firms were split into smaller firms, while others failed
to meet any basic logical criteria throughout the studied period. The enthusiasm of
change based on internal privatisation ruled the economy. In those circumstances, the
stripping of assets was the expected outcome. Putting more emphasis on external
ownership and the policy of attracting foreign capital to partially mitigate those
problems was a very wise move of policy-makers at the end of the nineties. No doubt,
they will have to continue with that policy after circumstances in the country are
normalised.
30 3

REFERENCES
Babic´, Stojan, “Transition Experience and Prospects for Growth - The Case of Serbia
and Montenegro.” Paper prepared for the Global Research Project. Vilnius: GDN
Meeting, August 2001.
Bartlett, Will, Prasˇnikar, Janez, “Small Firms and Economic Transformation in
Slovenia.” Communist Economies & Economic Transformation. Vol. 7, No. 1, pp. 83
–103, 1995.
Bajt, Aleksander, A Property Rights Analysis of the Transition Problems in the East.
Ljubljana: Economic Institute at the Faculty of Law, 1992.
Bole, Veljko, “The Conduct of Monetary Policy and Banking Soundness: A Slovenian
Episode.” In Bleyer, Skreb, Central Banking, Monetary Policy and the Implications for
Transition Economies, pp. 185-212. Oxford: Oxford University Press, 1999.
Brown, David, and Earle, John, “Privatisation and Restructuring in Russia: New
Evidence from Panel Data on Industrial Enterprises.” RECEP Working Papers No.1.
Moscow: 2000.
Cˇucˇkovic´, Nevenka, “Post-Privatisation Ownership Structure and its Impact on
Corporate Governance in Croatia.” Mimeo. 2001.
Domadenik, Polona, Prasˇnikar, Janez, and Svejnar, Jan, “Restructuring Slovenian
Firms in Imperfectly Developed Markets.” Paper presented at WDI & CEPR
Conference Economics of Transition. Portorozˇ: June 2001.
Drummond, Paulo, “Former Yugoslav Republic of Macedonia Banking Soundness and
Recent Lessons.” IMF Working Paper. Washington D.C.: August 2000.
EBRD, Transition Report 2000. London:2001.
Estrin, Saul, “Competition and Corporate Governance in Transition.” Paper presented 31 3

at JEP Conference. Prague: March 2001.
Frydman, Robert, Pistor, K., and Rapaczynski Andrew, “Investing in Insider-
Dominated Firms: A Study of Russian Voucher Privatisation Funds.” In Robert
Frydman, C. Gray, and Andrej Rapaczynsky, Eds., Corporate Governance in Central
Europe and Russia, Vol. 1: Banks, Funds and Foreign Investitors. Budapest, London,
New York: 1996.
Gregoricˇ, Aleksandra, Prasˇnikar, Janez, and Ribnikar Ivan, “Corporate Governance
in Transitional Economies: The Case of Slovenia.” Economic and Business Review, 2:
183-207, 2000.
Jefferson, Gary, Rawski, Thomas, Wang Li, and Zheng Yuxin, “Ownership,
Productivity Change and Financial Performance in Chinese Industry.” Journal of
Comparative Economics, 28: 786-813, 2000.
Kuznetsov, Pavel, and Muravyev, Aleksander, “Ownership Structure and Firm
Performance in Russia: the Case of the Blue Chips of the Stock Market.” Paper
presented at CEPR Annual Transition Economics Summer Workshop for Young
Academics. Portorozˇ: July 2001.
Markovska, Hadzˇi-Vasileva Verica, “Privatisation in the Republic of Macedonia as
the Main Vecihle for Improving Corporate Governance.” Phare ACE project paper.
Brussels: 2001.
Markovska, Hadzˇi-Vasileva Verica, Slaveski, Trajko, and Pahor, Marko, “Does the
Privatisation Method Matter? Privatisation and Corporate Governance in
Macedonia.” Phare ACE project paper. Brussels: 2001.
Mencinger, Jozˇe, “Deset let pozneje: tranzicija –uspeh, polom ali nekaj vmes (Ten
Years Later: Transition – Success, Failure or Something in-between).” Gospodarska
gibanja.Ljubljana: 2000/7: pp.25-40, 2000.32 3

Meyendorf, Anna, and Snyder, Edward, “Transactional Structure of Bank
Privatizations in Central Europe and Russia.” Journal of Comparative Economics. 25,
1: 5-30, 1997.
Pavlicˇ, Damijan Jozˇe, “Rastocˇi donosi glede na obseg in sestavo menjave: empiricˇni
prikaz (Increasing returns to scale and patterns of trade: empirical evidence).” Working
paper no. 26. Ljubljana: Faculty of Economics, 1996.
Prasˇnikar, Janez, and Svejnar, Jan, “Economic Behaviour of Yugoslav Enterprises.”
Advances in the Economic Analysis of Participatory and Labour Managed Firms. 3:
273-311, 1988.
Prasnikar Janez, Svejnar Jan, and Mark Klinedinst, “Structural adjustment policies
and productive efficiency of socialist enterprises.” European Economic Review. 36:
179-199, 1992.
Prasnikar, Janez, Mrak Mojmir, Jazbec Bostjan, Domadenik Polona, Gregoric,
Aleksandra, Koman, Matjaz, “Bosnia and Herzegovina – Country Study for GDN
Project.” Paper prepared for the Global Research Project. Vilnius: GDN Meeting,
August 2001.
Rojec, Matija, “Foreign investment and privatisation in Slovenia.” In Aristien-
Maksimenko, Patrick, and Rojec, Matija, Eds., Foreign investment and privatisation
in Eastern Europe. pp. 229-255. Basingstoke/New York: Palgrave, 2001.
Slaveski, Trajko, “Privatisation in Macedonia – Five Years After.” Eastern European
Economics. 35, 1, 31-52: January 1997.
Stiglitz, Joseph, Weiss, Andrew, “Credit Rationing in Markets with Imperfect
Information.” American Economic Review. 393-410, 1981.
Stiglitz, Joseph, “Whither Reform? Ten Years of Transition.” Paper presented at the
Annual Bank Conference on Development Economics. April 1999.33 3

34 3

APPENDIX
Table 1: Means of selected variables and ownership structure, by year
for Slovenia
1996 1997 1998 TotalVariable Description N Mean N Mean N Mean Mean
VA Value added (in 1000 SIT) 121 1.51E+06 127 1.65E+06 126 1.70E+06 1.62E+06
KA Tangible assets (in 1000 SIT) 121 2.86E+06 127 3.02E+06 126 3.29E+06 3.06E+06
L Number of employees 128 550.0 127 511.6 128 499.9 520.5
KA/L Tangible assets per worker (in 1000 SIT)
121 2.594E+03 127 2.786E+03
126 2.797E+03 2.728E+03
VA/L Value added per worker (in 1000 SIT) 121 4.983E+03 127 5.379E+03
126 5.685E+03 5.354E+03
OWNERSHIP STRUCTURE
FUNDS State and investment funds (%) 125 37.817 119 37.270 118 35.570 36.905
FIRMS Other firms (%) 125 10.736 119 13.661 118 17.331 13.847
INT_OWN Internal owners (%) 125 37.974 119 38.446 118 37.045 37.827
MISCEL Miscellaneous (%) 125 13.440 119 10.623 118 10.054 11.410
35 5

Table 2: Means of selected variables, by year and type of ownership for
Slovenia
1994
1995 1996
1997 1998
Total
N Mean N Mean N Mean N Mean N Mean Mean
External privatisation method
VA 57 1.94E+06 56 1.93E+06 56 1.96E+06 58 2.02E+06 57 1.86E+06 1.94E+06
KA 57 4.32E+06 56 4.26E+06 55 4.40E+06 58 4.27E+06 57 4.43E+06 4.34E+06
L 58 569.3 58 594.3 58 595.3 57 524.7 58 519.0 560.7
KA/L 56 2.799E+03 55 2.730E+03 56 2.902E+03 58 3.127E+03 57 2.971E+03 2.908E+03
VA/L 56 6.440E+03 55 6.351E+03 56 6.530E+03 58 6.807E+03 57 7.238E+03 6.677E+03
Internal privatisation method
VA 66 1.16E+06 66 1.09E+06 63 1.12E+06 67 1.09E+06 67 1.11E+06 1.11E+06
KA 66 1.62E+06 66 1.54E+06 63 1.59E+06 67 1.62E+06 67 1.69E+06 1.61E+06
L 68 523.0 66 525.1 68 503.6 68 493.0 68 477.3 504.3
KA/L 65 2.424E+03 66 2.340E+03 63 2.356E+03 67 2.528E+03 67 2.683E+03 2.468E+03
VA/L 65 3.927E+03 66 3.687E+03 63 3.710E+03 67 4.248E+03 67 4.474E+03 4.014E+03
36 5

Table 3: Means of selected variables, by year and type of ownership for Macedonia
1994 1995 1996 1997 1998 1999
N Mean N Mean N Mean N Mean N Mean N Mean
Employee buy-out
VA 91 8.78E+06 90 8.62E+06 90 7.51E+06 88 7.13E+06 89 6.74E+06 89 6.22E+06
KA 91 1.93E+07 90 1.86E+07 90 1.80E+07 88 1.99E+07 89 1.87E+07 89 1.93E+07
L 91 56.5 90 52.0 90 49.5 88 46.6 89 44.9 89 44.8
KA/L 91 3.263E+05 90 4.036E+05 90 4.246E+05 88 5.033E+05 89 5.076E+05 89 5.477E+05
VA/L 91 1.638E+05 90 1.753E+05 90 1.639E+05 88 1.619E+05 89 1.562E+05 89 1.484E+05
Other internal privatisation methods
VA 187 1.01E+08 186 1.02E+08 187 8.84E+07 188 8.91E+07 186
8.91E+07 188
8.47E+07
KA 187 2.09E+08 186 2.15E+08 187 2.14E+08 188 2.30E+08 186
2.09E+08 188
2.22E+08
L 187 484.0 186 463.9 187 440.1 188 419.4 186
380.1 187
369.3
KA/L 187 4.388E+05 186 4.773E+05 187 4.979E+05 188 5.539E+05 186
5.540E+05 187
5.967E+05
VA/L 187 2.249E+05 186 2.333E+05 187 2.178E+05 188 2.197E+05 186
2.450E+05 187
2.407E+05
Privatised by foreigners
VA 16 1.47E+08 16 1.31E+08 16 1.28E+08 15 1.53E+08 15 1.48E+08 15 1.59E+08
KA 16 2.80E+08 16 2.12E+08 16 2.02E+08 15 2.12E+08 15 1.84E+08 15 2.01E+08
L 16 440.8 16 421.8 16 421.4 15 423.5 15 429.2 15 456.7
KA/L 16 4.432E+05 16 3.967E+05 16 3.797E+05 15 4.453E+05 15 3.886E+05 15 4.182E+05
VA/L 16 2.568E+05 16 2.229E+05 16 2.379E+05 15 2.833E+05 15 2.809E+05 15 2.810E+05
Privatised by ex-Yugoslav firms
VA 36 4.25E+06 36 4.51E+06 34 4.57E+06 34 4.08E+06 34 3.78E+06 34 4.00E+06
KA 36 1.03E+07 36 9.77E+06 34 8.21E+06 34 6.98E+06 34 6.70E+06 34 6.86E+06
L 36 15.4 36 15.2 34 11.9 34 10.9 34 10.2 34 10.0
KA/L 36 8.347E+05 36 7.364E+05 34 8.006E+05 34 8.286E+05 34 7.672E+05 34 8.761E+05
VA/L 36 4.602E+05 36 4.702E+05 34 4.418E+05 34 4.375E+05 34 4.118E+05 34 4.930E+05
37 5

Table 3 (continued)
1994
1995 1996
1997
1998
1999
N Mean N Mean
N Mean N Mean N Mean N Mean
Privatised as subsidiary firms
VA 22 6.60E+06 22 7.26E+06
21 7.17E+06 22 9.77E+06 22 1.09E+07 23 1.14E+07
KA 22 1.67E+07 22 1.60E+07
21 1.66E+07 22 1.86E+07 22 1.95E+07 23 2.10E+07
L 22 53.7 22 54.6
21 52.1 22 60.6 22 60.9 23 58.7
KA/L 22 4.047E+05
22 3.517E+05
21 4.002E+05 22 4.211E+05 22 4.193E+05 23 4.960E+05
VA/L 22 2.465E+05
22 2.556E+05
21 2.833E+05 22 2.550E+05 22 2.770E+05 23 3.191E+05
Other external privatisation methods
VA 8 -5.31E+07 8 2.70E+07
9 3.15E+07 8 4.98E+07 8 7.06E+07 8 2.87E+07
KA 8 2.83E+08 8 2.68E+08
9 2.37E+08 8 2.47E+08 8 2.41E+08 8 2.36E+08
L 8 496.8 8 287.1
9 292.7 8 281.0 8 293.8 8 297.1
KA/L 8 7.764E+05
8 9.765E+05
9 8.649E+05 8 9.269E+05 8 8.594E+05 8 8.855E+05
VA/L 8 -2.133E+04
8 1.659E+05
9 1.609E+05 8 2.359E+05 8 2.694E+05 8 1.505E+05
38 5

Table 4: Effects of ownership on average productivity of Slovenian firms (detailed ownership)
Pooled OLS Fixed Effects
Between Effects Random Effects
Coef. SE Coef. SE Coef. SE Coef. SE
LN(capital) 0.407*** 0.032 0.267*** 0.070 0.426***
0.053 0.435*** 0.040
LN(labour) 0.584*** 0.042 0.210*** 0.077 0.562***
0.069 0.472*** 0.051
FUNDS -0.009*** 0.002 -3E-04 0.002 -0.012***
0.004 -0.002 0.002
FIRMS -0.003** 0.001 -3E-04 0.002 -0.005**
0.002 -0.001 0.002
MISCEL -0.004** 0.002 -0.003 0.002 -0.004 0.003 -0.003*** 0.002
Manufacturing 0.226*** 0.063 (dropped) 0.203** 0.101 0.128 0.100
Electricity, gas, water supply 0.075 0.085 (dropped) 0.027 0.139 0.039 0.140
Trade 0.022 0.066 (dropped) -0.023 0.107 -0.057 0.108
Other_ind 0.219** 0.094 (dropped) 0.169 0.153 0.146 0.155
1997 0.015 0.054 0.002 0.025 -0.185 0.458 0.000 0.026
1998 -0.010 0.054 -0.037 0.027 0.428 0.460 -0.036 0.027
Constant 4.811*** 0.308 8.650*** 1.028 4.765***
0.551 4.828*** 0.434
Adj.R2 0.833 within 0.125 within 0.002 within 0.119
between
0.8413 between 0.870 between 0.857
overall 0.8123 overall 0.771 overall 0.830
N 345 345 345 345
Note:
a) ***, **, * statistically significant values at 1%, 5% and 10% on a two-tail test, respectively. b) Firms serving as the base (constant) (a) operated in extraction, mining and manufacturing of food, textile and leather products industries and (b) were 100% owned by internal owners.
c) Hausman: Tests Chi2-value FE vs RE:44.08***
39 5

40 5

Table 5: Effects of ownership on marginal productivity of Slovenian firms (detailed ownership)
41 5

Pooled OLS Fixed Effects
Between Effects
Random Effects Coef. SE Coef. SE Coef
.SE Coef. SE
Ln(capital) 0.272** 0.107 0.279 0.209 0.274
0.197 0.521***
0.122
Ln(labour) 0.655*** 0.165 -0.108 0.196 0.764**
0.294 0.193 0.160
FUNDS -0.009 0.023 -0.037 0.038 -0.004
0.042 0.013 0.025
FIRMS -0.035** 0.017 -0.037 0.033 -0.020
0.032 -0.030 0.020
MISCEL -0.091*** 0.020 -0.051 0.046 -0.099***
0.034 -0.071***
0.026
LnkaFUNDS 0.000 0.002 -8E-04 0.003 0.0006
0.004 -0.003* 0.002
LnlFUNDS 0.000 0.003 0.008** 0.004 -0.003
0.006 0.006** 0.003
LnkaFIRMS 0.002* 0.002 0.002 0.003 0.001
0.003 0.002 0.002
LnlFIRMS -0.002 0.002 0.000 0.003 -0.001
0.005 0.000 0.002
LnkaMISC 0.008*** 0.002 8E-04 0.004 0.009***
0.003 0.003* 0.002
LnlMISC -0.005** 0.003 0.006* 0.003 -0.008*
0.005 0.003 0.003
Manufacturing 0.270*** 0.065 (dropped) 0.220** 0.106
0.171 0.099
Electricity, gas, water supply
0.108 0.089 (dropped) 0.025 0.149
0.090 0.140
Trade 0.063 0.067 (dropped) -0.003 0.112
-0.023 0.105
Other_ind 0.189* 0.093 (dropped) 0.105 0.156
0.130 0.150
1997 0.005 0.052 -0.002** 0.025 -0.381
0.459 -0.007 0.025
1998 -0.020 0.052 -0.054 0.027 0.5354
0.459 -0.053**
0.027
Constant 6.232*** 1.221 10.312*** 2.697 5.743***
2.153 5.225***
1.464
Adj.R2 0.846 within 0.1996 within 0.000
within 0.170
between 0.8109 between 0.885
between
0.867
overall 0.7837 overall 0.727
overall 0.842
N 345 345 345 345
42 5
Note:
a) ***, **, * statistically significant values at 1%, 5% and 10% on a two-tail test, respectively.
b) Firms serving as the base (constant) (a) operated in extraction, mining and manufacturing of food, textile and leather products industries and (b) were 100% owned by internal owners.c) Hausman: Tests Chi2-value FE vs RE:45.3***
43 5

Table 6: Effects of ownership on average productivity of Slovenian firms (majority-owned firms)
Pooled OLS Fixed Effects
Between Effects Random Effects Coef. SE Coef. SE Coef. SE Coef. SE
LN(capital) 0.335*** 0.022 0.143*** 0.036 0.342*** 0.045 0.277*** 0.027
LN(labour) 0.642*** 0.031 0.388*** 0.053 0.658*** 0.063 0.588*** 0.039
EXT -0.0109 0.036 (dropped) 0.004 0.070 0.029 0.070
Manufacturing 0.144*** 0.047 (dropped) 0.158* 0.091 0.109 0.092
Electricity, gas, water supply 0.081 0.065 (dropped) 0.091 0.125 0.040 0.129
Trade 0.015 0.051 (dropped) 0.024 0.099 -0.011 0.098
Other_ind 0.192*** 0.071 (dropped) 0.276* 0.143 0.153 0.139
1995 -0.002 0.054 -0.023 0.027 3.003 2.368 -0.015 0.028
1996 0.003 0.054 0.009 0.027 -1.638 1.822 0.018 0.028
1997 0.043 0.053 0.030 0.027 0.436 2.007 0.040 0.028
1998 0.026 0.053 0.001 0.027 0.274 1.340 0.017 0.028
Constant 5.060*** 0.209 9.330*** 0.549 4.429*** 1.354 6.19*** 0.322
Adj.R2 0.832 Within 0.1525 Within 0.000 Within 0.150
Between 0.8541 Between
0.882 Between
0.863
Overall 0.8258 Overall 0.239 Overall 0.834
N 607 607 607 607
Note:
a) ***, **, * statistically significant values at 1%, 5% and 10% on a two-tail test, respectively.
b) Firms serving as the base (constant) (a) operated in extraction, mining and manufacturing of food, textile and leather products industries and (b) were privatised by the internal method.
c) Hausman: Tests Chi2-value FE vs RE:47.7***
44 5

45 5

Table 7: Effects of ownership on marginal productivity of Slovenian firms (majority-owned firms)
Pooled OLS Fixed Effects
Between Effects Random
Effects
Coef. SE Coef. SE Coef. SE Coef. SE
LN(capital) 0.352*** 0.032 0.225*** 0.050 0.335*** 0.066 0.333*** 0.040
LN(labour) 0.601*** 0.034 0.254*** 0.051 0.636*** 0.070 0.453*** 0.041
EXT -0.0487 0.419 (dropped) -0.387 0.829 -0.408 0.650
LnkaEXT -0.048 0.037 -0.168** 0.066 0.0087 0.075 -0.184*** 0.051
LnlEXT 0.122*** 0.046 0.997*** 0.105 0.048 0.091 0.516*** 0.066
Manufacturing 0.139*** 0.048 (dropped) 0.173* 0.092 0.073 0.093
Electricity, gas, water supply 0.058 0.065 (dropped) 0.079 0.123 -0.053 0.131
Trade 0.007 0.051 (dropped) 0.016 0.098 -0.024 0.099
Other_ind 0.157*** 0.073 (dropped) 0.261* 0.143 0.027 0.142
1995 -0.007 0.053 -0.012 0.025 2.563 2.240 -0.015 0.026
1996 -0.007 0.054 0.027 0.025 -1.984 1.435 0.021 0.026
1997 0.034 0.053 0.067*** 0.025 0.198 2.191 0.053** 0.026
1998 0.016 0.053 0.037 0.025 -0.111 0.924 0.027 0.027
Constant 5.073*** 0.338 7.288*** 0.550 4.935*** 1.353 6.225*** 0.499
Adj.R2 0.836 within 0.2923 within 0.000 within 0.242
between 0.2277 between
0.888 between
0.833
overall 0.2313 overall 0.252 overall 0.813
N 604 604 604 604
Note:
a) ***, **, * statistically significant values at 1%, 5% and 10% on a two-tail test, respectively.
b) Firms serving as the base (constant) (a) operated in extraction, mining and manufacturing of food, textile and leather products industries and (b) were privatised by the internal method.
46 5

c) Hausman: Tests Chi2-value FE vs RE:89.21***
47 5

Table 8: Effects of ownership on marginal productivity, by year for Slovenia (majority-owned firms)
1994 1995 1996 1997 1998
Coef. SE Coef. SE Coef. SE Coef. SE Coef. SE
LN(capital) 0.342*** 0.078 0.233*** 0.069 0.319*** 0.065
0.425*** 0.075 0.428*** 0.068
LN(labour) 0.609*** 0.079 0.733*** 0.072 0.658*** 0.070
0.493*** 0.081 0.501*** 0.075
EXT 0.774 0.965 0.048 0.820 -0.954 0.878
-1.131 1.049 -0.926 0.975
LnkaEXT -0.162** 0.087 -0.058 0.076 0.070 0.077
0.039 0.095 0.055 0.088
LnlEXT 0.269** 0.107 0.143 0.097 -0.005 0.088
0.087 0.107 0.001 0.104
Manufacturing 0.047 0.108 0.162* 0.094 0.165* 0.096
0.208* 0.115 0.143 0.110
Electricity, gas, water supply 0.013 0.148 0.107 0.130 0.079 0.129
0.076 0.158 0.051 0.152
Trade 0.013 0.116 0.089 0.102 -0.011 0.100
-0.061 0.120 0.021 0.118
Other_ind -0.071 0.169 0.226 0.150 0.228 0.141
0.215 0.181 0.263 0.166
Constant 5.194*** 0.815 5.889*** 0.702 5.171*** 0.672
4.710*** 0.800 4.641*** 0.741
Adj.R2 0.835 0.872 0.876 0.821 0.8302
N 121 120 119 124 125
Note:
a) ***, **, * statistically significant values at 1%, 5% and 10% on a two-tail test, respectively.
48 5

49 5
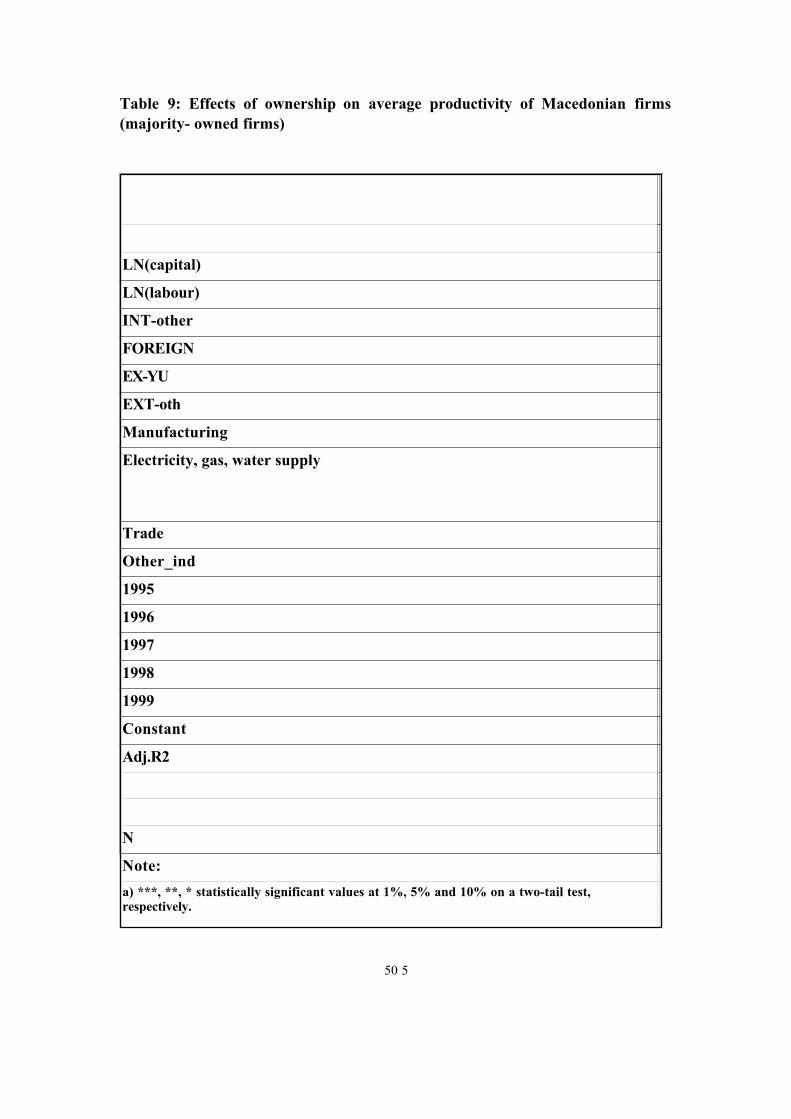
Table 9: Effects of ownership on average productivity of Macedonian firms (majority- owned firms)
Pooled
OLS
Fixed Effects Between Effects Random Effects
Coef.
SE Coef. SE Coef. SE Coef. SE
LN(capital) 0.183***
0.013 0.239*** 0.033 0.158*** 0.028 0.193*** 0.021
LN(labour) 0.743***
0.020 0.774*** 0.063 0.761*** 0.043 0.736*** 0.034
INT-other 0.273***
0.045 (dropped) 0.283*** 0.094 0.258*** 0.091
FOREIGN 0.453***
0.085 (dropped) 0.438** 0.178 0.448** 0.175
EX-YU 0.590***
0.062 (dropped) 0.524*** 0.131 0.520*** 0.129
EXT-oth 0.132**
0.060 (dropped) 0.068 0.125 0.078 0.124
Manufacturing -0.047
0.043 (dropped) -0.035 0.092 -0.032 0.091
Electricity, gas, water supply -0.033
0.058 (dropped) -0.041 0.124 -0.007 0.122
Trade -0.114**
0.049 (dropped) -0.101 0.104 -0.111 0.102
Other_ind 0.037
0.049 (dropped) 0.030 0.105 0.038 0.103
1995 -0.050
0.051 -0.046 0.031 -0.014 0.847 -0.047 0.031
1996 -0.124**
0.052 -0.127*** 0.031 1.744** 0.729 -0.128*** 0.031
1997 -0.117**
0.052 -0.118*** 0.032 0.5065 0.804 -0.120*** 0.031
1998 -0.031
0.052 -0.028 0.033 0.2678 0.937 -0.034 0.031
1999 -0.151**
0.052 -0.157*** 0.033 1.1069 0.877 -0.160*** 0.031
Constant 10.01***
0.170 9.133*** 0.544 9.66*** 0.473 9.87*** 0.289
Adj.R2 0.842
Within 0.194 Within 0.004 Within 0.193
Between 0.8615 Between 0.875 Between 0.871
Overall 0.8328 Overall 0.704 Overall 0.843
N 2100
2100 2100 2100
Note:
a) ***, **, * statistically significant values at 1%, 5% and 10% on a two-tail test, respectively.
50 5

b) Firms serving as the base (constant) (a) operated in extraction, mining and manufacturing of food, textile and leather products industries and (b) were privatised by the EBO method.
c) Hausman: Tests Chi2-value FE vs RE:12.55*
51 5
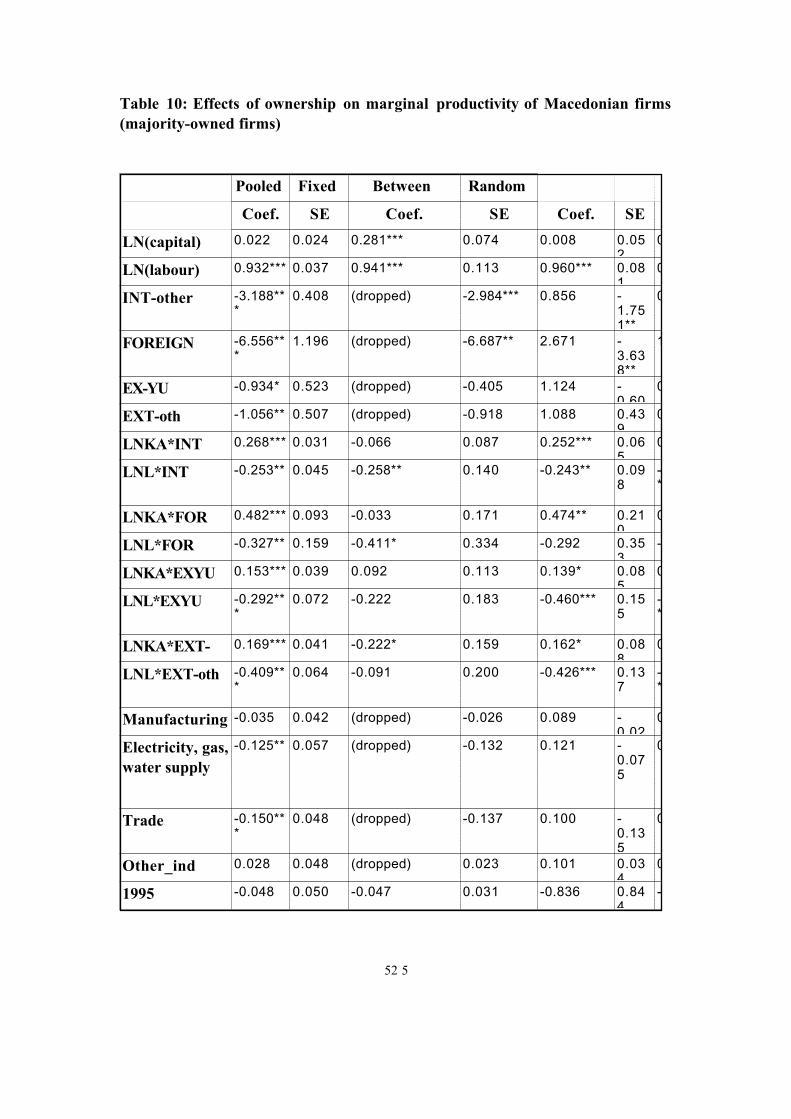
Table 10: Effects of ownership on marginal productivity of Macedonian firms (majority-owned firms)
Pooled OLS
Fixed Effects
Between Effects
Random Effects Coef. SE Coef. SE Coef. SE Coef. SE
LN(capital) 0.022 0.024 0.281*** 0.074 0.008 0.052
0.088** 0.041
LN(labour) 0.932*** 0.037 0.941*** 0.113 0.960*** 0.081
0.902*** 0.064
INT-other -3.188***
0.408 (dropped) -2.984*** 0.856 -1.751**
0.707
FOREIGN -6.556***
1.196 (dropped) -6.687** 2.671 -3.638**
1.904
EX-YU -0.934* 0.523 (dropped) -0.405 1.124 -0.607
0.915
EXT-oth -1.056** 0.507 (dropped) -0.918 1.088 0.439
0.934
LNKA*INT 0.268*** 0.031 -0.066 0.087 0.252*** 0.065
0.163*** 0.051
LNL*INT -0.253** 0.045 -0.258** 0.140 -0.243** 0.098
-0.187***
0.077
LNKA*FOR 0.482*** 0.093 -0.033 0.171 0.474** 0.210
0.287** 0.127
LNL*FOR -0.327** 0.159 -0.411* 0.334 -0.292 0.353
-0.228 0.227
LNKA*EXYU 0.153*** 0.039 0.092 0.113 0.139* 0.085
0.129** 0.067
LNL*EXYU -0.292***
0.072 -0.222 0.183 -0.460*** 0.155
-0.299***
0.116
LNKA*EXT-oth
0.169*** 0.041 -0.222* 0.159 0.162* 0.088
0.045 0.073
LNL*EXT-oth -0.409***
0.064 -0.091 0.200 -0.426*** 0.137
-0.284***
0.111
Manufacturing -0.035 0.042 (dropped) -0.026 0.089 -0.029
0.088
Electricity, gas, water supply
-0.125** 0.057 (dropped) -0.132 0.121 -0.075
0.119
Trade -0.150***
0.048 (dropped) -0.137 0.100 -0.135
0.099
Other_ind 0.028 0.048 (dropped) 0.023 0.101 0.034
0.099
1995 -0.048 0.050 -0.047 0.031 -0.836 0.844
-0.044 0.031
52 5

1996 -0.122** 0.050 -0.129*** 0.032 1.1554 0.723 -0.126***
0.031
1997 -0.120** 0.050 -0.119*** 0.033 0.1081 0.781 -0.118** 0.031
1998 -0.032 0.050 -0.028 0.034 -0.5609 0.947 -0.030 0.032
1999 -0.155***
0.050 -0.154*** 0.034 0.9026 0.853 -0.158***
0.032
Constant 11.89*** 0.324 9.395*** 0.573 11.82*** 0.788 10.947***
0.586
Adj.R2 0.852 Within 0.1986 within 0.002 Within 0.190
Between 0.3482 between 0.889 Between
0.883
Overall 0.3542 overall 0.688 Overall 0.852
N 2100 2100 2100 2100
Note:
a) ***, **, * statistically significant values at 1%, 5% and 10% on a two-tail test, respectively.
b) Firms serving as the base (constant) (a) operated in extraction, mining and manufacturing of food, textile and leather products industries and (b) were privatised by the EBO method.
c) Hausman: Tests Chi2-value FE vs RE:26.39*
53 5

Table 11: Effects of ownership on marginal productivity, by year for Macedonia (majority-owned firms)
1994 1995 1996 1997 1998 1999
Coef. SE Coef. SE Coef. SE Coef. SE Coef. SE Coef.
LN(capital) -0.033 0.056 0.013 0.063 0.060 0.066 -0.001 0.058 0.006 0.048 0.084 0.063
LN(labour) 0.985*** 0.088 0.921*** 0.096 0.894*** 0.102 1.014*** 0.091 0.955*** 0.076 0.809*** 0.099
INT-other -2.441*** 0.852 -4.646*** 1.008 -2.527** 1.097 -3.326*** 1.038 -3.855*** 0.894 -3.178*** 1.161
FOREIGN -6.85*** 2.282 -7.356*** 2.812 -4.574* 3.386 -6.688** 3.039 -7.338*** 2.670 -5.849 3.656
EX-YU -0.252 1.087 0.029 1.282 -0.457 1.441 -1.601* 1.370 -1.847* 1.126 -2.012 1.407
EXT-oth -1.699* 1.140 -1.428 1.260 0.449 1.532 -1.431* 1.238 -2.044** 1.050 -0.022 1.301
LNKA*INT 0.239*** 0.067 0.374*** 0.077 0.221** 0.082 0.273*** 0.077 0.313*** 0.066 0.249*** 0.086
LNL*INT -0.277* 0.105 -0.341*** 0.114 -0.232** 0.124 -0.274** 0.112 -0.274** 0.095 -0.163 0.125
LNKA*FOREIGN 0.465*** 0.189 0.404** 0.229 0.297 0.281 0.500** 0.223 0.566*** 0.193 0.591** 0.276
LNL*FOREIGN -0.227 0.374 0.023 0.415 -0.093 0.480 -0.378 0.360 -0.452* 0.298 -0.719 0.460
LNKA*EXYU 0.142* 0.083 0.089 0.097 0.099 0.107 0.204** 0.101 0.191** 0.085 0.206** 0.105
LNL*EXYU -0.539*** 0.145 -0.336** 0.171 -0.137 0.196 -0.260** 0.179 -0.100 0.171 -0.167 0.214
LNKA*EXT-oth 0.224*** 0.092 0.191* 0.103 0.063 0.124 0.203** 0.100 0.234** 0.085 0.088 0.105
LNL*EXT-oth -0.501*** 0.138 -0.452*** 0.162 -0.394** 0.188 -0.412*** 0.161 -0.374** 0.134 -0.314* 0.172
Manufacturing -0.001 0.092 0.084 0.103 -0.038 0.116 -0.098 0.105 -0.166** 0.090 -0.005 0.119
Electricity, gas, water supply -0.084 0.122 0.044 0.137 -0.021 0.154 -0.130 0.142 -0.333*** 0.120 -0.233 0.159
Trade -0.118 0.102 -0.148 0.114 -0.208* 0.131 -0.139 0.118 -0.214** 0.102 -0.128 0.135
Other_ind 0.160* 0.103 0.032 0.116 0.049 0.131 0.012 0.120 -0.081 0.102 -0.016 0.134
Constant 12.510*** 0.717 12.06*** 0.836 11.357*** 0.892 11.89*** 0.789 12.08*** 0.662 11.138*** 0.863
Adj.R2 0.879 0.853 0.817 0.849 0.891 0.822
N 350 353 348 352 349 348
Note:
a) ***, **, * statistically significant values at 1%, 5% and 10% on a two-tail test, respectively.
b) Firms serving as the base (constant) (a) operated in extraction, mining and manufacturing of food, textile and leather products industries and (b) were privatised by the EBO method.
54 5

55 5