DETERMINANTS OF AGRO-FOOD PRICE DEVELOPMENTS IN SLOVENIA
12
25 Delhi Business Review X Vol. 11, No. 2 (July - December 2010) DETERMINANTS OF AGRO DETERMINANTS OF AGRO DETERMINANTS OF AGRO DETERMINANTS OF AGRO DETERMINANTS OF AGRO- FOOD PRICE DEVELOPMENTS FOOD PRICE DEVELOPMENTS FOOD PRICE DEVELOPMENTS FOOD PRICE DEVELOPMENTS FOOD PRICE DEVELOPMENTS IN SLOVENIA IN SLOVENIA IN SLOVENIA IN SLOVENIA IN SLOVENIA tefan Bojnec* tefan Bojnec* tefan Bojnec* tefan Bojnec* tefan Bojnec* Sergej Gricar** Sergej Gricar** Sergej Gricar** Sergej Gricar** Sergej Gricar** UALITY and price are the critical determinants for consumers in making purchasing decisions. A firm that can provide an appropriate array of goods and services at a lower price than its competitors will have a competitive advantage that should result in an increase in business and enhance financial returns. This article focuses on the consumer food price developments during the Slovenian adjustments towards the European Union membership, and the Euro adoption by the followed increased in consumer prices, and the current economic and financial crises. The empirical analysis on the determinants of the consumer food prices is based on the monthly statistical data, which were obtained from the Statistical Office of the Republic of Slovenia. Agricultural producers prices during the period examined have increased substantially less than the consumer agro-food prices. During the analyzed period, there has been substantial increase in the energy prices as well as in agricultural wages. By using the principal component analyses, the two common components are identified: 1) general level of prices and wages in agriculture, and 2) the input material prices, funds for agriculture, weather conditions, and output prices of crops in agriculture, but the mitigating role of the Euro adoption. The first common component explains 48.4% of the total variance of the analyzed variables. The second common component additionally explains 13.7% of the total variance. By using the multiple regression analysis we found that the consumer food prices are positively and significantly associated with the agricultural wages, with the agricultural producer prices, with the prices of municipal services, energy prices, and the prices of inputs for agriculture. We also found that the Euro adoption had only the short-term impact on the consumer food prices, but not on the medium- term. By using the linear trend analysis on the time-series data we confirm that during the time of the high food prices from April 2007 to May 2008, the consumer food prices were overshooting above its average level. The highest growth in the consumer food prices was in September 2007. The consumer food price increases were statistically significant between February 2008 and May 2008. During this period the average value of the consumer food price index was 100.45. The economic recession in Slovenia since October 2008 has caused the stabilization and later decline in the consumer food prices. This decline has been significant between February and May 2009. During this period the average value of the consumer food price index was 99.75. This result and the later developments imply that the economic recession has caused the significant decline in the consumer food prices since October 2008. The lowest level in the consumer food price index is recorded by June 2009. During the economic recession the level of productivity (output) and the demand for most goods and services, including the food industry, have declined. Key Words: Agro-food Chain, Food Prices, Economic Recession, Euro, Slovenia. Introduction A key task for the economies that have joined the European Union (EU) (Blanchard, 1997) is a real convergence, the catching up with the per capita income levels of the older more developed members. Q * Professor of Economics, Faculty of Management, Koper, Slovenia. ** Ph.D. Student, University of Primorska, Faculty of Management, Koper, Slovenia.
-
Upload
independent -
Category
Documents
-
view
4 -
download
0
Transcript of DETERMINANTS OF AGRO-FOOD PRICE DEVELOPMENTS IN SLOVENIA

25
Delhi Business Review X Vol. 11, No. 2 (July - December 2010)
DETERMINANTS OF AGRODETERMINANTS OF AGRODETERMINANTS OF AGRODETERMINANTS OF AGRODETERMINANTS OF AGRO-FOOD PRICE DEVELOPMENTSFOOD PRICE DEVELOPMENTSFOOD PRICE DEVELOPMENTSFOOD PRICE DEVELOPMENTSFOOD PRICE DEVELOPMENTSIN SLOVENIAIN SLOVENIAIN SLOVENIAIN SLOVENIAIN SLOVENIA
�tefan Bojnec*�tefan Bojnec*�tefan Bojnec*�tefan Bojnec*�tefan Bojnec*Sergej Gricar**Sergej Gricar**Sergej Gricar**Sergej Gricar**Sergej Gricar**
UALITY and price are the critical determinants for consumers in making purchasing decisions.A firm that can provide an appropriate array of goods and services at a lower price than itscompetitors will have a competitive advantage that should result in an increase in business
and enhance financial returns. This article focuses on the consumer food price developments duringthe Slovenian adjustments towards the European Union membership, and the Euro adoption by thefollowed increased in consumer prices, and the current economic and financial crises. The empiricalanalysis on the determinants of the consumer food prices is based on the monthly statistical data,which were obtained from the Statistical Office of the Republic of Slovenia. Agricultural producers�prices during the period examined have increased substantially less than the consumer agro-foodprices. During the analyzed period, there has been substantial increase in the energy prices as well asin agricultural wages. By using the principal component analyses, the two common components areidentified: 1) general level of prices and wages in agriculture, and 2) the input material prices, fundsfor agriculture, weather conditions, and output prices of crops in agriculture, but the mitigating roleof the Euro adoption. The first common component explains 48.4% of the total variance of the analyzedvariables. The second common component additionally explains 13.7% of the total variance. By usingthe multiple regression analysis we found that the consumer food prices are positively and significantlyassociated with the agricultural wages, with the agricultural producer prices, with the prices ofmunicipal services, energy prices, and the prices of inputs for agriculture. We also found that theEuro adoption had only the short-term impact on the consumer food prices, but not on the medium-term. By using the linear trend analysis on the time-series data we confirm that during the time ofthe high food prices from April 2007 to May 2008, the consumer food prices were overshooting aboveits average level. The highest growth in the consumer food prices was in September 2007. The consumerfood price increases were statistically significant between February 2008 and May 2008. During thisperiod the average value of the consumer food price index was 100.45. The economic recession inSlovenia since October 2008 has caused the stabilization and later decline in the consumer foodprices. This decline has been significant between February and May 2009. During this period theaverage value of the consumer food price index was 99.75. This result and the later developmentsimply that the economic recession has caused the significant decline in the consumer food prices sinceOctober 2008. The lowest level in the consumer food price index is recorded by June 2009. During theeconomic recession the level of productivity (output) and the demand for most goods and services,including the food industry, have declined.
Key Words: Agro-food Chain, Food Prices, Economic Recession, Euro, Slovenia.
IntroductionA key task for the economies that have joined the European Union (EU) (Blanchard, 1997) is a realconvergence, the catching up with the per capita income levels of the older more developed members.
Q
* Professor of Economics, Faculty of Management, Koper, Slovenia.
** Ph.D. Student, University of Primorska, Faculty of Management, Koper, Slovenia.

26
Štefan Bojnec and Sergej Gricar
Although some observers have stressed that this process would require extensive investment in physi-cal and human capital (Blanchard, 1997 and Buiter, 2000), the economic growth literature suggeststhat these are not likely to be the decisive forces leading to the convergence. This literature, from Solow(Solow, 1957) to Prescott (Prescot, 1998) and Hall and Jones (Hall and Jones, 1999), stresses thateconomic growth as well as inter-country differences in per capita income are largely due to changes ordifferences in total factor productivity, while the accumulation of physical and human capital playsonly a subsidiary role.
The changing conditions in the world economy have caused the ways�, sources and participants in thechanging global competition. We can talk about competitiveness of enterprises, institutions, branches,and countries. Svetlicic (1996) argues that is necessary to distinguish between competitiveness andcompetition. The first one is pre-condition for an efficient competition at the market. The competitive-ness is not easy to define as it is a subject of different interpretations and misinterpretations. Althoughcompetitiveness is defined as an economic term, there are also other factors such as political, naturaland cultural characteristics of countries that might cause competitiveness. Porter (1990) distinguishestwo kinds of competitive advantages: first, cost, as an enterprise ability to produce and sell cheaper andmore efficient than competitors, and second, which is based on product differentiation, as an enterpriseability to supply products of higher quality, specific characteristics, and selling services.
The entry of Slovenia into the EU has caused an additional competition and thus changed the competi-tiveness relationships between sellers of food. The competitive forces have created pressures for a de-cline of prices for food and non-alcoholic beverages (agro-food prices) depending on the initial marketprice levels (Bojnec, 2009). The initial market conditions varied between the new member states of theEU (Bojnec and Ferto, 2009). The increased competition in the food markets, due to the entry of newdomestic retail chains as well as the entry of foreign retailers and supermarkets, can explain theincreased number of low price agro-food suppliers and the changes in the levels and structures of foodprices in the retail market outlets. The borderless trade on the single market, economic growth, Euroadoption and implementation of Common Agricultural Policy (CAP) are some of the important changesfor the Slovenian agro-food chains. The transportation of food on long distances is causing high costs,which are not only direct transportation costs, but also indirect costs such as pollution of environment,deterioration of nutritional value of food and similar (Kovac, and Majkovic, 2009). The EU policies arefocusing on farm diversification as well as on diversification of economic activities on agricultural areasand in households in rural areas. The farm entrepreneurship and entrepreneurship in agriculturalareas and in rural development are seen as efficient tools for promotion of rural economy developmentand for its sustainable long-term development (Bojnec, 2009a). Slovenian agriculture is relatively lessproductive due to less favourable natural conditions for agricultural production, historical farm struc-tures, less favourable demographic and educational structures of heads of agricultural households(Knific, 2008). Hocevar (2007) also mention the importance of storages of agro-food products on agro-food markets.
Price stability is one of the key objectives of the macroeconomic policy. Price indices give a weight toprices of goods and services depending on their economic importance (Samuelson and Nordhaus, 1995).Different theories of inflation have been developed in literature. Traditional explanation of inflation wasthat it is caused by pressures on demand side or pressures on cost side (Hrovatin, 2004). Both causes ofinflation are simultaneous, and are merging through inflation expectations. Factors, which usuallycontribute to inflation (�piljak, 2006), are increased demands (for example for agricultural produce),increased input costs (for example for means for plant protection), increased prices for non-tradablegoods (for example electrical energy), and increased wages in tradable sectors. Gricar and Bojnec (2009)for the catering industry sector show that prices are positively associated with the Euro adoption inSlovenia. The catering industry prices are also positively associated with demands for tourist services,wages and input costs in the catering industry.
On supply side, the pressures for consumer price increases started in 2002 and in mid-2007 due to aconsiderable increase in oil prices and increases of basic raw materials as well as food at the worldmarkets. This was transmitted into a rapid increase in domestic prices of food and liquid fuels (IMAD,2008).

27
Delhi Business Review X Vol. 11, No. 2 (July - December 2010)
Surti (2008) aimed to explain the causes of inflation with the Euro adoption in Slovenia. The Euroadoption was on 1st January 2007. The impact of the Euro adoption to inflation was significant in thefirst quarter of 2007, but between the second quarter and 2008 by high prices of food. IMAD (2009)estimated that the Euro adoption had the short-term impact on price increases by 0.24 percentagepoint. Since the second half of 2008 inflation has started to slow-down due to price stabilisation forliquid fuel.
Kozamernik (2009) argues that a part of agro-food price increases in 2007 was transferred from theprevious year during the adjustment to the Euro adoption. In general, agro-food price developments aredetermined by supply-side and demand-side factors. Since mid-2008 the rate of inflation in Slovenia hasstabilized due to the liquid fuel price stabilization (IMAD, 2009).
Recent institutional and economic erosions and the rise in state control over energy resources and theiruse violate the principles of globalization (Novak, 2008 and Quirk, 2008). Financial and economic crisissince the third quarter of 2008 has caused the reduction of economic activity as well as the interna-tional economic flows. The decline of the economic activity in the Slovenian main trading partners suchas in Germany, France and Italy has reduced the Slovenian exports as well as has had implications fordemands for the Slovenian goods and services (Gricar and Bojnec 2009).
The aim of the paper is to investigate factors that are associated with the development of agro-foodprices in Slovenia. The monthly data used are obtained from the Statistical Office of the Republic ofSlovenia (SORS) for the period from January 2000 to June 2009. We aim to estimate how agro-foodprices are associated with the costs of labour in agriculture, prices of energy, communal services andcosts for purchases of inputs in agriculture (Blanchard, 1997). We expect that the changes in agro-foodprices are positively associated with the Euro adoption during its initial stage of introduction and withproducer prices of agricultural products. The economic losses due to an extreme weather conditionsmight have an additional impact on agro-food prices during the last decades (European Commission2008). Due to this, we expect association of agro-food prices with the adverse weather conditions, whichare measured by the quantity of rains in Slovenia.
Methodology and Data UsedIn the empirical analysis we use the principal component method as one of the multivariate methods.We create two new synthetic variables Rk1, and Rk2 (Gricar, 2009) which are a linear combination ofthe original variables. In the principal component analysis, we use the following ten variables: index ofgross wages in agriculture (IGWA), index of quantity of rains (rains), index of prices for food and non-alcoholic beverages (IFB), consumer price index (CPI), dummy variable for the Euro adoption (D1),dummy variable for the period after the Euro adoption (D2), index of communal services for water(ICS), index of input prices in agriculture (IIA), index of energy prices (IEP), and agricultural producersprice index (APPI). The two dummy variables D1 and D2 are created arbitrary considering the previ-ous analysis (Bojnec and Gricar, 2009; IMAD, 2008; SORS, 2009 and Surti, 2008). With principalcomponent analysis we find two main principal components, which are used as the synthetic variables(Gricar, 2009).
We also employ multiple regression analysis. With the regression analysis we aim to find function y =f(x), which the best captures the mutual relationships between the analysed variables. We expectpositive association between IFB, which is the dependent variable, and IGWA, Rains, CPI, ICS, IIA,IEP, APPI, D1 and D2, respectively, which are used as the explanatory variables in the linear regres-sion equation:
IFB =a+b1*ICS+b2*IGWA+b3*rains+b4*IIA+b5*APPI+b6*IEP+b7*D1+b8*D2.
With the regression analysis we investigate the intensity, direction and significance of the associationsbetween the analysed variables. We aim to identify main determinants, which are associated withconsumer agro-food prices focusing on the costs determinants of inflation and the Euro adoption inSlovenia (Bojnec and Gricar, (2009).
With the variance analysis we test hypothesis about equality of regression coefficients (Ho: ß1 = ß2 = ...

28
Štefan Bojnec and Sergej Gricar
= ßk = 0) and with t test we test the association between the dependent and the individual explanatoryvariables (Ho: ßi = 0). Important is the statistical significance of the obtained empirical results. Theacceptable statistical significance is less or equal 5% (a ? 0.05) that we can reject the null hypothesisand to accept the conclusion on the dependence of the dependent variable on the individual explanatoryvariables (Ko�melj, 1987). For the multiple regression analysis it is important to estimate statisticalsignificance of the regression coefficient ßi and the determination coefficient R2 for the explanation ofthe regression by the specified explanatory variables. The ßi tells for how many units increases (ordecreases) the dependent variables yi, if the value for the explanatory variable xi increases for one unit.R2 tells the share of variance of the dependent variable, which is explained by the linear combination ofthe explanatory variables.
The price statistics monitor and collect prices in different stages of production or sale according to themethodological basis for monitoring and processing of price data18. The empirical regression resultsand results obtained by the principal component analysis are conducted on the data obtained from theSORS from January 2000 to June 2009. The variables are recalculated into the indices with the baseperiod in January 2000 (January 2000=100).
We also use the trend analysis of time-series data for the investigated variable IFB and its develop-ments over time. We aim to clarify the dynamics of the time-series data. With the regression analysiswe estimate the trend equation. Time variable is transformed into the technical time, which the sumis equal to zero. The IFB is in current prices from the SORS data for the period from January 2000 toSeptember 2009.
Empirical ResultsDevelopments of Prices and WagesThe summary statistics of the main data used for the analysed variables are presented in Table 1.Between January 2000 and June 2009 the greatest cumulative increase is found for the index ofenergy prices by 96.5% and for the index of gross wages in agriculture by 80.6%. The lowestcumulative increase is found for agricultural producer prices by 25.4%.
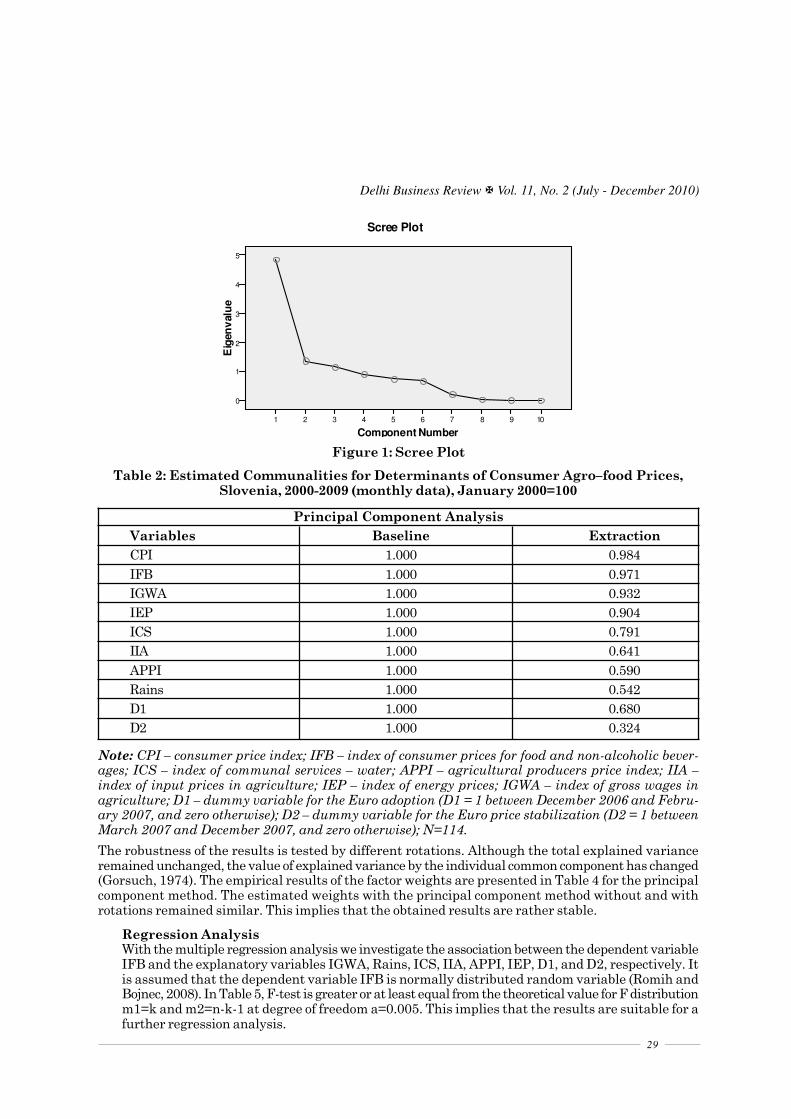
Principal Component AnalysisWith the principal component analysis we aim to find statistically significant the common principalcomponents, which explain the greatest possible variance and thus distribution of the analysedvariables. The scree plot (Figure 1) confirms the model with the three common factors. The KMOstatistics 0.671, which is greater than 0.5, implies that the data is suitable for the principalcomponent analysis. With the estimated communalities (Table 2) with the principle componentanalysis we find the highest weights of the explained variance of the common components for theCPI, IGWA, ICS, IIA, APPI, IEP and D2. With the principal component method, we identify twocommon components, which explain 62.1% of variance of the analysed variables (Table 3).
The first common component captures general price level and wages in agriculture. The secondcommon component captures input prices for materials and means for agriculture, weatherconditions, agricultural producer prices and a negative weight for the variable D2.
Table 1: Price Indices and Index of Wages, January 2000 = 100
Year/MonthCPI IFB ICS APPI IIA IEP IGWA2000/January100 100 100 100 100 100 1002009/June156.50 151.1 187.4 125.4 187.8 196.5 180.6
Source: SORS (2008)29 and Own Calculations.
Note: CPI � consumer price index; IFB � index of consumer prices for food and non-alcoholic bever-ages; ICS � index of communal services � water; APPI � agricultural producers price index; IIA �index of input prices in agriculture; IEP � index of energy prices; IGWA � index of gross wages inagriculture.
29
Delhi Business Review X Vol. 11, No. 2 (July - December 2010)
Component Number10987654321
Eig
enva
lue
5
4
3
2
1
0
Scree Plot
Figure 1: Scree Plot
Table 2: Estimated Communalities for Determinants of Consumer Agro�food Prices,Slovenia, 2000-2009 (monthly data), January 2000=100
Principal Component AnalysisVariables Baseline ExtractionCPI 1.000 0.984IFB 1.000 0.971IGWA 1.000 0.932IEP 1.000 0.904ICS 1.000 0.791IIA 1.000 0.641APPI 1.000 0.590Rains 1.000 0.542D1 1.000 0.680D2 1.000 0.324
Note: CPI � consumer price index; IFB � index of consumer prices for food and non-alcoholic bever-ages; ICS � index of communal services � water; APPI � agricultural producers price index; IIA �index of input prices in agriculture; IEP � index of energy prices; IGWA � index of gross wages inagriculture; D1 � dummy variable for the Euro adoption (D1 = 1 between December 2006 and Febru-ary 2007, and zero otherwise); D2 � dummy variable for the Euro price stabilization (D2 = 1 betweenMarch 2007 and December 2007, and zero otherwise); N=114.
The robustness of the results is tested by different rotations. Although the total explained varianceremained unchanged, the value of explained variance by the individual common component has changed(Gorsuch, 1974). The empirical results of the factor weights are presented in Table 4 for the principalcomponent method. The estimated weights with the principal component method without and withrotations remained similar. This implies that the obtained results are rather stable.
Regression AnalysisWith the multiple regression analysis we investigate the association between the dependent variableIFB and the explanatory variables IGWA, Rains, ICS, IIA, APPI, IEP, D1, and D2, respectively. Itis assumed that the dependent variable IFB is normally distributed random variable (Romih andBojnec, 2008). In Table 5, F-test is greater or at least equal from the theoretical value for F distributionm1=k and m2=n-k-1 at degree of freedom a=0.005. This implies that the results are suitable for afurther regression analysis.

30
Štefan Bojnec and Sergej Gricar
Table 3: Explanation of Total Variance
Initial Final Final Values after MaximumValues Values Likelihood � Varimax with Kaiser
NormalisationComponents (1) (2) (3) (1) (2) (3) (1) (2) (3)1 4.840 48.400 48.400 4.840 48.400 48.400 4.709 47.900 47.9002 1.369 13.685 62.085 1.369 13.685 62.085 1.419 14.185 62.0853 1.151 11.508 73.5934 0.923 9.229 82.8225 0.741 7.407 90.2296 0.664 6.642 96.8717 0.220 2.197 99.0688 0.061 0.605 99.6739 0.030 0.296 99.69610 0.003 0.031 100.000
Note: Principal component method. (1) own value, (2) % of explained variance, and (3) cumulativeshare (%) of explained variance.
Table 4: Component Matrices
Estimated Factor Weights of Variables for the Consumer Prices for Food and Non-alcoholic Beverages in Slovenia, January 2000 � June 2009 (monthly data)
Principal Component Analysis
Without factor Maximum likelihood � Maximum likelihood �rotation Oblimin with Kaiser Varimax with Kaiser
Normalisation Normalisation
Components Components ComponentsVariables 1 2 1 2 1 2CPI 0.988 -0.088 0.992 0.044 0.991 0.031IFB 0.979 0.109 0.964 0.238 0.958 0.226IGWA 0.964 -0.043 0.964 0.085 0.963 0.079IEP 0.950 -0.027 0.949 0.099 0.947 0.087ICS 0.837 -0.286 0.860 -0.172 0.865 -0.183IIA 0.208 0.723 0.141 0.745 0.114 0.743APPI 0.466 0.603 0.407 0.659 0.391 0.743rains -0.009 -0.406 0.028 -0.403 0.040 -0.404D1 0.091 -0.002 0.091 0.011 0.091 0.051D2 0.322 -0.462 0.141 -0.415 0.390 -0.420
Note: CPI � consumer price index; IFB � index of consumer prices for food and non-alcoholic bever-ages; ICS � index of communal services � water; APPI � agricultural producers price index; IIA �index of input prices in agriculture; IEP � index of energy prices; IGWA � index of gross wages inagriculture; D1 � dummy variable for the Euro adoption (D1 = 1 between December 2006 and Febru-ary 2007, and zero otherwise); D2 � dummy variable for the Euro price stabilization (D2 = 1 betweenMarch 2007 and December 2007, and zero otherwise); N=114.

31
Delhi Business Review X Vol. 11, No. 2 (July - December 2010)
The regression model 1 in Table 5 explains 95.5% of variance of the IFB with the linear associationwith the ICS, IGWA, Rains, IIA, APPI, IEP, D1, and D2, respectively. The rains and D1 are notstatistically significant. When we exclude them, the re-estimated model has not changed a lot(column 3 in Table 5). In this case, we can argue that the partial regression coefficients aresignificantly associated with the IFB. The regression equation gives associations for the IGWA,ICS, IIA, APPI, IEP, and D2, respectively, with the IFB (column 3):
IFB =-14.276+0.146*ICS+0.1*IGWA+0.033*IIA+0.625*APPI+0.21*IEP+2.366*D2.
The IFB is positively associated with each of the explanatory variables: ICS, IGWA, IIA, APPI,IEP, and D2. The regression parameter, which is pertained to the APPI indicates that an increasein agricultural producer prices (APPI) by one increases consumer food prices (IFB) by 0.63 ceterisparibus. The regression parameter for the D1 variable is significant in regression (2) in Table 5.This result implies that the IFB was significant with the Euro adoption only for the short period ofthe Euro adoption into the operation system, but not on the short- to medium-term (regression (1)in Table 5). This indicates that the Euro adoption has not caused the significant increase in consumeragro-food prices on the short-term. This is also confirmed by the regression coefficient pertaining tothe D2 variable.
Table 5: Regression Functions for the Index of Consumer Prices for Food andNon-alcoholic Beverages
IFB
(1) (2) (3)Constant -14.276 27.196 -14.276
(-2.762)*** (5.614)*** (-2.762)***ICS 0.146 0.225 0.146
(8.283)*** (15.890)*** (8.283)***IGWA 0.100 0.103 0.100
(2.568)*** (4.066)*** (2.568)***Rains -0.018 -0.007
(0.961) (-0.297)IIA 0.033 -0.002 0.033
(2.936)*** (-0.088) (2.936)***APPI 0.625 0.388 0.625
(12.681)*** (10.021)*** (12.681)***IEP 0.210 0.037 0.210
(7.111)*** (0.618) (7.111)***D1 -0.019 3.055
(-0.911) (2.288)***D2 2.366 9.328 2.366
(2.061)*** (9.293)*** (2.061)***N 114 96 114R2 0.955 0.958 0.955F test 393.243 427.699 393.243
Note: IFB � index of consumer prices for food and non-alcoholic beverages; ICS � index of communalservices � water; APPI � agricultural producers price index; IIA � index of input prices in agriculture;IEP � index of energy prices; IGWA � index of gross wages in agriculture; D1 � dummy variable forthe Euro adoption (D1 = 1 between December 2006 and February 2007, and zero otherwise); D2 �dummy variable for the Euro price stabilization (D2 = 1 between March 2007 and December 2007, andzero otherwise); R2 � adjusted determination coefficient; *** � statistical significant at 1%; ** �

32
Štefan Bojnec and Sergej Gricar
statistically significant at 5%; * � statistically significant at 10%; a � excluded variables; t � statisticsin the brackets. Headings of columns: (1), (3) � multiple regression functions January 2000 � June2009, N=114; (2) � multiple regression functions January 2000 � December 2007, N=96.
Our findings are consistent with some previous analysis. Kozamernik (2009) argues a neutralimpact of the Euro adoption on prices in the medium-term. SORS (2008) and IMAD, and Bojnecand Gricar (2009a) show that the short-term catering industry price increase was associated withthe roughling of prices by the Euro adoption in Slovenia. However, Gricar and Bojnec (2009) showsthat the catering industry prices are associated with inputs costs of food and beverages, wages inthe catering industry, demands for tourist services and the short-term roughling of prices with theEuro adoption. Gricar (2009) finds that the catering industry prices are also associated by inflationdevelopments and not only by specific costs and demand factors.
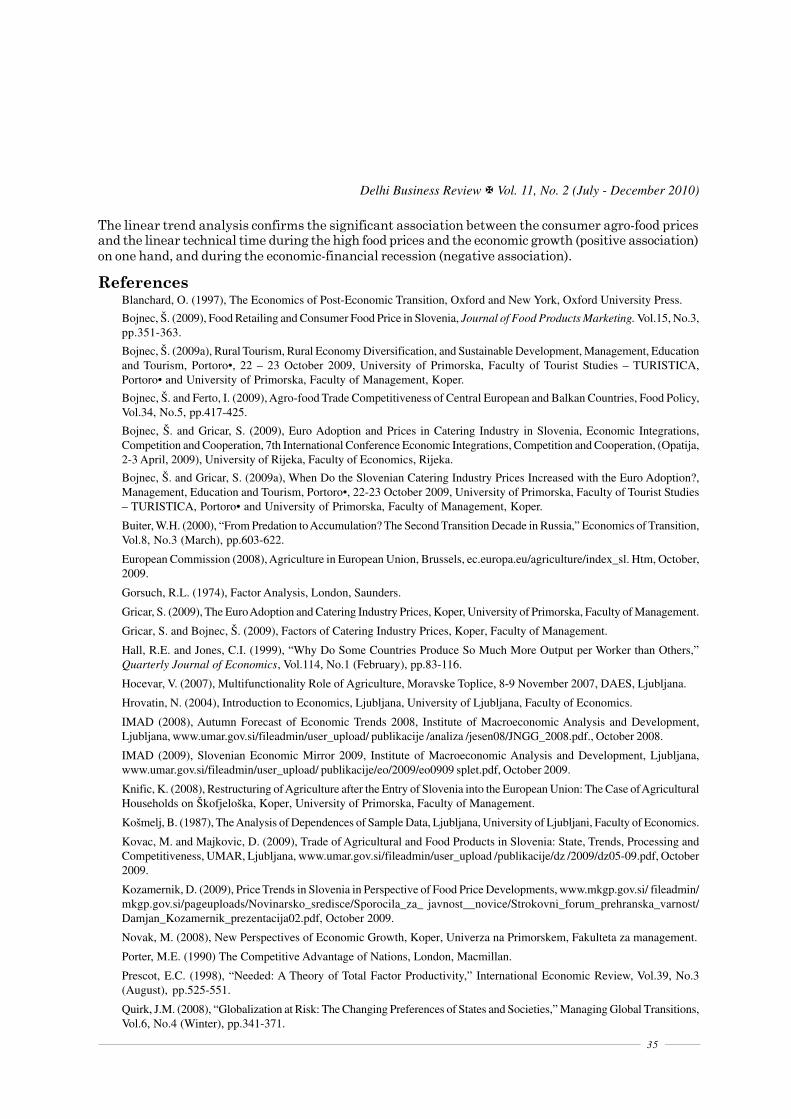
Linear Trend Analysis for the IFB during the High Food Prices and the Economic-Financial CrisisThe linear trend analysis considers features of the technical time and the regression constant a,which is explained as the arithmetic mean of the variable in the analysed time period, while theregression coefficient ß indicates the average change of the explanatory variable on the time unit.The estimated regression parameters are obtained by the least square method (Bojnec and Gricar2009a). We use data from the SORS for the period from January 2000 to September 2009 in thecurrent prices.
With the linear trend analysis of time series data we find that during the period of high food pricesthe IFB was the most significant (at 1.6% significance level) between February and May 2008. Thehigh correlation coefficient 0.97 implies strong positive association between the IFB and technicallinear time. The regression equation presents the association between the IFB and technical lineartime T for the period from February to May 2008: IFB=100.45+0.66T (Figure 2). This implies thatthe consumer agro-food prices increased on average by 0.66 percentage point per a month (see alsoTable 6).
Table 6: Linear Trend Analysis for the IFB
Dependent Variable IFB
February-May 2008 February-May 2009 October 08-September 2009
Constant 100.45 99.75 99.98(20.401)*** (45.809)*** (26.587)***
T (time) 0.66 0.260 -0.146(7.778)*** (7.506)*** (-1.885)**
R2 0.952 0.966 0.203F test 60.500 56.333 3.552D-W 2.62 2.23 2.95
Source: SORS (2008)29 and own calculations, linear trend monthly data, current prices,period at the January 2000 to September 2009; in the brackets are t statistics.
The similar analysis shows that during the economic-financial crisis in Slovenia the IFB was themost significant (at 1.7% significance level) between February and May 2009. The relatively highcorrelation coefficient 0.98 confirms strong positive association between the IFB and linear technicaltime during the economic-financial crisis. Since October 2008, the IFB in Slovenia has had thelowest value in June 2009. The regression equation presents the association between the IFB andtechnical linear time T for the period from February to May 2009: IFB=99.75+0.26T (Figure 3).This implies that the consumer agro-food prices increased on average by 0.26 percentage point permonth. However, during the deepest economic-financial crisis between October 2008 and September2009 the consumer agro-food prices declined by 0.146 percentage point per month: IFB=99.98-

33
Delhi Business Review X Vol. 11, No. 2 (July - December 2010)
Figure 2: Development of Consumer Agro-food Prices During High Food Prices
Figure 3: Development of Consumer Agro-food Prices During Economic Recession
Figure 4: Development of Consumer Agro-food Prices During Economic Recession

34
Štefan Bojnec and Sergej Gricar
ConclusionThe consumer agro-food prices are analysed within theoretical framework and empirical approaches ofdeterminants and causes of inflation, the Euro adoption, and economic-financial crisis in the Slovenianeconomy. The impact of the Euro adoption, except on the short-term, on consumer agro-food prices wasmodest. This is confirmed by the time series data analysis using the principal component analysis, theregression analysis, and the linear trend analysis. These approaches, particularly combining the prin-cipal component analysis and the regression analysis, have allowed that several determinants of theconsumer agro-food prices are included in the analysis, which has been so far rare.
With the principal component method we identify two common components. The first one is pertainedto general price level and wages in agriculture, and the second one to input prices for materials,adverse weather conditions for agriculture, and the Euro adverse.
With the multiple regression analysis we find association of consumer agro-food prices with costs forwages, energy, communal services and input prices for agriculture. As expected, the positive andsignificant association is revealed between consumer agro-food prices and agricultural producer prices.The Euro adoption is not found as a significant determinant for the consumer agro-food prices increaseson the short-term.
Figure 5: Growth of Consumer Agro-food Prices During High Food Prices
Figure 6: Growth of Consumer Agro-food Prices During Economic Recession
35
Delhi Business Review X Vol. 11, No. 2 (July - December 2010)
The linear trend analysis confirms the significant association between the consumer agro-food pricesand the linear technical time during the high food prices and the economic growth (positive association)on one hand, and during the economic-financial recession (negative association).
ReferencesBlanchard, O. (1997), The Economics of Post-Economic Transition, Oxford and New York, Oxford University Press.
Bojnec, Š. (2009), Food Retailing and Consumer Food Price in Slovenia, Journal of Food Products Marketing. Vol.15, No.3,pp.351-363.
Bojnec, Š. (2009a), Rural Tourism, Rural Economy Diversification, and Sustainable Development, Management, Educationand Tourism, Portoro•, 22 – 23 October 2009, University of Primorska, Faculty of Tourist Studies – TURISTICA,Portoro• and University of Primorska, Faculty of Management, Koper.
Bojnec, Š. and Ferto, I. (2009), Agro-food Trade Competitiveness of Central European and Balkan Countries, Food Policy,Vol.34, No.5, pp.417-425.
Bojnec, Š. and Gricar, S. (2009), Euro Adoption and Prices in Catering Industry in Slovenia, Economic Integrations,Competition and Cooperation, 7th International Conference Economic Integrations, Competition and Cooperation, (Opatija,2-3 April, 2009), University of Rijeka, Faculty of Economics, Rijeka.
Bojnec, Š. and Gricar, S. (2009a), When Do the Slovenian Catering Industry Prices Increased with the Euro Adoption?,Management, Education and Tourism, Portoro•, 22-23 October 2009, University of Primorska, Faculty of Tourist Studies– TURISTICA, Portoro• and University of Primorska, Faculty of Management, Koper.
Buiter, W.H. (2000), “From Predation to Accumulation? The Second Transition Decade in Russia,” Economics of Transition,Vol.8, No.3 (March), pp.603-622.
European Commission (2008), Agriculture in European Union, Brussels, ec.europa.eu/agriculture/index_sl. Htm, October,2009.
Gorsuch, R.L. (1974), Factor Analysis, London, Saunders.
Gricar, S. (2009), The Euro Adoption and Catering Industry Prices, Koper, University of Primorska, Faculty of Management.
Gricar, S. and Bojnec, Š. (2009), Factors of Catering Industry Prices, Koper, Faculty of Management.
Hall, R.E. and Jones, C.I. (1999), “Why Do Some Countries Produce So Much More Output per Worker than Others,”Quarterly Journal of Economics, Vol.114, No.1 (February), pp.83-116.
Hocevar, V. (2007), Multifunctionality Role of Agriculture, Moravske Toplice, 8-9 November 2007, DAES, Ljubljana.
Hrovatin, N. (2004), Introduction to Economics, Ljubljana, University of Ljubljana, Faculty of Economics.
IMAD (2008), Autumn Forecast of Economic Trends 2008, Institute of Macroeconomic Analysis and Development,Ljubljana, www.umar.gov.si/fileadmin/user_upload/ publikacije /analiza /jesen08/JNGG_2008.pdf., October 2008.
IMAD (2009), Slovenian Economic Mirror 2009, Institute of Macroeconomic Analysis and Development, Ljubljana,www.umar.gov.si/fileadmin/user_upload/ publikacije/eo/2009/eo0909 splet.pdf, October 2009.
Knific, K. (2008), Restructuring of Agriculture after the Entry of Slovenia into the European Union: The Case of AgriculturalHouseholds on Škofjeloška, Koper, University of Primorska, Faculty of Management.
Košmelj, B. (1987), The Analysis of Dependences of Sample Data, Ljubljana, University of Ljubljani, Faculty of Economics.
Kovac, M. and Majkovic, D. (2009), Trade of Agricultural and Food Products in Slovenia: State, Trends, Processing andCompetitiveness, UMAR, Ljubljana, www.umar.gov.si/fileadmin/user_upload /publikacije/dz /2009/dz05-09.pdf, October2009.
Kozamernik, D. (2009), Price Trends in Slovenia in Perspective of Food Price Developments, www.mkgp.gov.si/ fileadmin/mkgp.gov.si/pageuploads/Novinarsko_sredisce/Sporocila_za_ javnost__novice/Strokovni_forum_prehranska_varnost/Damjan_Kozamernik_prezentacija02.pdf, October 2009.
Novak, M. (2008), New Perspectives of Economic Growth, Koper, Univerza na Primorskem, Fakulteta za management.
Porter, M.E. (1990) The Competitive Advantage of Nations, London, Macmillan.
Prescot, E.C. (1998), “Needed: A Theory of Total Factor Productivity,” International Economic Review, Vol.39, No.3(August), pp.525-551.
Quirk, J.M. (2008), “Globalization at Risk: The Changing Preferences of States and Societies,” Managing Global Transitions,Vol.6, No.4 (Winter), pp.341-371.

36
Štefan Bojnec and Sergej Gricar
Romih, M. and Bojnec, Š. (2008), “Level and Price Formation of Housing in Slovenia,” Management, Vol.3, No.2, pp.165–184.
Samuelson P.A. and Nordhaus D.W. (1995), Economics. New York, McGraw-Hill.
Solow, R. (1957), “Technical Change and The Aggregate Production Function,” The Review of Economics and Statistics,Vol.39, No.3 (August), pp.312-320.
SORS (2008), Consumer Price Indices, Statistical Office of the Republic of Slovenia, Ljubljana, www.stat.si/pxweb/Database/Ekonomsko/04_cene/04006_ICZP/04006_ ICZP.asp, April 2008.
SORS (2009), SI – STAT Data Portal, Statistical Office of the Republic of Slovenia, Ljubljana, www.stat.si /pxweb/Dialog/statfile2.asp, November 2009.
Surti, J. (2008), What Drives Inflation in Slovenia?, Banka Slovenije, Contemporary Macroeconomics Issues- Challengesand Polices, bsi.si/publikacijein-raziskave.asp? mapaId=235, August 2008.
Svetlicic, M. (1996), World Enterprise, Ljubljana, Scientific and Publishing Center.
Špiljak, L. (2006), The Impact of Euro on Price Flexibility in Euro Area, Ljubljana, University of Ljubljani, Faculty ofEconomics.