Agro-environmental partnerships facilitate ... - WebPages@SCU
9
http://CaliforniaAgriculture.ucop.edu • OctOBER–DEcEMBER 2008 133 REVIEW ARTICLE ▼ Agro-environmental partnerships facilitate sustainable wine-grape production and assessment by Janet C. Broome and Keith Douglass Warner The California wine-grape sector has invested considerable time, money and effort in collective enterprises to reach fellow growers and assess the industry as a whole on sustain- ability. At the same time, California wine-grape production has become increasingly branded by particular geographic regions. Premium wine grapes are grown in regions with high population growth, high land values and often, charged environ- mental politics. Growers and their institutions have developed several agro-environmental partnerships to assess, improve and publicly repre- sent their environmental stewardship and farming practices. We review trends in several regional and state- wide indicators of sustainability, including crush prices, grape acreage, population growth and pesticide use. This review is based on 2 years of field research with participants in wine-grape partnerships, a review of documentary evidence, technical ad- visory work with the programs and summary assessment of case- study data, as well as an analysis of 10 years of Pesticide Use Report data for California wine-grape growers. C alifornia leads the nation in wine-grape and wine produc- tion, valued at $2.2 billion and $16.5 billion, respectively. The wine sector is estimated to collectively contribute more than $51.8 billion to the state’s economy (MKF Research 2006). More than any other commodity, the Cali- fornia wine-grape community over the past 15 years has embraced the concept of “sustainability” (Warner 2007a, 2007b). The United Nations’ techniques but are oriented toward a broader set of environmental goals than complying with a restricted list of inputs, as prescribed by the U.S. Department of Agriculture’s National Organic Program. Particularly in the wine-grape industry, these partner- ships have also involved regulators, and environmental and community leaders and their organizations. Between 1993 and 2003, 32 partner- ships were created in 16 California commodities. The biological and social systems of production in perennial crops are more suitable for these part- nerships, and 24 of them were in tree and vine crops. Wine-grape growers created six partnerships, more than any other crop (Warner 2007b). We present a summary of 2 years of field research with participants in three of these wine-grape partnerships, including in- terviews and focus sessions, and review of documentary evidence. We supple- ment that work with additional and updated state and federal data, as well as examples and summary assessment data obtained from the case studies. Brundtland Report (WCED 1987), which popularized this term, raised concerns that agricultural production had led to resource degradation and economic and social inequality. Sustainable agriculture has been defined as a goal, a scientific research endeavor (NRC 1989) and a social movement (Allen 1993) that prioritizes equally environmental protection, economic viability and social equity. Agro-environmental partnerships are the leading strategy for extending sustainable agriculture in California (Swezey and Broome 2000; Warner 2007a). These partnerships consist of an agreement over more than one season among growers, growers’ organizations and agricultural scientists to apply agro-ecological principles to farm-scale practices and improve the stewardship of environmental resources. These partnerships are a California version of “Third Way” agriculture (El Titi 1992), signifying a blend of organic and conventional pest-management and production practices. They draw from organic and other alternative The California wine industry has been a leader in proactively promoting sustainable practices. Above, IPM consultant Laura Breyer identifies natural enemies controlling a Sonoma County grower’s vineyard pests.
-
Upload
khangminh22 -
Category
Documents
-
view
7 -
download
0
Transcript of Agro-environmental partnerships facilitate ... - WebPages@SCU

http://CaliforniaAgriculture.ucop.edu • OctOBER–DEcEMBER 2008 133
REVIEW ARTICLE
▼
Agro-environmental partnerships facilitate sustainable wine-grape production and assessment
by Janet C. Broome and Keith Douglass Warner
The California wine-grape sector has
invested considerable time, money
and effort in collective enterprises
to reach fellow growers and assess
the industry as a whole on sustain-
ability. At the same time, California
wine-grape production has become
increasingly branded by particular
geographic regions. Premium wine
grapes are grown in regions with
high population growth, high land
values and often, charged environ-
mental politics. Growers and their
institutions have developed several
agro-environmental partnerships to
assess, improve and publicly repre-
sent their environmental stewardship
and farming practices. We review
trends in several regional and state-
wide indicators of sustainability,
including crush prices, grape acreage,
population growth and pesticide
use. This review is based on 2 years
of fi eld research with participants in
wine-grape partnerships, a review of
documentary evidence, technical ad-
visory work with the programs
and summary assessment of case-
study data, as well as an analysis of
10 years of Pesticide Use Report data
for California wine-grape growers.
California leads the nation in wine-grape and wine produc-
tion, valued at $2.2 billion and $16.5 billion, respectively. The wine sector is estimated to collectively contribute more than $51.8 billion to the state’s economy (MKF Research 2006). More than any other commodity, the Cali-fornia wine-grape community over the past 15 years has embraced the concept of “sustainability” (Warner 2007a, 2007b). The United Nations’
techniques but are oriented toward a broader set of environmental goals than complying with a restricted list of inputs, as prescribed by the U.S. Department of Agriculture’s National Organic Program. Particularly in the wine-grape industry, these partner-ships have also involved regulators, and environmental and community leaders and their organizations.
Between 1993 and 2003, 32 partner-ships were created in 16 California commodities. The biological and social systems of production in perennial crops are more suitable for these part-nerships, and 24 of them were in tree and vine crops. Wine-grape growers created six partnerships, more than any other crop (Warner 2007b). We present a summary of 2 years of fi eld research with participants in three of these wine-grape partnerships, including in-terviews and focus sessions, and review of documentary evidence. We supple-ment that work with additional and updated state and federal data, as well as examples and summary assessment data obtained from the case studies.
Brundtland Report (WCED 1987), which popularized this term, raised concerns that agricultural production had led to resource degradation and economic and social inequality.
Sustainable agriculture has been defi ned as a goal, a scientifi c research endeavor (NRC 1989) and a social movement (Allen 1993) that prioritizes equally environmental protection, economic viability and social equity. Agro-environmental partnerships are the leading strategy for extending sustainable agriculture in California (Swezey and Broome 2000; Warner 2007a). These partnerships consist of an agreement over more than one season among growers, growers’ organizations and agricultural scientists to apply agro-ecological principles to farm-scale practices and improve the stewardship of environmental resources.
These partnerships are a California version of “Third Way” agriculture (El Titi 1992), signifying a blend of organic and conventional pest-management and production practices. They draw from organic and other alternative
The California wine industry has been a leader in proactively promoting sustainable practices. Above, IPM consultant Laura Breyer identifi es natural enemies controlling a Sonoma County grower’s vineyard pests.

134 CALIFORNIA AGRICULTURE • VOLUME 62, NUMBER 4
to score their practices and document progress toward sustainability along a continuum. Growers, consultants, researchers, winery personnel and environmental advocates debated par-ticular practices and their social and environmental impacts, and designated rankings or points for specific practices. These assessment systems integrate a range of practices into a whole farming system.
Many of the practices effectively implement the results of years of University of California research, such as leaf removal and canopy manage-ment, use of cover crops, integrated pest management (IPM), economic injury thresholds, use of weather data and models for disease-risk forecasting, and genetic resource improvements. Wine-grape growers and their organizations created these partnerships to apply ba-sic research to the specifics of their local production regions. They are semipriva-tized extension efforts, drawing from and partnering with UC scientists and advisors to specify and make progress toward sustainability goals. All pro-grams described were created with ex-tensive UC Cooperative Extension input and review.
Central Coast Vineyard Team
The Central Coast Vineyard Team (CCVT) grew out of the Central Coast Natural Vineyard Team, initiated by the Robert Mondavi Winery in 1994 to enhance wine quality in the rapidly expanding Central Coast and promote sustainability. Mondavi staff facilitated
Sustainable grape innovation
Over the past decade, environmen-tal concerns that have arisen around California vineyards and wineries in-clude (Conaway 2002; Friedland 2002; Poirier-Locke 2002; Warner 2006):
• Oak woodland losses, and forest and wildland conversions on the North Coast and Central Coast.
• Water usage and water-quality stan-dard violations, principally from sediment.
• Farm labor, pay and environmental health concerns.
• Introduced invasive species and new pest-disease vectors.
• Regional pesticide-use controversies, such as spray drift.
• Hillside development and erosion problems in Napa and Sonoma counties.
• Congested roads and noise around wineries.
• Community conflicts. • The loss of endangered species and
their habitat.
To address these public concerns, wine-grape growers launched coordi-nated efforts to enhance environmental stewardship in their region’s vineyards, but also to reach out to neighbors with credible information about their progress.
Dating back to the 1970s, organic viticulturalists, including biodynamic ones, were the first sustainable viti-
culture innovators in California, and they have greatly contributed to later, broader attempts at designing and de-fining sustainable viticulture (Daane et al. 2005). Organic wine-grape growers must develop an organic systems plan, refrain from using most synthetic pes-ticides and fertilizers, undergo a 3-year transitional period, and obtain third-party certification for their production and processing systems based on fed-eral regulations (see sidebar, page 138).
California wine-grape growers have created more partnerships than any other commodity because they have: (1) created strong local organizations; (2) differentiated their product quality by varieties that depend on regional environmental conditions; (3) added significant economic value to wines by geographic branding; and (4) recognized the importance of providing educational outreach to their environmentally con-scious neighbors (Warner 2007b). These factors have prompted the industry to develop what may be the most compre-hensive sustainability initiative of any U.S. commodity. California’s more than 40 regional winegrower and vintner as-sociations provide a preexisting set of economic and social relationships upon which these partnerships have been built (CSWA 2004).
California sustainable wine-grape production systems comprise a suite of farming practices and include self-assessment systems that allow growers
The future is bright for collaborative sustainability initiatives in California agriculture.
The Robert Mondavi Winery (Mondavi, center), initiated one of the earliest sustainable viticulture initiatives, which evolved into the Central Coast Vineyard Team.
Robe
rt M
onda
vi W
iner
y
Winery operations — not just grape-growing — are included in “ground to bottle” partnerships such as the California Sustainable Winegrowing Program.

http://CaliforniaAgriculture.ucop.edu • OctOBER–DEcEMBER 2008 135
this process with vineyard manage-ment companies that had wine-grape contracts with them, but the initiative was soon opened up to include other wine-grape producers. Even though this growing region is geographically large, most vineyard management deci-sions were made by a small number of people who had worked together over the years. The CCVT was the first in California to develop a self-assessment system for vineyards, called the Positive Points System (PPS) (CCVT 2007). It ob-tained grants that enabled it to expand on-farm demonstrations and provide pest, crop and soil monitoring, and a collaborative outreach program.
Positive Points System (PPS). A first draft of the PPS was circulated on pa-per in 1995. Now it can be completed online or by filling in a 21-page printed version. The assessment has 152 ques-tions, with points assigned based on the issue’s importance to regional sustainability. For example, questions include: “Is sanitation regularly prac-ticed for those diseases that are spread by infected tissue left in the vineyard (i.e., bunch rot, phomopsis, crown gall)? (4 points)” and “Are cultural practices that deter the spread of dis-ease regularly used (i.e., late pruning for Eutypa; avoidance of trunk injury for crown gall; leaf removal for Botrytis cinerea)? (4 points).” Six sections cover pests, soils, water, viticulture manage-ment, wine quality and continuing education, with a total possible score of 1,000. Practices related to habitat pro-tection and ecosystem management are integrated throughout the six sections.
As of 2007, the CCVT had 300 mem-bers who farmed 60,000 acres on the Central Coast, and the team had con-ducted 750 assessments (some of the same vineyard blocks were addressed over multiple years). Overall, PPS self-assessment scores have steadily increased and were on average about 50 points higher in 2006 than 10 years earlier, indicating that participants are farming more sustainably than in the past. Growers evaluating a single block have also improved their scores; over a 10-year period (1996–2006) there were 166 repeat assessments where 153 scores increased and 13 decreased. More than one-half of the repeat evaluations im-proved their scores from 1 to 100 points,
indicating the adoption of as many as 10 new practices (fig. 1). Almost 10% of the repeat growers increased their scores by 300 points or more, indicating major changes.
Water quality. The CCVT also ob-tained funds to assess the potential to protect water quality by relating practices in the PPS to their erosion potential, based on a nonpoint-source erosion model. Starting in 2005, the Central Coast Regional Water Quality Control Board (CCRWQCB) allowed growers to complete the PPS and its Future Plans Form to qualify as a farm plan under the conditional agricultural waiver. The CCRWQCB requires farm plans that outline best management practices to be employed on-farm so that irrigation water discharges do not cause or contribute to water-quality impairments (by releasing sediments, pesticides or fertilizers), instead of re-quiring waste discharge permits from irrigated lands.
Certification. In 2007, the CCVT received funding to develop a pilot sustainable viticulture third-party certification program, which they launched in early 2008 with a revised certification-oriented PPS. Wine bot-tles from the 2008 harvest will display this label.
Lodi Winegrape Commission
The Lodi Winegrape Commission (LWC) was established by grower vote in 1991 under a state marketing order. Membership is mandatory for any producer of more than 25 tons of wine grapes per year in this region. LWC’s roughly $1 million budget is funded by a districtwide tax of 0.45% of grape
value, 70% of which supports promo-tion and 30% research and grower outreach. There are currently about 750 LWC member growers farming nearly 100,000 acres of wine grapes, about 13% of the acreage in California, and they produce about 18% of the state’s total crush tonnage (Goodhue et al. 2008).
Sustainable farming program and workbook. In 1995, LWC received a grant from the UC Sustainable Agriculture Research and Education Program’s (UC SAREP) Biologically Integrated Farming Systems (BIFS) program to develop on-farm demonstrations, a monitoring program, and a grower-driven outreach effort to increase the adoption of environmentally protec-tive and economical practices (see page 142). In 1998, they developed Lodi Winegrowers Workbook: A Self Assessment of Integrated Farming Practices (Ohmart and Matthiasson 2000; and revised in 2008). The workbook includes a form for growers to develop an action plan, along with detailed educational materials.
Lodi Rules. After the workbook was developed, a subset of growers, along with consultants and others, initiated the first third-party certi-fication system for California wine grapes, called the Lodi Rules for Sustainable Winegrowing (LWC 2007). The rules are based on a set of farm-ing standards or ranked practices, and unique to this program, a Pesticide Environmental Assessment System (PEAS) that provides a risk index for pesticides used in a vineyard. The rules outline 75 farming practices in six chapters, many of which require growers to have management plans with specific components.
50
45
40
35
30
25
20
15
10
5
0 50 100 150 200 250 300 350 400 450
Change (+) in points
Nu
mb
er o
f g
row
ers
4542
21
15 16
6 6
0 2
Fig. 1. Central Coast grape growers’ vineyard blocks (n = 153) self-assessed using the Positive Points System (1996–2006) and total point increases in use of sustainable practices. Point scores for only 13 blocks decreased over time (data not shown). Source: Self-assessment database maintained by the CCVT through Kris O’Connor.
136 CALIFORNIA AGRICULTURE • VOLUME 62, NUMBER 4
Viticulture
Soil mgmt.
Vineyard water mgmt.
Pest mgmt.
Wine quality
Ecosystem mgmt.
Energy efficiency
Material handling
Environmentally preferred purchasing
Human resources
Neighbors and community
Air quality
0 0.5 1.0 1.5 2.0 2.5 3.0 3.5 4.0
Mean response
Individual (home ranch)
Farm size (51–250 acres)
Regional (Central Valley)
Statewide
2007 vineyard chapter means
Fig. 2. California Sustainable Winegrowing Alliance’s Code of Sustainable Winegrowing 2007 mean chapter responses by statewide level, regional level, farm size range and individual vineyard operation (home ranch). Average responses (1–4) are across all criteria for each of the 12 chapters (chapters 10 and 12 are for winery operations only and are not included). Source: CSWA self-assessment database.
vineyards were certified under the Lodi Rules label. In 2006, 12 growers partici-pated, certifying 43 vineyards totaling 5,457 acres. In 2007, 18 growers certified 96 vineyards totaling 7,600 acres. In early 2008, five different wineries bot-tled and labeled a total of 14 different wines displaying the Lodi Rules logo on their labels. These wines are from the 2005 and 2006 vintages (personal communication, C. Ohmart, 2008).
Sustainable Winegrowing Program
The California Sustainable Winegrowing Program (SWP) be-gan in 2001 as a statewide initiative to promote and adopt “ground to bottle” practices for producing grapes and wine. The program is led by the California Sustainable Winegrowing Alliance (CSWA), a nonprofit organi-zation formed in 2003 of leaders from the two major statewide associations affiliated with California wine grapes and wine — the Wine Institute and the California Association of Winegrape Growers. The SWP uses the Code of Sustainable Winegrowing Practices: Self-assessment Workbook (2nd ed.) to outline and rank ecological, economic and social-equity practices through an integrated set of 16 chapters covering 12 areas and 227 criteria. It was first published in 2002, was revised in 2006 and is now available online (Dlott et al. 2006). Chapters cover soil, water and pest management, wine quality, energy efficiency, material handling, solid-waste reduction, purchasing, human resources, neighbors and com-munity, and air quality. The viticulture chapters are modified from the Lodi Winegrower’s Workbook (see page 145,
The PEAS score is calculated by mul-tiplying the pounds of a pesticide ap-plied by a toxicity factor, and it includes use patterns to further extrapolate the relative risk of exposure based on use method. Risks are assumed to poten-tially arise from multiple routes of expo-sure (for people, via food, water, dermal or inhalation exposure). Some exposures are short-term (acute risks) and others occur steadily over a long period of time (chronic risks). The PEAS model cur-rently includes (1) worker acute risks, (2) dietary risks to people from acute and chronic exposure, (3) acute risks to small aquatic invertebrates, (4) acute risks to birds and (5) acute risks to bees and natural enemies of pest insects.
Certification. Individual vineyards that subscribe to the Lodi Rules are certified by a third-party, Protected Harvest. A vineyard qualifies for certi-fication if it meets two criteria. First, the farming practices must achieve a score of 50% or better for each chapter; scor-ing below 50% on any chapter disquali-fies the vineyard from certification. Moreover, a vineyard cannot score “fail chapter” on any of 11 particular stan-dards, such as keeping written records of pest monitoring results for vineyard arthropod pests, having a comprehen-sive nutrient-management plan or test-ing soil before preplant fumigation.
Second, the “environmental impact units” for pesticides used in a vineyard for the year, calculated by the PEAS model, cannot exceed 50. In 2005, six
Grape growers who participate in partnerships assess their own practices and develop action plans to reduce vineyard impacts on the environment, wildlife and people. Field days, such as this one hosted by the Sonoma County Winegrape Commission, provide hands-on exposure to best practices.

http://CaliforniaAgriculture.ucop.edu • OctOBER–DEcEMBER 2008 137
table 2). The Code is, however, even more far-reaching than either regional initiative in that it includes an assess-ment of winery operations such as wa-ter quality and conservation.
The SWP collaborates with local grower and vintner organizations to create participatory educational pro-grams that help growers progress to-ward sustainability. Winegrowers who participate in workshops submit self-assessments, which the program uses to develop confidential benchmark re-ports on how individual operations are performing relative to statewide and regional scores, or scores based on vine-yard operation size (fig. 2). One hun-dred self-assessment workshops have been held since the program started.
The 2006 report indicated that 1,165 enterprises had evaluated their sus-tainable practices, covering 33% of California’s 522,000 total wine-grape acres and 53% of the state’s total an-nual wine production of 273 million cases (CSWA 2006). The statewide mean values for the chapters (pos-sible range of 1 to 4, with 4 being the highest) show higher scores, closer to 3, for vineyard management practices involving soils, water, pests and wine quality (fig. 2). These rankings are sim-ilar to earlier regional programs such as Lodi’s, and it appears that more of the industry that has assessed itself is at this level. The statewide mean scores for vineyard energy efficiency and environmentally preferred purchasing are lower than for vineyard produc-tion practices, closer to 2, with further room for improvement.
The mean scores can also be used to assess progress over time (CSWA 2006). Winegrowers assessed between 2002 and early in 2004 as compared to those assessed late in 2004 through 2006 in-creased their performance in 31 of 38 pest management criteria, by nearly 8%. Pest management along with energy efficiency, air and water quality, and ecosystem management were the focus of more than 100 targeted education events hosted by SWP during this time.
The SWP is remarkable in several respects. It involves the most sophisti-cated analytical tool yet developed for evaluating the production of an agricul-tural product, and it is the first partner-ship to evaluate operations based on
’91 ’92 ’93 ’94 ’95 ’96 ’97 ’98 ’99 ’00 ’01 ’02 ’03 ’04 ’05 ’06
Year
3,500
3,000
2,500
2,000
1,500
1,000
500
0
B (price)
Pric
e ($
)
100
80
60
40
20
A (acreage)
Acr
es b
y cr
ush
dis
tric
t
(th
ou
san
ds)
600
500
400
300Acr
es s
tate
wid
e
(th
ou
san
ds)
7 + 8
Crush district 3 (Sonoma, Marin) 4 (Napa) 7 (Monterey, San Benito) 8 (San Luis Obispo, Santa Barbara, Ventura) 11 (San Joaquin, Sacramento) 14 (Tulare, Kern) Statewide acres
Fig. 3. (A) Estimates of California wine-grape acreage (bearing and nonbearing), 1991–2006, for selected crush districts (CD) and statewide. CDs 7 and 8 include counties also in the Central Coast Vineyard Team, and CD 11 is the same as the Lodi Winegrape Commission. Source: USDA NASS 2006a. (B) Wine-grape weighted average of grower returns per ton, 1991–2006. Source: USDA NASS 2006b.
personnel practices and community outreach.
North Coast and other regions
With over 40 regional organiza-tions, California wine-grape grow-ers and vintners are well organized and represented. The North Coast premium wine regions have partner-ships that also embrace sustainability and play key roles in the statewide SWP. The Napa Valley Grape Growers Association and Napa Valley Vintners worked with the Fish Friendly Farming water-quality protection program in 2003 to create a local certification pro-gram called Napa Green Land. Napa is basing its winery certification pro-gram on the SWP and calling it Napa Green Winery. The Sonoma County Winegrape Commission, formed in 2006, will also use the statewide SWP. Mendocino County has been home to early pioneers in organic and sus-tainable viticulture such as Fetzer,
Bonterra and Frey, and over 70% of Lake County growers have contributed assessments to the SWP database.
Quality and place-based farming
California’s wine-grape industry has been proactive in addressing sustain-ability for the past 15 years. Interviews, focus groups and participation in these partnerships suggest a range of explana-tions (see Warner 2007b for details on methodology). Some individuals were motivated by a personal, deeply held philosophical commitment to the envi-ronment, others cited economic consid-erations and still others hoped to reduce the fallout from bad publicity linked to conflicts over resource use and the envi-ronment and/or human health.
Addressing regional conflicts. Wine grapes have been geographically branded or linked to specific regions for almost 40 years in California. Several transitions toward geographic specificity and segmentation in the

138 CALIFORNIA AGRICULTURE • VOLUME 62, NUMBER 4
industry have occurred, from generic table wines, to varietal wines, to ap-pellations and most recently vineyard-designated or terroir wines (Lapsley 1996). This means wine grapes are marketed as a product of specific place more than any other agricultural product. This approach has led to tre-mendous success and acreage growth, particularly throughout the 1990s and reaching a peak statewide of 570,000 acres in 2001, but more recently de-clining to 527,000 acres in 2006 (USDA NASS 2006a) (fig. 3A).
However, geographic branding has exposed wine-grape growers to greater environmental criticism linked to the place of production (Friedland 2002; Warner 2007b). Conflicts have arisen due to rapid vineyard development, an ever more-restricted land base in the pre-mium coastal valleys, and the growth of ex-urban wealthy populations in rural ar-eas. Long-term solutions will come from dialogue at the community level and im-provements to current practices that ad-dress equally the community’s economic, environmental and social goals.
Economics of sustainability. An important element of sustainability is economics, and for individual grow-ers the price they receive may deter-mine whether they continue to farm. Over the life of these initiatives, prices received by growers increased, espe-cially in the late 1990s, for all the crush districts that we studied (USDA NASS 2006b) (fig. 3B).
However, prices flattened out or de-clined early in 2000 for most districts. Much of this price decline is likely due to earlier increases in acreage and hence local grape oversupply, as well as global competition, particularly from other New World wines, and reduced leisure and business travel following 9/11. The average crush price growers receive has continued to climb in Napa, while its acreage has remained static due to a planting out of the valley. Napa (crush district 4) cur-rently has an average crush price that is over 10-fold higher than crush dis-trict 14 (Kern and Tulare counties).
Lodi (crush district 11) and the two Central Coast crush districts (7 and 8), which cover the CCVT membership area, at first experienced major growth
The term “organic” is used both to describe a market niche and a
legally defined way of farming. As codified by the U.S. Department of Ag-riculture’s National Organic Program (USDA NOP), organic farming is:
“An ecological production manage-ment system that promotes and enhances biodiversity, biological cycles and soil biological activity. It is based on minimal use of off-farm inputs and on management practices that restore, maintain and enhance ecological harmony” (NOSB 1998).
Major objectives of farming organi-cally are to improve soil quality by building soil organic matter; use only naturally occurring fertilizers and crop protectants (no synthetic materi-als allowed); recycle crop residues and animal waste by composting and/or in-corporating them into the soil; empha-size integrated pest management (IPM) to control pests, diseases and weeds; and create a safe and productive envi-ronment for crops and people working on the farm.
Certification. In order to legally use the term “organic” on a product label, the grower must become “certified” by a third-party agency (such as California Certified Organic Farmers, Oregon Tilth or Demeter Stellar), which as-sures that USDA NOP regulations are followed. A 3-year transition period is required, in which an Organic System Plan (OSP) is implemented. Typically, this includes: not using conventional crop protectants and fertilizers; imple-menting a soil fertility program with cover crops and compost; and develop-ing a pest management program with spray materials approved for organic growing. (The transition period can be shortened with proof that no restricted conventional materials were applied be-fore the certification process started.)
When organic certification is com-pleted, growers must register their production area and processing facil-ity (for winemaking) with the state of California. The cost of certification and registration varies depending on the area farmed and crop value, but usually
ranges from one-half to one percent of the crop value.
Crop protection. Organic winegrow-ers do spray crop protectants such as wettable sulfur, potassium bicarbonate and minerals, but these materials tend to be environmentally benign and not particularly toxic to workers. The materi-als must be approved by the third-party certifiers and the USDA NOP for use in organic farming. For wine grapes, an important goal is to create “balance,” in which vines are adequately cropped so as not to be excessively vigorous — but not over-cropped — so that the result-ing wine is of the highest quality. This involves moderate applications of fertil-izer and water, as well as careful canopy management to insure that diffused light penetrates and the fruit zone is aerated, while at the same time mini-mizing conditions that encourage pests and diseases.
Organic wine. Wine created from organic grapes must be made in a facil-ity certified for organic production, in which strict guidelines are followed that prohibit toxic chemicals and synthetic additives. There are two NOP–defined categories of wine made from organic grapes. First, “organic wine” contains no added sulfites (which are used to preserve and stabilize wine from unin-tended microbial degradation). However, organic wine is notoriously inconsistent and unpredictable in quality, and is mostly consumed by people who are sensitive to sulfites (a relatively small market niche). Second, “wine made from organically grown grapes” allows the use of sulfites at lower levels than con-ventionally processed wine. The major-ity of organic wine-grapes in California are used to make the latter.
State and global acreage. Interest in organic winegrowing has grown steadily over the past decade. In 2006, almost 8,000 vineyard acres were certi-fied organic (CDFA 2006). Total global acreage of organic grapes is estimated at just over 228,000 acres in 31 coun-tries (including California acreage), with Italy alone producing 77,000 acres (Willer and Yussefi 2006). Most California acres are in coastal wine-
Interest in organic winegrowing is increasingby Glenn McGourty
138 CALIFORNIA AGRICULTURE • VOLUME 62, NUMBER 4

http://CaliforniaAgriculture.ucop.edu • OctOBER–DEcEMBER 2008 139
growing districts: Mendocino County has the most with about 3,000 certi-fied acres, and Napa County is next with 1,600 acres. Significant acreage is also certified in Lake, Sonoma, Santa Barbara and San Luis Obispo counties. Oregon and Washington growers are also certifying significant grape acreage in organic production.
Why grow organic grapes?
Growers farm vineyards organi-cally for many different reasons. Most have a strong conservation ethic and want to minimize potential harm to the environment, workers, neighbors and their family, since many growers reside near their vineyards. They also embrace farming with nature, and want to encourage biological diversity on their property. They recognize that their farms can provide other ecological services, such as habitat for beneficial insects and birds of prey; the recycling and sequestering of organic matter; and protection for the overall health of their watersheds. Others are interested in achieving a very high-quality prod-uct, and potentially increasing their income. Finally, organic winegrowing is often used to position products in the marketplace. Many consumers and market outlets (such as high-end wine shops and restaurants) actively seek organically grown products, viewing
them as hand-crafted, unique and dis-tinctive compared to mass-produced items. Interestingly, organic practices are farm-scale neutral and are used both by large producers (such as Fetzer Vineyards with more than 1,700 acres in Mendocino County) and small produc-ers making less than 500 cases of wine annually.
Organic winegrowers manage their vineyards as mini-ecosystems, striv-ing to increase biodiversity in the soil, for example via the use of cover crops. Organically managed soils have higher biological activity than conventionally managed ones, pos-sibly due to more efficient resource utilization and diverse flora and fauna (Mader et al. 2002; Reeve et al. 2006). As organic matter is added, organisms in the root zone appear to change the dynamics of disease expression on the vine roots. Organically farmed vine-yards infested with phylloxera have been shown to last many years longer than conventionally farmed vineyards attacked by phylloxera, although they do need to be replanted eventually (Lotter et al. 1999). Diverse microflora in the soil suppresses pathogenic fungi that attack grapevine roots damaged by phylloxera.
Some growers feel that the quality of both fruit and wine improves after organic winegrowing practices are ad-
Interest in organic winegrowing is increasingby Glenn McGourty
opted. Grower experience has shown that under most conditions, organic winegrowing is both cost effective and productive, and does not reduce yields or quality (Klonsky et al. 1992; Weber et al. 2005). There is no specific premium for organically grown fruit, because wine-grape lots are judged on their in-dividual merits and are more affected by region of production (appellation), variety and intended price-point (such as a finished bottle of wine).
Finally, some organic winegrowers don’t bother to register and certify their vineyards, because they see no mar-ket or competitive advantage to doing so. Rather, they find that farming or-ganically personally satisfies and meets their production objectives.
G. McGourty is Winegrowing and Plant Science Advisor, UC Cooperative Extension, Mendocino and Lake counties.
References[CDFA] California Department of Food and Agri-culture. 2006. California Organic Statistics. www.cdfa.ca.gov/is/fveqc/organic.htm.
Klonsky K, Tourte L, Ingels C, et al. 1992. Sample Costs to Produce Organic Wine Grapes in the North Coast with Planted Cover Crop. UC Sus-tainable Agriculture Research and Extension Pro-gram. Davis, CA. 27 p.
Lotter DW, Granett J, Omer AD. 1999. Differ-ences in grape phylloxera-related grapevine root damage in organically and conventionally managed vineyards in California. HortScience 34:6:1015 –47.
Mader P, Fliessbach A, Dubois D, et al. 2002. Soil fertility and biodiversity in organic farming. Science 296(5573):1694 –7.
[NOSB] National Organic Standards Board. 1998. www.ams.usda.gov/nop/indexNet.htm.
Reeve JR, Carpenter-Boggs L, Reganold JR, et al. 2006. Soil and winegrape quality in organic and biodynamically managed vineyards. ASEV 56(4):367 –76.
Weber E, Klonsky K, De Moura R. 2005. Sample Costs to Produce Organic Wine Grapes. Cabernet Sauvignon. North Coast Region — Napa County. UCCE GR-NC-O, UC Davis Department of Agri-cultural Economics.
Willer H, Yussefi M. 2006. The World of Organic Agriculture. Statistics and Emerging Trends 2006. International Federation of Organic Agriculture Movements (IFOAM) and Research Institute of Organic Agriculture (FiBL). Bonn, Germany, and Frick, Switzerland.Grape growers may choose to farm organically to minimize environmental damage,
encourage biological diversity or position their products in the marketplace. Above, mixed cover crops at Bonterra Vineyards in Mendocino County.
http://CaliforniaAgriculture.ucop.edu • OctOBER–DEcEMBER 2008 139
A. T
hrup
p/Fe
tzer
Vin
eyar
ds
140 CALIFORNIA AGRICULTURE • VOLUME 62, NUMBER 4
warded economically for perceived superior wine quality.
Declining pesticide use
Wine-grape growing practices can affect — both positively and nega-tively — California water, air and soil quality, human health, and plant and animal habitat. This happens through vineyard development and production practices such as vegetation removal, new plantings, earth moving, tillage and the use of agricultural chemicals, including pesticides. We analyzed pesticide use trends as a proxy for the industry’s environmental and human health impacts.
California has a unique tool in its full-use reporting of pesticides applied to agricultural products, called Pesticide Use Reports (PUR). All agricultural ap-plications are required to be reported to county agricultural commissioners, who submit this information to the California Department of Pesticide Regulation (DPR). Working with DPR, we obtained error-checked summary data for pesti-cides used on wine grapes as county and statewide totals from 1994 through 2006. These data reside in an MS Access da-tabase and were manipulated using MS Excel and pivot tables.
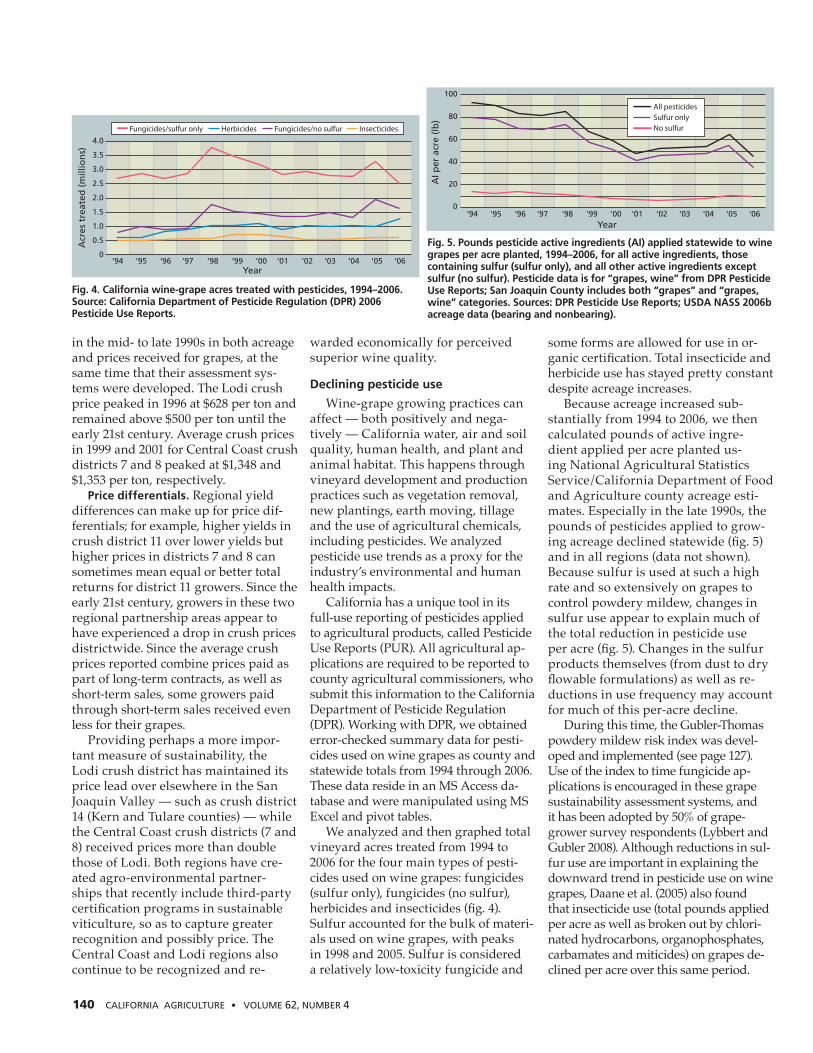
We analyzed and then graphed total vineyard acres treated from 1994 to 2006 for the four main types of pesti-cides used on wine grapes: fungicides (sulfur only), fungicides (no sulfur), herbicides and insecticides (fig. 4). Sulfur accounted for the bulk of materi-als used on wine grapes, with peaks in 1998 and 2005. Sulfur is considered a relatively low-toxicity fungicide and
some forms are allowed for use in or-ganic certification. Total insecticide and herbicide use has stayed pretty constant despite acreage increases.
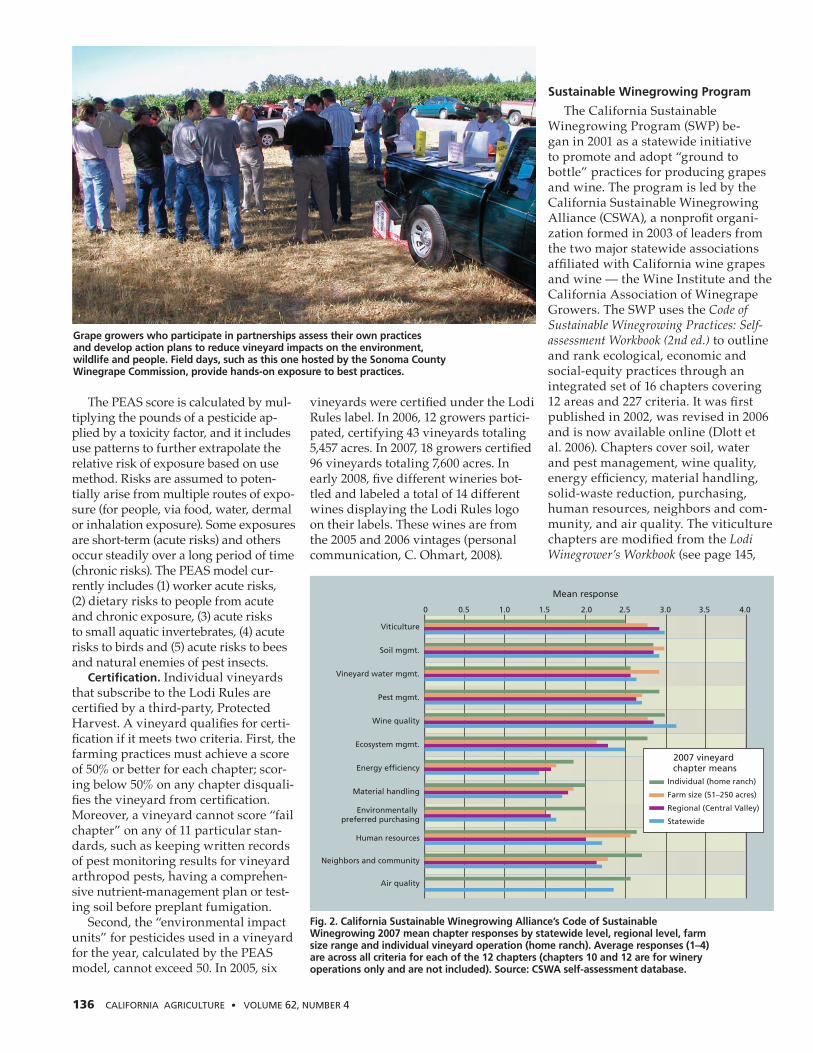
Because acreage increased sub-stantially from 1994 to 2006, we then calculated pounds of active ingre-dient applied per acre planted us-ing National Agricultural Statistics Service/California Department of Food and Agriculture county acreage esti-mates. Especially in the late 1990s, the pounds of pesticides applied to grow-ing acreage declined statewide (fig. 5) and in all regions (data not shown). Because sulfur is used at such a high rate and so extensively on grapes to control powdery mildew, changes in sulfur use appear to explain much of the total reduction in pesticide use per acre (fig. 5). Changes in the sulfur products themselves (from dust to dry flowable formulations) as well as re-ductions in use frequency may account for much of this per-acre decline.
During this time, the Gubler-Thomas powdery mildew risk index was devel-oped and implemented (see page 127). Use of the index to time fungicide ap-plications is encouraged in these grape sustainability assessment systems, and it has been adopted by 50% of grape-grower survey respondents (Lybbert and Gubler 2008). Although reductions in sul-fur use are important in explaining the downward trend in pesticide use on wine grapes, Daane et al. (2005) also found that insecticide use (total pounds applied per acre as well as broken out by chlori-nated hydrocarbons, organophosphates, carbamates and miticides) on grapes de-clined per acre over this same period.
‘94 ‘95 ‘96 ‘97 ‘98 ‘99 ‘00 ‘01 ‘02 ‘03 ‘04 ‘05 ‘06Year
100
80
60
40
20
0
AI p
er a
cre
(lb
)
All pesticidesSulfur only No sulfur
Fig. 5. Pounds pesticide active ingredients (AI) applied statewide to wine grapes per acre planted, 1994–2006, for all active ingredients, those containing sulfur (sulfur only), and all other active ingredients except sulfur (no sulfur). Pesticide data is for “grapes, wine” from DPR Pesticide Use Reports; San Joaquin County includes both “grapes” and “grapes, wine” categories. Sources: DPR Pesticide Use Reports; USDA NASS 2006b acreage data (bearing and nonbearing).
Year ‘94 ‘95 ‘96 ‘97 ‘98 ‘99 ‘00 ‘01 ‘02 ‘03 ‘04 ‘05 ‘06
4.0
3.5
3.0
2.5
2.0
1.5
1.0
0.5
0
Acr
es t
reat
ed (
mill
ion
s)
Fungicides/sulfur only Herbicides Fungicides/no sulfur Insecticides
Fig. 4. California wine-grape acres treated with pesticides, 1994–2006. Source: California Department of Pesticide Regulation (DPR) 2006 Pesticide Use Reports.
in the mid- to late 1990s in both acreage and prices received for grapes, at the same time that their assessment sys-tems were developed. The Lodi crush price peaked in 1996 at $628 per ton and remained above $500 per ton until the early 21st century. Average crush prices in 1999 and 2001 for Central Coast crush districts 7 and 8 peaked at $1,348 and $1,353 per ton, respectively.
Price differentials. Regional yield differences can make up for price dif-ferentials; for example, higher yields in crush district 11 over lower yields but higher prices in districts 7 and 8 can sometimes mean equal or better total returns for district 11 growers. Since the early 21st century, growers in these two regional partnership areas appear to have experienced a drop in crush prices districtwide. Since the average crush prices reported combine prices paid as part of long-term contracts, as well as short-term sales, some growers paid through short-term sales received even less for their grapes.
Providing perhaps a more impor-tant measure of sustainability, the Lodi crush district has maintained its price lead over elsewhere in the San Joaquin Valley — such as crush district 14 (Kern and Tulare counties) — while the Central Coast crush districts (7 and 8) received prices more than double those of Lodi. Both regions have cre-ated agro-environmental partner-ships that recently include third-party certification programs in sustainable viticulture, so as to capture greater recognition and possibly price. The Central Coast and Lodi regions also continue to be recognized and re-

http://CaliforniaAgriculture.ucop.edu • OctOBER–DEcEMBER 2008 141
ReferencesAllen P (ed.). 1993. Food for the Future: Conditions and Contradictions of Sustainability. New York: Wi-ley. 344 p.
[CSWA] California Sustainable Winegrowing Alliance. 2004. California Wine Community Sustainability Report 2004. San Francisco, CA. www.sustainable winegrowing.org/2004sustainabilityreport.php.
CSWA. 2006. California Sustainable Winegrowing Program Progress Report. San Francisco, CA. http://www.sustainablewinegrowing.org/docs/cswa_2006_swp_progress_report.pdf.
[CCVT] Central Coast Vineyard Team. 2007. Positive Points System: A Self-Assessment Tool for Evaluat-ing Sustainable Management Practices Used in Vineyards. Paso Robles, CA. www.vineyardteam.org/PPS_2006_
Conaway J. 2002. The Far Side of Eden. Boston: Hough Miffl. 384 p.
Daane KM, Smith RJ, Klonsky KM, Bentley WJ. 2005. Organic vineyard management in California. www.organic-research.com (May):37N–55N.
Dlott J, Ohmart C, Garn J, et al. 2006. The Code of Sustainable Winegrowing Workbook (2nd ed.). California Sustainable Winegrowing Alliance. San Francisco, CA. www.sustainablewinegrowing.org/index.php.
El Titi A. 1992. Integrated farming: An ecological farm-ing approach in European agriculture. Outlook Ag 21(1):33–9.
Friedland WH. 2002. Agriculture and rurality: Beginning the “final separation”? Rur Sociol 67(3):350–71.
Goodhue R, Green R, Heien D, Martin P. 2008. California wine industry evolving to compete in the 21st century. Cal Ag 62(1):12–8.
Lapsley JT. 1996. Bottled Poetry: Napa Winemaking from the Prohibition to the Modern Era. Berkeley, CA: UC Pr. 301 p.
[LWC] Lodi Winegrape Commission. 2007. Lodi Rules Farming Standards. Lodi, CA. www.lodiwine.com/lodir-ules_home1.shtml.
Lybbert TJ, Gubler WD. 2008. California wine grape growers’ use of powdery mildew forecasts. UC Gian-nini Foundation of Agricultural Economics. Davis, CA. www.agecon.ucdavis.edu/extension/update/articles/v11n4_4.pdf.
MKF Research 2006. The Economic Impact of California Wine 2006 Update. Research report. St. Helena, CA. 23 p.
[NRC] National Research Council. 1989. Alternative Agri-culture. Washington, DC: Nat Acad Pr. 448 p.
Ohmart CP, Matthiasson S. 2000. Lodi Winegrower’s Workbook: A Self Assessment of Integrated Farming
Practices. Lodi-Woodbridge Winegrape Commission. Lodi, CA. 145 p.
Poirier-Locke J. 2002. Vineyards in the Watershed: Sustainable Winegrowing in Napa County. Napa Sus-tainable Winegrowing Group. Napa, CA. 182 p.
Swezey SL, Broome JC. 2000. Growth predicted in biologically integrated and organic farming. Cal Ag 54(4):26–36.
[USDA NASS] US Department of Agriculture National Agricultural Statistics Service. 2006a. California Grape Acreage Bulletins. www.nass.usda.gov/ Statistics_by_State/California/Publications/Fruits_and_Nuts/index_prev_gab.asp.
USDA NASS. 2006b. California Grape Crush Bulletins. www.nass.usda.gov/Statistics_by_State/California/Publications/Grape_Crush/index_prev_gcb.asp.
Warner KD. 2006. Extending agroecology: Grower participation in partnerships is key to social learning. Renew Food Agr Syst 21(2):84–94.
Warner KD. 2007a. Agroecology in Action: Extend-ing Alternative Agriculture Through Social Networks. Cambridge, MA: MIT Pr. 273 p.
Warner KD. 2007b. The quality of sustainability: Agro-ecological partnerships and the geographic branding of California winegrapes. J Rur Stud 23(2):142–55.
[WCED] World Commission on Environment and Development. 1987. Our Common Future. Oxford Univ Pr. 400 p.
Long-term benefits
Sustainability programs cost money to create and implement. The CCVT obtained approximately $1.6 million in the past 10 years for the PPS and re-lated programs (K. O’Connor, personal communication). The Lodi Winegrape Commission has secured about $1.5 million in grant funds over the same period (C. Ohmart, personal communi-cation), but also draws on its annual as-sessment fee. The California Sustainable Winegrowing Alliance has obtained ap-proximately $2.2 million in grant funds over the past 5 years, and its main partners have provided about $1.5 mil-lion in direct funds (A. Jordon, personal communication). Matching funds from grower membership payments and in-kind services have substantially added to grant funds. The greatest additional expenses have been borne by growers, who generally recognize that environ-mental stewardship is necessary for credible community outreach and mar-ket reputation.
Faced with increasing population, global competition, environmental
protection and input costs, the wine-grape industry’s definition of quality and production in place increasingly includes promoting stewardship and sustainability. Other perennial crop commodity groups have witnessed the benefits of the wine-grape industry’s agro-environmental partnerships and are selectively adopting their strategies, suggesting that the future is bright for collaborative sustainability initiatives in California agriculture (Warner 2007b).
Only time will tell if an individual grower’s bottom line, environmental record or community relationships will benefit. Certainly the industrywide effort to assess itself and establish benchmarks, and then promote a cycle of continual improvement in the adop-tion of sustainable practices both in the vineyard and the winery, is an historic event.
Goodhue et al. (2008) documented the fragmentation of the California wine industry, finding bimodal expan-sion of multiwinery corporations with many labels on one end, and small wineries selling directly to consum-ers, restaurants and final users on the
other. Midsize wineries that sell 25,000 to 75,000 cases a year may be forced to get larger or smaller. Regional, sustain-able wine-growing branding may allow some of the “ag in the middle” growers to survive the coming challenges by increasing their economic sustainabil-ity, creating a more competitive and desirable product labeled as such, and creating greater consumer awareness, and therefore demand, for these place-based, sustainably produced wines.
J.C. Broome is Academic Coordinator, UC Coop-erative Extension, Sacramento, Yolo and Solano counties, and K.D. Warner is Lecturer and Re-searcher, Environmental Studies Institute, Santa Clara University. We thank Allison Jordan, Kris O’Connor and Cliff Ohmart of the wine-grape partnerships for kindly providing data and infor-mation to assist in this review, and Karen Ross and Jeff Dlott for additional input. We also thank Larry Wilhoit at DPR for providing the pesticide use data. We acknowledge with gratitude sup-port from the National Science Foundation (award BCS-0302393), the Biologically Integrated Farm-ing Systems Work Group and the UC Santa Cruz Center for Agroecology and Sustainable Food Systems.