Changing moisture sources over the last 330,000 years in Northern Oman from fluid-inclusion evidence...
10
Changing moisture sources over the last 330,000 years in Northern Oman from fluid-inclusion evidence in speleothems Dominik Fleitmann, a, * Stephen J. Burns, b Ulrich Neff, c Augusto Mangini, c and Albert Matter a a Institute of Geological Sciences, University of Bern, Baltzerstrasse 1-3, 3012 Bern, Switzerland b Department of Geosciences, Morrill Science Center, University of Massachusetts, Amherst, MA 01002, USA c Heidelberg Academy of Sciences, Im Neuenheimer Feld 229, 69120 Heidelberg, Germany Received 27 August 2002 Abstract Speleothems from Hoti Cave in northern Oman provide a record of continental pluvial periods over the last 330,000 yr. Periods of rapid speleothem deposition occurred from 6000 to 10,500, 78,000 to 82,000, 120,000 to 135,000, 180,000 to 200,000, and 300,000 to 330,000 yr ago, with little or no growth during the intervening periods. During each of these five pluvial periods, D values of water extracted from speleothem fluid inclusions (D FI ) are between 60 and 20‰ (VSMOW) and 18 O values of speleothem calcite ( 18 O C ) are between 12 and 4‰ to (VPDB). These values are much more negative than modern rainfall (for D) or modern stalagmites (for 18 O). Previous work on the isotopic composition of rainfall in Oman has shown that northern and southern moisture sources are isotopically distinct. Combined measurements of the D values of fluid-inclusion water with calculated 18 O values from peak interglacial speleothems indicate that groundwater was predominantly recharged by the southern (Indian Ocean) moisture source, when the monsoon rainfall belt moved northward and reached Northern Oman during each of these periods. © 2003 University of Washington. Published by Elsevier Inc. All rights reserved. Keywords: Speleothems; Stable isotopes; Fluid inclusions; Paleoprecipitation; Oman Introduction Currently, information on climate variability on glacial- interglacial time scales in the areas that border the Arabian Sea comes almost entirely from marine cores (Van Campo et al., 1982; Clemens and Prell, 1990; Clemens et al., 1991; Anderson and Prell, 1993). Paleoclimatic information ob- tained from marine records is based on various proxies, such as the percentage of Globigerinoides bulloides (a foramin- ifer associated with upwelling water), trace element concen- trations (e.g., barium or silica) and aeolian lithogenic grain sizes. All of these proxies, however, are rather an indicator of monsoonal wind strength than of continental wetness. Terrestrial paleoclimate records, such as paleolake sedi- ments and dune deposits, are more suitable to monitor fluctuations in the hydrological cycle in Northern Africa and on the Arabian Peninsula. Long-term records, however, are scarce and widely distributed geographically. Even when paleolake sequences are preserved (e.g., Szabo et al., 1995), precise Uranium-series age dating has not been possible due to diagenetic effects and detrital contamination, both of which result in large age uncertainties. Moreover, while paleolake sequences and dune deposits (e.g., Preusser et al., 2002) may reveal the occurrence of pluvial periods and/or wind direction, they do not give direct information about the source of precipitation. In contrast to these terrestrial paleo- climate archives, speleothems (stalagmites, stalactites, and flowstones) may provide direct information on the isotopic composition of rainfall and, therefore, potentially identify the source of moisture to a given area. The oxygen isotope ratios of speleothem calcite ( 18 O C ) and hydrogen isotope ratios of speleothem fluid inclusion (D FI ) are water-isotope tracers, which enable the calculation of the isotopic com- * Corresponding author. Fax: 0049-0-31-631-48-43. E-mail address: [email protected] (D. Fleitmann). R Available online at www.sciencedirect.com Quaternary Research 60 (2003) 223–232 www.elsevier.com/locate/yqres 0033-5894/03/$ – see front matter © 2003 University of Washington. Published by Elsevier Inc. All rights reserved. doi:10.1016/S0033-5894(03)00086-3
Transcript of Changing moisture sources over the last 330,000 years in Northern Oman from fluid-inclusion evidence...
Changing moisture sources over the last 330,000 years in NorthernOman from fluid-inclusion evidence in speleothems
Dominik Fleitmann,a,* Stephen J. Burns,b Ulrich Neff,c Augusto Mangini,c
and Albert Mattera
a Institute of Geological Sciences, University of Bern, Baltzerstrasse 1-3, 3012 Bern, Switzerlandb Department of Geosciences, Morrill Science Center, University of Massachusetts, Amherst, MA 01002, USA
c Heidelberg Academy of Sciences, Im Neuenheimer Feld 229, 69120 Heidelberg, Germany
Received 27 August 2002
Abstract
Speleothems from Hoti Cave in northern Oman provide a record of continental pluvial periods over the last 330,000 yr. Periods of rapidspeleothem deposition occurred from 6000 to 10,500, 78,000 to 82,000, 120,000 to 135,000, 180,000 to 200,000, and 300,000 to 330,000yr ago, with little or no growth during the intervening periods. During each of these five pluvial periods, �D values of water extracted fromspeleothem fluid inclusions (�DFI) are between �60 and �20‰ (VSMOW) and �18O values of speleothem calcite (�18OC) are between �12and �4‰ to (VPDB). These values are much more negative than modern rainfall (for �D) or modern stalagmites (for �18O). Previous workon the isotopic composition of rainfall in Oman has shown that northern and southern moisture sources are isotopically distinct. Combinedmeasurements of the �D values of fluid-inclusion water with calculated �18O values from peak interglacial speleothems indicate thatgroundwater was predominantly recharged by the southern (Indian Ocean) moisture source, when the monsoon rainfall belt movednorthward and reached Northern Oman during each of these periods.© 2003 University of Washington. Published by Elsevier Inc. All rights reserved.
Keywords: Speleothems; Stable isotopes; Fluid inclusions; Paleoprecipitation; Oman
Introduction
Currently, information on climate variability on glacial-interglacial time scales in the areas that border the ArabianSea comes almost entirely from marine cores (Van Campoet al., 1982; Clemens and Prell, 1990; Clemens et al., 1991;Anderson and Prell, 1993). Paleoclimatic information ob-tained from marine records is based on various proxies, suchas the percentage of Globigerinoides bulloides (a foramin-ifer associated with upwelling water), trace element concen-trations (e.g., barium or silica) and aeolian lithogenic grainsizes. All of these proxies, however, are rather an indicatorof monsoonal wind strength than of continental wetness.Terrestrial paleoclimate records, such as paleolake sedi-ments and dune deposits, are more suitable to monitor
fluctuations in the hydrological cycle in Northern Africa andon the Arabian Peninsula. Long-term records, however, arescarce and widely distributed geographically. Even whenpaleolake sequences are preserved (e.g., Szabo et al., 1995),precise Uranium-series age dating has not been possible dueto diagenetic effects and detrital contamination, both ofwhich result in large age uncertainties. Moreover, whilepaleolake sequences and dune deposits (e.g., Preusser et al.,2002) may reveal the occurrence of pluvial periods and/orwind direction, they do not give direct information about thesource of precipitation. In contrast to these terrestrial paleo-climate archives, speleothems (stalagmites, stalactites, andflowstones) may provide direct information on the isotopiccomposition of rainfall and, therefore, potentially identifythe source of moisture to a given area. The oxygen isotoperatios of speleothem calcite (�18OC) and hydrogen isotoperatios of speleothem fluid inclusion (�DFI) are water-isotopetracers, which enable the calculation of the isotopic com-
* Corresponding author. Fax: �0049-0-31-631-48-43.E-mail address: [email protected] (D. Fleitmann).
R
Available online at www.sciencedirect.com
Quaternary Research 60 (2003) 223–232 www.elsevier.com/locate/yqres
0033-5894/03/$ – see front matter © 2003 University of Washington. Published by Elsevier Inc. All rights reserved.doi:10.1016/S0033-5894(03)00086-3
position of paleogroundwater and paleoprecipitation.Knowledge of the isotopic composition of paleoprecipita-tion in Northern Oman helps to better identify changes inthe moisture source, air mass trajectories, and rain-out his-tory on glacial-interglacial time scales.
A composite oxygen isotope record derived from spe-leothems at Hoti Cave in Northern Oman and dated by urani-um-series indicates five periods of increased wetness occurringat 6000–10,500, 78,000–82,000, 120,000–135,000, 180,000–200,000, and 300,000–325,000 yr ago (Burns et al., 1998,2001). It has been suggested that during each of these periodsthe intertropical convergence zone (ITCZ) moved north intothe Arabian Peninsula and that the Indian Ocean monsoonreached Northern Oman (Burns et al., 1998, 2001; Neff et al.,2001). Currently, this interpretation is based on the highlynegative character of �18OC values alone. An additional indi-cator of rainfall isotopic composition is the hydrogen isotopiccomposition of speleothem fluid inclusions, which are filledwith water that was trapped in the host calcite at the time ofgrowth (Schwarcz et al., 1976, Kendall and Broughton, 1978).Provided that evaporation within the cave has not affected thedrip waters, fluid inclusions preserve the isotope compositionof cave drip water and groundwater, respectively. Due to thefact that in many caves the isotopic composition of drip watersreflects the isotopic composition of mean annual precipitationat the cave site (Harmon et al., 1979; Yonge et al., 1985), directinformation about the hydrogen isotope composition of pre-cipitation can be gained. Finally, in combination with �18OC
values and estimated cave temperatures, the isotope composi-tion of paleogroundwater and paleoprecipitation can be recon-structed.
Currently, two methods are used to liberate water fromspeleothem fluid inclusions for hydrogen isotope analysis:(1) by thermal decrepitation at high temperatures (Yonge,1982; Matthews et al., 2000) and (2) by crushing under highvacuum at low temperatures (Dennis et al., 1997, 2001).The first method, thermal decrepitation, liberates fluid-in-clusion water at very high temperatures (400° to 500°C).However, fluid-inclusion water extracted and recoveredfrom active stalagmites using this method is �20 to �30‰(VSMOW) more depleted than their parent drip waters, and,thus, a correction is needed (Yonge, 1982; Matthews et al.,2000). Furthermore, thermal decrepitation releases largevolumes of CO2, hindering precise measurements of fluidinclusion oxygen isotopes. To avoid the problems associ-ated with the thermal decrepitation method a vacuum-crush-ing cell was designed by Dennis et al. (1997). Recentstudies have shown that the crushing method enables simul-taneous measurements of the isotopic composition of fluid-inclusion water with a precision of �3‰ for �D and�0.4‰ for �18O without any analytical fractionation (Den-nis et al., 1997, 2001).
Despite these results, the reliability of �18O measure-ments of speleothem fluid inclusions is still a subject ofongoing discussions, because of possible postdepositionaloxygen isotope exchange between inclusion water and spe-
leothem calcite over time (Schwarcz et al., 1976). However,hydrogen isotopes do not exchange with their calcite hostrock and, therefore, accurately reflect the hydrogen isotopiccomposition of cave drip water and precipitation. In thispaper we present the results of hydrogen isotope measure-ments of fluid inclusion from uranium-series dated spe-leothems from Hoti Cave in Northern Oman, which providedirect information about the moisture source of precipitationand, thus, paleo-wind directions during the last 330,000 yr.
Environmental settings
Hoti Cave (57° 21� E, 23° 05� N) is located in NorthernOman, in the foothills along the southern margin of theOman Mountains (Fig. 1). The cave system, hosted in theCretaceous limestone of the Natih Formation, has two en-trances and is a subsurface, 4.5-km-long wadi. The cave airtemperature is variable near both entrances and is moreconstant at approximately 26°C inside. The present climateof the area is arid to semiarid with an annual precipitationranging from 50 to 255 mm yr�1 (station AI Hamra, 700 mabove sea level, 1974–1997). Mean monthly temperaturesrange from 33° to 35°C during the summer months and from20° to 25°C during the winter months. Precipitation inNorthern Oman is extremely variable and originates fromthree sources. The first source is Mediterranean frontal sys-tems approaching from the northwest, occurring mostlybetween December and March. The second source of pre-cipitation is local thunderstorms, which form over the JabalAkhdar mountains during very hot summers (orographicrain). These thunderstorms cause short and heavy rainfall.The third source of precipitation is tropical cyclones, whichoriginate in the Bay of Bengal and the southeastern ArabianSea. Tropical cyclones reach Northern Oman once every 5to 10 yr (Pedgely, 1989) between the summer and the winterseason (May–June and October–November) and are associ-
Fig. 1. Location map of Hoti Cave (black star), arrows indicate generalizedmodern, summer surface-wind patterns. Dashed line is the approximateposition of the intertropical convergence zone (ITCZ), which roughlymarks the northern limit of monsoon rainfall. The white circle marks the AlWusta area.
224 D. Fleitmann et al. / Quaternary Research 60 (2003) 223–232
ated with heavy rainfalls of several days duration. Atpresent, Northern Oman is not affected by the IndianOcean monsoon, because the intertropical convergencezone and the associated monsoon rainfall belt remainsgenerally to the south of the Arabian Peninsula (Has-tenrath, 1985) (Fig. 1).
Sample description
Eight stalagmites and one flowstone were collected inHoti Cave as whole samples or by drilling. The height of thefossil stalagmites ranges from about 0.6 to 3.0 m. Activestalagmites are almost absent in Hoti Cave; most of themare smaller than 0.3 m. Only one large active stalagmite wasfound in the entire cave, the 1-m-long stalagmite H12.
Thin sections were studied from all samples to investi-gate the nature of speleothem fluid inclusions. Most fluidinclusions are ellipsoidal or sausage-shaped micrometer-size cavities ranging from 1 to 20 �m. The majority of thecavities are completely filled with water; two-phase inclu-sions (gas-water) are rare. In general, these cavities tend toform inclusion-rich bands.
Analytical methods
Uranium-series dating
Ages were determined by measuring the U/Th ratios ofthe samples by thermal ionization mass spectrometry; a totalof 86 measurements were made for all samples (see Table1). Analytical procedures for the separation and purificationof thorium and uranium follow closely those described indetail by Ivanovich and Harmon (1993). U/Th measure-ments were performed on a multicollector mass spectrom-eter (Finnigan MAT 262 RPQ) with a double filamenttechnique. Uranium and thorium were measured in semi-peak-jump mode and peak-jump mode, respectively. Cali-bration of Faraday Cup to ICM efficiency was made byadopting the natural ratio 238U/235U of 137.88. To deter-mine the uranium and thorium concentrations, definedquantities of a 233U/236U double spike and a 229Th spikewere added. Th/U ages were corrected for detritus followingIvanovich and Harmon (1993) assuming a 232Th/238U iso-tope ratio of 3.8. The reproducibility of the isotope ratio of234U/238U and the concentration of 232Th of standard mate-rials is 0.3% and 0.8% (2�), respectively. For details aboutmeasurements of the standard material, see Frank et al.(2000).
Oxygen isotope measurements
More than 2800 oxygen and carbon isotope analyseswere done on all speleothems sampled in Hoti Cave (Burnset al., 1998, 2001; Neff et al., 2001; Fleitmann, 2001). The
oxygen isotopes shown in this paper are a representativeselection. For isotopic analyses approximately 5 mg ofpowder was drilled from the sample and analyzed with anon-line, automated, carbonate preparation system linked to aVG Prism II isotope ratio mass spectrometer. Results ofthese analyses are shown as the per-mil deviation betweenthe sample and the Vienna Pee Dee Belemnite standard(VPDB) in delta notation. Reproducibility of standard ma-terials is 0.08‰. Drip-water �D and �18O values weremeasured using an on-line, automated equilibration system.The values are reported against Vienna standard meanocean water (VSMOW) and have a reproducibility of�0.6‰ for hydrogen and �0.1‰ for oxygen.
Hydrogen isotope measurements on speleothem fluidinclusions
The high-vacuum-crushing cell is a metal constructionwith copper con-flat seals. An internal hammer, driven byan external electromagnetic coil, is repeatedly raised anddropped onto the sample (Dennis et al., 1997). The sample,varying between 1.5 and 2.5 g, is placed in the cell andevacuated until a vacuum, higher than 1 � 10�4 mb, isachieved. Thereafter, the vacuum-crushing cell is isolatedfrom the vacuum manifold and opened to a cold trap, cooledwith liquid nitrogen (�190°C). The sample is crushed using100–150 impact cycles and the crushing cell is then heatedto 150°C to transfer the liberated water over a period of 60min to a liquid nitrogen cold trap, which consists of a 6-mmpyrex tube containing zinc shavings (Biogeochemical Lab-oratories, Indiana University). To minimize water adsorp-tion to the glass, the glass transfer lines are wrapped inheating tape and heated up to 80°C. The cryogenicallycollected water is converted to hydrogen by reduction withZn at 500°C for 30 min (Coleman et al., 1982) and thehydrogen gas is then measured on a VG PRISM II isotoperatio mass spectrometer.
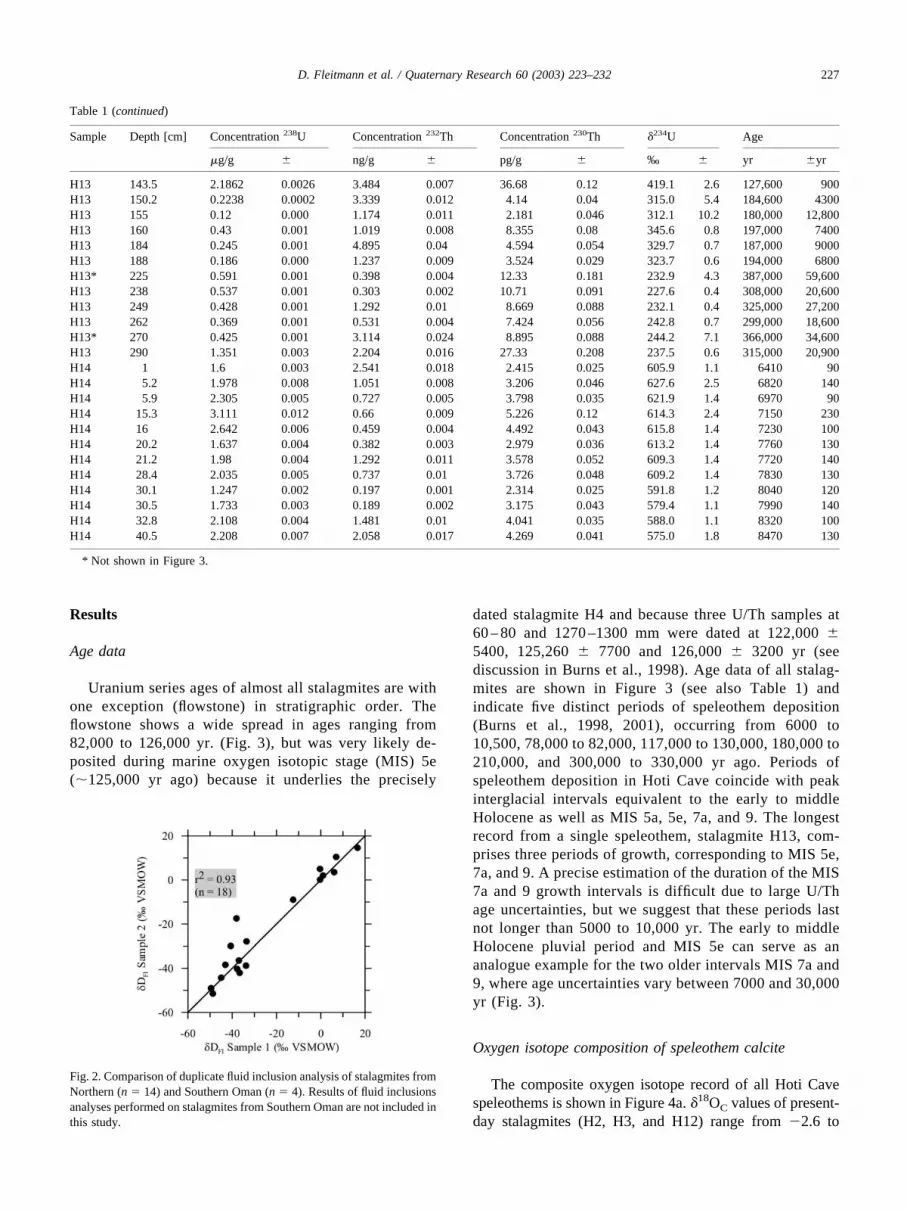
Following Dennis et al. (1997, 2001), the efficiency andthe precision of our electromagnetic crushing cell was testedwith three types of samples: (1) laboratory standard water(LSTDW) (1 and 2 �l) sealed in glass capillaries, (2)LSTDW water crushed together with anhydrous calcite(Iceland Spar), and (3) the upper few millimeters of modern,actively growing stalagmites for which we also have mea-sured the �D values of drip waters (Fleitmann et al., 1999).The results indicate that the total analytical precision isapproximately �3‰ and thus very similar to the precisiongiven by Dennis et al. (1997, 2001) for the same method ofextraction. Furthermore, duplicate measurements of spe-leothem fluid inclusions (Fig. 2) indicate a good reproduc-ibility and underline the reliability of the vacuum-crushingmethod. The average standard deviation for 18 duplicate�DFI samples also averages �3‰ (Fig. 2).
225D. Fleitmann et al. / Quaternary Research 60 (2003) 223–232
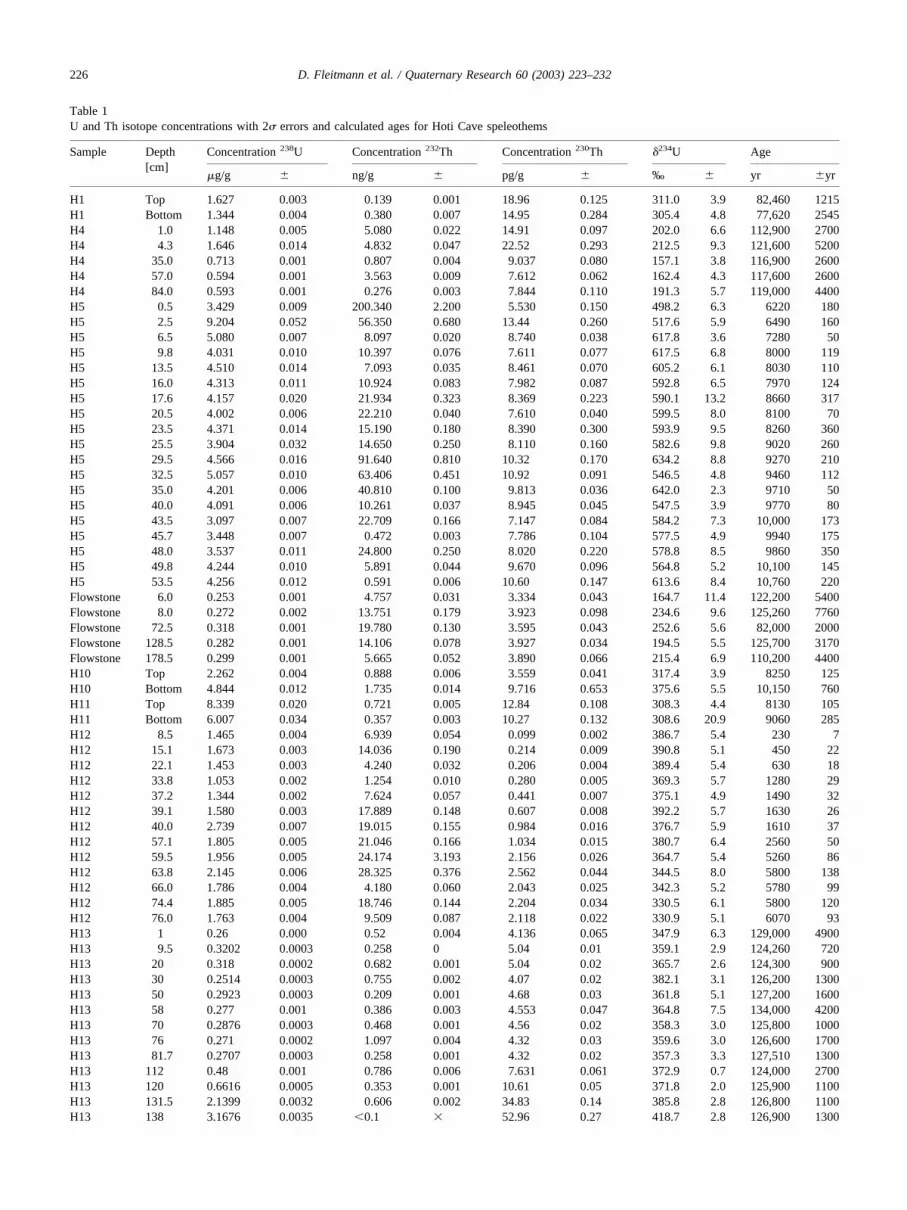
Table 1U and Th isotope concentrations with 2� errors and calculated ages for Hoti Cave speleothems
Sample Depth[cm]
Concentration 238U Concentration 232Th Concentration 230Th �234U Age
�g/g � ng/g � pg/g � ‰ � yr �yr
H1 Top 1.627 0.003 0.139 0.001 18.96 0.125 311.0 3.9 82,460 1215H1 Bottom 1.344 0.004 0.380 0.007 14.95 0.284 305.4 4.8 77,620 2545H4 1.0 1.148 0.005 5.080 0.022 14.91 0.097 202.0 6.6 112,900 2700H4 4.3 1.646 0.014 4.832 0.047 22.52 0.293 212.5 9.3 121,600 5200H4 35.0 0.713 0.001 0.807 0.004 9.037 0.080 157.1 3.8 116,900 2600H4 57.0 0.594 0.001 3.563 0.009 7.612 0.062 162.4 4.3 117,600 2600H4 84.0 0.593 0.001 0.276 0.003 7.844 0.110 191.3 5.7 119,000 4400H5 0.5 3.429 0.009 200.340 2.200 5.530 0.150 498.2 6.3 6220 180H5 2.5 9.204 0.052 56.350 0.680 13.44 0.260 517.6 5.9 6490 160H5 6.5 5.080 0.007 8.097 0.020 8.740 0.038 617.8 3.6 7280 50H5 9.8 4.031 0.010 10.397 0.076 7.611 0.077 617.5 6.8 8000 119H5 13.5 4.510 0.014 7.093 0.035 8.461 0.070 605.2 6.1 8030 110H5 16.0 4.313 0.011 10.924 0.083 7.982 0.087 592.8 6.5 7970 124H5 17.6 4.157 0.020 21.934 0.323 8.369 0.223 590.1 13.2 8660 317H5 20.5 4.002 0.006 22.210 0.040 7.610 0.040 599.5 8.0 8100 70H5 23.5 4.371 0.014 15.190 0.180 8.390 0.300 593.9 9.5 8260 360H5 25.5 3.904 0.032 14.650 0.250 8.110 0.160 582.6 9.8 9020 260H5 29.5 4.566 0.016 91.640 0.810 10.32 0.170 634.2 8.8 9270 210H5 32.5 5.057 0.010 63.406 0.451 10.92 0.091 546.5 4.8 9460 112H5 35.0 4.201 0.006 40.810 0.100 9.813 0.036 642.0 2.3 9710 50H5 40.0 4.091 0.006 10.261 0.037 8.945 0.045 547.5 3.9 9770 80H5 43.5 3.097 0.007 22.709 0.166 7.147 0.084 584.2 7.3 10,000 173H5 45.7 3.448 0.007 0.472 0.003 7.786 0.104 577.5 4.9 9940 175H5 48.0 3.537 0.011 24.800 0.250 8.020 0.220 578.8 8.5 9860 350H5 49.8 4.244 0.010 5.891 0.044 9.670 0.096 564.8 5.2 10,100 145H5 53.5 4.256 0.012 0.591 0.006 10.60 0.147 613.6 8.4 10,760 220Flowstone 6.0 0.253 0.001 4.757 0.031 3.334 0.043 164.7 11.4 122,200 5400Flowstone 8.0 0.272 0.002 13.751 0.179 3.923 0.098 234.6 9.6 125,260 7760Flowstone 72.5 0.318 0.001 19.780 0.130 3.595 0.043 252.6 5.6 82,000 2000Flowstone 128.5 0.282 0.001 14.106 0.078 3.927 0.034 194.5 5.5 125,700 3170Flowstone 178.5 0.299 0.001 5.665 0.052 3.890 0.066 215.4 6.9 110,200 4400H10 Top 2.262 0.004 0.888 0.006 3.559 0.041 317.4 3.9 8250 125H10 Bottom 4.844 0.012 1.735 0.014 9.716 0.653 375.6 5.5 10,150 760H11 Top 8.339 0.020 0.721 0.005 12.84 0.108 308.3 4.4 8130 105H11 Bottom 6.007 0.034 0.357 0.003 10.27 0.132 308.6 20.9 9060 285H12 8.5 1.465 0.004 6.939 0.054 0.099 0.002 386.7 5.4 230 7H12 15.1 1.673 0.003 14.036 0.190 0.214 0.009 390.8 5.1 450 22H12 22.1 1.453 0.003 4.240 0.032 0.206 0.004 389.4 5.4 630 18H12 33.8 1.053 0.002 1.254 0.010 0.280 0.005 369.3 5.7 1280 29H12 37.2 1.344 0.002 7.624 0.057 0.441 0.007 375.1 4.9 1490 32H12 39.1 1.580 0.003 17.889 0.148 0.607 0.008 392.2 5.7 1630 26H12 40.0 2.739 0.007 19.015 0.155 0.984 0.016 376.7 5.9 1610 37H12 57.1 1.805 0.005 21.046 0.166 1.034 0.015 380.7 6.4 2560 50H12 59.5 1.956 0.005 24.174 3.193 2.156 0.026 364.7 5.4 5260 86H12 63.8 2.145 0.006 28.325 0.376 2.562 0.044 344.5 8.0 5800 138H12 66.0 1.786 0.004 4.180 0.060 2.043 0.025 342.3 5.2 5780 99H12 74.4 1.885 0.005 18.746 0.144 2.204 0.034 330.5 6.1 5800 120H12 76.0 1.763 0.004 9.509 0.087 2.118 0.022 330.9 5.1 6070 93H13 1 0.26 0.000 0.52 0.004 4.136 0.065 347.9 6.3 129,000 4900H13 9.5 0.3202 0.0003 0.258 0 5.04 0.01 359.1 2.9 124,260 720H13 20 0.318 0.0002 0.682 0.001 5.04 0.02 365.7 2.6 124,300 900H13 30 0.2514 0.0003 0.755 0.002 4.07 0.02 382.1 3.1 126,200 1300H13 50 0.2923 0.0003 0.209 0.001 4.68 0.03 361.8 5.1 127,200 1600H13 58 0.277 0.001 0.386 0.003 4.553 0.047 364.8 7.5 134,000 4200H13 70 0.2876 0.0003 0.468 0.001 4.56 0.02 358.3 3.0 125,800 1000H13 76 0.271 0.0002 1.097 0.004 4.32 0.03 359.6 3.0 126,600 1700H13 81.7 0.2707 0.0003 0.258 0.001 4.32 0.02 357.3 3.3 127,510 1300H13 112 0.48 0.001 0.786 0.006 7.631 0.061 372.9 0.7 124,000 2700H13 120 0.6616 0.0005 0.353 0.001 10.61 0.05 371.8 2.0 125,900 1100H13 131.5 2.1399 0.0032 0.606 0.002 34.83 0.14 385.8 2.8 126,800 1100H13 138 3.1676 0.0035 �0.1 � 52.96 0.27 418.7 2.8 126,900 1300
226 D. Fleitmann et al. / Quaternary Research 60 (2003) 223–232
Results
Age data
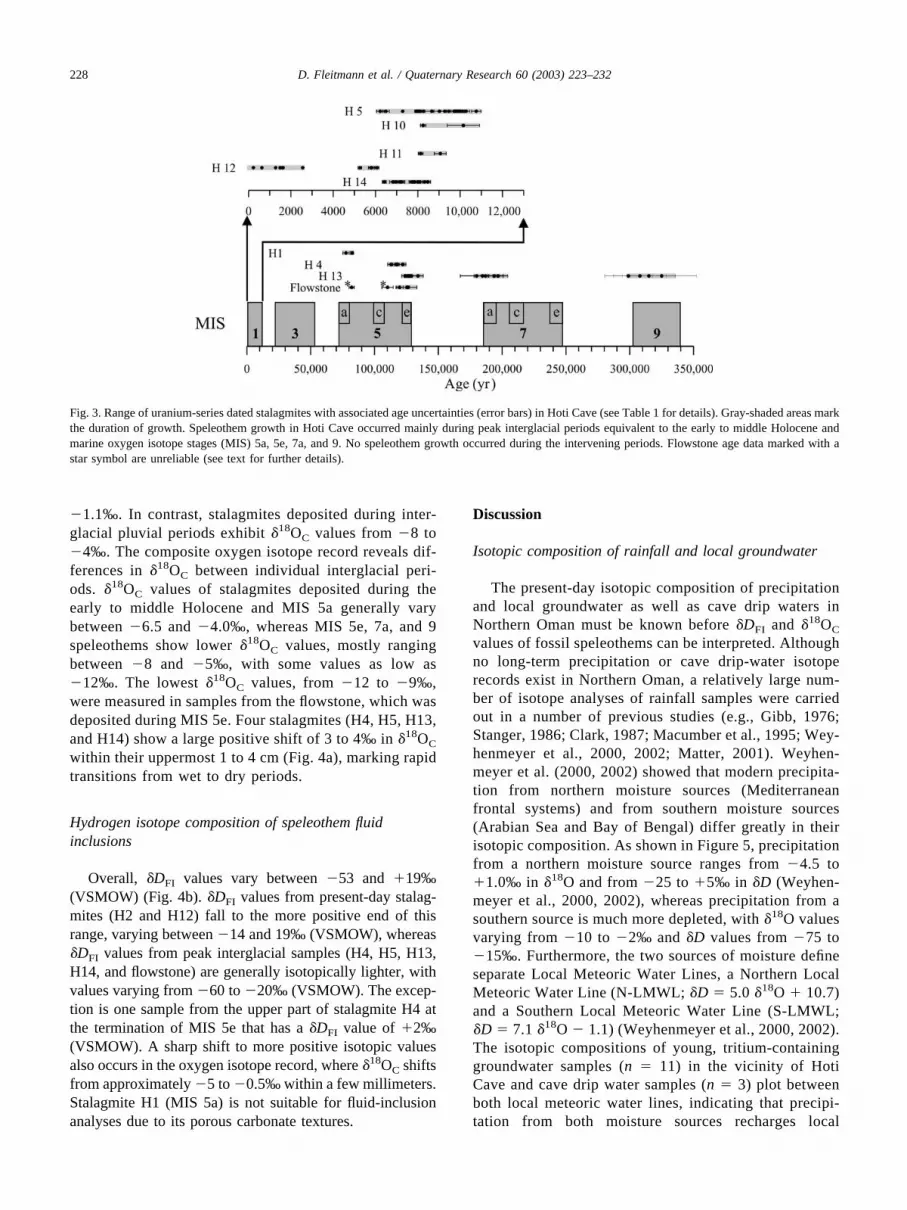
Uranium series ages of almost all stalagmites are withone exception (flowstone) in stratigraphic order. Theflowstone shows a wide spread in ages ranging from82,000 to 126,000 yr. (Fig. 3), but was very likely de-posited during marine oxygen isotopic stage (MIS) 5e(�125,000 yr ago) because it underlies the precisely
dated stalagmite H4 and because three U/Th samples at60 – 80 and 1270 –1300 mm were dated at 122,000 �5400, 125,260 � 7700 and 126,000 � 3200 yr (seediscussion in Burns et al., 1998). Age data of all stalag-mites are shown in Figure 3 (see also Table 1) andindicate five distinct periods of speleothem deposition(Burns et al., 1998, 2001), occurring from 6000 to10,500, 78,000 to 82,000, 117,000 to 130,000, 180,000 to210,000, and 300,000 to 330,000 yr ago. Periods ofspeleothem deposition in Hoti Cave coincide with peakinterglacial intervals equivalent to the early to middleHolocene as well as MIS 5a, 5e, 7a, and 9. The longestrecord from a single speleothem, stalagmite H13, com-prises three periods of growth, corresponding to MIS 5e,7a, and 9. A precise estimation of the duration of the MIS7a and 9 growth intervals is difficult due to large U/Thage uncertainties, but we suggest that these periods lastnot longer than 5000 to 10,000 yr. The early to middleHolocene pluvial period and MIS 5e can serve as ananalogue example for the two older intervals MIS 7a and9, where age uncertainties vary between 7000 and 30,000yr (Fig. 3).
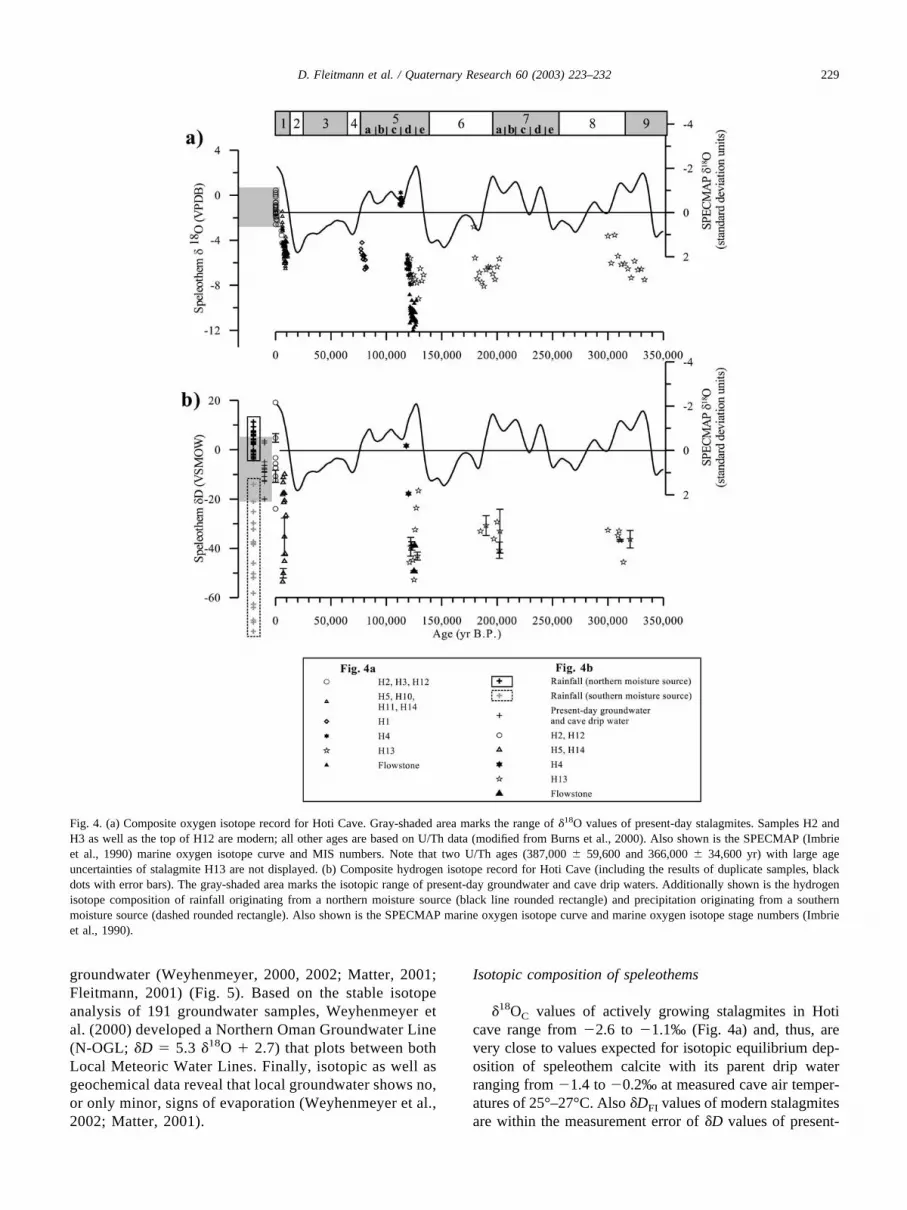
Oxygen isotope composition of speleothem calcite
The composite oxygen isotope record of all Hoti Cavespeleothems is shown in Figure 4a. �18OC values of present-day stalagmites (H2, H3, and H12) range from �2.6 to
Table 1 (continued)
Sample Depth [cm] Concentration 238U Concentration 232Th Concentration 230Th �234U Age
�g/g � ng/g � pg/g � ‰ � yr �yr
H13 143.5 2.1862 0.0026 3.484 0.007 36.68 0.12 419.1 2.6 127,600 900H13 150.2 0.2238 0.0002 3.339 0.012 4.14 0.04 315.0 5.4 184,600 4300H13 155 0.12 0.000 1.174 0.011 2.181 0.046 312.1 10.2 180,000 12,800H13 160 0.43 0.001 1.019 0.008 8.355 0.08 345.6 0.8 197,000 7400H13 184 0.245 0.001 4.895 0.04 4.594 0.054 329.7 0.7 187,000 9000H13 188 0.186 0.000 1.237 0.009 3.524 0.029 323.7 0.6 194,000 6800H13* 225 0.591 0.001 0.398 0.004 12.33 0.181 232.9 4.3 387,000 59,600H13 238 0.537 0.001 0.303 0.002 10.71 0.091 227.6 0.4 308,000 20,600H13 249 0.428 0.001 1.292 0.01 8.669 0.088 232.1 0.4 325,000 27,200H13 262 0.369 0.001 0.531 0.004 7.424 0.056 242.8 0.7 299,000 18,600H13* 270 0.425 0.001 3.114 0.024 8.895 0.088 244.2 7.1 366,000 34,600H13 290 1.351 0.003 2.204 0.016 27.33 0.208 237.5 0.6 315,000 20,900H14 1 1.6 0.003 2.541 0.018 2.415 0.025 605.9 1.1 6410 90H14 5.2 1.978 0.008 1.051 0.008 3.206 0.046 627.6 2.5 6820 140H14 5.9 2.305 0.005 0.727 0.005 3.798 0.035 621.9 1.4 6970 90H14 15.3 3.111 0.012 0.66 0.009 5.226 0.12 614.3 2.4 7150 230H14 16 2.642 0.006 0.459 0.004 4.492 0.043 615.8 1.4 7230 100H14 20.2 1.637 0.004 0.382 0.003 2.979 0.036 613.2 1.4 7760 130H14 21.2 1.98 0.004 1.292 0.011 3.578 0.052 609.3 1.4 7720 140H14 28.4 2.035 0.005 0.737 0.01 3.726 0.048 609.2 1.4 7830 130H14 30.1 1.247 0.002 0.197 0.001 2.314 0.025 591.8 1.2 8040 120H14 30.5 1.733 0.003 0.189 0.002 3.175 0.043 579.4 1.1 7990 140H14 32.8 2.108 0.004 1.481 0.01 4.041 0.035 588.0 1.1 8320 100H14 40.5 2.208 0.007 2.058 0.017 4.269 0.041 575.0 1.8 8470 130
* Not shown in Figure 3.
Fig. 2. Comparison of duplicate fluid inclusion analysis of stalagmites fromNorthern (n � 14) and Southern Oman (n � 4). Results of fluid inclusionsanalyses performed on stalagmites from Southern Oman are not included inthis study.
227D. Fleitmann et al. / Quaternary Research 60 (2003) 223–232
�1.1‰. In contrast, stalagmites deposited during inter-glacial pluvial periods exhibit �18OC values from �8 to�4‰. The composite oxygen isotope record reveals dif-ferences in �18OC between individual interglacial peri-ods. �18OC values of stalagmites deposited during theearly to middle Holocene and MIS 5a generally varybetween �6.5 and �4.0‰, whereas MIS 5e, 7a, and 9speleothems show lower �18OC values, mostly rangingbetween �8 and �5‰, with some values as low as�12‰. The lowest �18OC values, from �12 to �9‰,were measured in samples from the flowstone, which wasdeposited during MIS 5e. Four stalagmites (H4, H5, H13,and H14) show a large positive shift of 3 to 4‰ in �18OC
within their uppermost 1 to 4 cm (Fig. 4a), marking rapidtransitions from wet to dry periods.
Hydrogen isotope composition of speleothem fluidinclusions
Overall, �DFI values vary between �53 and �19‰(VSMOW) (Fig. 4b). �DFI values from present-day stalag-mites (H2 and H12) fall to the more positive end of thisrange, varying between �14 and 19‰ (VSMOW), whereas�DFI values from peak interglacial samples (H4, H5, H13,H14, and flowstone) are generally isotopically lighter, withvalues varying from �60 to �20‰ (VSMOW). The excep-tion is one sample from the upper part of stalagmite H4 atthe termination of MIS 5e that has a �DFI value of �2‰(VSMOW). A sharp shift to more positive isotopic valuesalso occurs in the oxygen isotope record, where �18OC shiftsfrom approximately �5 to �0.5‰ within a few millimeters.Stalagmite H1 (MIS 5a) is not suitable for fluid-inclusionanalyses due to its porous carbonate textures.
Discussion
Isotopic composition of rainfall and local groundwater
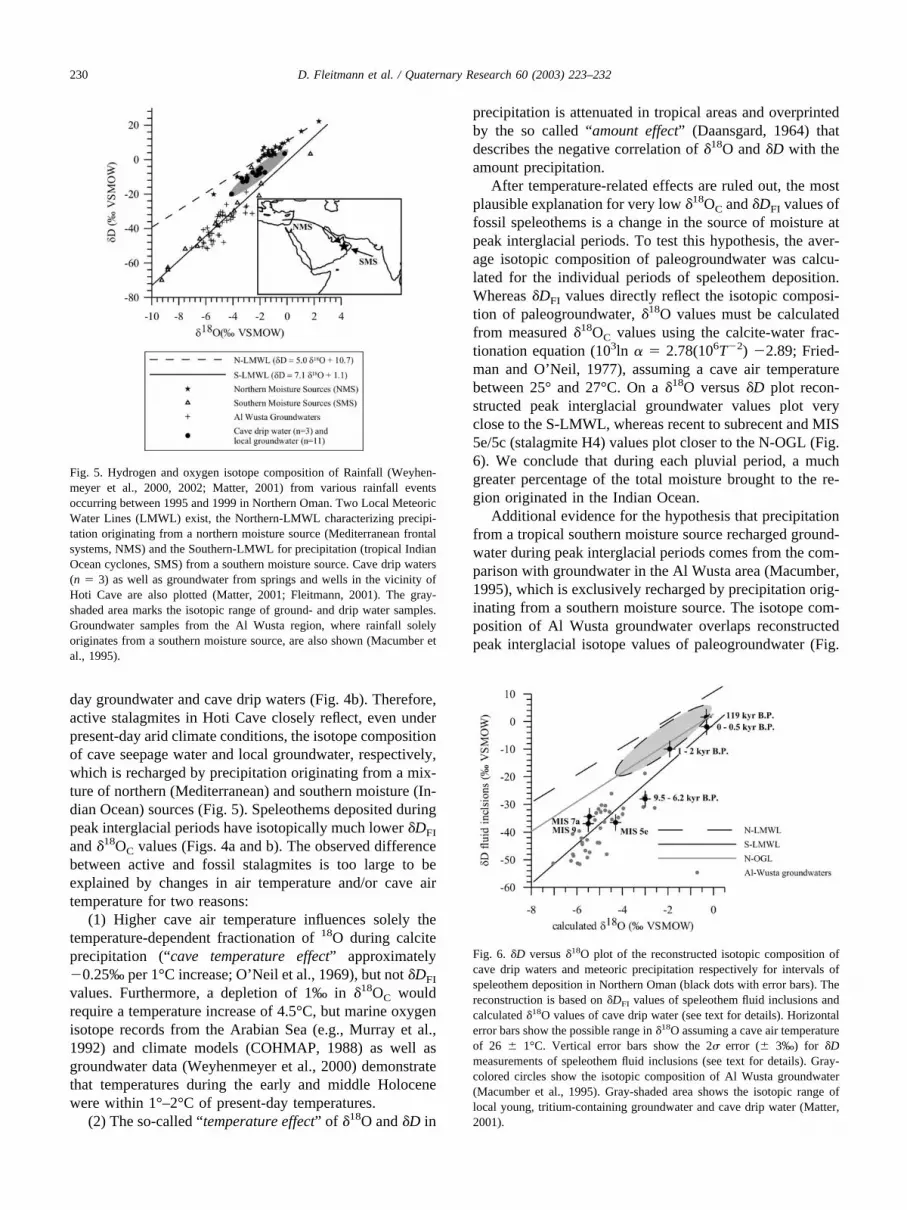
The present-day isotopic composition of precipitationand local groundwater as well as cave drip waters inNorthern Oman must be known before �DFI and �18OC
values of fossil speleothems can be interpreted. Althoughno long-term precipitation or cave drip-water isotoperecords exist in Northern Oman, a relatively large num-ber of isotope analyses of rainfall samples were carriedout in a number of previous studies (e.g., Gibb, 1976;Stanger, 1986; Clark, 1987; Macumber et al., 1995; Wey-henmeyer et al., 2000, 2002; Matter, 2001). Weyhen-meyer et al. (2000, 2002) showed that modern precipita-tion from northern moisture sources (Mediterraneanfrontal systems) and from southern moisture sources(Arabian Sea and Bay of Bengal) differ greatly in theirisotopic composition. As shown in Figure 5, precipitationfrom a northern moisture source ranges from �4.5 to�1.0‰ in �18O and from �25 to �5‰ in �D (Weyhen-meyer et al., 2000, 2002), whereas precipitation from asouthern source is much more depleted, with �18O valuesvarying from �10 to �2‰ and �D values from �75 to�15‰. Furthermore, the two sources of moisture defineseparate Local Meteoric Water Lines, a Northern LocalMeteoric Water Line (N-LMWL; �D � 5.0 �18O � 10.7)and a Southern Local Meteoric Water Line (S-LMWL;�D � 7.1 �18O � 1.1) (Weyhenmeyer et al., 2000, 2002).The isotopic compositions of young, tritium-containinggroundwater samples (n � 11) in the vicinity of HotiCave and cave drip water samples (n � 3) plot betweenboth local meteoric water lines, indicating that precipi-tation from both moisture sources recharges local
Fig. 3. Range of uranium-series dated stalagmites with associated age uncertainties (error bars) in Hoti Cave (see Table 1 for details). Gray-shaded areas markthe duration of growth. Speleothem growth in Hoti Cave occurred mainly during peak interglacial periods equivalent to the early to middle Holocene andmarine oxygen isotope stages (MIS) 5a, 5e, 7a, and 9. No speleothem growth occurred during the intervening periods. Flowstone age data marked with astar symbol are unreliable (see text for further details).
228 D. Fleitmann et al. / Quaternary Research 60 (2003) 223–232
groundwater (Weyhenmeyer, 2000, 2002; Matter, 2001;Fleitmann, 2001) (Fig. 5). Based on the stable isotopeanalysis of 191 groundwater samples, Weyhenmeyer etal. (2000) developed a Northern Oman Groundwater Line(N-OGL; �D � 5.3 �18O � 2.7) that plots between bothLocal Meteoric Water Lines. Finally, isotopic as well asgeochemical data reveal that local groundwater shows no,or only minor, signs of evaporation (Weyhenmeyer et al.,2002; Matter, 2001).
Isotopic composition of speleothems
�18OC values of actively growing stalagmites in Hoticave range from �2.6 to �1.1‰ (Fig. 4a) and, thus, arevery close to values expected for isotopic equilibrium dep-osition of speleothem calcite with its parent drip waterranging from �1.4 to �0.2‰ at measured cave air temper-atures of 25°–27°C. Also �DFI values of modern stalagmitesare within the measurement error of �D values of present-
Fig. 4. (a) Composite oxygen isotope record for Hoti Cave. Gray-shaded area marks the range of �18O values of present-day stalagmites. Samples H2 andH3 as well as the top of H12 are modern; all other ages are based on U/Th data (modified from Burns et al., 2000). Also shown is the SPECMAP (Imbrieet al., 1990) marine oxygen isotope curve and MIS numbers. Note that two U/Th ages (387,000 � 59,600 and 366,000 � 34,600 yr) with large ageuncertainties of stalagmite H13 are not displayed. (b) Composite hydrogen isotope record for Hoti Cave (including the results of duplicate samples, blackdots with error bars). The gray-shaded area marks the isotopic range of present-day groundwater and cave drip waters. Additionally shown is the hydrogenisotope composition of rainfall originating from a northern moisture source (black line rounded rectangle) and precipitation originating from a southernmoisture source (dashed rounded rectangle). Also shown is the SPECMAP marine oxygen isotope curve and marine oxygen isotope stage numbers (Imbrieet al., 1990).
229D. Fleitmann et al. / Quaternary Research 60 (2003) 223–232
day groundwater and cave drip waters (Fig. 4b). Therefore,active stalagmites in Hoti Cave closely reflect, even underpresent-day arid climate conditions, the isotope compositionof cave seepage water and local groundwater, respectively,which is recharged by precipitation originating from a mix-ture of northern (Mediterranean) and southern moisture (In-dian Ocean) sources (Fig. 5). Speleothems deposited duringpeak interglacial periods have isotopically much lower �DFI
and �18OC values (Figs. 4a and b). The observed differencebetween active and fossil stalagmites is too large to beexplained by changes in air temperature and/or cave airtemperature for two reasons:
(1) Higher cave air temperature influences solely thetemperature-dependent fractionation of 18O during calciteprecipitation (“cave temperature effect” approximately�0.25‰ per 1°C increase; O’Neil et al., 1969), but not �DFI
values. Furthermore, a depletion of 1‰ in �18OC wouldrequire a temperature increase of 4.5°C, but marine oxygenisotope records from the Arabian Sea (e.g., Murray et al.,1992) and climate models (COHMAP, 1988) as well asgroundwater data (Weyhenmeyer et al., 2000) demonstratethat temperatures during the early and middle Holocenewere within 1°–2°C of present-day temperatures.
(2) The so-called “temperature effect” of �18O and �D in
precipitation is attenuated in tropical areas and overprintedby the so called “amount effect” (Daansgard, 1964) thatdescribes the negative correlation of �18O and �D with theamount precipitation.
After temperature-related effects are ruled out, the mostplausible explanation for very low �18OC and �DFI values offossil speleothems is a change in the source of moisture atpeak interglacial periods. To test this hypothesis, the aver-age isotopic composition of paleogroundwater was calcu-lated for the individual periods of speleothem deposition.Whereas �DFI values directly reflect the isotopic composi-tion of paleogroundwater, �18O values must be calculatedfrom measured �18OC values using the calcite-water frac-tionation equation (103ln � � 2.78(106T�2) �2.89; Fried-man and O’Neil, 1977), assuming a cave air temperaturebetween 25° and 27°C. On a �18O versus �D plot recon-structed peak interglacial groundwater values plot veryclose to the S-LMWL, whereas recent to subrecent and MIS5e/5c (stalagmite H4) values plot closer to the N-OGL (Fig.6). We conclude that during each pluvial period, a muchgreater percentage of the total moisture brought to the re-gion originated in the Indian Ocean.
Additional evidence for the hypothesis that precipitationfrom a tropical southern moisture source recharged ground-water during peak interglacial periods comes from the com-parison with groundwater in the Al Wusta area (Macumber,1995), which is exclusively recharged by precipitation orig-inating from a southern moisture source. The isotope com-position of Al Wusta groundwater overlaps reconstructedpeak interglacial isotope values of paleogroundwater (Fig.
Fig. 6. �D versus �18O plot of the reconstructed isotopic composition ofcave drip waters and meteoric precipitation respectively for intervals ofspeleothem deposition in Northern Oman (black dots with error bars). Thereconstruction is based on �DFI values of speleothem fluid inclusions andcalculated �18O values of cave drip water (see text for details). Horizontalerror bars show the possible range in �18O assuming a cave air temperatureof 26 � 1°C. Vertical error bars show the 2� error (� 3‰) for �Dmeasurements of speleothem fluid inclusions (see text for details). Gray-colored circles show the isotopic composition of Al Wusta groundwater(Macumber et al., 1995). Gray-shaded area shows the isotopic range oflocal young, tritium-containing groundwater and cave drip water (Matter,2001).
Fig. 5. Hydrogen and oxygen isotope composition of Rainfall (Weyhen-meyer et al., 2000, 2002; Matter, 2001) from various rainfall eventsoccurring between 1995 and 1999 in Northern Oman. Two Local MeteoricWater Lines (LMWL) exist, the Northern-LMWL characterizing precipi-tation originating from a northern moisture source (Mediterranean frontalsystems, NMS) and the Southern-LMWL for precipitation (tropical IndianOcean cyclones, SMS) from a southern moisture source. Cave drip waters(n � 3) as well as groundwater from springs and wells in the vicinity ofHoti Cave are also plotted (Matter, 2001; Fleitmann, 2001). The gray-shaded area marks the isotopic range of ground- and drip water samples.Groundwater samples from the Al Wusta region, where rainfall solelyoriginates from a southern moisture source, are also shown (Macumber etal., 1995).
230 D. Fleitmann et al. / Quaternary Research 60 (2003) 223–232
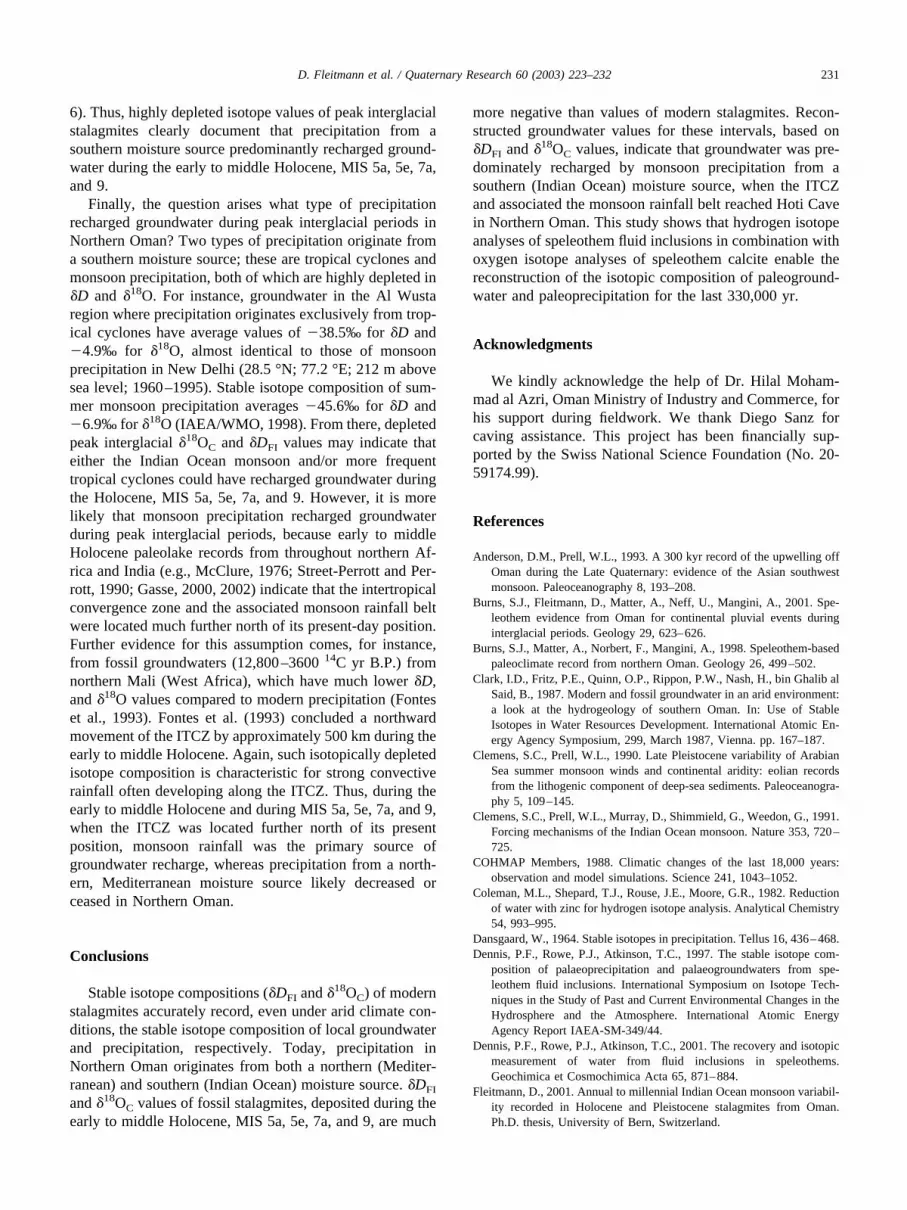
6). Thus, highly depleted isotope values of peak interglacialstalagmites clearly document that precipitation from asouthern moisture source predominantly recharged ground-water during the early to middle Holocene, MIS 5a, 5e, 7a,and 9.
Finally, the question arises what type of precipitationrecharged groundwater during peak interglacial periods inNorthern Oman? Two types of precipitation originate froma southern moisture source; these are tropical cyclones andmonsoon precipitation, both of which are highly depleted in�D and �18O. For instance, groundwater in the Al Wustaregion where precipitation originates exclusively from trop-ical cyclones have average values of �38.5‰ for �D and�4.9‰ for �18O, almost identical to those of monsoonprecipitation in New Delhi (28.5 °N; 77.2 °E; 212 m abovesea level; 1960–1995). Stable isotope composition of sum-mer monsoon precipitation averages �45.6‰ for �D and�6.9‰ for �18O (IAEA/WMO, 1998). From there, depletedpeak interglacial �18OC and �DFI values may indicate thateither the Indian Ocean monsoon and/or more frequenttropical cyclones could have recharged groundwater duringthe Holocene, MIS 5a, 5e, 7a, and 9. However, it is morelikely that monsoon precipitation recharged groundwaterduring peak interglacial periods, because early to middleHolocene paleolake records from throughout northern Af-rica and India (e.g., McClure, 1976; Street-Perrott and Per-rott, 1990; Gasse, 2000, 2002) indicate that the intertropicalconvergence zone and the associated monsoon rainfall beltwere located much further north of its present-day position.Further evidence for this assumption comes, for instance,from fossil groundwaters (12,800–3600 14C yr B.P.) fromnorthern Mali (West Africa), which have much lower �D,and �18O values compared to modern precipitation (Fonteset al., 1993). Fontes et al. (1993) concluded a northwardmovement of the ITCZ by approximately 500 km during theearly to middle Holocene. Again, such isotopically depletedisotope composition is characteristic for strong convectiverainfall often developing along the ITCZ. Thus, during theearly to middle Holocene and during MIS 5a, 5e, 7a, and 9,when the ITCZ was located further north of its presentposition, monsoon rainfall was the primary source ofgroundwater recharge, whereas precipitation from a north-ern, Mediterranean moisture source likely decreased orceased in Northern Oman.
Conclusions
Stable isotope compositions (�DFI and �18OC) of modernstalagmites accurately record, even under arid climate con-ditions, the stable isotope composition of local groundwaterand precipitation, respectively. Today, precipitation inNorthern Oman originates from both a northern (Mediter-ranean) and southern (Indian Ocean) moisture source. �DFI
and �18OC values of fossil stalagmites, deposited during theearly to middle Holocene, MIS 5a, 5e, 7a, and 9, are much
more negative than values of modern stalagmites. Recon-structed groundwater values for these intervals, based on�DFI and �18OC values, indicate that groundwater was pre-dominately recharged by monsoon precipitation from asouthern (Indian Ocean) moisture source, when the ITCZand associated the monsoon rainfall belt reached Hoti Cavein Northern Oman. This study shows that hydrogen isotopeanalyses of speleothem fluid inclusions in combination withoxygen isotope analyses of speleothem calcite enable thereconstruction of the isotopic composition of paleoground-water and paleoprecipitation for the last 330,000 yr.
Acknowledgments
We kindly acknowledge the help of Dr. Hilal Moham-mad al Azri, Oman Ministry of Industry and Commerce, forhis support during fieldwork. We thank Diego Sanz forcaving assistance. This project has been financially sup-ported by the Swiss National Science Foundation (No. 20-59174.99).
References
Anderson, D.M., Prell, W.L., 1993. A 300 kyr record of the upwelling offOman during the Late Quaternary: evidence of the Asian southwestmonsoon. Paleoceanography 8, 193–208.
Burns, S.J., Fleitmann, D., Matter, A., Neff, U., Mangini, A., 2001. Spe-leothem evidence from Oman for continental pluvial events duringinterglacial periods. Geology 29, 623–626.
Burns, S.J., Matter, A., Norbert, F., Mangini, A., 1998. Speleothem-basedpaleoclimate record from northern Oman. Geology 26, 499–502.
Clark, I.D., Fritz, P.E., Quinn, O.P., Rippon, P.W., Nash, H., bin Ghalib alSaid, B., 1987. Modern and fossil groundwater in an arid environment:a look at the hydrogeology of southern Oman. In: Use of StableIsotopes in Water Resources Development. International Atomic En-ergy Agency Symposium, 299, March 1987, Vienna. pp. 167–187.
Clemens, S.C., Prell, W.L., 1990. Late Pleistocene variability of ArabianSea summer monsoon winds and continental aridity: eolian recordsfrom the lithogenic component of deep-sea sediments. Paleoceanogra-phy 5, 109–145.
Clemens, S.C., Prell, W.L., Murray, D., Shimmield, G., Weedon, G., 1991.Forcing mechanisms of the Indian Ocean monsoon. Nature 353, 720–725.
COHMAP Members, 1988. Climatic changes of the last 18,000 years:observation and model simulations. Science 241, 1043–1052.
Coleman, M.L., Shepard, T.J., Rouse, J.E., Moore, G.R., 1982. Reductionof water with zinc for hydrogen isotope analysis. Analytical Chemistry54, 993–995.
Dansgaard, W., 1964. Stable isotopes in precipitation. Tellus 16, 436–468.Dennis, P.F., Rowe, P.J., Atkinson, T.C., 1997. The stable isotope com-
position of palaeoprecipitation and palaeogroundwaters from spe-leothem fluid inclusions. International Symposium on Isotope Tech-niques in the Study of Past and Current Environmental Changes in theHydrosphere and the Atmosphere. International Atomic EnergyAgency Report IAEA-SM-349/44.
Dennis, P.F., Rowe, P.J., Atkinson, T.C., 2001. The recovery and isotopicmeasurement of water from fluid inclusions in speleothems.Geochimica et Cosmochimica Acta 65, 871–884.
Fleitmann, D., 2001. Annual to millennial Indian Ocean monsoon variabil-ity recorded in Holocene and Pleistocene stalagmites from Oman.Ph.D. thesis, University of Bern, Switzerland.
231D. Fleitmann et al. / Quaternary Research 60 (2003) 223–232
Fleitmann, D., Burns, S.J., Matter, A., 1999. Stable isotope study of theactive water-carbonate system in caves in Oman: a test of applicabilityto paleoclimate studies. Eos Trans. AGU, 80, Fall Meet. Suppl., Ab-stract OS22B-12.
Fontes, J.-C., Gasse, F., Andrews, J.N., 1993. Climatic conditions ofHolocene groundwater recharge in the Sahel zone of Africa in: IsotopeTechniques in the Study of Past and Current Environmental Changes inthe Hydrosphere and the Atmosphere, IAEA-SM-329/59, pp. 231–248.
Frank, N., Braun, M., Hambach, U., Mangini, A., Wagner, G., 2000. Warmperiod growth of travertine during the last interglaciation in southernGermany. Quaternary Research 54, 38–48.
Friedman, I., O’Neil, J.R., 1977. Compilation of stable isotope fraction-ation factors of geochemical interest. In Data of Geochemistry, sixthedition, United States Geological Survey, Washington DC, ChapterKK, Professional Paper 440-KK.
Gasse, F., 2000. Hydrological changes in the African tropics since the LastGlacial Maximum. Quaternary Science Reviews 19, 189–213.
Gasse, F., 2002. Diatom-inferred salinity and carbonate oxygen isotopes inHolocene waterbodies of the western Sahara and Sahel (Africa). Qua-ternary Science Reviews 21, 737–767.
Gibb, Sir A., Partners 1976. Water resources survey of northern Oman.Internal Report, Ministry of Water Resources, Sultanate of Oman.
Harmon, R.S., Schwarcz, H.P., O’Neil, J.R., 1979. D/H ratios in spe-leothem fluid inclusions: a guide to variations in the isotopic compo-sition of meteoric precipitation. Earth and Planetary Science Letters 42,254–266.
Hastenrath, S., 1985. Climate and Circulation of the Tropics. Reidel,Boston.
IAEA/WMO 1998. Global Network for Isotopes in Precipitation. TheGNIP Database. Release 3, October 1999. URL: http://www.iaea.org/programs/ri/gnip/gnipmain.htm.
Imbrie, J., et al. 1990. SPECMAP Archive 1. IGB.P. PAGES/World DataCenter-A for Paleoclimatology Data Contribution Series 90–001.NOAA/NGDC Paleoclimatology Program, Boulder, CO.
Ivanovich, M., Harmon, R.S., 1993. Uranium Series Disequilibrium: Ap-plications to Environmental Problems. Clarendon, Oxford.
Kendall, A.C., Broughton, P.L., 1978. Origin of Fabrics in Speleothemscomposed of columnar calcite crystals. Journal of Sedimentary Petrol-ogy 48, 519–538.
Macumber, P.G., Barghash bin Ghalib Al-Said, Kew, G.A., and Tenna-konn, T.B. 1995. Hydrogeologic implications of a cyclonic rainfallevent in central Oman. In: Groundwater Quality, Nash, H., McCall,G.J.H., (Eds.). Chapman & Hall, London, pp. 87–97.
Matter, J.M., 2001. Geochemical evolution and hydrodynamics of ground-water in the Alluvial aquifer of the Dakhiliya area, Sultanate of Oman.Ph.D. thesis, ETH-Zurich, Switzerland.
Matthews, A., Ayalon, A., Bar-Matthews, M., 2000. D/H ratios of fluidinclusions of Soreq cave (Israel) speleothems as a guide to the Eastern
Mediterranean Meteoric Line relationships in the last 120 ky. ChemicalGeology 166, 183–191.
McClure, H.A., 1976. Radiocarbon chronology of late Quaternary lakes inthe Arabian Desert. Nature 263, 755–756.
Murray, D.W., Prell, W.L., 1992. Late Pliocene and Pleistocene climaticoscillations and monsoon upwelling recorded in sediments from theOwen Ridge, northwestern Arabia Sea.. In Summerhayes, C.P., et al.(Eds.), “Upwelling Systems: Evolution since the Early Miocene.” Geo-logical Society, [London], pp. 301–321 Special Publication 64.
Neff, U., Burns, S.J., Mangini, A., Mudelsee, M., Fleitmann, D., Matter,A., 2001. Evidence for solar forcing of the Indian Monsoon in ahigh-resolution speleothem record from Oman. Nature 411, 290–293.
O’Neil, J.R., Clayton, R.N., Mayeda, T.K., 1969. Oxygen isotope fraction-ation in divalent metal carbonates. Journal Chemical Physics 51, 5547–5558.
Pedgely, D.E., 1989. Cyclones along the Arabian coast. Weather 24,456–486.
Preusser, F., Radies, D., Matter, A., 2002. A 160 ka record of dunedevelopment and atmospheric circulation in Southern Arabia. Science296, 2018–2020.
Schwarcz, H.P., Harmon, R.S., Thompson, P., Ford, D.C., 1976. Stableisotope studies of fluid inclusions in speleothems and their paleocli-matic significance. Geochimica et Cosmochimica Acta 40, 657–665.
Stanger, G., 1986. The hydrogeology of the Oman Mountains. Ph.D. thesis,Open University, UK.
Street-Perrott, F.A., Perrott, R.A., 1990. Abrupt climate fluctuations in thetropics: the influence of Atlantic circulation. Nature 343, 607–612.
Szabo, B.J., Haynes Jr., C.V., Maxwell, T.A., 1995. Ages of Quaternarypluvial episodes determined by uranium-series and radiocarbon datingof lacustrine deposits of Eastern Sahara. Palaeogeography, Paleoclima-tology, Palaeoecology 113, 227–242.
Van Campo, E., Duplessy, J.C., Rossignol-Strick, M., 1982. Climaticconditions deduced from a 150-kyr oxygen isotope-pollen record fromthe Arabian Sea. Nature 296, 56–59.
Weyhenmeyer, C.E., Burns, S.J., Waber, H.N., Aeschbach-Hertig, W.,Kipfer, R., Beyerle, R., Loosli, H., Matter, A., 2000. Cool glacialtemperatures recorded by noble gases in a groundwater study fromNorthern Oman. Science 287, 842–845.
Weyhenmeyer, C.E., Burns, S.J., Waber, H.N., Macumber, P.G., Matter,A., 2002. Isotope study of moisture sources, recharge areas and ground-water flowpaths within the Eastern Batinah coastal plain, Sultanate ofOman. Water Resources Research 38, 1184 doi: 10.1029/2000WR000149,2002.
Yonge, C.J., 1982. Stable isotope studies of water extracted from spe-leothems. Ph.D. thesis, McMaster University, Canada.
Yonge, C.J., Ford, D.C., Gray, J., Schwarcz, H.P., 1985. Stable isotopestudies of seepage water. Chemical Geology 58, 97–105.
232 D. Fleitmann et al. / Quaternary Research 60 (2003) 223–232