Phenol and Heavy Metal Tolerance Among Petroleum Refinery Effluent Bacteria
Upload
khangminh22Category
view
2download
0
Changes of heavy metal concentrations in Shitalakhya
river water of Bangladesh with seasons
Md. Humayun Kabir1, Md. Sirajul Islam1*, Tanmoy Roy Tusher1, Md. Enamul Hoq2, Muliadi
3 and Shamim Al Mamun
1
1Department of Environmental Science and Resource Management, Mawlana Bhashani Science and Technology University, Tangail-1902, Bangladesh
2Bangladesh Fisheries Research Institute, Freshwater Station, Mymensingh-2201, Bangladesh 3Department of Chemistry, Universitas Khairun, Ternate, Maluku Utara, Indonesia
*Correspondence: E-mail: [email protected]
A B S T R A C T A R T I C L E I N F O
Heavy metal concentrations in water and fish of the
Shitalakhya river was measured to find out the suitability of
its water for drinking and irrigation purposes. The
concentrations of Pb, Cu, Cr, Zn, Cd and Hg in water were
0.0065; 0.0240; 0.0069; 0.8170; 0.0044; and 0.0057 mg/L,
respectively in pre-monsoon, 0.0029; 0.0151; 0.0019;
0.4270; 0.0015; and 0.0020 mg/L, respectively in monsoon,
and 0.0040; 0.0212; 0.0039; 0.6520; 0.0029; and 0.0031
mg/L, respectively in post-monsoon season. The heavy
metal concentrations were found higher in pre-monsoon
followed by post-monsoon and monsoon. The results also
depicted that over the three seasons heavy metal pollution
index and heavy metal evaluation index for all metals were
lower than the critical pollution index value and low heavy
metal contamination, respectively, and the degree of
contamination in pre-monsoon season stated medium level
pollution, followed by post-monsoon and monsoon season.
The concentrations of Pb, Cu, and Cr in fish were found less
than the lower detection limit, while the Zn were found
25.42; 18.30; and 29.34 mg/kg during the pre-monsoon,
monsoon and post-monsoon, respectively. The study
concluded that the Shitalakhya river water was not safe for
the aquatic environment, especially for aquatic biota. © 2020 Tim Pengembang Jurnal UPI
Article History: Received 2 Aug 2019 Revised 23 Sep 2019 Accepted 01 Oct 2019 Available online 30 May 2020
____________________ Keywords: Heavy metal; Water; Fish; Aquatic environment; Pollution index; Shitalakhya river.
Indonesian Journal of Science & Technology
Journal homepage: http://ejournal.upi.edu/index.php/ijost/
Indonesian Journal of Science & Technology 5 (3) (2020) 395-409
Humayun Kabir, et al., Changes of heavy metal concentrations in Shitalakhya river…| 396
1. INTRODUCTION Pollution of heavy metals in the aquatic
environment is now a serious attention for human civilization because currently, it has reached an alarming rate (Mahfuza et al., 2012). These metals mostly raise from human activities like draining of sewerage, industrial waste and effluents, dumping of hospital wastes, municipal waste and recreational operations (Alam et al., 2007; Malik et al., 2010), conversely, metals are also occur in trace amounts naturally and may reached into aquatic ecosystem through leaching of rocks, airborne dust, forest fires and vegetation (Ishaq et al., 2011). As heavy metals are highly persistent and have potential to be toxic to living organisms, incessantly being deposited and incorporated in water, causing heavy metal pollution in the aquatic ecosystem (Fernandes et al., 2008; Ebrahimpour & Mushrifah, 2008; Storelli et al., 2005). The availability of heavy metals in water may have an intense effect on the micro algae which forge the main food source for mollusks in all their growth stages, zooplankton and for larval stages of some crustacean and fish species (Seshan et al., 2010). Moreover, bio-accumulation, as well as bio-magnification, could lead to high toxicity in organisms, even when the exposure level is low and under such position, the toxicity of a moderately toxic metal could be enhanced by synergism and fish population may decline (Haque et al., 2004). Apart from destabilizing the aquatic ecosystem, the bio-accumulation of these toxic metals in the aquatic food web is an impendence to public health and thus their potential large scale effects on ecosystem integrality cannot be disregarded (Rashid et al., 2012).
The river is very important for aquatic species especially for fish and also plays a significant role in assimilating or carrying off industrial and municipal effluents, residential waste water and runoff from
agricultural fields which are accountable for river pollution (Alam 2003; Reza & Singh, 2010; Subramanian, 2004). Due to the swift population growth, unplanned urbanization, profound agricultural and industrial production, some rivers and water bodies has reached terrible levels in Bangladesh (Ghafoor et al., 2004). Pollution of the fresh aquatic ecosystem, especially the rivers are no longer within safe limits for human dealings and this can be measured through the heavy metal analysis in water and fishes (Haque et al., 2007). The environments of Bangladesh are particularly influenced by its regional and seasonal emergence and quality of water (MacFarlane & Burchett, 2000). In modern times Bangladesh holds 1176 industries that release almost 0.4 million m3 of untreated waste water and effluents into the rivers per day (Rabbani & Sharif, 2005). Among the environmental pollutants, metals are of special concern due to their dynamic toxic effect and ability to bio-accumulation in fishes (Censi et al., 2006; Lohani et al., 2008). Discharge of waste water into a water body could reduce the biological oxygen demand (BOD) to such a massive scale that the entire oxygen may be shifted and this would cause the death of all aerobic groups along with fishes (Bhuiyan et al., 2011).
The Narsingdi town is one of the most vital industrial zones of the country and the Shitalakhya river flows through this town, various types of industries have been established on the bank of the river and most of these industries directly or indirectly discharging a huge quantities of wastes and effluents into the river without any treatment, and also municipal and domestic waste water from Narsingdi urban area, find their way untreated into this river (Mottalib et al., 2016; Islam et al., 2014). A significant volume of industrial raw materials for production and processed products are also transported through this river continuously by ships and other water vehicles (Islam et
p- ISSN 2528-1410 | DOI: https://doi.org/10.17509/ijost.v5i3.25007 | e- ISSN 2527-8045
397 | Indonesian Journal of Science & Technology, Volume 5 Issue 3, December 2020 Hal 395-409
al., 2008). Therefore, the risks of aquatic pollution impact are rising upwards sequentially (Mokaddes et al., 2013). Thus, the present study was an attempt to assessing the present heavy metals pollution condition of the Shitalakhya river. The objectives of the study were as: (i) to investigate the heavy metal concentrations in water of the Shitalakhya river using pollution indices, and (ii) to assess the level of heavy metals contaminations in fish (Notopterus notopterus) of the Shitalakhya river.
2. MATERIALS AND METHODS 2.1. Study area
The study area was located in the
Shitalakhya river at Narsingdi district of
Bangladesh approximately within the
latitude between 23°55’36” to 23°91’92” N
and longitude between 90°43’54” to
90°71’76” E. The river flows through Gazipur
district forming its border with Narsingdi for
some distance and then through
Narayanganj district and one the most
prominent distributary of the Old
Brahmaputra river in the flood plain region
of Bangladesh (Ahmed et al., 2010). The
river is very much alive during the monsoon
and carries the major discharge of the Old
Brahmaputra river on its way down. The
river is about 110.0 km long and widest 0.3
km across and remains navigable year
round. The river's maximum depth is 21 m
and the average depth is 10 m (Haque,
2008).
2.2. Sampling stations
Water samples were collected from five
sampling stations namely as Saorait Bazar
(St-1), Ghorashal Fertilizer Company (St-2),
Jamalpur Bazar (St-3), Ghorashal Ferighat
(St-4) and Fuleshawri Bazar (St-5), whereas
fish samples were collected from only St-1,
St-3 and St-5 stations along the Shitalakhya
river of Bangladesh. Stations were selected
depending upon the presumed water quality
and extent of pollution by prior visiting the
study area. St-1 (upstream) located at the 1
km upstream of the Ghorashal Fertilizer
Company Limited, where agricultural runoff,
animal manure and waste water from
municipal drains were the main source of
pollution. St-2 (upstream) situated just
besides the fertilizer company. Waste water
from this industry was the main pollution
source at this station. St-3 (upstream) was
dominated by cement, textile, pesticide, and
fertilizer factory and food beverage
industrial park. Heavy metal containing
waste water from plant discharge and waste
water drains that collect mixed domestic,
municipal and industrial waste water were
the major pollution source in St-2. St-4
(downstream) situated just near the
Ghorashal Bridge and Railway Bridge. Waste
water from township, cement, fertilizer and
plastic industries were the significant source
of pollution at tis station. St-5 (downstream)
was severely dominated by large scale
industries such as, paper and pulp industry,
plastic industrial park, cement factory,
pesticide and fertilizer factory and textile
industry. Ghorashal Railway Bridge and ferry
Ghat were 1 km upstream near the St-5.
Waste water drains that collect plant
discharge, municipal, industrial and
agricultural runoff were the most
significance sources of pollution in St-5.
2.3. Sample collection
Water samples were collected from 5
sampling stations during the period from
March to November 2015, where pre-
monsoon (March to April), monsoon (July to
August) and post-monsoon (October to
November), respectively. On the other hand,
fish samples were collected at four months
interval i.e. in April, August and December
2015, and these three months were
p- ISSN 2528-1410 | DOI: https://doi.org/10.17509/ijost.v5i3.25007 | e- ISSN 2527-8045
Humayun Kabir, et al., Changes of heavy metal concentrations in Shitalakhya river…| 398
considered as pre-monsoon, monsoon and
post-monsoon season, respectively. To
analyze the water quality, 500 mL water was
collected by plastic bottles with double
stoppers from each sampling points. Before
sampling, the bottle was cleaned and
washed with the detergent solution and
treated with 5% nitric acid (HNO3) over
night. The bottles were finally rinsed with
deionized water and dried. At each sampling
station, the sampling bottles were rinsed at
least three times before sampling was done.
Pre-prepared sampling bottles were
immersed about 10 cm below the surface
water (Tareq et al., 2013). After sampling,
the bottles were screwed carefully and
marked with the respective identification
number. Then the samples were acidified
with 10% nitric acid (HNO3), were placed in
an ice bath and were brought to the
laboratory. The samples were filtered
through 0.45 µm micro pore membrane
filter and were kept in freeze at 4°C to avoid
further contamination until analysis. The
200gm fish samples were collected from
each sampling stations for analysis and
brought to the laboratory with ice box and
kept at freeze for preservation (Ahmad et
al., 2010).
2.4. Sample analysis
For water sample, at first 50 mL water
sample was taken in a beaker by using a
pipette. The 2 mL of concentrated HNO3 was
added in the water sample and then for
digestion, the beaker was put in the hot-
plate. After proper digestion, the sample
was taken in a 50 mL of volumetric flask and
filled with distilled water up to the limit.
Then through a filter paper, it was filtered
and preserved in a beaker and this process
was followed for every water samples. The
concentrations of Pb, Cu, Cr, Cd, Zn and Hg
in water samples were analyzed by atomic
absorption spectrophotometer (AAS-Model:
AA-7000, Shimadzu, Japan) following the
procedure in the laboratory of the Soil
Science, Bangladesh Institute of Nuclear
Agriculture (BINA), Mymensingh-2201,
Bangladesh. The fish samples were at freeze
until analysis, and a bit of muscle, the whole
liver and two-gill arches from each fish were
removed before analysis, and only tissues
from each fish were weighed and dried. A
microwave digestion against the first-rate
method is the concise time, lower
consumption of acid and keeping the
volatile mixture in the solution (Karadedea
et al., 2004). After digestion, the residues
diluted to 25 mL with 2.5% of HNO3.
Instrument calibrated standard solutions
were prepared from mercantile ingredients
accordingly manufacturers instruction
(Hassan et al., 2015). The metal analyses of
samples (Cr, Cu, Pb, and Zn) were carried
out by using UNICAM-929 atomic absorption
spectrophotometer (AAS) in the Food
Laboratory of Central Laboratory of Societe
de Surveillance (SGS), Bangladesh Limited,
Dhaka. The fish species were analyzed by
AOAC 19th Edition, 2012 BY ICP-OES, where
the lower detection limit was 0.05 ppm.
2.5 Heavy metal indexing approach for
water
Pollution indices are applied to explore
the pollution status of water, in this study,
three well-documented methods such as
heavy metal pollution index (HPI) stated by
Prasad and Bose (2001), heavy metal
evaluation index (HEI) stated by Edet and
Offiong (2002), and degree of contamination
(CD) stated by Brraich and Jangu (2015)
were weighted. These indices are often used
to investigate the quality of water for
drinking as well as irrigation purposes and
describe an overall water quality status in
relation to heavy metals.
p- ISSN 2528-1410 | DOI: https://doi.org/10.17509/ijost.v5i3.25007 | e- ISSN 2527-8045
399 | Indonesian Journal of Science & Technology, Volume 5 Issue 3, December 2020 Hal 395-409
For calculating the HPI, Prasad and Bose
(2001) considered unit weightage ( ) as a
value inversely proportional to the
recommended standard ( ) of the
corresponding parameter as proposed by
Reddy (1995).
The HPI model (Mohan et al., 1996) is
given by:
∑
∑
Where is the sub-index of the ith
parameter. is is the unit weightage of the
ith parameter and n is the number of
parameters considered. The sub-index ( )
of the parameter is calculated by:
∑* ( ) +
( )
where is is the monitored value of heavy
metal of ith parameter and the sign (−)
indicates numerical difference of the two
values, ignoring the algebraic sign. In
computing the HPI for the present study, Pb,
Cu, Zn, and Cd were used. The weightage
( ) was taken as the inverse of MAC, the
WHO standard for drinking water in ppb
and the guide value for the chosen
element in ppb, and MAC the maximum
admissible concentration/upper permissible.
Heavy metal evaluation index (HEI)
method gives an overall quality of the water
with respect to heavy metals (Edet &
Offiong, 2002) and is computed as:
∑
where is is the monitored value of the ith
parameter and is the maximum
admissible concentration of the ith
parameter.
The contamination index (CD)
summarizes the combined effects of several
quality parameters considered harmful to
domestic water (Backman et al., 1998) and
the contamination index is calculated from
equation below
∑
Where , , and represent the
contamination factor, the analytical value,
and the upper permissible concentration of
the ith component, respectively.
2.6. Statistical analysis
The collected data were compiled and
tabulated in proper form and were
subjected to statistical analysis. The MS
office excel 2010 and IBM statistics 20.0
software were used to analyze the collected
data. The findings of the study were
presented as charts and tabular forms.
3. RESULTS AND DISCUSSION 3.1 Heavy metal contamination in water
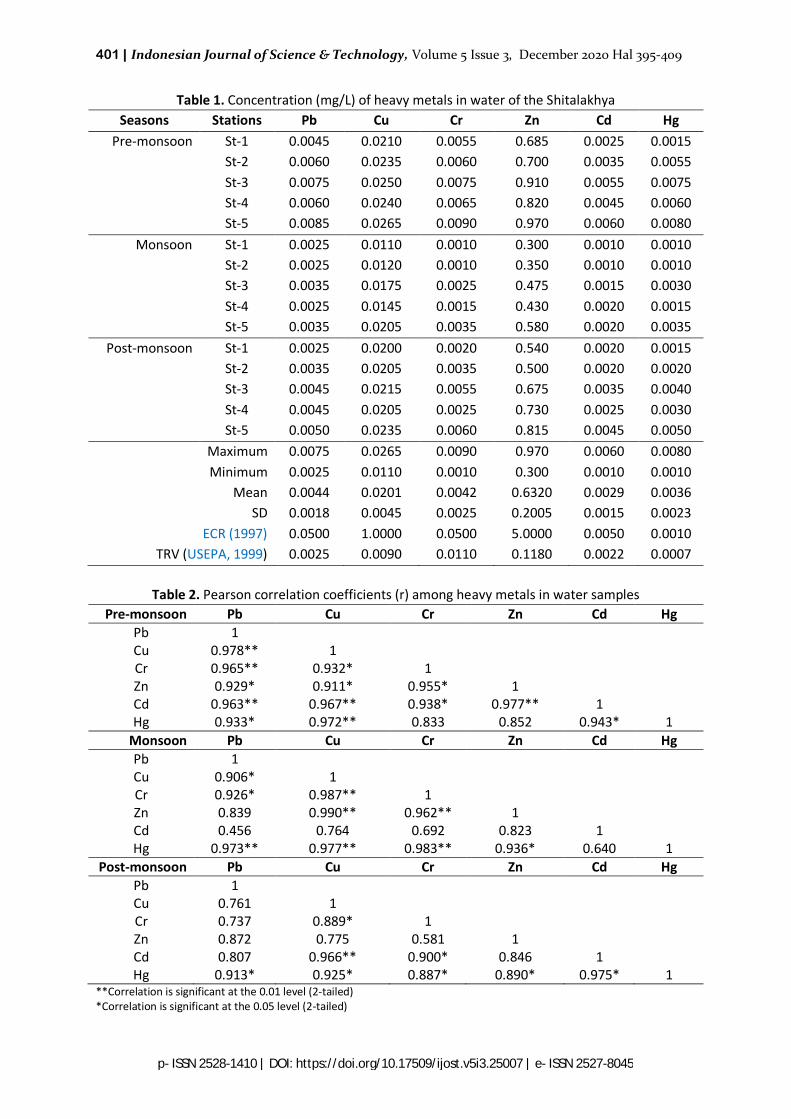
The mean concentration of Pb, Cu, Cr,
Zn, Cd, and Hg in water were found 0.0065;
0.0240; 0.0069; 0.8170; 0.0044; and 0.0057
mg/L, respectively in pre-monsoon, 0.0029;
0.0151; 0.0019; 0.4270; 0.0015; and 0.0020
mg/L, respectively in monsoon, and 0.0040,
0.0212; 0.0039; 0.6520; 0.0029; and 0.0031
mg/L, respectively in post-monsoon season.
The concentration of investigated heavy
metals was found higher in pre-monsoon
followed by post-monsoon and monsoon,
due to the presence of higher level of
pollutants into the river water with the lack
of heavy rainfall for dilution of pollutants
(Ahmad et al., 2010). Moreover, the mean
concentrations were observed in decreasing
order of Zn > Cu > Pb > Cr > Hg > Cd whereas
all the studied heavy metals concentrations
were found lower than the standard level
p- ISSN 2528-1410 | DOI: https://doi.org/10.17509/ijost.v5i3.25007 | e- ISSN 2527-8045
Humayun Kabir, et al., Changes of heavy metal concentrations in Shitalakhya river…| 400
reported by Environment Conservation
Rules (ECR, 1997) except Hg (Table 1). The
highest Hg (0.0080 mg/L) in water was
found at St-5 during the pre-monsoon
season, might be presence of electroplating,
fertilizer, paper and pulp, plastic and cement
industry in the bank of the river which
discharged a large amount of waste water
into the river water (Mottalib et al., 2016).
The Hg concentrations in Turag river water
was greatly exceeded the standard level of
the surface water quality (Zakir et al., 2006),
which is similar to the present study. The
study found that concentration of heavy
metals was varied from stations to stations
and found in order of St-5 > St-3 > St-4 > St-2
> St-1, this might be due to river water flow,
locations of industries, municipal and
commercial drainage system and
agricultural runoff (Hassan et al., 2015). The
level of Pb, Cd, and Zn of the Turag river
water were found 0.0021, 0.0136 and
0.0191 mg/L, respectively (Mokaddes et al.,
2013), almost similar to the present study.
The mean concentrations of heavy metal
found in the Buriganga river water were
observed Pb (0.0654 mg/L), Cu (0.1630
mg/L), Cr (0.5872 mg/L) and Cd (0.0093
mg/L) (Ahmad et al., 2010) reported higher
concentrations of heavy metals than the
present study. In relation to, the Toxicity
Reference Value (TRV) proposed by USEPA
(1999) for fresh water, the concentration of
Pb, Cu, Zn, Cd, and Hg in water were
exceeded the TRV value in great extent
whereas Cr found lower than the TRV value
(Table 1).
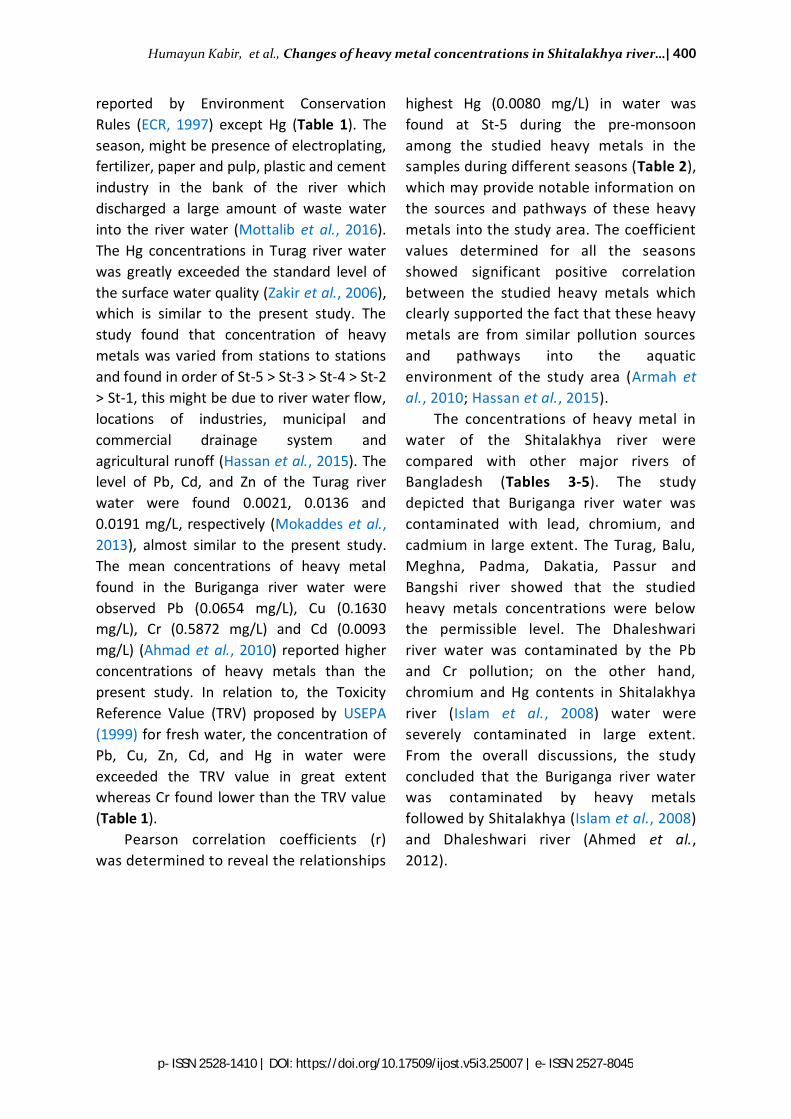
Pearson correlation coefficients (r)
was determined to reveal the relationships
among the studied heavy metals in the
samples during different seasons (Table 2),
which may provide notable information on
the sources and pathways of these heavy
metals into the study area. The coefficient
values determined for all the seasons
showed significant positive correlation
between the studied heavy metals which
clearly supported the fact that these heavy
metals are from similar pollution sources
and pathways into the aquatic
environment of the study area (Armah et
al., 2010; Hassan et al., 2015).
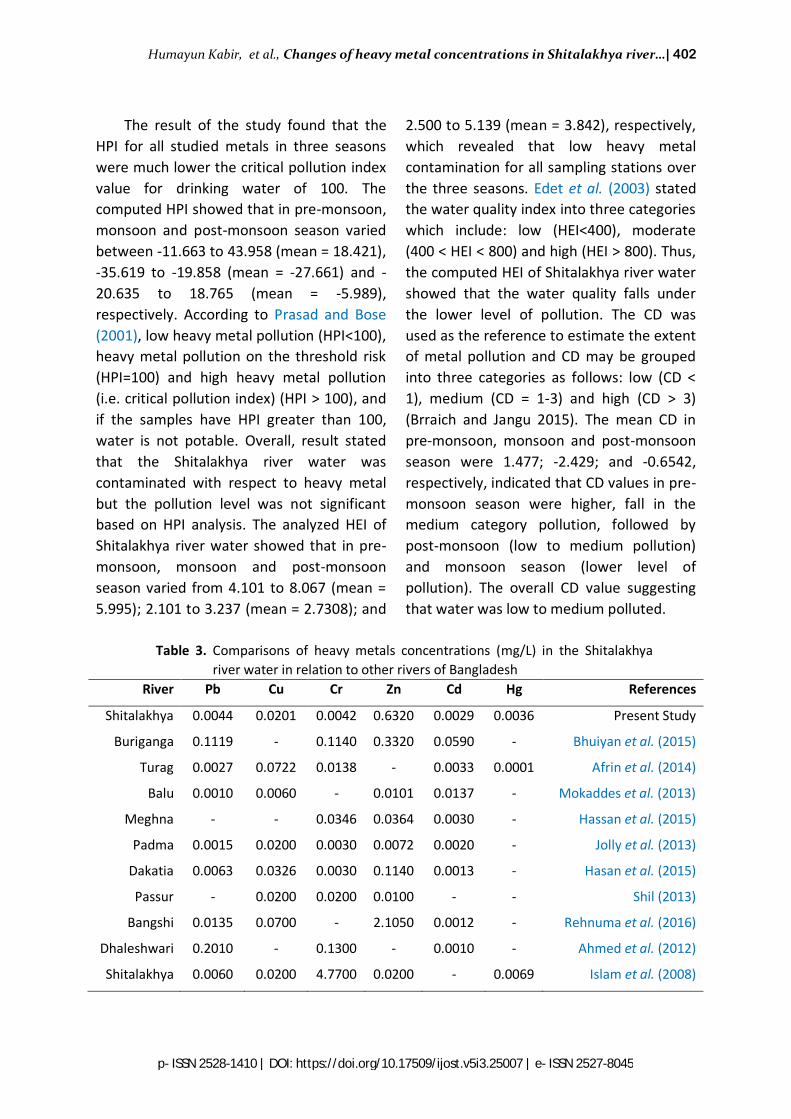
The concentrations of heavy metal in
water of the Shitalakhya river were
compared with other major rivers of
Bangladesh (Tables 3-5). The study
depicted that Buriganga river water was
contaminated with lead, chromium, and
cadmium in large extent. The Turag, Balu,
Meghna, Padma, Dakatia, Passur and
Bangshi river showed that the studied
heavy metals concentrations were below
the permissible level. The Dhaleshwari
river water was contaminated by the Pb
and Cr pollution; on the other hand,
chromium and Hg contents in Shitalakhya
river (Islam et al., 2008) water were
severely contaminated in large extent.
From the overall discussions, the study
concluded that the Buriganga river water
was contaminated by heavy metals
followed by Shitalakhya (Islam et al., 2008)
and Dhaleshwari river (Ahmed et al.,
2012).
p- ISSN 2528-1410 | DOI: https://doi.org/10.17509/ijost.v5i3.25007 | e- ISSN 2527-8045
401 | Indonesian Journal of Science & Technology, Volume 5 Issue 3, December 2020 Hal 395-409
Table 1. Concentration (mg/L) of heavy metals in water of the Shitalakhya
Seasons Stations Pb Cu Cr Zn Cd Hg
Pre-monsoon
St-1 0.0045 0.0210 0.0055 0.685 0.0025 0.0015
St-2 0.0060 0.0235 0.0060 0.700 0.0035 0.0055
St-3 0.0075 0.0250 0.0075 0.910 0.0055 0.0075
St-4 0.0060 0.0240 0.0065 0.820 0.0045 0.0060
St-5 0.0085 0.0265 0.0090 0.970 0.0060 0.0080
Monsoon St-1 0.0025 0.0110 0.0010 0.300 0.0010 0.0010
St-2 0.0025 0.0120 0.0010 0.350 0.0010 0.0010
St-3 0.0035 0.0175 0.0025 0.475 0.0015 0.0030
St-4 0.0025 0.0145 0.0015 0.430 0.0020 0.0015
St-5 0.0035 0.0205 0.0035 0.580 0.0020 0.0035
Post-monsoon St-1 0.0025 0.0200 0.0020 0.540 0.0020 0.0015
St-2 0.0035 0.0205 0.0035 0.500 0.0020 0.0020
St-3 0.0045 0.0215 0.0055 0.675 0.0035 0.0040
St-4 0.0045 0.0205 0.0025 0.730 0.0025 0.0030
St-5 0.0050 0.0235 0.0060 0.815 0.0045 0.0050
Maximum 0.0075 0.0265 0.0090 0.970 0.0060 0.0080
Minimum 0.0025 0.0110 0.0010 0.300 0.0010 0.0010
Mean 0.0044 0.0201 0.0042 0.6320 0.0029 0.0036
SD 0.0018 0.0045 0.0025 0.2005 0.0015 0.0023
ECR (1997) 0.0500 1.0000 0.0500 5.0000 0.0050 0.0010
TRV (USEPA, 1999) 0.0025 0.0090 0.0110 0.1180 0.0022 0.0007
Table 2. Pearson correlation coefficients (r) among heavy metals in water samples
Pre-monsoon Pb Cu Cr Zn Cd Hg
Pb 1 Cu 0.978** 1 Cr 0.965** 0.932* 1 Zn 0.929* 0.911* 0.955* 1 Cd 0.963** 0.967** 0.938* 0.977** 1 Hg 0.933* 0.972** 0.833 0.852 0.943* 1
Monsoon Pb Cu Cr Zn Cd Hg
Pb 1 Cu 0.906* 1 Cr 0.926* 0.987** 1 Zn 0.839 0.990** 0.962** 1 Cd 0.456 0.764 0.692 0.823 1 Hg 0.973** 0.977** 0.983** 0.936* 0.640 1
Post-monsoon Pb Cu Cr Zn Cd Hg
Pb 1 Cu 0.761 1 Cr 0.737 0.889* 1 Zn 0.872 0.775 0.581 1 Cd 0.807 0.966** 0.900* 0.846 1 Hg 0.913* 0.925* 0.887* 0.890* 0.975* 1
**Correlation is significant at the 0.01 level (2-tailed) *Correlation is significant at the 0.05 level (2-tailed)
p- ISSN 2528-1410 | DOI: https://doi.org/10.17509/ijost.v5i3.25007 | e- ISSN 2527-8045
Humayun Kabir, et al., Changes of heavy metal concentrations in Shitalakhya river…| 402
The result of the study found that the
HPI for all studied metals in three seasons
were much lower the critical pollution index
value for drinking water of 100. The
computed HPI showed that in pre-monsoon,
monsoon and post-monsoon season varied
between -11.663 to 43.958 (mean = 18.421),
-35.619 to -19.858 (mean = -27.661) and -
20.635 to 18.765 (mean = -5.989),
respectively. According to Prasad and Bose
(2001), low heavy metal pollution (HPI<100),
heavy metal pollution on the threshold risk
(HPI=100) and high heavy metal pollution
(i.e. critical pollution index) (HPI > 100), and
if the samples have HPI greater than 100,
water is not potable. Overall, result stated
that the Shitalakhya river water was
contaminated with respect to heavy metal
but the pollution level was not significant
based on HPI analysis. The analyzed HEI of
Shitalakhya river water showed that in pre-
monsoon, monsoon and post-monsoon
season varied from 4.101 to 8.067 (mean =
5.995); 2.101 to 3.237 (mean = 2.7308); and
2.500 to 5.139 (mean = 3.842), respectively,
which revealed that low heavy metal
contamination for all sampling stations over
the three seasons. Edet et al. (2003) stated
the water quality index into three categories
which include: low (HEI<400), moderate
(400 < HEI < 800) and high (HEI > 800). Thus,
the computed HEI of Shitalakhya river water
showed that the water quality falls under
the lower level of pollution. The CD was
used as the reference to estimate the extent
of metal pollution and CD may be grouped
into three categories as follows: low (CD <
1), medium (CD = 1-3) and high (CD > 3)
(Brraich and Jangu 2015). The mean CD in
pre-monsoon, monsoon and post-monsoon
season were 1.477; -2.429; and -0.6542,
respectively, indicated that CD values in pre-
monsoon season were higher, fall in the
medium category pollution, followed by
post-monsoon (low to medium pollution)
and monsoon season (lower level of
pollution). The overall CD value suggesting
that water was low to medium polluted.
Table 3. Comparisons of heavy metals concentrations (mg/L) in the Shitalakhya
river water in relation to other rivers of Bangladesh
River Pb Cu Cr Zn Cd Hg References
Shitalakhya 0.0044 0.0201 0.0042 0.6320 0.0029 0.0036 Present Study
Buriganga 0.1119 - 0.1140 0.3320 0.0590 - Bhuiyan et al. (2015)
Turag 0.0027 0.0722 0.0138 - 0.0033 0.0001 Afrin et al. (2014)
Balu 0.0010 0.0060 - 0.0101 0.0137 - Mokaddes et al. (2013)
Meghna - - 0.0346 0.0364 0.0030 - Hassan et al. (2015)
Padma 0.0015 0.0200 0.0030 0.0072 0.0020 - Jolly et al. (2013)
Dakatia 0.0063 0.0326 0.0030 0.1140 0.0013 - Hasan et al. (2015)
Passur - 0.0200 0.0200 0.0100 - - Shil (2013)
Bangshi 0.0135 0.0700 - 2.1050 0.0012 - Rehnuma et al. (2016)
Dhaleshwari 0.2010 - 0.1300 - 0.0010 - Ahmed et al. (2012)
Shitalakhya 0.0060 0.0200 4.7700 0.0200 - 0.0069 Islam et al. (2008)
p- ISSN 2528-1410 | DOI: https://doi.org/10.17509/ijost.v5i3.25007 | e- ISSN 2527-8045
403 | Indonesian Journal of Science & Technology, Volume 5 Issue 3, December 2020 Hal 395-409
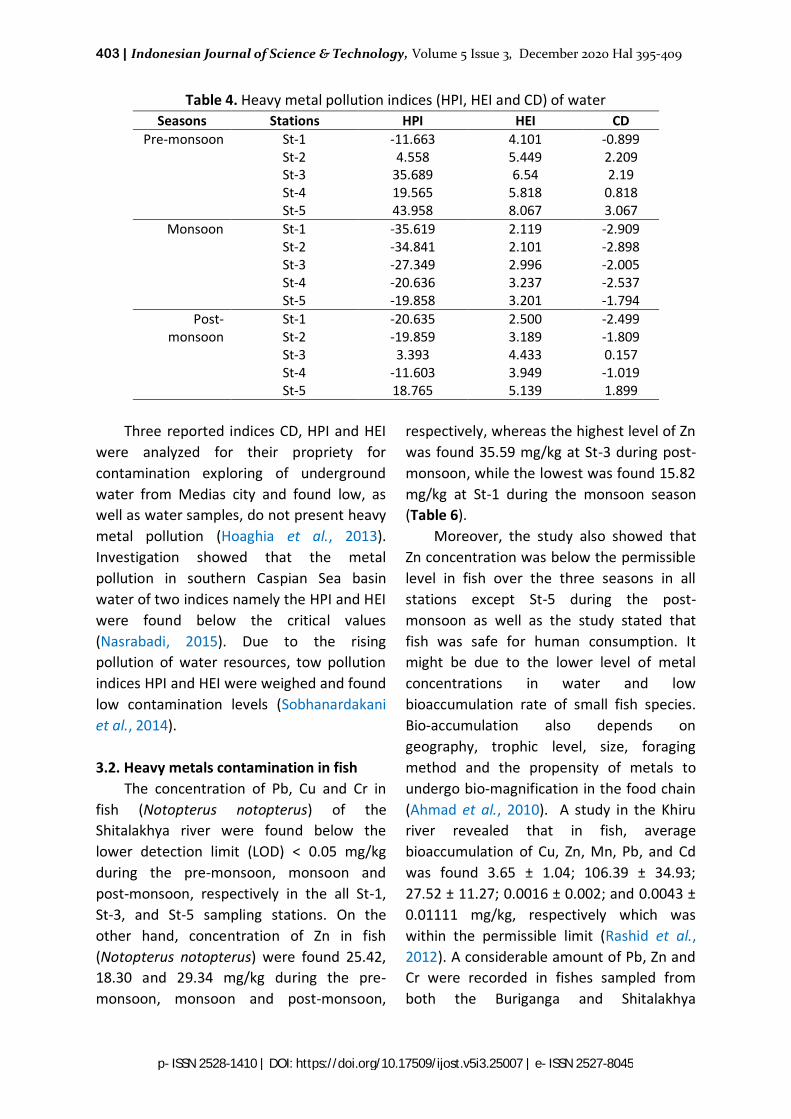
Table 4. Heavy metal pollution indices (HPI, HEI and CD) of water
Seasons Stations HPI HEI CD
Pre-monsoon St-1 -11.663 4.101 -0.899 St-2 4.558 5.449 2.209 St-3 35.689 6.54 2.19 St-4 19.565 5.818 0.818 St-5 43.958 8.067 3.067
Monsoon St-1 -35.619 2.119 -2.909 St-2 -34.841 2.101 -2.898 St-3 -27.349 2.996 -2.005 St-4 -20.636 3.237 -2.537 St-5 -19.858 3.201 -1.794
Post-monsoon
St-1 -20.635 2.500 -2.499 St-2 -19.859 3.189 -1.809 St-3 3.393 4.433 0.157 St-4 -11.603 3.949 -1.019 St-5 18.765 5.139 1.899
Three reported indices CD, HPI and HEI
were analyzed for their propriety for
contamination exploring of underground
water from Medias city and found low, as
well as water samples, do not present heavy
metal pollution (Hoaghia et al., 2013).
Investigation showed that the metal
pollution in southern Caspian Sea basin
water of two indices namely the HPI and HEI
were found below the critical values
(Nasrabadi, 2015). Due to the rising
pollution of water resources, tow pollution
indices HPI and HEI were weighed and found
low contamination levels (Sobhanardakani
et al., 2014).
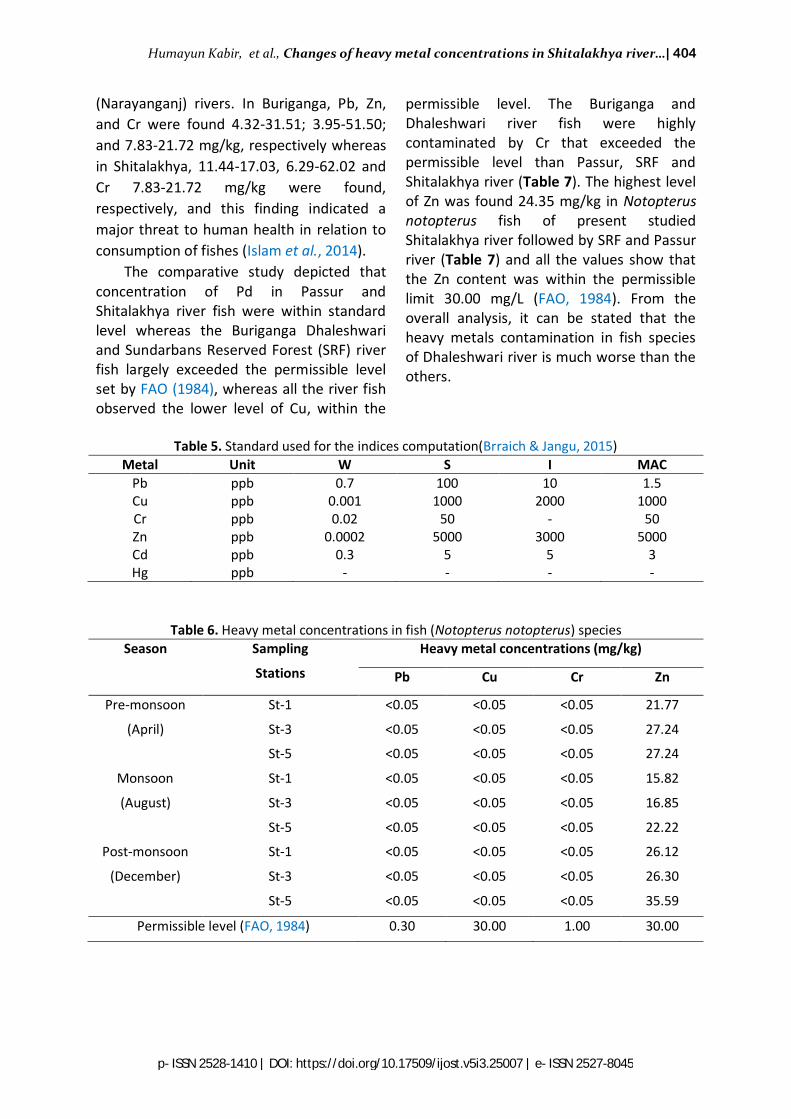
3.2. Heavy metals contamination in fish
The concentration of Pb, Cu and Cr in
fish (Notopterus notopterus) of the
Shitalakhya river were found below the
lower detection limit (LOD) ˂ 0.05 mg/kg
during the pre-monsoon, monsoon and
post-monsoon, respectively in the all St-1,
St-3, and St-5 sampling stations. On the
other hand, concentration of Zn in fish
(Notopterus notopterus) were found 25.42,
18.30 and 29.34 mg/kg during the pre-
monsoon, monsoon and post-monsoon,
respectively, whereas the highest level of Zn
was found 35.59 mg/kg at St-3 during post-
monsoon, while the lowest was found 15.82
mg/kg at St-1 during the monsoon season
(Table 6).
Moreover, the study also showed that
Zn concentration was below the permissible
level in fish over the three seasons in all
stations except St-5 during the post-
monsoon as well as the study stated that
fish was safe for human consumption. It
might be due to the lower level of metal
concentrations in water and low
bioaccumulation rate of small fish species.
Bio-accumulation also depends on
geography, trophic level, size, foraging
method and the propensity of metals to
undergo bio-magnification in the food chain
(Ahmad et al., 2010). A study in the Khiru
river revealed that in fish, average
bioaccumulation of Cu, Zn, Mn, Pb, and Cd
was found 3.65 ± 1.04; 106.39 ± 34.93;
27.52 ± 11.27; 0.0016 ± 0.002; and 0.0043 ±
0.01111 mg/kg, respectively which was
within the permissible limit (Rashid et al.,
2012). A considerable amount of Pb, Zn and
Cr were recorded in fishes sampled from
both the Buriganga and Shitalakhya
p- ISSN 2528-1410 | DOI: https://doi.org/10.17509/ijost.v5i3.25007 | e- ISSN 2527-8045
Humayun Kabir, et al., Changes of heavy metal concentrations in Shitalakhya river…| 404
(Narayanganj) rivers. In Buriganga, Pb, Zn,
and Cr were found 4.32-31.51; 3.95-51.50;
and 7.83-21.72 mg/kg, respectively whereas
in Shitalakhya, 11.44-17.03, 6.29-62.02 and
Cr 7.83-21.72 mg/kg were found,
respectively, and this finding indicated a
major threat to human health in relation to
consumption of fishes (Islam et al., 2014).
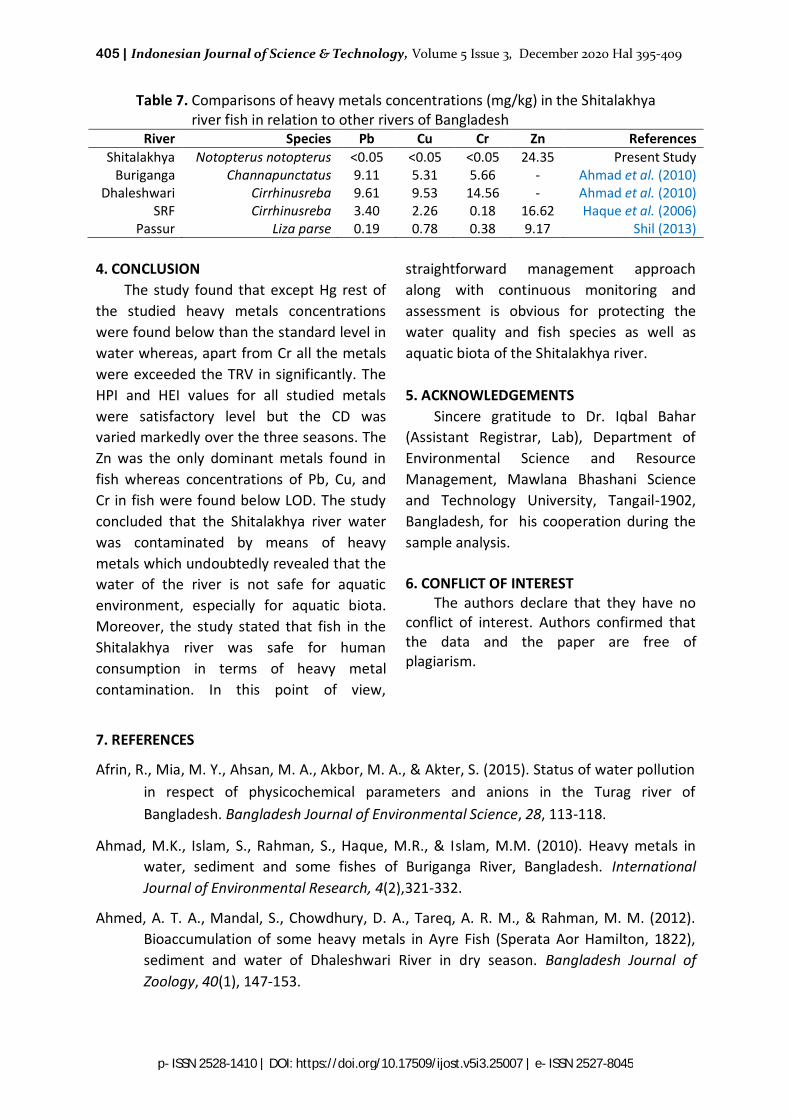
The comparative study depicted that concentration of Pd in Passur and Shitalakhya river fish were within standard level whereas the Buriganga Dhaleshwari and Sundarbans Reserved Forest (SRF) river fish largely exceeded the permissible level set by FAO (1984), whereas all the river fish observed the lower level of Cu, within the
permissible level. The Buriganga and Dhaleshwari river fish were highly contaminated by Cr that exceeded the permissible level than Passur, SRF and Shitalakhya river (Table 7). The highest level of Zn was found 24.35 mg/kg in Notopterus notopterus fish of present studied Shitalakhya river followed by SRF and Passur river (Table 7) and all the values show that the Zn content was within the permissible limit 30.00 mg/L (FAO, 1984). From the overall analysis, it can be stated that the heavy metals contamination in fish species of Dhaleshwari river is much worse than the others.
Table 5. Standard used for the indices computation(Brraich & Jangu, 2015)
Metal Unit W S I MAC
Pb ppb 0.7 100 10 1.5 Cu ppb 0.001 1000 2000 1000 Cr ppb 0.02 50 - 50 Zn ppb 0.0002 5000 3000 5000 Cd ppb 0.3 5 5 3 Hg ppb - - - -
Table 6. Heavy metal concentrations in fish (Notopterus notopterus) species
Season Sampling
Stations
Heavy metal concentrations (mg/kg)
Pb Cu Cr Zn
Pre-monsoon
(April)
St-1 ˂0.05 ˂0.05 ˂0.05 21.77
St-3 ˂0.05 ˂0.05 ˂0.05 27.24
St-5 ˂0.05 ˂0.05 ˂0.05 27.24
Monsoon
(August)
St-1 ˂0.05 ˂0.05 ˂0.05 15.82
St-3 ˂0.05 ˂0.05 ˂0.05 16.85
St-5 ˂0.05 ˂0.05 ˂0.05 22.22
Post-monsoon
(December)
St-1 ˂0.05 ˂0.05 ˂0.05 26.12
St-3 ˂0.05 ˂0.05 ˂0.05 26.30
St-5 ˂0.05 ˂0.05 ˂0.05 35.59
Permissible level (FAO, 1984) 0.30 30.00 1.00 30.00
p- ISSN 2528-1410 | DOI: https://doi.org/10.17509/ijost.v5i3.25007 | e- ISSN 2527-8045
405 | Indonesian Journal of Science & Technology, Volume 5 Issue 3, December 2020 Hal 395-409
Table 7. Comparisons of heavy metals concentrations (mg/kg) in the Shitalakhya river fish in relation to other rivers of Bangladesh
River Species Pb Cu Cr Zn References
Shitalakhya Notopterus notopterus ˂0.05 ˂0.05 ˂0.05 24.35 Present Study Buriganga Channapunctatus 9.11 5.31 5.66 - Ahmad et al. (2010)
Dhaleshwari Cirrhinusreba 9.61 9.53 14.56 - Ahmad et al. (2010) SRF Cirrhinusreba 3.40 2.26 0.18 16.62 Haque et al. (2006)
Passur Liza parse 0.19 0.78 0.38 9.17 Shil (2013)
4. CONCLUSION
The study found that except Hg rest of
the studied heavy metals concentrations
were found below than the standard level in
water whereas, apart from Cr all the metals
were exceeded the TRV in significantly. The
HPI and HEI values for all studied metals
were satisfactory level but the CD was
varied markedly over the three seasons. The
Zn was the only dominant metals found in
fish whereas concentrations of Pb, Cu, and
Cr in fish were found below LOD. The study
concluded that the Shitalakhya river water
was contaminated by means of heavy
metals which undoubtedly revealed that the
water of the river is not safe for aquatic
environment, especially for aquatic biota.
Moreover, the study stated that fish in the
Shitalakhya river was safe for human
consumption in terms of heavy metal
contamination. In this point of view,
straightforward management approach
along with continuous monitoring and
assessment is obvious for protecting the
water quality and fish species as well as
aquatic biota of the Shitalakhya river.
5. ACKNOWLEDGEMENTS
Sincere gratitude to Dr. Iqbal Bahar
(Assistant Registrar, Lab), Department of
Environmental Science and Resource
Management, Mawlana Bhashani Science
and Technology University, Tangail-1902,
Bangladesh, for his cooperation during the
sample analysis.
6. CONFLICT OF INTEREST
The authors declare that they have no conflict of interest. Authors confirmed that the data and the paper are free of plagiarism.
7. REFERENCES
Afrin, R., Mia, M. Y., Ahsan, M. A., Akbor, M. A., & Akter, S. (2015). Status of water pollution
in respect of physicochemical parameters and anions in the Turag river of
Bangladesh. Bangladesh Journal of Environmental Science, 28, 113-118.
Ahmad, M.K., Islam, S., Rahman, S., Haque, M.R., & Islam . . (2010). eav metals in
water sediment and some fishes of uriganga iver angladesh. International
Journal of Environmental Research, 4(2),321-332.
Ahmed, A. T. A., Mandal, S., Chowdhury, D. A., Tareq, A. R. M., & Rahman, M. M. (2012).
Bioaccumulation of some heavy metals in Ayre Fish (Sperata Aor Hamilton, 1822),
sediment and water of Dhaleshwari River in dry season. Bangladesh Journal of
Zoology, 40(1), 147-153.
p- ISSN 2528-1410 | DOI: https://doi.org/10.17509/ijost.v5i3.25007 | e- ISSN 2527-8045
Humayun Kabir, et al., Changes of heavy metal concentrations in Shitalakhya river…| 406
Ahmed, M., Bhowmik, A. C., Rahman, S., & Haque, M. (2010). Heavy metal concentration in
water, sediments, freshwater mussels and fishes of the river shitalakhya,
Bangladesh. Asian Journal of Water, Environment and Pollution, 7(1), 77-90.
Alam, A.M.S., Islam, M.A., Rahman, M.A., Ahmed, A., Islam, S., Sultana, K.S., & Siddique,
M.N. (2004). Transport of toxic metal through the major river system of
Bangladesh. Journal of Chemical Society of Pakistan, 26(3), 328-332.
Alam, M. J., Islam, M. R., Muyen, Z., Mamun, M., & Islam, S. (2007). Water quality
parameters along rivers. International Journal of Environmental Science and
Technology, 4(1), 159-167.
Armah, F. A., Obiri, S., Yawson, D. O., Onumah, E. E., Yengoh, G. T., Afrifa, E. K., & Odoi, J. O.
(2010). Anthropogenic sources and environmentally relevant concentrations of
heavy metals in surface water of a mining district in Ghana: a multivariate statistical
approach. Journal of Environmental Science and Health Part A, 45(13), 1804-1813.
ackman . odiš D. Lahermo P. apant S. & Tarvainen T. (1998). Application of a
groundwater contamination index in Finland and Slovakia. Environmental Geology,
36(1-2), 55-64.
Bhuiyan, M. A. H., Suruvi, N. I., Dampare, S. B., Islam, M. A., Quraishi, S. B., Ganyaglo, S., &
Suzuki, S. (2011). Investigation of the possible sources of heavy metal contamination
in lagoon and canal water in the tannery industrial area in Dhaka, Bangladesh.
Environmental monitoring and assessment, 175(1-4), 633-649.
Bhuiyan, M. A. H., Dampare, S. B., Islam, M. A., & Suzuki, S. (2015). Source apportionment
and pollution evaluation of heavy metals in water and sediments of Buriganga River,
Bangladesh, using multivariate analysis and pollution evaluation indices.
Environmental monitoring and assessment, 187(1), 4075.
Brraich, O. S., & Jangu, S. (2015). Evaluation of water quality pollution indices for heavy
metal contamination monitoring in the water of Harike Wetland (Ramsar Site), India.
International Journal of Scientific and Research Publications, 5(2), 1-6.
Censi, P. A. O. L. O., Spoto, S. E., Saiano, F. I. L. I. P. P. O., Sprovieri, M., Mazzola, S., Nardone,
G., Geronimo, S.I.D., Punturo, R., & Ottonello, D. (2006). Heavy metals in coastal
water systems. A case study from the northwestern Gulf of Thailand. Chemosphere,
64(7), 1167-1176.
Ebrahimpour, M., & Mushrifah, I. (2008). Heavy metal concentrations in water and
sediments in Tasik Chini, a freshwater lake, Malaysia. Environmental monitoring and
assessment, 141(1-3), 297-307.
ECR (1997). Environment Conservation Rules. Ministry of Environment and Forest,
Government of the People's Republic of Bangladesh.
Edet, A. E., & Offiong, O. E. (2002). Evaluation of water quality pollution indices for heavy
metal contamination monitoring. A study case from Akpabuyo-Odukpani area, Lower
Cross River Basin (southeastern Nigeria). GeoJournal, 57(4), 295-304.
p- ISSN 2528-1410 | DOI: https://doi.org/10.17509/ijost.v5i3.25007 | e- ISSN 2527-8045
407 | Indonesian Journal of Science & Technology, Volume 5 Issue 3, December 2020 Hal 395-409
Edet, A. E., Merkel, B. J., & Offiong, O. E. (2003). Trace element hydrochemical assessment
of the Calabar Coastal Plain Aquifer, southeastern Nigeria using statistical methods.
Environmental Geology, 44(2), 137-149.
FAO (1984). Food and Agricultural Organization. List of maximum levels recommended for
contaminants by the Joint FAO/WHO Codex Alimentarius Commission. Series 2nd
CAC/FAL, Rome.
Fernandes, C., Fontaínhas-Fernandes, A., Cabral, D., & Salgado, M. A. (2008). Heavy metals
in water, sediment and tissues of Liza saliens from Esmoriz–Paramos lagoon,
Portugal. Environmental monitoring and assessment, 136(1-3), 267-275.
Ghafoor, A., Qadir, M., Sadiq, M., Murtaza, G., & Brar, M. S. (2004). Lead, copper, zinc and
iron concentrations in soils and vegetables irrigated with city effluent on urban
agricultural lands. Journal of the Indian Society of Soil Science, 52(1), 114-117.
Haque, M. R., Ahmad, J. U., Chowdhury, M. D. A., Ahmed, M. K., & Rahman, M. S. (2004).
Seasonal variation of heavy metals concentration in sediments of the rivers and
estuaries of Sundarban mangrove forest. Asian Journal of Microbiology
Biotechnology and Environmental Sciences, 6(2), 175-185.
Haque, M. R., Ahmed, M. K., Ahmad, J. U., & Chowdhury, M. D. A. (2007). Seasonal variation
of heavy metals in some molluscs of Sundarban mangrove forest, Bangladesh.
Pakistan Journal of Oceanography, 2(2), 81-98.
Haque, M. R., Ahmed, M. K., Mannaf, M. A., & Islam, M. M. (2006). Seasonal variation of
heavy metals concentrations in Gudusia chapra inhabiting the Sundarban mangrove
forest. Journal of NOAMI, 23(1), 1-21.
Haque, M.I. (2008). Water resources management in Bangladesh. Anushilan Publishers,
Chuadanga and Dhaka
Hasan, S.J., Tanu, M.B., Haidar, M.S., Ahmed, T., Rubel, A.K.M.S.A. (2015). Physiochemical
characteristics and accumulation of heavy metals in water and sediments of the river
Dakatia, Bangladesh. International Journal of Fish Aquatic Studies, 2(5), 300-304.
Hassan, M., Rahman, M. A. T., Saha, B., & Kamal, A. K. I. (2015). Status of heavy metals in
water and sediment of the Meghna River, Bangladesh. American Journal of
Environmental Sciences, 11(6), 427.
Hoaghi, M. A., Roman, C., Ristoiu, D., Popita, G., & Tanaselia, C. (2013). Assessing of water
quality pollution indices for heavy metal contamination. a study case from medias
city groundwaters. Agricultura, 87(3-4).
Eneji I. S. Sha’Ato . & Annune P. A. (2011). ioaccumulation of heav metals in fish
(Tilapia zilli and Clarias gariepinus) organs from River Benue, North-Central Nigeria.
Pakistan Journal of Analytical Environmental Chemistry, 12(1), 25-31.
Islam, M. M., Rahman, S. L., Ahmed, S. U., & Haque, M. K. I. (2014). Biochemical
characteristics and accumulation of heavy metals in fishes, water and sediments of
p- ISSN 2528-1410 | DOI: https://doi.org/10.17509/ijost.v5i3.25007 | e- ISSN 2527-8045
Humayun Kabir, et al., Changes of heavy metal concentrations in Shitalakhya river…| 408
the river Buriganga and Shitalakhya of Bangladesh. Journal of Asian scientific
research, 4(6), 270-279.
Islam, M. Z., Azim, M. A., Islam, R., & Quraishi, S. B. (2008). Seasonal Variation of Heavy
metals in water samples from the Sitalakhya River. Journal of Bangladesh Academy
of Sciences, 32(1), 13-22.
Jolly, Y. N., Akter, J. S., Kabir, A. I., & Akbar, S. (2013). Trace elements contamination in the
river padma. Bangladesh Journal of Physics, 13, 95-102.
Karadede, H., Oymak, S. A., & Ünlü, E. (2004). Heavy metals in mullet, Liza abu, and catfish,
Silurus triostegus, from the Atatürk Dam Lake (Euphrates), Turkey. Environment
International, 30(2), 183-188.
Lohani, M. B., Singh, A., Rupainwar, D. C., & Dhar, D. N. (2008). Seasonal variations of heavy
metal contamination in river Gomti of Lucknow city region. Environmental
Monitoring and assessment, 147(1-3), 253-263.
MacFarlane, G. R., & Burchett, M. D. (2000). Cellular distribution of copper, lead and zinc in
the grey mangrove, Avicennia marina (Forsk.) Vierh. Aquatic Botany, 68(1), 45-59.
Sultana, M. S. (2012). Toxic Metal Contamination on the River near Industrial Area of Dhaka.
Universal Journal of Environmental Research & Technology, 2(2), 56-64.
Malik, N., Biswas, A. K., Qureshi, T. A., Borana, K., & Virha, R. (2010). Bioaccumulation of
heavy metals in fish tissues of a freshwater lake of Bhopal. Environmental monitoring
and assessment, 160(1-4), 267.
Mohan, S. V., Nithila, P., & Reddy, S. J. (1996). Estimation of heavy metals in drinking water
and development of heavy metal pollution index. Journal of Environmental Science &
Health Part A, 31(2), 283-289.
Mokaddes, M. A. A., Nahar, B. S., & Baten, M. A. (2012). Status of heavy metal
contaminations of Drain water of Dhaka Metropolitan city. Journal of Environmental
Science and Natural Resources, 5(2), 11-14.
Jannat, N., Mottalib, M. A., & Alam, M. N. (2019). Assessment of Physico-chemical
Properties of Surface Water of Mokeshbeel, Gazipur. Bangladesh Journal of
Environmental Science and Current Research, 2, 014.
Nasrabadi, T. (2015). An IndexApproach toMetallic Pollution in RiverWaters. International
Journal of Environmental Research, 9(1), 385-394.
Prasad, B., & Bose, J. (2001). Evaluation of the heavy metal pollution index for surface and
spring water near a limestone mining area of the lower Himalayas. Environmental
Geology, 41(1-2), 183-188.
Rabbani, G., & Sharif, M.I. (2005). Dhaka city-state of environment (SoE)-2005. UNEP in
collaboration with BCAS and DoE, Bangladesh.
p- ISSN 2528-1410 | DOI: https://doi.org/10.17509/ijost.v5i3.25007 | e- ISSN 2527-8045
409 | Indonesian Journal of Science & Technology, Volume 5 Issue 3, December 2020 Hal 395-409
Rashid, H., Hasan, M. N., Tanu, M. B., Parveen, R., Sukhan, Z. P., Rahman, M. S., & Mahmud,
Y. (2012). Heavy metal pollution and chemical profile of Khiru river, Bangladesh.
International Journal of Environment, 2(1), 57-63.
Reddy, S.J. (1995). Encyclopedia of environmental pollution and control. India:
Environmental Media.
Rehnuma, M., Islam, M.S., Meghla, N.T., & Kabir, M.H. (2016). Heavy metal exploration in
water and fish from Bangshi river at Mirzapur area under Tangail district of
Bangladesh. Bangladesh Journal of Environmetal Science, 30, 7-12.
Reza, R., & Singh, G. (2010). Heavy metal contamination and its indexing approach for river
water. International Journal of Environmental Science and Technology, 7(4), 785-792.
Seshan, B. R. R., Natesan, U., & Deepthi, K. (2010). Geochemical and statistical approach for
evaluation of heavy metal pollution in core sediments in southeast coast of India.
International Journal of Environmental Science & Technology, 7(2), 291-306.
Shil, S.C. (2013). Investigation of heavy metal contamination in water, sediment and fishes
from the Mongla port area near Sundarbans mangrove, Bangladesh. MS Thesis,
Mawlana Bhashani Science and Technology University, Bangladesh
Sobhanardakani, S., Jamali, M., Maànijou, M. (2014). Evaluation of As, Zn, Cr and Mn
concentrations in groundwater resources of Razan Plain and preparing the zoning
map using GIS. Journal of Environmental Science and Technology, 16(2), 25-38.
Storelli . . Storelli A. D’ddabbo . arano C. runo . & arcotrigiano G.O.
(2005). Trace elements in loggerhead turtles (Carettacaretta) from the eastern
Mediterranean Sea: overview and evaluation. Environmental Pollution, 135(1), 163-
170.
Subramanian, B. (2004). Water quality in south Asia. Asian Journal of Water Environmental
Pollution, 1(1-2), 41-54.
Tareq, S. M., Rahaman, M. S., Rikta, S. Y., Islam, S. N., & Sultana, M. S. (2013). Seasonal
variations in water quality of the Ganges and Brahmaputra River, Bangladesh.
Jahangirnagar University Environmental Bulletin, 2, 71-82.
USEPA (1999) United States Environmental Protection Agency, Screening level ecological risk
assessment protocol for hazardous waste combustion facilities, Appendix E: Toxicity
reference values. Washington DC, USA
Zakir, H.M., Sharmin, S., & Shikazono, N. (2006). Heavy metal pollution assessment in water
and sediments of Turag River at Tongi area in Bangladesh. International Journal of
Lake and River, 1(1), 85-96.
p- ISSN 2528-1410 | DOI: https://doi.org/10.17509/ijost.v5i3.25007 | e- ISSN 2527-8045
Copyright © 2022 FDOKUMEN