Heavy metal pollution of soils affected by the Guadiamar toxic flood
13
Ž . The Science of the Total Environment 242 1999 117]129 Heavy metal pollution of soils affected by the Guadiamar toxic flood F. Cabrera U , L. Clemente, E. Dıaz Barrientos, R. Lopez, J.M. Murillo ´ ´ ( ) Instituto de Recursos Naturales y Agrobiologıa de Se ¤ illa CSIC , Apartado 1052, 41080 Se ¤ illa, Spain ´ Abstract Total heavy metal concentrations were determined in soil samples of seven selected areas along the Guadiamar river valley affected by the toxic flood, after removal of the deposited sludge. Mean total concentrations of nine Ž . Ž elements As, Au, Bi, Cd, Cu, Pb, Sb, Tl and Zn out of the 23 As, Au, Ba, Be, Bi, Cd, Co, Cr, Cu, In, Mn, Mo, Ni, . Pb, Sb, Sc, Sn, Th, Tl, U, V, Y and Zn analysed were higher in sludge-covered soils than in unaffected soils. Mean values of total As, Au, Pb, Sb, Tl and Zn in sludge-affected soils were higher than the upper limits for normal soils world-wide. Mean concentrations of Bi, Cd and Cu were within these ranges, although some individual values exceeded the upper limits. In all sampling areas, severe heavy metal pollution was observed in the superficial layers Ž . 0 ] 20 cm of most of the affected soils, which decreased downward in the soil profile. Generally, in soils with more than 25% of clay, concentration of heavy metals below the 20-cm depth decreased to values close to those of the background level of the Guadiamar valley soils, while in coarser soils, heavy metal pollution penetrated below this depth, being noticeable down to a depth of at least 50 ] 80 cm. Q 1999 Elsevier Science B.V. All rights reserved. Keywords: Soil; Heavy metals; Pollution; Soil texture 1. Introduction In the early hours of the 25th April 1998, a tailing-dam dike at Los Frailes open-pit pyrite U Corresponding author. Tel.: q34-9-546-24711; fax: q34- 9-546-24002. Ž . E-mail address: [email protected] F. Cabrera Ž . mine Aznalcollar, 45 km west of Seville, Spain ´ was breached, allowing water and solids from the tailings pond to be discharged into the nearby Agrio river, a tributary of the Guadiamar river. Approximately 4.5 million cubic meters of slurry, composed of acidic water loaded with heavy met- als and other toxic elements, finely divided metal Ž . sulphides mainly pyrite , and materials used in Ž . the refining floating process, inundated both 0048-9697r99r$ - see front matter Q 1999 Elsevier Science B.V. All rights reserved. Ž . PII: S 0 0 4 8 - 9 6 9 7 99 00379-4
-
Upload
independent -
Category
Documents
-
view
1 -
download
0
Transcript of Heavy metal pollution of soils affected by the Guadiamar toxic flood
Ž .The Science of the Total Environment 242 1999 117]129
Heavy metal pollution of soils affected by theGuadiamar toxic flood
F. CabreraU, L. Clemente, E. Dıaz Barrientos, R. Lopez, J.M. Murillo´ ´( )Instituto de Recursos Naturales y Agrobiologıa de Se¨illa CSIC , Apartado 1052, 41080 Se¨illa, Spain´
Abstract
Total heavy metal concentrations were determined in soil samples of seven selected areas along the Guadiamarriver valley affected by the toxic flood, after removal of the deposited sludge. Mean total concentrations of nine
Ž . Želements As, Au, Bi, Cd, Cu, Pb, Sb, Tl and Zn out of the 23 As, Au, Ba, Be, Bi, Cd, Co, Cr, Cu, In, Mn, Mo, Ni,.Pb, Sb, Sc, Sn, Th, Tl, U, V, Y and Zn analysed were higher in sludge-covered soils than in unaffected soils. Mean
values of total As, Au, Pb, Sb, Tl and Zn in sludge-affected soils were higher than the upper limits for normal soilsworld-wide. Mean concentrations of Bi, Cd and Cu were within these ranges, although some individual valuesexceeded the upper limits. In all sampling areas, severe heavy metal pollution was observed in the superficial layersŽ .0]20 cm of most of the affected soils, which decreased downward in the soil profile. Generally, in soils with morethan 25% of clay, concentration of heavy metals below the 20-cm depth decreased to values close to those of thebackground level of the Guadiamar valley soils, while in coarser soils, heavy metal pollution penetrated below thisdepth, being noticeable down to a depth of at least 50]80 cm. Q 1999 Elsevier Science B.V. All rights reserved.
Keywords: Soil; Heavy metals; Pollution; Soil texture
1. Introduction
In the early hours of the 25th April 1998, atailing-dam dike at Los Frailes open-pit pyrite
U Corresponding author. Tel.: q34-9-546-24711; fax: q34-9-546-24002.
Ž .E-mail address: [email protected] F. Cabrera
Ž .mine Aznalcollar, 45 km west of Seville, Spain´was breached, allowing water and solids from thetailings pond to be discharged into the nearbyAgrio river, a tributary of the Guadiamar river.Approximately 4.5 million cubic meters of slurry,composed of acidic water loaded with heavy met-als and other toxic elements, finely divided metal
Ž .sulphides mainly pyrite , and materials used inŽ .the refining floating process, inundated both
0048-9697r99r$ - see front matter Q 1999 Elsevier Science B.V. All rights reserved.Ž .PII: S 0 0 4 8 - 9 6 9 7 9 9 0 0 3 7 9 - 4
( )F. Cabrera et al. r The Science of the Total En¨ironment 242 1999 117]129118
riverbanks of the Agrio and Guadiamar riversand threatened the Donana National Park, Eu-˜rope’s largest national park. Along 40 km, a stripof approximately 300 m wide on both sides of the
Ž .rivers was covered by a layer 2]30 cm thick ofŽ .toxic black sludge IGME, 1998 . Approximately
4500 ha of agricultural land devoted to dry-landagriculture and fruit and olive tree orchards were
Žaffected by the pollution Consejerıa de Medio´.Ambiente, 1998 .
ŽDissolved and particulate heavy metals fromnow on we use the term heavy metals to refer notonly to those metals with density )5 g cmy3, but
.also to other trace and toxic elements in theslurry can pollute the soil. Dissolved heavy metals
Žreact with soil components clay minerals, iron,aluminium and manganese oxides, carbonates,
.and organic matter and are retained throughŽdifferent sorption processes Selim and Amacher,
.1997 . The retention, and therefore the depth ofpenetration, of the dissolved heavy metals de-
Žpends on the soil properties pH, redox potential,moisture content, bulk density, texture, and com-
. Ž .position Adriano, 1986 . At the same time,sludge rich in heavy metal sulphides can enter thesoil through cracks and pores, increasing the totalconcentration of heavy metals in the soil. Sul-phidic components of the sludge, exposed to at-mospheric oxygen and moisture aided by bacteriaŽe.g. Thiobacillus thiooxidans, Thiobacillus ferrooxi-
.dans , can undergo a series of oxidation and hy-drolysis reactions producing sulphuric acid and
Žsoluble and mobile metal sulphates Forstner and¨.Wittmann, 1983 . According to Williamson and
Ž .Johnson 1981 , the factors liable to affect soilŽacidification are the carbonate:pyrite or metal
.sulphide ratio of the soil and the reactivity of theŽsulphidic components which is related to the
crystal form and to the particle size of the miner-.als .In order to start the remediation of the af-
fected soils, rapid information was necessary onthe extent of the pollution. This paper deals withthe work carried out immediately after the floodto evaluate the degree and the penetration of theheavy-metal pollution in the profiles of the af-fected soils.
2. Experimental
2.1. Sampling areas and sites
Between the 8th and 15th of May 1998, soilŽsamples were taken at different depths 0]5, 5]10,
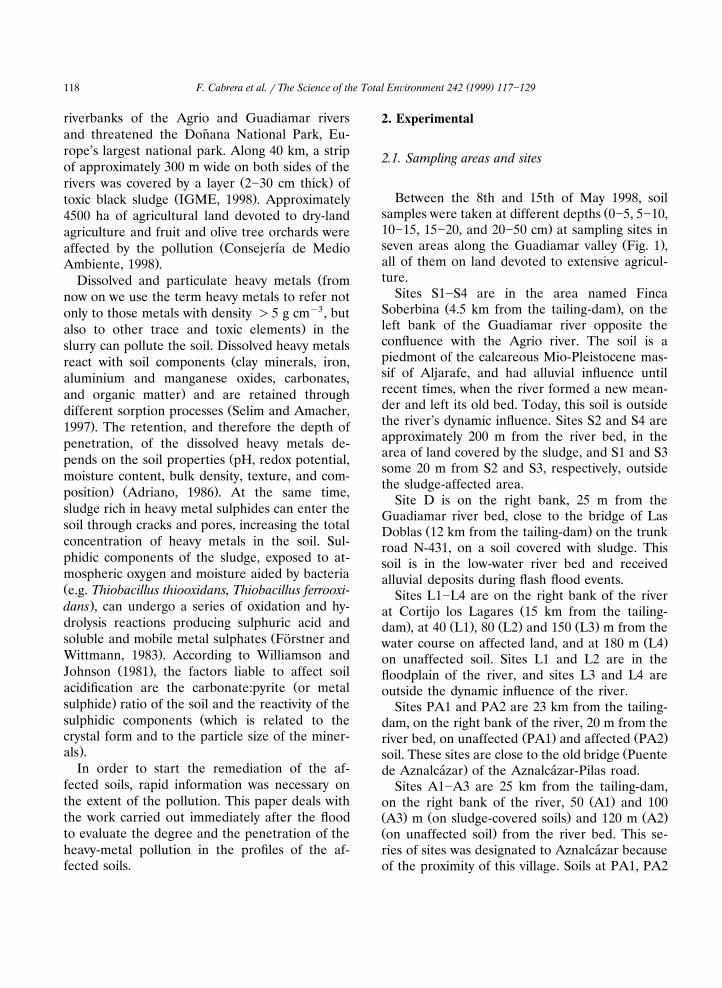
.10]15, 15]20, and 20]50 cm at sampling sites inŽ .seven areas along the Guadiamar valley Fig. 1 ,
all of them on land devoted to extensive agricul-ture.
Sites S1]S4 are in the area named FincaŽ .Soberbina 4.5 km from the tailing-dam , on the
left bank of the Guadiamar river opposite theconfluence with the Agrio river. The soil is apiedmont of the calcareous Mio-Pleistocene mas-sif of Aljarafe, and had alluvial influence untilrecent times, when the river formed a new mean-der and left its old bed. Today, this soil is outsidethe river’s dynamic influence. Sites S2 and S4 areapproximately 200 m from the river bed, in thearea of land covered by the sludge, and S1 and S3some 20 m from S2 and S3, respectively, outsidethe sludge-affected area.
Site D is on the right bank, 25 m from theGuadiamar river bed, close to the bridge of Las
Ž .Doblas 12 km from the tailing-dam on the trunkroad N-431, on a soil covered with sludge. Thissoil is in the low-water river bed and receivedalluvial deposits during flash flood events.
Sites L1]L4 are on the right bank of the riverŽat Cortijo los Lagares 15 km from the tailing-
. Ž . Ž . Ž .dam , at 40 L1 , 80 L2 and 150 L3 m from theŽ .water course on affected land, and at 180 m L4
on unaffected soil. Sites L1 and L2 are in thefloodplain of the river, and sites L3 and L4 areoutside the dynamic influence of the river.
Sites PA1 and PA2 are 23 km from the tailing-dam, on the right bank of the river, 20 m from the
Ž . Ž .river bed, on unaffected PA1 and affected PA2Žsoil. These sites are close to the old bridge Puente
.de Aznalcazar of the Aznalcazar-Pilas road.´ ´Sites A1]A3 are 25 km from the tailing-dam,
Ž .on the right bank of the river, 50 A1 and 100Ž . Ž . Ž .A3 m on sludge-covered soils and 120 m A2Ž .on unaffected soil from the river bed. This se-ries of sites was designated to Aznalcazar because´of the proximity of this village. Soils at PA1, PA2
( )F. Cabrera et al. r The Science of the Total En¨ironment 242 1999 117]129 119
Ž .Fig. 1. The Guadiamar river. Extent of the affected zone and situation of the sampling areas. Adapted from IGME, 1998.
and A1 are in the floodplain of the river, sub-jected to river sedimentation, although sites PA1and PA2 are today outside the river’s influencebecause of the construction of a road. Soils at A2and A3 are outside the dynamic influence of theriver.
Site Q is on sludge-affected soil on the leftbank of the river, 50 m from the river bed, at
Ž .Cortijo de Quemas 30 km from the tailing-dam .Soils at this site are alluvial and are in the sedi-mentation meandering zone.
Ž .Sites M1]M3 38 km from the tailing-dam are
( )F. Cabrera et al. r The Science of the Total En¨ironment 242 1999 117]129120
on the marshes of the Guadalquivir river, acrosswhich the river flows in the last stretch of itscourse. This is a flat area liable to flash flooding.Here, the right bank of the river is protected witha levee to prevent flooding of the reclaimed salinesoils on that bank. M1 is on the right bank, 20 mfrom the river, unaffected by the sludge, and M2and M3 are located on the left bank, parallel tothe river and 20 m from it, on sludge-coveredland.
At sites S3, S4, A2, A3, L3 and L4, soil sampleswere also taken at a depth )50 cm.
The soils were classified as Typic XerofluventŽ .D, L1, L2, PA1, PA2, A1 and Q , Vertic Xe-
Ž . Žrofluvent M2 and M3 , Typic Xerochrept A2. Ž .and A3 , Calcixerollic Xerochrept S1]S4 , Typic
Ž .Haploxeralf L3 and L4 and Aquic HaploxerertŽ . Ž .M1 Soil Survey Staff, 1994 .
2.2. Soil sampling and analytical methods
Sampling of the affected soils was carried outby digging a pit 50 cm deep after removing thedeposited sludge and cleaning the surface. When-ever possible, samples of soils unaffected by thesludge were also taken in a similar way at sitesclose to the affected spots. Samples of sludgeswere also taken at each site.
Ž .Soil and sludge samples were oven-dried 508Cand crushed to pass through a 2-mm sieve, and
Ž .then ground to -60 mm. Soil samples 2 mmŽwere analysed for pH in saturated paste Hesse,
.1971 , total carbonate content was determined byŽthe manometric method Demolon and Leroux,
.1952 , and size particle distribution by the hydro-Ž .meter method Gee and Bauder, 1979 .
Heavy metal and other trace element contentsŽAs, Au, Ba, Be, Bi, Cd, Co, Cr, Cu, In, Mn, Mo,
.Ni, Pb, Sb, Sc, Sn, Th, Tl, U, V, Y and Zn in theŽ .soil -60 mm and sludge samples were de-
termined by ICP-MS after digesting the sampleswith a mixture of concentrated HNO and HF to3dryness and redissolving in 4% concentratedHNO . Total heavy metal concentrations were3calculated on a dry weight basis. The accuracyand precision of the method were assessed bycarrying out analyses of two BCR reference sam-
Ž .ples: CRM 141 calcareous loam soil and CRM
Ž . Ž277 estuarine sediment Colinet et al., 1983;.Griepink and Muntau, 1988 . Recoveries from
CRM 141 ranged from 83 to 118%, with a relativeŽ .standard deviation R.S.D. of 0.79]77%, being
-10% for 18 out of the 23 elements analysed.Recoveries from CRM 277 ranged from 81 to107%, with R.S.D. of 0.54]21%, being -5% for
Ž .19 out of the 23 analysed Table 1 .
2.3. Quantification of the soil pollution
The degree and the penetration of heavy metalpollution in the affected soils were measured and
Ž .compared using the Pollution Load Index PLIŽ .of Tomlinson et al. 1980 . This index is based on
Ž .the values of the Concentration Factors CF ofeach metal in the soil. The CF is the ratio ob-tained by dividing the concentration of each metal
Ž .in the soil C by the base line or back-heavy metalŽground value concentration in unpolluted soil,
.Cbackground
Cheavy metalCF si Cbackground
In this paper, background values were estimatedfrom the mean concentrations of the heavy met-als in unaffected soils of the studied area.
For each sampling site, PLI at one determinedsoil depth may be calculated as the nth root ofthe product of the n CF:
nŽ .PLIs CF =CF = . . . =CF' 1 2 n
This index provides a simple, comparative meansfor assessing the level of heavy metal pollution.Values of PLIs1 indicate heavy metal loadsclose to the background level, and values above 1indicate pollution.
2.4. Statistical analysis
When sets of data of total heavy metal concen-trations in affected and unaffected soils werenormally distributed, Student’s t-test was used todetect differences between paired means. Whenthe normality test failed, the Mann]Whitney
( )F. Cabrera et al. r The Science of the Total En¨ironment 242 1999 117]129 121
Table 1aAnalysis of BCR reference samples
Element CRM-141 CRM-277
Ž . Ž .Certified indicative Experimental Certified indicative Experimental
Mean R.S.D. Mean R.S.D. Recovery Mean R.S.D. Mean R.S.D. RecoveryŽ . Ž .% %
Ž . Ž .Mn 547 ND 530 0.79 97 1600 ND 1560 0.80 98Ž .Be ND ] 2.07 9.9 ] 1.6 ND 1.81 21 113
Ž .Ba ND ] 234 2.2 ] 324 ND 300 0.81 93Sc ND ] 9.93 3.4 ] 9.0 1.3 9.17 2.9 102
Ž .V ND ] 87.7 1.8 ] 102 ND 101 0.39 99Ž .Cr 75 ND 72.7 3.1 97 192 3.6 172 1.1 90Ž . Ž .Co 9.2 ND 10.9 4.2 118 17 ND 16.3 1.3 96Ž .Ni 30.9 ND 33.8 4.8 109 43.4 3.7 45.3 1.4 104
Cu 32.6 4.3 34.3 5.5 106 101.7 1.6 105 0.79 103Zn 81.3 4.6 83.4 2.9 103 547 2.2 585 0.69 107Y ND ] 18.1 1.6 ] ND ] 33.2 0.41 ]
Ž .Mo ND ] 0.56 7.7 ] 1.5 ND 1.59 2.1 106Ž .As 8 ND 7.68 1.1 ] 47.3 3.4 42.8 1.4 90
Cd 0.36 27.8 0.30 12.4 83 11.9 3.4 11.6 1.3 97In ND ] 0.054 7.5 ] ND ] 0.32 11 ]
Ž .Sb ND ] 0.84 36 ] 4 ND 3.25 6.5 81Au ND ] 0.37 77 ] ND ] 0.19 21 ]
Sn ND ] 2.03 15 ] ND ] 7.55 7.0 ]
Bi ND ] 0.58 11 ] ND ] 3.66 2.8 ]
Tl ND ] 0.55 2.5 ] ND ] 1.01 3.0 ]
Pb 29.4 8.8 27.7 4.0 94 146 2.1 145 1.1 99Ž .U ND ] 1.55 2.0 ] 3 ND 2.5 0.54 83
Th ND ] 10.7 3.3 ] ND ] 8.92 4.6 ]
a ND, not determined; R.S.D., relative standard deviation.
non-parametric test was used. A significance levelof P-0.05 was used throughout the study. The
Ž .Sigmastat 1992 analysis program of the JandelCorporation was used for the statistical analysis.
3. Results and discussion
3.1. Soil characteristics
Table 2 shows some characteristics of the soils.The pH of the unaffected soils ranged from 7.0 to7.8, while the pH of the affected soils rangedfrom 5.8 to 7.8. Minima of the pH range of some
Žsamples of affected soils S2, S4, L1, L2, A3, M2,.and M3 were lower than those of the corre-
Ž .sponding unaffected soils S1, S2, A2, and M1 .Generally, the lowest pH coincided with the lowestCaCO contents. The lowest mean values of pH3
in the studied soils were found in the sample ofŽ .Las Doblas D , which had the lowest mean val-
ues of CaCO and clay content.3
3.2. Hea¨y metal contents of soils
Available data on the composition of the acidicŽ y1water of the slurry pH 5.5, As 0.27 mg l , Cd
0.85 mg ly1, Cr 0.039 mg ly1, Cu 0.021 mg ly1, Hg0.008 mg ly1, Mn 91 mg ly1, Ni 1.1 mg ly1, Pb 3.6
y1 y1. Žmg l , Zn 462 mg l Consejerıa de Medio´.Ambiente, 1998 indicated that soils affected by
the flood received large amounts of dissolvedheavy metals.
Heavy metals entering the soil in particulateform can be deduced from the analysis of thesludge samples. Table 3 shows mean heavy metalconcentrations and ranges in the samples ofsludges covering the affected soil, compared with
()
F.C
abreraetal.r
The
Scienceofthe
TotalE
n¨ironment242
1999117
]129122Table 2
aŽ .Some characteristics of soils 0]50 cm
b c dŽ . Ž . Ž . Ž . Ž .Sample Longitude Latitude Prof. cm pH CaCO % Sand % Silt % Clay % Mean texture3
Unaffected soilsS1 W 068 129 230 N 378 279 290 0]50 7.7 16.7 8.7 49.0 42.4 Silty clay
Ž . Ž . Ž . Ž . Ž .7.5]7.8 16.2]17.2 6.3]10.5 47.5]50.2 41.9]42.9S3 W 068 129 250 N 378 279 290 0]65 7.8 16.6 17.7 47.9 34.5 Silty clay loam
Ž . Ž . Ž . Ž . Ž .7.7]7.8 16.0]17.4 15.4]21.0 47.6]48.1 33.7]35.7L4 W 068 139 580 N 378 219 540 0]45 7.4 - 1 19.3 48.5 23.0 Loam
Ž . Ž . Ž . Ž .7.3]7.5 11.5]30.2 45.1]52.6 20.4]25.3PA1 W 068 159 390 N 378 189 210 0]50 7.4 - 1 25.3 38.5 36.2 Clay loam
Ž . Ž . Ž . Ž .7.0]7.5 18.7]33.2 33.8]43.6 33.1]37.4A2 W 068 159 580 N 378 189 100 0]50 7.5 - 1 24.5 33.6 41.9 Clay
Ž . Ž . Ž . Ž .7.0]7.6 22.2]27.7 31.7]35.5 41.2]42.6M1 W 068 119 230 N 378 119 140 0]50 7.4 6.8 4.2 48.5 47.3 Silty clay
Ž . Ž . Ž . Ž . Ž .7.0]7.6 6.3]7.8 3.5]5.1 47.9]49.7 46.4]48.2Affected soilsS2 W 068 129 310 N 378 279 300 0]50 7.6 17.1 9.7 44.6 45.8 Silty clay
Ž . Ž . Ž . Ž . Ž .7.3]7.8 15.4]18.9 8.1]11.8 41.1]46.9 44.9]47.1S4 W 068 129 310 N 378 279 300 0]55 7.3 16.6 12.1 49.1 38.7 Silty clay loam
Ž . Ž . Ž . Ž . Ž .7.1]7.5 15.7]21 9.2]47.3 47.3]52.3 36.3]41.3D W 068 139 510 N 378 239 000 0]50 6.9 - 1 48.4 33.9 17.8 Loam
Ž . Ž . Ž . Ž .6.3]7.2 31.5]86.3 9.1]46.0 5.5]23.2L1 W 068 139 490 N 378 219 470 0]50 7.4 14.0 20.2 49.2 30.6 Silty clay loam
Ž . Ž . Ž . Ž . Ž .7.0]7.7 12.0]15.7 13.5]25.4 46.0]53.6 28.9]33.2L2 W 068 139 510 N 378 219 510 0]50 7.3 14.3 24.5 48.4 27.1 Clay loam
Ž . Ž . Ž . Ž . Ž .7.0]7.6 12.9]16.6 12.5]37.8 42.2]52.8 24.8]30.3L3 W 068 139 550 N 378 219 490 0]45 7.4 4.6 23.6 44.5 27.0 Clay loam
Ž . Ž . Ž . Ž . Ž .7.0]7.6 0.0]8.1 18.6]31.8 43.2]53.3 25.0]28.4PA2 W 068 159 390 N 378 189 210 0]50 7.6 15.0 3.3 41.4 55.4 Silty clay
Ž . Ž . Ž . Ž . Ž .7.4]7.7 13.4]16.2 8.2]5.5 39.7]44.3 50.3]57.4A1 W 068 159 580 N 378 189 100 0]50 7.2 7.0 63.2 25.6 11.2 Sandy loam
Ž . Ž . Ž . Ž . Ž .7.0]7.5 6.1]7.5 44.1]78.0 22.2]34.2 8.3]15.4A3 W 068 159 580 N 378 189 100 0]50 7.0 3.3 17.9 38.3 43.9 Clay
Ž . Ž . Ž . Ž . Ž .6.3]7.3 -1]8.2 14.5]21.2 34.7]41.9 43.6]44.2Q W 068 159 550 N 378 149 470 0]40 7.2 6.8 37.9 35.9 26.3 Loam
Ž . Ž . Ž . Ž . Ž .7.0]7.4 6.5]7.0 37.4]38.4 34.8]36.9 25.0]27.6M2 W 068 119 100 N 378 119 150 0]50 7.0 7.1 12.2 50.4 37.4 Silty clay loam
Ž . Ž . Ž . Ž . Ž .5.8]7.5 0.0]9.7 6.6]23.2 43.4]60.4 31.4]44.0M3 W 068 119 100 N 378 119 150 0]50 7.5 12.0 20.2 54.6 25.4 Silt loam
Ž . Ž . Ž . Ž . Ž .7.0]7.7 10.1]13.4 7.3]30.2 49.9]63.6 20.1]38.3
a Ž .Mean value range .b2]0.05 mm.c50]2 mm.d -2 mm.
( )F. Cabrera et al. r The Science of the Total En¨ironment 242 1999 117]129 123
Table 3y1Ž .Mean concentration and range mg kg of heavy metals in
samples of sludge compared with normal ranges in soils
Element Normal soilSludgearangeMean Range
As 2878 1028]4022 0.1]40Au 0.55 0.25]0.90 0.01]0.02Ba 564 324]742 10]3000Be 0.75 0.12]2.24 0.01]40Bi 61.8 25.2]78.8 0.1]13Cd 25.1 15.1]36.4 0.01]2Co 43.8 26.2]55.4 0.05]65Cr 51.7 29.4]67.7 5]1500Cu 1552 715]2035 2]250In 2.19 0.00]2.88 0.7]3Mn 647 393]954 20]10000Mo 6.77 2.74]8.28 0.1]40Ni 15.9 10.1]23.2 2]750Pb 7888 3664]9692 2]300Sb 669 269]797 0.2]10Sc 4.66 2.33]9.63 0.5]55Sn 14.7 3.02]22.6 1]200Th 3.35 1.31]9.70 1]35Tl 51.6 28.3]61.8 0.1]0.8U 1.82 1.34]2.21 0.7]9V 34.8 19.3]48.6 3]500Y 6.38 2.55]15.3 10]250Zn 7096 4424]10950 1]900
a Ž .Bowen 1979 .
Ž .normal ranges in soils Bowen, 1979 . Only nineŽ .elements As, Au, Bi, Cd, Cu, Pb, Sb, Tl and Zn
out of the 23 analysed in the sludge samplespresent higher concentrations than the upper limitof the normal ranges in soils. Therefore, a firstassumption is that those elements could pollutethe soils on which the sludge was deposited.
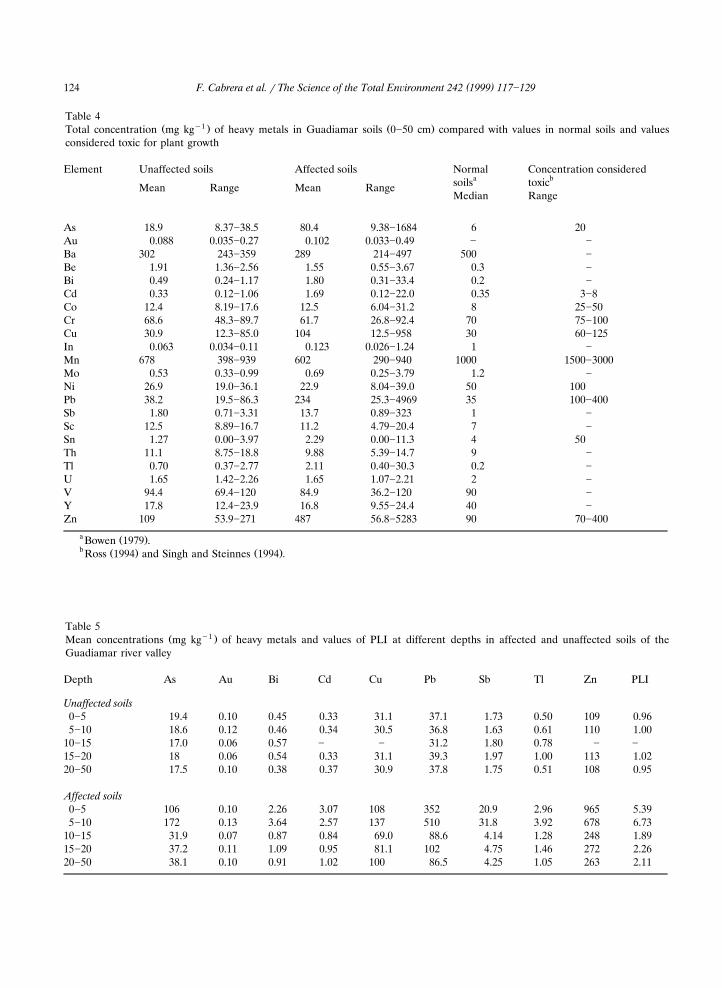
Mean concentrations of As, Au, Bi, Cd, Cu, Pb,Sb, Tl and Zn in the 0]50-cm layer of affected
Žsoils were higher than in unaffected soils Table.4 . Mean concentrations of As, Au, Pb, Sb, Tl,
and Zn in sludge-affected soils were also higherthan the upper limits of the ranges of normal
Ž .soils shown in Table 3 Bowen, 1979 . Mean con-centration values of Bi, Cd and Cu in affectedsoils were within the ranges of normal soils, al-though some individual values of these elementsexceeded the upper limit of those ranges. Avail-able data in the literature show that many of theindividual values of As, Cd, Cu, Pb and Zn con-
Ž .centration in affected soils Table 4 can be con-Žsidered toxic for plant growth Ross, 1994; Singh
.and Steinnes, 1994 .Table 5 shows that mean heavy metal concen-
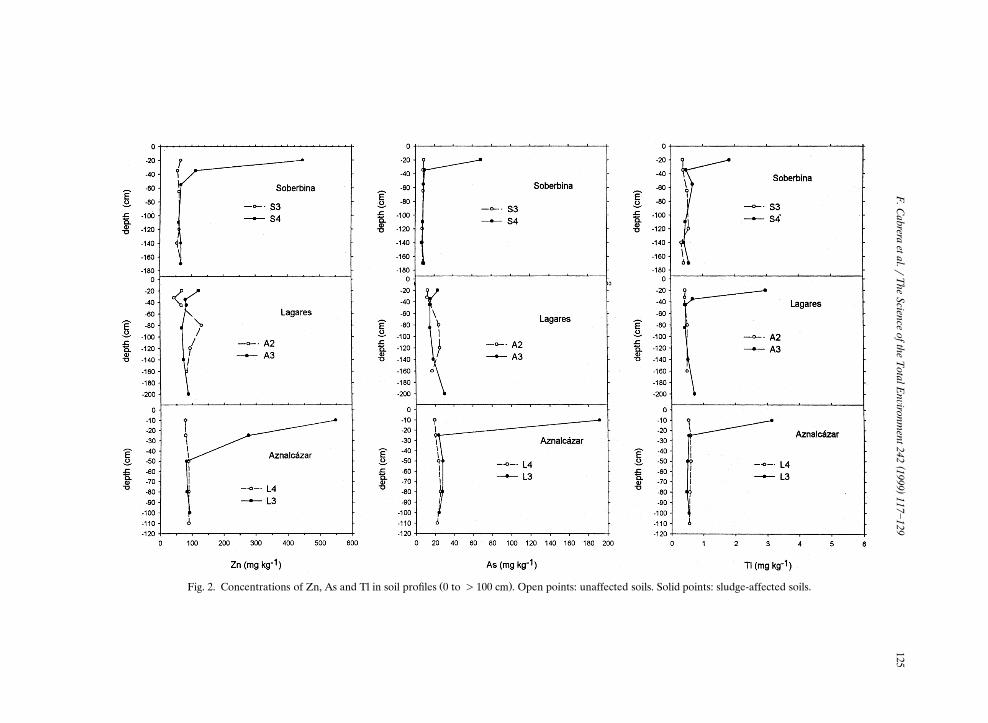
Ž .trations at different depths in the 0]50 cm soillayer of affected soils were higher than the corre-sponding values in unaffected soils. Mean con-centrations of heavy metals in unaffected soilswere very similar throughout the profile, while inaffected soils they tended to decrease with depth.In affected soils with textures from clay loam tosilty clay loam, heavy metal concentrations belowthe 0]50-cm layer were similar to those in thecorresponding unaffected soils. As an example,Fig. 2 shows the concentration trends of Zn, As
Ž .and Tl in three profiles 0 to )100 cm of af-Ž .fected soils of S4, A3 and L3 compared with
Žthose in the corresponding unaffected soils S3,.A2 and L4 .
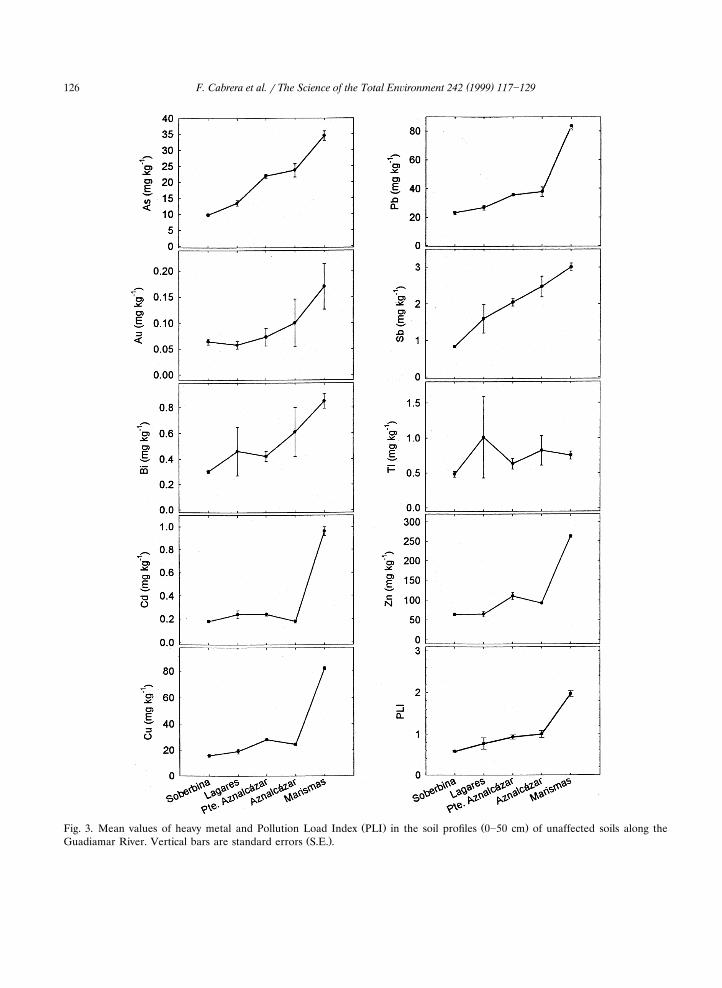
To calculate the PLI values of each samplingsite, the background values of the studied soilswere estimated as mean concentration of As, Au,Bi, Cd, Cu, Pb, Sb, Tl and Zn in unaffected soilsŽ .Table 4 . Background values of Cd, Cu, and Pbwere very close to the median for normal soilsŽ .Bowen, 1979 , but those of As, Bi, Sb, Tl and Zn,were respectively 3.2, 2.5, 1.8, 3.5, and 1.2 timeshigher than the median for normal soils. As men-tioned above, concentration in unaffected soilswere constant throughout the profile. However,
Ž .mean values in the profiles 0]50 cm tended toincrease downstream, especially at the last sam-
Ž . Ž .pling site Marismas Fig. 3 . The same has alsoŽ .been reported by IGME 1998 . This increase is a
consequence of flash flood events, to which theriver-bank soils have frequently been subjected.Waters of the Guadiamar river are characterisedby high heavy metal contents, which increase inflood events, due to the transport of heavy metal-rich solids precipitated upstream on the Agrio
Žand Guadiamar river beds Cabrera et al., 1984,.1987; Arambarri et al., 1996 . For this reason, PLI
mean values of unaffected soils increase down-stream from 0.58 in Soberbina to 1.97 in Maris-
Ž .mas Fig. 3 . Therefore, PLI underestimates oroverestimates the heavy metal pollution level inupstream or downstream samples, respectively.
Generally, PLI values in sludge-affected soils
( )F. Cabrera et al. r The Science of the Total En¨ironment 242 1999 117]129124
Table 4y1Ž . Ž .Total concentration mg kg of heavy metals in Guadiamar soils 0]50 cm compared with values in normal soils and values
considered toxic for plant growth
Element Normal Concentration consideredUnaffected soils Affected soilsa bsoils toxicMean Range Mean Range
Median Range
As 18.9 8.37]38.5 80.4 9.38]1684 6 20Au 0.088 0.035]0.27 0.102 0.033]0.49 ] ]
Ba 302 243]359 289 214]497 500 ]
Be 1.91 1.36]2.56 1.55 0.55]3.67 0.3 ]
Bi 0.49 0.24]1.17 1.80 0.31]33.4 0.2 ]
Cd 0.33 0.12]1.06 1.69 0.12]22.0 0.35 3]8Co 12.4 8.19]17.6 12.5 6.04]31.2 8 25]50Cr 68.6 48.3]89.7 61.7 26.8]92.4 70 75]100Cu 30.9 12.3]85.0 104 12.5]958 30 60]125In 0.063 0.034]0.11 0.123 0.026]1.24 1 ]
Mn 678 398]939 602 290]940 1000 1500]3000Mo 0.53 0.33]0.99 0.69 0.25]3.79 1.2 ]
Ni 26.9 19.0]36.1 22.9 8.04]39.0 50 100Pb 38.2 19.5]86.3 234 25.3]4969 35 100]400Sb 1.80 0.71]3.31 13.7 0.89]323 1 ]
Sc 12.5 8.89]16.7 11.2 4.79]20.4 7 ]
Sn 1.27 0.00]3.97 2.29 0.00]11.3 4 50Th 11.1 8.75]18.8 9.88 5.39]14.7 9 ]
Tl 0.70 0.37]2.77 2.11 0.40]30.3 0.2 ]
U 1.65 1.42]2.26 1.65 1.07]2.21 2 ]
V 94.4 69.4]120 84.9 36.2]120 90 ]
Y 17.8 12.4]23.9 16.8 9.55]24.4 40 ]
Zn 109 53.9]271 487 56.8]5283 90 70]400
a Ž .Bowen 1979 .b Ž . Ž .Ross 1994 and Singh and Steinnes 1994 .
Table 5y1Ž .Mean concentrations mg kg of heavy metals and values of PLI at different depths in affected and unaffected soils of the
Guadiamar river valley
Depth As Au Bi Cd Cu Pb Sb Tl Zn PLI
Unaffected soils0]5 19.4 0.10 0.45 0.33 31.1 37.1 1.73 0.50 109 0.965]10 18.6 0.12 0.46 0.34 30.5 36.8 1.63 0.61 110 1.00
10]15 17.0 0.06 0.57 ] ] 31.2 1.80 0.78 ] ]
15]20 18 0.06 0.54 0.33 31.1 39.3 1.97 1.00 113 1.0220]50 17.5 0.10 0.38 0.37 30.9 37.8 1.75 0.51 108 0.95
Affected soils0]5 106 0.10 2.26 3.07 108 352 20.9 2.96 965 5.395]10 172 0.13 3.64 2.57 137 510 31.8 3.92 678 6.73
10]15 31.9 0.07 0.87 0.84 69.0 88.6 4.14 1.28 248 1.8915]20 37.2 0.11 1.09 0.95 81.1 102 4.75 1.46 272 2.2620]50 38.1 0.10 0.91 1.02 100 86.5 4.25 1.05 263 2.11
()
F.C
abreraetal.r
The
Scienceofthe
TotalE
n¨ironment242
1999117
]129125
Ž .Fig. 2. Concentrations of Zn, As and Tl in soil profiles 0 to )100 cm . Open points: unaffected soils. Solid points: sludge-affected soils.
( )F. Cabrera et al. r The Science of the Total En¨ironment 242 1999 117]129126
Ž . Ž .Fig. 3. Mean values of heavy metal and Pollution Load Index PLI in the soil profiles 0]50 cm of unaffected soils along theŽ .Guadiamar River. Vertical bars are standard errors S.E. .
( )F. Cabrera et al. r The Science of the Total En¨ironment 242 1999 117]129 127
Ž .decrease downward in the profile Fig. 4 . In mostof these soils, PLI values are very high in thesuperficial layers, indicating severe heavy metalpollution. In soils S2, S4, L1]L3, PA2, A3 andM2, the PLI values below the 10]20-cm layertended to reach the characteristic values of unaf-fected soils. However, in soil D between 10 and50 cm, and in soil A1 between 20 and 80 cm, thePLI values still indicate heavy metal pollution. Acompletely different pattern was found in soil M3,
in which the superficial layer was less contami-nated than the deepest layer.
The clay content of soils S2, S4, L1]L3, PA2,Ž .A3, and M2 open points was higher than 25%,
while most of the points belonging to soils D, A1,Ž . Žand M3 solid points are below 25% of clay Fig.
.5 . The first group comprises soils in which heavyŽ .metals did not penetrate below 20 cm Fig. 4 ,
while the second group includes soils in whichvalues of PLI below 20 cm indicate heavy metal
Ž .Fig. 4. Values of the Pollution Load Index PLI throughout the soil profile in sludge-affected soils.
( )F. Cabrera et al. r The Science of the Total En¨ironment 242 1999 117]129128
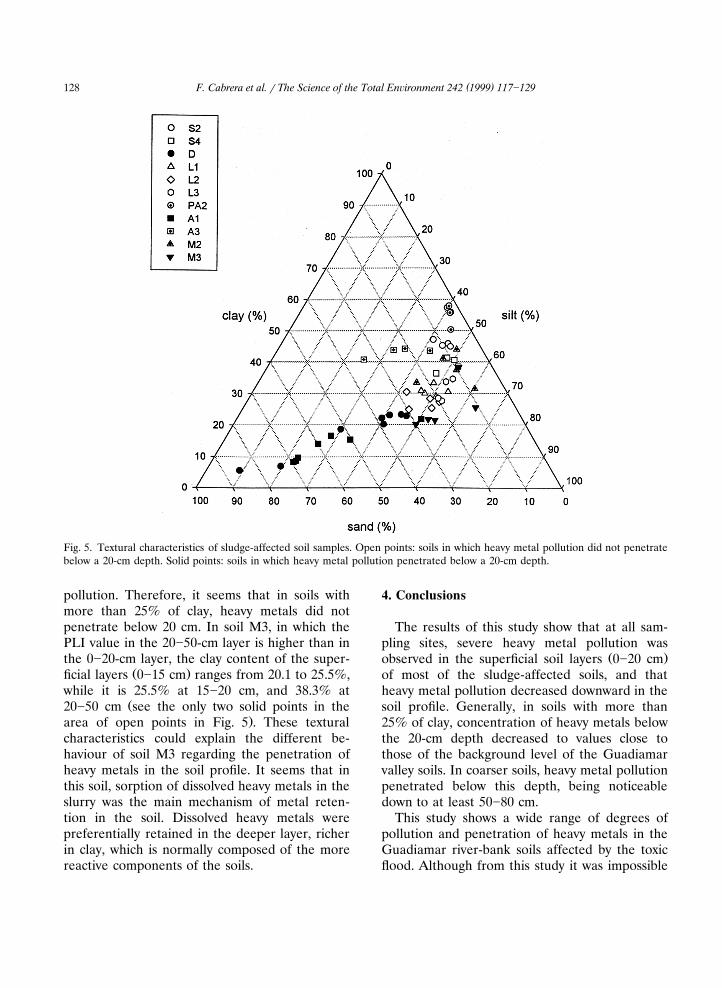
Fig. 5. Textural characteristics of sludge-affected soil samples. Open points: soils in which heavy metal pollution did not penetratebelow a 20-cm depth. Solid points: soils in which heavy metal pollution penetrated below a 20-cm depth.
pollution. Therefore, it seems that in soils withmore than 25% of clay, heavy metals did notpenetrate below 20 cm. In soil M3, in which thePLI value in the 20]50-cm layer is higher than inthe 0]20-cm layer, the clay content of the super-
Ž .ficial layers 0]15 cm ranges from 20.1 to 25.5%,while it is 25.5% at 15]20 cm, and 38.3% at
Ž20]50 cm see the only two solid points in the.area of open points in Fig. 5 . These textural
characteristics could explain the different be-haviour of soil M3 regarding the penetration ofheavy metals in the soil profile. It seems that inthis soil, sorption of dissolved heavy metals in theslurry was the main mechanism of metal reten-tion in the soil. Dissolved heavy metals werepreferentially retained in the deeper layer, richerin clay, which is normally composed of the morereactive components of the soils.
4. Conclusions
The results of this study show that at all sam-pling sites, severe heavy metal pollution was
Ž .observed in the superficial soil layers 0]20 cmof most of the sludge-affected soils, and thatheavy metal pollution decreased downward in thesoil profile. Generally, in soils with more than25% of clay, concentration of heavy metals belowthe 20-cm depth decreased to values close tothose of the background level of the Guadiamarvalley soils. In coarser soils, heavy metal pollutionpenetrated below this depth, being noticeabledown to at least 50]80 cm.
This study shows a wide range of degrees ofpollution and penetration of heavy metals in theGuadiamar river-bank soils affected by the toxicflood. Although from this study it was impossible

( )F. Cabrera et al. r The Science of the Total En¨ironment 242 1999 117]129 129
to make a general recommendation for the reme-diation of these soils, an immediate suggestion forthe ‘cleaning’ of the soils was to remove the layerof deposited sludge, together with the first 0]20-cm layer of the soil. With this soil management,most of the finer-textured soils would have levelsof polluting elements close to the background
Ž .level of the area. A later deep ploughing 20 cmwould mix the soil within the ploughed depth,distributing and diluting pollutants throughoutthis depth. In coarser-textured soils, in whichpollutants penetrated deeper, the solution would
Žbe the application of amendments e.g. lime, iron,.aluminium and manganese oxides, zeolites to
increase immobilisation of the pollutants, pre-venting leaching to ground water and uptake byplants. In any case, a programme of monitoringthe bioavailability of pollutants in ‘cleaned’ soilswould be an important tool to provide a warningof pollutant transfer between components of theair]water]soil]plant]animal system.
Acknowledgements
This work was carried out with the financialsupport of the Consejo Superior de Investiga-ciones Cientıficas. Total heavy metal concentra-´tions were determined in the Departamento deMineralogıa y Petrograf ıa of the Universidad de´ ´Granada. We wish to thank Dr C. Maqueda forher co-operation during the first stages of thiswork and Mr D. Moreno for the adaptation of themap.
References
Adriano DC. Trace elements in the terrestrial environment.New York: Springer-Verlag, 1986:533.
Arambarri P, Cabrera F, Gonzalez-Quesada R. Quality evalu-´ation of the surface waters entering the Donana National˜
Ž .Park SW Spain . Sci Total Environ 1996;191:185]196.Bowen HJM. Environmental chemistry of the elements. Lon-
don: Academic Press, 1979:333.Cabrera F, Toca CG, Dıaz E, Arambarri P. Acid mine]water´
and agricultural pollution in a river skirting the Donana˜Ž .National Park Guadiamar river, south west Spain . Water
Res 1984;18:1469]1482.
Cabrera F, Soldevilla M, Cordon R, Arambarri P. Heavy´metal pollution in the Guadiamar river and the
Ž .Guadalquivir estuary south west Spain . Chemosphere1987;16:463]468.
Colinet E, Gonska H, Griepink B, Muntau H. The certifica-tion of the contents of cadmium, copper, mercury, lead andzinc in a calcareous loam soil. BCR Information, Reportno. EUR 8833 EN. ECSC-EEC-EAEC, Brussels, 1983.
Consejerıa de Medio Ambiente. Junta de Andalucıa. Acci-´ ´dente minero en Aznalcollar y repercusiones ecologicas en´ ´el entorno de Donana. www.cma.caan.es. Junta de˜Andalucıa, Sevilla, 1998.´
Demolon A, Leroux D. Guide pour l’etude experimental dessols. Paris: Gautier Villars, 1952:251.
Forstner U, Wittmann GTW. Metal pollution in the aquatic¨environment. Berlin: Springer-Verlag, 1983:486.
Gee GW, Bauder JW. Particle-size analysis hydrometer: asimplified method for routine textural analysis and a sensi-tive test of measurement parameters. Soil Sci Soc Am J1979;43:1004]1007.
ŽGriepink B, Muntau H. The certification of the contents mass.fractions of As, Cd, Cr, Cu, Hg, Ni, Pb, Sc, Se and Zn in
three sediments. BCR Information, Report no. EUR 11850EN. ECSC-EEC-EAEC, Brussels, 1988.
Hesse PR. A textbook of soil chemical analysis. London: JohnMurray Publishers, 1971:520.
IGME. Contribucion al establecimiento del fondo geoquımico´ ´previo a la rotura de la balsa minera de Aznalcollar, en el´
Ž .aluvial del rıo Guadiamar Sector Aznalcollar-Entremuros .´ ´Instituto Tecnologico Geominero de Espana, Ministerio de´ ˜Medio Ambiente, Madrid, 1998:31.
Ross SM. Sources and forms of potentially toxic metals insoil]plant systems. In: Ross SM, editor. Toxic metals insoil]plant system. Chichester: John Wiley & Sons Ltd,1994:3]25.
Selim HM, Amacher MC. Reactivity and transport of heavymetals in soils. Boca Raton, Florida: CRC Lewis Publish-ers, 1997:201.
Sigmastat. Statistical Software Dos. Q Copyright Jandel Cor-poration, 1992.
Singh BR, Steinnes E. Soil and water contamination by heavymetals. In: Lal R, Stewart A, editors. Soil processes andwater quality. Advances in soil science. Boca Raton, Florida:Lewis Publishers, 1994:233]271.
Soil Survey Staff. Keys to soil taxonomy. Soil ConservationService, USDA, Washington, 1994:305.
Tomlinson DL, Wilson JG, Harris CR, Jeffrey DW. Problemsin the assessments of heavy-metal levels in estuaries andformation of a pollution index. Helgol Meeresunters1980;33:566]575.
Williamson A, Johnson MS. Reclamation of metalliferousmine wastes. In: Lepp NW, editor. Effect of heavy metalpollution on plants, vol. 2. Metal in the environment.Barking, Essex: Applied Science Publishers Ltd, 1981:185]212.


![.Noah's Flood WTJ2004[1]](https://static.fdokumen.com/doc/165x107/631c39e73e8acd997705cf6b/noahs-flood-wtj20041.jpg)