Heavy Metal Resistance in the Genus Gluconobacter-Emma BurnleyHeavy Metal Resistance in the Genus...
81
Heavy Metal Resistance in the Genus Gluconobacter by Leigh-Emma Burnley Thesis submitted to the Faculty of Virginia Tech in partial fulfillment of the requirements for the degree of MASTER of SCIENCE in BIOLOGY G. William Claus, Chairman David L. Popham Alan A. Yousten November 10, 2000 Blacksburg, VA Key words: Gluconobacter, plasmids, heavy metal resistance, czc, cadmium, cobalt, zinc, Ralstonia Copyright 2000, Leigh-Emma Burnley Heavy Metal Resistance in the Genus Gluconobacter Leigh-Emma Burnley
-
Upload
universidadnacionalsanluisgonzagadeica -
Category
Documents
-
view
2 -
download
0
Transcript of Heavy Metal Resistance in the Genus Gluconobacter-Emma BurnleyHeavy Metal Resistance in the Genus...
Heavy Metal Resistance in the Genus Gluconobacter
by
Leigh-Emma Burnley
Thesis submitted to the Faculty of Virginia Tech in partial fulfillment of therequirements for the degree of
MASTER of SCIENCEin
BIOLOGY
G. William Claus, Chairman
David L. Popham
Alan A. Yousten
November 10, 2000Blacksburg, VA
Key words: Gluconobacter, plasmids, heavy metal resistance, czc, cadmium,cobalt, zinc, Ralstonia
Copyright 2000, Leigh-Emma BurnleyHeavy Metal Resistance in the Genus Gluconobacter
Leigh-Emma Burnley
(ABSTRACT)
The genus Gluconobacter is industrially important due to the ability to accomplish unusual and
almost complete oxidation reactions (bioconversions) and to contaminate high sugar content products.
Following preliminary evidence that some strains of Gluconobacter were resistant to cadmium, and
realizing that cadmium resistance among gram-negative organisms is often encoded by an operon which
also encodes cobalt and zinc resistance via an efflux mechanism, 10 strains of Gluconobacter were tested
for heavy-metal resistance. Three of the 10 representative strains appeared to be resistant to cadmium
chloride, and two were also resistant to cobalt- and zinc chloride. These strains, as well as two cadmium-
sensitive strains were analyzed using PCR and sequencing to establish gene homology with Ralstonia
eutropha, the most frequently studied Gram-negative bacterium exhibiting cadmium resistance.
Amplification of two genes from the czc operon, known to encode cadmium, cobalt and zinc resistance in
Ralstonia, was attempted in the three resistant and two sensitive strains of Gluconobacter. The gene,
czcA, thought to encode the main pump protein of the efflux mechanism, was found in all Gluconobacter
strains tested. However, amplification of a regulatory gene czcD, thought to sense the extracellular metal
ion concentration, was not possible in the Gluconobacter strains tested. The PCR products were
sequenced and analyzed for homology to the czc operon in Ralstonia. From the data gathered, it appears
as though some strains of Gluconobacter contain at least a portion of the czc operon , encoding cadmium,
cobalt and zinc resistance in Ralstonia eutropha.
ACKNOWLDEGEMENTS
I would like to first thank the members of my graduate committee, Drs. David Popham and Alan Yousten
for their invaluable support and advice throughout this journey. I would especially like to thank my major professor,
Dr. G. William Claus for all of his guidance, support, knowledge, patience, time, and most importantly his sense of
humor and friendship. I certainly never would have made it this far without you, and I will forever be indebted to
you.
I would like to thank all of the 4th floor graduate students for their willingness to listen and console when
nothing was working, and to celebrate when things went well. Thanks to Sally Jewell for listening and for knowing
when I needed an emergency margarita or moral support. Thanks as well to Dan Sisco (even though he's a 5th floor
kind of guy) for his amazing consulting abilities, molecular knowledge, emergency supplies, and most of all, his
ability to brighten the day. To Jennie, Valerie and Joemel - thanks for your company, clean dishes, and help along
the way.
Thanks as well to those who had to live with me (and may have to live with me again!), at any point along
this journey, and to those who just had to put up with me…Heather Bloebaum, Jen Ruleman (Holl), Ansley Jones,
Melissa Bowman, and Kelley Maupin,. Thanks for always listening and understanding. You guys are the best
friends a girl could EVER have. Ansley, the cure for cancer is finally complete!! To Justin Hepner for being my
biggest believer, and never losing faith in me. For making me laugh and for reminding me constantly that happiness
is most important. Jen Anderson, thank you for all of the pep talks, hot meals, grocery shopping, and all of the other
little things you did. You are a saint for putting up with me through all of this.
Most importantly, I'd like to thank my family, without whom, I would never have been able to achieve such
things. My parents, Bob and Georgia Burnley, you are the reason that I made it. You never failed to make me
believe that I could do anything - no matter how hard. You were ALWAYS there…even when I thought no one
was. You were there to support me everyday, and you'll never know what a difference it made. Thank you. Thank
you. Thank you. Thanks for investing so much time, support and money in me, I owe everything to you. Aaron and
Andy, thanks for loving me, and for giving me the most wonderful niece a girl could ever ask for. To Andy, thanks
for being such a great friend and sister…for all of the late night talks and advice. To Dillyn for being so cute, and
for all of the smiles that you brought me. To Uncle Harold, without whom, this never would have happened, thanks
for believing in me and all of your support, moral and otherwise. To Granny for the many free nights at the inn, for
the hot meals, coffee, lunches, willingness to listen, and lots and lots of love. To Grandma for always being there
with a hug when I needed one, and for all of your love.

iv
TABLE OF CONTENTS
LIST OF FIGURES ....................................................................................................................vi
LIST OF TABLES...................................................................................................................viii
REVIEW OF THE LITERATURE ...........................................................................................1Gluconobacter overview................................................................................................1Preliminary testing for heavy metals.............................................................................1Bacterial resistance to heavy metals..............................................................................2
Efflux systems....................................................................................................3Plasmid overview ...........................................................................................................4
Industrial importance.........................................................................................4Plasmids and Gluconobacter .........................................................................................4
Attempted correlation of phenotypic characteristics with plasmid presence.5Antibiotic resistance..............................................................................5Oxidative capability ..............................................................................5Heavy-metal resistance .........................................................................6
Cadmium resistance .......................................................................................................6czc operon...........................................................................................................6
Purpose............................................................................................................................9
MATERIALS AND METHODS.............................................................................................10Bacterial strains and growth conditions......................................................................10Chemicals and materials ..............................................................................................10Heavy metal resistance testing.....................................................................................12
Disk method .....................................................................................................12Broth method....................................................................................................12Spread-plate method........................................................................................12
DNA extractions...........................................................................................................13Buffers and reagents ........................................................................................13Genomic-DNA extraction ...............................................................................13Small-plasmid-DNA extraction ......................................................................14Large-plasmid-DNA extraction ......................................................................14
Polymerase chain reaction ...........................................................................................15Gel electrophoresis .......................................................................................................18
Plasmid size estimation ...................................................................................18PCR-product size estimation...........................................................................19
Sequencing....................................................................................................................19
RESULTS..................................................................................................................................20Heavy metal resistance testing.....................................................................................20
Disk-sensitivity method...................................................................................20Cadmium chloride resistance..............................................................20Alternative salt.....................................................................................20

Cobalt and zinc chloride resistance ....................................................22Resistance testing of Ralstonia eutropha ..........................................22
Broth method....................................................................................................27Resistance testing without EDTA.......................................................27Resistance testing with and equal quantity of EDTA .......................27Resistance testing with an equal concentration of EDTA.................27
Spread-plate method........................................................................................30Examination of Gluconobacter strains for resistance genes......................................32
Amplification of a portion of czcA.................................................................32Amplification of a portion of czcD.................................................................34
Sequencing....................................................................................................................40
DISCUSSION ...........................................................................................................................61Heavy metal resistance testing.....................................................................................61
Finding an appropriate method and defining resistance................................61Resistant strains................................................................................................62
Resistance correlated with plasmid profile .................................................................63Screening for the presence of the czc operon in Gluconobacter...............................64Sequencing....................................................................................................................66
FUTURE RESEARCH SUGGESTIONS ...............................................................................67
CONCLUSIONS.......................................................................................................................68
LITERATURE CITED.............................................................................................................69
CURRICULUM VITAE...........................................................................................................72

vi
LIST OF FIGURES
Figure 1. Proposed model of the czc efflux system ..............................................................8
Figure 2. Chosen sequence of R. eutropha czcA amplified by PCR using the primers czc1and czc2. ....................................................................................................................................16
Figure 3. Chosen sequence of R. eutropha czcD amplified by PCR using the primers czcD1 andczcD2. ........................................................................................................................................17
Figure 4. Gel-electrophoresis image of Ralstonia eutropha PCR products........................33
Figure 5. Gel-electrophoresis image of Gluconobacter czcA PCR products from wholecells ............................................................................................................................................37
Figure 6. Gel-electrophoresis image of Gluconobacter czcA PCR products from the plasmidfraction.......................................................................................................................................38
Figure 7. Gel-electrophoresis image of Gluconobacter czcA PCR products from the genomicfraction.......................................................................................................................................39
Figure 8. Gel-electrophoresis image of Ralstonia eutropha czcD PCR products from the plasmidand genomic fractions...............................................................................................................41
Figure 9. Gel-electrophoresis image of Gluconobacter czcD PCR products from the genomicfraction.......................................................................................................................................42
Figure 10. Gel-electrophoresis image of Gluconobacter czcD PCR products from the plasmidfraction......................................................................................................................................43
Figure 11. DNA sequence obtained using primers designed to amplify (using PCR) part of theRalstonia czcA gene .................................................................................................................44
Figure 12. DNA sequences obtained using primers designed to amplify (using PCR) part of theRalstonia czcD gene .................................................................................................................45
Figure 13. DNA sequences obtained using primers designed to amplify (using PCR) part of theGluconobacter czcA gene ........................................................................................................46
Figure 14. Alignment of nucleotide sequences of the czcA-PCR products formed fromthe small-plasmid fraction and the published sequence from Ralstonia eutropha...............48
Figure 15. Alignment of nucleotide sequences of the czcA-PCR products formed fromthe Gluconobacter genomic fractions .....................................................................................50

Figure 16. Alignment of nucleotide sequences of the czcA-PCR products formed fromthe Gluconobacter genomic fractions and the plasmid fraction ............................................54
Figure 17. Alignment of nucleotide sequences of the czcD-PCR products formed fromthe Ralstonia eutropha plasmid and genomic fractions .........................................................58
viii
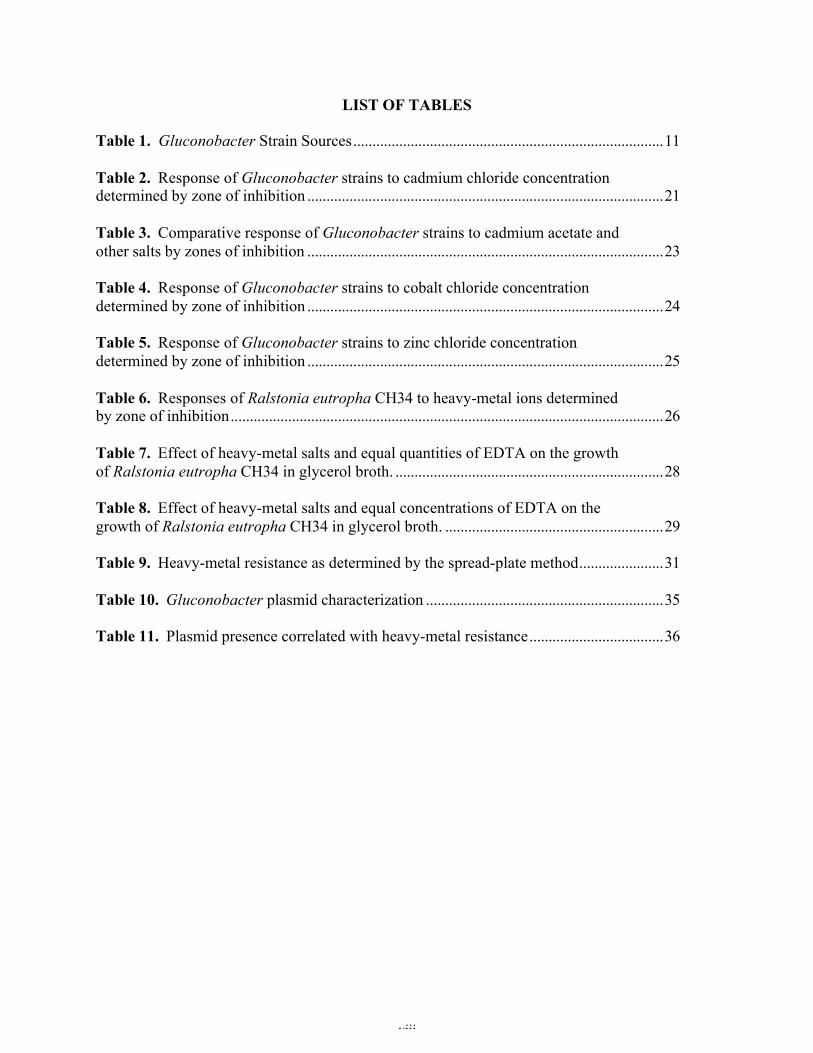
LIST OF TABLES
Table 1. Gluconobacter Strain Sources.................................................................................11
Table 2. Response of Gluconobacter strains to cadmium chloride concentrationdetermined by zone of inhibition .............................................................................................21
Table 3. Comparative response of Gluconobacter strains to cadmium acetate andother salts by zones of inhibition .............................................................................................23
Table 4. Response of Gluconobacter strains to cobalt chloride concentrationdetermined by zone of inhibition .............................................................................................24
Table 5. Response of Gluconobacter strains to zinc chloride concentrationdetermined by zone of inhibition .............................................................................................25
Table 6. Responses of Ralstonia eutropha CH34 to heavy-metal ions determinedby zone of inhibition.................................................................................................................26
Table 7. Effect of heavy-metal salts and equal quantities of EDTA on the growthof Ralstonia eutropha CH34 in glycerol broth. ......................................................................28
Table 8. Effect of heavy-metal salts and equal concentrations of EDTA on thegrowth of Ralstonia eutropha CH34 in glycerol broth. .........................................................29
Table 9. Heavy-metal resistance as determined by the spread-plate method......................31
Table 10. Gluconobacter plasmid characterization ..............................................................35
Table 11. Plasmid presence correlated with heavy-metal resistance...................................36
REVIEW OF THE LITERATURE
Gluconobacter OVERVIEW
The genus Gluconobacter, which belongs to the family Acetobacteriaceae, consists of short,
Gram-negative rods commonly associated with “sugar-enriched” environments such as fruits, flowers,
cider, beer, wine, baker’s yeast, and soft drinks (5, 32).
This genus has the unique ability to aerobically produce large volumes of partially oxidized
compounds such as L-sorbose, D-gluconic acid, 5-keto- and 2-ketogluconic acid, acetate, D-tartaric and
dihydroxyacetone through single step oxidations (5). The enzymes utilized to carry out these incomplete
oxidations are predominately plasma-membrane-bound, NADP-independent dehydrogenases. Although
some additional catabolism is possible if the energy source is transported across the plasma membrane,
the gluconobacters are incapable of complete oxidation to carbon dioxide. In one species that was
investigated, succinic dehydrogenase was absent, so the bacteria were unable to use the tricarboxylic acid
cycle to oxidize acetate to CO2 and H2O (9).
The industrial appeal of these organisms is evident in their ability to partially oxidize and
quantitatively excrete these compounds into the surrounding medium. The gluconobacters are used
industrially for one of the steps in the production of vitamin C (the production of the intermediate, 2,5-
diketogluconate).
PRELIMINARY TESTING FOR HEAVY METAL RESISTANCE
Joshua Munger, an undergraduate in Dr. Claus’ laboratory, began the study of heavy metal
resistance among the gluconobacters by testing two strains for resistance to three heavy metals: lead,
mercury and cadmium. These metals were chosen due to the likelihood that the gluconobacters may have
been exposed to them in their natural environment. Realizing that the gluconobacters are commonly
found in sugary environments like fruits (5), Munger learned lead, mercury, and cadmium were heavy
metals commonly found in pesticides, fertilizers, and other chemicals in fruit orchards (20). In addition,
he found that cadmium is also a common contaminant of freshwater and soils, due to its use in many
industrial processes (22). Since fruits are generally grown outdoors in the soil, and treated with pesticides,
it is evident how the gluconobacters may come into contact with lead, mercury, and cadmium compounds.
Using the saturated disk method, common to antibiotic resistance testing, Munger developed a
2
protocol for impregnating filter paper disks with solutions containing the chloride salts of lead, mercury
and cadmium. These disks were then placed onto agar plates, which were spread with one of two strains
of G. oxydans (either ATCC 621 or IFO 3244). After approximately 72 hours of incubation, the plates
were observed for zones of inhibition surrounding the metal-chloride saturated disks. Munger observed
characteristic zones of inhibition surrounding all cadmium-containing disks on all plates containing G.
oxydans strain IFO 3244, but not on plates prepared with ATCC strain 621. A similar correlation was not
apparent with the other metals tested, because both strains were sensitive to all lead chloride and mercuric
chloride concentrations (20).
BACTERIAL RESISTANCE TO HEAVY METALS
I found that the definition of the term “heavy metals” is somewhat ambiguous and varies
according to source. According to Dr. Larry Taylor of the Virginia Tech Chemistry Department, there is
no “hard and fast definition” (personal communication). However, for the purpose of this project, I
considered the heavy metals to include silver, antimony, arsenic, cadmium, chromium, cobalt, copper,
lead mercury, nickel, tellurium, thallium, and zinc. These elements were chosen based on their re-
occurrence in the literature that details bacterial resistance to heavy-metal ions (22, 34, 35, 36).
Heavy metals are often required by the cell in trace amounts for biochemical reactions, however,
at higher concentrations, they can have toxic effects (23). The cell may use the low concentrations of
some heavy metals (such as iron, copper and nickel) in redox reactions, or other heavy-metal ions (such
as magnesium or zinc) to stabilize electrostatic forces, and still others (such as Mg2+, in MgATP or Zn2+)
in enzymes and DNA binding proteins. Other heavy-metal ions (including Fe2+, Mg2+, Ni2+, and Co2+ )
form complex compounds such as iron-sulfur clusters that have diverse functions. Many heavy-metal
ions are needed to counteract negatively charged cellular building blocks and metabolites (28).
At concentrations above trace amounts, many heavy metals become toxic to the cell by forming
unspecific compounds and tying up nutrients that are needed by the cell. For example, heavy metals with
high atomic numbers (such as mercury, cadmium, and silver) often bind to sulfhydryl groups and thereby
inhibit the activity of certain enzymes by interacting with ligands present in all enzymes (28). Some
heavy metals also interact with physiological ions and inhibit the activity of that ion. Other heavy metals
bind glutathione in Gram-negative bacteria, and the resulting complex reacts with molecular oxygen to
form bisglutathione, the metal cation, and hydrogen peroxide which is toxic to the cell (28). Heavy

metals can also interfere with the metabolism of a structurally related non-metal, since the cellular metal-
binding sites are never entirely specific for a single metal, and metals with similar structures and charge
can often bind competitively (15). Heavy metals, when present, may bind to any or all of these sites and
compounds, however, some sites are considered more “sensitive” than others and therefore, binding at
these sites causes more damage to the cell than binding at other, less “sensitive” sites (28). This
explanation allows for an understanding of why most cells are protected to some extent against low heavy
metal concentrations, and why higher concentrations are often more toxic.
Due to the presence of highly concentrated areas of heavy metals in the environment, heavy metal
resistance mechanisms are commonly found in bacterial genomes. There is some debate as to when these
resistance genes may have been formed. One theory is that the resistance genes were present when
bacteria evolved into a world already polluted with heavy metals from volcanic activity and other
geological events. Another suggests that these genes arose much later, after humans polluted the world
(11, 32). Regardless of when these genes may have arisen, heavy metal resistance is known to be a
common phenotypic characteristic encoded by plasmids. Simon Silver says that there is “no general
mechanism for resistance to all heavy metal ions” (34). However, he goes on to say that, the mechanisms
of resistance usually involve either enzymatic detoxification or efflux pumping (34).
Efflux systems
Efflux systems, which essentially pump the toxic ions out of the cell prohibiting them from
accumulating to levels high enough to inhibit growth or cause cell death, are the most common
mechanism of “heavy metal” resistance (34). Resistance systems to all metals other than mercury appear
to use one of several variations of the energy-dependent efflux mechanism of detoxification. Efflux
detoxification may involve both the plasma-membrane-bound ATPases, which are cation pumps that form
a phosphorylated intermediate during the catalytic cycle (25), and the plasma-membrane-bound
chemiosmotic cation/proton antiporters (22). It seems logical to me, that it would be more metabolically
favorable to prohibit the entrance of these ions into the cell rather than to allow them to enter and
subsequently have to expend the energy to expel them. However, according to Dietrich Nies (22), the
energy required to maintain such a specific pump or gradient far exceeds the “genetic cost of having
plasmid genes in the population that can spread when needed.” Therefore, the normal, non-specific
uptake systems are constitutively expressed and very energy efficient considering that they transport
several types of heavy-metal ions by the same system. However, high concentrations of intracellular
metal ions can interfere with the function and transport of other metal ions (22). Resistance mechanisms,
that are often plasmid-encoded, have evolved to allow the induction of metal-ion efflux systems (22, 25).
4
PLASMID OVERVIEW
Plasmids are usually small, circular, extra-chromosomal, double-stranded DNA molecules which
exist in many bacterial species (37) and have the ability to replicate independently of the chromosome.
While rarely crucial to cell survival, plasmids often, under favorable conditions, confer desirable
phenotypic characteristics upon the cells they inhabit. Among these characteristics are virulence,
biochemical pathways, and both antibiotic and heavy-metal resistance as well as antibiotic production
(29).
Industrial importance of plasmids
Microorganisms form the basis of many industrial processes, such as the production of antibiotics
and other pharmaceuticals and the formation of fermented foods and beverage products. Many of these
processes rely upon plasmid-encoded gene products to aid in the formation of the desired product. These
plasmid-encoded gene products may be the desired product, or may enable the desired product to be
formed though various interactions and complex intracellular systems. These gene products may also
enable the microorganism to survive among the conditions necessary to form or collect the desired
product for the industrial process. Regardless of the way in which the plasmid functions in the process of
interest, the desired product often would not formed in the absence of the plasmid.
One way in which Gluconobacter plasmids may participate in industrially important processes, is
in the formation of the vitamin C intermediate, 2,5-diketogluconate (2,5-DKG). The 2,5-DKG is formed
by a single-step oxidation using a plasma-membrane bound NADP-independent dehydrogenase (31).
Qazi et al. (31) published data which suggested that this enzyme may be plasmid-encoded in this genus.
However, this study is the only one found to date that deals with Gluconobacter plasmid function.
PLASMIDS AND Gluconobacter
While many articles were retrieved using “Gluconobacter” or “plasmid” alone as search
keywords, these two keywords searched together as well as “Gluconobacter and heavy metals” together
returned a very few literature citations. Despite almost no research on the functions of Gluconobacter ,
several studies have shown that most of the examined strains contain plasmids. Fukaya et al. found that

23 of 36 examined Gluconobacter strains contained plasmids (7). Prior to Fukaya’s paper (7), Bruce
Micales (18) screened four Gluconobacter strains for the presence of plasmids. He found that all four
tested strains harbored plasmids, and they ranged in size from 3 to 178 kb. Laura McKibben (16) then
expanded the characterization study to include more strains and she tested for homology among the
strains. Using an alkaline lysis method to remove plasmids from 14 chosen strains of Gluconobacter
species, McKibben determined the plasmid molecular weights and used hybridization techniques to test
for relatedness among plasmids of similar sizes. Of these 14 strains, McKibben found 11 to harbor
plasmids and these varied in size from 2.7 to 260 kb. McKibben’s work was followed by that of Lori
Brookman (2) who conducted similar studies on 22 strains of Gluconobacter species. Brookman found
that 18 of these 22 strains contained plasmids ranging in size from 2 to >54 kb. Plasmids of similar size
were found among different strains in both McKibben and Brookman’s research. Brookman speculated
that these size similarities may indicate the transfer of plasmids among Gluconobacter species over time
(2).
Attempts to correlate phenotypic characteristics with plasmid presence
Other than the suggestion that the NADP-independent dehydrogenase is plasmid encoded (31),
the only other known studies that question which genes are encoded by the Gluconobacter plasmids are
the unpublished works of Brookman (2) and Munger (20). Since plasmids often provide phenotypic
characteristics, including antibiotic resistance and metabolic pathway utilization (oxidative capability),
Brookman attempted to correlate plasmid presence with these phenotypic characteristics (2).
Antibiotic resistance. Brookman (2) chose strains that contained and lacked plasmids to test for
resistance to ampicillin, cephalothin, chloramphenicol, ciprofloxacin, erythromycin, gentamycin,
kanamycin, lincomycin, nitrofurantoin, nitrofurazone, novobiocin, penicillin, streptomycin,
sulfamethoxazole, trimethoprim, and tetracycline. Her results demonstrated that most strains reacted
similarly to these antibiotics, regardless of presence or absence of plasmids. Antibiotic resistance in the
gluconobacters may therefore be chromosomally encoded, or as Brookman states, “some mechanisms of
antibiotic resistance in bacteria are not directly associated with the presence of a particular gene encoding
an enzyme involved in resistance “ (2). Instead, the resistance is due to the fact that the target of the
antibiotic is not present in these cells.
Oxidative capability. Brookman (2) tested the same Gluconobacter strains for their ability to
oxidize 13 substrates. This testing was completed using a tetranitroblue tetrazolium (TNBT) reduction
assay (2) that quantitatively determines the extent of substrate oxidation. The 13 substrates used were:

6
butanediol; glycerol; maltose; mannose; ribitol; butanol; cyclopentanol; fructose; sodium acetate;
raffinose; ethanol; glucose; and sorbitol. Brookman’s results showed that most of the tested strains of
Gluconobacter were able to oxidize most of these 13 substrates, regardless of whether they harbored
plasmids. However, Brookman found that G. oxydans ATCC strain 621 contains at least four plasmids,
and this strain oxidized butanol. Whereas G. oxydans IFO strain 3244 is known to lack plasmids, and this
strain did not oxidize butanol.
Brookman also grew both strains (ATCC 621 and IFO 3244) on agar medium containing butanol
as the sole carbon source, and observed that both strains were able to grow. This may be explained by the
fact that IFO strain 3244 was able to oxidize the butanol slowly over a period of two days incubation
time, a rate much slower than that detectable by the TNBT assay. Of course, this observation may also be
explained by the fact that the butanol oxidative capability may be chromosomally rather than plasmid
encoded (2). Because of past difficulties in curing plasmids from gluconobacter strains (2), Brookman
thought that plasmid transformation experiments might be more successful. However, a marker must be
present on the plasmids to be able to determine if the transformation procedure was successful. At
present, however, we have no marker on any gluconobacter plasmid.
Heavy Metal Resistance. Munger's study of heavy metal resistance was limited to two strains.
Regardless, he found that one strain was resistant to cadmium, while the other strain was sensitive (20).
The presence of cadmium resistance in this genus encouraged me to expand Munger's study.
BACTERIAL RESISTANCE TO CADMIUM
Plasmid-encoded cadmium resistance is documented in many bacterial species including
Alcaligenes eutrophus (6, 10, 11, 14, 21, 24, 25, 27, 30), Alcaligenes xylosoxidans (32), Lactococcus
lactis (3), Staphyococcus aureus (3, 4, 6) and Staphylococcus lugdunensis (6). In the Gram-positive
bacteria, the plasmid-encoded cadmium efflux system, called the CadA resistance system, utilizes the
CadA protein, which is a P-type ATPase (38). However, cadmium resistance in Gram-negative
organisms is a multi-protein chemiosmotic antiport system (34).
Czc operon
The most widely studied organism showing cadmium resistance is the Gram-negative soil
bacterium Ralstonia eutropha (formerly called Alcaligenes eutrophus) strain CH34. This strain contains
two large plasmids and utilizes the typical chemiosmotic cation/proton antiport system (22). The gene
sequence, which encodes the proteins involved in this cadmium resistance system, is present in the czc
operon, which confers resistance to three heavy metals: cobalt; zinc; and cadmium (6, 11, 14, 22, 27, 25,
34, 36). The czc operon has been cloned and sequenced (14) and is composed of three structural genes
(czcA, czcB, and czcC), as well as two regulatory genes (czcD and czcR ) (25). The three structural genes
catalyze the transport activity, while the two regulatory genes control induction of the efflux system in the
presence of the appropriate ions (21, 25). Once this operon is induced, toxic intracellular levels of ions
are reduced within a period of 1-24 hours, and growth resumes (21).
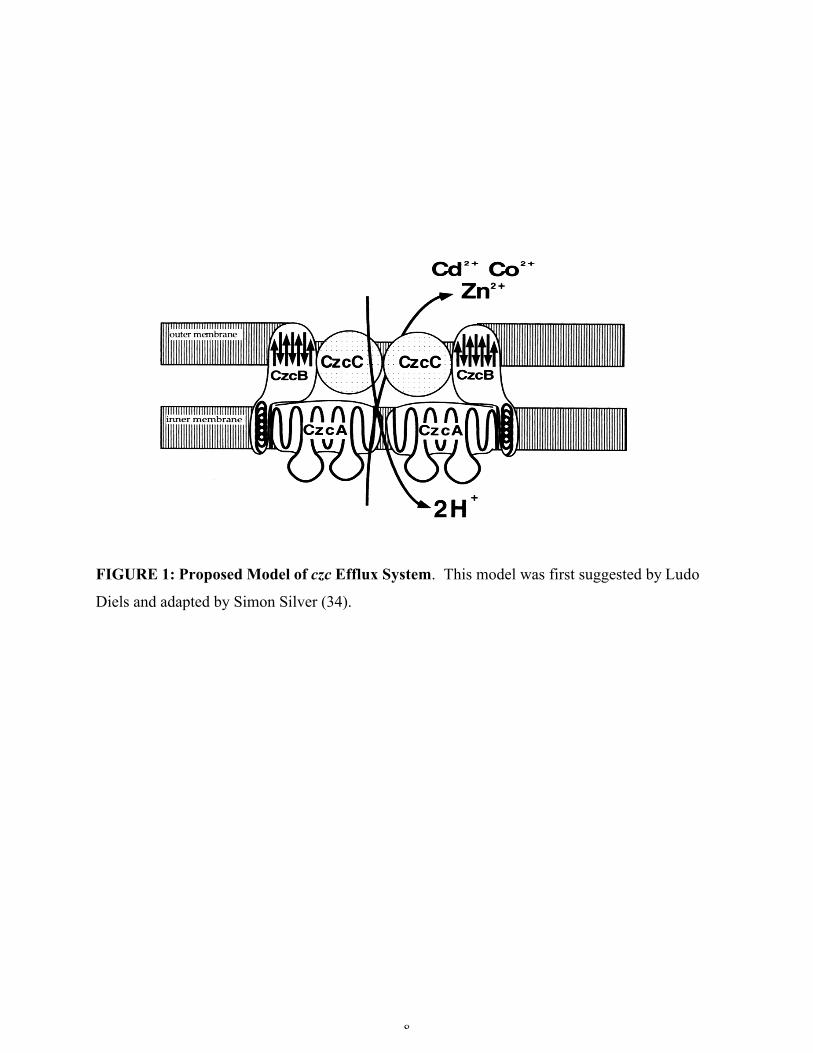
Several similar models of the structural protein complex for Ralstonia eutropha have been
proposed. The variations among these models are slight, and mainly concern whether or not the protein
complex acts as a dimer, or simply as a single unit. The dimer model is more commonly illustrated, and
has been included (Figure 1) as adapted from Diels by Silver (34). It is accepted that CzcA is the basic
plasma (“inner”) membrane transport protein, CzcC is the cell-wall (“outer”) membrane protein, and
CzcB is a “membrane fusion protein” that spans both membranes (36).
The basic mechanism proposed involves active transport by first binding the metal ions to
specific sites on the membrane fusion protein CzcB, and then transporting the metal ion out of the cell by
CzcA, the main pump protein (22). The CzcC protein functions to alter the metal specificity to allow for
transport of either zinc, or all three cations.
Cadmium (as well as cobalt, nickel, and zinc) all enter the cell through the magnesium transport
system. Cadmium, which Simon Silver describes as a “toxic element without biological utility” (35), is
always pumped out of the cell, as there is no fear of starving the organism of this metal. Zinc, however, a
common component of many DNA and RNA polymerases as well as some gene regulatory proteins (22),
is pumped out slowly at low intracellular concentrations and quickly at higher concentrations (25).
Cobalt, an essential component of vitamin B12 (22), does not induce the czc operon very efficiently, and
is therefore pumped out at a very low affinity (25).
The resistance efflux system is common for all three ions that are transported out of the cell.
However, there are differences that allow the mechanism to be specific for exportation of the particular
ion in excess, so as to prevent a deficiency of those ions necessary to the cell such as zinc and cobalt (22,
25). Studies that examined the effect of the deletion or mutation of one or more of these structural genes
indicated that each one plays a very specific role. Proteins CzcA and CzcB alone are capable of pumping
8
FIGURE 1: Proposed Model of czc Efflux System. This model was first suggested by Ludo
Diels and adapted by Simon Silver (34).

zinc ions out of the cell, even when CzcC is not present. However, those cells which lack CzcC (CzcC-),
are sensitive to cadmium and have a reduced efficiency for cobalt transportation (24). The zinc-efflux
efficiency of cells lacking CzcC is reduced to approximately half the rate of those cells in which CzcC is
present (25). However, this reduced-efflux rate is sufficient for cell survival. This demonstrates that the
function of CzcC is to modify the specificity of the mechanism for cadmium and cobalt. It is proposed
that CzcC functions by altering the conformation of the three protein complex (25). If CzcB is deleted
and only CzcA is present, zinc efflux does not occur, and therefore the organism is no longer resistant to
this metal. It can be determined, that CzcB functions to provide specificity for zinc efflux. Mutation of
CzcA eliminated the resistance to all three ions (24), however there was a small amount of cobalt efflux
reported. Therefore, CzcA is proposed to function as the actual efflux-transportation protein; however,
CzcA’s specificity for exportation of these ions is apparently regulated by the presence of the other two
structural proteins (24, 25).
The regulatory proteins CzcD and CzcR function together in a two-component system to prevent
cell starvation of essential nutrients, such as cobalt and zinc, yet allow sufficient efflux activity to prevent
the accumulation of toxic levels of any of the three metal ions. The CzcD protein may act as an activator
of czc transcription (21). The CzcD protein is not essential for the activation of the czc operon by CzcR;
however, the CzcR protein is essential for complete resistance to all three ions.
PURPOSE OF THIS INVESTIGATION
Due to the presence of cadmium resistance in Munger’s preliminary testing (21), I chose to
expand his study of resistance to include 20 additional strains of Gluconobacter. Following the resistance
testing, the plasmid and chromosomal DNA fractions of the resistant strains were used in PCR analysis to
assess the homology of the gluconobacter resistance genes to those of the control strain, Ralstonia
eutropha.

10
MATERIALS AND METHODS
BACTERIAL STRAINS AND GROWTH CONDITIONS
All Gluconobacter strains used in this study and the sources from which they were originally
obtained are listed in Table 1. Stock cultures of Gluconobacter and Ralstonia were kept for up to six
months at –100C in 66% glycerol and back-up cultures were kept indefinitely at -800C. All Gluconobacter
strains were grown at 280C on either a solid or liquid glycerol medium containing (w/v) 5% glycerol, 1%
peptone, and 1% yeast extract. Ralstonia eutropha (ATCC 43123) was grown on either nutrient broth or
agar at 280C for most purposes, or on 5% glycerol medium for heavy-metal resistance testing.
Glucose-calcium-carbonate plates were used to differentiate between the acetic acid bacteria and
other bacteria. Calcium-lactate plates were used to differentiate Gluconobacter strains from Acetobacter
strains. Testing on differential media was completed in order to ensure that the strains being used were
the strains chosen, rather than contaminants.
The 5% glycerol broth contained (w/v) 5% glycerol, 1% yeast extract, 1% peptone, with
distilled water added to volume, and the pH adjusted to 6.0. Glycerol-agar plates were prepared as above,
with the addition of 2% agar following pH adjustment. Glucose-calcium-carbonate plates contained (w/v)
5% glucose, 1% yeast extract, 1% peptone, 1%calcium carbonate, and 1.5% agar. Calcium-lactate plates
contained (w/v) 1% calcium lactate, 1% yeast extract, and 2% agar.
CHEMICALS AND MATERIALS
Glycerol, cadmium chloride, cobalt chloride, sodium chloride, phenol, and ethanol were
purchased from Fisher Scientific. Yeast extract, peptone, agar, nutrient broth, and nutrient agar were
purchased from Difco. Sodium dodecyl sulfate (SDS), zinc chloride, Tris-HCl, hexadecyltrimethyl
ammonium bromide (CTAB), isoamyl alcohol, isopropanol, ethylene diamine tetra acetic acid (EDTA),
sodium hydroxide, ethidium bromide and maleic acid were purchased from Sigma. Chloroform was
purchased from Baker, filter paper disks were purchased from Schleicher and Schuell, and AmpliTherm
DNA Polymerase was purchased from Epicentre Technologies. The PCR molecular weight markers,
Lambda DNA cut with HindIII molecular weight markers, Wizard PCR Prep DNA Purification System
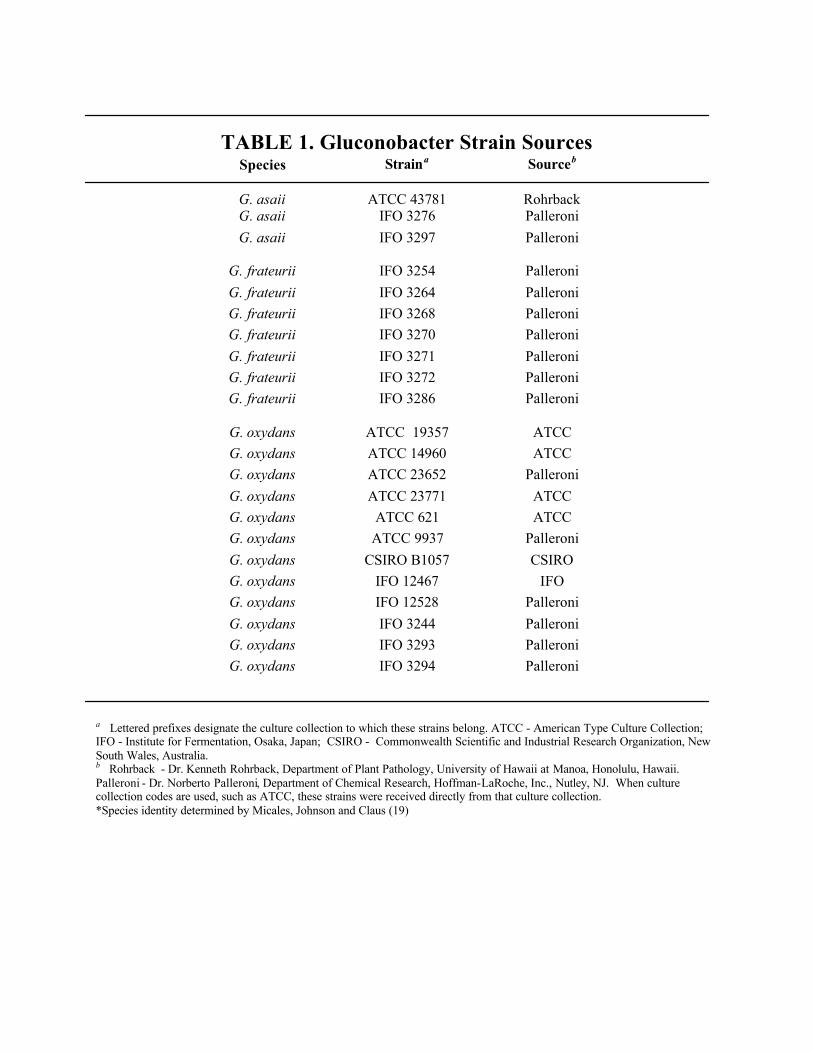
TABLE 1. Gluconobacter Strain SourcesSpecies Straina Sourceb
G. asaii ATCC 43781 RohrbackG. asaii IFO 3276 PalleroniG. asaii IFO 3297 Palleroni
G. frateurii IFO 3254 PalleroniG. frateurii IFO 3264 PalleroniG. frateurii IFO 3268 PalleroniG. frateurii IFO 3270 PalleroniG. frateurii IFO 3271 PalleroniG. frateurii IFO 3272 PalleroniG. frateurii IFO 3286 Palleroni
G. oxydans ATCC 19357 ATCCG. oxydans ATCC 14960 ATCCG. oxydans ATCC 23652 PalleroniG. oxydans ATCC 23771 ATCCG. oxydans ATCC 621 ATCCG. oxydans ATCC 9937 PalleroniG. oxydans CSIRO B1057 CSIROG. oxydans IFO 12467 IFOG. oxydans IFO 12528 PalleroniG. oxydans IFO 3244 PalleroniG. oxydans IFO 3293 PalleroniG. oxydans IFO 3294 Palleroni
a Lettered prefixes designate the culture collection to which these strains belong. ATCC - American Type Culture Collection;IFO - Institute for Fermentation, Osaka, Japan; CSIRO - Commonwealth Scientific and Industrial Research Organization, NewSouth Wales, Australia.b Rohrback - Dr. Kenneth Rohrback, Department of Plant Pathology, University of Hawaii at Manoa, Honolulu, Hawaii.Palleroni - Dr. Norberto Palleroni, Department of Chemical Research, Hoffman-LaRoche, Inc., Nutley, NJ. When culturecollection codes are used, such as ATCC, these strains were received directly from that culture collection.*Species identity determined by Micales, Johnson and Claus (19)
12
and Blue/orange loading dye were purchased from Promega. Supercoiled DNA Ladder, Low DNA
Mass Ladder, and glycogen were purchased from Life Technologies.
HEAVY METAL RESISTANCE TESTING
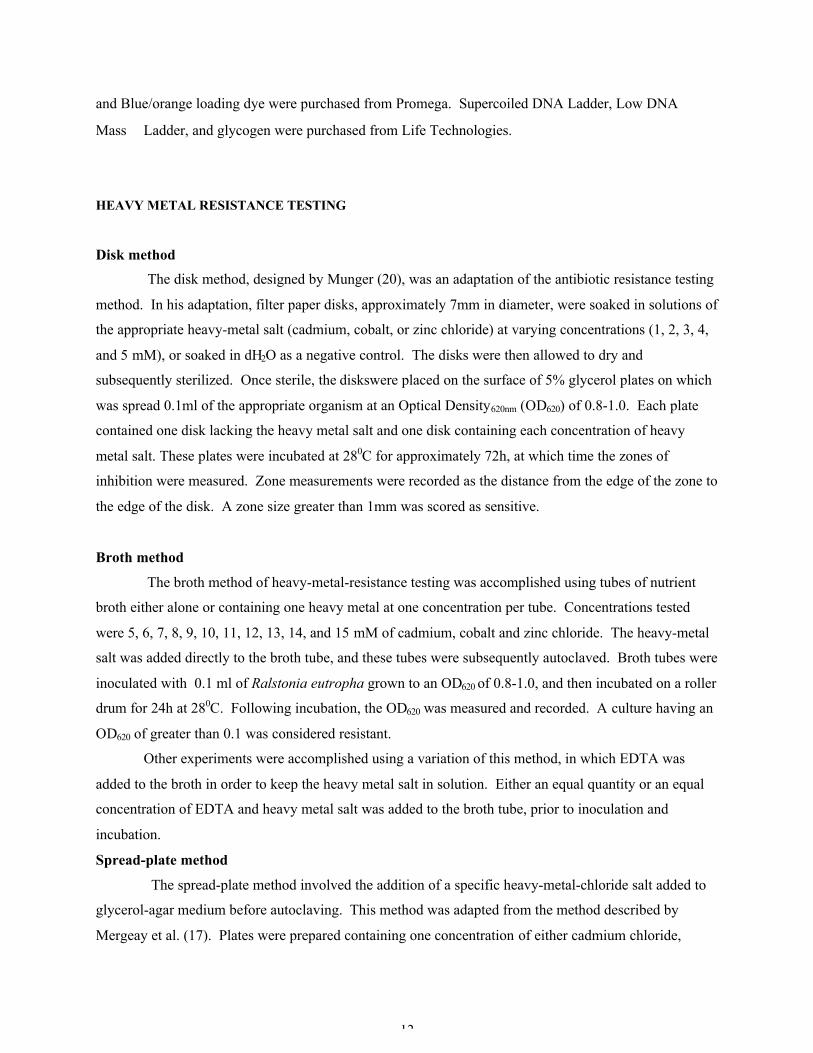
Disk method
The disk method, designed by Munger (20), was an adaptation of the antibiotic resistance testing
method. In his adaptation, filter paper disks, approximately 7mm in diameter, were soaked in solutions of
the appropriate heavy-metal salt (cadmium, cobalt, or zinc chloride) at varying concentrations (1, 2, 3, 4,
and 5 mM), or soaked in dH2O as a negative control. The disks were then allowed to dry and
subsequently sterilized. Once sterile, the diskswere placed on the surface of 5% glycerol plates on which
was spread 0.1ml of the appropriate organism at an Optical Density620nm (OD620) of 0.8-1.0. Each plate
contained one disk lacking the heavy metal salt and one disk containing each concentration of heavy
metal salt. These plates were incubated at 280C for approximately 72h, at which time the zones of
inhibition were measured. Zone measurements were recorded as the distance from the edge of the zone to
the edge of the disk. A zone size greater than 1mm was scored as sensitive.
Broth method
The broth method of heavy-metal-resistance testing was accomplished using tubes of nutrient
broth either alone or containing one heavy metal at one concentration per tube. Concentrations tested
were 5, 6, 7, 8, 9, 10, 11, 12, 13, 14, and 15 mM of cadmium, cobalt and zinc chloride. The heavy-metal
salt was added directly to the broth tube, and these tubes were subsequently autoclaved. Broth tubes were
inoculated with 0.1 ml of Ralstonia eutropha grown to an OD620 of 0.8-1.0, and then incubated on a roller
drum for 24h at 280C. Following incubation, the OD620 was measured and recorded. A culture having an
OD620 of greater than 0.1 was considered resistant.
Other experiments were accomplished using a variation of this method, in which EDTA was
added to the broth in order to keep the heavy metal salt in solution. Either an equal quantity or an equal
concentration of EDTA and heavy metal salt was added to the broth tube, prior to inoculation and
incubation.
Spread-plate method
The spread-plate method involved the addition of a specific heavy-metal-chloride salt added to
glycerol-agar medium before autoclaving. This method was adapted from the method described by
Mergeay et al. (17). Plates were prepared containing one concentration of either cadmium chloride,
cobalt chloride, or zinc chloride. Cadmium- and cobalt-chloride plates were made containing 5, 6, 7, 8, 9,
and 10 mM concentrations. Zinc-chloride plates were prepared using 5, 6, 7, 8, 9, 10, 11, 12, 13, 14, and
15 mM concentrations. Glycerol-agar plates lacking a heavy-metal salt were also prepared to determine
how many colony-forming units (CFU) were in the broth cultures spread on glycerol-agar plates that
contained heavy-metal salts. Serial dilutions of Gluconobacter cultures were spread onto the surface of
all plates to determine the minimum inhibitory concentration (MIC) of each heavy metal and each strain.
The MIC was defined as the lowest concentration at which no CFU were observed after 72h incubation at
280C (17). Resistance or sensitivity was determined for each strain and each heavy metal. Resistant
strains were defined as those having MIC values greater than 5 mM. Sensitive strains were defined as
those strains having MIC values ≤ 5 mM.
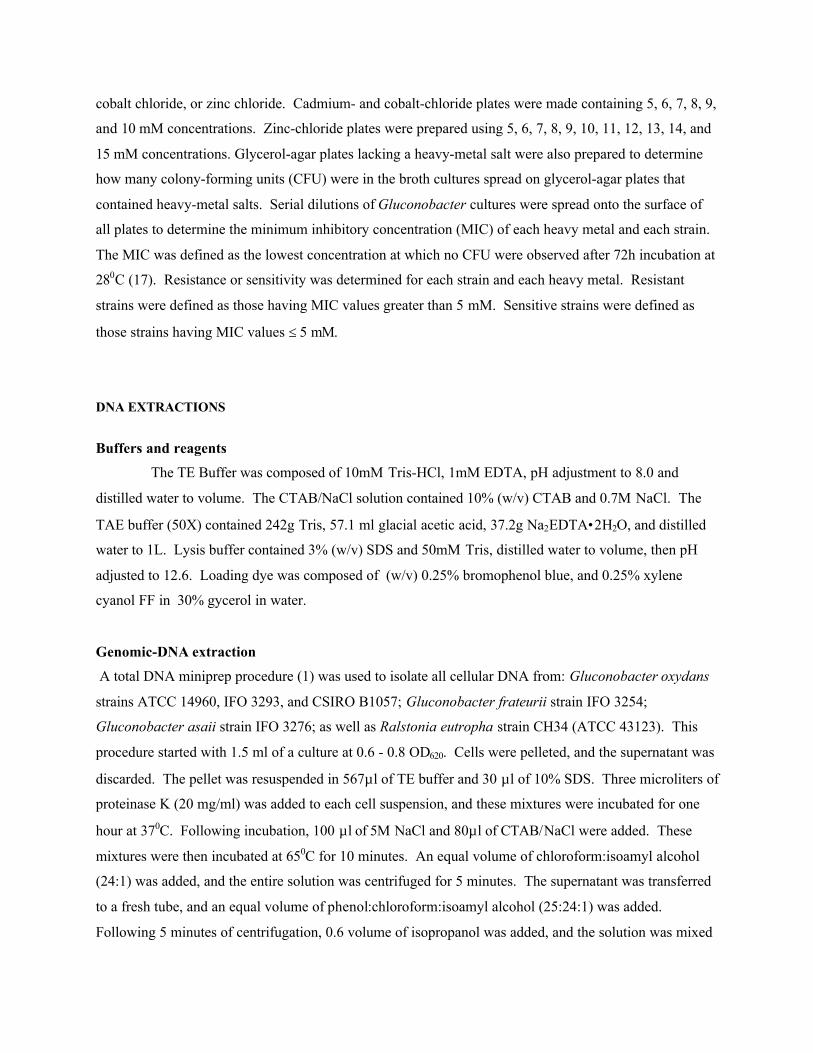
DNA EXTRACTIONS
Buffers and reagents
The TE Buffer was composed of 10mM Tris-HCl, 1mM EDTA, pH adjustment to 8.0 and
distilled water to volume. The CTAB/NaCl solution contained 10% (w/v) CTAB and 0.7M NaCl. The
TAE buffer (50X) contained 242g Tris, 57.1 ml glacial acetic acid, 37.2g Na2EDTA•2H2O, and distilled
water to 1L. Lysis buffer contained 3% (w/v) SDS and 50mM Tris, distilled water to volume, then pH
adjusted to 12.6. Loading dye was composed of (w/v) 0.25% bromophenol blue, and 0.25% xylene
cyanol FF in 30% gycerol in water.
Genomic-DNA extraction
A total DNA miniprep procedure (1) was used to isolate all cellular DNA from: Gluconobacter oxydans
strains ATCC 14960, IFO 3293, and CSIRO B1057; Gluconobacter frateurii strain IFO 3254;
Gluconobacter asaii strain IFO 3276; as well as Ralstonia eutropha strain CH34 (ATCC 43123). This
procedure started with 1.5 ml of a culture at 0.6 - 0.8 OD620. Cells were pelleted, and the supernatant was
discarded. The pellet was resuspended in 567µl of TE buffer and 30 µl of 10% SDS. Three microliters of
proteinase K (20 mg/ml) was added to each cell suspension, and these mixtures were incubated for one
hour at 370C. Following incubation, 100 µl of 5M NaCl and 80µl of CTAB/NaCl were added. These
mixtures were then incubated at 650C for 10 minutes. An equal volume of chloroform:isoamyl alcohol
(24:1) was added, and the entire solution was centrifuged for 5 minutes. The supernatant was transferred
to a fresh tube, and an equal volume of phenol:chloroform:isoamyl alcohol (25:24:1) was added.
Following 5 minutes of centrifugation, 0.6 volume of isopropanol was added, and the solution was mixed

14
until the DNA precipitated. The supernatant was discarded, and the pellet washed with 70% ethanol. The
suspension was then centrifuged, the supernatant discarded, and the pellet was allowed to air dry then
resuspended in 100 µl of TE buffer. These genomic DNA preps were stored at –100C until used.
Small-plasmid-DNA extraction
The plasmid-isolation procedure was previously described by Brookman (2). This procedure
involved an alkaline lysis step, followed by a phenol-chloroform extraction, then a lithium chloride-
ethanol precipitation. A five-milliliter volume of each cell culture was centrifuged, and the pellet was
resuspended in 200 µl of E buffer. After resuspension, 400 µl of lysis buffer was added, and the solution
was gently mixed. These cell suspensions were then heated at 600C for 30 minutes to allow for lysis of the
cells and denaturation of the DNA. The resulting cell lysates were cooled to room temperature, and, after
adding 100 µl of 2M Tris-HCl buffer (pH 7.0), they were incubated in a 370C water bath for 20 minutes.
This final incubation allowed plasmid DNA to reanneal, however, chromosomal DNA fragments, and
perhaps large plasmids, remained denatured.
Following the final (370C) incubation, a 1:1 ratio of phenol to chloroform (1.2 ml total) was
added to each lysate in order to remove protein and lipids. After gentle mixing, these solutions were
centrifuged for 20 minutes. The resulting aqueous top layer was then carefully removed, so as to prevent
disturbance of the organic-aqueous interface, and the bottom layer was discarded. The aqueous phase
was extracted again with an equal volume of chloroform to remove the residual phenol, and
microcentrifuged for 8 minutes. The resulting aqueous top layer was removed, and each 300 µl volume
was placed into a separate, clean, sterile microcentrifuge tube. In order to concentrate the plasmid DNA
contained in these 300µl volumes, glycogen (1 µl of a 20 mg/ml solution) was added to serve as a carrier
and to precipitate DNA from these small volumes. One-tenth volume of lithium-chloride buffer and 2.5
times the volume (after LiCl-buffer addition) of cold 95% ethanol was added to each tube and vortexed.
These tubes were placed on ice at 40C for at least 30 minutes to precipitate the DNA and centrifuged at
40C for 30 minutes. The resulting pellets were dried at room temperature overnight or air dried in an oven
at 43-450C for 15-30 minutes. The dried pellets were gently resuspended in 30 µl of TE buffer and placed
in a 43-450C oven for 15-20 minutes to dissolve the pellets. The resulting plasmid preparations were
stored at -800C until use.
Large-plasmid-DNA extraction
The procedure used to isolate large plasmids (163 and 238 kb) from Ralstonia eutropha was
adapted from Kado and Lui (12). Five ml of cells were pelleted by centrifugation and resuspended in 2
ml of 1X TAE buffer, and then 1 ml of lysis buffer was added to this suspension. Following incubation at

680C for one hour, 0.4 ml of 5M NaCl, 3 ml of phenol and 3 ml of chloroform were added, and this
mixture was centrifuged and stored at 40C for one hour to separate the organic and aqueous phases.
Subsequently, the lower phase (organic) was discarded, the upper phase (aqueous) transferred to a clean
tube, followed by the addition of 0.1 ml of 10% acetic acid and 6 ml of chloroform. Again, the mixture
was centrifuged, the upper phase (aqueous) was transferred to a clean tube, and the lower phase (organic)
was discarded. The residual chloroform that remained in the aqueous phase was evaporated for 10
minutes at 680C, and the DNA was precipitated with 95% ethanol. The precipitated DNA was removed
from the solution by centrifugation and the ethanol discarded. The pellet was washed with 85% ethanol,
allowed to dry, and resuspended in 10 mM Tris-HCl buffer. These large-plasmid preparations were
stored at –100C until use.
POLYMERASE CHAIN REACTION
The polymerase chain reactions were performed using Epicentre’s MasterAmp PCR
Optimization Kit and MasterAmp AmpliTherm DNA Polymerase. Primers were designed to amplify
the membrane-spanning (hydrophobic) region of the czcA gene and the majority of the czcD gene, and
these primers were constructed by Sigma Genosys (Figures 2 and 3).
The Epicenter kit protocol requires the generation of a reaction mixture containing 19.5 µl sterile
water, 1.5 µl of each primer (20 µM of DNA), 2 µl of DNA template (containing from 50-200 ng of
DNA) from the respective strain, and DNA fraction (whole cells, genomic DNA, plasmid, or large
plasmid), 0.5 µl of MasterAmp AmpliTherm DNA polymerase (5U/µl), and 20 µl of the respective
PCR pre-mix. During the first attempt at PCR for each template type, all pre-mixes contained in the kit
(A-L) were used. Following visualization of the PCR products, one pre-mix (pre-mix I) was chosen and
subsequently used in all future reactions. The thermal cycler (MJ Research, Inc. PTC-100) was
programmed with the following five steps:
1. Denature template at 940C for 4 minutes.
2. Denature template at 940C for 1 minute.
3. Anneal primers at 63.80C (for czcA primers) or 55.10C (for czcD primers) for 0.5 minutes.
4. Extend primers at 720C for 1 minute.
5. Final extension at 720C for 10 minutes.

16
Amplified sequence of czcA (hydrophobic region of czcA):
AACCAGATCTCGCGCGAGAACGGCAAGCGCCGCATCGTGATCAGTGCCAACGTTCGTGGACGTGATATTGGTTCATTCGTGCCCGAGGCGGAAGCGGCTATCCAAAGCCAGGTCAAGATCCCGGCTGGCTACTGGATGACATGGGGTGGCACCTTTGAGCAACTGCAGTCCGCCACCACCCGCCTGCAGGTGGTAGTGCCGGTGGCGCTGTTGCTGGTCTTCGTACTGTTGTTTGCGATGTTCAACAACATCAAGGATGGCTTGCTAGTCTTCACGGGCATTCCCTTTGCGCTGACTGGCGGGATTCTTGCCCTGTGGATACGCGGCATTCCGATGTCCATTACTGCAGCGGTGGGCTTCATCGCGCTGTGCGGGGTGGCGGTGCTCAATGGTCTGGTGATGCTGTCGTTTATCCGATCGCTGCGCGAAGAAGGGCATTCCCTCGACAGCGCGGTCCGAGTTGGCGCCCTGACGCGACTGCGTCCGGTGCTGATGACGGCCCTGGTGGCATCCCTGGGTTTCGTGCCGATGGCCATCGCCACCGGTACGGGCGCTGAGGTGCAACGTCCCCTCGCAACGGTGGTAATCGGTGGCATCTTGTCGTCCACGGCGCTGACCCTACTGGTGTTGCCG
Primer sequences:
czc1: AACCAGATCTCGCGCGAGAAC
czc2: CGGCAACACCAGTAGGGTCAG
FIGURE 2. Chosen sequence of R. eutropha czcA amplified by PCR using the primers (shown). Thesequence chosen encodes part of the hydrophobic region of the main pump protein (see CzcA in Figure1). This region was chosen because it would likely be a critical part of the efflux system and, therefore, allcells using this system to efflux heavy metals may contain part of this gene.
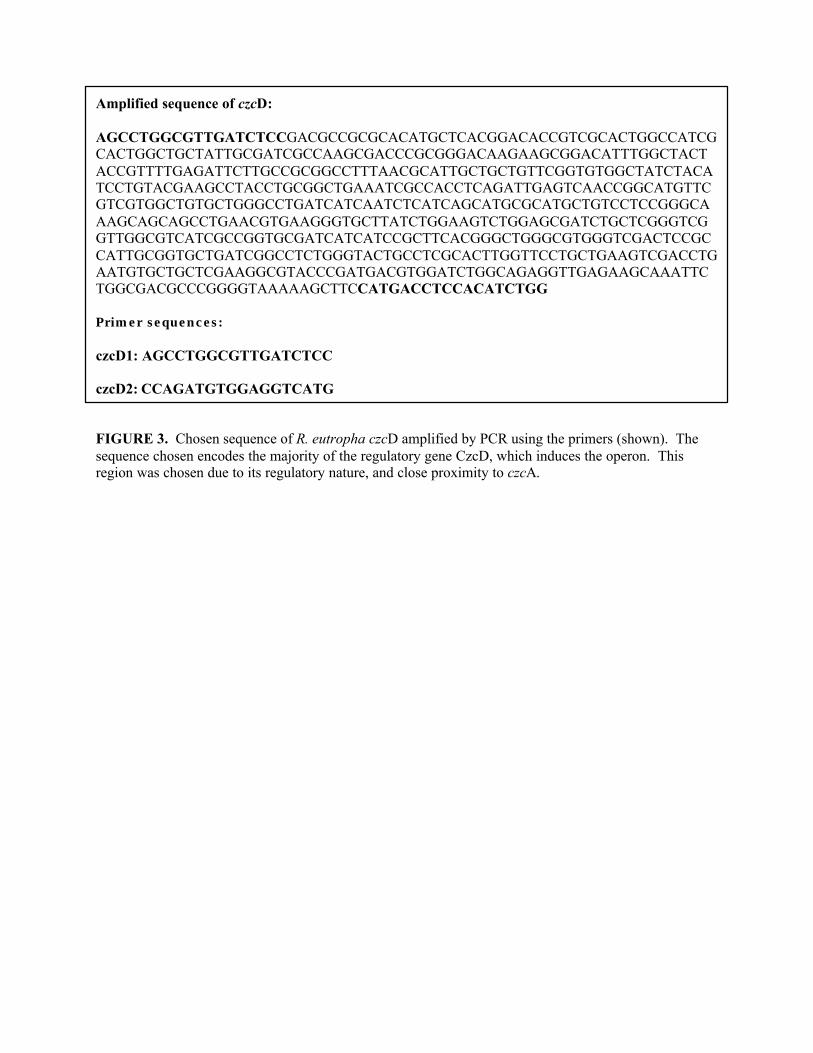
Amplified sequence of czcD:
AGCCTGGCGTTGATCTCCGACGCCGCGCACATGCTCACGGACACCGTCGCACTGGCCATCGCACTGGCTGCTATTGCGATCGCCAAGCGACCCGCGGGACAAGAAGCGGACATTTGGCTACTACCGTTTTGAGATTCTTGCCGCGGCCTTTAACGCATTGCTGCTGTTCGGTGTGGCTATCTACATCCTGTACGAAGCCTACCTGCGGCTGAAATCGCCACCTCAGATTGAGTCAACCGGCATGTTCGTCGTGGCTGTGCTGGGCCTGATCATCAATCTCATCAGCATGCGCATGCTGTCCTCCGGGCAAAGCAGCAGCCTGAACGTGAAGGGTGCTTATCTGGAAGTCTGGAGCGATCTGCTCGGGTCGGTTGGCGTCATCGCCGGTGCGATCATCATCCGCTTCACGGGCTGGGCGTGGGTCGACTCCGCCATTGCGGTGCTGATCGGCCTCTGGGTACTGCCTCGCACTTGGTTCCTGCTGAAGTCGACCTGAATGTGCTGCTCGAAGGCGTACCCGATGACGTGGATCTGGCAGAGGTTGAGAAGCAAATTCTGGCGACGCCCGGGGTAAAAAGCTTCCATGACCTCCACATCTGG
Primer sequences:
czcD1: AGCCTGGCGTTGATCTCC
czcD2: CCAGATGTGGAGGTCATG
FIGURE 3. Chosen sequence of R. eutropha czcD amplified by PCR using the primers (shown). Thesequence chosen encodes the majority of the regulatory gene CzcD, which induces the operon. Thisregion was chosen due to its regulatory nature, and close proximity to czcA.
18
Steps 2-4 were repeated 30 times, and the reaction was then held at 40C until use. Positive-control
reactions contained 2 µl of the R. eutropha total-DNA fraction. Negative-control reactions lacked DNA
template but contained an additional 2 µl of sterile water.
Whole cell PCR denotes the use of 2µl of a 0.6 OD620 culture as the DNA template in the PCR
reaction.
GEL ELECTROPHORESIS
Plasmid-extraction products were observed in order to assure the presence of DNA in he samples
prior to PCR analysis. These observations were made on 0.7 % agarose gels prepared with 1X TAE-
running buffer containing ethidium bromide for visualization of the DNA in the gel matrix. Ten µl of
each sample was loaded into each well, after mixing with 1 µl of loading dye. Size markers, (Supercoiled
DNA Ladder) ranging in size from 2 to 16 kb were used to determine the size of the plasmids. Gels were
run at 60V for 2.5 hours on a Hoefer Scientific Instruments, HE 33 Submarine agarose gel unit.
PCR products were observed on 2 % agarose gels prepared with 1X TAE running buffer
containing ethidium bromide for visualization of the DNA in the gel matrix. Five µl of each sample was
mixed with 1 µl of blue/orange loading dye and loaded into each well. Size markers, (PCR markers
ranging in size from 50-1000 bp) were used to determine the size of the PCR products. A Low DNA
Mass Ladder (bands ranging in mass from 10-200 ng) was also sometimes run in the gel in order to
quantify PCR product formed per reaction. Gels were run at 100V for 60 minutes on a Hoefer Scientific
Instruments, HE 33 Submarine agarose gel unit. Gels were visualized and photographed using an Alpha
Imager 2000 (Alpha Innotech Corporation) and photographs were printed on a Sony Digital Graphic
Printer (UP-D890).
Plasmid-size estimation
Gluconobacter plasmid sizes were estimated by comparison with molecular weight standards
that were run on the same gel as the plasmid samples. The molecular weight standard used for plasmid
size estimations was a Supercoiled Ladder (Life Technologies) containing 2,3,4,5,6,7,8,10, 12, 14, and 16
kb supercoiled fragments. The distance that these markers, as well as plasmids, traveled in the gel was
measured from the photograph. A standard curve was created based on the distances the markers
traveled, plasmid distances traveled were then plotted on this curve, and sizes determined by
extrapolation.

PCR-product-size estimation
PCR fragment sizes were estimated by comparison with molecular weight standards that were
run on the same gel as the PCR products. The molecular weight standard used for PCR product size
estimations was a PCR molecular weight marker (Promega) containing 50, 150, 300, 500, 750, and 1000
bp fragments. The distance that these markers, as well as the PCR products, traveled in the gel was
measured from the photograph. A standard curve was created based on the distances the markers
traveled. The distance migrated by the PCR product were then plotted on this curve, and sizes were
determined by extrapolation.
SEQUENCING
Sequencing of both the czcA and czcD PCR products was performed by the DNA Sequencing
Facility at the Center for Molecular Medicine and Infectious Diseases, Virginia-Maryland Regional
College of Veterinary Medicine, Blacksburg, VA, using BigDye Terminator Cycle Sequencing
technology.
The PCR reactions, following cycling, were purified using the Wizard PCR Prep DNA
Purification System (Promega) in order to remove excess deoxynucleoside triphosphates (dNTP's) and
primers,. The sequencing facility was provided with approximately 140 ng of each czcA PCR product and
120 ng of each czcD PCR product suspended in 2-18 µl of sterile water. Sequencing was completed using
only one primer of each pair, and the data presented is therefore single stranded.

20
RESULTS
HEAVY METAL RESISTANCE TESTING
Josh Munger examined two Gluconobacter strains (ATCC 621 and IFO 3244) for resistance to
cadmium, lead, and mercury using a disk-sensitivity method, and his preliminary results indicated the
presence of cadmium resistance in one of these strains (20). The goal of my project was to expand
Munger's study to include 20 additional strains. Before heavy metal resistance could be tested, an
appropriate method was needed, but a review of methods manuals and recent literature showed no one
well-accepted method for making this determination. Therefore, heavy metal resistance was tested using
a disk sensitivity method, and growth in either broth or on a solid media that contained varying
concentrations of heavy metals.
Disk-Sensitivity Method
Cadmium chloride resistance. The effect of the cadmium chloride concentration on the
inhibition-zone size of 22 Gluconobacter strains is shown in Table 2. From this data, it appeared as
though 8 strains of Gluconobacter were resistant to 5 mM cadmium chloride. Two additional strains
(ATCC 9937 and IFO 3272) resisted 3 mM but not 4 mM cadmium chloride. Two other strains (IFO
3254 and 3271) resisted both 1 and 2 mM but not 3 mM cadmium chloride. Thus, a total of 12 strains
showed some degree of resistance to cadmium chloride.
It seemed logical to me that the size of the zone of inhibition, when present, should increase as
the concentration of the salt increased. However, while this trend was observed in approximately half of
the strains tested, it was not always the case. Often, the inhibition zone would reach a maximum size at
the 3mM concentration, and that size did not increase with higher concentrations of CdCl2. Occasionally,
the zone surrounding the 3 mM or 4 mM disk would be larger than the one surrounding the 5 mM disk.
While it would have been desirable to choose one concentration at which to compare all strains, that zone
size may not have always represented the maximum zone size, and therefore, subsequent comparisons of
the degree of sensitivity were based on the maximum zone size at any concentration.
Alternative cadmium and chloride salts. Of the 22 strains tested for their response to cadmium
chloride (Table 2), nine strains were tested further to determine if the resistance or sensitivities were due
to the cadmium or chloride ions (Table 3). The seven strains sensitive to cadmium chloride were shown
to be almost equally sensitive to similar concentrations of cadmium acetate, but none of these strains were
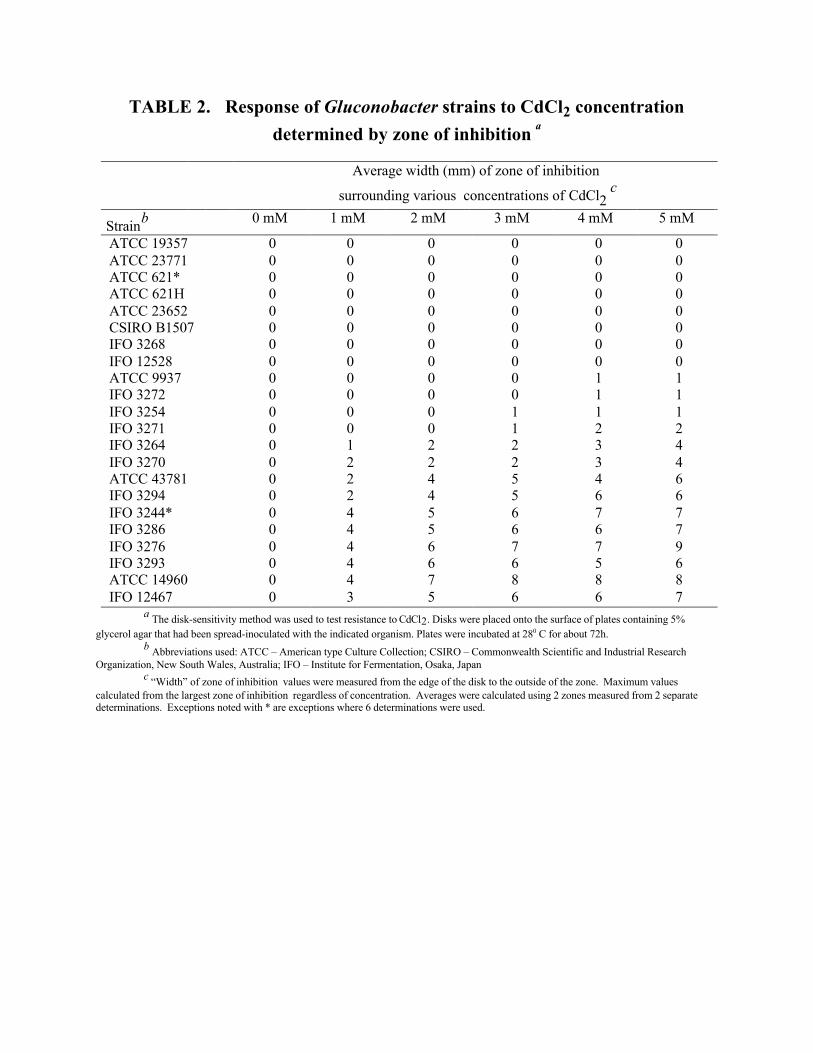
TABLE 2. Response of Gluconobacter strains to CdCl2 concentrationdetermined by zone of inhibition a
Average width (mm) of zone of inhibition
surrounding various concentrations of CdCl2 c
Strainb 0 mM 1 mM 2 mM 3 mM 4 mM 5 mM
ATCC 19357 0 0 0 0 0 0ATCC 23771 0 0 0 0 0 0ATCC 621* 0 0 0 0 0 0ATCC 621H 0 0 0 0 0 0ATCC 23652 0 0 0 0 0 0CSIRO B1507 0 0 0 0 0 0IFO 3268 0 0 0 0 0 0IFO 12528 0 0 0 0 0 0ATCC 9937 0 0 0 0 1 1IFO 3272 0 0 0 0 1 1IFO 3254 0 0 0 1 1 1IFO 3271 0 0 0 1 2 2IFO 3264 0 1 2 2 3 4IFO 3270 0 2 2 2 3 4ATCC 43781 0 2 4 5 4 6IFO 3294 0 2 4 5 6 6IFO 3244* 0 4 5 6 7 7IFO 3286 0 4 5 6 6 7IFO 3276 0 4 6 7 7 9IFO 3293 0 4 6 6 5 6ATCC 14960 0 4 7 8 8 8IFO 12467 0 3 5 6 6 7
a The disk-sensitivity method was used to test resistance to CdCl2. Disks were placed onto the surface of plates containing 5%glycerol agar that had been spread-inoculated with the indicated organism. Plates were incubated at 280 C for about 72h.
b Abbreviations used: ATCC – American type Culture Collection; CSIRO – Commonwealth Scientific and Industrial ResearchOrganization, New South Wales, Australia; IFO – Institute for Fermentation, Osaka, Japan
c “Width” of zone of inhibition values were measured from the edge of the disk to the outside of the zone. Maximum valuescalculated from the largest zone of inhibition regardless of concentration. Averages were calculated using 2 zones measured from 2 separatedeterminations. Exceptions noted with * are exceptions where 6 determinations were used.
22
sensitive to identical concentrations of sodium chloride or sodium acetate. These results strongly
suggested that the sensitivies and resistances shown in Table 2 was a response to the cadmium ion and not
the anions associated with cadmium.
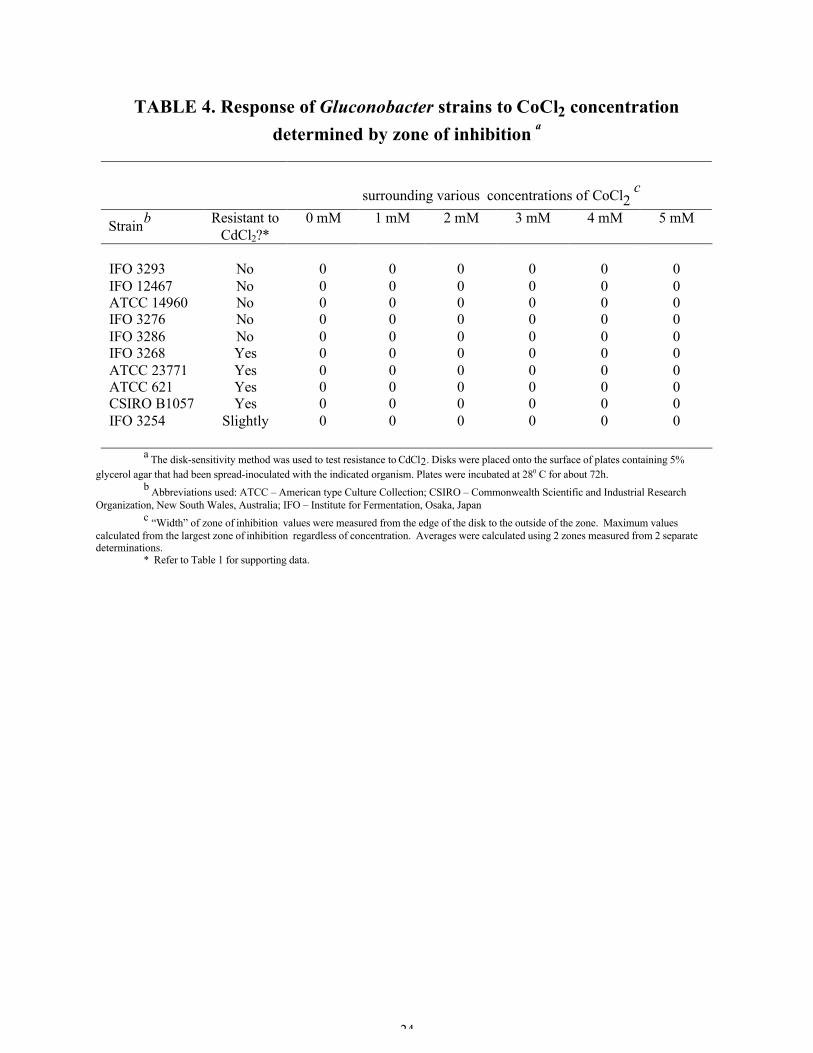
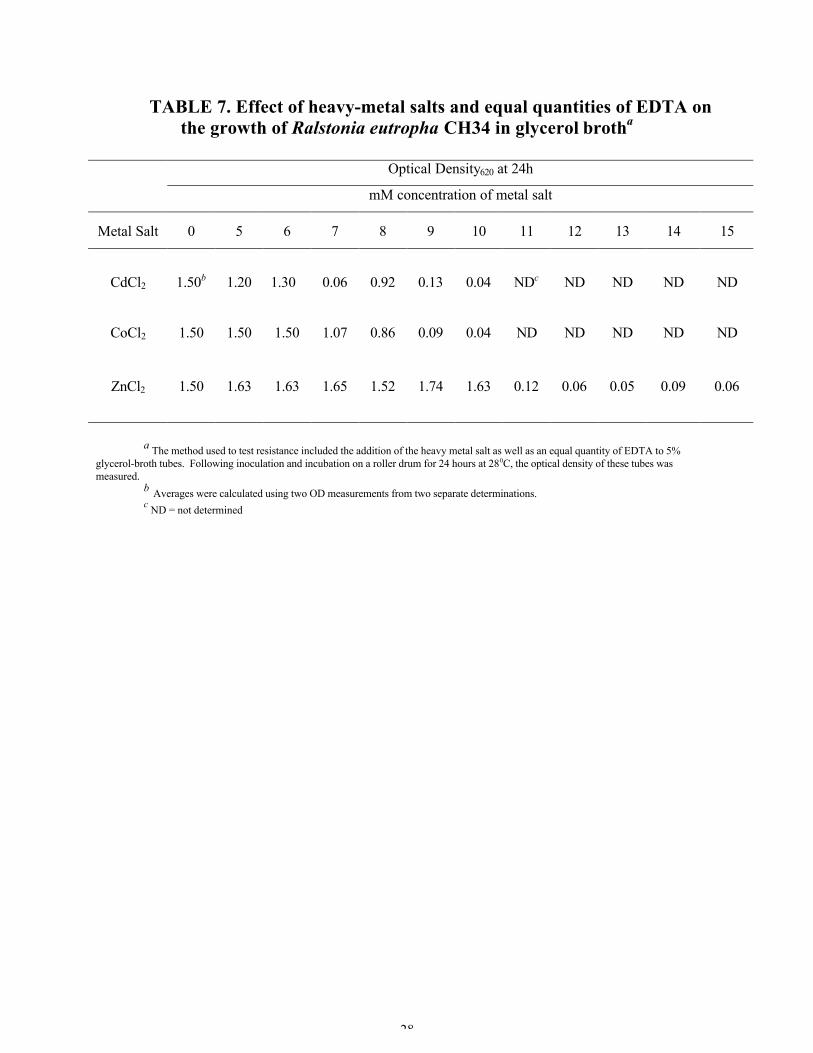
Cobalt and zinc chloride resistance. Since cadmium resistance in Gram-negative bacteria is
often encoded by an operon which also contains genes conferring cobalt and zinc resistance (6, 11, 21, 22,
25, 34, 35, 36), 10 strains were selected from those shown in Table 2 to test for resistance to cobalt and
zinc. Of these 10 strains, four were resistant to 1-5 mM cadmium chloride, one (IFO 3254) was resistant
only up to 3 mM, and five were sensitive to all tested cadmium chloride concentrations (1-5mM). Tables
3 and 4 demonstrate that all ten strains were resistant to all concentrations of cobalt chloride and zinc
chloride tested (1-5 mM). These results were unexpected. If it is true that the operon of all Gram-
negative bacteria that attributes cobalt and zinc resistance also attributes cadmium resistance, then only
the cadmium-resistant Gluconobacter strains should have been resistant to cobalt and zinc. Therefore, I
began to suspect that the disk-sensitivity method may not be adequate for determining cadmium
resistance or sensitivity of Gluconobacter strains, or the concentrations tested may have been too low to
indicate resistance.
Resistance testing of R. eutropha. Most literature involving Gram-negative cadmium resistance
uses Ralstonia eutropha as the model organism. Therefore, a strain of Ralstonia eutropha (known to be
resistant to cadmium, cobalt, and zinc), was tested using the disk-sensitivity method to determine the
reliability of this method for determining cadmium resistance or sensitivity (Table 6). These results were
surprising, because the minimum inhibitory concentration (MIC) for cadmium in Ralstonia eutropha
(formerly called Alcaligenes eutrophus) is reported to be 2.5mM (determined using a spread-plate
method). However, results using the disk-sensitivity method (Table 6) indicate that the MIC for R.
eutropha is around 10 mM.
Several things were evident from the results shown in Table 6. First, Table 6 suggests that
cadmium resistance by R. eutropha strain CH34 is not absolute; in other words, this resistance can be
overwhelmed but "excessively " high concentrations of cadmium. Second, if I wished to compare
cadmium resistance in Gluconobacter strains to that exhibited by R. eutropha, then the concentration
ranges (0-5 mM) used in Tables 1, 3, and 4 were too low.
It was conceivable that the disk-sensitivity method was not adequate to determine resistance or
sensitivity of Gram-negative bacteria to cadmium and other heavy-metal ions. Perhaps penetration of
cadmium ions into the medium surrounding the disk is too slow to adequately show resistance or
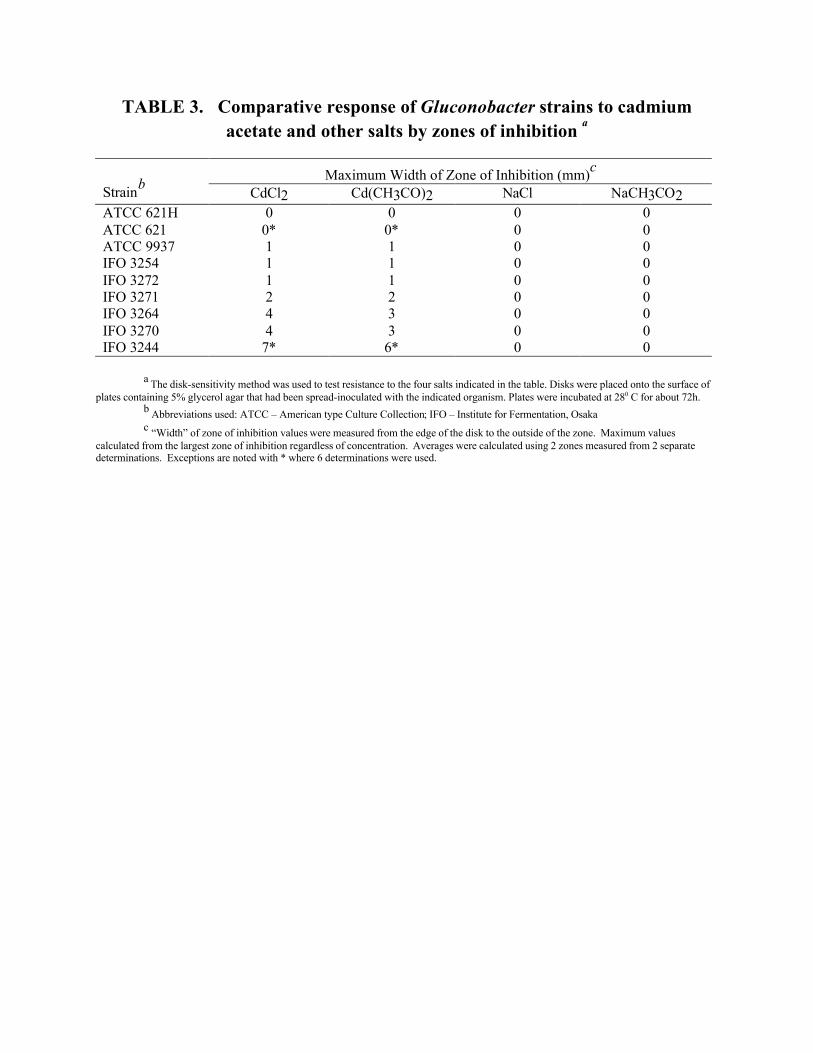
TABLE 3. Comparative response of Gluconobacter strains to cadmiumacetate and other salts by zones of inhibition a
Maximum Width of Zone of Inhibition (mm)c
StrainbCdCl2 Cd(CH3CO)2 NaCl NaCH3CO2
ATCC 621H 0 0 0 0ATCC 621 0* 0* 0 0ATCC 9937 1 1 0 0IFO 3254 1 1 0 0IFO 3272 1 1 0 0IFO 3271 2 2 0 0IFO 3264 4 3 0 0IFO 3270 4 3 0 0IFO 3244 7* 6* 0 0
a The disk-sensitivity method was used to test resistance to the four salts indicated in the table. Disks were placed onto the surface ofplates containing 5% glycerol agar that had been spread-inoculated with the indicated organism. Plates were incubated at 280 C for about 72h.
b Abbreviations used: ATCC – American type Culture Collection; IFO – Institute for Fermentation, Osakac “Width” of zone of inhibition values were measured from the edge of the disk to the outside of the zone. Maximum values
calculated from the largest zone of inhibition regardless of concentration. Averages were calculated using 2 zones measured from 2 separatedeterminations. Exceptions are noted with * where 6 determinations were used.
24
TABLE 4. Response of Gluconobacter strains to CoCl2 concentrationdetermined by zone of inhibition a
surrounding various concentrations of CoCl2 c
Strainb Resistant toCdCl2?*
0 mM 1 mM 2 mM 3 mM 4 mM 5 mM
IFO 3293 No 0 0 0 0 0 0IFO 12467 No 0 0 0 0 0 0ATCC 14960 No 0 0 0 0 0 0IFO 3276 No 0 0 0 0 0 0IFO 3286 No 0 0 0 0 0 0IFO 3268 Yes 0 0 0 0 0 0ATCC 23771 Yes 0 0 0 0 0 0ATCC 621 Yes 0 0 0 0 0 0CSIRO B1057 Yes 0 0 0 0 0 0IFO 3254 Slightly 0 0 0 0 0 0
a The disk-sensitivity method was used to test resistance to CdCl2. Disks were placed onto the surface of plates containing 5%glycerol agar that had been spread-inoculated with the indicated organism. Plates were incubated at 280 C for about 72h.
b Abbreviations used: ATCC – American type Culture Collection; CSIRO – Commonwealth Scientific and Industrial ResearchOrganization, New South Wales, Australia; IFO – Institute for Fermentation, Osaka, Japan
c “Width” of zone of inhibition values were measured from the edge of the disk to the outside of the zone. Maximum valuescalculated from the largest zone of inhibition regardless of concentration. Averages were calculated using 2 zones measured from 2 separatedeterminations.
* Refer to Table 1 for supporting data.

TABLE 5. Response of Gluconobacter strains to ZnCl2 concentrationdetermined by zone of inhibition a
Average width (mm) of zone of inhibition
surrounding various concentrations of ZnCl2 c
Strainb Resistant toCdCl2?*
0 mM 1 mM 2 mM 3 mM 4 mM 5 mM
IFO 3293 No 0 0 0 0 0 0IFO 12467 No 0 0 0 0 0 0ATCC 14960 No 0 0 0 0 0 0IFO 3276 No 0 0 0 0 0 0IFO 3286 No 0 0 0 0 0 0IFO 3268 Yes 0 0 0 0 0 0ATCC 23771 Yes 0 0 0 0 0 0ATCC 621 Yes 0 0 0 0 0 0CSIRO B1057 Yes 0 0 0 0 0 0IFO 3254 Slight 0 0 0 0 0 0
a The disk-sensitivity method was used to test resistance to ZnCl2. Disks were placed onto the surface of plates containing 5%glycerol agar that had been spread-inoculated with the indicated organism. Plates were incubated at 280 C for about 72h.
b Abbreviations used: ATCC – American type Culture Collection; CSIRO – Commonwealth Scientific and Industrial ResearchOrganization, New South Wales, Australia; IFO – Institute for Fermentation, Osaka, Japan
c “Width” of zone of inhibition values were measured from the edge of the disk to the outside of the zone. Maximum valuescalculated from the largest zone of inhibition regardless of concentration. Averages were calculated using 2 zones measured from 2 separatedeterminations.
* Refer to Table 1 for supporting data.

26
TABLE 6. Responses of Ralstonia eutropha CH34 to heavy-metal ions
determined by zone of inhibitiona
Average width (mm) of zone of inhibition b
mM concentration of metal salt
Metal Salt 0 5 6 7 8 9 10 15 20 25 30
CdCl2 0 0 0 0 0 1 1 1 3 3 4
CoCl2 0 0 0 0 0 0 3 6 6 7 8
ZnCl2 0 0 0 0 0 0 1 3 2 5 6
a The disk-sensitivity method was used to test resistance to ZnCl2. Disks were placed onto the surface of plates containing 5%glycerol agar that had been spread-inoculated with the indicated organism. Plates were incubated at 280 C for about 72h.
b “Width” of zone of inhibition values were measured from the edge of the disk to the outside of the zone. Maximum valuescalculated from the largest zone of inhibition regardless of concentration. Averages were calculated using 2 zones measured from 2 separatedeterminations.
sensitivity to cadmium and other heavy-metal ions by growing bacteria. Since there should be no
diffusion problems using heavy-metal salts dissolved in liquid media, I attempted to determine resistance
or sensitivity by examining the growth response to cadmium in broth cultures.
Broth Method
Resistance testing without EDTA. Ralstonia eutropha CH34 was inoculated into glycerol broth
containing 5-10mM cadmium chloride or cobalt chloride or 5-15mM zinc chloride (in 1 mM increments).
A control tube was also inoculated which lacked heavy-metal salt. It was clear, even prior to inoculation,
that a precipitate was formed in broths containing these heavy-metal salts. Following inoculation and 24
hours of incubation at 280C, there were obvious, visible clumps in the broths, likely consisting of the
heavy-metal salt as well as cell mass. These clumps were not dispersible by vortexing or agitation, and
therefore the OD readings were very low and did not accurately measure the extent of culture growth.
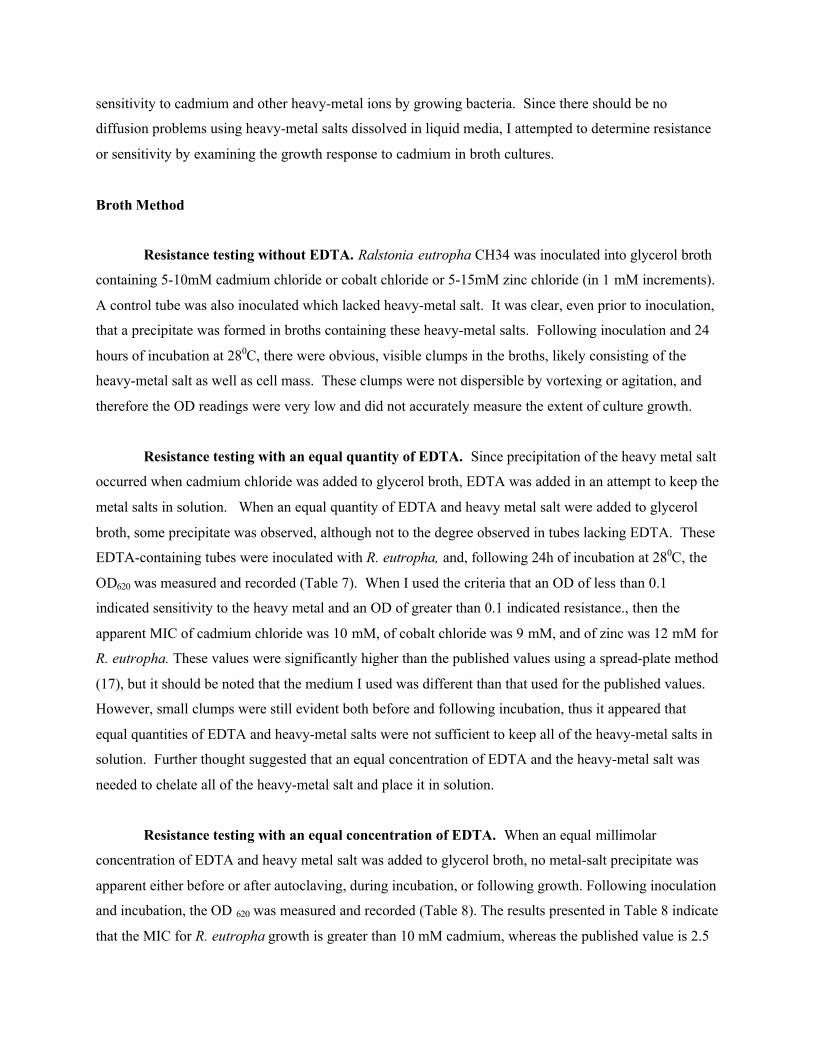
Resistance testing with an equal quantity of EDTA. Since precipitation of the heavy metal salt
occurred when cadmium chloride was added to glycerol broth, EDTA was added in an attempt to keep the
metal salts in solution. When an equal quantity of EDTA and heavy metal salt were added to glycerol
broth, some precipitate was observed, although not to the degree observed in tubes lacking EDTA. These
EDTA-containing tubes were inoculated with R. eutropha, and, following 24h of incubation at 280C, the
OD620 was measured and recorded (Table 7). When I used the criteria that an OD of less than 0.1
indicated sensitivity to the heavy metal and an OD of greater than 0.1 indicated resistance., then the
apparent MIC of cadmium chloride was 10 mM, of cobalt chloride was 9 mM, and of zinc was 12 mM for
R. eutropha. These values were significantly higher than the published values using a spread-plate method
(17), but it should be noted that the medium I used was different than that used for the published values.
However, small clumps were still evident both before and following incubation, thus it appeared that
equal quantities of EDTA and heavy-metal salts were not sufficient to keep all of the heavy-metal salts in
solution. Further thought suggested that an equal concentration of EDTA and the heavy-metal salt was
needed to chelate all of the heavy-metal salt and place it in solution.
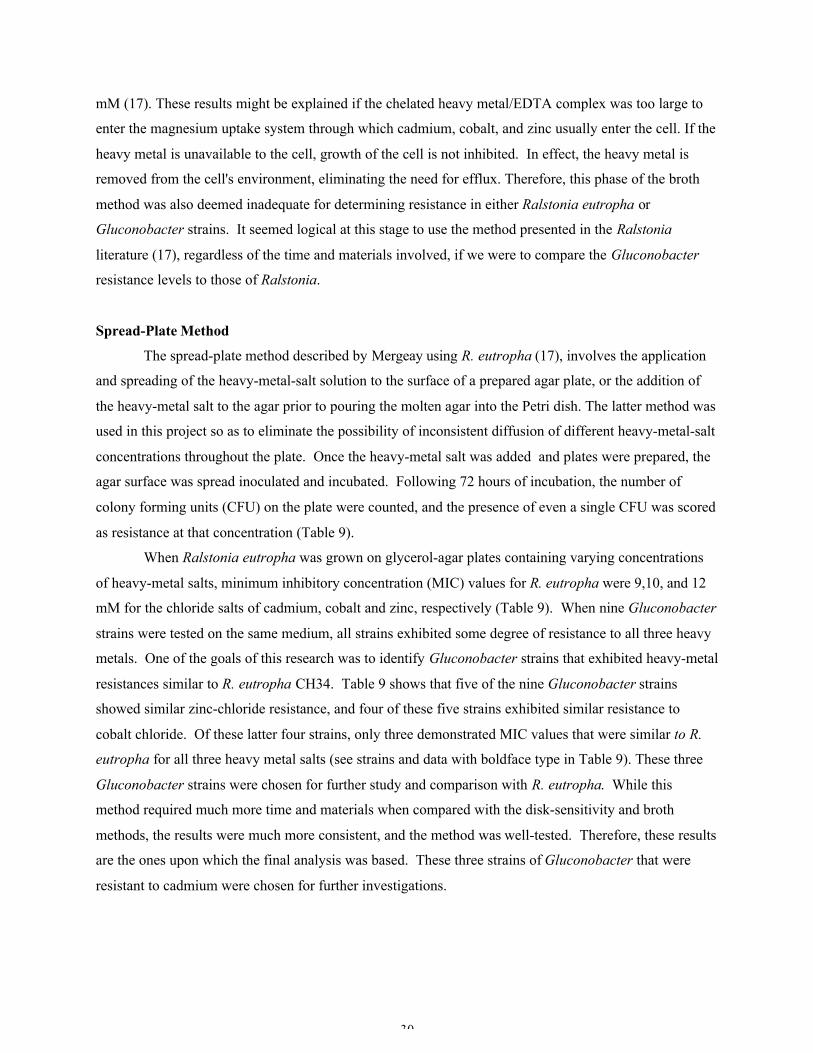
Resistance testing with an equal concentration of EDTA. When an equal millimolar
concentration of EDTA and heavy metal salt was added to glycerol broth, no metal-salt precipitate was
apparent either before or after autoclaving, during incubation, or following growth. Following inoculation
and incubation, the OD 620 was measured and recorded (Table 8). The results presented in Table 8 indicate
that the MIC for R. eutropha growth is greater than 10 mM cadmium, whereas the published value is 2.5
28
TABLE 7. Effect of heavy-metal salts and equal quantities of EDTA onthe growth of Ralstonia eutropha CH34 in glycerol brotha
Optical Density620 at 24h
mM concentration of metal salt
Metal Salt 0 5 6 7 8 9 10 11 12 13 14 15
CdCl2 1.50b 1.20 1.30 0.06 0.92 0.13 0.04 NDc ND ND ND ND
CoCl2 1.50 1.50 1.50 1.07 0.86 0.09 0.04 ND ND ND ND ND
ZnCl2 1.50 1.63 1.63 1.65 1.52 1.74 1.63 0.12 0.06 0.05 0.09 0.06
a The method used to test resistance included the addition of the heavy metal salt as well as an equal quantity of EDTA to 5%glycerol-broth tubes. Following inoculation and incubation on a roller drum for 24 hours at 280C, the optical density of these tubes wasmeasured.
b Averages were calculated using two OD measurements from two separate determinations.c ND = not determined

TABLE 8. Effect of heavy-metal salts and equal concentrations ofEDTA on the growth of Ralstonia eutropha CH34 in glycerol brotha
Optical Density620 at 24h
mM concentration of metal salt
Metal Salt 0 5 6 7 8 9 10 11 12 13 14 15
CdCl2 1.70b 1.63 1.56 1.53 1.56 1.63 1.56 NDc ND ND ND ND
CoCl2 1.70 0.09 0.19 0.21 0.18 0.19 0.17 ND ND ND ND ND
ZnCl2 1.70 1.50 1.43 1.43 1.33 1.20 1.03 0.80 0.56 0.40 0.50 0.50
a The method used to test resistance included the addition of the heavy metal salt as well as an equal quantity of EDTA to 5% glycerolbroth tubes. Following inoculation and incubation on a roller drum for 24 hours at 280C, the optical density of these tubes was measured.
b Averages were calculated using two OD measurements from two separate determinations.c ND = not determined
30
mM (17). These results might be explained if the chelated heavy metal/EDTA complex was too large to
enter the magnesium uptake system through which cadmium, cobalt, and zinc usually enter the cell. If the
heavy metal is unavailable to the cell, growth of the cell is not inhibited. In effect, the heavy metal is
removed from the cell's environment, eliminating the need for efflux. Therefore, this phase of the broth
method was also deemed inadequate for determining resistance in either Ralstonia eutropha or
Gluconobacter strains. It seemed logical at this stage to use the method presented in the Ralstonia
literature (17), regardless of the time and materials involved, if we were to compare the Gluconobacter
resistance levels to those of Ralstonia.
Spread-Plate Method
The spread-plate method described by Mergeay using R. eutropha (17), involves the application
and spreading of the heavy-metal-salt solution to the surface of a prepared agar plate, or the addition of
the heavy-metal salt to the agar prior to pouring the molten agar into the Petri dish. The latter method was
used in this project so as to eliminate the possibility of inconsistent diffusion of different heavy-metal-salt
concentrations throughout the plate. Once the heavy-metal salt was added and plates were prepared, the
agar surface was spread inoculated and incubated. Following 72 hours of incubation, the number of
colony forming units (CFU) on the plate were counted, and the presence of even a single CFU was scored
as resistance at that concentration (Table 9).
When Ralstonia eutropha was grown on glycerol-agar plates containing varying concentrations
of heavy-metal salts, minimum inhibitory concentration (MIC) values for R. eutropha were 9,10, and 12
mM for the chloride salts of cadmium, cobalt and zinc, respectively (Table 9). When nine Gluconobacter
strains were tested on the same medium, all strains exhibited some degree of resistance to all three heavy
metals. One of the goals of this research was to identify Gluconobacter strains that exhibited heavy-metal
resistances similar to R. eutropha CH34. Table 9 shows that five of the nine Gluconobacter strains
showed similar zinc-chloride resistance, and four of these five strains exhibited similar resistance to
cobalt chloride. Of these latter four strains, only three demonstrated MIC values that were similar to R.
eutropha for all three heavy metal salts (see strains and data with boldface type in Table 9). These three
Gluconobacter strains were chosen for further study and comparison with R. eutropha. While this
method required much more time and materials when compared with the disk-sensitivity and broth
methods, the results were much more consistent, and the method was well-tested. Therefore, these results
are the ones upon which the final analysis was based. These three strains of Gluconobacter that were
resistant to cadmium were chosen for further investigations.

TABLE 9. Heavy metal resistance as determined by the spread-platemethod
Minimum Inhibitory Concentration[mM] a
Species Strain c Cd Co Zn
R. eutropha ATCC 43123 9 10 12
G. oxydans IFO 3293 < 5 < 5 < 5G. oxydans IFO 12467 < 5 < 5 < 5G. oxydans ATCC 14960 < 5 < 5 < 5
G. asaii b IFO 3276 8 10 >15
G. frateurii IFO 3286 < 5 < 5 < 5
G. frateurii IFO 3268 < 5 < 5 8G. oxydans ATCC 23771 < 5 8 11G. oxydans ATCC 621 < 5 9 < 5G. oxydans CSIRO B1057 10 6 >15
G. frateurii IFO 3254 8 10 < 5
a Minimum inhibitory concentration determined as the first concentration (mM) of the heavy metal salt at which no CFU were observedon glycerol plates containing a heavy-metal salt after 72 hours of incubation at 280C.
b Strains denoted in bold represent those Gluconobacter strains chosen for PCR analysis due to their resistance patterns.c Abbreviations used: ATCC – American type Culture Collection; CSIRO – Commonwealth Scientific and Industrial Research
Organization, New South Wales, Australia; IFO – Institute for Fermentation, Osaka, Japan
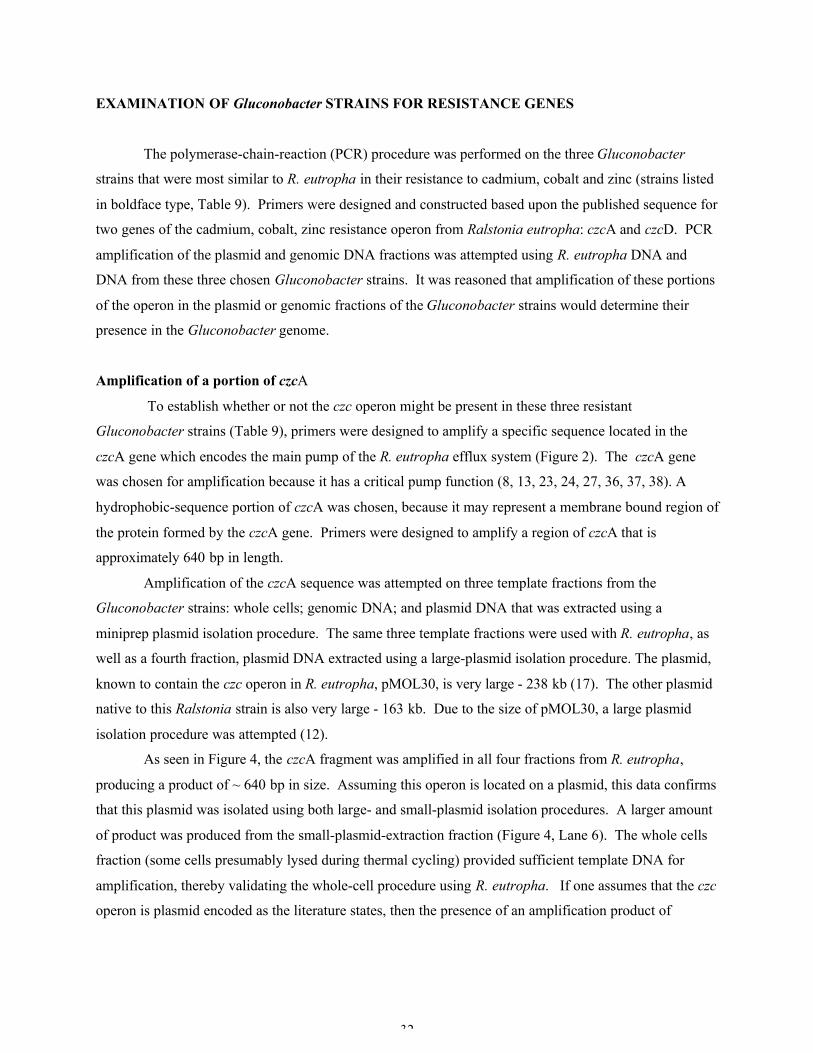
32
EXAMINATION OF Gluconobacter STRAINS FOR RESISTANCE GENES
The polymerase-chain-reaction (PCR) procedure was performed on the three Gluconobacter
strains that were most similar to R. eutropha in their resistance to cadmium, cobalt and zinc (strains listed
in boldface type, Table 9). Primers were designed and constructed based upon the published sequence for
two genes of the cadmium, cobalt, zinc resistance operon from Ralstonia eutropha: czcA and czcD. PCR
amplification of the plasmid and genomic DNA fractions was attempted using R. eutropha DNA and
DNA from these three chosen Gluconobacter strains. It was reasoned that amplification of these portions
of the operon in the plasmid or genomic fractions of the Gluconobacter strains would determine their
presence in the Gluconobacter genome.
Amplification of a portion of czcA
To establish whether or not the czc operon might be present in these three resistant
Gluconobacter strains (Table 9), primers were designed to amplify a specific sequence located in the
czcA gene which encodes the main pump of the R. eutropha efflux system (Figure 2). The czcA gene
was chosen for amplification because it has a critical pump function (8, 13, 23, 24, 27, 36, 37, 38). A
hydrophobic-sequence portion of czcA was chosen, because it may represent a membrane bound region of
the protein formed by the czcA gene. Primers were designed to amplify a region of czcA that is
approximately 640 bp in length.
Amplification of the czcA sequence was attempted on three template fractions from the
Gluconobacter strains: whole cells; genomic DNA; and plasmid DNA that was extracted using a
miniprep plasmid isolation procedure. The same three template fractions were used with R. eutropha, as
well as a fourth fraction, plasmid DNA extracted using a large-plasmid isolation procedure. The plasmid,
known to contain the czc operon in R. eutropha, pMOL30, is very large - 238 kb (17). The other plasmid
native to this Ralstonia strain is also very large - 163 kb. Due to the size of pMOL30, a large plasmid
isolation procedure was attempted (12).
As seen in Figure 4, the czcA fragment was amplified in all four fractions from R. eutropha,
producing a product of ~ 640 bp in size. Assuming this operon is located on a plasmid, this data confirms
that this plasmid was isolated using both large- and small-plasmid isolation procedures. A larger amount
of product was produced from the small-plasmid-extraction fraction (Figure 4, Lane 6). The whole cells
fraction (some cells presumably lysed during thermal cycling) provided sufficient template DNA for
amplification, thereby validating the whole-cell procedure using R. eutropha. If one assumes that the czc
operon is plasmid encoded as the literature states, then the presence of an amplification product of
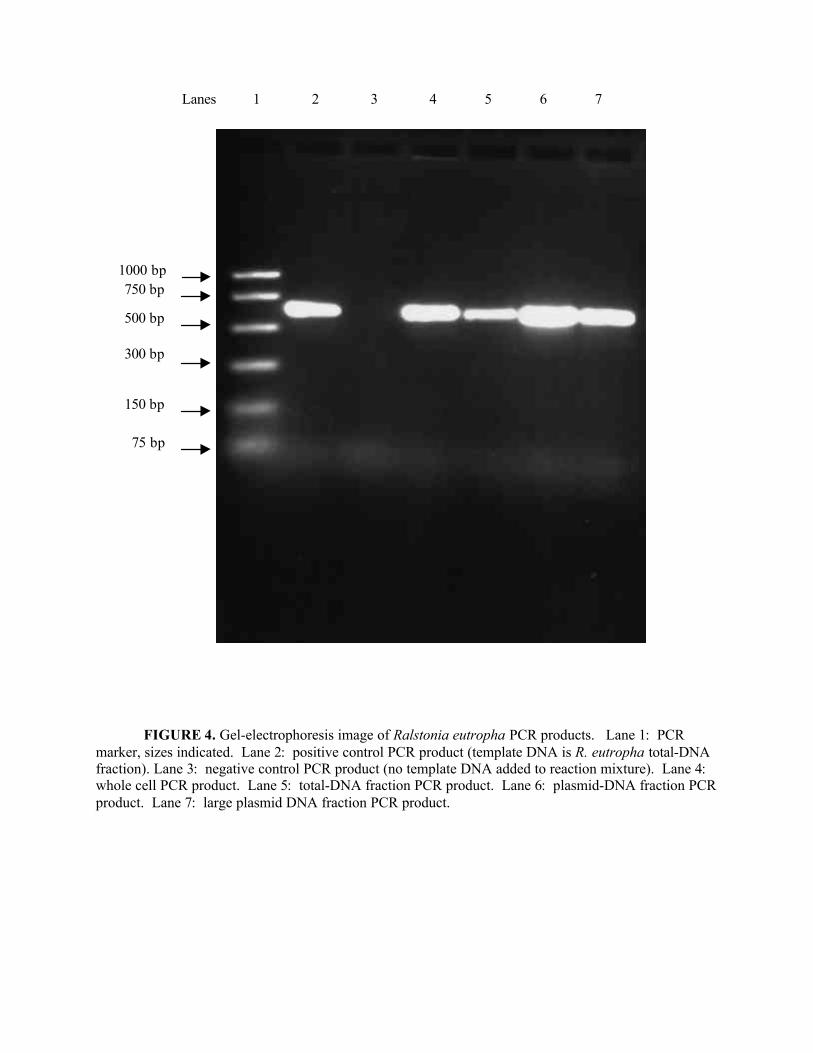
FIGURE 4. Gel-electrophoresis image of Ralstonia eutropha PCR products. Lane 1: PCRmarker, sizes indicated. Lane 2: positive control PCR product (template DNA is R. eutropha total-DNAfraction). Lane 3: negative control PCR product (no template DNA added to reaction mixture). Lane 4:whole cell PCR product. Lane 5: total-DNA fraction PCR product. Lane 6: plasmid-DNA fraction PCRproduct. Lane 7: large plasmid DNA fraction PCR product.
Lanes 1 2 3 4 5 6 7
1000 bp750 bp
500 bp
300 bp
150 bp
75 bp
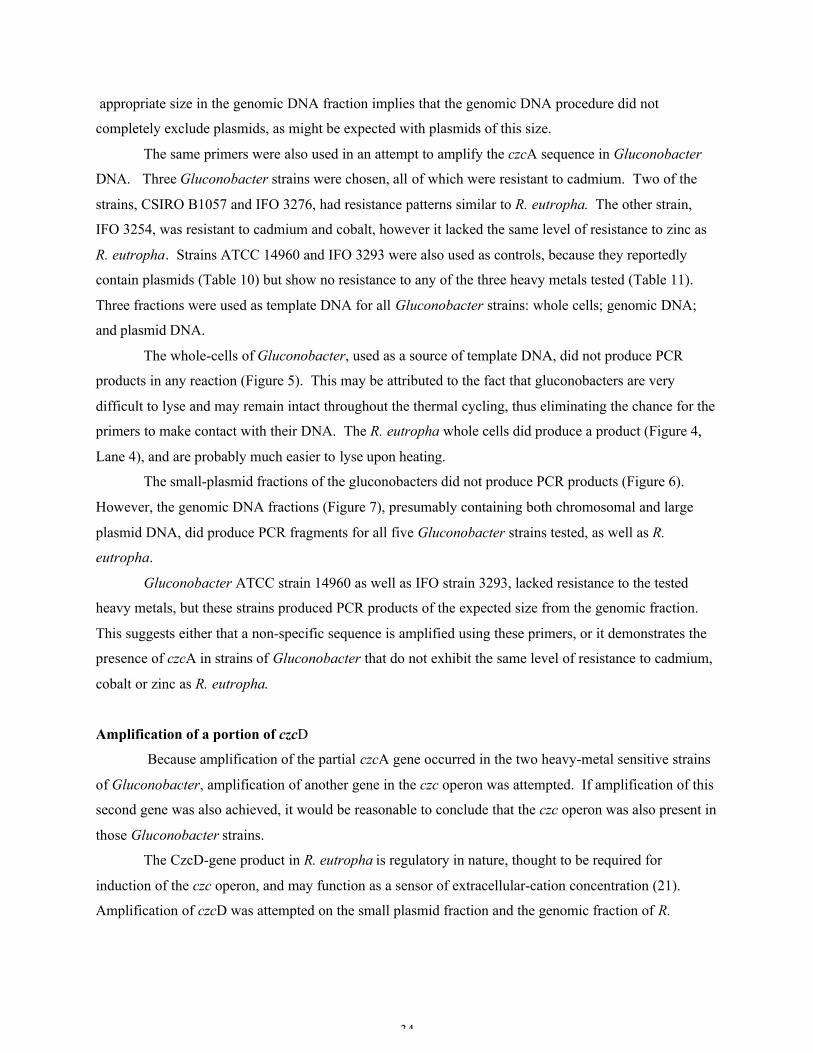
34
appropriate size in the genomic DNA fraction implies that the genomic DNA procedure did not
completely exclude plasmids, as might be expected with plasmids of this size.
The same primers were also used in an attempt to amplify the czcA sequence in Gluconobacter
DNA. Three Gluconobacter strains were chosen, all of which were resistant to cadmium. Two of the
strains, CSIRO B1057 and IFO 3276, had resistance patterns similar to R. eutropha. The other strain,
IFO 3254, was resistant to cadmium and cobalt, however it lacked the same level of resistance to zinc as
R. eutropha. Strains ATCC 14960 and IFO 3293 were also used as controls, because they reportedly
contain plasmids (Table 10) but show no resistance to any of the three heavy metals tested (Table 11).
Three fractions were used as template DNA for all Gluconobacter strains: whole cells; genomic DNA;
and plasmid DNA.
The whole-cells of Gluconobacter, used as a source of template DNA, did not produce PCR
products in any reaction (Figure 5). This may be attributed to the fact that gluconobacters are very
difficult to lyse and may remain intact throughout the thermal cycling, thus eliminating the chance for the
primers to make contact with their DNA. The R. eutropha whole cells did produce a product (Figure 4,
Lane 4), and are probably much easier to lyse upon heating.
The small-plasmid fractions of the gluconobacters did not produce PCR products (Figure 6).
However, the genomic DNA fractions (Figure 7), presumably containing both chromosomal and large
plasmid DNA, did produce PCR fragments for all five Gluconobacter strains tested, as well as R.
eutropha.
Gluconobacter ATCC strain 14960 as well as IFO strain 3293, lacked resistance to the tested
heavy metals, but these strains produced PCR products of the expected size from the genomic fraction.
This suggests either that a non-specific sequence is amplified using these primers, or it demonstrates the
presence of czcA in strains of Gluconobacter that do not exhibit the same level of resistance to cadmium,
cobalt or zinc as R. eutropha.
Amplification of a portion of czcD
Because amplification of the partial czcA gene occurred in the two heavy-metal sensitive strains
of Gluconobacter, amplification of another gene in the czc operon was attempted. If amplification of this
second gene was also achieved, it would be reasonable to conclude that the czc operon was also present in
those Gluconobacter strains.
The CzcD-gene product in R. eutropha is regulatory in nature, thought to be required for
induction of the czc operon, and may function as a sensor of extracellular-cation concentration (21).
Amplification of czcD was attempted on the small plasmid fraction and the genomic fraction of R.
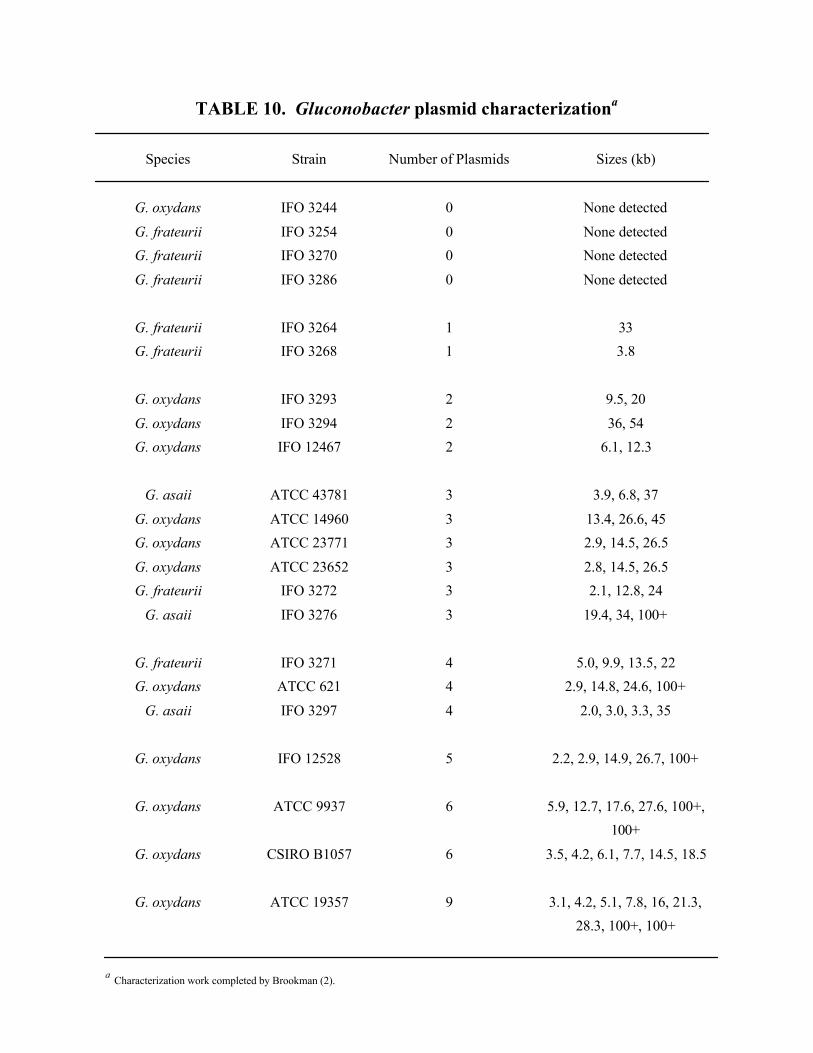
TABLE 10. Gluconobacter plasmid characterizationa
Species Strain Number of Plasmids Sizes (kb)
G. oxydans IFO 3244 0 None detected
G. frateurii IFO 3254 0 None detected
G. frateurii IFO 3270 0 None detected
G. frateurii IFO 3286 0 None detected
G. frateurii IFO 3264 1 33
G. frateurii IFO 3268 1 3.8
G. oxydans IFO 3293 2 9.5, 20
G. oxydans IFO 3294 2 36, 54
G. oxydans IFO 12467 2 6.1, 12.3
G. asaii ATCC 43781 3 3.9, 6.8, 37
G. oxydans ATCC 14960 3 13.4, 26.6, 45
G. oxydans ATCC 23771 3 2.9, 14.5, 26.5
G. oxydans ATCC 23652 3 2.8, 14.5, 26.5
G. frateurii IFO 3272 3 2.1, 12.8, 24
G. asaii IFO 3276 3 19.4, 34, 100+
G. frateurii IFO 3271 4 5.0, 9.9, 13.5, 22
G. oxydans ATCC 621 4 2.9, 14.8, 24.6, 100+
G. asaii IFO 3297 4 2.0, 3.0, 3.3, 35
G. oxydans IFO 12528 5 2.2, 2.9, 14.9, 26.7, 100+
G. oxydans ATCC 9937 6 5.9, 12.7, 17.6, 27.6, 100+,
100+
G. oxydans CSIRO B1057 6 3.5, 4.2, 6.1, 7.7, 14.5, 18.5
G. oxydans ATCC 19357 9 3.1, 4.2, 5.1, 7.8, 16, 21.3,
28.3, 100+, 100+
a Characterization work completed by Brookman (2).

36
TABLE 11. Plasmid presence correlated with heavy metal resistance
Resistant? b
Species Strain c Number ofPlasmids
Cd Co Zn
R. eutropha ATCC 43123 yes yes yes
G. oxydans IFO 3293 2 no no noG. oxydans IFO 12467 2 no no noG. oxydans ATCC 14960 3 no no noG. asaiia IFO 3276 3 yes yes yes
G. frateurii IFO 3286 0 no no no
G. frateurii IFO 3268 1 no no yesG. oxydans ATCC 23771 3 no yes yesG. oxydans ATCC 621 4 no yes noG. oxydans CSIRO B1057 6 yes yes yes
G. frateurii IFO 3254 0 yes yes no
a Strains denoted in bold represent those Gluconobacter strains chosen for PCR analysis due to their resistance patterns.b Resistant strains were defined as those having a minimum inhibitory concentration greater than 5 mM.c Abbreviations used: ATCC – American type Culture Collection; CSIRO – Commonwealth Scientific and Industrial ResearchOrganization, New South Wales, Australia; IFO – Institute for Fermentation, Osaka, Japan
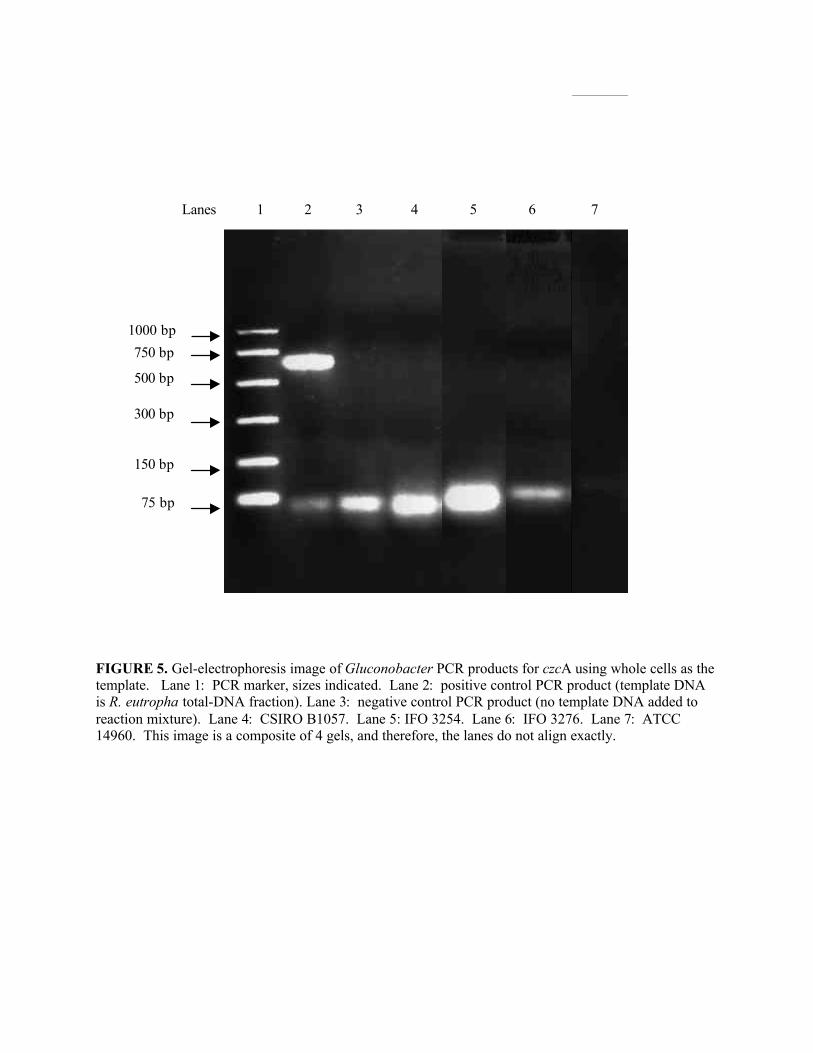
FIGURE 5. Gel-electrophoresis image of Gluconobacter PCR products for czcA using whole cells as thetemplate. Lane 1: PCR marker, sizes indicated. Lane 2: positive control PCR product (template DNAis R. eutropha total-DNA fraction). Lane 3: negative control PCR product (no template DNA added toreaction mixture). Lane 4: CSIRO B1057. Lane 5: IFO 3254. Lane 6: IFO 3276. Lane 7: ATCC14960. This image is a composite of 4 gels, and therefore, the lanes do not align exactly.
500 bp
1000 bp
750 bp
300 bp
150 bp
75 bp
Lanes 1 2 3 4 5 6 7

38
FIGURE 6. Gel-electrophoresis image of Gluconobacter PCR products for czcA uisng plasmid fractionsas the template. Lane 1: PCR marker, sizes indicated. Lane 2: negative control PCR product (notemplate DNA added to reaction mixture). Lane 3: positive control PCR product (template DNA is R.eutrophus total-DNA fraction). Lane 4: CSIRO B1057. Lane 5: IFO 3254. Lane 6: IFO 3276. Lane 7:IFO 3293. Lane 8: ATCC 14960.
Lanes 1 2 3 4 5 6 7 8
1000 bp
750 bp
500 bp
300 bp
150 bp
75 bp

FIGURE 7. Gel-electrophoresis image of Gluconobacter PCR products for czcA using the genomicfractions as the templates. Lane 1: PCR marker, sizes indicated. Lane 2: negative control PCR product(no template DNA added to reaction mixture). Lane 3: positive control PCR product (template DNA is R.eutrophus total-DNA fraction). Lane 4: CSIRO B1057. Lane 5: IFO 3254. Lane 6: IFO 3276. Lane 7:IFO 3293. Lane 8: ATCC 14960.
Lanes 1 2 3 4 5 6 7 8
1000 bp750 bp
500 bp
300 bp
150 bp
75 bp

40
eutropha as template DNA, to ensure that these primers functioned properly (Figure 3). A PCR product
of approximately 600 bp was produced in both fractions (Figure 8).
Amplification of the majority of the czcD gene (Figure 3) was attempted using the genomic
(Figure 9) and plasmid (Figure 10) fractions from the resistant Gluconobacter strains (CSIRO B1057,
IFO 3254, IFO 3276), as well as the sensitive strains (IFO 3293 and ATCC 14960). The small-plasmid
fraction from Ralstonia served as a positive control. The PCR products of approximately 600 bp were
formed using the Ralstonia plasmid and genomic fractions as template DNA, however, contrary to my
expectations, none of the Gluconobacter strain templates were able to produce a PCR product
consistently.
SEQUENCING
Sequencing of the Ralstonia and Gluconobacter PCR products was completed in order to be able
to compare the sequence conservation between the gluconobacters and Ralstonia.
The Ralstonia PCR product from the small-plasmid DNA fraction was sequenced for czcA
(Figure 11) and both the small-plasmid and genomic fractions were of czcD (Figure 12), and all
Gluconobacter strain genomic template products were sequenced for czcA (Figure 13).
The sequences were aligned in order to determine the number and size of the conserved regions
and homolgous portions using Lasergene's MegAlign program.
An alignment (Figure 14), between the control sequence (Ralstonia plasmid PCR product), and
the known sequence (GenBank X98451.1), from which the primers were designed, was performed in
order to assure that the primers effectively amplified the correct sequence. These sequences were able to
be aligned almost perfectly, using the opposite strand of the PCR product sequence, as was expected. This
alignment confirmed that the PCR products were amplified regions of the czcA gene.
In order to determine the amount of variation among the czcA PCR product sequences of the
Gluconobacter strains, an alignment was performed using only the sequences from the genomic PCR
products from the five Gluconobacter strains (Figure 15). In this alignment, there is a very highly
conserved region of sequence, among all five strains, from approximately base 125 to approximately 573,
where 72% of the bases are identical. When these sequences are aligned with the control sequence, from
the plasmid fraction of Ralstonia (Figure 16), the same conserved region is observed, from approximately
base 125 to 570, where 74% of the bases are identical. The appearance of the same conserved region
among these two alignments confirms the fact that the czcA gene is present in the gluconobacters, and
that it is conserved between the two genera of Ralstonia and Gluconobacter.

FIGURE 8. Gel-electrophoresis image of Ralstonia eutropha PCR products for czcD using plasmid andgenomic fractions as templates. Lane 1: PCR marker, sizes indicated. Lane 2: negative control PCRproduct (no template DNA added to reaction mixture). Lane 3: plasmid fraction. Lane 4: genomicfraction.
Lanes 1 2 3 4
500 bp
1000 bp750 bp
300 bp
150 bp
75 bp

42
FIGURE 9. Gel-electrophoresis image of Gluconobacter PCR products for czcD using the genomicfractions as templates. Lane 1: Mass Ladder, sizes indicated. Lane 2: negative control PCR product (notemplate DNA added to reaction mixture). Lane 3: positive control PCR product (template DNA is R.eutropha plasmid fraction). Lane 4: CSIRO B1057. Lane 5: IFO 3254. Lane 6: IFO 3276. Lane 7: IFO3293. Lane 8: ATCC 14960.
Lanes 1 2 3 4 5 6 7 8
2000 bp
1000 bp
800 bp
400 bp
200 bp
100 bp

FIGURE 10. Gel-electrophoresis image of Gluconobacter PCR products for czcD using the plasmidfractions as templates. Lane 1: Mass Ladder, sizes indicated. Lane 2: positive control PCR product(template DNA is R. eutropha plasmid fraction). Lane 3: CSIRO B1057. Lane 4: IFO 3254. Lane 5:IFO 3276. Lane 6: IFO 3293. Lane 7: ATCC 14960. A negative control is not included in this image,however, these reactions were run at the same time as those from Figure 9, and therefore the negativecontrol (Figure 9, Lane 2) is the same.
Lanes 1 2 3 4 5 6 7
2000 bp
1000 bp
800 bp
400 bp
200 bp
100 bp
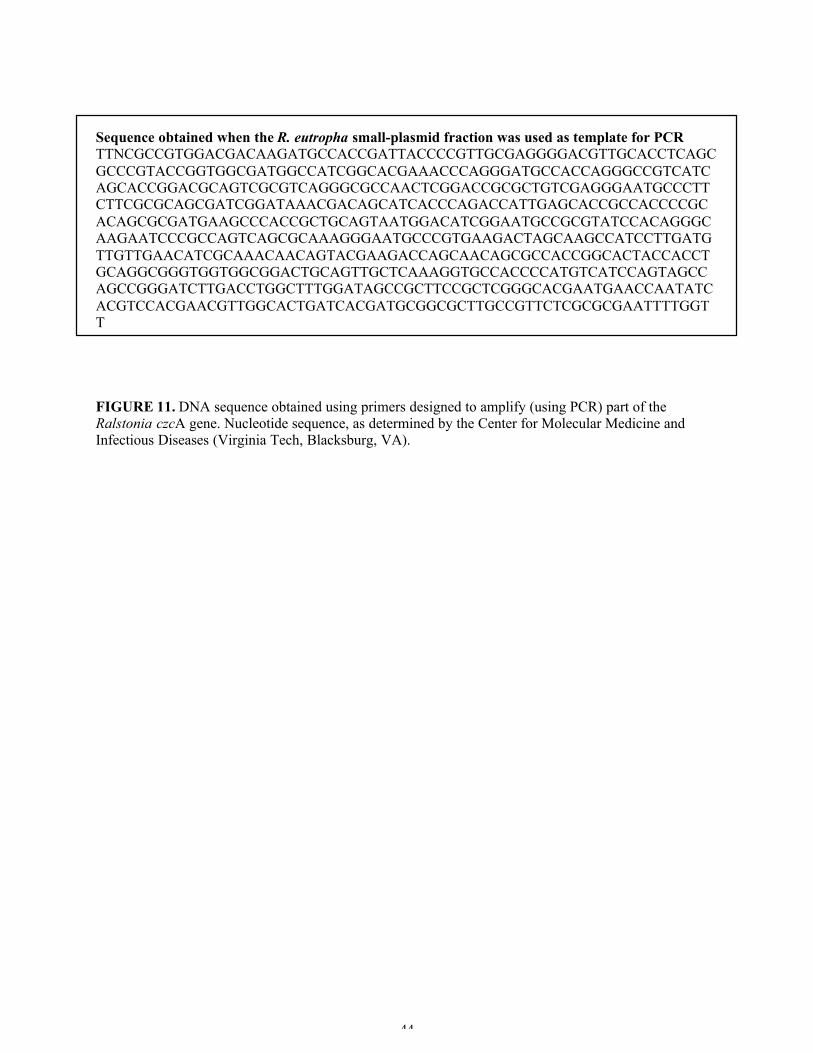
44
Sequence obtained when the R. eutropha small-plasmid fraction was used as template for PCRTTNCGCCGTGGACGACAAGATGCCACCGATTACCCCGTTGCGAGGGGACGTTGCACCTCAGCGCCCGTACCGGTGGCGATGGCCATCGGCACGAAACCCAGGGATGCCACCAGGGCCGTCATCAGCACCGGACGCAGTCGCGTCAGGGCGCCAACTCGGACCGCGCTGTCGAGGGAATGCCCTTCTTCGCGCAGCGATCGGATAAACGACAGCATCACCCAGACCATTGAGCACCGCCACCCCGCACAGCGCGATGAAGCCCACCGCTGCAGTAATGGACATCGGAATGCCGCGTATCCACAGGGCAAGAATCCCGCCAGTCAGCGCAAAGGGAATGCCCGTGAAGACTAGCAAGCCATCCTTGATGTTGTTGAACATCGCAAACAACAGTACGAAGACCAGCAACAGCGCCACCGGCACTACCACCTGCAGGCGGGTGGTGGCGGACTGCAGTTGCTCAAAGGTGCCACCCCATGTCATCCAGTAGCCAGCCGGGATCTTGACCTGGCTTTGGATAGCCGCTTCCGCTCGGGCACGAATGAACCAATATCACGTCCACGAACGTTGGCACTGATCACGATGCGGCGCTTGCCGTTCTCGCGCGAATTTTGGTT
FIGURE 11. DNA sequence obtained using primers designed to amplify (using PCR) part of theRalstonia czcA gene. Nucleotide sequence, as determined by the Center for Molecular Medicine andInfectious Diseases (Virginia Tech, Blacksburg, VA).

Sequence obtained when the R. eutropha small-plasmid fraction was used as template for PCRCCGNCACATGCTCACGGACACCGTCGCACTGGCCATCGCACTGGCTGCTATTGCGATCGCCAAGCGACCCGCGGACAAGAAGCGGACATTTGGCTACTACCGTTTTGAGATTCTTGCCGCGGCCTTTAACGCATTGCTGCTGTTCGGTGTGGCTATCTACATCCTGTACGAAGCCTACCTGCGGCTGAAATCGCCACCTCAGATTGAGTCAACCGGCATGTTCGTCGTGGCTGTGCTGGGCCTGATCATCAATCTCATCAGCATGCGCATGCTGTCCTCCGGGCAAAGCAGCAGCCTGAACGTGAAGGGTGCTTATCTGGAAGTCTGGAGCGATCTGCTCGGGTCGGTTGGCGTCATCGCCGGTGCGATCATCATCCGCTTCACGGGCTGGGCGTGGGTCGACTCCGCCATTGCGGTGCTGATCGGCCTCTGGGTACTGCCTCGCACGTGGATCCTGCTGAAGTCGAGCCTGAATGTGCTGCTCGAAGGCGTACCCGATGACGTGGATCTGGCAGAGGTTGAGAAGCAAATTCTGGCGACGCCCGGGGTAAAAAGCTTNCATGACCTCAATTTT
Sequence obtained when the R. eutropha genomic fraction was used as template for PCRCACATGCTCACGGACACCGTCGCACTGGCCATCGCACTGGCTGCTATTGCGATCGCCAAGCGACCCGCGGACAAGAAGCGGACATTTGGCTACTACCGTTTTGAGATTCTTGCCGCGGCCTTTAACGCATTGCTGCTGTTCGGTGTGGCTATCTACATCCTGTACGAAGCCTACCTGCGGCTGAAATCGCCACCTCAGATTGAGTCAACCGGCATGTTCGTCGTGGCTGTGCTGGGCCTGATCATCAATCTCATCAGCATGCGCATGCTGTCCTCCGGGCAAAGCAGCAGCCTGAACGTGAAGGGTGCTTATCTGGAAGTCTGGAGCGATCTGCTCGGGTCGGTTGGCGTCATCGCCGGTGCGATCATCATCCGCTTCACGGGCTGGGCGTGGGTCGACTCCGCCATTGCGGTGCTGATCGGCCTCTGGGTACTGCCTCGCACGTGGATCCTGCTGAAGTCGAGCCTGAATGTGCTGCTCGAAGGCGTACCCGATGACGTGGATCTGGCAGANGTTGAGAAGCAAATTCTGGCGACGCCCGGGGTAAAAAGCTTTCATGACCTCNATTTTTT
FIGURE 12. DNA sequences obtained using primers designed to amplify (using PCR) part of theRalstonia czcD gene. Nucleotide sequences, as determined by the Center for Molecular Medicine andInfectious Diseases (Virginia Tech, Blacksburg, VA).

46
Sequence obtained when the G. oxydans CSIRO B1057 genomic fraction was used as template forPCRAGGGGACGTTGCACCTCAGCGCCCGTACCGGTGGCGATGGCCATCGGCACGAAACCCAGGGATGCCACCAGGGCCGTCATCAGCACCGGACGCAGTCGCGTCAGGGCGCCAACTCGGACCGCGCTGTCGAGGGAATGCCCTTCTTCGCGCAGCGATCGGATAAACGACAGCATCACCAGACCATTGAGCACCGCCACCCCGCACAGCGCGATGAAGCCCACCGCTGCAGTAATGGACATCGGAATGCCGCGTATCCACAGGGCAAGAATCCCGCCAGTCANNGCAAAGGGAATGCCCGTGAAGACTAGCAAGCCATCCTTGATGTTGTTGAACATCGCAAACAACAGTACGAAGACCAGCAACAGCGCCACCGGCACTACCACCTGCAGGCGGGTGGTGGCGGACTGCAGTTGCTCAAAGGTGCCACCCCATGTNATCCAGTAGCCAGCCGGGATCTTGACCTGGCTTTTGGATAGCCGCTTCCGCCTNGGGCACGAATGAACCNATATNACTGTCCACGAACGTTGGCACTGATCACGATGCGGCGCTTTGCCGGTTCTCGCGCGAGAATTTGGTTAACTT
Sequence obtained when the G. asaii IFO 3276 genomic fraction was used as template for PCRCNCCGTGGNCNACANGATNNCNGCGATTACCACCGTTGCGAGGGGACGTTGCACCTCAACGCCCGTACCGGTGGNTATGGNCATTGGCACAAAACNCAGGNATGNCANCAGGGNNGNNATCAGNANCGGACGNNTTTGTGTCAGGGTNCCAACTCTGACNGCGCTGNTAAGNGANTNNTNNTNTTACCGCAGANAACNGATTAACGACNNTATNAANAGACCATNGNACACNNCCACNCNNNNCAGCGNGATTAAGCCCACCGTTGCANTAATGGACATNGGAATGCCGCGTATCCACAGGGCAAGAATCCCGCCAGTCAGCGCAAAGGGAATGCCCGTGAAGACTAGCAAGCCATCCTTGATGTTGTTGAACATCGCAAACAACAGTACGAAGACCAGCAACAGCGCCACCGGCACTACCACCTGCAGGCGGGTGGTGGCGGACTGCANTTGCTCAAAGGTGCCACCCCATGTNATCANTACCANCCGGGATTTGACCTGCTTTGGATANCCGNTTNCNNCTNNGCACNAATGAACCAATATACNTNCACNAACNTTGGNNCTGATA
FIGURE 13. DNA sequences obtained using primers designed to amplify (using PCR) part of theGluconobacter czcA gene. Nucleotide sequences, as determined by the Center for Molecular Medicineand Infectious Diseases (Virginia Tech, Blacksburg, VA).
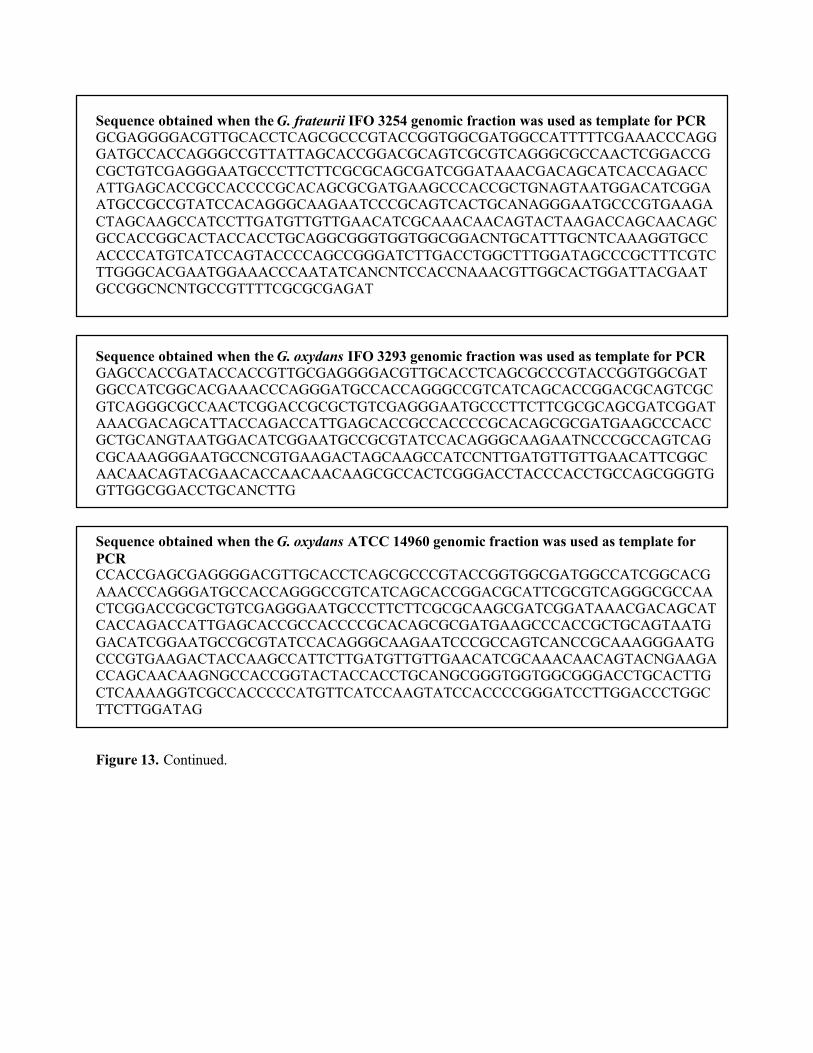
Sequence obtained when the G. frateurii IFO 3254 genomic fraction was used as template for PCRGCGAGGGGACGTTGCACCTCAGCGCCCGTACCGGTGGCGATGGCCATTTTTCGAAACCCAGGGATGCCACCAGGGCCGTTATTAGCACCGGACGCAGTCGCGTCAGGGCGCCAACTCGGACCGCGCTGTCGAGGGAATGCCCTTCTTCGCGCAGCGATCGGATAAACGACAGCATCACCAGACCATTGAGCACCGCCACCCCGCACAGCGCGATGAAGCCCACCGCTGNAGTAATGGACATCGGAATGCCGCCGTATCCACAGGGCAAGAATCCCGCAGTCACTGCANAGGGAATGCCCGTGAAGACTAGCAAGCCATCCTTGATGTTGTTGAACATCGCAAACAACAGTACTAAGACCAGCAACAGCGCCACCGGCACTACCACCTGCAGGCGGGTGGTGGCGGACNTGCATTTGCNTCAAAGGTGCCACCCCATGTCATCCAGTACCCCAGCCGGGATCTTGACCTGGCTTTGGATAGCCCGCTTTCGTCTTGGGCACGAATGGAAACCCAATATCANCNTCCACCNAAACGTTGGCACTGGATTACGAATGCCGGCNCNTGCCGTTTTCGCGCGAGAT
Sequence obtained when the G. oxydans IFO 3293 genomic fraction was used as template for PCRGAGCCACCGATACCACCGTTGCGAGGGGACGTTGCACCTCAGCGCCCGTACCGGTGGCGATGGCCATCGGCACGAAACCCAGGGATGCCACCAGGGCCGTCATCAGCACCGGACGCAGTCGCGTCAGGGCGCCAACTCGGACCGCGCTGTCGAGGGAATGCCCTTCTTCGCGCAGCGATCGGATAAACGACAGCATTACCAGACCATTGAGCACCGCCACCCCGCACAGCGCGATGAAGCCCACCGCTGCANGTAATGGACATCGGAATGCCGCGTATCCACAGGGCAAGAATNCCCGCCAGTCAGCGCAAAGGGAATGCCNCGTGAAGACTAGCAAGCCATCCNTTGATGTTGTTGAACATTCGGCAACAACAGTACGAACACCAACAACAAGCGCCACTCGGGACCTACCCACCTGCCAGCGGGTGGTTGGCGGACCTGCANCTTG
Sequence obtained when the G. oxydans ATCC 14960 genomic fraction was used as template forPCRCCACCGAGCGAGGGGACGTTGCACCTCAGCGCCCGTACCGGTGGCGATGGCCATCGGCACGAAACCCAGGGATGCCACCAGGGCCGTCATCAGCACCGGACGCATTCGCGTCAGGGCGCCAACTCGGACCGCGCTGTCGAGGGAATGCCCTTCTTCGCGCAAGCGATCGGATAAACGACAGCATCACCAGACCATTGAGCACCGCCACCCCGCACAGCGCGATGAAGCCCACCGCTGCAGTAATGGACATCGGAATGCCGCGTATCCACAGGGCAAGAATCCCGCCAGTCANCCGCAAAGGGAATGCCCGTGAAGACTACCAAGCCATTCTTGATGTTGTTGAACATCGCAAACAACAGTACNGAAGACCAGCAACAAGNGCCACCGGTACTACCACCTGCANGCGGGTGGTGGCGGGACCTGCACTTGCTCAAAAGGTCGCCACCCCCATGTTCATCCAAGTATCCACCCCGGGATCCTTGGACCCTGGCTTCTTGGATAG
Figure 13. Continued.
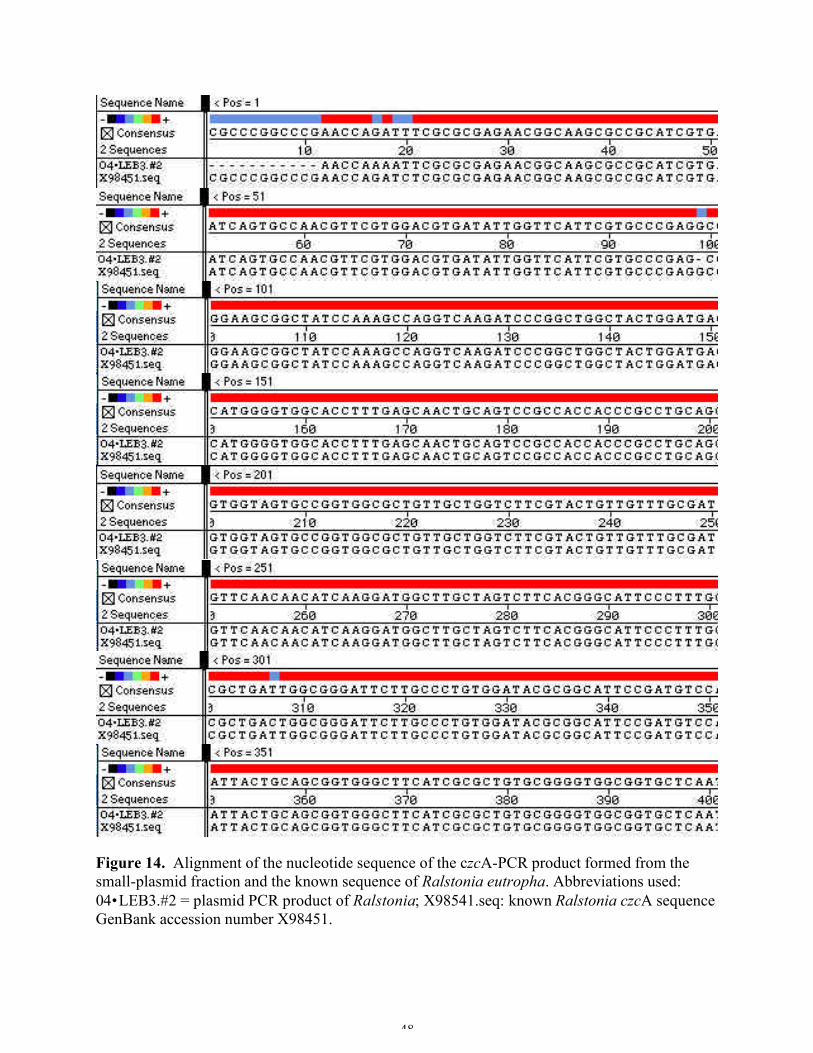
48
Figure 14. Alignment of the nucleotide sequence of the czcA-PCR product formed from thesmall-plasmid fraction and the known sequence of Ralstonia eutropha. Abbreviations used:04•LEB3.#2 = plasmid PCR product of Ralstonia; X98541.seq: known Ralstonia czcA sequenceGenBank accession number X98451.
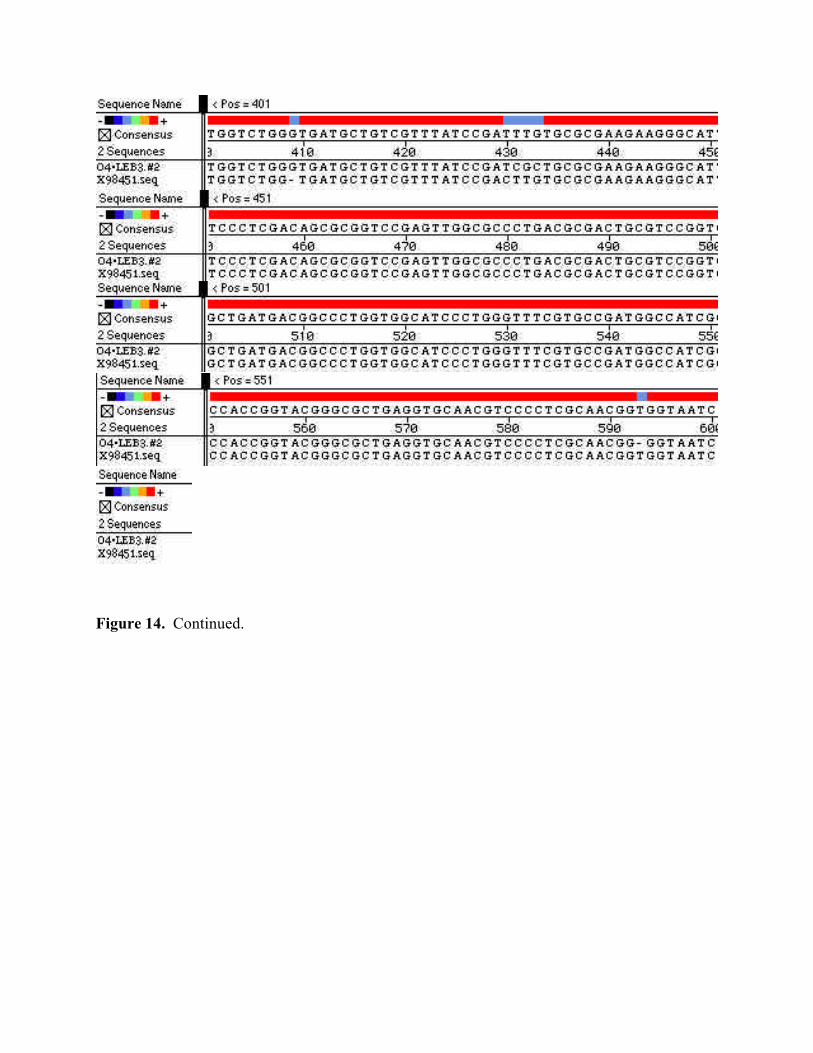
Figure 14. Continued.
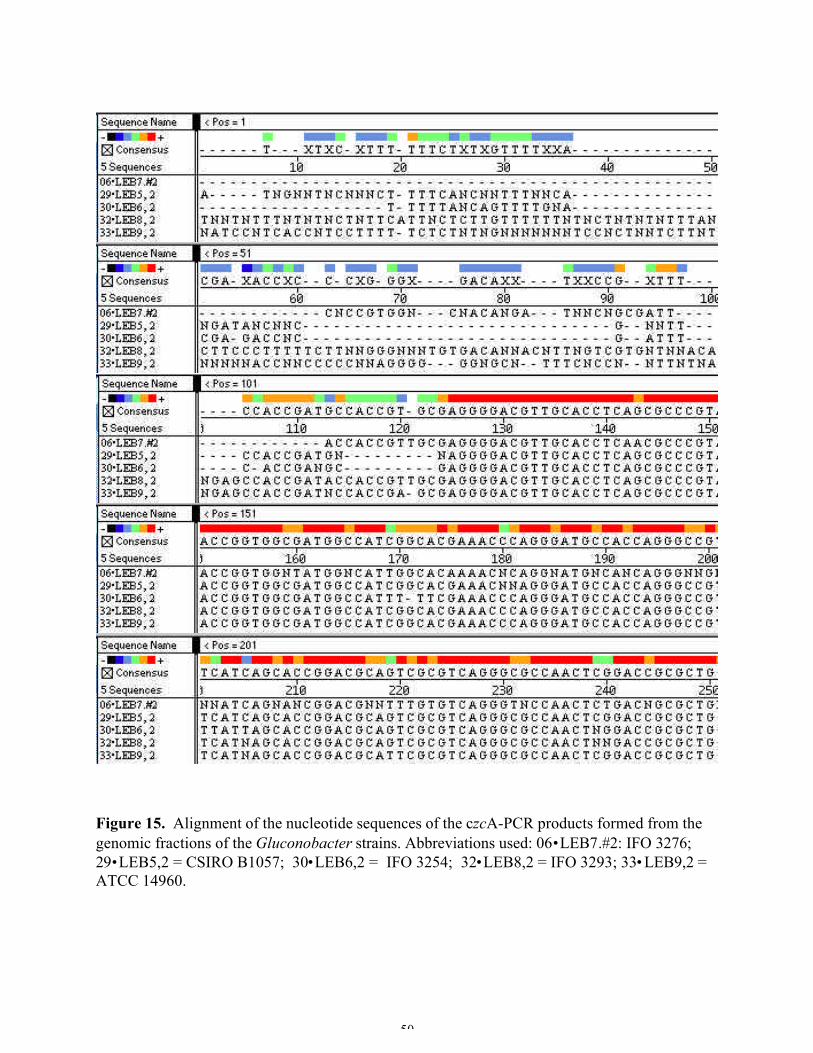
50
Figure 15. Alignment of the nucleotide sequences of the czcA-PCR products formed from thegenomic fractions of the Gluconobacter strains. Abbreviations used: 06•LEB7.#2: IFO 3276;29•LEB5,2 = CSIRO B1057; 30•LEB6,2 = IFO 3254; 32•LEB8,2 = IFO 3293; 33•LEB9,2 =ATCC 14960.
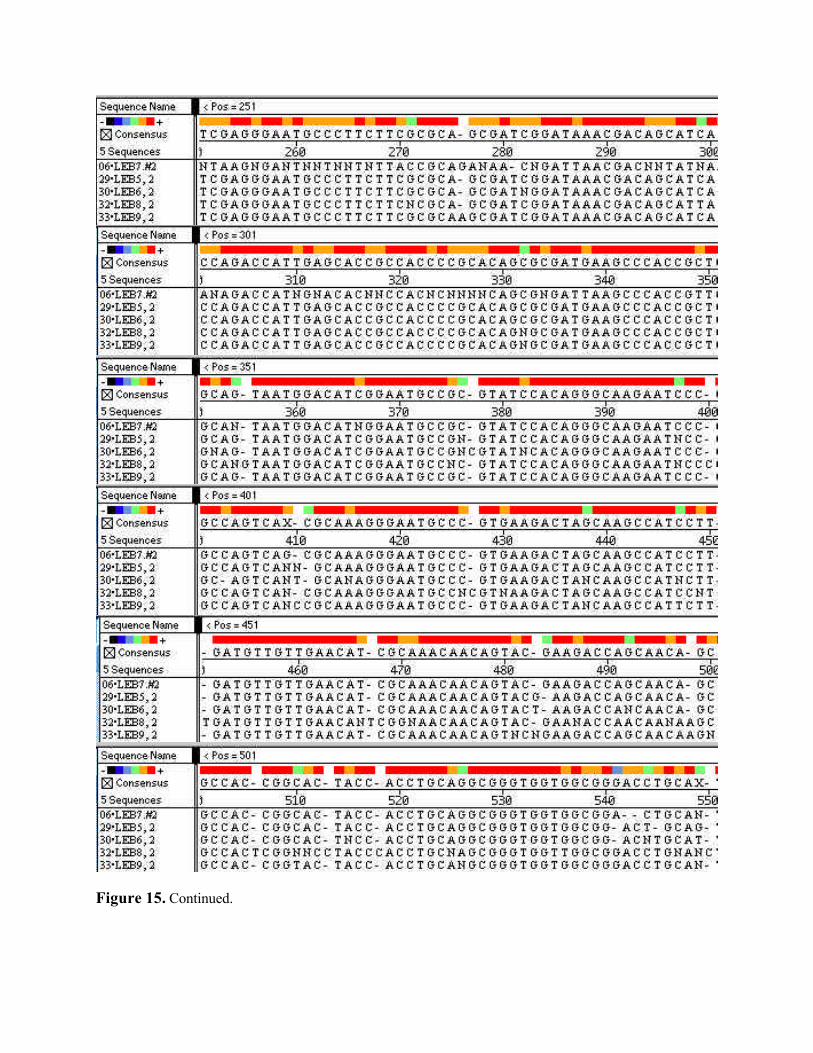
Figure 15. Continued.

52
Figure 15. Continued.
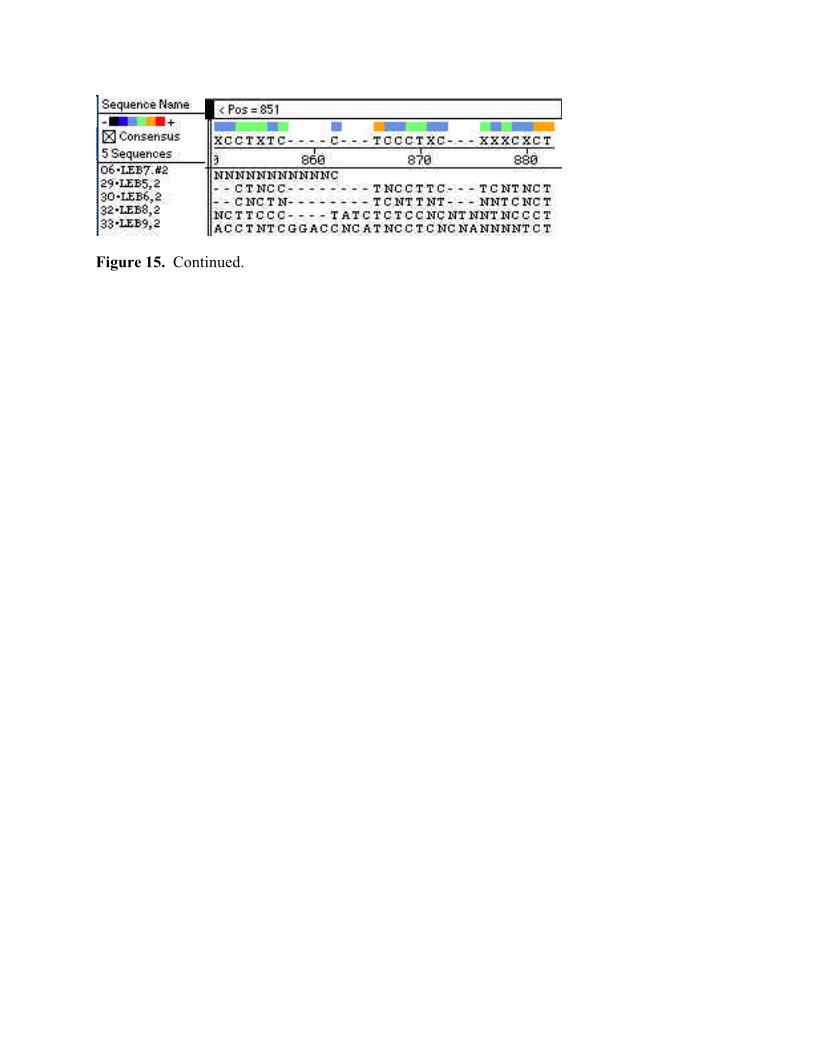
Figure 15. Continued.

54
Figure 16. Alignment of the nucleotide sequences of the czcA-PCR products formed from thegenomic fractions of the Gluconobacter strains and the czcA PCR product formed from thesmall-plasmid fraction of Ralstonia eutropha. Abbreviations used: 06•LEB7.#2 = GluconobacterIFO 3276; 29•LEB5,2 = Gluconobacter CSIRO B1057; 30•LEB6,2 = Gluconobacter IFO3254; 32•LEB8,2 = Gluconobacter IFO 3293; 33•LEB9,2 = Gluconobacter ATCC 14960;04•LEB3.#2 = Ralstonia plasmid PCR product.

Figure 16. Continued.
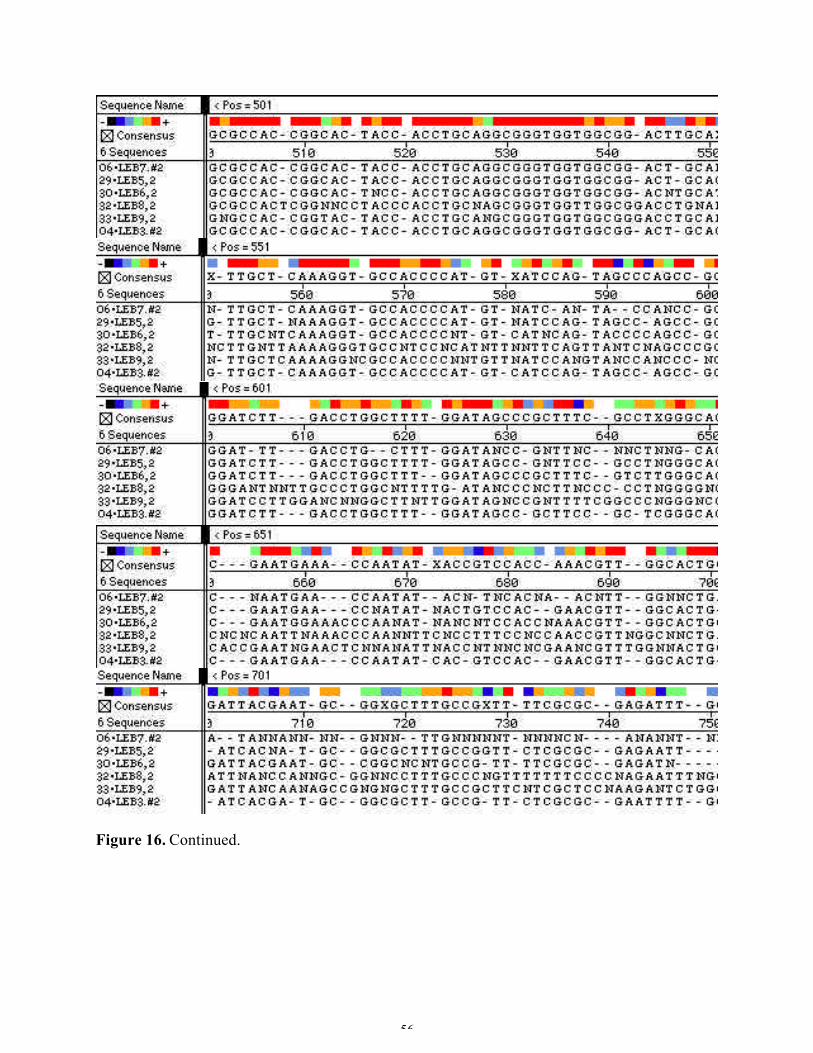
56
Figure 16. Continued.

Figure 16. Continued.

58
Figure 17. Alignment of the nucleotide sequences of the czcD-PCR products formed from theplasmid and genomic fractions of Ralstonia eutropha. Abbreviations used: 02•LEB1.#1 =plasmid PCR product; 03•LEB2.#1 = genomic PCR product; X98541.seq: Known RalstoniaczcD sequence, GenBank accession number X98451.

Figure 17. Continued.

60
The czcD PCR products from the plasmid and genomic fractions of Ralstonia were also aligned
with the known czcD sequence (GenBank X98451) in order to establish that the primers amplified the
desired sequence, even though the sequence was not able to be amplified in the Gluconobacter strains
(Figure 17). This alignment, which shows that 99% of the bases between these two sequences are
identical, confirmed that the PCR products were the desired portions of the czcD gene, and that the primer
design was not to blame for the lack of amplification among the gluconobacters.

DISCUSSION
HEAVY METAL RESISTANCE TESTING
Finding an appropriate method and defining resistance
The disk-sensitivity method, adapted from the antibiotic disk sensitivity testing method by
Munger (20), was used to repeat Munger's results and expand the number of strains tested. There were
two reasons for choosing this method. First, this method was well-accepted for determining sensitivity to
antibiotics. Second, several heavy-metal concentrations could be tested on a single plate, so both time and
money could be saved.
Fourteen strains exhibited resistance to some level of cadmium chloride using the disk sensitivity
method (Table 4). To ensure that the sensitivity observed was due to the cadmium concentration rather
than the chloride concentration, the same method was used to test for sensitivity using cadmium acetate,
sodium chloride and sodium acetate. With evidence that some strains of Gluconobacter were resistant to
cadmium, further exploration into the mechanisms of heavy-metal resistance was desired. The
exploration revealed that the model organism for Gram-negative cadmium resistance, Ralstonia eutropha
(formerly Alcaligenes eutrophus), was known to contain an operon that consisted of genes that encoded
resistance to cadmium, cobalt and zinc, the czc operon (6, 11, 17, 21, 22, 23, 24, 26, 27, 34, 35, 36). It
seemed, following this realization, logical to test the Gluconobacter strains for resistance to cobalt and
zinc in order to determine whether the mechanism used by the gluconobacters might be similar to that
used by Ralstonia eutropha. Ten strains of Gluconobacter were chosen for subsequent testing for zinc
and cobalt resistance, and it was found that all ten strains were resistant to both of these heavy metals at
the same concentrations as used in the cadmium experiment.
At this point, a "definition" of resistance was needed. What concentration of heavy-metal salt
must be the cell be able to survive in order to be deemed resistant? The literature on Ralstonia indicated
that the minimum inhibitory concentration (MIC) of each heavy-metal salt varied according to media
type. While this literature described a different method than the disk-sensitivity method, it seemed logical
that the MIC would also be dependent upon the method used. Therefore, the control strain, Ralstonia
eutropha, was tested using the disk sensitivity method, in order to set the parameters of resistance and
sensitivity (Table 6). From this experiment, it was determined that the concentrations of the heavy-metal
salts used in this experiment were too low to accurately indicate resistance. Therefore, the experiment
needed to be repeated using higher concentrations of the heavy metal salts. However, there were several
concerns with this method. The first concern was the long incubation time, 72 hours, that was required to
develop enough Gluconobacter growth on spread plates to detect an inhibition zone. A method with a
62
shorter incubation time would decrease the length of time needed to establish which strains were resistant
and which were sensitive. Another concern was the efficiency of the diffusion of the heavy-metal salt
into the surrounding medium. I was not convinced that the heavy-metal salt was completely diffusing
from the disk into the medium, and if this were true, this method was not adequately testing the
concentrations of heavy-metal salts desired. Therefore, rather than repeat the experiment using the
spread-plate method, another method was attempted.
It seemed that a method using a liquid medium would avoid diffusion problems and more quickly
detect effects on growth. However, the heavy-metal salt precipitated from the broth, again causing
inconsistent concentrations of heavy metal throughout the tube, and therefore questionable results. The
addition of EDTA to the broth to prevent the precipitation was attempted, but results suggested that
heavy-metal chelation kept the heavy-emtals from adversely affecting culture growth. If the heavy metal
was not entering the cell, resistance or sensitivity was not being demonstrated. Therefore, the broth
method was also abandoned, and a more widely documented method was adopted.
The spread-plate method, used to define resistance of Ralstonia eutropha (17), was used so that
the resistance of the gluconobacters to heavy metals could be compared. This method involved the
addition of the heavy-metal salt to an agar medium prior to solidification. Therefore, the precipitation of
the metal salt was decreased, as well as the concerns about the diffusion of the metal salt from the paper
disk. However, the incubation time was increased to 72 hours. The results using this method
demonstrated the expected gradient of decreased resistance at higher concentrations. Therefore, these
results were used in the final classification of Gluconobacter strains as sensitive or resistant to cadmium,
cobalt, and zinc (Table 11).
Resistant strains
The minimum inhibitory concentration of each heavy metal salt was first determined for
Ralstonia eutropha in order to establish baseline levels of resistance against which to compare values
determined for the Gluconobacter strains. Mergeay et al. (17), who describe this method, define
resistance as the presence of even a single CFU on a plate. They published MIC values of 1 mM
cadmium, 5 mM cobalt, and 2.5 mM zinc on Tris medium. On TY agar, they determined MIC values to
be 3 mM cadmium, 5 mM cobalt, and 10 mM zinc on TY agar (17). According to the results obtained
from my experiment on 5% glycerol agar (Table 9), the MIC values were 9, 10 and 12 mM respectively
for cadmium cobalt and zinc chloride; slightly higher than those obtained by Mergeay on Tris or TY
medium. Both their results and mine demonstrate variation in resistance levels due to medium
composition. The values from the spread-plate method were consistent with those obtained from the
disk-sensitivity method, with the exception of zinc chloride, which had an MIC value of 10 mM using the
disk sensitivity method (Table 6), and an MIC value of 12 mM using the spread-plate method (Table 9).
While the difference between 10 and 12 mM is not great, it is important to note that 12 mM zinc chloride
was not tested during the establishment of the baseline MIC values for Ralstonia using the disk-sensitivity
method, only 10 mM, and 15 mM.
Following the establisment of the resistance patterns for the test strain Ralstonia eutropha on
glycerol medium, the Gluconobacter strains were tested using this same method, same medium, and same
concentrations of heavy metal salts (Table 9). While none of the Gluconobacter strains exhibited levels
of resistance identical to, or higher than those of Ralstonia eutropha, several strains seemed to have
patterns of resistance much like Ralstonia. Of the 10 Gluconobacter strains tested, six were resistant to
one or more of the three heavy metals tested (cadmium, cobalt, and zinc). Of the six Gluconobacter
strains showing heavy-metal resistance: two were resistant to all three heavy metals tested (cadmium,
cobalt and zinc), similar to Ralstonia eutropha; one was resistant to both cadmium and cobalt; one was
resistant to both cobalt and zinc; one was resistant to only cobalt; and one was resistant only to zinc
(Table 9).
RESISTANCE CORRELATED WITH PLASMID PROFILE
The literature concerning cadmium resistance and the czc operon in Ralstonia eutropha, claims
that, this operon is located on a very large plasmid (238 kb). Following experiments that cured the strain
of this plasmid, resistance to cadmium, cobalt and zinc was lost (17).
While many strains of Gluconobacter are characterized in terms of the size and number of
plasmids per strain (Table 10), the function of the plasmids native to many of the Gluconobacter strains is
unknown. Common plasmid-encoded-phenotypic traits, including antibiotic resistance and oxidative
capability, were thoroughly explored, however, no link was found (2).
If one compares resistance to cadmium, cobalt and zinc (Table 9) to the presence of plasmids in
the gluconobacters (Table 10), a direct correlation between plasmid presence and heavy metal resistance
was could not be found. Not all of those strains containing plasmids were resistant to these metals, and
those lacking plasmids were not all sensitive. However, two strains of Gluconobacter, CSIRO B1057 and
IFO 3276, exhibit resistance patterns similar to R. eutropha and, like R. eutropha, were resistant to all
three heavy metal salts. These two Gluconobacter strains also contain plasmids. One strain, G. frateurii
IFO 3254, is resistant to cadmium and cobalt, but this strain lacks zinc resistance and is also reported to
lack plasmids.
64
The plasmid profiles for the Gluconobacter strains, however, were completed in a manner that
did not allow for a precise size description of plasmids greater than 16kb (2). Brookman does note the
presence of plasmids larger than 100kb in five strains of Gluconobacter, ATCC 621, ATCC 9937, ATCC
19357, IFO 12528 and IFO 3276 (2), however, only two of these strains were used in my study, ATCC
621 and IFO 3276. One of these strains, IFO 3276, does exhibit a resistance pattern similar to Ralstonia,
and is resistant to all three heavy metals tested. Separation of such a large plasmid from the chromosome
is difficult, and therefore, the exact size of this plasmid is still unknown. While the plasmid profiles could
not be directly associated to resistance or sensitivity in the gluconobacters, some strains were resistant to
cadmium, cobalt and zinc, and therefore, further investigation into the mechanism of resistance was
performed, including PCR analysis and subsequent sequencing.
SCREENING FOR THE PRESENCE OF THE czc OPERON IN Gluconobacter.
In an effort to gain more knowledge about the resistance genes present in the gluconobacters, an
attempt was made to amplify a region of the czc operon, a hydrophobic region of the main pump protein,
czcA, known to be present in Ralstonia eutropha (6, 11, 17, 21, 22, 23, 24, 26, 27, 34, 35, 36). This
region was chosen, as it seemed that the pump would be a critical part of the efflux mechanism, without
which, resistance would likely be lost.
Amplification of czcA occurred in all fractions of the Ralstonia test strain (Figure 4). While
amplification was expected only in the whole cell and plasmid fractions, a PCR product of the expected
size, 648 bp, was also produced in the genomic fraction (Figure 4). These results may be attributed to the
fact that large plasmids are not always excluded from the genomic DNA during genomic-DNA extraction.
Therefore, the presence of even a single copy of the large plasmid containing the gene of interest may be
present, and allow for amplification during PCR.
Using the same primers, amplification of czcA was attempted, on the plasmid and genomic
fractions of three Gluconobacter strains found to be resistant to cadmium, and two that were sensitive.
The plasmid fractions of these strains did not give rise to PCR products using these primers (Figure 6);
however, the genomic fractions of all strains, both sensitive and resistant, did give rise to czcA PCR
products (Figure 7).
The plasmid DNA fractions failed to produce amplification products for any strain of
Gluconobacter (Figure 6), indicating that the resistance genes, if present in these organisms, were not
located on a plasmid, or that the genomic prep did not sufficiently eliminate the large plasmids. It may be
possible that large plasmids are present in the gluconobacters as well, and were not visualized in

Brookman's study (2). However, with the Ralstonia strain, the large plasmids were apparently present in
the plasmid isolation procedure, because an amplification product was observed in this fraction as well
(Figure 5). Variation among plasmid preparation is certainly a possibility, and without knowing the size
of the proposed larger Gluconobacter plasmids, it is not possible to speculate at this point as to the impact
that the size of a plasmid may make on the ability to exclude large plasmids from either genomic or
plasmid preparations.
The amplification of this partial sequence of czcA in the sensitive Gluconobacter strains as well
as in the resistant strains led me to question the specificity of this gene sequence, even though the
amplicon was of the appropriate size. If we were amplifying something non-specific, as in another type
of pump protein, it would seem logical that it would be present in all strains of all bacteria, regardless of
resistance. Therefore, amplification of another region of the czc operon, czcD was attempted (Figure 3).
This gene sequence was chosen due to its close physical proximity to czcA and its regulatory nature (21).
Amplification of this sequence in the strains from which czcA were able to be produced would seemingly
decrease the likelihood that the PCR product produced from primers designed to amplify czcA was non-
specific.
The gene product, CzcD, is known to be half of a two component regulatory system. In Ralstonia
eutropha (21). However, this regulatory system is not homologous to the typical histidine kinase /
regulator protein type, and may represent a novel class of regulatory systems (21). It is thought that CzcD
acts as the sensor, of the extracellular cation concentration, and is needed for regulation of czc only when
the efflux mechanism is active (21). Another possible function of CzcD is in the mediation of zinc
resistance through Zn2+ transportation. This explanation is supported only by a low (34%) percentage of
homology of the CzcD on the amino acid level to the ZRC-1 protein known to function in this manner in
Saccharomyces cerevisiae (13).
During the attempted amplification of this additional sequence in Ralstonia (Figure 8), only 2
fractions were used: the plasmid and the genomic DNA. As expected following the czcA amplification
results, a 600 bp fragment was produced in both fractions. Following successful amplification of czcD in
Ralstonia, using the same primers, PCR amplification of this gene was attempted the gluconobacters. The
Gluconobacter plasmid and genomic fractions were used (Figures 9 and 10); however, no amplification
products were consistently produced from DNA fractions in any of the Gluconobacter strains. It may be
possible that in the gluconobacters, the regulatory czcD gene is not present, and the operon functions
without this level of regulation. Another possibility is that the sequence of czcD, or a similar regulatory
gene in the gluconobacters differs sufficiently that the primers that are able to amplify this sequence in
Ralstonia are not able to bind and allow for amplification of this sequence in the gluconobacters.
66
SEQUENCING
Sequencing of the PCR products formed from the primers designed to amplify portions of czcA
and czcD was completed in order to determine the relatedness of the Gluconobacter sequences to that of
the control strain, Ralstonia. The sequence data was analyzed by the BLAST program
(http://www.ncbi.nlm.nih.gov/blast) in order to determine the most closely related sequence present in the
data base. The experimentally formed Ralstonia sequences were expected to return the sequence from
which they were derived, accession number X98451. However, the czcA sequence formed from the
plasmid fraction of Ralstonia returned another Alcaligenes (Ralstonia) czcD sequence, accession
numberD67044. This sequence also had an "expected value" of 0.0, implying that the match was not due
to random chance, and therefore, this accession number was also determined to be a reasonable match for
this sequence. The czcA sequence data formed from the genomic fraction of Ralstonia was also entered
into the BLAST program, however, due to the significant number of undetectable bases, "N" values, there
was "no significant similarity found" between this sequence data and the sequences present in the
database. For this reason, the Ralstonia genomic-fraction sequence was eliminated from further analyses.
Both czcD sequences, plasmid and genomic, returned the X98451 accession number, as expected. All
Gluconobacter strain sequence data returned a closest match (E value ≤ 0.0) to either accession number
X98451, the sequence from which the primers were designed) or accession number D67044, "Alcaligenes
sp. CzcA, CzcB, CzcC and CzcD." Therefore, my data supports the idea that the czcA gene was present
in all tested Gluconobacter strains, regardless of sensitivity or resistance to cadmium, cobalt, or zinc.
The same sequences were then aligned, using the Clustal method and Lasergene's MegAlign
program in order to determine the conserved sequences among the strains, as well as the amount of
relatedness between the test (Gluconobacter) and control (Ralstonia) strains. From these alignments
(Figures 14-17), I concluded that the PCR products from the Gluconobacter strains were amplified
regions of the czcA gene. I also determined that the PCR products formed in Ralstonia, from the primers
designed to amplify a portion of the czcD, gene were effective at amplifying the correct czcD sequence in
the desired gene in this operon in Ralstonia. However, the primers were not able to amplify the same
region among the Gluconobacter genetic material. The czcD gene sequence may be absent from these
strains, or the sequence may be sufficiently different from the primers designed, thereby preventing them
from binding.

FUTURE RESEARCH SUGGESTIONS
• PCR amplification of additional strains of Gluconobacter genomic DNA using the primers designed
to amplify czcA and czcD, to better determine if heavy metal resistance is dependent upon these genes
in the gluconobacters.
• Attempt amplification of these genes on a large-plasmid-isolation preparation from Gluconobacter
strains.
• Design alternative primers for other regions of the czcD gene to be used in PCR analysis of the
Gluconobacter strains as a second attempt to amplify this gene in those strains.
• PCR amplification of additional strains of Gluconobacter using primers designed to amplify
additional genes in the czc operon, in order to have a better idea of the relationship between heavy
metal resistance and the presence of these genes.
• Construction of mutant Gluconobacter strains that lack czcA, and subsequent screening for heavy
metal resistance.
• Pulsed-field gel electrophoresis to determine the presence and sizes of large Gluconobacter plasmids.
• Investigate the role of siderophores in the heavy metal resistance, and possibly the location of
siderophore genes located on Gluconobacter plasmids (10).

68
CONCLUSIONS
• Some strains of Gluconobacter are resistant to cadmium, cobalt or zinc, and some are resistant to all
three heavy metals.
• Some Gluconobacter strains contain at least a portion of the czc operon as described in Ralstonia
eutropha and believed to be responsible for resistance to cadmium, cobalt, and zinc in R. eutropha.
That portion of the czc operon amplified within DNA from all Gluconobacter strains is homologous
to the czcA gene found in R. eutropha.
• The presence of the czcA gene in Gluconobacter strains, however, does not appear to be directly
related to the demonstration of resistance to cadmium, cobalt or zinc, because czcA is also present in
Gluconobacter strains that are sensitive to cadmium.
• The czcA gene could not be amplified from the small plasmid fractions of any Gluconobacter strains.
This strongly suggests that czcA is not located on a small plasmid in these gluconobacters. However,
czcA may be located on a plasmid that is too large to be separated from the chromosome fraction
during plasmid isolation.
• Although czcA was amplified from the genomic fractions of gluconobacters, the portion of the czcD
regulatory gene in Ralstonia chosen for amplification could not be found. Therefore, it is clear that
the czc operon, if present in the gluconobacters, is not identical to the czc operon present in Ralstonia.
LITERATURE CITED
1. Ausubel, F., R. Brent, R. E. Kingston, D. D. Moore, J.G. Seidman, J.A. Smith, and K. Struhl.1995. Short Protocols in Molecular Biology, Third Edition. John Wiley and Sons.
2. Brookman L.L. 1995. Characterization of plasmids among three species of Gluconobacter. Ph.D.dissertation. Virginia Polytechnic Institute, Blacksburg.
3. Chun-Qiang, L., N. Khunajakr, L.G. Chia, Y.M. Deng, P. Charoenchai, and N.W. Dunn. 1997.Plasmid. 38:79-90.
4. Crupper, S.S., V. Worrell, G.C. Stweart, and J.J. Iandolo. 1999. Cloning and Expression ofcadD, a New Cadmium Resistance Gene of Staphylococcus aureus. J. Bacteriol. 181:4071-4075.
5. De Ley, J., and J. Swings. 1984. Genus II Gluconobacter Asai 1935, 689, emend. Mut.char. Asai,Iizuka and Komagata 1964, 100, p. 275-278. In N.R. Krieg and J.G. Holt (eds.), Bergey's manualof systematic bacteriology, Volume 1, Williams and Wilkins, Baltimore.
6. Diels, L., Q. Dong, D. van der Lelie, W. Baeyens, and M. Mergeay. 1995. The czc operon ofAlcaligenes eutrophus CH34: from resistance mechanism to the removal of heavy metals. J. Ind.Microbiol. 14:142-153.
7. Fukaya, M., K. Tayama, T. Tamaki, H. Tagami, H. Okumura, and T. Beppu. 1985. Distributionand characterization of plasmids in acetic acid bacteria. Agric. Biol. Chem. (Tokyo) 49:1349-1355.
8. Gilis, A., P. Corbisier, W. Baeyens, S. Taghavi, M. Mergeay, and D. van der Lelie. 1998. Effectof the siderophore alcaligin E on the bioavailability of Cd in Alcaligenes eutrophus CH34. J. Ind.Microbiol. 20: 61-68.
9. Greenfield, S., and G.W. Claus. 1969. Isocitrate Dehydrogenase and Glutamate Synthesis inAcetobacter suboxydans. J. Bacteriol. 100:1264-1270.
10. Hambuckers-Berhin, F., and J Remacle. 1990. Cadmium sequestraion in cells of two strains ofAlcaligenes eutrophus. FEMS Microbiol. Ecology. 73:309-316.
11. Ji, G., and S. Silver. 1995. Bacterial resistance mechanisms for heavy metals of environmentalconcern. J. Ind. Microbiol. 14:61-75.
12. Kado, C.I., and S. T. Lui. 1981. Rapid Procedure for Detection and Isolation of Large and SmallPlasmids. J. Bacteriol. 145:1365-1373.
13. Kamizomo, A., M. Nishizawa, Y. Teranishi, K. Murata, and A. Kimura. 1989. Identification ofa gene conferring resistance to zinc and cadmium ions in the yeast Saccharomyces cerevisiae.Mol. Gen. Genet. 219:161-167.
14. Kunito, T., T. Kusano, H. Oyaizu, K. Senoo, S. Kanazawa, and S. Matsumoto. 1996. Cloning andsequence analysis of czc genes in Alcaligenes eutrophus sp. strain CT14. Biosci. Biotech.Biochem. 60:699-704.
70
15. Lovely, D. R. 2000. Environmental Microbe-Metal Interactions. ASM Press, Washington, D.C.
16. McKibben, L.A. 1992. Characterization of plasmids in Gluconobacter. M.S. thesis. VirginiaPolytechnic Institute, Blacksburg.
17. Mergeay, M., D. Nies, H.G. Schlegel, J. Gertis, P. Charles, and F. Van Gusegem. 1985.Alcaligenes eutrophus CH34 Is a Facultative Chemolithotroph with Plasmid-Bound Resistance toHeavy Metals. J. Bacteriol. 162: 328-334.
18. Micales, B.K. 1983. DNA/DNA homolgy studies on the genus Gluconobacter. M.S. thesis. VirginiaPolytechnic Institute, Blacksburg.
19. Micales, B.K., J.L. Johnson, and G.W. Claus. 1985. Deoxyribonucleic Acid Homologies AmongOrganisms in the Genus Gluconobacter. Int. J. Syst. Bacteriol. 35:79-85.
20. Munger, J. C. 1997. Search for plasmid mediated phenotypic characteristics in Gluconobacteroxydans. B.S. honors thesis. Virginia Polytechnic Institute, Blacksburg.
21. Nies , D. H. 1992. CzcR and CzcD, gene products affecting regulation of resistance to cobalt, zinc,and cadmium (czc system) in Alcaligenes eutrophus. J. Bacteriol. 174:8102-8110.
22. Nies, D. H. 1992. Resistance to cadmium, cobalt, zinc, and nickel in microbes. Plasmid. 27:17-28.
23. Nies, D. H. 1999. Microbial heavy-metal resistance. Appl. Microbiol. Biotechnol. 51:73-750.
24. Nies, D. H., A. Nies, L. Chu, and S. Silver. 1989. Expression and nucleotide sequence of a plasmid-determined divalent cation efflux system from Alcaligenes eutrophus. Proc. Natl.Acad.Sci. USA.86:7351-7355.
25. Nies, D. H., and S. Silver. 1995. Ion efflux systems involved in bacterial metal resistances. J. Ind.Microbiol. 14:186-199.
26. Nies, D. H., M. Mergeay, B. Friedrich, and H.G. Schlegel. 1987. Cloning of Plasmid GenesEncoding Resistance to Cadmium, Zinc, and Cobalt in Alcaligenes eutrophus CH34. J. Bacteriol.169: 4865-4868.
27. Nies, D.H. 1995. The cobalt, zinc, and cadmium efflux system CzcABC from Alcaligenes eutrophusfunctions as a cation-proton antiporter in E. coli. J. Bacteriol. 177:2707-2712.
28. Passow, H., A. Rothstein, and T.W. Clarkson. 1961. The General Phamacology of the HeavyMetals. Pharmacol. Revs. 13:185-224.
29. Pelczar, M., E.C.S. Chan, and N.R. Krieg. 1993. Microbiology concepts and applications. McGrawHill, Inc., New York, N.Y.
30. Poitevin-Later, F., F. Vandenesch, K. Dyke, J. Fleurette, and J. Etienne. 1992. Cadmium-resistance plasmid in Staphylococcus aureus. FEMS Microbiol. Lett. 99:59-64.
31. Qazi, G.N., V. Verma, R. Parshad and C.L. Chopra. 1989. Plasmid-mediated direct-glucoseoxidation in Gluconobacer oxydans. J.Biotechnology. 10:85-88.
32. Robakis, N.K., N.J. Palleroni, C.W. Despreaux, M. Boublik, C.A. Baker, P.J. Churn, and G.W.Claus. 1985. Isolation and characterization of two phages for Gluconobacter oxydans. J. Gen.Microbiol. 131:2467-2473.
33. Schmidt, T., and H.G. Schlegel. 1989. Nickel and cobalt resistance of various bacteria isolated fromsoil and highly polluted domestic and industrial wastes. FEMS Microbiol. Ecology. 62:315-328.
34. Silver, S. 1996. Bacterial resistances to toxic metal ions - a review. Gene. 179:9-19.
35. Silver, S. and T.K. Misra. 1984. Bacterial transformations of and resistances to heavy metals. BasicLife Sciences. 28:23-46.
36. Silver, S., and L.T. Phung. 1996. Bacterial heavy metal resistance: new surprises. Annu. Rev.Microbiol. 50:753-789.
37. Snyder, L., and W. Champness. 1997. Molecular genetics of bacteria. ASM Press,Washington D.C.
38. Tsai, K.J., and A.L. Linet. 1993. Formation of a Phosphorylated Enzyme Intermediate by the cadACd2+-ATPase. Archives of Biochemistry and Biophysics. 305: 267-270.
39. Tsai, K.J., K.P. Yoon, and A. R. Lynn. 1992. ATP-dependent cadmium trasnport by the cadAcadmium resistance determinant in everted membrane vesicles of Bacillus subtilis. J. Bacteriol.174:116-121.
40. Tynecka, Z. and Z. Szczesniak. 1991. Effect of Cd2+ on phosphate uptake by cadmium-resistantand cadmium-sensitive Staphylococcus aureus. Microbios. 68:53-63
41. Tynecka, Z., A. Malm, and T. Skwarek. 1989. Effect of Cd2+ on growth of the cadmium-resistantand sensitive Staphylococcus aureus. Acta Microbiologica Polonica. 38 (2):117-129.
72
LEIGH-EMMA BURNLEY
1112 Grove AvenueRichmond, Virginia 23220
(804) [email protected]
Education:
MASTER OF SCIENCE, VIRGINIA POLYTECHNIC INSTITUTE AND STATE UNIVERSITY, Blacksburg,Virginia. Major: Biology, Concentration: Microbiology. GPA 3.62. Date of completion: November,2000.
BACHELOR OF. SCIENCE, VIRGINIA POLYTECHNIC INSTITUTE AND STATE UNIVERSITY,Blacksburg, Virginia. Major: Biology. Minor: Chemistry. GPA 3.7. In-Major GPA 3.9. Date ofcompletion: May 1998.
Advanced Diploma, CLOVER HILL HIGH SCHOOL, Midlothian, Virginia. Date of completion: June1994.
Employment:
SCIENTIST, Philip Morris USA, Richmond, Virginia. Member of New Technology – Research,Development and Engineering Microbiology Team. October 2000 - present.
INTERN, Philip Morris USA, Richmond, Virginia. Intern on Microbiology Team. May 1997-August 1997, December 1997-January 1998, May 1998-August 1998.
ASSISTANT TEACHER, Children’s World Learning Center, Richmond, Virginia. Assistant Pre-Kindergarten Teacher. May 1996-January 1997.
CHAPTER 1 AIDE, Chesterfield Co., Virginia. Summer School Chapter 1 Aide for Pre-Kindergarten class. July 1995-August 1995.
Teaching and Research Experience:
GRADUATE RESEARCH, Biology Department, Virginia Tech, Blacksburg, Virginia. Master’sResearch Thesis entitled “Heavy Metal Resistance in the Genus Gluconobacter.” Project included astudy of the cadmium resistance mechanism in the industrially significant acetic acid bacteria as well asisolation of a portion of the gene sequence encoding this mechanism. Fall 1998-Fall 2000.
TEACHING ASSISTANT, Biology Department, Virginia Tech, Blacksburg, Virginia. Graduateteaching assistant for Pathogenic Bacteriology Laboratory. Fall Semester 1999. Graduate teachingassistant for General Microbiology Laboratory. First Summer Session 1999, Spring 2000. Graduateteaching assistant for General Biology Laboratory. Fall Semester 1998, Spring Semester 1999.
UNDERGRADUATE RESEARCH, Biology Department, Virginia Tech, Blacksburg, Virginia. “FecalColiform Contamination Health Risks” under Dr. George M. Simmons. Spring Semester 1998.
TEACHING ASSISTANT, Biology Department, Virginia Tech, Blacksburg, Virginia.Undergraduate teaching assistant for Dr. G. William Claus’ “General Microbiology” active learningcourse. Spring Semester 1998.
TEACHING ASSISTANT, Biology Department, Virginia Tech, Blacksburg, Virginia.Undergraduate teaching assistant for Dr. George M. Simmons’ “Introduction to Biology” course. SpringSemester 1997.
Honors:
PRESIDENT’S LIST – Fall 1994, Spring 1995
DEAN’S LIST – Fall 1994 - Spring 1997
MEMBER OF PHI BETA KAPPA
MEMBER OF GOLDEN KEY NATIONAL HONOR SOCIETY
MEMBER OF PHI KAPPA PHI
MEMBER OF PHI SIGMA - Biological Honor Society
MEMBER OF PHI ETA SIGMA- National Freshman Honor Society
Professional Activities:
AMERICAN SOCIETY OF MICROBIOLOGY , VIRGINIA BRANCH, Virginia Maryland RegionalCollege of Veterinary Medicine, Blacksburg, Virginia. Presentation Title - “Cadmium Resistance in theGenus Gluconobacter.” Authors: Leigh-Emma Burnley and G. William Claus. November 1999.
AMERICAN SOCIETY OF MICROBIOLOGY , NATIONAL MEETING, Los Angeles, California. PosterTitle - “Cadmium Resistance in the Genus Gluconobacter.” Authors: Leigh-Emma Burnley and G.William Claus. May 2000.
Volunteer Activities:
GRADUATE HONOR SYSTEM JUDICIAL PANEL MEMBER, Virginia Tech, Blacksburg, Virginia.Voting member of panel upholding the University’s honor code. Fall Semester 1999.
AQUACULTURE CENTER ASSISTANT, Virginia Tech, Blacksburg, Virginia. Weekly assistant infish husbandry and water quality monitoring. Fall Semester 1996.
YMCA ELEMENTARY TUTOR, Blacksburg, Virginia. Elementary Tutor for children ages 5-7.Kipps Elementary 1995-1996, Margaret Beeks Elementary 1994-1995.
References: Available upon request