Assessment of the Levels of Heavy Metal Contamination in ...
15
680 Nigerian Research Journal of Engineering and Environmental Sciences 3(2) 2018 pp. 680-694 Original Research Article Assessment of the Levels of Heavy Metal Contamination in Soils Around Selected Municipal Solid Waste Dumpsites in Benin City, Nigeria using Pollution Indices * 1 Otabor, K.E., 1 Oviawe, A.P. and 2 Ilori, E.G. 1 Department of Chemistry, Faculty of Physical Sciences, University of Benin, Benin City, Nigeria. 2 Nigerian Institute for Oil Palm Research, NIFOR, Benin City, Edo State, Nigeria. *[email protected] ARTICLE INFORMATION ABSTRACT Article history: Received 28 August, 2018 Revised 04 October, 2018 Accepted 05 October, 2018 Available online 30 December, 2018 Contamination levels assessment of heavy metals such as Cu, Pb, Mn, Ni, Zn, Cd and Cr in soils around municipal solid waste dumpsites in Benin City, Edo State, Nigeria was carried out. The aforementioned metals were analytically determined with an atomic absorption spectrophotometer. The mean concentration levels of heavy metals in the studied dumpsites ranged from 7.63 ± 0.06 to 37.27 ± 0.06 mg/kg for Cu, 1.23 ± 0.21 to 8.30 ± 0.01mg/kg for Pb, 1.30 ± 0.26 to 9.27 ± 0.31mg/kg for Mn, 1.00 ± 0.00 to 5.13 ±0.06 mg/kg for Ni, 5.00 ± 0.17 to 37.93 ± 0.87 mg/kg for Zn, 1.00 ± 0.00 to 6.79 ± 0.02 mg/kg for Cd, and 0.91 ± 0.01 to 5.60 ± 0.36 mg/kg for Cr. Zn was found to be more abundant and was closely followed by Cu while Cr was least abundant in the studied sites. The contamination and pollution index (C/PI) of the analysed heavy metals showed that only Cd was in the pollution ranges with high risk degree while other analysed heavy metals were in the contamination ranges with low risk degree as indicated by the C/PI and the potential ecological risk index ( ) respectively. The pollution load index (PLI) ranges and mean levels were in the following order: Dumpsite II (1.41 – 6.1) averaging 3.41 > dumpsite I (1.85 – 3.82) averaging 2.76 > dumpsite III (1.08 – 2.92) with an average of 1.95, which represents the number of times the metal content in the soil exceeds the average natural background concentration. © 2018 RJEES. All rights reserved. Keywords: Municipal solid waste dumpsite Heavy metals Pollution indices Benin City Contamination 1. INTRODUCTION Toxic heavy metals from waste dumpsites may contaminate soils, plants, water supplies and human food chain (Lokeshappa et al., 2012). The inability to manage these wastes effectively in most developing and some developed countries becomes an issue of great concern because apart from the destruction of aesthetic of landscape by the waste dumpsites, some of the municipal solid wastes contain both organic and in-organic toxic pollutants like heavy metals which threaten human health and the entire ecosystem (Anake et al., 2009).
-
Upload
khangminh22 -
Category
Documents
-
view
4 -
download
0
Transcript of Assessment of the Levels of Heavy Metal Contamination in ...
680
Nigerian Research Journal of Engineering and Environmental Sciences 3(2) 2018 pp. 680-694
Original Research Article
Assessment of the Levels of Heavy Metal Contamination in Soils Around Selected
Municipal Solid Waste Dumpsites in Benin City, Nigeria using Pollution Indices
*1Otabor, K.E., 1Oviawe, A.P. and 2Ilori, E.G. 1Department of Chemistry, Faculty of Physical Sciences, University of Benin, Benin City, Nigeria. 2Nigerian Institute for Oil Palm Research, NIFOR, Benin City, Edo State, Nigeria.
ARTICLE INFORMATION ABSTRACT
Article history:
Received 28 August, 2018
Revised 04 October, 2018
Accepted 05 October, 2018
Available online 30 December, 2018
Contamination levels assessment of heavy metals such as Cu, Pb,
Mn, Ni, Zn, Cd and Cr in soils around municipal solid waste
dumpsites in Benin City, Edo State, Nigeria was carried out. The
aforementioned metals were analytically determined with an
atomic absorption spectrophotometer. The mean concentration
levels of heavy metals in the studied dumpsites ranged from 7.63
± 0.06 to 37.27 ± 0.06 mg/kg for Cu, 1.23 ± 0.21 to 8.30 ±
0.01mg/kg for Pb, 1.30 ± 0.26 to 9.27 ± 0.31mg/kg for Mn, 1.00
± 0.00 to 5.13 ±0.06 mg/kg for Ni, 5.00 ± 0.17 to 37.93 ± 0.87
mg/kg for Zn, 1.00 ± 0.00 to 6.79 ± 0.02 mg/kg for Cd, and 0.91
± 0.01 to 5.60 ± 0.36 mg/kg for Cr. Zn was found to be more
abundant and was closely followed by Cu while Cr was least
abundant in the studied sites. The contamination and pollution
index (C/PI) of the analysed heavy metals showed that only Cd
was in the pollution ranges with high risk degree while other
analysed heavy metals were in the contamination ranges with low
risk degree as indicated by the C/PI and the potential ecological
risk index (���� ) respectively. The pollution load index (PLI)
ranges and mean levels were in the following order: Dumpsite II
(1.41 – 6.1) averaging 3.41 > dumpsite I (1.85 – 3.82) averaging
2.76 > dumpsite III (1.08 – 2.92) with an average of 1.95, which
represents the number of times the metal content in the soil
exceeds the average natural background concentration.
© 2018 RJEES. All rights reserved.
Keywords:
Municipal solid waste dumpsite
Heavy metals
Pollution indices
Benin City
Contamination
1. INTRODUCTION
Toxic heavy metals from waste dumpsites may contaminate soils, plants, water supplies and human food
chain (Lokeshappa et al., 2012). The inability to manage these wastes effectively in most developing and
some developed countries becomes an issue of great concern because apart from the destruction of aesthetic
of landscape by the waste dumpsites, some of the municipal solid wastes contain both organic and in-organic
toxic pollutants like heavy metals which threaten human health and the entire ecosystem (Anake et al., 2009).
681 K.E. Otabor et al. / Nigerian Research Journal of Engineering and Environmental Sciences
3(2) 2018 pp. 680-694 Heavy metals refer to any metallic chemical element in the periodic table having relatively high density
(density greater than 5g/cm3) and are toxic at low concentration. The condition of heavy metals in soils is
problematic due to their persistence and non-biodegradability in the environment (Yuan et al., 2004; Hong
et al., 2014). In recent years, there has been growing concerns over increased contamination of soils and
sediments from various anthropogenic sources like illegal dumping of wastes on land and water.
Heavy metals also occur naturally in soils either from the processes of weathering of parent materials or due
to the geochemical component or formation of the soil area but usually in trace amount (Narwal et al., 1999).
The accumulation of metals in soils from both natural and anthropogenic sources occur in the same way,
thus making it difficult to identify and determine the origin of heavy metals present in the soil (Caplat et al.,
2005; Idris et al., 2007). The largest fraction of heavy metals in soils is associated with the solid phase of
that soil. The problem of pollution arises when heavy metals are mobilised into soil solution and then taken
up by plants or transported to surface or ground water (Kabala and Singh, 2001). The solubility of
compounds or ions of metals in soils is controlled by reactions in solid Phases. These reactions include
mineral precipitation and dissolution, ion exchange, redox reaction, adsorption and desorption reactions,
aqueous complexation, biological immobilization and mobilization and plant uptake through diffusion
(Shiowatana et al., 2001). However, not all the reaction processes in soil chemical and biological processes
are equally important for each metal element, but all metals are affected by soil pH and biological processes
(Shiowatana et al., 2001; Kabala and Singh 2001). A study of the levels of contamination and pollution of
heavy metals in soils around municipal solid waste dumpsites is particularly important, especially in
developing country like Nigeria due to the unprofessional and lawless manner with which wastes are
disposed and also for the assessment of the possible influence of anthropogenic activities on lands and ground
water.
In this study, the levels of soil heavy metals contamination and pollution was assessed based on
contamination and pollution index (C/PI), pollution load index (P/LI) from contamination factors (CF), geo-
accumulation index (Igeo) and the potential ecological risk index (���� ). The standards employed for
interpreting soil heavy metal contamination / pollution (C/P) varies from country to country based on chosen
factors (Lacutusu, 2002). In Nigeria, the pollution index represents the metal content effectively measured
in the soil by chemical analysis and the reference value of contamination obtained using a standard table
formulated by the Department of Petroleum Resources of Nigeria, DPR (DPR, 2002) for maximum
allowable concentration of heavy metals in soils.
2. MATERIALS AND METHODS
2.1. Study Area
The study area is within Benin City metropolis, the capital of Edo state, Nigeria and is located in the south-
south geopolitical zone of Nigeria; bounded by latitudes 60 15’N to 6030’N and longitudes 5o30’E to 5o45’E
and area of about 500 square kilometres. The climatic condition falls within the Rain forest type and similar
to other parts of southern Nigeria. Limonitic coatings are responsible for the brown reddish-yellowish colour.
The formation is covered with loose brownish sand varying in thickness and is about 800m thick; almost all
of which is water bearing with water level varying from about 20 to 52 m. It is generally believed to be
highly permeable, porous and prolific in water yield (Short and Stauble, 1967; Kogbe, 1989; Adaikpoh et
al., 2005; Adaikpoh and Kaizer, 2012). The map of Benin showing soil sample collection points and a table
showing sampling sites description with their geographical position coordinates are presented in Figure 1
and Table 1 respectively.

682 K.E. Otabor et al. / Nigerian Research Journal of Engineering and Environmental Sciences
3(2) 2018 pp. 680-694
Figure 1: Map of Benin showing samples location
Table 1: Sampled sites description and coordinates
Sampled sites Location
of Dumpsite
Type
of waste
Age of
dumpsite
Size of
dumpsite
Coordinates
(Latitude &
Longitude)
Dumpsite (I)
Ikhueniro dumpsite;
Ikhueniro community,
Benin Agbor road (Bye
pass) Benin City
Domestic 15yrs 52,000 m2 6o19’28.261”
N5o45’04.158”E
Dumpsite (II)
Otofure dumpsite;
Otofure community,
Oluku Bye pass, Benin
City
Domestic Above
17yrs 37,500 m2
6o27’47.599”
N5o36’10.397”E
Dumpsite (III)
Iguomon dumpsite;
Iguomon community,
Benin Lagos express way
(Bye pass), Benin City
Domestic 15yrs 58,560 m2 6o21’36.360”
N5o44’58.085”E
Control site
(X)
Farm land at Ikhueniro
community, Benin Agbor
road, Benin City
_ _ _ 6o18’11.394”
N5o46’34.226”E
2.2. Sample Collection and Preparation
Composite soil samples were collected around three (3) Government approved municipal solid waste
dumpsites in Benin City, using a stainless-steel spade at depths of 0 – 15, 15 – 30 and 30- 45 cm, representing
top soils, sub soils and bottom soils respectively. Three soil samples per points from the three depths were
bulked together to form one composite sample. At each studied dumpsite, six (6) different points were
randomly chosen (50 metres away from the centre of each studied dumpsite) for sampling. The composite
soil samples from the six different points in each studied dumpsite were labelled A, B, C, D, E and F for
dumpsite (I); G, H, I, J, K and L for dumpsite (II); and M, N, O, P, Q and R for dumpsite (III), to give a total
of eighteen (18) composite soil samples from the three studied dumpsites. The gradient (high and low
gradient) and the direction of flow of erosion were also considered for each sampling point (spot). Control
soil samples were also obtained in similar manner from a farm land in the adjoining area of the solid wastes
683 K.E. Otabor et al. / Nigerian Research Journal of Engineering and Environmental Sciences
3(2) 2018 pp. 680-694 dumpsite (500 metres away from the studied wastes dumpsites) to serve as control and was labelled sample
‘X’. The control site was unaffected by dumping of waste materials. The geographical position coordinates
of the sampled sites were identified and mapped using global position system (GPS). Soil samples collected
were transferred into a black polythene bag, labelled properly and transported to the laboratory for analysis.
Soil samples were air-dried for a period of two weeks in a well-ventilated space. Samples were homogenized
by grinding in porcelain mortal and sieved through a 2mm (10 meshes) stainless sieve. The air-dried < 2mm
soil samples were oven-dried at 105 ± 0.5oC to a constant mass, cooled and stored in a labelled airtight plastic
Cans prior to analysis (Allen et al., 1974; Okuo et al., 2016a).
2.3. Determination of Total Heavy Metals in the Soil
Total heavy metals determination was carried out in accordance with the USEPA method described by
Khodadoust et al. (2004) and Ilori et al. (2012). Five (5) mL of aqua regia solution and 1 mL of perchloric
acid were added to two grams of soil sample in a 150 mL digestion tube and digested on a heating digester
until white fumes of perchloric acid appeared. All glassware used were soaked and washed with chromic
acid and rinsed with distilled water. Bulk scientific standard solution was used to calibrate the Atomic
Absorption Spectrometer (Bulk Scientific VGP 210). Procedural blank samples were subjected to similar
extraction method using the same amount of reagents.
2.4. Pollution Indices
2.4.1. Contamination/pollution index (C/PI)
This was calculated using Equation (1).
� ��� = �� ������ � � ���� �� ������� � ���� ��� � � � �� ���� (1)
A distinction between soil contamination and pollution range will be establish by means of the
contamination/pollution index (Lacutusu, 2002).
2.4.2. The Geo-accumulation index (1-geo)
The I-geo values were calculated using the Muller’s expression in Equation (2) (Sucharova et al., 2003;
Selvaraj et al., 2004; Reddy et al., 2004).
I-geo= ���� !"#.%&"
' (2)
2.4.3. Pollution load index (PLI)
The PLI was obtained as a contamination factor (CF) of each metal with respect to the natural background
value in the soil (Tomllinson et al., 1980; Angulo, 1996; Usero et al., 2000) by using Equations (3) and (4).
�( = �)*+,-. �&*/01234567 (3)
PLI = [CF1× CF2× CF3×…×CFn]1/n (4)
684 K.E. Otabor et al. / Nigerian Research Journal of Engineering and Environmental Sciences
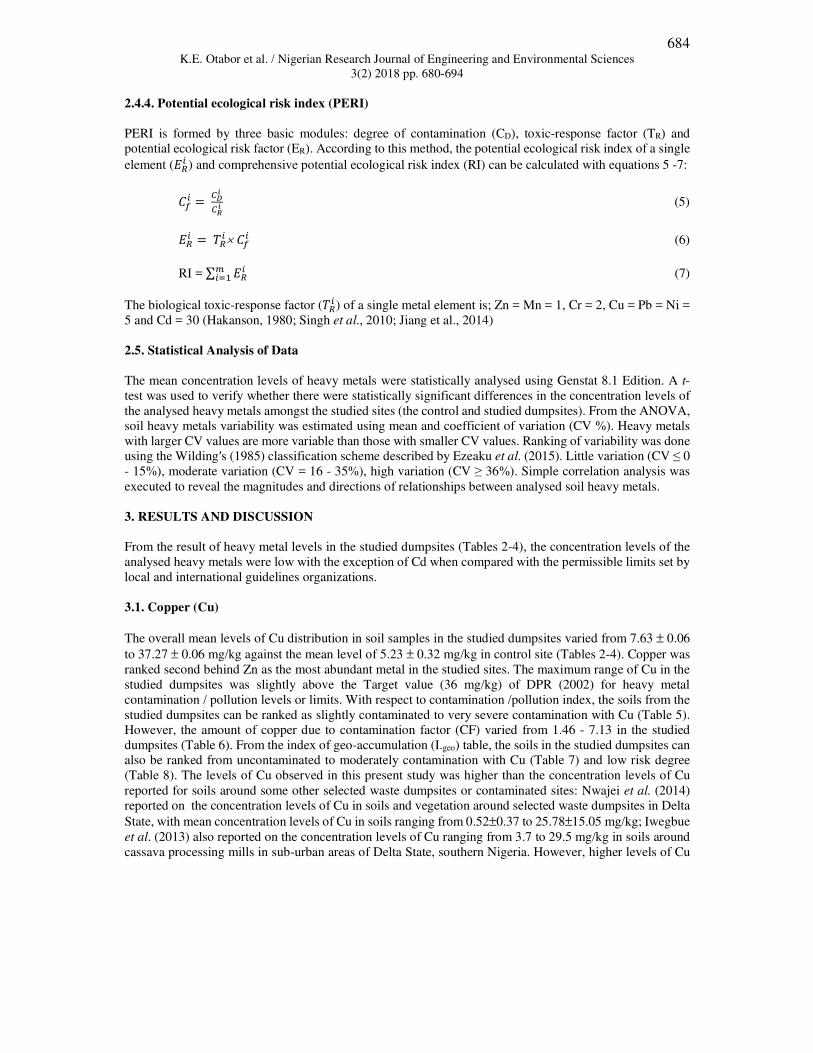
3(2) 2018 pp. 680-694 2.4.4. Potential ecological risk index (PERI)
PERI is formed by three basic modules: degree of contamination (CD), toxic-response factor (TR) and
potential ecological risk factor (ER). According to this method, the potential ecological risk index of a single
element (��� ) and comprehensive potential ecological risk index (RI) can be calculated with equations 5 -7:
�8� = !9:
!;: (5)
��� = <��× �8� (6)
RI = ∑ ���+�># (7)
The biological toxic-response factor (<�� ) of a single metal element is; Zn = Mn = 1, Cr = 2, Cu = Pb = Ni =
5 and Cd = 30 (Hakanson, 1980; Singh et al., 2010; Jiang et al., 2014)
2.5. Statistical Analysis of Data
The mean concentration levels of heavy metals were statistically analysed using Genstat 8.1 Edition. A t-
test was used to verify whether there were statistically significant differences in the concentration levels of
the analysed heavy metals amongst the studied sites (the control and studied dumpsites). From the ANOVA,
soil heavy metals variability was estimated using mean and coefficient of variation (CV %). Heavy metals
with larger CV values are more variable than those with smaller CV values. Ranking of variability was done
using the Wilding′s (1985) classification scheme described by Ezeaku et al. (2015). Little variation (CV ≤ 0
- 15%), moderate variation (CV = 16 - 35%), high variation (CV ≥ 36%). Simple correlation analysis was
executed to reveal the magnitudes and directions of relationships between analysed soil heavy metals.
3. RESULTS AND DISCUSSION
From the result of heavy metal levels in the studied dumpsites (Tables 2-4), the concentration levels of the
analysed heavy metals were low with the exception of Cd when compared with the permissible limits set by
local and international guidelines organizations.
3.1. Copper (Cu)
The overall mean levels of Cu distribution in soil samples in the studied dumpsites varied from 7.63 ± 0.06
to 37.27 ± 0.06 mg/kg against the mean level of 5.23 ± 0.32 mg/kg in control site (Tables 2-4). Copper was
ranked second behind Zn as the most abundant metal in the studied sites. The maximum range of Cu in the
studied dumpsites was slightly above the Target value (36 mg/kg) of DPR (2002) for heavy metal
contamination / pollution levels or limits. With respect to contamination /pollution index, the soils from the
studied dumpsites can be ranked as slightly contaminated to very severe contamination with Cu (Table 5).
However, the amount of copper due to contamination factor (CF) varied from 1.46 - 7.13 in the studied
dumpsites (Table 6). From the index of geo-accumulation (I-geo) table, the soils in the studied dumpsites can
also be ranked from uncontaminated to moderately contamination with Cu (Table 7) and low risk degree
(Table 8). The levels of Cu observed in this present study was higher than the concentration levels of Cu
reported for soils around some other selected waste dumpsites or contaminated sites: Nwajei et al. (2014)
reported on the concentration levels of Cu in soils and vegetation around selected waste dumpsites in Delta
State, with mean concentration levels of Cu in soils ranging from 0.52±0.37 to 25.78±15.05 mg/kg; Iwegbue
et al. (2013) also reported on the concentration levels of Cu ranging from 3.7 to 29.5 mg/kg in soils around
cassava processing mills in sub-urban areas of Delta State, southern Nigeria. However, higher levels of Cu
685 K.E. Otabor et al. / Nigerian Research Journal of Engineering and Environmental Sciences
3(2) 2018 pp. 680-694 have also been reported in other contaminated sites: Ololade, (2014) reported heavy metal contamination in
auto-mechanic workshops in Ikare Akoko, Ondo State, Nigeria with Cu concentration levels ranging from
186.7 to 363.3 mg/kg. Oguntimehin and Ipinmoroti, (2008) reported Cu levels of 151.4 mg/kg in soils from
automobile workshops Akure, Nigeria. Tripathi and Mira, (2012) reported Cu mean levels ranging from
14.96±96 to 90.70±1.84 mg/kg in contaminated soils of municipal waste dumpsites at Allahbad, India.
Ogbonna et al. (2009) reported Cu concentration levels ranging from 24.36 to 68.14 mg/kg in soils of waste
dumpsites in Port Harcourt Municipality and Environs and Ojo et al. (2012) also reported Cu levels ranging
between 37.20 and 120.00 µg/g in soils of major domestic waste dumpsites in Akure, Nigeria.
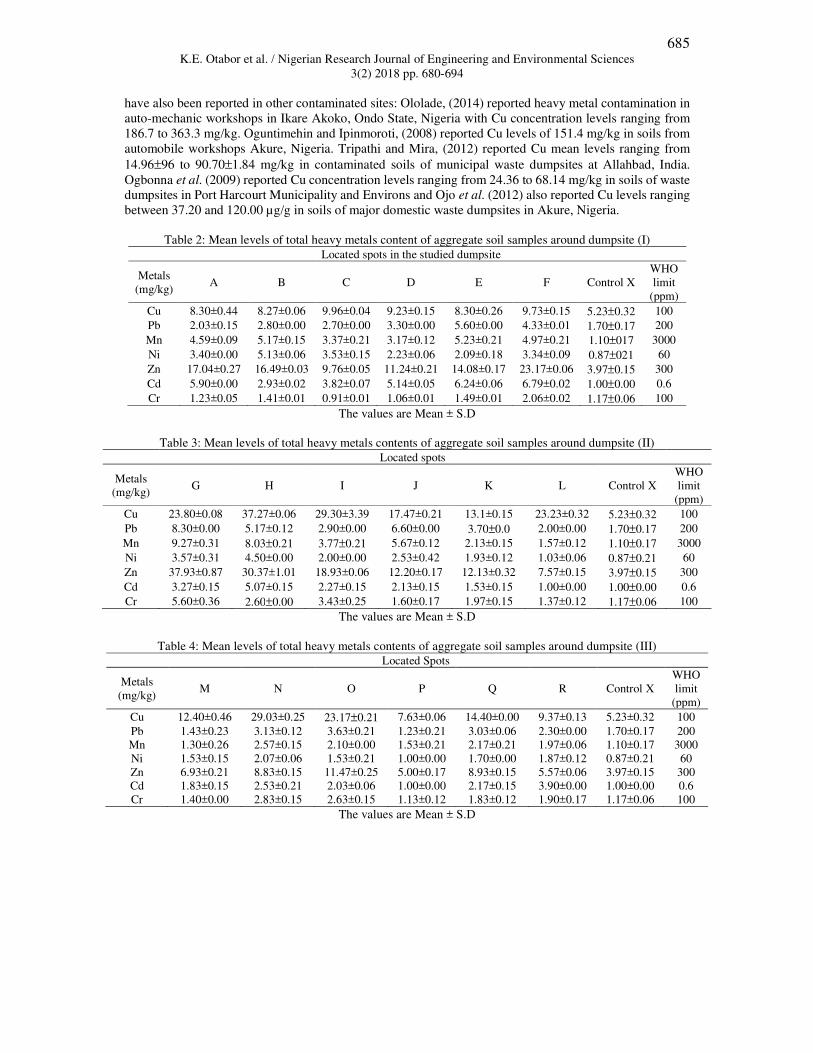
Table 2: Mean levels of total heavy metals content of aggregate soil samples around dumpsite (I)
Located spots in the studied dumpsite
Metals
(mg/kg) A B C D E F Control X
WHO
limit
(ppm)
Cu 8.30±0.44 8.27±0.06 9.96±0.04 9.23±0.15 8.30±0.26 9.73±0.15 5.23±0.32 100
Pb 2.03±0.15 2.80±0.00 2.70±0.00 3.30±0.00 5.60±0.00 4.33±0.01 1.70±0.17 200
Mn 4.59±0.09 5.17±0.15 3.37±0.21 3.17±0.12 5.23±0.21 4.97±0.21 1.10±017 3000
Ni 3.40±0.00 5.13±0.06 3.53±0.15 2.23±0.06 2.09±0.18 3.34±0.09 0.87±021 60
Zn 17.04±0.27 16.49±0.03 9.76±0.05 11.24±0.21 14.08±0.17 23.17±0.06 3.97±0.15 300
Cd 5.90±0.00 2.93±0.02 3.82±0.07 5.14±0.05 6.24±0.06 6.79±0.02 1.00±0.00 0.6
Cr 1.23±0.05 1.41±0.01 0.91±0.01 1.06±0.01 1.49±0.01 2.06±0.02 1.17±0.06 100
The values are Mean ± S.D
Table 3: Mean levels of total heavy metals contents of aggregate soil samples around dumpsite (II)
Located spots
Metals
(mg/kg) G H I J K L Control X
WHO
limit
(ppm)
Cu 23.80±0.08 37.27±0.06 29.30±3.39 17.47±0.21 13.1±0.15 23.23±0.32 5.23±0.32 100
Pb 8.30±0.00 5.17±0.12 2.90±0.00 6.60±0.00 3.70±0.0 2.00±0.00 1.70±0.17 200
Mn 9.27±0.31 8.03±0.21 3.77±0.21 5.67±0.12 2.13±0.15 1.57±0.12 1.10±0.17 3000
Ni 3.57±0.31 4.50±0.00 2.00±0.00 2.53±0.42 1.93±0.12 1.03±0.06 0.87±0.21 60
Zn 37.93±0.87 30.37±1.01 18.93±0.06 12.20±0.17 12.13±0.32 7.57±0.15 3.97±0.15 300
Cd 3.27±0.15 5.07±0.15 2.27±0.15 2.13±0.15 1.53±0.15 1.00±0.00 1.00±0.00 0.6
Cr 5.60±0.36 2.60±0.00 3.43±0.25 1.60±0.17 1.97±0.15 1.37±0.12 1.17±0.06 100
The values are Mean ± S.D
Table 4: Mean levels of total heavy metals contents of aggregate soil samples around dumpsite (III)
Located Spots
Metals
(mg/kg) M N O P Q R Control X
WHO
limit
(ppm)
Cu 12.40±0.46 29.03±0.25 23.17±0.21 7.63±0.06 14.40±0.00 9.37±0.13 5.23±0.32 100
Pb 1.43±0.23 3.13±0.12 3.63±0.21 1.23±0.21 3.03±0.06 2.30±0.00 1.70±0.17 200
Mn 1.30±0.26 2.57±0.15 2.10±0.00 1.53±0.21 2.17±0.21 1.97±0.06 1.10±0.17 3000
Ni 1.53±0.15 2.07±0.06 1.53±0.21 1.00±0.00 1.70±0.00 1.87±0.12 0.87±0.21 60
Zn 6.93±0.21 8.83±0.15 11.47±0.25 5.00±0.17 8.93±0.15 5.57±0.06 3.97±0.15 300
Cd 1.83±0.15 2.53±0.21 2.03±0.06 1.00±0.00 2.17±0.15 3.90±0.00 1.00±0.00 0.6
Cr 1.40±0.00 2.83±0.15 2.63±0.15 1.13±0.12 1.83±0.12 1.90±0.17 1.17±0.06 100
The values are Mean ± S.D
686 K.E. Otabor et al. / Nigerian Research Journal of Engineering and Environmental Sciences
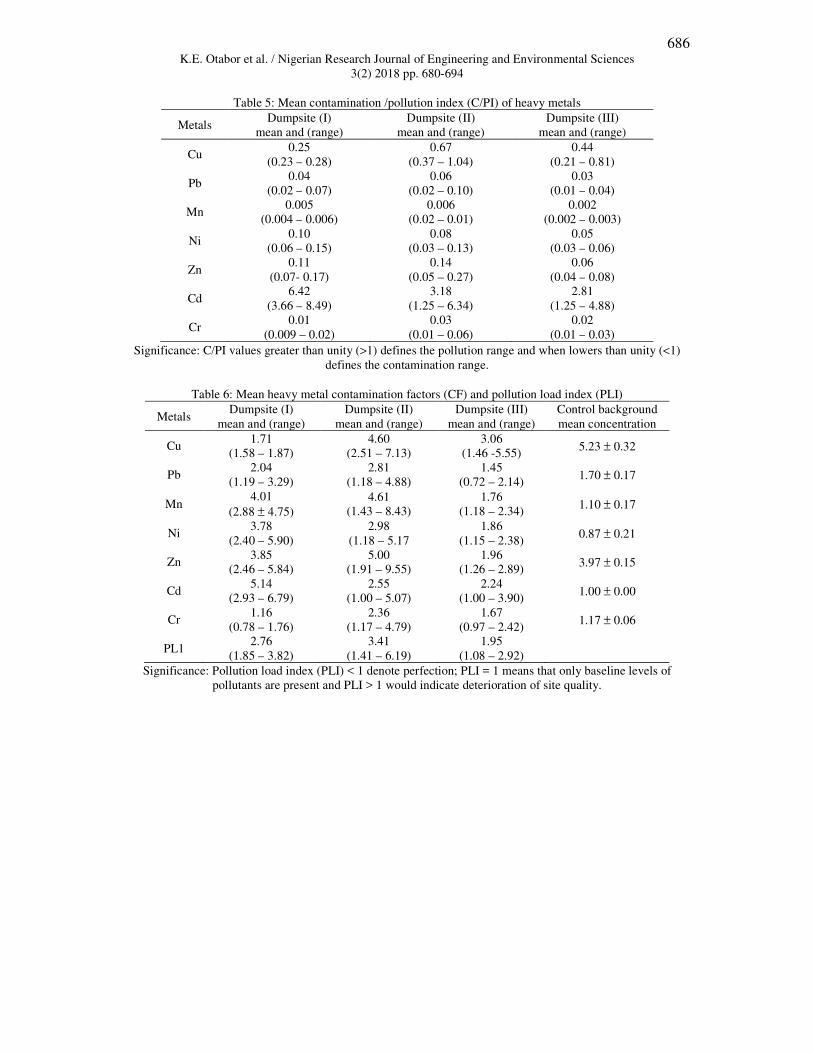
3(2) 2018 pp. 680-694 Table 5: Mean contamination /pollution index (C/PI) of heavy metals
Metals Dumpsite (I)
mean and (range)
Dumpsite (II)
mean and (range)
Dumpsite (III)
mean and (range)
Cu 0.25
(0.23 – 0.28)
0.67
(0.37 – 1.04)
0.44
(0.21 – 0.81)
Pb 0.04
(0.02 – 0.07)
0.06
(0.02 – 0.10)
0.03
(0.01 – 0.04)
Mn 0.005
(0.004 – 0.006)
0.006
(0.02 – 0.01)
0.002
(0.002 – 0.003)
Ni 0.10
(0.06 – 0.15)
0.08
(0.03 – 0.13)
0.05
(0.03 – 0.06)
Zn 0.11
(0.07- 0.17)
0.14
(0.05 – 0.27)
0.06
(0.04 – 0.08)
Cd 6.42
(3.66 – 8.49)
3.18
(1.25 – 6.34)
2.81
(1.25 – 4.88)
Cr 0.01
(0.009 – 0.02)
0.03
(0.01 – 0.06)
0.02
(0.01 – 0.03)
Significance: C/PI values greater than unity (>1) defines the pollution range and when lowers than unity (<1)
defines the contamination range.
Table 6: Mean heavy metal contamination factors (CF) and pollution load index (PLI)
Metals Dumpsite (I)
mean and (range)
Dumpsite (II)
mean and (range)
Dumpsite (III)
mean and (range)
Control background
mean concentration
Cu 1.71
(1.58 – 1.87)
4.60
(2.51 – 7.13)
3.06
(1.46 -5.55) 5.23 ± 0.32
Pb 2.04
(1.19 – 3.29)
2.81
(1.18 – 4.88)
1.45
(0.72 – 2.14) 1.70 ± 0.17
Mn 4.01
(2.88 ± 4.75)
4.61
(1.43 – 8.43)
1.76
(1.18 – 2.34) 1.10 ± 0.17
Ni 3.78
(2.40 – 5.90)
2.98
(1.18 – 5.17
1.86
(1.15 – 2.38) 0.87 ± 0.21
Zn 3.85
(2.46 – 5.84)
5.00
(1.91 – 9.55)
1.96
(1.26 – 2.89) 3.97 ± 0.15
Cd 5.14
(2.93 – 6.79)
2.55
(1.00 – 5.07)
2.24
(1.00 – 3.90) 1.00 ± 0.00
Cr 1.16
(0.78 – 1.76)
2.36
(1.17 – 4.79)
1.67
(0.97 – 2.42) 1.17 ± 0.06
PL1 2.76
(1.85 – 3.82)
3.41
(1.41 – 6.19)
1.95
(1.08 – 2.92)
Significance: Pollution load index (PLI) < 1 denote perfection; PLI = 1 means that only baseline levels of
pollutants are present and PLI > 1 would indicate deterioration of site quality.
687 K.E. Otabor et al. / Nigerian Research Journal of Engineering and Environmental Sciences
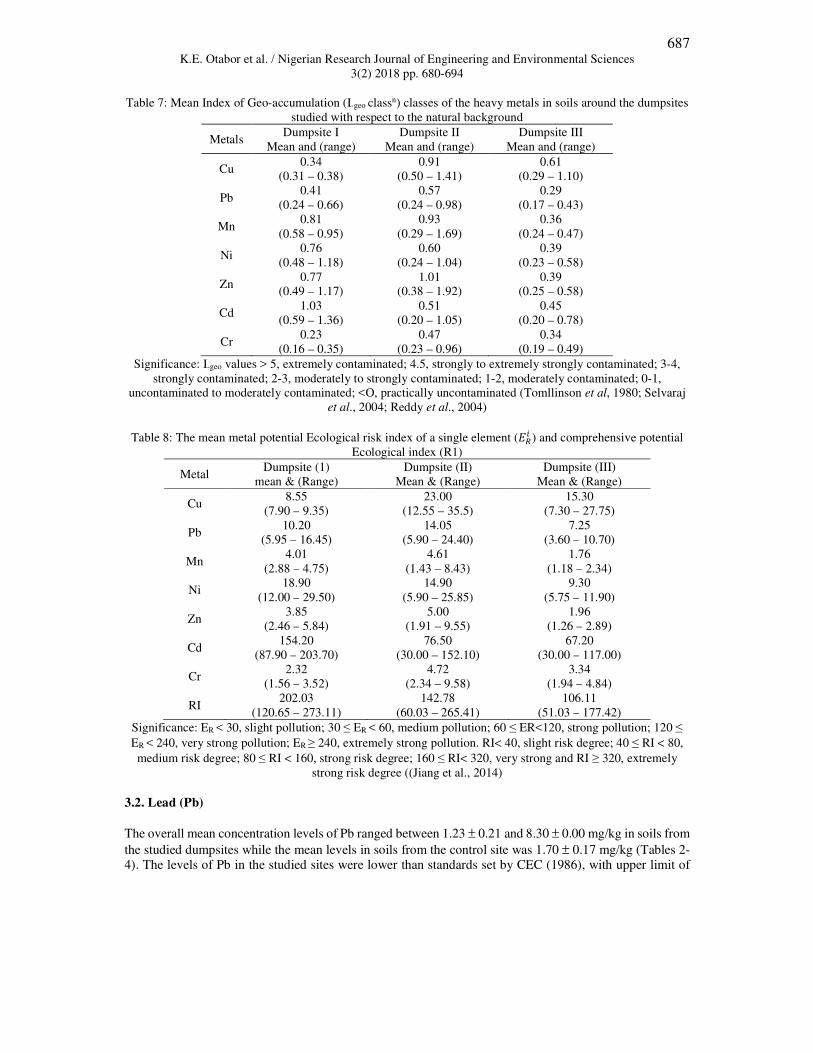
3(2) 2018 pp. 680-694 Table 7: Mean Index of Geo-accumulation (I-geo classn) classes of the heavy metals in soils around the dumpsites
studied with respect to the natural background
Metals Dumpsite I
Mean and (range)
Dumpsite II
Mean and (range)
Dumpsite III
Mean and (range)
Cu 0.34
(0.31 – 0.38)
0.91
(0.50 – 1.41)
0.61
(0.29 – 1.10)
Pb 0.41
(0.24 – 0.66)
0.57
(0.24 – 0.98)
0.29
(0.17 – 0.43)
Mn 0.81
(0.58 – 0.95)
0.93
(0.29 – 1.69)
0.36
(0.24 – 0.47)
Ni 0.76
(0.48 – 1.18)
0.60
(0.24 – 1.04)
0.39
(0.23 – 0.58)
Zn 0.77
(0.49 – 1.17)
1.01
(0.38 – 1.92)
0.39
(0.25 – 0.58)
Cd 1.03
(0.59 – 1.36)
0.51
(0.20 – 1.05)
0.45
(0.20 – 0.78)
Cr 0.23
(0.16 – 0.35)
0.47
(0.23 – 0.96)
0.34
(0.19 – 0.49)
Significance: I-geo values > 5, extremely contaminated; 4.5, strongly to extremely strongly contaminated; 3-4,
strongly contaminated; 2-3, moderately to strongly contaminated; 1-2, moderately contaminated; 0-1,
uncontaminated to moderately contaminated; <O, practically uncontaminated (Tomllinson et al, 1980; Selvaraj
et al., 2004; Reddy et al., 2004)
Table 8: The mean metal potential Ecological risk index of a single element (��� ) and comprehensive potential
Ecological index (R1)
Metal Dumpsite (1)
mean & (Range)
Dumpsite (II)
Mean & (Range)
Dumpsite (III)
Mean & (Range)
Cu 8.55
(7.90 – 9.35)
23.00
(12.55 – 35.5)
15.30
(7.30 – 27.75)
Pb 10.20
(5.95 – 16.45)
14.05
(5.90 – 24.40)
7.25
(3.60 – 10.70)
Mn 4.01
(2.88 – 4.75)
4.61
(1.43 – 8.43)
1.76
(1.18 – 2.34)
Ni 18.90
(12.00 – 29.50)
14.90
(5.90 – 25.85)
9.30
(5.75 – 11.90)
Zn 3.85
(2.46 – 5.84)
5.00
(1.91 – 9.55)
1.96
(1.26 – 2.89)
Cd 154.20
(87.90 – 203.70)
76.50
(30.00 – 152.10)
67.20
(30.00 – 117.00)
Cr 2.32
(1.56 – 3.52)
4.72
(2.34 – 9.58)
3.34
(1.94 – 4.84)
RI 202.03
(120.65 – 273.11)
142.78
(60.03 – 265.41)
106.11
(51.03 – 177.42)
Significance: ER < 30, slight pollution; 30 ≤ ER < 60, medium pollution; 60 ≤ ER<120, strong pollution; 120 ≤
ER < 240, very strong pollution; ER ≥ 240, extremely strong pollution. RI< 40, slight risk degree; 40 ≤ RI < 80,
medium risk degree; 80 ≤ RI < 160, strong risk degree; 160 ≤ RI< 320, very strong and RI ≥ 320, extremely
strong risk degree ((Jiang et al., 2014)
3.2. Lead (Pb)
The overall mean concentration levels of Pb ranged between 1.23 ± 0.21 and 8.30 ± 0.00 mg/kg in soils from
the studied dumpsites while the mean levels in soils from the control site was 1.70 ± 0.17 mg/kg (Tables 2-
4). The levels of Pb in the studied sites were lower than standards set by CEC (1986), with upper limit of
688 K.E. Otabor et al. / Nigerian Research Journal of Engineering and Environmental Sciences
3(2) 2018 pp. 680-694 300 mg/kg and maximum tolerable levels proposed for Agricultural soil, (90-400 mg/kg) set by WHO (1993)
and NEPCA (2010). The levels of Pb observed in this present study were higher than the concentration levels
of Pb reported for soils around some selected waste dumpsites across the country: Eneje and Lemoha, (2012)
reported Pb concentration levels ranging from 0.22 to 1.12 mg/kg in municipal solid waste dump soils in
Owerri Imo State, Nigeria. However, higher levels of Pb have also been reported in most contaminated sites:
Anake et al. (2009) reported Pb mean levels ranging between 169 ± 113 and 2917 ± 538 mg/kg in soils from
municipal solid waste dumpsites in Kano and Kaduna State, Nigeria: Nwajei et al. (2014) reported Pb mean
levels ranging between 44.33 ± 42.55 and 89.62 ± 23.09 mg/kg in Delta State, Nigeria; Amos-Tautua et al.
(2014) reported Pb mean levels ranging from14.75±0.0 to 16.14±0.04 mg/kg in surface soils of municipal
open waste dumpsites in Yenagoa, Nigeria: Tripathi and Misra, (2012) reported Pb mean levels ranging
between 71.47±3.34 and 108.85±3.99 mg/kg in contaminated soils of municipal waste dumpsites at
Allahabad, India: Oguntimehin and Ipinmoroti, (2008) reported Pb concentration levels varying between
98.58 and 218.78 mg/kg in soils around automobile mechanic workshops in Akure Ondo State, Nigeria;
Ololade, (2014) reported Pb concentration levels ranging between 96.6 and 199.3 mg/kg in soils within auto-
mechanic workshops in Ikare Akoko, Ondo State, Nigeria; Oladunni et al. (2013) also reported mean levels
of Pb in the dry season ranging from 569.07 ± 0.11 to 630.07 ± 0.01 mg/kg and in the wet season, the mean
levels ranged between 428.12 ± 0.01 and 502.12 ± 0.12 mg/kg in soils around electronics waste dumpsites
in Alaba International Market, Lagos. With respect to contamination / pollution index, the soils from the
studied dumpsites can be ranked from very slightly contaminated to slightly contamination with Pb (Table
5). The geo-accumulation index (I-geo) also ranked the soils from the studied dumpsites as uncontaminated
with Pb (Table 7). Lead contamination of soils are usually from automobile exhaust fumes as well as dry
cell batteries, sewage effluents, run off of wastes and atmospheric depositions owing to the close proximity
of sites to high vehicular traffic.
3.3. Manganese (Mn)
The mean concentration levels of Mn in soils in the studied dumpsites varied between 1.30 ± 0.26 and
9.27±0.31 mg/kg, the control soil has a mean value of 1.10 ± 0.17 mg/kg (Tables 2-4). It was observed that
the Mn in the studied dumpsites was considered anthropogenic when compared with the amount present in
the control soils (very low in control concentration level). The contamination / pollution index of Mn in the
studied dumpsites soils was ranked very slightly contaminated with Mn (Table 5), with contamination factor
(CF) ranging from 1.18 – 8.43 in the studied dumpsites (Table 6). However, Mn index of geo-accumulation
was ranked from uncontaminated to moderately contamination in the studied dumpsites (Table 7). Higher
levels of Mn in soils that have received significant impact of crude oil in Southern Nigeria have been reported
by Iwegbue et al. (2009). However, Iwegbue et al. (2013) also reported higher levels of Mn in soils around
Cassava Processing Mills in sub-urban areas of Delta State, southern Nigeria, with concentration levels
varying from 0.1 to 383.2mg/kg. Mn and Ni are fuel additives especially in burning fuel (diesel) that are
used in operating heavy duty machines (Sheppard et al., 2000; El-Hassan et al., 2006).
3.4. Nickel (Ni)
The mean levels of Ni in soils in the studied dumpsites ranged from 1.00 ± 0.00 to 5.13 ± 0.06 mg/kg and
the control soils had a mean concentration of 0.87 ± 0.2 mg/kg (Tables 2-4). The maximum range of Ni mean
levels in the studied dumpsites was far lesser than the Target value (35 mg/kg) of the DPR (2002) for soil
heavy metal contamination/pollution limits. The mean concentration levels of Ni found in soils around the
studied dumpsites were similar to the mean levels of Ni in soils from municipal solid waste dumpsites in
Kano and Kaduna State as reported by Anake et al. (2009) with Ni concentration levels ranging from 0.39 –
9.10 mg/kg. However, the levels of Ni recorded in this study were relatively low when compared with the
concentration levels of Ni reported in other contaminated sites: Nwajei et al. (2014) reported mean
concentration levels of Ni ranging from 9.61±7.73 to 23.93±13.08 mg/kg in Agbor, Sapele and Warri in
689 K.E. Otabor et al. / Nigerian Research Journal of Engineering and Environmental Sciences
3(2) 2018 pp. 680-694 Delta State, Nigeria. Oguntimehin and Ipinmoroti, (2008) reported Ni concentration level of 62.10 mg/kg in
automobile workshops in Akure, Nigeria. Iwegbue et al. (2013) reported Ni concentration levels ranging
from 4.0 to 11.3 mg/kg in soils around cassava processing mills in sub-urban areas of Delta State, southern
Nigeria: Tripathi and Misra, (2014) reported mean concentration levels of Ni ranging between 63.35 ± 2.86
and 92.22 ± 2.04 mg/kg in contaminated soils of municipal waste dumpsites at Allahabad, Uttar Pradesh,
India. Ololade, (2014) reported Ni concentration levels ranging from 7.9 to 57.8 µgg-1 in soils within auto-
mechanic workshops in Ikare Akoko, Ondo State, Nigeria. Ojo et al. (2012) reported Ni concentration levels
ranging between 15.60 and 19.20 µg/g in soils of major domestic waste dumpsites in Akure, Nigeria; Omuku
et al. (2012) reported Ni concentration levels varying from 14.54 – 35.80 mg/kg with mean levels of 24.69
± 0.003 mg/kg in soils within New Auto Spare Parts, Nkpor–Agu, Anambra state, Nigeria while Oladunni
et al. (2013) also reported concentration levels of Ni ranging between 82.70±0.06 and 85.43± 0.02 mg/kg in
dry season, and the mean levels in the wet season ranged between 80.24 ± 0.75 and 84.24 ± 0.12 mg/kg
inside electronic waste dumpsite in Alaba International Market Lagos, Nigeria. With respect to
contamination / pollution index, the soils around the studied waste dumpsites could be ranked from very
slightly contaminated to slight contamination with Ni (Table 5), with contamination factor ranging between
1.15 – 5.90 (Table 6) while the geo-accumulation index (I-geo) of Ni could also be ranked as uncontaminated
to moderately contamination with Ni in soils around the studied dumpsites (Table 7).
3.5. Zinc (Zn)
Zinc was ranked as the most abundant heavy metal in this present study. The mean concentration levels of
Zn spanned from 5.00 ± 0.17 to 37.93 ± 0.87 mg/kg in soils around the studied dumpsites. The control soils
had mean Zn concentration of 3.97 ± 0.15mg/kg (Tables 2- 4). The solubility of Cu and Zn ions is governed
by pH and redox conditions. In the pH range of 5.4 – 6.5, Cu and Zn are distinctly more soluble under
oxidizing conditions than reducing conditions. This could be related to their high abundance both in control
and in studied dumpsites (Bhattacharya et al., 2002). The contamination factor (CF) of Zn in soils around
the studied dumpsites ranged between 1.26 and 9.55 (Table 6). The levels of Zn in soils in the studied
dumpsites fits into the ranges of very slightly contaminated to moderate contamination from
contamination/pollution index table (Table 5), and with low ecological risk degree (Table 8). However,
higher concentration levels of Zn have been reported in some other contaminated sites in Nigeria: Ogbonna
et al. (2009) reported Zn concentration levels ranging between 10.32 and 128.16 mg/kg in soils from waste
dumpsites in Port Harcourt Municipality and Environs: Ojo et al. (2012) also reported Zn levels ranging
from 320.40 to 441.00 µg/g in soils of major domestic waste dumpsites in Akure, Nigeria: Ololade, (2014)
then reported Zn concentration levels spanning between 179.9 and 253.9 µgg-1 in soils within auto-mechanic
workshops in Ikare Akoko, Ondo State, Nigeria: Iwegbue et al. (2013) also reported Zn concentration levels
ranging between 21.9 to 97.3 mg/kg in soils around cassava processing mills in sub-urban areas of Delta
State, southern Nigeria: Oguntimehin and Ipinmoroti, (2008) also reported mean concentration levels of Zn
ranging from 328.31 to 693.39 mg/kg in soils from automobile workshops in Akure, Nigeria.
3.6. Cadmium (Cd)
The mean levels of Cadmium in soils around the studied dumpsites ranged between 1.00 ± 0.00 and 6.79 ±
0.02 mg/kg while soil samples from the control site had a mean value of 1.00 ± 0.00 mg/kg (Tables 2 - 4).
The mean levels of Cd recorded in the studied sites were having concentration levels higher than the Target
limit (0.8 mg/kg) of the DPR (2002). The maximum range of Cd in the studied dumpsites was higher than
the natural limits of 0.01 – 3.0 mg/kg in soils as given by MAFF (1992) and CEC (1986). However, the mean
levels of Cd in this study is in agreement with the results obtained from other similar study reported by
Anake et al. (2009), with Cd concentration levels ranging from 0.30 to 4.8 mg/kg in soils from municipal
solid waste dumpsites in Kano and Kaduna states, Nigeria: Nwajei et al. (2004) also reported Cd mean
concentration levels varying from 2.22 ± 1.03 to 3.83 ± 0.43 mg/kg dry weight, in soils around selected
690 K.E. Otabor et al. / Nigerian Research Journal of Engineering and Environmental Sciences
3(2) 2018 pp. 680-694 waste dumpsites in Delta state, Nigeria. With respect to contamination / pollution index evaluated in this
study, Cd has a range of 1.25 – 8.4 and was ranked from slightly polluted to very severe pollution on the
studied dumpsites soils (Table 5). The Cd contamination factors (CF) varied between 1.00 and 6.79 (Table
6) while its geo-accumulation index (I-geo) could also be ranked from uncontaminated to moderately
contamination with Cd in soils around the studied dumpsites (Table 7). In terms of ecological risk index, Cd
varied from strong pollution to very strong pollution with high ecological risk degree (Table 8). However,
the mean levels of Cd in this study were found to be higher in concentration than the Cd levels reported in
other contaminated sites: Amos-Tauta et al. (2014) reported that Cd concentration levels was in trace
amount, with mean values of <0.0001 ± 0.01 mg/kg in soils from municipal open waste dumpsites in
Yenagoa, Nigeria: Ojo et al. (2012) reported Cd mean concentration levels ranging between 1.76 and 2.55
µg/g in soils of major domestic waste dumpsites in Akure, Nigeria: Iwegbue et al. (2013) also reported Cd
mean concentration levels varying from 0.01 to 1.60 mg/kg in soils around cassava processing mills in sub-
urban areas of Delta State, southern Nigeria. Higher concentration levels of Cd have also been reported in
other contaminated sites: Ololade, (2014) reported Cd mean levels spanning from 40.8 to 63.4 µg/g in soils
within auto-mechanic workshops in Ikare Akoko, Ondo State, Nigeria: Oladunni et al. (2013) also reported
Cd mean concentration levels ranging between 9.63 ± 0.07 and 9.99 ± 0.07mg/kg in dry season while in the
wet season, the mean levels ranged between 7.28 ± 0.02 to 7.82 ± 0.02 mg/kg in soils within and around
electronics waste dumpsites in Alaba international market in Lagos, Nigeria; Ogbonna et al. (2009) reported
Cd mean levels ranging from 2.16 to 15.46 mg/kg in soils from waste dumpsites in Port Harcourt
Municipality and Environs; Tripathi and Misra, (2012) also reported higher Cd mean concentration levels of
35.50 ± 0.89 mg/kg in contaminated soils of municipal waste dumpsites at Allahabad, India. Other
contaminated sites were higher concentration levels of Cd have been reported: Bamgbose et al. (2000),
reported heavy metal pollution in dumpsite of Abeokuta City, Nigeria: Oviasogie and Omoruyi, (2007), also
reported levels of heavy metals and physicochemical properties of soil in a Foam manufacturing industry in
Benin City, Nigeria: Iwegbue et al. (2006b), reported preliminary assessment of metal levels of soil of an oil
field in the Niger Delta, Nigeria. Like zinc, Cadmium is found in lubricating oil as part of many additives.
It was reported that Cd concentration levels in Car tyres was in the range of 20 – 90 µg/g as Cd contamination
in the process of Vulcanization (Jaradat and Momani, 1999). The continuous accumulation of Cd in soils
around waste dumpsites may lead to increased uptake of the metal by plants.
3.7. Chromium (Cr)
The mean levels of Cr recorded in soil samples around the studied dumpsites varied between 0.91 ± 0.01
and 5.60 ± 0.36 mg/kg while the mean concentration in control site was 1.17 ± 0.06 mg/kg (Tables 2-4).
This implies that most of the Cr present in soils around the studied dumpsites was from anthropogenic origin.
The levels of Cr in the studied sites were far lower than the Target limit (100 mg/kg) set by DPR (2002) for
contaminated / polluted soil. The mean levels of Cr observed in this study from the studied sites were far
lower than the critical permissible limit which is 50 mg/kg for soils recommended for Agriculture by MAFF
(1992) and CEC (1986). With respect to contamination / pollution index, the levels of Cr in this study could
be ranked as very slightly contaminated (Table 5), with contamination factor ranging between 0.78 and 4.79
(Table 6). The geo-accumulation index of Cr was also ranked from uncontaminated to moderately
contamination (Table 7), with low ecological risk degree (Table 8). However, the levels of Cr in this present
study agrees with the findings of Nwajei et al. (2014), who investigated the heavy metals concentration
levels in soils and vegetation around selected waste dumpsites in Delta state, Nigeria. Lower concentration
levels of Cr have also been reported in some contaminated sites across the country: Amos-Tautua et al.
(2014) reported on Cr concentration levels ranging from 0.05±0.01 to 0.06±0.01 mg/kg in surface soils of
municipal open waste dumpsite in Yenagoa, Nigeria. Iwegbue et al. (2013) also reported mean concentration
levels of Cr ranging between 0.01 and 3.70 mg/kg in soils around cassava processing mills in sub-urban
areas of Delta State, southern Nigeria. Higher levels of Cr have been reported also in other contaminated
sites across the country. Anake et al. (2009) reported Cr mean concentration levels varying from 7.20 ± 1.49
691 K.E. Otabor et al. / Nigerian Research Journal of Engineering and Environmental Sciences
3(2) 2018 pp. 680-694 to 81.20 ± 61.30 mg/kg in soils at municipal solid waste dumpsites in Kano and Kaduna states, Nigeria.
Ololade, (2014) also reported Cr mean concentration levels ranging between 52.3 and 74.5 µgg-1 in soils
within auto-mechanic workshops in Ikare Akoko, Ondo State, Nigeria. Oguntimehin and Ipimoroti, (2008)
reported Cr concentration levels spanning from 28.50 to 115.03 mg/kg in soils from automobile workshops
in Akure, Nigeria. Oladunni et al. (2013) also reported Cr mean concentration levels ranging between 19.11
± 0.01 and 46.58±0.02 mg/kg in soils around an electronic waste dumpsite, Alaba international market in
Lagos, Nigeria. Ojo et al. (2012) reported Cr mean concentration levels varying between 17.06 and 22.10
µg/g in soils of major domestic waste dumpsites in Akure, Nigeria. Iwegbue et al. (2006b) also reported high
levels of Cr in the preliminary assessment of metals levels of soil of an oil field in the Niger Delta, Nigeria.
Sources of Cr in the soils could be due to waste consisting of coloured polythene bags, lead-chromium
batteries, discarded plastic materials and empty paint containers (Amos–Tautua et al., 2014).
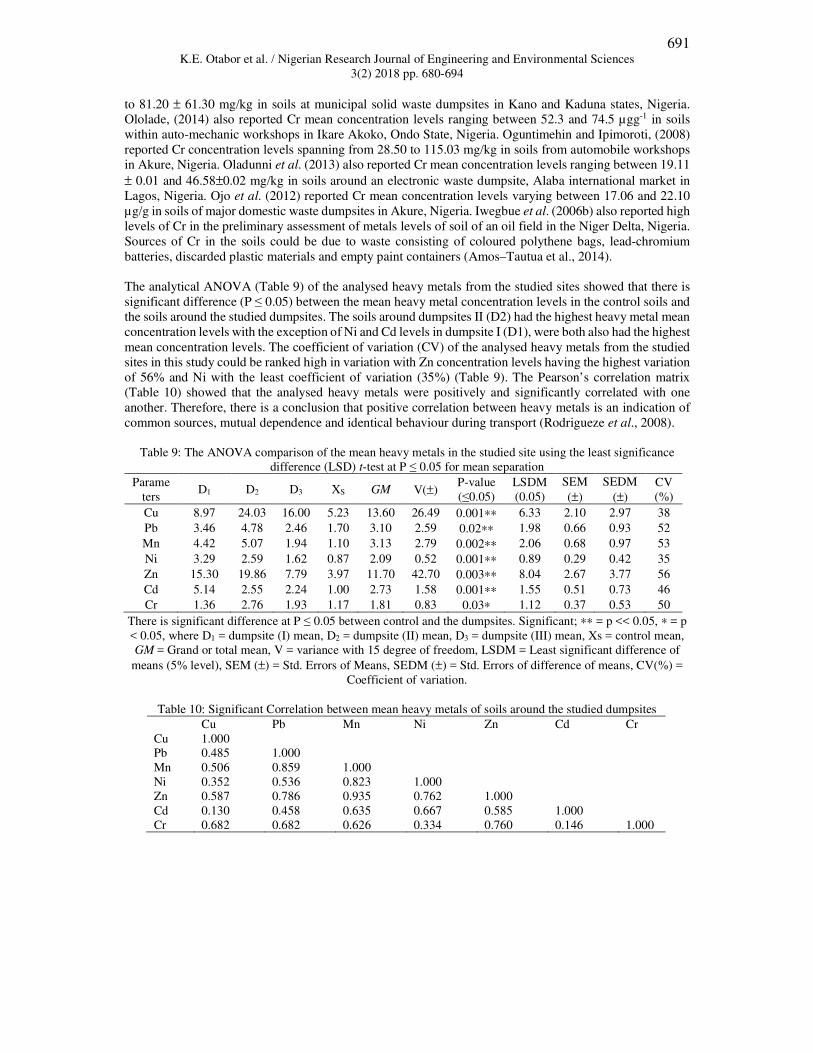
The analytical ANOVA (Table 9) of the analysed heavy metals from the studied sites showed that there is
significant difference (P ≤ 0.05) between the mean heavy metal concentration levels in the control soils and
the soils around the studied dumpsites. The soils around dumpsites II (D2) had the highest heavy metal mean
concentration levels with the exception of Ni and Cd levels in dumpsite I (D1), were both also had the highest
mean concentration levels. The coefficient of variation (CV) of the analysed heavy metals from the studied
sites in this study could be ranked high in variation with Zn concentration levels having the highest variation
of 56% and Ni with the least coefficient of variation (35%) (Table 9). The Pearson’s correlation matrix
(Table 10) showed that the analysed heavy metals were positively and significantly correlated with one
another. Therefore, there is a conclusion that positive correlation between heavy metals is an indication of
common sources, mutual dependence and identical behaviour during transport (Rodrigueze et al., 2008).
Table 9: The ANOVA comparison of the mean heavy metals in the studied site using the least significance
difference (LSD) t-test at P ≤ 0.05 for mean separation
Parame
ters D1 D2 D3 XS GM V(±)
P-value
(≤0.05)
LSDM
(0.05)
SEM
(±)
SEDM
(±)
CV
(%)
Cu 8.97 24.03 16.00 5.23 13.60 26.49 0.001∗∗ 6.33 2.10 2.97 38
Pb 3.46 4.78 2.46 1.70 3.10 2.59 0.02∗∗ 1.98 0.66 0.93 52
Mn 4.42 5.07 1.94 1.10 3.13 2.79 0.002∗∗ 2.06 0.68 0.97 53
Ni 3.29 2.59 1.62 0.87 2.09 0.52 0.001∗∗ 0.89 0.29 0.42 35
Zn 15.30 19.86 7.79 3.97 11.70 42.70 0.003∗∗ 8.04 2.67 3.77 56
Cd 5.14 2.55 2.24 1.00 2.73 1.58 0.001∗∗ 1.55 0.51 0.73 46
Cr 1.36 2.76 1.93 1.17 1.81 0.83 0.03∗ 1.12 0.37 0.53 50
There is significant difference at P ≤ 0.05 between control and the dumpsites. Significant; ∗∗ = p << 0.05, ∗ = p
< 0.05, where D1 = dumpsite (I) mean, D2 = dumpsite (II) mean, D3 = dumpsite (III) mean, Xs = control mean,
GM = Grand or total mean, V = variance with 15 degree of freedom, LSDM = Least significant difference of
means (5% level), SEM (±) = Std. Errors of Means, SEDM (±) = Std. Errors of difference of means, CV(%) =
Coefficient of variation.
Table 10: Significant Correlation between mean heavy metals of soils around the studied dumpsites
Cu Pb Mn Ni Zn Cd Cr
Cu 1.000
Pb 0.485 1.000
Mn 0.506 0.859 1.000
Ni 0.352 0.536 0.823 1.000
Zn 0.587 0.786 0.935 0.762 1.000
Cd 0.130 0.458 0.635 0.667 0.585 1.000
Cr 0.682 0.682 0.626 0.334 0.760 0.146 1.000
692 K.E. Otabor et al. / Nigerian Research Journal of Engineering and Environmental Sciences
3(2) 2018 pp. 680-694 4. CONCLUSION
The results from this study have allowed the analysis of the levels of some toxic heavy metals in soils around
municipal solid waste dumpsites in Benin City. The combined used of different approaches for evaluating
soil heavy metal contamination and pollution facilitates a comprehensive interpretation of the soil
characteristics in terms of the background influences. The levels of heavy metals like Cu, Pb, Ni, Mn, Zn,
and Cr in soils around the studied dumpsites were lower than the DPR target values with the exception of
Cd that was far higher than the target values. The contamination / pollution index of the analysed heavy
metals from this study showed that the studied heavy metals were in the contamination ranges with low risk
degree, with the exception of Cd that was in the pollution ranges with high risk degree as also indicated by
the potential ecological risk index. The heavy metals pollution load index (PLI) of the studied dumpsites
was low. The mean concentration levels of the analysed heavy metals around the studied waste dumpsites
were also lower than the permissible limits set by WHO and FAO for agricultural purpose except Cd. But
the prolong accumulation of these heavy metals in the soil could pose environmental risk. Anthropogenic
wastes and urbanization activities could account for the high levels of some of the potential toxic heavy
metals observed in this study.
5. CONFLICT OF INTEREST
There is no conflict of interest associated with this work.
REFERENCES
Adaikpoh, E.O. and Kaizer A. W. (2012). Trace metal Enrichment in sediments from Otofure and Teboga waste
Dumpsites in Benin City, Nigeria. International Journal of Chemistry, 4(4), p.14
Adaikpoh, E.O., Kaizer, A.N. and Osakwe, O. A. (2005). Distribution of heavy metals in surface soils in Abraka and
Environ, Southwest Nigeria. Journal of African Scientists, 6(1), pp. 29 – 33.
Allen, S.E., Grinshaw H.M., Parkinson J.A. and Quarmby C. (1974). Chemical Methods for Analysing Ecological
Materials. Oxford, Blackwell Scientific Publications, London, p. 565.
Amos–Tautua, B.M.W., Onigbinde, A. O. and Ere, D. (2014). Assessment of some heavy metals and physicochemical
properties in surface soils of Municipal Open Waste Dumpsite in Yenagoa, Nigeria. African Journal of Environmental
Science and Technology, 8(1), pp. 41-47
Anake, W. U., Adie, G. U. and Osibanjo, O. (2009). Heavy metals pollution at municipal solid waste dumpsites in
Kano and Kaduna States in Nigeria. Bulletin of the Chemical Society of Ethiopia, 23(1), pp. 281-289.
Angulo, E. (1996). The Tomllinson Pollution Load Index Applied to Heavy Metals “Mussel – Watch” Data: A useful
index to Assess coastal pollution. Science of the Total Environment., 187, pp. 19 – 56.
Bamgbose, O., Odukoya, O. and Arowolo, T. O. A. (2000). Earth worm as bio -indicator of heavy metal pollution in
dumpsite of Abeokuta City, Nigeria. Revista de Biologia Tropical, 48(1), pp. 229-234.
Bhattacharya, P., Mukherjee, A.B; Jack, G. and Nordquist, S. (2002). Metals contamination and experimental studies
on remediation. Science of the Total Environment, 290, pp. 165-180.
Caplat, C., Texier H., Bariller, D. and Lelievre, C. (2005). Heavy metals mobility in harbour contaminated sediments,
the case of Port-en-Bessin. Maritime Pollution Bulletin, 50, pp. 504 –511.
Department of petroleum Resources (DPR) (2002). Environmental guidelines and standards for the Petroleum
Industry in Nigeria (revised edition). Department of Petroleum and Natural Resources, Abuja, Nigeria.
Council of the European Communities (CEC) (1986). Directive 86278 EEC on the protection of the Environment and
in particular of the soil when sewage sludge is used EEC. Brussels.
El-Hassan, T., Batarseh M., Al-Omari, H., Ziadat, H., El-Alali, A. (2006). The distribution of heavy metals in Urban
street dust of Karak City, Jordan. Soil and Sediment Contamination, 15, pp. 357-365.
Eneje, RC. And Lemoha K. T. (2012). Heavy metal content and physicochemical properties of Municipal solid Waste
Dump soils in Owerri Imo state. International Journal of Modern Engineering Research (IJMER).2(5), pp. 3795 –
3799.
693 K.E. Otabor et al. / Nigerian Research Journal of Engineering and Environmental Sciences
3(2) 2018 pp. 680-694 Ezeaku, P.I., Eze, F.U. and Oku, E. (2015). Profile distribution and degradation of soil properties of an ultisol in
Nsukka semi-humid area of Nigeria. African Journal of Agricultural Research, 10(11), pp. 1306-1311.
Hakanson, L. (1980). An Ecological Risk index for Aquatic pollution control. A sedimentological approach. Water
Resources, 14, pp. 975-1001
Hong, A. H., Law, Puong, L. and Selaman, O. S. (2014). Heavy metal concentration levels in soil at Lake Geriyo
Irrigation Site, Yola, Adamawa State, North Eastern. Nigeria. International Journal of Environmental Monitoring and
Analysis, 2(2), pp. 106 – 111.
Idris, A.M., Eltayeb M.A.H., Potgleter-Vermaak, S.S., Grieken R. and Potgleter J.H. (2007). Assessment of heavy
metals pollution in Sudanese harbours along the Red sea coast. Microchemical Journal, 87, pp. 104 – 112
Ilori, E.G., Aisueni, N.O., Sulaiman-Ilobu, B.B., Ekhator, F., Eneje, R.C., and Efetie-Osie, A. (2012). Immbilization
effect of Cow Dung on Lead and Chromium in Soil Cultivated with Oil Palm. Bulletin of Environmental,
Pharmacological and Life Sciences 1(9), pp. 74- 80
Iwegbue, C.M.A., Bassey, F. I., Tesi, G. O., Nwajei, G.E. and Tsafe, A.I. (2013). Assessment of Heavy metal
contamination in soils around cassava processing Mills in sub-Urban Areas of Delta State, Southern Nigeria. Nigeria
Journal of Basic and Applied Science, 21(2), pp. 96-104.
Iwegbue, C.M.A., Egobueze, F.E.K. and Opuene, K. (2006a). Preliminary assessment of metals levels of soil of an oil
field in the Niger Delta. International Journal of Science and Technology, 3, pp. 167 – 172.
Iwegbue, C.M.A., Isirimah, N.O., Igwe, C. and Williams, E. S. (2006b). Characteristic level of heavy metals in soil
profiles of automobile Mechanic waste dumpsite in Nigeria. Environmentalist, 26, pp. 131-137.
Iwegbue, C.M.A., Williams, E.S. and Isirimah, N. O. (2009). Study of heavy metals distribution in soils impacted
with Crude oil in southern Nigeria. Soil and Sediment Contamination, 18, pp. 136-143.
Jaradat, G. M. and Momami, K. A. (1999). Contamination of road side soils, plants and air with heavy metals in
Jordan: a comparative study. Turkish Journal of Chemistry, 23, pp. 209-220.
Jiang, X., Lu, W.X., Zhao, H.Q., Yang, Q.C. and Yang, Z. P. (2014). Potential ecological risk assessment and
prediction of soil heavy metal pollution around coal gangue dump. Natural Hazards and Earth System Sciences, 14,
pp. 1599 – 1610.
Kabala, C. and Singh, B. R. (2001). Fractionation and mobility of Copper, Lead and Zinc in soil profile in the vicinity
of a copper smelter. Journal of Environmental Quality, 30, pp. 485 – 495.
Khodadoust, A.P., Reddy, K.R. and Maturi, K. (2004). Removal of nickel and phenanthrene from kaolin soil using
different extractants. Environmental Engineering Science, 21(6), pp. 691-704.
Kogbe, C.A. (1989). Geology of Nigeria (2 Ed). Rock view Ltd. Jos. pp. 311 - 325
Kress, N., Herut, B. and Galil, B.S. (2004). Sewage sludge impact on sediment quality and benthic assemblages off
the Mediterranean coast of Israeli long-term study. Marine and Environmental Research, 57, pp. 213 – 233.
Lacutusu, R. (2002). Appraising Levels of Soil Contamination and Pollution with Heavy Metals in Heinike H. J.,
Eckselman W., Thomasson A. J., Jones R.J.A, Montanrella L. and Buckeley B. (eds). Land Information Systems for
Planning the Sustainable use of Land Resources. European Soil Bureau Research Report No. 4. Office of official
publication of the European communities, Luxembourg, pp. 393-402.
Lokeshappa, B., Kandarp S., Vivek T. and Anil K. D. (2012). Assessment of Toxic metals in Agricultural produce.
Food and Public Health, 2(1), pp. 24 – 29.
MAFF (Ministry of Agriculture, Fisheries and Food) and Welch office- Agriculture Department (1992). Code of Good
Agriculture practice for the protection of soil. Draft consultation document, MAFF, London.
Narwal, R. P., Singh, B. R., and Slbu, B. (1999). Association of Cadmium, Zinc, Copper and Nickel with components
in naturally Heavy metal Rich Soils studied by parallel and sequential Extraction. Commun. Soil Science Plant
Analysis, 30, pp. 1209 – 1230.
NEPCA (National Environmental Protection Council of Australia (2010). Limits of heavy metals in soils. Available
online at www.newzealand.govt.nz
Nwajei, G. E., Dibofori-Orji, A. N., Oberhiri, V. U. and Nwajei, R. I. (2014). Heavy metals concentration in soils and
vegetation around selected waste dumpsites in Delta State, Nigeria. Asian Journal of Science and Technology, 5(9),
pp. 567-572.
694 K.E. Otabor et al. / Nigerian Research Journal of Engineering and Environmental Sciences
3(2) 2018 pp. 680-694 Ogbonna, D. N., Kii, B. L. and Youdeowi, P. O. (2009). Some physico-chemical and Heavy metal levels in soils of
waste dumpsites in Port-Harcourt Municipality and Environs. Journal of Applied Sciences and Environment 13(4), pp.
65 – 70.
Oguntimehin, I. and Ipinmoroti, K. (2008). Profile of heavy metals from automobile workshop in Akure, Nigeria.
Journal of Environmental Science and Technology, 1(1), pp. 19-26.
Ojo, I. O., Ojo J. O. and Osibanjo O. (2012). Analysis of Heavy metals and some physicochemical parameters in soils
of major domestic dumpsites in Akure, Nigeria. Journal of the Chemical Society of Nigeria, 37(1), pp. 99 – 103.
Okuo, J.M., Ilavbarhe, A. and Anegbe, B. (2016). Comparative studies on the use of fly ash and sludge in the
remediation of heavy metal polluted soil. Fuoye Journal of Pure and Applied Sciences, 1(1), pp. 1-16
Oladunni, B.O., Tejumade, A. and OtolorinAdelaja, O. (2013). Heavy metals contamination of water, soil and plants
around an Electronic Waste Dumpsite. Poland Journal of Environmental Studies, 22(5), pp. 1431 – 1439.
Ololade, I. A. (2014). An assessment of Heavy metal contamination in soils within Auto-mechanic Workshops using
Enrichment and contamination factors with Geo-accumulation indexes. Journal of Environmental Protection, 5, pp.
970–982.
Omuku, P.E., Okoye P.A.C. and Ekemezie P.N. (2012). Distribution patterns of heavy metals in the soil sediment
within new Auto-spare parts, Nkpor-Agu, Anambra state, Nigeria. Journal of the Chemical Society of Nigeria, 37(1),
pp. 33 – 38.
Oviasogie, P.O. and Omoruyi, E. (2007). Levels of heavy metals and physicochemical properties of soil in a foam
manufacturing industry. Journal of chemical society of Nigeria 32(1), pp. 102-106.
Reddy, M.S., Basha, S. Kumar, V.G.S., Joshi, H.V. and Ramachandraiah, G. (2004). Distribution, Enrichment and
Accumulation of Heavy Metals in Coastal Sediments of Alang-Sosiya Ship Scrapping Yard, India. Marine Pollution
Bulletin, 48, pp. 1055 -1059.
Rodriguez, J.A., Nanos, N., Grau, J.M., Gil, L., and Lopez-Arias, M. (2008). Multiscale analysis of heavy metal
contents in Spanish agricultural metal contents in Spanish agricultural top soils. Chemosphere, 70, pp. 1085-1096
Selvaraj, K., Mohan, V.R. and Szefer P. (2004). Evaluation of metal contamination in Coastal Sediments of the Bay of
Bengal, India: (Geochemical and statistical approaches). Marine Pollution Bulletin, 49, pp. 174 – 185
Sheppard, D. S., Claridge, G. G. C. and Campbell, I. B. (2000). Metal contribution of soil at Scott Urban-rural land
use ingredients. Applied Geochemistry, 15, pp. 513-530.
Shiowatana, J., McLaren, R.G. Chanmekha, N. and Samphao, A. (2001). Fractionation of arsenic in soil by a
continuous flow sequential extraction method. Journal of Environmental Quality, 30(6), pp. 1940- 1949.
Short, K. and Stauble, A. J. (1967). Outline of the Geology of Niger-Delta. An Association of petroleum Geologist
Bulletin, 51, pp. 761 867.
Singh, A., Sharma, R.K., Agrawal, M., and Marshall, F.M. (2010). Health risk assessment of heavy metals via dietary
intake of food stuffs from the waste water irrigated site of a dry tropical area of Indian. Food Chemistry and
Toxicology 48, pp. 611-619.
Sucharova, J. Suchara, I., Hola, M., Markova, S., Reimann, C., Boyd, R., Filzmoser, P. and Englmaier, P. (2012). Top-
/Bottom-soil Rations and Enrichment factors. What do they really show? Applied Geochemistry, 27, pp. 138–145.
Tomllinson, D. C., Wilson, J. G., Harris, C. R. and Jeffery, D. W. (1980). Problems in the Assessment of Heavy metals
levels in Estuaries and the formation of pollution index. HelgolanderWissenschaftlicheMeeresunters-Uchungen, 33, pp. 566-
569
Tripathi, A. and Misra, D.R. (2012). A study of physico-chemical properties and Heavy metals in contaminated soils of
Municipal Waste Dumpsites at Allahabad, Indian. International Journal of Environmental sciences, 2(4), pp. 150-160
Usero, U., Garcia, A. and Fraidias, J. (2000). Calidad de Lasaguasy sedimentosdel Litoral Andaluz. In: Sevilla, Ed. Junta de
Andalicia, Consejeria del medioAmbiente. 164.
World Health Organization (WHO) (1993). Standard Maxima for metals in Agricultural soils.
Wilding, L.P. (1985). Spatial variability: its documentation, accommodation and variability. Pudoc, Wageningen,
Netherlands. pp. 166 – 194.
Yuan, C.G., Shi, J.B., Liu J.F. and Liang, L.N. (2004). Speciation of heavy metals in marine sediments from the China Sea
by ICP-MS with sequential extraction. Environmental Intervention, 30, pp. 769 – 783.