CEPAL Review No. 72
198
CEPAL Review is prepared by the Secretariat of the Economic Commission for Latin America and the Caribbean. The views expressed in the signed articles, including the contributions of Secretariat staff members, however, represent the personal opinion of the authors and do not necessarily reflect the views of the Organization. The designations employed and the presentation of material in this publication do not imply the expression of any opinion whatsoever on the part of the Secretariat concerning the legal status of any country, territory, city or area or its authorities, or concerning the delimitation of its frontiers or boundaries. CEPAL Review is published in Spanish and English versions three times a year. Annual subscription costs for 2000 are US$ 30 for the Spanish version and US$ 35 for the English version. The price of single issues is US$ 15 in both cases. The cost of a two-year subscription (2000-2001) is US$ 50 for the Spanish-language version and US$ 60 for English. A subscription application form may be found just before the section “Recent ECLAC Publications”. Applications for the right to reproduce this work or parts thereof are welcomed and should be sent to the Secretary of the Publications Board, United Nations Headquarters, New York, N.Y. 10017, U.S.A. Member States and their governmental institutions may reproduce this work without application, but are requested to mention the source and inform the United Nations of such reproduction. Copyright © United Nations 2000 All rights reserved Printed in Chile LC/G.2120-P — December 2000 United Nations Publication ISSN 0251 - 2920 / ISBN 92-1-121306-1
-
Upload
khangminh22 -
Category
Documents
-
view
0 -
download
0
Transcript of CEPAL Review No. 72
CEPAL Review is prepared by the Secretariat of the Economic Commission for Latin America and theCaribbean. The views expressed in the signed articles, including the contributions of Secretariat staff members, however, represent the personal opinion of the authors and do not necessarily reflect the views of theOrganization. The designations employed and the presentation of material in this publication do not implythe expression of any opinion whatsoever on the part of the Secretariat concerning the legal status of anycountry, territory, city or area or its authorities, or concerning the delimitation of its frontiers or boundaries.
CEPAL Review is published in Spanish and English versions three times a year.Annual subscription costs for 2000 are US$ 30 for the Spanish version and US$ 35 for the English version.The price of single issues is US$ 15 in both cases.The cost of a two-year subscription (2000-2001) is US$ 50 for the Spanish-language version and US$ 60 forEnglish.A subscription application form may be found just before the section “Recent ECLAC Publications”.
Applications for the right to reproduce this work or parts thereof are welcomed and should be sent to theSecretary of the Publications Board, United Nations Headquarters, New York, N.Y. 10017, U.S.A. MemberStates and their governmental institutions may reproduce this work without application, but are requested tomention the source and inform the United Nations of such reproduction.
Copyright © United Nations 2000All rights reserved
Printed in Chile
LC/G.2120-P — December 2000
United Nations Publication
ISSN 0251 - 2920 / ISBN 92-1-121306-1
CEPAL REVIE W 72
United Nations
ECLAC
JOSE ANTONIO OCAMPOJOSE ANTONIO OCAMPOJOSE ANTONIO OCAMPOJOSE ANTONIO OCAMPOJOSE ANTONIO OCAMPOExecutive Secretary
REYNALDO BAJRAJREYNALDO BAJRAJREYNALDO BAJRAJREYNALDO BAJRAJREYNALDO BAJRAJDeputy Executive Secretary

CEPAL REVIE W 72
CEPALCEPALCEPALCEPALCEPALRRRRREVIEWEVIE WEVIE WEVIE WEVIE W
OSCAR ALOSCAR ALOSCAR ALOSCAR ALOSCAR ALTIMIRTIMIRTIMIRTIMIRTIMIRDirector of the Review
EUGENIO LAHERAEUGENIO LAHERAEUGENIO LAHERAEUGENIO LAHERAEUGENIO LAHERATechnical Secretary
UNITED NATIONS

Notes and explanation of symbolsThe following symbols are used in tables in the Review:
(…) Three dots indicate that data are not available or are not separately reported.
(—) A dash indicates that the amount is nil or negligible.
A blank space in a table means that the item in question is not applicable.
(–) A minus sign indicates a deficit or decrease, unless otherwise specified.
(.) A point is used to indicate decimals.
(/) A slash indicates a crop year or fiscal year, e.g., 1970/1971.
(-) Use of a hyphen between years, e.g., 1971-1973, indicates reference to the complete number ofcalendar years involved, including the beginning and end years.
References to “tons” mean metric tons, and to “dollars”, United States dollars, unless otherwise stated.Unless otherwise stated, references to annual rates of growth or variation signify compound annual rates.Individual figures and percentages in tables do not necessarily add up to the corresponding totals, becauseof rounding.
Guidelines for contributorsto CEPAL Review
The editorial board of the Review are always interested in encouraging the publication of articleswhich analyse the economic and social development of Latin America and the Caribbean. With this inmind, and in order to facilitate the presentation, consideration and publication of papers, they haveprepared the following information and suggestions to serve as a guide to future contributors.—The submission of an article assumes an undertaking by the author not to submit it simultaneouslyto other periodical publications.—Papers should be submitted in Spanish, English, French or Portuguese. They will be translated intothe appropriate language by ECLAC.—Every article must be accompanied by a short summary (of about 300 words) giving a brief descrip-tion of its subject matter and main conclusions. This summary will also be published on the ECLACHome Page on the Internet.—Papers should not be longer than 10,000 words, including the summary, notes and bibliography, ifapplicable, but shorter articles will also be considered.—One copy of the original text should be submitted, accompanied by a copy on diskette (Word forWindows 95 format), to CEPAL Review, casilla 179-D, Santiago, Chile. In the absence of the copy ondiskette, two printed or typed copies should be provided. Texts may also be sent by e-mail to:[email protected].—All contributions should be accompanied by a note clearly indicating the title of the paper, the name ofthe author, the institution he belongs to, his nationality, his fax and telephone numbers, and his e-mailaddress.—Footnotes should be kept to the minimum, as should the number of tables and figures, whichshould not duplicate information given in the text.—Special attention should be paid to the bibliography, which should not be excessively long. All thenecessary information must be correctly stated in each case (name of the author or authors, completetitle (including any subtitle), publisher, city, month and year of publication and, in the case of a series,the title and corresponding volume number or part, etc.).—The editorial board of the Review reserve the right to make any necessary revision or editorialchanges in the articles, including their titles.—Authors will receive a one-year courtesy subscription to the Review, plus 30 offprints of theirarticle, both in Spanish and in English, at the time of publication in each language.

C E P A L R E V I E W 7 2
D E C E M B E R 2 0 0 0
C O N T E N T S
Social stratification under tension in a globalized era 7Emilio Klein and Víctor Tokman
Employment trends in Latin America and the Caribbeanduring the 1990s 31Jürgen Weller
The labour market and income distribution in Colombiain the 1990s 53José Antonio Ocampo, Fabio Sánchez and Camilo Ernesto Tovar
New challenges for equity in Uruguay 79Rubén Kaztman, Fernando Filgueira and Magdalena Furtado
The adjustment strategies of Mexican ejidatarios in the faceof neoliberal reform 99Benjamin Davis
Population ageing and pension systemsin Latin America 119Jorge Bravo
Expert opinion as an instrument for assessinginvestment in primary education 143Ernesto Schiefelbein, Laurence Wolff and Paulina Schiefelbein
What schools teach us about educatingpoor children in Chile? 159Beverley A. Carlson
Static and dynamic effects of Mercosur.The case of the footwear sector 179Marta Bekerman and Pablo Sirlin
Recent ECLAC publications 199
7
SOCIAL STRATIF ICATION UNDER TENSION IN A GLOBALIZED ERA • EMIL IO KLEIN AND VICTOR TOKMAN
C E P A L R E V I E W 7 2 • D E C E M B E R 2 0 0 0C E P A L R E V I E W 7 2
DECEMBER 2000
Social stratificationunder tension in a
globalized era
Emilio Klein
Sociologist, MultidisciplinaryTechnical Team,International LabourOrganization (ILO),Santiago, [email protected]
Víctor Tokman
Regional Director forthe Americas,ILO, Santiago, [email protected]
The objective of this paper is to explore the effects of glo-balization on the labour market and social stratification. Itis generally held that globalization will bring about progressfor nations and people. This, however, is far from clear, sincethe experience of almost two decades has been raising in-creasing doubts about the potential net gains and, particu-larly, the distribution of such gains. Clearly, there are win-ners and losers among both countries and people. We willconcentrate on the effects upon people within countries andrefer only to one region: Latin America. Our aim is to iden-tify winners and losers in the globalization process and, par-ticularly, the impact on social stratification. Is globalizationleading towards greater social integration within nations, oris social disintegration the result (because only some groupsare being integrated, while a majority is progressively ex-cluded)? To analyse this issue, the paper is structured intofour parts. The first looks at globalization as an integral partof a policy compact, since it is necessary to consider theimpact of the whole package rather than trying to isolatepartial effects. The second concentrates on the effects onemployment, incomes and equity. The third explores changesin the social structure associated with some of the main pro-cesses accompanying globalization. Lastly, we draw someconclusions about the social structure of Latin America dur-ing the reform period.
C E P A L R E V I E W 7 2 • D E C E M B E R 2 0 0 08
SOCIAL STRATIF ICATION UNDER TENSION IN A GLOBALIZED ERA • EMIL IO KLEIN AND VICTOR TOKMAN
IGlobalization as partof a policy compact
Globalization in a restricted sense refers to majorchanges in trade, finance and information that havetaken place in the international economy. This processhas not happened in isolation, but as an integral part ofa policy package combining internal adjustment mea-sures with changes in the way countries relate to theinternational economy. Three main processes charac-terize the emerging situation: globalization,privatization and deregulation (Tokman, 1997). Thepolicy compact followed by most countries, at least inLatin America, came to be known after 1989 as the“Washington Consensus” (Williamson, 1990).
Globalization means that national economies arenow more integrated with the international economyand that goods, capital and communications, and alsopeople, are closer together today than ever before inthe past. This has been the result both of the openingup of economies and of rapid technological change.Trade and financial liberalization has come aboutthrough reductions in tariff and non-tariff barriers re-sulting from i) multilateral agreements in the GeneralAgreement on Tariffs and Trade (GATT) and the cre-ation of its successor, the World Trade Organization(WTO); ii) new or reactivated integration schemes, suchas the North American Free Trade Agreement (NAFTA)and the South American free trade association knownas Mercosur; iii) an explosion of bilateral trade agree-ments during recent years; and, most importantly,iv) unilateral tariff reductions as a key component ofthe adjustment policy package. Latin American tariffsdecreased from an average of between 35% and 100%(minimum and maximum rates) in 1985 to between14% and 22% in the early 1990s. Diversification of thetariff structure has also been greatly reduced, and isnow limited in most countries to three or fewer tariffcategories (Tokman, 1999).
Globalization opens up new opportunities forgrowth and job creation, but at the same time affectsthe determinants of employment and wages and requiresregulation to prevent unfair international competition.
A preliminary version of this paper was prepared at the requestof UNDP as a contribution to the Human Development Report, 1999.
For example, given the differences in factor endow-ment, it is expected that trade from developing to de-veloped countries will largely consist of goods whoseproduction involves intensive use of unskilled labour.This could increase the demand for workers of this typeand decrease the gap between the wages of skilled andunskilled labour.
If this came about, though, it could combine withthe differences in remuneration and labour regulationsthat obtain between countries to generate trade expan-sion based on unfair labour practices or increased ex-ploitation of workers. The prospect has sparked an in-ternational discussion about how this outcome can beavoided and whether there is a need for additional regu-lation. While there has been no general agreement onhow to proceed, it is clear that nobody postulates theequalization of wages between countries, since thiswould affect the competitive position of developingcountries. Nor is it accepted that trade expansion shouldbe based on labour exploitation. Trade sanctions forthose who do not comply with minimum internationallabour standards have been mooted, but so far the ideahas been ruled out because of the danger of their beingmisused as an instrument of trade protection. There is,however, more general agreement about the need fornational and international monitoring to ascertainwhether economic progress is being accompanied bysocial progress and, particularly, by compliance withbasic labour standards among all trading partners. Thishas been incorporated into the International LabourOrganization (ILO) Declaration on Fundamental Prin-ciples and Rights at Work and its Follow-up, adoptedby the International Labour Conference on 18 June1998.
Globalization also affects the determinants of jobcreation and wages because in open economies the abil-ity to compete becomes a major factor and places con-straints on wage adjustments. There now has to be acloser link between wages and productivity than therewas in the old economic environment. In closed econo-mies, wage increases in excess of productivity growthcan be transferred to prices, resulting in inflation; inopen economies, the outcome is a reduced capacity to
9
SOCIAL STRATIF ICATION UNDER TENSION IN A GLOBALIZED ERA • EMIL IO KLEIN AND VICTOR TOKMAN
C E P A L R E V I E W 7 2 • D E C E M B E R 2 0 0 0
compete. In addition, demand fluctuations mean thatcompanies have to be able to adapt faster and showgreater flexibility in production and labour processes.
Privatization is the second feature of the new eco-nomic environment. Privatization reduces the size andfunctions of government and increases the importanceof the private sector and markets in the managementand allocation of resources. Public-sector employmentnaturally falls, rationalization by the new owners re-duces total employment and public-sector enterprisesare transferred to national or international capitalists,the main motive being the need to reduce budget defi-cits during adjustment. Increasingly, furthermore, re-sponsibility for investment is transferred to the privatesector and public investment is limited to basic infra-structure and social sectors, with growing private-sec-tor involvement in the execution and management ofthese.
Deregulation is the third process in this new envi-ronment. This has meant reducing protection and gov-ernment intervention in trade, finance and labour mar-kets. As was mentioned earlier, trade and financialliberalization are leading to increased globalization,while product and labour market protection is beingreduced in order to increase economic efficiency andenable markets to play a greater role in the allocationof resources. The deregulation process has in part beendriven by substantial legal reforms, but there has alsobeen a considerable de facto increase in flexibilitybrought about by the unfettered operation of markets.
The threefold process of globalization,privatization and deregulation is occurring in an inter-national environment characterized by “universaliza-tion” of economic and social problems and by increasedideological homogeneity. Today, employment problemsand social exclusion are no longer to be found solely indeveloping countries, but constitute a major challengeeven in the more developed economies of the world.Unemployment in some of the industrialized countriesof the Organisation for Economic Co-operation andDevelopment (OECD) is stubbornly high; more than 30million people are officially classified as unemployed,while a further 10 million are no longer actively seek-ing work (OECD, 1994 and ILO, 1996). The average rateof unemployment exceeds 10% and in the case of somevulnerable groups, like young people, one in five isjobless in many countries. The end of the Cold Warbroke down ideological barriers, and today’s conflictsare caused less by ideological divergence and more bylocal interests or by a natural reaction against the so-cial cost of adjustment.
The three processes are interrelated in both practi-cal and analytical terms. On the analytical side, global-ization could not have advanced had it not been accom-panied by the other components of adjustment thatreduced trade protection, as well as by financial liberal-ization and privatization with all the opportunities theseopened up for increased trade, capital flows and foreigndirect investment. All these policies contributed to theattainment of macroeconomic balance, but they were alsonecessary conditions for integration into the worldeconomy. These sets of policies were fully incorporatedinto the Washington Consensus, together with instru-ments designed to help secure fiscal discipline. The lat-ter were included with the main objective of ensuringprice stability, but they also play an important role increating incentives for capital inflows in a framework ofgreater stability. Indeed, the one thing that has not beenliberalized is the movement of unskilled workers. Someretrospective policies regularizing illegal migration havebeen introduced, but closed borders, or at least tight regu-lation of flows, continue to be the rule.
The recent economic history of Latin Americancountries shows that, in practice, globalization has beenaccompanied by privatization and deregulation. Thetiming and policy mix has varied according to countryand it is perhaps premature to evaluate the results. Onlyfive countries –Brazil, Chile, Colombia, Costa Rica andUruguay– have attained a per capita income level higherthan in the pre-crisis period. Even fewer have achieveda high and sustained rate of growth, Chile and Colom-bia being the only countries that have been able to ex-pand at more than 5% a year for four consecutive years.Growth rates have been erratic and stop-go cycles havebeen the norm. In addition, other factors have influ-enced performance. Initial conditions were different ineach country: some started the reform process early,others only in the late 1980s or early 1990s. The policymix at each stage was also different.
In spite of the differences, after a decade and ahalf of adjustment it can be concluded that all LatinAmerican countries have been involved in the global-ization and adjustment process, and that privatizationand deregulation have been an integral part of the policycompact. The results are still unclear and policy instru-ments are continually evolving, but it is plain that theregion is today more open and integrated into the worldeconomy, more privatized and less regulated than it wasbefore 1980. All these things have happened simulta-neously; hence, any analysis of results should take ac-count of the context. This is what we shall do in therest of this paper.
C E P A L R E V I E W 7 2 • D E C E M B E R 2 0 0 010
SOCIAL STRATIF ICATION UNDER TENSION IN A GLOBALIZED ERA • EMIL IO KLEIN AND VICTOR TOKMAN
IIEmployment, incomes and equity under globalization
2. The results in practice
a) Productivity gains and international competitive-ness
The first of the expected outcomes that is actually ob-served in most countries is productivity growth in trad-able sectors, particularly manufacturing industry. Aswill be seen below, this outcome is associated with areduction in the employment level of the sector. Duringthe 1990s, productivity per employee expanded at an-nual rates of between 5% and 7% in Argentina, Brazil,Mexico and Peru, while the rate was about 3% in Chile.
The effects on international competitiveness varydepending on the country studied and the indicatorsused to measure labour costs. It is usually argued thatoverpriced labour can affect access to internationalmarkets, and in a more competitive environment costsdo indeed matter. Overpriced labour can be the resultof higher wages or high non-wage labour costs or both.The situation in most Latin American countries doesnot seem to justify the priority given to this issue (ex-cept for some necessary adjustments).
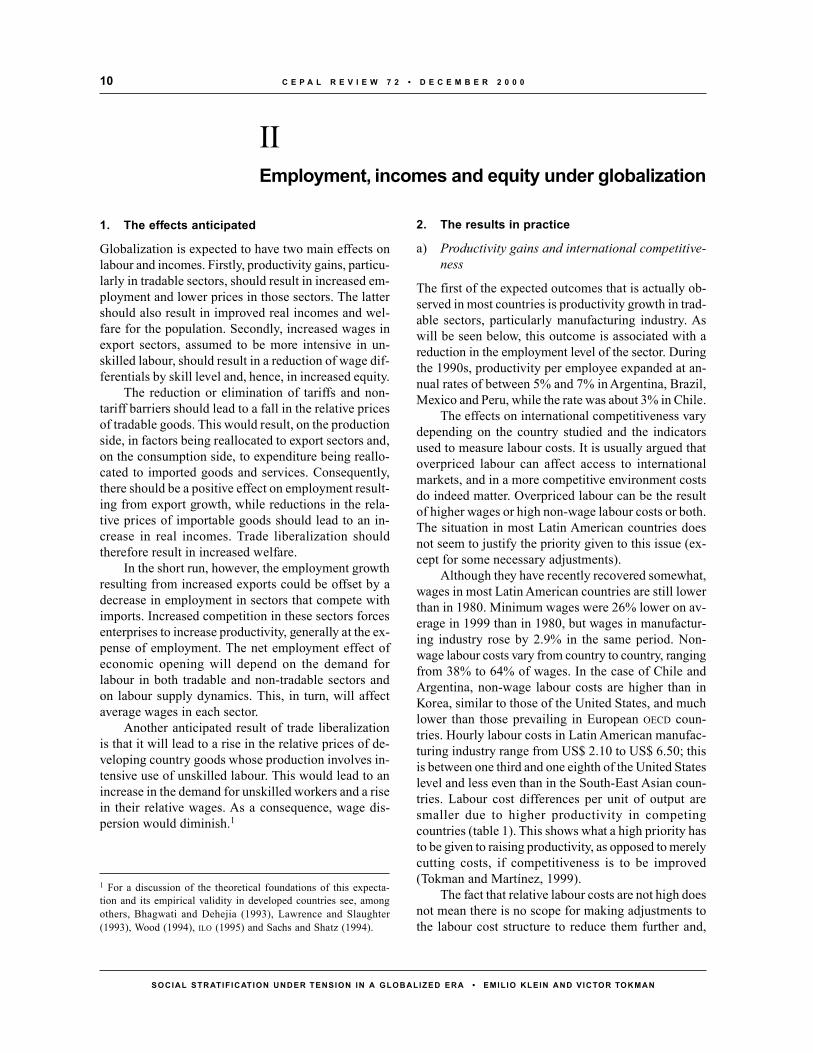
Although they have recently recovered somewhat,wages in most Latin American countries are still lowerthan in 1980. Minimum wages were 26% lower on av-erage in 1999 than in 1980, but wages in manufactur-ing industry rose by 2.9% in the same period. Non-wage labour costs vary from country to country, rangingfrom 38% to 64% of wages. In the case of Chile andArgentina, non-wage labour costs are higher than inKorea, similar to those of the United States, and muchlower than those prevailing in European OECD coun-tries. Hourly labour costs in Latin American manufac-turing industry range from US$ 2.10 to US$ 6.50; thisis between one third and one eighth of the United Stateslevel and less even than in the South-East Asian coun-tries. Labour cost differences per unit of output aresmaller due to higher productivity in competingcountries (table 1). This shows what a high priority hasto be given to raising productivity, as opposed to merelycutting costs, if competitiveness is to be improved(Tokman and Martínez, 1999).
The fact that relative labour costs are not high doesnot mean there is no scope for making adjustments tothe labour cost structure to reduce them further and,
1. The effects anticipated
Globalization is expected to have two main effects onlabour and incomes. Firstly, productivity gains, particu-larly in tradable sectors, should result in increased em-ployment and lower prices in those sectors. The lattershould also result in improved real incomes and wel-fare for the population. Secondly, increased wages inexport sectors, assumed to be more intensive in un-skilled labour, should result in a reduction of wage dif-ferentials by skill level and, hence, in increased equity.
The reduction or elimination of tariffs and non-tariff barriers should lead to a fall in the relative pricesof tradable goods. This would result, on the productionside, in factors being reallocated to export sectors and,on the consumption side, to expenditure being reallo-cated to imported goods and services. Consequently,there should be a positive effect on employment result-ing from export growth, while reductions in the rela-tive prices of importable goods should lead to an in-crease in real incomes. Trade liberalization shouldtherefore result in increased welfare.
In the short run, however, the employment growthresulting from increased exports could be offset by adecrease in employment in sectors that compete withimports. Increased competition in these sectors forcesenterprises to increase productivity, generally at the ex-pense of employment. The net employment effect ofeconomic opening will depend on the demand forlabour in both tradable and non-tradable sectors andon labour supply dynamics. This, in turn, will affectaverage wages in each sector.
Another anticipated result of trade liberalizationis that it will lead to a rise in the relative prices of de-veloping country goods whose production involves in-tensive use of unskilled labour. This would lead to anincrease in the demand for unskilled workers and a risein their relative wages. As a consequence, wage dis-persion would diminish.1
1 For a discussion of the theoretical foundations of this expecta-tion and its empirical validity in developed countries see, amongothers, Bhagwati and Dehejia (1993), Lawrence and Slaughter(1993), Wood (1994), ILO (1995) and Sachs and Shatz (1994).
11
SOCIAL STRATIF ICATION UNDER TENSION IN A GLOBALIZED ERA • EMIL IO KLEIN AND VICTOR TOKMAN
C E P A L R E V I E W 7 2 • D E C E M B E R 2 0 0 0
particularly, to lower the cost of unskilled labour. Taxeson unskilled workers tend to reduce employment, whilesome of the existing taxes on the wage bill would bemore efficient if they were transferred to other sourcesof revenue, particularly those that go to finance housingor other investments.
The evolution of labour costs in the 1990s alsothrows up other policy issues for consideration. Labourcosts deflated by consumer prices have not increasedahead of productivity, for instance, in Argentina, Bra-zil, Mexico or Peru, and have thus been no impedi-ment to increased access to international markets. How-ever, when expressed in dollars rather than localcurrency, or when observed in relation to producerprices, the gains are slighter, and in most cases com-petitiveness has declined (table 1). This is due to theeffects of macroeconomic policy during the period, asin most countries this involved national currenciesbeing kept overvalued owing to the need to reduce in-flation and to the liberalization of capital flows. Part ofthe decline is explained by delays in adjusting theexchange rate.
Meanwhile, domestic prices adapt at differingspeeds to a more competitive economic environment:prices for traded goods, generally included in producerprices, adjust relatively quickly, while those for consumergoods, which are more influenced by non-traded goodsand services, tend to be slower in adjusting. The result isthat while labour costs expressed in consumer price termsdid not rise, they actually increased very fast in relationto producer prices. This change in relative prices, while
it lies outside the labour market sphere, does influencethe dynamics of wage determination because it leads tothe outlook of workers (based on the purchasing powerof wages) diverging from that of those who operate busi-nesses (based on profit margins).
Furthermore, as the situation after mid-1997 clearlyillustrates, competitiveness is also dependent on devel-opments in other countries. Despite a rise of between0.4% and 10% in the competitiveness of Latin Ameri-can countries, their ability to compete with goods fromthe Asian countries deteriorated. Competitiveness gainsin these countries were about 50% –ranging from 20%in Thailand to 60% in Malaysia– while among LatinAmerican countries the largest increase, in Colombia,was about 10%.
To sum up, productivity grew, as expected, as a con-sequence of the reform process, but some adjustmentsare still needed. Firstly, if international competitivenessis to be maintained, non-wage labour costs need to beexamined. Secondly, macroeconomic policies, particu-larly overvalued exchange rates and relative prices,should be reviewed. Lastly, productivity gains have beeninsufficient to close the gap with competitors.
b) Job creation
A second effect of globalization has been inadequatejob creation in relation to the rapid increase in the eco-nomically active population (EAP). On average, the non-agricultural EAP has grown by over 3% a year, partly asa result of increasing female participation in the wageeconomy (table 2). Job creation has lagged due to slow
TABLE 1
Selected countries: Labour costs and international competitivenessa
Hourly Non-wage Hourly cost Labour costs Annual changes 1990-1995wage labour costs of labour per unit of Labour Produc- Competitivenessb
(dollars) as % of wages (dollars) output costs tivity(United States = 100) A B A B C
Argentina 4.6 42.5 6.5 55 -2.0 13.1 7.0 9.2 -6.1 3.7Brazil 3.7 58.2 5.9 60 2.9 8.5 7.5 4.5 -0.9 4.3Chile 2.5 38.0 3.5 43 4.3 9.4 3.2 -1.1 -5.7 5.9Mexico 1.9 42.0 2.8 47 1.2 1.5 5.2 4.0 3.6 naPeru 1.3 64.3 2.1 43 5.1 11.6 6.6 1.4 -4.5 0.3United States 12.6 40.3 17.7 100 2.6 3.8 -1.2 naGermany 16.1 78.5 28.7 150 2.1 1.8 -0.3 naRepublic of Korea 6.8 21.9 8.2 60 3.6 11.9 8.0 50.0
Source: Tokman and Martínez (1999), ILO (1998) and updating by authors.
a Manufacturing industry, circa 1997. Competitiveness is defined as the difference between changes in productivity and labour costs.b A = Changes in local currency at constant prices, deflated by consumer price index (1990-1995).
B = Changes in dollars (1990-1995).C = Changes in dollars between July 1997 and June 1998.

C E P A L R E V I E W 7 2 • D E C E M B E R 2 0 0 012
SOCIAL STRATIF ICATION UNDER TENSION IN A GLOBALIZED ERA • EMIL IO KLEIN AND VICTOR TOKMAN
and erratic economic growth. The result has been ris-ing unemployment.
The average unemployment rate in Latin Americarose from 6% in 1980 to 8.7% in 1983, i.e., during thefirst phase of adjustment. Unemployment fell from 1983to 1992, but never returned to its 1980 level. After 1992unemployment grew continuously, reaching 8.8% in1999. These developments reveal not only the limitedcapacity of the region’s economies to bring down un-employment, but also increased vulnerability, since con-tinuous adjustments entail a return to previous higherlevels of unemployment. By 1999, Latin American un-employment had returned to the high levels of the mid-1980s.
Four aspects should be taken into account in evalu-ating the way unemployment affects the people of LatinAmerica. The first is that it can be misleading simplyto compare the unemployment level with, for instance,the rates of over 10% prevailing in some OECD coun-tries. Most countries lack unemployment insurance, andprotection is generally occupation-linked. Joblessnessmeans no income and no protection, and this is one ofthe main sources of social exclusion. Secondly, unem-
ployment disproportionately affects women and youngpeople. While the female unemployment rate is about30% higher than the average, rates for young peopleare usually double the national figure. Unsurprisingly,women and young people account for a large propor-tion of the excluded. Thirdly, there are also large re-gional variations within countries. Adjustment tends tohave a disproportionate effect on places where key sec-tors in need of restructuring are located. These activi-ties generally constitute the main source of employ-ment and production, and restructuring affects thewhole region.
The situation also differs from country to country.Size, the degree of modernization attained and the stagereached in the reform process are determining factorsin unemployment. Small, open economies are more vul-nerable to external fluctuations and tend to have higherand more erratic unemployment rates than larger, moreclosed economies (where internal demand plays thebiggest role and provides more autonomy). Again, incountries that have reached an advanced stage of ur-banization and modernization, labour markets mainlyadjust through unemployment, while in those with a
TABLE 2
Latin America: Economic activity, employment, wages and poverty(Annual growth rates and index)
Indicator
Economic activityGNPa
GNP per capitaa
Inflationa
Population and employmentPopulationa
Total EAPa
Urban EAP (%)Non-agricultural employmenta
Open unemployment rateInformal employment (%)b
Public-sector employment (%)c
Wagesd
Real manufacturing wagesReal minimum wages
PovertyPercentage of households in poverty (%)Urbanization of poverty (%)
Source: ILO, on the basis of national statistics.
a Annual growth rates. d Index 1980 = 100.b Percentage of urban employment. e 1997 figure.c Percentage of total EAP.
1980 1985 1990 1995 1999
… 0.6 1.9 2.9 0.0… -1.6 -0.1 1.1 -1.8… 134.8 487.5 287.5 9.8
… 2.1 1.9 1.8 1.8… 3.5 3.1 2.6 2.666.9 70.0 72.8 75.3 76.6… 3.5 4.4 3.0 2.86.7 10.1 8.0 7.2 8.840.2 47.0 44.4 46.5 48.515.7 16.6 15.5 13.4 13.0
100.0 93.1 86.6 92.9 102.9100.0 86.4 68.4 70.8 73.8
35.0 37.0 41.0 38.0 36.071.4 … 85.4 84.2 83.3e

13
SOCIAL STRATIF ICATION UNDER TENSION IN A GLOBALIZED ERA • EMIL IO KLEIN AND VICTOR TOKMAN
C E P A L R E V I E W 7 2 • D E C E M B E R 2 0 0 0
large agricultural population or small formal sector, un-deremployment is the main adjustment variable. Lastly,the stage reached in the reform process also matters.Early reformers have been the most successful in re-ducing unemployment, while latecomers –particularlythose that are now in the early phases of adjustment–tend to have higher and rising unemployment.
c) Changes in the employment structure
In addition to a higher unemployment rate, reform hasbrought about profound changes in the structure of em-ployment. Four main interrelated processes can be iden-tified: privatization, the shift from goods-producing sec-tors to services, the increase in informal working, andthe loss of job security. These processes can be seen tohave taken place in the 1990s, when most countrieswere already beyond or well advanced in the adjust-ment process.
Privatization introduced a major change in patternsof job creation in Latin America, owing to the role tra-ditionally played by the public sector as the employerof last resort (something that will be discussed in thenext section) and an important contributor to the de-velopment of the middle classes. Government did notdirectly contribute to employment growth in the 1990s.On the contrary, its share of urban employment fell inthe region as a whole, from 15.5% in 1990 to 13.0% in1999. This decrease does not include falls in public-sector employment that took place in earlier periods,as in Chile. This movement from public- to private-sector employment occurred in all countries, while insome –including Argentina, Costa Rica and Panama–the decline amounted to as much as five to ten percent-age points.
The employment shift from the public to the pri-vate sector was a direct consequence of the privatizationand deregulation processes accompanying globaliza-tion. State enterprises were transferred to the privatesector and government functions were reduced. It wasalso one of the main results of fiscal discipline, an im-portant component of stabilization policy. Budget defi-cits were generally reduced by cutting public expendi-ture, mostly the payroll, through a series of wage andemployment cuts (table 3).
Generally speaking, however, the transfer of jobswas not towards larger private companies. Their shareof total employment also declined over the same pe-riod, although at a slower pace than government em-ployment. Between 1990 and 1998, the employmentshare accounted for by such companies fell from 40%
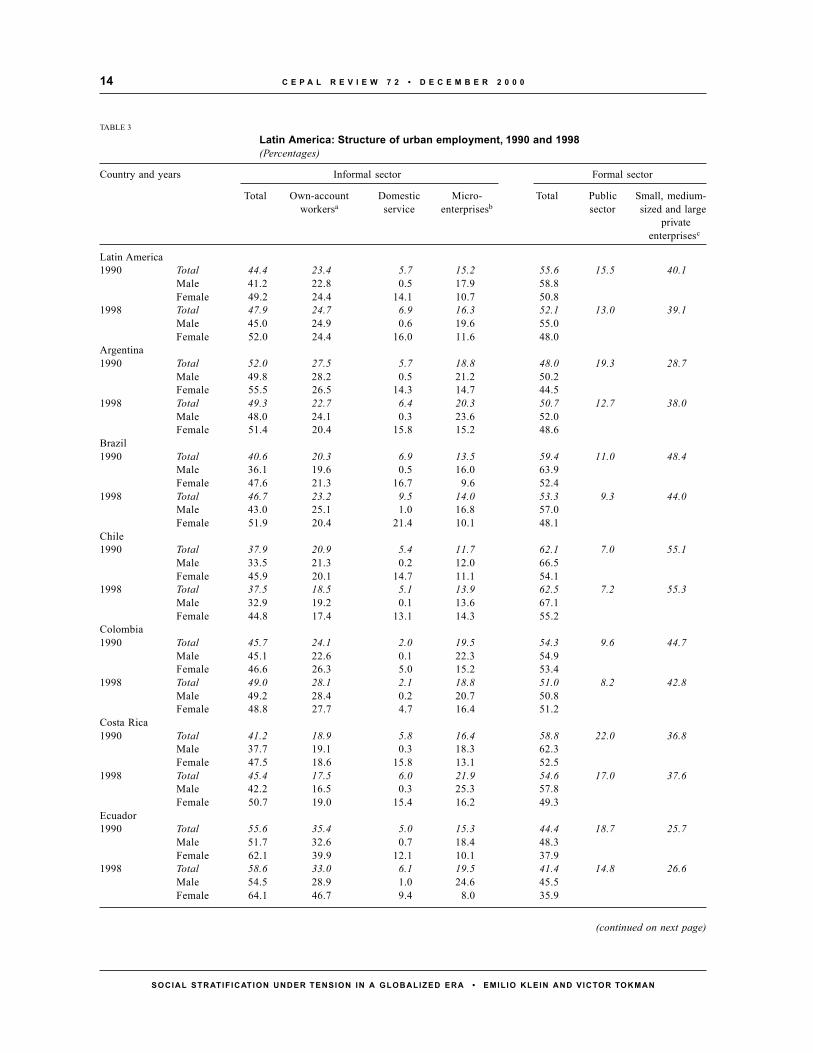
to 39%, the bulk of this decline taking place in coun-tries such as Brazil, Colombia and Venezuela. If smallenterprises are excluded, furthermore, the declineamounts to two percentage points (ILO, 1998). Largeenterprises (more than 100 employees) were the mostaffected by trade liberalization and the need to increaseproductivity (mostly through employment reduction).Only 17 out of every 100 new jobs created during the1990s were contributed by such companies. Increasedlabour flexibility facilitated adjustment, but at the costof a more erratic employment level, as is clearly illus-trated by the 1% decline in employment in large andmedium-sized enterprises in 1998, when these firmshad to adjust to increased competition from Asian prod-ucts (figure 1).
The second of the processes referred to, the shiftin employment from goods-producing sectors to ser-vices, was rapid in countries such as Bolivia, Costa Rica,Ecuador, Peru and Uruguay, where the share of manu-facturing employment fell by between four and six per-centage points during the 1990s.
In other countries the process was slower becauserestructuring was at a more mature stage (Chile) or agradual approach was followed (Brazil and Colombia)or, in cases like Panama, because the economy wassmall and already open.
The new structural conditions resulting from theadjustment process have left these sectors more vul-nerable to changes in competition. Manufacturing in-dustry contracted in 1998 as a result of increased com-petition from Asian products. This contraction of outputand employment was particularly large in food process-ing, textiles and clothing, shoes and machinery andequipment.
The shift of employment from manufacturing toservices is partly the result of increased competition ina more open economy. Falling employment has beenaccompanied by rising productivity which, particularlyin the short run, can only be achieved by cutting jobs.The effect has mainly been felt in urban employment,since agriculture, fishing and mining tend to contrib-ute to employment growth during the liberalizationprocess.
It cannot automatically be assumed that employ-ment growth in the service sector means a shift towardslow-productivity jobs. Some of the jobs created in thesector are in services that are integral to the modern-ization and globalization processes, such as finance,communications and trade. The productivity of thesesectors is usually higher than that of manufacturing andcan grow more rapidly. Unfortunately, this has not been
C E P A L R E V I E W 7 2 • D E C E M B E R 2 0 0 014
SOCIAL STRATIF ICATION UNDER TENSION IN A GLOBALIZED ERA • EMIL IO KLEIN AND VICTOR TOKMAN
TABLE 3
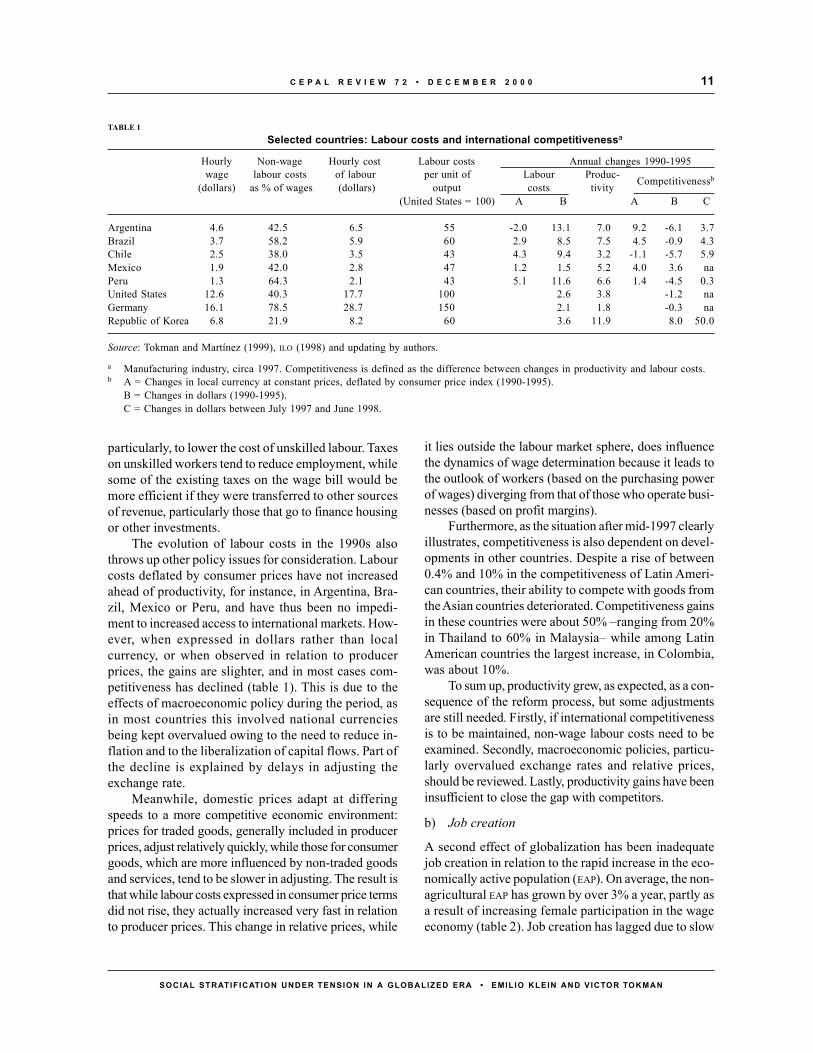
Latin America: Structure of urban employment, 1990 and 1998(Percentages)
Country and years Informal sector Formal sector
Total Own-account Domestic Micro- Total Public Small, medium-workersa service enterprisesb sector sized and large
privateenterprisesc
Latin America1990 Total 44.4 23.4 5.7 15.2 55.6 15.5 40.1
Male 41.2 22.8 0.5 17.9 58.8Female 49.2 24.4 14.1 10.7 50.8
1998 Total 47.9 24.7 6.9 16.3 52.1 13.0 39.1Male 45.0 24.9 0.6 19.6 55.0Female 52.0 24.4 16.0 11.6 48.0
Argentina1990 Total 52.0 27.5 5.7 18.8 48.0 19.3 28.7
Male 49.8 28.2 0.5 21.2 50.2Female 55.5 26.5 14.3 14.7 44.5
1998 Total 49.3 22.7 6.4 20.3 50.7 12.7 38.0Male 48.0 24.1 0.3 23.6 52.0Female 51.4 20.4 15.8 15.2 48.6
Brazil1990 Total 40.6 20.3 6.9 13.5 59.4 11.0 48.4
Male 36.1 19.6 0.5 16.0 63.9Female 47.6 21.3 16.7 9.6 52.4
1998 Total 46.7 23.2 9.5 14.0 53.3 9.3 44.0Male 43.0 25.1 1.0 16.8 57.0Female 51.9 20.4 21.4 10.1 48.1
Chile1990 Total 37.9 20.9 5.4 11.7 62.1 7.0 55.1
Male 33.5 21.3 0.2 12.0 66.5Female 45.9 20.1 14.7 11.1 54.1
1998 Total 37.5 18.5 5.1 13.9 62.5 7.2 55.3Male 32.9 19.2 0.1 13.6 67.1Female 44.8 17.4 13.1 14.3 55.2
Colombia1990 Total 45.7 24.1 2.0 19.5 54.3 9.6 44.7
Male 45.1 22.6 0.1 22.3 54.9Female 46.6 26.3 5.0 15.2 53.4
1998 Total 49.0 28.1 2.1 18.8 51.0 8.2 42.8Male 49.2 28.4 0.2 20.7 50.8Female 48.8 27.7 4.7 16.4 51.2
Costa Rica1990 Total 41.2 18.9 5.8 16.4 58.8 22.0 36.8
Male 37.7 19.1 0.3 18.3 62.3Female 47.5 18.6 15.8 13.1 52.5
1998 Total 45.4 17.5 6.0 21.9 54.6 17.0 37.6Male 42.2 16.5 0.3 25.3 57.8Female 50.7 19.0 15.4 16.2 49.3
Ecuador1990 Total 55.6 35.4 5.0 15.3 44.4 18.7 25.7
Male 51.7 32.6 0.7 18.4 48.3Female 62.1 39.9 12.1 10.1 37.9
1998 Total 58.6 33.0 6.1 19.5 41.4 14.8 26.6Male 54.5 28.9 1.0 24.6 45.5Female 64.1 46.7 9.4 8.0 35.9
(continued on next page)

15
SOCIAL STRATIF ICATION UNDER TENSION IN A GLOBALIZED ERA • EMIL IO KLEIN AND VICTOR TOKMAN
C E P A L R E V I E W 7 2 • D E C E M B E R 2 0 0 0
Table 3 (continued)
Country and years Informal sector Formal sector
Total Own-account Domestic Micro- Total Public Small, medium-workersa service enterprisesb sector sized and large
privateenterprisesc
Honduras1990 Total 57.6 37.3 7.1 13.3 42.4 14.9 27.5
Male 45.1 25.7 0.5 18.9 54.9Female 72.0 50.5 14.6 6.9 28.0
1998 Total 57.9 37.0 5.0 15.9 42.1 10.3 31.8Male 52.0 27.9 0.9 23.2 48.0Female 64.1 46.7 9.4 8.0 35.9
Mexico1990 Total 47.5 25.0 5.1 17.3 52.5 25.0 27.5
Male 46.6 25.1 0.8 20.7 53.4Female 48.8 24.6 13.4 10.8 51.2
1998 Total 49.6 24.9 4.8 19.8 50.4 21.7 28.7Male 48.1 23.7 0.2 24.2 51.9Female 51.8 26.8 12.9 12.1 8.2
Panama1990 Total 36.0 19.8 7.9 8.3 64.0 32.0 32.0
Male 34.6 23.8 1.0 9.7 65.4Female 38.0 14.0 17.8 6.3 62.0
1998 Total 38.5 21.5 6.9 10.1 61.5 21.8 39.7Male 35.9 22.8 1.3 11.9 64.1Female 42.3 19.5 15.4 7.4 57.7
Perud
1990 Total 52.7 33.4 4.9 14.5 47.3 11.6 35.7Male 46.3 28.9 0.6 16.9 53.7Female 62.9 40.4 11.6 10.8 37.1
1998 Total 53.7 30.2 5.5 18.0 46.3 7.2 39.1Male 45.3 23.8 0.5 21.0 54.7Female 64.6 38.7 11.9 14.0 35.4
Uruguaye
1990 Total 39.1 18.6 6.8 13.7 60.9 20.1 40.8Male 33.7 18.6 0.2 15.0 66.3Femae 46.6 18.5 16.2 11.8 53.4
1998 Total 41.2 20.1 7.5 13.6 58.8 16.8 42.0Male 37.3 22.1 0.2 15.0 62.7Female 46.4 17.5 17.2 11.7 53.6
Venezuela1990 Total 38.6 22.3 3.9 12.4 61.4 22.3 39.1
Male 38.3 22.0 0.4 15.9 61.7Female 39.3 22.8 10.4 6.1 60.7
1998 Total 43.0 28.9 4.7 9.4 57.0 19.0 38.0Male 43.3 27.8 0.2 15.3 56.7Female 46.6 28.4 11.4 6.8 53.4
Source: ILO estimates, based on country household surveys and other official sources (revised series).a Includes own-account workers (other than professional and technical workers) and unpaid family workers.b Employed in establishments of up to five workers.c Enterprises with six or more workers.d Metropolitan Lima.e Montevideo.
the situation in Latin America in the recent past. Nineout of every ten new jobs created in the 1990s were inservices, but 70% of these were in low-productivityservices, chiefly personal, retail trade and transporta-tion services in the informal sector. Under these cir-cumstances, the shift to services means a decline inemployment quality.
The third major change in the employment struc-ture in the 1990s was the shift from formal to informalemployment. As was mentioned earlier, the limited jobcreation capacity of the formal economy, both publicand private, left increasing numbers of people with noalternative but to find or create their own occupationsin the informal sector; in the absence of insurance, un-
C E P A L R E V I E W 7 2 • D E C E M B E R 2 0 0 016
SOCIAL STRATIF ICATION UNDER TENSION IN A GLOBALIZED ERA • EMIL IO KLEIN AND VICTOR TOKMAN
employment is a luxury that very few can afford. Slowand erratic growth, and the shedding of labour by thepublic sector during adjustment, conspired against thecreation of jobs in modern activities.
As a result, the proportion of the workforce ininformal employment expanded from 44% to 48%between 1990 and 1998. This includes own-accountwork, unpaid work in family businesses, domestic ser-vice and microenterprise (less than 5 employees). Onlyin Argentina, Chile and Honduras did informal employ-ment not expand as a share of the total, while in theremaining countries informal employment grew twiceas fast as total non-agricultural employment.
In the region as a whole, 61 out of every 100 jobscreated in the 1990s were informal. As was mentionedearlier, the great majority of new jobs in services wereinformal; furthermore, the most dynamic componentof informal employment growth has been work inmicroenterprises. Of every 10 new informal jobs, morethan three were contributed by microenterprises (figure 1).This could suggest a positive change within informalemployment, since microenterprises are more highlyorganized than most informal activities and averageincomes from microenterprises are higher than thoseof the rest of the informal sector, although not as highas those of the formal sector. Average incomes in
microenterprises are about 90% of average incomes inmodern activities generally, but only 55% of averageincomes in medium-sized and large enterprises.
Nevertheless, microenterprises are increasingly of-fering valid employment options. In 1998, for instance,they accounted for all new jobs created. Further analy-sis is needed, however, since although incomes are better,working conditions, job stability and social protectionare far from being acceptable. Between 65% and 95%of those working in microenterprises do not have awritten contract, and between 65% and 80% are notcovered for health risks or old age. They tend to worklonger hours and are more likely to have accidents atwork. Breaches of basic labour rights (child labour, free-dom of association, collective bargaining and forcedlabour) are also more frequent in establishments of thissize than in larger ones. Of course, insecurity is notsolely a characteristic of small enterprises; it is also tobe found in medium-sized and large firms (ILO, 1998).
The fourth process identified is the loss of job se-curity resulting from increased competition in a moreflexible labour environment. The search for cost reduc-tions and flexibility to allow for improvements in com-petitiveness has led to labour law reforms introducingflexibility at the margins. For new jobs, “non-standard”contracts have been introduced as a less costly and more
FIGURE 1
Latin America (selected countries): Employment trends in the 1990s(Share in employment growth)
Towards the tertiary sector
From goods to servicesGoods
Services
Growth of informal services
Modernservices
Informalservices
Towards the informal sector
From modern to informal
Modern
Informal
Modernization of the informal sector
Microbusinesses
Other informalactivities
17
SOCIAL STRATIF ICATION UNDER TENSION IN A GLOBALIZED ERA • EMILIO KLEIN AND VICTOR TOKMAN
C E P A L R E V I E W 7 2 • D E C E M B E R 2 0 0 0
flexible alternative to the open-ended contracts thatwere once the norm. The resultant increase in flexibil-ity and reduction in labour costs were expected to leadto growth in the number of waged jobs created.
In the 1990s waged employment did indeed in-crease more rapidly than total employment, suggest-ing that the reform produced incentives to hiring. How-ever, the social cost involved was increasing insecurityof employment. The introduction of “non-standard”labour contracts was accompanied by an increase inthe number of workers without any written employ-ment contract at all. It should be noted that neither non-standard contracts nor the lack of any written legal con-tract automatically entail lower labour protection thanstandard contracts. Only the reform in Argentina madeallowance for this reduction in temporary contracts, theexistence of an employment relationship being subjectto proof in the absence of a written contract. However,inspection and control become more difficult with tem-porary contracts. In the case of workers without con-tracts, many are unofficial and work for cash, so thattheir conditions of employment are almost impossibleto check. This development, furthermore, has comeabout in a situation where labour inspection is gener-ally weak, and because it is rigid contracts that are le-gally recognized as standard ones, the reform has meantthat powers of guidance have been diminished.
In 1996, workers without contracts or with “non-standard” contracts accounted for 30% of all workersin Chile, 40% in Argentina and Colombia and 74% inPeru. Most worked in microenterprises: 50% in Chile,65-70% in Argentina and Colombia and 80% in Peru.However, medium-sized and large enterprises recordedthe largest proportion of “non-standard” contracts andsignificant percentages of workers without contracts:6% in Chile, 11% in Peru and 32% in Argentina andColombia. In the case of microenterprises, informalworking and lack of employment security have a cleartendency to overlap, since both are mainly the result ofinability to pay the costs of labour protection. Withlarger enterprises, the number of unregistered workersis an indication that the law is being circumvented(Tokman and Martínez, eds., 1999).
Not only is the proportion of workers potentiallyor actually exposed to insecure employment conditionshigh, but in most countries insecure employment ac-counts for all job growth in the 1990s. Of the four coun-tries analysed, only in Colombia was there an increasein open-ended employment; in Argentina, Chile andPeru there was a fall in the absolute numbers of suchcontracts. The exact nature of the transition from per-
manent to temporary employment differed from coun-try to country. In Argentina, the decline in the numberof open-ended contracts was entirely offset by growthin the number of workers without contracts, mainly inlarger enterprises. In Peru, the decline in open-endedemployment was compensated for in equal proportionsby workers with temporary contracts and workers with-out contracts, mostly in microenterprises. In Chile, mostnew jobs were provided by larger enterprises under tem-porary contracts.
The four processes described resulted in a declinein the quality of labour protection in the 1990s.Privatization, which could have been a positive devel-opment, was not so because of the inadequacy of jobcreation in modern private-sector companies. A shifttowards tertiary employment is also a priori neutral,since good jobs in services could make up for a declinein available manufacturing employment. However, mostof the new jobs in services were of low productivity.Increased informal working and insecure employmentconditions clearly resulted in lower job quality, althoughthis was somewhat offset by the rapid expansion ofemployment in microenterprises.
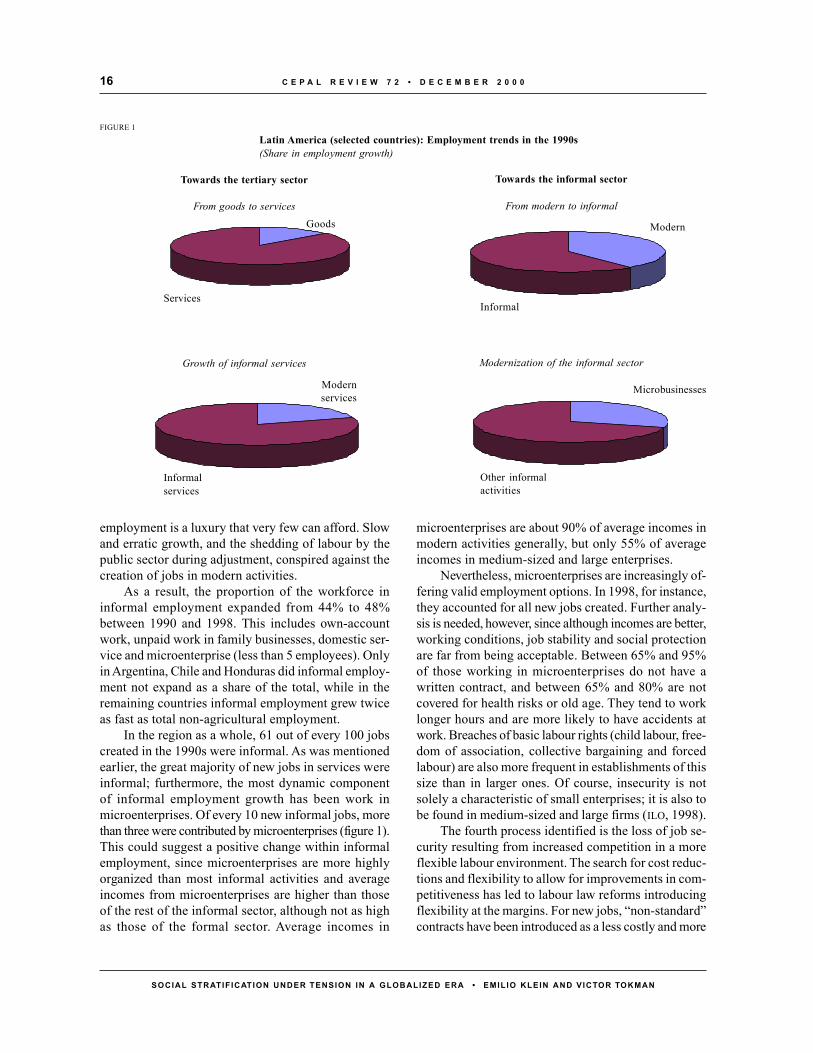
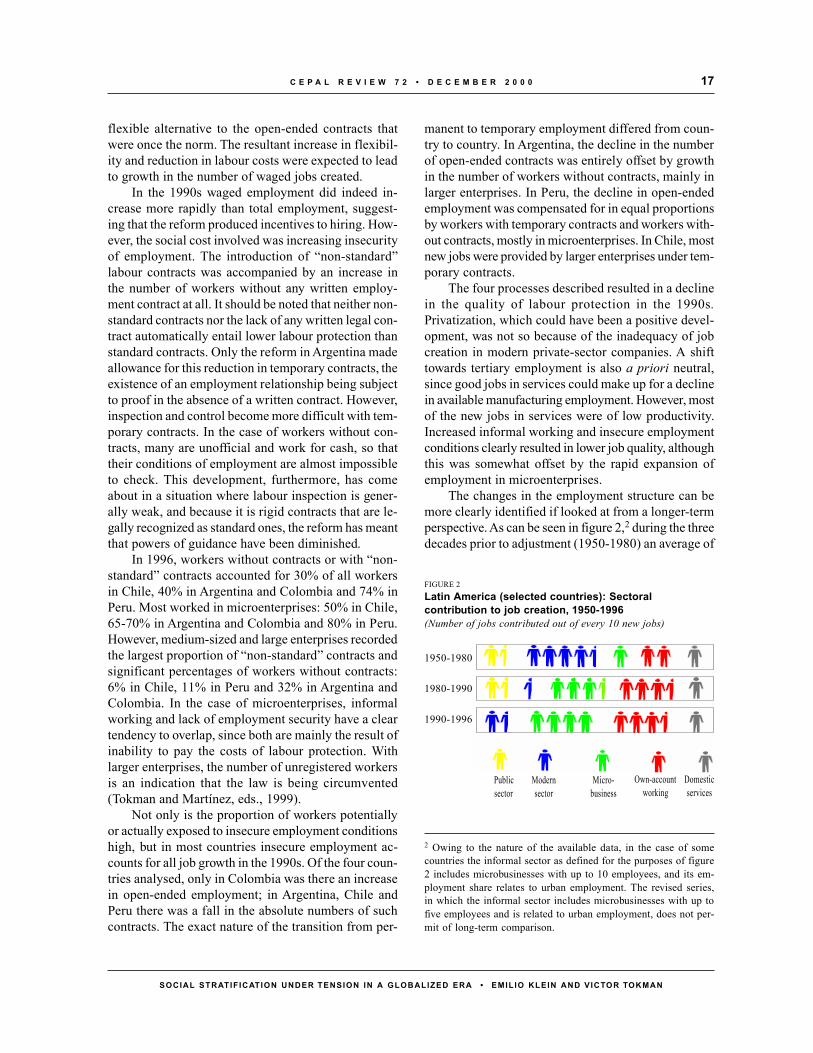
The changes in the employment structure can bemore clearly identified if looked at from a longer-termperspective. As can be seen in figure 2,2 during the threedecades prior to adjustment (1950-1980) an average of
2 Owing to the nature of the available data, in the case of somecountries the informal sector as defined for the purposes of figure2 includes microbusinesses with up to 10 employees, and its em-ployment share relates to urban employment. The revised series,in which the informal sector includes microbusinesses with up tofive employees and is related to urban employment, does not per-mit of long-term comparison.
FIGURE 2Latin America (selected countries): Sectoralcontribution to job creation, 1950-1996(Number of jobs contributed out of every 10 new jobs)
1950-1980
1980-1990
1990-1996
Micro-business
Own-accountworking
Publicsector
Modernsector
Domesticservices

C E P A L R E V I E W 7 2 • D E C E M B E R 2 0 0 018
SOCIAL STRATIF ICATION UNDER TENSION IN A GLOBALIZED ERA • EMILIO KLEIN AND VICTOR TOKMAN
60% of new jobs in Latin America were created by theformal sectors of the economy, with government ac-counting for 15% and medium-sized and large private-sector companies for 45%. The informal sector con-tributed 40% of new jobs, of which only 10% were inmicroenterprises (ILO, 1996).
A substantial change in the employment structureoccurred during the adjustment decade of the 1980s.The contribution made by employment in modern in-dustries fell to two out of every ten new jobs, this de-cline being most pronounced in modern private-sectorcompanies that had to adjust to a more open economy.The informal sector acted as a buffer: it doubled itscontribution to job creation, mostly in microenterprises,where it more than tripled. The 1990s saw a recoveryin labour absorption in larger private-sector companiesand continuing growth in informal employment.
To sum up, privatization has meant that public-sector employment is no longer contributing to labourabsorption. Larger enterprises, while they have beenrecovering from the adjustment decade, are still wellbelow the pre-adjustment level, and technologicalchange and decentralization of production and employ-ment mean that they are unlikely to be able to return toit. Indeed, business of all sizes account for the same5.5 out of every 10 new jobs as they did in the pre-adjustment period. The difference is that the main con-tributors now are microenterprises (including smallenterprises). This being the case, and informal and in-secure employment still being the norm in the sector,this employment shift has led to a decline in jobquality.
d) Wage trends and differentials
The adjustment process was expected to have two ef-fects on wages. It was predicted that wage levels wouldincrease as productivity grew, while wage differentialsby skill level would narrow as the demand for unskilledlabour increased because of the expansion of tradebased on labour-intensive sectors.
In 1990, both industrial and minimum wage lev-els were lower in real terms than they had been in1980. In both cases, though, there was a recoveryduring the 1990s. This was mainly due to success inreducing inflation, which declined from three digitsto less than 10% on average across Latin America.Latterly, productivity growth also contributed, particu-larly in the industrial sector. Nonetheless, as table 2shows, minimum wages are still substantially lowerthan in 1980.
Wage differentials have behaved in an unexpectedmanner, with the gaps between minimum and indus-trial wages and differences by skill or educational leveltending to widen. Industrial wages grew by 1.4% a yearbetween 1990 and 1997, while minimum wages in-creased by only 0.3%. Across Latin America, incomedifferentials between professional and technical work-ers and those employed in low-productivity sectors in-creased from 40% to 60% on average between 1990and 1994. This was the result of substantial growth inthe real incomes of high-skilled workers in modern ac-tivities and slow increases or even declines in the wagesof unskilled labour in low-productivity sectors. In eightout of ten countries for which data were available, thewage gap by skill level widened (ECLAC, 1997a). Thesame can also be seen when the wages of skilled work-ers are compared with those of blue-collar workers since1988 (IDB, 1998).
As wage gaps in Latin America widened over thisperiod, exactly the opposite trend was being seen inthe South-East Asian countries, despite the fact that in1980 wage gaps in Latin America were already the larg-est in the world. By 1997, the wage gap in LatinAmerica was 1.9 times as high as in developed coun-tries and the South-East Asian countries.
A number of explanations can be put forward forthis unexpected development. The effect of capital lib-eralization on the prices of capital goods could havebrought about an increase in investment and a concomi-tant demand for skilled labour. The expansion of im-ports from countries like China with an even greaterabundance of unskilled labour than Latin America, andcurrency appreciation, which favoured growth in moreskill-intensive non-tradable goods, are other factors(Lustig, 1998).
In addition, studies done on Brazil, Chile and Peru(Meller and Tokman, 1996; Paes de Barros and others,1996 and Saavedra, 1996) suggest that the maturity andcharacteristics of the trade liberalization process influ-ence the evolution of wage differentials. In Chile, wherethe liberalization process was at a more mature stage,large enterprises were able to expand employment af-ter 1984; in Brazil and Peru (two late starters in theprocess), large enterprises reduced employment in orderto raise productivity and competitiveness, while mostlabour absorption took place in small enterprises andmicroenterprises. In Chile demand for skilled labourgrew, while in the other two countries there was a shiftof labour from higher- to lower-productivity enterprisesand sectors, a process that was accompanied by net em-ployment growth in Peru but a net contraction in Brazil.
19
SOCIAL STRATIF ICATION UNDER TENSION IN A GLOBALIZED ERA • EMILIO KLEIN AND VICTOR TOKMAN
C E P A L R E V I E W 7 2 • D E C E M B E R 2 0 0 0
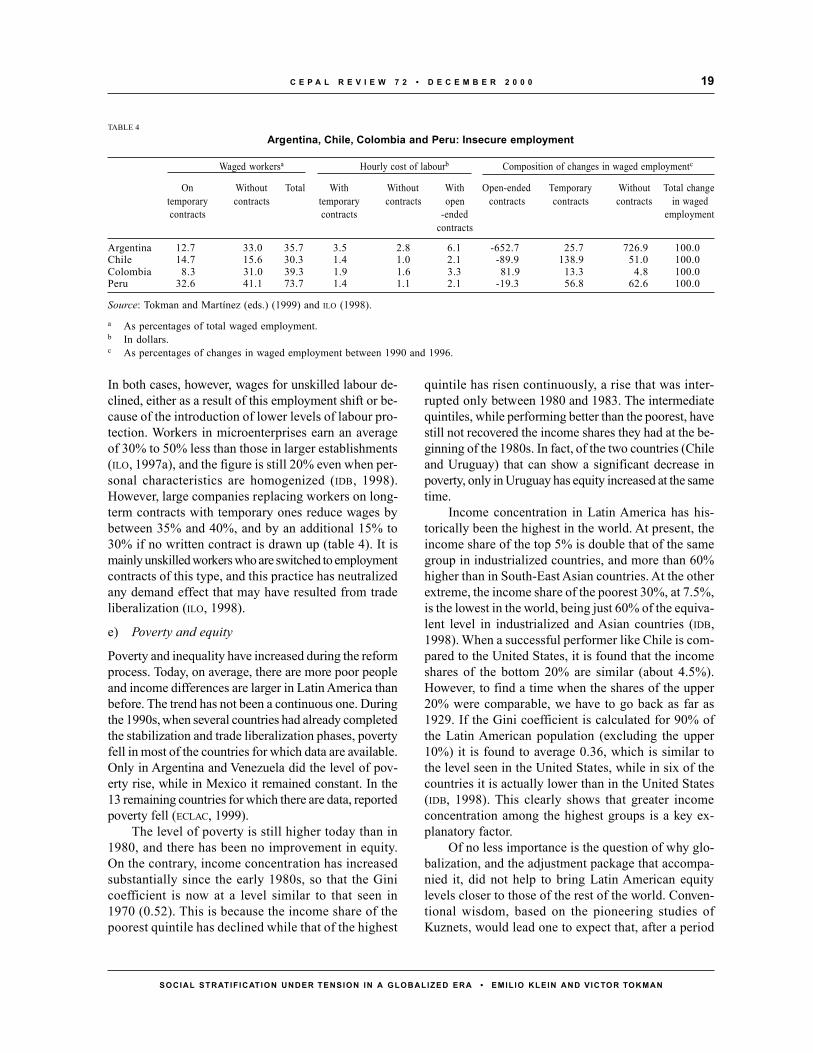
In both cases, however, wages for unskilled labour de-clined, either as a result of this employment shift or be-cause of the introduction of lower levels of labour pro-tection. Workers in microenterprises earn an averageof 30% to 50% less than those in larger establishments(ILO, 1997a), and the figure is still 20% even when per-sonal characteristics are homogenized (IDB, 1998).However, large companies replacing workers on long-term contracts with temporary ones reduce wages bybetween 35% and 40%, and by an additional 15% to30% if no written contract is drawn up (table 4). It ismainly unskilled workers who are switched to employmentcontracts of this type, and this practice has neutralizedany demand effect that may have resulted from tradeliberalization (ILO, 1998).
e) Poverty and equity
Poverty and inequality have increased during the reformprocess. Today, on average, there are more poor peopleand income differences are larger in Latin America thanbefore. The trend has not been a continuous one. Duringthe 1990s, when several countries had already completedthe stabilization and trade liberalization phases, povertyfell in most of the countries for which data are available.Only in Argentina and Venezuela did the level of pov-erty rise, while in Mexico it remained constant. In the13 remaining countries for which there are data, reportedpoverty fell (ECLAC, 1999).
The level of poverty is still higher today than in1980, and there has been no improvement in equity.On the contrary, income concentration has increasedsubstantially since the early 1980s, so that the Ginicoefficient is now at a level similar to that seen in1970 (0.52). This is because the income share of thepoorest quintile has declined while that of the highest
quintile has risen continuously, a rise that was inter-rupted only between 1980 and 1983. The intermediatequintiles, while performing better than the poorest, havestill not recovered the income shares they had at the be-ginning of the 1980s. In fact, of the two countries (Chileand Uruguay) that can show a significant decrease inpoverty, only in Uruguay has equity increased at the sametime.
Income concentration in Latin America has his-torically been the highest in the world. At present, theincome share of the top 5% is double that of the samegroup in industrialized countries, and more than 60%higher than in South-East Asian countries. At the otherextreme, the income share of the poorest 30%, at 7.5%,is the lowest in the world, being just 60% of the equiva-lent level in industrialized and Asian countries (IDB,1998). When a successful performer like Chile is com-pared to the United States, it is found that the incomeshares of the bottom 20% are similar (about 4.5%).However, to find a time when the shares of the upper20% were comparable, we have to go back as far as1929. If the Gini coefficient is calculated for 90% ofthe Latin American population (excluding the upper10%) it is found to average 0.36, which is similar tothe level seen in the United States, while in six of thecountries it is actually lower than in the United States(IDB, 1998). This clearly shows that greater incomeconcentration among the highest groups is a key ex-planatory factor.
Of no less importance is the question of why glo-balization, and the adjustment package that accompa-nied it, did not help to bring Latin American equitylevels closer to those of the rest of the world. Conven-tional wisdom, based on the pioneering studies ofKuznets, would lead one to expect that, after a period
TABLE 4
Argentina, Chile, Colombia and Peru: Insecure employment
Waged workersa Hourly cost of labourb Composition of changes in waged employmentc
On Without Total With Without With Open-ended Temporary Without Total changetemporary contracts temporary contracts open contracts contracts contracts in wagedcontracts contracts -ended employment
contracts
Argentina 12.7 33.0 35.7 3.5 2.8 6.1 -652.7 25.7 726.9 100.0Chile 14.7 15.6 30.3 1.4 1.0 2.1 -89.9 138.9 51.0 100.0Colombia 8.3 31.0 39.3 1.9 1.6 3.3 81.9 13.3 4.8 100.0Peru 32.6 41.1 73.7 1.4 1.1 2.1 -19.3 56.8 62.6 100.0
Source: Tokman and Martínez (eds.) (1999) and ILO (1998).
a As percentages of total waged employment.b In dollars.c As percentages of changes in waged employment between 1990 and 1996.
C E P A L R E V I E W 7 2 • D E C E M B E R 2 0 0 020
SOCIAL STRATIF ICATION UNDER TENSION IN A GLOBALIZED ERA • EMILIO KLEIN AND VICTOR TOKMAN
of increased income concentration in the early stage ofdevelopment, equity would improve. This conventionalwisdom does not seem to hold today, even for devel-oped countries. The trend towards greater equity hasbeen cut short or, at best, suspended. Inequality hasincreased in the United States since the end of the 1960s,while in the United Kingdom it increased from 1979 to1989, and it likewise rose in Sweden after 1988(Atkinson, 1996 and Krugman, 1995). This suggeststhat Latin American countries may be following a uni-versal path as a result of policy homogenization, with-out having passed through the stage of increased eq-uity seen earlier in those countries.
Several factors can help explain why globalizationhas not improved equity in Latin America. They relateto population dynamics, the distribution of opportuni-ties and the workings of labour markets during the ad-justment process.
Rapid population growth has resulted, particularlyin poor households, in larger household size (50% moremembers in the lowest quintile than in the highest),higher dependency rates (almost treble) and lower par-ticipation rates (60%) (ECLAC, 1997a).
Access to opportunities, and particularly to edu-cation, is also unequal. Although the time people spendin education has increased on average (albeit moreslowly than in South-East Asian countries), it tendsto be unequally distributed. There is a high drop-outrate among poor households. While 94% of poor chil-
dren in educationally advanced countries are enrolledin the first year of school, the figure is only 76% inthe less advanced countries. Enrolment rates decreaseto 63% and 32% by the fifth year, and to 15% and 6%by the ninth year. Entry rates are similar for poor chil-dren and children from higher-income families, butthe latter remain at school for longer periods. By thefifth year, the rates are 93% and 83%, while by theninth year they are 58% and 49% (IDB, 1998). Inequal-ity of access is reinforced by higher rates of educa-tion to university level among higher-income fami-lies and by differences in education quality. Academicattainments (in mathematics and science) are on av-erage 50% higher in private schools, which are at-tended only by children from higher-income families,than in State schools, which 90% of the children ofthe poor attend.
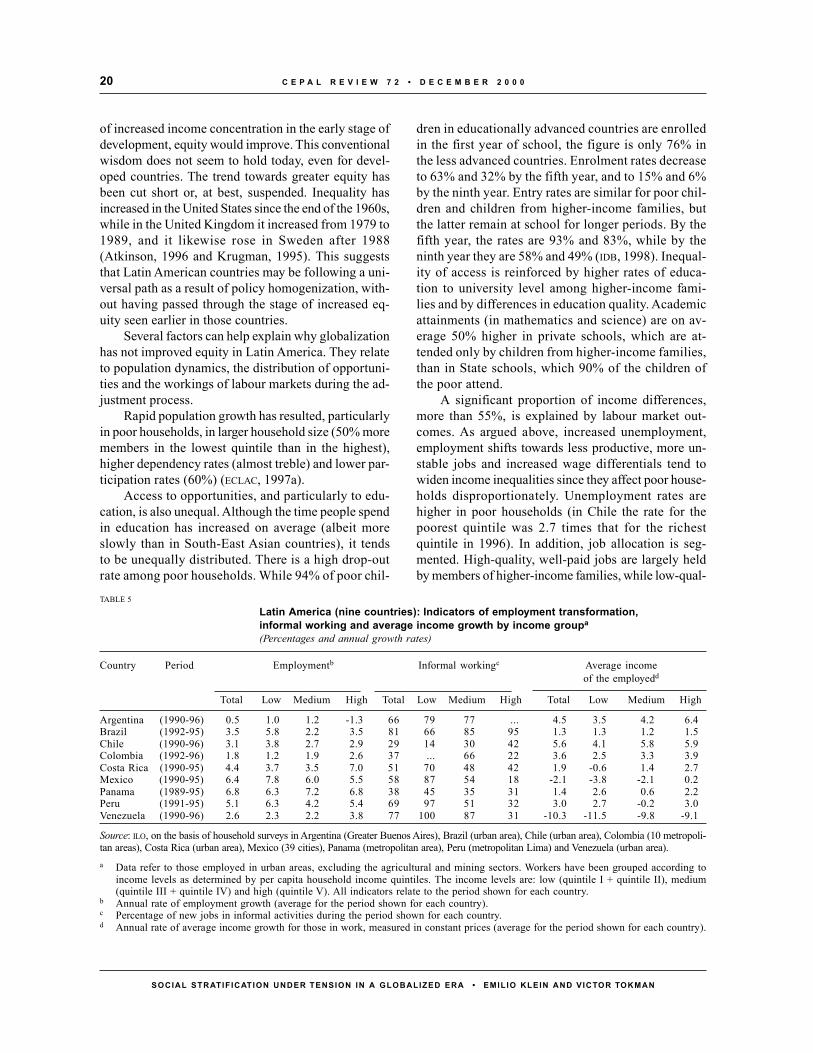
A significant proportion of income differences,more than 55%, is explained by labour market out-comes. As argued above, increased unemployment,employment shifts towards less productive, more un-stable jobs and increased wage differentials tend towiden income inequalities since they affect poor house-holds disproportionately. Unemployment rates arehigher in poor households (in Chile the rate for thepoorest quintile was 2.7 times that for the richestquintile in 1996). In addition, job allocation is seg-mented. High-quality, well-paid jobs are largely heldby members of higher-income families, while low-qual-
TABLE 5
Latin America (nine countries): Indicators of employment transformation,informal working and average income growth by income groupa
(Percentages and annual growth rates)
Country Period Employmentb Informal workingc Average incomeof the employedd
Total Low Medium High Total Low Medium High Total Low Medium High
Argentina (1990-96) 0.5 1.0 1.2 -1.3 66 79 77 ... 4.5 3.5 4.2 6.4Brazil (1992-95) 3.5 5.8 2.2 3.5 81 66 85 95 1.3 1.3 1.2 1.5Chile (1990-96) 3.1 3.8 2.7 2.9 29 14 30 42 5.6 4.1 5.8 5.9Colombia (1992-96) 1.8 1.2 1.9 2.6 37 ... 66 22 3.6 2.5 3.3 3.9Costa Rica (1990-95) 4.4 3.7 3.5 7.0 51 70 48 42 1.9 -0.6 1.4 2.7Mexico (1990-95) 6.4 7.8 6.0 5.5 58 87 54 18 -2.1 -3.8 -2.1 0.2Panama (1989-95) 6.8 6.3 7.2 6.8 38 45 35 31 1.4 2.6 0.6 2.2Peru (1991-95) 5.1 6.3 4.2 5.4 69 97 51 32 3.0 2.7 -0.2 3.0Venezuela (1990-96) 2.6 2.3 2.2 3.8 77 100 87 31 -10.3 -11.5 -9.8 -9.1
Source: ILO, on the basis of household surveys in Argentina (Greater Buenos Aires), Brazil (urban area), Chile (urban area), Colombia (10 metropoli-tan areas), Costa Rica (urban area), Mexico (39 cities), Panama (metropolitan area), Peru (metropolitan Lima) and Venezuela (urban area).a Data refer to those employed in urban areas, excluding the agricultural and mining sectors. Workers have been grouped according to
income levels as determined by per capita household income quintiles. The income levels are: low (quintile I + quintile II), medium(quintile III + quintile IV) and high (quintile V). All indicators relate to the period shown for each country.
b Annual rate of employment growth (average for the period shown for each country).c Percentage of new jobs in informal activities during the period shown for each country.d Annual rate of average income growth for those in work, measured in constant prices (average for the period shown for each country).
21
SOCIAL STRATIF ICATION UNDER TENSION IN A GLOBALIZED ERA • EMILIO KLEIN AND VICTOR TOKMAN
C E P A L R E V I E W 7 2 • D E C E M B E R 2 0 0 0
ity, informal and unskilled jobs tend to be taken up bypeople from poor households. Employment among thepoorest 40% in Chile increased between 1992 and 1994;while formal employment declined, the number of in-formal jobs grew by more than 20%. The opposite hap-pened in the upper quintile, where formal employmentexpanded by 13.5% and informal employment de-creased by 2.7%. More than half of all new jobs re-quiring high educational levels went to upper-incomefamilies, while upward mobility among the bottom 40%was limited, as they tended to take up jobs with sec-ondary or technical requirements (Tokman, 1998).
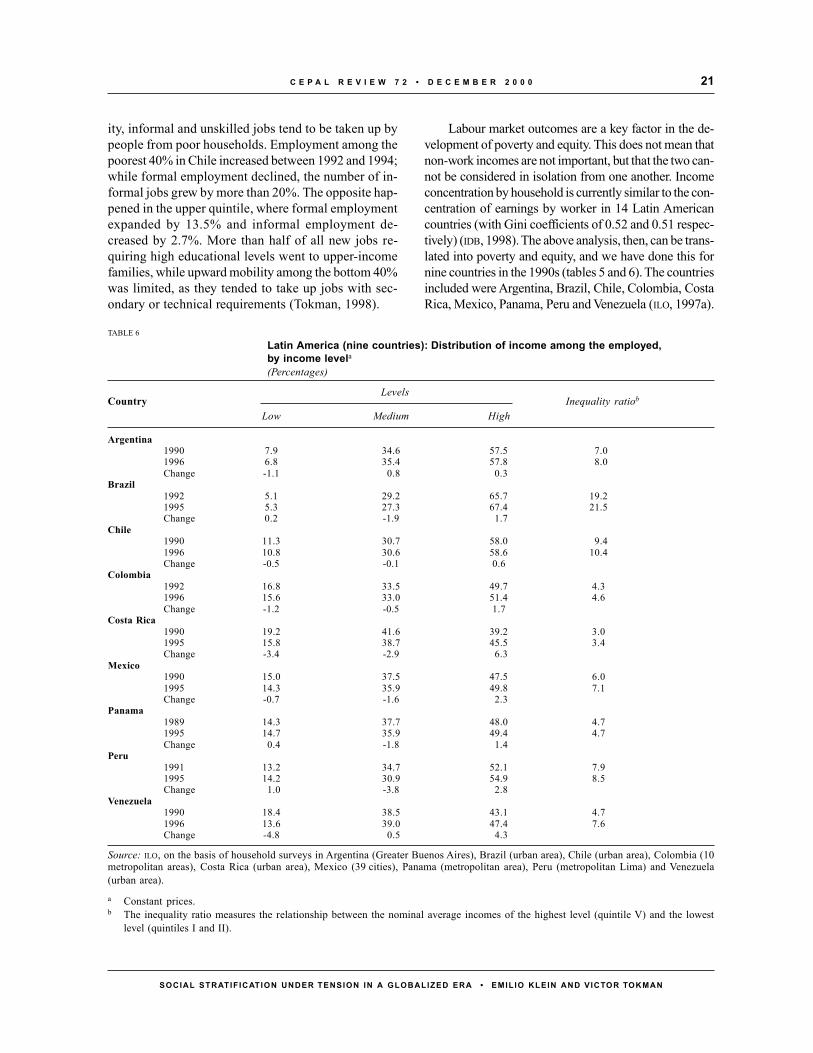
Labour market outcomes are a key factor in the de-velopment of poverty and equity. This does not mean thatnon-work incomes are not important, but that the two can-not be considered in isolation from one another. Incomeconcentration by household is currently similar to the con-centration of earnings by worker in 14 Latin Americancountries (with Gini coefficients of 0.52 and 0.51 respec-tively) (IDB, 1998). The above analysis, then, can be trans-lated into poverty and equity, and we have done this fornine countries in the 1990s (tables 5 and 6). The countriesincluded were Argentina, Brazil, Chile, Colombia, CostaRica, Mexico, Panama, Peru and Venezuela (ILO, 1997a).
TABLE 6
Latin America (nine countries): Distribution of income among the employed,by income levela(Percentages)
CountryLevels
Inequality ratiob
Low Medium High
Argentina1990 7.9 34.6 57.5 7.01996 6.8 35.4 57.8 8.0Change -1.1 0.8 0.3
Brazil1992 5.1 29.2 65.7 19.21995 5.3 27.3 67.4 21.5Change 0.2 -1.9 1.7
Chile1990 11.3 30.7 58.0 9.41996 10.8 30.6 58.6 10.4Change -0.5 -0.1 0.6
Colombia1992 16.8 33.5 49.7 4.31996 15.6 33.0 51.4 4.6Change -1.2 -0.5 1.7
Costa Rica1990 19.2 41.6 39.2 3.01995 15.8 38.7 45.5 3.4Change -3.4 -2.9 6.3
Mexico1990 15.0 37.5 47.5 6.01995 14.3 35.9 49.8 7.1Change -0.7 -1.6 2.3
Panama1989 14.3 37.7 48.0 4.71995 14.7 35.9 49.4 4.7Change 0.4 -1.8 1.4
Peru1991 13.2 34.7 52.1 7.91995 14.2 30.9 54.9 8.5Change 1.0 -3.8 2.8
Venezuela1990 18.4 38.5 43.1 4.71996 13.6 39.0 47.4 7.6Change -4.8 0.5 4.3
Source: ILO, on the basis of household surveys in Argentina (Greater Buenos Aires), Brazil (urban area), Chile (urban area), Colombia (10metropolitan areas), Costa Rica (urban area), Mexico (39 cities), Panama (metropolitan area), Peru (metropolitan Lima) and Venezuela(urban area).
a Constant prices.b The inequality ratio measures the relationship between the nominal average incomes of the highest level (quintile V) and the lowest
level (quintiles I and II).

C E P A L R E V I E W 7 2 • D E C E M B E R 2 0 0 022
SOCIAL STRATIF ICATION UNDER TENSION IN A GLOBALIZED ERA • EMILIO KLEIN AND VICTOR TOKMAN
On average, in the nine countries included, bothemployment and income per worker increased in the1990s, but the distribution of income favoured the up-per 20% of families. Employment grew fastest in poorhouseholds, followed by households in the upper 20%of income. Middle-income groups benefited the least(figure 3). Average income, however, grew most rap-idly in the higher income group, less rapidly in themiddle and most slowly among poor households. Thisis a consequence of segmented access to jobs by dif-ferent income groups. The poor, lacking in human capi-tal, tend to get access to informal jobs, while higher-income families tend to take up better jobs. About 70out of every 100 new jobs taken up by the poorest 40%were informal, while in the case of the middle 40% theratio was 52 out of every 100 new jobs. As a result,income concentration, as measured by the income dif-ference between the top 20% and the bottom 40%, in-creased in all the countries considered. Both the poorand the intermediate groups saw their share of totalincome diminish, the upper 20% being the only gain-ers. It seems likely, however, that relative poverty de-creased. Growth in employment and in earnings perworker, plus an increase in the number of family mem-bers at work, resulted in higher incomes for the poorand lower poverty in most countries during this period,the exceptions being Mexico and Venezuela.
The situation is fairly homogeneous across all thecountries. Incomes per worker grew fastest in theupper-income group in all the nine countries consid-ered, and employment did so in six of them. The situa-tion as regards developments in the poor and middlegroups is more diverse. In most countries, employmentgrew more rapidly for the poorest 40% than for themiddle 40%. However, income per worker grew fasterfor the middle-income group than for the low-incomegroup in six of the nine countries studied. As notedearlier, this was the result of differentiated access tojobs. Income differentials between the top 20% and thebottom 40% increased in all cases, with the cost beingborne by the poor and middle groups. In half thecountries the poor lost more ground than the middlegroup, while in the remainder the reverse was true.
FIGURE 3
Latin America (selected countries): Employmentand income growth by income level, 1990-1996(Percentages)
EmploymentAnnual growth rates
Low Medium HighIncome levels
Modern sector Informal sector
0123456
Average real incomeAnnual growth rates
01122
0
10
20
30
40
50
60
Low Medium High
1990 1996
Low Medium HighIncome levels
Low Medium High
Income distribution among those in work
Income levels
23
SOCIAL STRATIF ICATION UNDER TENSION IN A GLOBALIZED ERA • EMILIO KLEIN AND VICTOR TOKMAN
C E P A L R E V I E W 7 2 • D E C E M B E R 2 0 0 0
IIIAdjustment, global economies and
social stratification
Both the adjustment process in national economiesand the subsequent integration of these into the in-ternational economy have had a significant impacton the social stratification system. This is becausethat system is mainly based on an occupational struc-ture that has changed to reflect the transformationswrought in the labour market by economic restruc-turing. Some of the changes that have taken place,and the sociological consequences of these, will beanalysed below, with particular attention being paidto four aspects. The first is the relationship betweenthe transformation of public employment and middleclass impoverishment. The second is the wayprivatization generates increased social heterogene-ity, as a result of both involuntary labour mobilityand the growth of outsourcing. The third is the in-fluence of transnationalization on labour relationsystems. Lastly, we shall look at the increased dif-ferentiation emerging in employment growth areas,like microenterprise and agriculture.
1. Public-sector employment and the middle class
The first important issue is the new role of the Stateand its impact on the labour market. This transforma-tion has had two main effects. In the first instance, public-sector employment has declined in virtually all thecountries of the region. On average, public-sector em-ployment has decreased from 16% of the economicallyactive population at the beginning of the 1980s to 13%today, a fall of almost 20%. This average masks par-ticularly steep drops in some countries. For example,between 1990 and 1997 public-sector employment de-creased by 32% in Argentina, 33% in Bolivia, 22% inCosta Rica and 28% in Panama. This process has had alarge influence on social stratification in Latin America.It is a well documented fact that the origins and devel-opment of the middle class in Latin America wereclosely associated with the role of the State in promot-ing social and economic development during this cen-tury. In some countries this process began in the earlydecades of the century, in others it took place after theSecond World War, and in others again it is still going
on, but it is a feature of the entire region. This roleencompassed the creation of public employment andthe hiring of administrative staff to implement the de-velopment policies of the State, including health, edu-cation, public works and housing. The State was in-volved in creating employment in public enterprises ofall kinds, but essentially in those sectors deemed to beof national strategic importance (utilities, key naturalresources and basic industries). One illustration of theimportance of public-sector employment to the devel-opment of the middle class is the observation(Echeverría, 1985) that, in the 1970s, 60% of all LatinAmerican professionals were civil servants.
The occupational status of civil servants who havelost their jobs as a result of the decline in public-sectoremployment is unclear, and probably varies betweenand within countries. In some instances former civilservants have been eligible to receive compensationpayments, with which they have been able to start theirown businesses, usually as independent contractors oras micro-entrepreneurs. In many of these cases theirposition may have improved. In other cases, these re-dundancies have led to downward mobility. The fact isthat, in some countries, people discharged from the civilservice and public-sector enterprises have experiencedimpoverishment and loss of status, especially those whowere not professionals and whose status was based noton their educational attainments but on the occupationalpositions they held.
Again, those who have remained in public employ-ment have also lost status. With the economic adjust-ment measures that have been taken, the importance ofState administration has been reduced. At the same time,the prevailing ideological standpoint plays down therole of the State in society, and public functions do nothave the same prestige as before. One indication of thisis the reduced remuneration now given to civil servants;during the 1980s, the salaries of public employees fellby an average of 30% (ILO, 1992).
Of course, civil servants still enjoy considerableemployment stability, coupled with a certain amountof social protection and safety nets that, even thoughthey are far from satisfactory, provide some security
C E P A L R E V I E W 7 2 • D E C E M B E R 2 0 0 024
SOCIAL STRATIF ICATION UNDER TENSION IN A GLOBALIZED ERA • EMILIO KLEIN AND VICTOR TOKMAN
from the most pronounced of the negative trends oper-ating in today’s labour market. Furthermore, not all theremaining civil servants have seen their position worsen.One group, albeit small, have improved their incomesand status because they have been given increased re-sponsibilities and because demand from the privatesector for their type of specialization is high. This isparticularly true of those working for essential institu-tions in the new economic system, such as those incharge of overseeing and collecting tax revenues orcustoms duties. It is also true of those with a regulatoryrole in different areas of the financial system such asbanking, insurance and stock markets, and in the insti-tutions created to regulate privatized social securityactivities and utilities. As a result, wage and status dif-ferentials have widened in what used to be a very ho-mogeneous sector. The increasingly heterogeneouscharacter of the sector is not necessarily a negative fea-ture. Indeed, it may lead to greater economic efficiencyin the public sector if incentives related to labour pro-ductivity are introduced, as in fact is happening in ar-eas like education and health. Furthermore, if a highlyskilled labour force can be retained in the civil serviceby keeping wages and working conditions competitivewith the private sector, then the quality of the productwill improve. Creating opportunities for social mobil-ity and higher status for some of those working in thepublic sector by allowing wage differentials to increasecan result in improvements to the overall performanceof the sector.
2. Social heterogeneity and privatization ofpublic enterprises
The second feature of the changed role of the State isthe privatization of public-sector enterprises that hastaken place throughout Latin America. Privatization hashad a major impact on the way the labour market works,particularly where certain of its institutional character-istics are concerned. Labour market flexibility has beenachieved by various means. The first is greater scopeto dismiss workers. In almost all public enterprises thathave been privatized, a proportion of the labour forcehas been made redundant, the result in the first instancebeing an increase in open unemployment. This process,of course, is similar to the one seen in the private sec-tor. Some of these workers have not been able to findstable work and have become downwardly mobile, al-ternating between periods of underemployment andunemployment. Others have found employment simi-lar to the work they did for the public-sector enterprises
concerned. Lastly, the rest have turned themselves intoentrepreneurs, creating businesses of their own that inmany cases have functional links to the large compa-nies they were formerly employed by. In other words,when workers and employees in general are dismissedfrom newly privatized enterprises, some of their formerfunctions, including some essential ones, areoutsourced, and these enterprises subcontract withsmaller firms for this work. In this way, a subcontract-ing chain is established. This arrangement has tradi-tionally been quite common in some economic sectors,construction being an example. Today, it is also to befound in the primary sectors, basic utilities, telecom-munications, commerce and financial services.
Outsourcing gives companies greater flexibility,enabling them to respond appropriately to fluctuationsin the economic environment. Although there has beenno thorough macro-evaluation in respect of income andemployment, national case studies show that the im-pact is heterogeneous. For example, in the Chilean Statemining sector, where extensive redundancies have beenmade to reduce production costs, many workers havebeen rehired on a subcontracting basis. While they haveindeed forfeited employment stability and significantnon-wage benefits, working conditions and accidentrates have improved (ILO, 1997b). On the other hand,in many other cases income and employment condi-tions have deteriorated. Insecure employment aboundsin different sectors and countries where subcontract-ing is becoming a common feature of the labour mar-ket. In these cases, temporary jobs, lack of social secu-rity coverage and the absence of unions, collectivebargaining and training mechanisms may well be thenorm, even though wages might be higher.
3. Transnational enterprises and their socialeffects
Privatization of State enterprises has also increased thepresence of transnational corporations. This has gen-erated a new managerial stratum, characterized by veryhigh incomes, an international outlook (as opposed tonational interests) and a corporate ideology based onthe idea that globalization redefines national bound-aries and local interests. This stratum is to be found notonly in privatized public enterprises but also in privatecompanies, particularly those engaged in trading, fi-nancial services and industry. One of the effects of thetransnational status and management style of thesemanagers is that they tend to apply international stan-dards to labour relations, without recognizing national
25
SOCIAL STRATIF ICATION UNDER TENSION IN A GLOBALIZED ERA • EMILIO KLEIN AND VICTOR TOKMAN
C E P A L R E V I E W 7 2 • D E C E M B E R 2 0 0 0
and local characteristics. Often they are also sharehold-ers in the company, which gives them a concrete stakein its interests. They are also involved, however, inmaking the whole economic system work at a macrolevel, insofar as events in the capital and financial mar-kets directly affect their own overall incomes (in coun-tries where privatized pension funds have been allowedto invest in shares, this is also the case for all workersand employees participating in the system).
One specific kind of transnational presence is theso-called maquila or inbond assembly system wherebycertain parts of a company’s production process aretransferred to another country, this usually being justi-fied in terms of lower labour costs as these have a largedirect effect on total production costs (labour accountsfor 54% of total costs in the typical Central Americanmaquila or inbond assembly plant, where labour costsare 3.5 times lower than in the United States). In someareas of Latin America, this form of production is in-creasingly important. In Central America, plants of thistype now account for 250,000 jobs (400,000 if theDominican Republic is included), representing 30% ofemployment in the formal industrial sector, 20% ofexport value added and about 10% of industrial GNP(Gitli, 1997). Their impact, then, has been significant,and in some cases particularly disadvantaged groupsin the labour market, mainly women, have benefitedfrom the presence of these plants in their respectivecountries. This has become a means of increasing labourforce participation among these groups, which consti-tute a social stratum that is clearly dependent on thetransnational activities increasingly being undertakenby firms from the developed world as national econo-mies globalize.
The same study shows, however, that labour stan-dards and even human rights are not always respected.Sweatshops are widespread, even though there is in-creasing pressure for foreign firms to comply with mini-mum standards in their host countries. The questionthat remains to be answered is whether this is at allpossible when low labour costs are the driving forcebehind the very existence of the inbond assembly in-dustry.
4. Microenterprises and the informal sector
Microenterprises, many of them informal, have by andlarge been the main source of employment in LatinAmerica during the last decade. The social effects ofthis trend have been important. To begin with, it hasweakened the waged workforce that traditionally sus-
tained the labour movement. Permanent blue-collarworkers in medium-sized and large industrial compa-nies have increasingly been outnumbered by wage earn-ers in microenterprises. Others have been turned intoindependent contractors, mainly in the trade and ser-vices sectors.
The way microenterprises have developed has, inmany cases, reflected their relationship with the inter-national economy. While a large majority ofmicroenterprises cater to national markets, a propor-tion are now linked through exports to the worldeconomy. Some authors have argued that this “neo-in-formality” is a characteristic of today’s labour markets,particularly when enterprises form part of subcontract-ing chains with the inbond assembly operations of for-eign companies, and when they have found specificniches in particular external markets (Pérez-Sáinz,1996). In none of them, though, is there a significantdivision between labour and capital.
At this point it is worth recalling that up until the1970s the evolution of social stratification in LatinAmerica was a relatively straightforward process inwhich the labour force clearly experienced structuralsocial mobility. Indeed, research carried out byGermani, Stavenhagen and Medina Echeverría, amongothers, suggests there was a long-standing trend of up-ward mobility from low-productivity occupations tohigher-productivity ones, interpreted as being chieflya shift between sectors (from agriculture to manufac-turing and services) and between occupational catego-ries (from blue-collar to non-manual) (see Filgueira andGeneletti, 1981).
This seems no longer to be the case. The positionof the present paper is that one of the results of adjust-ment policies and the globalization of national econo-mies has been the emergence of heterogeneous char-acteristics within segments of the labour market, andthis phenomenon is seen most clearly when themicroenterprise sector is analysed. “Small scale” meansmany different things in both economic and socialterms. Some microenterprises are highly capitalized,have links to dynamic markets, operate in leading sec-tors and employ increasingly highly qualifiedworkforces, while others again are conventional interms of capital and labour use. Hence, heterogeneityis increasing as a result of current economic develop-ments: those employed in enterprises that are linked tothe developed strata have benefited in terms of incomeand employment opportunities (although not necessar-ily as regards employment quality), while those whoremain cut off from the main thrust of the economy
C E P A L R E V I E W 7 2 • D E C E M B E R 2 0 0 026
SOCIAL STRATIF ICATION UNDER TENSION IN A GLOBALIZED ERA • EMILIO KLEIN AND VICTOR TOKMAN
have lagged behind. They continue to work in low-pro-ductivity occupations, with low skills and little job se-curity.
5. Sectoral analysis
Heterogeneous trends in the labour market, and the so-cial impact these give rise to, can also be observed atthe sectoral level. Social strata will vary according tothe way businesses are linked with the rest of theeconomy (national and international). The developmentof agriculture clearly illustrates this point. Those agro-industrial sectors that have grown on the basis of exter-nal markets require a type of labour force different tothat employed in traditional agriculture, and have gen-erated a new set of occupations. Firstly, they require arelatively well trained and highly skilled labour force.Secondly, the jobs they generate are mostly temporary.Thirdly, they have opened up new waged employmentoptions for people who were previously unemployedand/or not economically active, particularly women,
whose increased participation in the labour market hasled to changes in the organization of the family and thedistribution of roles within it. Lastly, most of these jobsare remunerated according to labour productivity. Thesecharacteristics contrast strongly with those of the tra-ditional worker, the permanent, low-skilled male wageearner, employed in the cultivation of traditional cropsand earning, if he is lucky, the minimum wage. Withina single occupational category, therefore, the jobs avail-able have become more diverse in terms of theworkforce required, the personal characteristics of thisworkforce, productivity standards and time spent in thelabour market. To sum up, we can say that heterogene-ity has been a traditional feature of agriculture, an ex-ample of this being the coexistence of plantations anda peasant economy. The difference today is that thisheterogeneity is also to be found within occupationalcategories so that, for example, the characteristics ofwaged labour vary depending on whether or not thespecific sector concerned is linked to the wider eco-nomic system.
IVFinal remarks
Globalization cannot be isolated from the other poli-cies that have accompanied it over the last twenty years.They constitute a policy compact that it is very diffi-cult, both analytically and in practice, to break downinto its constituent parts. Three processes have beenscrutinized: globalization, privatization and deregula-tion. The effects on social stratification, mainly throughlabour market outcomes, have been the focus of ouranalysis, because the occupational structure is the ba-sis of the system of stratification.
The main conclusion is that the social structure inLatin America has been placed under tension duringthe reform period. This tension has affected social co-hesion and introduced greater heterogeneity. As withall processes, there are winners and losers. The differ-ence this time is that the changes are substantial andwill have a structural effect on peoples, societies andnations not only today but into the future.
Change, particularly during the 1990s, has not allbeen for the worse. Poverty is on a declining trend, andthe poor are better off in income terms. However, eq-uity has deteriorated. The winners are a minority, while
the rest, not only the poor but middle-income groupsas well, increasingly lag behind in relative terms. Theeffects of the policy compact on employment and earn-ings, as well as on equality of opportunities, have provento be an important determinant of this outcome. In aregion where inequality is already the highest in theworld, this is an unwelcome trend.
There seems to be enough evidence to sustain theproposition that the policy compact has led to greaterconcentration. Most of the positive effects have ben-efited sectors that were already situated in the upperechelons of income distribution: the policy compacthas favoured the relatively rich. Those negative effectsthat have occurred in the labour market as a result ofthe policy compact –increasingly insecure workingconditions (lack of contracts, social protection, etc.),the shift of employment towards the service sector andinformal jobs, unemployment– have mostly been con-centrated among sectors that were already relativelypoor. Thus, differences have increased. Wage earnersmay actually be paid more now than in the recent past,but their jobs are in many instances more informal and
27
SOCIAL STRATIF ICATION UNDER TENSION IN A GLOBALIZED ERA • EMILIO KLEIN AND VICTOR TOKMAN
C E P A L R E V I E W 7 2 • D E C E M B E R 2 0 0 0
less secure. In these cases, workers’ status has changedfor the worse.
The middle stratum has also experienced decreasedlevels of welfare. This paper has described the nega-tive effects of the compact on public-sector employ-ment, and the ensuing effects on social stratification. Itshould also be added that the benefits of social policieshave diminished, insofar as these policies have becomemore focused on the poor at the expense of middle-income groups. As a consequence, the middle classesnow have less protection against unemployment andpoor working conditions, public transfers (in the formof monetary benefits) have diminished and many oc-cupations that hitherto provided them with status haveeither lost their social significance or disappeared alto-gether.
This unequal distribution of gains and losses seemseven more regrettable in view of the high hopes beingplaced in the positive effects of globalization –a pathto which all Latin American countries adhered fromthe early stages– on growth, equity and social integra-tion. The issue, however, is how far globalization hasbrought additional distortions to an already unbalancedsocial situation. To place this in the right perspective, itshould be recalled that the starting point from whichglobalization set out was not conducive to a process ofsocial adjustment, since high income concentration andsevere macroeconomic imbalances limited any posi-tive effects that might have emerged from closer inte-gration into the world economy. The analysis, then,should focus more on the post-adjustment situation.
As has been shown, there have been fundamentalchanges in the employment structure as well as in in-comes and job quality. In most cases, people have foundthat the direction of change has been downward. Un-employment, a new feature of the situation, has alsocontributed to social exclusion, while volatility, whichis associated with the workings of a more openeconomy, has brought instability in jobs and incomes.Unsurprisingly, the main fear of people in the regiontoday is for their jobs, the chief concerns being insta-bility and loss of labour protection. Demands for in-creased labour protection during times of adjustmenthave been thwarted by the need to husband resources,and particularly for Governments to correct fiscal im-balances.
Globalization has brought new dimensions to eco-nomic analysis of labour markets, given their increasedlinks to trade, finance and communications at the in-ternational level. The old centre-periphery analysis,which has strongly influenced the Latin American in-
tellectual tradition, is giving way to dependence andmarginality analysis. Linkages today are not only closerbut also of a different nature. Heterogeneity has in-creased.
A direct way of looking at this relationship is toidentify population groups that are more closely linkedto the global economy than to the country in whichthey live. A case that provides an interesting illustra-tion of this situation is that of Mexico, which of all thecountries in the region has perhaps been one of the mostexposed to globalization in the recent past. Castañeda(1996) identifies four groups that are directly depen-dent on economic developments in the United States,totalling between them 20% to 25% of the Mexicanpopulation. Mexican migrants living in the UnitedStates are the first group. They constitute a source ofincome for an estimated 10 million Mexican residents;remittances, which have grown exponentially, are animportant contribution to the budgets of poor families(it is estimated that in 1998 they totalled US$ 5.5 billion,having tripled since 1990). A second group is involvedwith exports, including inbond assembly exports, whichare produced by 2,500 establishments and benefit afurther two million people, plus other export-relatedactivities in agriculture and manufacturing industry.Several examples serve to illustrate this. General Mo-tors of Mexico, the country’s biggest private-sector ex-porter, sells 40% more cars abroad than in the domes-tic market. Corona, the main beer producer, sells onebottle abroad for each bottle that goes to the internalmarket, and Cementos Mexicanos exported 90% of itsoutput in 1993. A third group whose livelihood dependson foreigners consists of those working in the tourismsector. It is estimated that 600,000 Mexicans are em-ployed in this activity and hence insulated from fluc-tuations in the domestic economy. Lastly, a large num-ber of people have links with foreign countries as legalor illegal property owners, or simply because they save,own assets, use financial instruments (like credit cards)or study or temporarily work abroad in professionaland technical jobs.
Castañeda’s analysis can be extended to the rest ofLatin America, with different proportions involved butwith similar types of relationships. Our own analysisshows, though, that not all sectors or all occupationswithin sectors have become global. The effects havenot been homogeneous. Not all sectors have beenequally affected, and within sectors the impact has beendifferentiated. Parts of industry have integrated into theworld economy, while others have lagged behind; agro-industry, for instance, has established strong links with

C E P A L R E V I E W 7 2 • D E C E M B E R 2 0 0 028
SOCIAL STRATIF ICATION UNDER TENSION IN A GLOBALIZED ERA • EMILIO KLEIN AND VICTOR TOKMAN
international markets, while traditional peasant agri-culture has remained autonomous. Occupations havebecome more heterogeneous, both between and withinsectors. This is particularly the case with the inbondassembly industry, tourism and subcontracting inmanufacturing industry. Businesses and hence owners,managers, technicians and skilled labour are incor-porated into the global economy; unskilled workers,while better off than before, are in an insecure posi-tion characterized by poor incomes, instability andlack of protection. Unemployment has added to socialexclusion, particularly among women and youngpeople.
Changes in the social structure have resulted fromlabour market effects; the differences between differ-ent population groups in the degree of global economicintegration go beyond jobs and incomes to permeatesocial habits. Cultural and economic differences trans-late into different social behaviour. Urban life is in-creasingly segregated; there are now ghettos for the rich,as there have traditionally been for the poor. Closedareas, private security, exclusive malls and clubs andeven schools conspire against social integration. Pub-lic spaces like parks and places of entertainment whichencouraged social interaction in the past are less avail-able. Separate schools divide children by social groups(Tokman and O’Donnell, eds., 1998). As O’Donnell(1998) puts it:
‘The sharp, and deepening, dualism of our coun-tries severely hinders the emergence of broad and ef-fective solidarity. Social distances have increased, andthe rich tend to isolate themselves from the strange anddisquieting world of the dispossessed. The fortifiedghettos of the rich and the secluded schools of theirchildren bear witness to their incorporation into thetransnationalized networks of modernity, as well as tothe gulf that separates them from large segments of thenational population.’
Social categories –as key instruments in the analy-sis of social stratification and social inclusion– are un-dergoing fundamental conceptual change. As Castañeda(1996) correctly argued, the issue today is not one ofclass, or ideology, or regions. It is not one of class,because the families of migrants or workers in someexport sectors benefit as owners and managers do. It isnot one of ideology, because ideas are now increas-ingly exposed and sustained by transnational events inwhat is a communications revolution. Nor is it a ques-tion of North against South, since the new economicsituation and worldwide ideological change are blur-ring the divisions of the past. It goes beyond all this.Social groups are structured by occupations as theywere in the past, but sectors tend to lose meaning whenheterogeneity prevails and, more importantly, whenpeople relate in a different way, culturally and economi-cally, to national and international interests.
Bibliography
Atkinson, A.B. (1996): Income distribution in Europe andthe United States, Oxford Review of Economic Policy,vol.12, No. 1, Oxford, U.K., Oxford University Press.
Bhagwati, J. and V. Dehejia (1993): Free trade and wages ofthe unskilled: Is Marx striking again?, J. Bhagwati andM. Kodsters (eds.), Trade and Wages, Washington, D.C.,American Enterprise Institute.
Castañeda, J. (1996): The Estados Unidos affair. Cincoensayos sobre un “amor” oblicuo, Mexico City, Aguilar.
ECLAC (Economic Commission for Latin America and theCaribbean) (1997a): The Equity Gap. Latin America,the Caribbean and the Social Summit, LC/G.1954/Rev.1-P, Santiago, Chile. United Nations publication,Sales No. E.97.II.G.11.
(1997b): Stylized Facts of Income Distribution inFive Countries of Latin America and General Guide-lines for a Redistributive Policy, Financiamiento deldesarrollo series, No. 72, Santiago, Chile.
(1999): Social Panorama of Latin America, 1998,LC/ G.1892-P, Santiago, Chile.
Echeverría, R. (1985): Empleo público en América Latina,Investigaciones sobre empleo series, No. 26, Santiago,
Chile, Regional Employment Programme for LatinAmerica and the Caribbean (PREALC).
Filgueira, C. and C. Geneletti (1981): Estratificación ymovilidad ocupacional en América Latina, Cuadernosde la CEPAL, No. 39, Santiago, Chile, ECLAC.
Gitli, E. (1997): La industria de la maquila enCentroamérica. Informe para el Seminario Suregionalde Empleadores de Centro América y RepúblicaDominicana, San José.
IDB (Inter-American Development Bank) (1998): AméricaLatina frente a la desigualdad, Progreso económicoy social en América Latina. Informe 1998-1999,Washington, D.C.
ILO (International Labour Organization) (1992): Report ofthe Director-General, Decimotercera Conferencia de losEstados de América Miembros de la OrganizaciónInternacional del Trabajo, Geneva.
(1995): World Employment 1995. An ILO Report,Geneva.
(1996): World Employment 1996/97: National Poli-cies in a Global Context, Geneva.
(1997a): NEWS Latin America and the Caribbean
29
SOCIAL STRATIF ICATION UNDER TENSION IN A GLOBALIZED ERA • EMILIO KLEIN AND VICTOR TOKMAN
C E P A L R E V I E W 7 2 • D E C E M B E R 2 0 0 0
1997 Labour Overview, Lima, ILO Regional Office forLatin America and the Caribbean.
(1997b): Chile: crecimiento, empleo y el desafío dela justicia social, Santiago, Chile, MultidisciplinaryTechnical Team.
(1998): NEWS Latin America and the Caribbean1998 Labour Overview, Lima, ILO Regional Office forLatin America and the Caribbean.
Krugman, P. (1995): The Age of Diminished Expectation,Cambridge, Massachusetts, MIT Press.
Lawrence, R. and M. Slaughter (1993): International trade andAmerican wages in the 1980s: Giant sucking sound orsmall hiccup?, Brookings Papers on Economic Activity,No. 2, Washington, D.C., The Brookings Institution.
Lustig, N. (1998): Pobreza y desigualdad: un desafío queperdura, CEPAL Review, special issue, LC/G.2037-P,Santiago, Chile, ECLAC.
Meller, P. and A. Tokman (1996): Chile: apertura comercial,empleo y salarios, Working document, No. 38, Lima, ILORegional Office for Latin America and the Caribbean.
OECD (Organisation for Economic Co-operation and Devel-opment) (1994): Perspectivas del empleo, The OECDJobs study. Facts, analysis, strategies, Paris.
O’Donnell, G. (1998): Poverty and inequality in LatinAmerica: Some political reflections, V. E. Tokman andG. O’Donnell (eds.): Poverty and Inequality in LatinAmerica: Issues and New Challenges, Notre Dame, In-diana, University of Notre Dame.
Paes de Barros, R. and others (1996): Brasil: aperturacomercial e mercado de trabalho, Working document,No. 39, Lima, ILO Regional Office for Latin Americaand the Caribbean.
Pérez-Sáinz, J. P. (1996): De la finca a la maquila, San José,Latin American Faculty of Social Sciences (FLACSO).
Saavedra, J. (1996): Perú: apertura comercial, empleo ysalarios, Working document, No. 40, Lima, ILO Re-gional Office for Latin America and the Caribbean.
Sachs, J. and H. Shatz (1994): Trade and jobs in US manu-facturing, Brookings Papers on Economic Activity,No. 1, Washington, D.C., The Brookings Institution.
Tokman, V.E. (1997): Jobs and solidarity: Main challengesfor the post-adjustment Latin America, L. Emmerij (ed.),Economic and Social Development into the XXI Cen-tury, Washington, D.C., IDB.
(1998): Jobs and welfare: Searching for new answers,V.E. Tokman and G. O’Donnell (eds.), Poverty and In-equality in Latin America. Issues and New Challenges,Notre Dame, Indiana, University of Notre Dame.
(1999): The labour challenges of globalization andeconomic integration, E. Mayobre (ed.), G-24. The de-veloping countries in the international financial system,Boulder, Colorado, Lynne Rienner Publishers.
Tokman, V.E. and D. Martínez (1999): Costo laboral ycompetitividad en el sector manufacturero de AméricaLatina, 1990-1998, CEPAL Review, No. 69, LC/G.2067-P,Santiago, Chile, ECLAC.
Tokman, V.E. and D. Martínez (eds.) (1999): Flexibilización enel margen: la reforma del contrato de trabajo, Lima, ILORegional Office for Latin America and the Caribbean.
Tokman, V.E. and G. O’Donnell (eds.) (1998): Poverty andInequality in Latin America. Issues and New Challenges,Notre Dame, Indiana, University of Notre Dame.
Williamson, J. (1990): Latin American Ajustment: How Muchhas Happened?, Washington, D.C., Institute for Inter-national Economics (IIE).
Wood, A. (1994): North-South Trade, Employment and In-equality, Oxford, U.K., Clarendon Press.

C E P A L R E V I E W 7 2 • D E C E M B E R 2 0 0 030
SOCIAL STRATIF ICATION UNDER TENSION IN A GLOBALIZED ERA • EMILIO KLEIN AND VICTOR TOKMAN
31C E P A L R E V I E W 7 2 • D E C E M B E R 2 0 0 0
EMPLOYMENT TRENDS IN LATIN AMERICA AND THE CARIBBEAN DURING THE 1990S • JÜRGEN WELLER
C E P A L R E V I E W 7 2
DECEMBER 2000
Employment trends inLatin America and
the Caribbean during the 1990s
Jürgen Weller
Economic Affairs Officer,Economic Development Division,Economic Commission forLatin Americaand the Caribbean (ECLAC)[email protected]
The economic reforms applied in the region during the 1980sand 1990s created expectations, for which there was theo-retical justification, of strong job creation and greater eq-uity in the labour market. This article analyses developmentsin the quantity and characteristics of employment duringthe 1990s. It concludes that today’s labour market problemsare due to insufficient economic growth and to less inten-sive use of labour, resulting mainly from changes in trad-able goods-producing activities. Modernization of produc-tion methods in companies and sectoral restructuring thatincreased the weight of tertiary activities contributed to seg-mentation of the labour market on the basis of people’s levelof education, as the demand for labour shifted towards thosewho had passed through intermediate and higher education.People with less formal education had less access to wageemployment and wage differences between skilled and un-skilled workers widened. At the same time, wage differencesbetween microenterprises and larger ones increased and, withemployment relationships becoming more flexible as well,employment quality indicators tended to worsen. All thesetendencies were contrary to what had been expected fromthe reforms. Sectoral restructuring of employment helpedtrigger a trend towards increasing heterogeneity in the labourmarket, and this took a variety of forms: substantial andsimultaneous job creation at the top and bottom of the em-ployment structure, a widening of the gap between formaland informal activities, differentiation of working conditionswithin medium-sized and large firms, and internal differen-tiation among microenterprises and own-account workers.
C E P A L R E V I E W 7 2 • D E C E M B E R 2 0 0 032
EMPLOYMENT TRENDS IN LATIN AMERICA AND THE CARIBBEAN DURING THE 1990S • JÜRGEN WELLER
IIntroduction
Developments in the labour market between 1950 and1980 were characterized by a process of social partici-pation and exclusion: while a growing proportion ofthe economically active population succeeded in par-ticipating in dynamic activities, large numbers of peoplewho left the agricultural sector as a result of interlinkedprocesses of attraction and expulsion –and of whommany migrated to the big cities– could only find em-ployment in low-productivity, low-paid activities(PREALC, 1991, pp. 9-14). There thus arose a consen-sus, reached from a variety of theoretical positions, tothe effect that even though open unemployment rateswere fairly low on average, there were still severe labourmarket problems in the region. The main one identi-fied was underemployment (visible and invisible),which affected large groups of people in small-scalefarming and the urban informal sector. During the cri-sis of the 1980s, the problems of the labour marketworsened as the ability of the formal sectors to gener-ate productive employment declined, with most newjobs being created in the informal sector. At the sametime, labour productivity and real wages fell.
The idea behind the economic reforms undertakenin the 1980s and 1990s was not just to achieve greatermacroeconomic stability and higher rates of outputgrowth, but also to solve the structural problems af-fecting the region’s labour markets. The starting as-sumption was that underutilization of the labour force,at a time when “inward” growth strategies were thenorm, was mainly due to distortions that had arisen inthe different markets for goods and factors. The first ofthese distortions was taken to be an anti-export biasthat favoured import substitution activities and the pro-duction of non-tradable goods and services at the ex-pense of exports, which were more labour-intensive.Secondly, it was argued that distortions in the labour
and capital markets had lowered the cost of capital andraised the cost of labour, and that this had had a nega-tive impact on the demand for labour. Lastly, it wasconsidered that the urban bias of this policy had rel-egated agricultural activities, which tend to be morelabour-intensive, to a position of secondary importance.Removing these distortions from goods and factormarkets would involve reallocating resources to activi-ties that produced exportable goods and to technolo-gies that were more labour-intensive, whereupon thedemand for labour would increase. Besides this the re-forms, taken all together, would have a positive effecton economic growth, an essential variable for increasedjob creation.
Because of the relative abundance of low-skilledworkers, the bulk of the additional demand would befor labour of this type. This would increase the relativewages of low-skilled workers, which would have posi-tive effects on distribution. Another positive develop-ment in this respect would be the strengthening of smalland medium-sized enterprises, as it was argued that theexisting distortions had given big firms an unfair ad-vantage over small ones. Lastly, the abolition of cer-tain labour regulations and measures to reduce the costof others would be conducive to the formalization ofemployment conditions and would reduce the relativeweight of the informal sector in employment.
During the 1980s and 1990s, reforms designed toremove distortions in the different markets of the re-gion made considerable progress (Morley, Machadoand Pettinato, 1999). So far, evaluations of develop-ments in the region’s labour markets during the 1990shave judged the results of these reforms to be disap-pointing.1 A fairly common conclusion is that thelabour market situation is the biggest problem facingthe Latin American and Caribbean countries, and theregion is often said to be experiencing “jobless growth”.
1 See ECLAC (1997), Thomas (1997), Lora and Olivera (1998) andWeeks (1999). ILO publications also stress the weakness of job cre-ation, in terms of both quantity and quality, but note that the coun-tries which implemented the reforms earliest have seen better re-sults; see, for example, ILO (1999b).
This article forms part of the research project “Growth,Employment, and Equity. The Impact of the Economic Reforms inLatin America and the Caribbean” conducted by ECLAC andresearchers in nine countries of the region and financed by theGovernments of the Netherlands and Sweden, the CanadianInternational Development Research Centre and the FordFoundation.
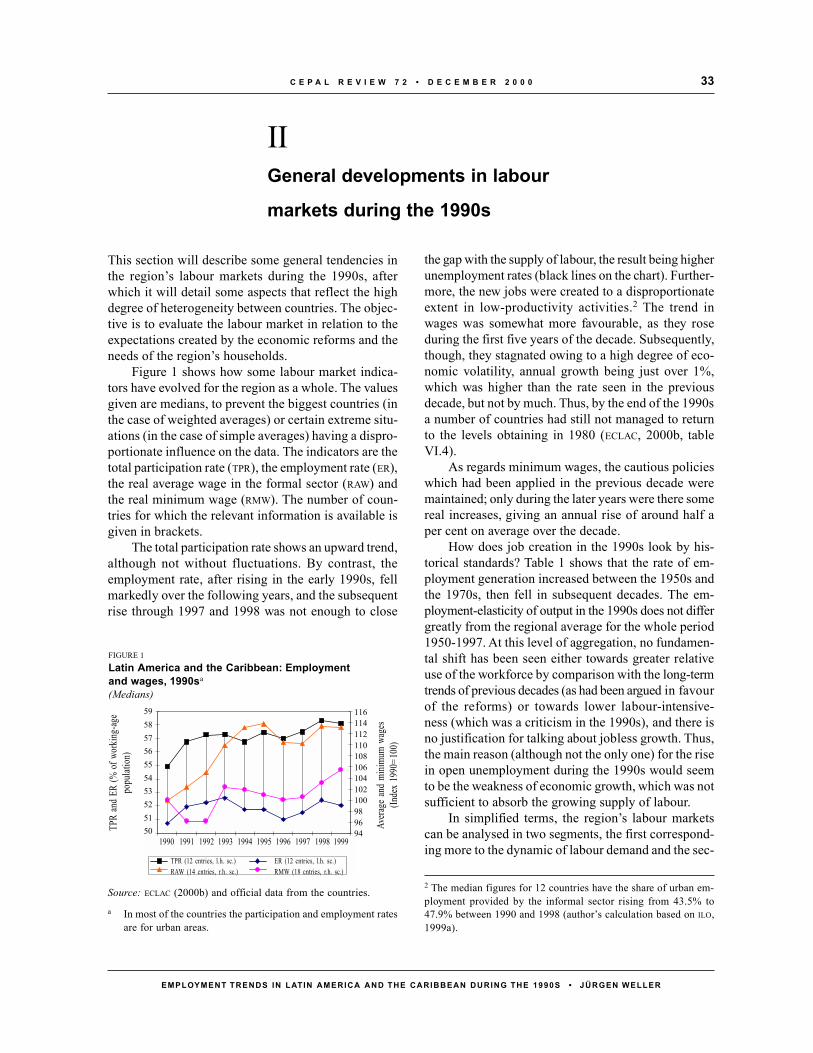
33C E P A L R E V I E W 7 2 • D E C E M B E R 2 0 0 0
EMPLOYMENT TRENDS IN LATIN AMERICA AND THE CARIBBEAN DURING THE 1990S • JÜRGEN WELLER
IIGeneral developments in labour
markets during the 1990s
the gap with the supply of labour, the result being higherunemployment rates (black lines on the chart). Further-more, the new jobs were created to a disproportionateextent in low-productivity activities.2 The trend inwages was somewhat more favourable, as they roseduring the first five years of the decade. Subsequently,though, they stagnated owing to a high degree of eco-nomic volatility, annual growth being just over 1%,which was higher than the rate seen in the previousdecade, but not by much. Thus, by the end of the 1990sa number of countries had still not managed to returnto the levels obtaining in 1980 (ECLAC, 2000b, tableVI.4).
As regards minimum wages, the cautious policieswhich had been applied in the previous decade weremaintained; only during the later years were there somereal increases, giving an annual rise of around half aper cent on average over the decade.
How does job creation in the 1990s look by his-torical standards? Table 1 shows that the rate of em-ployment generation increased between the 1950s andthe 1970s, then fell in subsequent decades. The em-ployment-elasticity of output in the 1990s does not differgreatly from the regional average for the whole period1950-1997. At this level of aggregation, no fundamen-tal shift has been seen either towards greater relativeuse of the workforce by comparison with the long-termtrends of previous decades (as had been argued in favourof the reforms) or towards lower labour-intensive-ness (which was a criticism in the 1990s), and there isno justification for talking about jobless growth. Thus,the main reason (although not the only one) for the risein open unemployment during the 1990s would seemto be the weakness of economic growth, which was notsufficient to absorb the growing supply of labour.
In simplified terms, the region’s labour marketscan be analysed in two segments, the first correspond-ing more to the dynamic of labour demand and the sec-
This section will describe some general tendencies inthe region’s labour markets during the 1990s, afterwhich it will detail some aspects that reflect the highdegree of heterogeneity between countries. The objec-tive is to evaluate the labour market in relation to theexpectations created by the economic reforms and theneeds of the region’s households.
Figure 1 shows how some labour market indica-tors have evolved for the region as a whole. The valuesgiven are medians, to prevent the biggest countries (inthe case of weighted averages) or certain extreme situ-ations (in the case of simple averages) having a dispro-portionate influence on the data. The indicators are thetotal participation rate (TPR), the employment rate (ER),the real average wage in the formal sector (RAW) andthe real minimum wage (RMW). The number of coun-tries for which the relevant information is available isgiven in brackets.
The total participation rate shows an upward trend,although not without fluctuations. By contrast, theemployment rate, after rising in the early 1990s, fellmarkedly over the following years, and the subsequentrise through 1997 and 1998 was not enough to close
2 The median figures for 12 countries have the share of urban em-ployment provided by the informal sector rising from 43.5% to47.9% between 1990 and 1998 (author’s calculation based on ILO,1999a).
Source: ECLAC (2000b) and official data from the countries.
a In most of the countries the participation and employment ratesare for urban areas.
FIGURE 1
Latin America and the Caribbean: Employmentand wages, 1990sa
(Medians)
TPR
and
ER (%
of w
orkin
g-ag
epo
pulat
ion)
Aver
age
and
minim
um w
ages
(Inde
x 19
90=1
00)
TPR (12 cntries, l.h. sc.) ER (12 cntries, l.h. sc.)RAW (14 cntries, r.h. sc.) RMW (18 cntries, r.h. sc.)
59585756555453525150
116114112110108106104102100989694
1990 1991 1992 1993 1994 1995 1996 1997 1998 1999

C E P A L R E V I E W 7 2 • D E C E M B E R 2 0 0 034
EMPLOYMENT TRENDS IN LATIN AMERICA AND THE CARIBBEAN DURING THE 1990S • JÜRGEN WELLER
ond to the dynamic of supply. Because of this seconddynamic, which is of great structural importance incountries that lack systems of unemployment benefit,in the long term –and when comparisons are made be-tween countries– job creation is closely correlated withmovements in supply. This is particularly true of over-all employment. Thus, the employment growth shownin table 1 –rising up until the 1970s, declining thereaf-ter– mainly reflects developments in supply, and par-ticularly in its most important component, the demo-graphic one, rather than differences in the use made ofthe labour factor by growth models of different kinds.
Simplifying once again, waged employment canbe used as a proxy for developments in the segmentdetermined mainly by demand, as it reflects the will-ingness of companies and the public sector to “pay aprice”, and own-account working can be used in thesame way for the segment determined mainly by sup-ply, as these are the main occupational categories ofthe respective segments. By historical standards, growthin wage employment was relatively weak (table 1).Whereas from the 1950s to the 1970s wage employ-ment grew more quickly than employment overall, andits share of total employment rose, in the 1990s em-ployment in this category only grew at the same rate asoverall employment.3 It fared worse only in the 1980s,when its share of total employment fell. The pressureof supply, of course, can also influence the generationof certain kinds of wage employment, particularly in
microenterprises,4 just as there is own-account employ-ment that reflects preferences and opportunities –inrespect of income or other aspects– more than the merenecessity of generating minimum incomes for survival,a necessity which is characteristic of those working inthe segment mainly determined by the supply situa-tion.
When the main labour market trends of the 1990sare analysed in greater detail, it is found that the char-acteristics of the labour supply in that decade did notdiffer sharply from previous tendencies. The increasein its demographic component continued to tail off5
and the participation rate continued to rise, owing tothe increasing numbers of women entering labour mar-kets.6 Thus, the total labour supply continued to growby more than its demographic component. As for thequalitative aspects, we find that the two components ofthe labour supply that are generally deemed essentialfor the development of human resources –formal edu-cation and work experience– developed positively. Onthe one hand, enrolment in secondary and tertiary edu-cation increased and, as young people with more yearsof formal education entered the labour market, the av-erage educational level of the workforce rose, althoughwith major quantitative and qualitative shortcomings
5.1 1.9 0.4 2.5 0.55.7 2.3 0.4 2.7 0.55.6 3.8 0.7 4.7 0.81.2 2.9 2.6 2.4 2.03.8 2.2 0.6 2.2 0.64.3 2.7 0.6 3.0 0.7
TABLE 1
Latin America and the Caribbean: Annual growth in output and employmentand the employment elasticity of output, 1950-1999
Period Economic Employment Employment elasticity Growth in wage Wage employmentgrowth growth of output employment elasticity of output
1950s1960s1970s1980s1990sa
1950s to 1990s
Source: Prepared by the author on the basis of information from ECLAC and the International Labour Organization (ILO).
a 1990-1997.
3 Relative growth in wage employment would be weaker if theinformation for 1998 and 1999 were included, as in both yearswage employment grew more slowly than the other employmentcategories taken together (see the relevant volumes of the ECLAC
Economic Survey of Latin America and the Caribbean).
4 The fact that job creation in the 1980s was low in relative terms,but higher than in the 1990s in absolute terms, shows that in situa-tions of economic crisis too waged employment reflects the pres-sure of supply to a great extent. In fact, most waged employmentwas generated in microenterprises.5 Annual growth in the working-age population fell from 2.5% inthe early 1980s to 2.0% in the late 1990s (author’s calculation basedon ECLAC/CELADE, 1999).6 See ECLAC (2000b, statistical annex) for the way labour marketparticipation developed differently by sex.
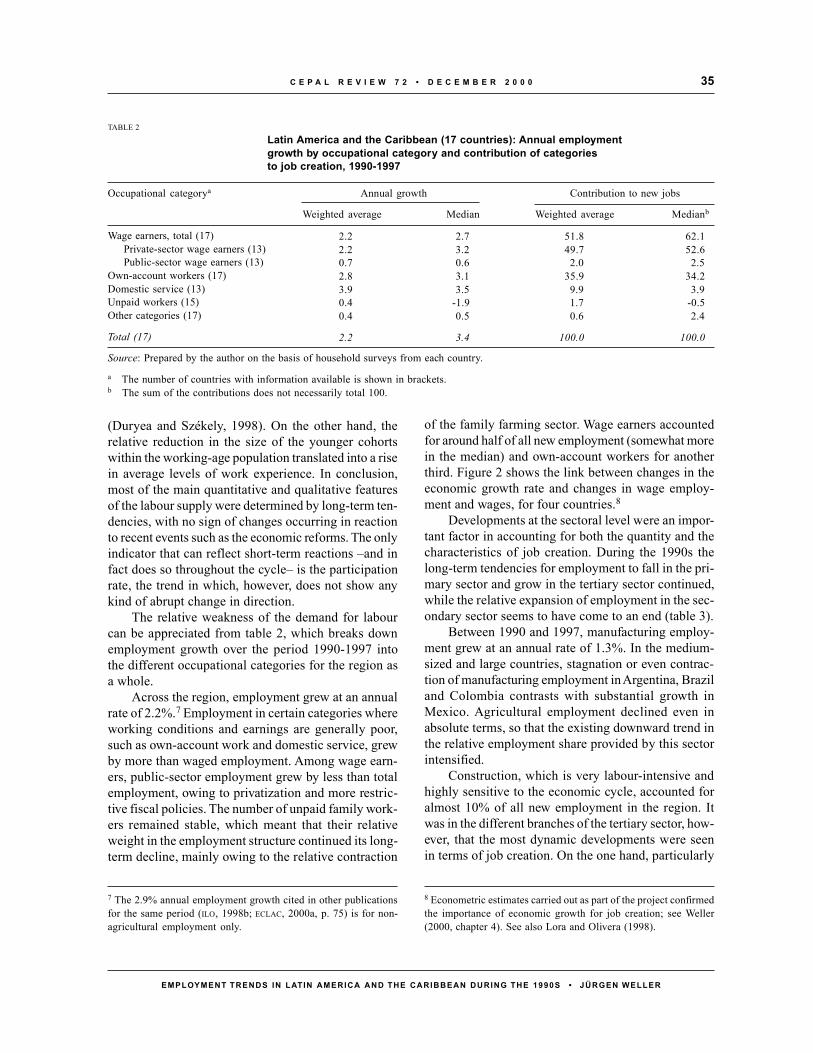
35C E P A L R E V I E W 7 2 • D E C E M B E R 2 0 0 0
EMPLOYMENT TRENDS IN LATIN AMERICA AND THE CARIBBEAN DURING THE 1990S • JÜRGEN WELLER
(Duryea and Székely, 1998). On the other hand, therelative reduction in the size of the younger cohortswithin the working-age population translated into a risein average levels of work experience. In conclusion,most of the main quantitative and qualitative featuresof the labour supply were determined by long-term ten-dencies, with no sign of changes occurring in reactionto recent events such as the economic reforms. The onlyindicator that can reflect short-term reactions –and infact does so throughout the cycle– is the participationrate, the trend in which, however, does not show anykind of abrupt change in direction.
The relative weakness of the demand for labourcan be appreciated from table 2, which breaks downemployment growth over the period 1990-1997 intothe different occupational categories for the region asa whole.
Across the region, employment grew at an annualrate of 2.2%.7 Employment in certain categories whereworking conditions and earnings are generally poor,such as own-account work and domestic service, grewby more than waged employment. Among wage earn-ers, public-sector employment grew by less than totalemployment, owing to privatization and more restric-tive fiscal policies. The number of unpaid family work-ers remained stable, which meant that their relativeweight in the employment structure continued its long-term decline, mainly owing to the relative contraction
of the family farming sector. Wage earners accountedfor around half of all new employment (somewhat morein the median) and own-account workers for anotherthird. Figure 2 shows the link between changes in theeconomic growth rate and changes in wage employ-ment and wages, for four countries.8
Developments at the sectoral level were an impor-tant factor in accounting for both the quantity and thecharacteristics of job creation. During the 1990s thelong-term tendencies for employment to fall in the pri-mary sector and grow in the tertiary sector continued,while the relative expansion of employment in the sec-ondary sector seems to have come to an end (table 3).
Between 1990 and 1997, manufacturing employ-ment grew at an annual rate of 1.3%. In the medium-sized and large countries, stagnation or even contrac-tion of manufacturing employment in Argentina, Braziland Colombia contrasts with substantial growth inMexico. Agricultural employment declined even inabsolute terms, so that the existing downward trend inthe relative employment share provided by this sectorintensified.
Construction, which is very labour-intensive andhighly sensitive to the economic cycle, accounted foralmost 10% of all new employment in the region. Itwas in the different branches of the tertiary sector, how-ever, that the most dynamic developments were seenin terms of job creation. On the one hand, particularly
TABLE 2
Latin America and the Caribbean (17 countries): Annual employmentgrowth by occupational category and contribution of categoriesto job creation, 1990-1997
Occupational categorya Annual growth Contribution to new jobs
Weighted average Median Weighted average Medianb
Wage earners, total (17)Private-sector wage earners (13)Public-sector wage earners (13)
Own-account workers (17)Domestic service (13)Unpaid workers (15)Other categories (17)
Total (17)
Source: Prepared by the author on the basis of household surveys from each country.
a The number of countries with information available is shown in brackets.b The sum of the contributions does not necessarily total 100.
2.2 2.7 51.8 62.12.2 3.2 49.7 52.60.7 0.6 2.0 2.52.8 3.1 35.9 34.23.9 3.5 9.9 3.90.4 -1.9 1.7 -0.50.4 0.5 0.6 2.4
2.2 3.4 100.0 100.0
8 Econometric estimates carried out as part of the project confirmedthe importance of economic growth for job creation; see Weller(2000, chapter 4). See also Lora and Olivera (1998).
7 The 2.9% annual employment growth cited in other publicationsfor the same period (ILO, 1998b; ECLAC, 2000a, p. 75) is for non-agricultural employment only.

C E P A L R E V I E W 7 2 • D E C E M B E R 2 0 0 036
EMPLOYMENT TRENDS IN LATIN AMERICA AND THE CARIBBEAN DURING THE 1990S • JÜRGEN WELLER
strong growth occurred in some areas associated withthe transformation of the region’s economies, particu-larly financial services, insurance, business services andreal estate and basic services (electricity, gas and water;transport, storage and communications). On the otherhand, the branch comprising trade, restaurants and ho-tels contains both activities that were very dynamicduring the 1990s (large stores and supermarkets, for-eign trade, tourism) and typical informal trading. A highdegree of heterogeneity also characterizes social, com-munity and personal services. Across the region, thelatter two branches accounted for around 70% of thejobs created in the 1990s.
An important factor behind employment trends wasthe fairly general rise in female participation in thelabour market (see the last column of table 3). This riseoccurred in sectors with a traditionally high level offemale involvement (services, trade and, to a lesserextent, manufacturing industry) but also in sectors
where this involvement is generally low. Furthermore,it was seen both in branches that did not generate strongemployment growth in the 1990s and in the sectors thataccounted for the bulk of such growth. The only ex-ception was basic services, owing to the large rise inemployment in transport services, where most jobs areheld by men.
The new employment created in the 1990s hashastened the tendency, dating from previous decades,for the importance of the tertiary sector in the employ-ment structure to increase. Towards the end of the de-cade, tertiary activities accounted for over 50% of em-ployment in 12 of the 14 countries for which nationwideinformation is available; in three countries, the figurewas over 60%. In 1997, in the region as a whole, 54.9%of those in work were employed in tertiary activities.9
9 Includes basic services.
FIGURE 2
Argentina, Brazil, Chile and Mexico: Growth in wage employmentand real wages in the formal sector
Source: Prepared by the author on the basis of ECLAC information.
Argentina, 19911997
-8
-3
2
7
12
1991 1992 1993 1994 1995 1996 1997
Waged Wage GDP
Brazil, 1991-1997
-15
-10
-5
0
5
10
1991 1992 1993 1994 1995 1996 1997
Waged Wage GDP
Chile, 1987-1997
-202468
1012
1987 1988 1989 1990 1991 1992 1993 1994 1995 1996 1997
Waged Wage GDP
Mexico, 1992-1997
-15
-10
-5
0
5
10
1992 1993 1994 1995 1996 1997
Waged Wages GDP
Argentina, 1991-1997
Chile, 1987-1997
-202468
1012
1987 1988 1989 1990 1991 1992 1993 1994 1995 1996 1997
Waged Wage GDPWage employment Wage GDP Wage employment Wage GDP
Wage employment Wage GDPWage employment Wage GDP
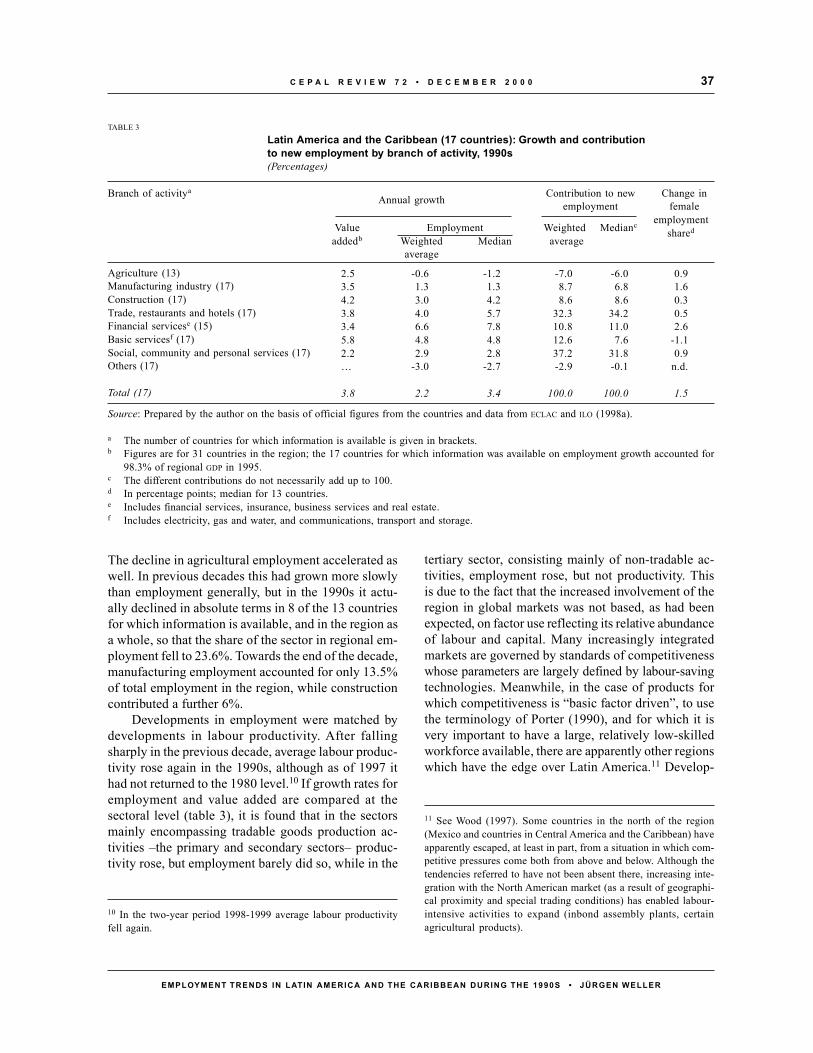
37C E P A L R E V I E W 7 2 • D E C E M B E R 2 0 0 0
EMPLOYMENT TRENDS IN LATIN AMERICA AND THE CARIBBEAN DURING THE 1990S • JÜRGEN WELLER
The decline in agricultural employment accelerated aswell. In previous decades this had grown more slowlythan employment generally, but in the 1990s it actu-ally declined in absolute terms in 8 of the 13 countriesfor which information is available, and in the region asa whole, so that the share of the sector in regional em-ployment fell to 23.6%. Towards the end of the decade,manufacturing employment accounted for only 13.5%of total employment in the region, while constructioncontributed a further 6%.
Developments in employment were matched bydevelopments in labour productivity. After fallingsharply in the previous decade, average labour produc-tivity rose again in the 1990s, although as of 1997 ithad not returned to the 1980 level.10 If growth rates foremployment and value added are compared at thesectoral level (table 3), it is found that in the sectorsmainly encompassing tradable goods production ac-tivities –the primary and secondary sectors– produc-tivity rose, but employment barely did so, while in the
tertiary sector, consisting mainly of non-tradable ac-tivities, employment rose, but not productivity. Thisis due to the fact that the increased involvement of theregion in global markets was not based, as had beenexpected, on factor use reflecting its relative abundanceof labour and capital. Many increasingly integratedmarkets are governed by standards of competitivenesswhose parameters are largely defined by labour-savingtechnologies. Meanwhile, in the case of products forwhich competitiveness is “basic factor driven”, to usethe terminology of Porter (1990), and for which it isvery important to have a large, relatively low-skilledworkforce available, there are apparently other regionswhich have the edge over Latin America.11 Develop-
TABLE 3
Latin America and the Caribbean (17 countries): Growth and contributionto new employment by branch of activity, 1990s(Percentages)
Branch of activityaAnnual growth Contribution to new Change in
employment female
Value Employment Weighted Medianc employment
addedb Weighted Median averageshared
average
Agriculture (13)Manufacturing industry (17)Construction (17)Trade, restaurants and hotels (17)Financial servicese (15)Basic servicesf (17)Social, community and personal services (17)Others (17)
Total (17)
Source: Prepared by the author on the basis of official figures from the countries and data from ECLAC and ILO (1998a).
a The number of countries for which information is available is given in brackets.b Figures are for 31 countries in the region; the 17 countries for which information was available on employment growth accounted for
98.3% of regional GDP in 1995.c The different contributions do not necessarily add up to 100.d In percentage points; median for 13 countries.e Includes financial services, insurance, business services and real estate.f Includes electricity, gas and water, and communications, transport and storage.
2.5 -0.6 -1.2 -7.0 -6.0 0.93.5 1.3 1.3 8.7 6.8 1.64.2 3.0 4.2 8.6 8.6 0.33.8 4.0 5.7 32.3 34.2 0.53.4 6.6 7.8 10.8 11.0 2.65.8 4.8 4.8 12.6 7.6 -1.12.2 2.9 2.8 37.2 31.8 0.9… -3.0 -2.7 -2.9 -0.1 n.d.
3.8 2.2 3.4 100.0 100.0 1.5
10 In the two-year period 1998-1999 average labour productivityfell again.
11 See Wood (1997). Some countries in the north of the region(Mexico and countries in Central America and the Caribbean) haveapparently escaped, at least in part, from a situation in which com-petitive pressures come both from above and below. Although thetendencies referred to have not been absent there, increasing inte-gration with the North American market (as a result of geographi-cal proximity and special trading conditions) has enabled labour-intensive activities to expand (inbond assembly plants, certainagricultural products).
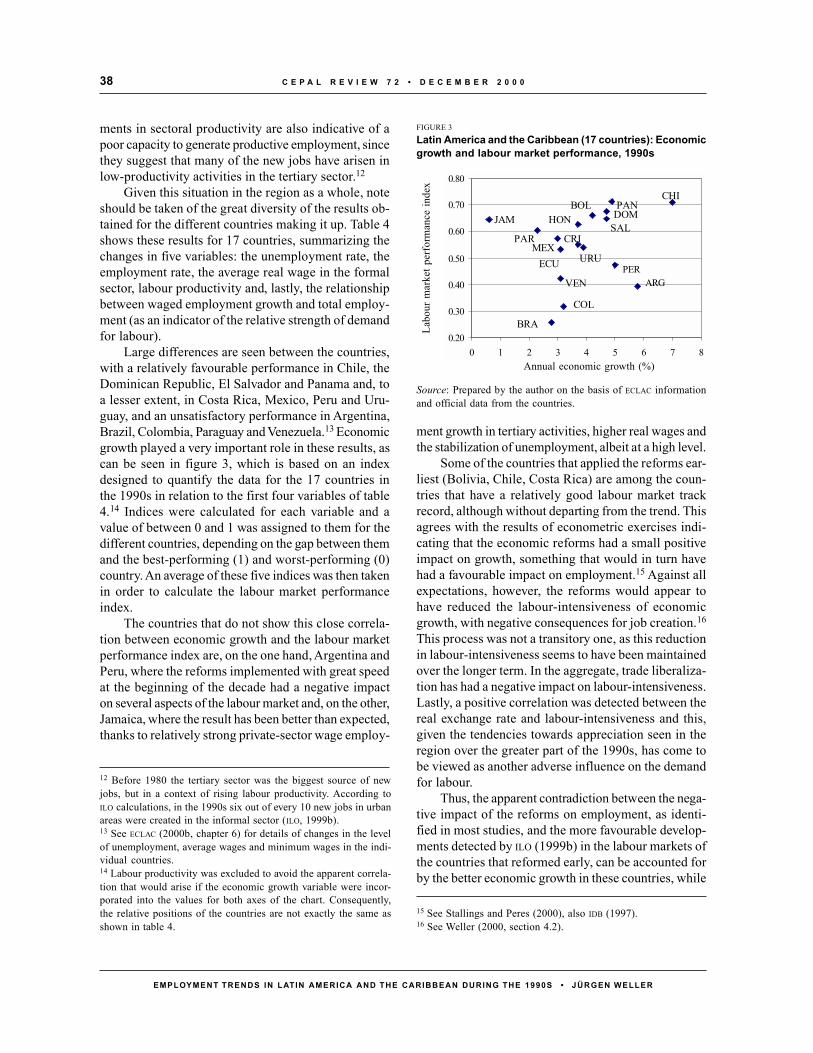
C E P A L R E V I E W 7 2 • D E C E M B E R 2 0 0 038
EMPLOYMENT TRENDS IN LATIN AMERICA AND THE CARIBBEAN DURING THE 1990S • JÜRGEN WELLER
ments in sectoral productivity are also indicative of apoor capacity to generate productive employment, sincethey suggest that many of the new jobs have arisen inlow-productivity activities in the tertiary sector.12
Given this situation in the region as a whole, noteshould be taken of the great diversity of the results ob-tained for the different countries making it up. Table 4shows these results for 17 countries, summarizing thechanges in five variables: the unemployment rate, theemployment rate, the average real wage in the formalsector, labour productivity and, lastly, the relationshipbetween waged employment growth and total employ-ment (as an indicator of the relative strength of demandfor labour).
Large differences are seen between the countries,with a relatively favourable performance in Chile, theDominican Republic, El Salvador and Panama and, toa lesser extent, in Costa Rica, Mexico, Peru and Uru-guay, and an unsatisfactory performance in Argentina,Brazil, Colombia, Paraguay and Venezuela.13 Economicgrowth played a very important role in these results, ascan be seen in figure 3, which is based on an indexdesigned to quantify the data for the 17 countries inthe 1990s in relation to the first four variables of table4.14 Indices were calculated for each variable and avalue of between 0 and 1 was assigned to them for thedifferent countries, depending on the gap between themand the best-performing (1) and worst-performing (0)country. An average of these five indices was then takenin order to calculate the labour market performanceindex.
The countries that do not show this close correla-tion between economic growth and the labour marketperformance index are, on the one hand, Argentina andPeru, where the reforms implemented with great speedat the beginning of the decade had a negative impacton several aspects of the labour market and, on the other,Jamaica, where the result has been better than expected,thanks to relatively strong private-sector wage employ-
ment growth in tertiary activities, higher real wages andthe stabilization of unemployment, albeit at a high level.
Some of the countries that applied the reforms ear-liest (Bolivia, Chile, Costa Rica) are among the coun-tries that have a relatively good labour market trackrecord, although without departing from the trend. Thisagrees with the results of econometric exercises indi-cating that the economic reforms had a small positiveimpact on growth, something that would in turn havehad a favourable impact on employment.15 Against allexpectations, however, the reforms would appear tohave reduced the labour-intensiveness of economicgrowth, with negative consequences for job creation.16
This process was not a transitory one, as this reductionin labour-intensiveness seems to have been maintainedover the longer term. In the aggregate, trade liberaliza-tion has had a negative impact on labour-intensiveness.Lastly, a positive correlation was detected between thereal exchange rate and labour-intensiveness and this,given the tendencies towards appreciation seen in theregion over the greater part of the 1990s, has come tobe viewed as another adverse influence on the demandfor labour.
Thus, the apparent contradiction between the nega-tive impact of the reforms on employment, as identi-fied in most studies, and the more favourable develop-ments detected by ILO (1999b) in the labour markets ofthe countries that reformed early, can be accounted forby the better economic growth in these countries, while
12 Before 1980 the tertiary sector was the biggest source of newjobs, but in a context of rising labour productivity. According toILO calculations, in the 1990s six out of every 10 new jobs in urbanareas were created in the informal sector (ILO, 1999b).13 See ECLAC (2000b, chapter 6) for details of changes in the levelof unemployment, average wages and minimum wages in the indi-vidual countries.14 Labour productivity was excluded to avoid the apparent correla-tion that would arise if the economic growth variable were incor-porated into the values for both axes of the chart. Consequently,the relative positions of the countries are not exactly the same asshown in table 4.
15 See Stallings and Peres (2000), also IDB (1997).16 See Weller (2000, section 4.2).
0.20
0.30
0.40
0.50
0.60
0.70
0.80
0 1 2 3 4 5 6 7 8
ARG
BOL
BRA
CHI
COL
CRI
ECU
SALHONJAM
MEX
PAN
PAR
PER
DOM
URU
VEN
FIGURE 3
Latin America and the Caribbean (17 countries): Economicgrowth and labour market performance, 1990s
Labo
ur m
arke
t per
form
ance
inde
x
Annual economic growth (%)
Source: Prepared by the author on the basis of ECLAC informationand official data from the countries.
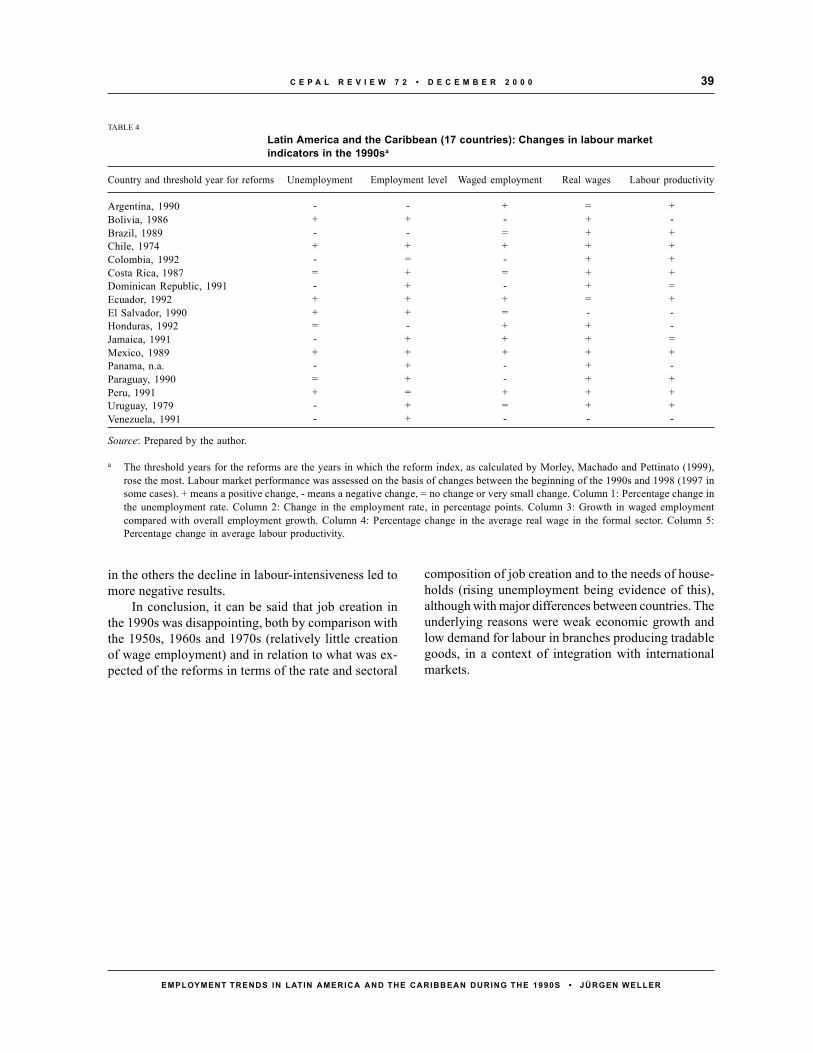
39C E P A L R E V I E W 7 2 • D E C E M B E R 2 0 0 0
EMPLOYMENT TRENDS IN LATIN AMERICA AND THE CARIBBEAN DURING THE 1990S • JÜRGEN WELLER
composition of job creation and to the needs of house-holds (rising unemployment being evidence of this),although with major differences between countries. Theunderlying reasons were weak economic growth andlow demand for labour in branches producing tradablegoods, in a context of integration with internationalmarkets.
in the others the decline in labour-intensiveness led tomore negative results.
In conclusion, it can be said that job creation inthe 1990s was disappointing, both by comparison withthe 1950s, 1960s and 1970s (relatively little creationof wage employment) and in relation to what was ex-pected of the reforms in terms of the rate and sectoral
TABLE 4
Latin America and the Caribbean (17 countries): Changes in labour marketindicators in the 1990sa
Country and threshold year for reforms Unemployment Employment level Waged employment Real wages Labour productivity
Argentina, 1990Bolivia, 1986Brazil, 1989Chile, 1974Colombia, 1992Costa Rica, 1987Dominican Republic, 1991Ecuador, 1992El Salvador, 1990Honduras, 1992Jamaica, 1991Mexico, 1989Panama, n.a.Paraguay, 1990Peru, 1991Uruguay, 1979Venezuela, 1991
Source: Prepared by the author.
a The threshold years for the reforms are the years in which the reform index, as calculated by Morley, Machado and Pettinato (1999),rose the most. Labour market performance was assessed on the basis of changes between the beginning of the 1990s and 1998 (1997 insome cases). + means a positive change, - means a negative change, = no change or very small change. Column 1: Percentage change inthe unemployment rate. Column 2: Change in the employment rate, in percentage points. Column 3: Growth in waged employmentcompared with overall employment growth. Column 4: Percentage change in the average real wage in the formal sector. Column 5:Percentage change in average labour productivity.
- - + = ++ + - + -- - = + ++ + + + +- = - + += + = + +- + - + =+ + + = ++ + = - -= - + + -- + + + =+ + + + +- + - + -= + - + ++ = + + +- + = + +- + - - -

C E P A L R E V I E W 7 2 • D E C E M B E R 2 0 0 040
EMPLOYMENT TRENDS IN LATIN AMERICA AND THE CARIBBEAN DURING THE 1990S • JÜRGEN WELLER
IIIThe bias of labour demand
groups, divided, for reasons of standardization, by theshare of the new employment taken by the entire edu-cational group. This indicator can be interpreted as rep-resenting the relative demand from companies for thedifferent educational groups in the workforce. A posi-tive value means that wage employment accounted formore of the new employment taken up by the educa-tional group concerned, while a negative value meansthat non-wage employment accounted for more.
As can be seen, in Bolivia, Brazil, Colombia, Chileand Peru there is a fairly strong positive correlationbetween educational level and the relative demand forlabour by companies. The exceptions are Argentina andCosta Rica. In Argentina, the group with the lowest levelof education saw a decline in the absolute numbers ofboth wage earners and unwaged workers, so the posi-tive value does not mean that companies have a prefer-ence for this group of workers. Only in Costa Rica wasthere strong relative demand for workers in the lowesteducational segment.
During the 1990s, segmentation of the labour mar-ket by educational level generally became more acute:while demand was skewed towards workers with moreyears of education, workers with less schooling had greaterdifficulty in finding wage employment and a higherproportion of them worked in non-wage occupations.
What is the source of this rising demand for highlyskilled staff? To identify it, changes in wage employ-ment were broken down with a view to distinguishingbetween the contribution made by changes within
As was seen earlier, one theoretical justification for thereforms was the argument that changes in the produc-tion structure and in the different sectors would fosterdemand for unskilled labour, owing to the relative abun-dance of this factor in the countries of the region, andthat this in turn would be instrumental in reducing wagedifferences between high-skilled and low-skilled work-ers. These expectations seemed to be borne out in the1980s, when the gap between the average wages ofpeople with a university education and those with pri-mary education lessened in most of the countries ofLatin America and the Caribbean (Psacharopoulos andNg, 1992, p. 15).
A number of studies dealing with the case of Chile,however, have raised doubts as to whether these ten-dencies can continue beyond the reform stage in a con-text of greater economic growth.17 In fact, if the im-proved educational level of the working-age populationis compared with that of people in work it is found thatin most of the countries groups with medium-high (be-tween 10 and 12 years of study) and high (13 years ofstudy and over) levels of education saw their share inemployment grow by more than the proportion of thewhole working-age population they accounted for; theopposite occurred in the case of groups with lower lev-els of education (Weller, 2000, table 6.1). This differ-entiation in the employment structure by educationallevel appears to provide initial confirmation that dur-ing the 1990s the demand for labour was oriented to-wards skilled workers and not towards unskilled ones.
If this orientation exists, it should be reflected bydifferences between educational levels in the creationof wage and non-wage employment. Since wage em-ployment gives the truest picture of the demand forlabour, differences of this type would show that thehigher growth in employment for skilled workers reallywas due to demand preferences. Figure 4 illustrates thisaspect. It shows, for seven countries, the differentproportions of new employment accounted for bywaged and unwaged jobs in respect of three educational
17 For the case of Chile in particular, Robbins (1994 and 1996)identified a tendency for wage differentials to rise.
-3.00
-2.00
-1.00
0.00
1.00
2.00
ARG BOL BRA CHI COL COS PER
Rel
ativ
e am
ount
of w
aged
empl
oym
ent c
reat
ed
Bajo Medio Alto
FIGURE 4Latin America (seven countries): Relative demandfor labour by educational level
Source: Prepared by the author.
Low Medium High
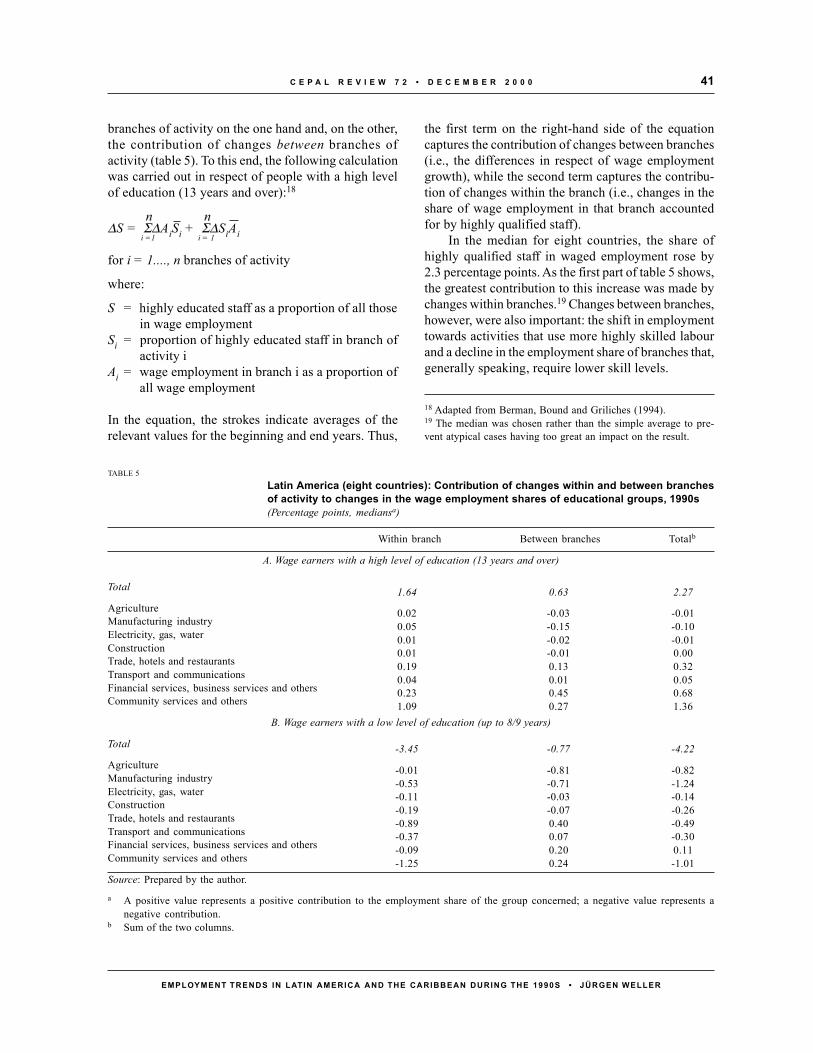
41C E P A L R E V I E W 7 2 • D E C E M B E R 2 0 0 0
EMPLOYMENT TRENDS IN LATIN AMERICA AND THE CARIBBEAN DURING THE 1990S • JÜRGEN WELLER
branches of activity on the one hand and, on the other,the contribution of changes between branches ofactivity (table 5). To this end, the following calculationwas carried out in respect of people with a high levelof education (13 years and over):18
n n∆S = Σ∆AiSi + Σ∆SiAii =1 i = 1
for i = 1...., n branches of activity
where:
S = highly educated staff as a proportion of all thosein wage employment
Si = proportion of highly educated staff in branch ofactivity i
Ai = wage employment in branch i as a proportion ofall wage employment
In the equation, the strokes indicate averages of therelevant values for the beginning and end years. Thus,
the first term on the right-hand side of the equationcaptures the contribution of changes between branches(i.e., the differences in respect of wage employmentgrowth), while the second term captures the contribu-tion of changes within the branch (i.e., changes in theshare of wage employment in that branch accountedfor by highly qualified staff).
In the median for eight countries, the share ofhighly qualified staff in waged employment rose by2.3 percentage points. As the first part of table 5 shows,the greatest contribution to this increase was made bychanges within branches.19 Changes between branches,however, were also important: the shift in employmenttowards activities that use more highly skilled labourand a decline in the employment share of branches that,generally speaking, require lower skill levels.
18 Adapted from Berman, Bound and Griliches (1994).19 The median was chosen rather than the simple average to pre-vent atypical cases having too great an impact on the result.
TABLE 5Latin America (eight countries): Contribution of changes within and between branchesof activity to changes in the wage employment shares of educational groups, 1990s(Percentage points, mediansa)
Within branch Between branches Totalb
A. Wage earners with a high level of education (13 years and over)
Total
AgricultureManufacturing industryElectricity, gas, waterConstructionTrade, hotels and restaurantsTransport and communicationsFinancial services, business services and othersCommunity services and others
B. Wage earners with a low level of education (up to 8/9 years)
Total
AgricultureManufacturing industryElectricity, gas, waterConstructionTrade, hotels and restaurantsTransport and communicationsFinancial services, business services and othersCommunity services and others
Source: Prepared by the author.
a A positive value represents a positive contribution to the employment share of the group concerned; a negative value represents anegative contribution.
b Sum of the two columns.
1.64 0.63 2.27
0.02 -0.03 -0.010.05 -0.15 -0.100.01 -0.02 -0.010.01 -0.01 0.000.19 0.13 0.320.04 0.01 0.050.23 0.45 0.681.09 0.27 1.36
-3.45 -0.77 -4.22
-0.01 -0.81 -0.82-0.53 -0.71 -1.24-0.11 -0.03 -0.14-0.19 -0.07 -0.26-0.89 0.40 -0.49-0.37 0.07 -0.30-0.09 0.20 0.11-1.25 0.24 -1.01
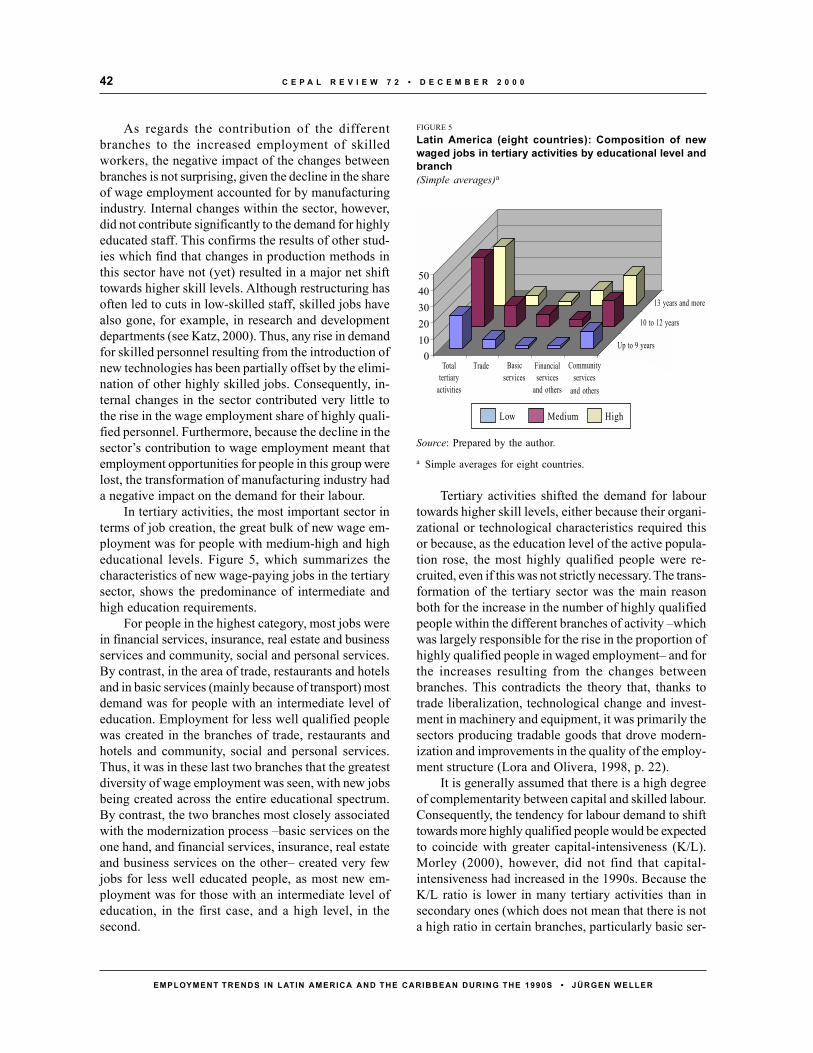
C E P A L R E V I E W 7 2 • D E C E M B E R 2 0 0 042
EMPLOYMENT TRENDS IN LATIN AMERICA AND THE CARIBBEAN DURING THE 1990S • JÜRGEN WELLER
As regards the contribution of the differentbranches to the increased employment of skilledworkers, the negative impact of the changes betweenbranches is not surprising, given the decline in the shareof wage employment accounted for by manufacturingindustry. Internal changes within the sector, however,did not contribute significantly to the demand for highlyeducated staff. This confirms the results of other stud-ies which find that changes in production methods inthis sector have not (yet) resulted in a major net shifttowards higher skill levels. Although restructuring hasoften led to cuts in low-skilled staff, skilled jobs havealso gone, for example, in research and developmentdepartments (see Katz, 2000). Thus, any rise in demandfor skilled personnel resulting from the introduction ofnew technologies has been partially offset by the elimi-nation of other highly skilled jobs. Consequently, in-ternal changes in the sector contributed very little tothe rise in the wage employment share of highly quali-fied personnel. Furthermore, because the decline in thesector’s contribution to wage employment meant thatemployment opportunities for people in this group werelost, the transformation of manufacturing industry hada negative impact on the demand for their labour.
In tertiary activities, the most important sector interms of job creation, the great bulk of new wage em-ployment was for people with medium-high and higheducational levels. Figure 5, which summarizes thecharacteristics of new wage-paying jobs in the tertiarysector, shows the predominance of intermediate andhigh education requirements.
For people in the highest category, most jobs werein financial services, insurance, real estate and businessservices and community, social and personal services.By contrast, in the area of trade, restaurants and hotelsand in basic services (mainly because of transport) mostdemand was for people with an intermediate level ofeducation. Employment for less well qualified peoplewas created in the branches of trade, restaurants andhotels and community, social and personal services.Thus, it was in these last two branches that the greatestdiversity of wage employment was seen, with new jobsbeing created across the entire educational spectrum.By contrast, the two branches most closely associatedwith the modernization process –basic services on theone hand, and financial services, insurance, real estateand business services on the other– created very fewjobs for less well educated people, as most new em-ployment was for those with an intermediate level ofeducation, in the first case, and a high level, in thesecond.
Tertiary activities shifted the demand for labourtowards higher skill levels, either because their organi-zational or technological characteristics required thisor because, as the education level of the active popula-tion rose, the most highly qualified people were re-cruited, even if this was not strictly necessary. The trans-formation of the tertiary sector was the main reasonboth for the increase in the number of highly qualifiedpeople within the different branches of activity –whichwas largely responsible for the rise in the proportion ofhighly qualified people in waged employment– and forthe increases resulting from the changes betweenbranches. This contradicts the theory that, thanks totrade liberalization, technological change and invest-ment in machinery and equipment, it was primarily thesectors producing tradable goods that drove modern-ization and improvements in the quality of the employ-ment structure (Lora and Olivera, 1998, p. 22).
It is generally assumed that there is a high degreeof complementarity between capital and skilled labour.Consequently, the tendency for labour demand to shifttowards more highly qualified people would be expectedto coincide with greater capital-intensiveness (K/L).Morley (2000), however, did not find that capital-intensiveness had increased in the 1990s. Because theK/L ratio is lower in many tertiary activities than insecondary ones (which does not mean that there is nota high ratio in certain branches, particularly basic ser-
01020304050
Hasta 9 añ
10 a 1
1
FIGURE 5
Latin America (eight countries): Composition of newwaged jobs in tertiary activities by educational level andbranch(Simple averages)a
Totaltertiary
activities
Trade Basicservices
Financialservices
and others
Communityservices
and others
Up to 9 years
10 to 12 years
13 years and more
Low Medium High
Source: Prepared by the author.
a Simple averages for eight countries.

43C E P A L R E V I E W 7 2 • D E C E M B E R 2 0 0 0
EMPLOYMENT TRENDS IN LATIN AMERICA AND THE CARIBBEAN DURING THE 1990S • JÜRGEN WELLER
vices), the rise in the demand for well qualified staff wasnot reflected in greater capital-intensiveness. In manu-facturing industry, the trend seen so far has been for theproportion of skilled personnel to increase, although thisis largely the result of cuts in less highly skilled staff.
When the same calculation was used to break downthe decline in the share accounted for by personnel withrelatively low levels of education, i.e., up to 8 or 9 yearsof schooling, it showed the data available (table 5, partB), that this decline was also due mainly to internalchanges in the different branches. Around 80% of the4.2 percentage point drop in this group’s share of wagedemployment can be attributed to changes of this type.This shift was largely due to the changing compositionof the labour supply (withdrawal of older people withlower levels of education). Most of the fall in wageemployment among people with a low level of educa-tion as a result of changes within branches was con-centrated in tertiary activities; this would seem to bethe corollary of the improvement in the employmentstructure referred to earlier. Changes in manufacturingindustry also made a large contribution. Since in thiscase there were no net increases in the number of highlyqualified staff, it would seem that, in many countries,labour force restructuring in this sector during the pe-riod analysed mainly meant the shedding of low-skilledstaff, unaccompanied by any major process of improve-ment in the quality of jobs. This bout of employment
restructuring seems to have been part of a stage in whichcompanies relied heavily on defensive strategies, witha view to improving competitiveness without major in-vestment (Moguillansky and Bielschowsky, 2000),when generally speaking the qualification levels ofhuman resources are given only a low priority(Palomares and Mertens, 1993).
As regards changes between branches, the decline inthe wage employment share of agriculture andmanufacturing industry, two of the branches that havetraditionally employed mainly low-skilled labour, meanta loss of jobs where this group was concerned.20
Meanwhile, despite the bias towards highly qualifiedpeople in the labour demand of the tertiary sector, theexpansion of some tertiary activities created new jobs forpeople with a lower level of education as well (figure 5).
Taken all together, developments in the maintradable goods branches, which have traditionallyprovided much of the wage employment available topeople of a lower educational level, must be heldresponsible for almost half the decline in this group’sshare of wage employment (particularly because of thefall in the share of these branches in total wageemployment), while tertiary activities, which havetypically employed less labour from this group, mustbe held responsible for the other half, owing to theincrease in the level of education required of theworkforce.
20 This was not the case in another branch that is a traditional em-ployer of this stratum of the workforce, the construction industry.21 See, for example, Robbins (1996) and Lora and Olivera (1998).
IVTendencies towards heterogeneity
and insecurity of employment
The reforms were expected to make labour marketsmore homogeneous by reducing wage differentials be-tween workers with different education levels, improv-ing the relative position of small enterprises andmicroenterprises and boosting formal employment.
1. Wage differences by education level
Since labour demand has been shown to have a biastowards more highly qualified personnel, it is not sur-prising that the data confirm the findings reached byother authors to the effect that wage differentials in most
of the countries have recently widened.21 In six out ofeight countries studied, the difference between the av-erage wage and the pay received by working peoplewith some university education increased to a greateror lesser degree, while the gap between the latter andthe wages of a reference group with around eight yearsof schooling increased by even more (table 6). The onlyexceptions were Brazil and Costa Rica. This means thatdifferentiated demand for labour more than offset the
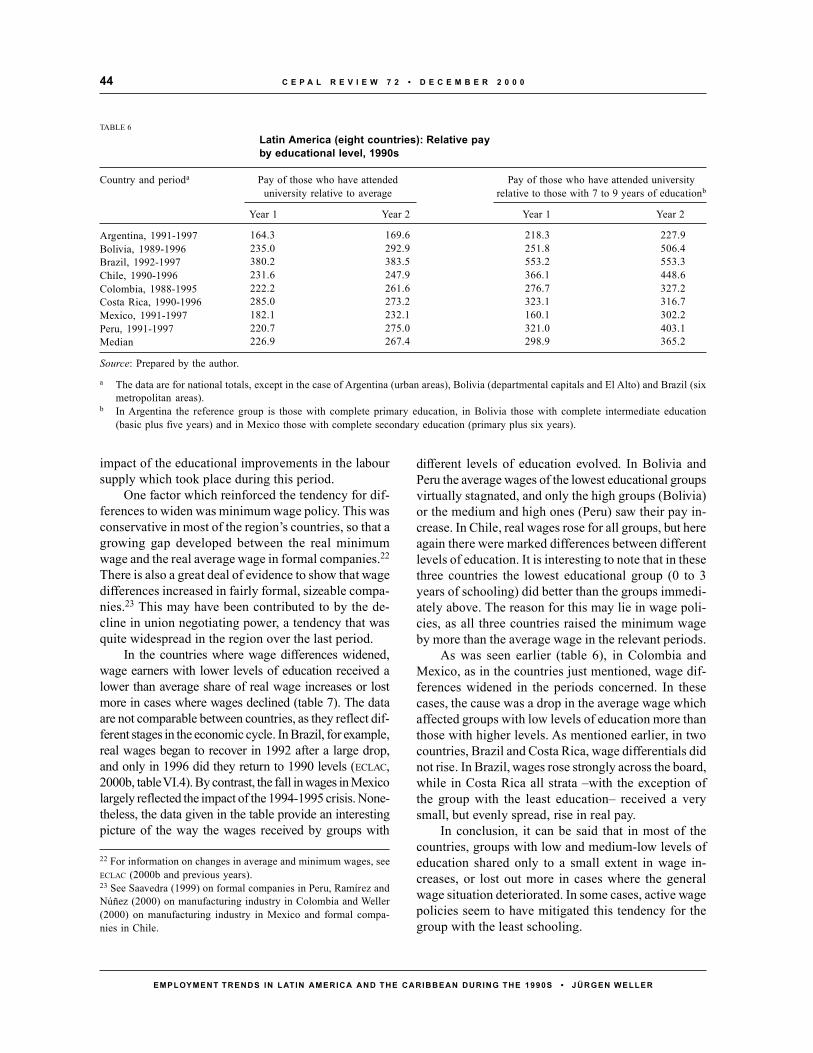
C E P A L R E V I E W 7 2 • D E C E M B E R 2 0 0 044
EMPLOYMENT TRENDS IN LATIN AMERICA AND THE CARIBBEAN DURING THE 1990S • JÜRGEN WELLER
impact of the educational improvements in the laboursupply which took place during this period.
One factor which reinforced the tendency for dif-ferences to widen was minimum wage policy. This wasconservative in most of the region’s countries, so that agrowing gap developed between the real minimumwage and the real average wage in formal companies.22
There is also a great deal of evidence to show that wagedifferences increased in fairly formal, sizeable compa-nies.23 This may have been contributed to by the de-cline in union negotiating power, a tendency that wasquite widespread in the region over the last period.
In the countries where wage differences widened,wage earners with lower levels of education received alower than average share of real wage increases or lostmore in cases where wages declined (table 7). The dataare not comparable between countries, as they reflect dif-ferent stages in the economic cycle. In Brazil, for example,real wages began to recover in 1992 after a large drop,and only in 1996 did they return to 1990 levels (ECLAC,2000b, table VI.4). By contrast, the fall in wages in Mexicolargely reflected the impact of the 1994-1995 crisis. None-theless, the data given in the table provide an interestingpicture of the way the wages received by groups with
different levels of education evolved. In Bolivia andPeru the average wages of the lowest educational groupsvirtually stagnated, and only the high groups (Bolivia)or the medium and high ones (Peru) saw their pay in-crease. In Chile, real wages rose for all groups, but hereagain there were marked differences between differentlevels of education. It is interesting to note that in thesethree countries the lowest educational group (0 to 3years of schooling) did better than the groups immedi-ately above. The reason for this may lie in wage poli-cies, as all three countries raised the minimum wageby more than the average wage in the relevant periods.
As was seen earlier (table 6), in Colombia andMexico, as in the countries just mentioned, wage dif-ferences widened in the periods concerned. In thesecases, the cause was a drop in the average wage whichaffected groups with low levels of education more thanthose with higher levels. As mentioned earlier, in twocountries, Brazil and Costa Rica, wage differentials didnot rise. In Brazil, wages rose strongly across the board,while in Costa Rica all strata –with the exception ofthe group with the least education– received a verysmall, but evenly spread, rise in real pay.
In conclusion, it can be said that in most of thecountries, groups with low and medium-low levels ofeducation shared only to a small extent in wage in-creases, or lost out more in cases where the generalwage situation deteriorated. In some cases, active wagepolicies seem to have mitigated this tendency for thegroup with the least schooling.
TABLE 6
Latin America (eight countries): Relative payby educational level, 1990s
Country and perioda Pay of those who have attended Pay of those who have attended universityuniversity relative to average relative to those with 7 to 9 years of educationb
Year 1 Year 2 Year 1 Year 2
Argentina, 1991-1997Bolivia, 1989-1996Brazil, 1992-1997Chile, 1990-1996Colombia, 1988-1995Costa Rica, 1990-1996Mexico, 1991-1997Peru, 1991-1997Median
Source: Prepared by the author.
a The data are for national totals, except in the case of Argentina (urban areas), Bolivia (departmental capitals and El Alto) and Brazil (sixmetropolitan areas).
b In Argentina the reference group is those with complete primary education, in Bolivia those with complete intermediate education(basic plus five years) and in Mexico those with complete secondary education (primary plus six years).
164.3 169.6 218.3 227.9235.0 292.9 251.8 506.4380.2 383.5 553.2 553.3231.6 247.9 366.1 448.6222.2 261.6 276.7 327.2285.0 273.2 323.1 316.7182.1 232.1 160.1 302.2220.7 275.0 321.0 403.1226.9 267.4 298.9 365.2
22 For information on changes in average and minimum wages, seeECLAC (2000b and previous years).23 See Saavedra (1999) on formal companies in Peru, Ramírez andNúñez (2000) on manufacturing industry in Colombia and Weller(2000) on manufacturing industry in Mexico and formal compa-nies in Chile.
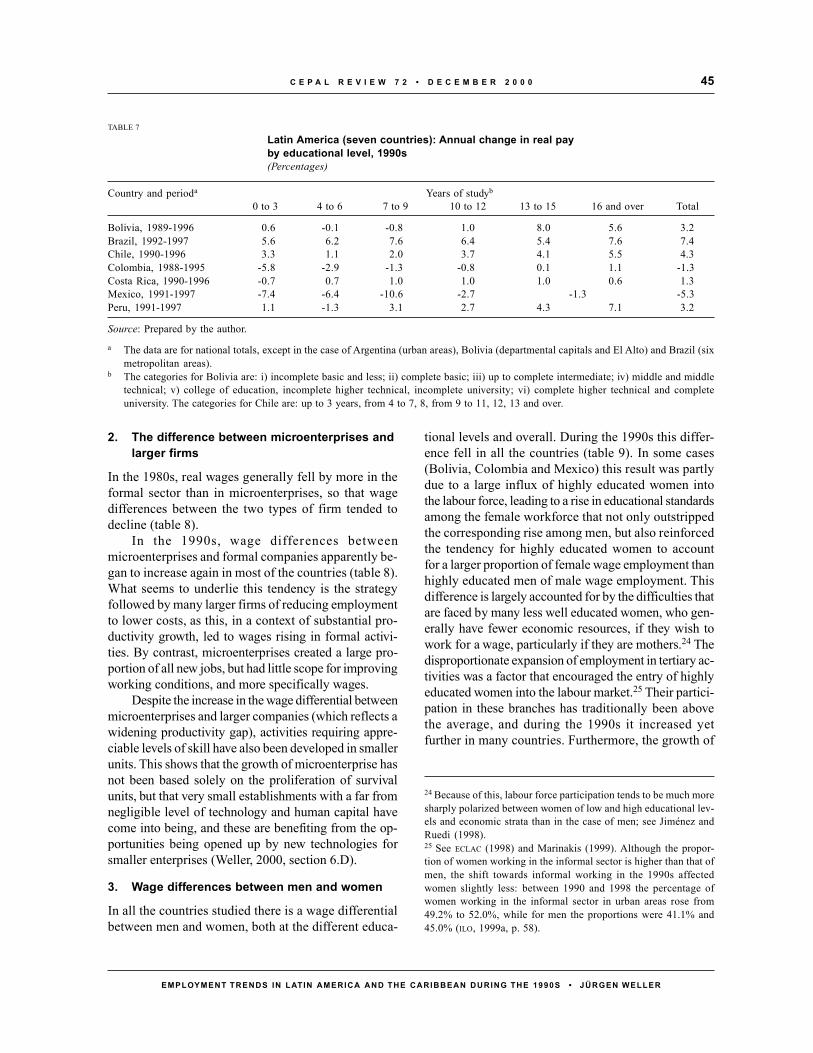
45C E P A L R E V I E W 7 2 • D E C E M B E R 2 0 0 0
EMPLOYMENT TRENDS IN LATIN AMERICA AND THE CARIBBEAN DURING THE 1990S • JÜRGEN WELLER
2. The difference between microenterprises andlarger firms
In the 1980s, real wages generally fell by more in theformal sector than in microenterprises, so that wagedifferences between the two types of firm tended todecline (table 8).
In the 1990s, wage differences betweenmicroenterprises and formal companies apparently be-gan to increase again in most of the countries (table 8).What seems to underlie this tendency is the strategyfollowed by many larger firms of reducing employmentto lower costs, as this, in a context of substantial pro-ductivity growth, led to wages rising in formal activi-ties. By contrast, microenterprises created a large pro-portion of all new jobs, but had little scope for improvingworking conditions, and more specifically wages.
Despite the increase in the wage differential betweenmicroenterprises and larger companies (which reflects awidening productivity gap), activities requiring appre-ciable levels of skill have also been developed in smallerunits. This shows that the growth of microenterprise hasnot been based solely on the proliferation of survivalunits, but that very small establishments with a far fromnegligible level of technology and human capital havecome into being, and these are benefiting from the op-portunities being opened up by new technologies forsmaller enterprises (Weller, 2000, section 6.D).
3. Wage differences between men and women
In all the countries studied there is a wage differentialbetween men and women, both at the different educa-
tional levels and overall. During the 1990s this differ-ence fell in all the countries (table 9). In some cases(Bolivia, Colombia and Mexico) this result was partlydue to a large influx of highly educated women intothe labour force, leading to a rise in educational standardsamong the female workforce that not only outstrippedthe corresponding rise among men, but also reinforcedthe tendency for highly educated women to accountfor a larger proportion of female wage employment thanhighly educated men of male wage employment. Thisdifference is largely accounted for by the difficulties thatare faced by many less well educated women, who gen-erally have fewer economic resources, if they wish towork for a wage, particularly if they are mothers.24 Thedisproportionate expansion of employment in tertiary ac-tivities was a factor that encouraged the entry of highlyeducated women into the labour market.25 Their partici-pation in these branches has traditionally been abovethe average, and during the 1990s it increased yetfurther in many countries. Furthermore, the growth of
TABLE 7
Latin America (seven countries): Annual change in real payby educational level, 1990s(Percentages)
Country and perioda Years of studyb
0 to 3 4 to 6 7 to 9 10 to 12 13 to 15 16 and over Total
Bolivia, 1989-1996Brazil, 1992-1997Chile, 1990-1996Colombia, 1988-1995Costa Rica, 1990-1996Mexico, 1991-1997Peru, 1991-1997
Source: Prepared by the author.
a The data are for national totals, except in the case of Argentina (urban areas), Bolivia (departmental capitals and El Alto) and Brazil (sixmetropolitan areas).
b The categories for Bolivia are: i) incomplete basic and less; ii) complete basic; iii) up to complete intermediate; iv) middle and middletechnical; v) college of education, incomplete higher technical, incomplete university; vi) complete higher technical and completeuniversity. The categories for Chile are: up to 3 years, from 4 to 7, 8, from 9 to 11, 12, 13 and over.
0.6 -0.1 -0.8 1.0 8.0 5.6 3.25.6 6.2 7.6 6.4 5.4 7.6 7.43.3 1.1 2.0 3.7 4.1 5.5 4.3
-5.8 -2.9 -1.3 -0.8 0.1 1.1 -1.3-0.7 0.7 1.0 1.0 1.0 0.6 1.3-7.4 -6.4 -10.6 -2.7 -1.3 -5.31.1 -1.3 3.1 2.7 4.3 7.1 3.2
24 Because of this, labour force participation tends to be much moresharply polarized between women of low and high educational lev-els and economic strata than in the case of men; see Jiménez andRuedi (1998).25 See ECLAC (1998) and Marinakis (1999). Although the propor-tion of women working in the informal sector is higher than that ofmen, the shift towards informal working in the 1990s affectedwomen slightly less: between 1990 and 1998 the percentage ofwomen working in the informal sector in urban areas rose from49.2% to 52.0%, while for men the proportions were 41.1% and45.0% (ILO, 1999a, p. 58).
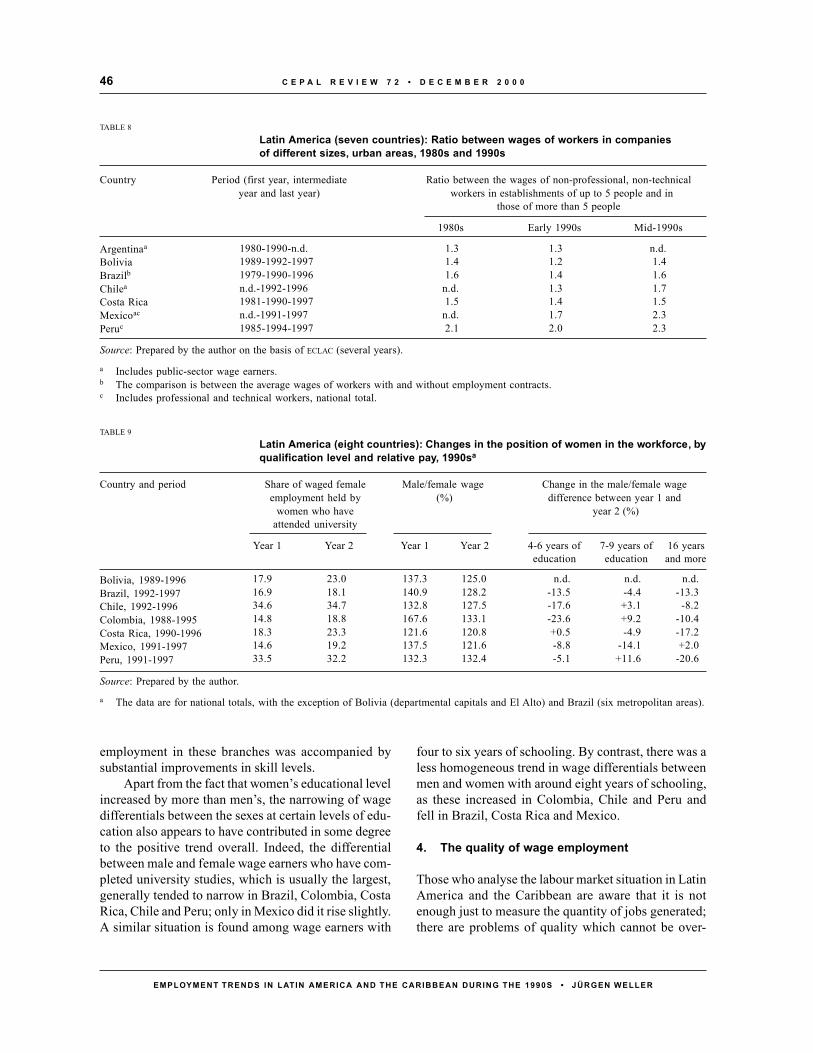
C E P A L R E V I E W 7 2 • D E C E M B E R 2 0 0 046
EMPLOYMENT TRENDS IN LATIN AMERICA AND THE CARIBBEAN DURING THE 1990S • JÜRGEN WELLER
1980-1990-n.d. 1.3 1.3 n.d.1989-1992-1997 1.4 1.2 1.41979-1990-1996 1.6 1.4 1.6n.d.-1992-1996 n.d. 1.3 1.71981-1990-1997 1.5 1.4 1.5n.d.-1991-1997 n.d. 1.7 2.31985-1994-1997 2.1 2.0 2.3
TABLE 8
Latin America (seven countries): Ratio between wages of workers in companiesof different sizes, urban areas, 1980s and 1990s
Country Period (first year, intermediate Ratio between the wages of non-professional, non-technicalyear and last year) workers in establishments of up to 5 people and in
those of more than 5 people
1980s Early 1990s Mid-1990s
Argentinaa
BoliviaBrazilbChilea
Costa RicaMexicoac
Peruc
Source: Prepared by the author on the basis of ECLAC (several years).
a Includes public-sector wage earners.b The comparison is between the average wages of workers with and without employment contracts.c Includes professional and technical workers, national total.
employment in these branches was accompanied bysubstantial improvements in skill levels.
Apart from the fact that women’s educational levelincreased by more than men’s, the narrowing of wagedifferentials between the sexes at certain levels of edu-cation also appears to have contributed in some degreeto the positive trend overall. Indeed, the differentialbetween male and female wage earners who have com-pleted university studies, which is usually the largest,generally tended to narrow in Brazil, Colombia, CostaRica, Chile and Peru; only in Mexico did it rise slightly.A similar situation is found among wage earners with
four to six years of schooling. By contrast, there was aless homogeneous trend in wage differentials betweenmen and women with around eight years of schooling,as these increased in Colombia, Chile and Peru andfell in Brazil, Costa Rica and Mexico.
4. The quality of wage employment
Those who analyse the labour market situation in LatinAmerica and the Caribbean are aware that it is notenough just to measure the quantity of jobs generated;there are problems of quality which cannot be over-
17.9 23.0 137.3 125.0 n.d. n.d. n.d.16.9 18.1 140.9 128.2 -13.5 -4.4 -13.334.6 34.7 132.8 127.5 -17.6 +3.1 -8.214.8 18.8 167.6 133.1 -23.6 +9.2 -10.418.3 23.3 121.6 120.8 +0.5 -4.9 -17.214.6 19.2 137.5 121.6 -8.8 -14.1 +2.033.5 32.2 132.3 132.4 -5.1 +11.6 -20.6
TABLE 9Latin America (eight countries): Changes in the position of women in the workforce, byqualification level and relative pay, 1990sa
Country and period Share of waged female Male/female wage Change in the male/female wageemployment held by (%) difference between year 1 and
women who have year 2 (%)attended university
Year 1 Year 2 Year 1 Year 2 4-6 years of 7-9 years of 16 yearseducation education and more
Bolivia, 1989-1996Brazil, 1992-1997Chile, 1992-1996Colombia, 1988-1995Costa Rica, 1990-1996Mexico, 1991-1997Peru, 1991-1997
Source: Prepared by the author.
a The data are for national totals, with the exception of Bolivia (departmental capitals and El Alto) and Brazil (six metropolitan areas).

47C E P A L R E V I E W 7 2 • D E C E M B E R 2 0 0 0
EMPLOYMENT TRENDS IN LATIN AMERICA AND THE CARIBBEAN DURING THE 1990S • JÜRGEN WELLER
looked. These arise partly because many jobs are createdin response to the pressure of labour supply, whichforces many economically active people to accept poorworking conditions as long as they can obtain an income.Other problems derive from the characteristics ofdemand (low levels of technology entailing low pro-ductivity) and the institutional conditions obtaining inthe labour market (low levels of social protection ornon-compliance with regulations).
Although surveys dealing with changes in thelabour market do not all use the same indicators, theinformation available would seem to indicate a downwardtrend in quality, in terms of job stability and socialsecurity (table 10).26 In a number of countries (Argen-tina, Bolivia, Brazil, Chile, Colombia) there was a fallin the number of indefinite contracts or even of wageemployment with contracts; in others (Mexico, Peru)social security coverage is found to have declined.27
The deterioration in the average quality of wage em-ployment affected both men and women, so that thedifferences in employment quality between the twosexes were maintained. This deterioration was partlydue to the introduction of greater flexibility into theinstitutional arrangements governing the labour mar-ket, the aim of which was to cope with the new marketconditions (Weller, 2000, chapter 7).
VConclusions and outlook
26 For a detailed conceptual and empirical analysis of employ-ment quality, see Infante (1999), and for trends in different em-ployment quality indicators, see ECLAC (2000b, statistical annex);regarding social security affiliation, see ILO (1999a, pp. 63 ff.).27 See also Tokman and Martínez (eds.) (1999).
TABLE 10
Latin America (eight countries): Indicators of wagedemployment quality, 1990s
Country and periodsa Indicator Year 1 Year 2
Argentina, 1991-1997 Registered- men- women
Bolivia, 1989-1996 Permanent contract- men- women
Brazil, 1992-1997 With carteira- men- women
Chile, 1990-1996 With contract- men- women
Colombia, 1991-1997b Permanent workCosta Rica, 1990-1996c High quality
- men- women
Mexico, 1990-1997 With benefitsPeru, 1991-1997d With social security
- men- women
Source: Prepared by the author.
a The data are for national totals, with the exception of Argentina(urban areas), Bolivia (departmental capitals and El Alto),Brazil (six metropolitan areas) and Colombia (seven metropolitanareas).
b Total of those in work.c Employment quality in Costa Rica was measured using an indi-
cator that took into account compliance with the minimum wagelaw, social security affiliation and employment stability (seeMontiel, 1999).
d Only private-sector wage earners.
63.2 58.868.8 62.755.7 53.178.8 76.776.0 74.486.5 81.768.8 64.771.5 67.064.5 62.982.0 76.182.4 77.581.0 73.481.8 78.955.6 42.656.0 46.554.7 34.379.5 75.351.2 26.952.0 26.749.4 27.4
The labour problems of the 1990s were due not to job-less growth but to weak economic growth compoundedby reduced labour-intensiveness, mainly owing totransformations in tradable goods-producing activities.The demand for labour was thus restrained, while pres-sure from the supply side generated a high proportionof non-wage employment. This was not enough tomake up for the shortage of new wage employment,so unemployment followed a rising trend to the pointwhere, by the end of the decade, it had reached levelseven higher than those seen during the debt crisis of
the 1980s. The effects of the economic reforms werecontradictory and unexpected: while they stimulatedgrowth, and thus the demand for labour, they reducedlabour-intensiveness.
Nor were expectations about sectoral developmentsin the quantity and characteristics of employment met.Modernization of production methods in companies inmany branches, and sectoral restructuring that gavegreater weight to tertiary activities, contributed to greatersegmentation of the labour market on the basis of edu-cational level, with the demand for labour showing a

C E P A L R E V I E W 7 2 • D E C E M B E R 2 0 0 048
EMPLOYMENT TRENDS IN LATIN AMERICA AND THE CARIBBEAN DURING THE 1990S • JÜRGEN WELLER
clear preference for people with medium and high lev-els of education. As a result, people with less formalschooling had less access to wage employment and thewage difference between skilled and unskilled work-ers grew. The gap between microenterprises and big-ger firms also increased and, as employment conditionsbecame more flexible, employment quality indicatorstended to worsen. All these tendencies went against theexpectations vested in the reforms. The only exceptionto the trend towards polarization seen in the region’slabour markets was the narrowing of the wage gap be-tween men and women.
Sectoral restructuring of employment helpedtrigger a movement towards greater heterogeneity inthe labour market. On the one hand, strong job creationtook place at the top and bottom of the labour marketsimultaneously: while educational expectationsincreased and the demand for highly qualified staffgrew, most new employment was actually created inlower-quality segments (informal sector). At the sametime, the differences in average labour productivity andwages between microenterprises and larger firmsincreased, which seems to suggest that the gap betweenthe formal and informal sectors is growing. Meanwhile,within the formal sector itself (medium-sized and largeenterprises), working conditions can be seen to havebecome more heterogeneous, in terms both of earnings(increase in wage differences between staff with differentqualification levels) and employment conditions(emergence of a divide between stable cores of workersand workers whose employment is unstable, with lesssecure types of contract and lower social protection).Lastly, differences have increased within themicroenterprise and own-account sectors, as there is asegment of these where the employment structure isalso tending to improve.
What is the outlook for labour demand and jobcreation at the sectoral level? The performance of theagricultural sector during the 1990s, and internationalexperience, do not give grounds for thinking that thenet negative balance of job creation is something tem-porary. Although new agricultural jobs will be createdas crops are diversified and certain activities expanded,the characteristics of factor utilization in many dynamicactivities, and the moderate growth of these, mean thatthere will not be many of them. Most importantly, inthe majority of the region’s countries much of the ruraland agricultural population belongs to the poorest strata,and a great many agricultural workers can be placed inthe categories of visible underemployment (seasonalwork) or invisible underemployment. This means that
the forces driving labour out of agriculture (particu-larly young people) and into non-agricultural activi-ties are still operating; indeed, this is a worldwide trendof long standing. In most of the countries, any reversalof this trend, i.e. any increase in net agricultural em-ployment, would be rather a manifestation of the weak-ness of non-agricultural sectors and the factors thatmake them attractive to labour than a reflection of anyrise in productive employment opportunities in the ag-ricultural sector. Progress in overcoming the problemstypically affecting small-scale farming, both in actualagricultural production and in the conditions underwhich this is undertaken, would raise labour produc-tivity and incomes rather than direct employment inthe sector. Owing to the many linkages that would comeinto play, however, a transformation of this kind in theagricultural sector would have a positive effect on ru-ral employment in other sectors.
As regards the prospects for manufacturing em-ployment, there are grounds for hoping that in futurethe sector will not be characterized by jobless growth.It would seem that with the completion of the restruc-turing phase, during which many companies shut downwhile others concentrated on defensive, labour-reduc-ing measures, many countries have left the severest andmost immediate of the negative effects behind them.Improvements in productivity and competitiveness meanthat many companies will be able to compete more suc-cessfully in domestic and external markets. Thus, pro-vided the macroeconomic problems can be solved,sectoral production should be able to grow at reason-able rates, with favourable effects on employment. Thisis true both for the biggest firms and for small and me-dium-sized ones, which are generally more labour-in-tensive and prosper during periods of expansion.
On the other hand, global competition and the trendtowards greater use of labour-saving technologies meanthat the sector cannot return to being the engine of jobcreation that it was up until the 1970s. Competition,increasingly on a world scale, is limiting the prospectsfor growth in labour-intensive areas, while in others itwill put steady pressure on companies to choose “firstbest” solutions that increasingly reduce the scope foradopting other combinations of factors. This being thecase, the job creation rate of the sector will be moder-ate, and across the region its share of employment willcontinue to decline.28 This process will be slower in
28 This would be consistent with developments in the industrial-ized countries, and also in the East Asian “tigers”; see Rowthornand Ramaswamy (1997).
49C E P A L R E V I E W 7 2 • D E C E M B E R 2 0 0 0
EMPLOYMENT TRENDS IN LATIN AMERICA AND THE CARIBBEAN DURING THE 1990S • JÜRGEN WELLER
the region northern countries because of the opportu-nities for industrial employment and investment flow-ing from increasing integration with the North Ameri-can markets.
Given this background, it seems clear that in thefuture too the great bulk of new jobs will have to comefrom tertiary activities. The relative expansion of bothoutput and employment in this sector is a long-termglobal trend. The issue here is not just that the primaryand secondary sectors are generating few jobs, but thattertiary activities seem to be called upon to play a newrole in the economic structure. Furthermore, the com-petitiveness of the sectors that have been the traditionalproducers of tradable goods is also coming to dependmore and more on efficient integration with services ofmany kinds, such as technological research and devel-opment, financial and marketing systems and after-salesservices. Other areas that are important to systemiccompetitiveness, albeit indirectly, and that are tendingto expand and generate good-quality employment on asubstantial scale, are education and health care. If thesocio-economic structure as a whole is to be modern-ized, the tertiary sector needs to play a more prominentrole, particularly in the field of knowledge, and to gen-erate the appropriate employment for people with me-dium and high qualifications. However, the transfor-mations now under way may also generate largenumbers of tertiary jobs for people with intermediateand low levels of education, particularly in communityand personal services, trade and the hotel industry, andcertain business services (cleaning, catering, transport,waste treatment, etc.).
The transformations now going on complicateanalysis of sectoral developments in employment, sincemany of the measuring instruments traditionally usedare no longer so effective in capturing their effects. Insectoral analysis, the distinction between the primary,secondary and tertiary sectors is becoming increasinglyblurred, and this is weakening labour market researchbased on the surveys commonly used. Changes to theproduction structure of economies and the organiza-tion of companies are having corresponding effects onthe structure of employment. In many manufacturingcompanies, for example, we are seeing a rise in theproportion of jobs that are not directly linked with pro-duction, such as research, internal services and cus-tomer services. By contrast, the tendency for certainactivities to be outsourced may lead to a statistical re-duction in employee numbers and affect average labourproductivity in companies that do this, even if therehas been no transformation in production processes.
These processes do not just affect the measurementof employment and productivity by branches of activ-ity; they also influence other labour measurement andanalysis variables such as company size and occupa-tional category. For example, subcontracting of indi-viduals or services may transform the composition ofoccupational categories by turning the wage earners ofbig companies into wage earners in small or medium-sized enterprises, or into own-account workers.
In the same way, the breakdown and recompositionof production processes is leading to a production–and labour– structure that is much more heterogeneousthan the old one. Specifically, the effects on job cre-ation and employment characteristics of replacing ver-tically organized production processes in large compa-nies with networks or chains that have multiple linksto local and, increasingly, foreign suppliers of inputsof every kind (goods and services) are little understoodin terms of their extent and characteristics, but are cer-tainly far-reaching.
While the tendencies referred to are changing theoutlook for the sectoral composition of employment infuture, economic growth is the main factor underlyingthe level of demand for labour, and thus the relativeweight of the different sectors of the labour market thatare driven by demand and by supply. When economicgrowth is inadequate, a high percentage of tertiaryemployment is concentrated in informal occupations.Thus, any policy that aims to improve the labour mar-ket has to concern itself with the level and stability ofthis growth. Meanwhile, long-term labour market prob-lems and the tendency for labour-intensiveness to fallmean there is a need to design instruments that can fos-ter competitive production and the creation of produc-tive employment simultaneously over the mediumterm.29
The tendency for wage differences to increase islikely to weaken gradually in future as the supply oflabour grows in those occupations where it is currentlyoutstripped by demand. Considering, though, that thenew production norms require more intensive use oftechnology and human capital than the Taylorist sys-tem that has operated since the early post-war years,and that the demand for low-skilled labour would ap-pear to be limited, there are no grounds for expectinglarge reductions in wage differences in the near future.Other important aspects are the forces at work in the
29 See Altenburg, Qualmann and Weller (1999) for a discussion ofmeasures to foster productive employment in different areas of pro-duction, along with complementary policies.
C E P A L R E V I E W 7 2 • D E C E M B E R 2 0 0 050
EMPLOYMENT TRENDS IN LATIN AMERICA AND THE CARIBBEAN DURING THE 1990S • JÜRGEN WELLER
institutional sphere of the labour market, including thefuture role of unions, which generally have an equaliz-ing effect on the wage structure, and minimum wage
policies, which have been conservative in most of thecountries, but in others have raised the wage floor forless educated workers.
Bibliography
Altenburg, T., R. Qualmann and J. Weller (1999):Wirtschaftliche Modernisierung und Beschäftigung inLateinamerika. Zielkonflikte und Lösungsansätze, Ber-lin, Deutsches Institut für Entwicklungspolitik.
Berman, E., J. Bound and Z. Griliches (1994): Changes inthe demand for skilled labor within U.S. manfacturing:Evidence from the annual survey of manufactures, TheQuarterly Journal of Economics, vol. CIX, issue 2,No. 436, Cambridge, Massachusetts, Harvard University.
Duryea, S. and M. Szèkely (1998): Labor markets in LatinAmerica: A supply-side story, paper presented at theseminar Employment in Latin America: What is theProblem and How to Address It?, Cartagena de Indias,Inter-American Development Bank (IDB), 15 March.
ECLAC (Economic Commission for Latin America and theCaribbean)/CELADE (Latin American Demographic Cen-tre) (1999): Latin America: Urban and Rural Popula-tion. Projections 1970-2025, Demographic bulletin, year32, No. 63, Santiago, Chile.
ECLAC (several years): Social Panorama of Latin America,Santiago, Chile.
(1997): The Equity Gap. Latin America, the Carib-bean and the Social Summit, LC/G.1954/Rev.1-P,Santiago, Chile. United Nations publication, SalesNo. E.97.II.G.11.
(1998): Social Panorama of Latin America, 1997,LC/G.1982-P, Santiago, Chile.
(2000a): Social Panorama of Latin America, 1999-2000, LC/G.2068-P, Santiago, Chile.
(2000b): Economic Survey of Latin America and theCaribbean, 1999-2000, Santiago, Chile.
IDB (1997): Economic and Social Progress in Latin America.1997 Report, Washington, D.C.
ILO (International Labour Organization) (1998a): Yearbookof Labour Statistics, Geneva.
(1998b): Panorama laboral ’98, Lima.(1999a): Panorama laboral ’99, Lima.(1999b): Trabajo decente y protección para todos.
Prioridad de las Américas, memoria del Director Gen-eral, XIV Reunión Regional Americana, Lima, 24-27August.
Infante, R. (ed.) (1999): La calidad del empleo. Laexperiencia de los países latinoamericanos y de losEstados Unidos, Santiago, Chile, ILO.
Jiménez, L.F. and N. Ruedi (1998): Determinantes de ladesigualdad entre los hogares urbanos, Revista de laCEPAL, No. 66, LC/G.2049-P, Santiago, Chile, ECLAC.
Katz, J. M. (2000): Reformas estructurales, productividad yconducta tecnológica en América Latina, Santiago,Chile, ECLAC.
Lora, E. and M. Olivera (1998): Macro policy and employ-
ment problems in Latin America, paper presented at theseminar Employment in Latin America: What is theProblem and How to Address It?, Cartagena de Indias,IDB, 15 March.
Marinakis, A.E. (1999): Género, pobreza y empleo en lospaíses del Cono Sur: interrelaciones y estado desituación, Santiago, Chile, ILO, Multidisciplinary Tech-nical Team.
Moguillansky, G. and R. Bielschowsky (2000): Las reformaseconómicas y la inversión en América Latina: unenfoque sectorial, Santiago, Chile, ECLAC.
Montiel Masís, N. (1999): Costa Rica: reformas económicas,sectores dinámicos y calidad de los empleos, serieReformas económicas series, No. 26, Santiago, Chile,ECLAC.
Morley, S.A. (2000): The Income Distribution Problem inLatin America, Washington, D.C., The BrookingsInstitution.
Morley, S.A., R. Machado and S. Pettinato (1999): Indexesof Structural Reform in Latin America, Reformaseconómicas series, No. 12, Santiago, Chile, ECLAC.
Palomares, L. and L. Mertens (1993): Cambios en la gestión yactitud empresarial en América Latina. Un marco deanálisis, Revista de economía y trabajo, year 1, No. 2,Santiago, Chile, Programa de Economía del Trabajo (PET).
Porter, M.E. (1990): The Competitive Advantage of Nations,New York, The Free Press.
PREALC (Regional Employment Programme for LatinAmerica and the Caribbean) (1991): Empleo y equidad:el desafío de los 90, Santiago, Chile.
Psacharopoulos, G. and Y.C. Ng (1992): Earnings and Edu-cation in Latin America, Assessing Priorities for School-ing Investments, The World Bank, Policy ResearchWorking Papers, No. 1056, Washingon, D.C., WorldBank.
Ramírez, J.M. and L. Núñez (2000): Reformas, crecimiento,progreso técnico y empleo en Colombia, Reformaseconómicas series, No. 59, Santiago, Chile, ECLAC.
Robbins, D.J. (1994): Relative wage structure in Chile, 1957-1992: Changes in the structure of demand for schooling,Estudios de economía, vol. 21, special issue, Santiago,Chile, University of Chile, Department of Economics.
(1996): Evidence on Trade and Wages in the Devel-oping World, Technical papers, No. 119, Paris, OECDDevelopment Centre.
Rowthorn, R. and R. Ramaswamy (1997): Deindustrialization:It’s Causes and Implications, Economic issues,No. 10, Washington, D.C., International Monetary Fund(IMF).
Saavedra Chanduví, J. (1999): La dinámica del mercado detrabajo en el Perú antes y después de las reformas
51C E P A L R E V I E W 7 2 • D E C E M B E R 2 0 0 0
EMPLOYMENT TRENDS IN LATIN AMERICA AND THE CARIBBEAN DURING THE 1990S • JÜRGEN WELLER
estructurales, Reformas económicas series, No. 27,Santiago, Chile, ECLAC.
Stallings, B. and W. Peres (2000): Growth, Employ-ment, and Equity. The Impact of the Economic Reformsin Latin America and the Caribbean, Santiago, Chile,ECLAC/Fondo de Cultura Económica (FCE).
Thomas, J. (1997): El nuevo modelo económico y losmercados laborales en América Latina, V. Bulmer-Tho-mas (comp.), El nuevo modelo económico en AméricaLatina. Su efecto en la distribución del ingreso y lapobreza, Mexico City, FCE.
Tokman, V. E. and D. Martínez (eds.) (1999): Flexibilizaciónen el margen: La reforma del contrato de trabajo,Geneva, ILO.
Weeks, J. (1999): Salarios, empleo y derechos de lostrabajadores en América Latina entre 1970 y 1998,Revista internacional del trabajo, vol. 118, No. 2,Geneva, International Labour Organization (ILO).
Weller, J. (2000): Reformas económicas, crecimiento yempleo: los mercados de trabajo en América Latina,Santiago, Chile, ECLAC/FCE.
Wood, A. (1997): Openness and wage inequality in develop-ing countries: The Latin American challenge to EastAsian conventional wisdom, The World Bank EconomicReview, vol. 11, No. 1, Washington, D.C., World Bank.

C E P A L R E V I E W 7 2 • D E C E M B E R 2 0 0 052
EMPLOYMENT TRENDS IN LATIN AMERICA AND THE CARIBBEAN DURING THE 1990S • JÜRGEN WELLER

53C E P A L R E V I E W 7 2 • D E C E M B E R 2 0 0 0
THE LABOUR MARKET AND INCOME DISTRIBUTION IN COLOMBIA IN THE 1990S • JOSE ANTONIO OCAMPO, FABIO SANCHEZAND CAMILO ERNESTO TOVAR
C E P A L R E V I E W 7 2
DECEMBER 2000
The labour market andincome distribution
in Colombiain the 1990s
José Antonio Ocampo
Executive Secretary of theEconomic Commission for LatinAmerica and the Caribbean (ECLAC)[email protected]
Fabio Sánchez
Research Professor,Faculty of Economics,Universidad de los Andes, Bogotá[email protected]
Camilo Ernesto Tovar
Consultant to the ExecutiveSecretary of ECLAC
This article analyses the behaviour of the Colombian labour
market and the changes it underwent during the 1990s. It
begins by outlining the reforms carried out in that country
and summarizing macroeconomic developments and changes
in the production structure in the 1990s. Then it uses data
available from household surveys to analyse the dynamic of
the labour market by economic sector, educational level and
occupational position. After briefly describing the latest
advances in research into income distribution in Colombia,
it then shows the results of simulation exercises carried out
to determine the effects of the changes observed in labour
market conditions (sectoral structure of employment, rela-
tive wages, unemployment and labour force participation)
on income distribution and poverty, both for the country as
a whole and for the urban and rural sectors separately. The
article concludes that the ability of the economy to generate
employment has deteriorated markedly, and that this dete-
rioration has affected lower-skilled workers most of all.

C E P A L R E V I E W 7 2 • D E C E M B E R 2 0 0 054
THE LABOUR MARKET AND INCOME DISTRIBUTION IN COLOMBIA IN THE 1990S • JOSE ANTONIO OCAMPO, FABIO SANCHEZAND CAMILO ERNESTO TOVAR
IIntroduction
In terms of productive activity, in the 1990s theeconomy grew at moderate rates and was less stablethan it had been in the past, particularly as regards thebehaviour of aggregate demand, while inflation gradu-ally declined. As this process went on, those sectorsthat were more exposed to external competition weak-ened markedly and the situation in the labour marketdeteriorated as its composition changed, a process thatwas accompanied by a fall in job creation, particu-larly in those production sectors, such as agricultureand manufacturing industry, that were more open tointernational competition. This recomposition of thelabour market entailed the shedding of low-skilledjobs, and this was not fully offset by the increase inthe number of new jobs for more highly educatedworkers. This suggests that the technical changeswhich have taken place since the early 1990s havegiven greater weight to processes that are more inten-sive in better educated labour, while lessening the needfor labour of every educational level. The changes inthe labour market have had adverse effects on incomedistribution in urban areas, and in the country as awhole these have outweighed the beneficial effectsfelt in rural ones. The latter have been mainly affectedby an adverse shock in the rural-urban terms of tradeand the resultant crisis in commercial farming.
This article was prepared for the UNDP-ECLAC-IDB project“Liberalización de la balanza de pagos: efectos sobre el empleo, ladistribución, la pobreza y el crecimiento”. Section V was writtenin collaboration with Jairo Núñez. The comments made on previ-ous versions of this text by Jaime Aristy, Samuel Morley, RobertoPaes de Barros, Juan Carlos Ramírez, Lance Taylor, Rob Vos andother project participants are gratefully acknowledged, as is theassistance provided by Piedad Urdinola.
In the 1990s Colombia, like other Latin American coun-tries, was in the throes of an intense process of struc-tural reform. On the external front, this process hadelements in common with developments elsewhere inthe region (trade reform and a new openness to foreigndirect investment), but there were also points of differ-ence, particularly the continuation of active externaldebt management. This was accompanied by moderatelabour market reform and a more ambitious reform tothe social security system, the latter being part of a widermove to allow the private sector to become involved inareas traditionally reserved to the State. The indepen-dence given to the Bank of the Republic (central bank)and a series of reforms designed to increase competi-tion among financial intermediaries and improve pru-dential regulation and supervision were the most strik-ing developments in the monetary and financial field.The greatest difference between Colombia and the re-gion in general, however, was the way these economicliberalization processes were combined with substan-tial growth in the size of the public sector, the purposeof which was to increase the provision of social ser-vices. Despite a rise in public revenue that was alsosubstantial, this tendency resulted in a deterioration ofthe fiscal position, showing how difficult it has beenfor the Colombian State to reconcile economic liberal-ization with a more active social policy.
IIThe reforms
The structural reform or economic opening process, asit is known in Colombia, began at the end of Barco’sterm in office and was pursued most vigorously under
Gaviria (1990-1994). With some slight modifications,the Samper Government (1994-1998) deepened the re-forms and the current one (Pastrana, 1998-2002) iscontinuing with them. The main feature of this processwas the liberalization of external transactions, i.e., thetrade, currency and foreign direct investment (FDI)regimes. These reforms were accompanied not just byeconomic growth but also by a change in the structureof the public sector and a recasting of its functions, allpart of the profound reform of the State that followedthe approval of a new political charter in 1991. In
55C E P A L R E V I E W 7 2 • D E C E M B E R 2 0 0 0
THE LABOUR MARKET AND INCOME DISTRIBUTION IN COLOMBIA IN THE 1990S • JOSE ANTONIO OCAMPO, FABIO SANCHEZAND CAMILO ERNESTO TOVAR
addition to these developments, mention should bemade of the 1990 reform that brought a degree offlexibility to the labour market and a more ambitiousreform to the social security system that took place in1993 (Ocampo, 1998).
1. Liberalization of external transactions
Trade liberalization has had two basic components: thefreeing up of imports and the signing of a wide rangeof integration and free trade agreements. Both the tar-iff reduction programme put into effect by the BarcoGovernment in February 1990 and the more ambitiousone announced a few months later by the Gaviria Gov-ernment proposed a gradual reduction in tariffs (overfive and three years, respectively) following rapid dis-mantling of quantitative restrictions on imports. How-ever, a series of macroeconomic complications led theauthorities to speed up the tariff reduction process,which culminated in August 1991. In this period of ayear and a half direct controls on imports were virtu-ally done away with, the average tariff was reducedfrom 44% to 12% and export incentives were cut from19% in 1990 to 6% in 1993. To mitigate the effects offluctuations in international prices, a price band sys-tem (variable tariffs) was adopted for agriculture. Inconjunction with this, safeguard and unfair competi-tion rules were designed, and generally moderate usewas made of these over the following years.
The increased vigour of the trade integration pro-cess, meanwhile, was the result of decisions taken in1989, when the presidents of the Andean Group (whichsubsequently became the Andean Community) agreedto revitalize, deepen and reorient the subregional inte-gration process. Subsequent meetings led to an agree-ment, in 1991, to create a free trade zone, which was tocome into force in 1992. In that year, though, it wasonly possible to create a free trade area with Venezuelaand Bolivia, which Ecuador also joined a year later. Inlate 1994 a common external tariff was adopted withcertain exceptions, although in practice this applies onlyto Colombia, Venezuela and, with numerous exceptions,Ecuador. This process was complemented by the sign-ing of the free trade agreement with Chile in 1993 andMexico (the Group of Three, which also includes Ven-ezuela) in 1994, and the commencement of AndeanCommunity-Mercosur negotiations in subsequentyears, among other instances.
The main components of the capital account liber-alization process were foreign exchange reform andliberalization of inward FDI. The latter process began
in the late 1980s and was completed in 1990 and 1991,when all restrictions on inward FDI were abolished,except in the areas of security, toxic wastes and large-scale mining investments. At the same time, the rulesgoverning Colombian investment abroad were also lib-eralized. Over the following years the country beganto sign up to agreements providing mutual protectionfor foreign investment.
The foreign exchange reform of 1991, meanwhile,decentralized the handling of foreign currencytransactions by authorizing intermediaries to carry theseout without prior controls being applied by the Bankof the Republic. Nonetheless, many transactionscontinued to be regulated, and they still had to bechannelled through financial intermediaries legallyauthorized to operate in the market. Where capitaltransactions were concerned, the ultimate use of loans(investment and foreign trade operations) continued tobe strictly controlled. Only in February 1992 did itbecome permissible for the first time to take out short-term loans abroad to finance working capital. Theforeign exchange reform of September 1993 authorizedfinancial intermediaries to make foreign currency loansto domestic companies regardless of the use made ofsuch credits, at the same time replacing the oldregulatory system by one based on an obligation forforeign currency borrowers to lodge a deposit or reservewith the Bank of the Republic. The purpose of this wasto oversee the scale and composition of capital flows.1The loan period after which the reserve requirementbecame applicable and the amount of this reserve weretightened up in 1994, eased in 1996 and tightened upagain in 1997. In May of that year the countryintroduced a simpler system of controls on foreignborrowing, more similar to the one used by Chilethroughout the 1990s, making it obligatory for a depositto be lodged for all loans. The size of the tax implicit inthis capital regime was consistently higher than in theChilean system during the years of abundant foreigncapital (an average of 13.6% and 6.4% in 1994-1998for credits of 12 and 36 months, respectively).2 Duringthe crisis of the latter part of the decade the size of this
1 For a detailed analysis of regulations applying to capital flows inthe 1990s, and of the effectiveness of these, see Ocampo and Tovar(1999) and Villar and Rincón (2000).2 In the early months of 1997 there was also a short period duringwhich capital flows were taxed explicitly. This was declared unen-forceable by the Constitutional Court in view of the procedure usedto order it (the constitutional formula of the “economic emer-gency”).

C E P A L R E V I E W 7 2 • D E C E M B E R 2 0 0 056
THE LABOUR MARKET AND INCOME DISTRIBUTION IN COLOMBIA IN THE 1990S • JOSE ANTONIO OCAMPO, FABIO SANCHEZAND CAMILO ERNESTO TOVAR
deposit was gradually lowered, until the requirementwas abolished in early 2000.
2. Growth, structural change and the redefiningof State functions
The 1991 Constitution and other political decisionstaken over the course of the decade had a significantimpact on the structure of the State, and this changedthe dynamic of the public finances. As we noted in theintroduction, the way this dynamic has combined withthe structural reform process sets Colombia apart fromthe rest of Latin America. The country’s singularity liesin the fact that the process of opening up andderegulating the economy has been accompanied byan increase in the size of the State, which grew from30% of GDP in 1990 to 38% by the end of the 1990s.
The reforms that had the greatest fiscal effect werethe increase in transfers to departments and munici-palities to finance higher social investment and the wid-ening of social security coverage. It has been estimatedthat the 1991 Constitution and the laws that built on it(particularly law 60 of 1993, which put the new sys-tem of transfers into effect, and law 100 of 1993, whichcreated the new social security system) permanentlyallocated to those ends national government expendi-ture equivalent to just over 4% of GDP (Ocampo, 1997).This is the main source of the overall increase in cen-tral government spending, excluding interest. Despitepartial privatization, the social security reform likewisegave rise to a parallel increase in the benefits providedby the relevant public bodies.
Rapid spending growth was largely offset by highertax revenues, owing especially to higher central gov-ernment taxes, higher social security contributions and,to a lesser extent, municipal taxes. In fact, the changein the tax structure resulting from trade liberalization,which made the country less dependent on externalrevenue, was counterbalanced by a series of tax reforms(1990, 1992, 1995, 1997, 1998 and one currently un-der way in 2000) which have served to finance thehigher spending, albeit only in part. Since the mid-1990s the budget deficit, particularly the central gov-ernment one, has tended to increase, so that it stood at3.9% of GDP in 1998 and 5.2% of GDP in 1999 (in thelatter year it reflects the fall-off in revenue resultingfrom the recession). Taking the public sector in theaggregate, the deficit stood at 3.1% and 4.5% of GDP inthe years referred to. This higher deficit, and the con-stant need to modify the country’s tax structure, reflectthe difficulties the Colombian State has encountered in
reconciling an open economy with a more active so-cial policy.
The growth in the size of the State was accompa-nied by a marked change in its structure, the main fea-tures of which were far-reaching fiscal decentraliza-tion and the opening up to the private sector of areas ofthe economy that had traditionally been the preserveof the State. The transfer of national revenue to thedepartments and, in particular, to the municipalities,has been the fastest growing component in nationalgovernment outlays. Meanwhile, it is the spending ofthe municipalities, together with that of the social se-curity system, that has seen the highest rate of growthin the public sector as a whole. Privatization, the fran-chising of infrastructure projects and the opening up ingeneral of the infrastructure and social security sectorsto private investment are the most notable developmentson this second front. This process was accompanied bythe creation of stronger regulatory and supervisory in-stitutions in the infrastructure, social security and fi-nancial sectors. In all these fields, however, what theimplicit model chosen entails in practice is the mainte-nance of a large number of public companies and or-ganizations that complement the private sector in somefields while competing with it in others. On the finan-cial front, it should be added that in the early part ofthe decade a reform was carried out with a view toincreasing competition among different types of in-termediaries, some of the organizations that had beennationalized during the financial crisis of the early1980s were privatized and the sector was fully openedup to FDI. The 1991 Constitution, meanwhile, made theBank of the Republic fully independent for the pur-poses of monetary and exchange rate management.
3. Labour market and social security reform
The 1990 labour market reform partially freed up thelabour market while giving greater protection to unionrights. The general thrust of this reform was to put intoeffect many of the proposals made a few yearspreviously by the Employment Commission (Colombia,Contraloría General de la República, 1986). The mostimportant reforms on the first front were the provisionsthat made temporary hiring more flexible, thosefacilitating dismissal for workers with more than tenyears of service (in exchange for a higher redundancypayment, and subject in any event to the requirementthat “just cause” be shown for the dismissal), theadoption of a wage system integrating all remunerationfor higher-income workers (those earning more than
57C E P A L R E V I E W 7 2 • D E C E M B E R 2 0 0 0
THE LABOUR MARKET AND INCOME DISTRIBUTION IN COLOMBIA IN THE 1990S • JOSE ANTONIO OCAMPO, FABIO SANCHEZAND CAMILO ERNESTO TOVAR
10 times the minimum wage) and the elimination ofthe excess costs involved in the previousunemployment regime. This social benefit providedfor workers to be paid one month’s wages per year ofservice when they left the company; however, thesystem for liquidating withdrawals from the worker’saccount meant that the cost rose rapidly as years ofservice increased. The reform replaced this systemwith one that obliged new workers to pay intounemployment funds and that enabled companies tonegotiate with existing workers with a view totransferring them to the new system, subject tocompensation. Besides these changes, which weredesigned to make the labour market more flexible, itstrengthened the right to unionization andcomplemented this with legal instruments to make iteffective.
In fact, the results in terms of greater labour marketflexibility were not striking, largely owing to thecountervailing effects of the subsequent 1993 socialsecurity reform. The changes made to the legislation ontemporary contracts were undoubtedly one of the factorsthat led to the share of temporary employment in totalurban employment increasing from 15.8% to 20%between 1990 and 1997 (ILO, 1998). Nonetheless, thisincrease in flexibility and reduction of the excessive costsassociated with the old unemployment system were offsetby the growing cost of taking on new workers and bythe rise in redundancy payments. The former was a directresult of the social security reform, which raised thecontribution costs payable by the company from 13.5%to 25.5% (of which 13.5% now goes to pensions and theother 12% to health),3 increasing social costs from 47%to 59.4% of basic wages.
IIIMacroeconomic developments
The 1990s were characterized by pronounced “stop andgo” cycles in macroeconomic policy. Although thesecycles were partly driven by external shocks, both posi-tive and negative, particularly those deriving from theinternational capital market, others originated in do-mestic events.
The decade began in the midst of rising inflation-ary pressures. These were addressed by means of astrong adjustment package, brought in towards the endof 1990, which included a severe monetary contrac-tion, revaluation, a moderate fiscal adjustment (table 1)and faster implementation of the trade liberalizationprogramme. This package slowed economic growth,halted the inflationary trend and sharply improved thecurrent account of the balance of payments.
As a result of the heavy pressure placed on inter-national reserves and the growing quasifiscal costs towhich these contractionary monetary measures gaverise over the course of 1991, the Bank of the Republicdecided to speed up the revaluation process and drasti-cally cut interest rates. At the same time, rapid growthin tax revenue led to strong growth in public spending,the overall fiscal position remaining in balance. Thecombined result of these policies was a rise in internaland external borrowing which caused aggregate domes-tic demand to grow rapidly in 1992-1994, more rap-
idly in fact than at any other time in Colombia’s post-war economic history. Economic activity and produc-tive investment boomed, but against the background ofa sharp deterioration in the current account balance.The biggest exception in terms of production was agri-culture, which struggled to cope with trade liberaliza-tion right from the beginning of the decade, particu-larly as international prices, especially for coffee, werelow. Inflation was kept in check –and even declinedsomewhat further during the first part of the upturn–thanks to currency appreciation and rapid importgrowth, but there were clear signs of inflation in domes-tic asset prices (real estate and stock market assets).
Monetary policy became increasingly tight overthe course of 1994 and 1995. The strong controls onforeign borrowing adopted in 1994 also helped to slowprivate demand growth and prevented this tight mon-etary policy giving rise to a further currency apprecia-tion in real terms. Aggregate demand began to slow in1995 and, more sharply, in 1996, giving rise to a pro-nounced fall-off in production activity and halting thedeterioration in the current account of the balance of
3 See ILO (1998) and Reina and Yanovich (1998).

C E P A L R E V I E W 7 2 • D E C E M B E R 2 0 0 058
THE LABOUR MARKET AND INCOME DISTRIBUTION IN COLOMBIA IN THE 1990S • JOSE ANTONIO OCAMPO, FABIO SANCHEZAND CAMILO ERNESTO TOVAR
payments. The continuing surge in public expenditurewas the main factor underlying growth in those years.
Cuts in interest rates over the course of 1996 helpedto reactivate private demand and production activity in1997. Public spending did not contribute to this up-turn; rather, it was during those years that the first stepsbegan to be taken to curb growing expenditure by thenational Government, given the evidence of rapidgrowth in the budget deficit. Strong control of externalborrowing curbed the tendency towards appreciationof the currency that had made itself felt during 1996(this being reflected in the annual averages for 1997),but there was a further moderate deterioration in thecurrent account.
The upturn was short-lived, owing to the effects ofthe international crisis and the measures taken to dealwith it, at a time when the external accounts and the
fiscal situation were weak. The tight monetary policywhich was adopted to deal with the crisis was effectivein gradually lowering the real exchange rate through aseries of changes to the exchange rate band, reducingaggregate demand, improving the external accounts andlowering inflation, but at the cost of bringing on theworst recession in Colombian history and acceleratingthe deterioration of the financial system portfolio. Para-doxically, these fiscal austerity measures were unableto check the deteriorating trend in the budget deficit;rather, the loss of tax revenue resulting from the reces-sion, rising debt service charges and the costs involvedin the financial rescue resulted in a further deteriora-tion in the fiscal position in 1999. A highly competi-tive exchange rate and the fall in interest rates that tookplace in 1999 helped bring about a moderate recoveryin production activity in 2000.
TABLE 1
Colombia: Policy variables and overview of results
1975- 1980- 1986- 1991- 1990 1991 1992 1993 1994 1995 1996 1997 1998 19991979 1985 1990 1999
Real exchange rate (1994=100) 81.0 73.0 103.0 103.1 114.9 113.0 106.8 107.5 100.0 102.3 98.8 93.3 98.3 108.2Real interest rate
Deposit rate (90 days) 10.3 6.4 6.2 4.9 4.8 -0.4 2.5 5.5 9.3 8.2 4.8 11.8 8.8Average lending rate 14.1 14.9 12.6 12.9 8.1 10.9 14.4 18.2 17.7 13.6 20.7 17.4
Total government expenditure (% of GDP)DANE 20.3 28.1 30.1 31.7 30.4 31.0 31.1 31.3 31.3 34.1Bank of the Republic(net of transfers) 31.9 30.4 31.8 31.0 31.3 31.4 34.0Ministry of Finance 30.3 32.0 35.8 37.2 36.0
Overall budget deficit or surplus,net of privatizations (% of GDP) -1.5 -5.3 -1.5 -1.5 -0.4 0.0 -0.1 0.0 0.1 -0.4 -2.0 -3.8 -3.9 -5.2
Central Government -0.2 -3.3 -0.9 -2.2 -0.6 0.4 0.1 -0.3 -1.6 -2.6 -4.3 -4.3 -5.6 -5.9Rest of the public sector -1.3 -2.0 -0.6 0.7 0.2 -0.4 -0.3 0.3 1.7 2.3 2.3 0.5 1.7 0.6
GDP growth 5.0 2.6 4.6 2.6 4.3 2.0 4.0 5.4 5.8 5.2 2.1 3.4 0.4 -4.5Value added by tradables 4.9 1.8 5.7 0.9 5.1 2.2 0.8 2.1 1.3 5.8 -0.6 0.9 1.4 -5.5Value added by non-tradables 5.1 3.2 3.7 3.4 3.2 2.0 5.4 5.3 7.8 6.4 4.8 4.7 -1.2 -4.4
Aggregate domestic demand 4.8 2.4 3.4 8.5 2.3 0.1 10.0 12.1 12.0 5.8 1.1 4.0 -1.1 -8.3
Inflation (CPI end of period) 23.9 26.7 26.3 20.2 32.4 26.8 25.1 22.6 22.6 19.5 21.6 17.7 16.7 9.2
Exports(% of GDP at 1975 prices) 15.0 14.4 18.5 22.9 20.7 22.7 23.1 23.3 22.0 21.7 23.3 23.2 23.1 24.2
External balances(% of GDP at 1994 par exchange rate)
Trade balance 3.5 -3.1 3.9 -1.2 4.3 6.2 2.3 -2.8 -3.3 -3.3 -2.9 -3.2 -4.7 0.4Current account 1.5 -6.8 0.3 -3.1 1.2 4.9 1.7 -3.7 -5.2 -5.6 -5.6 -6.5 -6.2 -1.2
Gross fixed capital formation(% of GDP at 1975 prices) 15.6 17.1 15.5 16.7 14.0 12.9 13.9 18.0 20.7 19.8 19.1 18.1 16.0 11.8
Sources: Bank of the Republic, National Department of Statistics (DANE) and National Department of Planning (DNP).
59C E P A L R E V I E W 7 2 • D E C E M B E R 2 0 0 0
THE LABOUR MARKET AND INCOME DISTRIBUTION IN COLOMBIA IN THE 1990S • JOSE ANTONIO OCAMPO, FABIO SANCHEZAND CAMILO ERNESTO TOVAR
All in all, economic growth was slow by thehistorical standards of the country, and was much moreunstable. Average growth rates have been greatlyaffected by the severity of the recent crisis, consideringthat up until 1997 they stood at moderate levels thatwere only slightly lower than those seen in the secondhalf of the 1980s. By contrast, instability –both ingrowth and, to an even greater extent, in aggregatedemand– was one of the most striking features of thedecade as a whole, all the more so in a country whosetradition of gradualism and anticyclical economicmanagement had given it the reputation of having themost subdued economic cycles of any country in LatinAmerica. Other notable features were the high currentaccount deficit that persisted throughout most of thedecade, associated in part with the rising trend of thecurrency, and the structural deterioration in the publicfinances.
In terms of the production structure, the pattern ofeconomic growth was characterized by a rapid declinein the share of production accounted for by theagricultural and industrial sectors (table 2). This
development has been manifest since the years of stronggrowth, showing that the rapid economic expansion ofthat time was dependent on the services andconstruction sectors, i.e., on non-tradable activitiesassociated with internal demand. In fact, someagricultural activities, particularly crops with a shortcycle (cereals and oil crops) went through a severe crisisin the early years of the 1990s. This high degree ofdependence on domestic demand during the years ofgrowth was also reflected in a slowdown in the risingtrend that had been seen in the export coefficient fromthe mid-1980s to 1991 (table 1).
The crisis in certain activities that had experienceda strong upturn in the first half of the decade (construc-tion and, latterly, financial services), together with thedecline of manufacturing industry, which was particu-larly marked during the recent crisis, were the mainchanges seen in the production structure during thesecond half of the decade. Mining and a few services(transport and government services until the fiscal ad-justment programmes began) were the only sources ofgrowth, and weak ones at that, during this period.
TABLE 2
Colombia: Sectoral composition of GDP and employment(Percentages)
GDP (1975 prices) Employment
Economic sector 1985 1991 1995 1997 1999 1991 1995 1997
Agriculture 21.9 21.8 19.3 18.8 19.9 26.7 22.2 22.9Mining 2.3 4.6 4.3 4.7 5.7 1.2 0.8 0.7Manufacturing 21.2 21.4 19.0 18.6 16.9 15.0 15.7 13.2Electricity, gas and water 1.0 1.1 1.1 1.1 1.2 0.6 0.5 0.9Construction 4.4 3.0 3.7 3.7 2.6 4.5 6.1 5.3Trade 12.1 11.5 11.9 12.0 11.5 20.7 21.7 21.9Transport 9.4 8.6 8.7 9.4 9.9 5.0 5.5 5.5Financial services 14.2 14.6 16.3 17.3 16.5 3.6 4.6 5.0Other services 13.2 13.2 12.9 14.5 16.1 22.6 22.8 24.7Total 100.0 100.0 100.0 100.0 100.0 100.0 100.0 100.0
Tradables 45.4 47.8 42.6 42.1 42.5 43.0 38.7 36.8Urban 14.2 14.1 12.5Rural 28.8 24.7 24.3
Non-tradables 54.3 52.0 54.7 57.9 57.6 57.0 61.3 63.2Urban 43.9 47.0 49.4Rural 13.1 14.3 13.8
Source: DANE, National Household Survey and National Accounts.
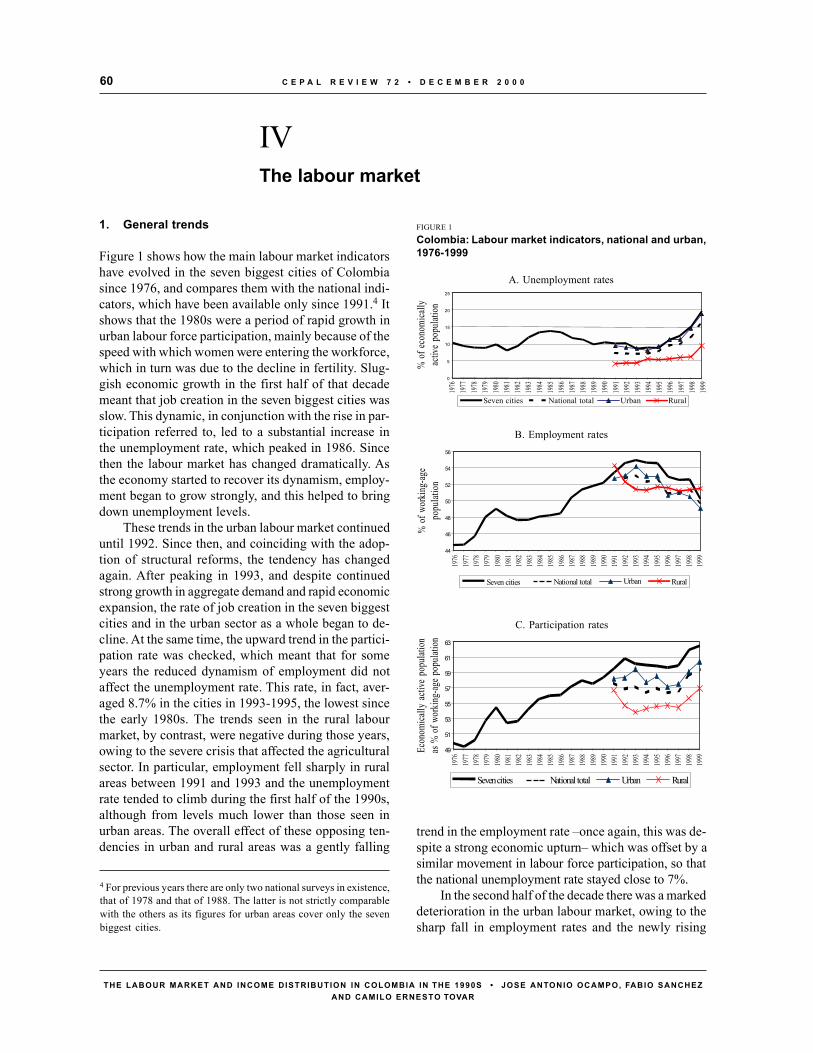
C E P A L R E V I E W 7 2 • D E C E M B E R 2 0 0 060
THE LABOUR MARKET AND INCOME DISTRIBUTION IN COLOMBIA IN THE 1990S • JOSE ANTONIO OCAMPO, FABIO SANCHEZAND CAMILO ERNESTO TOVAR
IVThe labour market
1. General trends
Figure 1 shows how the main labour market indicatorshave evolved in the seven biggest cities of Colombiasince 1976, and compares them with the national indi-cators, which have been available only since 1991.4 Itshows that the 1980s were a period of rapid growth inurban labour force participation, mainly because of thespeed with which women were entering the workforce,which in turn was due to the decline in fertility. Slug-gish economic growth in the first half of that decademeant that job creation in the seven biggest cities wasslow. This dynamic, in conjunction with the rise in par-ticipation referred to, led to a substantial increase inthe unemployment rate, which peaked in 1986. Sincethen the labour market has changed dramatically. Asthe economy started to recover its dynamism, employ-ment began to grow strongly, and this helped to bringdown unemployment levels.
These trends in the urban labour market continueduntil 1992. Since then, and coinciding with the adop-tion of structural reforms, the tendency has changedagain. After peaking in 1993, and despite continuedstrong growth in aggregate demand and rapid economicexpansion, the rate of job creation in the seven biggestcities and in the urban sector as a whole began to de-cline. At the same time, the upward trend in the partici-pation rate was checked, which meant that for someyears the reduced dynamism of employment did notaffect the unemployment rate. This rate, in fact, aver-aged 8.7% in the cities in 1993-1995, the lowest sincethe early 1980s. The trends seen in the rural labourmarket, by contrast, were negative during those years,owing to the severe crisis that affected the agriculturalsector. In particular, employment fell sharply in ruralareas between 1991 and 1993 and the unemploymentrate tended to climb during the first half of the 1990s,although from levels much lower than those seen inurban areas. The overall effect of these opposing ten-dencies in urban and rural areas was a gently falling
4 For previous years there are only two national surveys in existence,that of 1978 and that of 1988. The latter is not strictly comparablewith the others as its figures for urban areas cover only the sevenbiggest cities.
trend in the employment rate –once again, this was de-spite a strong economic upturn– which was offset by asimilar movement in labour force participation, so thatthe national unemployment rate stayed close to 7%.
In the second half of the decade there was a markeddeterioration in the urban labour market, owing to thesharp fall in employment rates and the newly rising
FIGURE 1
Colombia: Labour market indicators, national and urban,1976-1999
A. Unemployment rates
0
5
10
15
20
25
% o
f eco
nomi
cally
activ
e po
pulat
ion
Seven cities National total Urban Rural
B. Employment rates
44
46
48
50
52
54
56
Seven cities National total Urban Rural
49
51
53
55
57
59
61
63
Seven cities National total Urban Rural
% o
f wor
king-
age
popu
latio
n
C. Participation rates
Econ
omica
lly a
ctive
pop
ulatio
nas
% o
f wor
king-
age p
opula
tion
1976
1977
1978
1979
1980
1981
1982
1983
1984
1985
1986
1987
1988
1989
1990
1991
1992
1993
1994
1995
1996
1997
1998
1999
1976
1977
1978
1979
1980
1981
1982
1983
1984
1985
1986
1987
1988
1989
1990
1991
1992
1993
1994
1995
1996
1997
1998
1999
1976
1977
1978
1979
1980
1981
1982
1983
1984
1985
1986
1987
1988
1989
1990
1991
1992
1993
1994
1995
1996
1997
1998
1999
61C E P A L R E V I E W 7 2 • D E C E M B E R 2 0 0 0
THE LABOUR MARKET AND INCOME DISTRIBUTION IN COLOMBIA IN THE 1990S • JOSE ANTONIO OCAMPO, FABIO SANCHEZAND CAMILO ERNESTO TOVAR
trend in participation rates. This new dynamicmanifested itself, from 1996 onward, in the form of arapid increase in the unemployment rate, so that by 1999this stood at the highest level ever seen in the country.Although, as we shall see later, the lack of dynamismin employment cannot be attributed exclusively tointernal demand, there can be no doubt whatsoever thatin the most recent years this variable has played a decisiverole. In particular, the biggest falls in the employmentrate have coincided with periods of slowdown andrecession (1996 and 1999), and in general there has beena clear association since 1996 between the behaviour ofemployment in the biggest cities and quarterly GDPchanges (Colombia, DANE, 1999).
Overall, employment rates tended to fall through-out the decade, particularly in rural areas during theearly part of it and in urban ones during the secondhalf. In the country as a whole, the employment ratefell from 53% in the early years of the decade to justunder 50% in 1999. The renewed tendency for labourforce participation to rise meant that this led to an ex-plosion in unemployment. As we shall see, these ten-dencies were accompanied by major changes in thesectoral composition of employment.
Table 3 provides fuller details of movements inlabour market indicators for 1991 and 1997, the twoyears selected for the purpose of analysing the effectsof the reforms. As has already been noted, 1991 sawthe completion of the trade reforms and inward FDI lib-eralization and the issuing of the new political charter.In 1997, the effects of the reforms can be appreciated,but the consequences of the severe crisis affecting theColombian economy in recent years can also be identi-fied.
The indicators given in table 3 show that femaleparticipation rates are much lower than male ones. Thelabour force participation of the latest generations ofwomen has increased in urban areas, however, owingto higher levels of education and lower fertility rates.During the period under analysis, it transpires that maleparticipation fell in urban and rural areas and femaleparticipation fell in rural areas (Henao and Parra, 1998;Farné, Vivas and Núñez, 1998 and Ribero and García,1996).
Participation and employment rates rise as educa-tional levels increase, regardless of age group, genderor geographical area. Between 1991 and 1997, employ-ment rates fell for all educational groups, with the ex-ception of more highly educated women. Unemploy-ment is higher for women in all educational groups andfor people with 10 to 15 years of education. Between
1991 and 1997, unemployment rose for all educationalcategories, with the exception of more highly qualifiedpeople in rural areas, this exception being due, how-ever, to workers in this category withdrawing from thelabour market, as their employment rate fell substan-tially. Among those with 10 to 15 years of schooling,the rise in unemployment was slightly higher amongmen. As regards age, most of the population, in bothurban and rural areas, is in the 25 to 50 cohort, and it isin this age group too that the highest rates of employ-ment and participation are found. Conversely, unem-ployment rates tend to fall as age increases.
2. Employment trends
To achieve a more detailed analysis of the dynamic ofthe labour market in Colombia, an exercise was de-vised to break down changes in its structure resultingfrom shifts in the supply of and demand for labour.5The results are collected in table 4. This establishesthat supply-side changes, whether they are due to de-mographic factors or to changes in the total participa-tion rate, have to match changes in the structure of thelabour market brought about by demand factors, i.e.,by changes in the employment and unemployment rates,as a proportion, in both cases, of the total populationof the country.
Three basic conclusions can be drawn from theseresults. The first, relating to supply, is that the supplyof labour grew moderately during the period analysed.In 1991-1995 the positive effect of the demographiccomponent was largely offset by the decline in labourforce participation. The demographic effect halted en-tirely in the middle of the decade, giving rise, in con-junction with the continuing decline in labour forceparticipation, to a fall in the labour supply in 1995-1997. As we have seen, the downward trend in partici-pation came to an end in 1998, which is outside thereference period for analysing the effects of the reforms.
The second conclusion relates to the demand forlabour: taking the period as a whole, the job creationcapacity of the economy was very low. The inadequacyof the results achieved in this area were made manifestby a fall in the employment rate equivalent to 2.2 per-
5 This section and the following ones define the main labour marketindicators in relation to the total population, and thus depart fromthe approach traditionally followed in the study of the labour marketwhereby these variables are defined in relation to the working-ageor economically active population. The methodology used is setout in Taylor (1998).

C E P A L R E V I E W 7 2 • D E C E M B E R 2 0 0 062
THE LABOUR MARKET AND INCOME DISTRIBUTION IN COLOMBIA IN THE 1990S • JOSE ANTONIO OCAMPO, FABIO SANCHEZAND CAMILO ERNESTO TOVAR
TABLE 3
Colombia: Main labour market indicators by gender,years of education, age and area, 1991-1997(Percentages)
By area and gender, 1991 and 1997
1991 1997
National Men 78.4 74.0T Women 37.9 38.3P Urban Men 73.1 70.4R Women 40.9 41.5
Rural Men 84.4 82.6Women 33.7 28.3
National Men 4.3 6.8Women 10.7 13.3
U Urban Men 6.4 8.7R Women 12.7 13.3
Rural Men 2.2 2.9Women 7.6 13.4
National Men 75.1 69.0Women 33.8 33.2
E Urban Men 68.4 64.2R Women 35.7 36.0
Rural Men 82.6 80.1Women 31.2 24.5
By area and age, 1991 and 1997
1991 1997
National 12 to 24 45.7 39.925 to 50 66.7 66.8Over 50 47.4 44.3
T Urban 12 to 24 41.9 37.525 to 50 67.1 67.8
P Over 50 39.7 40.2Rural 12 to 24 50.2 46.0
R 25 to 50 66.2 63.9Over 50 55.5 54.1
National 12 to 24 14.1 19.025 to 50 6.3 7.0
U Over 50 2.0 4.1R Urban 12 to 24 20.1 22.9
25 to 50 5.8 8.0Over 50 3.6 5.1
Rural 12 to 24 8.3 10.625 to 50 2.2 4.1Over 50 0.7 2.2
National 12 to 24 39.3 32.225 to 50 63.8 62.1
E Over 50 46.4 42.5R Urban 12 to 24 33.5 28.9
25 to 50 63.2 62.4Over 50 38.2 38.2
Rural 12 to 24 46.0 41.125 to 50 64.8 61.3Over 50 55.1 52.9
By area and years of education, 1991 and 1997
1991 1997
National 9 years or less 54.1 50.210 to 15 years 64.9 65.7More than 15 years 88.4 86.9
T Urban 9 years or less 49.2 47.0P 10 to 15 years 64.7 65.7R More than 15 years 87.9 86.9
Rural 9 years or less 58.5 56.210 to 15 years 65.5 66.4More than 15 years 96.1 88.4
National 9 years or less 5.3 8.010 to 15 years 11.7 13.3
U More than 15 years 4.0 5.2R Urban 9 years or less 8.4 10.0
10 to 15 years 11.5 13.3More than 15 years 4.0 5.3
Rural 9 years or less 3.0 4.810 to 15 years 12.2 13.9More than 15 years 4.3 2.0
National 9 years or less 51.2 46.210 to 15 years 57.3 57.0More than 15 years 84.9 82.3
E Urban 9 years or less 45.1 42.3R 10 to 15 years 57.2 57.0
More than 15 years 84.4 82.2Rural 9 years or less 56.7 53.6
10 to 15 years 57.6 57.2More than 15 years 92.0 86.6
By years of education and gender, 1991 and 1997
1991 1997
9 years or less Men 77.6 71.7T Women 32.7 30.4P 10 to 15 years Men 78.4 77.7R Women 53.6 55.7
More than 15 years Men 93.0 90.0Women 81.8 83.0
9 years or less Men 3.5 6.0Women 9.2 12.3
U 10 to 15 years Men 72.1 69.9R Women 45.0 46.2
More than 15 years Men 90.1 86.1Women 77.4 77.6
9 years or less Men 74.8 67.4Women 29.7 26.7
E 10 to 15 years Men 8.0 10.1R Women 16.0 17.1
More than 15 years Men 3.2 4.3Women 5.4 6.5
Source: Calculated by the author on the basis of National Household Surveys.TPR : Total participation rateUR : Unemployment rateER : Employment rate

63C E P A L R E V I E W 7 2 • D E C E M B E R 2 0 0 0
THE LABOUR MARKET AND INCOME DISTRIBUTION IN COLOMBIA IN THE 1990S • JOSE ANTONIO OCAMPO, FABIO SANCHEZAND CAMILO ERNESTO TOVAR
centage points of the entire population between 1991and 1997, mainly owing to the sharp relative decline injob creation in sectors producing internationally trad-able goods. The loss of employment in tradable sectorswas a feature of the entire decade, and its severity meansit must be associated with the effects of the structuralreforms. Job creation in sectors producing non-trad-able goods and services offset this during the upturn,but ceased to do so during the following years of slow-ing economic growth, which meant that the fall in em-ployment in tradable sectors was fully reflected in theemployment rate.
Lastly, the favourable combination of participationand employment trends in non-tradable sectors wasneutral in its effect on unemployment up until 1995,after which the situation changed markedly, with un-employment rising by the equivalent of 2.1 percentagepoints of the total population between 1995 and 1997.As we have seen, the severe recession that followedand the renewal of the upward trend in labour forceparticipation would cause the unemployment rate toexplode over the following years.
Analysis of employment trends can be carried outat a level of one digit of the economic activity classifi-cation, and changes in the employment rate can be bro-ken down into weighted changes in the difference be-tween per capita output growth and changes in thelabour productivity of each sector.
The results of this breakdown are given in table 5.This shows that the general decline of employment in
TABLE 5
Colombia: Sectoral breakdown of labour productivity,output per capita and employment changesa
(Percentages)
1991-1995 1995-1997 1991-1997
Growth in labour productivity
Agriculture 18.7 -4.1 13.8Mining 65.6 22.7 103.2Industry -2.8 18.4 15.2Electricity, gas and water 34.1 -38.6 -17.6Construction 7.2 14.1 22.3Trade 13.2 1.1 14.5Transport 2.5 10.6 13.3Financial services -3.0 0.1 -2.9Other services 11.7 4.4 16.6Total 10.4 4.2 15.0Tradables 12.0 5.6 18.3Non-tradables 10.8 4.0 15.2
Per capita output growth
Agriculture -0.7 -3.9 -4.6Mining 9.0 8.5 18.3Industry 2.7 -3.7 -1.1Electricity, gas and water 11.7 2.5 14.6Construction 46.9 -4.1 40.8Trade 19.8 -0.9 18.7Transport 13.6 6.1 20.4Financial services 24.4 4.4 29.9Other services 13.4 9.9 24.6Total 11.2 1.2 12.5Tradables 1.7 -2.6 -0.9Non-tradables 19.8 4.2 24.8
Change in employment rate
Agriculture -4.4 0.0 -4.3Mining -0.4 -0.1 -0.5Industry 0.8 -2.9 -2.1Electricity, gas and water -0.1 0.3 0.2Construction 1.7 -1.0 0.7Trade 1.2 -0.4 0.8Transport 0.5 -0.2 0.3Financial services 1.0 0.2 1.2Other services 0.3 1.2 1.5Total 0.7 -2.9 -2.2Tradables -3.9 -3.0 -7.0Non-tradables 4.7 0.1 4.8
Source: Calculated by the author on the basis of National House-hold Surveys.
a The totals for the three breakdowns do not exactly match be-cause the separate calculations exclude the combined effect ofchanges in each of the two components.
agriculture and industry was associated with a sharpfall in output per inhabitant combined with significantincreases in labour productivity. As a result of this,between 1991 and 1997 the employment rate in trad-
TABLE 4
Colombia: Breakdown of overall changesin the labour market(Percentage point changes in rates calculatedin relation to the total population)
1991-1995 1995-1997 1991-1997
Changes in labour supply
Totala 1.2 -0.6 0.5Demographic 2.2 -0.1 2.2Participation -1.0 -0.6 -1.6
Absorption by labour demand
Employmenta 0.7 -2.9 -2.2Tradables -3.9 -3.0 -7.0Non-tradables 4.7 0.1 4.8Unemployment 0.5 2.1 2.6
Source: Calculated by the author on the basis of National House-hold Surveys.
a The breakdown excludes the combined effect of changes in eachof the components.
C E P A L R E V I E W 7 2 • D E C E M B E R 2 0 0 064
THE LABOUR MARKET AND INCOME DISTRIBUTION IN COLOMBIA IN THE 1990S • JOSE ANTONIO OCAMPO, FABIO SANCHEZAND CAMILO ERNESTO TOVAR
as regards jobs requiring higher levels of education wasone of stagnation.
In relation to the first point, it is important to notethat between 1991 and 1995 the fall in the employmentrate for less highly qualified workers, meaning thosewith some primary education (0-5 years) or incompletesecondary education (6-10 years), was accounted formainly by the agricultural sector. By contrast, between1995 and 1997 the fall in the employment rate amongthese workers was particularly sharp in the industrialsector. In the case of the non-tradable sectors, jobcreation for less highly qualified workers behaves in away that is clearly cyclical and is closely linked to thedynamic of the construction industry. During theexpansion phase, in fact, this sector was the mostdynamic source of new jobs for workers with a lowlevel of education; conversely, during the adjustmentphase it was this sector, after industry, that contributedmost to the decline in the employment rate among theseworkers. What this dynamic suggests, then, is that innon-tradable sectors the creation of low-skilled jobshas been associated with the particular economic cycleof each sector. The ability of sectors producing tradablegoods to create employment for workers with a lowlevel of education, by contrast, has been in continuousdecline.
The sectoral dynamic of the employment rateamong highly qualified workers, those with incomplete(12-15 years) and complete (16 years and over) uni-versity or polytechnic education, has been subdued,with the exception of financial services and other ser-vices. New high-skilled jobs in the financial servicesand other services sectors alone account for two thirdsof the increase in the employment rate among thosewith a higher level of education throughout theeconomy between 1991 and 1997. In the case of peoplewith an intermediate level of education (complete sec-ondary education, totalling 11 years of schooling), thetrade sector, along with other services, has been themain source of new jobs, with the transport sector alsomaking a major contribution.
Changes in the employment rate by occupationalcategory and by sex, meanwhile, evince three impor-tant characteristics (table 7). The first is the markedlycyclical nature of waged job creation in the private sec-tor. During the expansionary phase of the economy,this occupational category was the most dynamic of allin terms of job creation. Between 1995 and 1997, bycontrast, it was here that the bulk of the contraction inthe demand for labour occurred. The second is the dy-namic role played by own-account employment over
able sectors fell by an amount equivalent to seven per-centage points of the entire population. By contrast,sectors associated with non-tradable activities, chieflyservices, saw a sustained increase in output per inhab-itant, especially during the economic upturn. Duringthose years, per capita output growth exceeded labourproductivity growth. This meant that dynamic job cre-ation could take place in these sectors, but this processwas interrupted and even reversed in a number of sectorsduring the following years. The combined effects ofthe slowdown in job creation in non-tradable sectorsfrom 1996 onward –associated with the slowdown inthe economy– and the long-term decline of employ-ment in tradable activities, therefore, account for thesharp fall in the total employment rate of the economy.
These general tendencies at the sectoral level havesome peculiarities. On the one hand, the extent of thedecline in agricultural sector employment between 1991and 1995 is striking, particularly in rural areas, wherethe share of agricultural employment fell by more thanfour percentage points during those years (table 2).Between 1995 and 1997, by contrast, the fall in em-ployment in tradable sectors was accounted for essen-tially by the industrial sector, although on this occa-sion it was associated with a worsening employmentsituation in urban areas, something that reflected boththe effects of the structural adjustment and the slow-down in economic activity.
In conjunction, these tendencies brought about arapid increase in the share of total employment ac-counted for by the non-tradable sectors, which rosefrom 57.0% in 1991 to 63.2% in 1997 (table 2). Theprocyclical behaviour of employment was particularlystriking in the construction sector. This sector grewstrongly between 1991 and 1995, but this period wasfollowed by a recession whose effects on job creationare plain to see: the share of the construction sector intotal employment rose from 4.5% in 1991 to 6.1% in1995 and then fell again to 5.3% in 1997.
The above analysis can be extended to take in thedynamic of job creation in each sector in relation to theeducational level of workers, their occupational posi-tion and their sex. When movements in employmentrates are compared by production sector and by levelof schooling, two clearly defined patterns emerge(table 6). On the one hand, the employment rate forworkers with less schooling fell throughout the decade,and this decline was far sharper in tradable sectors. Onthe other hand, most skilled jobs were created in thenon-tradable sectors, especially financial services andother services, while in tradable sectors the situation
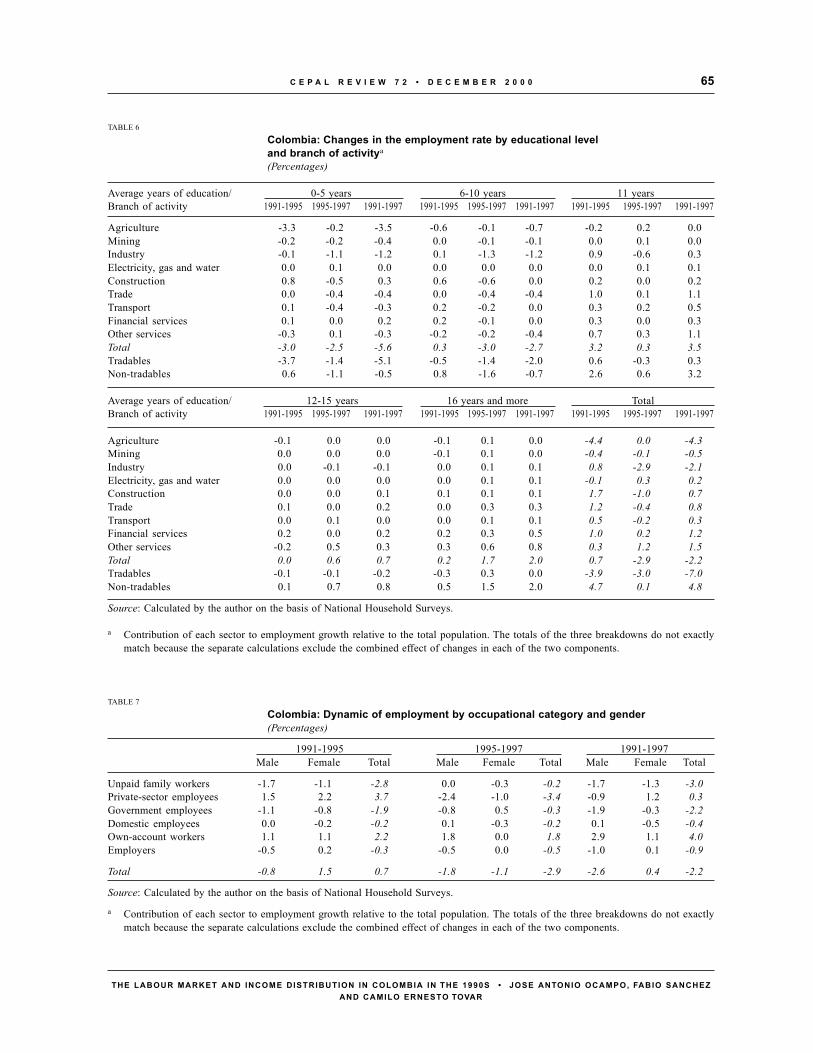
65C E P A L R E V I E W 7 2 • D E C E M B E R 2 0 0 0
THE LABOUR MARKET AND INCOME DISTRIBUTION IN COLOMBIA IN THE 1990S • JOSE ANTONIO OCAMPO, FABIO SANCHEZAND CAMILO ERNESTO TOVAR
TABLE 6
Colombia: Changes in the employment rate by educational leveland branch of activitya
(Percentages)
Average years of education/ 0-5 years 6-10 years 11 yearsBranch of activity 1991-1995 1995-1997 1991-1997 1991-1995 1995-1997 1991-1997 1991-1995 1995-1997 1991-1997
Agriculture -3.3 -0.2 -3.5 -0.6 -0.1 -0.7 -0.2 0.2 0.0Mining -0.2 -0.2 -0.4 0.0 -0.1 -0.1 0.0 0.1 0.0Industry -0.1 -1.1 -1.2 0.1 -1.3 -1.2 0.9 -0.6 0.3Electricity, gas and water 0.0 0.1 0.0 0.0 0.0 0.0 0.0 0.1 0.1Construction 0.8 -0.5 0.3 0.6 -0.6 0.0 0.2 0.0 0.2Trade 0.0 -0.4 -0.4 0.0 -0.4 -0.4 1.0 0.1 1.1Transport 0.1 -0.4 -0.3 0.2 -0.2 0.0 0.3 0.2 0.5Financial services 0.1 0.0 0.2 0.2 -0.1 0.0 0.3 0.0 0.3Other services -0.3 0.1 -0.3 -0.2 -0.2 -0.4 0.7 0.3 1.1Total -3.0 -2.5 -5.6 0.3 -3.0 -2.7 3.2 0.3 3.5Tradables -3.7 -1.4 -5.1 -0.5 -1.4 -2.0 0.6 -0.3 0.3Non-tradables 0.6 -1.1 -0.5 0.8 -1.6 -0.7 2.6 0.6 3.2
Average years of education/ 12-15 years 16 years and more TotalBranch of activity 1991-1995 1995-1997 1991-1997 1991-1995 1995-1997 1991-1997 1991-1995 1995-1997 1991-1997
Agriculture -0.1 0.0 0.0 -0.1 0.1 0.0 -4.4 0.0 -4.3Mining 0.0 0.0 0.0 -0.1 0.1 0.0 -0.4 -0.1 -0.5Industry 0.0 -0.1 -0.1 0.0 0.1 0.1 0.8 -2.9 -2.1Electricity, gas and water 0.0 0.0 0.0 0.0 0.1 0.1 -0.1 0.3 0.2Construction 0.0 0.0 0.1 0.1 0.1 0.1 1.7 -1.0 0.7Trade 0.1 0.0 0.2 0.0 0.3 0.3 1.2 -0.4 0.8Transport 0.0 0.1 0.0 0.0 0.1 0.1 0.5 -0.2 0.3Financial services 0.2 0.0 0.2 0.2 0.3 0.5 1.0 0.2 1.2Other services -0.2 0.5 0.3 0.3 0.6 0.8 0.3 1.2 1.5Total 0.0 0.6 0.7 0.2 1.7 2.0 0.7 -2.9 -2.2Tradables -0.1 -0.1 -0.2 -0.3 0.3 0.0 -3.9 -3.0 -7.0Non-tradables 0.1 0.7 0.8 0.5 1.5 2.0 4.7 0.1 4.8
Source: Calculated by the author on the basis of National Household Surveys.
a Contribution of each sector to employment growth relative to the total population. The totals of the three breakdowns do not exactlymatch because the separate calculations exclude the combined effect of changes in each of the two components.
TABLE 7
Colombia: Dynamic of employment by occupational category and gender(Percentages)
1991-1995 1995-1997 1991-1997Male Female Total Male Female Total Male Female Total
Unpaid family workers -1.7 -1.1 -2.8 0.0 -0.3 -0.2 -1.7 -1.3 -3.0Private-sector employees 1.5 2.2 3.7 -2.4 -1.0 -3.4 -0.9 1.2 0.3Government employees -1.1 -0.8 -1.9 -0.8 0.5 -0.3 -1.9 -0.3 -2.2Domestic employees 0.0 -0.2 -0.2 0.1 -0.3 -0.2 0.1 -0.5 -0.4Own-account workers 1.1 1.1 2.2 1.8 0.0 1.8 2.9 1.1 4.0Employers -0.5 0.2 -0.3 -0.5 0.0 -0.5 -1.0 0.1 -0.9
Total -0.8 1.5 0.7 -1.8 -1.1 -2.9 -2.6 0.4 -2.2
Source: Calculated by the author on the basis of National Household Surveys.
a Contribution of each sector to employment growth relative to the total population. The totals of the three breakdowns do not exactlymatch because the separate calculations exclude the combined effect of changes in each of the two components.
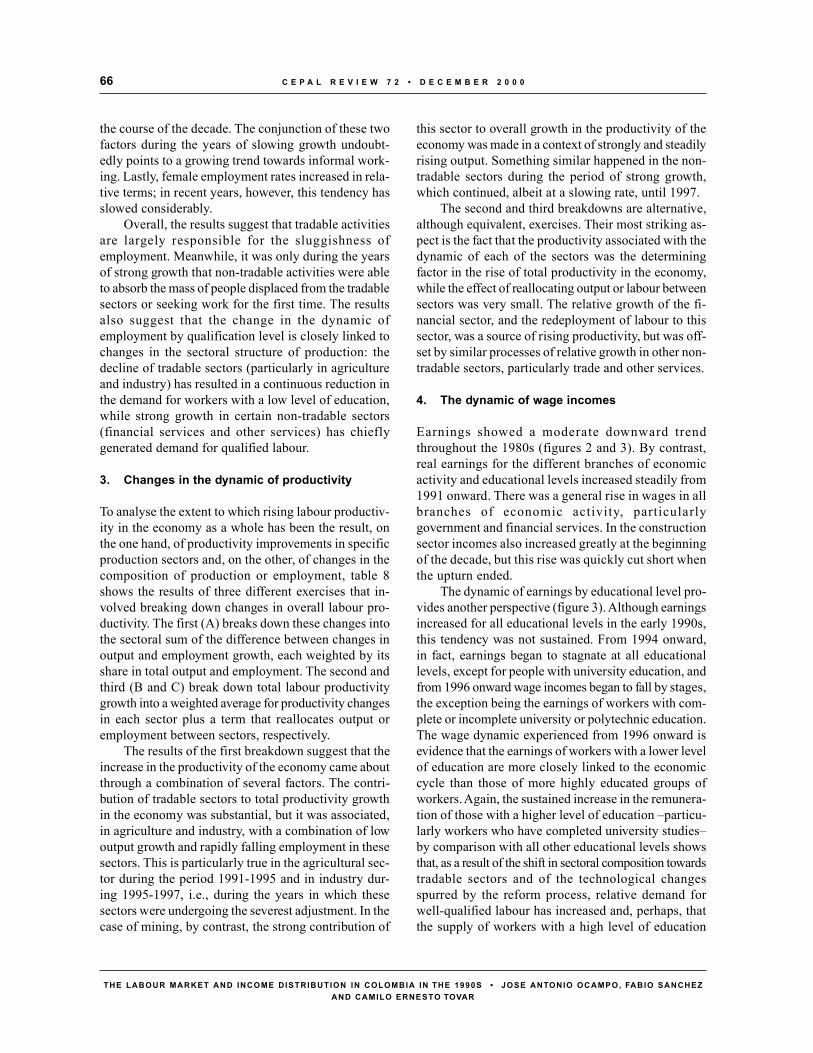
C E P A L R E V I E W 7 2 • D E C E M B E R 2 0 0 066
THE LABOUR MARKET AND INCOME DISTRIBUTION IN COLOMBIA IN THE 1990S • JOSE ANTONIO OCAMPO, FABIO SANCHEZAND CAMILO ERNESTO TOVAR
the course of the decade. The conjunction of these twofactors during the years of slowing growth undoubt-edly points to a growing trend towards informal work-ing. Lastly, female employment rates increased in rela-tive terms; in recent years, however, this tendency hasslowed considerably.
Overall, the results suggest that tradable activitiesare largely responsible for the sluggishness ofemployment. Meanwhile, it was only during the yearsof strong growth that non-tradable activities were ableto absorb the mass of people displaced from the tradablesectors or seeking work for the first time. The resultsalso suggest that the change in the dynamic ofemployment by qualification level is closely linked tochanges in the sectoral structure of production: thedecline of tradable sectors (particularly in agricultureand industry) has resulted in a continuous reduction inthe demand for workers with a low level of education,while strong growth in certain non-tradable sectors(financial services and other services) has chieflygenerated demand for qualified labour.
3. Changes in the dynamic of productivity
To analyse the extent to which rising labour productiv-ity in the economy as a whole has been the result, onthe one hand, of productivity improvements in specificproduction sectors and, on the other, of changes in thecomposition of production or employment, table 8shows the results of three different exercises that in-volved breaking down changes in overall labour pro-ductivity. The first (A) breaks down these changes intothe sectoral sum of the difference between changes inoutput and employment growth, each weighted by itsshare in total output and employment. The second andthird (B and C) break down total labour productivitygrowth into a weighted average for productivity changesin each sector plus a term that reallocates output oremployment between sectors, respectively.
The results of the first breakdown suggest that theincrease in the productivity of the economy came aboutthrough a combination of several factors. The contri-bution of tradable sectors to total productivity growthin the economy was substantial, but it was associated,in agriculture and industry, with a combination of lowoutput growth and rapidly falling employment in thesesectors. This is particularly true in the agricultural sec-tor during the period 1991-1995 and in industry dur-ing 1995-1997, i.e., during the years in which thesesectors were undergoing the severest adjustment. In thecase of mining, by contrast, the strong contribution of
this sector to overall growth in the productivity of theeconomy was made in a context of strongly and steadilyrising output. Something similar happened in the non-tradable sectors during the period of strong growth,which continued, albeit at a slowing rate, until 1997.
The second and third breakdowns are alternative,although equivalent, exercises. Their most striking as-pect is the fact that the productivity associated with thedynamic of each of the sectors was the determiningfactor in the rise of total productivity in the economy,while the effect of reallocating output or labour betweensectors was very small. The relative growth of the fi-nancial sector, and the redeployment of labour to thissector, was a source of rising productivity, but was off-set by similar processes of relative growth in other non-tradable sectors, particularly trade and other services.
4. The dynamic of wage incomes
Earnings showed a moderate downward trendthroughout the 1980s (figures 2 and 3). By contrast,real earnings for the different branches of economicactivity and educational levels increased steadily from1991 onward. There was a general rise in wages in allbranches of economic activity, particularlygovernment and financial services. In the constructionsector incomes also increased greatly at the beginningof the decade, but this rise was quickly cut short whenthe upturn ended.
The dynamic of earnings by educational level pro-vides another perspective (figure 3). Although earningsincreased for all educational levels in the early 1990s,this tendency was not sustained. From 1994 onward,in fact, earnings began to stagnate at all educationallevels, except for people with university education, andfrom 1996 onward wage incomes began to fall by stages,the exception being the earnings of workers with com-plete or incomplete university or polytechnic education.The wage dynamic experienced from 1996 onward isevidence that the earnings of workers with a lower levelof education are more closely linked to the economiccycle than those of more highly educated groups ofworkers. Again, the sustained increase in the remunera-tion of those with a higher level of education –particu-larly workers who have completed university studies–by comparison with all other educational levels showsthat, as a result of the shift in sectoral composition towardstradable sectors and of the technological changesspurred by the reform process, relative demand forwell-qualified labour has increased and, perhaps, thatthe supply of workers with a high level of education
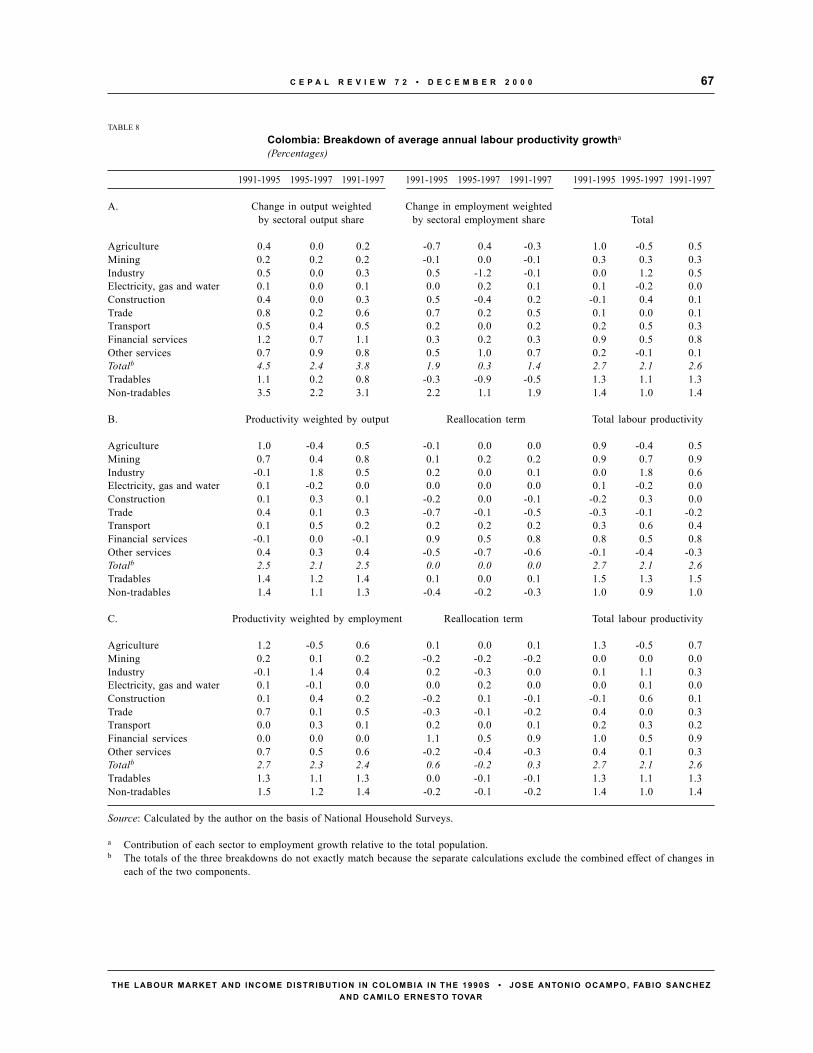
67C E P A L R E V I E W 7 2 • D E C E M B E R 2 0 0 0
THE LABOUR MARKET AND INCOME DISTRIBUTION IN COLOMBIA IN THE 1990S • JOSE ANTONIO OCAMPO, FABIO SANCHEZAND CAMILO ERNESTO TOVAR
TABLE 8
Colombia: Breakdown of average annual labour productivity growtha
(Percentages)
1991-1995 1995-1997 1991-1997 1991-1995 1995-1997 1991-1997 1991-1995 1995-1997 1991-1997
A. Change in output weighted Change in employment weightedby sectoral output share by sectoral employment share Total
Agriculture 0.4 0.0 0.2 -0.7 0.4 -0.3 1.0 -0.5 0.5Mining 0.2 0.2 0.2 -0.1 0.0 -0.1 0.3 0.3 0.3Industry 0.5 0.0 0.3 0.5 -1.2 -0.1 0.0 1.2 0.5Electricity, gas and water 0.1 0.0 0.1 0.0 0.2 0.1 0.1 -0.2 0.0Construction 0.4 0.0 0.3 0.5 -0.4 0.2 -0.1 0.4 0.1Trade 0.8 0.2 0.6 0.7 0.2 0.5 0.1 0.0 0.1Transport 0.5 0.4 0.5 0.2 0.0 0.2 0.2 0.5 0.3Financial services 1.2 0.7 1.1 0.3 0.2 0.3 0.9 0.5 0.8Other services 0.7 0.9 0.8 0.5 1.0 0.7 0.2 -0.1 0.1Totalb 4.5 2.4 3.8 1.9 0.3 1.4 2.7 2.1 2.6Tradables 1.1 0.2 0.8 -0.3 -0.9 -0.5 1.3 1.1 1.3Non-tradables 3.5 2.2 3.1 2.2 1.1 1.9 1.4 1.0 1.4
B. Productivity weighted by output Reallocation term Total labour productivity
Agriculture 1.0 -0.4 0.5 -0.1 0.0 0.0 0.9 -0.4 0.5Mining 0.7 0.4 0.8 0.1 0.2 0.2 0.9 0.7 0.9Industry -0.1 1.8 0.5 0.2 0.0 0.1 0.0 1.8 0.6Electricity, gas and water 0.1 -0.2 0.0 0.0 0.0 0.0 0.1 -0.2 0.0Construction 0.1 0.3 0.1 -0.2 0.0 -0.1 -0.2 0.3 0.0Trade 0.4 0.1 0.3 -0.7 -0.1 -0.5 -0.3 -0.1 -0.2Transport 0.1 0.5 0.2 0.2 0.2 0.2 0.3 0.6 0.4Financial services -0.1 0.0 -0.1 0.9 0.5 0.8 0.8 0.5 0.8Other services 0.4 0.3 0.4 -0.5 -0.7 -0.6 -0.1 -0.4 -0.3Totalb 2.5 2.1 2.5 0.0 0.0 0.0 2.7 2.1 2.6Tradables 1.4 1.2 1.4 0.1 0.0 0.1 1.5 1.3 1.5Non-tradables 1.4 1.1 1.3 -0.4 -0.2 -0.3 1.0 0.9 1.0
C. Productivity weighted by employment Reallocation term Total labour productivity
Agriculture 1.2 -0.5 0.6 0.1 0.0 0.1 1.3 -0.5 0.7Mining 0.2 0.1 0.2 -0.2 -0.2 -0.2 0.0 0.0 0.0Industry -0.1 1.4 0.4 0.2 -0.3 0.0 0.1 1.1 0.3Electricity, gas and water 0.1 -0.1 0.0 0.0 0.2 0.0 0.0 0.1 0.0Construction 0.1 0.4 0.2 -0.2 0.1 -0.1 -0.1 0.6 0.1Trade 0.7 0.1 0.5 -0.3 -0.1 -0.2 0.4 0.0 0.3Transport 0.0 0.3 0.1 0.2 0.0 0.1 0.2 0.3 0.2Financial services 0.0 0.0 0.0 1.1 0.5 0.9 1.0 0.5 0.9Other services 0.7 0.5 0.6 -0.2 -0.4 -0.3 0.4 0.1 0.3Totalb 2.7 2.3 2.4 0.6 -0.2 0.3 2.7 2.1 2.6Tradables 1.3 1.1 1.3 0.0 -0.1 -0.1 1.3 1.1 1.3Non-tradables 1.5 1.2 1.4 -0.2 -0.1 -0.2 1.4 1.0 1.4
Source: Calculated by the author on the basis of National Household Surveys.
a Contribution of each sector to employment growth relative to the total population.b The totals of the three breakdowns do not exactly match because the separate calculations exclude the combined effect of changes in
each of the two components.
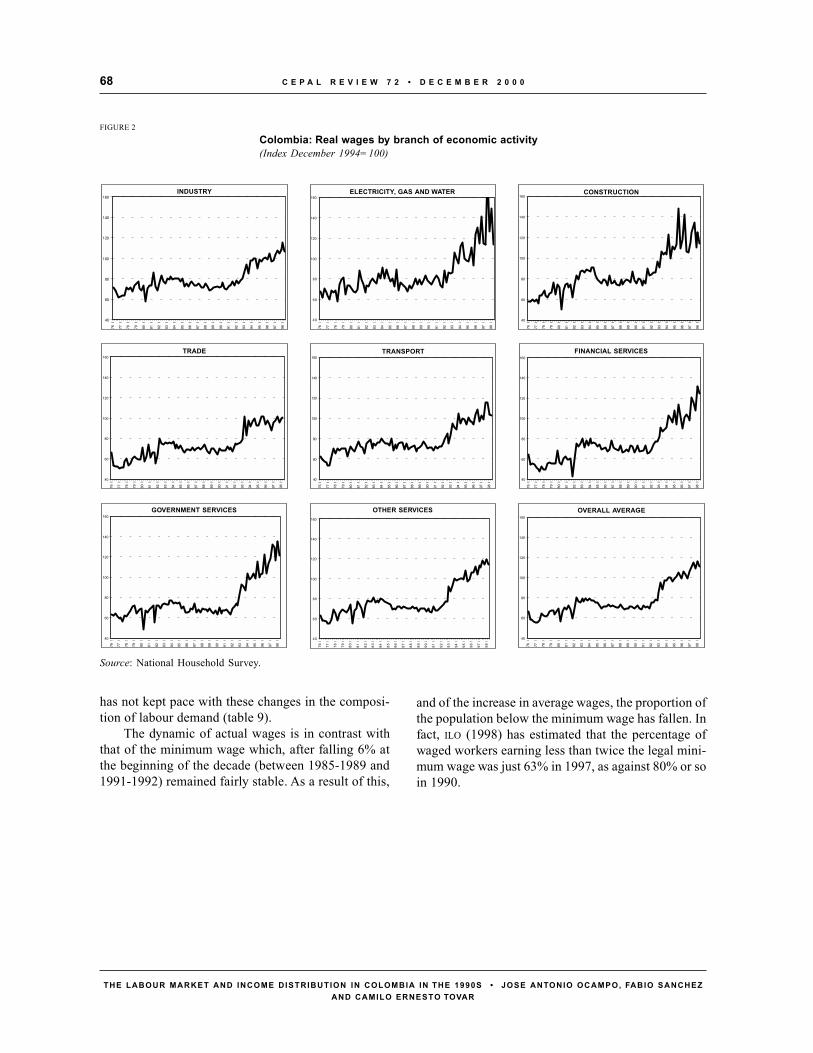
C E P A L R E V I E W 7 2 • D E C E M B E R 2 0 0 068
THE LABOUR MARKET AND INCOME DISTRIBUTION IN COLOMBIA IN THE 1990S • JOSE ANTONIO OCAMPO, FABIO SANCHEZAND CAMILO ERNESTO TOVAR
has not kept pace with these changes in the composi-tion of labour demand (table 9).
The dynamic of actual wages is in contrast withthat of the minimum wage which, after falling 6% atthe beginning of the decade (between 1985-1989 and1991-1992) remained fairly stable. As a result of this,
and of the increase in average wages, the proportion ofthe population below the minimum wage has fallen. Infact, ILO (1998) has estimated that the percentage ofwaged workers earning less than twice the legal mini-mum wage was just 63% in 1997, as against 80% or soin 1990.
FIGURE 2
Colombia: Real wages by branch of economic activity(Index December 1994=100)
INDUSTRIA
40
60
80
100
120
140
160
76 I
77 I
78 I
79 I
80 I
81 I
82 I
83 I
84 I
85 I
86 I
87 I
88 I
89 I
90 I
91 I
92 I
93 I
94 I
95 I
96 I
97 I
98 I
ELECTRICIDAD, GAS Y AGUA
40
60
80
100
120
140
160
76 I
77 I
78 I
79 I
80 I
81 I
82 I
83 I
84 I
85 I
86 I
87 I
88 I
89 I
90 I
91 I
92 I
93 I
94 I
95 I
96 I
97 I
98 I
COMERCIO
40
60
80
100
120
140
160
76 I
77 I
78 I
79 I
80 I
81 I
82 I
83 I
84 I
85 I
86 I
87 I
88 I
89 I
90 I
91 I
92 I
93 I
94 I
95 I
96 I
97 I
98 I
CONSTRUCCION
40
60
80
100
120
140
160
76 I
77 I
78 I
79 I
80 I
81 I
82 I
83 I
84 I
85 I
86 I
87 I
88 I
89 I
90 I
91 I
92 I
93 I
94 I
95 I
96 I
97 I
98 I
TRANSPORTE
40
60
80
100
120
140
160
76 I
77 I
78 I
79 I
80 I
81 I
82 I
83 I
84 I
85 I
86 I
87 I
88 I
89 I
90 I
91 I
92 I
93 I
94 I
95 I
96 I
97 I
98 I
SERVICIOS FINANCIEROS
40
60
80
100
120
140
160
76 I
77 I
78 I
79 I
80 I
81 I
82 I
83 I
84 I
85 I
86 I
87 I
88 I
89 I
90 I
91 I
92 I
93 I
94 I
95 I
96 I
97 I
98 I
SERVICIOS DEL GOBIERNO
40
60
80
100
120
140
160
76 I
77 I
78 I
79 I
80 I
81 I
82 I
83 I
84 I
85 I
86 I
87 I
88 I
89 I
90 I
91 I
92 I
93 I
94 I
95 I
96 I
97 I
98 I
OTROS SERVICIOS
40
60
80
100
120
140
160
76 I
77 I
78 I
79 I
80 I
81 I
82 I
83 I
84 I
85 I
86 I
87 I
88 I
89 I
90 I
91 I
92 I
93 I
94 I
95 I
96 I
97 I
98 I
TOTAL PROMEDIO
40
60
80
100
120
140
160
76 I
77 I
78 I
79 I
80 I
81 I
82 I
83 I
84 I
85 I
86 I
87 I
88 I
89 I
90 I
91 I
92 I
93 I
94 I
95 I
96 I
97 I
98 I
INDUSTRY ELECTRICITY, GAS AND WATER CONSTRUCTION
TRADE TRANSPORT FINANCIAL SERVICES
GOVERNMENT SERVICES OTHER SERVICES OVERALL AVERAGE
Source: National Household Survey.
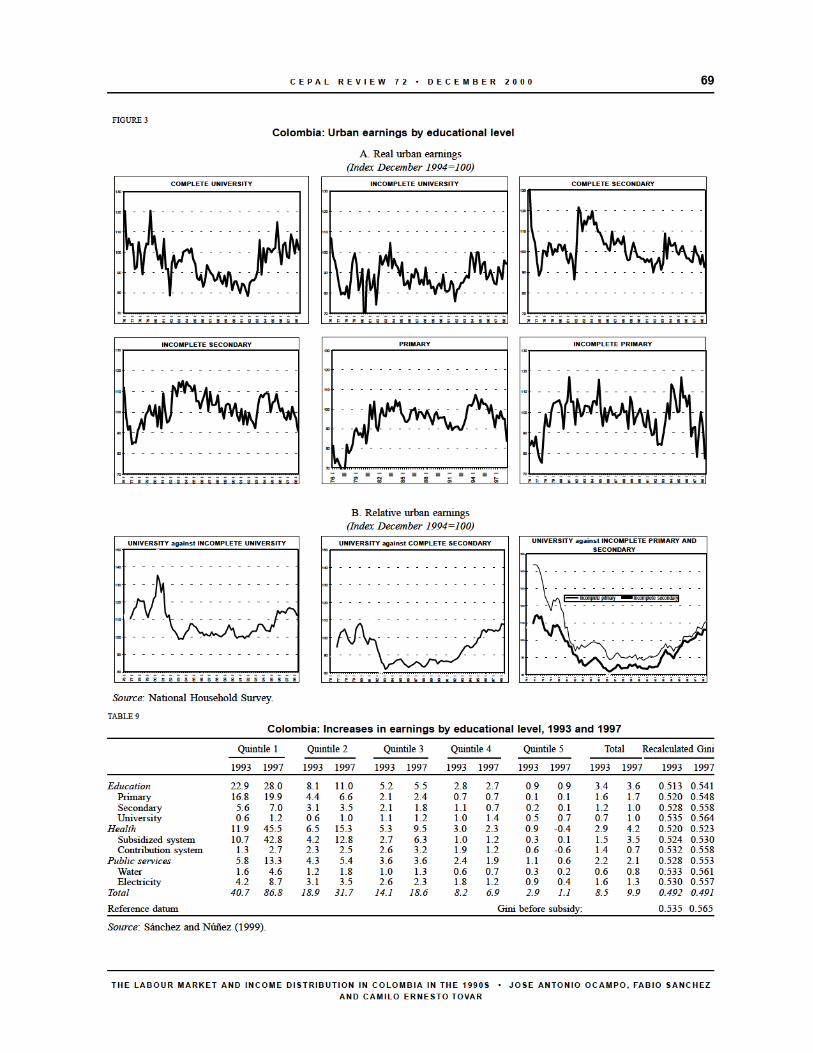
69CEPAL REVIE W 72 • DECEMBER 2000
THE LABOUR MARKET AND INCOME DISTRIBUTION IN COLOMBIA IN THE 1990S • JOSE ANTONIO OCAMPO, FABIO SANCHEZ
AND CAMILO ERNESTO TOVAR
TABLE 9
Colombia: Increases in earnings by educational level, 1993 and 1997
Quintile 1 Quintile 2 Quintile 3 Quintile 4 Quintile 5 Total Recalculated Gini
1993 1997 1993 1997 1993 1997 1993 1997 1993 1997 1993 1997 1993 1997
Education 22.9 28.0 8.1 11.0 5.2 5.5 2.8 2.7 0.9 0.9 3.4 3.6 0.513 0.541Primary 16.8 19.9 4.4 6.6 2.1 2.4 0.7 0.7 0.1 0.1 1.6 1.7 0.520 0.548Secondary 5.6 7.0 3.1 3.5 2.1 1.8 1.1 0.7 0.2 0.1 1.2 1.0 0.528 0.558University 0.6 1.2 0.6 1.0 1.1 1.2 1.0 1.4 0.5 0.7 0.7 1.0 0.535 0.564Health 11.9 45.5 6.5 15.3 5.3 9.5 3.0 2.3 0.9 -0.4 2.9 4.2 0.520 0.523Subsidized system 10.7 42.8 4.2 12.8 2.7 6.3 1.0 1.2 0.3 0.1 1.5 3.5 0.524 0.530Contribution system 1.3 2.7 2.3 2.5 2.6 3.2 1.9 1.2 0.6 -0.6 1.4 0.7 0.532 0.558Public services 5.8 13.3 4.3 5.4 3.6 3.6 2.4 1.9 1.1 0.6 2.2 2.1 0.528 0.553Water 1.6 4.6 1.2 1.8 1.0 1.3 0.6 0.7 0.3 0.2 0.6 0.8 0.533 0.561Electricity 4.2 8.7 3.1 3.5 2.6 2.3 1.8 1.2 0.9 0.4 1.6 1.3 0.530 0.557Total 40.7 86.8 18.9 31.7 14.1 18.6 8.2 6.9 2.9 1.1 8.5 9.9 0.492 0.491
Reference datum Gini before subsidy: 0.535 0.565
Source: Sánchez and Núñez (1999).
(Indice Diciembre de 1994 = 100)
B.- INGRESOS LABORALES URBANOS RELATIVOS
UNIVERSITARIA COMPLETA
70
80
90
100
110
120
130
76 I
77 I
78 I
79 I
80 I
81 I
82 I
83 I
84 I
85 I
86 I
87 I
88 I
89 I
90 I
91 I
92 I
93 I
94 I
95 I
96 I
97 I
98 I
UNIVERSITARIA INCOMPLETA
70
80
90
100
110
120
130
76 I
77 I
78 I
79 I
80 I
81 I
82 I
83 I
84 I
85 I
86 I
87 I
88 I
89 I
90 I
91 I
92 I
93 I
94 I
95 I
96 I
97 I
98 I
SECUNDARIA INCOMPLETA
70
80
90
100
110
120
130
76 I
77 I
78 I
79 I
80 I
81 I
82 I
83 I
84 I
85 I
86 I
87 I
88 I
89 I
90 I
91 I
92 I
93 I
94 I
95 I
96 I
97 I
98 I
SECUNDARIA COMPLETA
70
80
90
100
110
120
130
76 I
77 I
78 I
79 I
80 I
81 I
82 I
83 I
84 I
85 I
86 I
87 I
88 I
89 I
90 I
91 I
92 I
93 I
94 I
95 I
96 I
97 I
98 I
PRIMARIA
70
80
90
100
110
120
130
76 I III
79 I III
82 I III
85 I III
88 I III
91 I III
94 I III
97 I
PRIMARIA INCOMPLETA
70
80
90
100
110
120
130
76 I
77 I
78 I
79 I
80 I
81 I
82 I
83 I
84 I
85 I
86 I
87 I
88 I
89 I
90 I
91 I
92 I
93 I
94 I
95 I
96 I
97 I
98 I
UNIVERSITARIA vs. UNIVERSITARIA INCOMPLETA
80
90
100
110
120
130
140
150
76 I
77 I
78 I
79 I
80 I
81 I
82 I
83 I
84 I
85 I
86 I
87 I
88 I
89 I
90 I
91 I
92 I
93 I
94 I
95 I
96 I
97 I
98 I
UNIVERSITARIA vs. SECUNDARIA COMPLETA
80
90
100
110
120
130
140
150
76 I
77 I
78 I
79 I
80 I
81 I
82 I
83 I
84 I
85 I
86 I
87 I
88 I
89 I
90 I
91 I
92 I
93 I
94 I
95 I
96 I
97 I
98 I
UNIVERSITARIA vs. SECUNDARIA Y PRIMARIA
INCOMPLETA
80
90
10 0
11 0
12 0
13 0
14 0
15 0
76 I
77 I
78 I
79 I
80 I
81 I
82 I
83 I
84 I
85 I
86 I
87 I
88 I
89 I
90 I
91 I
92 I
93 I
94 I
95 I
96 I
97 I
98 I
Primaria incompleta S ecundaria incompleta
FIGURE 3
Colombia: Urban earnings by educational level
A. Real urban earnings(Index December 1994=100)
COMPLETE UNIVERSITY INCOMPLETE UNIVERSITY COMPLETE SECONDARY
INCOMPLETE SECONDARY PRIMARY INCOMPLETE PRIMARY
B. Relative urban earnings
(Index December 1994=100)
UNIVERSITY against INCOMPLETE UNIVERSITY UNIVERSITY against COMPLETE SECONDARY UNIVERSITY against INCOMPLETE PRIMARY AND
SECONDARY
Incomplete primary Incomplete secondary
Source: National Household Survey.
C E P A L R E V I E W 7 2 • D E C E M B E R 2 0 0 070
THE LABOUR MARKET AND INCOME DISTRIBUTION IN COLOMBIA IN THE 1990S • JOSE ANTONIO OCAMPO, FABIO SANCHEZAND CAMILO ERNESTO TOVAR
VEffects of the labour market on income distribution
1. A brief review of the literature
A number of recent studies have shown that the ten-dency for income distribution to improve in urban ar-eas which began in the 1970s continued throughoutmuch of the 1980s, but that this tendency was reversedin the late 1980s, to be followed by quite a markeddeterioration in distribution in the 1990s.6 In rural ar-eas, the opposite trends have been seen: a deteriorationin income distribution between 1978 and 1988, fol-lowed by an improvement in the first half of the 1990s,which was only partially reversed in the second half.Although these opposing trends tended to offset oneanother in the early years of the 1990s, the adversedevelopments seen in urban areas ultimately prevailed,bringing about a deteriorating income distribution situ-ation in the country as a whole (Colombia, DNP/UNDP,1998; Leibovich and Núñez, 1999; Ocampo, Pérez,Tovar and Lasso, 1998; Sánchez and Núñez, 1999 andVélez, Kugler and Bouillon, 1999). In fact, as table 10shows, primary income distribution in the country as awhole deteriorated between 1991 and 1997 by just undertwo percentage points of the Gini coefficient, owing toan adverse movement of over four points in urban areas,which prevailed over the rise of around four points inrural areas. This development in primary income dis-tribution nationally, however, was offset by thefavourable distributive effect of increased public socialspending and better targeting of this, which meant thatit benefited poorer sectors more (Sánchez and Núñez,1999); in other words, by improved secondary incomedistribution. The conclusion would seem to be thatoverall distribution (primary and secondary) did notshow any clear tendency over the course of the decade.
In rural-urban terms, Ocampo, Pérez, Tovar andLasso (1998) and Sánchez and Núñez (1999) show thatin the 1990s massive income redistribution took place
between the city and the countryside, the biggest gain-ers being the highest-income sectors in urban areas andthe biggest losers the highest-income sectors in ruralareas.7 What the first study primarily shows is an in-crease in the relative earnings of the most highly quali-fied workers, while the second shows a kind of “level-ling down” of rural incomes as a result of the crisis incommercial farming. In terms of gender, meanwhile,Vélez, Kugler and Bouillon (1999) show that amongmen the income gap fell between 1978 and 1988, butincreased sharply between 1988 and 1995. By contrast,the tendency towards greater income concentrationamong women was a characteristic of the 1978-1995period as a whole.
According to Ocampo, Pérez, Tovar and Lasso(1998), the favourable distribution tendencies that char-acterized urban areas in the 1980s can be accountedfor by a combination of more and better distributededucation, the narrowing of the income gap by educa-tional level, the good working opportunities availablefrom the middle of the decade onwards and the lowereconomic dependence rate in households, facilitatedby the demographic transition and the resulting increasein female workforce participation. Fewer working op-portunities, growing differentials in earnings from workby educational level and relative growth in non-wageincome, on the other hand, were the adverse factorsthat caused income distribution to worsen in the 1990s.These effects outweighed the impact of favourable ten-dencies, such as improvements in the quantity and dis-tribution of education, changes in demographic patterns,rising female participation in the workforce and de-clining average household size, which still continued,albeit at a slower pace. In rural areas, according to thisstudy, trade liberalization destroyed major sources ofincome, and this had particularly severe effects on biglandowners and wage earners in commercial farming,two groups that are in the highest deciles of rural in-come distribution. The net effect, therefore, was a down-ward “levelling” of income, which led to better distri-bution of dwindling rural incomes.
6 A common feature of recent studies is that they correct the resultsof household surveys to take account of non-disclosure problemsrelating to the highest incomes. The correction methods usedcombine with the problems traditionally encountered whenhousehold surveys are processed (the need to correct for unreportedor under-reported income, consistency with national accounts, etc.)to produce discrepancies between the estimates of different authors.
7 These studies disagree as to the amount of the losses suffered byother rural income recipients.

71C E P A L R E V I E W 7 2 • D E C E M B E R 2 0 0 0
THE LABOUR MARKET AND INCOME DISTRIBUTION IN COLOMBIA IN THE 1990S • JOSE ANTONIO OCAMPO, FABIO SANCHEZAND CAMILO ERNESTO TOVAR
The significant changes seen in the distributiontrend for earnings in urban areas can also be expressedas the outcome of large changes in the profitability ofeducation: a declining trend in the 1980s, followed bya substantial increase in the profitability of universityeducation in the 1990s (Sánchez and Núñez, 1998).According to this study, these changes in relative wagesare due to alterations not in the relative supply of labourbut rather in the demand for it, and are related to tech-nological change, the structure of sectoral production,relative factor productivity, the economic liberalizationand economic adjustment process and changes in theprices of non-labour factors, in particular the relativeprice of capital.
The analysis carried out by Leibovich and Núñez(1999) for the rural sector shows, for the period 1988-1995, that income distribution improved for both wageearners and own-account workers of both sexes. Thisresult was positively influenced by: changes in personalcircumstances (education and household size in par-ticular), in labour force participation and in the profit-ability of education. They also calculated the Gini andentropic measures which show that there is less ineq-uity among wage earners than among own-accountworkers, whether male or female. Again, just as in thestudies dealing with cities, the Gini is higher for womenthan for men.
Changes in distribution were heavily influencedby increases in the homogeneity or heterogeneity ofincomes within groups with the same basic character-istics (in terms of age, gender, education, experience,family headship and residence, in particular).8 Accord-ing to Vélez, Kugler and Bouillon (1999), increasedincome homogeneity in such groups accounts for a largepart of the improvement in urban income distributionin the period 1978-1988, and increased heterogeneityfor much of the reversal seen in the following period.For the recent period, Leibovich and Núñez (1999) findthat increased income homogeneity among workerswith similar occupational characteristics was one of thefactors underlying the improvement in rural incomedistribution.
A number of studies, again, have tried to explorethe effects of macroeconomic variables on income dis-tribution. Bernal, Cárdenas, Sánchez and Núñez (1998)find that a relative increase in the size of the tradablesectors tends to reduce the Gini coefficient, while higher
inflation, a higher unemployment rate and real currencydepreciation tend to raise it. Although the results ofOcampo, Pérez, Tovar and Lasso (1998) do not bearout some of these results (particularly the favourabledistributive effects of a lower inflation rate), they reachconclusions that are similar to the first of these results.In particular, this study shows that trade liberalizationhad an adverse distributive effect in the form of higherincome differentials by qualification level; the increasein public spending in the 1990s had a similar effect.The first of these results agrees, furthermore, with thoseobtained by Birchenall (1997) who, using a probabil-ity functions methodology, finds that trade liberaliza-tion led to technological change that increased the de-mand for skilled labour in the seven main cities. Fortheir part, Sánchez and Núñez (1999) find that, in thelong term, increases in the unemployment rate andhousehold size and real exchange rate depreciation in-crease the number of poor households, while improve-ments in educational levels, productivity and the termsof trade have favourable effects on the incidence ofpoverty in the main cities.
In summary, the studies that have been carried outlargely associate the deterioration in income distribu-tion experienced in the urban areas of Colombia in the1990s with a far-reaching shift in earnings from workby qualification level, which has widened the incomegap between qualified and unqualified workers, to thebenefit of the former. The different hypotheses put for-ward have linked this increase with growth in relativedemand for qualified labour resulting from trade liber-alization, technical change and higher public spend-ing; the last of these, however, has a favourablecountervailing effect on secondary income distribution.Although distribution improved in rural areas, it did soagainst the background of a substantial loss of revenuesresulting from deterioration in the rural terms of tradeand the resultant crisis in commercial farming.
2. Earnings and income distribution:general effects
Table 10 shows the results of applying Paes de Barros’methodology (2000) to the National Household Sur-veys (NHS) for September 1991 and 1997. This meth-odology essentially consists in simulating what the dis-tribution of income and poverty would have been in1997 if 1991 labour market conditions had obtained.These conditions are the participation rate, the unem-ployment rate, the sectoral distribution of employmentand earnings. Simulations are carried out for the na-
8 These effects are captured by residuals (unexplained effects) inincome generation functions.

C E P A L R E V I E W 7 2 • D E C E M B E R 2 0 0 072
THE LABOUR MARKET AND INCOME DISTRIBUTION IN COLOMBIA IN THE 1990S • JOSE ANTONIO OCAMPO, FABIO SANCHEZAND CAMILO ERNESTO TOVAR
coefficient by 0.0055 points (from an actual figure of0.0168), those in the unemployment rate by 0.0037,those in the sectoral composition of employment by0.0155 and those in wage levels by 0.0146. The results,then, reveal the greater relative influence exerted bythe last two of these variables on the incomeconcentration that took place during this period. Thesequential simulation confirms the results. If the set oflabour market conditions seen in 1991 had obtained in1997, the Gini coefficient would have been even lowerthan it was in the earlier year: 0.536 as against 0.548.
The results of the simulations of labour marketconditions for urban areas are similar to those arrivedat for the national total. The changes seen in thestructure of employment and wages account for 22.3%and 32.0% of the changes in the Gini coefficient. Thesequential simulation, meanwhile, accounts for 52%of the increase in the Gini coefficient in urban areas,i.e. 0.0224 out of a total increase of 0.0434 (from 0.497to 0.541), which implies that the increase in incomeconcentration was also contributed to by other factorsnot included in the labour market variables used forthe simulations (among them being the greaterheterogeneity of remuneration for workers with thesame characteristics and changes in non-work incomes).In rural areas the Gini coefficient fell by 0.0381 (from0.479 to 0.441). The changes in participation rates, inunemployment and, vitally, in the composition ofemployment (which is responsible for 60% of thechange in the Gini) account for much of the decline inconcentration. Changes in wage levels, however, showthe opposite tendency.
The same methodology was applied in the case ofchanges in poverty levels, with results that were quiteweak when compared with those obtained for incomedistribution. As table 11 shows, the percentage of poorhouseholds in the national total was 41.4% in 1997 asagainst 41.8% in 1991; in other words, the incidenceof poverty was basically the same. If we look at theincidence of poverty in urban and rural areas separately,however, different results are obtained. Thus, the per-centage of poor households fell in urban areas from37.5% to 28.9% and increased in rural ones from 55.0%to 59.9%. The simulation exercises show that if theparticipation rate, the unemployment rate and thesectoral composition of employment seen in 1991 hadobtained in 1997, the percentage of urban poor wouldhave been lower than it actually was. In the case ofwages, the simulation gives the opposite results.
In the case of the urban sector, however, thismethodology has only a very limited ability to explain
TABLE 10
Colombia: Simulations of the effects of labour marketchanges on the Gini coefficient, 1991 and 1997
National Urban Rural
Gini 1991 0.5482 0.4977 0.4790Gini 1997 0.5650 0.5411 0.4409Difference 0.0168 0.0434 -0.0381
Labour force participation
Simulated 0.5595 0.5385 0.4498Difference 0.0055 0.0026 -0.0089Explanatory % 32.7 6.0 -23.4
Unemployment
Simulated 0.5613 0.5365 0.4446Difference 0.0037 0.0046 -0.0037Explanatory % 22.1 10.7 -9.8
Sectoral composition of employment
Simulated 0.5495 0.5314 0.4638Difference 0.0155 0.0097 -0.0229Explanatory % 92.1 22.3 -60.2
Relative wages
Simulated 0.5504 0.5272 0.4295Difference 0.0146 0.0139 0.0114Explanatory % 86.5 32.0 30.0
Sequential
Simulated 0.5361 0.5201 0.4376Difference 0.0289 0.0224 -0.0414Explanatory % 171.9 51.7 -108.7
Source: Calculated by the author on the basis of National House-hold Surveys.
tional, urban and rural totals, in two ways. Firstly, theeffect of each of the labour market variables on incomedistribution is analysed in isolation. Then, their com-bined or sequential effect is analysed.9 In order to checkthe robustness of the values arrived at, the simulationswere repeated a thousand times (Montecarlo experi-ment).
The simulations of the effects of each of thevariables show that if 1991 labour market conditionshad obtained in 1997, the Gini coefficient for thecountry would have been lower in all cases. Thus, thechanges in the participation rate raised the Gini
9 The sequential simulation first calculates the effects of changesin participation; once these results have been obtained theunemployment simulations are carried out, then these results areused to carry out the simulations of changes in the sectoral structureof employment. The results from these, lastly, are used to carry outthe wage simulations.
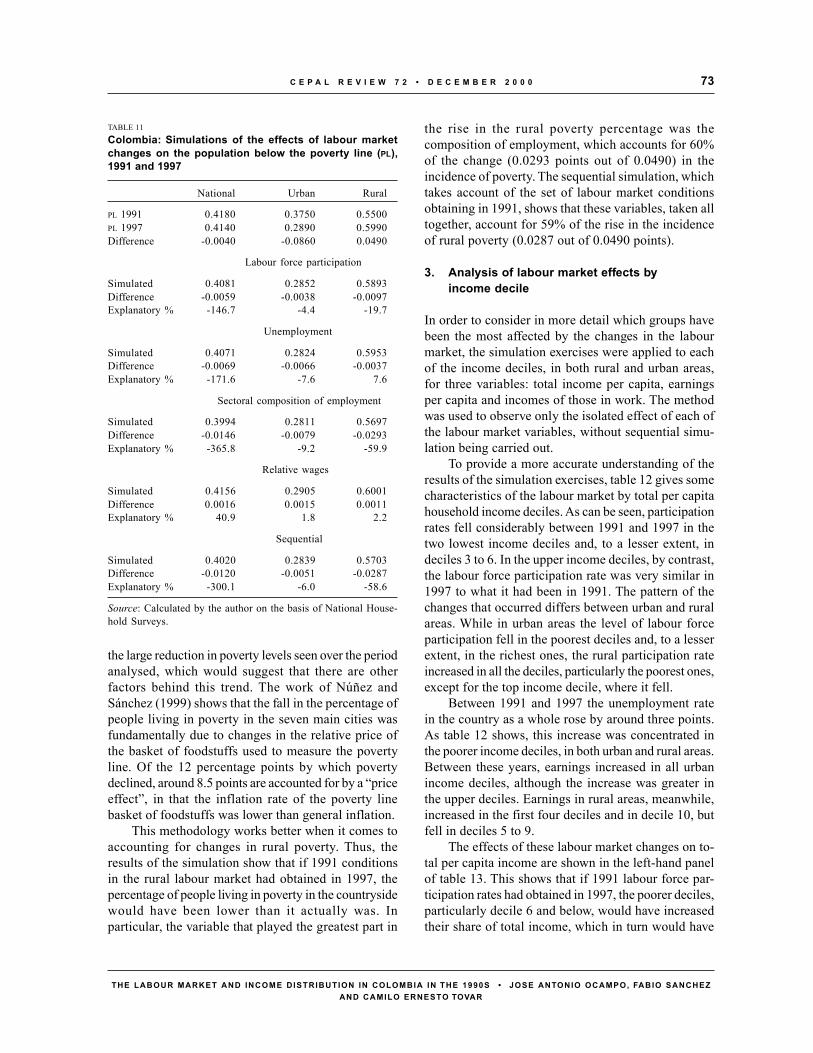
73C E P A L R E V I E W 7 2 • D E C E M B E R 2 0 0 0
THE LABOUR MARKET AND INCOME DISTRIBUTION IN COLOMBIA IN THE 1990S • JOSE ANTONIO OCAMPO, FABIO SANCHEZAND CAMILO ERNESTO TOVAR
the large reduction in poverty levels seen over the periodanalysed, which would suggest that there are otherfactors behind this trend. The work of Núñez andSánchez (1999) shows that the fall in the percentage ofpeople living in poverty in the seven main cities wasfundamentally due to changes in the relative price ofthe basket of foodstuffs used to measure the povertyline. Of the 12 percentage points by which povertydeclined, around 8.5 points are accounted for by a “priceeffect”, in that the inflation rate of the poverty linebasket of foodstuffs was lower than general inflation.
This methodology works better when it comes toaccounting for changes in rural poverty. Thus, theresults of the simulation show that if 1991 conditionsin the rural labour market had obtained in 1997, thepercentage of people living in poverty in the countrysidewould have been lower than it actually was. Inparticular, the variable that played the greatest part in
the rise in the rural poverty percentage was thecomposition of employment, which accounts for 60%of the change (0.0293 points out of 0.0490) in theincidence of poverty. The sequential simulation, whichtakes account of the set of labour market conditionsobtaining in 1991, shows that these variables, taken alltogether, account for 59% of the rise in the incidenceof rural poverty (0.0287 out of 0.0490 points).
3. Analysis of labour market effects byincome decile
In order to consider in more detail which groups havebeen the most affected by the changes in the labourmarket, the simulation exercises were applied to eachof the income deciles, in both rural and urban areas,for three variables: total income per capita, earningsper capita and incomes of those in work. The methodwas used to observe only the isolated effect of each ofthe labour market variables, without sequential simu-lation being carried out.
To provide a more accurate understanding of theresults of the simulation exercises, table 12 gives somecharacteristics of the labour market by total per capitahousehold income deciles. As can be seen, participationrates fell considerably between 1991 and 1997 in thetwo lowest income deciles and, to a lesser extent, indeciles 3 to 6. In the upper income deciles, by contrast,the labour force participation rate was very similar in1997 to what it had been in 1991. The pattern of thechanges that occurred differs between urban and ruralareas. While in urban areas the level of labour forceparticipation fell in the poorest deciles and, to a lesserextent, in the richest ones, the rural participation rateincreased in all the deciles, particularly the poorest ones,except for the top income decile, where it fell.
Between 1991 and 1997 the unemployment ratein the country as a whole rose by around three points.As table 12 shows, this increase was concentrated inthe poorer income deciles, in both urban and rural areas.Between these years, earnings increased in all urbanincome deciles, although the increase was greater inthe upper deciles. Earnings in rural areas, meanwhile,increased in the first four deciles and in decile 10, butfell in deciles 5 to 9.
The effects of these labour market changes on to-tal per capita income are shown in the left-hand panelof table 13. This shows that if 1991 labour force par-ticipation rates had obtained in 1997, the poorer deciles,particularly decile 6 and below, would have increasedtheir share of total income, which in turn would have
TABLE 11
Colombia: Simulations of the effects of labour marketchanges on the population below the poverty line (PL),1991 and 1997
National Urban Rural
PL 1991 0.4180 0.3750 0.5500PL 1997 0.4140 0.2890 0.5990Difference -0.0040 -0.0860 0.0490
Labour force participation
Simulated 0.4081 0.2852 0.5893Difference -0.0059 -0.0038 -0.0097Explanatory % -146.7 -4.4 -19.7
Unemployment
Simulated 0.4071 0.2824 0.5953Difference -0.0069 -0.0066 -0.0037Explanatory % -171.6 -7.6 7.6
Sectoral composition of employment
Simulated 0.3994 0.2811 0.5697Difference -0.0146 -0.0079 -0.0293Explanatory % -365.8 -9.2 -59.9
Relative wages
Simulated 0.4156 0.2905 0.6001Difference 0.0016 0.0015 0.0011Explanatory % 40.9 1.8 2.2
Sequential
Simulated 0.4020 0.2839 0.5703Difference -0.0120 -0.0051 -0.0287Explanatory % -300.1 -6.0 -58.6
Source: Calculated by the author on the basis of National House-hold Surveys.

C E P A L R E V I E W 7 2 • D E C E M B E R 2 0 0 074
THE LABOUR MARKET AND INCOME DISTRIBUTION IN COLOMBIA IN THE 1990S • JOSE ANTONIO OCAMPO, FABIO SANCHEZAND CAMILO ERNESTO TOVAR
improved income distribution. This is consistent withtable 12, which shows that labour force participationfell in the poorer deciles in the period being consid-ered. The same thing happens with the simulated ef-fect of the unemployment rate, although the greatesteffect on income would have been seen mainly indeciles 2 to 7. Meanwhile, the simulated effect of thechanges in the sectoral composition of employment isto increase the share of deciles 5 and 6 and, particu-larly, decile 10 in total income per capita. Lastly, thesimulated wage effect shows that if the national wage
structure seen in 1991 had obtained in 1997, all theincome deciles would have increased their share of to-tal income except the richest decile, which is the onethat would have lost out.
The simulations for urban areas of the effects ofthe labour market on changes in the shares of thedifferent deciles confirm the results obtained in theprevious section. If the labour market structureobtaining in 1991, in terms of the urban participationrate, unemployment rate, sectoral composition ofemployment and wages, had continued unchanged in1997, the total income share of deciles 6 and belowwould have been higher, and this would have improvedincome distribution. This agrees with the results of table12, which show that deciles 6 and below experienceddeclines in labour force participation, rises inunemployment and increases in earnings that were smallerthan those seen in the case of the higher income deciles. Itcan be seen, however, that it is deciles 3 to 6, rather thanthe poorest ones, that would have benefited most.
In rural areas, if the 1991 rural labour forceparticipation rate had obtained in 1997, the incomeshares of deciles 8 and below would have been lower,particularly where deciles 3 to 7 are concerned, whilethe shares of deciles 9 and 10 would have increased,implying a higher Gini coefficient. An effect similar tothe above is seen when the effect of the unemploymentrate is simulated. Simulation of the effects of theemployment structure and wages on changes in theshare of each decile in total rural income shows thatthis share would have declined for the poorest quintilesand increased for the richest ones in the countryside,which in turn would have meant higher incomeconcentration. As regards the effect of the sectoralcomposition of employment, it transpires that thesenegative effects would have been greatest in deciles 2to 4, while the positive ones would have occurredmainly in deciles 8 to 10. In the case of the effect ofwages, the simulation shows that all deciles would haveseen their income share decline, except for the richestone. The results confirm the trend in the rural labourmarket between 1991 and 1997, with greater increasesin labour force participation and unemployment in thepoorer deciles, higher earnings for deciles 5 and belowand decile 10, and lower ones for deciles 6 to 9.
The middle panel of table 13 contains the same setof simulations as was described earlier, carried out onthis occasion, however, on per capita earnings insteadof total income. The simulated effect of the participationrate and the unemployment rate on changes in theearnings shares of the different deciles shows results
TABLE 12
Colombia: Labour market indicators by income deciles,1991 and 1997
National total Urban Rural1991 1997 1991 1997 1991 1997
Total participation rate %
Decile 1 54.7 49.2 55.5 44.7 46.4 52.9Decile 2 56.5 49.3 47.3 47.5 49.9 59.1Decile 3 53.1 50.1 49.8 50.5 49.6 57.7Decile 4 54.2 53.2 51.8 53.6 51.0 55.5Decile 5 55.7 56.4 53.9 56.3 53.7 56.6Decile 6 57.1 56.6 59.3 57.4 57.6 59.2Decile 7 58.9 59.1 59.0 59.1 59.4 60.5Decile 8 61.8 61.0 61.8 63.0 63.1 61.5Decile 9 63.8 65.2 65.7 65.9 64.2 64.8Decile 10 68.9 68.4 70.9 69.9 72.2 68.6
Unemployment rate (%)
Decile 1 7.3 16.9 10.0 30.7 5.4 12.9Decile 2 8.5 13.8 17.4 20.0 6.1 10.7Decile 3 8.8 14.0 16.4 16.2 5.8 7.9Decile 4 8.7 12.7 14.3 14.6 6.2 6.1Decile 5 9.2 11.7 11.6 11.4 4.4 6.9Decile 6 8.3 10.5 10.6 10.8 3.6 5.0Decile 7 7.3 9.3 9.0 8.3 5.1 5.4Decile 8 6.6 7.2 6.2 6.3 4.1 5.0Decile 9 5.5 6.2 5.3 6.5 2.3 4.1Decile 10 4.0 4.2 3.2 3.5 1.3 2.0
Annual earnings per capita (1997 pesos)
Decile 1 53 677 44 486 107 299 136 789 33 033 54 196Decile 2 61 566 92 052 124 861 156 049 42 090 65 726Decile 3 106 358 124 307 158 767 171 500 72 840 83 743Decile 4 130 392 142 184 185 706 196 359 98 041 102 341Decile 5 149 833 166 767 205 006 207 569 113 091 110 448Decile 6 167 176 190 167 217 198 242 878 122 326 120 235Decile 7 185 970 223 300 251 955 263 876 139 755 121 570Decile 8 211 027 260 934 286 987 311 433 146 987 132 912Decile 9 262 110 348 211 371 026 417 982 162 367 150 980Decile 10 601 382 850 812 781 936 940 018 186 405 196 843
Source: Calculated by the author on the basis of National House-hold Surveys.

75C E P A L R E V I E W 7 2 • D E C E M B E R 2 0 0 0
THE LABOUR MARKET AND INCOME DISTRIBUTION IN COLOMBIA IN THE 1990S • JOSE ANTONIO OCAMPO, FABIO SANCHEZAND CAMILO ERNESTO TOVAR
TABLE 13Colombia: Changes in shares of total per capita household income, per capitahousehold earnings and income of the employed. Simulations of changes in the labourmarket, 1991-1997(Percentages)
Change in share of total per capita Change in share of per capita Change in share of income household income household earnings of the employed
National Urban Rural National Urban Rural National Urban Rural
Labour force participation
Decile 1 0.05 0.01 -0.03 0.01 0.03 -0.01 0.06 0.03 0.04Decile 2 0.06 0.02 -0.07 0.03 0.04 -0.02 0.08 0.06 0.17Decile 3 0.05 0.05 -0.09 0.02 0.03 -0.03 0.11 0.07 0.13Decile 4 0.08 0.04 -0.11 0.01 0.06 -0.03 0.11 0.01 -0.01Decile 5 0.06 0.04 -0.11 0.04 0.06 -0.05 0.06 0.01 0.04Decile 6 0.04 0.03 -0.10 0.05 0.04 -0.07 0.10 0.19 0.08Decile 7 0.00 0.00 -0.11 0.04 0.04 -0.02 0.22 0.05 -0.10Decile 8 -0.02 0.00 -0.01 0.02 0.04 -0.02 0.09 0.06 -0.07Decile 9 -0.04 -0.04 0.19 0.01 0.04 -0.03 -0.02 -0.02 0.40Decile 10 -0.27 -0.16 0.45 -0.24 -0.39 0.29 -0.83 -0.47 -0.69
Unemployment
Decile 1 0.04 0.01 -0.03 0.00 0.01 0.00 0.07 0.07 0.06Decile 2 0.07 0.02 -0.07 -0.01 0.01 -0.01 0.12 0.11 0.12Decile 3 0.08 0.04 -0.09 0.00 0.02 -0.02 0.14 0.16 0.18Decile 4 0.08 0.06 -0.09 0.00 0.01 -0.03 0.18 0.15 0.20Decile 5 0.09 0.05 -0.13 0.01 0.00 -0.01 0.18 0.20 0.18Decile 6 0.05 0.05 -0.11 0.01 0.03 -0.02 0.22 0.19 0.22Decile 7 0.03 0.03 -0.10 0.02 0.00 0.00 0.18 0.20 0.21Decile 8 -0.04 0.02 -0.01 0.00 0.02 0.05 0.18 0.15 0.07Decile 9 -0.07 -0.02 0.17 -0.02 -0.03 0.06 0.10 0.03 0.09Decile 10 -0.33 -0.27 0.48 -0.01 -0.08 -0.03 -1.37 -1.25 -1.33
Sectoral composition of employment
Decile 1 -0.02 0.00 -0.03 0.13 0.05 -0.17 0.07 0.08 0.05Decile 2 -0.05 0.00 -0.08 0.16 0.05 -0.37 0.14 0.13 0.16Decile 3 -0.02 -0.03 -0.09 0.14 0.09 -0.37 0.17 0.17 0.18Decile 4 -0.08 0.02 -0.13 0.16 0.08 -0.33 0.20 0.21 0.21Decile 5 0.05 0.03 -0.04 0.16 0.12 -0.32 0.24 0.19 0.23Decile 6 0.07 -0.04 -0.05 0.18 0.09 -0.23 0.22 0.26 0.25Decile 7 -0.08 -0.04 -0.03 0.15 0.10 -0.24 0.28 0.25 0.18Decile 8 -0.04 -0.04 0.17 0.15 0.09 -0.30 0.26 0.21 0.12Decile 9 -0.06 -0.07 0.14 0.08 0.05 -0.14 0.05 0.02 0.07Decile 10 0.22 0.16 0.14 -1.30 -0.72 2.47 -1.63 -1.53 -1.45
Relative wages
Decile 1 0.02 0.03 -0.02 0.13 0.05 -0.17 0.07 0.02 0.09Decile 2 0.03 0.02 -0.03 0.19 0.07 -0.39 0.11 0.11 0.20Decile 3 0.01 0.04 -0.05 0.18 0.08 -0.42 0.19 0.13 0.19Decile 4 0.03 0.04 -0.03 0.16 0.09 -0.33 0.17 0.19 0.20Decile 5 0.05 0.05 -0.05 0.19 0.10 -0.36 0.22 0.26 0.27Decile 6 0.05 0.05 -0.03 0.17 0.13 -0.28 0.32 0.32 0.29Decile 7 0.04 0.06 -0.03 0.20 0.12 -0.22 0.26 0.23 0.03Decile 8 0.02 0.07 -0.05 0.18 0.10 -0.36 0.17 0.13 0.22Decile 9 0.01 0.03 -0.06 0.06 -0.02 -0.23 -0.12 -0.13 0.15Decile 10 -0.28 -0.38 0.37 -1.47 -0.73 2.77 -1.40 -1.27 -1.65
Source: Calculated by the author on the basis of National Household Surveys.
C E P A L R E V I E W 7 2 • D E C E M B E R 2 0 0 076
THE LABOUR MARKET AND INCOME DISTRIBUTION IN COLOMBIA IN THE 1990S • JOSE ANTONIO OCAMPO, FABIO SANCHEZAND CAMILO ERNESTO TOVAR
similar to those obtained in the case of total income,although the values are generally lower, particularlywhere the simulation of the effects of the unemploymentrate is concerned. By contrast, the simulated effects ofemployment composition and changes in wage earningsare greater. Thus, the table shows that the earningsshares of all the deciles, both in the country as a wholeand in urban areas, would have been higher than theyactually were, with the exception of the richest quintile(and only to a small degree in the case of decile 9 inurban areas). For rural areas, the effects of employmentcomposition and the wage structure on rural incomeshares are also greater than those actually seen in thecase of total incomes. The earnings shares of all thedeciles would have been lower, except in the case ofthe richest decile, whose share would have beensignificantly higher.
Meanwhile, the simulations of the effects of thelabour market on the income shares of the differentdeciles of people in work, as shown in the right-handpanel of table 13, give results that, for the national totaland for urban areas, are very similar to those obtainedin the case of per capita earnings (central panel of thetable), but that are obviously much more pronouncedin the case of unemployment. The same does not holdtrue, however, for rural areas. In particular, the effectsof the labour market on the different income recipientswould appear to operate in the same direction in urbanand rural areas, rather than in opposite directions ashappens with the alternative simulations. To achieve amuch more accurate understanding of why thesecontrary effects are seen, it would be necessary to carryout a detailed study of changes in the structure of ruralhouseholds during the 1990s.
VIConclusions
This paper has analysed the changes undergone by thelabour market and income distribution over the periodfalling between 1991, when the reforms began, and1997. During those years, economic growth wasdetermined by the large swings experienced inaggregate domestic demand. The production structure,meanwhile, underwent appreciable changes: there wasan increase in the relative weight of sectors producinggoods and services that are not traded internationally,while there was a marked decline in tradable sectors,particularly agriculture and industry.
The repercussions of these changes in the labourmarket were significant. The ability of the economy togenerate employment deteriorated considerably. Thisphenomenon, furthermore, is not a recent one, as it beganto manifest itself during the spectacular surge in aggregatedemand seen between 1992 and 1995. At that time it wasnot reflected in the unemployment rate because of thefavourable trend in labour market participation. In sectoralterms, the decline in the ability of agriculture to generateemployment was plain to see at the beginning of thedecade, while in the case of industry it dates from theslowdown in that sector in the middle of the decade. Thesedevelopments were offset during the upturn in the firsthalf of the 1990s by the positive situation of non-tradableactivities, but this favourable effect disappeared when
the boom in domestic demand died down in the middleof the decade.
Those mainly affected by the adverse trend inemployment were workers with a lower level ofeducation. The changes undergone by the productionstructure, in fact, have hit the least well educatedworkers hardest, since it was these who were mostaffected by the loss of jobs in tradable sectors, whilethe rise in employment in non-tradable sectors tendedto favour more highly educated workers. Technologicalchange, meanwhile, has been capital-intensive and hasreduced the need for labour at all levels of education,although less highly qualified workers have sufferedmost. The bias in labour demand towards better educatedworkers, resulting from economic liberalization, is alsoreflected in the increased profitability of the higher levelsof education and in the improved incomes of theseworkers relative to others, which has had an adverse effecton urban income distribution.
Between 1991 and 1997 the country experienceda rise in income concentration as measured by the Ginicoefficient, although this was the net outcome ofcontrary tendencies in urban and rural areas.Simulations of the income distribution effects of labourmarket changes between 1991 and 1997 show that themost significant effects in the country as a whole were

77C E P A L R E V I E W 7 2 • D E C E M B E R 2 0 0 0
THE LABOUR MARKET AND INCOME DISTRIBUTION IN COLOMBIA IN THE 1990S • JOSE ANTONIO OCAMPO, FABIO SANCHEZAND CAMILO ERNESTO TOVAR
produced by the sectoral composition of employmentand the wage structure, and to a lesser degree bychanges in the labour force participation andunemployment rates. The same results are obtained forurban areas. The simulations for rural areas show thatthe changes which took place in the labour marketbetween 1991 and 1997, and particularly the changes
in the employment structure, helped to reduce incomeconcentration. Movements in poverty, particularly thesharp decline seen in urban areas between 1991 and1997, were dominated by other factors, above all thesignificant fall in the cost of the basic food basket, whichobviously had opposite effects, in terms of income, inurban and rural areas.
Bibliography
Birchenall, J. (1997): Income Distribution, Human Capitaland Economic Growth in Colombia, Archivos demacroeconomía, No. 70, Bogotá, Colombia, NationalPlanning Department. Macroeconomic Analysis Unit.
Bernal, R., M. Cárdenas, F. Sánchez and J. Núñez (1998): Eldesempeño de la macroeconomía y la igualdad: 1976-1996, F. Sánchez (ed.), La distribución del ingreso enColombia: tendencias recientes y retos de la políticapública, Bogotá, Tercer Mundo Editores.
Colombia, Contraloría General de la República (1986): Elproblema laboral colombiano: diagnóstico,perspectivas y políticas. Informe final de la Misión deEmpleo, Economía colombiana, No. 10, Bogotá.
Colombia, DANE (Departamento Administrativo Nacional deEstadística) (1999): Evolución de la economíacolombiana. Primer trimestre de 1999, Bogotá.
Colombia, DNP (Departamento Nacional de Planeación)/UNDP(United Nations Development Programme) (1998):Informe de desarrollo humano para Colombia, 1998,Bogotá, Tercer Mundo Editores.
Farné, S., A. Vivas and J. Núñez (1998): La estabilidad laboralen el mercado de trabajo urbano en Colombia, 1984-1986, Bogotá, mimeo.
Henao, M.L. and A. Parra (1998): Educación y mercados detrabajo, Empleo: un desafío para Colombia, Bogotá,International Labour Organization (ILO).
Leivobich, J. and J. Nuñez (1999): The Microeconomics ofIncome Distribution Dynamics in Rural Colombia(1978-1988-1995), CEDE Document, No. 12, Bogotá,Centre for Economic Development Studies, August.
Núñez, J. and F. Sánchez (1999): Estimaciones trimestralesde la línea de pobreza y sus relaciones con eldesempeño macroeconómico colombiano (1977-1997),Archivos de macroeconomía, No. 110, Bogotá, Co-lombia, National Planning Department. Macroeco-nomic Analysis Unit.
ILO (International Labour Oganization) (1998): Empleo: undesafío para Colombia, Bogotá, ILO/Ministry of LabourProject, mimeo.
Ocampo, J.A. (1997): Una evaluación de la situación fiscalcolombiana, Coyuntura económica, vol. XXVII, No. 2,Bogotá, Fundación para la Educación Superior y elDesarrollo (FEDESARROLLO), June.
(1998): Una década de grandes transformacioneseconómicas (1986-1996), Nueva historia de Colombia,vol. VIII, Bogotá, Editorial Planeta.
Ocampo, J.A., M.J. Pérez, C. Tovar and F.J. Lasso (1998):Macroeconomía, ajuste estructural y equidad en Colombia:1978-1996, E. Ganuza, L. Taylor and S. Morley (eds.),
Política macroeconómica y pobreza en América Latina yel Caribe, Madrid, Mundi Prensa.
Ocampo, J.A. and C. Tovar (1999): Price-Based CapitalAccount Regulations: The Colombian Experience,Financiamiento del desarrollo series, No. 87, Santiago,Chile, Economic Commission for Latin America andthe Caribbean (ECLAC).
Paes de Barros, R. (2000): Methodological issues, paperpresented for the project Liberalización de la balanzade pagos: efectos sobre el empleo, la distribución, lapobreza y el crecimiento, Buenos Aires, February.
Reina, M. and D. Yanovich (1998): Salud, educación ydesempleo: diagnóstico y recomendaciones, Cuadernos,No. 4, Bogotá, FEDESARROLLO.
Ribero, R. and J. García (1996): Estadísticas descriptivasdel mercado laboral masculino y femenino en Colom-bia: 1976-1995, Archivos de macroeconomía, No. 48,Bogotá, Colombia, National Planning Department.Macroeconomic Analysis Unit.
Sánchez, F. (ed.) (1998): La distribución del ingreso en Co-lombia: tendencias recientes y retos de la políticapública, Bogotá, Tercer Mundo Editores.
Sánchez, F. and J. Núñez (1998): Educación y salariosrelativos en Colombia, 1976-1995. Determinantes,evolución e implicaciones para la distribución delingreso, F. Sánchez (ed.), La distribución del ingresoen Colombia: tendencias recientes y retos de la políticapública, Bogotá, Tercer Mundo Editores.
(1999): Descentralización, pobreza y acceso a los serviciossociales. ¿Quién se benefició del gasto público en losnoventa?, Coyuntura social, No. 20, Bogotá, FEDESARROLLO.
Taylor, L. (1998): Balance of payments liberalization: Effectson employment, distribution, poverty and growth, termsof reference for the project Liberalización de la balanzade pagos: efectos sobre el empleo, la distribución, lapobreza y el crecimiento, Santiago, Chile, UnitedNations Development Programme (UNDP)/ECLAC/Inter-American development Bank (IDB)
Vélez, C.E., A. Kugler and C. Bouillón (1999): The reversalof inequality gains in urban Colombia, 1978-1995: acombination of persistent and fluctuating forces, Wash-ington, D.C., World Bank, mimeo.
Villar, L. and H. Rincón (2000): The Colombian economyin the nineties: capital flows and foreign exchangeregimes, paper presented at the conference CriticalIssues in Financial Reform: Latin American/Caribbeanand Canadian Perspectives, Toronto, University ofToronto, The Munk Centre for International StudiesProgramme on Latin America and the Caribbean, June.

C E P A L R E V I E W 7 2 • D E C E M B E R 2 0 0 078
THE LABOUR MARKET AND INCOME DISTRIBUTION IN COLOMBIA IN THE 1990S • JOSE ANTONIO OCAMPO, FABIO SANCHEZAND CAMILO ERNESTO TOVAR

79C E P A L R E V I E W 7 2 • D E C E M B E R 2 0 0 0
NEW CHALLENGES FOR EQUITY IN URUGUAY • RUBEN KAZTMAN, FERNANDO F ILGUEIRA AND MAG DALENA FURTADO
C E P A L R E V I E W 7 2
DECEMBER 2000
New challenges forequity in Uruguay
From the early decades of the twentieth century onward,the level of equity achieved in Uruguay, and the sophistica-tion of its social welfare institutions, set the country apartfrom the rest of Latin America. In the second half of thecentury, this heritage of democracy and equity survived thesevere tests to which it was subjected without fracturing toobadly. The strength of the country’s sociocultural founda-tions was convincingly demonstrated after the restorationof democracy in 1985, when Uruguay succeeded in main-taining the position it had traditionally held as the regionalleader in social development, this leadership being mani-fested at this time in the country’s indices of poverty andinequality as measured by income distribution, which werelow by the standards of other Latin American nations. Theauthors contend that in the last fifteen years of the twentiethcentury, Uruguay succeeded in coping with these challengesby maintaining a good balance between the political, socialand economic aspects of development. They analyse thesubject by placing the position of Uruguay in a Latin Ameri-can context. Using the same type of indicators, they thendescribe how the country evolved in the closing fifteen yearsof the twentieth century, after which they discuss some ofthe most important processes underlying these trends in themarket, in households and in the State. Lastly, they offersome reflections on the main challenges that the countrywill have to address if it is to retain or improve the level ofnational integration already achieved, on a basis of equity.
Rubén Kaztman
Director of the SocialIntegration, Poverty andExclusion ResearchProgramme,Universidad Católicade [email protected]
Fernando Filgueira
Doctor of Politics andResearcher with the [email protected]
Magdalena Furtado
EconomistECLAC Montevideo [email protected]
C E P A L R E V I E W 7 2 • D E C E M B E R 2 0 0 080
NEW CHALLENGES FOR EQUITY IN URUGUAY • RUBEN KAZTMAN, FERNANDO F ILGUEIRA AND MAG DALENA FURTADO
IIntroduction
Although it is a widespread phenomenon, the economicrestructuring that globalization entails does not occurin a social and political vacuum. On the contrary, ittakes place in societies that differ widely in terms oftheir regulatory systems, institutional structures, legalframeworks and welfare systems, which encapsulatethe most important features of their socioculturalcharacteristics. Thus, while the processes that stem fromcurrent development models are to be found in mostcountries, the pace, sequence and substance of reforms,and thus their social consequences, are different.
From the early decades of the twentieth centuryonward, the level of equity achieved in Uruguay, andthe sophistication of its social welfare institutions, setthe country apart from the rest of Latin America. Theabsence of significant ethnic and cultural divisions,substantial primary product surpluses and earlydemocratic consolidation were some of the factors thathelped establish the sociocultural foundations whichwere to give rise to this special position.
In the second half of the century, this heritage ofdemocracy and equity survived the severe tests to whichit was subjected without fracturing too badly. Thesetests included prolonged economic stagnation, conflictsbetween radically differing approaches to theorganization of society and the economy –whichimperilled political stability for a time– and a coupd’état which put a military Government into power. Thestrength of the country’s sociocultural foundations wasconvincingly demonstrated after the restoration ofdemocracy in 1985, when Uruguay succeeded inmaintaining the position it had traditionally held as theregional leader in social development, this leadership
being manifested at this time in the country’s indicesof poverty and inequality as measured by incomedistribution, which were low by the standards of otherLatin American nations.
The conditions brought about by the return todemocracy undoubtedly made it easier to preserve thisheritage of equity, and to cope with the new challengesthat threatened its survival. The country had to findits place in a globalized world, extend the boundariesof competitiveness and adapt the workings of welfareinstitutions to the demands of sustained growth withinthese new parameters, and the main threats stemmedfrom the consequences of these changes, whichaffected different segments of society in differentways.
In this section it is contended that, in the last fifteenyears of the twentieth century, the country managed tocope with these challenges by maintaining anappropriate balance between the political, social andeconomic aspects of development, which has led somespecialists in these subjects to regard it as an exampleof successful gradualism.1 In describing this processas “successful” –in a regional context, of course– weshould not overlook the fact that, like all Latin Americancountries, Uruguay is now being profoundly affectedby the serious problems that come with economicrestructuring, weak job creation and pressure toderegulate the labour market. In truth, the consequencesof these problems are already manifesting themselvesas rents in the traditionally integrated social fabric ofthe country, and in the warnings that are being soundedabout the difficulties involved in sustaining its style ofbalanced growth.
1 See the in-depth, comparative analysis of the Uruguayan case inFilgueira and Morães (1999).
The authors wish to thank Carlos Filgueira, Juan Andrés Morães,Juan Carlos Veronelli, Rafael Diez de Medina and Alvaro Fuentesfor their stimulating suggestions and for the comments they madeon a preliminary version of this paper.
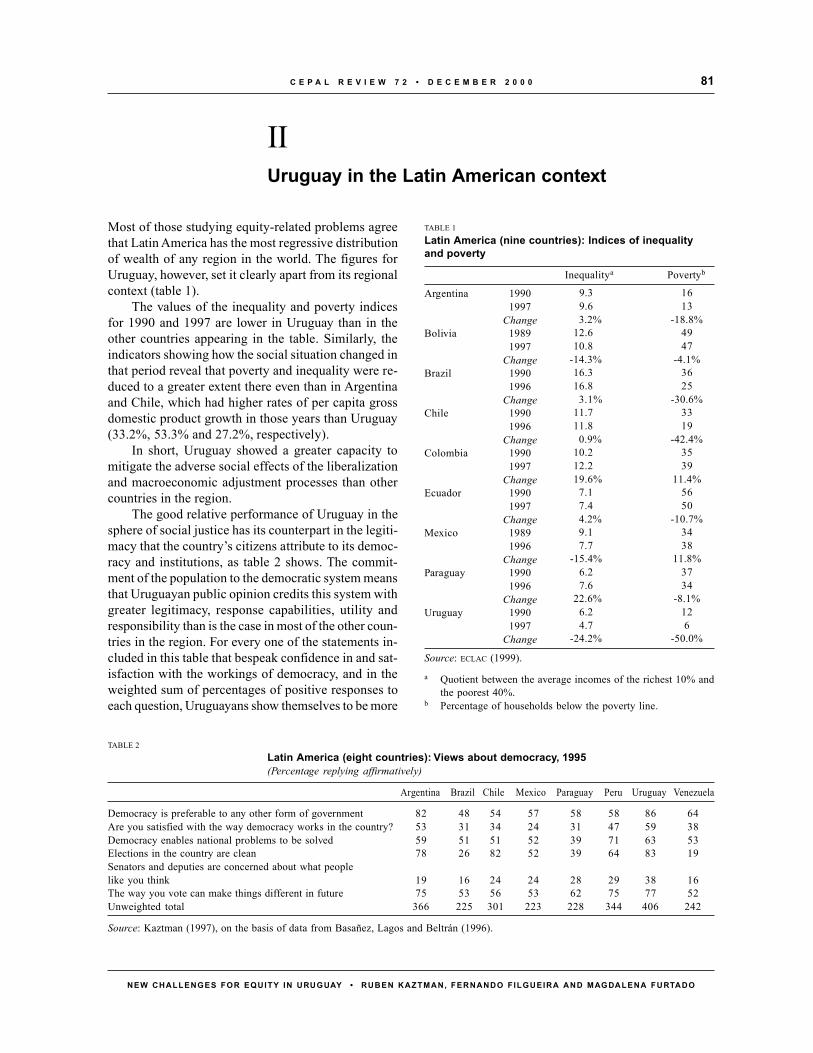
81C E P A L R E V I E W 7 2 • D E C E M B E R 2 0 0 0
NEW CHALLENGES FOR EQUITY IN URUGUAY • RUBEN KAZTMAN, FERNANDO F ILGUEIRA AND MAG DALENA FURTADO
IIUruguay in the Latin American context
Most of those studying equity-related problems agreethat Latin America has the most regressive distributionof wealth of any region in the world. The figures forUruguay, however, set it clearly apart from its regionalcontext (table 1).
The values of the inequality and poverty indicesfor 1990 and 1997 are lower in Uruguay than in theother countries appearing in the table. Similarly, theindicators showing how the social situation changed inthat period reveal that poverty and inequality were re-duced to a greater extent there even than in Argentinaand Chile, which had higher rates of per capita grossdomestic product growth in those years than Uruguay(33.2%, 53.3% and 27.2%, respectively).
In short, Uruguay showed a greater capacity tomitigate the adverse social effects of the liberalizationand macroeconomic adjustment processes than othercountries in the region.
The good relative performance of Uruguay in thesphere of social justice has its counterpart in the legiti-macy that the country’s citizens attribute to its democ-racy and institutions, as table 2 shows. The commit-ment of the population to the democratic system meansthat Uruguayan public opinion credits this system withgreater legitimacy, response capabilities, utility andresponsibility than is the case in most of the other coun-tries in the region. For every one of the statements in-cluded in this table that bespeak confidence in and sat-isfaction with the workings of democracy, and in theweighted sum of percentages of positive responses toeach question, Uruguayans show themselves to be more
TABLE 2Latin America (eight countries): Views about democracy, 1995(Percentage replying affirmatively)
Argentina Brazil Chile Mexico Paraguay Peru Uruguay Venezuela
Democracy is preferable to any other form of governmentAre you satisfied with the way democracy works in the country?Democracy enables national problems to be solvedElections in the country are cleanSenators and deputies are concerned about what peoplelike you thinkThe way you vote can make things different in futureUnweighted total
Source: Kaztman (1997), on the basis of data from Basañez, Lagos and Beltrán (1996).
82 48 54 57 58 58 86 6453 31 34 24 31 47 59 3859 51 51 52 39 71 63 5378 26 82 52 39 64 83 19
19 16 24 24 28 29 38 1675 53 56 53 62 75 77 52
366 225 301 223 228 344 406 242
TABLE 1
Latin America (nine countries): Indices of inequalityand poverty
Inequalitya Povertyb
Argentina 19901997
ChangeBolivia 1989
1997Change
Brazil 19901996
ChangeChile 1990
1996Change
Colombia 19901997
ChangeEcuador 1990
1997Change
Mexico 19891996
ChangeParaguay 1990
1996Change
Uruguay 19901997
Change
Source: ECLAC (1999).
a Quotient between the average incomes of the richest 10% andthe poorest 40%.
b Percentage of households below the poverty line.
9.3 169.6 133.2% -18.8%
12.6 4910.8 47
-14.3% -4.1%16.3 3616.8 25
3.1% -30.6%11.7 3311.8 19
0.9% -42.4%10.2 3512.2 3919.6% 11.4%
7.1 567.4 504.2% -10.7%9.1 347.7 38
-15.4% 11.8%6.2 377.6 34
22.6% -8.1%6.2 124.7 6
-24.2% -50.0%
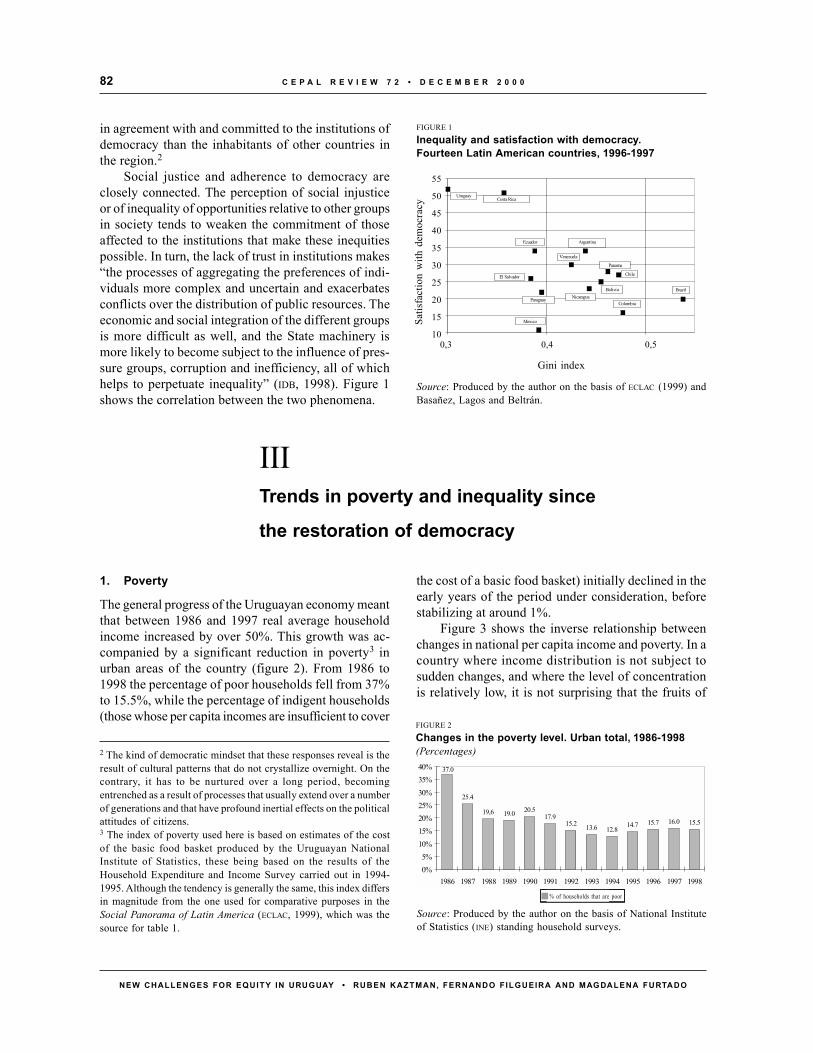
C E P A L R E V I E W 7 2 • D E C E M B E R 2 0 0 082
NEW CHALLENGES FOR EQUITY IN URUGUAY • RUBEN KAZTMAN, FERNANDO F ILGUEIRA AND MAG DALENA FURTADO
in agreement with and committed to the institutions ofdemocracy than the inhabitants of other countries inthe region.2
Social justice and adherence to democracy areclosely connected. The perception of social injusticeor of inequality of opportunities relative to other groupsin society tends to weaken the commitment of thoseaffected to the institutions that make these inequitiespossible. In turn, the lack of trust in institutions makes“the processes of aggregating the preferences of indi-viduals more complex and uncertain and exacerbatesconflicts over the distribution of public resources. Theeconomic and social integration of the different groupsis more difficult as well, and the State machinery ismore likely to become subject to the influence of pres-sure groups, corruption and inefficiency, all of whichhelps to perpetuate inequality” (IDB, 1998). Figure 1shows the correlation between the two phenomena.
IIITrends in poverty and inequality since
the restoration of democracy
1. Poverty
The general progress of the Uruguayan economy meantthat between 1986 and 1997 real average householdincome increased by over 50%. This growth was ac-companied by a significant reduction in poverty3 inurban areas of the country (figure 2). From 1986 to1998 the percentage of poor households fell from 37%to 15.5%, while the percentage of indigent households(those whose per capita incomes are insufficient to cover
the cost of a basic food basket) initially declined in theearly years of the period under consideration, beforestabilizing at around 1%.
Figure 3 shows the inverse relationship betweenchanges in national per capita income and poverty. In acountry where income distribution is not subject tosudden changes, and where the level of concentrationis relatively low, it is not surprising that the fruits of
2 The kind of democratic mindset that these responses reveal is theresult of cultural patterns that do not crystallize overnight. On thecontrary, it has to be nurtured over a long period, becomingentrenched as a result of processes that usually extend over a numberof generations and that have profound inertial effects on the politicalattitudes of citizens.3 The index of poverty used here is based on estimates of the costof the basic food basket produced by the Uruguayan NationalInstitute of Statistics, these being based on the results of theHousehold Expenditure and Income Survey carried out in 1994-1995. Although the tendency is generally the same, this index differsin magnitude from the one used for comparative purposes in theSocial Panorama of Latin America (ECLAC, 1999), which was thesource for table 1.
Source: Produced by the author on the basis of National Instituteof Statistics (INE) standing household surveys.
FIGURE 2
Changes in the poverty level. Urban total, 1986-1998(Percentages)
% of households that are poor
15.516.015.714.712.813.615.2
17.920.519.019,6
25.4
37.0
0%5%
10%15%20%25%30%35%40%
1986 1987 1988 1989 1990 1991 1992 1993 1994 1995 1996 1997 1998
FIGURE 1
Inequality and satisfaction with democracy.Fourteen Latin American countries, 1996-1997
Satis
fact
ion
with
dem
ocra
cy
Gini index
Source: Produced by the author on the basis of ECLAC (1999) andBasañez, Lagos and Beltrán.
55
50
45
40
35
30
25
20
15
100,3 0,4 0,5
UruguayCosta Rica
Ecuador
El Salvador
Paraguay
Mexico
Venezuela
Argentina
Panama
Chile
BoliviaNicaragua
Colombia
Brazil
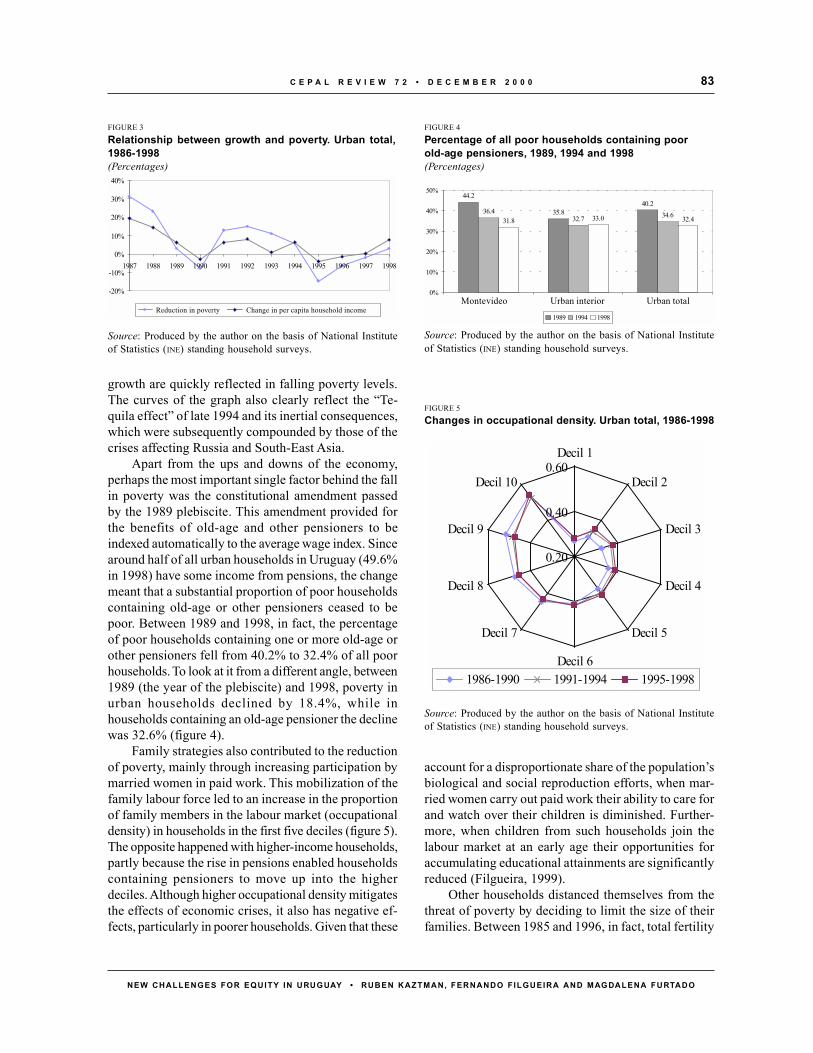
83C E P A L R E V I E W 7 2 • D E C E M B E R 2 0 0 0
NEW CHALLENGES FOR EQUITY IN URUGUAY • RUBEN KAZTMAN, FERNANDO F ILGUEIRA AND MAG DALENA FURTADO
growth are quickly reflected in falling poverty levels.The curves of the graph also clearly reflect the “Te-quila effect” of late 1994 and its inertial consequences,which were subsequently compounded by those of thecrises affecting Russia and South-East Asia.
Apart from the ups and downs of the economy,perhaps the most important single factor behind the fallin poverty was the constitutional amendment passedby the 1989 plebiscite. This amendment provided forthe benefits of old-age and other pensioners to beindexed automatically to the average wage index. Sincearound half of all urban households in Uruguay (49.6%in 1998) have some income from pensions, the changemeant that a substantial proportion of poor householdscontaining old-age or other pensioners ceased to bepoor. Between 1989 and 1998, in fact, the percentageof poor households containing one or more old-age orother pensioners fell from 40.2% to 32.4% of all poorhouseholds. To look at it from a different angle, between1989 (the year of the plebiscite) and 1998, poverty inurban households declined by 18.4%, while inhouseholds containing an old-age pensioner the declinewas 32.6% (figure 4).
Family strategies also contributed to the reductionof poverty, mainly through increasing participation bymarried women in paid work. This mobilization of thefamily labour force led to an increase in the proportionof family members in the labour market (occupationaldensity) in households in the first five deciles (figure 5).The opposite happened with higher-income households,partly because the rise in pensions enabled householdscontaining pensioners to move up into the higherdeciles. Although higher occupational density mitigatesthe effects of economic crises, it also has negative ef-fects, particularly in poorer households. Given that these
account for a disproportionate share of the population’sbiological and social reproduction efforts, when mar-ried women carry out paid work their ability to care forand watch over their children is diminished. Further-more, when children from such households join thelabour market at an early age their opportunities foraccumulating educational attainments are significantlyreduced (Filgueira, 1999).
Other households distanced themselves from thethreat of poverty by deciding to limit the size of theirfamilies. Between 1985 and 1996, in fact, total fertility
-20%
-10%
0%
10%
20%
30%
40%
1987 1988 1989 1990 1991 1992 1993 1994 1995 1996 1997 1998
Reducción de la pobreza Variación del ingreso per cápita de los hogares
FIGURE 3
Relationship between growth and poverty. Urban total,1986-1998(Percentages)
Reduction in poverty Change in per capita household income
Source: Produced by the author on the basis of National Instituteof Statistics (INE) standing household surveys.
40.235.8
44.2
34.632.736.4
32.433.031.8
0%
10%
20%
30%
40%
50%
Montevideo Interior Urbano Total Urbano
1989 1994 1998
FIGURE 4
Percentage of all poor households containing poorold-age pensioners, 1989, 1994 and 1998(Percentages)
Montevideo Urban interior Urban total
Source: Produced by the author on the basis of National Instituteof Statistics (INE) standing household surveys.
FIGURE 5Changes in occupational density. Urban total, 1986-1998
Source: Produced by the author on the basis of National Instituteof Statistics (INE) standing household surveys.
0.20
0.40
0.60Decil 1
Decil 2
Decil 3
Decil 4
Decil 5
Decil 6
Decil 7
Decil 8
Decil 9
Decil 10
1986-1990 1991-1994 1995-1998
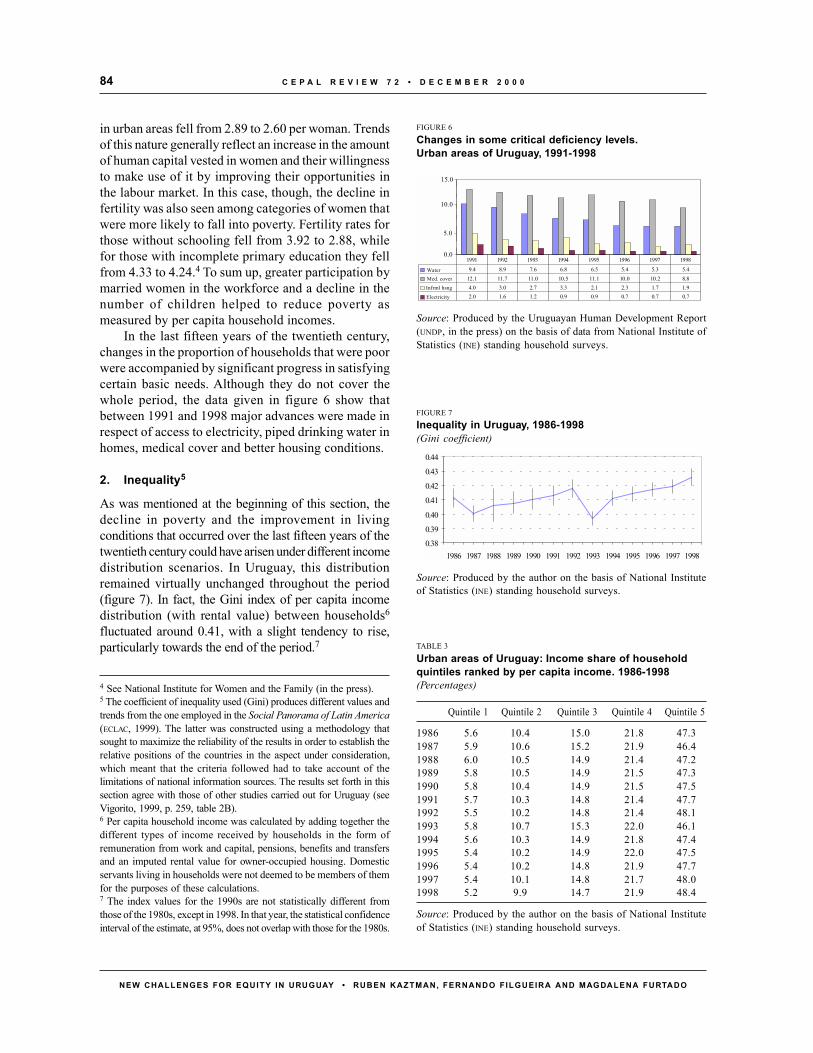
C E P A L R E V I E W 7 2 • D E C E M B E R 2 0 0 084
NEW CHALLENGES FOR EQUITY IN URUGUAY • RUBEN KAZTMAN, FERNANDO F ILGUEIRA AND MAG DALENA FURTADO
in urban areas fell from 2.89 to 2.60 per woman. Trendsof this nature generally reflect an increase in the amountof human capital vested in women and their willingnessto make use of it by improving their opportunities inthe labour market. In this case, though, the decline infertility was also seen among categories of women thatwere more likely to fall into poverty. Fertility rates forthose without schooling fell from 3.92 to 2.88, whilefor those with incomplete primary education they fellfrom 4.33 to 4.24.4 To sum up, greater participation bymarried women in the workforce and a decline in thenumber of children helped to reduce poverty asmeasured by per capita household incomes.
In the last fifteen years of the twentieth century,changes in the proportion of households that were poorwere accompanied by significant progress in satisfyingcertain basic needs. Although they do not cover thewhole period, the data given in figure 6 show thatbetween 1991 and 1998 major advances were made inrespect of access to electricity, piped drinking water inhomes, medical cover and better housing conditions.
2. Inequality5
As was mentioned at the beginning of this section, thedecline in poverty and the improvement in livingconditions that occurred over the last fifteen years of thetwentieth century could have arisen under different incomedistribution scenarios. In Uruguay, this distributionremained virtually unchanged throughout the period(figure 7). In fact, the Gini index of per capita incomedistribution (with rental value) between households6
fluctuated around 0.41, with a slight tendency to rise,particularly towards the end of the period.7
0.0
2.0
4.0
6.0
8.0
10.0
12.0
14.0
Agua 9.4 8.9 7.6 6.8 6.5 5.4 5.3 5.4
Cob. Médica 12.1 11.7 11.0 10.5 11.1 10.0 10.2 8.8Viv. Precaria 4.0 3.0 2.7 3.3 2.1 2.3 1.7 1.9Electricidad 2.0 1.6 1.2 0.9 0.9 0.7 0.7 0.7
1991 1992 1993 1994 1995 1996 1997 1998
FIGURE 6
Changes in some critical deficiency levels.Urban areas of Uruguay, 1991-1998
15.0
5.0
0.0
10.0
WaterMed. cover
Infrml hsng
Electricity
Source: Produced by the Uruguayan Human Development Report(UNDP, in the press) on the basis of data from National Institute ofStatistics (INE) standing household surveys.
FIGURE 7Inequality in Uruguay, 1986-1998(Gini coefficient)
Source: Produced by the author on the basis of National Instituteof Statistics (INE) standing household surveys.
0.38
0.39
0.40
0.41
0.42
0.43
0.44
1986 1987 1988 1989 1990 1991 1992 1993 1994 1995 1996 1997 1998
4 See National Institute for Women and the Family (in the press).5 The coefficient of inequality used (Gini) produces different values andtrends from the one employed in the Social Panorama of Latin America(ECLAC, 1999). The latter was constructed using a methodology thatsought to maximize the reliability of the results in order to establish therelative positions of the countries in the aspect under consideration,which meant that the criteria followed had to take account of thelimitations of national information sources. The results set forth in thissection agree with those of other studies carried out for Uruguay (seeVigorito, 1999, p. 259, table 2B).6 Per capita household income was calculated by adding together thedifferent types of income received by households in the form ofremuneration from work and capital, pensions, benefits and transfersand an imputed rental value for owner-occupied housing. Domesticservants living in households were not deemed to be members of themfor the purposes of these calculations.7 The index values for the 1990s are not statistically different fromthose of the 1980s, except in 1998. In that year, the statistical confidenceinterval of the estimate, at 95%, does not overlap with those for the 1980s.
TABLE 3
Urban areas of Uruguay: Income share of householdquintiles ranked by per capita income. 1986-1998(Percentages)
Quintile 1 Quintile 2 Quintile 3 Quintile 4 Quintile 5
1986 5.6 10.4 15.0 21.8 47.31987 5.9 10.6 15.2 21.9 46.41988 6.0 10.5 14.9 21.4 47.21989 5.8 10.5 14.9 21.5 47.31990 5.8 10.4 14.9 21.5 47.51991 5.7 10.3 14.8 21.4 47.71992 5.5 10.2 14.8 21.4 48.11993 5.8 10.7 15.3 22.0 46.11994 5.6 10.3 14.9 21.8 47.41995 5.4 10.2 14.9 22.0 47.51996 5.4 10.2 14.8 21.9 47.71997 5.4 10.1 14.8 21.7 48.01998 5.2 9.9 14.7 21.9 48.4
Source: Produced by the author on the basis of National Instituteof Statistics (INE) standing household surveys.

85C E P A L R E V I E W 7 2 • D E C E M B E R 2 0 0 0
NEW CHALLENGES FOR EQUITY IN URUGUAY • RUBEN KAZTMAN, FERNANDO F ILGUEIRA AND MAG DALENA FURTADO
A similar pattern is seen when, instead of asynthetic measure like the Gini index being used,changes in the income shares rece ived byhouseholds in each of the five per capita incomequintiles are tracked over the period. Thus, while
the movements seen over the entirety of the period1986-1998 are small, it transpires that the share ofthe 40% of urban households with the lowest incomesdeclined, while that of the richest 20% of householdsrose (table 3).
IVFactors determining trends in income distribution
1. Initial considerations
The modest extent of the changes in the incomedistribution indices may be misleading, as it might suggestthat inequality levels are relatively unaffected both by thetype of growth and by the major economic and socialprocesses affecting societies.8 The correct interpretationis quite different. Societies are constantly exposed to forcesthat shape their structures in more or less equitable ways,and that consequently affect different social categories indifferent directions and to differing degrees. The categoriesthat are affected adversely seek to counteract these effectsusing whatever individual and collective resources theycan mobilize.
When this view is taken, indicators of incomedistribution (and of wealth, when adequate informationis available) are interpreted rather as the outcome of acomplex web of forces set in train by the market on theone hand and by individuals, households and collectiveactors on the other. As we shall see later on, changes inthe market lead to shifts in the profitability of thedifferent factors of production, and thus affect bothaverage incomes and the distribution of income betweenthe different sources from which it derives.
Individuals react to changes in the market byopting, insofar as the opportunities available to themallow, for different courses of action. Within theirhouseholds, they are involved in decisions about thenumber of children to have, whether or not to keep themin the educational system when to do so begins tobecome incompatible with income needs, whetherpeople should enter or leave the household, and with
what frequency and level of commitment each memberof working age should participate in the labour market.On the institutional level, meanwhile, collective actorsstruggle among themselves to have a greater say in theway policy instruments are designed and implemented,using their social, political and economic resources toincrease or preserve their share in the fruits of growth,or to minimize the portion of costs they bear at timesof crisis. All these forces act beneath the surface,shaping the distribution of income and wealth in society.
We shall now take a more synthetic approach toexploring some of the factors that might have affectedthe distribution of income in Uruguay over the lastfifteen years of the second millennium.
2. Determining factors
a) Liberalization, fiscal adjustment and externalupheavals
Although it is still very early to claim that the new de-velopment styles have affected income distribution,some authors have identified an empirical associationbetween the structural reform processes that these stylesentail and an increase in inequality (Altimir, 1997).9Any attempt to apply this hypothesis to Uruguay wouldhave to take into account the particular characteristicsof its structural reform process, including among otherthings the absence of any significant privatizations andthe financial liberalization that was carried out as earlyas the 1970s.
In any event, between 1985 and 1998 Uruguaypushed ahead vigorously with the external liberalizationprocess and with measures to control the budget deficit.Tariff barriers were lowered, so that the average tariff
8 Li, Squire and Zou (1998) examined income distribution trendsin 45 countries for which there was good quality informationcovering long periods. They found that most of them (29) did notshow discernible tendencies in either direction, while the restdivided equally between rising inequality and falling inequality.
9 Altimir reached this finding after analysing five countries:Argentina, Brazil, Chile, Colombia and Mexico.
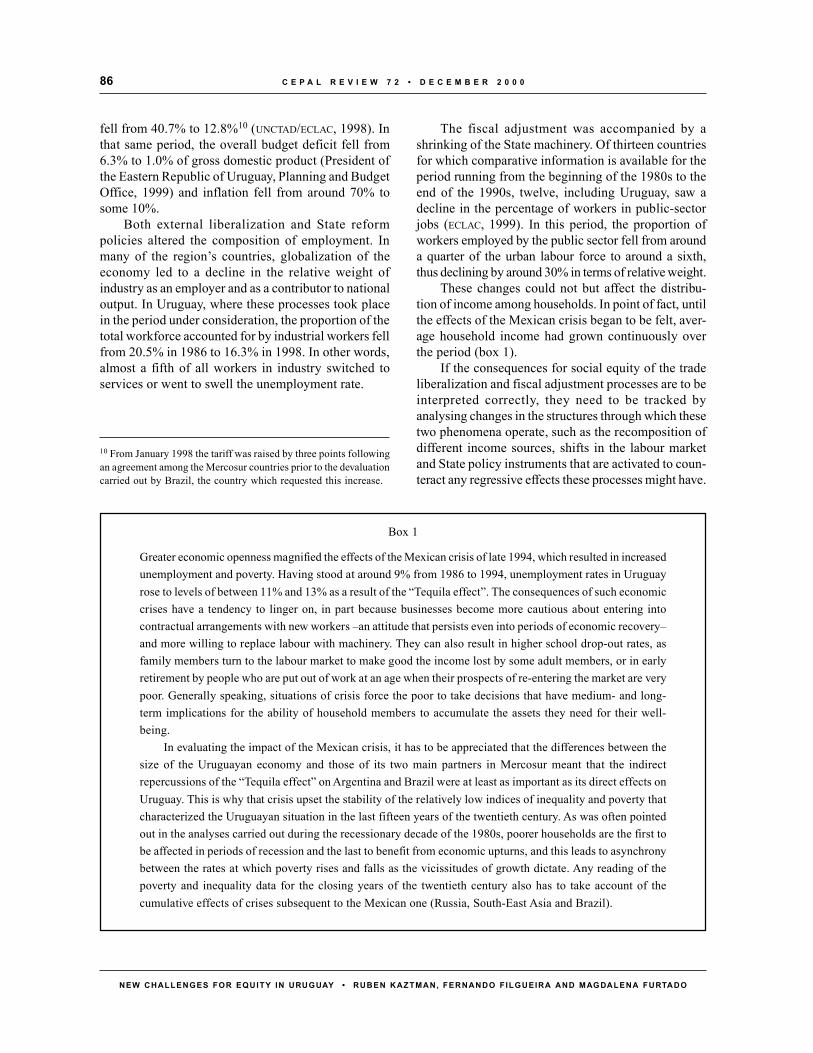
C E P A L R E V I E W 7 2 • D E C E M B E R 2 0 0 086
NEW CHALLENGES FOR EQUITY IN URUGUAY • RUBEN KAZTMAN, FERNANDO F ILGUEIRA AND MAG DALENA FURTADO
fell from 40.7% to 12.8%10 (UNCTAD/ECLAC, 1998). Inthat same period, the overall budget deficit fell from6.3% to 1.0% of gross domestic product (President ofthe Eastern Republic of Uruguay, Planning and BudgetOffice, 1999) and inflation fell from around 70% tosome 10%.
Both external liberalization and State reformpolicies altered the composition of employment. Inmany of the region’s countries, globalization of theeconomy led to a decline in the relative weight ofindustry as an employer and as a contributor to nationaloutput. In Uruguay, where these processes took placein the period under consideration, the proportion of thetotal workforce accounted for by industrial workers fellfrom 20.5% in 1986 to 16.3% in 1998. In other words,almost a fifth of all workers in industry switched toservices or went to swell the unemployment rate.
The fiscal adjustment was accompanied by ashrinking of the State machinery. Of thirteen countriesfor which comparative information is available for theperiod running from the beginning of the 1980s to theend of the 1990s, twelve, including Uruguay, saw adecline in the percentage of workers in public-sectorjobs (ECLAC, 1999). In this period, the proportion ofworkers employed by the public sector fell from arounda quarter of the urban labour force to around a sixth,thus declining by around 30% in terms of relative weight.
These changes could not but affect the distribu-tion of income among households. In point of fact, untilthe effects of the Mexican crisis began to be felt, aver-age household income had grown continuously overthe period (box 1).
If the consequences for social equity of the tradeliberalization and fiscal adjustment processes are to beinterpreted correctly, they need to be tracked byanalysing changes in the structures through which thesetwo phenomena operate, such as the recomposition ofdifferent income sources, shifts in the labour marketand State policy instruments that are activated to coun-teract any regressive effects these processes might have.
Box 1
Greater economic openness magnified the effects of the Mexican crisis of late 1994, which resulted in increasedunemployment and poverty. Having stood at around 9% from 1986 to 1994, unemployment rates in Uruguayrose to levels of between 11% and 13% as a result of the “Tequila effect”. The consequences of such economiccrises have a tendency to linger on, in part because businesses become more cautious about entering intocontractual arrangements with new workers –an attitude that persists even into periods of economic recovery–and more willing to replace labour with machinery. They can also result in higher school drop-out rates, asfamily members turn to the labour market to make good the income lost by some adult members, or in earlyretirement by people who are put out of work at an age when their prospects of re-entering the market are verypoor. Generally speaking, situations of crisis force the poor to take decisions that have medium- and long-term implications for the ability of household members to accumulate the assets they need for their well-being.
In evaluating the impact of the Mexican crisis, it has to be appreciated that the differences between thesize of the Uruguayan economy and those of its two main partners in Mercosur meant that the indirectrepercussions of the “Tequila effect” on Argentina and Brazil were at least as important as its direct effects onUruguay. This is why that crisis upset the stability of the relatively low indices of inequality and poverty thatcharacterized the Uruguayan situation in the last fifteen years of the twentieth century. As was often pointedout in the analyses carried out during the recessionary decade of the 1980s, poorer households are the first tobe affected in periods of recession and the last to benefit from economic upturns, and this leads to asynchronybetween the rates at which poverty rises and falls as the vicissitudes of growth dictate. Any reading of thepoverty and inequality data for the closing years of the twentieth century also has to take account of thecumulative effects of crises subsequent to the Mexican one (Russia, South-East Asia and Brazil).
10 From January 1998 the tariff was raised by three points followingan agreement among the Mercosur countries prior to the devaluationcarried out by Brazil, the country which requested this increase.
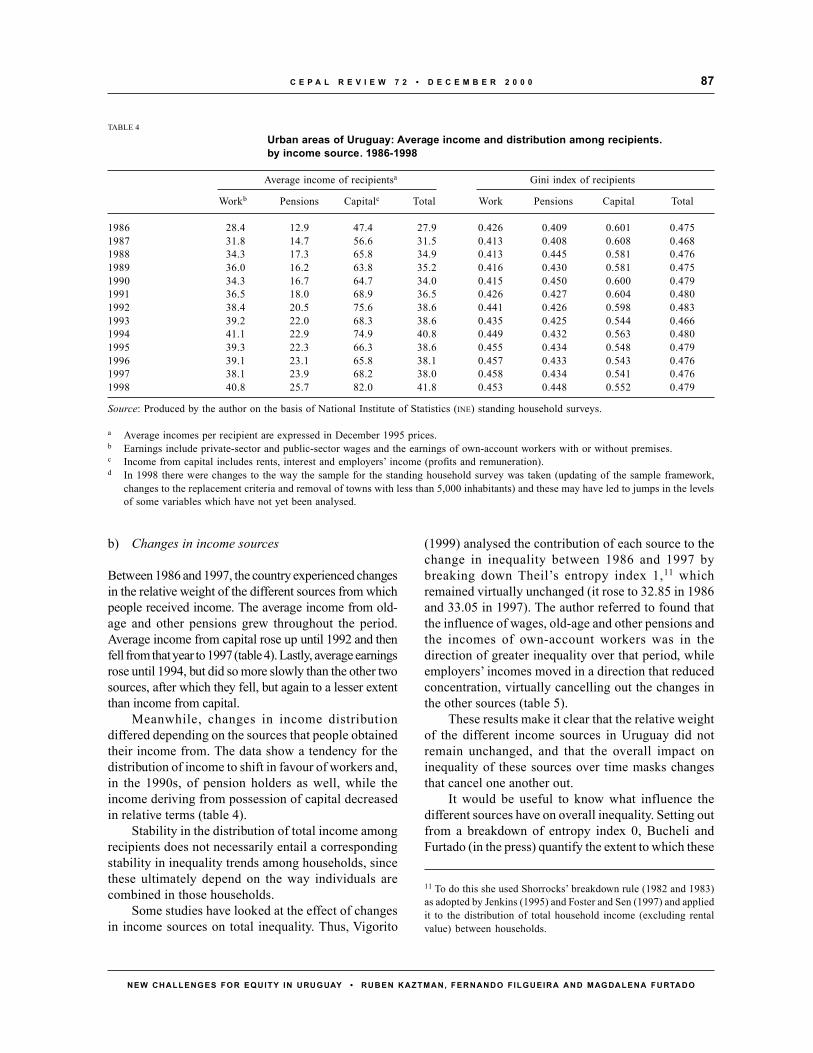
87C E P A L R E V I E W 7 2 • D E C E M B E R 2 0 0 0
NEW CHALLENGES FOR EQUITY IN URUGUAY • RUBEN KAZTMAN, FERNANDO F ILGUEIRA AND MAG DALENA FURTADO
b) Changes in income sources
Between 1986 and 1997, the country experienced changesin the relative weight of the different sources from whichpeople received income. The average income from old-age and other pensions grew throughout the period.Average income from capital rose up until 1992 and thenfell from that year to 1997 (table 4). Lastly, average earningsrose until 1994, but did so more slowly than the other twosources, after which they fell, but again to a lesser extentthan income from capital.
Meanwhile, changes in income distributiondiffered depending on the sources that people obtainedtheir income from. The data show a tendency for thedistribution of income to shift in favour of workers and,in the 1990s, of pension holders as well, while theincome deriving from possession of capital decreasedin relative terms (table 4).
Stability in the distribution of total income amongrecipients does not necessarily entail a correspondingstability in inequality trends among households, sincethese ultimately depend on the way individuals arecombined in those households.
Some studies have looked at the effect of changesin income sources on total inequality. Thus, Vigorito
(1999) analysed the contribution of each source to thechange in inequality between 1986 and 1997 bybreaking down Theil’s entropy index 1,11 whichremained virtually unchanged (it rose to 32.85 in 1986and 33.05 in 1997). The author referred to found thatthe influence of wages, old-age and other pensions andthe incomes of own-account workers was in thedirection of greater inequality over that period, whileemployers’ incomes moved in a direction that reducedconcentration, virtually cancelling out the changes inthe other sources (table 5).
These results make it clear that the relative weightof the different income sources in Uruguay did notremain unchanged, and that the overall impact oninequality of these sources over time masks changesthat cancel one another out.
It would be useful to know what influence thedifferent sources have on overall inequality. Setting outfrom a breakdown of entropy index 0, Bucheli andFurtado (in the press) quantify the extent to which these
11 To do this she used Shorrocks’ breakdown rule (1982 and 1983)as adopted by Jenkins (1995) and Foster and Sen (1997) and appliedit to the distribution of total household income (excluding rentalvalue) between households.
TABLE 4
Urban areas of Uruguay: Average income and distribution among recipients.by income source. 1986-1998
Average income of recipientsa Gini index of recipients
Workb Pensions Capitalc Total Work Pensions Capital Total
1986 28.4 12.9 47.4 27.9 0.426 0.409 0.601 0.4751987 31.8 14.7 56.6 31.5 0.413 0.408 0.608 0.4681988 34.3 17.3 65.8 34.9 0.413 0.445 0.581 0.4761989 36.0 16.2 63.8 35.2 0.416 0.430 0.581 0.4751990 34.3 16.7 64.7 34.0 0.415 0.450 0.600 0.4791991 36.5 18.0 68.9 36.5 0.426 0.427 0.604 0.4801992 38.4 20.5 75.6 38.6 0.441 0.426 0.598 0.4831993 39.2 22.0 68.3 38.6 0.435 0.425 0.544 0.4661994 41.1 22.9 74.9 40.8 0.449 0.432 0.563 0.4801995 39.3 22.3 66.3 38.6 0.455 0.434 0.548 0.4791996 39.1 23.1 65.8 38.1 0.457 0.433 0.543 0.4761997 38.1 23.9 68.2 38.0 0.458 0.434 0.541 0.4761998 40.8 25.7 82.0 41.8 0.453 0.448 0.552 0.479
Source: Produced by the author on the basis of National Institute of Statistics (INE) standing household surveys.
a Average incomes per recipient are expressed in December 1995 prices.b Earnings include private-sector and public-sector wages and the earnings of own-account workers with or without premises.c Income from capital includes rents, interest and employers’ income (profits and remuneration).d In 1998 there were changes to the way the sample for the standing household survey was taken (updating of the sample framework,
changes to the replacement criteria and removal of towns with less than 5,000 inhabitants) and these may have led to jumps in the levelsof some variables which have not yet been analysed.
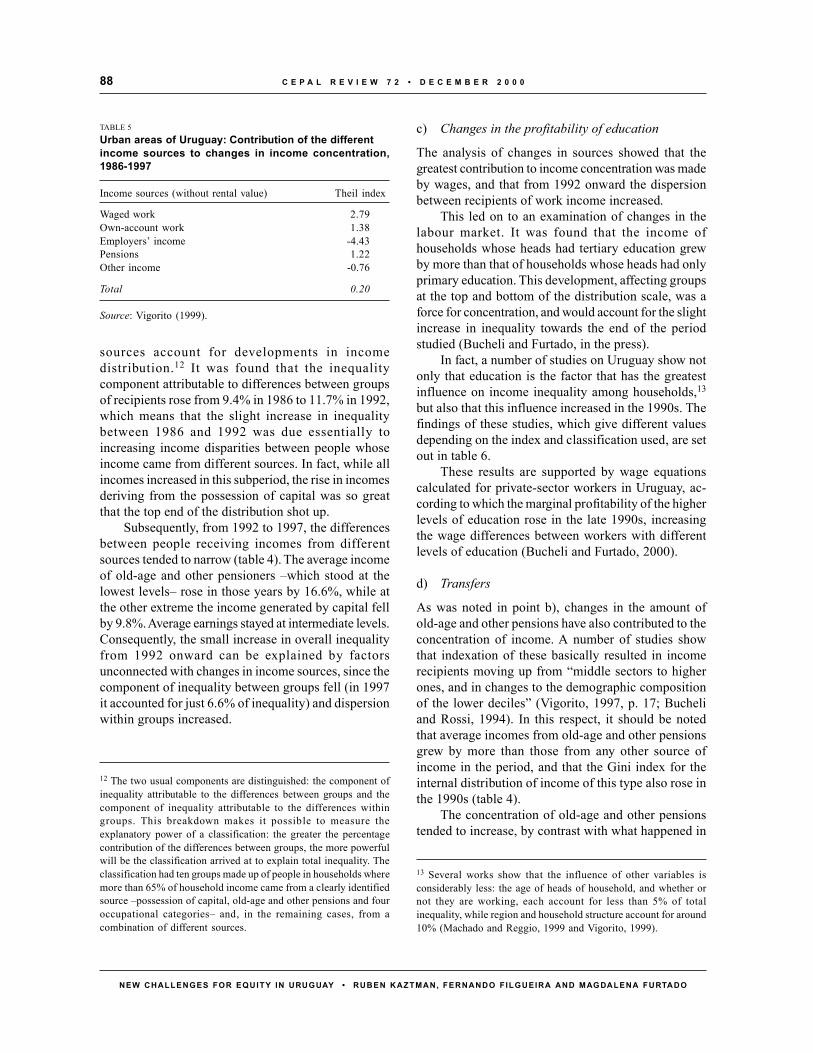
C E P A L R E V I E W 7 2 • D E C E M B E R 2 0 0 088
NEW CHALLENGES FOR EQUITY IN URUGUAY • RUBEN KAZTMAN, FERNANDO F ILGUEIRA AND MAG DALENA FURTADO
sources account for developments in incomedistribution.12 It was found that the inequalitycomponent attributable to differences between groupsof recipients rose from 9.4% in 1986 to 11.7% in 1992,which means that the slight increase in inequalitybetween 1986 and 1992 was due essentially toincreasing income disparities between people whoseincome came from different sources. In fact, while allincomes increased in this subperiod, the rise in incomesderiving from the possession of capital was so greatthat the top end of the distribution shot up.
Subsequently, from 1992 to 1997, the differencesbetween people receiving incomes from differentsources tended to narrow (table 4). The average incomeof old-age and other pensioners –which stood at thelowest levels– rose in those years by 16.6%, while atthe other extreme the income generated by capital fellby 9.8%. Average earnings stayed at intermediate levels.Consequently, the small increase in overall inequalityfrom 1992 onward can be explained by factorsunconnected with changes in income sources, since thecomponent of inequality between groups fell (in 1997it accounted for just 6.6% of inequality) and dispersionwithin groups increased.
c) Changes in the profitability of education
The analysis of changes in sources showed that thegreatest contribution to income concentration was madeby wages, and that from 1992 onward the dispersionbetween recipients of work income increased.
This led on to an examination of changes in thelabour market. It was found that the income ofhouseholds whose heads had tertiary education grewby more than that of households whose heads had onlyprimary education. This development, affecting groupsat the top and bottom of the distribution scale, was aforce for concentration, and would account for the slightincrease in inequality towards the end of the periodstudied (Bucheli and Furtado, in the press).
In fact, a number of studies on Uruguay show notonly that education is the factor that has the greatestinfluence on income inequality among households,13
but also that this influence increased in the 1990s. Thefindings of these studies, which give different valuesdepending on the index and classification used, are setout in table 6.
These results are supported by wage equationscalculated for private-sector workers in Uruguay, ac-cording to which the marginal profitability of the higherlevels of education rose in the late 1990s, increasingthe wage differences between workers with differentlevels of education (Bucheli and Furtado, 2000).
d) Transfers
As was noted in point b), changes in the amount ofold-age and other pensions have also contributed to theconcentration of income. A number of studies showthat indexation of these basically resulted in incomerecipients moving up from “middle sectors to higherones, and in changes to the demographic compositionof the lower deciles” (Vigorito, 1997, p. 17; Bucheliand Rossi, 1994). In this respect, it should be notedthat average incomes from old-age and other pensionsgrew by more than those from any other source ofincome in the period, and that the Gini index for theinternal distribution of income of this type also rose inthe 1990s (table 4).
The concentration of old-age and other pensionstended to increase, by contrast with what happened in
TABLE 5
Urban areas of Uruguay: Contribution of the differentincome sources to changes in income concentration,1986-1997
Income sources (without rental value) Theil index
Waged work 2.79Own-account work 1.38Employers’ income -4.43Pensions 1.22Other income -0.76
Total 0.20
Source: Vigorito (1999).
12 The two usual components are distinguished: the component ofinequality attributable to the differences between groups and thecomponent of inequality attributable to the differences withingroups. This breakdown makes it possible to measure theexplanatory power of a classification: the greater the percentagecontribution of the differences between groups, the more powerfulwill be the classification arrived at to explain total inequality. Theclassification had ten groups made up of people in households wheremore than 65% of household income came from a clearly identifiedsource –possession of capital, old-age and other pensions and fouroccupational categories– and, in the remaining cases, from acombination of different sources.
13 Several works show that the influence of other variables isconsiderably less: the age of heads of household, and whether ornot they are working, each account for less than 5% of totalinequality, while region and household structure account for around10% (Machado and Reggio, 1999 and Vigorito, 1999).
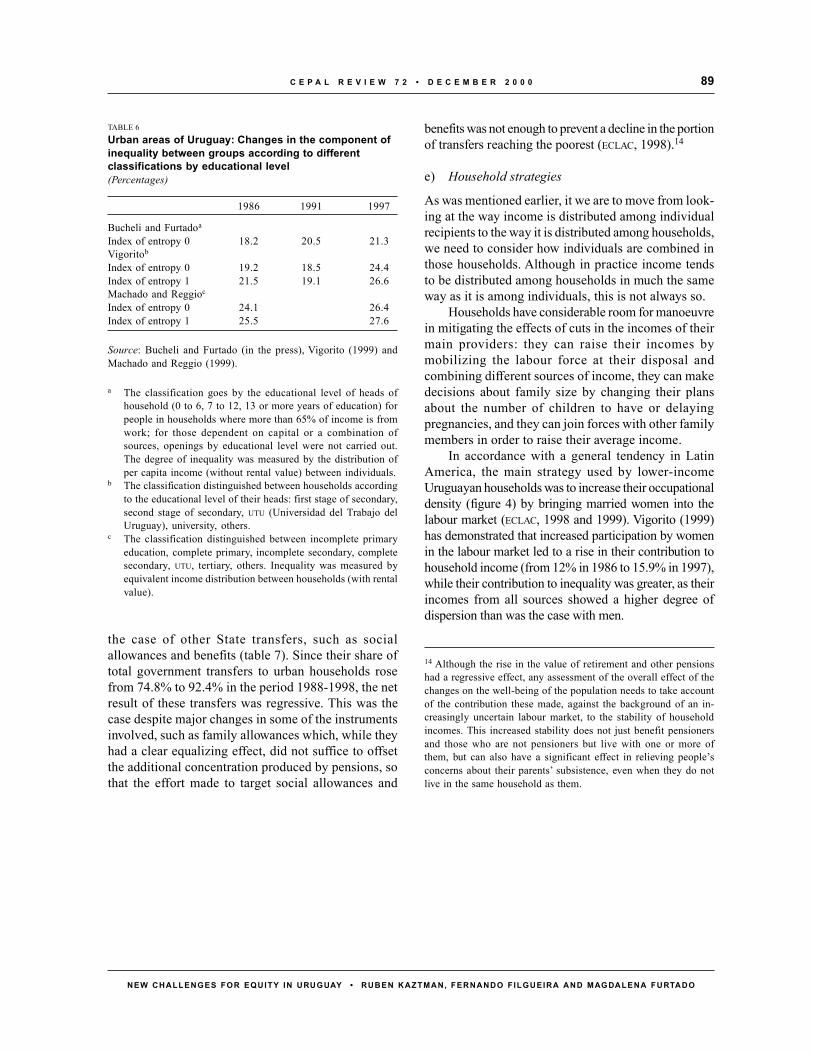
89C E P A L R E V I E W 7 2 • D E C E M B E R 2 0 0 0
NEW CHALLENGES FOR EQUITY IN URUGUAY • RUBEN KAZTMAN, FERNANDO F ILGUEIRA AND MAG DALENA FURTADO
the case of other State transfers, such as socialallowances and benefits (table 7). Since their share oftotal government transfers to urban households rosefrom 74.8% to 92.4% in the period 1988-1998, the netresult of these transfers was regressive. This was thecase despite major changes in some of the instrumentsinvolved, such as family allowances which, while theyhad a clear equalizing effect, did not suffice to offsetthe additional concentration produced by pensions, sothat the effort made to target social allowances and
benefits was not enough to prevent a decline in the portionof transfers reaching the poorest (ECLAC, 1998).14
e) Household strategies
As was mentioned earlier, it we are to move from look-ing at the way income is distributed among individualrecipients to the way it is distributed among households,we need to consider how individuals are combined inthose households. Although in practice income tendsto be distributed among households in much the sameway as it is among individuals, this is not always so.
Households have considerable room for manoeuvrein mitigating the effects of cuts in the incomes of theirmain providers: they can raise their incomes bymobilizing the labour force at their disposal andcombining different sources of income, they can makedecisions about family size by changing their plansabout the number of children to have or delayingpregnancies, and they can join forces with other familymembers in order to raise their average income.
In accordance with a general tendency in LatinAmerica, the main strategy used by lower-incomeUruguayan households was to increase their occupationaldensity (figure 4) by bringing married women into thelabour market (ECLAC, 1998 and 1999). Vigorito (1999)has demonstrated that increased participation by womenin the labour market led to a rise in their contribution tohousehold income (from 12% in 1986 to 15.9% in 1997),while their contribution to inequality was greater, as theirincomes from all sources showed a higher degree ofdispersion than was the case with men.
14 Although the rise in the value of retirement and other pensionshad a regressive effect, any assessment of the overall effect of thechanges on the well-being of the population needs to take accountof the contribution these made, against the background of an in-creasingly uncertain labour market, to the stability of householdincomes. This increased stability does not just benefit pensionersand those who are not pensioners but live with one or more ofthem, but can also have a significant effect in relieving people’sconcerns about their parents’ subsistence, even when they do notlive in the same household as them.
TABLE 6
Urban areas of Uruguay: Changes in the component ofinequality between groups according to differentclassifications by educational level(Percentages)
1986 1991 1997
Bucheli and Furtadoa
Index of entropy 0 18.2 20.5 21.3Vigoritob
Index of entropy 0 19.2 18.5 24.4Index of entropy 1 21.5 19.1 26.6Machado and Reggioc
Index of entropy 0 24.1 26.4Index of entropy 1 25.5 27.6
Source: Bucheli and Furtado (in the press), Vigorito (1999) andMachado and Reggio (1999).
a The classification goes by the educational level of heads ofhousehold (0 to 6, 7 to 12, 13 or more years of education) forpeople in households where more than 65% of income is fromwork; for those dependent on capital or a combination ofsources, openings by educational level were not carried out.The degree of inequality was measured by the distribution ofper capita income (without rental value) between individuals.
b The classification distinguished between households accordingto the educational level of their heads: first stage of secondary,second stage of secondary, UTU (Universidad del Trabajo delUruguay), university, others.
c The classification distinguished between incomplete primaryeducation, complete primary, incomplete secondary, completesecondary, UTU, tertiary, others. Inequality was measured byequivalent income distribution between households (with rentalvalue).
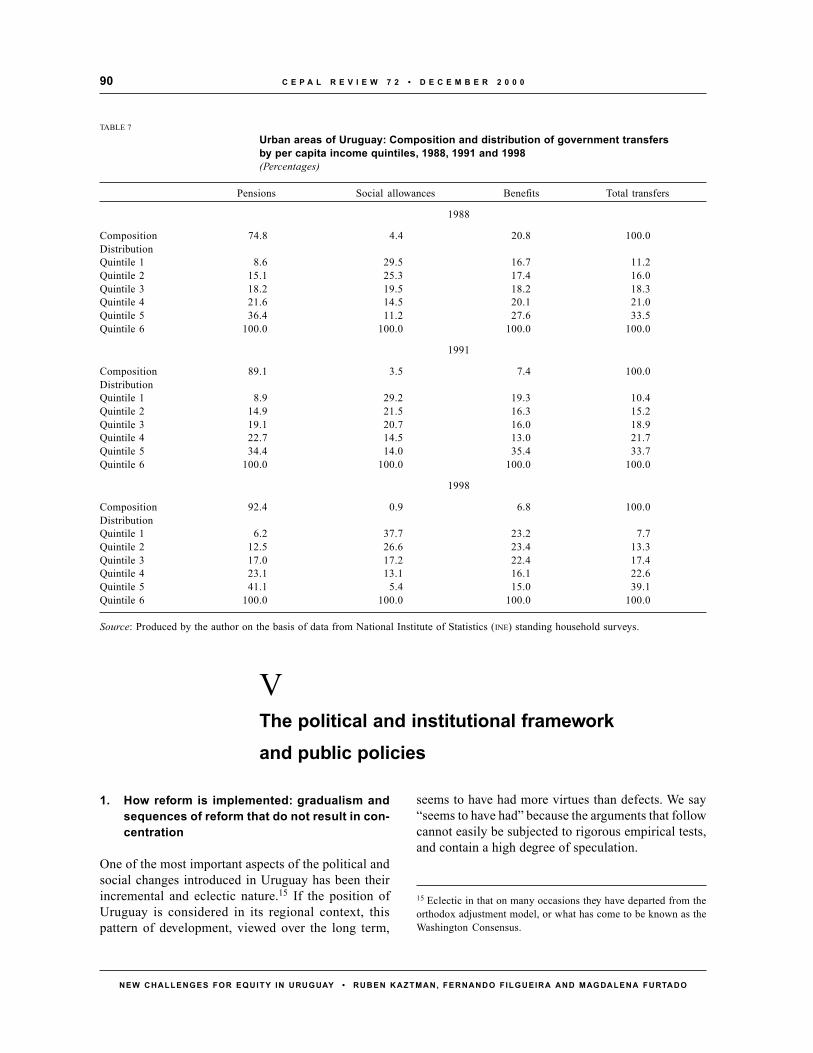
C E P A L R E V I E W 7 2 • D E C E M B E R 2 0 0 090
NEW CHALLENGES FOR EQUITY IN URUGUAY • RUBEN KAZTMAN, FERNANDO F ILGUEIRA AND MAG DALENA FURTADO
VThe political and institutional frameworkand public policies
1. How reform is implemented: gradualism andsequences of reform that do not result in con-centration
One of the most important aspects of the political andsocial changes introduced in Uruguay has been theirincremental and eclectic nature.15 If the position ofUruguay is considered in its regional context, thispattern of development, viewed over the long term,
seems to have had more virtues than defects. We say“seems to have had” because the arguments that followcannot easily be subjected to rigorous empirical tests,and contain a high degree of speculation.
TABLE 7
Urban areas of Uruguay: Composition and distribution of government transfersby per capita income quintiles, 1988, 1991 and 1998(Percentages)
Pensions Social allowances Benefits Total transfers
1988
Composition 74.8 4.4 20.8 100.0DistributionQuintile 1 8.6 29.5 16.7 11.2Quintile 2 15.1 25.3 17.4 16.0Quintile 3 18.2 19.5 18.2 18.3Quintile 4 21.6 14.5 20.1 21.0Quintile 5 36.4 11.2 27.6 33.5Quintile 6 100.0 100.0 100.0 100.0
1991
Composition 89.1 3.5 7.4 100.0DistributionQuintile 1 8.9 29.2 19.3 10.4Quintile 2 14.9 21.5 16.3 15.2Quintile 3 19.1 20.7 16.0 18.9Quintile 4 22.7 14.5 13.0 21.7Quintile 5 34.4 14.0 35.4 33.7Quintile 6 100.0 100.0 100.0 100.0
1998
Composition 92.4 0.9 6.8 100.0DistributionQuintile 1 6.2 37.7 23.2 7.7Quintile 2 12.5 26.6 23.4 13.3Quintile 3 17.0 17.2 22.4 17.4Quintile 4 23.1 13.1 16.1 22.6Quintile 5 41.1 5.4 15.0 39.1Quintile 6 100.0 100.0 100.0 100.0
Source: Produced by the author on the basis of data from National Institute of Statistics (INE) standing household surveys.
15 Eclectic in that on many occasions they have departed from theorthodox adjustment model, or what has come to be known as theWashington Consensus.

91C E P A L R E V I E W 7 2 • D E C E M B E R 2 0 0 0
NEW CHALLENGES FOR EQUITY IN URUGUAY • RUBEN KAZTMAN, FERNANDO F ILGUEIRA AND MAG DALENA FURTADO
Like the other countries in the region, Uruguay hadto cope with the obsolescence of an old inward-looking,State-led development model. At the same time, thecountry faced the difficult task of converting to anexport-oriented model in which the market plays acentral role in the allocation of resources, entailingreforms in at least five key areas: financial liberalization,trade liberalization, fiscal reform, privatization andreform of the State machinery, and labour marketderegulation.
The Inter-American Development Bank (IDB) hasdevised an index to measure progress with these fiveareas of reform in Latin America, the values itproduces being used to estimate the relative speed withwhich they are being applied in each country (IDB,1997). In the case of Uruguay, the data from this index(figure 8) record a difference of 18% between thebeginning and end of the period 1985-1995 in thecountry’s scores for progress in structural policies.This small difference –the lowest of any of thecountries for which information is available, includingthose such as Chile and Colombia which started offin 1985 with scores similar to Uruguay’s– make thecountry an example of gradualism in the region (IDB,1997, appendix 5).
In addition to the reform areas taken by IDB, socialreform also needs to be considered. The approach takenby Uruguay in this area has also been gradualist and,as will be seen later on, particularly eclectic.
The gradualism characterizing Uruguay has at leasttwo essential merits: it helps protect the interests ofsubordinate groups, and it bolsters democracy. In thefirst case, this is because the basic resources of the leastpowerful sectors –mass mobilization and organization–are more effective in democratic negotiations and areweakened when shock policies or sudden reforms areapplied.
The second merit of gradualism is that it strengthensand reaffirms the power of democratic mechanisms to takedifficult decisions about development models andproblems that are ultimately to do with distribution. Or tolook at it from the negative side: shock policies tend toinhibit the development or creation of a democratic culturein which the legitimacy of decisions derives from the waythey are taken, and not from their results.
The sequence of reforms in the country also hasits virtues. To put it in a highly condensed form, it maybe said that the essential role of the reforms is to “ex-pose to the blast of competition” actors who previouslyoperated in a “protected and regulated environment”.Depending on the reform that is applied, certain actors
will be more exposed to this “blast” than others. Byway of example: whereas lower tariffs force protectedcompanies (i.e., capital) to confront international com-petition, labour market deregulation increases compe-tition for labour rather than capital. Consequently, thesequence of reform determines the scope those affectedhave for transferring costs to other actors. Another example:if tariff reforms and labour market deregulation takeplace at the same time, companies can transfer a largepart of their costs to wage earners by reducing wagesand benefits and reducing staff levels at little cost tothemselves.
The sequence of reforms in Uruguay was ideal interms of distribution. Financial, fiscal and foreign tradereforms were the first to be carried out. With theexception of fiscal reform, whose effect on companiesand workers is unclear, the other two primarily affectcapital, forcing it to absorb part of the restructuringcosts of the development model. If it is considered thatthe labour market and social reforms were the last tobe applied, and that privatization was a failure, thereform sequence looks like a particularly progressiveone. It was wage earners and sectors depending on theState that were the last to be deprived of protection ofvarious kinds, and this reduced the scope of thosecontrolling capital to transfer costs to them. Theinformation provided over the course of this sectionseems to be consistent with these ideas. As was pointedout earlier, it was in respect of income from capitalthat concentration declined most over the period, sincecapital now has to operate in a common competitiveenvironment, whereas previously it extracted itsadvantages and profit from stratified protectionregimes.
FIGURE 8
Change in the index of structural policies between 1985and 1995(1985=100)
UruguayChile
ColombiaVenezuelaCosta Rica
BrazilMexico
EcuadorArgentinaParaguay
GuatemalaBolivia
NicaraguaPeru
Source: Produced by the author on the basis of IDB (1997).
307297
210193
186185
178171
168166
150133
128118
0 50 100 150 200 250 300 350
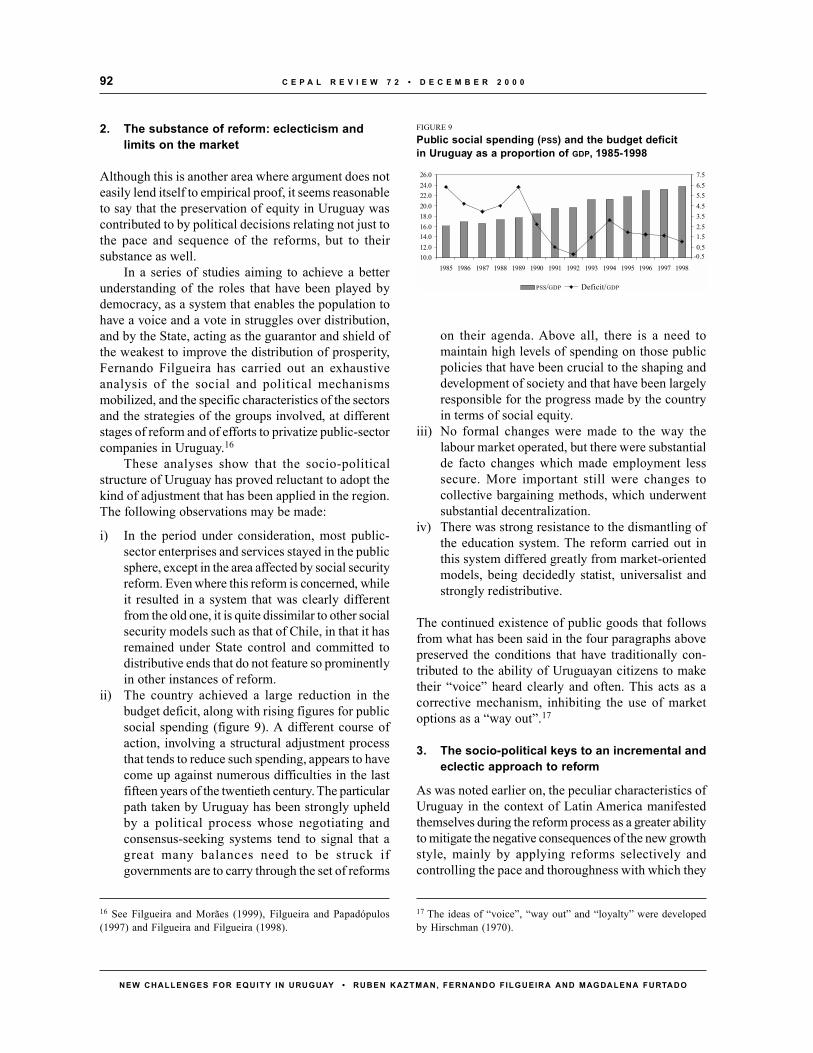
C E P A L R E V I E W 7 2 • D E C E M B E R 2 0 0 092
NEW CHALLENGES FOR EQUITY IN URUGUAY • RUBEN KAZTMAN, FERNANDO F ILGUEIRA AND MAG DALENA FURTADO
2. The substance of reform: eclecticism andlimits on the market
Although this is another area where argument does noteasily lend itself to empirical proof, it seems reasonableto say that the preservation of equity in Uruguay wascontributed to by political decisions relating not just tothe pace and sequence of the reforms, but to theirsubstance as well.
In a series of studies aiming to achieve a betterunderstanding of the roles that have been played bydemocracy, as a system that enables the population tohave a voice and a vote in struggles over distribution,and by the State, acting as the guarantor and shield ofthe weakest to improve the distribution of prosperity,Fernando Filgueira has carried out an exhaustiveanalysis of the social and political mechanismsmobilized, and the specific characteristics of the sectorsand the strategies of the groups involved, at differentstages of reform and of efforts to privatize public-sectorcompanies in Uruguay.16
These analyses show that the socio-politicalstructure of Uruguay has proved reluctant to adopt thekind of adjustment that has been applied in the region.The following observations may be made:
i) In the period under consideration, most public-sector enterprises and services stayed in the publicsphere, except in the area affected by social securityreform. Even where this reform is concerned, whileit resulted in a system that was clearly differentfrom the old one, it is quite dissimilar to other socialsecurity models such as that of Chile, in that it hasremained under State control and committed todistributive ends that do not feature so prominentlyin other instances of reform.
ii) The country achieved a large reduction in thebudget deficit, along with rising figures for publicsocial spending (figure 9). A different course ofaction, involving a structural adjustment processthat tends to reduce such spending, appears to havecome up against numerous difficulties in the lastfifteen years of the twentieth century. The particularpath taken by Uruguay has been strongly upheldby a political process whose negotiating andconsensus-seeking systems tend to signal that agreat many balances need to be struck ifgovernments are to carry through the set of reforms
on their agenda. Above all, there is a need tomaintain high levels of spending on those publicpolicies that have been crucial to the shaping anddevelopment of society and that have been largelyresponsible for the progress made by the countryin terms of social equity.
iii) No formal changes were made to the way thelabour market operated, but there were substantialde facto changes which made employment lesssecure. More important still were changes tocollective bargaining methods, which underwentsubstantial decentralization.
iv) There was strong resistance to the dismantling ofthe education system. The reform carried out inthis system differed greatly from market-orientedmodels, being decidedly statist, universalist andstrongly redistributive.
The continued existence of public goods that followsfrom what has been said in the four paragraphs abovepreserved the conditions that have traditionally con-tributed to the ability of Uruguayan citizens to maketheir “voice” heard clearly and often. This acts as acorrective mechanism, inhibiting the use of marketoptions as a “way out”.17
3. The socio-political keys to an incremental andeclectic approach to reform
As was noted earlier on, the peculiar characteristics ofUruguay in the context of Latin America manifestedthemselves during the reform process as a greater abilityto mitigate the negative consequences of the new growthstyle, mainly by applying reforms selectively andcontrolling the pace and thoroughness with which they
16 See Filgueira and Morães (1999), Filgueira and Papadópulos(1997) and Filgueira and Filgueira (1998).
17 The ideas of “voice”, “way out” and “loyalty” were developedby Hirschman (1970).
10.012.014.016.018.020.022.024.026.0
1985 1986 1987 1988 1989 1990 1991 1992 1993 1994 1995 1996 1997 1998-0.50.51.52.53.54.55.56.57.5
GPS/PBI Deficit/PBI
FIGURE 9
Public social spending (PSS) and the budget deficitin Uruguay as a proportion of GDP, 1985-1998
PSS/GDP Deficit/GDP
-0.5

93C E P A L R E V I E W 7 2 • D E C E M B E R 2 0 0 0
NEW CHALLENGES FOR EQUITY IN URUGUAY • RUBEN KAZTMAN, FERNANDO F ILGUEIRA AND MAG DALENA FURTADO
were introduced. We shall now briefly consider whatare the central characteristics of Uruguayan social andpolitical organization that enable us to understand boththe pace and the substance of the country’s structuralreforms.
Despite the major economic and social changes thatthe country underwent between 1970 and 1985, at theend of this period the key actors that had helped shape theold model, and that to a large extent had benefited from it,still had their place in the social structure of Uruguay. In1985, the unions whose members were urban workers indomestic industries, the protected industries themselves,old-age and other pensioners covered by the social welfaresystem and the large group constituted by civil servantswere still the main actors in the country’s distributivestruggles. To implement any major change, it wasnecessary to negotiate, synthesize and incorporate theinterests of these actors in the context of a restoreddemocracy. This is perhaps one of the most crucial aspectsdifferentiating Uruguay from, for example, Chile. In thelatter country, the bulk of the structural changes wereimplemented under a dictatorial regime, and the socio-political system with which the restored democracy hadto deal retained few of the actors and characteristics of theold development model. In Uruguay, by contrast, thesurvival of the old system, and its transition to democraticconditions, meant that any losers from the structuraltransformation could negotiate the costs they would haveto pay and the time they would have to do it in.
To this old social structure, which had to bereckoned with when the costs and benefits oftransforming the development model came to benegotiated, had to be added the political structureneeded for the demands of actors to be translated intoconcrete policies.
Politically, Uruguay had and has the most highlyinstitutionalized democratic process of any country inLatin America, owing to two prominent features of itspolitical dynamic: a long-established and highlyinstitutionalized party system, and a deep-rootedpolitical culture of consensus-building. These twofactors have had a range of effects on the politicalprocess, in which negotiations between parties and thenumerous ties that these have with different agents incivil society have given a pluralistic form to dealingsbetween decision-making agents.
On the one hand, these two factors have shaped aparticular kind of relationship between those involvedwith the technical side of policy-making and the partyelites, as a result of which, and by contrast with othercountries in Latin America, the links between technical
and political actors have always been channelledcompletely through the intermediary of solid politicalparties. On the other hand, the Uruguayan party systemhas always been able to deal with demands expressedas general interests in the provision of public goods, oras private interests, chiefly in the way it responds tocorporate pressure from the unionized workforce andfrom industrialists.
In the long term, the strong political intermediationto which technical and specialist disciplines are subject,and the arbitration capabilities evinced by the parties intheir system of responses to private and general demands,have shaped a democratic system characterized bypermanent negotiation between political and socialactors.18 Consequently, what is surprising about theUruguayan process in the long term is its ability to bringabout major transformations in a context of democracyand pluralism (O’Donnell, 1993). In addition, a range ofcharacteristics in the institutional framework and thepolitical system have combined with this tradition ofgradualism to give the substance of the reforms a stampthat, in economic terms, is markedly anti-liberal, so thatwhile the role of the State as an allocator of resources hasbeen moderated, in no case has it been replaced by a puremarket system. It should be emphasized that this situationhas arisen in an international and domestic context whichis strongly conducive to the adoption of a purely orthodoxmodel, but that the social and political structures haveplayed an effective intermediary role in guiding thesepressures.
The Uruguayan experience with structural reformshows that the degree to which these reforms areintroduced, and the models used to do so, rather thaninternational pressure and changes to productionsystems, are what determine the tendency of countriesto implement neoliberal reform processes and withdrawthe protection of the State. In other words, the likelihoodof these adjustment and transformation models beingapplied is directly proportional to the degree of socio-political exclusion traditionally affecting the poorersections of society. In Uruguay, we have a Statepenetrated throughout by party structures, a party
18 Of course, the long-term characteristics described here have beendistorted by temporary situations of great impact. Thus, the yearsof authoritarian rule (1973-1984) were a time when citizens expe-rienced very marked political and social exclusion. This, however,did not sharply reverse the prevailing relationship between techni-cians and policy, which shows that the structure was stronger thanthe circumstances. Nor could authoritarian rule reverse the gradu-alist tradition, despite its discretionary power to implement reforms.

C E P A L R E V I E W 7 2 • D E C E M B E R 2 0 0 094
NEW CHALLENGES FOR EQUITY IN URUGUAY • RUBEN KAZTMAN, FERNANDO F ILGUEIRA AND MAG DALENA FURTADO
system that is accessible to the poorer sections of thepopulation, and a society that has received protectionand benefits from the State on a generous scale.Although, as this article has stressed, Uruguay has mademajor changes to its development model and to the rolethe State plays in this model, the costs and benefits ofthese changes have been distributed far less inequitablythan in the case of other Latin American countries.
Among the social and political characteristics thatthe country displays, there is a political and social cul-
ture rooted in a past that has produced a country with-out major social, political, ethnic or even economicdistances: a country of proximities, as Real de Azúawould put it. Its heritage includes reserves of altruismand low tolerance to extreme inequalities, attributeswithout which the social and political structure ofUruguay would not have been in a position to main-tain, in an international context of increasing concen-tration and inequality, the essential identities of a soci-ety whose ideal for itself is equality and integration.
VIFinal reflections. The challenges to Uruguayanequity in the third millennium
Given the need for continuous readjustment in the faceof the upheavals unleashed by globalization, everythingseems to indicate that a great deal of time will be neededfor national economies to settle down to a viable, stablestate. As was mentioned in the introduction, experts onthe subject agree that under the new conditions the mainproblems will revolve around the weakness of jobcreation and the pressure exerted by the forces that areacting to roll back the gains made in the labour market.Uruguay is not proof against the socially destabilizingtendencies that are being unleashed in this way, andthis undoubtedly raises major new challenges for themaintenance of equity.19 Indeed, given that themeasures that will have to be designed and implementedwill be at the core of the struggle over distribution,efforts to address the new problems of employment willinvolve entering the “hardest” areas of social policy(Kaztman and Gerstenfeld, 1990). The resultant needto couple together very divergent interests will test thereserves of solidarity of Uruguayan society, as well as
the capacity of its institutions to generate around theseissues the wide base of political support that willundoubtedly be needed.
Uruguay’s preparedness for coping with thesechallenges and for retaining its position of leadershipin the region where social development is concernedwill depend on the capacities of the country’s peopleand the efficiency and effectiveness of its institutions,the threshold beyond which its citizens will not tolerateinequality and their willingness to support the needfulcorrections when inequality exceeds the thresholds oftolerance. It may be said that the historical legacy ofsocial justice and democracy in Uruguay, crystallizedin the country’s basic structures (market, property, State,etc.), has shaped the living conditions and attitudes ofits people, making them intolerant of inequality andendowing them with considerable reserves of altruismand solidarity.20 The results of these values in practiceare seen in the support given to the political andinstitutional mechanisms that come to the defence ofthe weakest.21
Attitudes of solidarity are also sustained, at theleast, by an ability to empathize which enables people19 Among the greatest of the influences for concentration associated
with globalization is the improved profitability of factors that cancross national boundaries, such as capital and highly qualifiedhuman resources. Big companies, and transnationals in particular,which make more intensive use of these factors, will show a growingability to take advantages of the economies of scale generated byglobalization both in trade and in the financing of productionactivities. In turn, greater scope for relocating production willundermine workers’ negotiating positions and make their incomesmore unstable by increasing the vulnerability of these to fluctuationsin demand.
20 The idea of a reserve of altruism is discussed in Paci (1998).21 Another set of motivations that may give rise to this supportsprings not from the aversion to inequality, but from fear of theexternalities of social inequity: political instability, weakening ofthe legitimacy of institutions and the consequent difficulty of mo-bilizing public opinion in support of plans for change, in the faceof public insecurity, etc.
95C E P A L R E V I E W 7 2 • D E C E M B E R 2 0 0 0
NEW CHALLENGES FOR EQUITY IN URUGUAY • RUBEN KAZTMAN, FERNANDO F ILGUEIRA AND MAG DALENA FURTADO
to place themselves in the situation of others and un-derstand how serious or otherwise their problems are,and by a feeling of moral obligation which makes thosewho possess it act for the benefit of others.
These feelings, abilities and attitudes are refreshedand restored daily through informal, face-to-facecontact between people of different social origins insituations that are not constrained by the hierarchiesinherent in market relationships. The more frequent andintense the contacts, the stronger the feelings will be.By contrast, all processes that tend to reduce theopportunities for informal contacts between the socialclasses tend to weaken feelings of solidarity and raisethe threshold of tolerance for inequality.
The literature dealing with these issues has identifieda number of processes that reduce the likelihood of suchinformal contacts taking place between classes. Themost important take place in the spheres of housing,basic services and travel, shopping and recreation.
In the first of these spheres, residential segregationleads to people with similar socio-economic levelsbeing concentrated in the same neighbourhoods. Theextreme manifestations of this segregation are richghettos and poor ghettos. Large Latin American citiesnow contain neighbourhoods inhabited by middle-income sectors with homogeneous characteristics. Thespatial polarization of social classes in cities is beingcompounded by the appearance of what are known as“fortified enclaves”, housing estates that are insulatedfrom their immediate geographical environment byphysical barriers and sophisticated securitytechnologies; at the same time, some poor ghettos alsoerect barriers against representatives of the society thatoperates outside their borders. Although these processesare at an embryonic stage in Uruguay, a recent studyshows that between 1985 and 1995 the socialcomposition of individual neighbourhoods becamemore homogeneous, which meant that heterogeneitybetween neighbourhoods also increased.
In the second, the segmentation of basic servicesis another of the factors that undermine a country’sreserve of solidarity. Because of its crucial importancein enabling people to take advantage of opportunitiesfor social mobility, educational segmentation hasreceived particular attention. When middle-incomesectors abandon State schooling, this is deprived of a“voice” in the struggle to maintain its quality, while atthe same time these sectors lose the incentive to payhigh taxes for this purpose.22 In addition, though, thisdeprives poorer children of contacts that help inculcatemiddle-class attitudes and aspirations (for example, the
belief that efforts to learn are rewarded by achievementand that it is therefore worthwhile to defer immediategratifications and invest in the long-term accumulation ofhuman resources). In recent years, there has been anincipient movement towards educational segmentation inMontevideo (but not in the urban interior of the country),with a growing proportion of children and young peoplefrom the highest income deciles now attending privateestablishments, while the great majority go to free Stateestablishments (Kaztman, 1997); fortunately, thesetendencies are being counteracted by an ambitiouseducational reform designed to improve the coverage andquality of public-sector schooling. Similar considerationscould be adduced in respect of the segmentation of otherbasic services, such as health care and, more recently,public security.23
Places of transit, shopping and recreation andleisure are the third area of informal contacts betweenthe classes which could be affected by middle-classabandonment. These include places as diverse as bars,small neighbourhood shops, beaches and popularentertainments such as football and carnivals.
By distinguishing between these three spheres, theaim is to highlight the variety of paths whereby multi-class sociability can be promoted and the powerfultendencies towards privatization and the isolation ofthe classes can be counteracted.
When the processes of segregation andsegmentation come together in the three areas referredto, there are sections of society that begin to be pushed,without their wishing it, to the margins of the sectorsthat represent the mainstream of society. This isolationencourages the consolidation of marginal subcultures,social exclusion and mechanisms that perpetuatepoverty between the generations.
Because the urban spaces where the differentclasses meet together in an informal way are decliningso slowly, the consequences of this for social integra-tion generally pass unnoticed by most citizens. As aresult, these spaces are usually undervalued as factorsof integration and as sources of renewal for a country’s
22 As Barry argues, approval of high taxes makes it possible toimprove the quality of collective services while reducing the re-sources available for higher-income groups to invest in private ser-vices, all of which discourages abandonment of public services(Barry, 1998, p. 23).23 The motor car, perhaps the paramount symbol of social mobil-ity, is increasingly distancing the middle classes from the hazardsand adversities of public transport and the informal sociability thatits use tends to encourage.

C E P A L R E V I E W 7 2 • D E C E M B E R 2 0 0 096
NEW CHALLENGES FOR EQUITY IN URUGUAY • RUBEN KAZTMAN, FERNANDO F ILGUEIRA AND MAG DALENA FURTADO
reserves of altruism, solidarity and aversion to inequal-ity. The effects of this decline, however, will come outsooner or later, sometime in a violent, anomic and un-expected way, through the socially disruptive correlatesof a poverty that is marginalized by the concentrationof want and by progressive isolation from the main-stream of society. The response of the middle classes isto distance themselves from the public places and ser-vices used by the “dangerous classes”, whose modesof behaviour, developed in isolation amid general want,are viewed by the other classes as exotic and alien. Thedesertion of the middle classes merely highlights thedecline of public spaces, which narrows the field ofexperiences capable of stimulating the capacity to em-pathize with less well-off sectors and the feeling ofhaving a moral obligation towards them, thus raisingthe threshold of tolerance for inequality.
The objective of strengthening social integrationin the cities by promoting public spaces where thedifferent classes can come together may appear to lieoutside the capabilities of State policies, partly becausethe resources that would have to be employed might berequired for other priorities on the social agenda linkedto poverty relief. Certainly, this perception would becorrect in many of the region’s major cities, where
residential segregation, segmentation of services andthe abandonment by the middle classes of public spacesin which informal contact can take place between theclasses have reached such an advanced stage that theidea of halting or reversing them in the short or mediumterm seems to be completely unrealistic. This is not thecase, however, in Uruguay, where these processes areincipient and the great bulk of society does not seemwilling to allow public goods to deteriorate, especiallyif people come to realize that such a deterioration alsoentails the weakening of a heritage of social justice anddemocracy which is taken for granted as a major featureof national identity.
Besides, many social integration initiatives have beenundertaken in the cities of North America and Europe–either specifically for this purpose or as part of sectoralpolicies– entailing urban management measures, theselection of beneficiaries for subsidized housing projects,measures to preserve the quality of public services andthe promotion of urban spaces which encourage informalcontacts between the classes. Out of the wide range ofurban social integration initiatives which have proved tobe successful, advantage can be taken of those which arebest suited to the resources and the special characteristicsof Uruguayan society.
Bibliography
Altimir, O. (1997): Desigualdad, empleo y pobreza enAmérica Latina: efectos del ajuste y del cambio en elestilo de desarrollo, Desarrollo económico, vol. 37,No. 145, Buenos Aires, Institute of Economic and So-cial Development (IDES).
Barry, B. (1998): Social Exclusion, Social Isolation and Dis-tribution of Income, Case paper, No. 12, London, Lon-don School of Economics.
Basañez, M., M. Lagos and T. Beltrán (1996): Reporte 1995:encuesta Latinobarómetro, Santiago, Chile, mimeo.
Bucheli, M. and M. Furtado (in the press): La contribuciónde las distintas fuentes de ingreso a la evolución de ladesigualdad en el Uruguay urbano 1986-1997 ,Montevideo, ECLAC office in Montevideo.
(2000): La evolución de la participación de lasfuentes de ingreso en Uruguay (1986-1997), paper pre-sented at Seminario de Economía Social, Montevideo,University of the Republic, Department of Economics,March.
Bucheli, M. and M. Rossi (1994): La distribución del ingresoen Uruguay 1984-1992, Document No. 10, Montevideo,University of the Republic, Department of Economics.
Bucheli, M. (1997): Equidad en la asignaciones familiaresde Uruguay, Montevideo, ECLAC office in Montevideo .
ECLAC (Economic Commission for Latin America and the
Caribbean) (1998): Social Panorama of Latin America,1997, Santiago, Chile.
(1999): Social Panorama of Latin America, 1998,Santiago, Chile.
Filgueira, F. and J.A. Moraes (1999): Political Environments,Sector Specific Configurations and Strategic Devices:Understanding Institutional Reform in Uruguay, IDBWorking Paper series, No. R-351, Washington, D.C.,Inter-American Development Bank (IDB).
Filgueira, F. and J. Papadópulos (1997): Putting conserva-tism to good use? Long crisis and vetoed alternatives inUruguay, D.A. Chalmers and others (eds.), The NewPolitics of Inequality in Latin America, Oxford, U.K.,Oxford University Press.
Filgueira, C. and F. Filgueira (1998): Taming market reform:The politics of social state reform in Uruguay,Montevideo, mimeo.
Filgueira, C. (1999): Vulnerabilidad, activos y recursos delos hogares: una exploración de indicadores, R. Kaztman(coord.), Activos y estructuras de oportunidades:estudios sobre las raíces de la vulnerabilidad social enUruguay, Montevideo, ECLAC office in Montevideo.
Foster, J. and A. Sen (1997): On Economic Inequality aftera Quarter Century, Oxford, U.K., Clarendon Press.
Hirschman, A.O. (1970): Exit, Voice and Loyalty: Responses
97C E P A L R E V I E W 7 2 • D E C E M B E R 2 0 0 0
NEW CHALLENGES FOR EQUITY IN URUGUAY • RUBEN KAZTMAN, FERNANDO F ILGUEIRA AND MAG DALENA FURTADO
to Decline in Firms, Organization and States, Cam-bridge, Massachusetts, Harvard University Press.
IDB (Inter-American Development Bank) (1997): LatinAmerica after a decade of reforms, Economic andSocial Progress 1997 Report, Washington, D.C.
(1998): América Latina frente a la desigualdad,Progreso económico y social en América Latina.Informe 1998-1999, Washington, D.C.
Instituto Nacional de la Familia y de la Mujer (in the press):Mujer y estadísticas, Montevideo.
Jenkins, A. (1995): Accounting for inequality trends: De-composition for the UK, 1971-1986, Economica, No. 62.
Kaztman, R. (1997): Marginality and social integration inUruguay, CEPAL Review, No. 62, LC/G.1969-P, Santiago,Chile, ECLAC.
Kaztman, R. and P. Gerstenfeld (1980): The complexity ofevaluating social development, CEPAL Review, No. 41,LC/G.1631-P, Santiago, Chile, ECLAC.
Li, H., L. Squire and H.F. Zou (1998): Explaining interna-tional and intertemporal variations in income inequal-ity, The Economic Journal, vol. 108, No. 446, Oxford,U.K., Blackwell Publishers.
Machado A. and I. Reggio (1999): Incidencia de la reformaen el mecanismo de ajuste de las pasividades de 1990sobre la distribución del ingreso de los hogares. Uru-guay: 1986-1997, Montevideo, University of the Re-public, monograph for Economics degree.
O’Donnell, G. (1993): On the State, Democratization andSome Conceptual Problems: A Latin American View withGlances at Some Post-Communist Countries, Indiana,University of Notre Dame.
President of the Eastern Republic of Uruguay, Office of Plan-ning and the Budget (1999): Datos económicos ysociales del Uruguay, Montevideo.
Paci, M. (1998): Il welfare state come problema di egemonia,Stato e mercato, No. 22, Rome.
Shorrocks, A. (1982): Inequality decomposition by factorcomponents, Econometrica, vol. 50, Evanston, Illinois,Econometric Society.
(1983): The impact of income components on the distri-bution of family income, Quarterly Journal of Economics,vol. 98, Cambridge, Massachusetts, Harvard University.
UNCTAD/ECLAC (1998): Política comercial a nivel país y losacuerdos de la Ronda Uruguay, Montevideo, January,mimeo.
UNDP (United Nations Development Programme), Office inUruguay (in the press): Informe de desarrollo humanode Uruguay, Montevideo.
Vigorito, A. (1997): Una distribución del ingreso estable. Elcaso de Uruguay 1986-1997, Montevideo, Universityof the Republic, Institute of Economics.
(1999): La distribución del ingreso en Uruguay en-tre 1986 y 1997, Revista de economía, vol. 6, No. 2,Montevideo, Central Bank.

C E P A L R E V I E W 7 2 • D E C E M B E R 2 0 0 098
NEW CHALLENGES FOR EQUITY IN URUGUAY • RUBEN KAZTMAN, FERNANDO F ILGUEIRA AND MAG DALENA FURTADO
99C E P A L R E V I E W 7 2 • D E C E M B E R 2 0 0 0
THE ADJUSTMENT STRATEGIES OF MEXICAN EJIDATARIOS IN THE FACE OF NEOLIBERAL REFORM • BENJAMIN DAVIS
C E P A L R E V I E W 7 2
DECEMBER 2000
The adjustment strategiesof Mexican ejidatarios
in the face ofneoliberal reform
Benjamin Davis
United Nations Foodand AgricultureOrganization (FAO), [email protected]
Since 1988 the ejido sector in Mexico has been buffeted bya series of policy changes and exogenous shocks that havebrought into question the agricultural viability of the sectoras a whole. These changes –trade liberalization, privatization,falling subsidies, the abolition of price controls, macroeco-nomic shocks, devaluation and momentous changes in thelegal framework governing land use in the ejido– have ledto a radical reordering of the policy framework and incen-tive structure under which the farmers of these communallands operate. The cumulative effect of these reforms hastheoretically been to give ejido producers the freedom andflexibility to adjust to changes in the incentive structure andemerge as viable, competitive producers in an increasinglyglobalized economy. Unfortunately, the hoped-for benefitsfirst of sectoral reform, then of macroeconomic reform, havenot materialized. The author provides a brief history of theejido sector and the Salinas/Zedillo reforms. He then dis-cusses in broad terms the responses that ejidatarios havemade to these neoliberal reforms and the subsequent mac-roeconomic crisis. This is followed by a detailed look at thedifferent components of this changing situation: land accu-mulation, risk-averse agriculture, scarcity of credit, livestockaccumulation, diversification into off-farm activities andincome structure. The principal tools of analysis are catego-rization of households on the basis of changes in these dif-ferent components and comparison of the characteristics andasset positions of households engaged in different responsestrategies. The article concludes by analysing the conse-quences of these response strategies for State developmentpolicy in the rural sector in Mexico.

C E P A L R E V I E W 7 2 • D E C E M B E R 2 0 0 0100
THE ADJUSTMENT STRATEGIES OF MEXICAN EJIDATARIOS IN THE FACE OF NEOLIBERAL REFORM • BENJAMIN DAVIS
IIntroduction
I am grateful to Sudhanshu Handa, Fernando Rello, Benedictede la Briere, Louise Cord, Alain de Janvry, Elisabeth Sadoulet,Pedro Olinto, Peter Lanjouw, Alberto Valdes and an anonymousreviewer for their helpful comments and suggestions during thedifferent stages in the development of this paper. All errors aremine.
The characteristics of the ejido sector on the eve of thetwenty-first century differ greatly from those withwhich it began over 60 years ago. The Mexican LandReform, with its unique community (or ejido) land grantmechanism, was born of peasant demands for landbrought on by the Mexican Revolution. While the im-portance of community and an attachment to the landremain, the predominantly agricultural economy of the1930s has given way to a tremendously diversified onewith an array of household income generation strate-gies. Today, ejidatarios and their children are just aslikely to be working in off-farm wage activities such asthe inbond assembly industry, or in a restaurant in LosAngeles, as growing maize and beans on the familyplot. Almost half of all ejido household income derivesfrom sources other than agricultural or livestock pro-duction, while over 60% of all households have somefamily member working off farm.
While the shift towards income diversification hasbeen a gradual one, since 1988 the ejido sector has beenbuffeted by a series of policy changes and exogenousshocks that have brought into question the agriculturalviability of the sector as a whole. These changes –tradeliberalization, privatization, falling subsidies, the abo-lition of price controls, macroeconomic shocks, devalu-ation and momentous changes in the legal frameworkgoverning land use in the ejido– have led to a radicalreordering of the policy framework and incentive struc-ture under which ejido producers operate.
The cumulative effect of these reforms hastheoretically been to give ejido producers –representingover 75% of all agricultural producers and 70% ofnational maize production– the freedom and flexibilityto adjust to changes in the incentive structure andemerge as viable, competitive producers in anincreasingly globalized economy. Unfortunately, thehoped-for benefits first of sectoral reform underPresident Salinas, then of macroeconomic reform underPresident Zedillo, have not materialized.
Utilizing 1994-1997 panel data from a nationalsurvey of ejido producers, we analyse the wayhouseholds have responded to these changes. From thedata, it is evident that most producers have chosen tocope, rather than compete, in agriculture. What thiscoping entails is staying in maize and fodder –and, inthe case of larger, modernized farms, increasing thearea of these crops under cultivation– rather thanexpanding into higher value crops. This has beenaccompanied by further diversification into off-farmwaged and own-account activities, and particularlymigration to the United States, as well as increases incattle stocks. For ejidatarios with small and medium-sized farms, off-farm activities have come to be theprimary source of income.
What these tendencies have in common is that theyare part of a risk-averse, or risk spreading, complemen-tary income generation strategy in the face of uncer-tainty and non-existent or incomplete markets. Lim-ited access to agrarian institutions providing credit,technical assistance and so on, combined with severeoutput price risk brought on by macroeconomic insta-bility, makes the production of relatively low-risk andlow-cost maize more attractive, despite the steady de-cline in its real price. The lower returns and height-ened uncertainty associated with agricultural produc-tion mean that ejido households are increasinglydiversifying into off-farm working activities, thoughrelatively few leave agriculture altogether.1
A portfolio diversification strategy of this kindenables households to spread income risk among a va-riety of income generating activities. In certain cases,these off-farm activities may also ease the credit andliquidity constraints faced by producers, although inmost instances the income from them appears to beconsumed or invested in livestock holdings. Further-more, leaving off-farm activities aside, those house-holds that have scope to adjust their agricultural strate-gies are decidedly better off then those that do not havethis room for manoeuvre, even if they are expanding
1 Risk aversion in agricultural strategies does not mean thatejidatarios are not taking risks, as these are implicit in diversifica-tion into off-farm activities, particularly international migration.
101C E P A L R E V I E W 7 2 • D E C E M B E R 2 0 0 0
THE ADJUSTMENT STRATEGIES OF MEXICAN EJIDATARIOS IN THE FACE OF NEOLIBERAL REFORM • BENJAMIN DAVIS
into low-risk, low-return crops. Lastly, given the highcost or non-existence of formal institutions in the ejidosector, livestock production can operate as a savings orinsurance mechanism as well as an important sourceof on-farm consumption.
Our conclusions are, firstly, that the predominanceof risk-averse agricultural strategies among ejidohouseholds means that Mexico is losing its chance tocapitalize on the opportunity offered by reform ofArticle 27. Unfortunately, the conditions are not in placefor producers to use their newly acquired land assetsproductively. While the withdrawal of inefficientproducers from agriculture was an explicit componentof the reforms, poor incentives and an institutionalvacuum threaten the existence of many potentiallyviable producers. Lacking profitability, these producersare forced to enter the labour market or migrate to urbancentres and the United States. Wholesale diversificationof this sort clearly does not constitute a permanentsolution for Mexican rural development.
Secondly, despite the negative incentive structureand patchy government support, those households thathave adequate levels of agricultural assets, and thus thescope to achieve at least partial adjustment throughagriculture, are clearly better off then those that do nothave these resources. Studies in this area have shownthat ejido producers can respond if credit and liquidityconstraints are eased. Thus, potentially large rewardscould be reaped if government were to take action torevitalize agrarian institutions and services that can
reduce the risk and enhance the productivity of on-farmactivities.
On the other hand, the complexity and diversity ofthe ejido sector suggest that the correct policy responseis one that encompasses not just agriculturaldevelopment, but rural development more generally.Meeting the challenge of reducing rural poverty,stemming the flow of migrants to urban areas andincreasing the welfare of rural inhabitants will entailnot just reducing risk and raising productivity inagriculture, but also providing the framework for anintegrated rural development strategy. This wouldinclude measures to increase human capital,infrastructure improvements to attract investment andprovide better communications and, above all, jobs.
The analysis carried out here is based on data takenfrom a nationally representative sample of ejido house-holds. Panel data were collected from 1,287 households,covering 261 ejidos, at two points in time, the springand early summer of 1994 and 1997.2 The survey cov-ers a wide array of household assets including land,livestock, machinery and education, as well as house-hold demographics, labour and land market participa-tion, migration, agricultural and livestock productionand participation in organizations. Community leveldata were also collected on the characteristics andorganization of the ejido. The surveys were carriedout by the Agrarian Reform Secretariat and the WorldBank with assistance from the University of California,Berkeley.
IIBrief history of the ejido and theSalinas/Zedillo reforms
The land reform process in Mexico was the result ofpressure from the peasantry who played a key role inthe Mexican Revolution during the second decade ofthe twentieth century. Land and water resources weregranted by the President of the Republic notindividually but to communities or groups of producers,known as ejidos. Indigenous communities recognizedas such were given a different status, and were termedagrarian communities. Each ejidatario, or comunero,was given usufruct rights over a parcel of land, access
2 A detailed description of the Mexican data and their samplingproperties can be found in Cord (1998a). The total 1997 dataset,panel and non-panel, numbered 1,665 households. A largeproportion of these households were in Chiapas, a state from whichno observations were drawn in 1994 owing to the armed insurrectionearly that year.3 See De Janvry, Gordillo and Sadoulet (1997) for a good descrip-tion of the social and political background to the ejido.
to common lands, the right to an urban plot and votingrights in the ejido assembly.3
C E P A L R E V I E W 7 2 • D E C E M B E R 2 0 0 0102
THE ADJUSTMENT STRATEGIES OF MEXICAN EJIDATARIOS IN THE FACE OF NEOLIBERAL REFORM • BENJAMIN DAVIS
As of 1996, over 29,000 legally constituted ejidosand agrarian communities were in existence (INDA,1996), controlling more than half the nation’s irrigatedand rainfed land and over 70% of its forest cover. Thisland reform (or social) sector includes more than 3million ejidatarios, accounting for over 75% of allagricultural producers in the country. More than 15million people directly depend on ejido lands for partof their livelihood. In 1992, the land reform sectorcontributed over 70% of the country’s output of maizeand 80% of that of beans (De Janvry and others, 1995).
The question of whether ejido producers are moreor less productive than farmers in the private sector isone that has been much debated.4 While ejido peasantsas a group have been the recipients of much Statelargesse and patronage, this has come at the cost ofinflexibility in production and political control. ManyState policies, furthermore, have benefited private andejido producers alike; indeed, State investment inagriculture since the Cárdenas presidency (1934-1940)has tended to favour private and ejido commercialfarming rather then the ejido sector as a whole(Thiesenhusen, 1996 and Heath, 1990).
Furthermore, it is unclear whether the communitystructure of the ejido has had a positive or negative ef-fect on productivity. While often clearly playing a rolein increasing access to credit, common natural re-sources, pooled labour resources and economies ofscale for the purchase of agricultural machinery, theejido has often been undermined by corruption and in-efficiency, as local caciques and government agents usethe legal structure to further their personal interests atthe expense of the ejido. Both Dovring (1969) andHeath (1990) have shown that, controlling for farm size,few differences in productivity can be found betweenejido and private producers.
During the presidency of Carlos Salinas de Gortari(1988-1994), Mexico embarked upon a programme ofstructural reforms that has worked and will continue towork profound transformations in its economy andsociety. The Government joined the General Agreementon Tariffs and Trade (GATT), signed the North AmericanFree Trade Agreement (NAFTA) with Canada and theUnited States, initiated changes in the system of landownership in the ejido (land reform) sector affectingover half the country’s territory and modified the roleof the State in credit, marketing and other agriculturalsupport services.
Sectoral reforms centred on trade liberalization,the curtailment of State intervention in agriculture andcattle production and the reduction and redirection ofsubsidies, particularly as regards credit and technicalassistance. This involved doing away with quantitativerestrictions and licensing-in requirements, reducingtariffs, deregulating input and output markets and abol-ishing price guarantees, with the exception of maizeand bean prices. As development bank credit came tobe restricted to producers with productive potential andwithout debt arrears, a new national welfare institutionarose, Pronasol, which in agriculture functioned as aprovider of credit to poor rainfed producers and as apromoter of rural development initiatives. The impactof the reforms was aggravated by a macroeconomicpolicy that resulted in high interest rates and an over-valued exchange rate, as well as a slowdown in theoverall rate of economic growth. The impact of thisprofitability crisis differed greatly between households,having the severest effects on those farmers who par-ticipated in output markets and/or used purchased in-puts in agricultural and cattle production.5
The federal Government used two mainprogrammes to support agricultural and livestock-producing households. In 1994 it initiated an incomesupport programme, Procampo, with the goal ofcompensating basic grain and oilseed farmers for thenegative impact expected to result from the abolitionof price guarantees and market support under NAFTA.In 1996, the Government created the Alianza para elCampo (Countryside Alliance) programme. The goalof Alianza was to enhance agricultural and livestockproductivity through small investment projects financedjointly by the Government and producers. WhileProcampo reached over 80% of all ejidatarios in 1997,only 12% of ejido households participated in Alianza.
The backbone of the agricultural sector reformswas the 1992 reform of Article 27 of the Constitution,which formally ended the process of land reform inMexico. This reform established a legal process, calledProcede, whereby land rights were delineated withinthe ejido and land titles provided, and whereby ejidos,if authorized by the assembly, could then privatizeindividual parcels and eventually sell or rent out theirland. The explicit objective of the reforms was to fostera modernized and efficient agricultural sector. Thosefarmers who were unable to compete were expected toleave agriculture (Téllez Kuenzler, 1994).
4 See Thiesenhusen (1996) for a concise summary of this debate.
5 See De Janvry, Gordillo and Sadoulet (1997) and Davis (1997)for a description of the impact of the reforms during this period.

103C E P A L R E V I E W 7 2 • D E C E M B E R 2 0 0 0
THE ADJUSTMENT STRATEGIES OF MEXICAN EJIDATARIOS IN THE FACE OF NEOLIBERAL REFORM • BENJAMIN DAVIS
In addition to this law, which was highlycontroversial and which many feared would signal theend of the ejido in Mexico, the reform also establisheda body of regulations, covering land transactions bothprior and subsequent to privatization, which served as“candados” or lock-ins by making it harder to sell ejidoland. Although by 1994 little progress had been madein the cumbersome process of delineating land rightswithin the ejido under the Procede programme, theliberalizing climate surrounding controls over the ejidohad led to an increase in informal transactions, as isevident from the data available for this study.
The start of the Zedillo administration (1994-2000)was greeted by a severe currency crisis, which led to alarge devaluation (120% between December 1994 andMarch 1995), high levels of inflation and
macroeconomic instability right through 1996. Theseverity of the crisis and the subsequent macroeconomicinstability overshadowed the impact of NAFTA for mostof the agricultural sector, and it was this, combined withthe continuing implementation of Procede, that was themain determinant of change in ejido householdeconomic strategies over the 1994-1997 period.
In response, the Government tightened monetaryand fiscal policy and continued with the structuraladjustment of the economy, including deregulation andprivatization of the transport sector and implementationof Article 27 reform (Cord, 1998a and 1998b). ByDecember 1997, 79% of all ejidos had at least made astart with the Procede programme, while 59% hadreceived title. Very few ejidos had opted for dominiopleno, or full privatization of their plots.
IIIHow ejidatarios have responded
Macroeconomic instability since 1994 and implementationof Article 27 reform have brought forth a variety ofresponses from ejido households, these responses beingconditioned by the level of household access to a varietyof income-producing assets. A first response involves theaccumulation of land and the expansion of maizeproduction; a second, further diversification into off-farmactivities, particularly migration to the United States; anda third, the accumulation of cattle in conjunction with bothincreased maize growing and migration. Of overridingimportance to all ejido household adjustment strategies,however, whether explicitly or as future options, arediversification into non-agricultural or livestockactivities, which has been very widespread, and thepervasive influence of the United States labour market.Almost 45% of all households have a family connectionin the United States, whether in the form of a currentmigrant or children and siblings of the head of thehousehold residing permanently there. That thisconnection is alive and vibrant is shown by the highincidence of remitters (43%) among family membersliving in the United States.
These broad responses can be broken down.Despite the negative incentive framework and the risingcost of inputs, a core of modernized producers has beenjoined by a new group, and together these have led an
expansion of the maize growing area. For manyproducers, including a large proportion of indigenoushouseholds, expansion into maize and fodder has beenaccompanied by the accumulation of cattle. Similarly,a group of new United States migrants have investedtheir off-farm earnings in cattle accumulation. Anothergroup has expanded fruit and vegetable production,based not on access to irrigation but rather on agro-ecological factors. Those households that have the land,livestock and human capital assets needed to adjustsuccessfully have significantly higher incomes thanhouseholds without such assets.
The largest subgroup of ejidatarios, however,consists mostly of subsistence peasant producers, oftenindigenous, with little access to assets, institutions orgovernment support, who are more constrained in theirability to adjust. They continue to depend on subsistenceproduction of maize and beans, and have diversifiedheavily into low-paying local wage labour. Thesehouseholds, with less land, livestock, migration andhuman capital assets, have significantly lowerhousehold incomes then the households referred toabove that have been able to adjust successfully. Withoutaccess to adequate levels of assets, these householdswill continue to struggle in the current austeremacroeconomic environment.

C E P A L R E V I E W 7 2 • D E C E M B E R 2 0 0 0104
THE ADJUSTMENT STRATEGIES OF MEXICAN EJIDATARIOS IN THE FACE OF NEOLIBERAL REFORM • BENJAMIN DAVIS
Lastly, the adjustment responses exhibited by in-digenous households from different parts of the coun-try refute the assumption, common in sectoral analysis
and political debate, that indigenous households arehomogeneous in terms of living standards and assetlevels.
IVKey components of ejidatarios’adjustment strategies
1. Land accumulation
Reform of Article 27 of the Mexican constitution hasbrought about significant changes in patterns of landownership and control in the Mexican ejido. From 1994to 1997, the amount of quality-adjusted land assetsunder individual control increased by over 25% froman average of 8 NRE (National Rainfed Equivalents)6
hectares in 1994 to 10 NRE hectares in 1997. Thisincrease in individual control over land assets is a factorbehind many of the changes in household incomegeneration strategies described in the rest of this paper.These include increases in cattle accumulation, croparea given over to maize and fodder and maize marketparticipation as sellers, as table 1 shows.7
This change in land ownership patterns came aboutthrough unexpected channels. One of the results prom-ised for Article 27 reform was that land markets wouldbe formalized and become more efficient. The Procedecertification process was intended to increase the fre-quency of land sales and rentals. However, analysisshows that while Procede did indeed have a significantimpact in stimulating land markets, particularly forsmall, poor landholders (Olinto, Deininger and Davis,2000), the largest increase in rentals owed more to thepassage of the law then to the formal process of certifi-cation (Olinto, 1998).
More importantly, however, in terms of the changein total land area, ejidos, in anticipation of or as part ofthe Procede delineation process, or simply because ofthe atmosphere created by Article 27 reform, began to
divide up common land resources among theirejidatarios, so that vast tracts of pasture and forest landcame under individual control, both formally and in-formally. Part of the increase in land assets was alsodue to quality improvements, as our measure adjustsfor quality: in many cases rainfed land became irri-gated,8 particularly in the North and Pacific North, whileelsewhere forest was converted into pasture or rainfedagricultural land.9
Without more detailed study it is difficult to deter-mine the exact importance of each of these differentchanges in the land situation. As can be seen in table 1,without adjusting for quality, the average amount ofirrigated, rainfed and forest land per household in-creased significantly from 1994 to 1997. The relativeinsignificance of pasture land masks widespread shiftsbetween the forest, pasture and rainfed categories. TheGulf region has been the scene of the greatest of thesechanges, which we suspect are primarily due to the di-vision of the Commons.10 One negative consequencehas been the creation of a new class of large producers,latifundistas from a Mexican historical perspective,controlling over 100 NRE hectares of land apiece. Theten producers concerned (up from one in 1994 in thepanel subset) account for over 25% of the total increasein new land under individual control.
Nonetheless, the new latifundia aside, thesechanges do not appear to have worsened the distribu-tion of individually controlled land. Except for a few
6 Land was aggregated, adjusting for quality, into National RainfedEquivalents. Details of the construction of this land aggregate canbe found in Davis, 1997.7 Means tests in all tables are the following: for 0,1 variables, thenull hypothesis is rejected if c > 3.84 (2 tails, 10%*) or 5.02 (2tails, 5%**); for continuous variables, the null hypotheses is re-jected if t > 1.65 (2 tails, 10%) or 1.96 (2 tails, 5%).
8 This increase is due not to a widespread programme to expandirrigation, but rather to the variable nature of much of Mexicanirrigation.9 That this should be regarded as a quality improvement does notmean that it is better or preferable from a social point of view,simply that rainfed land is considered to have higher economicpotential.10 This has been confirmed in further recent field work by CarlosMunoz of the University of California, Berkeley.
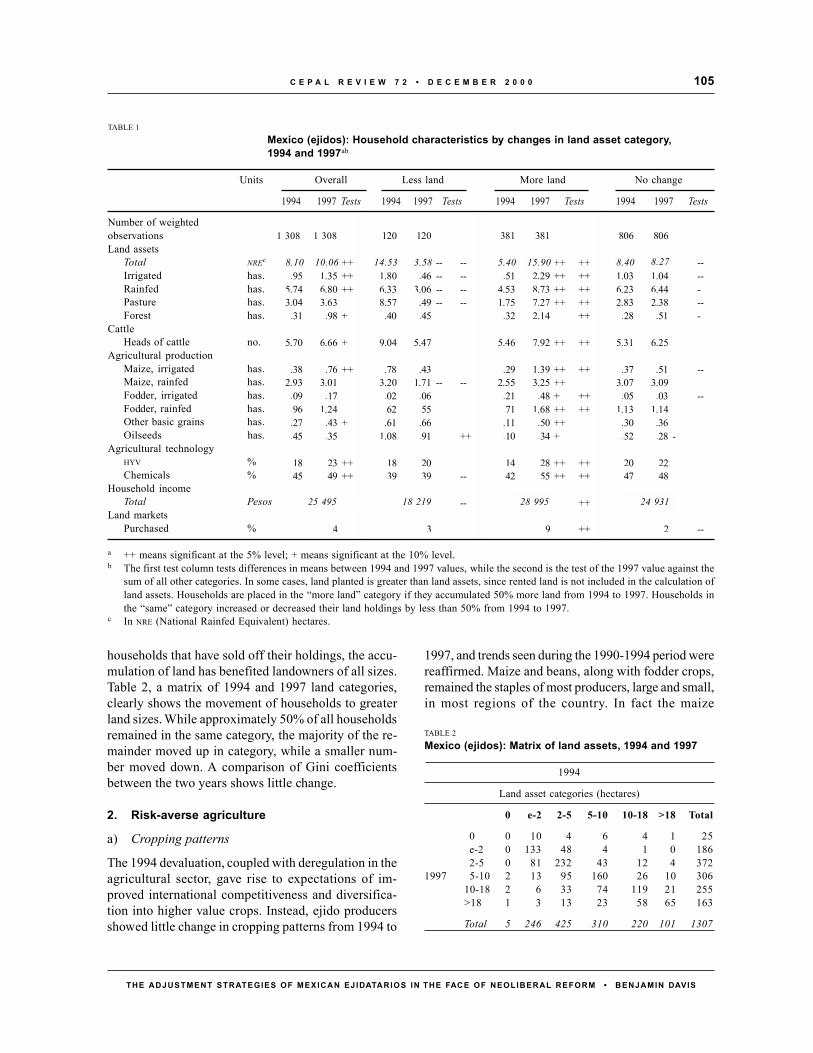
105C E P A L R E V I E W 7 2 • D E C E M B E R 2 0 0 0
THE ADJUSTMENT STRATEGIES OF MEXICAN EJIDATARIOS IN THE FACE OF NEOLIBERAL REFORM • BENJAMIN DAVIS
households that have sold off their holdings, the accu-mulation of land has benefited landowners of all sizes.Table 2, a matrix of 1994 and 1997 land categories,clearly shows the movement of households to greaterland sizes. While approximately 50% of all householdsremained in the same category, the majority of the re-mainder moved up in category, while a smaller num-ber moved down. A comparison of Gini coefficientsbetween the two years shows little change.
2. Risk-averse agriculture
a) Cropping patterns
The 1994 devaluation, coupled with deregulation in theagricultural sector, gave rise to expectations of im-proved international competitiveness and diversifica-tion into higher value crops. Instead, ejido producersshowed little change in cropping patterns from 1994 to
1997, and trends seen during the 1990-1994 period werereaffirmed. Maize and beans, along with fodder crops,remained the staples of most producers, large and small,in most regions of the country. In fact the maize
TABLE 1
Mexico (ejidos): Household characteristics by changes in land asset category,1994 and 1997ab
Units Overall Less land More land No change
1994 1997 Tests 1994 1997 Tests 1994 1997 Tests 1994 1997 Tests
Number of weightedobservationsLand assets
Total NREc
Irrigated has.Rainfed has.Pasture has.Forest has.
CattleHeads of cattle no.
Agricultural productionMaize, irrigated has.Maize, rainfed has.Fodder, irrigated has.Fodder, rainfed has.Other basic grains has.Oilseeds has.
Agricultural technologyHYV %Chemicals %
Household incomeTotal Pesos
Land marketsPurchased %
a ++ means significant at the 5% level; + means significant at the 10% level.b The first test column tests differences in means between 1994 and 1997 values, while the second is the test of the 1997 value against the
sum of all other categories. In some cases, land planted is greater than land assets, since rented land is not included in the calculation ofland assets. Households are placed in the “more land” category if they accumulated 50% more land from 1994 to 1997. Households inthe “same” category increased or decreased their land holdings by less than 50% from 1994 to 1997.
c In NRE (National Rainfed Equivalent) hectares.
1308 1308 120 120 381 381 806 806
8.10 10.06 ++ 14.63 3.58 -- -- 5.40 15.90 ++ ++ 8.40 8.27 --.95 1.35 ++ 1.80 .46 -- -- .51 2.29 ++ ++ 1.03 1.04 --
5.74 6.80 ++ 6.33 3.06 -- -- 4.53 8.73 ++ ++ 6.23 6.44 -3.04 3.63 8.57 .49 -- -- 1.75 7.27 ++ ++ 2.83 2.38 --.31 .98 + .40 .45 .32 2.14 ++ .28 .51 -
5.70 6.66 + 9.04 5.47 5.46 7.92 ++ ++ 5.31 6.25
.38 .76 ++ .78 .43 .29 1.39 ++ ++ .37 .51 --2.93 3.01 3.20 1.71 -- -- 2.55 3.25 ++ 3.07 3.09.09 .17 .02 .06 .21 .48 + ++ .05 .03 --.96 1.24 .62 .55 .71 1.68 ++ ++ 1.13 1.14.27 .43 + .61 .66 .11 .50 ++ .30 .36.45 .35 1.08 .91 ++ .10 .34 + .52 .28 -
18 23 ++ 18 20 14 28 ++ ++ 20 2245 49 ++ 39 39 -- 42 55 ++ ++ 47 48
25495 18219 -- 28995 ++ 24931
4 3 9 ++ 2 --
1 308 1 308
25 495 18 219 28 995 24 931
8.278.4015.905.403.5814.5310.068.10
TABLE 2
Mexico (ejidos): Matrix of land assets, 1994 and 1997
1994
Land asset categories (hectares)
0 e-2 2-5 5-10 10-18 >18 Total
0 0 10 4 6 4 1 25e-2 0 133 48 4 1 0 1862-5 0 81 232 43 12 4 372
1997 5-10 2 13 95 160 26 10 30610-18 2 6 33 74 119 21 255>18 1 3 13 23 58 65 163
Total 5 246 425 310 220 101 1307

C E P A L R E V I E W 7 2 • D E C E M B E R 2 0 0 0106
THE ADJUSTMENT STRATEGIES OF MEXICAN EJIDATARIOS IN THE FACE OF NEOLIBERAL REFORM • BENJAMIN DAVIS
growing area was expanded, primarily by larger, irri-gated farms, partially at the expense of higher valuecrops such as wheat and oilseeds, while the majority ofpeasant farmers continued to depend on maize.
While this tendency from 1990 to 1994 was as-cribed to higher guaranteed prices for maize, from 1994to 1997 real maize prices underwent significant de-creases. The continued reliance on maize in 1997 islinked to the low price risk and production costs of thiscrop by comparison with higher value crops, consider-ations that were particularly important in a situation ofeconomic uncertainty compounded by poor institutionalsupport and weak marketing channels (see Cord, 1998aand Olsen, 1998). Many households also prefer thequality of home-grown native varieties to the importedor HYV maize used in most of the dough and tortillasavailable for purchase. Also, a mistaken belief amongfarmers that they had to continue to grow basic grainsin order to receive Procampo benefits may have influ-enced the decision of many of them to stay in maizeproduction.
Most producers continued to grow maize and beansbetween 1994 and 1997. Almost 75% of householdsplanted monocropped maize, while 19% intercroppedmaize with other crops, primarily beans. The propor-tion of households growing fruit and vegetables andfodder, the next most important crop groups, remainedessentially unchanged between 1994 and 1997.
The expansion of maize growing becomes evidentwhen looked at from the perspective of the area undercultivation. This expansion occurred primarily on larger,irrigated farms planting in the autumn-winter season,the very farms that were expected to diversify intohigher value crops. Table 3 shows the irrigated areaunder cultivation, in the aggregate and by farm size.The average area give over to monocropped maize perhousehold more than doubled from 1994 to 1997, con-tinuing the trend seen during the earlier period. Simi-larly, the area under fodder crops almost doubled. Thisgrowth came partly from an increase of almost 50% inthe amount of irrigated land under cultivation, whichreversed the 1990-1994 trend towards a decrease in theirrigated area. The remainder of the growth in maizeand fodder production came at the expense of wheatand oilseeds (particularly soya beans): the area of thelatter dropped to zero, completing the long-term de-cline in the production of those crops. Again, most ofthis change took place on larger farms.
In table 4, households are categorized accordingto changes in the area planted with maize over the sur-vey period. Comparison of households that expanded
maize production with those that reduced it or kept itunchanged shows that the former were larger, modern-ized producers. These tended to have more land assetsand land in use than the other categories, and were theonly category of households to increase cattle stockssignificantly over the survey period. A significantlylarger proportion of these households used HYV seedsin production, and they showed the largest increase inuse of these from 1994 onwards. Their farms werespread out geographically across the country, and theyhad higher than average household incomes.
By contrast, households that reduced the area undermaize showed significantly lower technology use inboth 1994 and 1997, and did not accumulate cattle. Partof this decrease was transferred to other basic grains,while a significantly higher proportion of householdsrented out land. These households were located to adisproportionate extent in the North, and less in theGulf region.
The largest group of maize producers maintainedtheir level of production. These primarily rainfed-basedpeasant producers showed little change in agriculturalproduction, with the exception of the area under fod-der, but expanded their participation in off-farm wagelabour and temporary migration to the United States.Generally speaking, these households had lower levelsof education and production assets (land, cattle andmachinery). Their limited ability to adjust through ag-riculture resulted in their having significantly lowerincomes than other households.
While irrigated, modernized producers wereprimarily engaged in driving the expansion of maize
TABLE 3
Mexico (ejidos): Average irrigated area per crop by yearand farm size (hectares), 1990, 1994 and 1997
1990 1994 1997
Maize (monocropped) 0.25 0.39 0.79< 5 has 0.16 0.10 0.13≥ 5 has 0.46 0.79 1.41
Wheat 0.30 0.16 0.13< 5 has 0.01 0.01 0.00≥≥≥≥≥ 5 has 0.66 0.37 0.25
Oil seeds 0.16 0.07 0.00< 5 has 0.00 0.00 0.00≥ 5 has 0.37 0.16 0.00
Fodder 0.09 0.10 0.18< 5 has 0.02 0.02 0.01≥ 5 has 0.18 0.20 0.34
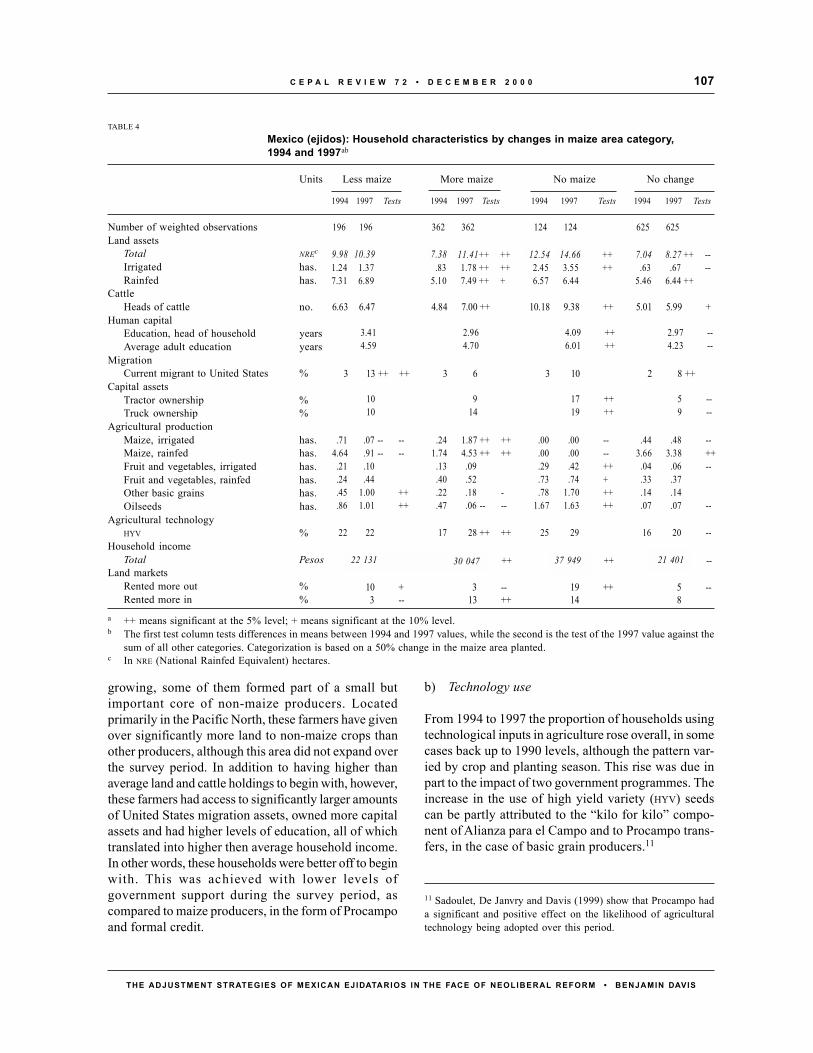
107C E P A L R E V I E W 7 2 • D E C E M B E R 2 0 0 0
THE ADJUSTMENT STRATEGIES OF MEXICAN EJIDATARIOS IN THE FACE OF NEOLIBERAL REFORM • BENJAMIN DAVIS
growing, some of them formed part of a small butimportant core of non-maize producers. Locatedprimarily in the Pacific North, these farmers have givenover significantly more land to non-maize crops thanother producers, although this area did not expand overthe survey period. In addition to having higher thanaverage land and cattle holdings to begin with, however,these farmers had access to significantly larger amountsof United States migration assets, owned more capitalassets and had higher levels of education, all of whichtranslated into higher then average household income.In other words, these households were better off to beginwith. This was achieved with lower levels ofgovernment support during the survey period, ascompared to maize producers, in the form of Procampoand formal credit.
b) Technology use
From 1994 to 1997 the proportion of households usingtechnological inputs in agriculture rose overall, in somecases back up to 1990 levels, although the pattern var-ied by crop and planting season. This rise was due inpart to the impact of two government programmes. Theincrease in the use of high yield variety (HYV) seedscan be partly attributed to the “kilo for kilo” compo-nent of Alianza para el Campo and to Procampo trans-fers, in the case of basic grain producers.11
11 Sadoulet, De Janvry and Davis (1999) show that Procampo hada significant and positive effect on the likelihood of agriculturaltechnology being adopted over this period.
9.98 10.39 7.38 11.41 ++ ++ 12.54 14.66 ++ 7.04 8.27 ++ --1.24 1.37 .83 1.78 ++ ++ 2.45 3.55 ++ .63 .67 --7.31 6.89 5.10 7.49 ++ + 6.57 6.44 5.46 6.44 ++
6.63 6.47 4.84 7.00 ++ 10.18 9.38 ++ 5.01 5.99 +
3.41 2.96 4.09 ++ 2.97 --4.59 4.70 6.01 ++ 4.23 --
3 13 ++ ++ 3 6 3 10 2 8 ++
10 9 17 ++ 5 --10 14 19 ++ 9 --
.71 .07 -- -- .24 1.87 ++ ++ .00 .00 -- .44 .48 --4.64 .91 -- -- 1.74 4.53 ++ ++ .00 .00 -- 3.66 3.38 ++.21 .10 .13 .09 .29 .42 ++ .04 .06 --.24 .44 .40 .52 .73 .74 + .33 .37.45 1.00 ++ .22 .18 - .78 1.70 ++ .14 .14.86 1.01 ++ .47 .06 -- -- 1.67 1.63 ++ .07 .07 --
22 22 17 28 ++ ++ 25 29 16 20 --
22131 30047 ++ 37949 ++ 21401 --
10 + 3 -- 19 ++ 5 --3 -- 13 ++ 14 8
196 196 362 362 124 124 625 625
22 131 30 047 37 949 21 401
8.277.0414.6612.54
TABLE 4
Mexico (ejidos): Household characteristics by changes in maize area category,1994 and 1997ab
Units Less maize More maize No maize No change
1994 1997 Tests 1994 1997 Tests 1994 1997 Tests 1994 1997 Tests
Number of weighted observationsLand assets
Total NREc
Irrigated has.Rainfed has.
CattleHeads of cattle no.
Human capitalEducation, head of household yearsAverage adult education years
MigrationCurrent migrant to United States %
Capital assetsTractor ownership %Truck ownership %
Agricultural productionMaize, irrigated has.Maize, rainfed has.Fruit and vegetables, irrigated has.Fruit and vegetables, rainfed has.Other basic grains has.Oilseeds has.
Agricultural technologyHYV %
Household incomeTotal Pesos
Land marketsRented more out %Rented more in %
a ++ means significant at the 5% level; + means significant at the 10% level.b The first test column tests differences in means between 1994 and 1997 values, while the second is the test of the 1997 value against the
sum of all other categories. Categorization is based on a 50% change in the maize area planted.c In NRE (National Rainfed Equivalent) hectares.
11.417.3810.399.98
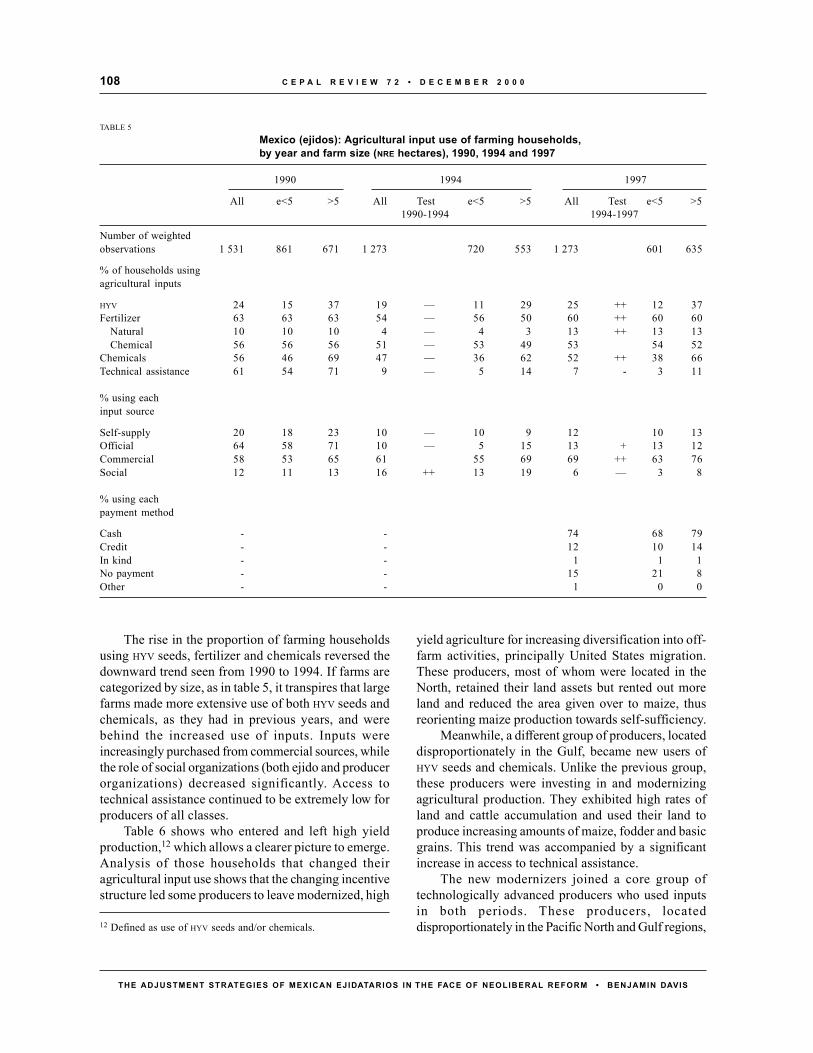
C E P A L R E V I E W 7 2 • D E C E M B E R 2 0 0 0108
THE ADJUSTMENT STRATEGIES OF MEXICAN EJIDATARIOS IN THE FACE OF NEOLIBERAL REFORM • BENJAMIN DAVIS
The rise in the proportion of farming householdsusing HYV seeds, fertilizer and chemicals reversed thedownward trend seen from 1990 to 1994. If farms arecategorized by size, as in table 5, it transpires that largefarms made more extensive use of both HYV seeds andchemicals, as they had in previous years, and werebehind the increased use of inputs. Inputs wereincreasingly purchased from commercial sources, whilethe role of social organizations (both ejido and producerorganizations) decreased significantly. Access totechnical assistance continued to be extremely low forproducers of all classes.
Table 6 shows who entered and left high yieldproduction,12 which allows a clearer picture to emerge.Analysis of those households that changed theiragricultural input use shows that the changing incentivestructure led some producers to leave modernized, high
yield agriculture for increasing diversification into off-farm activities, principally United States migration.These producers, most of whom were located in theNorth, retained their land assets but rented out moreland and reduced the area given over to maize, thusreorienting maize production towards self-sufficiency.
Meanwhile, a different group of producers, locateddisproportionately in the Gulf, became new users ofHYV seeds and chemicals. Unlike the previous group,these producers were investing in and modernizingagricultural production. They exhibited high rates ofland and cattle accumulation and used their land toproduce increasing amounts of maize, fodder and basicgrains. This trend was accompanied by a significantincrease in access to technical assistance.
The new modernizers joined a core group oftechnologically advanced producers who used inputsin both periods. These producers, locateddisproportionately in the Pacific North and Gulf regions,
TABLE 5
Mexico (ejidos): Agricultural input use of farming households,by year and farm size (NRE hectares), 1990, 1994 and 1997
1990 1994 1997
All e<5 >5 All Test e<5 >5 All Test e<5 >51990-1994 1994-1997
Number of weightedobservations 1 531 861 671 1 273 720 553 1 273 601 635
% of households usingagricultural inputs
HYV 24 15 37 19 — 11 29 25 ++ 12 37Fertilizer 63 63 63 54 — 56 50 60 ++ 60 60
Natural 10 10 10 4 — 4 3 13 ++ 13 13Chemical 56 56 56 51 — 53 49 53 54 52
Chemicals 56 46 69 47 — 36 62 52 ++ 38 66Technical assistance 61 54 71 9 — 5 14 7 - 3 11
% using eachinput source
Self-supply 20 18 23 10 — 10 9 12 10 13Official 64 58 71 10 — 5 15 13 + 13 12Commercial 58 53 65 61 55 69 69 ++ 63 76Social 12 11 13 16 ++ 13 19 6 — 3 8
% using eachpayment method
Cash - - 74 68 79Credit - - 12 10 14In kind - - 1 1 1No payment - - 15 21 8Other - - 1 0 0
12 Defined as use of HYV seeds and/or chemicals.
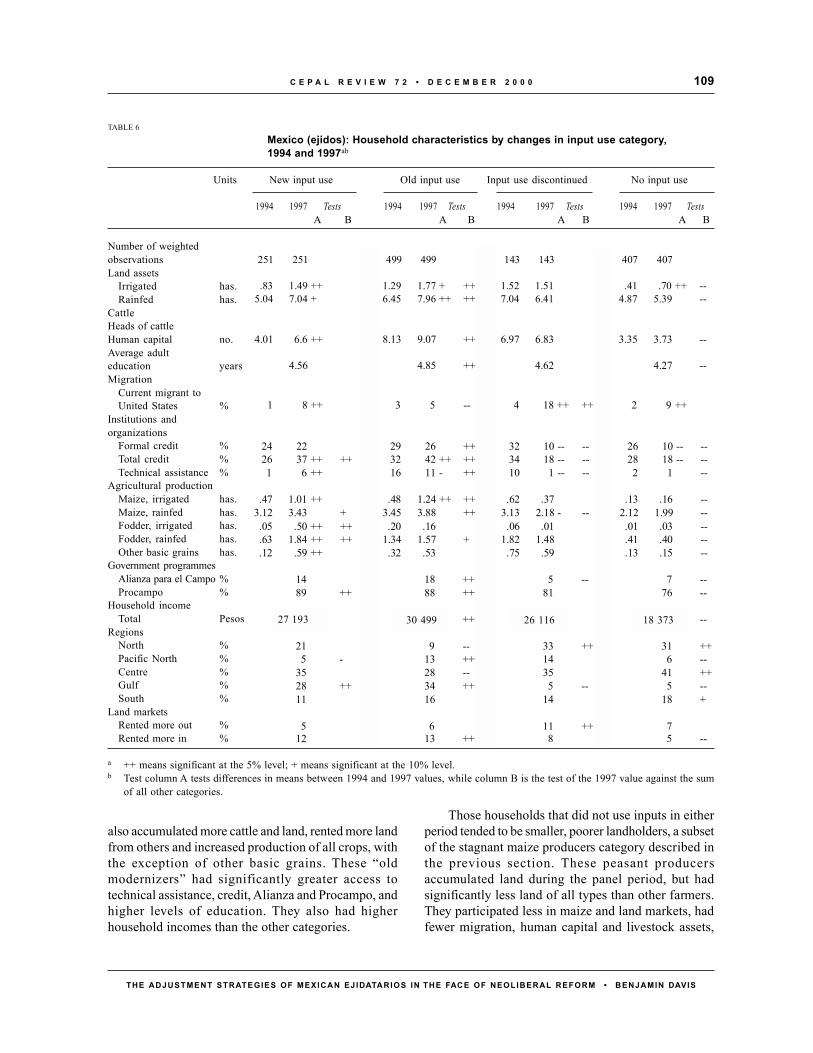
109C E P A L R E V I E W 7 2 • D E C E M B E R 2 0 0 0
THE ADJUSTMENT STRATEGIES OF MEXICAN EJIDATARIOS IN THE FACE OF NEOLIBERAL REFORM • BENJAMIN DAVIS
also accumulated more cattle and land, rented more landfrom others and increased production of all crops, withthe exception of other basic grains. These “oldmodernizers” had significantly greater access totechnical assistance, credit, Alianza and Procampo, andhigher levels of education. They also had higherhousehold incomes than the other categories.
Those households that did not use inputs in eitherperiod tended to be smaller, poorer landholders, a subsetof the stagnant maize producers category described inthe previous section. These peasant producersaccumulated land during the panel period, but hadsignificantly less land of all types than other farmers.They participated less in maize and land markets, hadfewer migration, human capital and livestock assets,
TABLE 6
Mexico (ejidos): Household characteristics by changes in input use category,1994 and 1997ab
Units New input use Old input use Input use discontinued No input use
1994 1997 Tests 1994 1997 Tests 1994 1997 Tests 1994 1997 TestsA B A B A B A B
Number of weightedobservationsLand assets
Irrigated has.Rainfed has.
CattleHeads of cattleHuman capital no.Average adulteducation yearsMigration
Current migrant toUnited States %
Institutions andorganizations
Formal credit %Total credit %Technical assistance %
Agricultural productionMaize, irrigated has.Maize, rainfed has.Fodder, irrigated has.Fodder, rainfed has.Other basic grains has.
Government programmesAlianza para el Campo %Procampo %
Household incomeTotal Pesos
RegionsNorth %Pacific North %Centre %Gulf %South %
Land marketsRented more out %Rented more in %
a ++ means significant at the 5% level; + means significant at the 10% level.b Test column A tests differences in means between 1994 and 1997 values, while column B is the test of the 1997 value against the sum
of all other categories.
251 251 499 499 143 143 407 407
.83 1.49 ++ 1.29 1.77 + ++ 1.52 1.51 .41 .70 ++ --5.04 7.04 + 6.45 7.96 ++ ++ 7.04 6.41 4.87 5.39 --
4.01 6.6 ++ 8.13 9.07 ++ 6.97 6.83 3.35 3.73 --
4.56 4.85 ++ 4.62 4.27 --
1 8 ++ 3 5 -- 4 18 ++ ++ 2 9 ++
24 22 29 26 ++ 32 10 -- -- 26 10 -- --26 37 ++ ++ 32 42 ++ ++ 34 18 -- -- 28 18 -- --1 6 ++ 16 11 - ++ 10 1 -- -- 2 1 --
.47 1.01 ++ .48 1.24 ++ ++ .62 .37 .13 .16 --3.12 3.43 + 3.45 3.88 ++ 3.13 2.18 - -- 2.12 1.99 --.05 .50 ++ ++ .20 .16 .06 .01 .01 .03 --.63 1.84 ++ ++ 1.34 1.57 + 1.82 1.48 .41 .40 --.12 .59 ++ .32 .53 .75 .59 .13 .15 --
14 18 ++ 5 -- 7 --89 ++ 88 ++ 81 76 --
27193 30499 ++ 26116 18373 --
21 9 -- 33 ++ 31 ++5 - 13 ++ 14 6 --
35 28 -- 35 41 ++28 ++ 34 ++ 5 -- 5 --11 16 14 18 +
5 6 11 ++ 712 13 ++ 8 5 --
27 193 30 499 26 116 18 373

C E P A L R E V I E W 7 2 • D E C E M B E R 2 0 0 0110
THE ADJUSTMENT STRATEGIES OF MEXICAN EJIDATARIOS IN THE FACE OF NEOLIBERAL REFORM • BENJAMIN DAVIS
and were heavily dependent on off-farm activities,primarily local agricultural wage labour, to supplementtheir meagre agricultural and cattle income. Overall,these households had significantly lower totalhousehold incomes. They were located primarily in theNorth and Centre regions, and to a lesser extent in theGulf, and had less access to Alianza and Procampo.
c) Scarcity of credit
Providing access to adequate financial resources has tobe a key component of any sectoral programme thathas the goal of increasing agricultural competitiveness.Unfortunately, credit remains scarce for producers inthe ejido sector. At first glance, it seems that access tocredit declined precipitously between 1994 and 1997.While 30% of households had some kind of formal orinformal credit in 1994, by 1996 and 1997 this propor-tion had dropped to 20% in each year. Most of thisdecline was due to the ending of the Pronasolprogramme, which was only partially made up for byan increase in the use of informal sources. Access toBanrural credit remained more or less constant ataround 5%, while other types of formal public-sectoror commercial credit were negligible. If access to creditis taken for 1996 and 1997 together, however, over 10%of panel households had Banrural credit. Going backto table 5, only 12% of households received agricul-tural inputs on credit.
The drop caused by the ending of Pronasol is some-what deceptive, however. Although its conceptual ori-gins were different, Pronasol was similar in practice tothe Procampo programme. While Pronasol was con-ceived as a way of providing interest-free loans tosmaller producers for agricultural inputs, Procampo ismeant to compensate basic grain producers for the tradeliberalization provisions of NAFTA. The goal is to pro-vide this income transfer in time for it to be used in thepurchase of agricultural inputs, whence the similarityto Pronasol. Procampo has much wider coverage thanPronasol ever did, reaching more than 80% of all ejidohouseholds. In this respect, then, there has been a tre-mendous increase in credit. The amounts provided aretoo small, however, to entice producers to take the riskof diversifying beyond maize and other basic grains.
Nonetheless, econometric studies using ejido datahave shown that to some extent Procampo paymentsdo in fact ease the credit and/or liquidity constraintsthat pervade the ejido sector. Sadoulet, De Janvry andDavis (1999) find that Procampo transfers have a mul-tiplier effect on total agricultural and livestock income.
For every peso given in transfers, 2 pesos’ worth ofhousehold income is generated. These results are in-dicative both of the hunger for financing that exists andof the actual and potential returns that can be gener-ated by easing credit and liquidity constraints in theejido sector.
Households that did receive formal credit in 1997,as shown in table 7, display special characteristics.Those households that received formal credit for thefirst time in 1997, or had credit in both periods, hadagriculture as their primary economic activity and weredynamic producers using high yield technologies andincreasing the amount of land they rented from others.Both groups received over half their 1997 credit fromBanrural and had a significantly higher incidence ofparticipation in Alianza and Procampo. Both had sig-nificantly higher incomes then those households thatdid not receive credit in 1996 or 1997.
Important differences separate these groups, how-ever. The new credit recipients had significantly greaterareas under maize, and 17% of these households wentinto fruit and vegetable production. This increase inagricultural production was helped by a large rise inland holdings, and was accompanied by an increase ininput use. Over 50% sold their maize at market. More-over, these households had significantly lower partici-pation in waged activities owing to their success inagriculture and cattle production. A significantly higherpercentage of them were from the Gulf region,13 and alower percentage from the South and North.
Existing credit recipients, on the other hand, ex-panded maize production partly at the expense of otherbasic grains and oilseeds. These households maintainedtheir off-farm activities and expanded into United Statesmigration; they already had high levels of input use in1994, and this continued to be the case in 1997. Thisgroup includes the traditionally modernizing produc-ers of the North Pacific, as well as other regions.
Those households that received formal credit in1994 but no longer did so in 1996 or 1997 were mainlyPronasol recipients who received no credit, even of aninformal kind, in 1997. A significantly higher propor-tion of these well educated households left maize andfodder production while expanding into off-farm ac-tivities, particularly United States migration. There is
13 The data show that the Gulf region was particularly favouredwith access to government programmes (Alianza, Procampo, creditand technical assistance) during this period (see Cord, 1998b). Tworeasons may account for this. Yucatan and Tabasco states both hadnationally important elections for governors, and the governor ofYucatan is a former Secretary of Agrarian Reform.
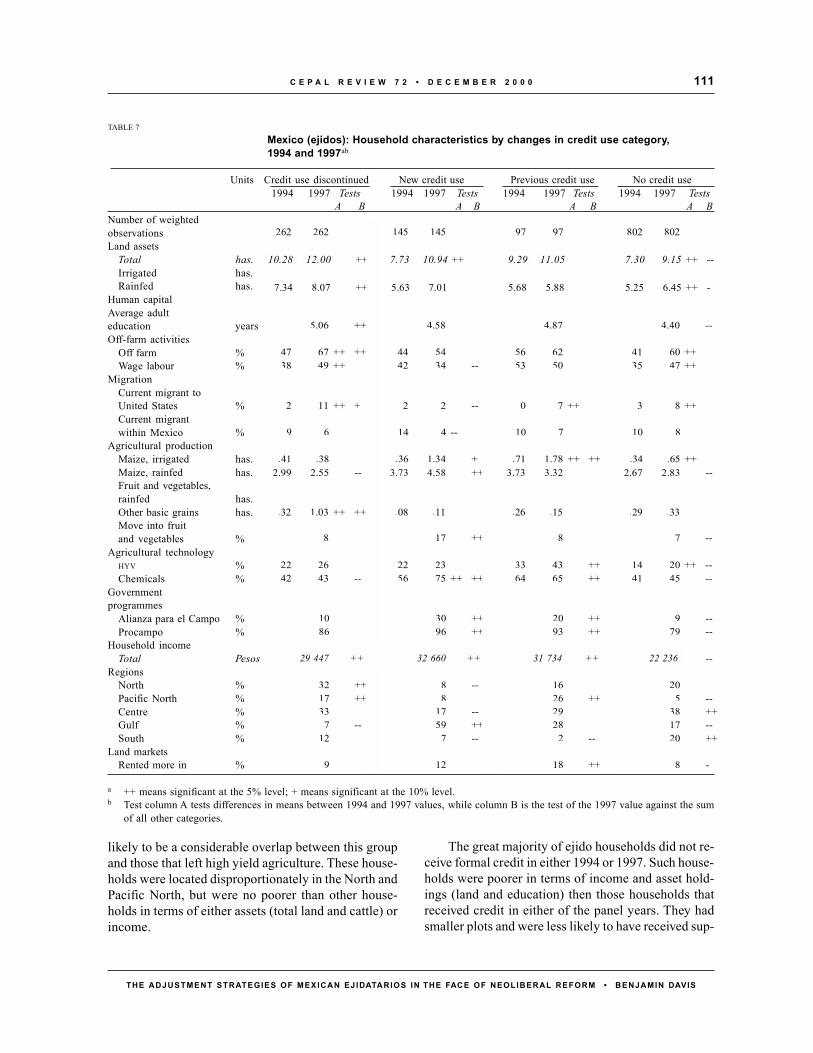
111C E P A L R E V I E W 7 2 • D E C E M B E R 2 0 0 0
THE ADJUSTMENT STRATEGIES OF MEXICAN EJIDATARIOS IN THE FACE OF NEOLIBERAL REFORM • BENJAMIN DAVIS
likely to be a considerable overlap between this groupand those that left high yield agriculture. These house-holds were located disproportionately in the North andPacific North, but were no poorer than other house-holds in terms of either assets (total land and cattle) orincome.
The great majority of ejido households did not re-ceive formal credit in either 1994 or 1997. Such house-holds were poorer in terms of income and asset hold-ings (land and education) then those households thatreceived credit in either of the panel years. They hadsmaller plots and were less likely to have received sup-
TABLE 7
Mexico (ejidos): Household characteristics by changes in credit use category,1994 and 1997ab
Units Credit use discontinued New credit use Previous credit use No credit use1994 1997 Tests 1994 1997 Tests 1994 1997 Tests 1994 1997 Tests
A B A B A B A BNumber of weightedobservationsLand assets
Total has.Irrigated has.Rainfed has.
Human capitalAverage adulteducation yearsOff-farm activities
Off farm %Wage labour %
MigrationCurrent migrant toUnited States %Current migrantwithin Mexico %
Agricultural productionMaize, irrigated has.Maize, rainfed has.Fruit and vegetables,rainfed has.Other basic grains has.Move into fruitand vegetables %
Agricultural technologyHYV %Chemicals %
Governmentprogrammes
Alianza para el Campo %Procampo %
Household incomeTotal Pesos
RegionsNorth %Pacific North %Centre %Gulf %South %
Land marketsRented more in %
a ++ means significant at the 5% level; + means significant at the 10% level.b Test column A tests differences in means between 1994 and 1997 values, while column B is the test of the 1997 value against the sum
of all other categories.
10.28 12.00 ++ 7.73 10.94 ++ 9.29 11.05 7.30 9.15 ++ --
7.34 8.07 ++ 5.63 7.01 5.68 5.88 5.25 6.45 ++ -
262 262 145 145 97 97 802 802
5.06 ++ 4.58 4.87 4.40 --
47 67 ++ ++ 44 54 56 62 41 60 ++38 49 ++ 42 34 -- 53 50 35 47 ++
2 11 ++ + 2 2 -- 0 7 ++ 3 8 ++
9 6 14 4 -- 10 7 10 8
.41 .38 .36 1.34 + .71 1.78 ++ ++ .34 .65 ++2.99 2.55 -- 3.73 4.58 ++ 3.73 3.32 2.67 2.83 --
.32 1.03 ++ ++ .08 .11 .26 .15 .29 .33
8 17 ++ 8 7 --
22 26 22 23 33 43 ++ 14 20 ++ --42 43 -- 56 75 ++ ++ 64 65 ++ 41 45 --
10 30 ++ 20 ++ 9 --86 96 ++ 93 ++ 79 --
29447 ++ 32660 ++ 31734 ++ 22236 --
32 ++ 8 -- 16 2017 ++ 8 26 ++ 5 --33 17 -- 29 38 ++
7 -- 59 ++ 28 17 --12 7 -- 2 -- 20 ++
9 12 18 ++ 8 -
29 447 ++ 32 660 ++ 31 734 ++ 22 236
10.28 12.00 7.73 10.94 9.29 11.05 7.30 9.15

C E P A L R E V I E W 7 2 • D E C E M B E R 2 0 0 0112
THE ADJUSTMENT STRATEGIES OF MEXICAN EJIDATARIOS IN THE FACE OF NEOLIBERAL REFORM • BENJAMIN DAVIS
port from government agricultural sector programmes.They were located primarily in the Centre andSouthern regions.
3. Livestock accumulation
Livestock production in the ejido sector has threeimportant functions. Firstly, it accounts for over 16%of all income in that sector. Secondly, livestock andlivestock derivatives (such as milk and eggs) consumedat home are an integral part of household diets. Thirdly,and perhaps most importantly given the macroeconomicinstability and high interest rates that prevailed duringthis period, animal holdings serve as saving andinsurance mechanisms for many producers. In mostcases they function as part of a complementary strategy,which may be one of land accumulation and increasedmaize growing or United States migration.
Accordingly, livestock production is anincreasingly important component of incomegeneration strategies among ejido households. Theaverage number of heads of cattle owned increasedsignificantly from 1994 to 1997, growing by almost20%, although this increase was less than that of the1990-1994 period. Besides cattle, other kinds oflivestock are widely kept. Over half the 1997households owned poultry and almost 40% pigs. Milkwas produced by 25% of households and eggs by 38%.
As was seen in the section on agriculture, cattleaccumulation is associated with expansion of the areagiven over to maize and fodder, as well as fruit andvegetables. To achieve this growth, cattle-accumulatinghouseholds increased all types of land assets exceptforest, as table 8 shows. These households had aboveaverage input use and Alianza participation rates. Overhalf the accumulators were new cattle owners.
A key accumulator subgroup was constituted bythose households, primarily in the North, whosemembers migrated to the United States for the first timeduring the survey period. These cattle-accumulatinghouseholds had higher than average migration assetsin the United States. Conversely, those who decreasedtheir holdings of livestock, or had none, receivedsignificantly less in remittances than cattle owners.Those with access to networks in the United States arein a better position to accumulate cattle because theyreceive remittances and are able to generate temporarymigration income. Migration may serve to relax creditconstraints that inhibit cattle accumulation.14 Cattle
accumulation may also complement United Statesmigration in that it is relatively non-labour intensiveand serves as an investment/saving mechanism formigration income. Overall, accumulating householdshad significantly higher income than those thatdecreased their holdings of livestock or had no suchholdings.
Those livestock households that maintained the sizeof their herds, however, did not expand either maize orfodder production or accumulate land, although their1997 holdings of cattle and land, and the area they hadunder fodder, were significantly greater than those ofthe other categories. These households also hadsignificantly higher levels of migration, something thatseems to confirm the cattle-migration link discussedearlier. On the other hand, while they increased theiroff-farm activities during the survey period, in 1997they still engaged less in these than the other categories.Unsurprisingly, given their large internal demand, thesehouseholds participated less as sellers in the maizemarket.
Those that reduced their cattle holdings, on theother hand, also reduced their holdings of pasture landand increasingly rented land out. Although off-farmactivities increased somewhat (1997 levels were stillsignificantly lower than among other households), asdid United States migration, no strong alternative tothe maize-cattle strategy emerged among thesehouseholds. Thus, it appears that reducing livestockholdings serves the same function as running downsavings during difficult economic times.
4. Diversification into off-farm activities
It is no longer accurate to think of the ejido sector asprimarily agricultural. In terms of both activities andincome, ejido households have diversified into the off-farm sector. Off-farm activities serve a variety of purposes,most importantly as sources of income or householdconsumption. We have found evidence that in some casesthese activities may also complement agriculturalproduction by easing the liquidity and credit constraintsthat afflict the sector.
It is thus not surprising that ejido adjustment is takingplace primarily outside agriculture. Households arereacting to price risk, instability in agriculture anddeclining profitability by further diversifying into income-generating activities outside agriculture. From 1994 to1997, the proportion of households participating in off-farm activities increased by 33% to stand at 60% of allejido households. This statistically significant increase was
14 This is the conclusion drawn by Sadoulet, De Janvry and Davis(1999).
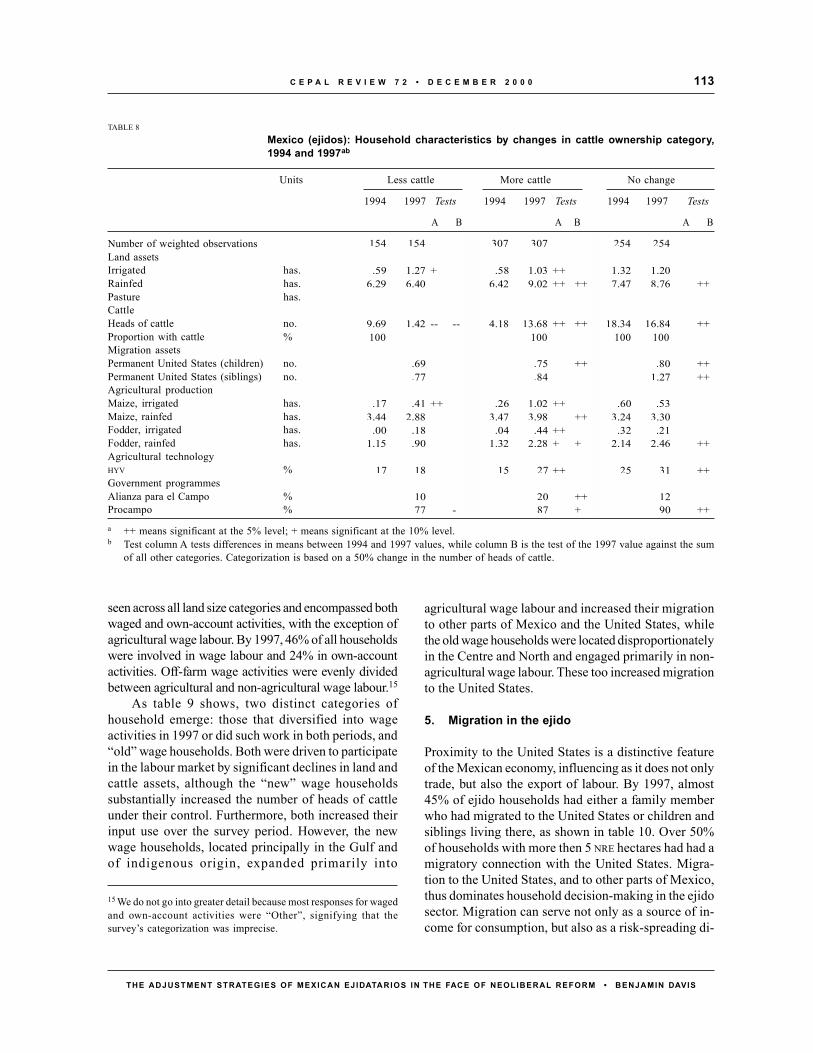
113C E P A L R E V I E W 7 2 • D E C E M B E R 2 0 0 0
THE ADJUSTMENT STRATEGIES OF MEXICAN EJIDATARIOS IN THE FACE OF NEOLIBERAL REFORM • BENJAMIN DAVIS
seen across all land size categories and encompassed bothwaged and own-account activities, with the exception ofagricultural wage labour. By 1997, 46% of all householdswere involved in wage labour and 24% in own-accountactivities. Off-farm wage activities were evenly dividedbetween agricultural and non-agricultural wage labour.15
As table 9 shows, two distinct categories ofhousehold emerge: those that diversified into wageactivities in 1997 or did such work in both periods, and“old” wage households. Both were driven to participatein the labour market by significant declines in land andcattle assets, although the “new” wage householdssubstantially increased the number of heads of cattleunder their control. Furthermore, both increased theirinput use over the survey period. However, the newwage households, located principally in the Gulf andof indigenous origin, expanded primarily into
agricultural wage labour and increased their migrationto other parts of Mexico and the United States, whilethe old wage households were located disproportionatelyin the Centre and North and engaged primarily in non-agricultural wage labour. These too increased migrationto the United States.
5. Migration in the ejido
Proximity to the United States is a distinctive featureof the Mexican economy, influencing as it does not onlytrade, but also the export of labour. By 1997, almost45% of ejido households had either a family memberwho had migrated to the United States or children andsiblings living there, as shown in table 10. Over 50%of households with more then 5 NRE hectares had had amigratory connection with the United States. Migra-tion to the United States, and to other parts of Mexico,thus dominates household decision-making in the ejidosector. Migration can serve not only as a source of in-come for consumption, but also as a risk-spreading di-
15 We do not go into greater detail because most responses for wagedand own-account activities were “Other”, signifying that thesurvey’s categorization was imprecise.
TABLE 8
Mexico (ejidos): Household characteristics by changes in cattle ownership category,1994 and 1997ab
Units Less cattle More cattle No change
1994 1997 Tests 1994 1997 Tests 1994 1997 Tests
A B A B A B
Number of weighted observationsLand assetsIrrigated has.Rainfed has.Pasture has.CattleHeads of cattle no.Proportion with cattle %Migration assetsPermanent United States (children) no.Permanent United States (siblings) no.Agricultural productionMaize, irrigated has.Maize, rainfed has.Fodder, irrigated has.Fodder, rainfed has.Agricultural technologyHYV %Government programmesAlianza para el Campo %Procampo %
a ++ means significant at the 5% level; + means significant at the 10% level.b Test column A tests differences in means between 1994 and 1997 values, while column B is the test of the 1997 value against the sum
of all other categories. Categorization is based on a 50% change in the number of heads of cattle.
.59 1.27 + .58 1.03 ++ 1.32 1.206.29 6.40 6.42 9.02 ++ ++ 7.47 8.76 ++
9.69 1.42 -- -- 4.18 13.68 ++ ++ 18.34 16.84 ++
.69 .75 ++ .80 ++
.77 .84 1.27 ++
.17 .41 ++ .26 1.02 ++ .60 .533.44 2.88 3.47 3.98 ++ 3.24 3.30
.00 .18 .04 .44 ++ .32 .211.15 .90 1.32 2.28 + + 2.14 2.46 ++
17 18 15 27 ++ 25 31 ++
10 20 ++ 1277 - 87 + 90 ++
154 154 307 307 254 254
100 100 100 100
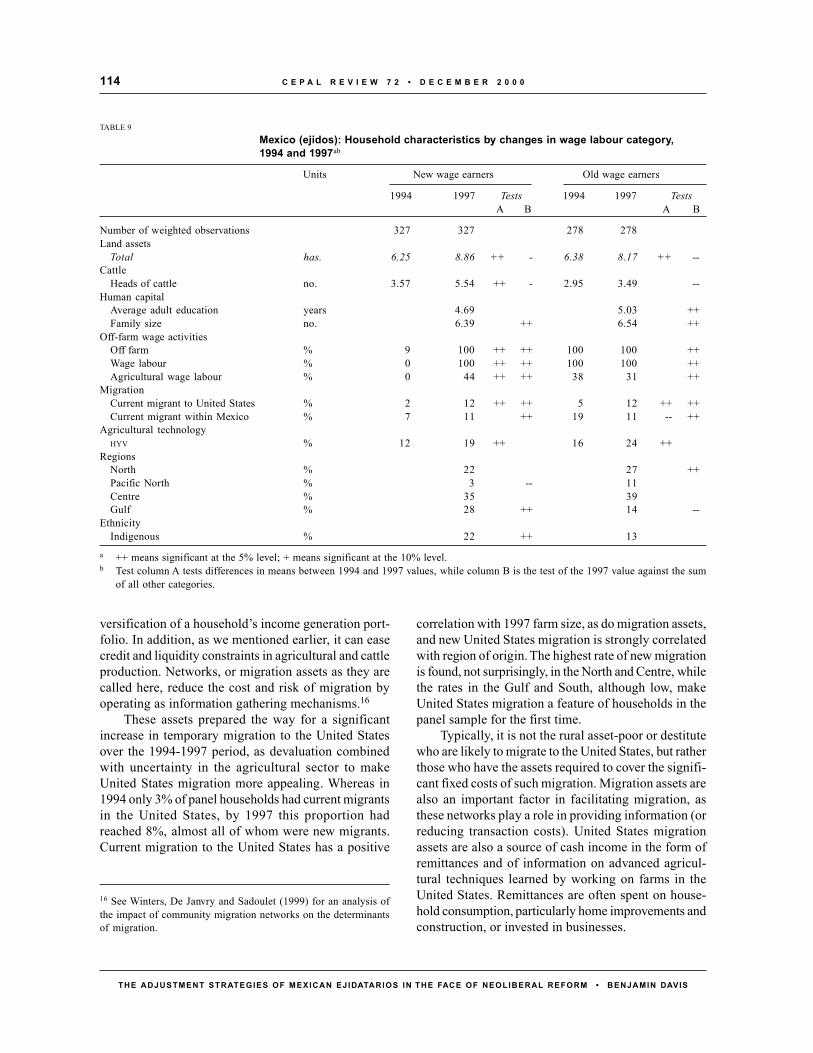
C E P A L R E V I E W 7 2 • D E C E M B E R 2 0 0 0114
THE ADJUSTMENT STRATEGIES OF MEXICAN EJIDATARIOS IN THE FACE OF NEOLIBERAL REFORM • BENJAMIN DAVIS
versification of a household’s income generation port-folio. In addition, as we mentioned earlier, it can easecredit and liquidity constraints in agricultural and cattleproduction. Networks, or migration assets as they arecalled here, reduce the cost and risk of migration byoperating as information gathering mechanisms.16
These assets prepared the way for a significantincrease in temporary migration to the United Statesover the 1994-1997 period, as devaluation combinedwith uncertainty in the agricultural sector to makeUnited States migration more appealing. Whereas in1994 only 3% of panel households had current migrantsin the United States, by 1997 this proportion hadreached 8%, almost all of whom were new migrants.Current migration to the United States has a positive
correlation with 1997 farm size, as do migration assets,and new United States migration is strongly correlatedwith region of origin. The highest rate of new migrationis found, not surprisingly, in the North and Centre, whilethe rates in the Gulf and South, although low, makeUnited States migration a feature of households in thepanel sample for the first time.
Typically, it is not the rural asset-poor or destitutewho are likely to migrate to the United States, but ratherthose who have the assets required to cover the signifi-cant fixed costs of such migration. Migration assets arealso an important factor in facilitating migration, asthese networks play a role in providing information (orreducing transaction costs). United States migrationassets are also a source of cash income in the form ofremittances and of information on advanced agricul-tural techniques learned by working on farms in theUnited States. Remittances are often spent on house-hold consumption, particularly home improvements andconstruction, or invested in businesses.
16 See Winters, De Janvry and Sadoulet (1999) for an analysis ofthe impact of community migration networks on the determinantsof migration.
TABLE 9
Mexico (ejidos): Household characteristics by changes in wage labour category,1994 and 1997ab
Units New wage earners Old wage earners
1994 1997 Tests 1994 1997 TestsA B A B
Number of weighted observations 327 327 278 278Land assets
Total has. 6.25 8.86 ++ - 6.38 8.17 ++ --Cattle
Heads of cattle no. 3.57 5.54 ++ - 2.95 3.49 --Human capital
Average adult education years 4.69 5.03 ++Family size no. 6.39 ++ 6.54 ++
Off-farm wage activitiesOff farm % 9 100 ++ ++ 100 100 ++Wage labour % 0 100 ++ ++ 100 100 ++Agricultural wage labour % 0 44 ++ ++ 38 31 ++
MigrationCurrent migrant to United States % 2 12 ++ ++ 5 12 ++ ++Current migrant within Mexico % 7 11 ++ 19 11 -- ++
Agricultural technologyHYV % 12 19 ++ 16 24 ++
RegionsNorth % 22 27 ++Pacific North % 3 -- 11Centre % 35 39Gulf % 28 ++ 14 --
EthnicityIndigenous % 22 ++ 13
a ++ means significant at the 5% level; + means significant at the 10% level.b Test column A tests differences in means between 1994 and 1997 values, while column B is the test of the 1997 value against the sum
of all other categories.

115C E P A L R E V I E W 7 2 • D E C E M B E R 2 0 0 0
THE ADJUSTMENT STRATEGIES OF MEXICAN EJIDATARIOS IN THE FACE OF NEOLIBERAL REFORM • BENJAMIN DAVIS
Households with United States migration assetshave significantly larger quantities of all types of as-sets, with the exception of education (not shown). Thesehouseholds had significantly more land assets in 1994and 1997, although accumulation rates among house-holds with and without migration assets were almostidentical. On the other hand, households with UnitedStates migration assets had significantly more heads ofcattle in both years and a higher rate of accumulationas well. A significantly larger proportion of these house-holds owned tractors and trucks. This higher level ofassets translated into significantly higher incomes. Adisproportionately large number of these householdslived in the North and Centre regions.
6. Income
The structure of income, as shown in table 11, confirmsthe diversified nature of household economic activitiesdiscussed throughout this paper.17 The importance of
non-agricultural working activities is manifest: the 1997figures in this survey of agricultural households showthat most income was not from agricultural or livestockproduction. Over 44% of total household incomederived from off-farm working activities, while almost13% came from other sources, primarily Procampopayments. Wage labour, constituting 25% of totalincome, was the most important off-farm income
TABLE 10
Mexico (ejidos): Migration by farm size, 1997a
(Percentage of households with each type of migration)
Farm size (NRE hectares)
All <5 >5 Tests
Number of weighted observations 1 665 782 792
1997 migration, temporaryUnited States 8 5 10 **Mexico 7 8 5Either 14 12 15
Pre-1997 migration, temporaryUnited States 10 8 11Mexico 17 21 14 *
Permanent migration (children)Living in United States 21 17 24 **Living in Mexico but migrating temporarily to United States 7 5 9 **Living in Mexico, outside home state 27 28 25Living in Mexico, in home state 52 49 56 **
Permanent migration (siblings)Living in United States 22 15 27 **Living in Mexico but migrating temporarily to United States 13 8 17 **Living in Mexico, outside home town 81 75 89 **Living in Mexico, in home town 83 84 83
Any migration or relative in United States 44 35 52 **
a ** indicates that means are significantly different at 5%; * indicates that means are significantly different at 10%; no mark indicatesmeans are not significantly different at 10%.
17 A more detailed analysis of the structure and determinants ofincome using 1994-1997 data can be found in Davis, De Janvry,Diehl and Sadoulet (2000) and Sadoulet, De Janvry and Davis(1999).
TABLE 11
Mexico (ejidos): Household income, 1994 and 1997(1994 pesos and percentages)
1994 1997 Change(%)
Number of weighted observations 1 031 1 031Total household income (pesos) 10 155 11 925On farm (% of total income) 51 44 -13
Net agriculture 36 28 -22Net livestock 15 16 7
Off farm (% of total income) 38 43 11Wages 30 25 -18Own-account earnings 6 10 76Remittances 2 8 215
Other (% of total income) 10 13 25Procampo payments 0 8 ...
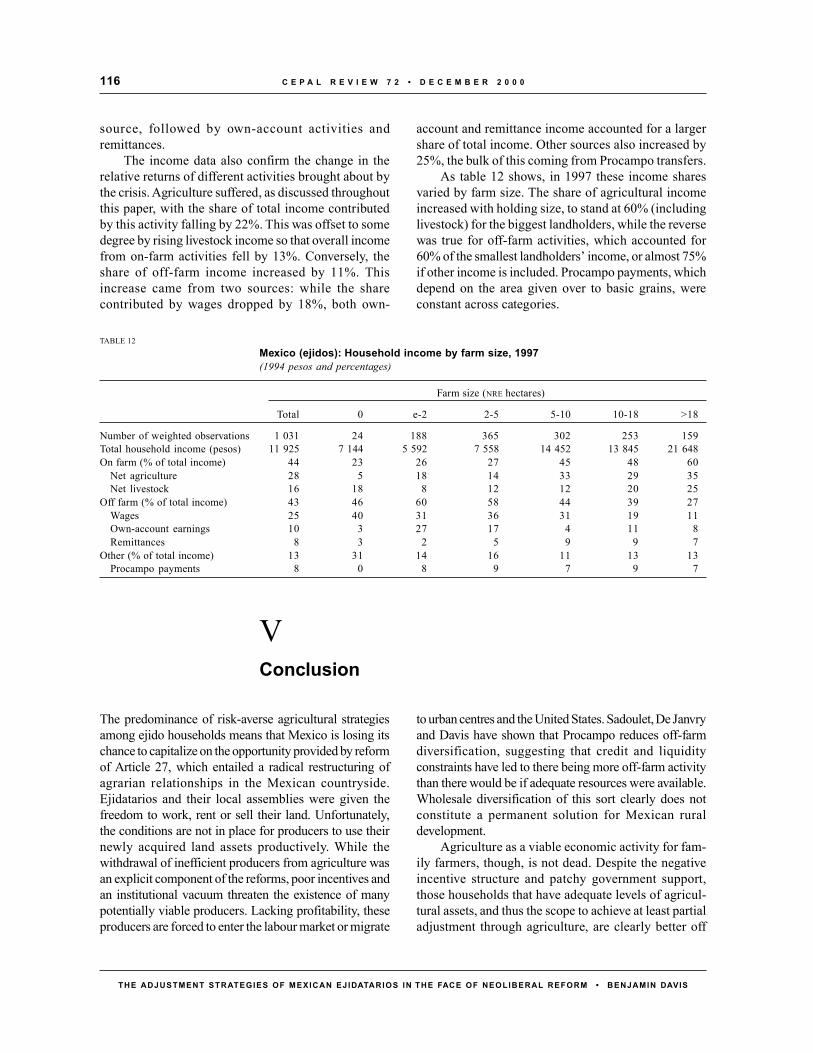
C E P A L R E V I E W 7 2 • D E C E M B E R 2 0 0 0116
THE ADJUSTMENT STRATEGIES OF MEXICAN EJIDATARIOS IN THE FACE OF NEOLIBERAL REFORM • BENJAMIN DAVIS
source, followed by own-account activities andremittances.
The income data also confirm the change in therelative returns of different activities brought about bythe crisis. Agriculture suffered, as discussed throughoutthis paper, with the share of total income contributedby this activity falling by 22%. This was offset to somedegree by rising livestock income so that overall incomefrom on-farm activities fell by 13%. Conversely, theshare of off-farm income increased by 11%. Thisincrease came from two sources: while the sharecontributed by wages dropped by 18%, both own-
account and remittance income accounted for a largershare of total income. Other sources also increased by25%, the bulk of this coming from Procampo transfers.
As table 12 shows, in 1997 these income sharesvaried by farm size. The share of agricultural incomeincreased with holding size, to stand at 60% (includinglivestock) for the biggest landholders, while the reversewas true for off-farm activities, which accounted for60% of the smallest landholders’ income, or almost 75%if other income is included. Procampo payments, whichdepend on the area given over to basic grains, wereconstant across categories.
TABLE 12Mexico (ejidos): Household income by farm size, 1997(1994 pesos and percentages)
Farm size (NRE hectares)
Total 0 e-2 2-5 5-10 10-18 >18
Number of weighted observations 1 031 24 188 365 302 253 159Total household income (pesos) 11 925 7 144 5 592 7 558 14 452 13 845 21 648On farm (% of total income) 44 23 26 27 45 48 60
Net agriculture 28 5 18 14 33 29 35Net livestock 16 18 8 12 12 20 25
Off farm (% of total income) 43 46 60 58 44 39 27Wages 25 40 31 36 31 19 11Own-account earnings 10 3 27 17 4 11 8Remittances 8 3 2 5 9 9 7
Other (% of total income) 13 31 14 16 11 13 13Procampo payments 8 0 8 9 7 9 7
VConclusion
The predominance of risk-averse agricultural strategiesamong ejido households means that Mexico is losing itschance to capitalize on the opportunity provided by reformof Article 27, which entailed a radical restructuring ofagrarian relationships in the Mexican countryside.Ejidatarios and their local assemblies were given thefreedom to work, rent or sell their land. Unfortunately,the conditions are not in place for producers to use theirnewly acquired land assets productively. While thewithdrawal of inefficient producers from agriculture wasan explicit component of the reforms, poor incentives andan institutional vacuum threaten the existence of manypotentially viable producers. Lacking profitability, theseproducers are forced to enter the labour market or migrate
to urban centres and the United States. Sadoulet, De Janvryand Davis have shown that Procampo reduces off-farmdiversification, suggesting that credit and liquidityconstraints have led to there being more off-farm activitythan there would be if adequate resources were available.Wholesale diversification of this sort clearly does notconstitute a permanent solution for Mexican ruraldevelopment.
Agriculture as a viable economic activity for fam-ily farmers, though, is not dead. Despite the negativeincentive structure and patchy government support,those households that have adequate levels of agricul-tural assets, and thus the scope to achieve at least partialadjustment through agriculture, are clearly better off
117C E P A L R E V I E W 7 2 • D E C E M B E R 2 0 0 0
THE ADJUSTMENT STRATEGIES OF MEXICAN EJIDATARIOS IN THE FACE OF NEOLIBERAL REFORM • BENJAMIN DAVIS
then those that do not have this room for manoeuvre inagriculture. Again, studies using this data have shownthat ejido producers can respond if credit and liquidityconstraints are eased. Thus, potentially large rewardscould be reaped if government were to take action torevitalize agrarian institutions and services that canreduce the risk and enhance the productivity of on-farmactivities.
On the other hand, the complexity and diversity ofthe ejido sector suggest that the correct policy responseis one that encompasses not just agricultural develop-ment, but rural development more generally. Ejidatariosare no longer primarily farmers, but instead rely on anarray of activities to ensure their survival. Thus, meet-ing the challenge of reducing rural poverty, stemmingthe flow of migrants to urban areas and increasing thewelfare of rural inhabitants will entail not just reduc-ing risk and raising productivity in agriculture, but alsoproviding the framework for an integrated rural devel-opment strategy. This would include measures to in-crease human capital (greater access to education andhealth services), infrastructure improvements to attractinvestment and provide better communications and,above all, jobs.
Structural adjustment and stabilization policiescreated a new context for rural development in the 1990svirtually throughout Latin America and the rest of thedeveloping world. In Mexico, the rural developmentchallenge involves:
i) Factor and product markets that have becomeless controlled and more global, but in many cases re-main incomplete and opaque.
ii) The State which, with its reduced presence, issearching for a relevant role in the countryside. Thedismantling of Conasupo, the increasing irrelevance ofthe Agrarian Reform Secretariat and the disappearanceof the ejido from President Zedillo’s agenda do notaugur well. While the Agricultural Secretariat has takenon the mantle of rural development and embarked on aseries of projects for marginal areas that are couchedin terms of democracy and producer participation, theimpact and nature of these programmes are as yet un-clear.
iii) Civil society, which has taken on renewed im-portance. It remains to be seen, however, how a veryheterogeneous assortment of producer organizations,community organizations (including the ejido), NGOsand individual actors will build on this new context.
A renascence of Mexican agrarian studies –whichhave a vibrant history, but have withered under the as-sault of the neoliberal revolution– is required, with anew focus on rural development, to document, describeand motivate the new dynamic of rural development.The subject-matter would have to include not just tra-ditional agrarian issues but also other initiatives in therural sector, such as the Progresa anti-povertyprogramme, which influence the economic strategiesof rural households.
C E P A L R E V I E W 7 2 • D E C E M B E R 2 0 0 0118
THE ADJUSTMENT STRATEGIES OF MEXICAN EJIDATARIOS IN THE FACE OF NEOLIBERAL REFORM • BENJAMIN DAVIS
Bibliography
Cord, L. (1998a): Introduction, background paper preparedfor the World Bank, Latin America and the CaribbeanRegion, Washington, D.C., World Bank, July.
(1998b): Government programs, background paperprepared for the World Bank, Latin America and theCaribbean Region, Washington, D.C., World Bank, July.
Davis, B. (1997): Economic reform and the determinants ofincome among agricultural households in Mexico andNicaragua, Berkeley, California, University of Califor-nia, Ph.D. dissertation.
Davis, B., A. De Janvry, T. Diehl and E. Sadoulet (2000): Ananalysis of poverty in the Ejido sector, in A. Loyns, R.Knutson, K. Meilke and A. Yunez-Naude (eds.), PolicyHarmonization and Adjustment in the North AmericanAgricultural and Food Industry, Mexico City, Univer-sity of Guelph/Colegio de México.
Deininger, K. and A. Heinegg (1995): Rural poverty inMexico,Washington, D.C., World Bank, mimeo.
De Janvry, A., G. Gordillo and E. Sadoulet (1997): Mexico’sSecond Agrarian Reform: Household and CommunityResponses, 1990-1994, San Diego, California, Centerfor U.S.-Mexican Studies.
De Janvry, A. and others (1995): Reformas del sector agrícolay el campesinado en México, San José, InternationalFund for Agricultural Development (IFAD).
Dovring, F. (1969): Land Reform and Productivity: TheMexican Case, Analysis of Census Data, LTC paper,No. 63, Madison, Wisconsin, University of Wisconsin.
Heath, J. (1990): Enhancing the Contribution of Land Re-form to Mexican Agricultural Development, Policy re-search and external affairs working papers, No. 285,Washington, D.C., World Bank.
INDA (Instituto Nacional de Desarrollo Agrario) (1996):Principales resultados de la cédula de informaciónbásica a nivel nacional, Mexico City.
Key, N., C. Muñoz-Pina, A. De Janvry and E. Sadoulet(1998): Social and environmental consequences of theMexican reforms: Common pool resources in the Ejidosector, Berkeley, California, University of California,mimeo.
Lanjouw, P. (1998): Poverty and the non-farm economy inMexico’s Ejidos: 1994-1997, background paperprepared for the World Bank, Latin America and theCaribbean Region, Washington, D.C., World Bank, July.
Olinto, P., K. Deininger and B. Davis (2000): Land MarketLiberalization and the Access to Land by the Rural Poor:Panel Data Evidence of the Impact of the Mexican EjidoReform, Washington, D.C., World Bank/InternationalFood Policy Research Institute (IFPRI), April.
Olinto, P. (1998): The impact of the Ejido reforms on landmarkets in Mexico, background paper prepared for theWorld Bank, Latin America and the Caribbean Region,Washington, D.C., World Bank, July.
Olsen, N. (1998): Incentive framework for agriculture, back-ground paper prepared for the World Bank, LatinAmerica and the Caribbean Region, Washington, D.C.,World Bank, July.
Sadoulet, E., A. De Janvry and B. Davis (1999): Cash Trans-fer Programs with Income Multipliers: PROCAMPO inMexico, Washington, D.C., World Bank/IFPRI, August.
Téllez Kuenzler, L. (1994): La modernización del sectoragropecuario y forestal, Mexico City, Fondo de CulturaEconómica (FCE).
Thiesenhusen, W. (1996): Mexican land reform, 1934-1991:Success or failure, in L. Randall (ed.), ReformingMexico’s Agrarian Reform, Armonk, New York, M.E.Sharpe.
Winters, P., A. De Janvry and B. Sadoulet (1999): Familyand Community Networks in Mexico-U.S. Migration,GSARE working paper, No. 12 (http://www.une.edu.au/febl/GSARE/arewp.htm).

119C E P A L R E V I E W 7 2 • D E C E M B E R 2 0 0 0
POPULATION AGEING AND PENSION SYSTEMS IN LATIN AMERICA • JORGE BRAVO
C E P A L R E V I E W 7 2
DECEMBER 2000
Population ageingand pension
systems inLatin America
This paper will examine the effects of population ageing on
the medium- and long-term evolution of pension systems in
Latin America and the Caribbean. It is organized into six
sections. After the introductory section, section II provides
information on ageing and pension system trends in the Latin
American countries, with some references to the interna-
tional context. Section III gives indicators, data and meth-
ods of analysis, and examines the effects of ageing popula-
tion structures and rising life expectancy on pension system
variables: spending on pensions, the financial position, pen-
sion liabilities and the implicit rate of return; it also includes
a critical analysis of the criteria that are generally used to
evaluate the sustainability of unfunded systems. Next, sec-
tion IV provides a more systematic introduction to the con-
cept of and indicators used for implicit pension debt, gives
estimates of the scale of the pension liabilities that have to
be made explicit when the switch to a funded system takes
place and analyses the effects of the age structure and adult
mortality rates in the Latin American countries. Section V
looks briefly at the fiscal transition costs that have to be
coped with when this type of reform is applied and, lastly,
section VI contains a summary and conclusions.
Jorge Bravo
Population Division,Latin American andCaribbean DemographicCentre (CELADE)Economic Commissionfor Latin America and theCaribbean (ECLAC)[email protected]
C E P A L R E V I E W 7 2 • D E C E M B E R 2 0 0 0120
POPULATION AGEING AND PENSION SYSTEMS IN LATIN AMERICA • JORGE BRAVO
IIntroduction
except for some references made in relation toassociated topics. Many aspects that have given rise tomajor debates, such as the relative merits of fundedand unfunded schemes, and of State-run systems andprivately managed ones, are touched upon only insofaras they contribute to an understanding of therelationships with which this article is particularlyconcerned.1 The effects of gender differentiation, whichbecome more important as populations age, are anotherrelevant subject not addressed here (see Arenas, 2000;Cox, 1999 and Bravo, 1999).
The more specific approach taken here, however,does open the way to a clearer presentation andunderstanding of the effects of demography on differentaspects of pension systems. Accordingly, the paper isorganized as follows. Section II provides backgroundinformation on ageing and pension system trends inthe countries of Latin America, with some reference tothe international situation. Section III explains thereasons for the analytical model approach used andexamines the effects of ageing population structuresand greater longevity on four important variables ofunfunded systems: spending on pensions, the financialposition of the system, pension liabilities and theimplicit rate of return of the system. This section alsoincludes a critical analysis of the criteria used to assessthe sustainability of unfunded schemes.
Section IV provides a more systematic introductionto the concept of the implicit pension debt and the waythis is measured, and gives estimates for the scale ofthe liabilities that have to be made explicit when thetransition is made to a funded system. It also analysesthe effects of the age structure and adult mortality inthe Latin American countries. Section V brieflyexamines the transitional fiscal costs that have to bemet when this type of reform is carried out, and sectionVI contains a summing up and closing remarks.
The original version of this article was prepared while theauthor was principal consultant to the ECLAC-CELADE/IDB programmeATN/TF-5827-RG attached to the Institut national d’étudesdémographiques (INED) in Paris, France, from 15 December 1998to 15 February 1999 under the international relations programmeof that institute. It was revised at ECLAC and thanks are due for thevaluable observations of Didier Blanchet, Georges Tapinos, AntoineBommier, Andras Uthoff, Juan Chackiel, Carmelo Mesa-Lago,Mario Marcel and two anonymous readers from IDB. The authorbears sole responsibility for any remaining errors or deficiencies.
Over recent decades, the Latin America and Caribbeanregion has undergone substantial demographic changesthat have altered the population base and the workingsof the institutions that transfer resources betweengenerational groups. One particular manifestation ofthese demographic changes, population ageing, isdirectly linked to developments in social securitysystems, and as the tendency towards ageing intensifiesits effects will increase in scope and scale, as is shownvery clearly by the historical experience of the moredeveloped countries.
This is the essential standpoint of this paper, whichexamines the effects of population ageing on medium-and long-term developments in pension systems. Thissynthesis is based on studies carried out in recent yearsat CELADE and in collaboration with the DevelopmentFinance Unit of ECLAC that deal with the demographicand financial aspects of the region’s pension systemreforms.
First of all, the analysis focuses on the effects ofchanges in the age structure and in the mortality ratesof the adult population on certain indicators of unfundedsystems. It then deals with the transition from unfundedsystems to funded ones, and in particular with theinfluence of demographic variables in determiningpension liabilities and the fiscal costs of transition. Inso doing, the paper brings together and analyses avariety of facts and results brought to light by appliedresearch and uses medium- and long-term forecasts toconsider how far these relationships may extend.
Every effort has been made to examine these issuessystematically, but there are many important mattersthat are not addressed in this presentation. For example,it does not deal with general equilibrium relationships,
1 A useful contribution to this debate would be a comprehensiveanalysis of the most important advantages and limitations of thedifferent schemes, including the numerous demographic, economicand political issues involved and the development strategies of thecountries where the assessment is to be applied. This is far beyondthe scope of the present study.

121C E P A L R E V I E W 7 2 • D E C E M B E R 2 0 0 0
POPULATION AGEING AND PENSION SYSTEMS IN LATIN AMERICA • JORGE BRAVO
IIPopulation ageing andpension systems: Latin Americain the international context
are at intermediate stages in the demographic transitionand are projected to age significantly over the next fewdecades (including the two most populous ones, Braziland Mexico), while in a few countries ageing is alreadyfairly advanced, such as Argentina, Uruguay and someof the Caribbean countries. In countries such as Chile,Costa Rica and Panama ageing is only slightly lessadvanced, with low mortality not yet being matchedby such low fertility rates. Cuba is a special case, as inno other country of the region has fertility declinedfaster or more sharply since the 1960s, so that in justover a decade the ageing process will be more advancedthere than in any other country. Ageing also varieswithin countries, between socio-economic groups andby gender. As has been documented in detail elsewhere,the specific social context, and the particular sequenceof events during the demographic transition, also varyfrom one country to the next (Guzmán, 1996 and Cosio-Zavala, 1996). The different demographic contexts willbe taken into account in the discussion that follows, tothe extent that they affect ageing patterns.
As regards the formal public pension systems thatare analysed here in relation to population ageing, theseare not at all times and in all places the most importantmeans of providing economic support to the elderly.Intergenerational transfers, effected through family/community or market mechanisms (Sauvy, 1953 andLee, 1995), have historically been important in bothdeveloping and developed countries, and still are.3 InLatin America, some countries began to institutionalizetheir pension systems in the early twentieth century(examples being Argentina, Chile and Uruguay), but
Having passed through the early stages in thedemographic transition, in which child mortality felland fertility was sharply reduced, the population ofLatin America is beginning to age. Over-60s make upthe fastest-growing population group in the region: theirnumbers, currently around 40 million, are expected todouble within 20 years. The proportion of thepopulation aged 60 and over is still modest bycomparison with the more developed countries of theworld: it now stands at just under 8% in Latin America,compared to about 16% in the United States, 20% inEurope and almost 23% in Japan (United Nations,1998). Nonetheless, mortality in the region has beenfalling substantially over the course of this century, andis now fairly low in many countries; average lifeexpectancy at birth has now reached the 70 mark, andlife expectancy at 60 is almost 20 years (ECLAC/CELADE,1998) in the region as a whole. In virtually all thecountries of the region, reductions in national fertilityrates have tended to follow reductions in mortality aftera relatively short time lag, in most cases less than twodecades (Bravo, 1992). Taken all together, these trendsimply that ageing, as measured either by the “old”proportion of the population or by the old-agedependency ratio, is going to accelerate over the comingdecades, and is going to do so at a much faster ratethan was seen in the populations where ageing is nowmost advanced. Changes in these indicators which tookfrom six to ten decades to come about in the developedcountries are expected to take only two to three decadesin most of the Latin American countries.2
As is the case with almost all socio-economic anddemographic variables in the region, there is greatdiversity between countries as regards ageing: some(for example Bolivia, Honduras and Nicaragua) stillhave fairly young age distributions and will continueto do so for many years to come. A number of countries
2 For more extensive analyses of ageing tendencies in the region,see Chackiel (2000) and Villa and Rivadeneira (2000).
3 The evidence reviewed by Lee (1995) indicates that in traditionalsocieties intergenerational transfers are “downward” overall, i.e.,they pass from the older members of the population to the youngerones. This also holds true for family transfers in developed countriestoday. It is the strong “upward” movement of transfers channelledthrough saving capital accumulation and the public sector(including pensions) that has produced the net upward direction ofintergenerational transfers in more developed societies.
C E P A L R E V I E W 7 2 • D E C E M B E R 2 0 0 0122
POPULATION AGEING AND PENSION SYSTEMS IN LATIN AMERICA • JORGE BRAVO
most national systems became more comprehensive inthe post-war period. Since their inception, these systemshave expanded their coverage and brought majorbenefits to a significant proportion of the elderlypopulation. However, they have also suffered from anumber of problems. They have had difficulty inachieving the ideal of universal coverage, ensuring fulland timely collection of contributions, protecting thereal value of reserve funds and making the contributionand benefit adjustments that have become necessary aspopulation structures have changed and systems havematured (Mesa-Lago, 1985 and Uthoff, 1997). Theseproblems have built up over the years and have beencompounded by the regional economic crisis of the1980s, which brought administrative and financialshortcomings more clearly to light. These factorsweighed heavily in the pension scheme assessments andproposals for reform that were made in that decade andput into effect in the 1990s. In the following sectionswe shall examine some of the reform issues from thepoint of view of population ageing and its implicationsfor financing and intergenerational distribution.
In the Latin America region, as in the rest of theworld, most public pension systems are unfunded andare backed by relatively small reserves.4 Publicspending on pensions has grown steadily worldwideand now averages between 8% and 10% of GDP in theOrganisation for Economic Co-operation andDevelopment (OECD) and the countries of easternEurope (World Bank, 1994 and Dumont, 1998). Inmany industrial countries, social security spending isone of the two or three biggest government expenditureitems; in the United States, social security is now thebiggest government programme, having overtakendefence in the early 1990s. Forecasts by OECD (Leibfritzand Roseveare, 1995) predict that over the twenty-firstcentury pension payments could range from 5% to 20%of GDP and that deficits could be from 0% to 10% ofGDP, unless substantial adjustments are made over thecoming years. The main factors influencing theseforecasts are the long-term trend towards populationageing and the fluctuations predicted in the age structureof the population as a result of the baby boom in theearly 1960s.
In Latin America, by contrast, the overall level ofpension spending is similar to that of Asia,5 averagingaround 2% to 3% of GDP. Comparison of this aggregateexpenditure level with the ageing indicators referred toearlier shows that there is a large gap between the LatinAmerican countries and the more developed regionsand countries, whose ageing indicators are double ortreble those of Latin America, but which spend four orfive times as much on pensions as a proportion of GDP.We shall analyse these differences further in thefollowing section.
Before turning to a more thorough evaluation ofthe effects of ageing, it is worth glancing at the globalimplications of this phenomenon in the coming decades.As figure 1 shows, the adult ageing process (measuredby the old-age dependency ratio) is expected toaccelerate in all regions of the world over the next fewdecades, even in Europe and North America whereageing is already well advanced. These changes arequite substantial: whereas in 1990 the old-agedependency ratio (population aged 65 and over inrelation to the population aged 15 to 64) varied from6% to 18% in different regions (the world average being10%), it is forecast that by 2030 all regions except Africawill have dependency ratios of between 16% and 35%(with a world average of 17%).6
The chart shows that the population of LatinAmerica and the Caribbean will age faster than theaverage, as the old-age dependency ratio there isforecast to reach the world average in 2030, but startingfrom a below-average value (8%) in 1990. By 2050 theLatin American ratio will have more than tripled to standat around 27%, around three percentage points abovethe world average. The strength of this projected trendis only surpassed by longer-term projections for theEuropean and OECD countries, which show the greatestageing effects on pension systems hitherto estimated(Roseveare and others, 1996 and Calot and Chesnais,1997).
When these changes occur in situations wherepension systems are maturing, and where there are
4 A notable exception is the United States, where the important oldage, sickness and death insurance (OASDI) fund will carry on growingfor at least another decade to provide for the retirement of the largebaby boom cohorts. There is considerable controversy, however,over the liquidity and real economic value of the assets making upthis fund.
5 There are a number of differences between the two regions,however: in Asia, public systems are generally of more recentcreation, and tend to cover a smaller proportion of the workforceand the elderly (Kinsella and Gist, 1995).6 A simple interpretation of this tendency in terms of pension systemvariables is that, simply as a result of population ageing,contribution rates would have to increase by around 70% over thisperiod to prevent the financial position becoming worse than itwas in 1990.
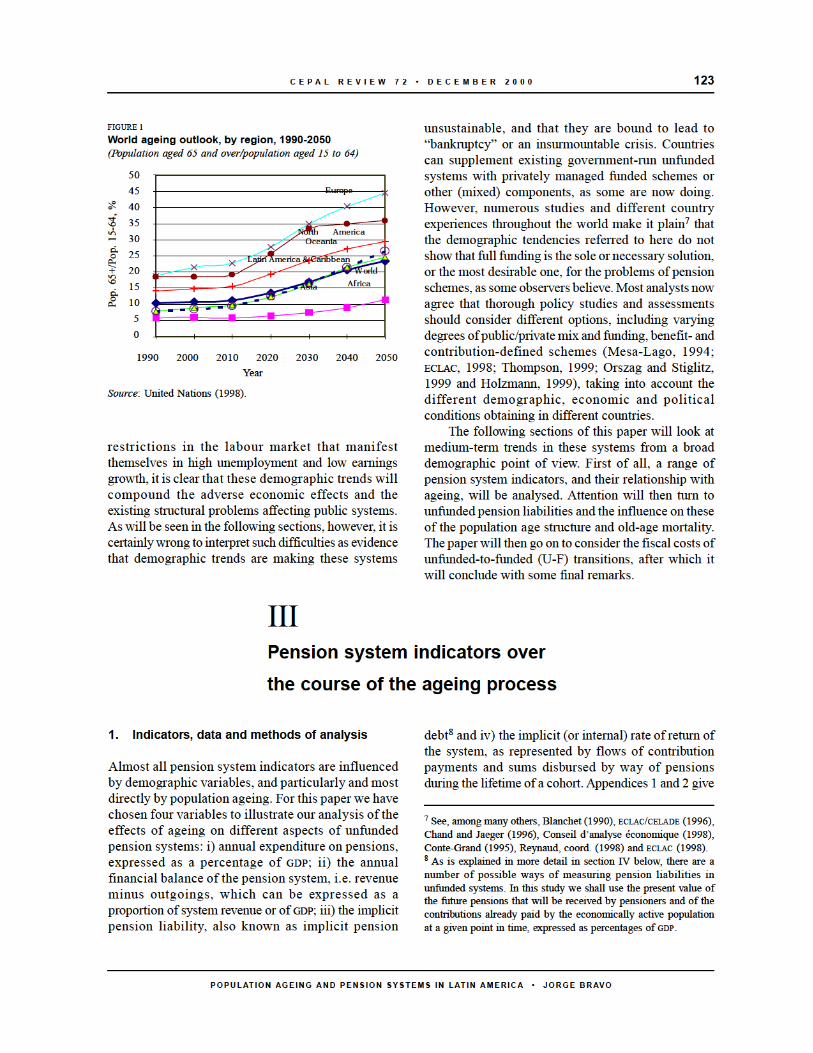
123CEPAL REVIE W 72 • DECEMBER 2000
POPULATION AGEING AND PENSION SYSTEMS IN LATIN AMERICA • JORGE BRAVO
restrictions in the labour market that manifestthemselves in high unemployment and low earningsgrowth, it is clear that these demographic trends willcompound the adverse economic effects and theexisting structural problems affecting public systems.As will be seen in the following sections, however, it iscertainly wrong to interpret such difficulties as evidencethat demographic trends are making these systems
unsustainable, and that they are bound to lead to“bankruptcy” or an insurmountable crisis. Countriescan supplement existing government-run unfundedsystems with privately managed funded schemes orother (mixed) components, as some are now doing.However, numerous studies and different countryexperiences throughout the world make it plain7 thatthe demographic tendencies referred to here do notshow that full funding is the sole or necessary solution,or the most desirable one, for the problems of pensionschemes, as some observers believe. Most analysts nowagree that thorough policy studies and assessmentsshould consider different options, including varyingdegrees of public/private mix and funding, benefit- andcontribution-defined schemes (Mesa-Lago, 1994;ECLAC, 1998; Thompson, 1999; Orszag and Stiglitz,1999 and Holzmann, 1999), taking into account thedifferent demographic, economic and politicalconditions obtaining in different countries.The following sections of this paper will look at
medium-term trends in these systems from a broaddemographic point of view. First of all, a range ofpension system indicators, and their relationship withageing, will be analysed. Attention will then turn tounfunded pension liabilities and the influence on theseof the population age structure and old-age mortality.The paper will then go on to consider the fiscal costs ofunfunded-to-funded (U-F) transitions, after which itwill conclude with some final remarks.
IIIPension system indicators over
the course of the ageing process
debt8 and iv) the implicit (or internal) rate of return ofthe system, as represented by flows of contributionpayments and sums disbursed by way of pensionsduring the lifetime of a cohort. Appendices 1 and 2 give
1. Indicators, data and methods of analysis
Almost all pension system indicators are influencedby demographic variables, and particularly and mostdirectly by population ageing. For this paper we havechosen four variables to illustrate our analysis of theeffects of ageing on different aspects of unfundedpension systems: i) annual expenditure on pensions,expressed as a percentage of GDP; ii) the annualfinancial balance of the pension system, i.e. revenueminus outgoings, which can be expressed as aproportion of system revenue or of GDP; iii) the implicitpension liability, also known as implicit pension
7 See, among many others, Blanchet (1990), ECLAC/CELADE (1996),
Chand and Jaeger (1996), Conseil d’analyse économique (1998),
Conte-Grand (1995), Reynaud, coord. (1998) and ECLAC (1998).8 As is explained in more detail in section IV below, there are a
number of possible ways of measuring pension liabilities in
unfunded systems. In this study we shall use the present value ofthe future pensions that will be received by pensioners and of the
contributions already paid by the economically active population
at a given point in time, expressed as percentages of GDP.
FIGURE 1
World ageing outlook, by region, 1990-2050
(Population aged 65 and over/population aged 15 to 64)
50
45
40
35
30
25
20
15
10
5
0
1990 2000 2010 2020 2030 2040 2050
Pop. 65+/Pop. 15-64, %
Year
Source: United Nations (1998).
Europe
Northern AmericaOceania
Latin America & Caribbean
Asia
World
Africa

C E P A L R E V I E W 7 2 • D E C E M B E R 2 0 0 0124
POPULATION AGEING AND PENSION SYSTEMS IN LATIN AMERICA • JORGE BRAVO
more details about the concepts, measurements and dataused to calculate these.
The most standard indicators, such as annualpensions spending or the financial balance of thesystem, are periodic measurements (i.e. annual flows)which can be used to quantify the burden of the pensionsystem on the national economy, but which provide littleinformation about the medium- or long-term financialsustainability of the system or its distributionalperformance, especially in different generationalgroups. These aspects are captured better, although stillonly partially and imperfectly, by other indicators thatsummarize contribution and benefit flows over the lifecycle. Two of these are implicit pension debt andimplicit system rate of return, which are analysed inthe following sections. We have chosen d, the old-agedependency ratio,9 which from now on we shall simplycall the dependency ratio, as the population ageingindicator to be used for analysing the pension systemindicators selected. Historically, ageing of individualsor population cohorts, as measured by rising lifeexpectancy, tends to precede and then overlap withchanges in d, although the correlation between thesetwo forms of ageing is not a strict one and theirconsequences for pension systems differ in nature andextent, as will be shown in the following sections.
Panel A of figure 2 shows observed pensionexpenditure values as a percentage of GDP, estimatedon the basis of data compiled by ILO (1997) on nationalsocial security expenditure in the period 1991-1993.These estimates relate to old-age, survivors’ andinvalidity pensions in the public and private sectors andexclude transfers to other schemes. They are to betreated merely as an indication of magnitude, since theexact figure may vary depending on the specificmeasurement criteria being used. Again, no informationis available for Brazil, Mexico, Peru and Uruguay, fourvery important countries in the region.
Nonetheless the data, plotted against the proportionof the population aged 60 and over, suggest a couple ofthings. Firstly, as had been predicted, the spending ofmany countries is of the order of 2% of GDP or less,among these being an appreciable number of Caribbeanand Central American countries, Bolivia and Ecuador.The expenditure of the remaining countries ranges froma low of around 3% of GDP in Colombia to a high of
over 8% in Cuba, with countries such as Argentina,Chile and Panama being at an intermediate level. Takenall together, these data reveal spending levels that arelow to medium by international standards. Secondly,although a number of the countries with high spendingare in the medium to high ageing categories by regionalstandards, there is no obvious sign of a closerelationship between the degree of ageing and pensionexpenditure. This partly reflects problems with thecomparability of expenditure data, but also, andprobably more importantly, differences in thepopulation coverage of pension schemes, contributionand replacement rates, eligibility criteria and the degreeof system maturity.
These two types of limitation make themselves feltto at least the same degree when the financial balance
9 For the purposes of the present paper, this ratio will henceforthbe between the population aged 60 and over and the populationaged 20 to 59.
FIGURE 2
Latin America and the Caribbean (selected countries):Pension system expenditure and financial balance, bydegree of population ageing, 1990-1993
A. Pension expenditure and population ageing
Expe
nditu
re a
s %
of
GD
P 10
86420
-2
0.00 0.05 0.10 0.15 0.20
Proportion of the population aged 60 and over
B. Financial balance and old-age dependency ratio
3
2
1
0
-1
-2
-3
-4
Includes State contributionExcludes State contribution
Source: Author’s estimates based on ILO (1997), ECLAC/CELADE
(1999) and United Nations (1999).
Cuba
ChilePanama
Nicaragua
Barbados
Argentina
JamaicaJamaica
.00 0.05 0.10 0.15 0.20 0.25 0.30 0.35
Cuba
Cuba
Chile
Chile

125C E P A L R E V I E W 7 2 • D E C E M B E R 2 0 0 0
POPULATION AGEING AND PENSION SYSTEMS IN LATIN AMERICA • JORGE BRAVO
of the system is analysed. There are comparabilityproblems not just with expenditure, as before, but alsowith revenue, which is affected by internationaldifferences in the way system components andprogrammes are defined and in accounting conventions,particularly as these relate to the treatment of transfersfrom other programmes and to State contributions netof the contribution made by the public sector as anemployer (appendix 1). Bearing these caveats in mind,the estimates for the financial balance of pensionsystems given in panel B of figure 2 suggest that asurplus is the norm, particularly in countries whoseschemes are of more recent creation. The exceptionsare the small deficit of Panama and the more substantialones of Chile and Cuba.10 These last two countries arespecial cases: the revenue and expenditure accounts ofChile are strongly affected by the transition deficitresulting from the move towards full funding, and thoseof Cuba by the fact that the State absorbs the primaryimbalance, so that the country’s system is precisely inbalance when the State contribution is included. Thetransversal relationship observed between thedemographic dependency ratio and the financialbalance is even weaker than in the case of spending,for reasons similar to those already adduced.
To sum up, the data just analysed provide usefulgeneral information on the indicators and relationshipswe are concerned with, but offer rather limitedpossibilities for more detailed and specific study.11 Forthe purpose of isolating and analysing the effects ofageing on pension systems, a more viable and productiveapproach is to use individual country models, brokendown by age, that take account of the key parameters ofthe system. The following model, which has had to leaveout a number of the details and peculiarities of pensionsystems (appendix 2), gives rough orders of magnitudefor the indicators we are concerned with, and not exactcalculations.12 The drawbacks of simplification arecompensated for by the possibility of studying a wider
range of ageing levels (outside the range observedhitherto in Latin America) and examining other importantsystem variables, such as pension liabilities and thesystem’s internal rate of return, which are extremelydifficult or impossible to calculate directly when existingdata are the only basis used.
2. Effects of ageing on the expenditure and financialbalance of the system
Figure 3 illustrates the general tendencies forecast forthese two variables as the population ages. The figuresshown assume fixed values for the contribution rate(c = 12.2%), wages as a share of GDP (s = 34.3%) andthe number of workers covered by the pension systemas a proportion of all waged workers (k = 0.76), thesebeing the averages for the Latin American countriesaround 1990. In the case of the financial balance, it isfurther assumed that no debt or reserve fund capableof offsetting periodic imbalances has been set up; inother words, our definition of balance reflects theprimary surplus or deficit.
Figure 3 isolates the demographic effect in theusual way by setting the value of other accompanyingfactors and examining the change in the indicators thatconcern us within a plausible range for our ageingvariable, d. Four reference points are graphed for eachsystem indicator. The first two points, from left to right,are obtained from the demographic profile (adult agestructure and mortality schedule) of Nicaragua in 1990and Uruguay in 1990, these being the countries thathave the youngest and oldest age structures in theregion, respectively. In addition, to provide an idea ofthe way pension system indicators may change overthe longer term, the third point corresponds to thedemographic profile of France in 1990 and the fourthone to the profile projected for France in 2050 (Dinh,1995 and Meslé and Vallin, 1998).
Panel A of the chart shows the linear relationshipbetween pension system spending and ageing (indexedby d), other things being equal, that is embedded in themodel conditions. The values for the data confirm thefact, already documented in section II of this paper,that when systems cover a fraction of a demographically“young” working-age population, pension spendingmay be just 1% or 2% of GDP, but that this can reachlevels of close to 10% when the country’s populationreaches an advanced state of ageing, even if coverageremains as incomplete as it is at present in Latin Americaas a whole (about half the workforce). Spending levelscan be even higher in practice when coverage is wider
10 Argentina and Uruguay also had sizeable social security deficitsin the late 1970s and early 1980s (Mesa-Lago, 1991, table 9).11 In theory, another approach would be to carry out longitudinalanalyses on countries with reliable chronological series of spendingand revenue data. This requires consistent, complete statistical seriescovering at least four or five decades so that substantial changesarise in the indicators of ageing, something that limits yet furtherthe scope for carrying out this kind of analysis in the case of mostLatin American countries.12 The calculations are strictly valid if the rules of the system, labourforce participation, coverage rates and the degree of compliancewith contribution liabilities are constant in each country.
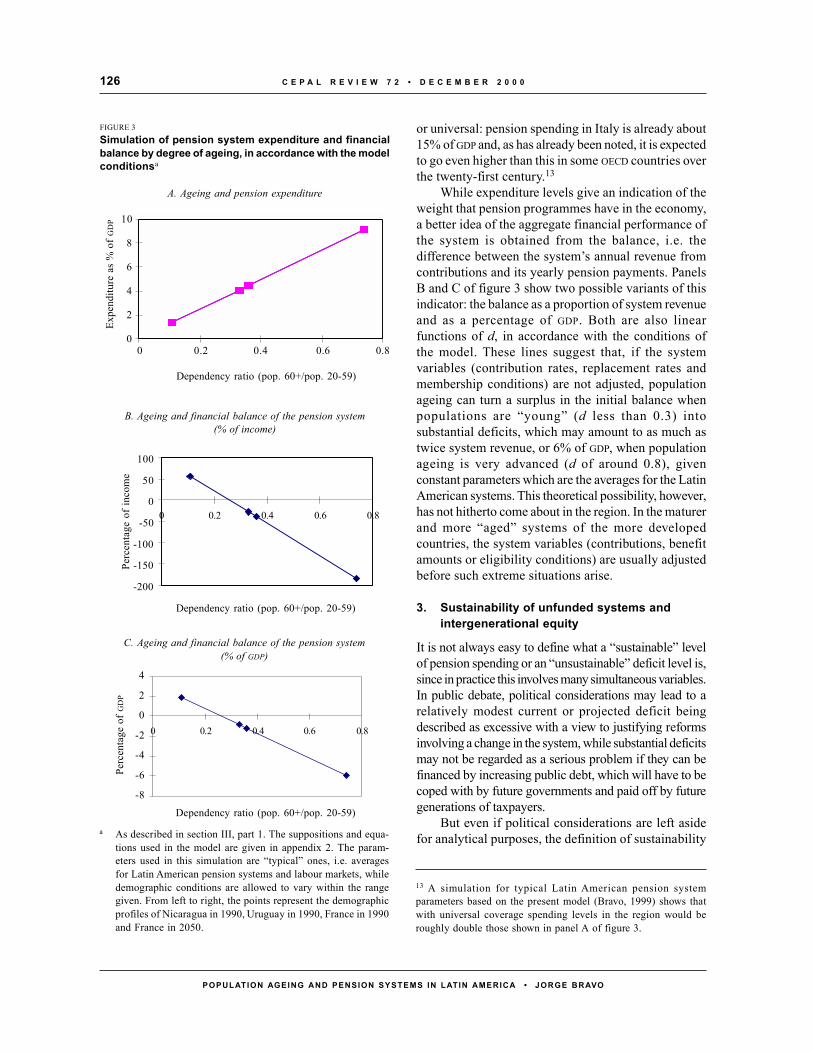
C E P A L R E V I E W 7 2 • D E C E M B E R 2 0 0 0126
POPULATION AGEING AND PENSION SYSTEMS IN LATIN AMERICA • JORGE BRAVO
or universal: pension spending in Italy is already about15% of GDP and, as has already been noted, it is expectedto go even higher than this in some OECD countries overthe twenty-first century.13
While expenditure levels give an indication of theweight that pension programmes have in the economy,a better idea of the aggregate financial performance ofthe system is obtained from the balance, i.e. thedifference between the system’s annual revenue fromcontributions and its yearly pension payments. PanelsB and C of figure 3 show two possible variants of thisindicator: the balance as a proportion of system revenueand as a percentage of GDP. Both are also linearfunctions of d, in accordance with the conditions ofthe model. These lines suggest that, if the systemvariables (contribution rates, replacement rates andmembership conditions) are not adjusted, populationageing can turn a surplus in the initial balance whenpopulations are “young” (d less than 0.3) intosubstantial deficits, which may amount to as much astwice system revenue, or 6% of GDP, when populationageing is very advanced (d of around 0.8), givenconstant parameters which are the averages for the LatinAmerican systems. This theoretical possibility, however,has not hitherto come about in the region. In the maturerand more “aged” systems of the more developedcountries, the system variables (contributions, benefitamounts or eligibility conditions) are usually adjustedbefore such extreme situations arise.
3. Sustainability of unfunded systems andintergenerational equity
It is not always easy to define what a “sustainable” levelof pension spending or an “unsustainable” deficit level is,since in practice this involves many simultaneous variables.In public debate, political considerations may lead to arelatively modest current or projected deficit beingdescribed as excessive with a view to justifying reformsinvolving a change in the system, while substantial deficitsmay not be regarded as a serious problem if they can befinanced by increasing public debt, which will have to becoped with by future governments and paid off by futuregenerations of taxpayers.
But even if political considerations are left asidefor analytical purposes, the definition of sustainability
13 A simulation for typical Latin American pension systemparameters based on the present model (Bravo, 1999) shows thatwith universal coverage spending levels in the region would beroughly double those shown in panel A of figure 3.
FIGURE 3
Simulation of pension system expenditure and financialbalance by degree of ageing, in accordance with the modelconditionsa
A. Ageing and pension expenditure
10
8
6
4
2
0
Expe
nditu
re a
s %
of
GD
P
0 0.2 0.4 0.6 0.8
Dependency ratio (pop. 60+/pop. 20-59)
B. Ageing and financial balance of the pension system(% of income)
Perc
enta
ge o
f in
com
e
100
50
0
-50
-100
-150
-200
Dependency ratio (pop. 60+/pop. 20-59)
C. Ageing and financial balance of the pension system(% of GDP)
4
2
0
-2
-4
-6
-8
Perc
enta
ge o
f G
DP
Dependency ratio (pop. 60+/pop. 20-59)
a As described in section III, part 1. The suppositions and equa-tions used in the model are given in appendix 2. The param-eters used in this simulation are “typical” ones, i.e. averagesfor Latin American pension systems and labour markets, whiledemographic conditions are allowed to vary within the rangegiven. From left to right, the points represent the demographicprofiles of Nicaragua in 1990, Uruguay in 1990, France in 1990and France in 2050.
0 0.2 0.4 0.6 0.8
0 0.2 0.4 0.6 0.8
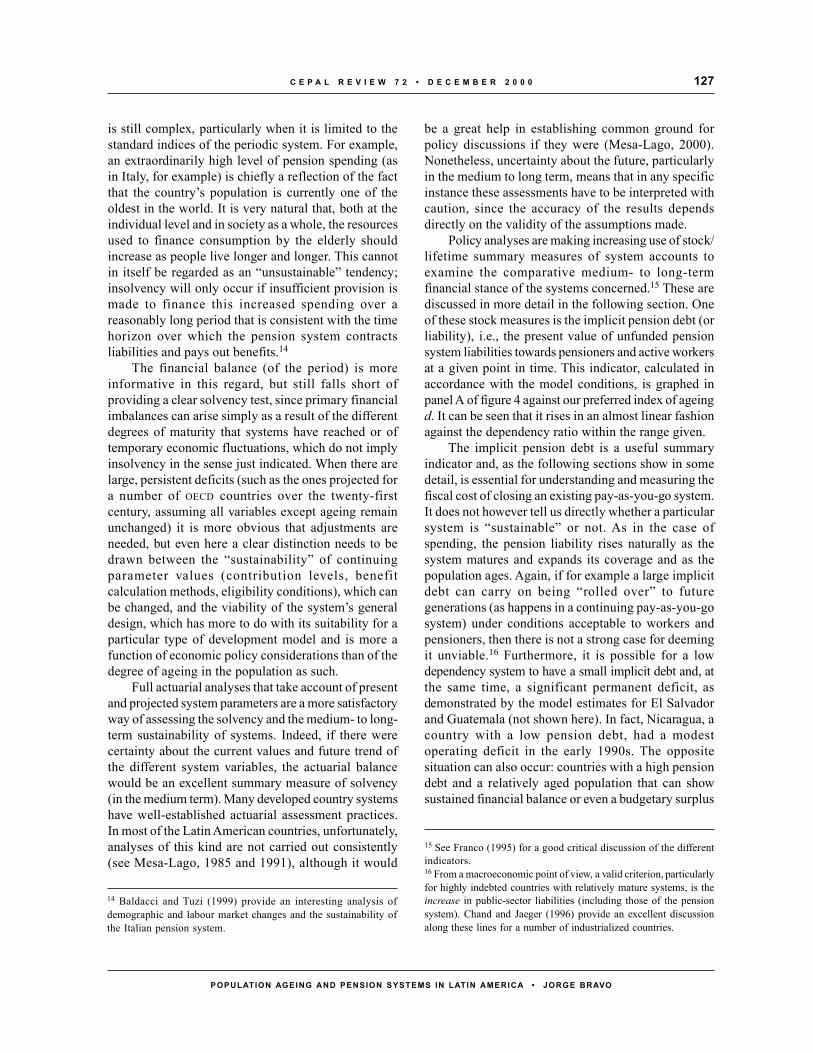
127C E P A L R E V I E W 7 2 • D E C E M B E R 2 0 0 0
POPULATION AGEING AND PENSION SYSTEMS IN LATIN AMERICA • JORGE BRAVO
is still complex, particularly when it is limited to thestandard indices of the periodic system. For example,an extraordinarily high level of pension spending (asin Italy, for example) is chiefly a reflection of the factthat the country’s population is currently one of theoldest in the world. It is very natural that, both at theindividual level and in society as a whole, the resourcesused to finance consumption by the elderly shouldincrease as people live longer and longer. This cannotin itself be regarded as an “unsustainable” tendency;insolvency will only occur if insufficient provision ismade to finance this increased spending over areasonably long period that is consistent with the timehorizon over which the pension system contractsliabilities and pays out benefits.14
The financial balance (of the period) is moreinformative in this regard, but still falls short ofproviding a clear solvency test, since primary financialimbalances can arise simply as a result of the differentdegrees of maturity that systems have reached or oftemporary economic fluctuations, which do not implyinsolvency in the sense just indicated. When there arelarge, persistent deficits (such as the ones projected fora number of OECD countries over the twenty-firstcentury, assuming all variables except ageing remainunchanged) it is more obvious that adjustments areneeded, but even here a clear distinction needs to bedrawn between the “sustainability” of continuingparameter values (contribution levels, benefitcalculation methods, eligibility conditions), which canbe changed, and the viability of the system’s generaldesign, which has more to do with its suitability for aparticular type of development model and is more afunction of economic policy considerations than of thedegree of ageing in the population as such.
Full actuarial analyses that take account of presentand projected system parameters are a more satisfactoryway of assessing the solvency and the medium- to long-term sustainability of systems. Indeed, if there werecertainty about the current values and future trend ofthe different system variables, the actuarial balancewould be an excellent summary measure of solvency(in the medium term). Many developed country systemshave well-established actuarial assessment practices.In most of the Latin American countries, unfortunately,analyses of this kind are not carried out consistently(see Mesa-Lago, 1985 and 1991), although it would
be a great help in establishing common ground forpolicy discussions if they were (Mesa-Lago, 2000).Nonetheless, uncertainty about the future, particularlyin the medium to long term, means that in any specificinstance these assessments have to be interpreted withcaution, since the accuracy of the results dependsdirectly on the validity of the assumptions made.
Policy analyses are making increasing use of stock/lifetime summary measures of system accounts toexamine the comparative medium- to long-termfinancial stance of the systems concerned.15 These arediscussed in more detail in the following section. Oneof these stock measures is the implicit pension debt (orliability), i.e., the present value of unfunded pensionsystem liabilities towards pensioners and active workersat a given point in time. This indicator, calculated inaccordance with the model conditions, is graphed inpanel A of figure 4 against our preferred index of ageingd. It can be seen that it rises in an almost linear fashionagainst the dependency ratio within the range given.
The implicit pension debt is a useful summaryindicator and, as the following sections show in somedetail, is essential for understanding and measuring thefiscal cost of closing an existing pay-as-you-go system.It does not however tell us directly whether a particularsystem is “sustainable” or not. As in the case ofspending, the pension liability rises naturally as thesystem matures and expands its coverage and as thepopulation ages. Again, if for example a large implicitdebt can carry on being “rolled over” to futuregenerations (as happens in a continuing pay-as-you-gosystem) under conditions acceptable to workers andpensioners, then there is not a strong case for deemingit unviable.16 Furthermore, it is possible for a lowdependency system to have a small implicit debt and, atthe same time, a significant permanent deficit, asdemonstrated by the model estimates for El Salvadorand Guatemala (not shown here). In fact, Nicaragua, acountry with a low pension debt, had a modestoperating deficit in the early 1990s. The oppositesituation can also occur: countries with a high pensiondebt and a relatively aged population that can showsustained financial balance or even a budgetary surplus
14 Baldacci and Tuzi (1999) provide an interesting analysis ofdemographic and labour market changes and the sustainability ofthe Italian pension system.
15 See Franco (1995) for a good critical discussion of the differentindicators.16 From a macroeconomic point of view, a valid criterion, particularlyfor highly indebted countries with relatively mature systems, is theincrease in public-sector liabilities (including those of the pensionsystem). Chand and Jaeger (1996) provide an excellent discussionalong these lines for a number of industrialized countries.

C E P A L R E V I E W 7 2 • D E C E M B E R 2 0 0 0128
POPULATION AGEING AND PENSION SYSTEMS IN LATIN AMERICA • JORGE BRAVO
(for example, the model estimates for Chile andUruguay). Costa Rica, a relatively high debt country,had an operating surplus in the early 1990s; a moreextreme case is that of the United States, which has alarge pension liability but a substantial periodic balancesurplus. A number of other OECD countries have evengreater pension liabilities but operate with modestdeficits or balanced budgets.
In some cases, a more consistent diagnosis can beobtained when spending, the financial deficit and thepension debt are all substantial, as for example inArgentina and Uruguay during the 1980s. When all theindicators point in the same direction, the need to makemajor adjustments to the system becomes more obvious.
In many theoretical and real-world situations, though,the indicators referred to do not permit of anunambiguous interpretation, which supports the ideathat there is no generally applicable rule to justify theneed for one particular type of reform on the basis ofageing trends alone.17
Another way of approaching the problem is to askhow the system affects different generational groups.In fact, one increasingly widespread approach todetermining the sustainability of public policy or aparticular government programme, which is what weare concerned with here, is to consider that a system orpolicy suffers from intergenerational inequity if itprovides benefits to current generations at the expenseof the economic welfare of future ones. In extremecases, a particular programme or policy may prove tobe more absolutely unsustainable if it requires futuregenerations to bear an excessively large net lifetimetax burden. An example of this situation is provided byGokhale (1995), who uses generational accounts forthe United States to calculate that if current governmenteconomic policies were continued, future generationswould have to bear a net tax burden 35 percentage pointshigher than that borne by current generations, yieldingthe obviously inconceivable figure of 80% of lifetimeincome.
Panel B of figure 4 plots the implicit rate of returnof the pension system (r), which reflects the net lifetimebenefit of participating in the system for a givenindividual or cohort. What r measures is the excessproportionate present value that the individual or cohortobtains in pension benefits over and above the value ofthe contributions paid into the system over their workinglife, an indicator analogous to the one used to measurethe rate of return on financial investments.18 As in thecase of the variables plotted previously, this indicatoris calculated in accordance with the generalassumptions of our basic model, with two alternativescenarios now being considered: firstly, the casewhere the system variables remain constantthroughout the ageing process and the general
17 See Blanchet (1990 and 1998) for a fine, nuanced discussion ofthe relative merits of funded and unfunded systems under changingdemographic conditions in a context of general balance, whichrefutes some common misconceptions about the subject.18 See Bravo (1996) for a more detailed discussion of the implicitrate of return and the way this is affected by different factors andpolicies. Related effects on lifetime wealth are studied in Auerbachand Kotlikoff (1987), Arrau (1991) and Cifuentes (1995) in thecontext of general-equilibrium, overlapping-generation models.
FIGURE 4Simulated values for implicit pension debt and implicitrate of return of the pension system, in accordance withthe model conditionsa
A. Implicit pension debt and ageing
Pens
ion
syst
emde
bt a
s %
of G
DP
250
200
150
100
50
00 0.2 0.4 0.6 0.8
Dependency ratio (pop. 60+/pop. 20-59)
B. Pension system rate of return and ageing
Perc
enta
ge r
etur
n
0 0.2 0.4 0.6 0.8
76543210
Dependency ratio (pop. 60+/pop. 20-59)
a As described in section III, part 1. The suppositions and equa-tions used in the model are given in appendix 2. The param-eters used in this simulation are “typical” ones, i.e. averagesfor Latin American pension systems and labour markets, whiledemographic conditions are allowed to vary within the rangegiven. From left to right, the points represent the demographicprofiles of Nicaragua in 1990, Uruguay in 1990, France in 1990and France in 2050.

129C E P A L R E V I E W 7 2 • D E C E M B E R 2 0 0 0
POPULATION AGEING AND PENSION SYSTEMS IN LATIN AMERICA • JORGE BRAVO
government budget absorbs any imbalance that mayarise in the pension system and, secondly, the casewhere the ratio between contributions and benefits isplanned in such a way that it adjusts to changes in thedemographic profile and financial balance is obtainedat all times. Neither of these two functions of d is strictlylinear, for the reasons given below.
The first line shows that when the contributions/benefits ratio remains constant, the greater adultlongevity that occurs in the ageing process leads firstlyto a slight fall in r, then to a large increase. This happensbecause the greatest declines in adult mortality areobtained first for the “young adult” or working ages,while later declines mainly occur at more advanced(retirement) ages. This means that the ratio betweenthe number of years lived as a pensioner and the numberlived as a worker first remains constant or declinessomewhat, then rises sharply.
The second line shows that if the contributions/benefits ratio always stays at levels that producefinancial balance, then the system rate of return declinesrapidly with d, at least until “moderate” ageing levelsare reached, after which it falls at a slower rate. Theexplanation is as follows. When the population ages ina balanced system, contributions have to be increasedor benefits reduced. Given that the early stages of ageingin the adult population are primarily due to decliningfertility –and not to survival to advanced ages– theadjustment in the contributions/benefits ratio isconsiderable by comparison with the modestimprovements in adult survival rates. After d = 0.8, thefalls in r become much smaller, as much of the changein d is produced by increases in the ratio between thenumber of years lived at advanced ages and the numberlived at young adult ages, and this has a positive effecton r which largely offsets the negative effect of thenecessary increase in the contributions/benefits ratio.
Which of these two scenarios –the one wherecontribution and replacement rates are fixed or the onethat produces financial balance– is more “sustainable”,in the sense of minimizing intergenerational inequity?The chart suggests that maintaining fixed rules in thesystem during the early stages of the ageing process(up to d = 0.3, in figure 4) leads to a reasonably stablerate of return, while at the more advanced stages of theageing process the financial balance rule would givesmaller differences in the rate of return between cohorts.If the same data are interpreted from a slightly differentpoint of view, it transpires that in the early stages of theprocess disproportionately large transfers would bemade to the early cohorts if the system worked on the
basis of financial balance, i.e., if all revenue weretransferred automatically in the form of pensions,without considering the contributions made by thepensioners. The chart also illustrates the risk ofproviding excessively generous benefits to the latercohorts, since the system will go into a state of chronicunderfunding (after d = 0.3, in the chart) if the benefits/contributions ratio does not adjust to a more elderlydemographic context.
Consequently, in the long-term ageing process thefollowing sequence of policies could prevent largedifferences arising in the rate of return obtained bydifferent cohorts: i) fixing both contribution and benefitrates during the early stages of the ageing process andii) when ageing is further advanced, changing over tothe financial equilibrium rule, which would ensuregreater intergenerational equity at this stage. The firstpart of this sequence –offering defined benefits inexchange for more or less defined contributions– hasin fact been the rule traditionally followed by manycountries; most current systems are still benefit-defined.As more recent experience shows, however, switchingto the second stage rule (“financial balance”) has provedmore problematic, since although fiscal constraintsmake the changeover virtually unavoidable, this entailsa loss (by comparison with the no-change scenario) forpresent generations of workers, to which there is oftenpolitical resistance.19 If today’s cohorts of workers aresuccessful in holding out against change and resistingdirect or indirect financing, however, the current deficitwill be transferred to future generations, which meansthat intergenerational equity will be impaired.
Given this situation, two basic approaches can betaken to achieving financial balance. The most commonand traditional one, expressed in terms of a defined-benefit logic and terminology, involves “parametric”changes or reforms in which contributions are changed,benefits adjusted or eligibility conditions made morestringent. The second approach consists in makingexplicit the dual objective of financial solvency andintergenerational equity and designing the system in away that can accommodate both. One approach ofthis kind, known as the “notional contribution” scheme,
19 The changeover to the financial balance rule can be facilitatedenormously if the surplus generated since the system began issuitably invested and is used to cover deficits when the systemmatures. This, indeed, is sensible advice for countries that haveyoung populations and set up their systems recently, but it comestoo late for those that have already spent the surplus or have let thereal value of reserves be eroded by negative rates of return.
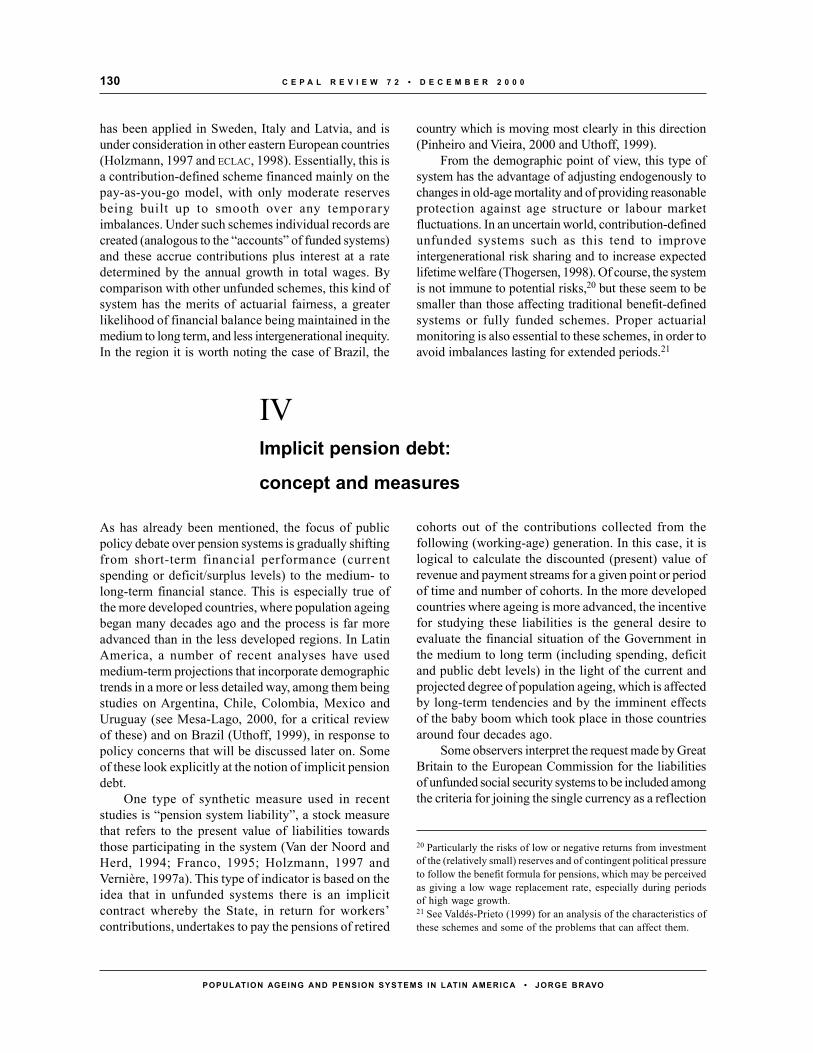
C E P A L R E V I E W 7 2 • D E C E M B E R 2 0 0 0130
POPULATION AGEING AND PENSION SYSTEMS IN LATIN AMERICA • JORGE BRAVO
has been applied in Sweden, Italy and Latvia, and isunder consideration in other eastern European countries(Holzmann, 1997 and ECLAC, 1998). Essentially, this isa contribution-defined scheme financed mainly on thepay-as-you-go model, with only moderate reservesbeing built up to smooth over any temporaryimbalances. Under such schemes individual records arecreated (analogous to the “accounts” of funded systems)and these accrue contributions plus interest at a ratedetermined by the annual growth in total wages. Bycomparison with other unfunded schemes, this kind ofsystem has the merits of actuarial fairness, a greaterlikelihood of financial balance being maintained in themedium to long term, and less intergenerational inequity.In the region it is worth noting the case of Brazil, the
country which is moving most clearly in this direction(Pinheiro and Vieira, 2000 and Uthoff, 1999).
From the demographic point of view, this type ofsystem has the advantage of adjusting endogenously tochanges in old-age mortality and of providing reasonableprotection against age structure or labour marketfluctuations. In an uncertain world, contribution-definedunfunded systems such as this tend to improveintergenerational risk sharing and to increase expectedlifetime welfare (Thogersen, 1998). Of course, the systemis not immune to potential risks,20 but these seem to besmaller than those affecting traditional benefit-definedsystems or fully funded schemes. Proper actuarialmonitoring is also essential to these schemes, in order toavoid imbalances lasting for extended periods.21
IVImplicit pension debt:
concept and measures
As has already been mentioned, the focus of publicpolicy debate over pension systems is gradually shiftingfrom short-term financial performance (currentspending or deficit/surplus levels) to the medium- tolong-term financial stance. This is especially true ofthe more developed countries, where population ageingbegan many decades ago and the process is far moreadvanced than in the less developed regions. In LatinAmerica, a number of recent analyses have usedmedium-term projections that incorporate demographictrends in a more or less detailed way, among them beingstudies on Argentina, Chile, Colombia, Mexico andUruguay (see Mesa-Lago, 2000, for a critical reviewof these) and on Brazil (Uthoff, 1999), in response topolicy concerns that will be discussed later on. Someof these look explicitly at the notion of implicit pensiondebt.
One type of synthetic measure used in recentstudies is “pension system liability”, a stock measurethat refers to the present value of liabilities towardsthose participating in the system (Van der Noord andHerd, 1994; Franco, 1995; Holzmann, 1997 andVernière, 1997a). This type of indicator is based on theidea that in unfunded systems there is an implicitcontract whereby the State, in return for workers’contributions, undertakes to pay the pensions of retired
cohorts out of the contributions collected from thefollowing (working-age) generation. In this case, it islogical to calculate the discounted (present) value ofrevenue and payment streams for a given point or periodof time and number of cohorts. In the more developedcountries where ageing is more advanced, the incentivefor studying these liabilities is the general desire toevaluate the financial situation of the Government inthe medium to long term (including spending, deficitand public debt levels) in the light of the current andprojected degree of population ageing, which is affectedby long-term tendencies and by the imminent effectsof the baby boom which took place in those countriesaround four decades ago.
Some observers interpret the request made by GreatBritain to the European Commission for the liabilitiesof unfunded social security systems to be included amongthe criteria for joining the single currency as a reflection
20 Particularly the risks of low or negative returns from investmentof the (relatively small) reserves and of contingent political pressureto follow the benefit formula for pensions, which may be perceivedas giving a low wage replacement rate, especially during periodsof high wage growth.21 See Valdés-Prieto (1999) for an analysis of the characteristics ofthese schemes and some of the problems that can affect them.
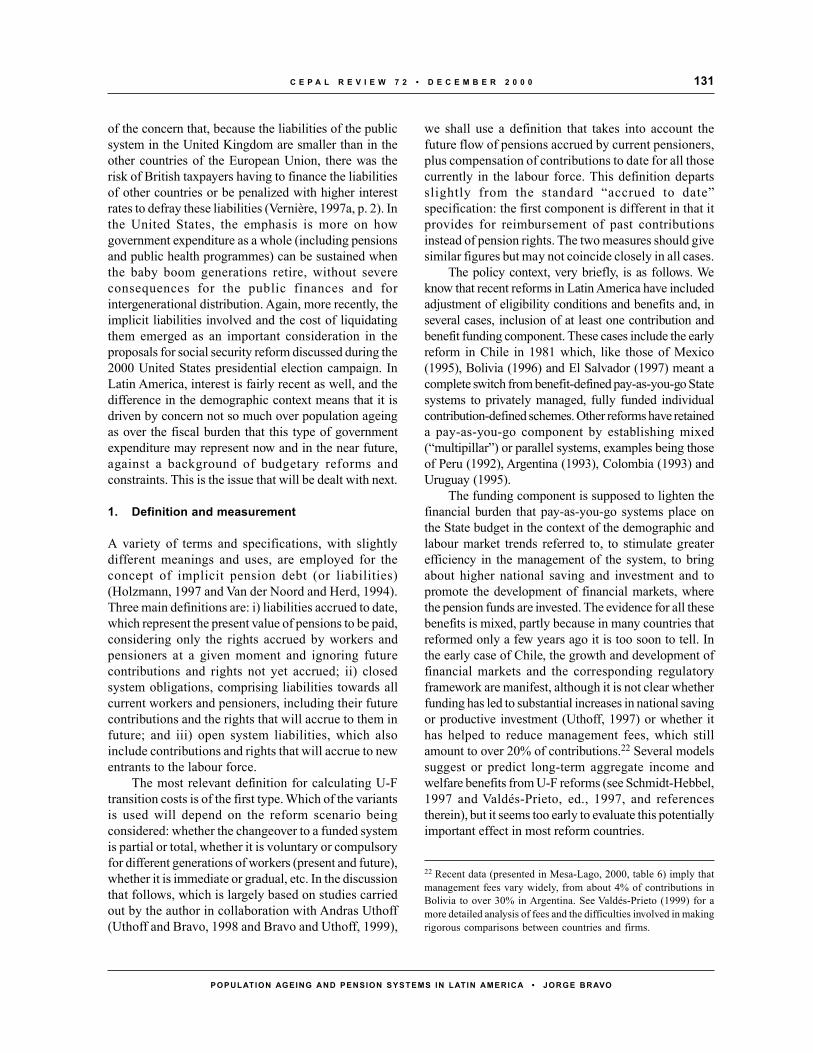
131C E P A L R E V I E W 7 2 • D E C E M B E R 2 0 0 0
POPULATION AGEING AND PENSION SYSTEMS IN LATIN AMERICA • JORGE BRAVO
of the concern that, because the liabilities of the publicsystem in the United Kingdom are smaller than in theother countries of the European Union, there was therisk of British taxpayers having to finance the liabilitiesof other countries or be penalized with higher interestrates to defray these liabilities (Vernière, 1997a, p. 2). Inthe United States, the emphasis is more on howgovernment expenditure as a whole (including pensionsand public health programmes) can be sustained whenthe baby boom generations retire, without severeconsequences for the public finances and forintergenerational distribution. Again, more recently, theimplicit liabilities involved and the cost of liquidatingthem emerged as an important consideration in theproposals for social security reform discussed during the2000 United States presidential election campaign. InLatin America, interest is fairly recent as well, and thedifference in the demographic context means that it isdriven by concern not so much over population ageingas over the fiscal burden that this type of governmentexpenditure may represent now and in the near future,against a background of budgetary reforms andconstraints. This is the issue that will be dealt with next.
1. Definition and measurement
A variety of terms and specifications, with slightlydifferent meanings and uses, are employed for theconcept of implicit pension debt (or liabilities)(Holzmann, 1997 and Van der Noord and Herd, 1994).Three main definitions are: i) liabilities accrued to date,which represent the present value of pensions to be paid,considering only the rights accrued by workers andpensioners at a given moment and ignoring futurecontributions and rights not yet accrued; ii) closedsystem obligations, comprising liabilities towards allcurrent workers and pensioners, including their futurecontributions and the rights that will accrue to them infuture; and iii) open system liabilities, which alsoinclude contributions and rights that will accrue to newentrants to the labour force.
The most relevant definition for calculating U-Ftransition costs is of the first type. Which of the variantsis used will depend on the reform scenario beingconsidered: whether the changeover to a funded systemis partial or total, whether it is voluntary or compulsoryfor different generations of workers (present and future),whether it is immediate or gradual, etc. In the discussionthat follows, which is largely based on studies carriedout by the author in collaboration with Andras Uthoff(Uthoff and Bravo, 1998 and Bravo and Uthoff, 1999),
we shall use a definition that takes into account thefuture flow of pensions accrued by current pensioners,plus compensation of contributions to date for all thosecurrently in the labour force. This definition departsslightly from the standard “accrued to date”specification: the first component is different in that itprovides for reimbursement of past contributionsinstead of pension rights. The two measures should givesimilar figures but may not coincide closely in all cases.
The policy context, very briefly, is as follows. Weknow that recent reforms in Latin America have includedadjustment of eligibility conditions and benefits and, inseveral cases, inclusion of at least one contribution andbenefit funding component. These cases include the earlyreform in Chile in 1981 which, like those of Mexico(1995), Bolivia (1996) and El Salvador (1997) meant acomplete switch from benefit-defined pay-as-you-go Statesystems to privately managed, fully funded individualcontribution-defined schemes. Other reforms have retaineda pay-as-you-go component by establishing mixed(“multipillar”) or parallel systems, examples being thoseof Peru (1992), Argentina (1993), Colombia (1993) andUruguay (1995).
The funding component is supposed to lighten thefinancial burden that pay-as-you-go systems place onthe State budget in the context of the demographic andlabour market trends referred to, to stimulate greaterefficiency in the management of the system, to bringabout higher national saving and investment and topromote the development of financial markets, wherethe pension funds are invested. The evidence for all thesebenefits is mixed, partly because in many countries thatreformed only a few years ago it is too soon to tell. Inthe early case of Chile, the growth and development offinancial markets and the corresponding regulatoryframework are manifest, although it is not clear whetherfunding has led to substantial increases in national savingor productive investment (Uthoff, 1997) or whether ithas helped to reduce management fees, which stillamount to over 20% of contributions.22 Several modelssuggest or predict long-term aggregate income andwelfare benefits from U-F reforms (see Schmidt-Hebbel,1997 and Valdés-Prieto, ed., 1997, and referencestherein), but it seems too early to evaluate this potentiallyimportant effect in most reform countries.
22 Recent data (presented in Mesa-Lago, 2000, table 6) imply thatmanagement fees vary widely, from about 4% of contributions inBolivia to over 30% in Argentina. See Valdés-Prieto (1999) for amore detailed analysis of fees and the difficulties involved in makingrigorous comparisons between countries and firms.
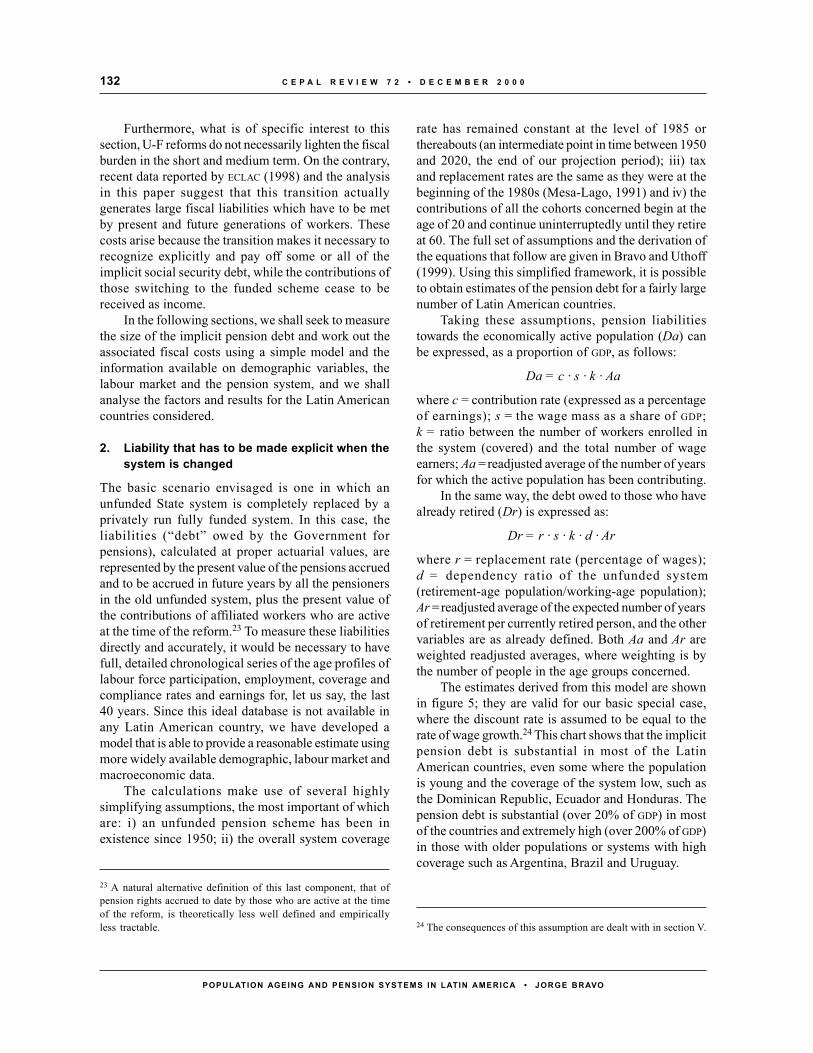
C E P A L R E V I E W 7 2 • D E C E M B E R 2 0 0 0132
POPULATION AGEING AND PENSION SYSTEMS IN LATIN AMERICA • JORGE BRAVO
Furthermore, what is of specific interest to thissection, U-F reforms do not necessarily lighten the fiscalburden in the short and medium term. On the contrary,recent data reported by ECLAC (1998) and the analysisin this paper suggest that this transition actuallygenerates large fiscal liabilities which have to be metby present and future generations of workers. Thesecosts arise because the transition makes it necessary torecognize explicitly and pay off some or all of theimplicit social security debt, while the contributions ofthose switching to the funded scheme cease to bereceived as income.
In the following sections, we shall seek to measurethe size of the implicit pension debt and work out theassociated fiscal costs using a simple model and theinformation available on demographic variables, thelabour market and the pension system, and we shallanalyse the factors and results for the Latin Americancountries considered.
2. Liability that has to be made explicit when thesystem is changed
The basic scenario envisaged is one in which anunfunded State system is completely replaced by aprivately run fully funded system. In this case, theliabilities (“debt” owed by the Government forpensions), calculated at proper actuarial values, arerepresented by the present value of the pensions accruedand to be accrued in future years by all the pensionersin the old unfunded system, plus the present value ofthe contributions of affiliated workers who are activeat the time of the reform.23 To measure these liabilitiesdirectly and accurately, it would be necessary to havefull, detailed chronological series of the age profiles oflabour force participation, employment, coverage andcompliance rates and earnings for, let us say, the last40 years. Since this ideal database is not available inany Latin American country, we have developed amodel that is able to provide a reasonable estimate usingmore widely available demographic, labour market andmacroeconomic data.
The calculations make use of several highlysimplifying assumptions, the most important of whichare: i) an unfunded pension scheme has been inexistence since 1950; ii) the overall system coverage
rate has remained constant at the level of 1985 orthereabouts (an intermediate point in time between 1950and 2020, the end of our projection period); iii) taxand replacement rates are the same as they were at thebeginning of the 1980s (Mesa-Lago, 1991) and iv) thecontributions of all the cohorts concerned begin at theage of 20 and continue uninterruptedly until they retireat 60. The full set of assumptions and the derivation ofthe equations that follow are given in Bravo and Uthoff(1999). Using this simplified framework, it is possibleto obtain estimates of the pension debt for a fairly largenumber of Latin American countries.
Taking these assumptions, pension liabilitiestowards the economically active population (Da) canbe expressed, as a proportion of GDP, as follows:
Da = c · s · k · Aa
where c = contribution rate (expressed as a percentageof earnings); s = the wage mass as a share of GDP;k = ratio between the number of workers enrolled inthe system (covered) and the total number of wageearners; Aa = readjusted average of the number of yearsfor which the active population has been contributing.
In the same way, the debt owed to those who havealready retired (Dr) is expressed as:
Dr = r · s · k · d · Ar
where r = replacement rate (percentage of wages);d = dependency ratio of the unfunded system(retirement-age population/working-age population);Ar = readjusted average of the expected number of yearsof retirement per currently retired person, and the othervariables are as already defined. Both Aa and Ar areweighted readjusted averages, where weighting is bythe number of people in the age groups concerned.
The estimates derived from this model are shownin figure 5; they are valid for our basic special case,where the discount rate is assumed to be equal to therate of wage growth.24 This chart shows that the implicitpension debt is substantial in most of the LatinAmerican countries, even some where the populationis young and the coverage of the system low, such asthe Dominican Republic, Ecuador and Honduras. Thepension debt is substantial (over 20% of GDP) in mostof the countries and extremely high (over 200% of GDP)in those with older populations or systems with highcoverage such as Argentina, Brazil and Uruguay.
23 A natural alternative definition of this last component, that ofpension rights accrued to date by those who are active at the timeof the reform, is theoretically less well defined and empiricallyless tractable. 24 The consequences of this assumption are dealt with in section V.
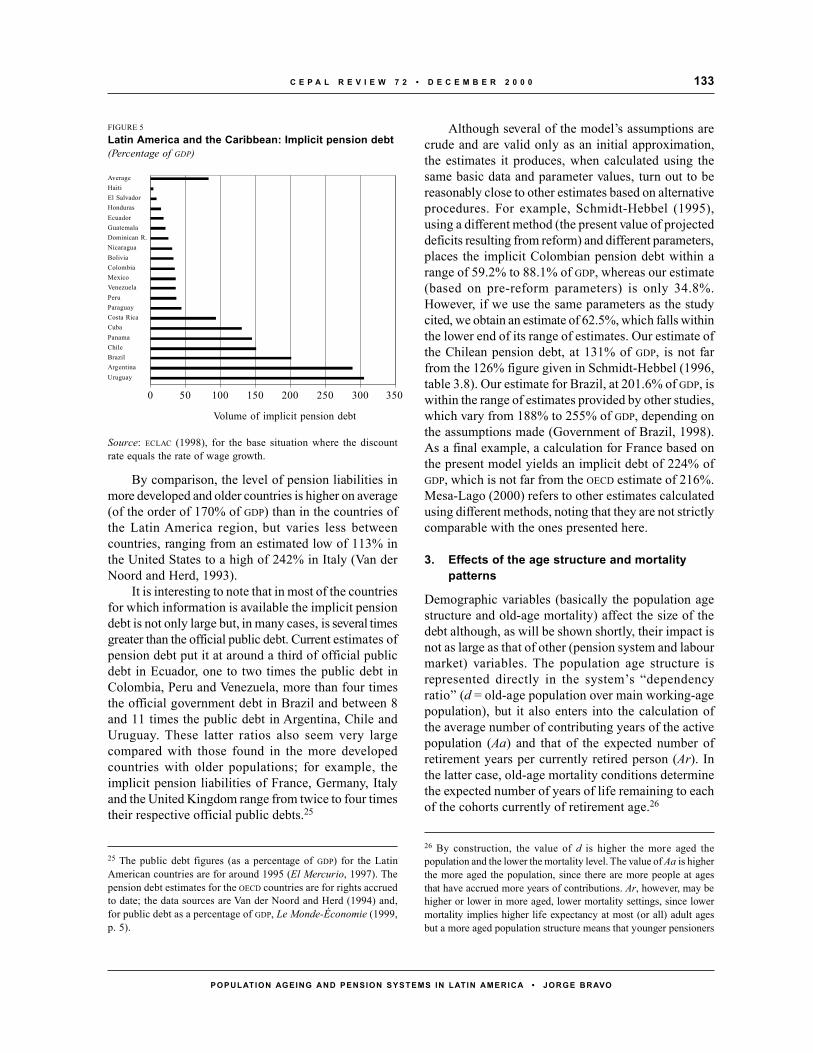
133C E P A L R E V I E W 7 2 • D E C E M B E R 2 0 0 0
POPULATION AGEING AND PENSION SYSTEMS IN LATIN AMERICA • JORGE BRAVO
By comparison, the level of pension liabilities inmore developed and older countries is higher on average(of the order of 170% of GDP) than in the countries ofthe Latin America region, but varies less betweencountries, ranging from an estimated low of 113% inthe United States to a high of 242% in Italy (Van derNoord and Herd, 1993).
It is interesting to note that in most of the countriesfor which information is available the implicit pensiondebt is not only large but, in many cases, is several timesgreater than the official public debt. Current estimates ofpension debt put it at around a third of official publicdebt in Ecuador, one to two times the public debt inColombia, Peru and Venezuela, more than four timesthe official government debt in Brazil and between 8and 11 times the public debt in Argentina, Chile andUruguay. These latter ratios also seem very largecompared with those found in the more developedcountries with older populations; for example, theimplicit pension liabilities of France, Germany, Italyand the United Kingdom range from twice to four timestheir respective official public debts.25
Although several of the model’s assumptions arecrude and are valid only as an initial approximation,the estimates it produces, when calculated using thesame basic data and parameter values, turn out to bereasonably close to other estimates based on alternativeprocedures. For example, Schmidt-Hebbel (1995),using a different method (the present value of projecteddeficits resulting from reform) and different parameters,places the implicit Colombian pension debt within arange of 59.2% to 88.1% of GDP, whereas our estimate(based on pre-reform parameters) is only 34.8%.However, if we use the same parameters as the studycited, we obtain an estimate of 62.5%, which falls withinthe lower end of its range of estimates. Our estimate ofthe Chilean pension debt, at 131% of GDP, is not farfrom the 126% figure given in Schmidt-Hebbel (1996,table 3.8). Our estimate for Brazil, at 201.6% of GDP, iswithin the range of estimates provided by other studies,which vary from 188% to 255% of GDP, depending onthe assumptions made (Government of Brazil, 1998).As a final example, a calculation for France based onthe present model yields an implicit debt of 224% ofGDP, which is not far from the OECD estimate of 216%.Mesa-Lago (2000) refers to other estimates calculatedusing different methods, noting that they are not strictlycomparable with the ones presented here.
3. Effects of the age structure and mortalitypatterns
Demographic variables (basically the population agestructure and old-age mortality) affect the size of thedebt although, as will be shown shortly, their impact isnot as large as that of other (pension system and labourmarket) variables. The population age structure isrepresented directly in the system’s “dependencyratio” (d = old-age population over main working-agepopulation), but it also enters into the calculation ofthe average number of contributing years of the activepopulation (Aa) and that of the expected number ofretirement years per currently retired person (Ar). Inthe latter case, old-age mortality conditions determinethe expected number of years of life remaining to eachof the cohorts currently of retirement age.26
25 The public debt figures (as a percentage of GDP) for the LatinAmerican countries are for around 1995 (El Mercurio, 1997). Thepension debt estimates for the OECD countries are for rights accruedto date; the data sources are Van der Noord and Herd (1994) and,for public debt as a percentage of GDP, Le Monde-Économie (1999,p. 5).
26 By construction, the value of d is higher the more aged thepopulation and the lower the mortality level. The value of Aa is higherthe more aged the population, since there are more people at agesthat have accrued more years of contributions. Ar, however, may behigher or lower in more aged, lower mortality settings, since lowermortality implies higher life expectancy at most (or all) adult agesbut a more aged population structure means that younger pensioners
FIGURE 5
Latin America and the Caribbean: Implicit pension debt(Percentage of GDP)
AverageHaitiEl SalvadorHondurasEcuadorGuatemalaDominican R.NicaraguaBoliviaColombiaMexicoVenezuelaPeruParaguayCosta RicaCubaPanamaChileBrazilArgentinaUruguay
Volume of implicit pension debt
Source: ECLAC (1998), for the base situation where the discountrate equals the rate of wage growth.
0 50 100 150 200 250 300 350
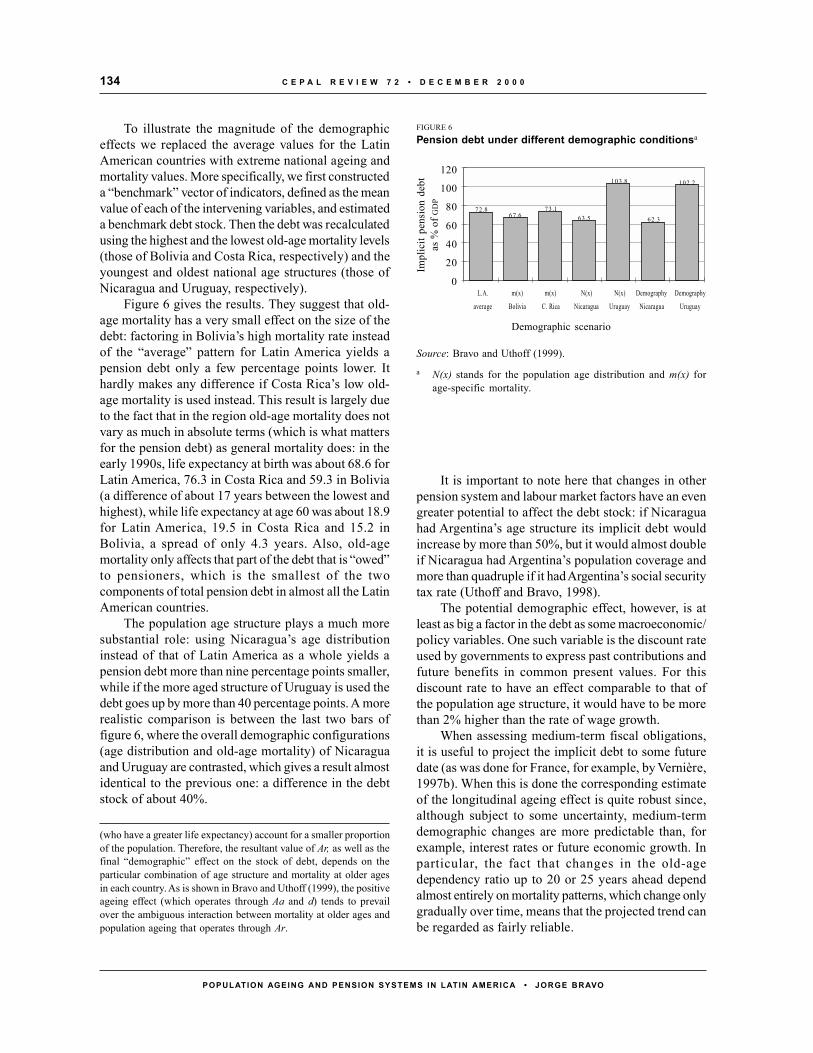
C E P A L R E V I E W 7 2 • D E C E M B E R 2 0 0 0134
POPULATION AGEING AND PENSION SYSTEMS IN LATIN AMERICA • JORGE BRAVO
To illustrate the magnitude of the demographiceffects we replaced the average values for the LatinAmerican countries with extreme national ageing andmortality values. More specifically, we first constructeda “benchmark” vector of indicators, defined as the meanvalue of each of the intervening variables, and estimateda benchmark debt stock. Then the debt was recalculatedusing the highest and the lowest old-age mortality levels(those of Bolivia and Costa Rica, respectively) and theyoungest and oldest national age structures (those ofNicaragua and Uruguay, respectively).
Figure 6 gives the results. They suggest that old-age mortality has a very small effect on the size of thedebt: factoring in Bolivia’s high mortality rate insteadof the “average” pattern for Latin America yields apension debt only a few percentage points lower. Ithardly makes any difference if Costa Rica’s low old-age mortality is used instead. This result is largely dueto the fact that in the region old-age mortality does notvary as much in absolute terms (which is what mattersfor the pension debt) as general mortality does: in theearly 1990s, life expectancy at birth was about 68.6 forLatin America, 76.3 in Costa Rica and 59.3 in Bolivia(a difference of about 17 years between the lowest andhighest), while life expectancy at age 60 was about 18.9for Latin America, 19.5 in Costa Rica and 15.2 inBolivia, a spread of only 4.3 years. Also, old-agemortality only affects that part of the debt that is “owed”to pensioners, which is the smallest of the twocomponents of total pension debt in almost all the LatinAmerican countries.
The population age structure plays a much moresubstantial role: using Nicaragua’s age distributioninstead of that of Latin America as a whole yields apension debt more than nine percentage points smaller,while if the more aged structure of Uruguay is used thedebt goes up by more than 40 percentage points. A morerealistic comparison is between the last two bars offigure 6, where the overall demographic configurations(age distribution and old-age mortality) of Nicaraguaand Uruguay are contrasted, which gives a result almostidentical to the previous one: a difference in the debtstock of about 40%.
It is important to note here that changes in otherpension system and labour market factors have an evengreater potential to affect the debt stock: if Nicaraguahad Argentina’s age structure its implicit debt wouldincrease by more than 50%, but it would almost doubleif Nicaragua had Argentina’s population coverage andmore than quadruple if it had Argentina’s social securitytax rate (Uthoff and Bravo, 1998).
The potential demographic effect, however, is atleast as big a factor in the debt as some macroeconomic/policy variables. One such variable is the discount rateused by governments to express past contributions andfuture benefits in common present values. For thisdiscount rate to have an effect comparable to that ofthe population age structure, it would have to be morethan 2% higher than the rate of wage growth.
When assessing medium-term fiscal obligations,it is useful to project the implicit debt to some futuredate (as was done for France, for example, by Vernière,1997b). When this is done the corresponding estimateof the longitudinal ageing effect is quite robust since,although subject to some uncertainty, medium-termdemographic changes are more predictable than, forexample, interest rates or future economic growth. Inparticular, the fact that changes in the old-agedependency ratio up to 20 or 25 years ahead dependalmost entirely on mortality patterns, which change onlygradually over time, means that the projected trend canbe regarded as fairly reliable.
(who have a greater life expectancy) account for a smaller proportionof the population. Therefore, the resultant value of Ar, as well as thefinal “demographic” effect on the stock of debt, depends on theparticular combination of age structure and mortality at older agesin each country. As is shown in Bravo and Uthoff (1999), the positiveageing effect (which operates through Aa and d) tends to prevailover the ambiguous interaction between mortality at older ages andpopulation ageing that operates through Ar.
FIGURE 6
Pension debt under different demographic conditionsa
Impl
icit
pens
ion
debt
as %
of G
DP
120
100
80
60
40
20
0L.A. m(x) m(x) N(x) N(x) Demography Demography
average Bolivia C. Rica Nicaragua Uruguay Nicaragua Uruguay
Demographic scenario
Source: Bravo and Uthoff (1999).
a N(x) stands for the population age distribution and m(x) forage-specific mortality.
73.167.6
72.863.5
103.8
62.3
102.2
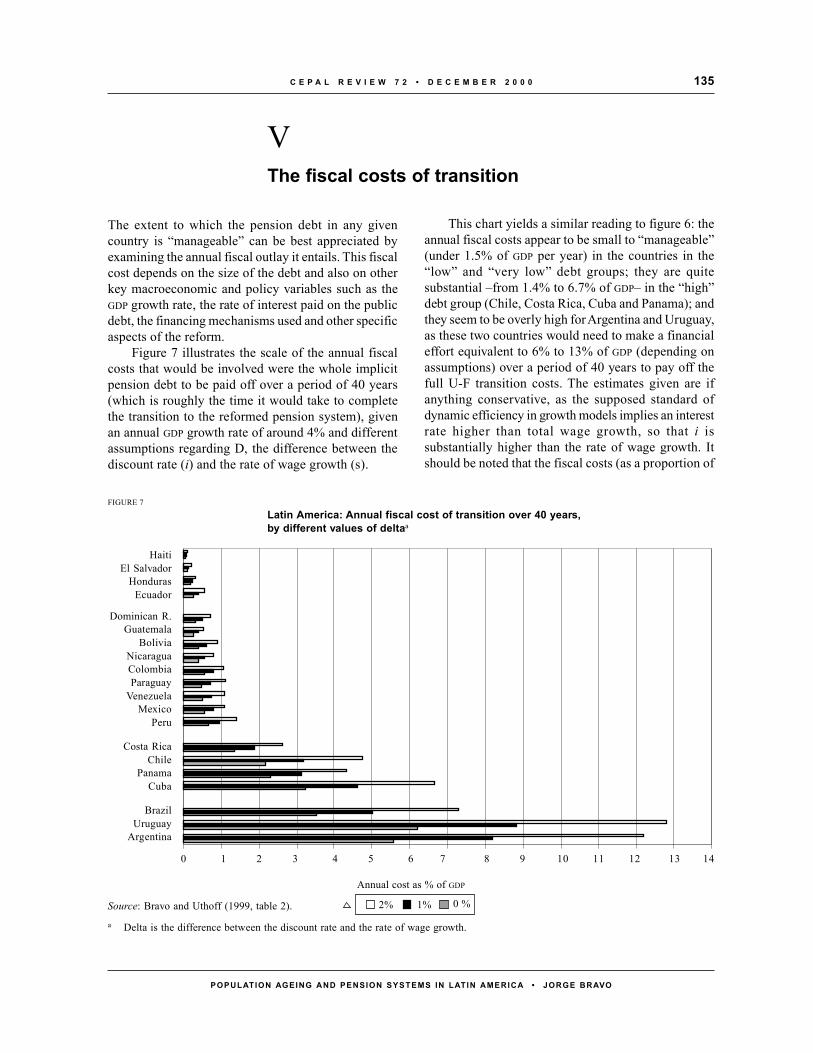
135C E P A L R E V I E W 7 2 • D E C E M B E R 2 0 0 0
POPULATION AGEING AND PENSION SYSTEMS IN LATIN AMERICA • JORGE BRAVO
VThe fiscal costs of transition
This chart yields a similar reading to figure 6: theannual fiscal costs appear to be small to “manageable”(under 1.5% of GDP per year) in the countries in the“low” and “very low” debt groups; they are quitesubstantial –from 1.4% to 6.7% of GDP– in the “high”debt group (Chile, Costa Rica, Cuba and Panama); andthey seem to be overly high for Argentina and Uruguay,as these two countries would need to make a financialeffort equivalent to 6% to 13% of GDP (depending onassumptions) over a period of 40 years to pay off thefull U-F transition costs. The estimates given are ifanything conservative, as the supposed standard ofdynamic efficiency in growth models implies an interestrate higher than total wage growth, so that i issubstantially higher than the rate of wage growth. Itshould be noted that the fiscal costs (as a proportion of
The extent to which the pension debt in any givencountry is “manageable” can be best appreciated byexamining the annual fiscal outlay it entails. This fiscalcost depends on the size of the debt and also on otherkey macroeconomic and policy variables such as theGDP growth rate, the rate of interest paid on the publicdebt, the financing mechanisms used and other specificaspects of the reform.
Figure 7 illustrates the scale of the annual fiscalcosts that would be involved were the whole implicitpension debt to be paid off over a period of 40 years(which is roughly the time it would take to completethe transition to the reformed pension system), givenan annual GDP growth rate of around 4% and differentassumptions regarding D, the difference between thediscount rate (i) and the rate of wage growth (s).
FIGURE 7
Latin America: Annual fiscal cost of transition over 40 years,by different values of deltaa
HaitiEl Salvador
HondurasEcuador
Dominican R.Guatemala
BoliviaNicaraguaColombiaParaguay
VenezuelaMexico
Peru
Costa RicaChile
PanamaCuba
BrazilUruguay
Argentina
Annual cost as % of GDP
Source: Bravo and Uthoff (1999, table 2).
a Delta is the difference between the discount rate and the rate of wage growth.
0 1 2 3 4 5 6 7 8 9 10 11 12 13 14
2% 1% 0 %
C E P A L R E V I E W 7 2 • D E C E M B E R 2 0 0 0136
POPULATION AGEING AND PENSION SYSTEMS IN LATIN AMERICA • JORGE BRAVO
GDP) do not vary significantly with the level of GDPgrowth. What matters most is the difference betweenthis growth rate and the discount (or interest) rate: adiscount rate 2% higher than GDP growth means that inmany cases the fiscal costs are more than double whatthey would be in a situation where i = σ.
These figures, which are for the average over a 40year period, give a useful idea of the scale of costsinvolved. In actual transitions the fiscal costs vary overtime, depending on the arrangements made for paymentof the pension debt and the financing mechanismsused.27 In particular, extending the period over whichthe debt is paid (for example by setting periodiccompensation as in Argentina and Bolivia, as opposedto the lump-sum “bond” used in Chile and Colombia)can achieve some reduction in the annual fiscal cost insituations where the discount rate (i) is greater than theeconomic growth rate (g). However, such reductionsare not as dramatic as might be assumed: if i exceededg by two percentage points, and the payment periodwere extended from 40 to 60 years (assuming this werefeasible), the annual cost of repaying a debt of D =100% of GDP would fall from 3.7% to 2.9% of GDP, andif it were extended to 80 years the annual cost wouldstill be 2.5% a year.28
Bravo and Uthoff (1999) discuss the observed andprojected trajectories of the transitional deficits ofArgentina, Bolivia and Chile according to the above-mentioned model, noting the constraints these wouldplace on the overall government budget and the risk ofdefault on the entitlements accrued by workers andpensioners in the pension system. More detailedaccounts of the cases of Brazil and Chile are given inUthoff (1999) and Arenas (2000), respectively, showinghow the timescale over which liabilities are amortized
depends on the present and projected age and sexdistribution of the active and retired population. In thesimulations for Brazil, the most salient features are thegreater relative importance of pensions being paid underthe old system during the early stages of the transitionand the subsequent predominance of the Stateguarantees for the non-contributory system and the“recognition bonds”, the latter being provided to therelatively large working-age cohorts. In the case ofChile, perhaps the most significant features are thegrowing relative importance of women and theguaranteed minimum and “welfare” pensions over themedium to long term, which are likely to impose a largefiscal liability for pension funding well beyond thetransition period.
Two final observations should be made regardingthe practical policy-making process. Firstly, the levelof debt and the payment schedule are not absolutegivens, and countries can and have sought ways to makethe fiscal costs more bearable (ECLAC, 1998 andQueisser, 1998). Many countries in Latin America havemade only a partial switch to funding (this is the casewith all the recent reforms, except those of Bolivia,Chile and Mexico), something that is particularlyimportant for countries with mature, high-coveragepension systems and aged populations, such asArgentina and Uruguay. Changes to benefits andeligibility conditions, timed to coincide with the switchto funding, have also been made with a view to reducingfiscal obligations, and other stipulations have beenintroduced to the same end (Holzmann, 1997; ECLAC,1998 and Mesa-Lago, 2000). Secondly, the overallmacroeconomic and fiscal environment is crucial for acountry’s prospects of absorbing the transition costs.For example, implementation of the Chilean reform(which involves a complete switch) has been madepossible by a very positive macroeconomicperformance to date and by vigorous implementationof the necessary changes to the regulatory frameworkfor the financial market (Arrau, 1994). Even so, it hasrequired great fiscal discipline. All the reformingcountries in the region have made efforts in thesedirections, with differing degrees of strain on theirbudgets and with different balances being struckbetween easing the fiscal burden and reducing thebenefits provided to those in the system (Bravo andUthoff, 1999 and Mesa-Lago, 2000).
27 Two main financing mechanisms are (current) taxes and theissuance of new official public debt (i.e. future taxes). The financingmix affects both the amortization programme and the way thetransitional costs are distributed between present and futuregenerations of taxpayers. These intergenerational distributioneffects are important, but will not be discussed here in any detail.See Arrau (1991), Schmidt-Hebbel (1995), Cifuentes (1995) andValdés-Prieto, ed. (1997).28 After about 90 years, no further reductions would be obtained inthe annual fiscal cost; the reductions diminish and the time afterwhich no further reductions occur is shorter the larger the differencei - g is.
137C E P A L R E V I E W 7 2 • D E C E M B E R 2 0 0 0
POPULATION AGEING AND PENSION SYSTEMS IN LATIN AMERICA • JORGE BRAVO
VISummary and conclusions
cases. Rising expenditure, due in part to long-termpopulation ageing, should not be regarded as aharbinger of imminent crisis or bankruptcy, insofar asit reflects a natural reallocation of resources within thelife cycle owing to the increase in life expectancy amongindividuals and cohorts. The same is true in the case ofpension liabilities, which naturally tend to be higher incountries with older populations and with maturersystems that have greater coverage. When systems haveto be adapted, parametric changes to offset the effectsof population ageing may often be enough. If not,reform options need to be evaluated in the light of thenumerous possible permutations of public, private andmixed systems, benefit- or contribution-defined systemsand funded or unfunded schemes.
The introduction of greater contribution and benefitfunding is a type of reform that has been implementedin a number of Latin American countries and is beingactively discussed in other regions as well. Sections IVand V of this paper raised and analysed some of theissues associated with this kind of reform. It was pointedout that, although funding is generally justified on thegrounds of its potential to ease pressure on publicbudgets, improve labour market efficiency and thedevelopment of financial markets, raise saving, capitalaccumulation and growth rates and provide protectionagainst population ageing and fluctuations in the agestructure, the theory is not clear-cut as regards theseissues.
The empirical data are not conclusive either, exceptfor a few specific aspects. This paper examined onedirect effect of switching to a funding system, the needto make the implicit pension debt explicit, and the fiscalcosts that this entails. The model used considers theage structure of the population and shows the importantrole that this plays. It also shows the lesser effect ofold-age mortality and the more substantial one of thesystem’s population coverage, labour market factors andother system parameters such as contribution andreplacement rates. Countries that are at an intermediateto more advanced stage of ageing and have systemswith wide population coverage show high levels ofpension debt, which is often greater than their officialpublic debt and even than their annual GDP. Forcountries whose reforms envision full funding, this
After decades of declining demographic indices, thepopulation of Latin America is beginning to age.Although the region is a long way from the situation ofthe world’s most aged countries, it is forecast to agemuch more quickly than did the societies that arecurrently more advanced. These changes are going totake place in economic and institutional contexts wherethe living standards of more elderly generations willbe much less protected than they are now in the moredeveloped countries. Consequently, it is of the greatestimportance for the countries in the region to beginassessing the different policy options available so thatthey can arrive at the decisions and programmes thatare most appropriate to their demographic andeconomic conditions, now and in the near future.
It is often suggested that population ageing is a keyunderlying cause of the system’s financial problems, butexamination of the facts shows that this is generally notthe case. This paper has demonstrated that populationage structures and mortality patterns can have majoreffects on medium- to long-term developments in pensionsystems, but that, so far at least, labour market conditionsand administrative problems have played a much moredecisive role. In the vast majority of the region’s countriesthe greatest effects of population ageing on pensionsystems still lie ahead, as was discussed in section III ofthis paper. That section examined trends in a number ofpension system indicators relating to the ageing process,taking in the whole range from the younger age structuresin Latin American countries today to the age distributionprojected for France in the middle of the twenty-firstcentury.
This paper has shown what might be the generaltrends in pension spending, financial balance, pensiondebt and the pension system rate of return if conditionsin the system, the labour market and the economyremain unchanged. The analysis suggests that, if futureageing scenarios come about with system rulesunchanged, the Latin American countries could see theirexpenditure, and perhaps their deficit levels, rising tomeet those of the countries that are currently moreadvanced. It was seen, though, that it is very difficultto determine what pension liability levels are“sustainable” or “unsustainable”, both in general andfor particular countries, except in a few rather extreme
C E P A L R E V I E W 7 2 • D E C E M B E R 2 0 0 0138
POPULATION AGEING AND PENSION SYSTEMS IN LATIN AMERICA • JORGE BRAVO
translates into considerable fiscal transition costs overthe 40 years or so that are required to complete thetransition from one type of system to the other.
It was also noted that neither the size of the explicitdebt nor the amortization schedule are absolute givens,since they can be, and indeed have been, adapted tosuit different national situations. The fiscal costs dependon the strategies followed by governments as regards thedegree of funding introduced and the way the implicitpension debt is made explicit. Countries have adopteddifferent variants with a view to making the transition costsmore bearable, although these sometimes have a negativeeffect on the welfare of system participants.
Among the different reform options currently beingdiscussed, it is worth mentioning one that involves
introducing contribution-defined mechanisms intounfunded systems. This method allows for (“notional”)funding of contributions at a rate that matches growthin total wages, providing benefits that are actuariallyfair between cohorts without the need to introducefunding. As with funding systems, in this schemebenefits adjust, to a large extent endogenously, tochanges in the old-age survival rate and to populationageing. The fact that funding systems are almost alwayscontribution-defined means they can be integrated moreeasily into the kind of system described. A system ofthis type is now being introduced in Brazil, and it couldbe a worthwhile option for other Latin Americancountries that are facing some of the demographic,political or fiscal constraints analysed here.
APPENDIX 1
The estimates in table A1 are based on the data given in The cost ofsocial security. Basic tables 1990-1993 (ILO, 1997). The figuresfor pension expenditure and revenue refer to public- and private-sector old-age, survivors’ and invalidity pensions. The table ex-cludes the expenditure rows for family allowances, unemploymentbenefits, employment injuries and funeral, sickness and maternityexpenses. The “transfers to other schemes” column is also excluded.
Generally speaking, the same rows were used for the income cal-culation, and the “transfers from other schemes” column was ex-cluded.
Given below are the items included and excluded for each coun-try considered.a References to sections and items in the ILO tablesreferred to have been kept, in case these should need to be con-sulted.
Country Expenditure Income
Argentina 1. Pensions 2. NC pensions 1. Pensions 2. NC pensions 3. Judiciary 4. Retention of wages5. Own-account work
Bahamas 1. Old-age, survivors’ and retirement 1. Old-age, survivors’ and retirementBarbados 1. OASI 1. Pensions (1 to 3 – Xs 2 and 3)Belize 1. OASI (long term – funeral grant) 1. OASI (long term – funeral Xs)Bolivia 1. OASI + 2. c, d, f 1. OASI + 2. c, d, fChile 1. OAS – TTOS 1. OAS – TFOSColombia All – EI – SM – TTOS All – EI – SM – TTOSCosta Rica 2. OASI 2. OASICuba 1. OASI 1. OASIDominica 1. OASI (long term – funeral grant) 1. OASI (long term – funeral grant Xs)Ecuador 1. OASI – SM – EI – UN 1. OASI – SM – EI – UNGrenada 1. OASI + 5. Public-sector employees 1. OASI + 5. Public-sector employeesGuatemala 1. OASI 1. OASIGuyana 1.c OASI + 1.a.ii invalidity + 1.a.iii death 1.c OASI + 1.a.ii invalidity + 1.a.iii death + 2. Dependents’ fund
+ 2. Dependents’ fundJamaica I. National insurance – maternity I. National insurance – maternity – funeral grant
– funeral grant + III. Public-sector employees + III. Public-sector employeesNicaragua 1. OASI 1. OASIPanama 1. OASI + 2. Public-sector employees 1. OASI + 2. Public-sector employees + 4. Administration
+ 4. AdministrationTrinidad and Tobago 1. OASI + 2. NC old-age pension 1. National insurance – funeral grant and SM Xs
a The abbreviations used are as follows:
EI = employment injuries OASI = Old-age, survivors’ and invalidity TTOS = Transfers to other schemesNC = Non-contributory SM = Sickness and maternity UN = UnemploymentOAS = Old-age and survivors’ TFOS = Transfers from other schemes Xs = Expenditure

139C E P A L R E V I E W 7 2 • D E C E M B E R 2 0 0 0
POPULATION AGEING AND PENSION SYSTEMS IN LATIN AMERICA • JORGE BRAVO
TABLE A.1
Data and estimates of Social Security expenditures and financial balance, based on ILO(1997) The Cost of Social Security, 1990-1993
A. Basic estimate, including B. Estimate excludingState contribution State contributionData in % of GDP Data in % of GDP
Expenditure Revenue Balance Revenue Balance
Country Proportion Dependency Year Pensions Total Pensions Total Pensions Total Pensions Total Pensions Total60+ (1990) ratio (1990)
Barbados 0.15 0.30 1992 2.48 5.23 3.86 8.21 1.38 2.98 3.86 8.21 1.38 2.98Argentina 0.13 0.27 1992 4.41 4.78 4.71 5.28 0.30 0.50 4.52 5.09 0.11 0.31Dominica 0.12 0.23 1993 1.42 2.66 2.78 4.51 1.36 1.85 2.70 4.51 1.28 1.85Jamaica 0.09 0.21 1991 0.66 1.05 1.39 1.72 0.73 0.67 1.39 1.72 0.73 0.67Cuba 0.12 0.21 1991 8.40 18.00 8.40 18.00 0.00 0.00 4.85 6.50 -3.55 -11.50Grenada 0.09 0.21 1993 2.23 2.66 4.14 4.83 1.91 2.17 4.14 4.83 1.91 2.17Chile* 0.09 0.18 1993 6.89 22.67 8.91 34.15 2.02 11.48 3.91 16.25 -2.98 -6.42Trini&Toba 0.08 0.17 1991 0.64 0.95 1.50 1.54 0.86 0.59 1.50 1.54 0.86 0.59
Panama 0.07 0.16 1990 5.76 9.31 6.01 10.43 0.25 1.12 5.66 10.08 -0.10 0.77Belize 0.06 0.16 1992 0.24 1.14 1.38 2.65 1.14 1.51 1.38 2.65 1.14 1.51Ecuador 0.06 0.14 1991 1.85 1.95 2.39 2.93 0.54 0.98 2.13 2.67 0.28 0.72Bolivia 0.06 0.14 1992 1.72 1.83 2.01 2.23 0.29 0.40 1.94 2.16 0.22 0.33Colombia 0.06 0.13 1992 3.26 4.36 3.92 5.18 0.66 0.82 3.88 5.14 0.62 0.78Costa Rica 0.06 0.13 1993 1.92 7.65 2.26 8.91 0.34 1.26 2.19 8.08 0.27 0.43Bahamas 0.07 0.13 1992 1.72 2.32 2.80 3.43 1.08 1.11 2.67 3.30 0.95 0.98Guatemala 0.05 0.13 1993 0.28 1.05 0.49 1.35 0.21 0.30 0.49 1.35 0.21 0.30Guyana 0.06 0.13 1992 1.05 1.52 1.77 2.26 0.72 0.74 1.77 2.26 0.72 0.74Nicaragua 0.04 0.11 1992 0.22 0.50 0.22 0.53 0.00 0.03 0.21 0.47 -0.01 -0.03Average 0.08 0.17 2.51 4.98 3.27 6.56 0.77 1.58 2.73 4.82 0.22 -0.16
Source: Author’s estimates, based on ILO (1997) The Cost of Social Security 1990-1993, Basic Tables. Demographic indicators are basedon CELADE (1999) population estimates.
* “Income from capital” was excluded in both the A and B estimates, for comparability with the other countries that had not started theirfunded pillars by 1990-1993.
C E P A L R E V I E W 7 2 • D E C E M B E R 2 0 0 0140
POPULATION AGEING AND PENSION SYSTEMS IN LATIN AMERICA • JORGE BRAVO
APPENDIX 2
Model equations
The following set of equations are used in the paper to study therelationship between a standard ageing index in the analysis ofpension systems, the old age dependency ratio (d), i.e., the ratio ofthe retirement-age to the working-age population, and selectedpension system indicators. The equations are based on the assump-tion that the contribution rate (c), the replacement rate (r) and theratio of covered workers to the waged work force (k) stay constantover time in the country of interest. Assuming additionally thatpensions are calculated as a proportion of real wages, it followsthat:
1. Pension system expenditure (E), expressed as a fraction of an-nual GDP (Y) is:
E = r • s • k • d (1)
where s is the share of the wage mass in GDP.
2. Since system revenue from contributions is C = c • s • k, thesystem’s financial balance (C-E), expressed as a ratio to GDP is:
Fi = s • k • (c - rd) (2)
and the balance as a fraction of revenue is:
Fii = 1 – (—) d (3)rc
3. The implicit pension debt (see Bravo and Uthoff, 1999) is given by:
D = sk(cAa + rdAr) (4)
where Aa is the discounted average number of years of contribu-tion by the economically active at a given moment in time, and Aris the discounted average expected lifetime of all those in retire-ment ages at the given moment in time.
4. The pension system’s implicit rate of return (ρ), when the sys-tem rules are fixed throughout the cohort’s adult lifetime (Bravo,1996, p. 126), can be written as:
1 r LRρi = [ln ( ) + ln ( )] + σ (5)(AR – AW) c LW
where AR is the mean age at retirement, AW the mean working age,LR is the average number of years lived in retirement, LW the num-ber of working years lived by the individual or cohort of interest,and σ is the growth rate of wages. When the financial equilibriumrule holds (Bravo, 1996, p. 127), then
LRln( ) – ln(d)LWρi = + σ (6)(AR – AW)
Bibliography
un enfoque difusionista?, Notas de población, year 20,No. 56, Santiago, Chile, Latin American DemographicCentre (CELADE).
(1996): La tasa de retorno de los sistemas depensiones de reparto, Estudios de economía, vol. 23,No. 1, Santiago, Chile, University of Chile, Faculty ofEconomics and Management Sciences, Department ofEconomics, June.
(1999): Envejecimiento de la población yresponsabilidades fiscales hacia los sistemas depensiones en América Latina, SeminarioResponsabilidades Fiscales en Sistemas de Previsión,Santiago, Chile, ECLAC, 2-3 September.
Bravo, J. and A. Uthoff (1999): Transitional Fiscal Costsand Demographic Factors in Shifting from Unfundedto Funded Pensions in Latin America, Financiamientodel desarrollo series, No. 88, Santiago, Chile,ECLAC.
Brazil, Government (1998): Custos de transição para umsistema de capitalização individual, Informe dePrevidência Social, vol. 10, No. 2, Brasilia, February.
Calot, G. and J.C. Chesnais (1997): Le vieillissementdémographique dans l’Union européenne à l’horizon2050: une étude d’impact, Travaux et recherches de pro-spective, No. 6, Paris, Commissariat Général du Plan,October.
Chackiel, J. (2000): El envejecimiento de la poblaciónlatinoamericana, Encuentro latinoamericano y caribeño
Arenas, A. (2000): El sistema de pensiones en Chile:resultados y desafíos pendientes, Santiago, Chile, Eco-nomic Commission for Latin America and the Carib-bean (ECLAC).
Arrau, P. (1991): La reforma previsional chilena y sufinanciamiento durante la transición, Colección estudiosCIEPLAN, No. 32, Santiago, Chile, Economic ResearchCorporation for Latin America (CIEPLAN).
(1994): Fondo de pensiones y desarrollo del mercadode capitales en Chile: 1980-1993, Financiamiento deldesarrollo series, No. 19, Santiago, Chile, ECLAC.
Auerbach, A. and J. Kotlikoff (1987): Dynamic Fiscal Policy,Cambridge, Massachusetts, Cambridge University Press.
Baldacci, E. and D. Tuzi (1999): Effects of labour marketchanges on the sustainability of the Italian pension sys-tem, Âge, génération et activité: Vers un nouveau contratsocial? Proceedings of the 1ères Rencontres Sauvy,Paris, National Institute of Demographic Studies, De-cember.
Blanchet, D. (1990): Retraites par capitalisation et parrépartition selon le contexte démographique: quelquesrésultats comparatifs, Annales d’économie et destatistique, No. 18,
(1998): Le débat repartition-capitalisation: un étatdes lieux, Retraites et épargne, Paris, Conseil d’AnalyseÉconomique.
Bravo, J. (1992): Visiones teóricas de la transición de lafecundidad en América Latina. ¿Qué relevancia tiene

141C E P A L R E V I E W 7 2 • D E C E M B E R 2 0 0 0
POPULATION AGEING AND PENSION SYSTEMS IN LATIN AMERICA • JORGE BRAVO
sobre las personas de edad, Santiago, Chile, ECLAC,August.
Chand, S. and A. Jaeger (1996): Ageing Populations andPublic Pension Schemes, Occasional Paper, No. 147,Washington, D.C., International Monetary Fund (IMF).
Chauveau, T. and R. Loufir (1995): L’avenir des régimespublics de retraite dans les pays du G7, Revue del’OFCE, No. 52, Paris, Observatoire Français desConjonctures Économiques (OFCE), January.
Cifuentes, R. (1995): Reforma de los sistemas previsionales:aspectos macroeconómicos, Cuadernos de economía,year 32, No. 96, Santiago, Chile, Catholic Universityof Chile.
Conseil d’Analyse Économique (1998): Retraites et épargne,Paris, La Documentation Française.
Conte-Grand, A. (1995): Reparto o capitalización-gestiónpública o privada: aporte para las discusiones enmateria de seguridad social, Working document,No. 24, Santiago, Chile, International LabourOrganization (ILO).
Cosio-Zavala, M. (1996): The demographic transition in LatinAmerica and Europe, J.M. Guzmán and others (eds.),The Fertility Transition in Latin America, Oxford, U.K.,Clarendon Press.
Cox, A. (1999): Pensions projections for Chilean men andwomen: Estimates from social security contributions,World Bank Research Project on Gender and SocialSecurity, Washington, D.C., World Bank.
Dinh, Q. (1995): Projection de population totale pour laFrance Metropolitaine, base RP90, horizons 1990-2050,Paris, National Institute of Statistics and EconomicStudies.
Dumont, J.P. (1998): Les systèmes de protection sociale enEurope, Paris, Fédération Mutualiste Parisienne (FMP),Mutualité Francilienne.
ECLAC (1998): The Fiscal Covenant. Strengths, weaknesses,challenges, LC/G.2024, Santiago, Chile, April.
ECLAC/CELADE (1996): Impacto de las tendenciasdemográficas sobre los sectores sociales en AméricaLatina: contribución al diseño de políticas y programas,E-CELADE series, No. 45, Santiago, Chile.
(1998): Latin America: population projections, 1970-2050, Demographic Bulletin, year 31, No. 62, Santiago,Chile.
(1999): Latin America: Economically active popu-lation 1980-2025, Demographic Bulletin, No. 64,Santiago, Chile.
El Mercurio (1997): Pulso latinoamericano, Santiago, Chile,27 March.
Franco, D. (1995): Pension Liabilities: Their Use and Mis-use in the Assessment of Fiscal Policies, EconomicPapers, No. 110, Brussels, Luxembourg, EuropeanCommission, May.
Gokhale, J. (1995): Demographic changes, generationalaccounts and national saving in the United States, pa-per presented at the Conference on IntergenerationalEconomic Relations and Demographic Change, Honolulu,Hawaii, International Union for the Scientific Study ofPopulation (IUSSP)/East-West Center (EWC), September.
Guzmán, J.M. (1996): Social change and fertility decline inLatin America, J.M. Guzmán and others (eds.), The
Fertility Transition in Latin America, Oxford, U.K.,Clarendon Press.
Holzmann, R. (1997a): On Economic Benefits and FiscalRequirements of Moving from Unfunded to FundedPensions, Financiamiento del desarrollo series, No. 48,Santiago, Chile, ECLAC.
(1999): Comments to “Rethinking pension reform:Ten myths about social security”, by P. Orszag and J.Stiglitz, paper presented at the Conference on New Ideasabout Old Age Security, Washington, D.C., World Bank,September.
ILO (1997): The cost of social security, Basic Tables 1990-1993, http:/www-ilo-mirror.who.or.jp/public/english/110secso/css/.
Kinsella, K. and Y. Gist (1995): Older Workers, Retirementand Pensions: A Comparative International Chartbook,Washington, D.C., U.S. Department of Commerce,Bureau of the Census/U.S. Department of Health andHuman Services, National Institute on Ageing.
Le Monde-Économie (1999): Paris, 19 January.Lee, R. (1995): A Trans-cultural perspective of
intergenerational transfers, paper presented at theConference on Intergenerational Economic Relationsand Demographic Change, Honolulu, Hawaii, IUSSP/EWC,September.
Leibfritz, W. and D. Roseveare (1995): Ageing populationsand government budgets, The OECD Observer, No. 197,Paris, Organisation for Economic Co-operation andDevelopment (OECD).
Mesa-Lago, C. (1985): Social Security in Latin America,Cuadernos de la CEPAL series, No. 85, Santiago, Chile,ECLAC.
(1991): Social Security and Prospects for Equity inLatin America, World Bank discussion papers, No. 140,Washington, D.C., World Bank.
(1994): La reforma de la seguridad social y laspensiones en América Latina: importancia y evaluaciónde las alternativas de privatización, Reformas depolítica pública series, No. 28, Santiago, Chile, ECLAC.
(2000): Estudio comparativo de los costos fiscalesen la transición de ocho reformas de pensiones enAmérica Latina, Financiamiento del desarrollo series,No. 93, Santiago, Chile, ECLAC.
Meslé, F. and J. Vallin (1998): Tables de mortalité du moment1806-2100: sexe féminin, sexe masculin, sexes réunis,Paris, National Institute of Demographic Studies.
Orszag, P. and J. Stiglitz (1999): Rethinking pension reform:Ten myths about social security, paper presented at theConference on New Ideas about Old Age Security,Washington, D.C., World Bank, 14-15 September.
Pinheiro, V. and S. Vieira (2000): Reforma previsional enBrasil. La nueva regla para el cálculo de los beneficios,Financiamiento del desarrollo series, No. 97, Santiago,Chile, ECLAC.
Queisser, M. (1998): The second-generation pension reformsin Latin America, OECD working paper, Paris, OECD.
Reynaud, E. (coord.) (1998): Les retraites dans l’Unioneuropéenne: adaptation aux évolutions économiques etsociales, Paris, L’Hartman.
Rofman, R. (1997): Modelling transition costs in social se-curity reforms, paper presented at the International

C E P A L R E V I E W 7 2 • D E C E M B E R 2 0 0 0142
POPULATION AGEING AND PENSION SYSTEMS IN LATIN AMERICA • JORGE BRAVO
Population Conference, Beijing 1997, session I.29:Intergenerational Transfers and Population Ageing,Belgium, IUSSP.
Roseveare, D. and others (1996): Ageing Populations,Pension Systems and Government Budgets: Simulationsfor 20 OECD Countries, OECD Economics Departmentworking papers, No. 168, Paris, OECD.
Sauvy. A. (1953): L’Europe et sa population, Paris, NationalInstitute of Demographic Studies.
Schmidt-Hebbel, K. (1995): La reforma pensionalcolombiana: efectos fiscales y macroeconómicos,Bogotá, Bogotá, Stock Exchange.
(1997): Pension Reform, Informal Markets andLong-Term Income and Welfare, Working document,No. 4, Santiago, Chile, Central Bank of Chile.
Thompson, L. (1999): Pension reform in industrializedcountries, paper presented at the Latin American andCaribbean Symposium on Older Persons, Santiago,Chile, ECLAC, 8-10 September.
Thogersen, O. (1998): A note on intergenerational risksharing and the design of pay-as-you-go pensionprograms, Population Economics, vol. 11, No. 3, Berlin,Springer-Verlag.
United Nations (1998): World Population Prospects: the 1996Revision, New York, Department of Economic andSocial Affairs.
(1999): World Population Prospects: the 1998Revision. Sex and Age, New York, Department ofEconomic and Social Affairs.
Uthoff, A. (1997): Pension system reforms, the capital marketand saving, CEPAL Review, No. 63, LC/G.1986-P,Santiago, Chile, ECLAC
(1999): Perfil de responsabilidades fiscales de unaeventual sustitución hacia un sistema de capitalización
individual en Brasil, paper presented at theResponsabilidades Fiscales en Sistemas de PrevisiónSeminar, Santiago, Chile, ECLAC, 2-3 September.
Uthoff, A. and J. Bravo (1998): Deuda previsional yprivatización de los sistemas de pensiones, X SeminarioRegional de Política Fiscal: Compilación deDocumentos, Santiago, Chile, ECLAC, 26-28 January.
Valdés-Prieto, S. (ed.) (1997): The Economics of Pensions:Principles, Policies and International Experience,London, Cambridge University Press.
Valdés-Prieto, S. (1999): El tamaño de las comisiones de lasAFP: comparación internacional, Santiago, Chile,Catholic University of Chile.
Van der Noord and Herd (1993): Pension Liabilities in SevenMajor Economies, Working paper, No. 142, Paris, OECD.
(1994): Estimating pension liabilities: A method-ological framework, OECD Economic Studies, No. 23,Paris, OECD.
Vernière, L. (1997a): La mesure et l’interpretation del’équivalent patrimonial des droits à la retraite,Questions retraite, No. 4, Paris, Caisse de Dépots etConsignations, Branche Retraites..
(1997b): Une évaluation de l’équivalent patrimonialdes droits détenu par les retraités en France, Questionsretraite, Nº 5, Paris, Caisse de Dépôts et Consignations,Branche Retraites.
Villa, M. and L. Rivadeneira (2000): El proceso deenvejecimiento de la población en América Latina y elCaribe: una expresión de la transición demográfica,Encuentro Latinoamericano y Caribeño sobre las Per-sonas de Edad, Santiago, Chile, ECLAC, August.
World Bank (1994): Averting the Old Age Crisis. PolicyResearch Report, Oxford, U.K., Oxford UniversityPress.

143C E P A L R E V I E W 7 2 • D E C E M B E R 2 0 0 0
EXPERT OPINION AS AN INSTRUMENT FOR ASSESSING INVESTMENT IN PRIMARY EDUCATION • ERNESTO SCHIEFELBEIN,
LAURENCE WOLF AND PAULINA SCHIEFELBEIN
C E P A L R E V I E W 7 2
DECEMBER 2000
Expert opinionas an instrument
for assessing investmentin primary education
Ernesto Schiefelbein
Rector, Universidad Santo TomásSantiago, [email protected]
Laurence Wolff
Inter-AmericanDevelopment [email protected]
Paulina Schiefelbein
Centro de Investigacióny Desarrollode la Educación (CIDE),Santiago, Chile
Most educational investment is based on untested or partially
tested assumptions about the cost-effectiveness of a given
course of action. Indeed, the only estimates that have been
available have been for the average profitability of each type
of education, even though these differ greatly from marginal
profitability. This article sets out a new approach to
estimating the cost-effectiveness of educational investment.
The authors canvassed the views of ten world-renowned
educational researchers on the likely impact on students’
learning achievements of a set of forty measures generally
regarded as desirable for improving primary education, and
supplemented the responses received with their own
calculations of the cost of each, the aim being to establish
an index of cost-effectiveness. On this basis, they concluded
that the educational projects implemented in the region have
failed to include many of the measures identified as the most
efficient, and this has limited the quality of the education
provided and its potential contribution to economic success,
despite the considerable increase in educational investment
by governments and international bodies in the 1990s. The
article concludes with a number of recommendations aimed
at remedying this situation, which take account
simultaneously of the impact and the cost of the different
educational measures.

C E P A L R E V I E W 7 2 • D E C E M B E R 2 0 0 0144
EXPERT OPINION AS AN INSTRUMENT FOR ASSESSING INVESTMENT IN PRIMARY EDUCATION • ERNESTO SCHIEFELBEIN,
LAURENCE WOLF AND PAULINA SCHIEFELBEIN
IThe low quality of education
in Latin America
generally considered to determine the level of learningand retention. Among these, mention is often made ofthe availability and use of text books, the provision ofpre-school education, teaching by radio and some in-service training programmes (Lockheed and Verspoor,1991), even though the effects of these have rarely beencalculated and have never been correlated with theircosts. Up to 1998, few of the experiments carried outat the primary education level in Latin America hadbeen properly evaluated and publicized. Of experimentswhere this was done, mention may be made of:mathematics by radio in Nicaragua (Jamison, Searle,Heyneman and Galda, 1981), educational television inEl Salvador (Hornik, Ingle, Macanany and Schramm,1973), North-East Education Programme in Brazil(Harbison and Hanushek, 1992), Escuela Nueva inColombia (McEwan, 1995; Psacharopoulos, Rojas andVélez, 1995 and Rojas and Castillo, 1998), P-900 inChile (Gutman, 1993), Escuelas Fe y Alegría (Swopeand Latorre, 1998), EDUCO in El Salvador (El Salvador,Ministry of Education, 1996) and fast-track primary
Readers wishing to apply the methodology described in thisdocument should apply to the authors for permission at one of thefollowing e-mail addresses: [email protected] or [email protected].
In Latin America, working out the most efficient wayof using the limited resources available to schools iscritical. The quality of education in the Latin Americanregion is much lower than in the countries it competeswith, in terms both of quantity (school completion ratesand the average educational level of the workforce) andthe degree to which knowledge and learning are madeuse of (OECD, 2000 and UNESCO, 2000). Recently, theUNESCO/OREALC Laboratorio Latinoamericano deEvaluación de la Calidad de la Educación (LatinAmerican Education Quality Assessment Laboratory)has published comparative information on learning inthe third and fourth grades of primary education in theregion. Table 1 shows the scores obtained by elevenLatin American countries in the mathematics sectionof a regional test set by UNESCO, which measures muchsimpler and less sophisticated skills than the tests usedin the industrialized countries. It can be seen that, otherthan in Cuba, performance is inadequate.
The results of the test also show that performanceis worse in rural areas than in urban ones (except inColombia), that capital cities do better than smaller onesand that private schools (except in the DominicanRepublic) achieve better results than State ones.
The results for the Spanish test are similar. Pupilsfrom the half of the population with below-averageincomes get around 40% of the questions right. As thetests give four multiple-choice alternatives, pupils whoknow the right answers to 20% of the questions willalso give “correct” (but random) answers to one infour of the other 80 questions to which they do notknow the answers, giving a total of a 40% successrate in answering the questions. This means that mostpupils do not understand the contents of the writtentexts presented to them in this test. In other words,the great majority of future workers are functionallyilliterate.
The poor results obtained make it necessary tocarry out a careful examination of the critical factors
TABLE 1
Latin America (11 countries): Average scoresin the UNESCO regional test for fourthgrade mathematicsa
Country Score
Cuba 353Argentina 269Brazil 269Chile 265Colombia 258Mexico 256Paraguay 248Bolivia 245Dominican Republic 234Venezuela 231Honduras 226
Source: UNESCO, 1998.
a Standardized average scores of 250 for third and fourth gradesand standard deviation of 50. The average pupil in the regiongot approximately 50% of the questions right; the average Cu-ban student got 85% right.

145C E P A L R E V I E W 7 2 • D E C E M B E R 2 0 0 0
EXPERT OPINION AS AN INSTRUMENT FOR ASSESSING INVESTMENT IN PRIMARY EDUCATION • ERNESTO SCHIEFELBEIN,
LAURENCE WOLF AND PAULINA SCHIEFELBEIN
schools in Brazil (Araujo Oliveira, 1998). Over time,the increase in the number of national programmes formeasuring educational attainments will make it possibleto determine which measures have had a significanteffect on learning.1
The scantiness of the information available on thefactors that influence the results of learning,2 despite the
importance of the issue, and the difficulties involved intraditional research into efficiency, led the authors to seeka different strategy to help professional educators andresearchers gain a better understanding of the fundamentalaspects of the subject and to develop an instrument thatmay facilitate training, consensus-building and theidentification of critical areas of research.
IIForty strategies commonly used
to improve education quality
in Latin America
To obtain comparable responses from the panel of teninternational experts whose opinion was sought, all ofwhom are active in universities and internationalorganizations, the authors designed an index of cost-effectiveness (efficiency) which included a precise
definition of each of the possible measures whoseimpact and feasibility they were being asked to assess,the idea being to reduce variations resulting fromdifferences in the “assumed” scope of each of thesemeasures. Those interviewed had to estimate the impactthat each of the 40 primary education measures deemedpossible (box 1) might have on learning attainments(as measured by scores in a standardized test to beadministered at the end of the sixth grade), then estimatethe percentage probability of successful implementation.The authors then brought in their own calculations of theunit cost of the 40 measures. These three pieces ofinformation were used to calculate the cost-effectivenessindex value of each.
The 40 measures submitted to the experts, whichrelate to the twelve operational areas of the educationsystem given in table 2, were selected on the basis ofseven different types of criterion:
i) the components of educational programmes andprojects applied in Latin America over the last 20years, successfully or otherwise;
ii) the priorities and recommendations put forward byinternational bodies and development banks(Lockheed and Verspoor, 1991; World Bank, 1994and Carnoy and de Moura Castro, 1997);
iii) the main conclusions drawn from the regionaldiagnostic surveys carried out in the 1990s(Schiefelbein, coord., 1998 and Wolff, Schiefelbeinand Valenzuela, 1994);
iv) analysis of existing research studies into the cost-effectiveness of key strategies (Wolff, Schiefelbein
1 See Rojas and Esquivel (1998) for a detailed summary of recentexperience.2 Besides the studies referred to, other worthwhile efforts have beenmade in this direction. The sectoral studies of Honduras and ElSalvador on failure at school and the repeating of years (Reimersand McGinn, 1997) have resulted in the implementation of a rangeof programmes designed to reduce the repetition rate. However,the few systematic research initiatives that have been undertaken,particularly those dealing with impact on learning, are riddled withuncertainties and inconsistencies. In the case of the decentraliza-tion programme implemented in El Salvador through the EDUCO
programme, it has been ascertained that enrolment levels in ruralschools have increased and learning attainments and retention rateshave improved, but few clear differences can be discerned betweenthe level of learning in EDUCO schools and that in traditional Salva-doran schools. EDUCO schools are better equipped, devote moretime to teaching and have greater parent involvement. It is pos-sible, though, that the improvement in learning attainments maybe the result of the higher expectations accompanying decentrali-zation, which has indeed included a more learning-oriented ap-proach (Meza, 1997). It is also observed that decentralized schoolsin Nicaragua show higher retention rates, although other factorsmay be influencing this finding. Satisfaction levels among teach-ers and parents are found to be higher, although here again theeducational results are not clear (Castillo, 1998). In fact, althoughthere are solid political and social reasons for supporting the adop-tion of a decentralized system –in particular, the role of such asystem in strengthening civil society– there is little evidence world-wide to show that decentralization is accompanied by an increasein learning.

C E P A L R E V I E W 7 2 • D E C E M B E R 2 0 0 0146
EXPERT OPINION AS AN INSTRUMENT FOR ASSESSING INVESTMENT IN PRIMARY EDUCATION • ERNESTO SCHIEFELBEIN,
LAURENCE WOLF AND PAULINA SCHIEFELBEIN
Box 1FORTY POSSIBLE EDUCATIONAL MEASURES FOR LATIN AMERICA
1. Enforce a policy of not switching classroom teachers during school year.2. Implement a policy of assigning best teachers to first grade.3. Enforce regulations on official length of school year.4. Extend daily schedule by one hour (40 minutes academic classes, 20 minutes recreational) and pay teachers additional salary
in proportion.5. Extend length of school year by one week and pay teachers additional salary in proportion.6. Pay teachers in rural schools salary increment of 50% to have better trained teachers and raise the percentage of certified teachers.7. Raise teachers’ salaries by 10% in real terms, with no-strike agreement for two years.8. Raise teachers’ salaries by 20% in real terms, with no-strike agreement for three years.9. Fire half the staff in the education bureaucracy (currently 5% of unit costs) and establish a new highly trained and motivated
bureaucracy paid on average 2.1 times previous salary.10. Establish management information system (MIS) for identifying low-performing schools and inform school supervisors.11. Decentralization: give authority to school principals to manage funds and to hire and fire teachers with local council approval,
with no improvement in the capacity of the ministry of education for assessment and oversight.12. Same as above, except the ministry’s capacity for assessment and oversight is improved significantly.13. Test a 10% sample of fourth graders in mathematics and reading and provide numerical results to all fourth grade classroom teachers.14. Test the same sample, analyse results in terms of remedial strategies, and organize local follow-up seminars for fourth grade
teachers (one week).15. Universal testing of fourth graders (same as above).16. Provide classrooms with one standard textbook per student in mathematics as well as in reading (200 pages each) and accom-
panying teacher guide, without training teachers to use them.17. Provide same as above and also train teachers to use them (one week per year).18. Produce and provide to each student a set of learning materials for individualized instruction in reading and mathematics (400
pages per student, replaced every three years).19. Provide small library (100 books) for each classroom (renew every five years).20. School feeding programmes: free snack (cup of milk and bread) for everyone.21. School feeding programmes: free snack (cup of milk and bread) provided for half the children, the rest pay.22. School feeding programmes: free lunch for everyone.23. School feeding programmes: free lunch for half the children, the rest pay.24. Yearly check-up and referral by doctor. Not including medical treatment provided by the health system.25. Eyesight test by school and referral. Not including treatment.26. Adapt and broadcast high-quality pre-school television programmes such as Sesame Street (250 programmes). For home
viewing only.27. Media campaigns for parents to provide early stimulation to children (“Did you read one page last night to your children?”),
30 one-minute spots in one week.28. One year of development-oriented pre-schooling for at-risk children (50%), at unit cost equal to one year of primary school.29. Same as above at unit cost 0.5 times primary.30. One year of caretaking of pre-schoolers with no educational development content (unit cost 0.5 of primary school).31. Provide general in-service training for teachers (upgrading), four weeks per year (without follow-up materials for students).32. Targeted in-service hands-on training focusing on developing classroom strategies for cooperative learning (group work) and
students’ active use of time (one week per year).33. Targeted training focusing on using programmed learning materials (one week).34. Targeted training acquainting teachers with modern curriculum objectives and strategies (one week, as in Venezuela’s CENAMEC
programme).35. Establish a government grant programme to improve the quality of pre-service training to meet the challenges of the twenty-
first century. Government provides US$ 50 extra for every teacher trainee to teacher training institutions revising theirprogrammes to emphasize active learning, high standards, commitment and responsibility.
36. Revise curriculum in mathematics and reading using local experts and send a copy to each teacher (without in-service teachertraining and without field study of implemented curriculum).
37. Prepare and implement bilingual education curriculum, including materials, training and selection of teachers, in reading andmathematics, first and second grade, as well as adaptation and translation of textbooks.
38. Prepare and implement interactive radio instruction programme for mathematics and Spanish and broadcast by radio to allschool children with accompanying teaching/learning materials.
39. Provide one hour per week of computer access to all primary school children at which time they study LOGO.40. Establish a national consensus on the importance of improving basic education. Then deliver a complete learning package to
schools at risk (50% lowest-performing schools): self-learning materials, training in active and cooperative learning, hands-onworkshops, community involvement, school-based management, formative evaluation and systematic testing and feedback.

147C E P A L R E V I E W 7 2 • D E C E M B E R 2 0 0 0
EXPERT OPINION AS AN INSTRUMENT FOR ASSESSING INVESTMENT IN PRIMARY EDUCATION • ERNESTO SCHIEFELBEIN,
LAURENCE WOLF AND PAULINA SCHIEFELBEIN
and Valenzuela, 1994; Lockheed and Verspoor,1991 and Verspoor, 1989);
v) research into factors affecting performance (Fullerand Clarke, 1994);
vi) the results of the reform implemented in California(Chrispeels, 1997) and
vii) the suitability of this information for expression
in simple, precise terms so that estimates could bereliably compared.
The measures identified included the five “promisingpolicy measures” selected by Lockheed and Verspoor(1991, p. 28): teaching time, text books and teachingmaterials, measures to increase pupils’ learning capacity(nutrition, health and initial education), teacher trainingand the curriculum. Also included were some measuresthat are prevalent in the region, even though there wasevidence that they were ineffective. A preliminaryversion of these 40 strategies was reviewed with topofficials from the countries participating in threeplanning courses organized by UNESCO in 1994 and1996. By means of this process, the forty measuresdescribed in box 1 were eventually arrived at.
The public tend to believe (and pedagogicalthinking tends to support them) that combinations ofmeasures can have a cumulative effect, which is why anumber of strategies combine two or more measures.For example, as well as measure 11 (decentralizationgiving greater authority to school principals) measure12 is included (as above, but with greater inspectionpowers for the ministry), and measure 16 (provide twobooks to every pupil) is supplemented by 17 (as above,plus a week of teacher training).
TABLE 2
Educational measures by operational area
Operational area Measure numbera
Time on task 3,4,5Academic management 1,2Salaries 6,7,8Management and decentralization 9,10,11,12Testing 13,14,15Textbooks and self-learning materials 16,17,18,19Food and health 20,21,22,23,24,25Initial education 26,27,28,29,30Teacher training 31,32,33,34,35Curriculum 36,37Radio and computers 38,39Package of measures 40
a The numbers of the measures are those assigned to them intable 1, where they are described in detail.
IIIThe country, “Concordia”, where
the strategies would be applied
In order to produce valid comparisons, a target countrywas devised: “Concordia”. This prototype country,which is described in box 2, was constructed on thebasis of average values observed in Latin America,including demographic characteristics, cost levels,pupil-teacher ratio, school equipment and test scores.Consequently, all the responses (from the world expertsand planners) are linked to a common educationalcontext.
It was necessary to have this “artificial construct”without history or context because cost-effectiveness
will vary significantly depending on the number ofstudents enrolled in each country’s education system,its degree of educational development and its grossdomestic product per inhabitant. For example, relativeequipment costs may be considerably higher in acountry where the average unit cost of primaryeducation is US$ 100 or less, as compared with aregional average of US$ 200. The same would be truein smaller countries where fixed costs are high andvariable costs low (for example, sample-basedassessments and distance learning).

C E P A L R E V I E W 7 2 • D E C E M B E R 2 0 0 0148
EXPERT OPINION AS AN INSTRUMENT FOR ASSESSING INVESTMENT IN PRIMARY EDUCATION • ERNESTO SCHIEFELBEIN,
LAURENCE WOLF AND PAULINA SCHIEFELBEIN
IVCharacteristics of the panel of world experts
McGinn and Fernando Reimers (University ofHarvard), Claudio de Moura Castro (Inter-AmericanDevelopment Bank), Steve Heyneman, HimeldaMartínez and Eduardo Vélez (World Bank), JeffreyPuryear (Inter-American Dialogue) and Juan CarlosTedesco (Geneva International Bureau of Education,UNESCO). The authors would like to take this opportunityto express their heartfelt gratitude to the panel thatsupported this study.
The response of the experts was enthusiastic, owingto their deep interest in the issues raised (only the twoEuropean representatives in the original sample couldnot respond to the survey). No systematic differenceswere noticed in the estimates submitted by the expertsfrom the two regions referred to above.
VThe indicator of pupils’ academic performance
Box 2CONCORDIA
• Population: 20 millionRural population: 30%Indigenous population: 10%
• Primary education completion rate (six years): 60%• Student-teacher ratio: 29:1• Unit cost of primary education: US$ 200• Number of children in primary schooling (grades 1 to 6): 2 million• Total cost of primary education system: US$ 400 million• Percentage of budget going on teachers’ salaries: 90%• Hours of schooling: four a day, 27 class periods of 45 minutes each per week• 50% of children have (or use) basic textbooks• There is no assessment system in place. However, a small sample of pupils were tested at the end of sixth grade. The test was
based on the official mathematics and Spanish language curricula. The average test score was 50 out of 100. This score wouldindicate that a student had mastered what the official curriculum expected him or her to know.
The authors selected experts who met six criteria: i)they had published articles in good professionalreviews, ii) they had been cited repeatedly by educationplanners and professionals, iii) they had easy access tothe results of recent research, iv) they had participatedin projects in a variety of Latin American countries, v)they were leaders in the analysis of educationaldevelopment initiatives and vi) they had experienceof working with multilateral development bodies in theregion. In addition, a balance was sought between thenumber of experts from North America and Latin America.
The names of the world experts on the panel andthe institutions they work in obviate any need for furthercomment regarding the weight of their opinions: MartinCarnoy and Henry Levin (University of Stanford), Noel
The dependent variable selected was the “score obtainedby the pupil in a standardized test taken at the end ofthe sixth grade”. It was assumed that this test would besimilar to the language and mathematics tests given byUNESCO/OREALC in 13 countries in 1997, in which the
average pupil answered 50% of the questions correctly(table 1). The questions in these tests embodied a con-sensus opinion among the participant countries as towhat would be expected of a common curriculum. Inthis case, the tests dealing with criteria anticipate a
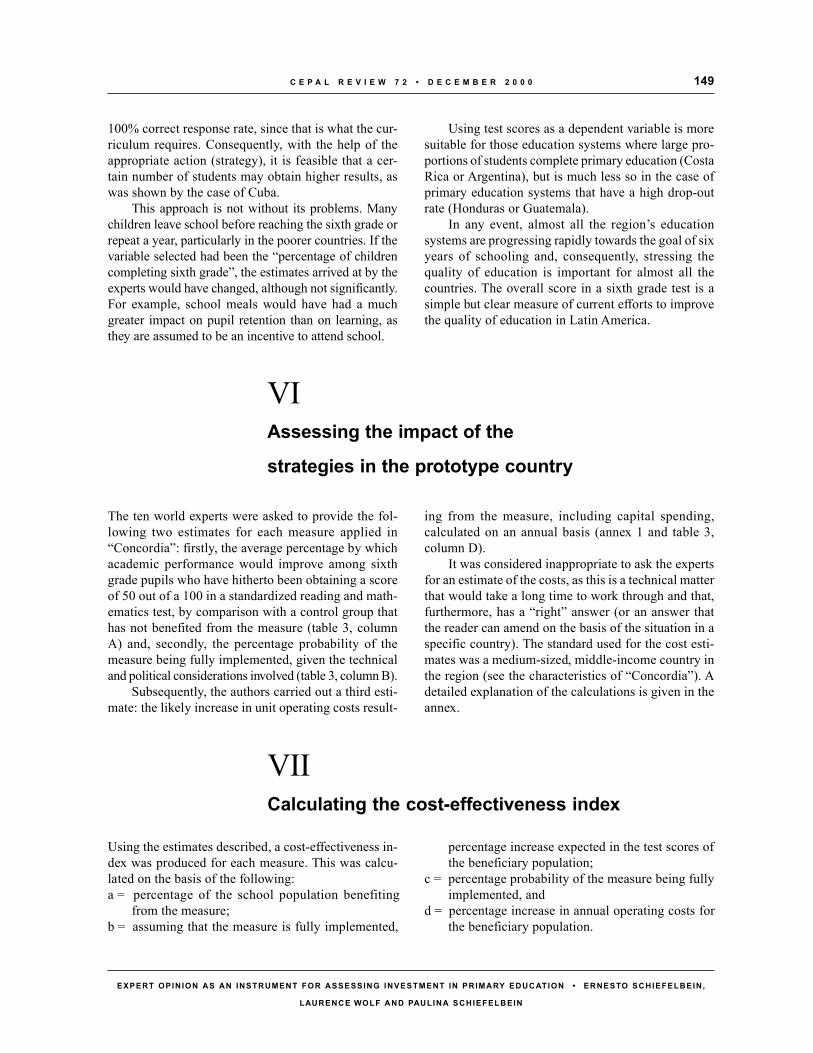
149C E P A L R E V I E W 7 2 • D E C E M B E R 2 0 0 0
EXPERT OPINION AS AN INSTRUMENT FOR ASSESSING INVESTMENT IN PRIMARY EDUCATION • ERNESTO SCHIEFELBEIN,
LAURENCE WOLF AND PAULINA SCHIEFELBEIN
Using test scores as a dependent variable is moresuitable for those education systems where large pro-portions of students complete primary education (CostaRica or Argentina), but is much less so in the case ofprimary education systems that have a high drop-outrate (Honduras or Guatemala).
In any event, almost all the region’s educationsystems are progressing rapidly towards the goal of sixyears of schooling and, consequently, stressing thequality of education is important for almost all thecountries. The overall score in a sixth grade test is asimple but clear measure of current efforts to improvethe quality of education in Latin America.
100% correct response rate, since that is what the cur-riculum requires. Consequently, with the help of theappropriate action (strategy), it is feasible that a cer-tain number of students may obtain higher results, aswas shown by the case of Cuba.
This approach is not without its problems. Manychildren leave school before reaching the sixth grade orrepeat a year, particularly in the poorer countries. If thevariable selected had been the “percentage of childrencompleting sixth grade”, the estimates arrived at by theexperts would have changed, although not significantly.For example, school meals would have had a muchgreater impact on pupil retention than on learning, asthey are assumed to be an incentive to attend school.
VIAssessing the impact of the
strategies in the prototype country
The ten world experts were asked to provide the fol-lowing two estimates for each measure applied in“Concordia”: firstly, the average percentage by whichacademic performance would improve among sixthgrade pupils who have hitherto been obtaining a scoreof 50 out of a 100 in a standardized reading and math-ematics test, by comparison with a control group thathas not benefited from the measure (table 3, columnA) and, secondly, the percentage probability of themeasure being fully implemented, given the technicaland political considerations involved (table 3, column B).
Subsequently, the authors carried out a third esti-mate: the likely increase in unit operating costs result-
ing from the measure, including capital spending,calculated on an annual basis (annex 1 and table 3,column D).
It was considered inappropriate to ask the expertsfor an estimate of the costs, as this is a technical matterthat would take a long time to work through and that,furthermore, has a “right” answer (or an answer thatthe reader can amend on the basis of the situation in aspecific country). The standard used for the cost esti-mates was a medium-sized, middle-income country inthe region (see the characteristics of “Concordia”). Adetailed explanation of the calculations is given in theannex.
VIICalculating the cost-effectiveness index
Using the estimates described, a cost-effectiveness in-dex was produced for each measure. This was calcu-lated on the basis of the following:a = percentage of the school population benefiting
from the measure;b = assuming that the measure is fully implemented,
percentage increase expected in the test scores ofthe beneficiary population;
c = percentage probability of the measure being fullyimplemented, and
d = percentage increase in annual operating costs forthe beneficiary population.
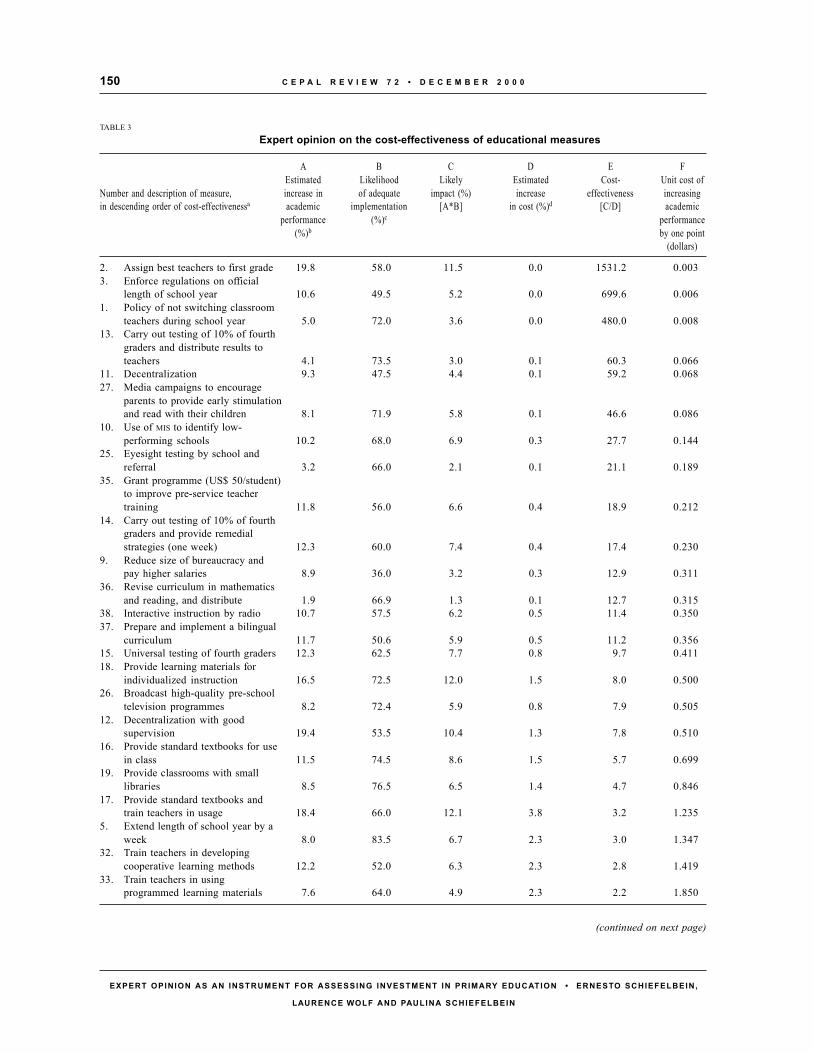
C E P A L R E V I E W 7 2 • D E C E M B E R 2 0 0 0150
EXPERT OPINION AS AN INSTRUMENT FOR ASSESSING INVESTMENT IN PRIMARY EDUCATION • ERNESTO SCHIEFELBEIN,
LAURENCE WOLF AND PAULINA SCHIEFELBEIN
TABLE 3
Expert opinion on the cost-effectiveness of educational measures
A B C D E FEstimated Likelihood Likely Estimated Cost- Unit cost of
Number and description of measure, increase in of adequate impact (%) increase effectiveness increasingin descending order of cost-effectivenessa academic implementation [A*B] in cost (%)d [C/D] academic
performance (%)c performance(%)b by one point
(dollars)
2. Assign best teachers to first grade3. Enforce regulations on official
length of school year1. Policy of not switching classroom
teachers during school year13. Carry out testing of 10% of fourth
graders and distribute results toteachers
11. Decentralization27. Media campaigns to encourage
parents to provide early stimulationand read with their children
10. Use of MIS to identify low-performing schools
25. Eyesight testing by school andreferral
35. Grant programme (US$ 50/student)to improve pre-service teachertraining
14. Carry out testing of 10% of fourthgraders and provide remedialstrategies (one week)
9. Reduce size of bureaucracy andpay higher salaries
36. Revise curriculum in mathematicsand reading, and distribute
38. Interactive instruction by radio37. Prepare and implement a bilingual
curriculum15. Universal testing of fourth graders18. Provide learning materials for
individualized instruction26. Broadcast high-quality pre-school
television programmes12. Decentralization with good
supervision16. Provide standard textbooks for use
in class19. Provide classrooms with small
libraries17. Provide standard textbooks and
train teachers in usage5. Extend length of school year by a
week32. Train teachers in developing
cooperative learning methods33. Train teachers in using
programmed learning materials
19.8 58.0 11.5 0.0 1531.2 0.003
10.6 49.5 5.2 0.0 699.6 0.006
5.0 72.0 3.6 0.0 480.0 0.008
4.1 73.5 3.0 0.1 60.3 0.0669.3 47.5 4.4 0.1 59.2 0.068
8.1 71.9 5.8 0.1 46.6 0.086
10.2 68.0 6.9 0.3 27.7 0.144
3.2 66.0 2.1 0.1 21.1 0.189
11.8 56.0 6.6 0.4 18.9 0.212
12.3 60.0 7.4 0.4 17.4 0.230
8.9 36.0 3.2 0.3 12.9 0.311
1.9 66.9 1.3 0.1 12.7 0.31510.7 57.5 6.2 0.5 11.4 0.350
11.7 50.6 5.9 0.5 11.2 0.35612.3 62.5 7.7 0.8 9.7 0.411
16.5 72.5 12.0 1.5 8.0 0.500
8.2 72.4 5.9 0.8 7.9 0.505
19.4 53.5 10.4 1.3 7.8 0.510
11.5 74.5 8.6 1.5 5.7 0.699
8.5 76.5 6.5 1.4 4.7 0.846
18.4 66.0 12.1 3.8 3.2 1.235
8.0 83.5 6.7 2.3 3.0 1.347
12.2 52.0 6.3 2.3 2.8 1.419
7.6 64.0 4.9 2.3 2.2 1.850
(continued on next page)

151C E P A L R E V I E W 7 2 • D E C E M B E R 2 0 0 0
EXPERT OPINION AS AN INSTRUMENT FOR ASSESSING INVESTMENT IN PRIMARY EDUCATION • ERNESTO SCHIEFELBEIN,
LAURENCE WOLF AND PAULINA SCHIEFELBEIN
For the beneficiary population I (Index) = b*c/d;for the population as a whole both the costs and theeffects fall proportionately, although the index valueremains unchanged (for example, I = b*c*a/d*a).
Table 3 gives the efficiency index values of the 40measures considered, in descending order. However,
there are many possible ways of summarizing theinformation from this table and drawing conclusions,including the percentage increase expected in testscores, the rise in scores in relation to the feasibilityof implementing the measure, and cost-effective-ness.
34. Acquaint teachers with moderncurriculum
40. Multiple interventions: learningpackages, school-basedmanagement, training, testing
29. Development-orientedpre-schooling (50% unit cost ofprimary school)
28. Development-orientedpre-schooling (100% unit cost ofprimary school)
24. Yearly check-up and referral bydoctor
30. Caretaking of pre-schoolers withno educational development
6. Pay teachers in rural schoolssalary increment of 50%
4. Extend daily schedule by one hour7. Raise teachers’ salaries by 10%21. School feeding programmes
(50% receive free snack)8. Raise teachers’ salaries by 20%20. School feeding programmes
(100% receive free snack)31. In-service training for teachers
without follow-up materials23. School feeding programmes
(50% receive free lunch)39. Provide one-hour access to
computers each week22. School feeding programmes
(100% receive free lunch)
Averages
a See box 1 for detailed descriptions of the measures.b Estimated average percentage increase in student achievement in a standardized mathematics and reading test given to sixth graders,
with an initial score of 50 out of 100, compared to a control population that did not benefit from the measure.c Percentage probability of the measure being implemented adequately given the technical and political considerations involved.d Likely increase in annual unit operating costs as a result of the measure, including projected annualized capital cost.
7.0 64.0 4.5 2.3 2.0 2.009
26.8 45.0 12.1 7.0 1.7 2.322
13.0 54.5 7.1 4.2 1.7 2.354
18.3 51.5 9.4 8.3 1.1 3.538
4.1 61.5 2.5 2.4 1.1 3.807
5.7 65.9 3.8 4.2 0.9 4.441
18.6 65.0 12.1 13.5 0.9 4.46717.0 67.0 11.4 15.0 0.8 5.268
6.3 72.5 4.6 9.0 0.5 7.882
5.1 63.0 3.2 6.8 0.5 8.40310.7 74.5 8.0 18.0 0.4 9.032
5.6 74.5 4.2 13.5 0.3 12.943
4.1 63.5 2.6 10.0 0.3 15.364
6.9 59.0 4.1 18.0 0.2 17.686
4.4 51.5 2.3 14.9 0.2 26.337
8.1 67.5 5.5 36.0 0.2 26.337
10.3 62.8 6.5 5.1 76.9 4.1
Table 3 (continued)
A B C D E FEstimated Likelihood Likely Estimated Cost- Unit cost of
Number and description of measure, increase in of adequate impact (%) increase effectiveness increasingin descending order of cost-effectivenessa academic implementation [A*B] in cost (%)d [C/D] academic
performance (%)c performance(%)b by one point
(dollars)
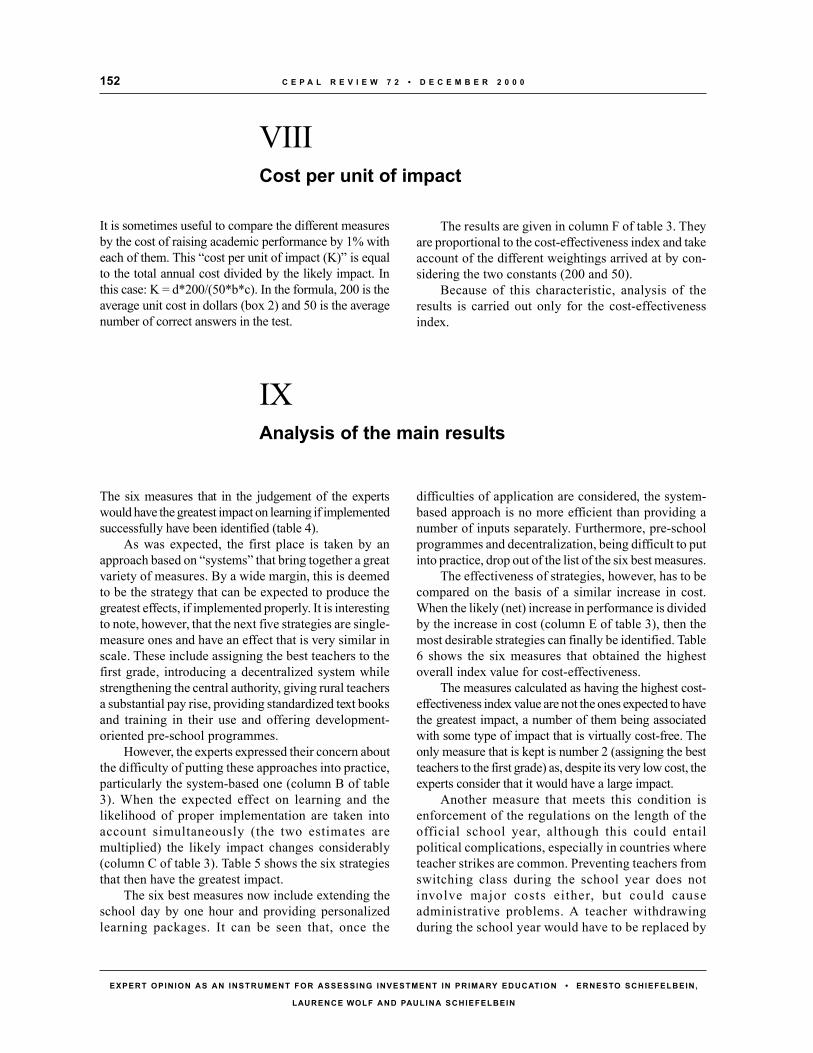
C E P A L R E V I E W 7 2 • D E C E M B E R 2 0 0 0152
EXPERT OPINION AS AN INSTRUMENT FOR ASSESSING INVESTMENT IN PRIMARY EDUCATION • ERNESTO SCHIEFELBEIN,
LAURENCE WOLF AND PAULINA SCHIEFELBEIN
VIIICost per unit of impact
The results are given in column F of table 3. Theyare proportional to the cost-effectiveness index and takeaccount of the different weightings arrived at by con-sidering the two constants (200 and 50).
Because of this characteristic, analysis of theresults is carried out only for the cost-effectivenessindex.
It is sometimes useful to compare the different measuresby the cost of raising academic performance by 1% witheach of them. This “cost per unit of impact (K)” is equalto the total annual cost divided by the likely impact. Inthis case: K = d*200/(50*b*c). In the formula, 200 is theaverage unit cost in dollars (box 2) and 50 is the averagenumber of correct answers in the test.
IXAnalysis of the main results
The six measures that in the judgement of the expertswould have the greatest impact on learning if implementedsuccessfully have been identified (table 4).
As was expected, the first place is taken by anapproach based on “systems” that bring together a greatvariety of measures. By a wide margin, this is deemedto be the strategy that can be expected to produce thegreatest effects, if implemented properly. It is interestingto note, however, that the next five strategies are single-measure ones and have an effect that is very similar inscale. These include assigning the best teachers to thefirst grade, introducing a decentralized system whilestrengthening the central authority, giving rural teachersa substantial pay rise, providing standardized text booksand training in their use and offering development-oriented pre-school programmes.
However, the experts expressed their concern aboutthe difficulty of putting these approaches into practice,particularly the system-based one (column B of table3). When the expected effect on learning and thelikelihood of proper implementation are taken intoaccount simultaneously (the two estimates aremultiplied) the likely impact changes considerably(column C of table 3). Table 5 shows the six strategiesthat then have the greatest impact.
The six best measures now include extending theschool day by one hour and providing personalizedlearning packages. It can be seen that, once the
difficulties of application are considered, the system-based approach is no more efficient than providing anumber of inputs separately. Furthermore, pre-schoolprogrammes and decentralization, being difficult to putinto practice, drop out of the list of the six best measures.
The effectiveness of strategies, however, has to becompared on the basis of a similar increase in cost.When the likely (net) increase in performance is dividedby the increase in cost (column E of table 3), then themost desirable strategies can finally be identified. Table6 shows the six measures that obtained the highestoverall index value for cost-effectiveness.
The measures calculated as having the highest cost-effectiveness index value are not the ones expected to havethe greatest impact, a number of them being associatedwith some type of impact that is virtually cost-free. Theonly measure that is kept is number 2 (assigning the bestteachers to the first grade) as, despite its very low cost, theexperts consider that it would have a large impact.
Another measure that meets this condition isenforcement of the regulations on the length of theofficial school year, although this could entailpolitical complications, especially in countries whereteacher strikes are common. Preventing teachers fromswitching class during the school year does notinvolve major costs either, but could causeadministrative problems. A teacher withdrawingduring the school year would have to be replaced by
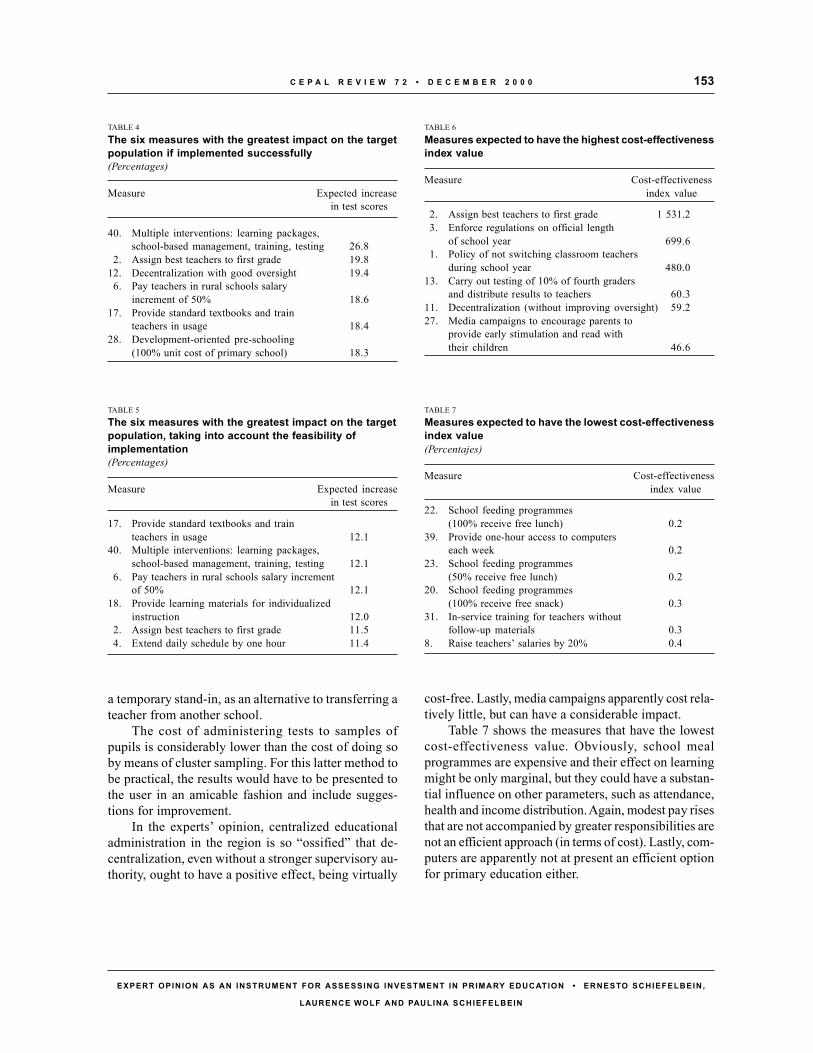
153C E P A L R E V I E W 7 2 • D E C E M B E R 2 0 0 0
EXPERT OPINION AS AN INSTRUMENT FOR ASSESSING INVESTMENT IN PRIMARY EDUCATION • ERNESTO SCHIEFELBEIN,
LAURENCE WOLF AND PAULINA SCHIEFELBEIN
a temporary stand-in, as an alternative to transferring ateacher from another school.
The cost of administering tests to samples ofpupils is considerably lower than the cost of doing soby means of cluster sampling. For this latter method tobe practical, the results would have to be presented tothe user in an amicable fashion and include sugges-tions for improvement.
In the experts’ opinion, centralized educationaladministration in the region is so “ossified” that de-centralization, even without a stronger supervisory au-thority, ought to have a positive effect, being virtually
TABLE 4
The six measures with the greatest impact on the targetpopulation if implemented successfully(Percentages)
Measure Expected increasein test scores
40. Multiple interventions: learning packages,school-based management, training, testing
2. Assign best teachers to first grade12. Decentralization with good oversight
6. Pay teachers in rural schools salaryincrement of 50%
17. Provide standard textbooks and trainteachers in usage
28. Development-oriented pre-schooling(100% unit cost of primary school)
26.819.819.4
18.6
18.4
18.3
TABLE 5The six measures with the greatest impact on the targetpopulation, taking into account the feasibility ofimplementation(Percentages)
Measure Expected increasein test scores
17. Provide standard textbooks and trainteachers in usage 12.1
40. Multiple interventions: learning packages,school-based management, training, testing 12.1
6. Pay teachers in rural schools salary incrementof 50% 12.1
18. Provide learning materials for individualizedinstruction 12.0
2. Assign best teachers to first grade 11.54. Extend daily schedule by one hour 11.4
TABLE 6
Measures expected to have the highest cost-effectivenessindex value
Measure Cost-effectivenessindex value
2. Assign best teachers to first grade 1 531.23. Enforce regulations on official length
of school year 699.61. Policy of not switching classroom teachers
during school year 480.013. Carry out testing of 10% of fourth graders
and distribute results to teachers 60.311. Decentralization (without improving oversight) 59.227. Media campaigns to encourage parents to
provide early stimulation and read withtheir children 46.6
cost-free. Lastly, media campaigns apparently cost rela-tively little, but can have a considerable impact.
Table 7 shows the measures that have the lowestcost-effectiveness value. Obviously, school mealprogrammes are expensive and their effect on learningmight be only marginal, but they could have a substan-tial influence on other parameters, such as attendance,health and income distribution. Again, modest pay risesthat are not accompanied by greater responsibilities arenot an efficient approach (in terms of cost). Lastly, com-puters are apparently not at present an efficient optionfor primary education either.
TABLE 7Measures expected to have the lowest cost-effectivenessindex value(Percentajes)
Measure Cost-effectivenessindex value
22. School feeding programmes(100% receive free lunch) 0.2
39. Provide one-hour access to computerseach week 0.2
23. School feeding programmes(50% receive free lunch) 0.2
20. School feeding programmes(100% receive free snack) 0.3
31. In-service training for teachers withoutfollow-up materials 0.3
8. Raise teachers’ salaries by 20% 0.4

C E P A L R E V I E W 7 2 • D E C E M B E R 2 0 0 0154
EXPERT OPINION AS AN INSTRUMENT FOR ASSESSING INVESTMENT IN PRIMARY EDUCATION • ERNESTO SCHIEFELBEIN,
LAURENCE WOLF AND PAULINA SCHIEFELBEIN
XComparison of these results withthe estimates of Latin American planners
As regards cost-effectiveness calculations, the valuesobtained by the planners and the experts are of the sameorder (when compared using the cost estimates in theannex), although there are some differences. The plannersattribute appreciably greater cost-effectiveness than do theexperts (more than double) to decentralization (No. 11),prevention of class switching by teachers (No. 1),improvements in pre-service teacher training (No. 35),curricular changes (no. 36), pre-school programmes(Nos. 29 and 30), traditional in-service training initiatives(No. 31) and computer use (No. 39). The experts,meanwhile, attribute greater cost-effectiveness only tothose measures that involve slimming down bureaucracy(No. 9), television programmes for pre-school childrenand media campaigns (Nos. 26 and 27), lengthening theschool day and year (No. 4 and no. 5), a salary incrementfor rural teachers (No. 6) and higher pay for teachers(Nos. 7 and 8).
When the estimates of the panel of experts are comparedwith those of the planners and advisers in LatinAmerican ministries of education who attended theplanning courses run by UNESCO in 1994 and 1996, it isfound that the latter are more optimistic than the expertsabout the impact the measures could have (on average,19% as against 10%). It is possible that the plannersare not sufficiently familiar with the literature dealingwith the effectiveness of measures, which tends to bevery conservative (Schiefelbein, Wolff andSchiefelbein, 1998). Again, when it came to opinionsabout the likelihood of successful implementation,exactly the opposite occurred (48% as against 63%).In particular, the planners inclined less towards actionrequiring higher financing, and their figure for theincrease in unit cost produced by each measure was14% on average, almost three times the percentagearrived at by the authors (5%).
XIConclusions of the cost-effectivenessestimates for the 40 strategies
The cost-effectiveness index is a tool designed to “makethinking explicit”, and the coefficients analysed have thelimitations (and strengths) of the experts who submittedtheir estimates. Its main value lies in the help it offers informulating important questions about the componentsincluded in the projects under consideration. It comes ata very good time for Latin America, given the growingconsensus regarding the fundamental role played byeducation in economic and social success, the interestof the region’s presidents as expressed in an agreementsigned at the Heads of State Summit in 1998, the largeincrease in educational investment made by governmentsand international organizations in the 1990s and the lowimpact levels revealed by the reports of OECD (2000) andUNESCO (2000).
The need to decide on strategies in the sphere ofeducation concerns not just those working in this fieldbut also political and business leaders. Perhaps thesimple instrument devised may help those who have totake decisions to distinguish between strategies that“might possibly be expected to work” and those that“are unlikely to do so” and aid in building a strongersocial consensus over the need to invest efficiently inthe education sector.
The exercise carried out is also an excellent trainingmethod for policy makers and planners, as it forces themto make their thinking explicit. The best way of goingabout this is to set up small groups that work witharound five measures. The idea is to work as a teamand submit the conclusions to a plenary session. This
155C E P A L R E V I E W 7 2 • D E C E M B E R 2 0 0 0
EXPERT OPINION AS AN INSTRUMENT FOR ASSESSING INVESTMENT IN PRIMARY EDUCATION • ERNESTO SCHIEFELBEIN,
LAURENCE WOLF AND PAULINA SCHIEFELBEIN
reduces inconsistencies, ambiguities and contradictionsover the cost-effectiveness of the project or strategy.
Generally speaking, many of the programmes andprojects implemented in Latin America do not accordwith the recommendations derived from this exercise.In particular, simple, low-cost approaches such asteacher assignment and continuity and mediacampaigns are not usually included in projects.Unfortunately, when empirical information is obtained,very few measures can show substantial improvementsin the level of learning.
The above is particularly true of measures that arecurrently in vogue, such as decentralization, testing andcomputer use. Mistakes are costly, and at a time when
education is being proclaimed as a key factor ineconomic and social development, and a great deal ofinvestment is being put into it in the region and aroundthe world, it is indispensable for the impact of thedifferent measures to be re-examined.
The fact that no more than 10 experts participated,even though these were unquestionably of the highestlevel, may reduce the reliability of the results: if just oneof them expressed an exceptional view, the effect on theoverall average would be significant. The authors haveidentified other experts and recommend that, at a laterdate, new surveys be conducted with the participation of20 to 25 experts. Similar exercises can be carried out forintermediate and higher education.
XIIRecommendations derivingfrom examination of the results
The exercise suggests four recommendations for poli-cies associated with educational measures:
i) Implement those measures that have a “largeimpact on performance”, particularly thoseinvolving multiple initiatives, teaching materialsand differential support for rural education, wherethe cost is moderate. These measures should beimplemented because of the considerable effectthey can be expected to have, in spite of the cost.Caution is needed, however, in regard to potentialproblems with developing and applying them.
ii) Implement measures that cost very little and havea positive impact. These are the ones that aregenerally overlooked (for example, regulating thelength of the school year or assigning good teachersto the first grade).
iii) Avoid measures that entail a high cost and that donot in themselves (in the absence of supplementaryactivities or objectives) produce a major impact,i.e. do not constitute a good investment. Thisapplies particularly to pay rises, computer use andschool feeding programmes.
iv) Compare the projects put forward for improving thecountry’s education with the estimates of the panelof experts and account for the differences. At the least,
having available a range of strategies on which theexperts have given their views makes it possible toarrive at a detailed explanation of these differences.
When questions are formulated in future, it wouldbe advisable for the expected costs and effects to bemade explicit, with a view to giving greater transpar-ency to the thinking of those proposing the strategiesin relation to more debatable aspects which may or maynot work in certain circumstances. Exercises of this typecan give education policy planners timely warning ofthe relative value of the strategies they have adopted,enabling them to reassess their assumptions. Calculat-ing the cost of measures is very useful in itself, as thisis something that is not generally done in a systematicway. Thus, these estimates can be used for evaluationpurposes, or at least to provide a reference figure, witha view to calculating how much the components of theseprojects would cost in different countries.
Latin America now has a great opportunity to carryout applied research, as all the countries in the regionare conducting assessments on a national scale, whetherby means of pupil samples or clusters, and will now bein a position to use this research as an instrument tohelp them identify which strategies produce the bestlearning outcomes.
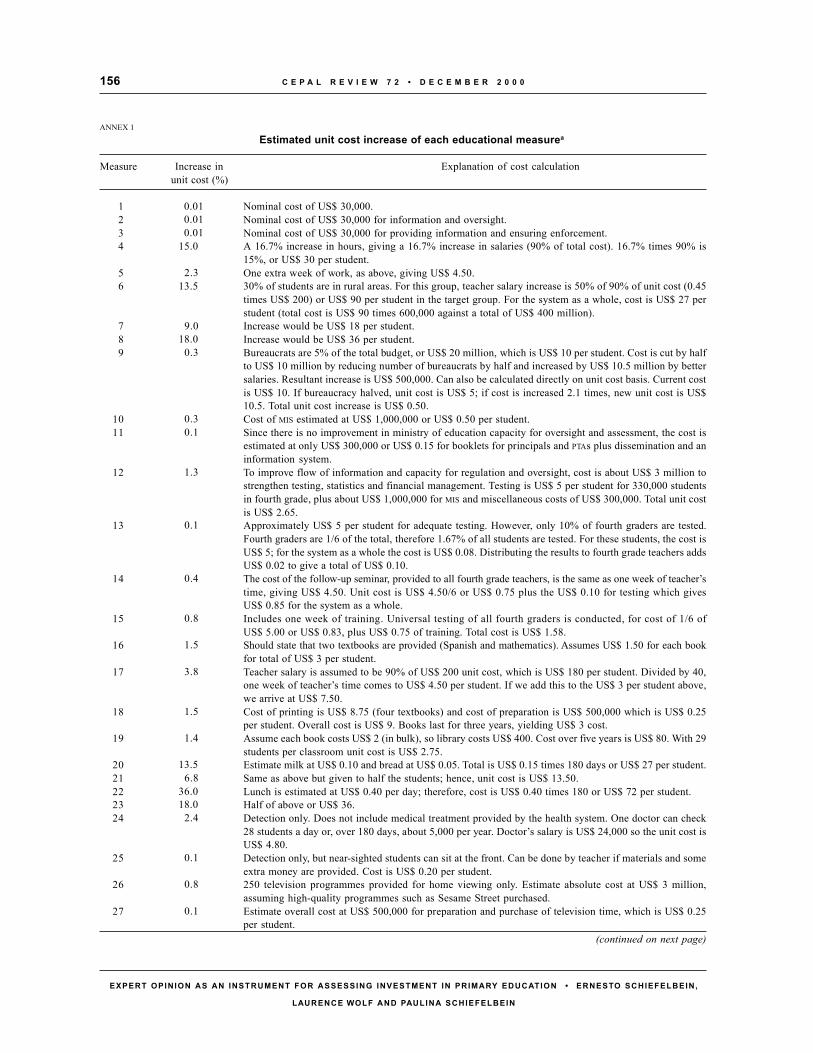
C E P A L R E V I E W 7 2 • D E C E M B E R 2 0 0 0156
EXPERT OPINION AS AN INSTRUMENT FOR ASSESSING INVESTMENT IN PRIMARY EDUCATION • ERNESTO SCHIEFELBEIN,
LAURENCE WOLF AND PAULINA SCHIEFELBEIN
ANNEX 1
Estimated unit cost increase of each educational measurea
Measure Increase in Explanation of cost calculationunit cost (%)
1 Nominal cost of US$ 30,000.2 Nominal cost of US$ 30,000 for information and oversight.3 Nominal cost of US$ 30,000 for providing information and ensuring enforcement.4 A 16.7% increase in hours, giving a 16.7% increase in salaries (90% of total cost). 16.7% times 90% is
15%, or US$ 30 per student.5 One extra week of work, as above, giving US$ 4.50.6 30% of students are in rural areas. For this group, teacher salary increase is 50% of 90% of unit cost (0.45
times US$ 200) or US$ 90 per student in the target group. For the system as a whole, cost is US$ 27 perstudent (total cost is US$ 90 times 600,000 against a total of US$ 400 million).
7 Increase would be US$ 18 per student.8 Increase would be US$ 36 per student.9 Bureaucrats are 5% of the total budget, or US$ 20 million, which is US$ 10 per student. Cost is cut by half
to US$ 10 million by reducing number of bureaucrats by half and increased by US$ 10.5 million by bettersalaries. Resultant increase is US$ 500,000. Can also be calculated directly on unit cost basis. Current costis US$ 10. If bureaucracy halved, unit cost is US$ 5; if cost is increased 2.1 times, new unit cost is US$10.5. Total unit cost increase is US$ 0.50.
10 Cost of MIS estimated at US$ 1,000,000 or US$ 0.50 per student.11 Since there is no improvement in ministry of education capacity for oversight and assessment, the cost is
estimated at only US$ 300,000 or US$ 0.15 for booklets for principals and PTAs plus dissemination and aninformation system.
12 To improve flow of information and capacity for regulation and oversight, cost is about US$ 3 million tostrengthen testing, statistics and financial management. Testing is US$ 5 per student for 330,000 studentsin fourth grade, plus about US$ 1,000,000 for MIS and miscellaneous costs of US$ 300,000. Total unit costis US$ 2.65.
13 Approximately US$ 5 per student for adequate testing. However, only 10% of fourth graders are tested.Fourth graders are 1/6 of the total, therefore 1.67% of all students are tested. For these students, the cost isUS$ 5; for the system as a whole the cost is US$ 0.08. Distributing the results to fourth grade teachers addsUS$ 0.02 to give a total of US$ 0.10.
14 The cost of the follow-up seminar, provided to all fourth grade teachers, is the same as one week of teacher’stime, giving US$ 4.50. Unit cost is US$ 4.50/6 or US$ 0.75 plus the US$ 0.10 for testing which givesUS$ 0.85 for the system as a whole.
15 Includes one week of training. Universal testing of all fourth graders is conducted, for cost of 1/6 ofUS$ 5.00 or US$ 0.83, plus US$ 0.75 of training. Total cost is US$ 1.58.
16 Should state that two textbooks are provided (Spanish and mathematics). Assumes US$ 1.50 for each bookfor total of US$ 3 per student.
17 Teacher salary is assumed to be 90% of US$ 200 unit cost, which is US$ 180 per student. Divided by 40,one week of teacher’s time comes to US$ 4.50 per student. If we add this to the US$ 3 per student above,we arrive at US$ 7.50.
18 Cost of printing is US$ 8.75 (four textbooks) and cost of preparation is US$ 500,000 which is US$ 0.25per student. Overall cost is US$ 9. Books last for three years, yielding US$ 3 cost.
19 Assume each book costs US$ 2 (in bulk), so library costs US$ 400. Cost over five years is US$ 80. With 29students per classroom unit cost is US$ 2.75.
20 Estimate milk at US$ 0.10 and bread at US$ 0.05. Total is US$ 0.15 times 180 days or US$ 27 per student.21 Same as above but given to half the students; hence, unit cost is US$ 13.50.22 Lunch is estimated at US$ 0.40 per day; therefore, cost is US$ 0.40 times 180 or US$ 72 per student.23 Half of above or US$ 36.24 Detection only. Does not include medical treatment provided by the health system. One doctor can check
28 students a day or, over 180 days, about 5,000 per year. Doctor’s salary is US$ 24,000 so the unit cost isUS$ 4.80.
25 Detection only, but near-sighted students can sit at the front. Can be done by teacher if materials and someextra money are provided. Cost is US$ 0.20 per student.
26 250 television programmes provided for home viewing only. Estimate absolute cost at US$ 3 million,assuming high-quality programmes such as Sesame Street purchased.
27 Estimate overall cost at US$ 500,000 for preparation and purchase of television time, which is US$ 0.25per student.
0.010.010.01
15.0
2.313.5
9.018.0
0.3
0.30.1
1.3
0.1
0.4
0.8
1.5
3.8
1.5
1.4
13.56.8
36.018.0
2.4
0.1
0.8
0.1
(continued on next page)

157C E P A L R E V I E W 7 2 • D E C E M B E R 2 0 0 0
EXPERT OPINION AS AN INSTRUMENT FOR ASSESSING INVESTMENT IN PRIMARY EDUCATION • ERNESTO SCHIEFELBEIN,
LAURENCE WOLF AND PAULINA SCHIEFELBEIN
28 Cost is US$ 200 for 50% of students pro-rated over 6 years which comes to US$ 33.33 for the target groupand US$ 16.67 per student for the system as a whole.
29 Half the cost. Results in US$ 16.67 for the target group and US$ 8.34 per student for the system.30 Provided to 50% of students. Cost is same as above.31 Four full weeks of teacher upgrading is estimated at four times US$ 4.50 which comes to US$ 18. Adding
cost of course preparation, material and travel gives approximately US$ 20.32 Training for one week is estimated at US$ 4.50 as above.33 Same as above.34 Same as above.35 Grant programme is estimated at US$ 200 per graduate teacher (US$ 50 x 4) who will teach for 10 years,
so the cost is US$ 20 per year per teacher. Since there are 29 students per teacher, the annual cost is 20/29or US$ 0.70. (Another way of looking at this is that each year 7,000 new teachers are trained to replace10% of teaching force of 70,000. 7,000 new teachers times US$ 200 gives US$ 1,400,000 or a US$ 0.70unit cost).
36 Not based on detailed research but rather on contracting local experts and distributing curriculum guide.Cost estimated at US$ 400,000, mainly for local experts and a very small amount for distributing curricu-lum guide (US$ 1 per guide, 70,000 copies).
37 Bilingual curriculum has a low fixed cost of about US$ 100,000 to contract bilingual teachers. This isUS$ 0.50 per student reached (10% of students). Books have to be provided and teachers trained for atleast one week per year. Therefore, the variable cost for 10% of the population is US$ 4.50 for one weekof training plus three books at US$ 2 each totalling US$ 6; total is about US$ 10.55 for indigenousstudents. Cost to the entire system is 10% or US$ 1.05.
38 US$ 500,000 for preparation which is US$ 0.25 per student, without using foreign technical assistance(case of Venezuela). Cost of radio (US$ 29 per set per class) is about US$ 1 per student but it lasts threeyears so it is US$ 0.33. Materials are about US$ 0.50. Total unit cost is US$ 1.08.
39 US$ 2,000 for the computer plus US$ 100 for other physical modifications. Computer lasts four years;therefore, computer cost is US$ 525 a year. Computer serves 30 students at one hour per week (30 hoursper week) or US$ 16.50 per student. Add a full-time teacher working 27 hours per week (once in the weeka class works with two teachers for one period). Teacher cost comes to 1/27 of 90% of unit cost, orUS$ 6.67. Maintenance for computer is US$ 200 per year or another US$ 6.67 per student. Total isUS$ 29.84 per student. Cost could be reduced significantly if outdated computers were purchased forUS$ 1,000, which would also reduce security and maintenance costs by half. Another option is to hire atechnician rather than a teacher at 2/3 cost. Total cost could be reduced to US$ 8.25 plus US$ 5 plusUS$ 3.33 or US$ 16.58; this, however, may not be feasible.
40 Cost is based on above calculations as follows: textbooks US$ 3; self-help learning materials US$ 3; oneweek’s training US$ 4.50; local school management US$ 2.65; evaluation system US$ 0.85. Total cost isUS$ 14.
8.3
4.24.2
10.0
2.32.32.30.4
0.1
0.5
0.5
14.9
7.0
ANNEX 1 (continued)
Measure Increase in Explanation of cost calculationunit cost (%)
C E P A L R E V I E W 7 2 • D E C E M B E R 2 0 0 0158
EXPERT OPINION AS AN INSTRUMENT FOR ASSESSING INVESTMENT IN PRIMARY EDUCATION • ERNESTO SCHIEFELBEIN,
LAURENCE WOLF AND PAULINA SCHIEFELBEIN
Bibliography
Araujo Oliveira, J.B. (1998): A Pedagogia du Sucesso, Bra-zil, Belo Horizonte.
Carnoy, M. and C. de Moura Castro (1997): La reformaeducativa en América Latina: Actas de un seminario,Washington, D.C., Inter-American Development Bank(IDB).
Castillo, M. (1998): La descentralización de los servicios deeducación en Nicaragua, serie Reformas de políticapública, No. 53, Santiago, Chile, Economic Commis-sion for Latin America and the Caribbean (ECLAC).
Chrispeels, J. (1997): Educational policy implementation ina shifting political climate: The California experience,American Education Research Journal, vol. 34, No. 3.
El Salvador, Ministry of Education (1996): Los educadoresy la comunidad, San Salvador.
Fuller B. and P. Clarke (1994): Raising schools effects whileignoring culture?, Review of Economic Research, vol. 64,No. 1.
Gutman, C. (1993): Todos los niños pueden aprender. ElPrograma de las 900 Escuelas para los sectores pobresde Chile, Paris, United Nations Educational, Scientificand Cultural Organization (UNESCO).
Harbison, R. and E. Hanushek (1992): Educational Perfor-mance of the Poor: Lessons from Rural Northeast Bra-zil, New York, World Bank.
Hornik, R., H. Ingle, M. Macanany and W. Schramm (1973):Television and Educational Reform in El Salvador,Stanford, California, Stanford University.
Jamison, D., B. Searle, S. Heyneman and K. Galda. (1981):Improving Elementary Mathematics Education in Nica-ragua: An Experimental Study of the Impact of Text-books and Radio on Achievement, Working document,No. 5, Washington, D.C., World Bank.
Lockheed, M. and A. Verspoor (1991): Improving PrimaryEducation in Developing Countries, New York, WorldBank.
Meza, D. (1997): Descentralización educativa, organizacióny manejo de las escuelas a nivel local: El caso de ElSalvador, LAC report, No. 9, Washington, D.C., WorldBank/Programme for Education with Community Par-ticipation.
McEwan, P. (1995): Primary School Reform for Rural De-velopment: An Evaluation of Colombian New Schools,Washington, D.C., World Bank.
OECD (Organisation for Economic Co-operation and Devel-opment) (2000): Literacy in the Information Age: Finalreport of the International Adult survey, Canada, Sta-tistic Canada.
Psacharopulos, G., C. Rojas and E. Vélez (1995):Achievement evaluation of Colombia’s Escuela Nueva:Is multigrade the answer?, Comparative EducationReview, vol. 37, No. 3.
Reimers, F. and N. McGinn (1997): Informed Dialogue.Using Research to Shape Education Policy around theWorld, Westport, Connecticut, Praeger.
Rojas, C. and Z. Castillo (1998): Evaluación del ProgramaEscuela Nueva en Colombia, Bogotá, Instituto SER deInvestigación.
Rojas, C. and M. Esquivel (1998): Assessment Programs inLatin America, Working document, Washington, D.C.,World Bank.
Schiefelbein, E. (coord.) (1998): Educación en las Américas:calidad y equidad en el proceso de globalización, Wash-ington, D.C., Organization of American States (OAS).
Schiefelbein, E., L. Wolff and P. Schiefelbein (1998): Cost-Effectiveness of Education Policies in Latin America: ASurvey of Expert Opinion, Washington, D.C., IDB.
Swope, J. and M. Latorre (1998): Fe y Alegría Schools inLatin America. Educational Communities where thePavements Ends, Santiago, Chile, LOM Ediciones.
UNESCO (1998): Primer estudio internacional comparativo,Santiago, Chile, Laboratorio Latinoamericano deEvaluación de la Calidad de la Educación.
(2000): Alfabetismo funcional en siete países deAmérica Latina, Santiago, Chile.
Verspoor, A. (1989): Pathways to Change: Improving theQuality of Education in Developing Countries, Workingdocument, Washington, D.C., World Bank.
Wolff, L., E. Schiefelbein and J. Valenzuela (1994): Improv-ing the Quality of Primary Education in Latin Americaand the Caribbean, Washington, D.C., World Bank.
World Bank (1994): Priorities and Strategies for Education,Washington, D.C.

159C E P A L R E V I E W 7 2 • D E C E M B E R 2 0 0 0
WHAT SCHOOLS TEACH US ABOUT EDUCATING POOR CHILDREN IN CHILE • BEVERLEY A. CARLSON
C E P A L R E V I E W 7 2
DECEMBER 2000
What schools teach usabout educating
poor childrenin Chile
Beverley A. Carlson
Social Affairs Officer,Division of Production,Productivity and Management,Economic Commissionfor Latin Americaand the Caribbean (ECLAC)[email protected]
A great deal of effort has been put into education reform inLatin America since the early 1990s. Extending the coverageof educational opportunities and improving the quality of theeducation delivered in schools are crucial for the countries ofthe region, where education in State schools has often beenof a low standard. It is not enough just to study macroeducation policies as they are formulated by governments andimplemented by centralized ministries of education. What ispromised or envisioned on paper is often quite different fromwhat actually happens in school establishments. It is importantto understand, at the micro level, how schools are functioningin practice as they implement educational policies. Educationalpolicies and social reality come together in school classroomsand schools can teach us a great deal about achieving qualityin basic education. The focus of this article is on poor childrenin poor schools and the continuing challenges of educatingchildren in poor communities. Chile’s national programmeto improve the quality of education and educational outcomesin 900 of its poorer primary schools, known as the P900programme, provided an ideal framework for identifying andstudying the challenges faced by schools in poor communitiesin trying to deliver a high-quality education to their childrenand for understanding how and why they are struggling tomeet national standards. This study is concerned with learningfrom schools to achieve a better understanding of what theysee, in the context of their community and the studentpopulation they serve, as the practical realities of educatingpoor children. At the national level, a macro researchmethodology was used to identify the worst-performingschools in the P900 programme on the basis of their resultsin standardized examinations and the trends seen in theseresults over the 1990s. A small purposive sample of the worst-performing schools was drawn from this group and quotasampling techniques were used to ascertain their maincharacteristics. A micro study of each of the schools selectedwas then carried out, involving school visits and interviewsto understand school and pupil performance and to identifycritical factors that might be amenable to change. In-depthreports were prepared on each school. This article synthesizesthe lessons learned from these micro studies.

C E P A L R E V I E W 7 2 • D E C E M B E R 2 0 0 0160
WHAT SCHOOLS TEACH US ABOUT EDUCATING POOR CHILDREN IN CHILE • BEVERLEY A. CARLSON
IEvaluating education quality:macro to micro
achievements is in schools and their individual studentoutcomes: the micro perspective.
The focus of this article is on poor children in poorschools, the continuing challenge of educating childrenin poor communities, and what this can teach us aboutachieving quality in basic education.4 Because theschool is the bottom rung on a bureaucratic ladder ofimportant education delivery actors, it is necessary firstto understand the unusual structure of basic educationin Chile and the reasons behind it. The Chileaneducation system is a mixed public-private one. Thereare three types of primary school: municipal schoolswhich receive central government funding (called asubvention) and are administered by municipalities,private schools which receive the same centralgovernment subvention and are privately run, andprivately financed, privately managed schools. Thistripartite arrangement is the legacy of a school reformin the early 1980s that transferred school managementaway from central government authorities and made ita local municipal or private responsibility. It is also aresult of government policy at the time, which aimedto create incentives for the private sector to provideeducational facilities and introduce competition into thesystem. Effectively, about 8% of primary schools arefully private, i.e. in the third category. Just over a quarterof school establishments are in the mixed category ofprivate schools that receive the central governmentsubvention, and the remaining two thirds are municipal.
Education policies and social reality come togetherin the classroom in schools across the country. In evalu-ating educational quality, it is not sensible or fair tocompare student and school performance solely on thebasis of standardized test results. Students enter schoolwith “quality” differences that result from a multiplic-ity of factors ranging from brain development, whichis enormously affected by early childhood nutrition andcare, to positive home learning environments and so-cial interaction. These factors limit what schools alonecan achieve in purely numerical terms, especially when
This article synthesizes and amplifies the findings of a macro-micro study entitled Achieving educational quality: What schoolsteach us published by ECLAC in January 2000. The author wouldlike to express her gratitude to the Chilean Ministry of Educationand its P900 schools programme, provincial and municipalauthorities and, especially, each of the schools in the study thatshared their time, energy and knowledge. These schools are thecentre of this work. The author would like to thank Jorge Katz forhis valuable comments on the draft version of this article, Joe Ramosfor his advice on project design and comments on an earlier version,Pilar Bascuñán, Elizabeth Love and Howard La Franchi for theirexpertise and help with school interviews and reporting and theschool principals, teachers, children and parents who gave theirtime and their insights into the continuing challenges of educatingchildren in poor communities.1 See Gajardo (2000), World Bank (1999), PREAL (1998) and Rojasand Esquivel (1998).2 See García-Huidobro (1999), García-Huidobro and Jara (1994),Schiefelbein and Schiefelbein (1999), Cox (1997) and Carnoy andMcEwan (1997).3 In Chile, compulsory basic (primary) education lasts for eightyears.
A great deal of effort has been put into education reformin Latin America since the early 1990s.1 In Chile, amajor emphasis of reform is on improving the qualityand equity of education in the public sector.2 Thecountry is striving to improve education throughinitiatives in four main areas: reforming the curriculum,strengthening university teacher training programmes,extending basic education3 from half-day shifts to full-day schooling and improving quality. These initiativesbegan in the early 1990s but the undertaking is aconsiderable one and the impact of the reforms, to theextent they are successful, will necessarily take time tocome through.
Educational reform and national education policiesdo not automatically translate into better education inschools. Reforms –to the macro, legal and financialframework– are an important starting point. Turningreforms into policies, programmes, delivery and actionsaffecting students in schools, though, is a greatchallenge involving many actors and variables. Reformsare statements of intent. Consequently, it is not enoughjust to evaluate stated reforms. The place to look for
4 See Carlson (2000).
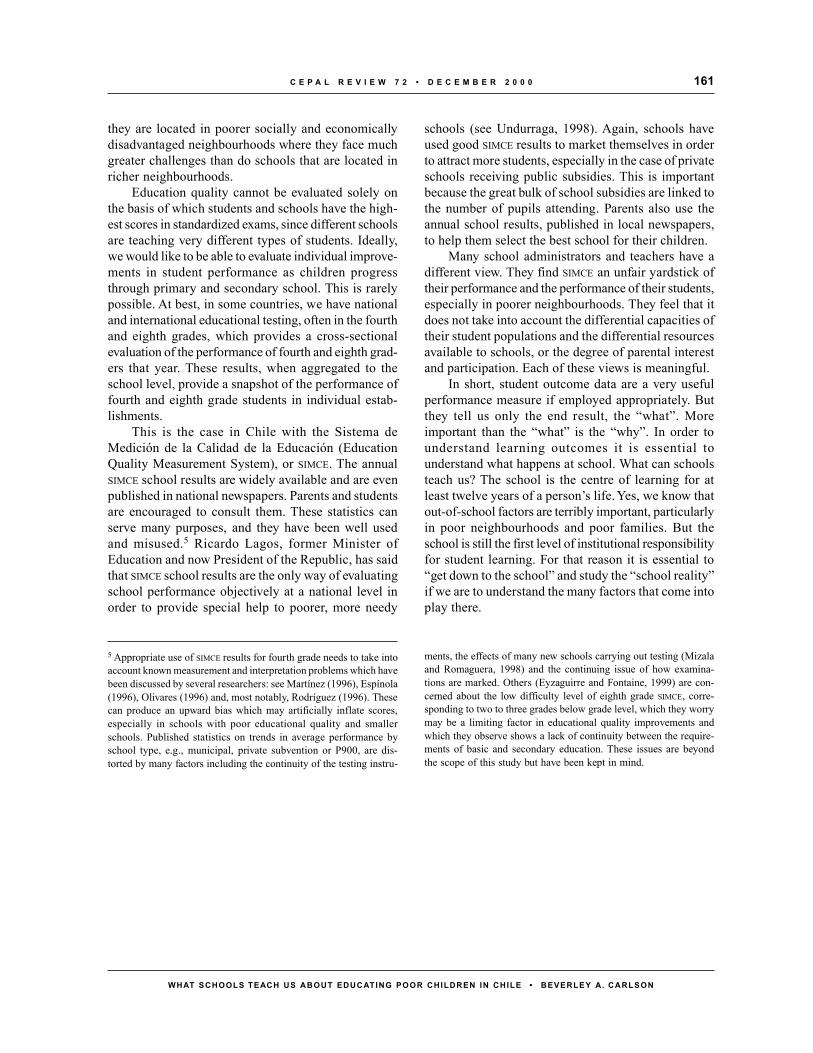
161C E P A L R E V I E W 7 2 • D E C E M B E R 2 0 0 0
WHAT SCHOOLS TEACH US ABOUT EDUCATING POOR CHILDREN IN CHILE • BEVERLEY A. CARLSON
they are located in poorer socially and economicallydisadvantaged neighbourhoods where they face muchgreater challenges than do schools that are located inricher neighbourhoods.
Education quality cannot be evaluated solely onthe basis of which students and schools have the high-est scores in standardized exams, since different schoolsare teaching very different types of students. Ideally,we would like to be able to evaluate individual improve-ments in student performance as children progressthrough primary and secondary school. This is rarelypossible. At best, in some countries, we have nationaland international educational testing, often in the fourthand eighth grades, which provides a cross-sectionalevaluation of the performance of fourth and eighth grad-ers that year. These results, when aggregated to theschool level, provide a snapshot of the performance offourth and eighth grade students in individual estab-lishments.
This is the case in Chile with the Sistema deMedición de la Calidad de la Educación (EducationQuality Measurement System), or SIMCE. The annualSIMCE school results are widely available and are evenpublished in national newspapers. Parents and studentsare encouraged to consult them. These statistics canserve many purposes, and they have been well usedand misused.5 Ricardo Lagos, former Minister ofEducation and now President of the Republic, has saidthat SIMCE school results are the only way of evaluatingschool performance objectively at a national level inorder to provide special help to poorer, more needy
schools (see Undurraga, 1998). Again, schools haveused good SIMCE results to market themselves in orderto attract more students, especially in the case of privateschools receiving public subsidies. This is importantbecause the great bulk of school subsidies are linked tothe number of pupils attending. Parents also use theannual school results, published in local newspapers,to help them select the best school for their children.
Many school administrators and teachers have adifferent view. They find SIMCE an unfair yardstick oftheir performance and the performance of their students,especially in poorer neighbourhoods. They feel that itdoes not take into account the differential capacities oftheir student populations and the differential resourcesavailable to schools, or the degree of parental interestand participation. Each of these views is meaningful.
In short, student outcome data are a very usefulperformance measure if employed appropriately. Butthey tell us only the end result, the “what”. Moreimportant than the “what” is the “why”. In order tounderstand learning outcomes it is essential tounderstand what happens at school. What can schoolsteach us? The school is the centre of learning for atleast twelve years of a person’s life. Yes, we know thatout-of-school factors are terribly important, particularlyin poor neighbourhoods and poor families. But theschool is still the first level of institutional responsibilityfor student learning. For that reason it is essential to“get down to the school” and study the “school reality”if we are to understand the many factors that come intoplay there.
5 Appropriate use of SIMCE results for fourth grade needs to take intoaccount known measurement and interpretation problems which havebeen discussed by several researchers: see Martínez (1996), Espínola(1996), Olivares (1996) and, most notably, Rodríguez (1996). Thesecan produce an upward bias which may artificially inflate scores,especially in schools with poor educational quality and smallerschools. Published statistics on trends in average performance byschool type, e.g., municipal, private subvention or P900, are dis-torted by many factors including the continuity of the testing instru-
ments, the effects of many new schools carrying out testing (Mizalaand Romaguera, 1998) and the continuing issue of how examina-tions are marked. Others (Eyzaguirre and Fontaine, 1999) are con-cerned about the low difficulty level of eighth grade SIMCE, corre-sponding to two to three grades below grade level, which they worrymay be a limiting factor in educational quality improvements andwhich they observe shows a lack of continuity between the require-ments of basic and secondary education. These issues are beyondthe scope of this study but have been kept in mind.

C E P A L R E V I E W 7 2 • D E C E M B E R 2 0 0 0162
WHAT SCHOOLS TEACH US ABOUT EDUCATING POOR CHILDREN IN CHILE • BEVERLEY A. CARLSON
IIEducational performance in poor schools
for one or more years. Out of this large number ofschools, a core group of 308 schools that had partici-pated in P900 for five years or more and had still notgraduated from the programme was identified, and fromthose the 100 currently worst-performing schools wereselected. A small purposive sample of poorly perform-ing schools was then drawn from this last group usingquota sampling techniques to reflect the main charac-teristics of these schools with respect to the major do-mains of interest, i.e. urban and rural schools, small,medium-sized and large schools, poorer and better offschools, schools in different geographical regions, andmunicipal and private schools receiving public support(see section III).
The study uses fourth grade SIMCE scores for 1990-1996 with follow-up on eighth grade SIMCE performancethrough to 1997. In 1996, curriculum changes began tobe introduced in grades 1 to 4, followed by curriculumchanges in grades 5 to 8 in later years. The testing systemwas changed accordingly. Therefore, the 1990-1996SIMCE results were the last “comparable” cohort forgrades 1 to 4 (and the 1991-1997 SIMCE results were thelast comparable ones for grades 5 to 8). The availabilityof comparable results over this many years made itpossible to track performance and investigate reasonsfor changes or lack of improvement over an extendedperiod. Average 1990-1996 SIMCE scores for fourth grademathematics and Spanish are shown in figure 1 andillustrate the performance patterns of different schooltypes.
The theoretical maximum score in SIMCE tests is100. During the period under study the averageperformance of fourth grade students in subsidizedschools,7 both municipal and private, increased by 11SIMCE points to reach a high of 70 in 1996. There was asimilar improvement of 12 SIMCE points among P900schools. This suggests a broad-based improvement ineducational performance if, in fact, the SIMCE
The Chilean education authorities provided an oppor-tunity to examine educational performance in relationto the national programme for improving the qualityof educational outcomes in 900 of Chile’s poorer pri-mary schools, known as the P900 Programme.6 Theeducation authorities were interested in finding out whysome schools did not improve despite having had yearsof special inputs and attention from this programme,and wanted help in doing so in order to take correctiveaction. Initially, ECLAC had proposed just the reverse:to investigate why some schools excelled in spite ofcommon difficulties and to disseminate “lessonslearned”. In any event, similar issues arise whether oneis trying to measure why some schools and studentsexcel or why some schools and students do not mea-sure up to expectations. Both approaches need to com-bine an assessment of quantitative results with qualita-tive research that can explain these results.
It was decided to concentrate on the school as thecentre of learning and decision-making and to studywhat happens in schools at first hand. Schools are whereeducational policies and programmes are implementedand put to the test within the context of the many factorsthat play a role in achieving educational quality. Theschool is the “front line” where school authorities firstconfront the situation of children and their preparednessfor learning. It is where the intangibles become tangible.Consequently, the key feature of this study is theknowledge gained from within school establishments,since the school is where policy and practice are playedout.
The research was carried out during the 1998school year, which in Chile is March to December. Weproposed a two-pronged methodology that in generalterms used both quantitative and qualitative methods.It was essential that unbiased quantitative methods beused to identify the so-called “worst P900 schools” andtrack their performance over time on the basis of theirSIMCE results since 1990, when P900 began. Over 2,100municipal and private primary schools in receipt of thegovernment subvention had participated in the P900
6 See numerous documents on P900 and SIMCE published by theChilean Ministry of Education. See also Angell (1996).
7 Rather less than 70% of subsidized schools took the SIMCE test in1996, partly because of exclusion and disqualification rules andpartly because some schools opted not to participate. Small andremote schools were most likely not to have participated. How-ever, to be considered for inclusion in the P900 programme schoolswere required to have taken SIMCE.

163C E P A L R E V I E W 7 2 • D E C E M B E R 2 0 0 0
WHAT SCHOOLS TEACH US ABOUT EDUCATING POOR CHILDREN IN CHILE • BEVERLEY A. CARLSON
examination measurement standards were keptconstant. Again, it is not possible to say how much ofthe increase in the P900 scores was due to improvementin individual schools and how much to the recruitmentinto the programme of new schools with better SIMCEperformance to begin with. In both groups there was asimilar large, one-off improvement in performancebetween 1990 and 1992, much greater than in anysubsequent period.
The SIMCE performance of unsubsidized privateschools shows a very large gap between the educationalperformance and opportunities of the elite 8% ofstudents whose families can afford to enrol them instrictly private schools and those of children frommiddle class and poor families attending publiclysubsidized schools. Children attending the elite schoolsachieved a high of 86 SIMCE points in 1996, nearlydouble the score of the 100 worst-performing long-termP900 schools which are the subject of this study.
Approximately 900 schools participate in P900each year. Of the more than 2,100 school that haveparticipated in P900 since 1990, in 1996 there werestill 308 under-performing schools that had not beenable to graduate out of the system even after five yearsor more of P900 programme support. The SIMCE scores
of the 100 worst-performing schools in this group oflong-term P900 schools, i.e. the bottom third, are alsoshown in figure 1. After an initial but relatively smallrise in their scores in 1992 these schools stagnated, andbetween 1994 and 1996 there was actually a slight de-cline. It is these under-performing P900 schools thatare the concern of the study.
It should be noted that these under-performingschools are not necessarily the “poorest of the poor”,nor even very poor. This is illustrated by thevulnerability index of each school. Table 1 shows thevulnerability indices of the poor schools visited for thestudy. The Junta Nacional de Auxilio Escolar y Becas(National Student Assistance and Scholarship Board)or JUNAEB vulnerability index is used to decide thedistribution of school feeding programmes, so that morefood can be targeted at the neediest. The index goesfrom one to five, one indicating minimum vulnerabilityand five maximum vulnerability. The schools visitedranged in vulnerability from two to five, so theyincluded low and medium, as well as high, vulnerabilitychildren. This is because P900 aims for some regionalbalance while poor schools tend to be highlyconcentrated in certain regions. The poorest schoolsare much more likely to be found among the 2,500primary schools that were excluded or disqualified fromthe SIMCE tests. The great majority of them are verypoor rural schools, often small, often difficult of access.When these schools receive educational assistance it isusually under the Programa de Mejoramiento de laCalidad y Equidad de la Educación (MECE), aprogramme designed to improve the quality and equityof education in smaller poor rural schools.
In drawing conclusions from this study it shouldbe borne in mind that more than one third of subsi-dized schools are no better and probably worse off thanthe schools studied here. The many lessons learned fromthe school visits will certainly be relevant for a signifi-cant proportion of the country’s subsidized primaryschools, be they municipal or private, and will be veryimportant for improving the quality and equity of pri-mary education.
FIGURE 1
Chile: Average scores in fourth grade SIMCEa
mathematics and Spanish tests, 1990-1996
86
70
64
49
80
86 85
59
66 67
52
6162
4348
50
40
50
60
70
80
90
1990 1992 1994 1996
Years
Scor
es
Privately financed schools
Subsidized schools
P900 schools
100 worst-performing long-term P900 schools
a SIMCE = Education Quality Measurement System.
C E P A L R E V I E W 7 2 • D E C E M B E R 2 0 0 0164
WHAT SCHOOLS TEACH US ABOUT EDUCATING POOR CHILDREN IN CHILE • BEVERLEY A. CARLSON
IIIMicro research methodology
This paper synthesizes the micro evidence from theschool visits, and draws conclusions about the macroquality issues. Essentially, the macro-micro evidencecan be distinguished as the “macro-what” and the“micro-how”. At the macro level, performanceindicators, statistics, policies, programmes andfinancing are the guiding forces. At the micro level,schools tell us “how the whats are implemented” inpractice and in the context of the client group, thestudent population served by the schools.
The qualitative methods involved daylong visitsto each of the sampled schools by a two-person teamcomprising the project director and an accompanyingjournalist. In-depth interviews were conducted with allthe principal actors: students, teachers, school princi-pals, parents, school administrators and provincial andmunicipal education authorities. Children in the fourthgrade were the group of greatest interest. This is due tothe fact that in the period of analysis the P900programme was targeted at children in the first cycle,i.e. the first four grades. Also, it was the fourth gradethat SIMCE tested every two years, thereby providing aconvenient output measure of fourth grade performanceand, indirectly, of P900 performance/impact at theschool level.
Eighth grade school performance also proved tobe useful for assessing school performance in thesecond cycle, grades 5 to 8, and for measuring whetherthe early P900 input was having a continuing impactas students progressed through the system.
Done properly, the micro research is time-consuming, and it has to be carefully planned so thatunbiased, truthful, unrehearsed feedback can be obtainedfrom the school. The project director should ideally visiteach school to ensure consistency and to build on lessonslearned in earlier interviews. These interviews shouldbe conducted in private, without the presence of Ministryof Education or local or provincial officials, in order togive respondents the best opportunity to provide candidcomments. While the interviews were scripted insofaras questions were prepared in advance of school visitsand tailored to each type of interview (school principal,technical director, fourth grade teacher, all teachers,students, parents, provincial and municipal authorities),these questions were used flexibly and developed upon
in view of the way the interviews were progressing. Tothe extent that information may differ from that availableat the national level, this is due to differences ofperception and knowledge among local authorities andschool officials.
The schools were selected on the basis of the fol-lowing criteria:– The schools had to be currently in the P900
programme.– They had to have been in the P900 system for five
years or more and never graduated.– Their average fourth grade mathematics and Span-
ish SIMCE score in 1996 (the latest year available)had to be 60 or less.
– The past trend in average fourth grade mathemat-ics and Spanish SIMCE scores had to place them inthe “hard core” of under-performing long-termP900 schools. Their scores had to show a steadyor periodic deterioration or an obvious lack of im-provement in contrast to the steady improvementin comparable scores shown by the P900 schoolsas a whole.
– Only one school could be selected in any region.– One or two schools had to be subsidized private
schools as opposed to municipal schools, to reflectthe fact that about 25% of the P900 schools aresubsidized private schools.
– Half the schools had to be urban and half rural,reflecting the P900 school split of 46% urban to54% rural.
– The wide range of school enrolment sizes had tobe captured.
– The full range of years spent in the P900 system by long-term schools (five to eight years) had to be covered.
– Average fourth grade mathematics and SpanishSIMCE scores vary considerably among regions.Since one of the criteria for including a school inthe P900 system is the ratio between the school’sSIMCE score and the average regional SIMCE score,the selected schools had to reflect this regionalrange of SIMCE scores.
– As many as possible of the five quintiles of theproportion of vulnerable children by commune, asassessed by the JUNAEB vulnerability index, had tobe represented.
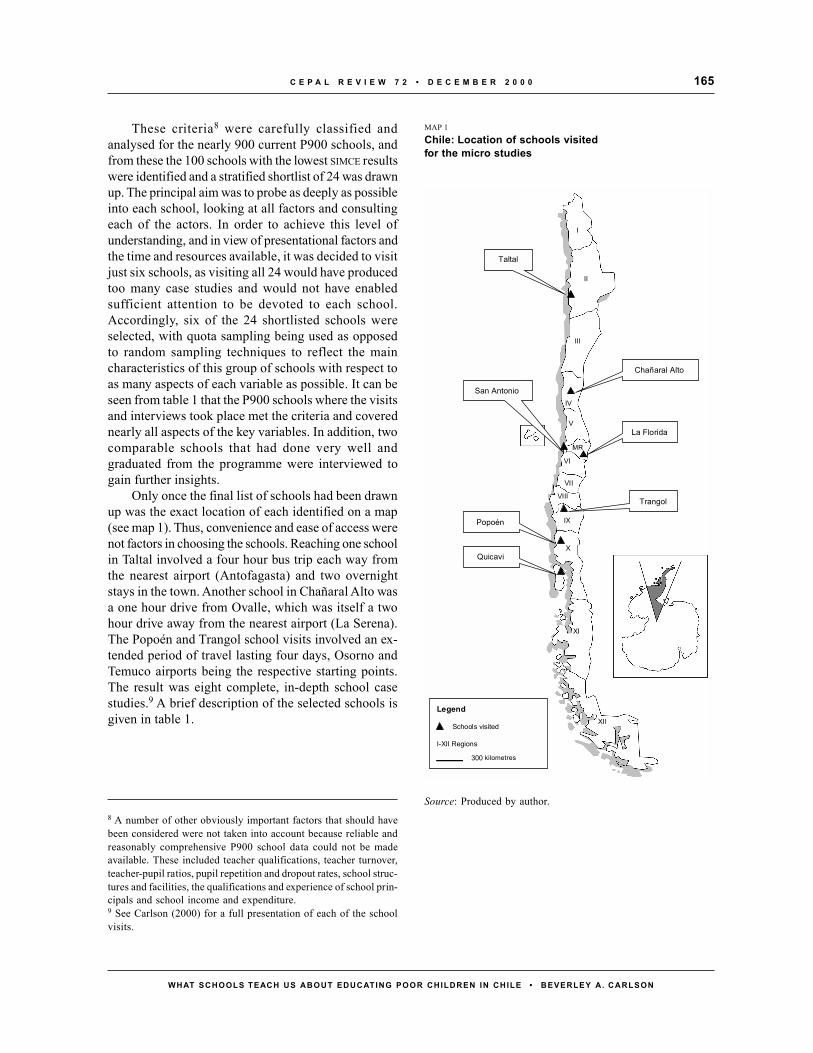
165C E P A L R E V I E W 7 2 • D E C E M B E R 2 0 0 0
WHAT SCHOOLS TEACH US ABOUT EDUCATING POOR CHILDREN IN CHILE • BEVERLEY A. CARLSON
These criteria8 were carefully classified andanalysed for the nearly 900 current P900 schools, andfrom these the 100 schools with the lowest SIMCE resultswere identified and a stratified shortlist of 24 was drawnup. The principal aim was to probe as deeply as possibleinto each school, looking at all factors and consultingeach of the actors. In order to achieve this level ofunderstanding, and in view of presentational factors andthe time and resources available, it was decided to visitjust six schools, as visiting all 24 would have producedtoo many case studies and would not have enabledsufficient attention to be devoted to each school.Accordingly, six of the 24 shortlisted schools wereselected, with quota sampling being used as opposedto random sampling techniques to reflect the maincharacteristics of this group of schools with respect toas many aspects of each variable as possible. It can beseen from table 1 that the P900 schools where the visitsand interviews took place met the criteria and coverednearly all aspects of the key variables. In addition, twocomparable schools that had done very well andgraduated from the programme were interviewed togain further insights.
Only once the final list of schools had been drawnup was the exact location of each identified on a map(see map 1). Thus, convenience and ease of access werenot factors in choosing the schools. Reaching one schoolin Taltal involved a four hour bus trip each way fromthe nearest airport (Antofagasta) and two overnightstays in the town. Another school in Chañaral Alto wasa one hour drive from Ovalle, which was itself a twohour drive away from the nearest airport (La Serena).The Popoén and Trangol school visits involved an ex-tended period of travel lasting four days, Osorno andTemuco airports being the respective starting points.The result was eight complete, in-depth school casestudies.9 A brief description of the selected schools isgiven in table 1.
RM
VIII
Chañaral Alto
La Florida
Trangol
Taltal
San Antonio
Popoén
Quicavi
I
II
III
V
IV
VI
VII
IX
X
XI
XII
Legend
Schools visited
I-XII Regions
300 kilometers
MAP 1
Chile: Location of schools visitedfor the micro studies
kilometres
Source: Produced by author.8 A number of other obviously important factors that should havebeen considered were not taken into account because reliable andreasonably comprehensive P900 school data could not be madeavailable. These included teacher qualifications, teacher turnover,teacher-pupil ratios, pupil repetition and dropout rates, school struc-tures and facilities, the qualifications and experience of school prin-cipals and school income and expenditure.9 See Carlson (2000) for a full presentation of each of the schoolvisits.
MR

C E P A L R E V I E W 7 2 • D E C E M B E R 2 0 0 0166
WHAT SCHOOLS TEACH US ABOUT EDUCATING POOR CHILDREN IN CHILE • BEVERLEY A. CARLSON
These factors add up to bigger challenges in schoolslike the ones we are considering. It takes more effort to makea good school in a poor setting; it is a continuous challenge,renewed year after year. These schools were selected becausethey were not doing well according to standardizedexamination results, but each school has distinct factors atwork and each has its own lessons to teach. While the lessonshere apply most directly to under-performing schools indifficult settings, they also have meaning for schools at large.We can see that these schools are not all equally “poor” orequally “vulnerable”, as they come from four out of the fivelevels of vulnerability measured by the national schoolfeeding programme algorithm for allocating school lunches.Socio-economic vulnerability is only one of the factorsgoverning school performance.
What makes a good school? What does it take to makea good school in a poor community? Or conversely,what keeps a school from being a good school? Ourschool interviews bring many realities to light and drivehome the truth that parents, educators and studentsknow: one factor alone does not make the difference.Educating young people is a complex process; manyfactors come into play at school. The factors areadditive: good teachers, an accomplished schoolprincipal, an effective curriculum, enough money tocarry out programmes, well-fed children who aremotivated and prepared to learn, parental involvement,good facilities, adequate classrooms, small class sizes,schools close to home, creative teaching, a stablestudent-teacher population.
TABLE 1
Chile: Summary of the P900a schools visited
Region Town Municipal or Urban Number JUNAEB Years in Fourth grade SIMCEb scoressubsidized or rural of students level 1997 P900 1990 1992 1994 1996
private 1997 (quintiles)c
Badly performingschoolsX Popoén Subsid. Rural 80 4 6 53 47 38 49IX Trangol Mun. Rural 72 5 8 30 32 41 39XII La Florida Subsid. Urban 642 2 7 41 44 46 47V San Antonio Mun. Urban 518 3 8 46 56 56 57IV Chañaral Alto Mun. Rural 681 4 7 55 62 67 57II Taltal Mun. Urban 1 110 2 5 53 64 64 60
Well performingschoolsd
X Quicavi Mun. Rural ... 3 6 55 ... 68 70V San Antonio Mun. Urban 1 158 1 6 54 67 68 ..
a P900 = Programme to improve the quality of schools in poor areas.b Average of mathematics and Spanish scores.c Quintiles 1 to 5 according to the vulnerability index used by the Junta Nacional de Auxilio Escolar y Becas (National Student Assis-
tance and Scholarship Board) or JUNAEB.1 = Lowest vulnerability (0-32)2 = Low vulnerability (33-44)3 = Medium vulnerability (45-56)4 = High vulnerability (57-66)5 = Very high vulnerability (67-100)
d In San Antonio, a contrasting, well performing school that had recently graduated from the P900 system and was just a short walk awayfrom the under-achieving school visited was selected as a comparator. A school visit to a successful, poor, rural boarding school inQuicavi, Chiloé, is also reported as a contrast to the under-achieving rural schools that were visited in regions IX and X.
IVWhat schools teach us
167C E P A L R E V I E W 7 2 • D E C E M B E R 2 0 0 0
WHAT SCHOOLS TEACH US ABOUT EDUCATING POOR CHILDREN IN CHILE • BEVERLEY A. CARLSON
The reforms being undertaken by central authori-ties to improve education are medium- to long-terminvestments. At least five to ten years will pass beforeall schools see them functioning effectively. The ef-fects of curriculum reform, teacher training and full-day education will take time to come through. In themeantime, focused efforts to improve the workings ofschools are needed, within the existing parameters.
1. What schools teach us about teacher and studentperformance
The aim of the school visits was not a rigorous evaluationof classroom teaching per se. This would have requireda specialized, in-depth study focusing on that topic aloneand lasting for longer. Classrooms, especially fourthgrade classrooms, were visited at all schools and someteaching was observed . In some classroomsstudents had been divided into groups, in others theyhad not. A lot of information emerged from the interviewswith teachers, principals and students. There was a fairamount of rhetoric about child-centred learning, the resultin part of current Ministry of Education policyrecommendations to teachers participating in Ministryteaching improvement workshops.
The problem, of course, is to translate standardsinto practice. One teacher can indeed make a differ-ence, even at a poor school. In 1992, for example, thefourth grade children at Taltal’s Escuela Hogar turnedin mathematics and Spanish results far higher than thoseof previous years (62 and 65 respectively out of 100), aresult attributed to three particularly good teachers. In1996, though, there was a drop of two points in theaverage score for Spanish and seven points in the scorefor mathematics, largely because the teachers hadchanged.
There is a clear difference in average age betweenteachers in municipal schools where they have a jobfor life and those in private subsidized schools wherethey can be dismissed. The high average age of teachersin many of the schools visited was striking. In Taltalthe school principal said this was because he could notget new teachers to go to that remote place. Two of theteachers responsible for the commendable 1992 and1994 scores had since retired and recruiting newteachers was a difficult if not impossible task. Taltal isa desert town of 12,000, a four hour bus ride south ofthe nearest city, Antofagasta. The town is isolated andmost goods have to be brought in by truck, so the costof living is high. These factors conspire to keep youngprofessionals away. “If you advertise a job opening in
Taltal nobody will apply. They all prefer the big cities,”said former P900 supervisor Alfaro.
If some veteran teachers resist change, an equalnumber of them embrace it and use it to their advantage.Teachers responsible for first to fourth grade studentsin Taltal put together a project for an audio-visual roomthat won funds from the Ministry of Education. Becausethe project was devised by the teachers themselves, theyalso make more frequent use of this facility and haveintegrated it into their lesson plans. Popoén’s teacherscredit the school’s impressive performance in scienceto the frequent use of educational videos, which areshown on a video cassette recorder and televisionobtained through a PME (Proyecto de MejoramientoEducativo)10 project grant.
Continuing education for experienced teachers isas important as changing the way new teachers are taught.Good videos of “ideal” classrooms and classroomteaching methods can be very effective in acquaintingteachers and students with methods and practices thatwould improve their teaching and learning. These videoswould be especially effective if they used real examplesfrom poor schools and difficult settings.
However, large class sizes and overcrowding stoodout as a major challenge to even the most innovativeteacher. At the successful Portuarios school in SanAntonio, the most serious problem today is the grow-ing demand from parents wanting their children to studythere. Teachers fear this could hinder the performanceof the children. There are too many classes with 45students, which hampers their ability to give the inter-active classes they consider best for learning. It is alsovirtually impossible to bridge the differences betweenslow and advanced students. Very large differences inthe quality and quantity of classroom learning materi-als, textbooks and student notebooks were readily evi-dent, even among these troubled schools. Some schoolsand classrooms were especially deficient; this was thecase, for example, at the Chañaral Alto school, whichis not even one of the schools with the highest vulner-ability level. The poor quality of students’ notebooksand the individual work in them was striking. In somecases, the work was barely legible.
10 The Proyecto de Mejoramiento de Educación (Educational Im-provement Project) is a three-year Ministry of Education grantawarded for innovative projects to improve the quality of teach-ing.

C E P A L R E V I E W 7 2 • D E C E M B E R 2 0 0 0168
WHAT SCHOOLS TEACH US ABOUT EDUCATING POOR CHILDREN IN CHILE • BEVERLEY A. CARLSON
2. What schools teach us about lack of parentalinvolvement
Lack of parental involvement was a problem in everystruggling school. Although this is not a new discov-ery, the specific examples cited by those interviewedare certainly instructive and shed light on the depth ofthe problem in poor families.
The key to the seeming contradiction betweeninnovative educational projects and poor scores in thenational SIMCE tests at the Trangol school lies withinthe student body itself. Almost 100% of the childrenare full-blooded Araucanian Indians who speak virtuallyno Spanish when they enter the school for the first time.Their parents enrol them more for the daily schoolbreakfast and lunch than for the food for thought theymight get during class. This is understandableconsidering the minimal education of the parentsthemselves. On average, the men have just four yearsof formal schooling, and half the women are “illiteratefrom lack of use” of reading and writing skills. Theseparents seldom take any interest in their children’s classactivities and sometimes do not even know what gradetheir offspring are in. When a parent-teacher meetingwas held recently at the school only 10 out of 68 parentsbothered to turn up. “I’ve never had a parent come tome and ask me how his child is doing in school. Never,”said Mary Torres, who has taught at Trangol for nineyears and is currently in charge of first and secondgrades. “We get no reinforcement at home of what theyare learning. One day the kids know it and the next daythey forget.”
With an average of 3.5 years of schooling inPopoén, parents take little or no interest in theirchildren’s class activities. “The children here have atremendous lack of affection and that affects their abilityto learn,” said their principal. The school bought aschool bus to pick up weekly boarders each week anddrive them back home every Friday and this has raisedattendance considerably.
Most students who attend Taltal’s Escuela Hogardo not receive sufficient support or reinforcement athome for what they are learning at school. Some of theolder boys have to alternate between jobs and classes,working one day and going to school the next. “Thereis a lot of social work involved,” said eighth gradeteacher Rosa Ovalle Fernández, who has taught at theEscuela Hogar for 16 years.
Trifeña Tarita Chirino is a fourth grader who readswith a fluency appropriate to her nine years, despitebeing one of 17 brothers and sisters who work collecting
and selling seaweed. Her teacher says she is enthusiasticabout learning and will sometimes knock on the doorafter school hours to ask for a pencil or for help with aquestion. “I talk to Trifeña’s mother and tell her to helpher daughter, but it is as if I were speaking a differentlanguage,” said teacher Patricia Jiménez Rojas.Trifeña’s grades, which average 4.4 out of 7, reflectthe lack of parental concern. Yet in the same class,Cristián Astudillo Collao boasts grades averaging 6.2.Happy and confident, the nine-year-old announces hewill be a palaeontologist when he grows up. His fatherworks in a thermoelectric plant.
After years of fending off teacher complaints aboutthe composition of their classes, the Escuela Hogar’sprincipal changed the system used for deciding themakeup of each class. When parents arrive to registertheir children for school, they are told to select theteacher who will accompany their child from first gradeto fourth. If a particularly good teacher’s class fills upquickly, parents will have to settle for a different teacher.Those who carry out the registration process last willmost likely get the worst teachers and condemn theirchildren to mediocre teaching for four straight years.So in the end it is the children with parents who do notfully understand the value of education that often paythe price of the school’s reluctance to take responsibil-ity for the makeup of classes.
This unfair system enables the principal to avoidcomplaints and theoretically provides a motivation forbad teachers to reform. “We do this precisely so thatthe teacher will improve his teaching, because thereshouldn’t be any mediocre teachers,” said Rojas. Un-fortunately, he admits, there are teachers who do notcare if they are chosen last, so in practice the incentivedoes not work. If, however, a child is lucky enough tohave an excellent teacher from first to fourth grade,that child is likely to carry on being a good student infifth grade and beyond under a normal “one teacherper subject” system.
Changes in disciplinary procedures at the big-cityUnidad Divina school in the poor section of La Florida,a large district in the nation’s capital, Santiago, sparkedclashes with parents, who tend to be aggressive and takelittle responsibility for the education of their children.“The parents have a very convenient view of theirchildren’s education. They expect the school to teacheverything from toilet training to academic content,” saidthe principal. There has been no centre for parents at theschool since the old one was closed. Ramón, an eighthgrade teacher, considers the lack of parental support oneof the school’s most serious problems. “There is no

169C E P A L R E V I E W 7 2 • D E C E M B E R 2 0 0 0
WHAT SCHOOLS TEACH US ABOUT EDUCATING POOR CHILDREN IN CHILE • BEVERLEY A. CARLSON
commitment on the part of the parents, the children onlyget what you teach them in school.”
Most parents do not participate in school activitiesat San Antonio’s San José Calasanz School. It is notuncommon for them to send their children to work inthe market, watch over cars or beg in the streets insteadof going to school. Many of the children arrive withoutschool equipment and teachers have to provide it. Oneteacher recalled students whose mothers never came topick up the schoolbooks sent by the Ministry of Edu-cation. “I gave them directly to the kids, we couldn’tcontinue to wait for their parents,” he said.
Five minutes away from the struggling San Joséde Calasanz school, the Movilizadores Portuarioselementary school 479 in San Antonio boasts such agood reputation and attracts so many parents that itsonly serious problem is finding enough room for all itsstudents. This school proves what can be achieved whenadministrators and parents work together and reflectsthe commitment of upwardly mobile, more highlyeducated parents from a higher socio-economic level.Parents of children at the school generally have aneducation that falls short of high school completion,
although some have studied at university. Family lifeis stable, with three quarters of the students’ homescomposed of both parents and siblings.
The parents’ centre also works actively with theschool and maintains an excellent relationship withstaff, who appreciate its efforts. These efforts haveraised funds to improve the floors, buy books for thelibrary, finance a new ball court, build bathrooms forthe kindergarten and cover the play area with concrete.Parents have also bought a photocopier and currentlypay assistants to clean the classrooms.
In return, parents expect the teachers to provide ahigh standard of education to their children in the class-rooms. They are very interested in the school’s SIMCEtest results and many of them are willing to help theschool with time as well as money. Some work as work-shop monitors, others volunteer for special projects.Last year they worked on three special projects in thekindergarten, focusing on the family, the month of thesea and national holidays. All subjects taught in theclassroom echo the chosen theme and parents pitch inwith family anecdotes and work with children andschool monitors to build models and displays.
VLessons learned
The school interviews tell us very clearly that whilequality factors are additive, individual factors can makea difference, either for better or for worse. These factorsare the critical ones to identify and understand becausethey are the ones that need to be acted on in the shortterm. What the school stories tell us, reinforcinginternational experience, is that the single mostimportant factor at the school level is having a top-notchprincipal with the authority to act. Our schoolexperiences make it crystal clear that a stable, qualified,motivated teaching staff is the lifeblood of a goodschool. They demonstrate that a skilled and dedicatedteacher makes a measurable difference in studentoutcomes. By contrast, high teacher turnover and lowteacher qualifications and interest immediately resultin lower student performance.
The central problem is to attract and retain qualifiedteachers and talented principals in poor, remote areasof Chile and difficult inner city schools. Financialincentives are not enough. They do not address the
desire of most people to live near their families andfriends. Young teachers just starting out are motivatedand not yet tied down to family responsibilities. Theyare in a position to move to communities in need,although they cannot be expected to stay there for thelong term, perhaps not for more than five years. Inreturn, they could be granted scholarships for advancedstudy or other incentives which would compensate themfor their contribution to poor communities and poorstudents and would also be a further human capitalinvestment in Chile’s future.
But how can these lessons be put into practice?Educational authorities could institute school manage-ment reviews, like the ones that have been carried outhere, to identify significant problems and practices thatcan be put right. While quantum leaps in quality arenot realistic in most settings, finding and correcting oneor more acute problems can make an important differ-ence to children’s learning, as the school audits dem-onstrate. In Chañaral Alto it is getting teachers to stay,
C E P A L R E V I E W 7 2 • D E C E M B E R 2 0 0 0170
WHAT SCHOOLS TEACH US ABOUT EDUCATING POOR CHILDREN IN CHILE • BEVERLEY A. CARLSON
in Taltal it is negotiating with the mayor, changing theschool principal and sorting out school financing, andso on. Let us review the lessons from these schools indifficult circumstances, lessons that reflect their struggleto raise student achievements.
1. Achieving educational quality: a renewedchallenge every year
Schooling in poor neighbourhoods provides the biggestchallenge to school officials and students. Using trendsin SIMCE scores to measure success can be misleadingbecause the assumption is that they should continue torise as special attention and special inputs are directedat the school. With good teaching and good schooldirection, test performance should go up. It will notnecessarily do so, however, because each year a newcohort of kindergarten or first grade students startsafresh and presents school authorities with the samechallenges all over again. This is important when it isconsidered that as much as 60% of achievement isattributable to the social context in which children growup, out-of-school factors like the home environmentand parental support or lack of it. “The household’seducational climate (years of education of the adults inthe household) is the most important factor and accountsfor between 40% and 50% of the socio-economic andfamily factors.”11
If the characteristics of the student populationchanged markedly from year to year, this would affectpotential school achievement results. In most cases, thestudent population probably does not change that muchand so teachers face similarly large challenges every year.In a sense, though, SIMCE performance is misleading.The biennial tests taken by fourth grade students are anindependent event each time and it is a fresh set ofstudents that is being tested. Therefore, trends in SIMCEscores are not a very accurate measure of whether aschool continues to need compensatory interventionprogrammes such as P900 or is ready to graduate fromthem. (Subsequent to these school reports, P900introduced additional qualitative factors into the criteriafor deciding whether a school is ready to graduate). Aschool may have become successful after participatingin the programme for a few years, and the SIMCE resultsmay reflect this. But is that the right time to leave or is itbetter for the school to stay in and help a new cohort offirst grade students receive a higher quality education?
Why should schools be expected to perform as well whentheir resources are being reduced?
2. Achieving educational quality: makingimprovements sustainable
To graduate from P900, schools need to undergo afundamental change in the way they do business. Schooladministrators and teachers, and not just students, needto learn from the programme. P900 must find ways toprovide sustainable inputs so that the school can manageon its own better than it had been doing before itparticipated in the programme. It is the school thatshould be tested, not just its students, to monitor whatit has learned. The fact is that P900 is only onecomplementary programme with limited resources.Probably, and the school stories bear this out, it isschool-wide factors that matter when it comes tosustained improvement, and not special programmefactors. P900 has provided excellent materials tostimulate teachers and students, and its schoolmanagement and outreach strategies are valuable. Theymay not, however, be sustainable.
Overall test scores do not tell the whole story either.In each and every school visited, even the poorest andmost backward, some children stood out; they hungeredfor knowledge and were getting as much as they couldfrom what the school offered. At the San José deCalasanz School in San Antonio, it was possible toidentify a large of number of students with learningproblems who needed remedial help. The school wasdoing its best to attend to these children. Side by sidewith them, though, were others who were beingchallenged in the classroom and by special programmesand after-school activities such as the school newspaper.The school had many sponsors from the communitywho gave their money, their time and their skills to makethe school better.
3. What makes a good school: it’s the schoolprincipal
The single factor that seems to matter most is the schoolprincipal. The school principal can turn a school around.The changes introduced by Dora Muñoz at UnidadDivina school in Santiago’s La Florida district havetaken three years to make a difference, but they arebeginning to pay off, as the SIMCE 1997 eighth gradetest results showed. She has wrought a transformationin her poor, difficult, overcrowded school, changingeverything from the teachers to the level of hygiene.Another example is Elsa Carrasco, principal of San
11 See World Bank (1995), Carlson, ed. (1999), ECLAC (1998) andCohen, ed. (1998).
171C E P A L R E V I E W 7 2 • D E C E M B E R 2 0 0 0
WHAT SCHOOLS TEACH US ABOUT EDUCATING POOR CHILDREN IN CHILE • BEVERLEY A. CARLSON
Antonio’s San José de Calasanz Elementary School,whose dedicated, creative, entrepreneurial drive hasovercome adversity, making her school a centre of hercommunity and a place where children of all abilitiesare challenged. Again, after two decades Ivan RodríguezMercado, the principal at Trangol, continues to makehis tiny, remote school a warm and welcoming learn-ing experience for its ultra-poor children.
But leadership was clearly missing in Taltal’sEscuela Hogar, and this was due as much to the au-thoritarian mayor as to the tired school principal.Chañaral Alto’s Alejandro Chelén Rojas ElementarySchool awaits a new school principal and in the mean-time Claudina Rodríguez, filling in as temporary prin-cipal, has her heart in the right place and gives of herbest, but is clearly handicapped by the lack of man-date. What the Chañaral Alto school needs to shift gearsis a tough, dynamic leader who can turn the teachersituation around.
An important change that Quicavi’s innovativeprincipal introduced was the idea that all teachersshould share in school administration. “When you sharethe responsibilities and decision-making, you get a morecommitted staff,” he says. “It’s democracy.” Out wentthe heavy rote learning that had previously typified theschool’s teaching. In came more discussion, explana-tion and discovery. The PME school programme paidfor teachers to get special training in using the school’snew equipment, and in such subjects as speech skills.
The school’s low results in national testing beganto show a steady improvement. Class repetition fell fromas high as 25% to 1%. For the first time AquelarreSchool in Quicavi on the island of Chiloé had no drop-outs. Pérez credits his staff of seven teachers with theschool’s turnaround. “Once we got beyond some initialresistance to giving up old [teaching] ways, everyoneadopted the project like a team, and we found we couldhave fun while doing a better job,” he says. Teacherstake it in turns to live at the school for a week at a timeto supervise boarders. It makes for long days, but bothteachers and students mention the sense of communitywhen listing the school’s strong points.
Pedro Martínez, Provincial Department Head forthe Ministry of Education in the X Region, believesthat the key ingredient in making a good school is theprincipal. “The success of a school depends upon theleadership of its principal. If you have a good princi-pal, you will attract good teachers who will put togethergood projects to win good grants,” concluded Martínez.
Incentives are needed to attract more dynamic lead-ers to work as principals, especially in these tough
schools. It is really no different from turning around afailing company. Why not actively search for schoolmanagers with entrepreneurial, managerial and peopleskills and give them the authority they need to make agood school? It is clear that the quality of the studentsentering schools is not going to change significantlyuntil the problems of inequality and poverty are ad-dressed, and these are long-term problems. In the mean-time, the school system can confront the special chal-lenge of difficult schools by allocating its best leadersto them.
4. Jornada completa: full-day schooling
It should be remembered that the school visits werebeing carried out while many of the educational re-forms referred to earlier were at the implementationstage, and while it is anticipated that these reforms willresult in a higher quality of education, this will taketime. When this process is going on it can be disruptiveas well as helpful. The move from half-day to full-dayeducation means in practice that many schools have tofind two or even three times the physical space to imple-ment this reform. It is not just a question of financing.In many poorer schools like the ones in this study, thereis simply not enough space left in the current physicalpremises. These schools are already overcrowded aftermany years of growth within the same infrastructure.The logistics of giving over the available space to oneshift means that, as a minimum, the number of class-rooms has to be doubled. In most of the schools visitedthis was not feasible. The municipalities are having tosearch for alternative sites and the logistics of imple-menting the change has wide-ranging implications forother school inputs such as teachers, recurrent costsand the building of new premises which old schoolsare not able to accommodate. There is now a specialMinistry programme to help schools solve these prob-lems.
5. Accountability
The quality of education in schools is suffering froman almost total dependence on outside decision-mak-ing and outside financing by three principal actors: theMinistry of Education, the provincial department andthe municipality or private administrator. The bulk offinancing continues to come from the central authori-ties in Santiago in the form of a subvention or paymentper child. This is calculated on the basis of monthlyattendance records and handed over to the municipal-ity to administer. The municipalities manage the schools

C E P A L R E V I E W 7 2 • D E C E M B E R 2 0 0 0172
WHAT SCHOOLS TEACH US ABOUT EDUCATING POOR CHILDREN IN CHILE • BEVERLEY A. CARLSON
and are expected to provide additional financing forequipment and school operations. The Ministry of Edu-cation in Santiago is responsible for curricular and peda-gogical aspects. The provincial departments supervisethe implementation of Ministry programmes by schools.
There needs to be more coordination andaccountability among these three actors. At the moment,schools are being “graded” only on their SIMCEperformance. In large part school SIMCE performanceis determined by the quality of school staff, i.e. teachersand administrators in the schools. However, decisionsabout school staff are not made by schools but by thelocal municipal authorities. Where is the municipality’sgrade? Somehow the linkage between the school, themunicipality, the Ministry and the provincial authoritiesneeds to be improved, and some checks and balancesinstituted.
6. High student-teacher ratios
Under Chilean law, schools can assign as many as 45students to a classroom and receive a subvention foreach of them; there is no subvention for students above45. Schools thus have a very powerful economic in-centive to have classes as close to 45 as possible. Howcan one teacher manage a class of 45 students and pro-vide them with a high-quality education? Certainly itis not optimum. By way of comparison, the averageclass size in private schools throughout the country is24 students per teacher, as against 38 for all privatesubvention-funded schools and 35 for all municipalschools.12 This problem was particularly noticeable inpoor private subvention-funded schools, schools thatare privately owned but which receive the per capitastudent subvention. A case in point is the Unidad DivinaSchool. Because of its limited resources, it dependsheavily on the subvention to pay for its major opera-tions, and especially to fund reasonable salaries for itsteachers. Consequently, the teachers themselves, to-gether with the administration, went on a campaign torecruit more students. The Popoén school generallyoperates at a loss, according to its owner, who had toreturn to teaching at the school to save on the salary ofanother teacher.
How does this stack up with international experi-ence and knowledge? There has been much debateabout class size because of the high cost of smallerclasses. There are a range of views on the subject and
the evidence is different for different levels of school-ing. Hitherto, small class sizes have tended to be re-garded as inappropriate, at least for “developing coun-tries”, because they are not cost-effective.13 This generalguideline does not discriminate sufficiently betweendifferent developing countries, however, and while itmay be a reasonable prescription for very low-incomecountries, it is not necessarily the right one for others,like Chile. Furthermore, why is it necessary to applyclass size rules across the board?
There is much new evidence regarding the cost andeffects of class size reduction (CSR) and much remainsto be learned.14 To judge by short-term effects at least,CSR prompts significant academic improvement. In classsize experiments in the United States, the effects onminority student were double those on white students.Most improvement was shown during kindergarten andfirst grade. The long-term effects are harder to gaugebecause other factors make it difficult to isolate theresults. Care also has to be exercised with the definitionof small and large classes. In the United States, wheremuch of this research is carried out, small is very smallin Chilean terms (less than 20 students per class ascompared with more than 20, for example). As wouldbe expected, the results of current research show thatthe opportunity costs of giving students individualattention are greater in large classes, and with a smallernumber of students the teacher is able to spend lesstime on discipline and more time on instruction. In asmaller class, the teacher is able to give more individualinstruction, usually to those students who do not haveparental support at home. Low-income and minoritystudents benefit the most from class size reduction.
In some East Asian countries such as Japan andKorea, CSR does not produce the same results as in theUnited States. The Third International Mathematics andScience Study (TIMSS) shows that while class sizes arelarge in these countries, students’ academicperformance is also high. However, teachers in Japanteach their students by lecturing and the lectures arethe same regardless of the number of students in theclass. In Chile, education reform is aiming for a switchfrom the “frontal” approach to “interactive” teaching,requiring more individual attention.
Parental involvement is crucial for successful learn-ing, especially when class sizes are large. Even with aclass of less than 20 students, a teacher can spend only
12 See Chilean Ministry of Education (1998).13 See Lockheed and Verspoor (1991).14 See Grissmer (1999).

173C E P A L R E V I E W 7 2 • D E C E M B E R 2 0 0 0
WHAT SCHOOLS TEACH US ABOUT EDUCATING POOR CHILDREN IN CHILE • BEVERLEY A. CARLSON
a limited amount of time on each student. Parents caneasily spend more time with their children. However,students from poor families do not receive parentalsupport and schools are being called upon to make goodthis deficiency in the transition from home to school,especially in the early years of education. There is evi-dence of significant short-term achievement gains inthe first four years of school with CSR.
7. Overcrowded classrooms
How can quality learning take place when largenumbers of students are packed into small classrooms?Crowding was found in a number of the schools visited,but it was particularly evident as a serious problem atUnidad Divina School located in the commune of LaFlorida in Santiago. Forty or more children were packedinto the small classrooms and seated so close togetherthat they were literally “shoulder to shoulder”. Thisproblem was exacerbated by the move to full-dayschooling, as some classes were now operatingthroughout the day and displacing other classes thatwould otherwise have used the same rooms in theafternoon shift. In Taltal’s Escuela Hogar, 40 pluschildren were stuffed into classrooms designed for nomore than 35 children. Overcrowding was observed inall but the smallest schools.
8. Teacher turnover, teacher qualifications,teacher involvement
Chañaral Alto’s Alejandro Chelén Rojas ElementarySchool shows us how much teachers do matter. Itschildren are starved of teacher involvement. Childrenmust question their own worth when they experiencetheir teachers’ lack of commitment, watch them rushoff at the end of the day for the long drive back tocivilization in the nearest big town, call in sick as oftenas possible or quit as soon as they can. Only 13 of the26 teachers currently live in Chañaral Alto, the restcommute. The SIMCE scores for the fourth grade plungedin 1996 because that cohort went through 12 differentteachers in a four year period. Those in eighth grade,meanwhile, had had just one excellent teacher from firstgrade to eighth and their 15 point increase in SIMCEscores reflected that. Because of the difficulty of findingteachers, 11 out of the 26 lack degrees. None of theseven new teachers has one. The school has had threeprincipals within the space of a year and the position isvacant again. This is clearly a disaster that needs to besorted out. If the school cannot keep teachers then whykeep the school in the town? Why not transfer the school
to the nearest large community and bus the childrenin? The cost-benefit implications and impact of such achange warrant consideration.
The Chañaral Alto example may be representativeof an underlying problem worth investigating further:the problem of getting good teachers for rural schoolsthat are too remote for convenient travel but not sodistant that teachers would choose to live in thecommunity.
At Unidad Divina School in the Santiago districtof La Florida, the principal thought that her team ofteachers had learned to work well together and washappy that teacher turnover had decreased. Beingprivate, the school could change its teachers, unlikemunicipal schools where the teachers’ union and thelaw strictly regulate teacher contracts.
Most of the 16 teachers at Unidad Divina camefrom professional institutes. Almost all the teachersspent the entire day at the school, since their contractsstipulated a working week of 44 hours. Teachers earneda modest basic salary, but the school had begunawarding bonuses as an incentive for efficient andeffective teachers. While the teachers appreciated theprincipal’s efforts and the ease with which they couldget their new projects approved by her, low wagescontinued to be a source of frustration, particularlywhen higher qualifications did not translate into highersalaries. “It doesn’t pay to get extra training,” saidRamón, who said the school only provided a small partof the financing for his graduate degree in counsellingand did not raise his pay after these additional studies.
9. School financing: a case of reverse targeting
The Taltal School provided a major insight into howeducational reform can work in practice or, in this case,not work in practice. The Taltal School was visitedbecause it was an instance of a very large school whoseperformance had improved, stagnated and then startedto slide back, in spite of P900 and other project andprogramme interventions. The Ministry had conjecturedthat it was in large schools that it was likely to proveespecially difficult to achieve sustained improvements.At the same time, the Taltal School is not a particularlypoor school as measured by the JUNAEB vulnerabilityindex used as a basis for allocating school lunches. Ona scale of 1 to 5, the Escuela Hogar scored 2, placing itin the low vulnerability category. The physicalinfrastructure and the children seen during the visitappeared to be in better condition than at any of theother six under-performing schools visited.

C E P A L R E V I E W 7 2 • D E C E M B E R 2 0 0 0174
WHAT SCHOOLS TEACH US ABOUT EDUCATING POOR CHILDREN IN CHILE • BEVERLEY A. CARLSON
It transpired that the local mayor, who had theauthority to decide how the municipality’s schoolfunding would be spent, elected to take funds from thepoorest and biggest school in his town, the EscuelaHogar, in order to pay for the operations of thesecondary schools and night schools, which wereoperating inefficiently owing to their lower enrolmentrates and unreliable attendance. The Escuela Hogar,with its 1,110 primary students and compulsoryattendance, was generating a reliable flow of income,but part of this was being transferred away to financethe rest of the system. Meanwhile, the school waslacking in basic infrastructure; there were not evenenough chairs in the canteen.
This case perfectly illustrates the importance ofstudying micro as well as macro performance; the needto observe the “how” at first hand, and not just rely onthe facts that reach the top. Without this localinformation, the normal assumption would have beenthat child-based subventions to schools would be spentas they were allocated in the schools for which theywere intended. It may also help to explain why somesenior Ministry of Education officials were of theopinion that the serious “hard cases” were the very largeschools. There may be other examples of municipalitiesreallocating funds from larger primary schools to coverthe costs of smaller schools, more expensive secondaryschools and schools where attendance is not mandatoryand is therefore irregular, resulting in lower subventions.What with the current recession and economic crisis,municipalities are seeing their budgets cut even furtherand this practice may well become more common. It istruly a case of reverse targeting.
10. Special programmes competing with the basics
Many schools are receiving special programme inputsdesigned to improve the quality and relevance ofeducation. In addition to P900, most of the schoolsvisited had won PME (Educational Improvement Project)funding. In 1995, 736 project grants were awardedthrough primary school competitions in a range oflearning areas: language, subject integration, socialintegration, mathematics, natural sciences, socialsciences, art and physical education. The equivalent ofover US$ 4 million was awarded to primary schools,giving an average of US $6,000 per school in currentdollars, for projects lasting two to three years. Theoverwhelming majority of these grants, over 60%, wereawarded in the language area. A typical example is thetelevision project won by the Quicavi School in Chiloé,
which was so instrumental in bringing learning alivefor those students.
While these projects and programmes provideenriching opportunities for students, they also competefor the time and attention of teachers and administrators.More than one school remarked on this conflict. InChañaral Alto, for example, the school with the mostserious difficulties in attracting and retaining qualifiedteachers and staff, school officials, while very proud oftheir PME project, also expressed concern about the lessthan optimal implementation of P900 due to the timedemands of the PME and other projects. Winning thePME project involved setting aside time to write up theproposal and, when the award was made, spending timeimplementing and supervising it. In addition, schoolsreceive a number of different special programme inputsfor which they must compete. This is not to say thatthese are not useful projects and programme inputs,but there is a resource cost involved.
The innovative Enlaces project to give studentshands-on experience with computers is another example.The project requires a special secure, dedicated room.Teachers must be trained first to use the computers andthen to train and supervise their students. At the UnidadDivina School in La Florida, the library had beensacrificed to the Enlaces project since there were no sparerooms available. The impression that one is left with isof a two-tiered quality effort: innovative projects on theone hand, but failure to get to grips with classroom basicson the other. In Taltal, the Escuela Hogar was long onfrills and short on the basics, with computers still standingboxed up and donated laboratory equipment proudlydisplayed in the multimedia room while children werefollowing what for the most part was the same old routinein the classrooms.
11. “Home” work or supervised exercises at school?
Homework may be set, but it is very difficult for manypoor students to find a quiet place to work at home. Manyhouseholds have no private areas. Instead, childrenprobably have to share the dining room table with otherfamily members while they are watching television ortalking or entertaining friends. Parents with littleeducation are less prepared to support their children andless aware of how to go about it, homework being a casein point. Ramón, an eighth grade teacher at the UnidadDivina school in La Florida, Santiago, considers this aserious problem: “At home their school bag gets thrownin a corner, they don’t open it, and in most cases theyhave nowhere to study. If they do try to study, it is at a

175C E P A L R E V I E W 7 2 • D E C E M B E R 2 0 0 0
WHAT SCHOOLS TEACH US ABOUT EDUCATING POOR CHILDREN IN CHILE • BEVERLEY A. CARLSON
table with a radio on, a television blaring and a bunch ofkids yelling.” This type of comment was echoed in mostschools with achievement problems, while in the“successful” Movilizadores Portuarios school in SanAntonio parents hold the teachers to high standards andare very interested in the school’s SIMCE results. Theygive their time not just at home but in the school, workingas workshop monitors and volunteering for specialprojects. Rather than complaining about these hard truths,a more constructive solution could be to provide a“home” work setting at the school and carry outsupervised exercises in homework rooms after hours.
12. What should be done about textbooks?
Textbooks give concrete expression to the curriculumand enable students to study independently. Each yearthe Chilean government invites tenders for the provisionof school textbooks for children in State-supportededucation, who account for over 93% of total enrolmentin the country. The unsatisfactory supply of textbooks isstill a serious handicap to quality education and furtherefforts to improve the quality of textbooks are needed.
Teachers frequently complained that they did nothave enough textbooks, and that those they did have wereof poor quality. When the Ministry of Education sendsout questionnaires on which textbooks teachers wish toreceive, Ovalle Fernández, a teacher at the Escuela Hogarin Taltal, makes her choices carefully, but to no avail.“We always choose the best and we always get whateveris available,” she complained. A teacher at the SanAntonio Movilizadores Portuarios school said “I wasfurious when I discovered that the language book fromthe publisher Arrayán supplied by the Ministry is sold inbookstores with a workbook that we never get. So thatmeans we are already at a disadvantage before we evenbegin.” Some teachers review the new school texts everyyear then buy the most useful ones with their own moneyand photocopy them for their students, charging onlyfor the photocopying.
Although textbook evaluation was not the focus ofthis study, the issue was looked into. Whereas in 1990many children had to share textbooks, in the ten yearssince then the Ministry of Education has tripled thenumber of textbooks provided to schools and has statedthat in the school year beginning March 2000 all studentsin basic education will have their own textbooks. Effortsare also under way to improve textbook quality inconnection with the curriculum reform.
Given the centrality of textbooks to educationaloutcomes, why are they not better and what needs tobe done to change the situation? A big research studyby the Centro de Estudios Públicos (Centre for PublicStudies or CEP) provided an in-depth assessment of thequality of textbooks being used in Chilean schoolsreceiving government subventions.15 The CEP study puttogether two commissions: one to evaluate mathematicstexts and another to evaluate Spanish languagetextbooks. The expert panel included people from rich,middle class and poor backgrounds, university teachers,users of mathematics and Spanish texts and schoolprincipals. They agreed that Chilean textbooks did notmeasure up to the foreign textbooks from countries likeSpain and England that were used for the purposes ofcomparison, and came up with conclusions andproposals regarding language and mathematics texts.
Textbook reform could be a relatively quick wayto make an impact on education quality at the studentlevel. Good textbooks can produce immediateimprovements in classroom and personal learning.There is not much in the way of choice among the textsavailable on the market. However, the Ministry isevaluating the bidding process and the texts being used.This is very welcome, but the critical issue remains thatChilean texts are below international standards and therecannot be a real change in the near future unless thebasic issue of standards is addressed. As basic educationis undergoing curricular reform, an accompanyingtextbook reform is an urgent priority.
15 See Eyzaguirre and Fontaine, eds. (1997).
C E P A L R E V I E W 7 2 • D E C E M B E R 2 0 0 0176
WHAT SCHOOLS TEACH US ABOUT EDUCATING POOR CHILDREN IN CHILE • BEVERLEY A. CARLSON
VIConclusion
The many lessons learned from the in-depth schoolvisits will be directly relevant for a significantproportion of the country’s subsidized primary schoolsand will be very important for improving the qualityand equity of primary education. The school interviewsshow that while quality factors are additive, someindividual factors make a great difference. These factorsare the critical ones to identify and understand becausethey are the ones that need to be acted on in the shortterm. The school stories show that the most important
factor at the school level is having a top-notch principalwith the authority to act. They also show that a stable,qualified and motivated teaching staff is the lifebloodof a good school and makes a measurable difference tostudent outcomes, whereas high teacher turnover andlow teacher qualifications and interest immediatelyresult in lower performance. The central problem thatfaces us is to attract and retain qualified teachers andtalented principals in poor or remote areas of Chile anddifficult inner city schools.

177C E P A L R E V I E W 7 2 • D E C E M B E R 2 0 0 0
WHAT SCHOOLS TEACH US ABOUT EDUCATING POOR CHILDREN IN CHILE • BEVERLEY A. CARLSON
Bibliography
García-Huidobro J. and C. Jara (1994): El programa de las900 escuelas, M. Gajardo (ed.), Cooperacióninternacional y desarrollo de la educación, Santiago,Chile, Ministry of Planning and Cooperation, Interna-tional Cooperation Agency/SIDA/Centre for EducationalResearch and Development.
Grissmer, D. (1999): Seminar on Class Size Effects: Assessingthe Evidence, its Policy Implications, and FutureResearch Agenda, Washington, D.C., RAND Corporation,September.
Lockheed, M. and A. Vespoor (1991): Improving PrimaryEducation in Developing Countries, Washington, D.C.,World Bank.
Martínez, R. (1996): La prueba SIMCE y la medición de lacalidad de la educación, Educación, eficiencia yequidad, Santiago, Chile, ECLAC/OAS/Ediciones SUR.
Mizala, A. and P. Romaguera (1998): Desempeño escolar yelección de colegios: la experiencia chilena, Workingdocuments, Economía series, No. 36, Santiago, Chile,University of Chile, Department of Industrial Engineer-ing, Centre for Applied Economics.
National Student Assistance and Scholarship Board (1998):JUNAEB, Red nacional de apoyo al estudiante, programas98.99, Santiago, Chile.
Olivares, J. (1996): Sistema de medición de la calidad de laeducación en Chile: SIMCE, algunos problemas demedición, Revista iberoamericana de educación, No. 10,Madrid, Organization of Ibero-American States forEducation, Science and Culture.
Partnership for Educational Revitalization in the Americas(1998): The future at Stake, Washington D.C., Inter-American Dialogue, April, mimeo.
Rojas, C. and J.M. Esquivel (1998): Los sistemas de medicióndel logro académico en Latinoamérica, LCSHD paperseries, No. 25, Washington, D.C., World Bank, LatinAmerican and Caribbean Regional Office, October.
Schiefelbein, E. and P. Schiefelbein (1998): Repetition andquality of education in Chile, L. Randall and J. Ander-son (eds.), Schooling for Success, New York, Sharpe.
Undurraga, C. (1998): Reforma educacional en Chile:perspectiva de cinco ministros, Washington, D.C., IDB,mimeo.
World Bank (1995): Priorities and strategies for education,Washington, D.C.
(1999): Educational Change in Latin America andthe Caribbean, World Bank strategy paper, Washing-ton, D.C., Latin America and the Caribbean Social andHuman Development.
Angell, A. (1996): Improving the quality and equity of edu-cation in Chile: The programme 900 escuelas and theMECE-básica, A. Silva (ed.): Implementing Policy Inno-vations in Latin America: Politics, Economics and Tech-niques, Washington, D.C., Inter-American DevelopmentBank (IDB).
Carlson, B. (2000): Achieving Educational Quality: WhatSchools Teach Us, Desarrollo productivo series, No. 64,Santiago, Chile, Economic Commission for LatinAmerica and the Caribbean (ECLAC), January.
Carlson, B. (ed.) (1999): Social Dimensions of EconomicDevelopment and Productivity: Inequality and SocialPerformance, Desarrollo productivo series, No. 56,Santiago, Chile, ECLAC, August.
Carnoy, M. and P. McEwan (1997): Public Investment inPrivate Schools: A Reconstruction of Educational Im-provements in Chile, Stanford, California, StanfordUniversity.
Chile, Ministry of Education (1996): Compendio deinformación estadística 1996 , Santiago, Chile,Department of Statistics.
(1998): Compendio de información estadística 1998,Santiago, Chile, Department of Statistics.
Cohen, E. (ed.) (1998): Educación, eficiencia y equidad: unadifícil convivencia, Educación, eficiencia y equidad,Santiago, Chile, ECLAC/Organization of American States(OAS)/Ediciones SUR.
Cox, C. (1997): La reforma de la educación chilena: contexto,contenidos, implementación, Documentos PREAL,No. 8, Santiago, Chile, Partnership for Educational Re-vitalization in the Americas.
ECLAC (1998): Social Panorama of Latin America, 1997,Santiago, Chile.
Espínola, V. (1996): Revisión de quince años de políticaeducativa en Chile: ajustes en función de la equidad,Santiago, Chile, ECLAC.
Eyzaguirre, B. and L. Fontaine (1999): ¿Qué nos dice el SIMCEde 8° Básico? Análisis y perspectivas, Documentos detrabajo series, No. 294, Santiago, Chile, Centre for Pub-lic Studies.
Eyzaguirre, B. and L. Fontaine (eds.) (1997): El futuro enriesgo: nuestros textos escolares, 1997, Santiago, Chile,Centre for Public Studies.
Gajardo, M. (2000): Reformas educativas en América Latina.Balance de una década, Partnership for EducationalRevitalization in the Americas paper, No. 15, Santiago,Chile, Partnership for Educational Revitalization in theAmericas, January.
García-Huidobro, J. (1999): La reforma educacional chilena,Santiago, Chile, Editorial Popular.

C E P A L R E V I E W 7 2 • D E C E M B E R 2 0 0 0178
WHAT SCHOOLS TEACH US ABOUT EDUCATING POOR CHILDREN IN CHILE • BEVERLEY A. CARLSON

179C E P A L R E V I E W 7 2 • D E C E M B E R 2 0 0 0
STATIC AND DYNAMIC EFFECTS OF MERCOSUR. THE CASE OF THE FOOTWEAR SECTOR • MARTA BEKERMAN AND PABLO SIRLIN
C E P A L R E V I E W 7 2
DECEMBER 2000
Static and dynamiceffects of Mercosur.
The case of thefootwear sector
Marta Bekerman
Pablo Sirlin
[email protected] for EconomicStructural Studies (CENES)Faculty of Economics,University of Buenos Aires
The static effects of trade creation or diversion are generallyheld to be the essential variable for evaluating the costs andbenefits of regional integration. However, it is the effects of adynamic nature that provide the most convincing argumentsin favour of integrating economies rather than opening themup unilaterally. The difficulties involved in measuring theseeffects make it necessary to isolate aspects that can providea basis for analysing the changes undergone by the differentproduction sectors and the consequences of these for thelevels and types of industrial organization, businessstrategies, technological modernization and the regionaldynamic, among other things. The footwear sector is veryuseful when it comes to analysing the effects of subregionalintegration, as it is a sector that displays rising trade flowswithin and outside the area, with small and medium-sizedenterprises (SMEs) playing an important role. It forms partof a larger production chain, and its competitiveness dependson systemic factors.This article consists of five sections. Section I describes themain characteristics of the footwear sector. Section IIanalyses the regulatory and microeconomic policyframework within which the sector operates nationally andsubregionally. Section III describes the structure andperformance of the sector in the 1990s. Section IV analysesthe static and dynamic effects that can be identified fromstatistical analysis and the fieldwork carried out in Argentina,Brazil and Uruguay.1 Lastly, by way of conclusion, sectionV deals with the inherited and acquired advantages of thefootwear industry.
1 These studies involved conducting the same standardized inter-view with around fifteen firms from each of the countries con-cerned and with the main business organizations in the sector.
C E P A L R E V I E W 7 2 • D E C E M B E R 2 0 0 0180
STATIC AND DYNAMIC EFFECTS OF MERCOSUR. THE CASE OF THE FOOTWEAR SECTOR • MARTA BEKERMAN AND PABLO SIRLIN
IBasic characteristics of the footwear sector
number of major international brands that supply theworld market through their own production plants indifferent locations (often in countries with cheap labour)or through production and/or marketing licences. Thesame is true, to a lesser extent, in the higher-qualitysegments of the formal footwear category.
Since price is a crucial feature of competition inthe sector, cost reduction is a key element in companies’competition strategies. Labour is a particularlyimportant cost since, despite the introduction of newautomated technologies, the production process is stilllabour-intensive. Consequently, the availability of low-wage labour has been a key factor in competitivenessfor this industry and in the shift of production fromdeveloped countries to economies with low-cost labour(first Taiwan, the Republic of Korea, Hong Kong andBrazil then, in a second stage, China, the Philippinesand Indonesia).
Similarly, the availability of raw materials (naturalleather) of the requisite quality and price has beenanother determining factor for competitiveness in theindustry, although it now seems to be declining inimportance as characteristics such as quality, design,delivery times and production efficiency come to thefore, and as the variety and quality of leather substitutesincrease (Da Costa, 1993).
From the technological point of view, the industryis highly diverse, and in many countries there are still agreat many small firms using traditional technology.Nonetheless, there are certain innovations –computer-aided design (CAD) and production– that have becomeincreasingly important to competitiveness and are beingadopted more and more widely in the sector. In somemarket segments, such as women’s footwear, that havea particularly wide and frequently changing model range,the introduction of CAD has enabled plants to achievethe flexibility of production needed to meet demand.
This paper is part of a wider project coordinated by the au-thors, the national studies on Argentina, Brazil and Uruguay hav-ing been carried out by CENES, FUNCEX (Centre for Foreign TradeStudies Foundation) and CINVE (Centre for Economic Research)
The footwear industry is part of a production chain thatbegins with cattle rearing and leather production and thenmoves on to the industrial phase, which comprises threestages: the cold-storage plant and slaughterhouse stage,then the tannery stage and, lastly, the manufacture ofleather goods, including footwear. If the footwearproduced is not made wholly from leather, themanufacturers concerned are also linked with the rubberand plastics production chain. In addition, footwearmanufacturing links back to a range of supportingindustrial activities, among them the production andimportation of footwear parts and components, cardboardboxes and machinery and equipment for the industry.
The output of the sector is not homogeneous. Notonly is the product range highly varied (sports, formalor special shoes, shoes for men, women or children,shoes made entirely of leather, plastic or rubber or acombination of these, etc.), but within a single categoryof footwear products are differentiated by quality,brand, etc. This variety has led to considerablesegmentation of the footwear market, which determinesthe characteristics of competition in the sector.
Price competition is very important, particularlywhere lower-quality footwear is concerned. Withhigher-quality footwear, product differentiation is thekey factor. In the sports footwear category, brand imageplays a fundamental role and advertising and marketingcosts are consequently a central feature.
In the formal footwear segment economies of scaleare not decisive (something that has not been changedby the technological innovations that are beingintroduced into the industry) and in many countriesfootwear production is carried out mainly by SMEs.Economies of scale seem to be more important in thesports footwear segment, so plants tend to be larger.Again, the importance of brands means that the worldmarket for sports footwear is dominated by a small
respectively operating as part of the INTAL (Institute for the Inte-gration of Latin America and the Caribbean) RedInt network ofcentres. The authors are grateful for the comments of one of theanonymous assessors working at the CEPAL Review.

181C E P A L R E V I E W 7 2 • D E C E M B E R 2 0 0 0
STATIC AND DYNAMIC EFFECTS OF MERCOSUR. THE CASE OF THE FOOTWEAR SECTOR • MARTA BEKERMAN AND PABLO SIRLIN
IIThe microeconomic policy framework
Provisional Measure 1569 to place certain restrictionson import financing, although these were eventuallyeased somewhat for Mercosur members (exceptionswere granted for imports of less than US$ 40,000 witha term of up to 89 days).2
2. Sectoral regulation and trade policies in thecontext of Mercosur
At the subregional level the relevant policy areas areconnected with the movement towards subregional freetrade in the sector, implementation of the commonexternal tariff, the reduction or elimination ofrestrictions or taxes on exports of hides within Mercosurand the harmonization of incentive policies amongmember countries.
Trade liberalization within Mercosur is a relativelyrecent process. Right from the outset, many of the mostsignificant tariff positions of Argentina and Uruguaywere on their respective lists of exceptions to intrazonaltrade liberalization and, once the Customs Union hadbeen set up in 1995, most of these positions came toform part of their adjustment regimes. Thus, it was onlyin 1995 that a gradual process of intrazonal tariffreduction began in the cases of Argentina and Uruguay,a process that ended in 1999 and 2000, respectively.Brazil also created obstacles to intrazonal free trade,essentially by means of Provisional Measure 1569 of1997 restricting import financing, which has alreadybeen touched upon.
The common external tariff for the footwear sectorwas originally 20%, a level similar to that of nominaltariffs in Argentina and Uruguay and slightly higherthan the Brazilian tariff. However, the pressure ofimports from outside Mercosur (mainly from South-East Asia) at a time of currency appreciation led theGovernments of Argentina and Brazil to place a numberof the sector’s products on their lists of exceptions to thecommon external tariff (with a timetable for reducingduties that was to bring them into line with the commonexternal tariff in 2001). In addition, Argentina has
1. National trade and sectoral regulation policies
During the import substitution industrialization phase,the Mercosur countries, and particularly Argentina andBrazil, developed a vast range of promotionalinstruments that combined high rates of trade protectionwith special investment incentive regimes and,subsequently, with instruments to stimulate exports. Inthe late 1980s came the first signs of a strategy changein economic policy which was to take hold at differingspeeds and with differing degrees of thoroughness inthe various countries.
In the 1990s, moves towards greater economicopenness in Argentina and Brazil began to result in asubstantial reduction in the nominal and actualprotection provided to the footwear sector. Despite thesegeneral tendencies towards rationalization anddeclining public-sector intervention in industrial policy,however, both countries still retain different policyinstruments that have benefited the sector.
In 1994 Argentina established specific minimumduties for a range of sports footwear categories, andthese were increased in 1995. In 1997 a safeguard clauseproviding for the application of specific minimumduties (from which the Mercosur countries areexempted) came into effect, and in November 1998 thiswas extended to provide for import quotas (if these areexceeded, specific duty levels double). Lastly, in 1999Argentina tried to implement para-tariff measuresdesigned to hinder imports, mainly from Brazil.
In the case of Brazil, incentives provided by thefederal Government overlap with those of stategovernments, which have greater powers to provide taxincentives than do their Argentine counterparts. Thefederal Government has taken a range of measures tosupport the sector. Between 1995 and 1998, the NationalDevelopment Bank (BNDES) set up an investmentfinancing programme for the sector with a preferentialinterest rate. Meanwhile, the Brazilian Governmentbegan to make more active use of external trade policy.In 1995 it placed a large number of tariff categoriesrelating to the footwear sector on the list of exceptionsto the common external tariff, and a tariff of 31% wasset for these, to be gradually reduced from 2000onwards. In April 1997 the federal Government used
2 This measure would have had serious effects on Argentineexports, as was confirmed by interviews with the Chamber andwith one of the companies exporting footwear to Brazil.

C E P A L R E V I E W 7 2 • D E C E M B E R 2 0 0 0182
STATIC AND DYNAMIC EFFECTS OF MERCOSUR. THE CASE OF THE FOOTWEAR SECTOR • MARTA BEKERMAN AND PABLO SIRLIN
lodged a national safeguard clause against imports offootwear originating outside the area, something that hasdeepened subregional differences as regards externaltrade policy and benefited trading partners within thearea. Thus, where the footwear sector is concernedMercosur has not yet become a true customs unions.
One issue that has given rise to conflict and intensenegotiations is the imposition by Argentina andUruguay of restrictions and taxes on leather exports.The Uruguayan restrictions were eventually lifted,while in Argentina a timetable has been laid down forreducing intrazonal export duties to zero by 2000.
Lastly, there is still the crucial problem of regu-latory discrepancies between the member countriesof Mercosur. Harmonization of industrial policies
within the area was laid down as one of the prioritiesin the 1991 Treaty of Asuncion, but very little progresshas been made so far. Against this background, thenoticeably more active approach being taken by thefederal and state governments of Brazil (mainlythrough the fiscal battle to attract investment) wouldappear to be creating a highly asymmetrical contextfor intraregional competition. This situation has beeninstrumental in complicating relations between theemployers’ organizations of the member countries,which are characterized more by conflict than bycooperation. Meanwhile, the lack of harmonizationin numerous areas of industrial policy is beingcompounded by non-compliance with communitydecisions already signed up to.
IIIStructure and performance of the sector
1. Structure of the footwear sector in Mercosur
The Mercosur footwear sector is composed of a veryheterogeneous collection of different-sized companies,a few large enterprises coexisting with numerous smalland medium-sized ones (tables 1 and 2).
In the three countries considered the structure ofthis sector takes the form of a pyramid, with a largebase of microbusinesses and small enterprises, asubstantial number of medium-sized firms and arelatively small number of large ones (tables 1 to 5).
Leaving aside this similarity, there are largedifferences between the different Mercosur countriesas regards the number of companies operating in thesector (8,500 in Brazil, 1,400 in Argentina, 117 inUruguay) and in their size: the number of companieswith more than 100 employees is 435 in Brazil, 30 inArgentina and just 2 in Uruguay.
In Argentina there is a clear distinction betweenthe sports footwear and the non-sports footwear seg-ments. The sports footwear segment is highly concen-trated: at one extreme there are two big producers ofbranded sports footwear (Alpargatas Calzados S.A. andGatic S.A.), whose various plants around the countryaccount for 95% of all footwear of this type producednationally (CLAVES, 1997). These companies are li-censed by the main international brands (Nike in thecase of Alpargatas Calzados S.A. and Adidas, New
TABLE 1
Argentina: Concentration in the footwearsector, 1993(Argentine pesos)
Size of firm by Number of Percentage of sectoralgross output value firms output by gross value
Under 1 million 1.222 231 to 5 million 136 275 to 20 million 23 20Over 20 million 7 30
Source: Prepared by the authors using data from the NationalInstitute of Statistics and Censuses (1994).
TABLE 2
Brazil: Concentration in the footwearsector, 1995
Size of firm by Number Total Total turnovernumber of of firms employees (millions of reals)employees
Under 10 6 334 16 174 26610 to 49 1 387 30 874 43850 to 99 344 24 200 349100 to 249 259 40 535 644Over 250 176 177 170 3 220
Total 8 500 288 953 4 917
Source: Correa (1999).

183C E P A L R E V I E W 7 2 • D E C E M B E R 2 0 0 0
STATIC AND DYNAMIC EFFECTS OF MERCOSUR. THE CASE OF THE FOOTWEAR SECTOR • MARTA BEKERMAN AND PABLO SIRLIN
Balance and Le Coq Sportif in the case of Gatic S.A.).In addition, Alpargatas Calzados S.A. has consolidateda brand of its own (Topper) which it sells not just inArgentina but elsewhere in Latin America as well. Athird company (Unisol S.A.) produces sports footwearunder the Puma and Lotto brands, although on aconsiderably smaller scale. At the other extreme, thereare a number of small firms producing lower-pricedsports footwear without international branding, whichthey sell in regional markets.
The non-sports footwear segment, which is subdi-vided by the type of user (men, women, children) andby product quality and price, is highly fragmented.There is just one leading firm (Grimoldi S.A.) whichworks with its own brands and foreign licences, butwhose output is no more than 10% of that of the bigsports shoe manufacturers. Besides this, there are a fewmedium-sized companies and a multitude of small oneswhose gross output is less than five million pesos.
In Brazil, three big groups of companies can beidentified in the footwear sector. The large producers(over 450 employees) specialize essentially in sportsfootwear and the bulk of their sales are in the domesticmarket; they produce under international licences andhave a few brands of their own that are established inspecific niches. At the other extreme, small firms andmicrobusinesses also operate in local markets, but usemore artisanal production methods.
Lastly, medium-sized enterprises (between 50 and449 employees) mainly concentrate on foreign marketsand tend to be located in the state of Rio Grande do Sul,specifically in the Valle de Sinos region, which has playeda vital role in the vigorous export performance of thesector.3 Footwear production in this region was startedoff by a conglomeration of small firms focused on thedomestic market. Over recent decades, this has turnedinto a group of different-sized companies that nowexport 70% of their output (Schmitz, 1997).
In Uruguay, there are just two big footwear pro-ducers (over 100 employees), which export most of theiroutput (one concentrates on the United States marketand the other on the Argentine one). Medium-sized andsmall enterprises basically produce for the domesticmarket and occasionally export.
2. Performance of the sector
a) Production and apparent consumption
In 1997, footwear production in the three Mercosurcountries being studied was US$ 4.2 billion at currentprices, of which Brazil accounted for 71%, Argentinafor 24% and Uruguay for 5%. The sector has devel-oped erratically, but there has been a clear medium-term tendency for production, and to a lesser extentapparent consumption, to stagnate or fall (figures 1 to 3).
From figures 1 to 3 the following general tenden-cies can be deduced for the period from 1991 to 1997:
– The trend in footwear production was erratic, witha tendency for output to stagnate (Argentina) orfall (Uruguay and Brazil).
– Apparent consumption was sluggish, even thoughgross output in the area increased substantiallyduring the period.
In the three countries studied there was a large increasein imports which eventually reversed the positive tradebalance that had traditionally been a feature of the sec-tor in Uruguay and Argentina. Imports also rose sub-stantially in the case of Brazil, but the trade balanceremained in surplus thanks to large export volumes.
b) Employment and productivity in the footwear in-dustry
According to the statistics available, the footwearindustry of the three countries studied employed around310,000 people in 1995. Of this total, 288,000 wereaccounted for by Brazil, 20,000 by Argentina and justover 2,000 by Uruguay.4
Between 1988 and 1998 the number of employeesin the sector fell greatly in all the countries analysed(by over 50% in Uruguay and 20% in Argentina). Thiswas the result of stagnant or falling output and risingproductivity (figures 4 to 6).
These charts show that productivity improvedconsiderably in the footwear industries of Brazil andArgentina and evinced great volatility in Uruguay.
TABLE 3
Uruguay: Concentration in the footwear sector, 1997
Size of firm by Number Percentage of totalnumber of employees of firms number of firms
Under 10 77 65.810 to 19 27 23.120 to 100 11 9.4Over 100 2 1.7
Source: Laens, Osimani and Failde (1999).
3 Between 1970 and 1990 Brazil increased its share of world leatherfootwear exports from 0.5% to 12.3%.
4 We believe that the employment figures for the sector may bedistorted by the informal nature of some of its activities.
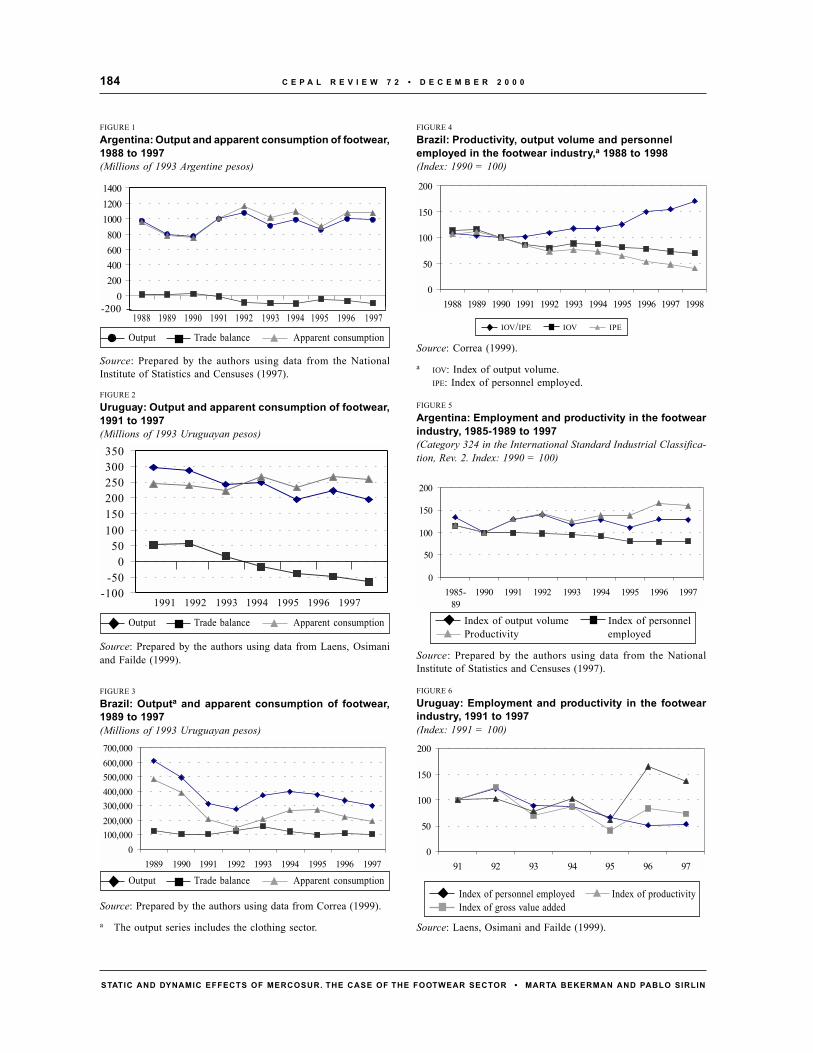
C E P A L R E V I E W 7 2 • D E C E M B E R 2 0 0 0184
STATIC AND DYNAMIC EFFECTS OF MERCOSUR. THE CASE OF THE FOOTWEAR SECTOR • MARTA BEKERMAN AND PABLO SIRLIN
FIGURE 3
Brazil: Outputa and apparent consumption of footwear,1989 to 1997(Millions of 1993 Uruguayan pesos)
0100,000200,000300,000400,000500,000600,000700,000
1989 1990 1991 1992 1993 1994 1995 1996 1997
Output Trade balance Apparent consumption
Source: Prepared by the authors using data from Correa (1999).
a The output series includes the clothing sector.
-100-50
050
100150200250300350
FIGURE 2
Uruguay: Output and apparent consumption of footwear,1991 to 1997(Millions of 1993 Uruguayan pesos)
1991 1992 1993 1994 1995 1996 1997
Source: Prepared by the authors using data from Laens, Osimaniand Failde (1999).
Output Trade balance Apparent consumption
0
50
100
150
200
1988 1989 1990 1991 1992 1993 1994 1995 1996 1997 1998
FIGURE 4
Brazil: Productivity, output volume and personnelemployed in the footwear industry,a 1988 to 1998(Index: 1990 = 100)
IOV/IPE IOV IPE
Source: Correa (1999).
a IOV: Index of output volume.IPE: Index of personnel employed.
FIGURE 5
Argentina: Employment and productivity in the footwearindustry, 1985-1989 to 1997(Category 324 in the International Standard Industrial Classifica-tion, Rev. 2. Index: 1990 = 100)
0
50
100
150
200
1985-89
1990 1991 1992 1993 1994 1995 1996 1997
Index of output volume Index of personnelProductivity employed
Source: Prepared by the authors using data from the NationalInstitute of Statistics and Censuses (1997).
0
50
100
150
200
91 92 93 94 95 96 97
FIGURE 6
Uruguay: Employment and productivity in the footwearindustry, 1991 to 1997(Index: 1991 = 100)
Index of personnel employed Index of productivityIndex of gross value added
Source: Laens, Osimani and Failde (1999).
FIGURE 1
Argentina: Output and apparent consumption of footwear,1988 to 1997(Millions of 1993 Argentine pesos)
0200400600800
100012001400
1988 1989 1990 1991 1992 1993 1994 1995 1996 1997-200
Source: Prepared by the authors using data from the NationalInstitute of Statistics and Censuses (1997).
Output Trade balance Apparent consumption
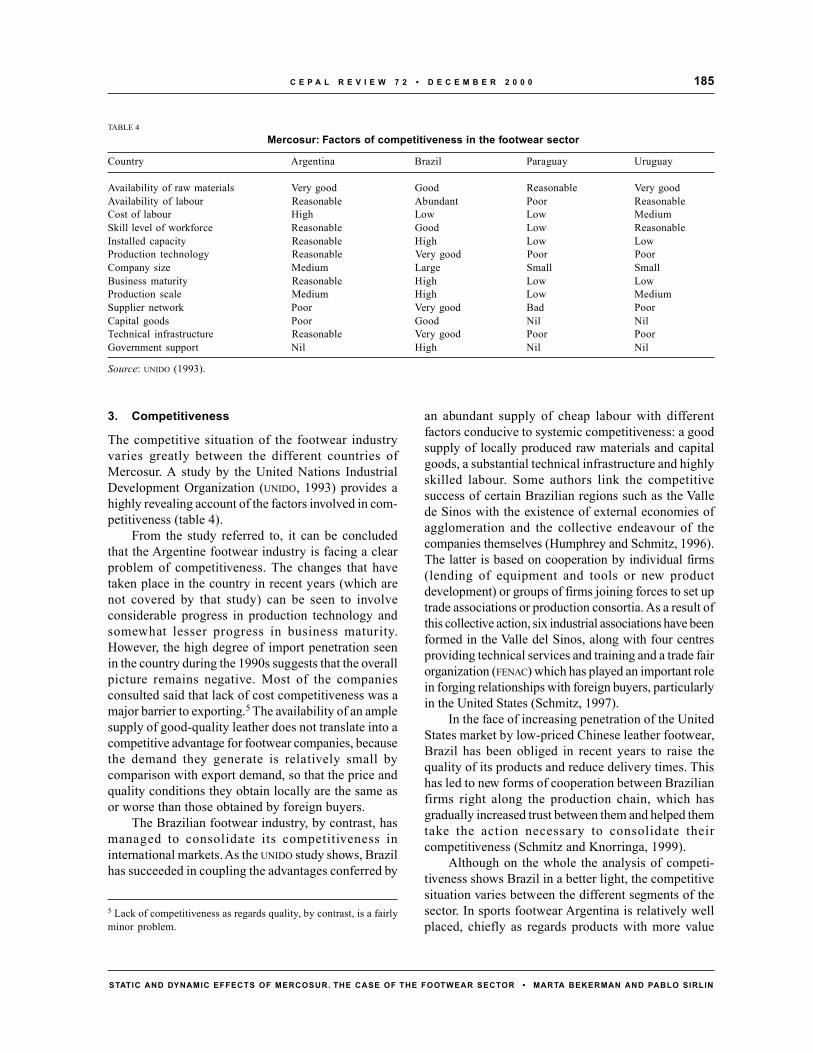
185C E P A L R E V I E W 7 2 • D E C E M B E R 2 0 0 0
STATIC AND DYNAMIC EFFECTS OF MERCOSUR. THE CASE OF THE FOOTWEAR SECTOR • MARTA BEKERMAN AND PABLO SIRLIN
3. Competitiveness
The competitive situation of the footwear industryvaries greatly between the different countries ofMercosur. A study by the United Nations IndustrialDevelopment Organization (UNIDO, 1993) provides ahighly revealing account of the factors involved in com-petitiveness (table 4).
From the study referred to, it can be concludedthat the Argentine footwear industry is facing a clearproblem of competitiveness. The changes that havetaken place in the country in recent years (which arenot covered by that study) can be seen to involveconsiderable progress in production technology andsomewhat lesser progress in business maturity.However, the high degree of import penetration seenin the country during the 1990s suggests that the overallpicture remains negative. Most of the companiesconsulted said that lack of cost competitiveness was amajor barrier to exporting.5 The availability of an amplesupply of good-quality leather does not translate into acompetitive advantage for footwear companies, becausethe demand they generate is relatively small bycomparison with export demand, so that the price andquality conditions they obtain locally are the same asor worse than those obtained by foreign buyers.
The Brazilian footwear industry, by contrast, hasmanaged to consolidate its competitiveness ininternational markets. As the UNIDO study shows, Brazilhas succeeded in coupling the advantages conferred by
an abundant supply of cheap labour with differentfactors conducive to systemic competitiveness: a goodsupply of locally produced raw materials and capitalgoods, a substantial technical infrastructure and highlyskilled labour. Some authors link the competitivesuccess of certain Brazilian regions such as the Vallede Sinos with the existence of external economies ofagglomeration and the collective endeavour of thecompanies themselves (Humphrey and Schmitz, 1996).The latter is based on cooperation by individual firms(lending of equipment and tools or new productdevelopment) or groups of firms joining forces to set uptrade associations or production consortia. As a result ofthis collective action, six industrial associations have beenformed in the Valle del Sinos, along with four centresproviding technical services and training and a trade fairorganization (FENAC) which has played an important rolein forging relationships with foreign buyers, particularlyin the United States (Schmitz, 1997).
In the face of increasing penetration of the UnitedStates market by low-priced Chinese leather footwear,Brazil has been obliged in recent years to raise thequality of its products and reduce delivery times. Thishas led to new forms of cooperation between Brazilianfirms right along the production chain, which hasgradually increased trust between them and helped themtake the action necessary to consolidate theircompetitiveness (Schmitz and Knorringa, 1999).
Although on the whole the analysis of competi-tiveness shows Brazil in a better light, the competitivesituation varies between the different segments of thesector. In sports footwear Argentina is relatively wellplaced, chiefly as regards products with more value
TABLE 4
Mercosur: Factors of competitiveness in the footwear sector
Country Argentina Brazil Paraguay Uruguay
Availability of raw materials Very good Good Reasonable Very goodAvailability of labour Reasonable Abundant Poor ReasonableCost of labour High Low Low MediumSkill level of workforce Reasonable Good Low ReasonableInstalled capacity Reasonable High Low LowProduction technology Reasonable Very good Poor PoorCompany size Medium Large Small SmallBusiness maturity Reasonable High Low LowProduction scale Medium High Low MediumSupplier network Poor Very good Bad PoorCapital goods Poor Good Nil NilTechnical infrastructure Reasonable Very good Poor PoorGovernment support Nil High Nil Nil
Source: UNIDO (1993).
5 Lack of competitiveness as regards quality, by contrast, is a fairlyminor problem.

C E P A L R E V I E W 7 2 • D E C E M B E R 2 0 0 0186
STATIC AND DYNAMIC EFFECTS OF MERCOSUR. THE CASE OF THE FOOTWEAR SECTOR • MARTA BEKERMAN AND PABLO SIRLIN
added and greater technological content. The lowerwage costs of Brazil are offset in Argentina by highquality and productivity.
Where non-sports footwear is concerned, thecompetitive situation of Argentina is much more fragilethan that of Brazil, owing both to macroeconomicvariables (wage levels and a high real exchange rate,the latter following the recent devaluation of the real)and to microeconomic ones (technological capabilities,economies of scale, workforce skill levels) and theposition as regards public-sector incentives. Problemsof competitiveness are found right along the Argentineproduction chain whereas, for the reasons referred to,the conditions for the supply of raw materials and inputs(except for leather) are better in Brazil, i.e., theproduction chain is better structured.
4. Mercosur trade with the rest of the world
a) Global exports and imports
The external footwear trade of Mercosur underwentmarked changes in the 1990s. Between 1990 and 1996the area’s exports grew by 42% (table 5) while importsincreased by 1,108%, albeit from a very low base(table 6). The regional trade of the sector continued toshow a substantial surplus (table 7).
The overall figures for the footwear sector inMercosur, though, mask very different nationalsituations. Brazil accounts for around 95% of footwearexports from the area and is the only country that stillhas a trade surplus in this sector.
In Argentina, substantial growth in footwearimports led to a large trade deficit from 1992 onwards.Trade restrictions and a significant increase in exportspartially reversed the deficit in 1995 and 1996.
The footwear industries of Uruguay and Brazilexport between 30% and 40% of their output by value.Argentina’s, on the other hand, has a very low exportcoefficient, as its focus is almost exclusively on thedomestic market.
b) Origin and destination of Mercosur external tradein footwear
The geographical origin and destination patterns offootwear exports from the different countries ofMercosur between 1988 and 1996 differed considerably(table 8). Over 90% of Brazil’s exports went outsidethe area and only a marginal (although growing) share
went to Mercosur countries. Argentina, on the otherhand, sent more and more of its exports to thesecountries (almost 75% in 1996), while its exports tothe rest of the world declined in absolute terms.Uruguayan exports followed a similar pattern, althoughto a lesser degree. From this it can be deduced thatexports to Mercosur have ended up by replacing theexports that the two latter countries used to send to therest of the world.
The imports of the Mercosur countries alsodisplayed differing geographical patterns (table 9). InBrazil, the share of intrazonal imports increased greatly,but imports from outside the zone remained muchhigher. In Argentina, the proportion of importsoriginating in Mercosur, mainly Brazil, also grewrapidly (to reach 50% in 1998). In Uruguay, however,the share of intrazonal imports fell over the 1990s.
5. Trade within Mercosur
a) Intrazonal exports and imports
As a result of the regional integration process, tradewithin Mercosur has been more dynamic thanextrazonal trade. In fact, exports (imports) within thezone rose by 570% between 1990 and 1996 (tables 10and 11).
The structure of intrazonal trade in the footwearsector, however, is very different from that of thesector’s overall trade. Up until 1996 the leading exportposition of Brazil, which accounted for 60% of intra-zonal exports in that year, was appreciably less markedin intrazonal trade than in trade with the rest of theworld. Argentina, by contrast, was far more dynamicas an exporter within the zone.
As regards intrazonal imports, the most salient factis that Brazil remained virtually closed to exports fromthe other Mercosur countries until 1994. Its imports(from Argentina) grew strongly from that year onwards,however, with the result that the structure of intrazonalimports came to resemble that of imports from outsidethe zone more closely. As a consequence of thesedevelopments, intrazonal trade balances were verydifferent from those with the rest of the world: Brazilhad a fairly modest surplus, while Argentina alternatedbetween deficits and surpluses in different years. From1997 onwards, the position of Argentina deterioratedsharply, with a growing deficit emerging in sectoraltrade with Brazil.
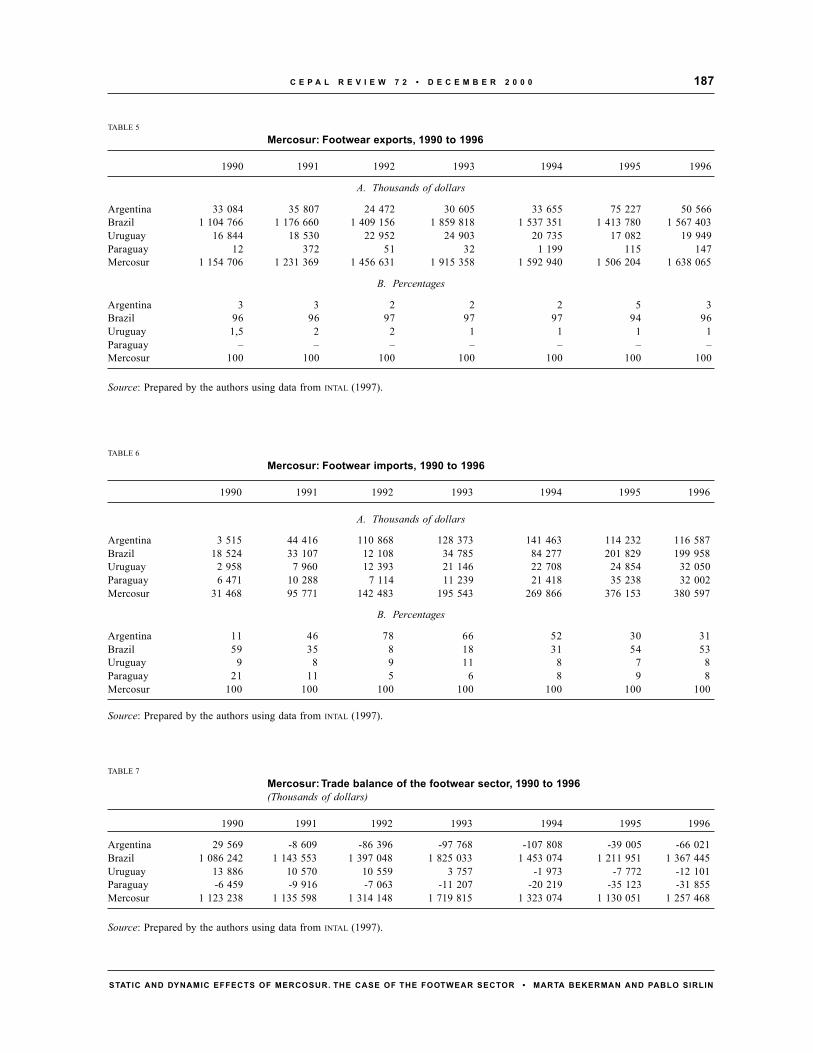
187C E P A L R E V I E W 7 2 • D E C E M B E R 2 0 0 0
STATIC AND DYNAMIC EFFECTS OF MERCOSUR. THE CASE OF THE FOOTWEAR SECTOR • MARTA BEKERMAN AND PABLO SIRLIN
TABLE 5
Mercosur: Footwear exports, 1990 to 1996
1990 1991 1992 1993 1994 1995 1996
A. Thousands of dollars
Argentina 33 084 35 807 24 472 30 605 33 655 75 227 50 566Brazil 1 104 766 1 176 660 1 409 156 1 859 818 1 537 351 1 413 780 1 567 403Uruguay 16 844 18 530 22 952 24 903 20 735 17 082 19 949Paraguay 12 372 51 32 1 199 115 147Mercosur 1 154 706 1 231 369 1 456 631 1 915 358 1 592 940 1 506 204 1 638 065
B. Percentages
Argentina 3 3 2 2 2 5 3Brazil 96 96 97 97 97 94 96Uruguay 1,5 2 2 1 1 1 1Paraguay – – – – – – –Mercosur 100 100 100 100 100 100 100
Source: Prepared by the authors using data from INTAL (1997).
TABLE 6
Mercosur: Footwear imports, 1990 to 1996
1990 1991 1992 1993 1994 1995 1996
A. Thousands of dollars
Argentina 3 515 44 416 110 868 128 373 141 463 114 232 116 587Brazil 18 524 33 107 12 108 34 785 84 277 201 829 199 958Uruguay 2 958 7 960 12 393 21 146 22 708 24 854 32 050Paraguay 6 471 10 288 7 114 11 239 21 418 35 238 32 002Mercosur 31 468 95 771 142 483 195 543 269 866 376 153 380 597
B. Percentages
Argentina 11 46 78 66 52 30 31Brazil 59 35 8 18 31 54 53Uruguay 9 8 9 11 8 7 8Paraguay 21 11 5 6 8 9 8Mercosur 100 100 100 100 100 100 100
Source: Prepared by the authors using data from INTAL (1997).
TABLE 7
Mercosur: Trade balance of the footwear sector, 1990 to 1996(Thousands of dollars)
1990 1991 1992 1993 1994 1995 1996
Argentina 29 569 -8 609 -86 396 -97 768 -107 808 -39 005 -66 021Brazil 1 086 242 1 143 553 1 397 048 1 825 033 1 453 074 1 211 951 1 367 445Uruguay 13 886 10 570 10 559 3 757 -1 973 -7 772 -12 101Paraguay -6 459 -9 916 -7 063 -11 207 -20 219 -35 123 -31 855Mercosur 1 123 238 1 135 598 1 314 148 1 719 815 1 323 074 1 130 051 1 257 468
Source: Prepared by the authors using data from INTAL (1997).
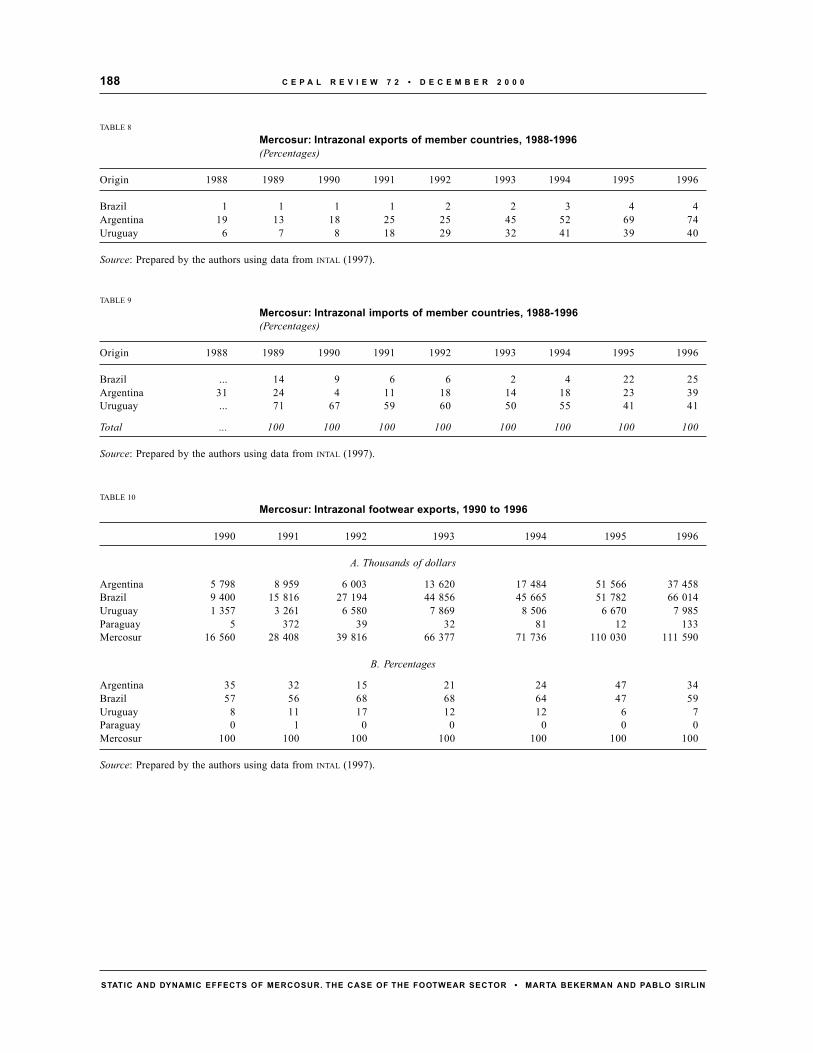
C E P A L R E V I E W 7 2 • D E C E M B E R 2 0 0 0188
STATIC AND DYNAMIC EFFECTS OF MERCOSUR. THE CASE OF THE FOOTWEAR SECTOR • MARTA BEKERMAN AND PABLO SIRLIN
TABLE 8
Mercosur: Intrazonal exports of member countries, 1988-1996(Percentages)
Origin 1988 1989 1990 1991 1992 1993 1994 1995 1996
Brazil 1 1 1 1 2 2 3 4 4Argentina 19 13 18 25 25 45 52 69 74Uruguay 6 7 8 18 29 32 41 39 40
Source: Prepared by the authors using data from INTAL (1997).
TABLE 9
Mercosur: Intrazonal imports of member countries, 1988-1996(Percentages)
Origin 1988 1989 1990 1991 1992 1993 1994 1995 1996
Brazil ... 14 9 6 6 2 4 22 25Argentina 31 24 4 11 18 14 18 23 39Uruguay ... 71 67 59 60 50 55 41 41
Total ... 100 100 100 100 100 100 100 100
Source: Prepared by the authors using data from INTAL (1997).
TABLE 10Mercosur: Intrazonal footwear exports, 1990 to 1996
1990 1991 1992 1993 1994 1995 1996
A. Thousands of dollars
Argentina 5 798 8 959 6 003 13 620 17 484 51 566 37 458Brazil 9 400 15 816 27 194 44 856 45 665 51 782 66 014Uruguay 1 357 3 261 6 580 7 869 8 506 6 670 7 985Paraguay 5 372 39 32 81 12 133Mercosur 16 560 28 408 39 816 66 377 71 736 110 030 111 590
B. Percentages
Argentina 35 32 15 21 24 47 34Brazil 57 56 68 68 64 47 59Uruguay 8 11 17 12 12 6 7Paraguay 0 1 0 0 0 0 0Mercosur 100 100 100 100 100 100 100
Source: Prepared by the authors using data from INTAL (1997).

189C E P A L R E V I E W 7 2 • D E C E M B E R 2 0 0 0
STATIC AND DYNAMIC EFFECTS OF MERCOSUR. THE CASE OF THE FOOTWEAR SECTOR • MARTA BEKERMAN AND PABLO SIRLIN
IVStatic and dynamic effects attributableto the zonal integration process
1. Analysis of economic effects of a static nature
Static-type analyses of integration and tradeliberalization processes generally seek to ascertain theextent to which these processes reduce the staticdistortions created by trade protection. From this pointof view, trade liberalization and zonal integration areundoubtedly bringing static benefits to the threecountries studied. Imports have grown considerably,displacing national production and increasing thevariety of products (in terms of both design and quality)
available to consumers. Furthermore, in the case ofArgentina average import prices have always beenlower than the estimated average prices of domesticproducts, so it might be said that competition fromimported products has disciplined domestic prices.
At the same time, the zonal integration and tradeliberalization processes would also appear to havegenerated static benefits on the export side, with thecountries of Mercosur increasing their exports of bothfootwear and leather (an area where Argentina andUruguay have comparative advantages in static terms).
TABLE 11
Mercosur: Intrazonal footwear imports, 1990 to 1996
1990 1991 1992 1993 1994 1995 1996
A. Thousands of dollars
Argentina 134 4 857 19 678 18 113 25 570 25 954 45 702Brazil 1 620 2 019 687 600 3 507 43 689 50 527Uruguay 1 975 4 732 7 473 10 540 12 495 10 096 13 141Paraguay 436 373 790 3 530 4 777 9 665 7 806Mercosur 4 165 11 981 28 628 32 783 46 349 89 404 117 176
B. Percentages
Argentina 3 41 69 55 55 29 39Brazil 39 17 2 2 8 49 43Uruguay 47 39 26 32 27 11 11Paraguay 10 3 3 11 10 11 7Mercosur 100 100 100 100 100 100 100
Source: Prepared by the authors using data from INTAL (1997).
TABLE 12Mercosur: Intrazonal trade balance of the footwear sector, 1990 to 1996(Thousands of dollars)
1990 1991 1992 1993 1994 1995 1996
Argentina 5 664 4 102 -13 675 -4 493 -8 086 25 612 -8 244Brazil 7 780 13 797 26 507 44 256 42 158 8 093 15 487Uruguay -618 -1 471 -893 -2 671 -3 989 -3 426 -5 156Paraguay -431 -1 -751 -3 498 -4 696 -9 653 -7 673
Source: Prepared by the authors using data from INTAL (1997).

C E P A L R E V I E W 7 2 • D E C E M B E R 2 0 0 0190
STATIC AND DYNAMIC EFFECTS OF MERCOSUR. THE CASE OF THE FOOTWEAR SECTOR • MARTA BEKERMAN AND PABLO SIRLIN
Hitherto we have dealt with the static effects ofthe general trade liberalization process at the extrazonallevel (unilateral liberalization) and at the intrazonal level(integration). We should now consider whether or notthe zonal integration process in itself has generatedbenefits of a static nature.
Assuming that the productive resources releasedby protected activities are spontaneously redeployedin sectors with genuine comparative advantages(generating greater profitability than in the past),Vinerian analyses tend to centre on the behaviour ofimports and on the way these displace imports fromother origins (trade diversion) or inefficient nationalproduction (trade creation). It needs to be asked, then,whether Mercosur has generated trade creation ordiversion.6 Using extrazonal and intrazonal imports asthe basis for analysis, the answers vary depending onthe period of analysis chosen.
One option is to compare the situation as it was inany year of the 1990s with what it was before theregional integration process began in January 1991.Since the Mercosur countries imported virtually nofootwear in the late 1980s, the answer will obviouslybe that there has been no trade diversion (imports thatnever existed cannot have been displaced).
A second option is to follow the sequence of zonaltrade liberalization and integration more closely. Whenthis is done the results are very different. The integrationprocess in the footwear sector has had a dynamic thatin some respects differs from that of the unilateral tradeliberalization process undertaken by the countries ofMercosur. Two major stages can be identified:
i) Between 1991 and 1994 unilateral trade liberalizationadvanced in the sector while the zonal integrationprocess had serious shortcomings (see section II).
ii) From 1995 onwards zonal integration (tariffpreferences) went forward while the unilateral tradeliberalization process was partially reversed.
When the situation in 1996-1997 is compared withthat in 1992-1994, the Argentine case shows some signsof trade diversion from the rest of the world to Brazil(table 13).
It is found, then, that with a production level thatis almost constant between the two averages, Argentinefootwear imports from the rest of the world fell by anaverage of US$ 24 million, while imports from Brazil
increased by US$ 33 million.7 The presumption thattrade diversion took place is given credence by thefieldwork done in Brazil, which points to the conclusionthat neither the type of footwear exported to Argentinanor the identity of the companies exporting it are thesame as are involved in Brazil’s exports to the rest ofthe world.
Something similar may have occurred in Brazil,although to a lesser degree. The change in trade policythat took place in 1995 may have contributed to thetransformation in the structure of import origin seenbetween 1995 and 1997: whereas imports from withinMercosur grew by US$ 18 million, imports from outsidethe zone fell by US$ 22.5 million.
In many cases, trade diversion (which always entailsa loss of static efficiency) is the result of trading behaviourthat reflects the dynamic gains (exploitation of economiesof scale, product specialization, dissemination oftechnological know-how, learning effects, etc.) resultingfrom the integration process. Unfortunately, as we shallsee in the following subsection, these dynamic gains havebeen relatively modest, so that the trade diversiondetected here needs to be evaluated essentially on thebasis of its static effects.
Considering the production complex as a whole,the orientation of trade growth in the context ofMercosur seems to have been towards greater productspecialization and consolidation of static comparativeadvantages. In this process, Brazil came to specializein the more labour-intensive segment (with greater valueadded) of the production chain (footwear) while
TABLE 13
Argentina: Imports from Brazil and from the rest of the world(Millions of dollars)
Annual average Annual average Differencefor the period for the period
1992-1994 1996-1997
Importsfrom Brazil
Importsfrom the restof the world
Local production
Source: Prepared by the authors using data from the NationalInstitute of Statistics and Censuses (1997).
13.0 46.0 +33.0
114.1 90.0 -24.1993.3 994.5 +1.2
7 Preliminary figures for 1998 show Brazil’s share of total Argen-tine footwear imports continuing to grow (to stand at 45%).
6 Although discussions couched in terms of trade creation and di-version are encountered throughout the specialist literature on thesubject, there are very difficult methodological problems involvedin arriving at empirical estimates.
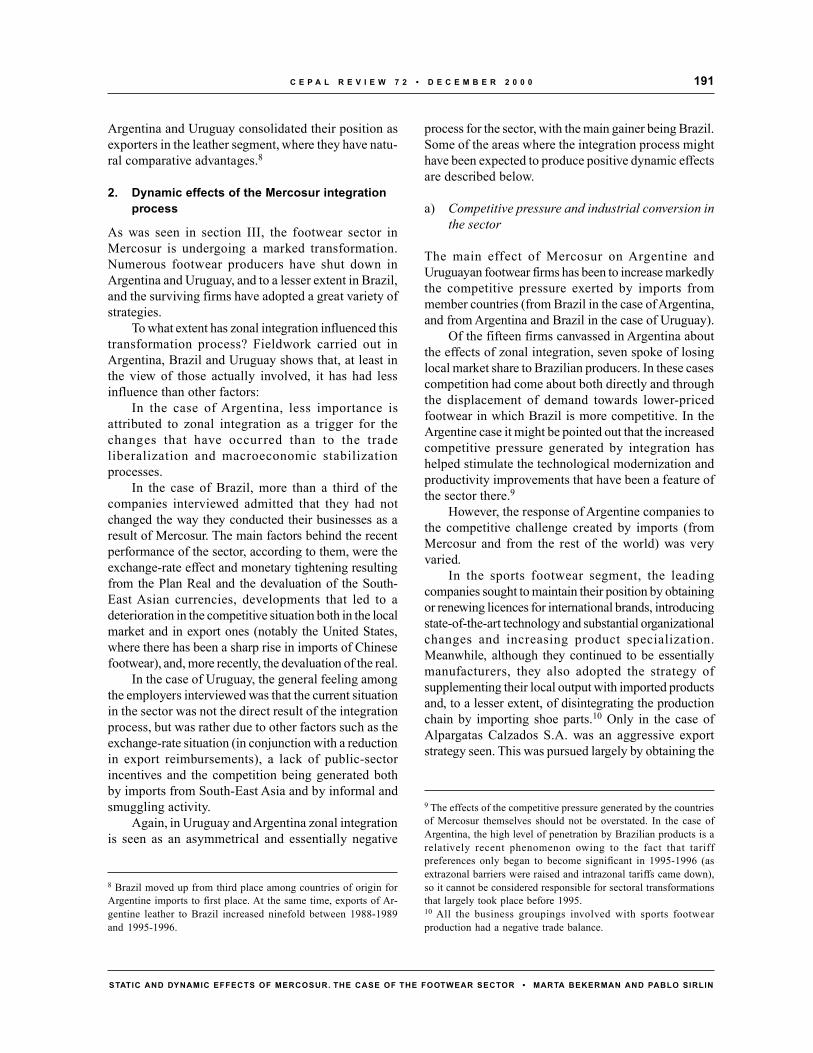
191C E P A L R E V I E W 7 2 • D E C E M B E R 2 0 0 0
STATIC AND DYNAMIC EFFECTS OF MERCOSUR. THE CASE OF THE FOOTWEAR SECTOR • MARTA BEKERMAN AND PABLO SIRLIN
Argentina and Uruguay consolidated their position asexporters in the leather segment, where they have natu-ral comparative advantages.8
2. Dynamic effects of the Mercosur integrationprocess
As was seen in section III, the footwear sector inMercosur is undergoing a marked transformation.Numerous footwear producers have shut down inArgentina and Uruguay, and to a lesser extent in Brazil,and the surviving firms have adopted a great variety ofstrategies.
To what extent has zonal integration influenced thistransformation process? Fieldwork carried out inArgentina, Brazil and Uruguay shows that, at least inthe view of those actually involved, it has had lessinfluence than other factors:
In the case of Argentina, less importance isattributed to zonal integration as a trigger for thechanges that have occurred than to the tradeliberalization and macroeconomic stabilizationprocesses.
In the case of Brazil, more than a third of thecompanies interviewed admitted that they had notchanged the way they conducted their businesses as aresult of Mercosur. The main factors behind the recentperformance of the sector, according to them, were theexchange-rate effect and monetary tightening resultingfrom the Plan Real and the devaluation of the South-East Asian currencies, developments that led to adeterioration in the competitive situation both in the localmarket and in export ones (notably the United States,where there has been a sharp rise in imports of Chinesefootwear), and, more recently, the devaluation of the real.
In the case of Uruguay, the general feeling amongthe employers interviewed was that the current situationin the sector was not the direct result of the integrationprocess, but was rather due to other factors such as theexchange-rate situation (in conjunction with a reductionin export reimbursements), a lack of public-sectorincentives and the competition being generated bothby imports from South-East Asia and by informal andsmuggling activity.
Again, in Uruguay and Argentina zonal integrationis seen as an asymmetrical and essentially negative
process for the sector, with the main gainer being Brazil.Some of the areas where the integration process mighthave been expected to produce positive dynamic effectsare described below.
a) Competitive pressure and industrial conversion inthe sector
The main effect of Mercosur on Argentine andUruguayan footwear firms has been to increase markedlythe competitive pressure exerted by imports frommember countries (from Brazil in the case of Argentina,and from Argentina and Brazil in the case of Uruguay).
Of the fifteen firms canvassed in Argentina aboutthe effects of zonal integration, seven spoke of losinglocal market share to Brazilian producers. In these casescompetition had come about both directly and throughthe displacement of demand towards lower-pricedfootwear in which Brazil is more competitive. In theArgentine case it might be pointed out that the increasedcompetitive pressure generated by integration hashelped stimulate the technological modernization andproductivity improvements that have been a feature ofthe sector there.9
However, the response of Argentine companies tothe competitive challenge created by imports (fromMercosur and from the rest of the world) was veryvaried.
In the sports footwear segment, the leadingcompanies sought to maintain their position by obtainingor renewing licences for international brands, introducingstate-of-the-art technology and substantial organizationalchanges and increasing product specialization.Meanwhile, although they continued to be essentiallymanufacturers, they also adopted the strategy ofsupplementing their local output with imported productsand, to a lesser extent, of disintegrating the productionchain by importing shoe parts.10 Only in the case ofAlpargatas Calzados S.A. was an aggressive exportstrategy seen. This was pursued largely by obtaining the
8 Brazil moved up from third place among countries of origin forArgentine imports to first place. At the same time, exports of Ar-gentine leather to Brazil increased ninefold between 1988-1989and 1995-1996.
9 The effects of the competitive pressure generated by the countriesof Mercosur themselves should not be overstated. In the case ofArgentina, the high level of penetration by Brazilian products is arelatively recent phenomenon owing to the fact that tariffpreferences only began to become significant in 1995-1996 (asextrazonal barriers were raised and intrazonal tariffs came down),so it cannot be considered responsible for sectoral transformationsthat largely took place before 1995.10 All the business groupings involved with sports footwearproduction had a negative trade balance.
C E P A L R E V I E W 7 2 • D E C E M B E R 2 0 0 0192
STATIC AND DYNAMIC EFFECTS OF MERCOSUR. THE CASE OF THE FOOTWEAR SECTOR • MARTA BEKERMAN AND PABLO SIRLIN
Nike licence to sell in Brazil and by exploiting thecompany’s own Topper brand in South American markets.
Smaller companies in this segment behaved dif-ferently: some of them shut down, others scraped by inlimited local markets and the rest were obliged tochange their line of business.
Now that prices have stabilized, however, andbrands have been strengthened by the use of licensees,the big transnational footwear companies have soughtto take back control of their brands in order to supplythe market with products imported from their factoriesin South-East Asia. Thus, the main domestic sportsfootwear producers have found it increasingly difficultto renew licences, and this is the biggest medium-termthreat to domestic production.
In the non-sports footwear segment, the situationof Argentine producers is different. The companiesinvolved are smaller and have found it more difficult tocome up with a coherent approach to restructuring.They have tended to concentrate on the domestic marketand increase product variety (despite the diseconomiesof scale) to capture different market niches. Again,smaller companies have not had the capacity to applymore defensive restructuring strategies, such as usingtheir marketing network to distribute imported footwearor import shoe parts. Medium-sized and larger companiesin this segment have made more use of such defensivestrategies, and in some cases the importing business hasbeen gaining more and more ground over localmanufacturing. By contrast with what has happened inBrazil, Argentine firms have made very little effort tocooperate among themselves, and the agreements thathave been arrived at have been short-lived.
A similar situation seems to have arisen in Uruguay,as the strategies the companies interviewed set storeby were specialization in producing for niches lessexposed to international competition (smart men’s shoesor country footwear) and use of their marketingnetworks to distribute imported products.11
In Brazil, on the other hand, zonal integration hasnot greatly added to the competitive pressure felt bylocal industry. For a large majority of the companiesinterviewed, imports from Mercosur that competed withtheir products accounted for less than 10% of the localmarket, and furthermore were stable or declining. None
of the firms consulted said they had reduced produc-tion because of intrazonal imports.
In conclusion, Mercosur has meant greatercompetitive pressure for companies in the footwearsector in Argentina (which is increasing as intrazonaltariff barriers come down) and in Uruguay, but the sameis not true for companies in Brazil. The effects of thisincreased competitive pressure on the strategic decision-making of Argentine and Uruguayan firms should notbe underestimated just because the tendency is a recentone in Argentina and not so marked (as regardsextrazonal imports) in Uruguay. In any event, theintrinsic weaknesses of the sector and the absence of afavourable environment have meant that this increasedcompetitive pressure has in the main been respondedto defensively, for example by producers graduallyturning themselves into importers. In the few caseswhere a more aggressive restructuring strategy has beenseen (for example in the case of Alpargatas CalzadosS.A. in Argentina), the outcome of this strategy will begreatly affected by the tendency of big internationalbrands to restrict the licences they grant to local firmsas time goes on.
b) Dealing with an expanded zonal market, capital-izing on economies of scale and coverage andlearning about exporting
The effects that the expansion of the subregional marketis having on Mercosur companies do not seem to becritical. They are most in evidence in Brazil and in afew isolated instances in Argentina and Uruguay.
Clearly, it is Brazilian firms that have taken thegreatest advantage of Mercosur to expand theirintrazonal exports: 40% of the firms approached saidthey had increased output thanks to Mercosur, while athird claimed that they had developed new productstailored to the preferences of consumers in othermember countries. Looking to the future, a third of thecompanies said that in future they would concentratetheir greatest selling efforts on the Mercosur countries.
Although intrazonal footwear exports increasedsubstantially in the late 1980s as a share of the total,the proportion of Brazil’s sectoral exports and totalfootwear output that they account for is still very low,at 8% and 4% respectively in 1998. Consequently, thepossible impact of these trade flows on production costsin the form of economies of scale should not be over-estimated. Nor have substantial changes been seen inbusiness behaviour (such as product specialization withcompanies in the zone, or mergers and acquisitions).
11 In this case, too, the impact that the increased competitivepressure generated by Mercosur may have had should be put inperspective, as imports from the rest of the world are moresignificant both absolutely and in terms of growth rates.
193C E P A L R E V I E W 7 2 • D E C E M B E R 2 0 0 0
STATIC AND DYNAMIC EFFECTS OF MERCOSUR. THE CASE OF THE FOOTWEAR SECTOR • MARTA BEKERMAN AND PABLO SIRLIN
It should be emphasized, though, that the exportopportunities opened up by Mercosur have enabledBrazilian firms that have traditionally focused on thedomestic market (including sports shoe manufacturers)to commence export operations, with the consequentlearning effects that may help them to expand theiroperations outside the zone in future. Again, somecompanies that have traditionally exported women’sfootwear have used the Argentine market to break intoown-brand exporting.
Argentine footwear firms have not yet succeededin exploring the large Brazilian market adequately. Onlythree of the fifteen Argentine firms surveyed said theyhad penetrated it. One of them (Alpargatas CalzadosS.A.) has achieved this essentially because of atemporary licence issued by Nike International tomarket its brand in Brazil, which casts doubt over thesustainability of the company’s activities in the comingyears.12 The other two firms, which have been exportingmid- and high-range non-sports footwear, have beenrelatively unsuccessful, either because of poorprofitability or because of non-payment problems partlybrought about by the import financing restrictionsimposed by the Brazilian Government.
Argentine firms have had greater success in theUruguayan market and, to a lesser extent, the Para-guayan one. However, it is difficult to specify how muchinfluence zonal integration has had on this process,since the same firms that say they export to Uruguayand Paraguay also export to other Latin American coun-tries where they do not enjoy any trade preference.Besides, the Uruguayan and Paraguayan markets aresmaller. Thus, for the companies consulted (except forAlpargatas Calzados S.A.), the prospects of achievinggreater economies of scale because of zonal integra-tion have been virtually nil. Sluggish exports, combinedwith loss of local market share and stagnant consump-tion, have also limited the prospects for profiting fromgreater product specialization.13
Meanwhile, most of the Mercosur companies thathave succeeded in exporting footwear within the zone
already had substantial exporting experience, so it canbe said that the impact of subregional integration onlearning has not been very significant.
In Uruguay, the subregional integration process hasgiven rise to an increase in the sector’s exports toArgentina but not to Brazil. Even so, the bulk ofUruguayan footwear exports still go to markets outsidethe zone.
The fact that the extrazonal exports of Argentinaand Uruguay dropped in absolute terms over the courseof the 1990s shows that subregional integration has notserved as a launch pad into new markets either.
In conclusion, it can be deduced that Mercosur hasgenerated some dynamic benefits in terms of productionscale, economies of coverage and export learningeffects, mainly in Brazil. The inability of the Uruguayanfootwear industry and the Argentine non-sportsfootwear segment to penetrate the Brazilian market haslimited these benefits for those two countries.
c) New technology, the dissemination of know-howand improved access to raw materials and inputs
One area in which there do seem to have been somepositive dynamic effects is the dissemination oftechnology and know-how. Five of the fifteen firmsinterviewed in Argentina had purchased capital goodsproduced in Brazil. Another three said they hadintroduced organizational techniques used in Brazilianfirms and, more significantly still, two firms declaredthey had hired Brazilian engineers or overseers to workon their industrial restructuring programmes. Anothereight, furthermore, said that zonal integration hadimproved access to raw materials and inputs.
None of the field studies, however, detected any“deep integration” initiatives, such as cooperationagreements going beyond mere distribution ofimported products, complementary productionsystems or the establishment of factories in otherMercosur countries (although distribution companieshave been set up).
12 The operations of this firm alone would account for almost theentire increase in Argentine footwear exports to the Brazilian marketsince 1995.13 In early 1993, UNIDO (1993) predicted that the Brazilian footwearindustry would dominate domestic markets for low-priced footwear
while Argentine and Uruguayan producers would do the same inthe higher segments. Six years on it could be seen that only thefirst part of the UNIDO forecast had become reality.

C E P A L R E V I E W 7 2 • D E C E M B E R 2 0 0 0194
STATIC AND DYNAMIC EFFECTS OF MERCOSUR. THE CASE OF THE FOOTWEAR SECTOR • MARTA BEKERMAN AND PABLO SIRLIN
VBy way of conclusion: inherited advantages andacquired advantages
capitalize on the natural comparative advantagesprovided by their leather industries to create dynamicadvantages in the next links of the production chain(footwear and leather goods). However, unilateral tradeliberalization tended to reinforce a form of trading basedon natural advantages, which translated into stronggrowth in leather exports and a marked deteriorationin the trade balance of the footwear sector.
The zonal integration process seems in manyrespects to have worked in the same direction as unilateraltrade liberalization. None of the static or dynamic benefitsthat could be generated by this process –and not by oneof unilateral trade liberalization– seem to have had adecisive influence in Argentina or Uruguay (except, sofar, growth in Argentine exports of sports footwear toBrazil). Nonetheless, from the way Argentine andUruguayan exports have behaved it can be seen thatMercosur has ended up becoming the destination forexports which previously went to the rest of the worldand which, for a variety of reasons, became lesscompetitive with the products of other supplier nations.
Meanwhile, the large initial differences in maturityand competitiveness that separated the region’sindustries, combined with major regulatory asymmetriesthat have not yet been subjected to community discipline,have prevented zonal integration giving rise to a form ofindustrial specialization that can provide a platform forcapturing new markets outside the zone. Thus, there is atendency towards entrenchment of a kind of sectoralspecialization in which Argentina and Uruguay reinforcetheir role as providers of leather while the market shareof Brazilian footwear in the region grows.
In Mercosur, macroeconomic developments,unilateral trade liberalization vis-à-vis the rest of theworld and the tendency for apparent consumption levelsto stagnate (Argentina) or fall sharply (Brazil) have ledto production and employment levels declining and to arelative deterioration in the trade balance of the sector(which is still positive, however, thanks to the solidexporting position that has been maintained by Brazil).
In future, if the aim is for the subregional integra-tion process to be justified by dynamic development ofthe footwear industry in all member countries, both
The footwear industries of the different Mercosurcountries entered the 1990s in very different positions.The Brazilian industry had created and consolidatedcompetitive advantages: its production chain was wellstructured (there were good suppliers of inputs andparts, companies producing capital goods for the sectorand specialist occupational training institutions) and itsexports had penetrated the main international markets.This progress was facilitated by a high geographicalconcentration of production, which made it possible tocapture externalities, and by the collective efforts ofcompanies themselves to resolve their competitiveproblems by setting up industrial associations, trainingcentres and trade organizations. Compared withcountries like Italy, however, Brazil does not appear tohave made much progress in developing its owndesigns, a situation that may limit its role in the sectorin future; interaction with Argentine companies in thisarea may help increase Brazilian potential.
The footwear industries of Argentina andUruguay, on the other hand, entered the 1990s in atotally different position. Firstly, macroeconomicinstability and the fitfulness of public- and private-sector export promotion efforts (which peaked in bothcountries in the mid-1970s) prevented them fromconsolidating their export position and thus restrictedtheir development to a relatively small and sluggishdomestic market. Secondly, the ingredients forsystemic competitiveness were not in place as, bycontrast with the situation in Brazil, the industriessupplying inputs and machinery could not developproperly owing to a lack of joint initiatives bycompanies. Lastly, institutional mechanisms forsupporting technological innovation andoccupational training were not strong enough.
In the case of Argentina, this situation in thefootwear sector contrasted greatly with that of theleather industry which, after a period of high investmentand modernization (in some cases sustained by largepublic-sector incentives), appeared to be competitiveand well equipped for exporting.
The great challenge for the Argentine andUruguayan footwear industries was to modernize and

195C E P A L R E V I E W 7 2 • D E C E M B E R 2 0 0 0
STATIC AND DYNAMIC EFFECTS OF MERCOSUR. THE CASE OF THE FOOTWEAR SECTOR • MARTA BEKERMAN AND PABLO SIRLIN
national governments and Mercosur as a whole willhave to consider:
i) putting in place the conditions for faircompetition within the subregion by harmonizinginvestment and export incentive policies and phasingout explicit and implicit trade barriers;
ii) developing national policies of a horizontalnature that facilitate the productive and technologicalrestructuring of companies in the sector, ensuring theyhave access to credit on competitive terms and can
introduce new technologies, improving managementcapabilities and decision-making and promoting theinternationalization of business strategies, and
iii) taking action in Mercosur to developcommunity policies that encourage intra-industryspecialization and complementary productionsystems, and to establish coordinated strategiesbetween companies so that these can compete withextrazonal suppliers both in local markets and in thoseof the rest of the world.
Bibliography
CLAVES (1997): Calzado e indumentaria deportiva. Informesectorial, Buenos Aires, mimeo.
Correa, P. (1999): Impacto setorial dos processos de integraçãosubregional. O caso de calçados, Rio de Janeiro, Centrefor Foreign Trade Studies Foundation, mimeo.
Da Costa, A.B. (1993): Competitividade da indústria decalçados. Estudo da competitividade da indústriabrasileira, Campinas, Brazil, State University atCampinas/Centre for Foreign Trade Studies Foundation.
Humphrey J. and Schmitz H. (1996): The triple C approachto local industrial policy, World Development, vol. 24,No. 12, Oxford, U.K., Pergamon Press.
INTAL (Institute for the Integration of Latin America and theCaribbean) (1997): Sistema de estadísticas de comerciode América, Buenos Aires.
Laens, S., R. Osimani and A. Failde (1999): Sector calzado.El caso de Uruguay, Montevideo, Economic ResearchCentre (CINVE), mimeo.
Ministry of Industry and Foreign Trade (1997): Sectorcalzados. Comercio exterior y medidas arancelarias,Buenos Aires, mimeo.
National Institute of Statistics and Censuses (1994): Censonacional económico, Buenos Aires.
(1997): Anuario estadístico, Buenos Aires.Schmitz, H. (1997): Collective Efficiency and Increasing
Returns, IDS Working Paper, No. 50, Brighton, U.K.,University of Sussex, Institute of Development Studies(IDS).
Schmitz, H., and P. Knorringa (1999): Learning from Glo-bal Buyers, IDS working paper, No. 100, Brighton, U.K.,University of Sussex, IDS.
UNIDO (United Nations Industrial Development Organization)(1993): Medium-term scenarios for industrial restruc-turing: the leather and footwear subsector, Vienna,mimeo.
(1995): International Yearbook of IndustrialStatistics 1995, Vienna.
(1996): International Yearbook of IndustrialStatistics 1996, Vienna.

C E P A L R E V I E W 7 2 • D E C E M B E R 2 0 0 0196
STATIC AND DYNAMIC EFFECTS OF MERCOSUR. THE CASE OF THE FOOTWEAR SECTOR • MARTA BEKERMAN AND PABLO SIRLIN
199C E P A L R E V I E W 7 2 • D E C E M B E R 2 0 0 0
THE ADJUSTMENT STRATEGIES OF MEXICAN EJIDATARIOS IN THE FACE OF NEOLIBERAL REFORM • BENJAMIN DAVIS
C E P A L R E V I E W 7 2
DECEMBER 2000
RecentECLACpublications
Periodicals
Social Panorama of Latin America 1999-2000, LC/G.2068-P,United Nations Publication, Sales number: E.00.II.G.18, ECLAC,Santiago, Chile, November 2000, 312 pages.
The 1999-2000 edition of the Social Panorama of Latin Americaexamines the growing social vulnerability of the population, themain features of the pattern of occupational stratification associatedwith newly emerging modes of development, the living conditionsof two particularly vulnerable groups, namely, children and ado-lescents, and older adults, and the institutional and social implicationsof drug production, trafficking and consumption in the region.
Social vulnerability is manifested in feelings of economicprecariousness, and of insecurity and defencelessness, which seemto overwhelm the majority of the population in many countries.This edition of the Social Panorama explores the objective reasonsunderlying this phenomenon, including the increasing instabilityof household income, which causes households to emerge fromand fall back into poverty, and the increasing precariousness of alabour market where fewer and fewer workers have permanent jobs,proper contracts or social security.
ECLAC has studied traditional and new patterns of occupa-tional stratification bearing in mind the impact they have on socialstratification. This edition of the Social Panorama presents the re-sults of a study on the main aspects of occupational stratificationin eight countries representing the wide range of situations to befound in the region. An analysis of labour income by occupationalcategory identifies three main strata accounting for 10%, 15% and75% of the working population (the exact figures differ from coun-try to country) and shows how these strata correlate with the edu-cational level and socio-economic status of the household con-cerned.
The chapter on older adults examines issues relating to thewell-being of this group, the living arrangements developing inresponse to the ageing of the population, the coverage provided by
social security systems, which are the main source of income forolder adults, the extent to which the latter participate in the labourforce and the impact of these factors on income distribution andthe poverty level of the households of which these adults are part.
The chapter on living conditions for children and adolescentslooks at the impact of economic growth in the 1990s on povertylevels affecting this segment of the population, the main risk fac-tors during early childhood and lags in terms of education.
The chapter dealing with the social agenda explores the prob-lems associated with drug production, trafficking and consump-tion in Latin America and discusses how this affects the quality ofpeople’s lives, how it exacerbates the problem of social exclusionand how drugs undermine the stability of the region’s institutionsand instil a sense of insecurity in the population.
Other publications
Financial globalization and the emerging economies, LC/G.2097-P,United Nations Publication, Sales number E.00.II.G.39, ECLAC,Santiago, Chile, May 2000, 328 pages.
One of the most dynamic features of globalization in recent yearshas been the increasing integration of financial markets. Capitalflows to emerging economies expanded rapidly, often leaving intheir wake financial crises that affected much of Asia and LatinAmerica.
There is broad recognition that financial instability is deeplyrooted in the way markets now operate and that in-depth analysisis urgently needed in order to come up with better solutions forcrisis prevention and management. Recent meetings of internationalfinancial institutions, of the G-7 and of a number of developingeconomy groupings have been devoted to this issue.
This collection of essays is the outcome of an internationalconference convened jointly by ECLAC and the International JacquesMaritain Institute of Rome, and held in Santiago, Chile, in 1999.The conference brought together policy makers, academics, mem-bers of international institutions and a variety of social actors.
The book is divided into four sections. The introduction con-tains the opening statements delivered at the conference. Part Ipresents a broad discussion of the issues and proposals on how toreform the international financial structure. Part II examines na-tional policies for addressing financial instability and the role theyplay in stabilizing capital flows. Part III sets forth the viewpointsof different social actors on financial globalization, together withtheir message to policy makers.

C E P A L R E V I E W 7 2 • D E C E M B E R 2 0 0 0200
THE ADJUSTMENT STRATEGIES OF MEXICAN EJIDATARIOS IN THE FACE OF NEOLIBERAL REFORM • BENJAMIN DAVIS