CEPAL Review No 128
213
ISSN 0251-2920 Monetary regimes and labour institutions: an alternative interpretation of the downward trend in exchange-rate pass-through in peripheral countries Martín Cherkasky and Martín Abeles 7 Models of the developmental state Luiz Carlos Bresser-Pereira 35 The development of venture capital in Latin America and the Caribbean: a comparative perspective Ernesto H. Stein and Rodrigo A. Wagner 49 The heterogeneity of effects of preschool education on cognitive outcomes in Latin America Juan Antonio Dip and Luis Fernando Gamboa 71 Economic growth and financial development in Brazil: a flexible regression model approach Filipe de Morais Cangussu Pessoa, Marcelo José Braga and Gabriel Alves de Sampaio Morais 91 The importance of terms of trade in the Colombian economy Andrés Felipe Oviedo Gómez and Lya Paola Sierra Suárez 113 Short- and long-term ex post evaluation of community-based environmental initiatives in Chile Cristian Mardones 143 A multidimensional approach to the well-being of the population of the states of Mexico Amilcar O. Fernández Domínguez and Denise Gómez Hernández 169 Inherited and social factors explaining early skills inequality: the case of Chilean children Ricardo Rivas 191 AUGUST • 2019
-
Upload
khangminh22 -
Category
Documents
-
view
1 -
download
0
Transcript of CEPAL Review No 128

ISSN 0251-2920
Monetary regimes and labour institutions: an alternative interpretation of the downward trend in exchange-rate pass-through in peripheral countriesMartín Cherkasky and Martín Abeles 7
Models of the developmental stateLuiz Carlos Bresser-Pereira 35
The development of venture capital in Latin America and the Caribbean: a comparative perspectiveErnesto H. Stein and Rodrigo A. Wagner 49
The heterogeneity of effects of preschool education on cognitive outcomes in Latin AmericaJuan Antonio Dip and Luis Fernando Gamboa 71
Economic growth and financial development in Brazil: a flexible regression model approachFilipe de Morais Cangussu Pessoa, Marcelo José Braga and Gabriel Alves de Sampaio Morais 91
The importance of terms of trade in the Colombian economyAndrés Felipe Oviedo Gómez and Lya Paola Sierra Suárez 113
Short- and long-term ex post evaluation of community-based environmental initiatives in ChileCristian Mardones 143
A multidimensional approach to the well-being of the population of the states of MexicoAmilcar O. Fernández Domínguez and Denise Gómez Hernández 169
Inherited and social factors explaining early skills inequality: the case of Chilean childrenRicardo Rivas 191
AUGUST • 2019


Alicia BárcenaExecutive Secretary
Mario CimoliDeputy Executive Secretary
Raúl García-BuchacaDeputy Executive Secretary
for Management and Programme Analysis
Osvaldo SunkelChairman of the Editorial Board
Miguel TorresEditor
AUGUST • 2019

Alicia BárcenaExecutive Secretary
Mario CimoliDeputy Executive Secretary
Raúl García-BuchacaDeputy Executive Secretary
for Management and Programme Analysis
Osvaldo SunkelChair of the Editorial Board
Miguel TorresEditor
The CEPAL Review was founded in 1976, along with the corresponding Spanish version, Revista CEPAL, and it is published three times a year by the Economic Commission for Latin America and the Caribbean (ECLAC), which has its headquarters in Santiago. The Review has full editorial independence and follows the usual academic procedures and criteria, including the review of articles by independent external referees. The purpose of the Review is to contribute to the discussion of socioeconomic development issues in the region by offering analytical and policy approaches and articles by economists and other social scientists working both within and outside the United Nations. The Review is distributed to universities, research institutes and other international organizations, as well as to individual subscribers.
The opinions expressed in the articles are those of the authors and do not necessarily reflect the views of ECLAC.
The designations employed and the way in which data are presented do not imply the expression of any opinion whatsoever on the part of the United Nations concerning the legal status of any country, territory, city or area or its authorities, or concerning the delimitation of its frontiers or boundaries.
To subscribe, please visit the Web page: http://ebiz.turpin-distribution.com/products/197587-cepal-review.aspx
The complete text of the Review can also be downloaded free of charge from the ECLAC website (www.cepal.org/en).
This publication, entitled CEPAL Review, is covered in theSocial Sciences Citation Index (SSCI), published by Thomson
Reuters, and in the Journal of Economic Literature (JEL),published by the American Economic Association
United Nations publicationISSN: 0251-2920LC/PUB.2019/11-PSales No.: E.19.II.G.13Distribution: GCopyright © United Nations, August 2019All rights reservedPrinted at United Nations, SantiagoS.19-00154
Requests for authorization to reproduce this work in whole or in part should be sent to the Economic Commission for Latin America and the Caribbean (ECLAC), Publications and Web Services Division, [email protected]. Member States of the United Nations and their governmental institutions may reproduce this work without prior authorization, but are requested to mention the source and to inform ECLAC of such reproduction.

Monetary regimes and labour institutions: an alternative interpretation of the downward trend in exchange-rate pass-through in peripheral countries
Martín Cherkasky and Martín Abeles . . . . . . . . . . . . . . . . . . . . . . . . . . . . . . . . . . . . . . . 7
Models of the developmental state
Luiz Carlos Bresser-Pereira . . . . . . . . . . . . . . . . . . . . . . . . . . . . . . . . . . . . . . . . . . . . . . 35
The development of venture capital in Latin America and the Caribbean: a comparative perspective
Ernesto H . Stein and Rodrigo A . Wagner . . . . . . . . . . . . . . . . . . . . . . . . . . . . . . . . . . . 49
The heterogeneity of effects of preschool education on cognitive outcomes in Latin America
Juan Antonio Dip and Luis Fernando Gamboa . . . . . . . . . . . . . . . . . . . . . . . . . . . . . . 71
Economic growth and financial development in Brazil: a flexible regression model approach
Filipe de Morais Cangussu Pessoa, Marcelo José Braga and Gabriel Alves de Sampaio Morais . . . . . . . . . . . . . . . . . . . . . . . . . . . . . . . . . . . . . 91
The importance of terms of trade in the Colombian economy
Andrés Felipe Oviedo Gómez and Lya Paola Sierra Suárez . . . . . . . . . . . . . . . . . . . . 113
Short- and long-term ex post evaluation of community-based environmental initiatives in Chile
Cristian Mardones . . . . . . . . . . . . . . . . . . . . . . . . . . . . . . . . . . . . . . . . . . . . . . . . . . . 143
A multidimensional approach to the well-being of the population of the states of Mexico
Amilcar O . Fernández Domínguez and Denise Gómez Hernández . . . . . . . . . . . . . . . 169
Inherited and social factors explaining early skills inequality: the case of Chilean children
Ricardo Rivas . . . . . . . . . . . . . . . . . . . . . . . . . . . . . . . . . . . . . . . . . . . . . . . . . . . . . . . . 191
Guidelines for contributors to the CEPAL Review . . . . . . . . . . . . . . . . . . . . . . . . 207
ECLAC recent publications . . . . . . . . . . . . . . . . . . . . . . . . . . . . . . . . . . . . . . . . . . . 208
Contents

Explanatory notes
- Three dots (...) indicate that data are not available or are not separately reported.- A dash (-) indicates that the amount is nil or negligible.- A full stop (.) is used to indicate decimals.- The word “dollars” refers to United States dollars, unless otherwise specified.- A slash (/) between years (e.g. 2013/2014) indicates a 12-month period falling between the two years.- Individual figures and percentages in tables may not always add up to the corresponding total because of rounding.

Monetary regimes and labour institutions: an alternative interpretation of the downward trend in exchange-rate pass-through in peripheral countries1
Martín Cherkasky and Martín Abeles
1 The authors are grateful for the contributions and suggestions provided by Francisco Arroyo Marioli, Pablo Bortz, Pablo Chena, Ariel Dvoskin, Germán Feldman, Gabriel Porcile, Juan Manuel Telechea, Fernando Toledo, Sebastián Valdecantos and Soledad Villafañe, and for the assistance provided by Alicia Pita in building the databases. The authors assume sole responsibility for any errors or omissions in this document.
Abstract
In recent years, several empirical studies have documented the decline in exchange-rate pass-through in peripheral countries. Conventional wisdom has interpreted this trend —verified in the last two decades— as the result of greater central bank credibility stemming from the implementation of formal inflation-targeting regimes. This paper offers an alternative interpretation, in line with the structuralist tradition, as it examines other instrumental transformations, concurrent with the establishment of inflation-targeting regimes, including ubiquitous labour market flexibilization. Empirical estimates for a set of peripheral countries for the period 1994–2016 show a marked correlation between the intensity of the exchange-rate pass-through and the weakening of labour market institutions.
Keywords
Foreign exchange rates, monetary policy, employment, labour market, developing countries
JEL classification
E02, E31, E58, J50
Authors
Martín Cherkasky is a Research Assistant in the Economic Commission for Latin America and the Caribbean (ECLAC) office in Buenos Aires. Email: [email protected].
Martín Abeles is Chief of the ECLAC office in Buenos Aires. Email: [email protected].

8 CEPAL Review N° 128 • August 2019
Monetary regimes and labour institutions: an alternative interpretation of the downward trend...
I. Introduction
Economists started off with an unshaken faith in their science as the source of verifiable explanations. Inflation was explained by factors that could be manipulated, that is, by
factors which could be adjusted without any change in people’s self-definitions: the level of demand, levels of taxation, size of government deficit, growth of money supply.
At the beginning of the 1980s, we are more ready to ask ourselves whether inflation isn’t largely fuelled by our political relations, in other words, in part by the self-definitions
implicit in our dominant practices.
Charles Taylor2
With the proliferation of inflation-targeting regimes in recent decades —which include the setting up of flexible exchange-rate schemes— the analysis of the relationship between exchange-rate fluctuations and inflation has gained prominence.3 In inflation-targeting regimes, exchange-rate pass-through needs to be minimized so that greater exchange-rate volatility resulting from a freely floating exchange rate does not hinder the attainment of low and stable inflation. Several recent studies have shown a downward trend in exchange-rate pass-through coefficients, which may explain why monetary authorities in many countries have tamed their “fear of floating” in implementing monetary policy.4
There are essentially two sorts of explanations of this downward trend in the literature. The first focuses on the decline in exchange-rate pass-through of import prices (Campa and Goldberg, 2005). This explanation suggests that one of the main reasons for the decline in pass-through coefficients is a change in the composition of imports, with a shift towards products whose prices are less sensitive to exchange-rate fluctuations because of the market power of importing companies and price discrimination in international markets. This approach suggests that higher product differentiation allows importing companies to reduce profit margins in order to maintain market shares, which allows for a lower pass-through.5 Another reason is the increasingly important role of the costs of non-traded services (whose prices are less sensitive to the exchange rate) in the value of traded products in developing countries, as countries become richer (Frankel, Parsley and Wei, 2012).
The second sort of explanation examines the reduction in exchange-rate pass-through to consumer prices in general (not just import prices) and highlights the role of expectations (Gagnon and Ihrig, 2004; Choudhri and Hakura, 2006; Carrière-Swallow and others, 2016; Devereux and Yetman, 2010; Bailliu and Fujii, 2004). The relevant studies are based on the theory put forward by Taylor (2000), according to which, in a model of staggered price setting and imperfect competition, price increases tend to be smaller when there is low inflation and a lower perceived persistence of cost changes. In this context, the credibility of the monetary authority becomes vital. In a monetary regime in which the official inflation target acts as the nominal anchor of the economy, central bank credibility depends on how effective
2 Taylor, 1985, p. 115.3 There are two basic requirements in inflation-targeting regimes: (i) the absence of fiscal dominance; and (ii) the absence of external
dominance. A logical consequence of the first requirement is central bank independence, which typically goes hand in hand with fiscal rules, including legal limits on the monetization of fiscal deficits. The second requirement entails that monetary policy should not target real exchange rates (e.g. for the sake of export promotion). Hence, inflation-targeting monetary regimes come with the establishment of freely floating exchange-rate regimes. It should be noted, however, that managed floating exchange-rate schemes tend to prevail in practice, with monetary authorities commonly intervening to limit short-term exchange-rate volatility, allegedly without interfering with the market determination of the real exchange rate in the long run.
4 Some authors suggest that central banks’ “fear of floating” is due to “fear of inflation”, especially in countries where exchange-rate pass-through is high (Schönerwald da Silva and Vernengo, 2008). In countries with floating exchange rates, this “fear of inflation” manifests as a relatively stricter policy response for limiting or containing depreciations compared with appreciations. In Latin America, this asymmetric policy response to exchange-rate movements seems to be more significant in countries such as Brazil and Mexico (Libman, 2018).
5 This explanation is based on pricing-to-market theory (Dornbusch, 1987; Krugman, 1987; and Marston, 1990).

9CEPAL Review N° 128 • August 2019
Martín Cherkasky and Martín Abeles
the monetary authority is perceived to be in meeting its goal (Choudhri and Hakura, 2001). A “credible” central bank is one which lets the official target guide agents’ inflationary expectations, regardless of exchange-rate fluctuations. Several studies have illustrated the statistical significance of monetary policy credibility in explaining lower exchange-rate pass-through in developing countries in recent years (Carrière-Swallow and others, 2016; Borensztein and Queijo von Heideken, 2016).6
Exchange-rate pass-through to consumer prices can be broken down into two rounds: a so-called first-round effect, which involves the impact of nominal exchange-rate variations on the prices of tradable goods and services that are directly or indirectly included in household consumption baskets; and a second-round effect, which involves the impact of nominal exchange-rate variations on the rest of the prices of goods and services.7 The strength of the second-round effect depends on the capacity (market power) of suppliers of those goods and services to recover the loss (directly or indirectly) inflicted by inflation in tradables. Wage adjustment may account for a significant share of that loss. Workers’ purchasing power is typically hit hard by exchange-rate depreciations. Assuming operative real wage resistance, the intensity of its inflationary (second-round) effect will ultimately depend on employers’ ability to pass the increase in wage costs on to retail prices.8
From a macroeconomic perspective, there is a direct relationship between the strength of exchange-rate pass-through to domestic prices and real wage resistance. The conventional wisdom is that, such resistance —as well as the ability of entrepreneurs to transfer rising costs to prices— depends on the economic cycle, in which monetary policy itself may play a major role. It also depends on levels of unionization and the type of labour market institutions prevalent in each country. Lower exchange-rate pass-through is more likely the result of the weakening of trade unions, the retreat of certain labour market institutions, or a combination of both, than of an increase in central bank credibility. This paper provides empirical evidence to support this alternative interpretation.
This working hypothesis is in line with the structuralist approach, whose analysis of inflation ascribes a decisive role to the institutions that regulate the distributive conflict (Kalecki, 1971; Rowthorn, 1977; Frenkel, 1984; Noyola, 1956; Sunkel, 1958; Olivera, 1967; Vernengo, 2003). It also ties in with the debate on the drop in inflation during the great moderation (1987–2007), a period characterized by the weakening of workers’ bargaining power.9 This approach highlights the type of institutional arrangements needed for the effective establishment of inflation targeting regimes. By transcending the strictly monetary sphere, this standpoint provides a better understanding of the relationship between the lower-inflation trend seen since the late 1980s, the weakening of labour market institutions and the concomitant fall in wage shares, in developed and developing countries alike. The importance given to labour market institutions in this paper is also found in other analytical frameworks, including the post-Keynesian perspective, the French Regulation School and the varieties of capitalism approach.
The article is divided into six sections, including this introduction. Section II presents an alternative interpretation to the traditional explanations of the decline in exchange-rate pass-through. Section III estimates the exchange-rate pass-through in rolling windows for a panel of 22 peripheral countries, based on the local projection method devised by Jordà (2005) and commonly used in the empirical literature (Carrière-Swallow and others, 2016; Caselli and Roitman, 2016). Section IV presents different approaches to operationalizing workers’ bargaining power and puts forward a strategy for estimating
6 In Carrière-Swallow and others (2016) monetary policy credibility is proxied by the divergence of professional inflation forecasts; in Borensztein and Queijo von Heideken (2016), it is defined as the difference between expected inflation (also resulting from professional forecasts) and the central bank’s inflation target.
7 First-round pass-through includes the inflationary effect of intermediate and final tradable goods and services that are used in the local production of consumer goods.
8 Real wage resistance is defined as the increase in nominal wages intended to offset, in part or in full, the loss of purchasing power resulting from past inflation.
9 Perry and Cline (2016) provide evidence of the critical role played by wage resistance in lowering inflation during the great moderation in the United States.

10 CEPAL Review N° 128 • August 2019
Monetary regimes and labour institutions: an alternative interpretation of the downward trend...
wage resistance. Section V assesses the statistical significance of the variables obtained in the previous stage in explaining exchange-rate pass-through, combined with a broader set of variables commonly used in the empirical literature. Section VI concludes.
II. Exchange-rate pass-through, distributive conflict and wage resistance
This paper adopts an alternative approach in the analysis of the decline in exchange-rate pass-through. In line with the structuralist approach, labour market institutions are conceived of as the most important factor in regulating the distributive conflict. Two statistical relationships are considered in order to assess the effects of currency devaluations on income distribution: (i) a static relationship between variables’ absolute levels, so as to show the distributive changes resulting from a modification of the real exchange rate; and (ii) a dynamic relationship, to examine the role of distributional conflict between local stakeholders and, in particular, of wage resilience.
We begin by introducing a cost-push pricing equation,10 in which, following Bastian and Setterfield (2017), import goods are introduced in line with the “producer approach”.11
P=(1+τ)(Wa + ePf b) (2.1)
Where P denotes the price of the local good, W is the nominal wage, e is the nominal exchange rate, Pf is the price of imported goods in foreign currency, a and b are the ratios for labour and imports, respectively, over the total product, and τ denotes the mark-up.
We then solve equation (2.1) and divide both sides by P to express wages and the exchange rate in real terms.
(1 + τ)Wa = P − (1 + τ) ePf b ⇒ (1 + τ)wa = 1 − (1 + τ) eRb (2.2)
Where w denotes the real wage and eR is the real exchange rate.
Equation (2.2) shows the distributive changes caused by a change in the real exchange rate in two extreme cases, assuming international prices and the production structure remain unchanged:
(i) Endogenous wages and exogenous mark-up rate:
w =
1-(1+τ) eRb
(1+τ)a (2.3)
dwdeR
τ=τ
= –ba <0 (2.4)
10 The presentation of price levels from a cost-push perspective is in line with the post-Keynesian, neo-Keynesian (Carlin and Soskice, 2006) and structuralist traditions.
11 There are two approaches to modelling inflation in an open economy (Bastian and Setterfield, 2017): (i) the consumer approach, which treats imports as final goods (Blecker, 1989 and 2011); and (ii) the producer approach, which treats imports as intermediate goods (Bhaduri and Marglin, 1990; Taylor, 2004).

11CEPAL Review N° 128 • August 2019
Martín Cherkasky and Martín Abeles
(ii) Endogenous mark-up rate and exogenous wages:
τ = 1–(wa+eRb)
wa+eRb (2.5)
dτ
deR w=w
= –b
(wa+eRb)2 <0 (2.6)
These two cases show that a change in the real exchange rate must be absorbed by the real wage, the mark-up rate, or a combination of both, given the cost structure and the international prices of imported goods.12 This is critical for differentiating between disinflation and the decline in exchange-rate pass-through. In the first case, wages, prices and exchange rates may increase at a steadily slower nominal rate as a result of better coordination of expectations (forcing each sector to reduce its income claims, but without a loss of real income);13 in the second case, lower exchange-rate pass-through to domestic prices necessarily implies that at least one local sector will experience some income loss after the currency devaluation (firms, workers or both).
This distinction is also important for understanding the role of macroeconomic policy. While setting a target during a disinflation process may facilitate the coordination of agents’ expectations, without necessarily changing in income distribution, a decline in exchange-rate pass-through requires that at least one local sector reduce its real income. Hence, central bank credibility may reduce exchange-rate pass-through, provided that its expected response to a devaluation is a contractionary monetary policy, which increases unemployment and reduces the wage share. Alternatively, the credibility of disinflation measures may be based on the ability to diminish workers’ bargaining power through labour market flexibilization. Cornwall (1990) and Setterfield (2006b) define the latter as “incomes policy based on fear”.
Next, a two-equation system is used to illustrate the dynamic relationship between wages and prices after a devaluation in a conflicting claims framework. First, let the growth rate of nominal wages sought by trade unions depend on two elements: the difference between the desired real wage and the effective real wage, and inflation for the previous period (2.7a):
ŵt = μ1 (ωw – ωt–1 ) + μ2 p̂t–1 (2.7a)
Where ŵt is the rate of nominal wage increase, p̂t–1 is inflation in the previous period, ωw is workers’ desired real wage, μ1 is the parameter indicating how trade unions respond to the discrepancy between the desired real wage and the effective real wage, and μ2 is the parameter indicating to what extent unions can index wages on the basis of past inflation.
The first element reflects the gap in workers’ income aspirations. It is positive insofar as workers are unable to attain what they consider fair wages because of partial indexation. The second reflects size indexation, i.e. the extent of real wage recovery after an increase in nominal prices, following the specifications suggested by Arestis and Sawyer (2005), Neville and Kriesler (2008) and Lavoie (2014), who postulate that unions, due to fundamental uncertainty, operate in an adaptive expectations environment.14
12 Dvoskin and Feldman (2015) examine the negative link between real wages and the real exchange rate, for a given profit rate, in various production structures in Latin America.
13 In an ideal situation where there is consensus between workers and enterprises in the context of a “social bargain”, it might be possible to reduce inflation without changing the functional distribution of income (Cornwall 1990; Cornwall and Cornwall, 2001; Setterfield, 2006b).
14 If the second term in equation (2.7a) were replaced by a term denoting future expected inflation, there would be no change in the long-term equilibrium between inflation and real wages, which depends solely on the income aspiration gap. In other words, if the wage adjustment requested by workers is lower than past inflation because it is based on expectations of lower inflation in the future, the difference would be reflected in a greater increase in nominal wages in subsequent periods, owing to a wider gap between the desired real wage and the effective real wage.

12 CEPAL Review N° 128 • August 2019
Monetary regimes and labour institutions: an alternative interpretation of the downward trend...
Parameters μ1 and μ2 represent workers’ bargaining power and can be expressed as a function of other variables. In the expression proposed by Rochon and Setterfield (2007) and Vera (2014), workers’ bargaining power depends on the unemployment rate. However, in Setterfield’s specification (2006a), workers’ bargaining power depends on institutional changes in the labour market.
Second, it is assumed that the inflation rate is affected by three factors: the income aspiration gap, wage costs and the cost of imported goods. The first component shows that firms have a target mark-up on unit production costs, which can be expressed in terms of real wages.15 The second component of the price equation corresponds to wage costs. For the sake of simplicity, labour productivity is assumed to remain constant so that changes in labour costs depend solely on nominal wages.16 The third and fourth components refer to the effect of changes in the nominal exchange rate and international prices of tradable goods.
p̂ t =φ1 (ωt–1 – ωf ) + φ2�t + φ3êt + φ4 p̂tf (2.8a)
Where ê denotes nominal exchange-rate variation, φ1 is the parameter indicating firms´ response to differences between the effective and the desired real wage, φ2 is the parameter indicating the direct effect of labour costs on prices, φ3 is the parameter indicating the direct effect of the exchange rate on inflation, and φ4 denotes the direct effect of the international price of tradable goods.
In addition, the target real wages of workers and firms can be defined as depending on an exogenous component and the real exchange rate, in line with Bastian and Setterfield (2017).
ωw = [ωw 0 + μ2eRt-1 ] (2.9)
ωf = [ωf 0 – φ2eRt-1 ] (2.10)
This paper aims to weigh the effect of a devaluation on prices and wages, which amounts to estimating the effect of a temporary increase in the nominal exchange-rate variation over these variables. The shock can be assessed on the basis of two types of equilibrium: short-run and long-run equilibrium.
Short-run equilibrium may be defined as a position at which the shock’s effect is reflected in the variables’ variations over the short term, without necessarily reaching a stable relationship between the different variables. Under the above system, this equilibrium may be assumed to be achieved after one year, the typical interval for wage negotiations and adjustments.
Long-run equilibrium may be defined as a position at which variables return to a stable relationship after several periods of time n. In the system presented above, the income aspiration gap works as the attractor. A widening gap between worker’s desired and effective real wages causes nominal wages to increase faster than prices and the nominal exchange rate, until the real wage returns to a stable position. If the real equilibrium wage is computed according to the above equations, considering solely the income aspiration gap (see annex A1), it can be shown that a change in the rate of variation in the nominal exchange rate, if temporary, does not affect the long-run real equilibrium wage (2.11).
15 This equation has been used by Dutt (1987), Sawyer (1982), L. Taylor (1985 and 1991), Sarantis (1990), Smithin (1994), Cassetti (2003), Setterfield (2006a and 2009) and Godley and Lavoie (2007), among other authors.
16 If changes in labour productivity were taken into account, the income aspiration gap would have to be expressed in terms of the wage share in total income, so that changes in productivity would also be included in the distributional conflict between workers and enterprises.

13CEPAL Review N° 128 • August 2019
Martín Cherkasky and Martín Abeles
ω* =
μ1ωw 0 + φ1ωf 0 + (μ1μ2 – φ1φ2 ) (ê + p̂f
t )(μ1 + φ1) – μ1φ1 (ωw 0 – ωf 0 )
μ1φ1 (μ2 + φ2 )μ1 + φ1
(2.11)
While long-run equilibrium is useful for analysing the trend of endogenous variables, it merely represents an ideal position, in which parameters are assumed to remain constant and are not affected by other shocks during the transition. Furthermore, the system described does not consider the interactions between distribution and employment and product, nor the equilibrium real exchange rate and its link to current account sustainability.
To simplify the analysis of a temporary increase in the nominal exchange rate, expressions (2.7a) and (2.8a) are adapted as (2.7b) and (2.8b), respectively, to represent a short-run equilibrium which shows the effect of devaluation on inflation without necessarily reaching stability. For this purpose, the terms associated with the income aspiration gap are replaced by constants (α0 and β0) so as to include their baseline level. This procedure assumes that inflation is determined only by nominal changes in costs and focuses attention on the dynamic relationship between prices and wages.
ŵt = α0 + α1p̂t–1 (2.7b)
p̂ t = β0 + β1êt + β2ŵt + β3p̂ ft
(2.8b)
Equation (2.7b) is then substituted into (2.8b), assuming short-run equilibrium as p̂ t = p̂t–1 and solving for p̂ t:
p̂ t = β0 + β1êt + β2α0 + β3p̂ f
t(1 – α1 β2 )
(2.12)
Lastly, we find the exchange-rate’s time derivative as an approximation of exchange-rate pass-through.
dp̂ t dêt
= β1 1
(1 – α1 β2 ) (2.13)
Two components can be distinguished in expression (2.13). The first is associated with the direct (or first-round) effect and is represented by the parameter β1. This effect indicates the extent to which exchange-rate movements are passed on to consumer prices because of changes in tradable goods prices. The second component is associated with the indirect (or second-round) effect. This effect depends on wage resistance (α1) and the weight of wages in unit production costs (β2).
17 From a structuralist perspective, the direct effect of devaluation on domestic prices can be regarded as the shock that pushes inflation over its initial equilibrium, and the second-round effects —primarily related to wage negotiation— can be seen as the propagation mechanism (Noyola, 1956; Furtado, 1963).
This paper’s hypothesis is that the decline in exchange-rate pass-through in recent decades is primarily attributable to lower wage resistance, which is explained by the reduction of workers’ bargaining power resulting from both the weakening of labour market institutions and the mechanisms that push up unemployment. These include the policies pursued by central banks with a view to achieving their inflation targets.
17 If the incidence of wages in unit production costs were to increase (accompanied by an equal and opposite decrease in the incidence of imports), and considering a pass-through of the price of imported products to consumer prices that exceeds wage resistance, the total pass-through of the exchange rate on consumer prices should decline.

14 CEPAL Review N° 128 • August 2019
Monetary regimes and labour institutions: an alternative interpretation of the downward trend...
To empirically evaluate the importance of wage resistance in determining exchange-rate pass-through to prices, the following reasoning follows three steps: (i) estimation of exchange-rate pass-through in the sample; (ii) estimation of wage resistance; and (iii) regression of exchange-rate pass-through coefficients, using wage resistance coefficients and a set of control variables that are commonly used in the literature as explanatory variables.
III. Evidence for the decline in exchange-rate pass-through
1. Estimation of total exchange-rate pass-through
To calculate the accumulated response of internal prices for one year, the total exchange-rate pass-through is estimated using Jordà’s local projection method (2005), a method used in recent studies measuring exchange-rate pass-through (Carrière-Swallow and others, 2016; Caselli and Roitman, 2016). The estimated specification is as follows:
lnpi,t+h–1 – lnpi,t–1 = β0 + ∑ jj=0 (βh1,j NEERi,t–j ) + βh
2 energyt +
βh3 foodt + βh
4,j pi,t–1 + βh5,j gapi,t + μh
i,t + ϵhi,t
(3.1)
Where p is the consumer price index, NEER is the logarithmic difference of the nominal effective exchange rate, energy and food are the logarithmic differences of the international price of energy and food, respectively, gap is the product gap, μ is a fixed effect per country, ϵ is an error term, h is the projection timespan, i denotes each of the countries included in the panel and j the number of lags. The number of lags considered for the exchange rate is one ( j=1) and the selected projection timespan is four quarters (h=4). This timespan (one year) is in line with the frequency of wage negotiations and adjustments, which is important when examining the second-round effects of exchange-rate variations. We are interested in β h=4
1,j=0, which represents the one-year cumulative exchange-rate pass-through to consumer prices.
The local projection method estimates the effect of the explanatory variable in “t” on the given variable in “t+h”, where “h” is the selected projection timespan. In this case, the dependent variable is expressed as the cumulative variation. The main advantage of the local projection method over the estimation using an autoregressive vector (VAR) model is that it is less sensitive to specification errors arising from introducing a growing number of regressors, lags and the projection timespan (Jordà, 2005; Teulings and Zubanov, 2014). The drawback is that the error term takes, by design, the structure of a moving average, introducing serial correlation and thus preventing standard statistical inference. Driscoll-Kraay standard errors are used to control for serial correlation.18
The specification uses the nominal effective exchange rate (NEER), a multicurrency indicator which covers more amply the scope of relative prices that affect the consumer price index (CPI). The use of the NEER is more relevant for countries that have weaker trading ties with the United States and whose trading partners’ currencies are more volatile against the United States dollar. In these cases, the difference between the NEER and the bilateral nominal exchange rate (BNER) tends to be greater.19 The inclusion of international food and energy prices allows for the control of imported inflation, the
18 See Driscoll and Kraay (1998).19 Carrière-Swallow and others (2016) and Caselli and Roitman (2016) also use the nominal effective exchange rate to estimate
exchange-rate pass-through.

15CEPAL Review N° 128 • August 2019
Martín Cherkasky and Martín Abeles
inclusion of past inflation allows for the control of inflationary inertia, while the inclusion of the GDP gap allows for the control of inflationary pressures generated by excess demand, in line with the conventional approach. Alternatively, the GDP gap could be used to control for the distributive conflict, given the absence of information regarding unit labour costs and unemployment rates. In this study, the GDP gap is proxied by the cyclical component of GDP, calculated by means of a Hodrick-Prescott filter. Lastly, fixed effects for each country are included to control for their specific, structural characteristics.
The sample period runs from 1994 to 2016, on a quarterly basis. The panel consists of 22 countries, primarily in Latin America and Eastern Europe (see table 1). Fifteen of these 22 countries have already implemented inflation-targeting regimes.20
Table 1 Countries included in analysis
Argentina India Romania
Bolivia (Plurinational State of) Indonesia Russian Federation
Brazil Malaysia South Africa
Bulgaria Mexico Thailand
Chile Philippines Turkey
Colombia Paraguay Uruguay
Croatia Peru
Hungary Poland
Source: Prepared by the authors.Note: Based on the International Monetary Fund classification of emerging and developing countries (2018).
The data sample includes episodes of sharp devaluation and/or hyperinflation (see table 2). Observations in which quarterly changes in the NEER and CPI are above 100% were excluded from the sample, together with the three subsequent observations which affect one-year cumulative inflation. While these observations are unlikely to pertain to customary wage negotiations and/or price-fixing, their inclusion as part of the sample tends to distort estimates. This treatment of the data is similar to that carried out by Caselli and Roitman (2016) and Fischer, Sahay and Vegh (2002).
Table 2 Descriptive statistics for panel data
Variable Observations Mean Standard deviation Minimum Maximum∆lnIPC 2 318 0.040 0.105 -0.038 2.144
∆lnTCNE 2 334 0.028 0.121 -0.379 1.753
∆lnPal 2 266 0.003 0.059 -0.304 0.163
∆lnPer 2 178 0.010 0.129 -0.627 0.262
ln(y/y*) 1 935 1.010 0.033 0.728 1.248
Source: Prepared by the authors on the basis of data from the International Monetary Fund (IMF), the Economic Commission for Latin America and the Caribbean (ECLAC), Bruegel and official information from the countries.
Note: ln(y/y*) is the cyclical component of the product, from which the gap is approximated.
Estimates carried out in 12-year rolling windows confirm the results found in the literature: exchange-rate pass-through to consumer prices declined from 0.52 in the period 1994–2005 to 0.16 in the period 2005–2016 (see figure 1). Estimates for different time horizons also show that the largest falloff in the exchange-rate pass-through is focused on the second and third quarters following a devaluation and that the exchange-rate effect stabilizes between the third and fourth quarters (see figure 2). This would suggest that the use of a four-quarter timespan is appropriate to measure the total effect.
20 Of these 15 countries, 13 had inflation-targeting regimes in place for over half of the 2001–2016 period: Brazil, Chile, Colombia, Hungary, Indonesia, Mexico, Peru, Philippines, Poland, Romania, South Africa, Thailand and Turkey. India adopted an inflation-targeting regime in 2016. Argentina an inflation-targeting regime in 2017 and suspended it in 2018.

16 CEPAL Review N° 128 • August 2019
Monetary regimes and labour institutions: an alternative interpretation of the downward trend...
Figure 1 Exchange-rate pass-through in peripheral countries, by rolling time windows
(Percentages)
0.52
0.31
0.16
0
0.1
0.2
0.3
0.4
0.5
0.6
1994–2005 1999–2010 2005–2016
Estitation windows
Source: Prepared by the authors. Note: Cumulative response of consumer prices one year after a 1% increase in the nominal effective exchange rate. The
following countries are included in the estimates: Argentina, Bolivia (Plurinational State of), Brazil, Bulgaria, Chile, Colombia, Croatia, Hungary, India, Indonesia, Malaysia, Mexico, Paraguay, Peru, Philippines, Poland, Romania, Russian Federation, South Africa, Thailand, Turkey and Uruguay.
Figure 2 Exchange-rate pass-through in peripheral countries, for different timespans
(Percentages)
0.06
0.130.16 0.16
0.21
0.43
0.51 0.52
0
0.1
0.2
0.3
0.4
0.5
0.6
h=0 h=1 h=2 h=3 h=4
2005–20161994–2005
Quarters after event
Source: Prepared by the authors. Note: Cumulative response of consumer prices one, two, three and four quarters after a 1% increase in the nominal effective
exchange rate. The following countries are included in the estimates: Argentina, Bolivia (Plurinational State of), Brazil, Bulgaria, Chile, Colombia, Croatia, Hungary, India, Indonesia, Malaysia, Mexico, Paraguay, Peru, Philippines, Poland, Romania, Russian Federation, South Africa, Thailand, Turkey and Uruguay.

17CEPAL Review N° 128 • August 2019
Martín Cherkasky and Martín Abeles
Estimates by region show that the decline in exchange-rate pass-through was widespread. Exchange-rate pass-through declined most steeply in Eastern Europe, from 0.86 to 0.17 between 1994–2005 and 2005–2016, and less steeply in Latin America from 0.34 to 0.18. Asian countries included in the study show the lowest exchange-rate pass-through in recent years (see figure 3).
Figure 3 Exchange rate pass-through by region
(Percentages)
0.34
0.86
0.42
0.25
0.57
0.09
0.18 0.17
0.08
0
0.1
0.2
0.3
0.4
0.5
0.6
0.7
0.8
0.9
Latin America Eastern Europe Asia
1994–2005 1999–2010 2005–2016
Source: Prepared by the authors. Note: Cumulative response of consumer prices one year after a 1% increase in the nominal effective exchange rate. Latin America
includes: Argentina, Bolivia (Plurinational State of), Brazil, Chile, Colombia, Mexico, Paraguay, Peru and Uruguay; Eastern Europe includes: Bulgaria, Croatia, Hungary, Poland, Romania, Russian Federation and Turkey; Asia includes: Philippines, India, Indonesia, Malaysia and Thailand.
In order to determine the extent to which the decline in exchange-rate pass-through can be attributed to greater central bank credibility, estimates were made for two groups of countries: those that had adopted inflation-targeting regimes for a prolonged period21 and those that had not or had recently implemented such regimes. The results indicate two things. First, exchange-rate pass-through falls in both types of countries (i.e. those that apply inflation-targeting regimes and those that do not). This may imply that the decline observed is the result of a broader, global process and not necessarily linked to increased central bank credibility. Second, the estimates show that the reduction in exchange-rate pass-through was greater in countries with inflation-targeting regimes in place (see figure 4). While this outcome suggests that the implementation of inflation-targeting regimes may have helped to reduce pass-through more deeply, it could also reveal that the effects of other potential determinants (such as trade liberalization or weaker labour regulation) were more strongly felt in this second group.
21 These are countries where inflation-targeting regimes were in place for more than half of the last window (2005–2016), meaning it was implemented in or prior to 2010. They are: Brazil, Chile, Colombia, Hungary, Indonesia, Mexico, Peru, Philippines, Poland, Romania, South Africa, Thailand and Turkey.

18 CEPAL Review N° 128 • August 2019
Monetary regimes and labour institutions: an alternative interpretation of the downward trend...
Figure 4 Exchange-rate pass-through, by monetary regime in peripheral countries
(Percentages)
0.48
0.56
0.32 0.30
0.26
0.13
0
0.1
0.2
0.3
0.4
0.5
0.6
Without inflation-targeting regimes With inflation-targeting regimes
1994–2005 1999–2010 2005–2016
Source: Prepared by the authors. Note: Cumulative response of consumer prices one year after a 1% increase in the nominal effective exchange rate. Countries
with inflation-targeting regimes (implemented in or prior to 2010) include: Brazil, Chile, Colombia, Hungary, Indonesia, Mexico, Peru, the Philippines, Poland, Romania, South Africa, Thailand and Turkey. Countries without inflation-targeting regimes (or with regimes implemented since 2011) include: Argentina, Bolivia (Plurinational State of), Bulgaria, Croatia, India, Malaysia, Paraguay, Russian Federation and Uruguay.
2. Measurement of the first-round effect
Once the total exchange-rate pass-through has been estimated, the question arises as to what extent the decline observed in recent decades was owed to the first-round effect, linked to the prices of tradable products, or the second-round effect, linked to non-tradables. It is therefore necessary to estimate the first-round effect separately. One benchmark indicator typically used in the literature for the first-round effect is the share of imported products in the household consumption basket.22
Input-output tables are used to measure the strength of first-round effects (Burstein, Eichenbaum and Rebelo, 2005; Carrière-Swallow and others, 2016; Gopinath, 2015), based Carrière-Swallow and others (2016), using data from the Eora multi-region input-output tables (Lenzen and others, 2012 and 2013).
The share of imports of final goods is obtained by calculating the ratio of consumption imports to total consumption. The share of intermediate imports is calculated by multiplying local production intended for private consumption by the share of intermediate imports per sector. The sum of all sectors is then calculated, and this is divided by total private consumption.
The import content of private consumption increased in the Latin American and Eastern European countries included in the panel (see figure 5). These results are in line with the growing importance of global value chains, which raised trade flows both into and from these countries. In Asian countries, however, this content remained stable.
Figure 6 shows that the recent decline in pass-through contrasts with the increase in the share of imported products. In Latin America and Eastern Europe, pass-through coefficients tend to move closer to the import content of household consumption. The data do not provide sufficient evidence to show
22 This benchmark assumes that the exchange-rate pass-through to the price of imported goods and services is complete and it excludes export goods that are part of the household consumption basket. Although empirical evidence shows that pass-through to imported products tends to be complete, in some cases it can be partial, as is typically the case in more differentiated goods (Campa and Goldberg, 2005).

19CEPAL Review N° 128 • August 2019
Martín Cherkasky and Martín Abeles
that there was no weakening of the first-round effect in these countries; however, they do suggest that the recent decline in pass-through is more closely related the second-round effects, i.e. to the price dynamics of non-tradable goods and services. To assess the extent to which the weakening of labour market institutions played a part in the lower second-round effect, in the following section we estimate a proxy for wage resistance.
Figure 5 Import content of private consumption, by region
(Percentages)
0.130.16
0.19
0.23 0.23 0.23
0
0.05
0.10
0.15
0.20
0.25
1994–2005 2005–2016 1994-2005 2005–2016 1994–2005 2005–2016Latin America Eastern Europe Asia
Final goodsIntermediate goods Total imports
Source: Prepared by the authors, on the basis of M. Lenzen and others, “Building EORA: a global multi-region input-output database at high country and sector resolution”, Economic Systems Research, vol. 25, N° 1, Abingdon, Taylor & Francis, 2013; and “Mapping the structure of the world economy”, Environmental Science & Technology, vol. 46, N° 15, Washington, D.C., American Chemical Society, 2012.
Note: Shows the share of intermediate, final and total imported goods in private consumption. Latin America includes: Argentina, Bolivia (Plurinational State of), Brazil, Chile, Colombia, Mexico, Paraguay, Peru and Uruguay; Eastern Europe includes: Bulgaria, Croatia, Hungary, Poland, Romania, Russian Federation and Turkey; Asia includes: Philippines, India, Indonesia, Malaysia and Thailand.
Figure 6 Exchange-rate pass-through and import content of private consumption, by region
(Percentages)
0
0.1
0.2
0.3
0.4
0.5
0.6
0.7
0.8
0.9
1994–2005 2005–2016 1994-2005 2005–2016 1994–2005 2005–2016
Latin America Eastern Europe Asia
Exchange-rate pass-through Imported component of private consumption
Source: Prepared by the authors. Note: The solid bars show the cumulative response of consumer prices one year after a 1% increase in the nominal effective
exchange rate. The plotted points show the share of intermediate and final imported goods in private consumption. Latin America includes: Argentina, Bolivia (Plurinational State of), Brazil, Chile, Colombia, Mexico, Paraguay, Peru and Uruguay; Eastern Europe includes: Bulgaria, Croatia, Hungary, Poland, Romania, Russian Federation and Turkey; Asia includes: Philippines, India, Indonesia, Malaysia and Thailand.

20 CEPAL Review N° 128 • August 2019
Monetary regimes and labour institutions: an alternative interpretation of the downward trend...
IV. Labour market institutions and wage resistance
In recent years, labour market institutions have been eroded globally (Berg, 2015). The expansion of the global work force resulting from the inclusion of China, India as well as the Russian Federation and the countries of the former Soviet Union to the global economy created upward pressure on unemployment and fostered labour flexibilization in virtually all countries, leading to worldwide intensification of wage discipline.
Greater labour flexibility shows up in various ways, including the promotion of non-standard employment (fixed-term employment or extension of probationary periods), reduction of job security (shortening of notice periods and reduction of severance pay), the decentralization of collective bargaining (elimination or suspension of national collective agreements), weakening of and interventions in collective bargaining (suspension of existing agreements and limitation of the duration of agreements) and weakening of trade unions (facilitating the conditions for non-union employee representatives to conclude collective agreements) (United Nations, 2016, pp. 7–8). Figure 7 shows the declining trend in collective bargaining coverage in a number of countries of the Organization for Economic Cooperation and Development (OECD).
Figure 7 Collective bargaining coverage
(Percentages)
62.257.5
53.9
0
10
20
30
40
50
60
70
80
90
100
1990–1999 2000–2009 2010–2016
Source: Prepared by the authors, on the basis of data from the Organization for Economic Cooperation and Development (OECD).Note: The rectangles and the central indicator denote the interquartile range and the median of the distribution, respectively. The
plotted points correspond to the mean for each period. Sample countries include: Australia, Canada, Czechia, Denmark, Finland, France, Germany, Greece, Hungary, Iceland, Japan, Luxembourg, Netherlands, New Zealand, Norway, Portugal, Republic of Korea, Slovenia, Spain, Sweden, Switzerland, Turkey, United Kingdom and United States.
The weakening of labour’s bargaining power is also related to financialization, in two possible ways (Stockhammer, 2013): (i) by increasing possibilities for investing in financial assets and abroad, thus reducing the incentives to invest in real domestic assets and inducing “short-termism”; and (ii) by empowering shareholders relative to workers, through changes in corporate governance as well as by the development of capital markets, which places emphasis on dividend payments and encourages cost-cutting strategies (Lazonick and O’Sullivan 2000).
Using trade openness as a proxy for the magnitude of globalization and the size of external assets and liabilities over GDP as a proxy for the spread of financialization, in line with Stockhammer (2013), it can be seen that both indicators —which are negatively associated with workers’ bargaining power—

21CEPAL Review N° 128 • August 2019
Martín Cherkasky and Martín Abeles
have trended upwards in recent years. The increase was more pronounced in countries that implemented inflation-targeting regimes, where the exchange-rate pass-through declined the most (see figures 8 and 9).
Figure 8 Globalization indicator
(Index: 1994–2005 window=100)
90
110
130
150
170
190
21020
05
2006
2007
2008
2009
2010
2011
2012
2013
2014
2015
2016
With inflation-targeting regimes Without inflation-targeting regimesTotal
Source: Prepared by the authors, on the basis of information from International Monetary Fund (IMF) and the World Bank.Note: Series correspond to indices for the 12-year moving average since 1994. The gross domestic product (GDP) used
as the denominator of the financialization indicator is adjusted for purchasing power parity (PPP). Countries with inflation-targeting regimes (implemented in or prior to 2010) include: Brazil, Chile, Colombia, Hungary, Indonesia, Mexico, Peru, the Philippines, Poland, Romania, South Africa, Thailand and Turkey. Countries without inflation-targeting regimes (or with regimes implemented since 2011) include: Argentina, Bolivia (Plurinational State of), Bulgaria, Croatia, India, Malaysia, Paraguay, Russian Federation and Uruguay.
Figure 9 Financialization indicator
(Index: 1994–2005 window=100)
90
110
130
150
170
190
210
2005
2006
2007
2008
2009
2010
2011
2012
2013
2014
2015
2016
With inflation-targeting regimes Without inflation-targeting regimesTotal
Source: Prepared by the authors, on the basis of information from International Monetary Fund (IMF) and the World Bank.Note: Series correspond to indices for the 12-year moving average since 1994. The gross domestic product (GDP) used
as the denominator of the financialization indicator is adjusted for purchasing power parity (PPP). Countries with inflation-targeting regimes (implemented in or prior to 2010) include: Brazil, Chile, Colombia, Hungary, Indonesia, Mexico, Peru, the Philippines, Poland, Romania, South Africa, Thailand and Turkey. Countries without inflation-targeting regimes (or with regimes implemented since 2011) include: Argentina, Bolivia (Plurinational State of), Bulgaria, Croatia, India, Malaysia, Paraguay, Russian Federation and Uruguay.

22 CEPAL Review N° 128 • August 2019
Monetary regimes and labour institutions: an alternative interpretation of the downward trend...
The trade openness (globalization) indicator is particularly relevant in linking the decline in exchange-rate pass-through with the weakening of labour market institutions if one considers that, from the point of view of pricing, trade liberalization must have increased competition between domestic and foreign firms (Benigno and Faia, 2016).
In any inflationary process, workers’ bargaining power is reflected in their ability to mitigate or offset their loss of real income over time. This aspect of the distributive conflict is fundamental for determining the intensity of the second-round effect caused by an increase in the exchange rate (see section II).
To assess changes in wage resistance in recent years, expression (4.1) was estimated using the local projection method and quarterly series of nominal wages using rolling windows (see annex A2) for a subset of 10 countries for which sufficient data are available.23,24
lnwi,t+h–1 – lnwi,t–1 = α0 + j
∑j=1
(αh1,j pi,t–j ) + αh
2pri,t + αh3ui,t + υi,t (4.1)
Where w is the nominal wage, p is the logarithmic difference of the consumer price index, pr is the logarithmic difference of labour productivity, u is the unemployment rate, υ is an error term, h is the projection timespan, i denotes each of the countries included in the panel and j the number of lags. The number of lags considered for the consumer price index is two ( j=2) and the selected projection timespan is four quarters (h=4). We are interested in αh=4
1,j=1, a parameter that reflects the extent of the cumulative response of nominal wages one year after an increase in consumer prices, which we use as a proxy for wage resistance.
Unemployment rates and labour productivity data were estimated as annual series by means of a Hodrick-Prescott filter (insufficiency of quarterly data did not allow for a higher frequency). Nominal wages were obtained from international organizations and national agencies (see annex A2).
The results show a reduction in wage resistance in recent years, which is consistent with the evidence of the weakening of labour market institutions and the decline in the exchange-rate pass-through for the same group of countries (see figure 10). These findings suggest that lower wage resistance to past inflation may have been a significant factor in the decline in pass-through.
The fall in wage resistance was most marked in countries with inflation-targeting regimes (see figure 11). This suggests that the greater decline in exchange-rate pass-through in these countries may be tied to lower wage resistance stemming from changes in labour market institutions. This result is also consistent with the steeper rise in the globalization and financialization indicators —which are negatively associated with workers’ bargaining power— in the group of countries with inflation-targeting regimes. This hypothesis is empirically tested in the following section.
23 Countries with quarterly nominal wages series covering a period of 20 years or more.24 The work of Vogel and others (2009) is a noteworthy antecedent. Vogel and others (2009) estimate the resistance of real wages
to changes in the terms of trade in the Group of Seven (G7) countries to analyse the second-round effects of inflation caused by the sharp rise in commodity prices that took place during the first half of 2008. An autoregressive distributed lag equation was used for the estimate, which suggests that real wage resistance as captured by the corresponding parameter declined after the 1970s.

23CEPAL Review N° 128 • August 2019
Martín Cherkasky and Martín Abeles
Figure 10 Exchange-rate pass-through, wage resistance and import content of private consumption
(Percentages)
0.49
0.18
0.81
0.58
0
0.1
0.2
0.3
0.4
0.5
0.6
0.7
0.8
0.9
1994–2005 2005–2016
Exchange-rate pass-through Wage resistance Imported component of private consumption
Source: Prepared by the authors. Note: The exchange-rate pass-through reflects the cumulative response of consumer prices one year after a 1% increase in
the nominal effective exchange rate. The import content indicates the share of intermediate and final imported goods in private consumption. Wage resistance indicates the cumulative response of nominal wages one year after a 1% increase in consumer prices. Country fixed effects are included in the estimations of exchange-rate pass-through and wage resistance. Countries included in the estimates are: Argentina, Brazil, Chile, Colombia, Croatia, Hungary, Poland, Romania, Russian Federation and Uruguay.
Figure 11 Exchange-rate pass-through, wage resistance and import content of private consumption,
by monetary regime(Percentages)
0.48
0.26
0.58
0.13
0.76
0.65
0.89
0.27
0
0.1
0.2
0.3
0.4
0.5
0.6
0.7
0.8
0.9
1.0
1994–2005 2005–2016 1994–2005 2005–2016
Without inflation-targeting regimes With inflation-targeting regimes
Exchange-rate pass-through Wage resistance Imported component of private consumption
Source: Prepared by the authors. Note: The exchange-rate pass-through reflects the cumulative response of consumer prices one year after a 1% increase in
the nominal effective exchange rate. The import content indicates the share of intermediate and final imported goods in private consumption. Wage resistance indicates the cumulative response of nominal wages one year after a 1% increase in consumer prices. Countries without inflation-targeting regimes include: Argentina, Croatia, Russian Federation and Uruguay. Countries with inflation-targeting regimes include: Brazil, Chile, Colombia, Hungary, Poland and Romania. Country fixed effects are included in the estimations of exchange-rate pass-through and wage resistance.

24 CEPAL Review N° 128 • August 2019
Monetary regimes and labour institutions: an alternative interpretation of the downward trend...
V. The link between wage resistance and exchange-rate pass-through
A similar strategy to that applied by Carrière-Swallow and others (2016) and Choudhri and Hakura (2006) was used to assess the determinants of exchange-rate pass-through in two steps. First, we estimated exchange-rate pass-through and wage resistance coefficients by equations (3.1) and (4.1), respectively, for each country, using 12-year rolling windows. Rolling windows begin in the first quarter of each year, starting in 1994. This means that we have used 12 windows, the first for 1994–2005, the second for 1995–2006, and the last for 2005–2016.
Second, we ran a regression between exchange rate pass-through coefficients and wage resistance coefficients obtained in the first (5.1 below). The globalization indicator (see section IV) and other variables which, according to the literature, may affect exchange-rate pass-through, such as the mean and standard deviation of inflation (inflation volatility) and the mean and standard deviation of exchange rate variation (exchange rate volatility), were also included as explanatory variables.25 The latter are also calculated for the same periods used for exchange rate pass-through and wage resistance. Estimates are conducted for a subset of 10 countries for which quarterly nominal wage data are available (see annex A2).
β h=41,i,τ = δχi,τ + ςτ + ϵi,τ (5.1)
Where β h=41,i,τ are the pass-through coefficients, and χi,τ and δ denote the explanatory variables
(the mean and standard deviation of inflation and of the rate of variation of the nominal exchange rate, the globalization indicator and wage resistance) and their respective coefficients. The observations pertain to each time window (τ) and country in the sample (i). The specification includes time fixed effects (ςτ).
The different estimates of equation (5.1) show that each of the explanatory variables is significant when included individually (see table 3, columns 1–6). When all explanatory variables are included together and the results are controlled for time fixed effects, average depreciation and the wage resistance indicator are significant (see table 3, column 7). When country fixed effects are also included to control for each country’s structural characteristics, exchange rate volatility, average inflation, the globalization indicator and wage resistance are significant (see table 3, column 8). Similar results are obtained and presented in annex A3, based on the bilateral nominal exchange rate instead of the effective nominal exchange rate.
The coefficients obtained for average depreciation, exchange-rate volatility and average inflation in the regressions where these variables are significant report a positive sign, as expected. This is also consistent with empirical literature: the greater the exchange-rate instability and the higher the starting level of inflation, the greater the pass-through coefficient.
Wage resistance is significant in the two regressions that include all variables (with and without country fixed effects) and the sign of the related coefficient is positive, in line with our working hypothesis: the lower the capacity (bargaining power) for a recovery in wages after a devaluation, the less intense the second-round pass-through will be. Additionally, the globalization indicator is significant in the regression that includes country fixed effects and its coefficient has a negative sign. This result can be interpreted as follows: as trade openness increases, there is more indirect competition between workers at the global level, the pressure for flexibilization of the local labour market increases, wage negotiating power decreases and second-round pass-through loses strength.
25 In the literature it is argued that as inflation and exchange-rate movements become more pronounced and more volatile, firms tend to adjust their prices more frequently and exchange-rate pass-through tends to increase.

25CEPAL Review N° 128 • August 2019
Martín Cherkasky and Martín Abeles
Table 3 Determinants of total pass-through of the nominal effective exchange rate
Dependent variable: β h=41,i,τ 1 2 3 4 5 6 7 8
Average depreciation 11.423*** 11.594*** 1.344
(1.58) (2.93) (3.15)
Nominal-effective-exchange-rate volatility
2.384*** -0.435 2.235**
(0.75) (0.74) (1.02)
Average inflation 10.710*** 2.468 7.636***
(1.16) (2.37) (2.65)
Inflation volatility 4.752*** -0.949 -1.466
(0.92) (1.33) (1.38)
Globalization indicator -1.051*** 0.132 -0.967***
(0.37) (0.10) (0.30)
Wage resistance 0.072*** 0.079** 0.100***
(0.03) (0.04) (0.04)
Country fixed effects No No No No No No No Yes
Time fixed effects Yes Yes Yes Yes Yes Yes Yes Yes
Observations 118 118 118 118 118 118 118 118
R-squared 0.861 0.805 0.886 0.832 0.802 0.808 0.820 0.910
Source: Prepared by the authors. Note: The dependent variable is the estimated total pass-through to consumer prices for the time window τ and country i. The
standard error is shown in parentheses. Significant at 1% (***), significant at 5% (**) and significant at 10% (*). Extreme observations where the exchange-rate pass-through to consumer prices was greater than 1 were excluded.
Overall, these results suggest that, given the level and volatility of inflation and the exchange rate, lower wage resistance (and greater trade openness) leads to lower exchange-rate pass-through to domestic consumer prices. The weakening of labour market institutions —when combined with these two variables— has global repercussions and may have played a significant role in explaining the decline in exchange rate pass-through observed in recent years.
VI. Conclusions
This paper presents an alternative interpretation of the decline in the exchange-rate pass-through to consumer prices in recent decades in peripheral countries. Conventional wisdom claims that this decline was due to increased central bank credibility, which the literature typically ascribes to the establishment of formal inflation-targeting regimes and related institutional reforms, such as central bank independence, full mobility of international capital and floating exchange rates. From a structuralist standpoint, which views the distributive conflict as a fundamental factor in accounting for inflation, this paper has laid emphasis on other structural changes occurring in parallel with the establishment of inflation-targeting regimes, which have led to lower wage resistance, a key variable in explaining the intensity of exchange-rate pass-through. These changes include the weakening of labour market institutions and a decline in union density.
The empirical evidence gathered shows that exchange-rate pass-through declined in countries both with and without formal inflation-targeting regimes. This may imply that the decline was due to a broader, global process —not necessarily ascribable to greater credibility of monetary authorities— that could involve widespread trade liberalization, increasing financial deregulation or expansion of the global workforce. The data collected also indicate that the fall in exchange-rate pass-through was more significant in the countries with formal inflation-targeting regimes than in the rest of the countries in the sample.

26 CEPAL Review N° 128 • August 2019
Monetary regimes and labour institutions: an alternative interpretation of the downward trend...
In keeping with conventional wisdom, this could suggest that, setting aside the likely incidence of the said global factors, the introduction of inflation-targeting regimes may have been a determining factor in the stronger decline in exchange-rate pass-through. However, a more detailed examination of the empirical evidence presented in sections IV and V reveals that: (i) the decline in wage resistance was more pronounced in countries with formal inflation-targeting regimes, and (ii) wage resistance is a statistically significant factor in explaining the strength of exchange-rate pass-through. From this, it could be inferred that the fall in pass-through was stronger in countries with formal inflation-targeting regimes because the reduction in wage resilience —and, presumably, the structural and institutional transformations that triggered that reduction— was greater in these countries, as opposed to enhanced central bank credibility.
These results, while perhaps not surprising, may still be of interest to those engaged in the comparative analysis of different capitalist institutional forms, such as proponents of the French regulation theory or the “varieties of capitalism” approach.26 The latter, for example, emphasizes the idea of institutional complementarities, which looks at how the functioning and performance of one institution can affect the functioning and performance of another. At times, conventional macroeconomic analysis appears to adopt a similar perspective, suggesting a combination of conditions that an economy must meet if the implementation of a formal inflation-targeting regime is to yield a low and stable inflation rate. These conditions usually include central bank independence, capital account liberalization, free floating exchange rates and self-imposed fiscal limits.27
An additional institutional prerequisite may be inferred from the evidence presented in this paper that is equally or more significant than the above —namely, labour market deregulation.28 This condition is rarely mentioned explicitly in the conventional literature, nor is it openly advocated by the enthusiasts of inflation-targeting regimes, even if it is perfectly consistent with the standard explanation. In fact, a more credible monetary authority may imply that workers’ wage aspirations have been lined up with the official inflation target, whether spontaneously or by means of some sort of union representation. Going back to the interpretation of the decline in pass-through coefficients under inflation-targeting regimes, one further implication is that, in the event of an exchange-rate depreciation, workers offer minimal wage resistance, placidly accepting a real wage reduction. This may be conceivable if workers are certain that the only alternative to their acquiescence would be a contractionary monetary policy that would yield the same result (with regard to wages and the inflation rate) but with a much higher cost in terms of employment and activity levels.29 In short, the decline in exchange-rate pass-through —which, from a conventional perspective, is presented as an attribute of monetary credibility— is, in practice, a consequence of the weakening of labour institutions.
26 For an application of the varieties of capitalism approach to Latin American countries, see Schneider (2009). For a critical review of this approach and its applicability in the region, see Aguirre and Lo Vuolo (2013). For an alternative perspective on Latin American economies based on regulatory theory, see Bizberg and Théret (2012).
27 See, for example, Fraga, Goldfajn and Minella (2003).28 Similar reasoning can be found in Hall and Gingerich (2009).29 This is referred to in the literature as the sacrifice ratio.

27CEPAL Review N° 128 • August 2019
Martín Cherkasky and Martín Abeles
Bibliography
Aguirre, J. and R. Lo Vuolo (2013), “Variedades de capitalismo: una aproximación al estudio comparado del capitalismo y sus aplicaciones para América Latina”, Documentos de Trabajo CIEPP, No. 85, Buenos Aires, Interdisciplinary Centre for Public Research (CIEPP).
Arestis, P. and M. Sawyer (2005), “Aggregate demand, conflict and capacity in the inflationary process”, Cambridge Journal of Economics, vol. 29, No. 6, Oxford, Oxford University Press.
Bailliu, J. and E. Fujii (2004), “Exchange rate pass-through and the inflation environment in industrialized countries: an empirical investigation”, Bank of Canada Working Paper, No. 2004–21, Ottawa, Bank of Canada.
Bastian, E. and M. Setterfield (2017), “Nominal exchange rate shocks and inflation in an open economy: towards a structuralist inflation targeting agenda”, NSSR Working Paper, No. 20/2017, New York, The New School for Social Research.
Benigno, P. and E. Faia (2016), “Globalization, pass-through, and inflation dynamics”, International Journal of Central Banking, vol. 12, No. 4.
Berg, J. (ed.) (2015), Labour Markets, Institutions and Inequality: Building Just Societies in the 21st Century, Cheltenham, Edward Elgar/International Labour Organization (ILO).
Bhaduri, A. and S. Marglin (1990), “Unemployment and the real wage: the economic basis for contesting political ideologies”, Cambridge Journal of Economics, vol. 14, No. 4, Oxford, Oxford University Press.
Bizberg, I. and B. Théret (2012), “La diversité des capitalismes latino-américains: les cas de l’Argentine, du Brésil et du Mexique”, Revue de la Régulation, No. 11, Paris, Maison des Sciences de l´Homme Paris Nord.
Blecker, R. (2011), “Open economy models of distribution and growth”, A Modern Guide to Keynesian Macroeconomics and Economic Policies, E. Hein and E. Stockhammer (eds.), Cheltenham, Edward Elgar. (1989), “International competition, income distribution and economic growth”, Cambridge Journal of Economics, vol. 13, No. 3, Oxford, Oxford University Press.
Borensztein, E. and V. Queijo von Heideken (2016), “Exchange rate pass-through in South America: an overview”, IDB Working Paper, No. 710, Washington, D.C., Inter-American Development Bank (IDB).
Burstein, A., M. Eichenbaum and S. Rebelo (2005), “Large devaluations and the real exchange rate”, Journal of Political Economy, vol. 113, No. 4, Chicago, University of Chicago Press.
Calvo, G. and C. Reinhart (2002), “Fear of floating”, The Quarterly Journal of Economics, vol. 117, No. 2, Oxford, Oxford University Press.
Campa, J. and L. Goldberg (2005), “Exchange rate pass-through into import prices”, Review of Economics and Statistics, vol. 87, No. 4, Cambridge, Massachusetts, MIT Press.
Carlin, W. and D. Soskice (2006), Macroeconomics: Imperfections, Institutions, and Policies, Oxford, Oxford University Press.
Carrière-Swallow and others (2016), “Monetary policy credibility and exchange rate pass-through”, IMF Working Paper, No. 16/240, Washington, D.C., International Monetary Fund (IMF).
Caselli, F. and A. Roitman (2016), “Non-linear exchange rate pass-through in emerging markets”, IMF Working Paper, No. 16/1, Washington, D.C., International Monetary Fund.
Cassetti, M. (2003), “Bargaining power, effective demand and technical progress: a Kaleckian model of growth”, Cambridge Journal of Economics, vol. 27, No. 3, Oxford, Oxford University Press.
Choudhri, E. and D. Hakura (2006), “Exchange rate pass-through to domestic prices: does the inflationary environment matter?”, Journal of international Money and Finance, vol. 25, No. 4, Amsterdam, Elsevier.(2001), “Exchange rate pass-through to domestic prices: does the inflationary environment matter?”, IMF Working Paper, No. 01/194, Washington, D.C., International Monetary Fund (IMF).
Cornwall, J. (1990), The Theory of Economic Breakdown, Oxford, Basil Blackwell. Cornwall, J. and W. Cornwall (2001), Capitalist Development in the Twentieth Century, Cambridge, Cambridge
University Press. Devereux, M. and J. Yetman (2010), “Price adjustment and exchange rate pass-through”, Journal of International
Money and Finance, vol. 29, No. 1, Amsterdam, Elsevier.Dornbusch, R. (1987), “Exchange rate and prices”, American Economic Review, vol. 77, No. 1, Nashville,
Tennessee, American Economic Association.Driscoll, J. and A. Kraay (1998), “Consistent covariance matrix estimation with spatially dependent panel data”,
Review of Economics and Statistics, vol. 80, No. 4, Cambridge, Massachusetts, MIT Press.
28 CEPAL Review N° 128 • August 2019
Monetary regimes and labour institutions: an alternative interpretation of the downward trend...
Dutt, A. (1987), “Alternative closures again: a comment on ‘Growth, distribution and inflation’”, Cambridge Journal of Economics, vol. 11, No. 1, Oxford, Oxford University Press.
Dvoskin, A. and G. Feldman (2015), “Política cambiaria, distribución del ingreso y estructura productiva”, Estructura productiva y política macroeconómica: enfoques heterodoxos desde América Latina, A. Bárcena, A. Prado and M. Abeles (eds.), ECLAC Books, No. 138 (LC/G.2653-P), Santiago, Economic Comission for Latin America and the Caribbean (ECLAC).
Fischer, S., R. Sahay and C. Vegh (2002), “Modern hyper-and high inflations”, NBER Working Paper, No. 8930, Cambridge, Massachusetts, National Bureau of Economic Research (NBER).
Fraga, A., I. Goldfajn and A. Minella (2003), “Inflation targeting in emerging market economies”, NBER Working Paper, No. 10019, Cambridge, Massachusetts, National Bureau of Economic Research (NBER).
Frankel, J., D. Parsley and S. Wei (2012), “Slow pass-through around the world: a new import for developing countries?”, Open Economies Review, vol. 23, No. 2, New York, Springer.
Freeman, R. (2006), “The great doubling: the challenge of the new global labor market” [online] https://www.researchgate.net/publication/237491969.
Frenkel, R. (1984), “Inflación, shocks y mark-up: Argentina 1975–1982”, Ensayos Económicos, No. 30, Buenos Aires, Central Bank of Argentina.
Furtado, C. (1963), The Economic Growth of Brazil, Berkeley, University of California Press.Gagnon, J. and J. Ihrig (2004), “Monetary policy and exchange rate pass-through”, International Journal of
Finance & Economics, vol. 9, No. 4, Hoboken, Wiley.Godley, W. and M. Lavoie (2007), Monetary Economics: An Integrated Approach to Credit, Money, Income,
Production and Wealth, New York, Palgrave Macmillan.Gopinath, G. (2015), “The international price system”, NBER Working Paper, No. 21646, Cambridge,
Massachusetts, National Bureau of Economic Research (NBER).Hall, P. and D. Gingerich (2009), “Varieties of capitalism and institutional complementarities in the political
economy: an empirical analysis”, British Journal of Political Science, vol. 39, No. 3, Cambridge, Cambridge University Press.
Jordà, Ò. (2005), “Estimation and inference of impulse responses by local projections”, American Economic Review, vol. 95, No. 1, Nashville, Tennessee, American Economic Association.
Kalecki, M. (1971), “Costs and prices”, Selected Essays on the Dynamics of the Capitalist Economy 1933–1970, Cambridge, Cambridge University Press.
Krugman, P. (1987), “Pricing to market when the exchange rate changes,” Real Financial Linkages Among Open Economies, S. Arndt and J. Richardson (eds.), Cambridge, Massachusetts, MIT Press.
Lavoie, M. (2014), Post-Keynesian Economics: New Foundations, Cheltenham, Edward Elgar.Lazonick, W. and M. O’Sullivan (2000), “Maximizing shareholder value: a new ideology for corporate
governance”, Economy and Society, vol. 29, No. 1, Abingdon, Taylor & Francis.Lenzen, M. and others (2013), “Building EORA: a global multi-region input-output database at high country
and sector resolution”, Economic Systems Research, vol. 25, No. 1, Abingdon, Taylor & Francis.(2012), “Mapping the structure of the world economy”, Environmental Science & Technology, vol. 46, No. 15, Washington, D.C., American Chemical Society.
Libman, E. (2018), “Asymmetric monetary and exchange-rate policies in Latin American countries that use inflation targeting”, CEPAL Review, No. 125 (LC/PUB.2018/6-P), Santiago, Economic Commission for Latin America and the Caribbean (ECLAC).
Marston, R. (1990), “Pricing to market in Japanese manufacturing”, Journal of International Economics, vol. 29, No. 3–4, Amsterdam, Elsevier.
Neville, J. and P. Kriesler (2008), “Expectations and unemployment”, Keynes and Macroeconomics after 70 Years: Critical Assessments of The General Theory, L. Wray and M. Forstater (eds.), Cheltenham, Edward Elgar.
Noyola, J. (1956), “El desarrollo económico y la inflación en México y otros países latinoamericanos”, Investigación Económica, vol. 16, No. 4, Mexico City, National Autonomous University of Mexico (UNAM).
Olivera, J. (1967), “Aspectos dinámicos de la inflación estructural”, Desarrollo Económico, vol. 7, No. 27, Buenos Aires, Institute of Economic and Social Development (IDES).
Perry, N. and N. Cline (2016), “What caused the great inflation moderation in the US? A post-Keynesian view”, Review of Keynesian Economics, vol. 4, No. 4, Cheltenham, Edward Elgar.

29CEPAL Review N° 128 • August 2019
Martín Cherkasky and Martín Abeles
Rochon, L. and M. Setterfield (2007), “Interest rates, income distribution, and monetary policy dominance: post Keynesians and the ‘fair rate’ of interest”, Journal of Post Keynesian Economics, vol. 30, No. 1, Abingdon, Taylor & Francis.
Rowthorn, R. (1977), “Conflict, inflation and money”, Cambridge Journal of Economics, vol. 1, No. 3, Oxford, Oxford University Press.
Sarantis, N. (1990), “Distribution and terms of trade dynamics, inflation, and growth”, Journal of Post Keynesian Economics, vol. 13, No. 2, Abingdon, Taylor & Francis.
Sawyer, M. (1982), Macro-Economics in Question: The Keynesian-Monetarist Orthodoxies and the Kaleckian Alternative, New York, M. E. Sharpe.
Schneider, B. (2009), “Hierarchical market economies and varieties of capitalism in Latin America”, Journal of Latin American Studies, vol. 41, No. 3, Cambridge, Cambridge University Press.
Schönerwald da Silva, C. and M. Vernengo (2008), “The decline of the exchange rate pass-through in Brazil: explaining the ‘fear of floating’”, International Journal of Political Economy, vol. 37, No. 4, Abingdon, Taylor & Francis.
Setterfield, M. (2009), “Macroeconomics without the LM curve: an alternative view”, Cambridge Journal of Economics, vol. 33, No. 2, Oxford, Oxford University Press. (2006a), “Balancing the macroeconomic books on the backs of the workers: a simple analytical political economy model of contemporary US capitalism”, International Journal of Political Economy, vol. 35, No. 3, Abingdon, Taylor & Francis.(2006b), “Is inflation targeting compatible with post Keynesian economics?”, Journal of Post Keynesian Economics, vol. 28, No. 4, Abingdon, Taylor & Francis.
Smithin, J. (1994), Controversies in Monetary Economics: Ideas, Issues, and Policy, Cheltenham, Edward Elgar.Stockhammer, E. (2013), “Why have wage shares fallen? An analysis of the determinants of functional
income distribution”, Wage-led Growth. An Equitable Strategy for Economic Recovery, M. Lavoie and E. Stockhammer (eds.), London, Palgrave Macmillan/International Labour Organization (ILO).
Sunkel, O. (1958), “La inflación chilena: un enfoque heterodoxo”, El Trimestre Económico, vol. 25, No. 4, Mexico City, Fondo de Cultura Económica.
Taylor, C. (1985), “Social theory as practice”, Philosophy and the Human Sciences: Philosophical Papers 2, Cambridge, Cambridge University Press.
Taylor, J. (2000), “Low inflation, pass-through, and the pricing power of firms”, European Economic Review, vol. 44, No. 7, Amsterdam, Elsevier.
Taylor, L. (2004), Reconstructing Macroeconomics: Structuralist Proposals and Critiques of the Mainstream, Cambridge, Massachusetts, Harvard University Press. (1991), Income Distribution, Inflation and Growth: Lectures on Structuralist Macroeconomic Theory, Cambridge, Massachusetts, MIT Press. (1985), “A stagnationist model of economic growth”, Cambridge Journal of Economics, vol. 9, No. 4, Oxford, Oxford University Press.
Teulings, C. and N. Zubanov (2014), “Is economic recovery a myth? Robust estimation of impulse responses”, Journal of Applied Econometrics, vol. 29, No. 3, Hoboken, Wiley.
United Nations (2016), Report of the Independent Expert on the effects of foreign debt and other related international financial obligations of States on the full enjoyment of all human rights, particularly economic, social and cultural rights (A/HRC/34/57), New York, 27 December.
Vera, L. (2014), “The simple post-Keynesian monetary policy model: an open economy approach”, Review of Political Economy, vol. 26, No. 4, Abingdon, Taylor & Francis.
Vernengo, M. (2003), “Balance of payments constraint and inflation”, Department of Economics Working Paper, Nº 2003–06, University of Utah.
Vogel, L. and others (2009), “Inflation responses to recent shocks: do G7 countries behave differently?”, OECD Economics Department Working Paper, No. 689, Paris, Organization for Economic Cooperation and Development (OECD).

30 CEPAL Review N° 128 • August 2019
Monetary regimes and labour institutions: an alternative interpretation of the downward trend...
Annex A1
Obtaining the real equilibrium wage
In line with Bastian and Setterfield (2017), the rates of growth of nominal wages and prices are defined taking only the income aspiration gap into consideration:
ŵt = μ1 ([ωw 0 + μ2e Rt–1 ] – ωt–1) (A.1)
p̂ t = φ1 (ωt–1 – [ωf 0 – φ2e Rt–1 ]) (A.2)
The real equilibrium wage is obtained, provided that the real wage remains constant (ŵt = p̂t ):
ω* = μ1ωw0 + φ1ωf 0 + (μ1μ2 – φ1φ2 ) e
Rt
μ1 + φ1 (A.3)
Equation (A.3) is substituted into (A.2) to obtain the equilibrium inflation rate:
p* = μ1φ1 (ωw0 – ωf 0 ) + (μ2 + φ2 ) e
Rt
μ1 + φ1 (A.4)
The variation rate of the nominal break-even exchange rate is obtained, assuming that the real exchange rate remains constant. This implies that the variation rate of the nominal exchange rate is equal to inflation, minus the variation rate of the prices of imported products in foreign currency (ê = ̂p – p̂ f ).
ê* = μ1φ1 [(ωw0 – ωf 0 ) + (μ2 + φ2 ) e
Rt ]
μ1 + φ1 – p̂f
(A.5)
ê* = μ1φ1 (ωw0 – ωf 0 ) + μ1φ1 (μ2 + φ2) e
Rt – p̂ f (μ1 + φ1)
μ1 + φ1
We then solve for the real exchange rate:
eRt * =
μ1φ1 (ωw0 – ωf 0) + p̂f (μ1 + φ1)
μ1 + φ1ê* –
μ1 + φ1
μ1φ1 (μ2 + φ2) (A.6)
Finally, equation (A.6) is substituted into (A.3):
ω* =
μ1ωw0 + φ1ωf0 + (μ1 μ2 – φ1 φ2 ) (ê + p̂ f
t )(μ1 + φ1) – μ1φ1 (ωw0 – ωf 0 )μ1φ1 (μ2 + φ2 )
μ1 + φ1 (A.7)

31CEPAL Review N° 128 • August 2019
Martín Cherkasky and Martín Abeles
Annex A2
Data sourcesTable A2.1
Data sources
Variable Frequency of publication Methodology SourcesConsumer Price Index (CPI) Monthly Quarterly average International Monetary Fund (IMF),
national and provincial bodies
Real effective exchange rate (REER) Monthly Quarterly average Bruegel
Commodity prices Monthly Quarterly average IMF
Gross domestic product (GDP) Quarterly Seasonal adjustment (X-12-ARIMA) IMF, ECLAC, OECD and national bodies
Unemployment Yearly Hodrick-Prescott filter International Labour Organization (ILO)
Productivity Yearly Hodrick-Prescott filter ILO
Trade flow over GDP Yearly - World Bank
External assets and liabilities Yearly - IMF
GDP (in purchasing power parity) Yearly - IMF
Source: Prepared by the authors.
Table A2.2 Data sources for nominal wage series
Country Period Description SourceArgentina 1995–2016 Average wage in the registered private sector Ministry of Labour, Employment and
Social Security
Brazil 1994–2016 Average private and public sector wage Brazilian Geographical and Statistical Institute (IBGE)
Chile 1994–2016 Average wage International Monetary Fund (IMF)
Colombia 1994–2016 Average wage (manufacturing industry and retail)
Bank of the Republic
Croatia 1994–2016 Net average wage Croatian Bureau of Statistics
Hungary 1994–2016 Average wage IMF
Poland 1994–2016 Average wage IMF
Romania 1994–2016 Average wage IMF
Russian Federation 1994–2016 Average wage Federal State Statistics Service of the Russian Federation
Uruguay 1994–2016 Average wage index Ministry of Labour and Social Security
Source: Prepared by the authors.

32 CEPAL Review N° 128 • August 2019
Monetary regimes and labour institutions: an alternative interpretation of the downward trend...
Annex A3
Robustness control: estimation based on the bilateral nominal exchange rate
The results based on the bilateral nominal exchange rate are similar to those obtained using the nominal effective exchange rate; a decrease was noted in all cases, with the largest declines in countries with inflation-targeting regimes (see figures A3.1 to A3.4 and table A3.1).
Figure A3.1 Exchange-rate pass-through in peripheral countries, by rolling windows
(Percentages)
0.50
0.29
0.17
0
0.1
0.2
0.3
0.4
0.5
0.6
1994–2005 1999–2010 2005–2016
Estimation windows
Source: Prepared by the authors.Note: Cumulative response of consumer prices one year after a 1% increase in the bilateral nominal exchange rate. The following
countries are included in the estimates: Argentina, Bolivia (Plurinational State of), Brazil, Bulgaria, Chile, Colombia, Croatia, Hungary, India, Indonesia, Malaysia, Mexico, Paraguay, Peru, Philippines, Poland, Romania, Russian Federation, South Africa, Thailand, Turkey and Uruguay.

33CEPAL Review N° 128 • August 2019
Martín Cherkasky and Martín Abeles
Figure A3.2 Exchange-rate pass-through in peripheral countries, for different time horizons
(Percentages)
0.06
0.140.17 0.17
0.20
0.42
0.50 0.50
0
0.1
0.2
0.3
0.4
0.5
0.6
h=0 h=1 h=2 h=3 h=4
2005–20161994–2005
Quarters after event
Source: Prepared by the authors. Note: Cumulative response of consumer prices one, two, three and four quarters after a 1% increase in the bilateral nominal
exchange rate. The following countries are included in the estimates: Argentina, Bolivia (Plurinational State of), Brazil, Bulgaria, Chile, Colombia, Croatia, Hungary, India, Indonesia, Malaysia, Mexico, Paraguay, Peru, Philippines, Poland, Romania, Russian Federation, South Africa, Thailand, Turkey and Uruguay.
Figure A3.3 Exchange rate pass-through by region
(Percentages)
0.33
0.81
0.41
0.24
0.54
0.10
0.18 0.18
0.08
0
0.1
0.2
0.3
0.4
0.5
0.6
0.7
0.8
0.9
Latin America Eastern Europe Asia
1994–2005 1999–2010 2005–2016
Source: Prepared by the authors. Note: Cumulative response of consumer prices one year after a 1% increase in the bilateral nominal exchange rate. Latin America
includes: Argentina, Bolivia (Plurinational State of), Brazil, Chile, Colombia, Mexico, Paraguay, Peru and Uruguay; Eastern Europe includes: Bulgaria, Croatia, Hungary, Poland, Romania, Russian Federation and Turkey; Asia includes: India, Indonesia, Malaysia, Philippines and Thailand.

34 CEPAL Review N° 128 • August 2019
Monetary regimes and labour institutions: an alternative interpretation of the downward trend...
Figure A3.4 Exchange-rate pass-through, by monetary regime in peripheral countries
(Percentages)
0.45
0.57
0.29 0.300.27
0.13
0
0.1
0.2
0.3
0.4
0.5
0.6
0.7
Without inflation-targeting regimes With inflation-targeting regimes
1994–2005 1999–2010 2005–2016
Source: Prepared by the authors. Note: Cumulative response of consumer prices one year after a 1% increase in the bilateral nominal exchange rate. Countries
with inflation-targeting regimes (implemented in or prior to 2010) include: Brazil, Chile, Colombia, Hungary, Indonesia, Mexico, Peru, the Philippines, Poland, Romania, South Africa, Thailand and Turkey. Countries without inflation-targeting regimes (or with regimes implemented since 2011) include: Argentina, Bolivia (Plurinational State of), Bulgaria, Croatia, India, Malaysia, Paraguay, Russian Federation and Uruguay.
Table A3.1 Determinants of total pass-through of the bilateral nominal exchange rate
Dependent variable:
βh=41,i,τ 1 2 3 4 5 6 7 8
Average depreciation 11.606*** 13.372*** 5.077
(1.74) (3.33) (3.51)
Bilateral-nominal-exchange-rate volatility
2.005** -0.808 1.288
(0.83) (0.84) (1.13)
Average inflation 10.856*** 2.098 4.669
(1.31) (2.69) (2.95)
Inflation volatility 4.637*** -1.399 -0.687
(1.01) (1.51) (1.53)
Globalization indicator -1.452*** 0.156 -1.458***
(0.38) (0.11) (0.33)
Wage resistance 0.059** 0.074* 0.097**
(0.03) (0.04) (0.04)
Country fixed effects No No No No No No No Yes
Time fixed effects Yes Yes Yes Yes Yes Yes Yes Yes
Observations 118 118 118 118 118 118 118 118
R-squared 0.844 0.785 0.867 0.813 0.801 0.786 0.787 0.897
Source: Prepared by the authors. Note: The dependent variable is the estimated total pass-through (bilateral nominal exchange rate with the United States) for
the window τ and country i. The standard error is shown in parentheses. Significant at 1% (***), significant at 5% (**) and at 10% (*). Extreme observations where the exchange-rate pass-through to consumer prices and the wage resistance coefficient were greater than 1 were excluded.

Models of the developmental state
Luiz Carlos Bresser-Pereira
Abstract
This paper seeks to understand the developmental state and its historical role in industrial revolutions and afterwards. First, the developmental state is defined as an alternative to the liberal state. Second, it is argued that industrial revolutions have always taken place within the framework of a developmental state. Third, four models of developmental states are defined according to the point in time at which the industrial revolution took place and the central or peripheral character of the country. Fourth, the paper describes how the state withdraws partially from the economy after the industrial revolution, but the developmental state continues to have a major role in directing industrial policy and in conducting an active macroeconomic policy.
Keywords
Public administration, economic planning, macroeconomics, liberalism, nationalism, economic policy, economic development
JEL classification
O10, O11, O19
Author
Luiz Carlos Bresser-Pereira is an Emeritus Professor with the Department of Economics of the Sao Paulo School of Economics, Getulio Vargas Foundation, Brazil. Email: [email protected].

36 CEPAL Review N° 128 • August 2019
Models of the developmental state
I. Introduction
In the 1950s, Brazilian political scientists and economists identified “developmentalism” as a set of political ideas and economic strategies that drove Brazil’s rapid industrialization and underpinned the coalition of social classes identified with national development. Hélio Jaguaribe (1962, p. 208) stated in the early 1960s that “the core thesis of developmentalism is that the promotion of economic development and the consolidation of nationality stand as two correlated aspects of a single emancipatory process”. Through “national developmentalism”, which would become the established term for the country’s development strategy, Brazilian society was successfully overcoming the patrimonial state that characterized its politics until 1930. Other Latin American countries such as Mexico and Argentina and East Asian countries such as South Korea, Taiwan and Singapore grew by embracing a developmental strategy that was theoretically grounded in a combination of structuralist development theory and Keynesian macroeconomics. These countries combined state intervention with a dynamic private sector, modelling themselves on Japan. In the early 1980s, Chalmers Johnson (1982), in an attempt to understand its extraordinary economic development, called the Japanese state a “developmental state”.1 Yet, notwithstanding the extraordinary success of these countries, over the 30 neoliberal years of capitalism (1979–2008), developmentalism became a derogatory term synonymous with fiscal irresponsibility or populism. This rhetorical manoeuvre was a way of reaffirming the new neoliberal and neoclassical hegemony, but was not entirely groundless. Indeed, from the late 1970s, faced with the crisis brought about by the second energy shock, several Latin American countries refused to carry out the required macroeconomic adjustments and embraced populism in the name of Keynesianism, giving rise to a major foreign debt crisis in the 1980s that created the conditions for neoliberal hegemony in the region. In the 1990s, the liberal state and its neoliberal policies and reforms failed to make good on their promises, instead indulging in current account deficits and exchange-rate populism,2 and the outcome was sluggish growth, great financial instability and a marked increase in inequality. In the early 2000s, developmentalism resurfaced both as an existing historical phenomenon and as a theoretical framework and development strategy. In the former manifestation, it was associated with leftist governments that might be identified with “social developmentalism”, often sliding into fiscal populism; as regards the latter, economists and other social scientists, including the author of this paper, proposed a new theoretical approach to the problem that came to be called “new developmentalism” —an alternative to Latin America’s “classical developmentalism” or “structuralism”.3
New developmentalism is an attempt to refresh development economics. Its developmental macroeconomics is based on the tendency towards cyclical and chronic overvaluation of the exchange rate. It focuses on the five macroeconomic prices —the profit rate, the interest rate, the exchange rate, the wage rate and the inflation rate— that the market is unable to get right. Its political economy is based on the concepts of the developmental state and developmental capitalism.
Taking the countries that industrialized first (England and France) as benchmarks, the historical path they have followed may be summarized in a few stylized facts. In the late Middle Ages, absolute monarchies allied with the nascent bourgeoisie to overcome feudal lords and form the absolute and mercantilist state. The industrial revolution took place within the framework of this first developmentalism: mercantilism. A liberal state became dominant in the 1830s and lasted for 100 years. The New Deal
1 The term State is usually written with an upper-case “s”, which seems reasonable as a designation of a society’s greatest institution. In speaking of the developmental state or the patrimonial state, and indeed the nation-state, however, what is meant is a political system or form of government in the former case and a form of sovereign political-territorial society in the latter, so the lower case will be used in these instances.
2 The concept of exchange-rate populism originates from the works of Adolfo Canitrot (1975) and Carlos Díaz-Alejandro (1981). The concept is central to the new developmentalism, whose macroeconomics focuses on the foreign exchange rate and on current account deficits or surpluses.
3 See Bresser-Pereira (2016).

37CEPAL Review N° 128 • August 2019
Luiz Carlos Bresser-Pereira
emerged from the Great Depression and the golden age of capitalism from the Second World War. This was the second developmentalism, marked by moderate state intervention in the economy, an active macroeconomic policy, financial stability, fast growth, moderate reduction of inequality and a developmental and social class coalition: Fordism.4 This new phase was to last for about 30 years before once again giving way to economic liberalism, which lasted for a like period before entering a deep crisis with the global financial crisis of 2008.5
This paper will not cover each phase of the long-term process. Its purpose, rather, is to convey the logic of the developmental state within the framework of capitalism, the four historical forms that it adopted when it led the industrial and capitalist revolution, and the fifth developmental model that came after the Second World War. Its two institutions of economic and social coordination are the state and the market. While the market is devoid of will (albeit not of the interests of those operating in it), the state represents the law and, therefore, political will. It is through the state that collective action takes place and that nations regulate social life in pursuit of the political objectives that modern societies have set for themselves: security, liberty, well-being, social justice and protection of the environment. It is through the market that companies compete, prices are formed and resources are efficiently allocated across the various competitive sectors of the economy. It is through the market that the economy’s competitive sectors are coordinated, and it is through the state that the market is regulated, non-competitive industries are coordinated and active macroeconomic policy can operate to ensure macroeconomic balance and create the conditions for private sector investment and innovation, full employment and sustained economic development.
II. What is the developmental state?
The presence of the developmental state throughout the history of capitalist development is not the product of chance. The logic of the nation-state is that of economic development and competition. As Ernest Gellner (1996) put it, the nation-state is opposed to the classical, or pre-industrial, empire. The empire is the political-territorial unit that characterizes more developed ancient societies (those that Gellner refers to as “agro-literate societies”), whereas the nation-state is the political-territorial society of capitalism. The logic of nation-states is one of economic growth that the state, as an organization and as manifested in laws and policies, must foster. In regulating capitalist economies, the modern state assumes two basic forms, the developmental and the liberal, that are also the two forms of economic and political organization for capitalism, given that the state is the fundamental institution of modern societies. The liberal state limits itself to guaranteeing property rights and contracts, controlling the national currency and maintaining healthy public finances, leaving all other activities to the coordination of the market. Chalmers Johnson (1982 and 1999) defined the developmental state as a state that has economic development as a priority objective; intervenes in the economy not only by means of regulation, but also directly; has a small and highly skilled public bureaucracy to which actual powers are assigned, leaving the legislature and judiciary in the background; controls its foreign commercial and financial accounts and, therefore, the exchange rate; protects domestic manufacturing industry from end products; facilitates machinery imports; separates foreign technology, in which it has a strong interest, from foreign capital, in which it has no interest; creates state-owned financial institutions; adopts credit and fiscal incentives, but always on a temporary basis, subject to constant assessments; adopts a consolidated public investment budget; offers strong government support for science and
4 Fordism was the name given by the French Regulation School to the “mode of regulation” of capitalism led by the United States from the New Deal to the 1970s. It was a developmental class coalition characterized by mass consumption, large monopolist and bureaucratic corporations and some reduction of inequality, insofar as wages grew with productivity and technical progress was capital-saving.
5 See Bresser-Pereira and Ianoni (2017) for a comprehensive review of historical forms of developmental class coalitions.

38 CEPAL Review N° 128 • August 2019
Models of the developmental state
technology; and eschews detailed laws, leaving room for firms to take the initiative, with discretionary guidance from the public bureaucracy. Peter Evans (1992) has drawn attention to two characteristics of the twentieth-century developmental state, namely bureaucratic capacity and embeddedness: the way the public bureaucracy is enmeshed in society and the business community. Johnson and Evans credit the public bureaucracy with a strategic role in the developmental state, which is reasonable, but industrial entrepreneurs also have a decisive part to play.
These are excellent definitions of the developmental state, but it seems legitimate to define it in a broader way. The state will be developmental if it: (i) views economic growth as its main objective; (ii) intervenes moderately in the market by planning the economy’s non-competitive sector and by adopting strategic industrial policies; (iii) operates an active macroeconomic policy by limiting budget and current account deficits and by getting “right” the five macroeconomic prices, particularly the exchange rate; and (iv) is politically supported by a developmental class coalition formed of entrepreneurs, workers, public bureaucrats and sectors from the old dominant class which holds political power and embraces a national development strategy, thereby standing in opposition to a conservative or liberal coalition made up of sectors of the pre-industrial dominant class, rentier capitalists and financiers.6
Following Evans (1992, p. 12), besides being developmental or liberal, the modern state may be “predatory” when it “lack[s] the ability to prevent individual incumbents from pursuing their own goals. Personal ties are the only source of cohesion, and individual maximization takes precedence over pursuit of collective goals”. Predatory states exist in pre-industrial countries that have not yet had their industrial and capitalist revolution. Their rulers claim to be developmental or liberal, as convenience dictates, but this means little or nothing. History shows that the state has played a key role in all industrialization episodes; in other words, that all episodes of industrial take-off or revolution have taken place within the framework of a developmental state, beginning with the British Industrial Revolution, which took place in a context of mercantilism —the first historical form of developmentalism. There are good reasons for this. The market is an excellent institution for coordinating competitive economic activity, but is powerless when it comes to non-competitive activities, and is a poor coordinator of macroeconomic prices, while the change from an agrarian to an industrial society necessarily involves a national development project.
One important issue is whether agrarian elites take part in developmental class coalitions. As Marcus Ianoni (2014, p. 99) noted, “in South Korea and Taiwan, the rural society converged with industrial progress, not seeking an independent political settlement”. The same can be said of the German agrarian elites that Bismarck successfully brought into his political settlement. In Brazil, it is usually argued that the agrarian elites have opposed the developmental state, both in the pre-industrial period and currently. Where agriculture is concerned, however, a crucial distinction exists between countries like Brazil, on the one hand, and most European and East Asian ones, on the other. In these, agriculture is essentially domestic market-oriented, while in Brazil coffee and sugar cane in the past, and these two plus soybeans and orange juice at the present day, are export commodities and causes of Dutch disease —the long-term appreciation of the domestic currency that hinders industrial activity because these commodities can be exported at an exchange rate far stronger than the one at which competent industrial companies would be competitive. Dutch disease was neutralized in Brazil during a period of rapid development by means of a disguised tax on exports that the coffee growers called “foreign-exchange confiscation” —a tax that led them to oppose industrialization. From the 1930s to the 1950s, however, support from the non-exporting agrarian oligarchy was crucial to the success of Getúlio Vargas’s national developmental pact.
The definition proposed here is not prescriptive, but rather a generalization of the behaviour of developmental states, particularly those in East Asia and Brazil at the time they industrialized. Assuming
6 Conservative coalitions in developing countries are associated with the liberal international elites and are thus “liberal” insofar as they defend, even if they do not necessarily practise, economic liberalism.

39CEPAL Review N° 128 • August 2019
Luiz Carlos Bresser-Pereira
that the behaviour of developmental states has not been too different, let us consider South Korea and summarize the measure that enabled it to successfully catch up: high import tariffs, in the range of 30% to 40% in the 1970s and 20% to 30% in the 1980s; plenty of non-tariff barriers; large export subsidies; small fiscal deficits; a low debt-to-GDP ratio; a strongly regulated financial market; low, often negative, interest rates; strict control of the exchange rate; strict control of capital inflows and outflows; and average inflation of 17.4% in the 1960s and 19.8% in the 1970s.7
III. Models
When this broad view of the developmental and liberal states in their economic aspect is taken, a crucial fact emerges from the history of capitalist development: every industrial revolution —the decisive moment of the capitalist revolution in each country— has taken place under the leadership of a developmental state. England and France industrialized under mercantilism, which was the first developmentalism; Germany under Bismarckism; the United States under Hamiltonianism; Japan under the strong control of the Meiji state; Brazil and Mexico under national developmentalism.
To verify this, it is worth categorizing countries and developmental state models. Going by two criteria, namely the points in time when peoples gain autonomy, become a nation, form a nation-state and achieve the industrial revolution, and the position of the country in question at the centre or on the periphery of capitalism, it is possible to distinguish four developmental state models at the time of their industrial revolutions: (i) the original central developmental state model of the countries that industrialized in the eighteenth and early nineteenth centuries, such as England and France; (ii) the original latecomer central developmental state model of countries that were not colonies but achieved their industrial revolution belatedly, such as Germany and the United States; (iii) the peripheral independent developmental state model of countries that were colonies or quasi-colonies of developed countries, but achieved a high level of national autonomy, industrialized, caught up and became rich, such as Japan, Taiwan and South Korea, or became middle-income countries, like China, India, Malaysia and Thailand; and (iv) the peripheral national-dependent developmental state model of countries that did achieve the capitalist revolution but, after the deep foreign debt crisis of the 1980s, lost some of their national autonomy and started growing at a very slow pace, such as Brazil and Mexico. In addition to these four models of the developmental state according to the timing of the industrial revolution, there is a fifth model: (v) the welfare developmental state, after the Second World War. There are also pre-industrial countries that are trying to achieve the revolution right now and countries that are simply poor, but this article is not concerned with either of these.
1. The original central model
With the first four developmental state models, the countries involved achieved a reasonable degree of autonomy and embraced a growth strategy in which the state and the market played important roles. The original central model has been the subject of study by many scholars, from great economists such as Adam Smith and Karl Marx to historians like Fernand Braudel, Paul Bairoch and David Landes. It unfolded within the framework of a mercantilist developmental state rather than a liberal state. The liberal critique of mercantilism —taken both as a historic phase of capitalism and as economic theory— is therefore misguided. The mercantilist, or absolute, state is that in which the emergence of market economies —the industrial revolution— takes place through intervention in the market to foster
7 This summary is based on Ha-Joon Chang (2002b) and on a class at the sixth Latin American Advanced Programme on Rethinking Macro and Development Economics (Laporde), Sao Paulo, 11 January 2016.

40 CEPAL Review N° 128 • August 2019
Models of the developmental state
national development. It rests on a coalition of classes formed by the monarch, his patrimonial nobility (whose revenues come from state coffers rather than land rent) and the large nascent bourgeoisie. Its overarching development strategy is to enlarge the domestic market by making the boundaries of the nation-state as wide as possible, the means to which include waging war upon neighbours in order to annex them. Notwithstanding the fact that it is creating a market economy, it does not hesitate to intervene in the economy and organize monopolies through which the partnership between the absolute monarch and the large bourgeoisie, which has paid taxes to fund the monarch’s wars, increasingly takes shape. As for Adam Smith’s radical criticism of mercantilist theory, it is quite understandable, not because he was “founding” economic theory (its founders were mercantilist economists), but because he was founding a new school of economics: the Classical school, whose members would include brilliant economists such as Malthus, Ricardo and Marx. It is, or should be, common knowledge, at least since Schumpeter’s monumental History of Economic Analysis (1954), that there were remarkable economists among the mercantilists.
2. The latecomer central model
The latecomer central model characterized countries such as Germany, Italy, Sweden and the United States. The classic study of this development model comes from Alexander Gerschenkron (1962), who analysed European countries that developed in the latter half of the nineteenth century and found in them a larger degree of state intervention. These countries had to face the industrial imperialism of England and France, which, as Friedrich List (1999) put it in 1846, attempted to “kick the ladder” from under Germany.8 In that country, the developmental state was called Bismarckian. The German industrial revolution, led by Otto von Bismarck (1815–1898), combined state intervention and investment banks and served as an example for other latecomer central countries. Hélio Jaguaribe, writing about Bismarckian development in 1962, noted that under it the domestic market was reserved to domestic industry and that the state played the role of an arbiter between conflicting forces.
Although the United States domestic market was also reserved to domestic manufacturers, the state’s decisive role is not as clear because the liberal ideology was so prevalent there that the state’s role in the country’s industrialization is systematically obscured. Its first Secretary of the Treasury, Alexander Hamilton, was not only one of the three great Federalist philosophers, but a developmental economist —indeed, the doyen of developmental economists. His classic “Report on Manufactures” (1791), on the need to protect American industry, launched a lasting and consistent policy of industrial promotion that only ended as late as 1939, when the United States finally lowered its customs tariffs, which had been very high until that point.9 According to Paul Bairoch (1993, pp. 40 and 51), the average import tariff in the nineteenth century and until the 1930s ranged from 35% to 48%, making the country, in the words of this remarkable economic historian, “a bastion of protectionism”. Ha-Joon Chang (2002a, pp. 24–32) provides additional data bearing this out. The present author’s interpretation of tariffs so much higher than those of the United Kingdom and France, where they were lowered more than 100 years previously, is a developmental strategy that neutralized the country’s Dutch disease.10
8 The expression “ladder kicking” was originally employed by Friedrich List in 1846 to describe the behaviour of England, which sought to convince the Germans not to industrialize by using the arguments of classical liberal economics. The argument describes the current behaviour of rich countries vis-à-vis developing ones. Ha-Joon Chang (2002a) picked up the expression and applied it very capably and appositely.
9 According to William A. Lovett, Alfred E. Eckes Jr. and Richard L. Brinkman (1999), the United States made 621 concessions in a 1938 agreement with the United Kingdom that added up to US$ 457.8 million and represented 37% of the country’s durable goods imports.
10 The right way to neutralize Dutch disease (long-term overvaluation of the exchange rate because commodities can be successfully exported at a substantially stronger exchange rate than tradable industrial non-commodities) is to impose a variable retention on the prices of the commodities giving rise to it. High import tariffs only neutralize Dutch disease on the domestic market side, by increasing the price of imports, while multiple exchange-rate regimes may neutralize it on both the import and the export side.

41CEPAL Review N° 128 • August 2019
Luiz Carlos Bresser-Pereira
The United States’ extraordinary natural resources, including oil, resulted in long-term overvaluation of the exchange rate because these commodities could be profitably exported at a stronger exchange rate than manufactured goods. The tariffs, therefore, were not so much a “protectionist” system as a means to neutralize Dutch disease for the purposes of the domestic market.
3. The independent peripheral model
The third developmental state model, the independent peripheral model, has Japan as an exemplar. The Japanese were humiliated when they were forced to open up to trade with the West in 1854 under the threat of Commodore Perry’s cannons.11 The Meiji restoration of 1868 —the Japanese nationalist revolution that freed the country from the West’s tutelage— was followed by a strategy of copying Western technology and institutions. Rapid industrialization occurred in the following 40 years, under the direct control of the Japanese state.12 This was how technology was copied. The copying of institutions came from 1908 to 1910, with the decision to privatize companies in competitive industries. Thus, the former Samurai of the Tokugawa period, who took part in the Meiji Restoration in a military capacity, became first a middle class of bureaucrats and then, with privatization, businessmen. Privatization had no ideological import: the Japanese simply copied the Western institutional model, which, in the case of competitive companies, assigns the role of economic coordination to the market. Classic works on latecomer independent development include those by Alexandre Barbosa Lima (1973) and Chalmers Johnson (1982) on Japan, by Alice Amsden (1989) on South Korea and by Robert Wade (1990) on Taiwan. These books clearly show the impact of the state’s intervention —or industrial policy— on firms. What they lack, with the partial exception of Robert Wade’s, is an accurate analysis of the active macroeconomic policy these countries embraced. Each sought, first, to limit foreign borrowing and penetration of the domestic market by multinational companies and, second, to get macroeconomic prices right: the profit rate, the interest rate, the wage rate, the inflation rate and, above all, the exchange rate. In this effort, Asian policymakers had a major advantage over their Latin American counterparts: they did not export commodities and so did not have to neutralize Dutch disease. But neither were aware of the problem. Corden and Neary (1982) had already published their paper on Dutch disease, but it manifested itself as a problem only in boom times. Only after Bresser-Pereira’s (2008) paper did it become clear that Dutch disease could also derive from a structural variable, namely Ricardian rents, and that it could be successfully neutralized by an export tax on commodities.13
Concerning this third model of industrialization, China also illustrates the metaphor of flying geese originally proposed by Kaname Akamatsu (1962) for the way Asian countries copied the Japanese model in waves: first came South Korea, Taiwan and Singapore, then Malaysia and Indonesia, then China and Vietnam.14 China, having declined enormously under the West’s industrial imperialism since
11 By the West is meant the group of rich countries around the North Atlantic plus Australia, New Zealand, Japan and the three East Asian countries that caught up in the twentieth century: South Korea, Taiwan and Singapore. The West is therefore not a geographical concept. Its members make up the modern empire, under the leadership of the United States. These are countries that have in common high levels of knowledge and high wages that they attempt to protect along with the profits of their firms. They are militarily organized through NATO and their main economic instruments are the International Monetary Fund and the World Bank.
12 Angus Maddison’s data suggest that the Japanese industrial revolution happened at the time of the Second World War, but the ability of these data to detect industrial revolutions is limited. Japan was only able to attack Russia in 1905, China in 1936 and the United States in 1942 because it had already developed a powerful manufacturing industry.
13 In a 1989 conference held in Tokyo by the Institute of Developing Economies, the natural resource-rich Latin American countries were compared with the natural resource-poor East Asian countries, but none of the economists used the Dutch disease model to explain why the East Asian countries continued to grow fast even as Latin America fell behind from 1980. The book on the conference is Fukuchi and Kagami (1990).
14 In the case of South Korea, the Japanese model was imposed in the more than 30 years of Japanese colonial rule and maintained after the country’s independence. As Atul Kohli (1999, p. 94) points out, by 1940 Korea was already a country with a “relatively high level of industrialization”.

42 CEPAL Review N° 128 • August 2019
Models of the developmental state
the mid-1800s, had its national and supposedly socialist revolution in 1949. The national revolution was completed by the industrial revolution, which was divided into two parts, the first from 1949 to 1978 under the leadership of Mao Zedong (1893–1976) and the second from 1989 to 2010 under Deng Xiaoping (1904–1997). Mao thought he was carrying out the first phase in the Chinese socialist revolution, when he was in fact carrying out the first phase of the capitalist revolution: with him at the helm, China asserted itself as a genuinely independent nation-state, educated its population and developed infrastructure and basic industry —activities that the state can typically conduct effectively and with reasonable efficiency. The second phase of the industrial revolution involved privatization and production diversification. As had happened in Japan, the competitive sector of the economy was privatized and left to the market while the state maintained political control, planned the non-competitive sector and executed an active macroeconomic policy to make sure that the five prices, and particularly the exchange rate, were correct. In this second phase, where the market takes on a strategic role, China experienced the most extraordinary economic development of all time, outstripping even Japan’s earlier example and achieving an average yearly growth rate of 10% for 30 years.
4. The national-dependent peripheral model
The fourth developmental state model, the national-dependent peripheral model, was not as successful. Countries in this group were developmental enough to achieve the industrial revolution, but unable to maintain rapid growth rates from 1980 onward. In Brazil, per capita income growth dropped from almost 4% a year during the industrial revolution (1930–1980) to 1.2% a year from 1981 to 2014. Much the same happened in Mexico. When analysing the two countries’ developmentalism in this period, Ben Ross Schneider (1999, p. 278) found it to have four basic characteristics: state-dependent profits and investment, a developmental discourse dominated by the need to industrialize and the role of the state in fostering industrialization, the exclusion of the majority of the population, and a highly institutionalized public sector bureaucracy.15 I would add a fifth characteristic to the foregoing: over-dependence on foreign borrowing, which ultimately financed consumption far more than investment and was the central cause of the crisis and demise of the developmental state —something that was definitely not a feature of East Asia’s independent peripheral model. This saved the East Asian countries from the deep financial crisis produced by the foreign debt crisis of the 1980s, which interrupted growth in the Latin American countries even as the East Asian countries continued to grow fast.
The main analysts of national-dependent development were Raúl Prebisch, Celso Furtado, Osvaldo Sunkel, Aníbal Pinto, Hélio Jaguaribe and Ignácio Rangel, whose fundamental contributions emerged in the 1950s and 1960s. Classic developmentalism argued that the market could not ensure correct microeconomic pricing in developing countries, particularly in the early industrialization phase, and proposed industrial policy as a remedy. Fifty years on, the new developmentalism reserves a secondary but strategic place for industrial policy and argues that in developing countries (and to a lesser extent rich countries too) the market is incapable, above all, of setting correct macroeconomic prices: (i) a low base interest rate around which the central bank conducts monetary policy, (ii) a balanced exchange rate that makes manufacturing companies using state-of-the-art technology competitive, (iii) wages that grow with productivity so that (iv) inflation is kept under control and, last but not least, (v) a satisfactory rate of profit for manufacturing firms, motivating them to invest. The very existence of central banks is, indeed, an admission of this incapability. To achieve this, besides defending balanced fiscal and external accounts, the country must adopt an active exchange-rate policy involving structural or long-term
15 Where the public bureaucracy is concerned, this view applies more to Mexico than to Brazil. In an essential book, Schneider (1991) showed that the Brazilian public bureaucracy was relatively informal but very professional.

43CEPAL Review N° 128 • August 2019
Luiz Carlos Bresser-Pereira
measures.16 Asian techno-bureaucrats did not have this theoretical framework to rely on, but had an impressive ability to pragmatically align measures to correct microeconomic prices through industrial policy with the maintenance of the right macroeconomic prices through active macroeconomic policy.
In the 2000s, the economic development literature formulated the concept of the “middle-income trap” to explain the loss of growth momentum in a whole set of countries that it dubbed middle-income, but whose range of per capita income levels in fact mixes two categories, pre-industrial and middle-income countries, the latter of which, in the opinion of the present author, have already carried out their industrial revolutions (Eichengreen, Park and Shin, 2014; Jankowska, Nagengast and Perea, 2012; Kharas and Kohli, 2011). What this literature found was the obvious: countries that grow at high rates (more than 4% a year, for example) for a relatively long period of time (such as five years) then experience a relatively large drop in growth rates (to below 2.5% a year, for example). Having identified those periods, which are common to radically different types of countries, the literature then attempts to use econometric studies to determine the cause of the slowdown and finds answers that are simply tautologies, such as “lack of industrial diversification” or “too high a growth rate”, or that are too generic, such as “insufficient investment in education”.
From 1980, indeed, growth rates plunged in countries with national-dependent developmental states, like Brazil and Mexico. But explaining this radical change requires new historical facts that the middle-income trap literature does not provide. Nor are they to be found in Schneider’s (1999) explanation, according to which the central difference between Latin American and East Asian countries was the less formal and less powerful bureaucracy of Latin America. This is not a new fact. Certainly a more professional bureaucracy with greater powers in the economic arena is to be preferred, but it is worth pointing out that Mexico’s and particularly Brazil’s public bureaucracies were strong enough to bring about industrialization before 1980, and there is no reason why they should have weakened thereafter. The two new historical facts that best explain the drop in Brazil’s and Mexico’s growth rates are the great foreign debt crisis of the 1980s and the West’s increased criticism of the developmental state since the adoption of neoliberalism as an ideology and its practical definition in the shape of the Washington Consensus. These two factors led to the abandonment of the developmental strategy near the end of that decade. The liberal state embraced neoliberal policies, ceased to neutralize Dutch disease (which afflicts the majority of these countries) and began growing slowly except during commodity boom periods such as the 2000s. Chile has been the exception, but it is worth mentioning that the country changed its economic policy after the crisis created by the neoliberal experience of 1981–1982, making it less liberal, and has consistently maintained a high rate of tax on copper, partially neutralizing its Dutch disease.17
IV. The developmental state after the industrial revolution
We therefore have four models for the developmental state at the time countries carry out their industrial revolutions: the original central, latecomer central, independent peripheral and national-dependent peripheral models. What about after the industrial revolution? At this stage, a country’s economy liberalizes. Britain and France were liberal from the 1830s to the 1920s, albeit theirs was not a radical
16 To neutralize the tendency towards cyclical and chronic overvaluation of the exchange rate, the new developmentalism proposes an export tax to neutralize Dutch disease and a rejection of three commonly applied policies: growth combined with foreign borrowing (“savings”), the use of an exchange-rate anchor to control inflation, and a high real interest rate around which the central bank manages its monetary policy.
17 The tax on copper exports would fully neutralize Chile’s Dutch disease if it its rate varied with the severity of the disease (that is, exchange-rate overvaluation), which varies in turn with international commodity prices.

44 CEPAL Review N° 128 • August 2019
Models of the developmental state
economic liberalism. In the 30 golden years of capitalism after the Second World War, however, the fifth model of developmental state arose: the social welfare developmental state, involving a state that was both developmental and social democratic and a major class compromise, of which Przeworski (1985) produced the definitive study, allowing for a combination of growth and distribution.
However, an economic crisis in the 1970s paved the way for a contradictory economic liberalism, namely neoliberalism, a conservative ideology based on neoclassical economics and Austrian theory that endeavoured to carry out radical economic reforms that were supported by conservatives, even though their radical character made them incompatible with conservatism. The new state born out of this, the neoliberal state, was a radical attempt to go back to the liberal state of the nineteenth century. The attempt failed, however. First, it made no sense to return to an inferior model of the state. Second, capitalism had undergone extraordinary changes and become much more complex, so that it required more, not less, state coordination. Globalization retreated after the global financial crisis of 2008 and the collapse of neoliberalism and the state resumed a far greater role in rich countries, so that while their states may remain conservative, they are no longer neoliberal. However, this cannot be construed as a return to a developmental and social state like that in place after the Second World War. These countries are currently in a transition crisis where the conditions for strengthening the social state are not present. One cause of the advent of neoliberalism was the competition from developing countries that rich ones started to face as the former began exporting manufactured goods. This began in the 1970s and rose to new levels with the emergence of China in the 1990s. Now, together with the problem of migration to rich countries, competition from countries with access to cheap labour has been one of the root causes of the crisis of the social democratic state and the appearance of a nationalist far right in Europe.18
The market takes on a greater coordinating role once a country has become capitalist, but this is not to say that the state must cease to be developmental. As has just been seen, the golden years of capitalism were a second stage of developmentalism for the central original countries. Yet market coordination is more important in developed than in developing countries. The political explanation lies in rentiers’ and financiers’ clear preference for economic liberalism and the growing ideological hegemony of this social class in relation to productive entrepreneurs. The economic explanation lies in the increased economic diversity arising from economic development. As economic activities become more diversified relative to the level of diversity evinced by infrastructure and basic industry firms in the non-competitive sector, the market becomes more efficient than the state at coordinating the very numerous and diversified firms that then emerge. While it is relatively easy for the state to plan and coordinate infrastructure, and there is no prospect of the market doing it, the market is a more appropriate institution when it comes to coordinating diversified activities involving creativity and innovation. Therefore, it can be predicted that once a country’s industrial revolution is complete, market-based coordination will gain ground on coordination by the state. But this is not to say that the developmental state disappears, as liberal economists would have it. Instead, the state’s economic role changes. Now, the state’s essential role in the economic domain is to create the general conditions that make competent enterprises in the country able to compete and willing to invest, which means getting the five macroeconomic prices right (the profit rate, the interest rate, the exchange rate, the wage rate and the inflation rate) —something the market certainly does not achieve, as can be seen from the recurring price and financial instability that characterizes unregulated markets— and planning and partially investing in infrastructure and basic industry, adopting a strategic industrial policy, fostering scientific and technological development, promoting reduction of economic inequality, defending the environment, which is a public asset, and of course guaranteeing property rights and contracts. Once the industrial revolution is complete, therefore, the state over time retreats fully from competitive industries and partially from non-competitive ones
18 Regarding the costs to the United States from its trade with China, Autor, Dorn and Hanson (2016, p. 1) conclude that, in addition to high regional costs because of firms shutting down, “[a]t the national level, employment has fallen in U.S. industries more exposed to import competition, as expected, but offsetting employment gains in other industries have yet to materialize”.

45CEPAL Review N° 128 • August 2019
Luiz Carlos Bresser-Pereira
(which means limiting public investment to around one fifth of total investment), because the market is better equipped to coordinate competitive activities. If it is a developmental state, though, it will continue to coordinate the monopolistic sector of the economy and conduct an active macroeconomic policy.19
The main problem facing developmental and liberal states alike is the political and economic competence of their rulers. Successful developmental states have always relied on republican-minded nationalist politicians and pragmatic economists who knew that their core job was to ensure economic stability and develop policies that contributed to their country’s industrialization or productive sophistication. Such competent politicians and economists are not always to be found. Politicians often give in to the temptation of raising people’s incomes without the required increase in production and indulging in economic populism, be it exchange-rate populism, whereby the country runs up large current account deficits, or fiscal populism, whereby the state runs up large public deficits. In either case, the result is increased consumption and indebtedness, whether domestic, foreign or both. It must not be imagined, though, that the liberal state avoids these problems. Exchange-rate populism is a more common practice in this model of state than in developmental states. The liberal politicians and economists who govern developing countries believe in the thesis, very dear to rich countries, that current account deficits are foreign savings which, added to domestic ones, increase the country’s investment rate. They do not know or care that there is a high rate of substitution of foreign for domestic savings in developing countries, where the marginal propensity to consume is high. More broadly, and against all evidence, they believe that the market correctly sets the foreign exchange rate, so that the government should not intervene in it. In developmental states, on the other hand, even if there was until recently no theory legitimizing exchange-rate policy, pragmatic exchange-rate management policies are commonly adopted because developmental economists know that strategies based on industrialization depend on the foreign exchange rate.20
V. Concluding remarks
In conclusion, economic development is a historical process of productivity and wage increases arising from the use of increasingly skilled or sophisticated labour in activities with greater value added per capita. It is the result of a coalition of classes that brings politicians and public bureaucrats into partnership with the businessmen responsible for investment and innovation. Within this framework, the developmental state has historically been and must continue to be the central development-oriented institution because it is the state that guarantees and regulates another equally fundamental institution: the market, a merely economic institution. The scope of the state is far greater. It is the instrument par excellence for the nation to attain the five major political objectives of modern societies: security, liberty, economic well-being, social justice and protection of the environment, objectives that must constantly be the subject of compromises or the principle of reasonability in the light of perceived or real short-run conflicts with each other. Economic development is necessarily the outcome of a national development strategy arising when a strong nation shows the ability to build an equally strong or capable developmental state. Nations only form and remain alive and strong when they are the product of a constantly renewed national agreement. If the social contract that binds them together is not sufficiently sound, if the social classes that form it do not maintain basic ties of solidarity when it comes to competing internationally, they will not stand as true nations, the country will be far more vulnerable to hegemonic Western thinking and the nation will lose strength, as Latin American countries did after the great crisis of the 1980s.
19 Japan’s industrialization in the late nineteenth century was almost entirely carried out by the state. Around 1910, however, a rapid and radical privatization process took place. In the case of Russia and China, their professedly socialist revolutions were in fact national and industrial; paradoxically, they were part of the capitalist revolution.
20 This theory constitutes the new developmentalism and its developmental macroeconomics. See Bresser-Pereira, Oreiro and Marconi (2014).

46 CEPAL Review N° 128 • August 2019
Models of the developmental state
The developmental state, which lies between the liberal state and statism, is a superior form of capitalist economic and political organization. It is a means whereby state and market coordination can be sensibly or pragmatically combined in capitalist economies. Several models of the developmental state have existed over the course of history, depending on whether its development was original or latecomer, central or peripheral, first- or second-wave. Every industrial revolution has taken place within the framework of developmental states, when a group of nationalist politicians have successfully formed a nation-state and industrialized. This phase is always dominated by the state, which manages to regulate a broad and comprehensive market, whereupon activities in the competitive sector of the economy, which are now more diverse and involve more creativity and innovation, can be advantageously coordinated by this market. But the state needs to and usually does remain developmental, because it is responsible for coordinating the non-competitive sector of infrastructure and basic industry, implementing an active macroeconomic policy (including an exchange-rate policy), reducing economic inequality and protecting the environment —a set of activities that the market cannot accomplish.
Bibliography
Akamatsu, K. (1962), “A historical pattern of economic growth in developing countries”, The Developing Economies, vol. 1, No. 1, Hoboken, Wiley.
Amsden, A. (1989), Asia’s Next Giant: South Korea and Late Industrialization, New York, Oxford University Press.Autor, D., D. Dorn and G. Hanson (2016), “The China shock: learning from labour market adjustment to large
changes in trade”, Annual Review of Economics, vol. 8, No. 1, Annual Reviews [online] https://www.annualreviews.org/doi/full/10.1146/annurev-economics-080315-015041.
Bairoch, P. (1993), Economics and World History: Myths and Paradoxes, Chicago, Chicago University Press.Barbosa Lima, A. (1973), Japão: O Capital se Faz em Casa, Rio de Janeiro, Paz e Terra. Bresser-Pereira, L. (2016), “Reflecting on new developmentalism and classical developmentalism”, Review
of Keynesian Economics, vol. 4, No. 3, Cheltenham, Edward Elgar [online] http://dx.doi.org/10.4337/roke.2016.03.07. (2008), “The Dutch disease and its neutralization: a Ricardian approach”, Brazilian Journal of Political Economy, vol. 28, No. 1, Sao Paulo, Editora 34 [online] http://dx.doi.org/10.1590/S0101-31572008000100003.(1963), “O empresário industrial e a revolução brasileira”, Revista de Administração de Empresas, vol. 3, No. 8, Sao Paulo, Getulio Vargas Foundation/School of Business Administration of Sao Paulo [online] http://www.scielo.br/scielo.php?script=sci_arttext&pid=S0034-75901963000300001.
Bresser-Pereira, L. and M. Ianoni (2017), “Developmental class coalitions: historical experiences and prospects”, Growth, Crisis and Democracy: The Political Economy of Social Coalitions and Policy Regime Change, H. Magara and B. Amable (eds.), London, Routledge.
Bresser-Pereira, L., J. Oreiro and N. Marconi (2014), Developmental Macroeconomics: New Developmentalism as a Growth Strategy, London, Routledge.
Canitrot, A. (1975), “La experiencia populista de redistribución de ingresos”, Desarrollo Económico, vol. 15, No. 59, Buenos Aires, Institute of Economic and Social Development.
Chang, H. (2002a), Kicking Away the Ladder, London, Anthem Press.(2002b), “The East Asian model of economic policy”, Models of Capitalism: Lessons for Latin America, E. Huber (ed.), University Park, Pennsylvania, Pennsylvania State University Press.
Corden, W. and J. Neary (1982), “Booming sector and de-industrialization in a small open economy”, The Economic Journal, vol. 92, No. 368, Hoboken, Wiley.
Díaz-Alejandro, C. (1981), “Southern Cone stabilization plans”, Economic Stabilization in Developing Countries, W. Cline and S. Weintraub (orgs.), Washington, D.C., The Brookings Institution.
Eichengreen, B., D. Park and K. Shin (2014), “Growth slowdowns redux”, Japan and the World Economy, vol. 32, Amsterdam, Elsevier [online] http://doi.org/10.1016/j.japwor.2014.07.003.
Evans, P. (1995), Embedded Autonomy: States and Industrial Transformation, Princeton, Princeton University Press.(1992), “The State as problem and solution: predation, embedded autonomy, and structural change”, The Politics of Economic Adjustment: International Constraints, Distributive Conflicts and the State, S. Haggard and R. Kaufman (eds.), Princeton, Princeton University Press.

47CEPAL Review N° 128 • August 2019
Luiz Carlos Bresser-Pereira
Fonseca, P. (2014), “Desenvolvimentismo: a construção do conceito”, Presente e Futuro do Desenvolvimento Brasileiro, A. Calixtre, A. Biancarelli and M. Cintra (eds.), Brasilia, Institute of Applied Economic Research (IPEA).
Fukuchi, T. and M. Kagami (eds.) (1990), Perspectives on the Pacific Basin Economy: A Comparison of Asia and Latin America, Tokyo, Institute of Developing Economies.
Gellner, E. (1996), “The coming of nationalism and its interpretation: the myths of nation and class”, Mapping the Nation, G. Balakrishnan (ed.), London, Verso. (1983), Nations and Nationalism, Ithaca, Cornell University Press.
Gerschenkron, A. (1962), Economic Backwardness in Historical Perspective: A Book of Essays, New York, Praeger.Hamilton, A. (1791), “Report on manufactures” [online] http://bit.ly/1FaVTTg.Ianoni, M. (2014), “Teoria do Estado desenvolvimentista: uma revisão da literatura”, Sinais Sociais, vol. 9,
No. 24, Rio de Janeiro, Departamento Nacional de Serviço Social do Comércio (SESC) [online] http://bit.ly/2od6pYO.
Jaguaribe, H. (1962), Desenvolvimento Econômico e Desenvolvimento Político, Rio de Janeiro, Fundo de Cultura.Jankowska, A., A. Nagengast and J. Perea (2012), “The middle-income trap: comparing Asian and
Latin American experiences”, OECD Development Centre’s Policy Insights, No. 96, Paris, Organization for Economic Cooperation and Development (OECD) [online] http://dx.doi.org/10.1787/5k8x7gwqsllp-en.
Johnson, C. (1999), “The developmental State: odyssey of a concept”, The Developmental State, M. Woo-Cumings (ed.), Ithaca, Cornell University Press. (1982), MITI and the Japanese Miracle, Stanford, Stanford University Press.
Kharas, H. and H. Kohli (2011), “What is the middle-income trap, why do countries fall into it, and how can it be avoided?”, Global Journal of Emerging Market Economies, vol. 3, No. 3, Thousand Oaks, SAGE [online] https://doi.org/10.1177/097491011100300302.
Kohli, A. (2012), “Coping with globalization: Asian versus Latin American strategies of development, 1980–2010”, Brazilian Journal of Political Economy, vol. 32, No. 4, Sao Paulo, Editora 34 [online] http://dx.doi.org/10.1590/S0101-31572012000400001. (1999), “Where do high growth political economies come from? The Japanese lineage of Korea’s ‘developmental State’”, The Developmental State, M. Woo-Cumings (ed.), Ithaca, Cornell University Press.
List, F. (1999), National System of Political Economy, Roseville, Dry Bones Press.Lovett, W., A. Eckes Jr. and R. Brinkman (1999), US Trade Policy: History, Theory, and the WTO, Armonk,
New York, M. E. Sharpe.Maddison, A. (1977), “Phases of Capitalist Development”, PSL Quarterly Review, vol. 30, No. 121, Roma,
Banca Nazionale del Lavoro.Przeworski, A. (1985), Capitalism and Social Democracy, Cambridge, Massachusetts, Cambridge University Press.Schneider, B. (1999), “The desarrollista State in Brazil and México”, The Developmental State, M. Woo-Cumings (ed.),
Ithaca, Cornell University Press. (1991), Politics within the State: Elite Bureaucrats and Industrial Policy in Brazil, Pittsburgh, Pittsburgh University Press.
Schumpeter, J. (1954), History of Economic Analysis, London, Allen & Unwin. Wade, R. (1990), Governing the Market, Princeton, Princeton University Press.Woo-Cumings, M. (ed.) (1999), The Developmental State, Ithaca, Cornell University Press.


The development of venture capital in Latin America and the Caribbean: a comparative perspective
Ernesto H. Stein and Rodrigo A. Wagner1
1 The authors gratefully acknowledge the support provided to this research by an anonymous referee, Susana García-Robles and her team at the Multilateral Investment Fund (MIF), and Juan Savino from the Latin American Venture Capital Association (LAVCA). The authors also acknowledge useful comments received at the Conference on Model-based Evidence on Innovation and Development (MEIDE) and from the Inter-American Development Bank (IDB). This research was partially funded by a grant from the IDB Research Department project, Understanding Venture Capital in Latin America.
Abstract
Venture capital (VC) contributes to the financing of high-growth companies. In Latin America and the Caribbean, this capital is lower than in China and India as well as the developed economies. Nonetheless, between 2005 and 2011, regional VC investments grew by 30% per year. Venture capital investments in Latin America and the Caribbean tend to be larger, focus less on high-technology industries and are more likely to be funded from abroad than those in benchmark regions. Transactions in Latin America and the Caribbean are made by less experienced investors and in fewer rounds than in comparator countries. Venture capital growth has been quite procyclical. The evidence shows that VC investments are in the early stages of development, with apparently more money than high-technology ideas.
Keywords
Venture capital, investments, enterprise development, comparative analysis, statistical data, Latin America
JEL classification
G24, L26
Authors
Ernesto Stein is Principal Economist with the Research Department of the Inter-American Development Bank. Email: [email protected].
Rodrigo Wagner is an Assistant Professor with the School of Business of Universidad Adolfo Ibáñez (UAI), Chile. Email: [email protected].
50 CEPAL Review N° 128 • August 2019
The development of venture capital in Latin America and the Caribbean: a comparative perspective
I. Introduction
According to Rajan (2012), the fundamental tension in corporate finance is caused by the interplay of two forces. Firstly, an entrepreneur has to produce innovative and differentiated assets that create new value, otherwise the enterprise would be unlikely to take market share. Secondly, the entrepreneur has to be able to credibly promise a fraction of the value created by these new assets to an outside investor, in order to obtain external finance. The problem arises because the more differentiated and the less known the asset, the harder it is to credibly pledge income from the project to a third party who finances it but does not control it. This creates constraints for new types of technology, because projects that are potentially profitable may not receive funding because of this credibility problem (also known as pledgeability concerns).
Fortunately, this major constraint on new, innovative businesses can be mitigated by using a form of financing that departs from arm’s length transactions, adopting instead an active monitoring role and conditional control rights, which improves the pledgeability of the project and thus its chances of obtaining funding. The type of financing in question is venture capital (VC), which has enjoyed spectacular growth in recent decades, and has been especially important for the financing of highly innovative start-ups in the United States.
Venture capital has also been taking off in Latin America, albeit on a much smaller scale. Nonetheless, while a few studies have touched on specific features of this process, there is currently no academic work examining the basic stylized facts of recent VC development in the region. This is an inconvenient gap because Latin American governments are increasingly looking to foster the entrepreneurial ecosystem; and international development institutions are actively participating as partners in this process. For example, the International Finance Corporation (IFC), part of the World Bank Group, and the Multilateral Investment Fund (MIF), which is the investment arm of the Inter-American Development Bank (IDB), have acted as limited partners in private equity financing in the region, with a significant focus on VC.2
This article provides a quantitative overview of VC investments in Latin American firms. Wherever possible, it provides a comparative perspective showing how the various characteristics of Latin American VC investments differ from those in other regions of the world.
It is worth starting this process by noting the main limitations of the exercise, the most important of which stems from imperfect data availability, since VC investments do not target publicly traded corporations. Nonetheless, VC financing could play a pivotal role in the development of the private sector in Latin America, so it is worth exploring the patterns that emerge from the available data, even if they are imperfect.3 A second limitation arises from the exploratory nature of this study, which aims to provide an overview of VC in the region. The study will make gross simplifications that mean ignoring many country-level specifics that are potentially relevant. Lastly, a third limitation stems from the previous two. It is tempting to read comparative data across countries as if they were rankings of national soccer teams, where even small differences between neighbouring countries can become sources of national pride or shame. However, readers should resist this temptation in this instance because data for the region are incomplete and volatile, so it is difficult to identify statistical noise and second-order differences.
2 Venture capital is a subset of private equity. Between 1996 and 2010, MIF invested a total of US$ 215 million in private equity in the region. More than 30% of recorded private equity investments were made at the beginning of that period. Since then, other players have entered the market, so the share of these types of institutions is decreasing.
3 Venture capital is a minuscule fraction of overall macroeconomic investment, even in the United States, but particularly in Latin America. Countries value it for its potential to unveil new business models, rather than for its mechanical effects through aggregate investment. Macroeconomic investment is equivalent to 23% of gross domestic product (GDP) (see table A1.1 in the annex). The unweighted global average VC-to-GDP ratio across countries is 0.04%. In Latin American countries, VC investments are in the neighbourhood of 0.01% to 0.04 % of GDP; and in the United States they are equivalent to 0.18% of GDP.

51CEPAL Review N° 128 • August 2019
Ernesto H. Stein and Rodrigo A. Wagner
As noted above, the aim of this study is to add to the sparse literature that exists on VC financing in Latin America, focusing more on broad quantitative patterns than on either the relevant qualitative aspects or a single economic mechanism. While there is limited literature on the topic, this study is not the first to examine VC in Latin America. For example, Bruton, Ahlstrom and Puky (2009) use expert interviews and qualitative analysis to compare VC practices in Asian and Latin American countries. The present study takes a more quantitative approach, examining the amounts and types of investment. In that regard, it is closer to Khoury, Junkunc and Mingo (2012), who drew on data from Thomson Reuters for the period 1995–2004 on VC investments in Latin America. Those authors show that the average size of investment per round in the region tends to be larger in countries that have weaker institutions. They argue that when venture capitalists face institutional uncertainty they tend to avoid early-stage investments, which require more intensive staging and multiple investment rounds, preferring projects that are at a later stage of development.4 The approach taken by this paper differs not only in terms of the time horizon —extended to 2011— but also because it explicitly compares VC investments in Latin America with those in other regions of the world, to identify what is different and distinctive in Latin America. This study seeks to reveal broad patterns, rather than focusing on a single mechanism. Along similar lines, Jiménez (2008) was also interested in VC patterns and policy, but his analysis only encompasses aggregate data for Brazil and Chile. This paper uses two sources or microdata, namely the new Latin American Venture Capital Association (LAVCA) database, with data covering the period from 2008 to 2011 and Thomson ONE, with data from 2000 to 2012. Wherever possible, two data sources are used explore whether a particular stylized fact is robust to data-collection differences.5 Overall, this study complements the recent review of alternative investments in emerging markets made in Cumming and Zhang (2016), by comparing Latin America with other regions.
The main findings of the study are that, in keeping with other sources, it confirms that VC financing in Latin America is clearly orders of magnitude below that of developed economies; but more importantly, the VC-to-GDP ratio in the region is also well below those of the regions that are home to China and India, despite the lower per-capita income levels of those regions.
Nonetheless, despite starting from a low base, since 2005, VC investments in Latin American companies have been growing by an average of more than 30% per year, with around one quarter of all such deals being made by foreign VC investors.
The study establishes a number of stylized facts about VC investments in the region. Firstly, VC investments in Latin America tend to be in less high-technology ventures than in other regions of similar income level. Secondly, the average project size is larger than in these comparator regions, although the size difference is mostly explained by the fact that non-high-technology projects are larger. Thirdly, venture capitalists from outside the region invest significantly larger amounts in Latin American firms than those from the region. Fourthly, VC firms that invest in Latin America have significantly less experience than those investing in other world regions, with the sole exception of Sub-Saharan Africa. Fifthly, VC investments are heavily dependent on the business cycle in the host country. This procyclicality is three times stronger for VC than for macroeconomic investment in the region, and six times stronger than the procyclicality displayed by VC outside of Latin America. Taking these facts together, the evidence points to an underdeveloped VC ecosystem that is in its early stages.
4 Liao, Lu and Wang (2014) examine the success of VC-backed firms in emerging markets when taken public through an initial public offering (IPO). Otchere and Vong (2016) explore the effects of VC-backed firms on the pricing of IPOs in China.
5 Pereiro (2001) surveyed various sources of entrepreneurial finance in Argentina compared to out-of-sample estimates from developed countries, concluding that “(a) it takes on average more money for the Argentinian entrepreneur to start a de novo venture than for his/her counterparts in the United States; (b) operational parameters of formal private equity or VC funds are in line with international standards; and (c) Argentinian angels invest on average substantially higher amounts per venture than their counterparts in other countries, being also younger than the international average.” Unlike that study, this one relies on comparable data from various Latin American countries and, in some cases, uses data from the same databases in the region.

52 CEPAL Review N° 128 • August 2019
The development of venture capital in Latin America and the Caribbean: a comparative perspective
Lastly, the study explores which variables explain the differences in levels of VC development among countries, measured as the VC-to-GDP ratio. The results show that the factors driving the demand for VC, such as patents and scientific articles, explain a significant part of the VC-to-GDP ratio. The size of the market is also important. In contrast, the study did not find a significant link between VC development and the factors associated with the supply of funding, measured by stock market capitalization as a percentage of GDP. Large countries with high levels of patenting activity tend to have more developed VC markets. This is relevant for discussions on Latin American innovation and integration.
II. Sources of data on venture capital investments in Latin America
Historically, VC data collection is still in its infancy in less developed economies, as was the case with GDP measures was in the early 1900s, or as empirical studies of corporate finance of publicly traded companies used to be before standardized data were available. Unlike data on GDP and public enterprises, the availability and reliability of VC data is unlikely to improve very fast since the vast majority of transactions take place between private parties that have no legal obligation to report to a centralized clearing house. There is therefore no point in waiting to explore the available data. It would also be a mistake to take every single aggregate figure at face value, partly because data collection is still in its infancy, but also because classification criteria are not yet standardized across reporting sources. For example, an injection of US$ 500,000 into a website in Colombia that claims to be the new e-Bay is probably an early-stage VC investment, but what about a relatively new family firm with a successful business model that wishes to expand? This would normally be classified as non-VC private equity; but it could be an example of VC financing, depending on the circumstances. One criterion is the age of the firm, another is the type of contract used and the novelty of the technology, as well as the size of the investment. Since many figures are self-reported, the organizations that collect the data also consider the orientation of the reporting fund. The annex to this article discusses the criteria in question, noting that databases may have different classifications, but those differences are hard to pin down.
In short, this article will describe broad trends and will identify the differences between and potential biases of the two data sources.
1. Comparing the two sources: similarities and differences
The two main data sources are, firstly the updated dataset produced by LAVCA, covering the period 2008–2011; and, secondly, transaction-level information from the Thomson ONE Private Equity Module (formerly VentureXpert). The sample is drawn from the period 2000–2012, but emphasis is placed on the trends displayed in 2005–2012. The annex provides details on both samples.6
It is important to clarify that the two databases obtain their information from different reporting sources and might not be measuring exactly the same phenomenon.7 Thomson ONE information is sourced through direct submissions by global private equity and VC firms, and banking and legal contributors. Although it is not explicitly stated, the manner in which the data are reported would tend to give undue weight to large investments and those involving foreign firms. In contrast, LAVCA data
6 Although data since 2000 are certainly available, the authors of this study preferred to examine new trends and limit the scope to a period where data, albeit imperfect, have a higher deal density, otherwise the figures would become too volatile to be able to draw any conclusions.
7 Another leading source for VC research, Dow Jones VentureSource, does not cover transactions in Latin America.

53CEPAL Review N° 128 • August 2019
Ernesto H. Stein and Rodrigo A. Wagner
comes from surveying VC firms in Latin America under a confidentiality agreement. This makes the LAVCA data a better resource when considering smaller domestic investors or investors that syndicate less with foreign VC firms, as well as for firms that prefer confidentiality clauses when reporting their transactions. One big advantage of Thomson ONE is that it is possible to observe many more covariates, such as the age of the firms, type of technology, country of origin of the firm and the track record of previous investments for a particular the country in which the VC firm is located. LAVCA data indicate the technology involved and transaction value, but only for the most recent years in the sample. Most importantly, Thomson ONE data allow Latin America and the Caribbean to be compared with other regions. In general, in this study, LAVCA data will be used only to supplement more complex analysis. Nonetheless, it is reassuring to note that the aggregate figures display a high correlation between the two datasets. Using overlapping country-year combinations from the two sources, figure 1 displays the logarithm of the sum of VC investment for Thomson ONE (horizontal scale) and for LAVCA (vertical scale). While there are differences, the results are reasonably close to the 45-degree line.
Figure 1 Latin America (10 countries):a venture capital investments, 2008–2011
(Sum of investments (log scale))
ARG 2009 MEX 2008
ARG 2008ARG 2010
ARG 2011
BRA 2008
BRA 2009
BRA 2010BRA 2011
CHL 2008CHL 2009
CHL 2010
COL 2010
COL 2011
CRI 2009
DOM 2010HND 2011
MEX 2009
MEX 2010MEX 2011
PER 2010
URY 2011
45 degree
0
2
4
6
8
10
Vent
ure c
apita
l inv
estm
ents
in L
AVCA
0 2 4 6 8 10Venture capital investments in Thomson ONE
Source: Prepared by the authors, on the basis of data from Latin America Private Equity and Venture Capital Association (LAVCA) and Thomson ONE.
Note: Best fit log of investment in LAVCA = 3.25 + 0.48*log of investment in Thomson ONE.a Argentina, Brazil, Chile, Colombia, Costa Rica, Dominican Republic, Honduras, Mexico, Peru and Uruguay.
III. Venture capital in Latin America and the Caribbean
This section reviews VC levels and growth in Latin America and the Caribbean from a comparative standpoint. Figure 2 shows how VC investments in the region have evolved since 2000, and it compares this with other regions of the world, based on Thomson ONE data. As expected, the leader in terms of funding is clearly the United States —almost two orders of magnitude ahead of Latin America and the Caribbean— followed by other high-income economies.

54 CEPAL Review N° 128 • August 2019
The development of venture capital in Latin America and the Caribbean: a comparative perspective
Figure 2 World: total venture capital investments, 2000–October 2011
(Millions of dollars)
United States
10
100
1 000
10 000
100 000
2000 2002 2004 2006 2008 2010 2011
High-income countriesEast Asia and the Pacific (inc. China)Latin America and the Caribbean
South Asia (inc. India)Eastern Europe and Central AsiaSub-Saharan AfricaMiddle East and North Africa
2001 2003 2005 2007 2009
Source: Prepared by the authors, on the basis of data from Thomson ONE.
The region of Latin America and the Caribbean is still currently close to regaining the volumes recorded at the time of the dotcom crash in 2000, with a trend that resembled an inverted-U with a trough around 2005.
Figure 2 clearly shows that VC flows to firms in the region are relatively more volatile, which is partly explained by the fact that a few large transactions in a given year can drastically change investment totals even though VC development is at relatively low levels. The figure also shows that investment is less volatile in those regions where venture capitalism is more developed, as, proportionally, more transactions take place in those regions, which makes the measurement more stable.
Overall, each year in the period 2000–2011, Latin America received between US$ 100 million and US$ 1 billion in VC financing, with VC investments growing particularly fast since 2005.
Table 1 displays the trend VC growth rates in various regions between 2005 and 2011 (calculated using log-linear regression). The most salient aspect of the data for the purposes of this study is that Latin America and Caribbean is clearly among the regions where VC investments are growing fastest, together with Sub-Saharan Africa. In Latin America and the Caribbean, the value of VC investments grew at a rate of 31.2% per year, which is well above the 9.7% of East Asia and the Pacific (including China) and the 7.6% per annum of South Asia, including India. During this period, developed regions were essentially flat, as measured by the log-linear trend (0.5% annual growth in industrialized countries excluding the United States, and a 0.1% decrease in that country).
Additional analysis suggest this rapid growth in Latin America could be a real phenomenon rather than an artefact of measurement, as even though the databases use different recording systems, this rapid growth in Latin America and the Caribbean is qualitatively mirrored by LAVCA data on VC transactions between 2008 and 2011, which showed 53% annualized growth (part of the difference can be explained by the fact that the starting point for the data is 2008, not 2005).

55CEPAL Review N° 128 • August 2019
Ernesto H. Stein and Rodrigo A. Wagner
Table 1 World: annual growth rates of venture capital, 2005–2011
(Percentages)
RegionVolume reported Overall No. of
financing roundsNo. of rounds reporting
value invested Reporting rate
(A) (B) (C) (D) = (C) - (B)
Sub-Saharan Africa 39.40 -3.80 -3.20 0.60
Latin America and the Caribbean 31.20 11.70 8.40 -3.30
East Asia and the Pacific 9.70 14.20 8.80 -5.50
Eastern Europe and Central Asia 9.70 -2.20 -1.20 1.00
South Asia 7.60 15.50 13.00 -2.50
High-income countriesa 0.40 -7.90 -6.30 1.70
United States -0.10 0.40 -0.60 -1.00
Middle East and North Africa -64.70 -0.50 -26.00 -25.50
Alternative data for Latin America and the Caribbeanb
53.50 22.40 17.60 -4.80
Source: Prepared by the authors, on the basis of data from Latin America Private Equity and Venture Capital Association (LAVCA) and Thomson ONE.
a Excluding the United States of America.b Data taken from Latin America Private Equity and Venture Capital Association (LAVCA) covers the period 2008–2011.
A potential concern is that the rate of reporting is changing over time; and the remarkable growth in the region in recent years is a spurious result. But this seems less of a concern because table 1 shows that the rate of reporting has actually dropped slightly in the region, by 3% per year. This suggests that the growth in VC investment volumes is occurring despite less, rather than because of increased reporting. The LAVCA data reveals a similar situation in the final row of the table. Lastly, the number of financing rounds reported in the region increased by 11.7% per year according to Thomson ONE data, placing it in the top three regions. In the case of LAVCA data, the number of deals increased by 22% per year. In short, the two databases present the same qualitative picture of rapid growth in VC investments in Latin America and the Caribbean in the last few years. However, as noted above part of this large growth reflects the very low starting level.
To explain potential changes in the composition of these VC investments in Latin America and the Caribbean, figure 3 describes the evolution of certain characteristics of transactions in the regional portfolio reported by Thomson ONE.8 The transactions are disaggregated by syndicated investments, those which involve more than one VC firm; investments in high-technology industries; and domestic private equity investors. It should be borne in mind that transactions may combine different characteristics.
The picture does not suggest a major compositional change during the years of rapid VC investment growth in Latin America and the Caribbean, although the share of high-technology transactions declined following the commodity price boom in 2004–2005. Investments in high-technology firms accounted for around 60% of total VC financing before that boom and later dropped to a mean fluctuating around 40%. Apart from that, however, figure 3 shows no other obvious trends. The share of syndicated transactions was in the neighbourhood of 10% to 20% over the period, while the domestic private equity accounted for between 50% and 70% of transactions.9
8 Shares are weighted by investment round, not by value.9 One caveat is that Thomson ONE may overrepresent the share of foreign transactions, particularly those originating from the
United States or some other large and well-reported economy.

56 CEPAL Review N° 128 • August 2019
The development of venture capital in Latin America and the Caribbean: a comparative perspective
Figure 3 Latin America and the Caribbean: venture capital transactions by specific characteristics,
2000–2011(Share of total venture capital investments)
0
0.2
0.4
0.6
0.8
2000 2005 2010SyndicatedHigh-technology Domestic private equity
Source: Prepared by the authors.
In order to compare venture capitalism in Latin America with the rest of the world, figure 4 explores the development of VC financing in different countries by calculating VC investments in each country as a percentage of domestic GDP and then plotting that figure against national per capita GDP, measured in purchasing power parity (PPP) terms. This makes it possible to compare some Latin American economies to other countries, controlling for their level of development and also the size of their economy. The vertical axes of the graphs are measured both in percentage terms and as a log scale, because otherwise it would be impossible to distinguish anything given the very large differences, even when presented as percentages of GDP.
Figure 4 World (selected countries): venture capital relative to domestic GDP, by per capita income
on the basis of purchasing power parity dollars(Percentages and log scale)
A. Using data from regional venture capital associations, 2010–2011
Vent
ure c
apita
l inv
estm
ent a
s a s
hare
of G
DP(p
erce
ntag
es an
d lo
g sc
ale)
Log of GDP per capita (purchasing power parity dollars)
ARE
AUSAUTBEL
BGR
BRN
CANCHE
CHN
CYP
CZE DEU
DNK
ESP
EST
FIN
FRA
GBR
GEO
GRC
HKG
HUN
IDN
IND
IRL
ISR
ITA
JOR
JPN
KOR
KWT
LTU
LUX
LVA
MNG
MYS
NLDNOR
NZL
POL
PRT
RUS
SAU
SGP
SWE
THA
TUN TUR
UKR
USA
VNMZAF
ARGBRA
CHL
COL
DOM
HND
MEX
URY
0.001
0.010
0.050
0.100
0.500
8 9 10 11

57CEPAL Review N° 128 • August 2019
Ernesto H. Stein and Rodrigo A. Wagner
B. Using venture capital data from Thomson ONE, around 2011
AUSAUT
BEL
BGR
CAN
CHECHN
CZE
DEU
DNK
ESP
FINFRA
GBR
HKG
HUN
IND
IRL
ISR
ITAJPN
KOR
MYSNLD
NZL
POL
PRT
ROURUS
SWE
TUR
UKR
USA
VNM ZAF
ARG
BRA
CHL
COL
MEX
0.001
0.010
0.050
0.100
0.500
8 9 10 11
Vent
ure c
apita
l inv
estm
ent a
s a s
hare
of G
DP(p
erce
ntag
es an
d lo
g sc
ale)
Log of GDP per capita (purchasing power parity dollars)
Source: Prepared by the authors, on the basis of J. Lerner, “Presentation of venture capital trends”, paper presented at the Venture Capital in Latin American Policy Meeting, Inter-American Development Bank (IDB)/Multilateral Investment Fund, 17 May 2012, and data from Thomson ONE and World Bank, World Development Indicators [online database] https://datacatalog.worldbank.org/dataset/world-development-indicators.
As expected, Latin American countries are behind global leaders such as the United States and Israel. Nonetheless, a striking but less obvious fact is that the average VC investment-to-GDP ratio for China and India is 0.04%, but the average for the Latin American countries in the sample is just one tenth of this (0.004%), even though the average per capita income of the Latin American countries is twice that of China and India (see figure 4.A). This qualitative result does not change significantly if weighted by the size of the countries in each group (in other words, if the Latin American countries in the sample are considered as a single entity). Most Latin American countries in this plot seem closer to some Eastern European economies, or even to more developed economies with lower relative VC penetration such as Italy, Spain or Japan. Although the relative positions of Latin American countries change in figure 4.B, which uses Thomson ONE data, the overall picture of the region and the comparison with China and India are strikingly similar.
China and India tend to invest more than other countries generally, not just in VC investments. For same years shown in figure 4, gross fixed capital formation was around 21% of GDP for the Latin American economies in the sample. The investment rate in China was twice that, close to 45% of GDP; while the rate in India was somewhere in between, around 33% of GDP. That means that there is a difference in investment generally; but the tenfold difference in the VC-to-GDP ratio found by this study is only partially explained by this general investment trend. There is at least a fivefold “residual” lag in the Latin American VC-to-GDP ratio even after this correction.
Figure 4 (concluded)

58 CEPAL Review N° 128 • August 2019
The development of venture capital in Latin America and the Caribbean: a comparative perspective
When comparing research and development (R&D) investments in the same years as used for figure 4, the weighted average in Latin America is not far behind India’s, at around 0.8% of GDP.10 In contrast, the rate of R&D investment in China is twice as high as these figures, in the neighbourhood of 1.7% of GDP. Nonetheless, these differences in R&D investment intensity do not fully explain the tenfold difference in VC investment between Latin America and China and India revealed by figures 4.A and 4.B. In short, the lag of Latin American venture capitalism vis-à-vis the large emerging Asian economies seems greater than expected, at least when considering macroeconomic investment rates or R&D intensities.
It is worth noting that the goal of an economy is not to maximize venture capitalism; and, in fact many developed economies do not have high levels of VC financing. Having said that, an open question for the rest of this article would be whether levels of VC investment are low because there are few projects demanding VC financing (little “deal flow”, maybe because of the type of innovation or industry in which the country in question has advantages) or because of the level of financial development. This point will be considered below in section V.
IV. Comparative stylized facts on venture capitalism in Latin America and the Caribbean
This section outlines various characteristics of VC investments in Latin America and the Caribbean, in comparison to those of other regions, especially the large Asian economies such as China and India.
1. High-technology sectors account for a lower share of Latin American venture capital investments
Figure 5 shows that VC investment rates in Latin America have been 5 percentage points lower than in other non-industrialized regions over the last decade. This trend can also be seen in specifications (4) and (5) of table 2, which show that the share of projects in high-technology sectors is smaller in Latin America and the Caribbean than in high-income and East Asian and Pacific countries (chiefly China). To check that the high-technology share does not reflect reporting bias, table 2 considers those transactions which report investment in (4), as well as those that do not in (5). The aforementioned differences in regional averages are qualitatively unaffected by the type of measurement, which suggests that that the high-technology sector’s low share of investment in Latin America and the Caribbean is unlikely to stem from a bias in the value of reported transactions. Overall, roughly half of early-stage investments in the region are in high technology firms, compared to 75% in East Asia (a figure that is almost the same as that of developed nations) and 60% in South Asia. Only high-technology firms in the region of Eastern Europe and Central Asia (mostly composed of countries of the former Soviet Union) receive as little investment as those in Latin America, while those in Sub-Saharan Africa are at the very bottom of the ranking, with around 10%.
Overall, the wealthier the country, the greater VC investments tend to be. This appears both in a worldwide cross-country correlation (not shown) and also within Latin American economies (see figure 6).
10 Brazil spent more on R&D relative to GDP than India, at around 1.1% of GDP; while the rate is lower than that of India in Mexico, Chile and most of the other Latin American countries. See World Bank, World Development Indicators [online database] https://datacatalog.worldbank.org/dataset/world-development-indicators for the year 2010–2011.

59CEPAL Review N° 128 • August 2019
Ernesto H. Stein and Rodrigo A. Wagner
Figure 5 Latin America and selected non-industrialized countries: the high-technology sector’s share
of venture capital transactions, 2000–2012 (Decimal fractions, 0–1)
65
70
75
80
2000 2005 2010 2015
95% confidence interval Latin America and the CaribbeanOther non-industrialized countries
Source: Prepared by the authors.
Figure 6 Latin America (10 countries):a the high-technology sector’s share of venture capital
transactions, by per capita GDP (At 2011 purchasing power parity (PPP), in logs)
ARG
BOL
BRA
CHLCOL
CRI
ECU
MEX
PER
URY
-0.2
0
0.2
0.4
0.6
0.8
1.0
High
-tech
nolo
gy s
ecto
r’s s
hare
of V
C tra
nsac
tions
8.5 9.0 9.5 10.0
Log of per capita GDP
Source: Prepared by the authors, on the basis of data from Thomson ONE.Note: Each log point of per capita GDP is associated with a 14 percentage point increase in the share of the high-technology sector.a Argentina, Brazil, Chile, Colombia,Costa Rica, Ecuador, Mexico, Peru, Plurinational State of Bolivia and Uruguay.

60 CEPAL Review N° 128 • August 2019
The development of venture capital in Latin America and the Caribbean: a comparative perspective
2. Venture capital investments in Latin America are larger on average than in comparable regions, but mostly go to non-high-technology firms
Table 2 reports the average investment amounts by region. Column (1) shows that early-stage VC investments are larger in Latin America and the Caribbean than in developed and many other non-high-income regions, except for East Asia and the Pacific, which is mostly dominated by transactions in China. To understand the reasons for this, transactions are classified according to whether or not they are in the high-technology sector (2 and 3). The analysis reveals that the bulk of the difference for Latin America is caused by very large investments in non-technology sectors, which pushes up the average investment amount. This trend contrasts with the pattern in East Asia and the Pacific (chiefly China), where investment sizes are larger in both the high-technology and the other categories.
Table 2 World: regressions of venture capital investment size and share of high-technology firms
on regional dummiesa
Region
Left-hand side: log of investment Left-hand side: share of high-technology firms
All If non-high-technology High-technology If reporting investment
(US dollars) All
(1) (2) (3) (4) (5)East Asia and the Pacific 1.288*** 1.606*** 1.172*** 0.733*** 0.726***
(0.02) (0.08) (0.02) (0.01) (0.00)
Eastern Europe and Central Asia 0.203 0.701 -0.295 0.500** 0.536***
(0.35) (0.66) (0.25) (0.22) (0.14)
Industrialized countries -0.579* -0.733** -0.522* 0.728*** 0.727***
(0.30) (0.31) (0.31) (0.03) (0.02)
Latin America and the Caribbean 1.373*** 2.655*** 0.0912 0.500*** 0.483***
(0.22) (0.58) (0.28) (0.13) (0.10)
South Asia 0.682*** 1.079*** 0.418*** 0.600*** 0.634***
(0.03) (0.04) 0.00 (0.02) (0.01)
Sub-Saharan Africa -0.456 -0.478 -0.247 0.0952** 0.0800**
(0.41) (0.39) (1.69) (0.04) (0.04)
No. of observations 1 818 520 1 298 1 818 2 748
R-squared 0.105 0.155 0.09 0.722 0.721
Source: Prepared by the authors, on the basis of data from Thomson ONE.Note: Robust standard errors clustered by country are given in parentheses. Asterisks indicate the statistical significance of the
coefficient: *** p-value <0.01, ** p-value <0.05, * p-value <0.1.a The Middle East and Africa is excluded because Thomson ONE data only cover seed and early-stage investments for that
region. No group is omitted from the regression.
3. In Latin America and the Caribbean, foreign venture capitalists invest larger amounts per round than domestic ones
Figure 7 displays the distribution of transaction size by round and according to the nationality of the VC firm investing in the deal. On average foreign firms invest larger amounts. Figure 7.A shows that this is the case for seed and early-stage investments, while figure 7.B confirms that it is also the case with expansion and later-stage projects. These results, obtained using post-2005 data, are consistent with the previous findings of Khoury, Junkunc and Mingo (2012), who used pre-2004 data.
One potential concern is that the manner in which Thomson ONE data are collected could make it more likely that smaller transactions by foreign firms (many of which are based in the United States) are recorded. This potential bias, however, works contrary to the finding in figure 7, making the

61CEPAL Review N° 128 • August 2019
Ernesto H. Stein and Rodrigo A. Wagner
case for an even higher average level of investment by foreign firms. Another potential concern with the aforementioned stylized fact is that in Latin America the share of investments made by foreign VC firms could be larger, for example, because of a favourable time-zone relative to the United States or for some other reason. Table 3 considers the share of investments made by domestic venture capitalists (in other words, the complement of foreign VC firms). Investment in Latin America does not appear to be particularly skewed towards foreign firms. Foreign VC firms account for a similar share of investment in the region of East Asia and the Pacific (which includes China) as in Latin America and the Caribbean. Investment in the region of South Asia, which includes India, is split roughly 50–50 between domestic and foreign venture capitalists. This is almost twice the share of foreign VC investment than East Asia and the Pacific or Latin America and the Caribbean.
Figure 7 Latin America and the Caribbean: investment rounds, by domestic or foreign
venture capital investors, 2005–October 2012(US dollars, in log10)
A. All venture capital investments
0
0.2
0.4
0.6
Dens
ity
4 5 6 7 8 9Log10 (investment rounds)
B. Seed and early-stage venture capital investments
0
0.2
0.4
0.6
Log10 (investment rounds)4 5 6 7 8 9
Foreign investorsDomestic investors
0.8
Dens
ity
Source: Prepared by the authors, on the basis of data from Thomson ONE.Note: The plots use company-round-firm observations to avoid overweighting syndicated deals. The t-tests of means confirm
that VC investments by foreign venture capitalists are larger.

62 CEPAL Review N° 128 • August 2019
The development of venture capital in Latin America and the Caribbean: a comparative perspective
4. Venture capitalists investing in Latin America have less experience than those in comparable regions
Venture capital has been described as an industry in which there is much to learn from experience and specialization.11 Unfortunately, VC firms investing in Latin America seem to have less experience. Table 3 shows that the average VC firm investing in Latin America is 12 years old, in sharp contrast to all other regions, where, on average, firms have between 18 and 20 years of experience. The only exception is Sub-Saharan Africa, where VC firms are even younger. To some extent, Latin American VC firms suffer from a problem similar to that noted by Hsieh and Klenow (2014), who show that most United States manufacturing jobs are created by firms with longer histories and probably more organizational capital than companies in Mexico.
It is important to note the magnitude. The VC firms investing in industrialized countries are in fact those with the greatest experience (around 21 years). Columns (3) and (4) show that firms investing in East Asia and the Pacific (which includes China) and in South Asia (including India) only have two or three years less experience than those in industrialized countries. In contrast, Latin American investments are made by firms that, on average, have half the experience of their counterparts in industrialized countries. Column (4) also explores whether the results depend on the share of investments made by domestic VC firms, using a dummy variable that considers the fact that domestic VC firms may have less experience. On average, a domestic VC firm has four years less experience. Nonetheless, the fact that Latin America lags behind other regions —except Sub-Saharan Africa— is robust to this additional control variable.
Table 3 World: regressions explaining the regional effects of the share of domestic
venture capital investors and age of the firm, 2005–October 2012
Region
Left-hand side: binary 1 if VC is domestic Left-hand side: age of VC firm (years)Reported investment
(US dollars) All Reported investment (US dollars) All
(1) (2) (3) (4)East Asia and the Pacific 0.730*** 0.699*** 18.14*** 17.65***
(0.01) (0.01) (0.27) (1.33)
Eastern Europe and Central Asia 0.563*** 0.500*** 18.47*** 18.01***
(0.05) (0.05) (3.98) (2.32)
Industrialized countries 0.847*** 0.864*** 20.56*** 21.81***
(0.03) (0.02) (1.45) (1.07)
Latin America and the Caribbean 0.778*** 0.760*** 12.95*** 11.96***
(0.22) (0.17) (4.42) (2.14)
South Asia 0.535*** 0.547*** 20.54*** 21.74***
(0.02) (0.01) (0.33) (1.03)
Sub-Saharan Africa 0.619*** 0.560*** 7.840*** 12.35***
(0.17) (0.15) (2.93) (3.07)
1{Domestic VC} -4.84***
(1.71)
No. of observations 1 562 2 424 1 810 2 415
R-squared 0.828 0.842 0.566 0.498
Source: Prepared by the authors, on the basis of data from Thomson ONE.Note: The benchmark is Middle East (no intercept). The dummy variable 1{Domestic VC} takes the value one for domestic VC
and zero otherwise. Subsample only includes seed and early-stage projects from Thomson ONE. Robust standard errors clustered by country are given in parentheses. Asterisks indicate the statistical significance of the coefficient: *** p-value <0.01, ** p-value <0.05, * p-value <0.1.
11 Gompers, Kovner and Lerner (2009) note that the experience and focus of a firm’s board members are what matters most for returns. Although that measure is not available, it might be reasonable to assume that in less developed economies VC firms are small, so the age of the firm might be a proxy for individual board members’ skills. See Gompers and Lerner (2004) for additional information.

63CEPAL Review N° 128 • August 2019
Ernesto H. Stein and Rodrigo A. Wagner
5. Venture capital investments in Latin America and the Caribbean are highly procyclical
In most countries around the world, investment tends to be procyclical with respect to the business cycle. This subsection explores the differential characteristics of venture capital investments.
Table 4 reports estimates of the procyclicality of VC investments at the country level, over the period 2000–2011. The estimations are made using an unbalanced panel data regression, with country fixed effects, where the percentage change in VC investments is explained by GDP growth and a linear trend. The coefficient on GDP growth, referred to as the cyclicality coefficient, is used in fiscal literature to determine whether these types of investment are procyclical with respect to overall economic activity (a positive coefficient) or countercyclical (a negative coefficient). Column (1) shows that for Latin American countries, post-2000 VC investments seem highly procyclical, with a coefficient of 19. This means that, on average, when the economy as a whole grows 1% faster than average, the VC dollars invested in the country grow by 19% more than average.
Table 4 Procyclicality regressions: changes in investment relative to changes in per capita GDP
VariablesLatin America and the Caribbeana All other regions of the worldb
∆% VC $ ∆% VC N ∆% GFCF ∆% VC $ ∆% VC N ∆% GFCF(1) (2) (3) (4) (5) (6)
Cyclicality (∆ % GDP)
19.02** 9.636* 6.131*** 3.213 3.408** 4.35***
(6.15) (4.52) (0.51) (3.56) (1.35) (0.35)
Trend (year)
0.00889 -0.0214 0.00162 0.0323* -0.0133* 0.007***
(0.04) (0.02) (0.01) (0.02) (0.01) (0.00)
No. of observations 37 37 37 530 530 514
R-squared 0.321 0.205 0.805 0.008 0.027 0.497
No. of Country FE 9 9 9 83 83 80
Source: Prepared by the authors, on the basis of World Bank, World Development Indicators [online database] https://datacatalog.worldbank.org/dataset/world-development-indicators.
Note: Robust standard errors clustered by country are given in parentheses. Asterisks indicate the statistical significance of the coefficient: *** p-value <0.01, ** p-value <0.05, * p-value <0.1.
a Argentina, Bahamas, Brazil, Chile, Colombia, Mexico, Panama, Trinidad and Tobago, and Uruguay. b Excluding the United States and Canada.
All panel regressions are in the form:
Δ% y = β Δ% GDP + γ Time Trend + Country FE
Columns (1) and (4) use the percentage change in the total amount of VC investment (Δ% VC $) on the left-hand side. Columns (2) and (5) use the change in the number of projects (Δ% VC N). Columns (3) and (6) are benchmarks using changes in gross fixed capital formation (GFCF) from the national accounts as measure of macroeconomic investment. For comparability, the exercise is performed for the same years and countries for which data are available on VC investments, including the value and number of projects. Columns (4) to (6) perform the same regressions as in (1) to (3) but for all countries of the world that are included in the Thomson ONE data, with the exception of the United States and Canada, which were excluded in order to obtain a global comparison that was not skewed by data from these highly innovative countries where VC is more developed.
It is well known in the macroeconomics literature that investment is procyclical, but the estimates reported in column (1) of table 4 indicate that VC is significantly more procyclical than macroeconomic investment in general. As a benchmark, column (3) computes the procyclicality of gross fixed capital formation. This macroeconomic investment displays a procyclicality coefficient of 6.1 in the same sample of Latin American countries and years used in figure 6.

64 CEPAL Review N° 128 • August 2019
The development of venture capital in Latin America and the Caribbean: a comparative perspective
This means that VC is three times more procyclical than macroeconomic investment. Nonetheless, models (1) and (3) are not nested, so it is impossible to test directly for the difference in procyclicality, but it is safe to say that Latin American VC seems more procyclical than investment in general.
The worldwide VC cyclicality coefficient is just 3.2; well below the 19 recorded for Latin America. Importantly, the difference between Latin America and the worldwide sample seems much higher for VC investment ((1) minus (4) gives a difference of 15 units but with a large standard error) than for macroeconomic capital formation ((3) minus (6) indicates a gap of just 1 to 2 units).
Columns (2) and (5) explore the cyclical sensitivity of the extensive margin, that is the number of VC projects recorded in the database. The point estimate for Latin America is 9.6, almost three times the equivalent for the worldwide sample (column (4)); in other words, the sample of VC investments in the Latin American region depicts a remarkably cyclical pattern, with a portion coming from the number of projects and another stemming from average project size.
Another regression (not shown) analogous to (2) but using the number of projects reporting transaction values produces a very similar procyclicality coefficient. This suggests that partial recording of investment size might not be the main cause of the high level of procyclicality in Latin America.
Excluding the year 2000 from the sample does not qualitatively change the results for Latin America except that it increases the standard error for the coefficient of GDP growth in the Δ% VC N specification, since it has a p-value slightly above 10%.
With regard to the rest of the world, specifications (4) and (5) become less procyclical and insignificant when 2000 is excluded for the worldwide regressions. But since that is the benchmark group for this study, the qualitative claim that Latin America seems more procyclical becomes even stronger.
To summarize, the Latin American pattern of VC investment is highly correlated with the domestic business cycle. In a context of volatile economic growth, this procyclicality is a further complication for firms wishing to specialize in venture capital, since in harder times investment of this type retreats much more quickly from a Latin American country than from an average country in the rest of the world.
V. Venture capital: chasing ideas or following financial development?
This final empirical section explores the determinants of variations in VC development among countries, dividing the explanatory factors into two groups. One category consists of demand for VC arising from scientific and technological ideas, proxied by patents and scientific articles. The other contains a standard indicator of financial development used in the literature (for example Rajan and Zingales, 1997), measured as stock market capitalization relative to GDP. The latter measures the availability of funds, not for VC, but for a larger portion of the financial system. The idea is to test whether factors driving demand for VC (ideas), or the supply of finance, have empirical traction in explaining different VC patterns of development among countries. In the regression, we also control for country size (GDP), splitting this into per capita income and population.
Table 5 shows the estimates for factors that could explain the VC-to-GDP ratio. These are: ln(patents/pop), which represents the number of patent applications by residents per capita; ln(articles/pop), which denotes the number of scientific articles by residents per capita; ln(GDP), which is the country’s GDP in PPP terms. This is then split into a per capita income term and a population term, namely ln(GDP/pop) and ln(population). The variable ln(market cap) corresponds to the usual sum of stock market capitalization of listed companies in the country, as a proportion of GDP.

65CEPAL Review N° 128 • August 2019
Ernesto H. Stein and Rodrigo A. Wagner
Table 5 Venture capital development
Variables, around 2011
Left-hand side variable: ln(VC/GDP) in the country, 2010–2011
(1) (2) (3) (4) (5) (6) (7) Mean (standard deviation)
ln(patents/pop) 0.44** 0.41*** 0.36*** 0.43** 0.40*** -9.89
(0.19) (0.12) (0.12) (0.16) (0.12) (1.89)
ln(sci articles/pop) 0.84*** -8.90
(0.24) (1.72)
ln(market cap/GDP) 0.11 0.10 -0.19 -0.55 0.19 -0.53 3.57
(0.23) (0.22) (0.58) (0.52) (0.22) (0.51) (1.09)
ln(market cap/GDP)2 0.07 0.06 0.07
(0.09) (0.08) (0.08)
ln(GDP) -0.07 -8.44** 26.52
(0.16) (3.85) (1.54)
ln(GDP)2 0.16**
(0.07)
ln(GDP/pop) -0.17 -16.5*** -14.8*** 9.65
(0.44) (3.82) (3.68) (0.91)
ln(GDP/pop)2 0.89*** 0.77***
(0.21) (0.20)
ln(population) -0.07 -3.62* -5.02*** 16.87
(0.16) (1.85) (1.79) (1.62)
ln(population)2 0.11** 0.15***
(0.05) (0.05)
Constant 2.37 0.95 111.4** 106.6*** -0.51 -5.1*** 116.08***
(7.16) (4.53) (50.83) (21.76) (1.16) (0.82) (21.36)
log (VC/GDP) -4.47
(1.84)
No. of countries 61 61 61 61 61 61 60 61
R-squared 0.17 0.17 0.25 0.45 0.17 0.01 0.50
Source: Prepared by the authors, on the basis of data from Thomson ONE and World Bank, World Development Indicators [online database] https://datacatalog.worldbank.org/dataset/world-development-indicators.
Note: Robust standard errors clustered by country are given in parentheses. Asterisks indicate the statistical significance of the coefficient: *** p-value <0.01, ** p-value <0.05, * p-value <0.1.
In all specifications (1) to (7) technical and scientific ideas are a robust predictor of VC development. Depending on the specification, a 1 percentage point increase in patents per capita is associated with a 0.4-point increase in the VC-to-GDP ratio. Specification (7) shows that a 1-point increase in scientific articles per capita is associated with a 0.8 of a percentage point increase in the VC-to-GDP ratio. Only one of these measures can be used at a time, however, because they are highly correlated (0.84).
In contrast, all specifications show that the standard financial development variable does not explain VC development differences among countries. Specifications (1) to (4) and (6) to (7) all report statistically non-significant coefficients for the standard financial development coefficient. This continues even with nonlinear specifications for market capitalization (columns 3, 4 and 7) or when used as a single explanatory variable (column 6).
The results suggest that the demand for VC stemming from technical ideas is a relevant indicator and better at explaining VC intensity around the world. Venture capital grows when there are ideas, not when there is simply a high stock valuation.
Table 5 also includes controls for other obvious effects, such as market size. Column (2) controls for the log of total GDP, while column (1) splits this covariate into two separate components: per capita income and population. Neither of these specifications finds statistical significance for these market-size effects. The reason seems to be that the response of market-size variables is nonlinear. In fact, column (3)

66 CEPAL Review N° 128 • August 2019
The development of venture capital in Latin America and the Caribbean: a comparative perspective
shows that log of total GDP has a positive and statistically significant quadratic term. In practice, given the averages in the right-hand column of table 5, this means the effect of size has the shape of a J-curve in VC development. This is also confirmed when non-parametric methods are used (not shown in the table). Columns (4) and (7) include quadratic components for the subcomponents of total GDP, namely per capita income and population, in log form. These regressions also suggest a J-shaped curve, which means that VC investments tend to be disproportionally larger in very large economies.12
The regression analysis performed in this study seems to indicate the relevance of both market size and technology ideas in driving the demand for VC. Using the coefficient estimated in column (5), and multiplying it by the difference in patenting rates between China and the average for Latin America and the Caribbean, we can account for a third of the gap in VC-to-GDP ratio with China, evident in figure 4.A.13 In that regard, Ketelhöhn and Ogliastri (2013) argue that Latin America has low levels of patenting and innovation; the present study finds that this deficit of technology and scientific ideas could pose a bottleneck for further VC development in the region.
Nonetheless, as noted above, patenting rates are far from the only factor. Table 5 clearly shows that market size matters. Using the model in column (3) indicates that at least a third of the VC gap between China and the average for Latin America and the Caribbean can be more readily explained by size-related variables, rather than patenting rates.14 Market size is important not because the factors impeding VC development would be resolved as Latin America becomes wealthier, nor because the region needs faster population growth. Instead, the issue is that Latin American integration remains a major challenge for entrepreneurs. Despite the near-zero tariff barriers on trade across Latin America, it seems that the region has not achieved enough market integration to offer sufficiently large opportunities for innovative businesses demanding VC. In an ideal world, entrepreneurs in any Latin American market could think of ideas that could be replicated throughout the region as part of the same firm, as happens in China or even the United States.
VI. Concluding remarks
This article examined the main trends in VC investments in Latin America, compared to other regions of the world. It finds that VC investments in Latin America and the Caribbean are growing very rapidly, outpacing nearly every other region in the world, although starting from a very low base.
The paper has highlighted various stylized facts about VC in the region, which are consistent with a VC ecosystem in its initial stages. First, the share of high-technology investments in the region is smaller than in other non-industrialized countries. Second, VC investments in Latin America are on average larger than in other regions of a similar income level but tend to take the form of non-high-technology investments. Third, foreign venture capitalists invest higher amounts in Latin America per round than domestic VC firms.15 This is consistent with a selection model, where foreign firms participate only if the deals are, on average, large enough to absorb the international transaction costs, or when foreign VC
12 Regressions that restrict the sample to countries with per capita incomes equal to, or above, those of India or Viet Nam do not produce qualitatively different results.
13 Column (5) uses log(patents/population) as the only covariate and computes the residuals after fitting the model. The leftover portion after accounting for the patenting gap between China and the average for Latin America and the Caribbean is 37%. The residual difference between the average patenting rate in Latin America and the Caribbean and that of China is 63% of the original difference, meaning that 37% of the proportional gap can be explained by this channel.
14 Column (3) uses a specification including nonlinear economy size. This model explains 73% of the proportional gap between Latin America and the Caribbean and China. In short, roughly one third of the gap is explained by size, another third by patenting and a third remains unexplained. Including market capitalization in column (3) is innocuous, since the coefficients are small and insignificant, which means they have a negligible impact on this accounting exercise. Doing a similar exercise with a model like the one shown in column (3), but excluding market size, yields similar results (not shown here for brevity).
15 There is still a role for the local investor in attracting foreign venture capital (see for example Mäkelä and Maula, 2008).

67CEPAL Review N° 128 • August 2019
Ernesto H. Stein and Rodrigo A. Wagner
firms are more productive (see Helpman, Melitz and Yeaple, 2004). Fourth, VC firms in Latin America are younger and less experienced than in other regions. This is important, because experience is a key factor in explaining VC firms’ performance and fundraising ability (Gompers and Lerner, 2004). Fifth, VC investments in the region are highly procyclical, more so than the VC procyclicality in other regions, and also more procyclical than macroeconomic investment in Latin America and the Caribbean.
Lastly, the paper has explored the variation in VC development among countries, attempting to disentangle why countries with much lower levels of development, such as China, have a much more highly developed VC market, given that stock markets do not follow this development trend. A regression of the VC-to-GDP ratio shows that the production of patentable ideas is a strong predictor of VC investment, while a standard measure of financial development (stock market capitalization) fails to explain the variation among countries. More importantly, VC investments as a share of GDP are shown to be disproportionately bigger in larger markets. This calls for greater de facto integration of entrepreneurial business models in Latin America, to enable venture capitalists to detect regional potential for expansion. Overall, the findings of this study suggest that Latin America is in an early stage of VC development.
Bibliography
Bruton, G., D. Ahlstrom and T. Puky (2009), “Institutional differences and the development of entrepreneurial ventures: a comparison of the venture capital industries in Latin America and Asia”, Journal of International Business Studies, vol. 40, No. 5, New York, Springer.
Cumming, D. and Y. Zhang (2016), “Alternative investments in emerging markets: a review and new trends”, Emerging Markets Review, vol. 26, Amsterdam, Elsevier.
Gompers, P. and J. Lerner (2004), The Venture Capital Cycle, Cambridge, MIT Press.Gompers, P., A. Kovner and J. Lerner (2009), “Specialization and success: evidence from venture capital”,
Journal of Economics & Management Strategy, vol. 18, No. 3, Hoboken, Wiley.Helpman, E., M. Melitz and S. Yeaple (2004), “Export versus FDI with heterogeneous firms”, The American
Economic Review, vol. 94, No. 1, Nashville, American Economic Association.Hsieh, C. and P. Klenow (2014), “The life cycle of plants in India and Mexico”, Quarterly Journal of Economics,
vol. 129, No. 3, Oxford, Oxford University Press.Jiménez, L. (2008), “Venture capital and innovation in Latin America”, CEPAL Review, No. 96 (LC/G.2396-P),
Santiago, Economic Commission for Latin America and the Caribbean (ECLAC).Ketelhöhn, N. and E. Ogliastri (2013), “Introduction: innovation in Latin America”, Academia. Revista
Latinoamericana de Administración, vol. 26, No. 1, Bingley, Emerald.Khoury, T., M. Junkunc and S. Mingo (2012), “Navigating political hazard risks and legal system quality: venture
capital investments in Latin America”, Journal of Management, vol. 41, No. 3, Thousand Oaks, SAGE.LAVCA (Latin America Private Equity and Venture Capital Association) (2012), “First database of private equity
investments in Latin America”. Lerner, J. (2012), “Presentation of Venture Capital Trends”, paper presented at the Venture Capital in
Latin American Policy Meeting, Inter-American Development Bank (IDB)/Multilateral Investment Fund, May 17th.
Liao, W., C. Lu and H. Wang (2014), “Venture capital, corporate governance, and financial stability of IPO firms”, Emerging Markets Review, vol. 18, Amsterdam, Elsevier.
Mäkelä, M. and M. Maula (2008), “Attracting cross-border venture capital: the role of a local investor”, Entrepreneurship & Regional Development, vol. 20, No. 3, Abingdon, Taylor & Francis.
Otchere, I. and A. Vong (2016), “Venture capitalist participation and the performance of Chinese IPOs”, Emerging Markets Review, vol. 29, Amsterdam, Elsevier.
Pereiro, L. (2001), “Tango and cash: entrepreneurial finance and venture capital in Argentina”, Venture Capital, vol. 3, No. 4, Abingdon, Taylor & Francis.
Rajan, R. (2012), “The corporation in finance”, NBER Working Paper, No. 17760, Cambridge, Massachusetts, National Bureau of Economic Research (NBER).
Rajan, R. and L. Zingales (1998), “Financial dependence and growth”, The American Economic Review, vol. 88, No. 3, Nashville, American Economic Association.

68 CEPAL Review N° 128 • August 2019
The development of venture capital in Latin America and the Caribbean: a comparative perspective
Annex A1
Additional description of the sample
1. Thomson ONE VC data
The private equity module of the Thomson ONE database includes different types of private equity investments, namely venture capital, buyouts and acquisitions, real estate and other. This paper focuses on VC investments only, which comprise seed, early stage, expansion and later stage investments. This study covers all of them, except where explicitly mentioned in each table. Each stage of investment is defined according to the criteria used by Thomson ONE. These criteria include, among other things, the investing fund, the company being invested in and the timing. The structure of the deal also helps to distinguish VC investments from non-venture capital ones. Given the nature of private equity, part of this classification is based on the self-reported activity of VC firms.
The venture capital subcomponent of the Thomson ONE private equity module is the successor of an earlier database, known as VentureXpert, which was used in previous analysis in the literature (see Gompers and Lerner, 2004). In short, these are standard data used in the academic literature on VC investments.
The specific sample used in this study spans 2000 to October 2012. Yearly analyses were used only up to 2011, which was the last complete year for which data are available; and most of the analysis in the various tables and figures uses post-2005 data.16 The investments in the sample cover nearly all industry categories, according to the Standard Industrial Classification (SIC). When investments are broken down by industry sector, just over 80% of transactions were in the following sectors: SIC 73 (business services), which accounted for 41% of all deals; SIC 28 (chemicals and allied products, including pharmaceuticals), with 11%; SIC 36 (electronic and other electrical equipment, except computers), with 10.9%; SIC 38 (instruments and related products), with 8.4%; SIC 87 (engineering and management services) with 5.2%; and SIC 48 (communications) with 4.1%. The other sectors account for less than 3% of investments.17 Thomson ONE also uses another industry classification for VC investments that can be used to distinguish between high-technology and non-high technology industries.18
Table A1.1 displays the main descriptive statistics of Thomson ONE. The median firm in the sample received US$ 3.5 million in a round, but in the first round the median firm received US$ 2.6 million. The median firm received two rounds of financing. At the country level, the unweighted average VC investment is equivalent to 0.04% of GDP, while total investment in an average country is around 23% of GDP.
16 The following countries are included in the sample: Argentina, Australia, Austria, Belgium, Brazil, Bulgaria, Canada, Chile, China, Colombia, Croatia, Cyprus, Czechia, Denmark, Egypt, Estonia, Finland, France, Georgia, Germany, Greece, Hong Kong Special Administrative Region, Hungary, India, Indonesia, Ireland, Israel, Italy, Japan, Jordan, Kenya, Latvia, Lithuania, Luxembourg, Malaysia, Mexico, Mongolia, Netherlands, New Zealand, Norway, Pakistan, Peru, Poland, Portugal, Republic of Korea, Russian Federation, Saudi Arabia, Singapore, South Africa, Spain, Sweden, Switzerland, Thailand, Tunisia, Turkey, Uganda, Ukraine, United Kingdom, United States, Uruguay and Viet Nam.
17 The SIC system classifies industries using a four-digit code. The first two digits represent the industry sector, and when the data are disaggregated by these first two digits, it reveals that VC investments were made in nearly all the 99 industry sectors classified in the SIC system. There are observations in the data for the 2000–2012 period in the following two-digit SIC codes: 10, 12, 13, 14, 15, 16, 17, 20, 21, 22, 23, 24, 25, 26, 27, 28, 29, 30, 31, 32, 33, 34, 35, 36, 37, 38, 39, 40, 41, 42, 43, 44, 45, 46, 47, 48, 49, 50, 51, 52, 53, 54, 55, 56, 57, 58, 59, 60, 61, 62, 63, 64, 65, 67, 70, 72, 73, 75, 76, 78, 79, 80, 81, 82, 83, 84, 86, 87, 88, 89, 91, 92, 93, 94, 95, 96 and 97. Syndicated investments appear as often as partners in these descriptive statistics. This issue is appropriately resolved in the main tables of the paper.
18 The sector composition of the Thomson Reuters Venture Capital Index is: healthcare related; communications; biotechnology; semiconductor and electronics; computer software-; non-high-technology. All but the last of these are high-technology sectors.

69CEPAL Review N° 128 • August 2019
Ernesto H. Stein and Rodrigo A. Wagner
Table A1.1 Additional descriptive statistics, 2000–October 2012
Variable Mean Tenth percentile
Twenty-fifth percentile
Fiftieth percentile
Seventy-fifth percentile Na
Microdata
Equity invested (millions of dollars) 10.4 0.3 1.0 3.5 10.0 61 833
Investment round 2.6 1 1 2 3 87 756
Equity invested in first round (millions of dollars) 9.3 0.3 0.9 2.6 7.3 27 918
Country-level aggregates
VC investments (percentages of GDP) 0.04% 0.00% 0.00% 0.02% 0.05% 61
Gross fixed capital formation (percentages of GDP) 23.17% 16.11% 19.42% 21.76% 25.00% 59
High-technology investments 64.91% 0.00% 50.00% 70.09% 88.89% 57
Syndicated investments 50.47% 0.00% 0.00% 47.33% 95.73% 56
Domestic VC investor 49.82% 0.00% 4.17% 50.00% 84.06% 56
Source: Prepared by the authors, on the basis of data from Thomson ONE.a For the microdata, N is the number of investments made by VC firms (excluding the United States); whereas, for the country-
level aggregates, N is the number of countries in the group that are included in the estimation sample shown in table 5. The inclusion of figures for the United States in the microdata does not change these broad averages significantly.
Table A1.2 shows the whole VC matrix by industry and country for the sample in Latin America and the Caribbean. Of the 773 projects, around half are non-high-technology projects. In terms of country distribution, 60% of VC investments in the region occur in Brazil.
Table A1.2 Latin American and the Caribbean (27 countries): VC investments by industry
and country, 2000–October 2012
Country Healthcare related Communications Biotechnology Semiconductor
and electronicsComputer software
Non-high-technology Total
Antigua and Barbuda 0 1 0 0 1 1 3
Argentina 1 7 1 0 36 11 56
Bahamas 0 0 0 0 1 8 9
Belize 0 0 0 0 0 1 1
Bermuda 0 12 0 2 1 10 25
Bolivia (Plur. State of) 0 0 0 0 0 6 6
Brazil 22 70 23 12 172 198 497
Chile 5 2 1 0 10 8 26
Colombia 1 1 0 0 1 5 8
Costa Rica 0 1 0 0 2 11 14
Cuba 0 0 0 0 0 2 2
Cayman Islands 2 1 0 4 3 8 18
Dominica 0 0 0 0 1 0 1
Dominican Republic 0 0 1 0 0 1 2
Ecuador 0 0 0 0 0 9 9
Guatemala 0 0 0 0 1 3 4
French Guiana 0 0 0 0 1 2 3
Honduras 0 0 0 0 0 3 3
Mexico 5 3 0 0 14 32 54
Nicaragua 0 1 0 0 0 3 4
Panama 0 0 0 0 0 3 3
Peru 0 0 0 0 0 11 11
Paraguay 0 0 0 0 0 2 2
El Salvador 0 1 0 0 0 2 3
Trinidad and Tobago 0 0 0 0 0 2 2
Uruguay 0 1 0 0 4 0 5
Venezuela (Bol. Rep. of) 0 1 1 0 0 0 2
Total 36 102 27 18 248 342 773
Source: Prepared by the authors, on the basis of data from Thomson ONE.

70 CEPAL Review N° 128 • August 2019
The development of venture capital in Latin America and the Caribbean: a comparative perspective
2. The Latin American Venture Capital Association (LAVCA) database
The version of the LAVCA database used in this study covers Latin America and Caribbean and spans the period from 2006 to October 2012. The countries in the dataset are: Argentina, Brazil, Chile, Colombia, Costa Rica, the Dominican Republic, El Salvador, Mexico, Panama, Peru, Trinidad and Tobago, and Uruguay. The data are collected by LAVCA from reports by funds, by national private equity and venture capital associations and by funds that report their financial data to institutions such as MIF or IFC. As in the case of Thomson ONE, both the reporting institutions and LAVCA use their own criteria for classifying an investment as VC. Nonetheless, they all base their classification on the nature of the firm, its age and the fact that it is not taken over by another company. For the years after the period covered by this study, the LAVCA database has been used to monitor private equity and VC investments in the region. This paper used it to double check certain magnitudes such as those given in figure 1 and table 1.

The heterogeneity of effects of preschool education on cognitive outcomes in Latin America
Juan Antonio Dip and Luis Fernando Gamboa
Abstract
This study applies a propensity score matching model to quantify the significance of preschool education in short- and medium-term academic results in several Latin American countries, using data from the Third Regional Comparative and Explanatory Study (TERCE) conducted among third and sixth grade pupils. The results vary by country and grade, with standard deviations ranging between 0.05 and 0.3. Third-grade reading and mathematics scores show an effect greater than 0.10 standard deviations in at least 10 countries, while 7 countries show the same effect for the three tests conducted in sixth grade.
Keywords
Preschool education, children, child development, academic achievement, educational indicators, Latin America
JEL classification
C14, H4, I21
Authors
Juan Antonio Dip holds a doctorate in economics and is a faculty member in the Department of Economics and Finance, Faculty of Economics, Universidad Nacional de Misiones, Argentina. Email: [email protected].
Luis Fernando Gamboa holds a doctorate in economics and is a faculty member in the Department of Economics, Universidad Jorge Tadeo Lozano, Colombia. Email: [email protected].

72 CEPAL Review N° 128 • August 2019
The heterogeneity of effects of preschool education on cognitive outcomes in Latin America
I. Introduction
The importance of assessing the success of educational policies is undisputed, and intervention in early childhood offers greater room for manoeuvre and the effectiveness of resources is economically significant (Heckman, Pinto and Savelyev, 2013). This paper aims to identify the effect of preschool education on the scores of third- and sixth-grade pupils in the mathematics, reading and writing and natural science tests of the Third Regional Comparative and Explanatory Study (TERCE) conducted in 2013 —the third of a series of regional assessments, following the First Regional Comparative and Explanatory Study (PERCE) and the Second Regional Comparative and Explanatory Study (SERCE).1 The studies are comparable, as are the data from the different countries, because of the statistical methodology and the two-stage stratified cluster sample selection method.
The issue is critical, reflecting the institutional interest in improving the living conditions of Latin Americans given the region’s low averages in human capital levels as well as the need to improve equality in these countries. Recently, the differences in cognitive achievement between Latin American countries and their counterparts in the developed world have been made apparent in the results of the Programme for International pupil Assessment (PISA) and the Trends in International Mathematics and Science Study (TIMSS) tests. Investment in preschool education programmes has both direct and indirect positive effects. First, it builds capacity in children at a lower cost compared with older populations; second, it reduces barriers to the participation of mothers in the workforce (Cascio, 2015; Shah and others, 2017; Heckman, Pinto and Savelyev, 2013; Loeb and others, 2007; Behrman, Cheng and Todd, 2004; Skibbe and others, 2011; Shonkoff and Phillips, 2000).
These effects are sustained over the long run; others decline over time, but remain apparent several years later (Nores and Barnett, 2010; Berlinski, Galiani and Manacorda, 2008; Magnuson, Ruhm and Waldfogel, 2007a and 2007b). The literature supports the view that such programmes have positive, albeit modest, effects on children that may persist over time and is therefore a key area for intervention and global monitoring (UNESCO, 2014).
According to the United Nations Educational, Scientific and Cultural Organization (UNESCO) (2013), the average net enrolment ratio in pre-primary education jumped from 55.5% to 66% between 1990 and 2010. However, pre-primary coverage varies greatly in these countries (between 40% and 90%). For example, enrolment ratios in Mexico and Uruguay were twice those of the Plurinational State of Bolivia and Paraguay in 2010. In 2014, net pre-primary coverage increased, exceeding 85% in Peru and Uruguay; in contrast, the countries of Central America (Costa Rica, Guatemala, Honduras and Panama) did not register significant progress, with net enrolment rates below 53%.
However, the fact that preschool attendance is an educational service gives rise to several challenges. First, there is no standard of quality against which the package of actions and the components used to deliver it can be fully compared. Second, the number of years of attendance depends on both supply and demand.
In Latin America, there is little evidence on the causal effects of preschool that can be supported by internationally comparable tests. Recent literature provides a detailed description of the problems of access to and coverage of early education in Latin America. Examples include the studies conducted by the Regional Program for Social Policy in Latin America (SOPLA) (2014) and by Gamboa and Krüger (2016), which present an overview of the country-level differences in coverage indicators that illustrate the adverse access conditions facing the most vulnerable populations. Gamboa and Krüger use a non-parametric method to decompose the results of the 2012 PISA cycle to show the effect of early education on reading and mathematics in Argentina, Brazil, Chile, Colombia, Mexico, Peru and
1 TERCE and SERCE are comparable. For details on the historical evolution of this study, see [online] http://www.unesco.org.

73CEPAL Review N° 128 • August 2019
Juan Antonio Dip and Luis Fernando Gamboa
Uruguay. Their analysis reveals the existence of socioeconomic segregation in terms of access and score gaps that widen the longer the period of preschool attendance.
The common finding in these studies is that in Latin American countries there are significant cognitive gaps between children in wealthier and poorer households when they enter school and these gaps persist over time (Schady and others, 2015). Araujo, Dormal and Schady (2017) present an interesting discussion of the findings on the effects of the quality of child care, with an extensive review of the literature.
In Chile, the Ministry of Education (MINEDUC, 2014) provides studies on the short-, medium- and long-term effects of attending preschool. Overall, the studies show that the effects of attending preschool are positive and significant, although there is no conclusive evidence supporting the universality of the impact of preschool attendance on the comprehensive development of children (p. 22).
Other studies, including Bernal and others (2012) and Bernal and Camacho (2012), go further and prove the causal effect of early education programmes on children’s education outcomes. Bernal and others (2015) show that a transition in the education model in Colombia from small community nurseries to large child-care centres catering to 150 children or more did not improve quality. Other more detailed studies estimate a positive impact of early education programmes of about 0.20 standard deviation in cognitive skills scores (see Berlinski and Schady, 2015). The contributions of the present paper are multifarious. First, as mentioned above, it emphasizes the need to address performance differentials in assessments such as PISA tests that are conducted at later stages of the educational cycle. Second, it provides evidence on the cognitive effects of increasing access to preschool after controlling for other variables associated with pupils, their families, schools and education systems. Third, it underscores the need for cooperation to learn from different coverage initiatives in neighbouring countries. These aspects aside, some caution in the interpretation of results is warranted as variables that are not always observable may influence the findings.
The empirical strategy uses a propensity score matching model that reduces the bias generated by unobservable variables.
The results are heterogeneous but positive in the countries participating in TERCE. In Central American countries, there appears to be evidence of a greater effect on test scores than in other countries, but there is no pattern of an increase or decrease in effect between countries and between third and sixth grade.
The article is divided into five sections including this introduction. Section II presents the empirical strategy for comparing performance according to the levels of exposure to a preschool programme. Section III describes the data used to assess the effect and section IV presents the results. The article concludes with some recommendations for consideration.
II. Empirical strategy
In cognitive tests (mathematics, reading and natural sciences) of the individual i in school s in municipality m in country j, standardized scores (Yismj ) are determined by factors associated with the individual and his or her family (X), education establishment variables (Z) and country- or region-specific variables (W).
Yismj = a + Preij + β1X + β2Z + β3W + εi (1)
The variables considered within vector X include age, gender, household wealth and parents’ educational level. Controls for the school (Z) include whether the school is urban or rural and State-run or private, and an establishment quality indicator calculated from the classroom climate is also introduced. However, there is no control for parent motivation or pupil ability.

74 CEPAL Review N° 128 • August 2019
The heterogeneity of effects of preschool education on cognitive outcomes in Latin America
If it is assumed that these are randomly distributed, where E(X/ε) = 0, then it is possible to estimate the preschool effect using an ordinary least squares model.
However, greater parent motivation can increase and improve educational practices in the home, which would mean that the effect of preschool is overestimated. If the correlation between ability and performance is positive and the correlation between ability and parents’ motivation with respect to education is also positive, the estimator ^(Preij) will be greater than the true value. In addition, ordinary least squares regression may miss the heterogeneous impact of treatment (Black, 2015), which, in this case, is given by preschool attendance. To control for these limitations, a quasi-experimental method —propensity score matching— is used to evaluate the causal effect.
Proposed by Rosenbaum and Rubin (1983), this matching method can be used to correct selection bias on the question of whether children from better socioeconomic backgrounds tend to start their education at earlier ages and have a greater likelihood of attending preschool. Preschool attendance is determined by parents’ decisions and is therefore not random. Consequently, children’s measurable and non-measurable characteristics are associated with the likelihood of attending preschool (treatment) and with performance (standardized tests). Propensity score matching assumes that there is a vector of X observable covariates, such that, after controlling for those covariates, the potential outcomes are independent of the treatment assignment (conditional independence) and that, for each value of X, there is a positive probability of being treated and not treated (common support).
The strategy adopted estimates the causal effect of attending preschool on academic achievement —measured through various standardized TERCE tests— as well as the average treatment effect on the treated (ATT). According to Heckman and Robb (1986), the estimation of the average effect on the treated is valuable for answering research questions related to social policy development, and particularly so with regard to educational policies that aim to expand compulsory preschool education.
To this end, treatment, outcome and the relevant covariates must be identified (for further details see Caliendo and Kopeinig, 2008 and Stuart, 2010). For this study, the treatment variable was PREKFOR6, which takes the value 1 if the pupil attended preschool between 4 and 6 years of age and 0 if he/she did not. The outcome variable is the z-score (with a mean of 0 and a standard deviation of 1) obtained by third-grade pupils from the participating countries in reading and mathematics and by sixth-grade pupils in reading, mathematics and natural sciences.2
Covariates may be selected for matching based on the association between the covariates and treatment and outcome (Stuart, 2010), however Brookhart and others (2006) suggest that variables that are unrelated to an exposure effect but related to the outcome should always be included in a propensity score model as this will increase the precision of the estimated exposure effect without increasing bias. Taking into account the above and the existing literature on preschool education, the covariates included are those considered in the ordinary least squares model and parent expectations were included in the analysis.
The matching technique was then chosen based on the standardized mean difference of covariates. Kernel matching was selected to calculate the average treatment effect on the treated because the variance was lower than that derived using the other methods tested. For all models (each test subject and for each participating country), two indicators proposed by Rubin (2001) were used to determine the balance achieved with the propensity score: Rubin’s B, defined as the standardized mean difference of the linear index of the propensity score of the treated and the untreated group in the matched sample; and Rubin’s R, which is the ratio of the propensity score’s variance in the treated
2 Although the tests use a scaled score with a mean of 700, the outcome variable has been rescaled to allow interpretation of the results in terms of standard deviations.

75CEPAL Review N° 128 • August 2019
Juan Antonio Dip and Luis Fernando Gamboa
and untreated sample. Rubin (2001) suggests that a B value of less than 0.25 indicates that the covariates are balanced. The variance ratio R should remain close to 1 but values between 0.5 and 2 are considered acceptable (see table 5).
All calculations yielded values for B of less than 0.25 and values for R that were close to 1. In this methodology, the interpretation of the average treatment effect on the treated depends on the standard errors that are calculated. While the focus in literature has been on adjusting standard errors through bootstrapping, Abadie and Imbens (2005) demonstrate that bootstrap standard errors are not valid as the basis for inference with simple nearest-neighbour matching estimators. However, the reservations expressed about bootstrapping standard errors in matching do not apply to the kernel method, because it does not run into the discontinuities that arise in nearest-neighbour matching (Wagstaff, 2007).
To generalize the results of estimates obtained from data samples, sample weights must be used in propensity score matching; failure to do so would limit the external validity of the results given that the population inferences are based on a non-representative sample. Therefore, sample weights and sample design are integral to the process of estimating propensity scores and using the propensity score to determine the treatment effect. Two types of treatment effects are thus distinguished: the sample average treatment effect on the treated, where survey weights are incorporated only in the calculation of the propensity score; and the population average treatment effect on the treated, where survey weights and the propensity score weights are multiplied to form a new composite weight that is used in a weighted regression (DuGoff, Schuler and Stuart, 2014).
III. Data
Coordinated by UNESCO, TERCE was conducted in 2013 among more than 100,000 school children in 15 Latin American countries (Argentina, Brazil, Chile, Colombia, Costa Rica, Dominican Republic, Ecuador, Guatemala, Honduras, Mexico, Nicaragua, Panama, Paraguay, Peru and Uruguay). It assesses school performance in mathematics and language (reading and writing) in third grade, with the inclusion of natural sciences in sixth grade. To enable comparisons at country level and over time with the 2006 SERCE, a two-stage stratified cluster sample selection method was used for TERCE. In the first stage, a probability proportional to size method was used to select schools (in each explicit stratum). In the second stage, a class was selected randomly and all pupils in the class were included in the sample. This sampling technique is useful for making inferences regarding the education system because it recognizes that there are different levels of inter- and intra- school variability3 (further information on sample representativeness is available in UNESCO, 2016). Annex A1 shows that the sample sizes are considerable for each of the participating countries once the sample weights provided by TERCE are taken into account —for the third-grade language test, there were more than 2600 pupils in the country with the smallest absolute sample size. As part of the construction of the cognitive tests, the curricular frameworks of the participating countries were reviewed to determine performance levels by subject area. Consequently, TERCE can help to enrich the literature on educational assessment in the region because it is based on common content and uses a sample design similar to that of other assessments such as PISA or the Progress in International Reading Literacy Study (PIRLS). The variable for identifying children who attended preschool between the ages of 4 and 6 was created by TERCE.
Before analysing the overall results obtained by the participating countries, it is useful to review the aggregate indicators pertaining to the current state of the education sector (see table 1). Despite the progress made in Latin America in reducing poverty, there are still countries where poverty rates
3 In addition, it uses senate weights, which are a re-scaling of the originally calculated sample weight within each country to make the population of each country equal to a constant. They are used to perform comparative estimates or analyses across countries, regardless of their population size.

76 CEPAL Review N° 128 • August 2019
The heterogeneity of effects of preschool education on cognitive outcomes in Latin America
are above 10%, such as Colombia, Ecuador, El Salvador Honduras and Nicaragua, while others such as Argentina, Chile and Costa Rica have rates below 5%. The geographic distribution of population shows that some countries, such as Argentina or Uruguay, are highly urbanized; others have large rural populations —commonly the case in Central American countries, as seen for Guatemala (48%) and Honduras (45%).
Table 1 Socioeconomic indicators
(Percentages)
Country Poverty rates (in percentages)*
Rural population (as percentages of total population)
Public spending on education
(percentages of GDP)**
Participation: net enrolment rate, by level of education (in percentages)***
Preschool Primary Secondary Tertiary Argentina 4.3 8 5.33 72.47 99.3 88.2 82.9
Brazil 7.6 14 5.99 81.98 92.7 81.3 50.6
Chile 2 10 4.92 80.76 94.3 87.9 88.5
Colombia 13.2 24 4.49 78.29 90.6 78.2 55.6
Costa Rica 3.9 23 7.18 50.36 96.4 79.3 53.6
Ecuador 10.2 36 4.96 66.14 91.2 85.4 40.4
El Salvador 11.3 33 3.55 42.94 91.2 68.7 55.5
Guatemala 24 48 2.96 41.91 85.4 48.1 29.1
Honduras 31.2 45 5.87 68.72 93 49.4 21.8
Mexico 11 21 5.31 - 95 90.5 22
Nicaragua 17.1 41 4.49 46.83 96.9 48.9 29.9
Peru 9 21 9 88.36 94 77.6 -
Dominican Republic 9.1 21 - 43.16 86.89 66 50.12
Uruguay 1.3 5 4.36 88.23 94.2 76.3 -
Source: Prepared by the authors, on the basis of information from United Nations Educational, Scientific and Cultural Organization (UNESCO).
Note: * Based on a poverty line of US$ 3.10 per day (in 2011 PPP dollars); ** Latest data on education available from UNESCO Institute for Statistics; *** Data refer to 2015 except for Argentina, Honduras and Nicaragua (2010) and Panama (2014).
While there is not much disparity in the levels of government spending on education, it is possible to distinguish two groups: countries that spend more than 5% of GDP on education (seven countries, with Peru spending the most in recent years) and those with lower spending, with Guatemala being the country that dedicates the lowest share of public resources to education.
There is, however, great variation among countries in terms of participation rates in higher levels of education: Argentina and Chile stand out with enrolment rates above 83% at all levels, while in Mexico, coverage of primary and secondary education is high but declines at the tertiary level. At the other end of the spectrum, Guatemala and Honduras register enrolment rates below 50% in secondary and tertiary education.
As can be seen from the performance rankings for subjects and by country (see table 2), more than 185 points separate the country with the highest scores in third grade (Chile) from the country with the lowest scores (Dominican Republic); this differential narrows in sixth grade scores. Costa Rica and Mexico are among the countries with the highest scores, while the Dominican Republic and Paraguay are among the lowest in the rankings. The results show varying levels of heterogeneity within each country: there is high dispersion Colombia and low dispersion in Nicaragua.
Moreover, an analysis of average differences by population group and school type (rural schools and urban public schools) indicates that girls and boys who attend State-run schools in urban areas perform better in all countries, regardless of grade or type of test. This bias is more pronounced in countries with large rural populations (Guatemala, Honduras and Nicaragua) than in those with small rural populations (Argentina, Chile and Uruguay) (see annex tables A1.4 and A1.5).

77CEPAL Review N° 128 • August 2019
Juan Antonio Dip and Luis Fernando Gamboa
Table 2 TERCE scores, by subject and by country
(Means and standard deviation)
Reading Mathematics Natural sciencesThird grade Sixth grade Third grade Sixth grade Sixth grade
Mean Standard deviation Mean Standard
deviation Mean Standard deviation Mean Standard
deviation Mean Standard deviation
Argentina 703 4.89 707 4.5 717 4.83 722 4.14 700 4.65
Brazil 712 4.99 721 4.91 727 6.05 709 5.29 700 4.52
Chile 802 3.96 776 3.23 787 4.04 793 4.24 768 4.63
Colombia 714 8.33 726 5.49 694 7.8 705 5.45 733 4.57
Costa Rica 754 3.24 755 2.8 750 2.86 730 3.09 756 3.14
Ecuador 698 4.72 683 5.14 703 4.75 702 4.64 711 4.57
Guatemala 678 3.87 678 3.2 672 3.28 672 2.96 684 3.43
Honduras 681 4.14 662 6.19 680 4.97 661 4.01 668 3.52
Mexico 718 3.25 735 3.34 741 3.26 768 3.51 732 3.23
Nicaragua 654 2.84 662 2.72 653 3.07 643 2.44 668 3.38
Paraguay 653 4.81 652 3.99 652 5.42 641 3.75 646 4.12
Peru 719 3.91 703 3.39 716 4.1 721 3.92 701 3.61
Dominican Republic 614 3.5 633 3.29 602 3.68 622 2.31 632 3.01
Uruguay 728 7.15 736 5.02 742 7.96 765 6.38 725 6.7
Mean 700 1.22 700 1.08 700 1.28 700 1.06 700 1.07
Source: United Nations Educational, Scientific and Cultural Organization (UNESCO), TERCE: Learning Achievements, Executive Summary, Santiago, 2016.
The sociodemographic characteristics among the selected sample of pupils from the TERCE test are highly heterogeneous. There is a slight predominance of girls in both grades at country level and of pupils from urban schools (this is not the case in the Central American countries). Annex A5 shows that with the exception of Chile, more than 65% of pupils in third and sixth grade have mothers or fathers with low levels of education (below ISCED-P level 3)4 (see annex table A1.5).
An alternative method for measuring the effect size of preschool attendance on TERCE scores is Cohen’s d (Cohen 1988 and 1992), which expresses the mean difference between two groups in standard deviation units. The author posits that a value of d = 0.8 is a large effect, d = 0.5 is a moderate effect, and d = 0.2 a small effect. Ideally, the size of the effect should be compared to that of other effects found in the literature on similar topics. Thus, Wen and others (2012), when comparing differences in the effect of one or two years’ of preschool attendance on mathematics and language scores, find d values in the range of 0.27–0.96 and classify them as moderate and large. In a recent study on the effect of preschool education on mathematics, vocabulary and executive function outcomes at first and second grade, Shah and others (2017) observed that d values ranged from 0.22 to 0.40.
As table 3 shows, the effect sizes (original sample) can be classified as small and moderate, with a range of values of 0.32 < d ≦ 0.75 for countries and for each of the tests (see annex table A1.3 for the values found after propensity score matching).
The smallest effect size is seen in Argentina for the sixth-grade natural sciences test (d = 0.32) and the largest effect size corresponds to Honduras for the third-grade reading test (d = 0.75). Furthermore, a divergent pattern can be observed with respect to the increase or decrease in the effect size when comparing third and sixth grades. For example, in mathematics, the effect size decreases in countries such as Argentina, Chile, Colombia and Uruguay, while it increases in Brazil, Costa Rica and Peru. However, for all countries and for all the tests, the effect size classified as small for third grade remained unchanged for sixth grade and the moderate effect size also remained unchanged.
4 Level 3 of the International Standard Classification of Education (ISCED) classification for education programmes (ISCED-Programmes or ISCED-P) corresponds to upper secondary education.

78 CEPAL Review N° 128 • August 2019
The heterogeneity of effects of preschool education on cognitive outcomes in Latin America
Table 3 Cohen’s d effect size, original sample
Country Mathematics Reading Natural sciences
Third grade Sixth grade Third grade Sixth grade Sixth grade
Argentina 0.41 0.38 0.41 0.4 0.32
Brazil 0.48 0.56 0.45 0.64 0.50
Uruguay 0.58 0.57 0.50 0.53 0.55
Paraguay 0.60 0.64 0.73 0.74 0.68
Colombia 0.67 0.66 0.69 0.69 0.52
Mexico 0.53 0.45 0.53 0.51 0.45
Costa Rica 0.46 0.51 0.49 0.50 0.45
Peru 0.58 0.62 0.58 0.67 0.54
Ecuador 0.34 0.38 0.41 0.51 0.41
Nicaragua 0.53 0.51 0.53 0.53 0.53
Guatemala 0.75 0.57 0.74 0.61 0.60
Honduras 0.77 0.66 0.75 0.73 0.66
Dominican Republic 0.54 0.42 0.52 0.47 0.45
Chile 0.43 0.38 0.40 0.33 0.34
Source: Prepared by the authors.Note: According to the size of the coefficient d, the effect can be classified as: very small (d ≦ 0.20), small (0.20 < d ≦ 0.50),
moderate (0.50 < d ≦ 0.80) and large (d > 0.80). Calculated for original sample.
IV. Results
The authors estimated the effect using an ordinary least squares model with individual, family, school and city controls for each subject and for each country then presented the results obtained using the synthetic control method generated by propensity score matching. The findings show no evidence of a significant effect of preschool attendance on TERCE test scores, with a few exceptions (see table 4). That notwithstanding, the aforementioned discussion on the importance of isolating the effect of hidden variables or, at least, of considering synthetic controls, contributed to the propensity score matching results.
To ensure clarity of the propensity score matching results, the variables were first standardized to have a mean of 0 and a standard deviation of 1 before presenting the estimated coefficients of the standardized variables.5 This provides a better understanding of the effects, since regional differences in development are such that a given gross change in a subject may have significantly different relative effects.
The average treatment effect on the treated was calculated using various specifications in line with different controls. The decision was taken based on the B and R values proposed by Rubin (2001) in different types of matching (nearest neighbour 1:1, caliper 1:1 with replacement, and kernel) without initially observing the value of the average treatment effect on the treated. Kernel matching was thus selected, with the covariates described above. However, as adequate balance was not achieved on some covariates (e.g. gender) in some countries, a model excluding this variable was tested and there was no substantial change in the results.
5 The coefficients for the propensity score matching estimates (sample average treatment effect on the treated) are included in annex table A1.2.

79CEPAL Review N° 128 • August 2019
Juan Antonio Dip and Luis Fernando Gamboa
Table 4 Results of ordinary least squares regressiona
Argentina Brazil Uruguay Paraguay Colombia Mexico Peru Ecuador Nicaragua Guatemala Honduras Dominican Republic Chile
Third grade
Reading
Preschool 0.181** 0.0878 0.0699 0.146 0.175 0.0264 0.0961** 0.0995** 0.104 0.122** 0.154 0.0882 0.0390
(0.0708) 0 (0.0953) 0 0 0 (0.0417) (0.0497) (0.0643) (0.0553) 0 (0.0690) 0
N 917 1 339 994 1 342 1 666 1 922 2 362 1 755 1 384 1 931 1 624 1 092 2 224
R-squared 0.233 0.261 0.350 0.198 0.342 0.270 0.255 0.285 0.209 0.313 0.211 0.165 0.184
Mathematics
Preschool 0.173** 0.130 0.0577 0.204 0.103 0.113 0.0654 0.0472 0.101* 0.0932* 0.0874 0.0784 0.0386
(0.0769) 0 (0.0823) 0 0 0 (0.0465) (0.0466) (0.0560) (0.0502) 0 (0.0615) 0
N 914 1 337 995 1 324 1 657 1 910 2 342 1 735 1 369 1 907 1 615 1 091 2 217
R-squared 0.199 0.287 0.316 0.147 0.349 0.258 0.243 0.178 0.187 0.334 0.176 0.165 0.192
Sixth grade
Reading
Preschool 0.0298 0.277*** 0.177 0.142** 0.172 0.131 0.196*** 0.174 0.151*** 0.0721 0.0904 0.101* 0.0985**
(0.0479) (0.0812) 0 (0.0554) 0 0 (0.0373) 0 (0.0474) (0.0492) 0 (0.0561) (0.0426)
N 1 626 1 224 1 304 1 592 2 189 2 331 2 753 2 225 1 820 2 350 2 169 1 706 2 695
R-squared 0.173 0.211 0.199 0.322 0.176 0.217 0.320 0.245 0.190 0.260 0.220 0.177 0.143
Mathematics
Preschool 0.0792 0.169** 0.151 0.160*** 0.171 0.166 0.244*** 0.0752 0.133*** 0.114** 0.147 0.151*** 0.155***
(0.0555) (0.0728) 0 (0.0522) 0 0 (0.0434) 0 (0.0409) (0.0477) 0 (0.0475) (0.0452)
N 1 521 1 207 1 259 1 538 2 108 2 289 2 733 2 181 1 739 2 283 2 089 1 539 2 649
R-squared 0.132 0.178 0.213 0.171 0.144 0.168 0.263 0.169 0.129 0.215 0.111 0.089 0.113
Source: Prepared by the authors.Note: Standard errors in parentheses: *** p<0.01, ** p<0.05, * p<0.1.a All regressions include controls for pupils, family and school.
Table 5 shows the results of the average treatment effect on the treated for all countries for the tests administered in third grade and in sixth grade. This was done using the methodology proposed by DuGoff, Schuler and Stuart (2014) for incorporating survey weights with propensity score methods to estimate the average treatment effect on the treated. Lastly, for clarity and robustness of the results, one covariate (pupil gender) was removed from the model in the propensity score analysis. The aim was to observe significant differences in the estimations and this demonstrated the stability of the calculations. The sensitivity analysis proposed by Rosenbaum (2002) was conducted. The odds ratios (gamma (Γ) values) at which estimates are sensitive to hidden bias range from 1.05 to 1.65.6 Most countries were sensitive from Γ values of 1.20 (95% confidence interval).7
6 Because of difficulty accounting for the existing problems concerning the variability of the data for Panama since the creation of the database, the authors opted not to include it in the study.
7 Due to the extent of the calculations, they have not been included in the document but are available on request.

80 CEPAL Review N° 128 • August 2019
The heterogeneity of effects of preschool education on cognitive outcomes in Latin America
Table 5 Propensity score matching results: population average treatment effect on the treated
Third grade Sixth grade
Population average treatment effect on the treated
Mean (bias)
Balance with propensity score (B)
Variance ratio (R)
Population average treatment effect on the treated
Mean (bias)
Balance with propensity score (B)
Variance ratio (R)
Argentina
Mathematics 0.191** 1.1 6.8 0.99 0.127** 3.1 12.9 1
Language 0.112** 1.1 6.8 0.99 0.07~ 3.1 12.9 1
Natural sciences 0.09~ 3.1 12.9 1
Brazil
Mathematics 0.142** 2.4 9.2 1 0.210** 1.7 8.5 1.16
Language 0.07~ 2.4 9.2 1 0.316** 1.7 8.5 1.16
Natural sciences 0.194** 1.7 8.5 1.16
Uruguay
Mathematics 0.06~ 3 14 0.93 0.179** 1.9 8.6 1
Language 0.09* 3 14 0.93 0.152** 1.9 8.6 1
Natural sciences 0.135** 1.9 8.6 1
Paraguay
Mathematics 0.220** 1.4 5.7 1.33 0.139** 1.7 7.8 1.21
Language 0.173** 1.4 5.7 1.33 0.03~ 1.7 7.8 1.21
Natural sciences 0.120** 1.7 7.8 1.21
Colombia
Mathematics 0.06~ 2.1 12.4 0.91 0.170** 2 8.5 1.16
Language 0.154** 2.1 12.4 0.91 0.07* 2 8.5 1.16
Natural sciences 0.132** 2 8.5 1.16
Mexico
Mathematics 0.087** 2.7 14.7 1.09 0.142** 2.4 9 1.17
Language 0.065~ 2.7 14.7 1.09 0.09** 2.4 9 1.17
Natural sciences 0.121** 2.4 9 1.17
Peru
Mathematics 0.085** 1.5 7.9 1.02 0.207** 1.2 5.2 0.99
Language 0.090** 1.5 7.9 1.02 0.164** 1.2 5.2 0.99
Natural sciences 0.121** 1.2 5.2 0.99
Ecuador
Mathematics 0.129** 2 9 1 0.05~ 2 8.9 1.04
Language 0.145** 2 9 1 0.128** 2 8.9 1.04
Natural sciences 0.138** 2 8.9 1.04
Panama
Mathematics 0.04~ 1.5 7.3 0.91 0.02~ 1.6 8.4 1
Language -0.06~ 1.5 7.3 0.91 0.02~ 1.6 8.4 1
Natural sciences 0.07~ 1.6 8.4 1
Nicaragua
Mathematics 0.1263** 1.9 9.1 0.97 0.125** 2.1 9.2 1
Language 0.112~ 1.9 9.1 0.97 0.154** 2.1 9.2 1
Natural sciences 0.141** 2.1 9.2 1

81CEPAL Review N° 128 • August 2019
Juan Antonio Dip and Luis Fernando Gamboa
Third grade Sixth grade
Population average treatment effect on the treated
Mean (bias)
Balance with propensity score (B)
Variance ratio (R)
Population average treatment effect on the treated
Mean (bias)
Balance with propensity score (B)
Variance ratio (R)
Guatemala
Mathematics 0.07~ 5 24.4 0.76 0.116* 2.5 11.6 0.92
Language 0.214** 5 24.4 0.76 0.05~ 2.5 11.6 0.92
Natural sciences 0.109** 2.5 11.6 0.92
Honduras
Mathematics 0.223~ 2.1 8.7 1.05 0.179** 2 10.3 1.3
Language 0.189~ 2.1 8.7 1.05 0.143* 2 10.3 1.3
Natural sciences 0.09~ 2 10.3 1.3
Dominican Republic
Mathematics 0.08~ 1.1 5.9 1.09 0.167** 1 5.4 1.19
Language 0.105* 1.1 5.9 1.09 0.69~ 1 5.4 1.19
Natural sciences 0.108* 1 5.4 1.19
Chile
Mathematics 0.104** 2.1 10.4 1.1 0.124** 1.4 6.1 1.07
Language 0.101** 2.1 10.4 1.1 0.04~ 1.4 6.1 1.07
Natural sciences 0.03~ 1.4 6.1 1.07
Source: Prepared by the authors.Note: ** Significant at 5%; * Significant at 10%; ~ Not significant; Bootstrap standard errors (100 replications).
In the short term (third grade) a positive effect was found for most countries in both mathematics and reading, but there are some notable differences in the effect size. For countries such as Honduras and Paraguay, the effect of preschool attendance on mathematics varies between 0.25 and 0.33 of a standard deviation. In terms of scores, the effect size is equivalent to between 24 and 31 points on the test (sample average treatment effect on the treated), however the effects are the same when the population average treatment effect on the treated is considered and are not significant for Honduras. In the remaining countries, the estimated effect (the average treatment effect on the treated and population average treatment effect on the treated) is generally between 0.08 and 0.2 standard deviations, which is within the expected values in other estimates found in the aforementioned literature. With the exception of the Dominican Republic, Ecuador and Guatemala (sample average treatment effect on the treated) —and also of Colombia and Uruguay when the population average treatment effect on the treated is considered—, the effect size is smaller for the reading tests in the vast majority of countries. This characteristic would seem to suggest that mathematics learning in schools generate a greater advantage than language-related activities. This is not surprising when one considers that language acquisition begins at a very early age in the home.
Analysis of results for sixth grade, which include a natural sciences assessment, reveals some particularities. First, in the vast majority of countries, the effect of preschool on mathematics outcomes is more pronounced (sample average treatment effect on the treated and population average treatment effect on the treated), and only in Argentina, Ecuador, Honduras and Paraguay does the coefficient size of the population average treatment effect on the treated decrease. The opposite appears to be true for reading in many countries. Thus, in the countries of the Southern Cone (Argentina, Chile and Paraguay), the effect of preschool attendance on the TERCE test score decreases, as seen in the sample average treatment effect on the treated and population average treatment effect on the treated, while in more populous countries like Brazil, Colombia and Mexico the causal effect size. Second, the magnitude of
Table 5 (concluded)

82 CEPAL Review N° 128 • August 2019
The heterogeneity of effects of preschool education on cognitive outcomes in Latin America
the changes is heterogeneous. For example, the population average effect of treatment on the treated for reading goes from 0.07 (non-significant) in third grade to 0.31 in sixth grade in Brazil, while in Paraguay it decreases from 0.173 in third grade to 0.03 (non-significant) in sixth grade.
Regardless of whether there is an increase or decrease in the medium-term effect of preschool attendance on test results, the effect sizes for Brazil, the Dominican Republic, Nicaragua and Paraguay vary markedly. Third, although the largest effect size continues to be in mathematics, the results in natural sciences is noteworthy. It could often be said that experimentation, guided learning and learning to follow instructions at an early young age stimulates the acquisition of science and scientific skills, hence preschool attendance has an effect ranging from 0.07 to 0.2 standard deviations in the sixth-grade TERCE score (10 of the 14 countries considered have a coefficient greater than 0.10 standard deviations in the average effect of treatment on the treatment of the target population).
The above results substantiate the importance of continuing efforts to increase preschool education coverage, since, in addition to the direct benefits mentioned for pupils, there is also evidence of indirect benefits on equity, mothers’ labour market participation, and health.
V. Conclusions
There are considerable differences in access to preschool education in Latin America today, and these differences are more pronounced among pupils in urban and rural areas.
The results obtained from the propensity score matching on the TERCE test seem to indicate that there are positive effects of attending preschool and that these effects persist up to six years after preschool. This outcome has important education policy implications because it illustrates the need to reduce the inequality of opportunities at the beginning of the education cycle by making the necessary investments to ensure that children attend school at a younger age.
Notwithstanding the above, the results vary between countries, subjects and period for the TERCE test. This implies that the evidence does not support an upward or downward trend for all the countries studied. Domestic policies may help to reduce inequalities in access and thus improve the cognitive and non-cognitive outcomes among the most vulnerable pupils. While there are very diverse institutional variables, it can be affirmed that, on average, the general trend in mathematics differs from that in reading. Preschool attendance was also found to have a positive effect on natural sciences and, after controlling for covariates mentioned above, the size of the effect was not insignificant.
These findings provide important evidence to support continuing efforts to achieve universal coverage, which enhance development potential by providing additional education options for children and by increasing opportunities for mothers to participate in the labour market. It must be borne in mind that the younger children are enrolled in school, the more likely they are to have better cognitive and non-cognitive achievements. These are very important if vulnerable communities are to achieve other health and nutrition goals.
The resulting evidence suggests that governments must be encouraged to intensify and sustain efforts in the area of early childhood education, making available the necessary resources not only to expand coverage, but also to improve the quality of these programmes. Given the return on such investments, it is important to monitor both quality and coverage in rural areas to reduce the inequality of access in Latin America. Only thus can it be said that preschool education is guaranteeing children’s rights.

83CEPAL Review N° 128 • August 2019
Juan Antonio Dip and Luis Fernando Gamboa
BibliographyAbadie, A. and G. Imbens (2005), “On the failure of the bootstrap for matching estimators” [online] http://
www.princeton.edu/~erp/Econometrics/Old%20Pdfs/Abadie.pdf. Araujo, M., M. Dormal and N. Schady (2017), “Child care quality and child development”, IDB Working Paper,
No. 779, Washington, D.C., Inter-American Development Bank (IDB).Behrman, J., Y. Cheng and P. Todd (2004), “Evaluating preschool programs when length of exposure to the
program varies: a nonparametric approach”, The Review of Economics and Statistics, vol. 86, No. 1, Cambridge, MIT Press.
Berlinski, S., S. Galiani and M. Manacorda (2008), “Giving children a better start: preschool attendance and school-age profiles”, Journal of Public Economics, vol. 92, No. 5–6, Amsterdam, Elsevier.
Berlinski, S. and N. Schady (eds.) (2015), The Early Years: Child Well-being and the Role of Public Policy, Washington, D.C., Inter-American Development Bank (IDB).
Bernal, R. and A. Camacho (2012), “La política de primera infancia en el contexto de la equidad y movilidad social en Colombia”, Documentos CEDE, No. 33, Bogota, University of Los Andes.
Bernal, R. and others (2015), “The effects of the transition from home-based childcare to center-based childcare in Colombia”, Bogota, University of Los Andes, unpublished.(2012), Evaluación de impacto del Programa Jardines Sociales/Centros de Desarrollo Infantil. Informe final de impacto, Bogota, University of Los Andes.
Black, D. (2015), “Matching as a regression estimator”, IZA World of Labor, No. 186, Bonn.Brookhart, M. and others (2006), “Variable selection for propensity score models”, American Journal of
Epidemiology, vol. 163, No. 12, Oxford, Oxford University Press.Caliendo, M. and S. Kopeinig (2008), “Some practical guidance for the implementation of propensity score
matching”, Journal of Economic Surveys, vol. 22, No. 1, Hoboken, Wiley. Cascio, E. (2015), “The promises and pitfalls of universal early education”, IZA World of Labor, No. 116, Bonn. Cohen, J. (1992), “A power primer”, Psychological Bulletin, vol. 112, No. 1, Washington, D.C., American
Psychological Association. (1988), Statistical Power Analysis for the Behavioral Sciences, Hillsdale, Lawrence Erlbaum Associates.
DuGoff, E., M. Schuler and E. Stuart (2014), “Generalizing observational study results: applying propensity score methods to complex surveys”, Health Services Research, vol. 49, No. 1, Hoboken, Wiley.
Gamboa, L. and N. Krüger (2016), “Does the contribution made by early education to later academic achievement differ in Latin America?: PISA 2009–2012”, CEPAL Review, No. 118 (LC/G-2676-P), Santiago, Economic Commission for Latin America and the Caribbean (ECLAC).
Heckman, J., R. Pinto and P. Savelyev (2013), “Understanding the mechanisms through which an influential early childhood program boosted adult outcomes”, American Economic Review, vol. 103, No. 6, Nashville, American Economic Association.
Heckman, J. and R. Robb (1986), “Alternative methods for solving the problem of selection bias in evaluating the impact of treatments on outcomes”, Drawing Inferences from Self-Selected Samples, H. Wainer (ed.), New York, Springer.
Loeb, S. and others (2007), “How much is too much? The influence of preschool centers on children's social and cognitive development”, Economics of Education Review, vol. 26, No. 1, Amsterdam, Elsevier.
Magnuson, K., C. Ruhm and J. Waldfogel (2007a), “Does prekindergarten improve school preparation and performance?”, Economics of Education Review, vol. 26, No. 1, Amsterdam, Elsevier. (2007b), “The persistence of preschool effects: do subsequent classroom experience matter?”, Early Childhood Research Quarterly, vol. 22, No. 1, Amsterdam, Elsevier.
Mateo, M. and L. Rodríguez-Chamussy (2013), “Childcare and women’s labor participation: evidence for Latin America and the Caribbean”, IDB Technical Note, No. 586, Washington, D.C., Inter-American Development Bank (IDB).
MINEDUC (Ministry of Education of Chile) (2014), “Estado del arte de la educación parvularia en Chile”, Santiago.Nores, M. and W. Barnett (2010), “Benefits of early childhood interventions across the world: (under) investing
in the very young”, Economics of Education Review, vol. 29, No. 2, Amsterdam, Elsevier.Rosenbaum, P. (2002), Observational Studies, New York, Springer.Rosenbaum, P. and D. Rubin (1983), “The central role of the propensity score in observational studies for
causal effects”, Biometrika, vol. 70, No. 1, Oxford, Oxford University Press.

84 CEPAL Review N° 128 • August 2019
The heterogeneity of effects of preschool education on cognitive outcomes in Latin America
Rubin, D. (2001), “Using propensity scores to help design observational studies: application to the tobacco litigation”, Health Services and Outcomes Research Methodology, vol. 2, No. 3–4, New York, Springer.
Schady, N. and others (2015), “Wealth gradients in early childhood cognitive development in five Latin American countries”, Journal of Human Resources, vol. 50, No. 2, Madison, University of Wisconsin Press.
Shah, H. and others (2017), “One or two years of participation: is dosage of an enhanced publicly funded preschool program associated with the academic and executive function skills of low-income children in early elementary school?”, Early Childhood Research Quarterly, vol. 40, Amsterdam, Elsevier.
Shonkoff, J. and D. Phillips (2000), From Neurons to Neighborhoods: The Science of Early Childhood Development, Washington, D.C., National Academy Press.
Skibbe, L. and others (2011), “Schooling effects on preschoolers’ self-regulation, early literacy, and language growth”, Early Childhood Research Quarterly, vol. 26, No. 1, Amsterdam, Elsevier.
SOPLA (Programa Regional sobre Políticas Sociales) (2014), Los desafíos de educación preescolar, básica y media en América Latina, Santiago, Konrad Adenauer Stiftung/Programa Regional sobre Políticas Sociales (SOPLA).
Stuart, E. (2010), “Matching methods for causal inference: a review and look forward”, Statistical Science, vol. 25, No. 1, Beachwood, Institute of Mathematical Statistics (IMS).
Temple, J. and A. Reynolds (2007), “Benefits and costs of investments in preschool education: evidence from the Child-Parent Centers and related programs”, Economics of Education Review, vol. 26, No. 1, Amsterdam, Elsevier.
UNESCO (United Nations Educational, Scientific and Cultural Organization) (2016), Reporte técnico. Tercer Estudio Regional Comparativo y Explicativo (TERCE), Santiago.(2014), EFA Global Monitoring Report 2013/4. Teaching and Learning: Achieving Quality for All, Paris.(2013), Situación educativa de América Latina y el Caribe: hacia una educación para todos 2015, Santiago. (2008), Indicadores de la educación de la primera infancia en América Latina: propuesta y experiencias piloto, Santiago.
Wagstaff, A. (2007), “Health insurance for the poor: initial impacts of Vietnam’s Health Care Fund for the Poor”, Impact Evaluation Series, No. 11, Washington, D.C., World Bank.
Wen, X. and others (2012), “Are two years better than one year? A propensity score analysis of the impact of Head Start program duration on children’s school performance in kindergarten”, Early Childhood Research Quarterly, vol. 27, No. 4, Amsterdam, Elsevier.

85CEPAL Review N° 128 • August 2019
Juan Antonio Dip and Luis Fernando Gamboa
Annex A1Table A1.1
Effective sample from the Third Regional Comparative and Explanatory Study (TERCE)
Reading Mathematics Natural sciences Third grade Sixth grade Third grade Sixth grade Third grade Sixth grade
Argentina 3 655 3 658 3 751 3 639 3 663 3 632
Brazil 3 254 2 900 3 343 2 983 2 986 3 908
Chile 4 751 5 056 4 709 5 044 5 029 4 754
Colombia 4 018 4 343 3 975 4 308 4 325 4 028
Costa Rica 3 427 3 490 3 428 3 520 3 520 3 436
Ecuador 4 631 4 842 4 642 4 818 4 820 4 621
Guatemala 4 060 3 891 4 282 4 056 4 070 4 112
Honduras 3 743 3 788 3 870 3 880 3 886 3 651
Mexico 3 465 3 554 3 543 3 618 3 622 3 456
Nicaragua 3 513 3 470 3 810 3 726 3 741 3 537
Paraguay 3 123 3 175 3 271 3 222 3 231 3 274
Peru 4 946 4 739 5 038 4 789 4 801 5 003
Dominican Republic 3 504 3 588 3 757 3 661 3 669 3 652
Uruguay 2 663 2 799 2 728 2 799 2 803 2 672
Total 56 036 56 779 57 561 57 476 54 055 56 500
Source: United Nations Educational, Scientific and Cultural Organization (UNESCO), TERCE: Learning Achievements, Executive Summary, Santiago, 2016.
Table A1.2 Propensity score matching results: sample average treatment effect on the treated
Third grade Sixth gradeSample average treatment effect on the treated
Mean (bias)
Balance with propensity score (B)
Variance ratio (R)
Sample average treatment effect on the treated
Mean (bias)
Balance with propensity score (B)
Variance ratio (R)
Argentina
Mathematics 0.17** 1.1 6.8 0.99 0.15** 3.1 12.9 1
Reading 0.11** 1.1 6.8 0.99 0.09~ 3.1 12.9 1
Natural sciences 0.10~ 3.1 12.9 1
Brazil
Mathematics 0.14** 2.4 9.2 1 0.27** 1.7 8.5 1.16
Reading 0.06~ 2.4 9.2 1 0.31** 1.7 8.5 1.16
Natural sciences 0.24** 1.7 8.5 1.16
Uruguay
Mathematics 0.16** 3 14 0.93 0.20** 1.9 8.6 1
Reading 0.15** 3 14 0.93 0.14** 1.9 8.6 1
Natural sciences 0.18** 1.9 8.6 1
Paraguay
Mathematics 0.22** 1.4 5.7 1.33 0.16** 1.7 7.8 1.21
Reading 0.19** 1.4 5.7 1.33 0.06~ 1.7 7.8 1.21
Natural sciences 0.13** 1.7 7.8 1.21
Colombia
Mathematics 0.12** 2.1 12.4 0.91 0.19** 2 8.5 1.16
Reading 0.10** 2.1 12.4 0.91 0.13** 2 8.5 1.16
Natural sciences 0.09** 2 8.5 1.16
Mexico
Mathematics 0.10** 2.7 14.7 1.09 0.15** 2.4 9 1.17
Reading 0.09~ 2.7 14.7 1.09 0.10** 2.4 9 1.17
Natural sciences 0.14** 2.4 9 1.17

86 CEPAL Review N° 128 • August 2019
The heterogeneity of effects of preschool education on cognitive outcomes in Latin America
Third grade Sixth gradeSample average treatment effect on the treated
Mean (bias)
Balance with propensity score (B)
Variance ratio (R)
Sample average treatment effect on the treated
Mean (bias)
Balance with propensity score (B)
Variance ratio (R)
Peru
Mathematics 0.13** 1.5 7.9 1.02 0.21** 1.2 5.2 0.99
Reading 0.13** 1.5 7.9 1.02 0.15** 1.2 5.2 0.99
Natural sciences 0.11** 1.2 5.2 0.99
Ecuador
Mathematics 0.12** 2 9 1 0.06~ 2 8.9 1.04
Reading 0.14** 2 9 1 0.11** 2 8.9 1.04
Natural sciences 0.11~ 2 8.9 1.04
Nicaragua
Mathematics 0.16** 1.9 9.1 0.97 0.19** 2.1 9.2 1
Reading 0.08~ 1.9 9.1 0.97 0.17** 2.1 9.2 1
Natural sciences 0.22** 2.1 9.2 1
Guatemala
Mathematics 0.08~ 5 24.4 0.76 0.14** 2.5 11.6 0.92
Reading 0.20** 5 24.4 0.76 0.13** 2.5 11.6 0.92
Natural sciences 0.15** 2.5 11.6 0.92
Honduras
Mathematics 0.34** 2.1 8.7 1.05 0.29** 2 10.3 1.3
Reading 0.23** 2.1 8.7 1.05 0.28** 2 10.3 1.3
Natural sciences 0.29** 2 10.3 1.3
Dominican Republic
Mathematics 0.11~ 1.1 5.9 1.09 0.18** 1 5.4 1.19
Reading 0.20** 1.1 5.9 1.09 0.11~ 1 5.4 1.19
Natural sciences 0.14** 1 5.4 1.19
Chile
Mathematics 0.14** 2.1 10.4 1.1 0.11** 1.4 6.1 1.07
Reading 0.11** 2.1 10.4 1.1 0.05~ 1.4 6.1 1.07
Natural sciences 0.04~ 1.4 6.1 1.07
Source: Prepared by the authors, based on data from the Third Regional Comparative and Explanatory Study (TERCE). Note: ** significant at 5%, * Significant at 10%, ~ Not significant.
Table A1.3 Cohen’s d effect size in the sample preschool attendance–no preschool attendance
after propensity score matching
CountryMathematics Reading Natural sciences
Third grade Sixth grade Third grade Sixth grade Sixth gradeArgentina 0.39 0.43 0.42 0.41 0.30
Brazil 0.43 0.57 0.40 0.70 0.57
Uruguay 0.57 0.55 0.47 0.51 0.53
Paraguay 0.59 0.63 0.69 0.74 0.65
Colombia 0.66 0.63 0.68 0.66 0.49
Mexico 0.48 0.43 0.47 0.47 0.44
Peru 0.55 0.61 0.55 0.65 0.52
Ecuador 0.33 0.38 0.39 0.52 0.42
Nicaragua 0.46 0.51 0.46 0.55 0.53
Guatemala 0.74 0.56 0.73 0.60 0.60
Honduras 0.76 0.71 0.73 0.75 0.67
Dominican Republic 0.48 0.41 0.55 0.43 0.43
Chile 0.41 0.38 0.38 0.33 0.35
Source: Prepared by the authors, based on data from the Third Regional Comparative and Explanatory Study (TERCE). Note: Very small (d ≦ 0.20), small (0.20 < d ≦ 0.50), moderate (0.50 < d ≦ 0.80) and large (> 0.80). Sample after propensity
score matching, common support.
Table A1.2 (concluded)

87CEPAL Review N° 128 • August 2019
Juan Antonio Dip and Luis Fernando Gamboa
Table A1.4 Pupil distribution, by socioeconomic characteristics
(Proportion of the sample)
ARG BRA CHL COL CRI DOM ECU GTM HND MEX NIC PRY PER URY Total
Sixth grade
Pupil age
11 years 0.15 0.00 0.06 0.12 0.00 0.20 0.32 0.02 0.07 0.02 0.14 0.12 0.28 0.03 0.11
12 years 0.68 0.27 0.76 0.49 0.52 0.43 0.54 0.23 0.5 0.72 0.46 0.62 0.51 0.77 0.55
13–15 years 0.17 0.73 0.18 0.39 0.48 0.37 0.14 0.75 0.43 0.26 0.40 0.25 0.21 0.20 0.34
Girls 0.49 0.52 0.51 0.5 0.5 0.51 0.47 0.49 0.5 0.5 0.54 0.51 0.5 0.52 0.5
Rural school 0.34 0.18 0.22 0.38 0.09 0.35 0.27 0.66 0.55 0.27 0.51 0.39 0.31 0.14 0.34
Urban-public school 0.42 0.5 0.20 0.20 0.71 0.44 0.48 0.25 0.12 0.47 0.27 0.25 0.37 0.67 0.37
Mother’s level of education
No schooling 0.03 0.15 0.03 0.03 0.06 0.07 0.05 0.18 0.13 0.07 0.09 0.03 0.07 0.01 0.07
[ISCED-P 1-2] 0.40 0.31 0.21 0.29 0.42 0.31 0.45 0.52 0.45 0.51 0.39 0.38 0.32 0.34 0.39
[ISCED-P 3] 0.34 0.37 0.33 0.34 0.25 0.29 0.31 0.23 0.19 0.17 0.31 0.30 0.32 0.45 0.29
[ISCED-P 4-5] 0.14 0.03 0.19 0.17 0.15 0.08 0.03 0.04 0.05 0.05 0.06 0.11 0.16 0.09 0.10
[ISCED-P 6-8] 0.09 0.14 0.24 0.17 0.12 0.26 0.16 0.03 0.19 0.20 0.15 0.18 0.12 0.11 0.16
Father’s level of education
No schooling 0.03 0.19 0.03 0.04 0.06 0.07 0.06 0.12 0.14 0.08 0.11 0.03 0.03 0.02 0.06
[ISCED-P 1-2] 0.48 0.36 0.22 0.33 0.44 0.39 0.44 0.52 0.46 0.49 0.39 0.37 0.30 0.43 0.40
[ISCED-P 3] 0.33 0.31 0.32 0.34 0.23 0.27 0.30 0.26 0.16 0.16 0.29 0.31 0.36 0.41 0.28
[ISCED-P 4-5] 0.07 0.02 0.14 0.13 0.14 0.10 0.05 0.04 0.06 0.04 0.06 0.11 0.16 0.06 0.09
[ISCED-P 6-8] 0.08 0.12 0.29 0.17 0.12 0.17 0.15 0.05 0.18 0.23 0.16 0.17 0.15 0.08 0.16
Third grade
8 years 0.18 0.00 0.05 0.13 0.00 0.18 0.33 0.01 0.09 0.03 0.16 0.17 0.22 0.03 0.11
9 years 0.71 0.17 0.77 0.60 0.51 0.5 0.57 0.27 0.55 0.86 0.47 0.61 0.61 0.81 0.60
10–11 years 0.11 0.83 0.18 0.27 0.49 0.32 0.10 0.72 0.36 0.11 0.37 0.22 0.17 0.16 0.28
Girls 0.48 0.5 0.5 0.52 0.48 0.51 0.46 0.49 0.5 0.51 0.5 0.48 0.48 0.51 0.49
Rural school 0.34 0.22 0.22 0.35 0.08 0.35 0.27 0.64 0.57 0.28 0.56 0.40 0.33 0.15 0.35
Urban-public school 0.40 0.46 0.18 0.22 0.72 0.38 0.48 0.25 0.11 0.44 0.22 0.23 0.35 0.64 0.36
Mother’s level of education
No schooling 0.02 0.14 0.02 0.03 0.06 0.08 0.05 0.16 0.13 0.06 0.10 0.04 0.08 0.01 0.06
[ISCED-P 1-2] 0.37 0.30 0.18 0.24 0.40 0.31 0.43 0.52 0.42 0.47 0.35 0.37 0.32 0.32 0.36
[ISCED-P 3] 0.36 0.38 0.34 0.33 0.26 0.28 0.32 0.24 0.22 0.18 0.31 0.28 0.33 0.44 0.30
[ISCED-P 4-5] 0.13 0.02 0.20 0.19 0.15 0.06 0.04 0.04 0.05 0.05 0.07 0.11 0.17 0.11 0.10
[ISCED-P 6-8] 0.11 0.16 0.25 0.20 0.13 0.27 0.15 0.04 0.19 0.23 0.17 0.20 0.11 0.11 0.17
Father’s level of education
No schooling 0.04 0.18 0.03 0.04 0.07 0.09 0.06 0.13 0.14 0.07 0.12 0.04 0.04 0.02 0.07
[ISCED-P 1-2] 0.46 0.35 0.21 0.29 0.44 0.38 0.42 0.51 0.45 0.48 0.39 0.35 0.29 0.39 0.39
[ISCED-P 3] 0.35 0.33 0.33 0.34 0.23 0.27 0.32 0.27 0.18 0.17 0.26 0.32 0.38 0.44 0.29
[ISCED-P 4-5] 0.07 0.02 0.15 0.15 0.14 0.08 0.06 0.05 0.07 0.05 0.07 0.11 0.16 0.06 0.09
[ISCED-P 6-8] 0.09 0.11 0.28 0.17 0.12 0.18 0.14 0.05 0.15 0.23 0.16 0.17 0.13 0.09 0.16
Source: Prepared by the authors, based on data from the Third Regional Comparative and Explanatory Study (TERCE). Note: ISCED: International Standard Classification of Education.

88 CEPAL Review N° 128 • August 2019
The heterogeneity of effects of preschool education on cognitive outcomes in Latin America
Table A1.5 Mean Third Regional Comparative and Explanatory Study (TERCE) reading and
mathematics scores, sixth grade and third grade
ARG BRA CHL COL CRI DOM ECU GTM HND MEX NIC PRY PER URY TotalSixth grade
Reading
Girls 723.2 746.1 795.7 743.1 769.1 651.8 693.7 684.8 702 752.5 676.4 682.8 698.8 750.2 722.5
Pupil age
11 years 714.9 711.6 763.5 748.2 806.9 662.6 693.5 709.1 703 768 683.6 687.6 723.4 761.6 707.5
12 years 720 759.4 791.2 756.3 771.8 656.6 712 709.2 706.1 752.7 691.1 691.8 719.9 759.1 734.6
13 years 668.1 752.8 776.2 725.4 767.9 629.5 664.7 694.1 701.4 747.2 658.6 634.2 643.2 680 711.9
14–15 years 644.1 681.8 724.2 685.2 714.8 602.5 634.8 656.4 661.5 670.3 632.7 608.4 606.8 652 652.4
Rural school 679.4 682.1 750.7 696.5 734 620.4 684.2 673 665.2 692.9 651.7 625.3 614.7 712.6 672.1
Urban-public school 706.6 726.2 757.2 741 750.1 645.2 688.1 688.5 690.6 742.3 673.1 661.6 708.2 726.6 716.0
Father’s level of education
No schooling 676.6 686.9 740.5 680.6 719.9 608.7 626.1 652.3 644.4 668.2 632.4 609.7 610.7 673.6 656.1
[ISCED-P 1-2] 689.2 725.6 745.9 700 743.1 629.3 671.1 670 672.9 719.5 649.6 629.1 633.9 708.1 686.5
[ISCED-P 3] 725.1 754.9 768.9 731 767.2 643.9 711 709.7 721.5 766.2 683.2 680.1 702.7 755.9 723.4
[ISCED-P 4-5] 733.1 745.6 797.4 770.8 802.9 661.4 739.6 735.4 741.6 792.8 700.7 714.5 757.6 794.4 756.5
[ISCED-P 6] 746.7 805.1 826.7 802.8 807.4 675.8 759 767.6 763.9 814.8 718.4 747.5 778.7 823.2 780.8
[ISCED-P 7-8] 799.8 820.9 844.8 835.1 835.4 698.4 785.6 795.7 773.1 827.8 740.9 752.5 822.8 850.8 806.7
Mother’s level of education
No schooling 676.2 682.7 742.8 666 722.7 607.1 630.7 658.2 647.4 664 633 606.6 607.2 667.8 654.7
[ISCED-P 1-2] 687.4 725.6 746.6 701.4 742.4 625.5 670 676 674.1 721.1 650.1 636.4 645.9 698 688.9
[ISCED-P 3] 718.8 754.8 772.1 725.7 764.7 647.5 713.4 717.3 719.6 782.3 682.8 677.6 713.6 750.3 726.0
[ISCED-P 4-5] 728.5 736.3 796.4 767 810.8 661.9 761 760.6 738.7 791 704.6 724.6 766 796.4 765.1
[ISCED-P 6] 765.6 784.7 832.3 812.4 816.4 673.7 761.3 774.6 766.6 820.4 725.4 753.5 796.6 823.8 781.3
[ISCED-P 7-8] 780.7 827.3 853 831.5 836.7 713.8 795.4 779.3 787.8 825.1 754.2 765.3 826.7 852.8 807.0
Third grade reading
Girls 721.9 736.6 814.1 741.2 767.6 639.2 707.9 701 711.6 748.5 678 678.6 721.9 738.9 725.4
Pupil age
8 years 714.4 793 790.4 744.8 716.1 641.5 701.3 738.7 707.8 716.9 680.8 687.5 733.6 709.8 708.7
9 years 719.1 752 809.7 745.8 761.6 645.7 717.3 712.9 709.2 742 687.1 683.3 733.3 740.1 731.7
10 years 660 740.2 809.2 722 768.6 603.1 690.8 713.4 714 745.2 652.8 620.6 653.9 681 713.7
11 years 640.3 675.3 763.6 671.7 704.5 606.7 656.3 663.4 675.8 662.5 644.8 627.8 645.4 660.5 658.6
Rural school 691.2 688.3 773 689.1 727.5 614.4 691.4 680.6 675.7 693.9 651.1 632.1 647.8 709 677.0
Urban-public school 700.1 715.8 778.5 727 747.2 621.7 702.1 706.4 702.1 724.9 672.8 662.9 727.2 713.7 713.4
Father’s level of education
No schooling 684.4 675.3 748.8 663.4 714.8 605.6 660.8 658 662.1 663.2 644.7 601.9 645 680.1 661.2
[ISCED-P 1-2] 691.1 717.1 769.8 696.4 741.1 616.2 683.9 678.6 684.1 711.1 652.9 637.3 661.2 695.7 688.4
[ISCED-P 3] 721.4 745.8 793.9 728 756.4 625.2 716.9 729.2 724 755.9 671.9 674.1 721.2 741.6 724.2
[ISCED-P 4-5] 746.8 768.6 817.8 762.9 794.7 657.9 750 754.1 730.4 763.4 704.3 695.6 774.8 774.5 758.6
[ISCED-P 6] 756.6 787.4 847.1 799.7 814.1 674 761.1 785.1 774.7 804.9 722.1 737.6 791.5 790.5 780.0
[ISCED-P 7-8] 764.8 808.3 865.9 823.9 830.5 696.5 789 793.5 793.3 823.1 738.7 725.7 813.3 815.8 809.7
Mother’s level of education
No schooling 678.7 667.1 758.2 664.1 702.2 604 663 660.1 662.7 659.9 641.7 604.7 637.3 704.7 658.6
[ISCED-P 1-2] 684.5 708.6 767.6 686.5 738.4 611.2 682.7 688 684.3 712.8 656 638.5 669.3 688.8 688.9
[ISCED-P 3] 720.5 742.3 795.8 728.2 766.5 627 718.9 737.7 738.1 764.1 670 669.3 735.2 738 728.6
[ISCED-P 4-5] 732.4 752.5 817.8 766.5 790.2 651.5 752.3 783.3 739.5 767.6 697.3 707 781.1 768.9 765.7
[ISCED-P 6] 750.7 793.4 852.1 796.1 810.5 671.2 760.8 798.1 765.7 802.4 733.3 740 809.4 795 777.5
[ISCED-P 7-8] 771.3 803.5 873.6 823.7 825.6 719.4 791.9 803.7 777.9 834.6 745 755.8 835.7 799.5 811.9

89CEPAL Review N° 128 • August 2019
Juan Antonio Dip and Luis Fernando Gamboa
ARG BRA CHL COL CRI DOM ECU GTM HND MEX NIC PRY PER URY TotalSixth grade
Mathematics
Girls 721.4 720.8 802.2 707.7 737.5 633.8 700.6 672.8 685.4 771 650.1 657.4 707.6 767.2 713.8
11 years 723.4 711.6 782.6 722.7 759.9 645.9 706.1 694.7 700.7 785.2 660.3 674.7 737 791.6 707.8
12 years 732 745 808.7 728.1 749.8 642.4 715.6 703.5 693.4 783.8 670.4 671.7 735.5 784.1 736.3
13 years 690.7 740.2 801.3 708.2 745.4 625.7 683.5 687.1 694.3 774.5 637.1 633 661.8 713.7 712.2
14–15 years 673.6 677.5 732.7 676.7 696.6 611.8 662.5 657.7 663.3 688.4 636.1 620.2 643 679.1 657.6
Rural school 700.9 681.5 762.2 682.4 707.5 620.4 691.9 671.6 666.1 732.6 640.8 633.5 644.8 750.8 677.2
Urban-public school 721.7 713.1 767.2 710.4 729.7 635.8 700.7 679.9 667.1 772.3 651 644 721 754.2 719.0
Father’s level of education
No schooling 699.6 680 744.2 665.2 701.5 618.5 661.3 657.6 649.1 707.2 631.7 624.9 639.4 686.5 663.7
[ISCED-P 1-2] 705.9 716.8 757.6 682.1 723.7 625.3 687 670.1 670.5 753.4 639.9 632.7 661.3 737.9 693.8
[ISCED-P 3] 734.5 737.5 781.7 708.9 740.9 630.5 714.7 696.1 708.1 790.7 659.8 660.5 716.3 784.1 719.8
[ISCED-P 4-5] 751 742.3 821.4 740.4 779.6 646.6 735.4 724.9 719 804.9 677.2 685 768.9 811.2 752.3
[ISCED-P 6] 753.5 793.3 853.9 775.9 781.9 660.2 752 750.4 738.6 839.2 690.5 717.2 794.8 840.4 778.4
[ISCED-P 7-8] 805.7 820.6 876.3 811.3 813.9 679.6 782.3 771.7 756.7 849.4 701.5 711.1 815.1 850.4 803.7
Mother’s level of education
No schooling 702.2 682.5 760.5 666.2 704.6 625.2 652.1 660.8 645 710.2 638.5 612.1 635 698.9 665.0
[ISCED-P 1-2] 701.6 711.9 756.4 682.7 723.9 623.8 688 672 672.1 754.8 640 638.6 671.9 727 696.0
[ISCED-P 3] 727.7 737.7 786.4 704.3 741 632.9 717.4 709.1 709 803 658.3 660.1 726 777.6 723.3
[ISCED-P 4-5] 755.6 734.9 822.1 740.1 785.7 644.3 750 744.2 725.2 807 675.8 689.1 778.4 811.9 765.0
[ISCED-P 6] 769.5 783.5 859.4 781 791 655.1 753.5 757.4 741.8 838.9 698.9 721.2 807.9 850.6 775.6
[ISCED-P 7-8] 786.8 826.7 881.4 805.8 811.4 674 782.6 744.5 754.9 855.2 717.2 720.8 821.5 852.8 794.9
Third grade
Mathematics
Girls 725.8 747.9 796.7 714.6 754.4 629.3 701.6 689.1 706.5 758.3 668 672.1 712.3 748.9 719.2
Pupil age
8 years 731.9 753.4 782.1 723.5 699.7 636.8 697.8 708.1 709.8 730 675.5 676.2 730.9 727.8 705.5
9 years 729.9 770.8 799.1 727.4 759.1 636.8 709.1 705.8 707.7 759.8 680.1 683.7 731.1 757.6 732.2
10 years 674.4 759 795.3 708.4 764.8 602 688.4 708.7 713 746.9 653.8 638 655.5 685 714.9
11 years 648.3 691.3 739.4 660.8 708.5 606.3 665.4 656.8 681.9 681.9 652.6 623.5 645.3 657.4 659.7
Rural school 704.1 707.7 761.3 675.7 724.3 610.8 687.5 675.8 681.3 717.8 656.3 649.5 647.8 726.9 679.9
Urban-public school 712.3 730.6 766.2 706.8 745.2 613.8 698.7 698.8 691.3 745.4 663.8 654.3 724.8 726.1 716.0
Father’s level of education
No schooling 679.1 694 742.9 652 707.8 608 673.6 647.5 667.1 690.4 654.8 621.6 629.2 691.7 665.7
[ISCED-P 1-2] 706.5 732.6 757.2 679.6 738.5 609.3 682.9 673.7 687.8 732.5 656.6 648.2 660.3 706.7 692.4
[ISCED-P 3] 733.4 761.1 780.9 712.1 757.7 624 711.9 722.1 721.9 770.1 661.2 667.4 720 758.9 723.2
[ISCED-P 4-5] 749.8 798.1 810.1 744.6 786.8 655.2 722.5 748.4 729.7 774.1 687.4 690.6 774 789.4 753.4
[ISCED-P 6] 767.5 820 836.7 776.3 811.2 660.4 739 779.5 763.1 810.5 712.1 726.4 790.8 815.4 775.3
[ISCED-P 7-8] 773.1 829.6 855.3 816.7 831.2 670.5 770.2 790.6 772.8 822.4 742.6 716.6 801.6 836.3 803.8
Mother’s level of education
No schooling 692.1 684.2 748.6 646.7 700.9 609.5 673.7 652.3 671.5 682.9 657.7 611.5 641 695.2 663.4
[ISCED-P 1-2] 701.9 727.6 755.1 672.2 739 608 682.4 680.7 687 734.8 654.1 651.8 669.9 699.3 693.7
[ISCED-P 3] 728.2 758.3 781.7 711.5 761.8 624 713.7 733.2 732.9 779.1 666.8 667 733.9 752.5 727.7
[ISCED-P 4-5] 745.7 775.2 810.4 747.4 789.2 638.9 725.8 770.3 740.5 782 693.7 694.3 778.6 791.3 762.5
[ISCED-P 6] 764 822.8 846 773 801.2 659.6 739.5 791.4 754.7 809.8 719 727.6 805.7 820.7 772.1
[ISCED-P 7-8] 806.4 809.7 850.1 805.4 823.5 708.3 772.9 800 765.9 820.8 733.7 731.6 817.8 823.6 801.0
Source: Prepared by the authors, based on data from the Third Regional Comparative and Explanatory Study (TERCE).
Table A1.5 (concluded)


Economic growth and financial development in Brazil: a flexible regression model approach
Filipe de Morais Cangussu Pessoa, Marcelo José Braga and Gabriel Alves de Sampaio Morais
Abstract
This paper examines the relationship between economic growth and financial development in Brazil. To this end, a data panel is constructed of all the Brazilian states for the period 1995–2014, with appropriate control variables and proxies for economic growth and financial development. The relationship is analysed for five different indicators of financial development, with a view to capturing its different aspects. Flexible regression modelling determines the direction of this relationship, characterizing it as linear or non-linear for each financial development indicator. It is concluded that the relationship between financial development and economic growth is positive and non-linear.
Keywords
Economic growth, financial matters, banking operations, investment, economic indicators, econometric models, Brazil
JEL classification
O16, C54
Authors
Filipe de Morais Cangussu Pessoa is an economist with the Administrative Office (PRAD) of the Federal Institute of Brasilia (IFB), Brazil. Email: [email protected].
Marcelo José Braga is a professor with the Department of Rural Economics of the Federal University of Viçosa, Brazil. Email: [email protected].
Gabriel Alves de Sampaio Morais is a PhD student in Applied Economics with the Department of Rural Economics of the Federal University of Viçosa, Brazil. Email: [email protected].

92 CEPAL Review N° 128 • August 2019
Economic growth and financial development in Brazil: a flexible regression model approach
I. Introduction
The relationship between financial development and economic growth has been discussed extensively in the theoretical and empirical literature.1 The theoretical basis for this relationship dates back to the work of Schumpeter (1934) and, later, McKinnon (1973) and Shaw (1973). Schumpeter (1934) stresses the importance of financial services in promoting economic growth and highlights the circumstances in which financial institutions can actively encourage innovation to promote economic growth, by identifying and financing productive investments. McKinnon (1973) and Shaw (1973) argue that financial repression by governments —through measures such as interest-rate ceilings and channelling credit to priority non-production sectors— hinders financial development, which they consider crucial to economic growth.
According to Levine (1997), the literature on endogenous growth also highlights the importance of financial development for long-term economic growth, owing to the effects of financial systems’ functions on capital accumulation and technological innovation. These functions include mobilizing savings; obtaining information about investment acquisition and resource allocation; monitoring managers and exerting corporate control; and facilitating risk management.
However, some influential economists, such as Robinson (1952) and Kuznets (1955), assert that the role of financial development has been exaggerated or that financial development is a result of the expansion of the real economy. Therefore, counter to the hypotheses of McKinnon (1973), Shaw (1973) and endogenous growth theorists, this would indicate that the causality, if it exists, runs from growth to financial development. In particular, Robinson (1952, pp. 52 and 86) argues that when income grows, the demand for financial services increases, which, in turn, has a positive effect on financial development. If all other factors remain constant, financial development follows production growth and not vice versa.
Patrick (1966) also contributed to this literature by identifying two possible patterns in the causal relationship between financial development and economic growth. The first is demand-following and assumes that the creation of modern financial institutions, their assets and liabilities, and related financial services is in response to demand for these services by investors and savers in the real economy (Patrick, 1966, p. 174). This approach assumes that the financial system can thus support and sustain the leading sectors in the process of growth. In this case, the financial system expands as a result of real economic growth. The second pattern is supply-leading, whereby the creation of financial institutions and the supply of their financial assets, liabilities, and related financial services in advance of demand for them, especially the demand of entrepreneurs in the modern, growth-inducing sectors. The supply-leading pattern has two functions: to transfer resources from traditional (non-growth) sectors to modern sectors (which generate abundant growth); and to promote and stimulate an entrepreneurial response in these modern sectors (Patrick, 1966, pp. 175-176). In addition, Gurley and Shaw (1955) and Goldsmith (1969) argue that more developed financial markets foster economic growth by mobilizing savings and facilitating investment.
Although the earlier literature underscored the importance of financial development in the economic growth process (Gurley and Shaw, 1955; Patrick, 1966; Goldsmith, 1969), there was no compelling theoretical framework until the publication of the articles by McKinnon (1973) and Shaw (1973). According to these authors, excessive government interference in the economy and central bank rules distorts financial markets, affecting decisions on savings and investments. In other words, artificially low (subsidized) interest rates depress the economy because, by not encouraging resources to be channelled into savings, they reduced investment efficiency and, ultimately, hamper economic growth in developing countries.
1 The term “financial development” refers to the ability of a financial system to reduce market frictions such as transaction and information costs, by promoting the mobilization of savings and allocation of resource, exerting corporate control and facilitating risk management and the trade of goods, services and contracts (Levine, 1997).

93CEPAL Review N° 128 • August 2019
Filipe de Morais Cangussu Pessoa, Marcelo José Braga and Gabriel Alves de Sampaio Morais
McKinnon and Shaw propose that developing countries should focus on liberalizing financial markets by deregulating interest rates and allowing financial institutions to allocate credit based on the viability and productivity of borrowers, their businesses or projects. The authors argue that market forces must determine the interest rate in the banking sector —banks generally being the only organized financial institutions in developing countries— to ensure the efficient allocation of resources for investment and, therefore, faster economic growth.
It is thought that financial liberalization or deregulation, in the form of increasing interest rates, not only results in a more efficient allocation of resources, but also to an increase in loan funds, as it encourages households to deposit their savings with bank which, in turn, leads to greater investment and economic growth.2 McKinnon and Shaw’s approach depicts a theoretical relationship between financial liberalization and economic growth and thus implicitly shows that financial development leads to economic growth, as Schumpeter (1934) does.
The emergence of endogenous growth theory in the 1980s (Romer, 1986, 1990; Lucas, 1988; Barro, 1991) revived interest in the relationship between financial development and economic growth. As a result, numerous studies attempted to explain how the functions of the financial sector can affect the rate of endogenous economic growth (Greenwood and Jovanovic, 1990; Bencivenga and Smith, 1991; Saint-Paul, 1992; King and Levine, 1993a, 1993b; Roubini and Sala-i-Martin, 1992; Pagano, 1993; Bencivenga, Smith and Starr, 1996; Blackburn and Hung, 1998; Deidda, 2006). These studies explicitly model the role of financial intermediaries —including gathering and analysing information, distributing risk and providing liquidity—, revealing that, in general, financial development promotes growth (Levine, 1997).
However, Robinson (1952), Lucas (1988), Stern (1989), Chandavarkar (1992), Stiglitz (1994) and Singh and Weisse (1998) question the importance of the financial system in promoting economic growth. In particular, Lucas (1988, p. 6) asserts that “the importance of financial matters is very badly over-stressed” and Chandavarkar (1992, p. 134) observes that none of the pioneers of development economics mention the financial system as a development factor. Lastly, Singh and Weisse (1998) highlight the risks of financial collapse and economic recession as a consequence of rapid deregulation of financial systems previously controlled through state mechanisms.
These theoretical discussions reveal that there is no consensus on the role of the financial sector in economic growth or on the direction of causality between the financial sector and economic growth. However, the debate over whether the financial sector drives economic growth or vice versa has significant political implications for developed and developing countries. As Levine (1998) observes, empirical evidence on the causal relationship between financial development and economic growth can help governments determine whether financial sector reforms should be prioritized. Proponents of the first of these two viewpoints (Schumpeter, 1934; Gurley and Shaw, 1955; Goldsmith, 1969; McKinnon, 1973; Shaw, 1973; Greenwood and Jovanovic, 1990; Bencivenga and Smith, 1991; King and Levine, 1993a, 1993b; Roubini and Sala-i-Martin, 1992; Pagano, 1993) suggest that government policies should be geared towards improving the financial system, since financial development has considerable causal effects on growth. In contrast, supporters of the second viewpoint (Robinson, 1952; Lucas, 1988; Stern, 1989; Chandavarkar, 1992; Stiglitz, 1994) argue that government policies to improve the financial system have limited effects on growth, as the impact of financial development on economic growth is insignificant (Xu, 2000, p. 332).
2 This view is not unanimous. According to Pagano (1993) and De Gregorio and Guidotti (1995), the effects of the real interest rate on savings are ambiguous. Savers can either decide to save more as real interest rates rise or simply reduce or maintain the amount they save since, in a context of higher interest rates, their savings yields would remain the same or increase, thereby freeing up resources for other purposes such as consumption.

94 CEPAL Review N° 128 • August 2019
Economic growth and financial development in Brazil: a flexible regression model approach
The divergent theoretical approaches to the relationship between finance and growth discussed above show that economists and policymakers still face a dichotomy between the supply-leading and demand-following schools of thought (Murinde, 1996; Murinde and Eng, 1994a, 1994b; Shen and others, 2001; Deidda, 2006). The contradictory results of numerous empirical studies for groups of countries and for specific countries preclude a robust conclusion and instead seem to deepen the existing dichotomy because of their ambiguity (Lawrence, 2006).
Thus, the extensive and growing body of literature on this subject can be summarized in two main trends. On one hand, some cross-cutting and panel data studies find that financial development has a positive impact on production growth, controlling for potential simultaneity biases, omitted variables and country-specific unobserved effects. On the other hand, time series studies sometimes show one-way causality running from financial development to economic growth, sometimes two-way causality and sometimes reverse causality.
Overall, the vast body of literature on the subject indicates that country-specific studies must be conducted to better understand the causal relationship between financial development and economic growth, using a diversified set of financial measures and credit policies and bearing in mind that the institutional, economic and social specificities of each country greatly influence the relationship.3 As Crocco, Santos and Amaral (2009) note, little attention has been paid to studying the regional aspects of this relationship.
Empirical evidence from Brazil on the relationship between financial system development and economic growth can be found in the studies by Arraes and Teles (2000), Monte and Távora Júnior (2000), Matos (2002), Marques Jr. and Porto Jr. (2004), Rocha and Nakane (2007) and Missio, Jayme Jr. and Oliveira (2010). In general, the results of these studies reveal a positive one-way relationship between financial development and economic growth. In other words, the data support the hypothesis that the financial system induces growth in the Brazilian economy, satisfactorily resolving the dichotomy in international literature.
One aspect that is not addressed in the first studies on the impact of financial development on economic growth in Brazil is that all the aforementioned works assume a linear relationship between financial development and economic growth. However, the traditional linear specification between finance and growth implicitly assumes that this relationship remains constant at different levels of financial development. This presupposition ignores the fact that financial development entails dynamic change. As countries grow, their financial sector develops and even their financial structure can change. Patrick (1966) emphasizes in his theoretical framework that, at certain stages, economic growth is beneficial to financial development. Bencivenga, Smith and Starr (1995) maintain that, depending on the level of financial liquidity, reducing transaction costs may encourage, stunt or have no impact on economic growth. It is therefore essential to bear in mind that the roles played by the financial sector in the economy may vary according to the sector’s activity and economic growth.
More recent studies have questioned the assumption of linearity and suggested that the relationship between financial development and economic growth is non-linear. These studies examine the existence of a curb on the finance-growth relationship, by applying either an exogenous threshold on an ad hoc basis, as in Rioja and Valev (2004a, 2004b), or an endogenous threshold technique, as in Deidda and Fattouh (2002).4
3 From 1965 onwards, Brazil adopted several credit policies to promote development, in conjunction with development banks. For more details, see Morais (2008) and Cintra (2009).
4 An exogenous threshold is identified through sample distribution analysis using an ex ante criterion followed by the application of the econometric model. In the case of Rioja and Valev (2004a, 2004b), the countries in the study were divided into three groups according to income level and the econometric model was then applied, including dummy variables to capture the effect of that criterion. In contrast, an endogenous threshold is one that is determined by the econometric model on the basis of statistical criteria. Thus, in Deidda and Fattouh (2002) the threshold is defined by an indicator function based on a variable that subdivides the sample. The existence of the threshold is verified through a statistical Lagrange multiplier test.

95CEPAL Review N° 128 • August 2019
Filipe de Morais Cangussu Pessoa, Marcelo José Braga and Gabriel Alves de Sampaio Morais
The theoretical model of Hung (2009) demonstrates that financial development is capable of making loans viable for consumption and investment purposes. While investment loans promote economic growth, consumer loans have the opposite effect. Consequently, the effect of financial development on economic growth depends on the relative magnitude of these two different channels. The main result of the model reveals that the initial level of financial development plays a key role in determining the relative magnitudes of the two channels that affect economic growth, generating non-linear relationships between financial development and economic growth.
In the specific case of Brazil, the regional inequalities argument can be extended to its financial sector: as the level of financial development in Brazil varies from state to state, the effects on economic growth are different (non-linear relationship between financial development and economic growth). Ultimately, this would indicate which levels of financial development are linked to the greatest benefits in terms of economic growth.
However extensive, the aforementioned literature has significant limitations. Firstly, these studies ignore the fact that the relationship between growth and financial development changes according to the level of financial development (Hung, 2009) and the level of national economic development (Deidda and Fattouh, 2002). Secondly, studies that adopt non-linear modelling by applying quadratic methods or thresholds may ignore other possible non-linear relationships between finance and growth. For example, an asymmetric relationship between finance and growth may suggest that a well-developed financial system generates more economic growth in less developed countries or vice versa (Shen and others, 2011).
For this reason, the flexible regression model proposed by Hamilton (2001) is used in this study. The flexible regression model can be considered to be exploratory data analysis to find the functional form that best represents the inference about the conditional expectation function, on the basis of observed data. It therefore has the following advantages over the aforementioned methods: (i) it allows for testing of non-linearity; (ii) it identifies which variable contributes to the non-linearity; (iii) it determines the form of the relationship between the dependent variable and the conditional expectation function; and (iv) it does not impose an ex ante functional form: instead, the functional form is the result of a stochastic process.
A second limitation is that there is still little research, in the case of Brazil, that takes into account the regional angle of the relationship among the variables in question.5 The regional angle refers to the impact of the functioning of the financial system on economic growth in territorial subdivisions of Brazil (such as regions, states and municipalities). This is important because there are deep regional inequalities within Brazil, as is well known.
This paper therefore seeks to develop these two approaches. This article is divided into four sections, including this introduction. The methodology for addressing non-linearity between the dependent variable and the independent variables is set out in section II. The procedures adopted for empirical analysis and the data used are described in section III and the results obtained are presented and examined. The conclusions are outlined in section IV.
5 The studies by Rocha and Nakane (2007) and Missio, Jayme Jr. and Oliveira (2010) did adopt this approach.
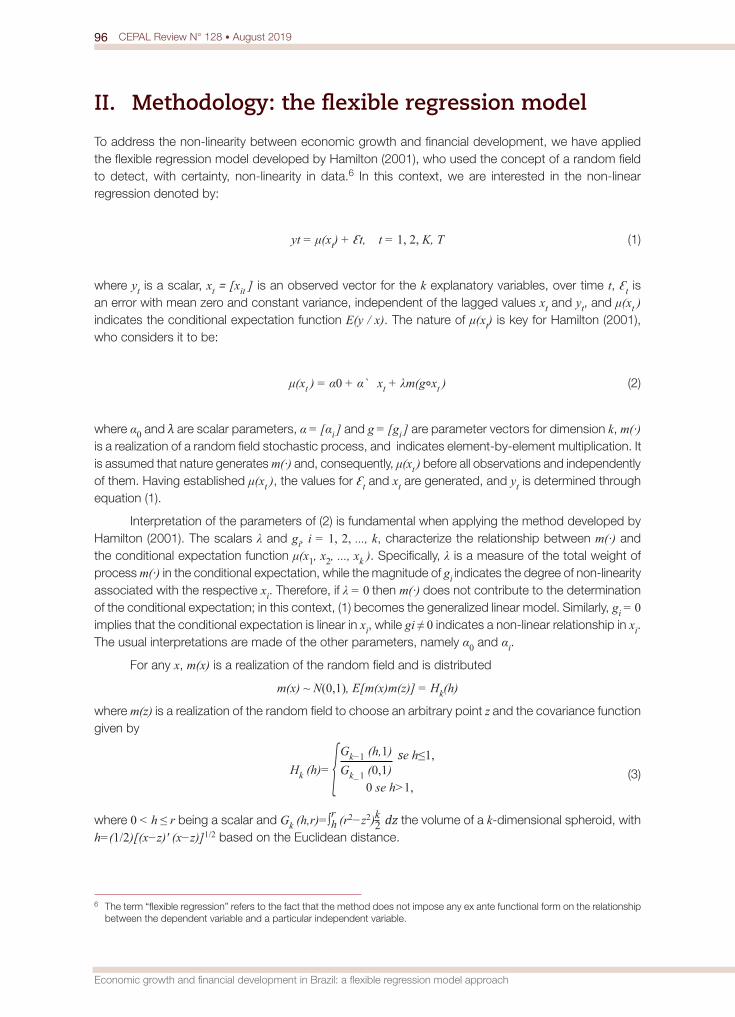
96 CEPAL Review N° 128 • August 2019
Economic growth and financial development in Brazil: a flexible regression model approach
II. Methodology: the flexible regression model
To address the non-linearity between economic growth and financial development, we have applied the flexible regression model developed by Hamilton (2001), who used the concept of a random field to detect, with certainty, non-linearity in data.6 In this context, we are interested in the non-linear regression denoted by:
yt = μ(xt) + Ɛt, t = 1, 2, K, T (1)
where yt is a scalar, xt = [xit ] is an observed vector for the k explanatory variables, over time t, Ɛt is an error with mean zero and constant variance, independent of the lagged values xt and yt, and μ(xt ) indicates the conditional expectation function E(y / x). The nature of μ(xt) is key for Hamilton (2001), who considers it to be:
μ(xt ) = α0 + α` xt + λm(g∘xt ) (2)
where α0 and λ are scalar parameters, α = [αi ] and g = [gi ] are parameter vectors for dimension k, m(·) is a realization of a random field stochastic process, and indicates element-by-element multiplication. It is assumed that nature generates m(·) and, consequently, μ(xt ) before all observations and independently of them. Having established μ(xt ), the values for Ɛt and xt are generated, and yt is determined through equation (1).
Interpretation of the parameters of (2) is fundamental when applying the method developed by Hamilton (2001). The scalars λ and gi, i = 1, 2, ..., k, characterize the relationship between m(·) and the conditional expectation function μ(x1, x2, ..., xk ). Specifically, λ is a measure of the total weight of process m(·) in the conditional expectation, while the magnitude of gi indicates the degree of non-linearity associated with the respective xi. Therefore, if λ = 0 then m(·) does not contribute to the determination of the conditional expectation; in this context, (1) becomes the generalized linear model. Similarly, gi = 0 implies that the conditional expectation is linear in xi, while gi ≠ 0 indicates a non-linear relationship in xi. The usual interpretations are made of the other parameters, namely α0 and αi.
For any x, m(x) is a realization of the random field and is distributed
m(x) ~ N(0,1), E[m(x)m(z)] = Hk(h)
where m(z) is a realization of the random field to choose an arbitrary point z and the covariance function given by
Hk (h)= Gk−1 (h,1)Gk−1 (0,1)
se h≤1,
0 se h>1, (3)
where 0 < h ≤ r being a scalar and Gk (h,r)=∫rh (r2−z2)k2 dz the volume of a k-dimensional spheroid, with h=(1/2)[(x−z)' (x−z)]1/2 based on the Euclidean distance.
6 The term “flexible regression” refers to the fact that the method does not impose any ex ante functional form on the relationship between the dependent variable and a particular independent variable.

97CEPAL Review N° 128 • August 2019
Filipe de Morais Cangussu Pessoa, Marcelo José Braga and Gabriel Alves de Sampaio Morais
1. Econometric procedures
Neither the conditional function μ(xt ) nor the parameter vector υ = (α0,α',σ,g',λ)' offer any inference, as m(·) is latent. Hamilton proposes representing equations (1) and (2) in the form of generalized least squares (GLS) to enable division of the unobserved part m(x) into residuals. Hamilton thus reformulated the model as:
y=Xβ+u,
where
y =
y1y2MyT
x=
1 x11 x2M M1 xT
β=[α0 α' ] u=
λm(g o x1)+ε1λm(g o x2)+ε2 Mλm(g o xT)+εT
Assuming Ɛt is normal, and based on (1), (2) and (3) the result is
Y ~(Xβ,C+σ2 IT ), (4)
where Y is a T-dimensional vector of observations of the dependent variable in (1), X is a T x (k+1) observation matrix of the K explanatory variables and a column of ones associated with the intercept, β=[α0 α']' is the parameter vector of dimension (k+1) of the linear component of the conditional expectation, C=[λ2 Hk (hts )] is a variance-covariance matrix of dimension T x T whose typical element is given by λ2 Covk (m(g⸰xt ), m(g⸰xs )) and hts is half the distance between g⸰xt and g⸰xs. The log likelihood function associated with (4) is given by:
ln f (Y ; β,g,λ,σ2)=– T2 ln (2π)– 12 ln|C+σ2 IT |– 12 (Y–Xβ)' (C+σ2 IT)–1 (Y–Xβ) (5)
Hamilton suggests using the maximum likelihood estimate (MLE) with a recursive formulation to obtain the parameters of υ. However, to simplify the numerical optimization process, (5) can be rewritten. Conditional on an initial set of parameters, namely λ and g, defining ζ=λ/σ, ψ=[β' σ2]', as the (k + 2) dimensional vector of parameters for the linear part of the model, θ=[g',ζ ]' as (k + 1) dimensional vector of the non-linear component and W(X;θ)=ζ 2 C*+IT, where C*=λ–2C, the right-hand side (1.9) can be rewritten as:
– T2 ln(2π) – T2 lnσ2 – 12 ln|W(X;θ)| – 12σ 2 (Y – Xβ)' W(X;θ)–1 (Y – Xβ) (6)
The parameters of the linear part, that is to say β and σ2, which maximize (6) for a given θ can be calculated analytically as:
~β (θ)=[X'W(X ;θ)–1X]–1 [X'W(X ;θ )–1 y] (7)
~σ2 (θ)=[y – X
~β (θ)]' W(X ; θ)–1 [y – X~β (θ)]
T (8)

98 CEPAL Review N° 128 • August 2019
Economic growth and financial development in Brazil: a flexible regression model approach
It is therefore possible to write the concentrated log likelihood function as:
η(θ; y; X) = – T2 ln(2π) – T2 ln~σ2 (θ) – 12 ln|W(X ; θ)| – T2 (9)
Numerical optimization of (9) provides the maximum likelihood estimate of the parameters
{^ ^ ^ ^ ^α0, α',σ2, g', ζ'}.
2. Non-linearity test
Given the structure of equations (1) and (2), linearity can be tested using λ or the vector g, two parameters that capture linearity and curvature, respectively. If the null hypothesis H0 : λ2= 0 is not rejected, the non-linear component λm (g ∘ xt ) in equation (2) disappears. Furthermore, if the null hypothesis H0 : g = 0 is rejected, this indicates that the variable in question contributes non-linear proprieties to the model. Hamilton (2001) proposes a λ-test, called λH
E (g), based on the Euclidean distance measure and a Hessian information matrix. The Lagrange multiplier (LM) statistic for the non-linearity test can be calculated as:
λEH (g) =
û'HTû – õ2T tr(MTHTMT)
(2tr{[MTHTMT − (T−k−1)−1MTtr(MTHTMT)]2})2T
~χ2(1)
(10)
where M=IT – X(X' X)–1 X'.
However, the proposed λHE (g) statistic poses a problem, since the parameter vector g is
not identified in the null hypothesis. To this end, Dahl and González-Rivera (2003) propose various statistical tests for non-linearity, which circumvent the problem of unidentified parameters in the null hypothesis of linearity and that are robust to the specification of the covariance function that defines the random field.
To resolve the problem of the unidentified parameter vector g, Dahl and González-Rivera (2003) proposed two versions of the modified λ-test, based on the Minkowski distance measure. One way of avoiding the identification problem is to fix g. This method assumes full knowledge of the covariance matrix, H(g), associated with the random field. This version of the statistic λE
OP, which is based on the known covariance function, can be calculated as follows:
λEOP (g)= T
2
2k' ~ ~ ~ ~x(x'x)x'k
k'k ~χ2(1) (11)
where k = vec(IT −uu' / σ2).
Another approach that seeks to resolve the identification problem is to use the Taylor expansion method and auxiliary regressions to approximate the unknown covariance matrix. This version of the λ-test, denoted as λA
OP , is not dependent on the unidentified parameters of g. The statistic λAOP, which
is based on the unknown covariance function, can be calculated as follows:
λAOP (g)=T2 R2 ~χ2(q*) (12)
where q*=1+∑2k+2j=1 ( k+j−1
k−1 ) and k indicate the number of non-linear variables.
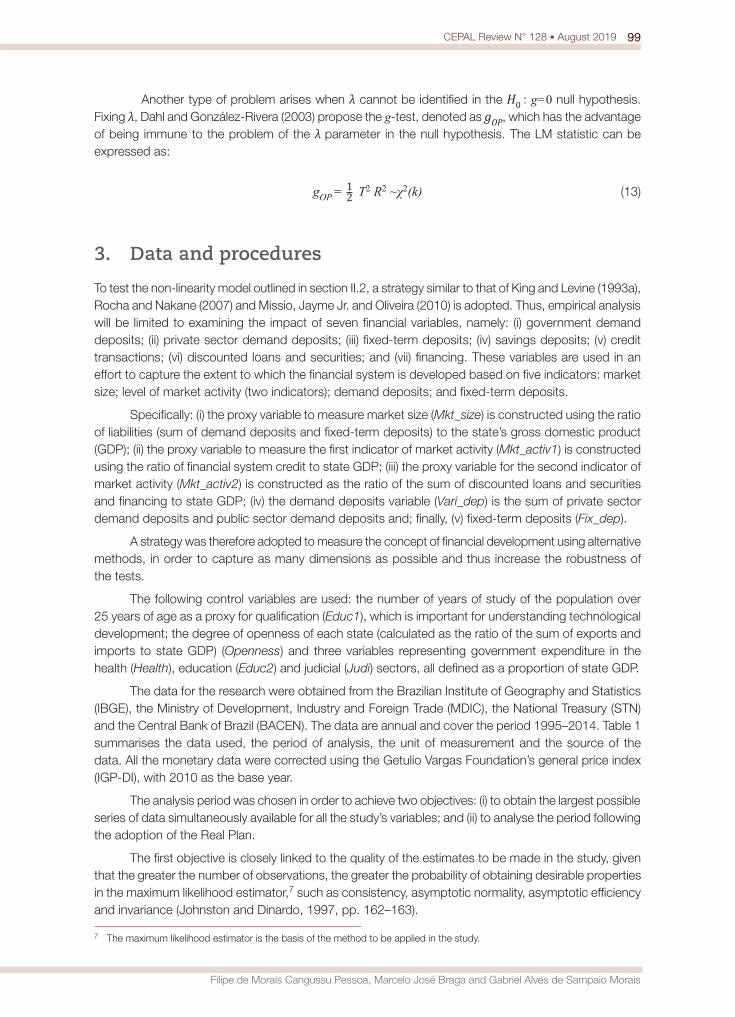
99CEPAL Review N° 128 • August 2019
Filipe de Morais Cangussu Pessoa, Marcelo José Braga and Gabriel Alves de Sampaio Morais
Another type of problem arises when λ cannot be identified in the H0 : g=0 null hypothesis. Fixing λ, Dahl and González-Rivera (2003) propose the g-test, denoted as gOP, which has the advantage of being immune to the problem of the λ parameter in the null hypothesis. The LM statistic can be expressed as:
gOP = 12 T2 R2 ~χ2(k) (13)
3. Data and procedures
To test the non-linearity model outlined in section II.2, a strategy similar to that of King and Levine (1993a), Rocha and Nakane (2007) and Missio, Jayme Jr. and Oliveira (2010) is adopted. Thus, empirical analysis will be limited to examining the impact of seven financial variables, namely: (i) government demand deposits; (ii) private sector demand deposits; (iii) fixed-term deposits; (iv) savings deposits; (v) credit transactions; (vi) discounted loans and securities; and (vii) financing. These variables are used in an effort to capture the extent to which the financial system is developed based on five indicators: market size; level of market activity (two indicators); demand deposits; and fixed-term deposits.
Specifically: (i) the proxy variable to measure market size (Mkt_size) is constructed using the ratio of liabilities (sum of demand deposits and fixed-term deposits) to the state’s gross domestic product (GDP); (ii) the proxy variable to measure the first indicator of market activity (Mkt_activ1) is constructed using the ratio of financial system credit to state GDP; (iii) the proxy variable for the second indicator of market activity (Mkt_activ2) is constructed as the ratio of the sum of discounted loans and securities and financing to state GDP; (iv) the demand deposits variable (Vari_dep) is the sum of private sector demand deposits and public sector demand deposits and; finally, (v) fixed-term deposits (Fix_dep).
A strategy was therefore adopted to measure the concept of financial development using alternative methods, in order to capture as many dimensions as possible and thus increase the robustness of the tests.
The following control variables are used: the number of years of study of the population over 25 years of age as a proxy for qualification (Educ1), which is important for understanding technological development; the degree of openness of each state (calculated as the ratio of the sum of exports and imports to state GDP) (Openness) and three variables representing government expenditure in the health (Health), education (Educ2) and judicial (Judi) sectors, all defined as a proportion of state GDP.
The data for the research were obtained from the Brazilian Institute of Geography and Statistics (IBGE), the Ministry of Development, Industry and Foreign Trade (MDIC), the National Treasury (STN) and the Central Bank of Brazil (BACEN). The data are annual and cover the period 1995–2014. Table 1 summarises the data used, the period of analysis, the unit of measurement and the source of the data. All the monetary data were corrected using the Getulio Vargas Foundation’s general price index (IGP-DI), with 2010 as the base year.
The analysis period was chosen in order to achieve two objectives: (i) to obtain the largest possible series of data simultaneously available for all the study’s variables; and (ii) to analyse the period following the adoption of the Real Plan.
The first objective is closely linked to the quality of the estimates to be made in the study, given that the greater the number of observations, the greater the probability of obtaining desirable properties in the maximum likelihood estimator,7 such as consistency, asymptotic normality, asymptotic efficiency and invariance (Johnston and Dinardo, 1997, pp. 162–163).
7 The maximum likelihood estimator is the basis of the method to be applied in the study.

100 CEPAL Review N° 128 • August 2019
Economic growth and financial development in Brazil: a flexible regression model approach
Table 1 Description of data used to verify non-linearity between economic growth
and financial development
Data Period Unit of measurement Source
Government demand deposits 1995–2014 R$ 1 000 from 2010 BACENa
Private sector demand deposits 1995–2014 R$ 1 000 from 2010 BACEN
Fixed-term deposits 1995–2014 R$ 1 000 from 2010 BACEN
Savings deposits 1995–2014 R$ 1 000 from 2010 BACEN
Credit transactions 1995–2014 R$ 1 000 from 2010 BACEN
Discounted loans and securities 1995–2014 R$ 1 000 from 2010 BACEN
Financing 1995–2014 R$ 1 000 from 2010 BACEN
State– GDP per capita 1995–2014 R$ 1 000 from 2010 IBGEb
State GDP 1995–2014 R$ 1 000 from 2010 IBGE
Number of years of study of the population aged over 25 1995–2014 Number of years of study (average) IBGE
State exports 1995–2014 R$ 1 000 from 2010 MDICc
State imports 1995–2014 R$ 1 000 from 2010 MDIC
Government expenditure on health 1995–2014 R$ 1 000 from 2010 STNd
Government expenditure on education 1995–2014 R$ 1 000 from 2010 STN
Government expenditure on the judiciary 1995–2014 R$ 1 000 from 2010 STN
Source: Prepared by the authors. a Central Bank of Brazil.b Brazilian Geographical and Statistical Institute.c Ministry of Development, Industry and Foreign Trade.d National Treasury.
Given that the central bank only began to publish agency balance sheets by municipality and state in 1995, in its Bank Statistics by Municipality (Estatística Bancária Por Município, ESTBAN), that year was chosen for the beginning of the analysis period.8 The end of the analysis period was set as 2014, in line with the period in which data are available.
The second objective is to frame the study in a period that, according to Modenesi (2010), constitutes one of the most significant in contemporary Brazilian economic history, following five consecutive failed attempts to combat inflation that determined the direction of the country’s economic policy for a decade, namely: the Cruzado Plan (1986), the Bresser Plan (1987), the Summer Plan (1989), the Collor Plan I (1990) and the Collor Plan II (1991). It was not until 1994 that the Real Plan interrupted the long process of chronic high inflation, which had intensified from the mid-1980s onwards.
This context is fundamental to studying the effects of financial development on economic growth, since the economic stability provided by the Real Plan extended the planning horizons of economic agents, by stimulating demand for financial products to make long-term investments held to maturity (Stulz, 2000).
In addition, the work of Rousseau and Wachtel (2001), which analyses the relationship between financial development and economic growth for a sample of 84 countries in the period 1960–1995, shows that there is a 13% to 25% threshold for the inflation rate, below which financial development can induce economic growth. When the inflation rate exceeds this threshold, financial development does not appear to stimulate economic growth. In contrast, this relationship becomes significantly positive when the inflation rate is between 6% and 8%.
8 Between 1995 and 1999, the Central Bank of Brazil released the December balance data of each year. Monthly balances (January to December) have only been published since 2000.

101CEPAL Review N° 128 • August 2019
Filipe de Morais Cangussu Pessoa, Marcelo José Braga and Gabriel Alves de Sampaio Morais
Taking into account the above, and with a view to conducting an initial investigation into the relationship between economic growth and financial development and comparing estimates with the flexible regression model, the following linear panel models are estimated:
ln(gdppercapitait )=αi+β1 ln(Vari_depit )+β2 ln(Openessit )+β3 ln(Educ1it )+β4 ln(Educ2it )+ β5 ln(Healthit )+β6 ln(Judiit )+εit
(14)
ln(gdppercapitait )=αi+β1 ln(Fix_depit )+β2 ln(Openessit )+β3 ln(Educ1it )+β4 ln(Educ2it )+ β5 ln(Healthit )+β6 ln(Judiit )+εit
(15)
ln(gdppercapitait )=αi+β1 ln(Mkt_sizeit )+β2 ln(Openessit )+β3 ln(Educ1it )+β4 ln(Educ2it )+ β5 ln(Healthit )+β6 ln(Judiit)+εit
(16)
ln(gdppercapitait )=αi+β1 ln(Mkt_activ1it )+β2 ln(Openessit )+β3 ln(Educ1it )+β4 ln(Educ2it )+ β5 ln(Healthit )+β6 ln(Judiit )+εit
(17)
ln(gdppercapitait )=αi+β1 ln(Mkt_activ2it )+β2 ln(Openessit )+β3 ln(Educ1it )+β4 ln(Educ2it )+ β5 ln(Healthit )+β6 ln(Judiit )+εit
(18)
where αi represents the specific constant for each state, capturing the effect of the omitted variables in the model; β1, i = 1, ...,6, are the angular coefficients of the linear part of the model and εit are the random error terms.
To further this research and analyse the relationship between economic growth and financial development, and to test whether that relationship is, in fact, linear, the following flexible regression models are estimated:
ln(gdppercapitait )=αi+β1 ln(Vari_depit )+β2 ln(Openessit )+β3 ln(Educ1it )+ β4 ln(Educ2it )+β5 ln(Healthit )+β6 ln(Judiit )+^
σ [^ζ m(g1 ln(Vari_depit ))]+εit
(19)
ln(gdppercapitait )=αi+β1 ln(Fix_depit )+β2 ln(Openessit )+β3 ln(Educ1it )+β4 ln(Educ2it )+β5 ln(Healthit )+β6 ln(Judiit )+^
σ [^ζ m(g1 ln(Vari_depit ))]+εit
(20)
ln(gdppercapitait )=αi+β1 ln(Mkt_sizeit )+β2 ln(Openessit )+β3 ln(Educ1it )+β4 ln(Educ2it )+β5 ln(Healthit )+β6 ln(Judiit )+^
σ [^ζ m(g1 ln(Mkt_sizeit ))]+εit
(21)
ln(gdppercapitait )=αi+β1 ln(Mkt_activ1it )+β2 ln(Openessit )+β3 ln(Educ1it )+β4 ln(Educ2it )+β5 ln(Healthit )+β6 ln(Judiit )+^
σ [^ζ m(g1 ln(Activ_Mercit ))]+εit
(22)
ln(gdppercapitait )=αi+β1 ln(Mkt_activ2it )+β2 ln(Openessit )+β3 ln(Educ1it )+β4 ln(Educ2it )+β5 ln(Healthit )+β6 ln(Judiit )+^
σ [^ζ m(g1 ln(Mkt_activit ))]+εit
(23)
where αi represents the specific constant for each state, capturing the effect of the omitted variables on the model, β1, i = 1, ...,6, are the angular coefficients of the linear part of the model, εit are the random error terms, ^λ =^^
σζ and g1 characterize the relationship between the random field and the conditional expectation function μ(xt ).

102 CEPAL Review N° 128 • August 2019
Economic growth and financial development in Brazil: a flexible regression model approach
III. Results and analysis
Map 1 provides a spatial context for the five financial development indicators used, by presenting the average values of the indicators over the 1995–2014 period, in four quartiles, for all Brazilian states.
Map 1 Brazil: geographical distribution by quartile of five financial development indicators by state
25%
50%
75%
100%
25%
50%
75%
100%
25%
50%
75%
100%
25%50%
75%
100%
0%
25%50%75%
100%
A. Demand deposits B. Fixed-term deposits
C. Market size D. Market activity 1
E. Market activity 2
0% 0%
0%
0%
Source: Prepared by the authors.
Analysis of map 1 shows that, for indicators Vari_dep and Fix_dep (see maps 1A and 1B), the states with the highest level of financial development are mainly in the South and South-East Regions. In the case of the Mkt_size indicator, the states with the greatest financial development are in the

103CEPAL Review N° 128 • August 2019
Filipe de Morais Cangussu Pessoa, Marcelo José Braga and Gabriel Alves de Sampaio Morais
South, South-East and North-East Regions. Specifically, the states of Bahía, Sergipe, Pernambuco and Rio Grande do Norte, which are all in the North-East Region.
Lastly, in the case of the indicators Mkt_activ1 and Mkt_activ2, the regions with the highest levels of financial development are the South, South-East and Central-West Regions. In short, irrespective of the financial development indicator used, the states of the South and South-East Regions generally have the highest levels of financial development.
Table 2 presents the results of models (14) to (18) and of the Chow and Hausman tests to indicate whether the panel data should be viewed as pooled data against fixed effects or fixed effects against random effects.
Table 2 Linear panel models with fixed effects for five financial development indicators
Variables (1) (2) (3) (4) (5)
Constant 7.5479***(0.0679)[0.0000]
7.6581***(0.0621)[0.0000]
8.2716***(0.0794)[0.0000]
8.2082***(0.0760)[0.0000]
8.3855***(0.0796)[0.0000]
Vari_dep 0.0523***(0.0043)[0.0000]
- - - -
Fix_dep-
0.0472***(0.0031)[0.0000]
- - -
Mkt_size- -
0.0457***(0.0040)[0.0000]
- -
Mkt_activ1- - -
0.0378***(0.0033)[0.0000]
-
Mkt_activ2- - - -
0.0448***(0.0035)[0.0000]
Openness 0.0069NS
(0.0063)[0.2760]
0.0143**(0.0059)[0.0160]
0.0119*(0.0064)[0.0620]
0.0164**(0.0064)[0.0110]
0.0145**(0.0062)[0.0200]
Educ1 0.6098***(0.0379)[0.0000]
0.5776***(0.0349)[0.0000]
0.6854***(0.0353)[0.0000]
0.7123***(0.0337)[0.0000]
0.6332***(0.0354)[0.0000]
Educ2 -0.0477***(0.0104)[0.0000]
-0.05019***(0.0099)[0.0000]
-0.0512***(0.0106)[0.0000]
-0.0561***(0.0106)[0.0000]
-0.0476***(0.0103)[0.0000]
Health 0.0374***(0.0090)[0.0000]
0.0355***(0.0085)[0.0000]
0.0369***(0.0092)[0.0000]
0.0447***(0.0093)[0.0000]
0.0363***(0.0089)[0.0000]
Judi -0.0054**(0.0023)[0.0200]
-0.0058***(0.0022)[0.0070]
-0.0052**(0.0023)[0.0270]
-0.0059**(0.0023)[0.0120]
-0.0060***(0.0023)[0.0090]
Chow test [0.0000]*** [0.0000]*** [0.0000]*** [0.0000]*** [0.0000]***
Hausman test [0.0000]*** [0.0000]*** [0.0000]*** [0.0000]*** [0.0000]***
Observations 540 540 540 540 540
R2 0.69 0.70 0.68 0.68 0.63
Source: Prepared by the authors.Note: *** Significant at 1%, ** significant at 5% and NS not significant. The values in parentheses and square brackets correspond
to the standard deviation and the p-value, respectively.
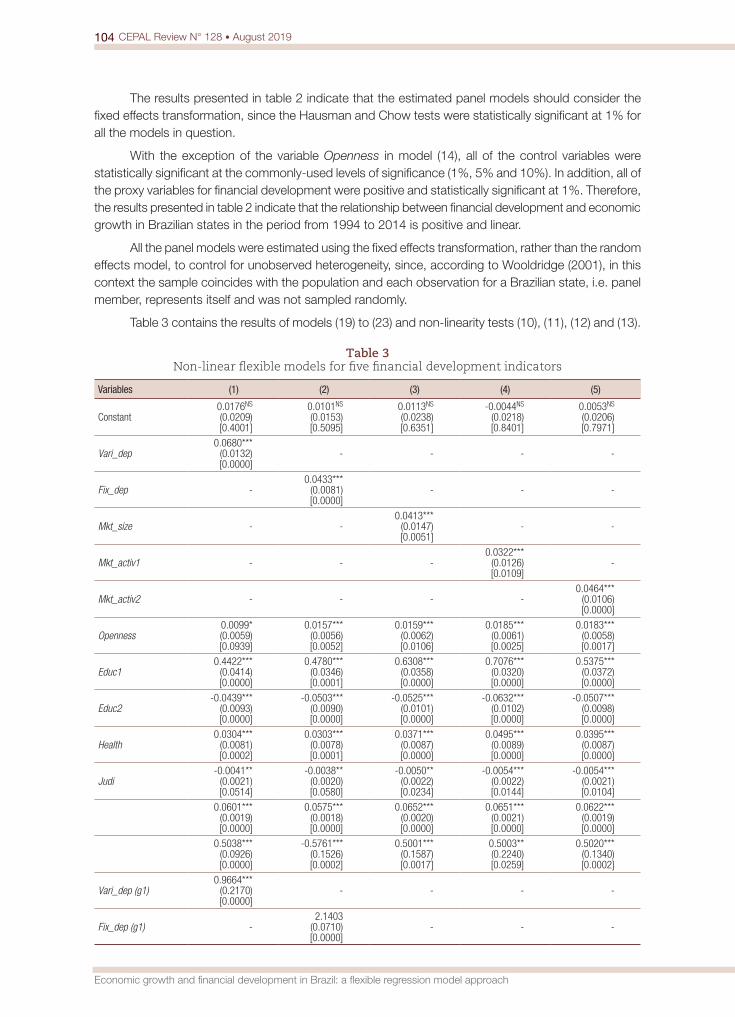
104 CEPAL Review N° 128 • August 2019
Economic growth and financial development in Brazil: a flexible regression model approach
The results presented in table 2 indicate that the estimated panel models should consider the fixed effects transformation, since the Hausman and Chow tests were statistically significant at 1% for all the models in question.
With the exception of the variable Openness in model (14), all of the control variables were statistically significant at the commonly-used levels of significance (1%, 5% and 10%). In addition, all of the proxy variables for financial development were positive and statistically significant at 1%. Therefore, the results presented in table 2 indicate that the relationship between financial development and economic growth in Brazilian states in the period from 1994 to 2014 is positive and linear.
All the panel models were estimated using the fixed effects transformation, rather than the random effects model, to control for unobserved heterogeneity, since, according to Wooldridge (2001), in this context the sample coincides with the population and each observation for a Brazilian state, i.e. panel member, represents itself and was not sampled randomly.
Table 3 contains the results of models (19) to (23) and non-linearity tests (10), (11), (12) and (13).
Table 3 Non-linear flexible models for five financial development indicators
Variables (1) (2) (3) (4) (5)
Constant0.0176NS
(0.0209)[0.4001]
0.0101NS
(0.0153)[0.5095]
0.0113NS
(0.0238)[0.6351]
-0.0044NS
(0.0218)[0.8401]
0.0053NS
(0.0206)[0.7971]
Vari_dep0.0680***
(0.0132)[0.0000]
- - - -
Fix_dep -0.0433***
(0.0081)[0.0000]
- - -
Mkt_size - -0.0413***
(0.0147)[0.0051]
- -
Mkt_activ1 - - -0.0322***
(0.0126)[0.0109]
-
Mkt_activ2 - - - -0.0464***
(0.0106)[0.0000]
Openness0.0099*(0.0059)[0.0939]
0.0157***(0.0056)[0.0052]
0.0159***(0.0062)[0.0106]
0.0185***(0.0061)[0.0025]
0.0183***(0.0058)[0.0017]
Educ10.4422***
(0.0414)[0.0000]
0.4780***(0.0346)[0.0001]
0.6308***(0.0358)[0.0000]
0.7076***(0.0320)[0.0000]
0.5375***(0.0372)[0.0000]
Educ2-0.0439***
(0.0093)[0.0000]
-0.0503***(0.0090)[0.0000]
-0.0525***(0.0101)[0.0000]
-0.0632***(0.0102)[0.0000]
-0.0507***(0.0098)[0.0000]
Health0.0304***
(0.0081)[0.0002]
0.0303***(0.0078)[0.0001]
0.0371***(0.0087)[0.0000]
0.0495***(0.0089)[0.0000]
0.0395***(0.0087)[0.0000]
Judi-0.0041**
(0.0021)[0.0514]
-0.0038**(0.0020)[0.0580]
-0.0050**(0.0022)[0.0234]
-0.0054***(0.0022)[0.0144]
-0.0054***(0.0021)[0.0104]
0.0601***(0.0019)[0.0000]
0.0575***(0.0018)[0.0000]
0.0652***(0.0020)[0.0000]
0.0651***(0.0021)[0.0000]
0.0622*** (0.0019)[0.0000]
0.5038***(0.0926)[0.0000]
-0.5761***(0.1526)[0.0002]
0.5001***(0.1587)[0.0017]
0.5003**(0.2240)[0.0259]
0.5020***(0.1340)[0.0002]
Vari_dep (g1)0.9664***
(0.2170)[0.0000]
- - - -
Fix_dep (g1) -2.1403
(0.0710)[0.0000]
- - -

105CEPAL Review N° 128 • August 2019
Filipe de Morais Cangussu Pessoa, Marcelo José Braga and Gabriel Alves de Sampaio Morais
Variables (1) (2) (3) (4) (5)
Mkt_size (g1) - -1.0182***
(0.0081)[0.0000]
- -
Mkt_activ1 (g1) - - -0.9025**(0.0169)[0.0000]
-
Mkt_activ2 (g1) - - - -0.8470***
(0.0144)[0.0000]
Log L 743.65900 759.17876 699.53436 699.81553 724.35636
λEH -test [0.001] *** [0.001] *** [0.001] *** [0.011]*** [0.001] ***
λEOP -test [0.001] *** [0.001] *** [0.001] *** [0.017]*** [0.001] ***
λAOP -test [0.001] *** [0.001] *** [0.001] *** [0.900]NS [0.001] ***
gOP -test [0.001] *** [0.001] *** [0.001] *** [0.982]NS [0.001] ***
Source: Prepared by the authors.Note: *** Significant at 1%, ** significant at 5% and NS not significant. The values in parentheses and square brackets correspond
to the standard deviation and the p-value, respectively.
In models (1), (2), (3), (4) and (5) of table 3, the financial development indicators for which are, respectively, Vari_dep, Fix_dep, Mkt_size, Mkt_activ1 and Mkt_activ2, all variables were statistically significant at the commonly-used levels of significance (1%, 5% and 10%).
For the control variables, these models indicate a direct relationship between the explanatory variables Openness, Educ1 and Health and the dependent variable of state GDP per capita. In the case of the control variables Educ2 and Judi, the opposite occurs.
For the financial development indicators, the five models presented a positive relationship with state GDP per capita, as evidenced by the signs of the coefficients of the linear part of Vari_dep, Fix_dep, Mkt_size, Mkt_activ1 and Mkt_activ2.
The parameters σ, ζ and g1, which capture the part of the non-linear relationship between the financial development indicators and state GDP per capita, were statistically significant at 1% and 5% (in the case of model (4) for the ζ coefficient).
Given that the tests λEH , λE
OP , λAOP and gOP were significant at 1% for models (1), (2), (3) and (5),
it can be inferred that there is a non-linear relationship between Vari_dep, Fix_dep, Mkt_size and Mkt_activ2 and state GDP per capita. The λA
OP and gOP tests for model (4) are the exception, as they were not statistically significant, even at 10%. However, all of the other tests were significant at 1%.9
In light of the results presented in table 3, a researcher who had considered the results obtained in table 1 to be valid, would have been led into error, as it would be assumed that relationship between economic growth and financial development was linear, when in fact it is not for any of the five indicators analysed.
Non-linearity tests only tell part of the story, since they are tests in which the null hypothesis assumes a linear relationship between the dependent variable and the independent variable being considered. Thus, rejection of the null hypothesis under these tests means that this relationship can take any form (non-linear), except linear.
Thus, one question that has not yet been answered is: what is the precise form of the relationship between the five financial development indicators and state GDP per capita? Figure 1 attempts to answer this question, by plotting state GDP per capita against the five financial development indicators.
9 As the empirical example put forward by Dahl and González-Rivera (2003) shows, when two or more tests indicate rejection of the linearity null hypothesis, the model is considered to be non-linear.
Table 3 (concluded)

106 CEPAL Review N° 128 • August 2019
Economic growth and financial development in Brazil: a flexible regression model approach
Figure 1 Non-linear relationship between per capita GDP and five financial development variables
A. Demand deposits B. Fixed-term deposits
-0.3
-0.2
-0.1
0
0.1
0.2
0.3
-3 -2 -1 0 1 2 3
GDP
per c
apita
Vari_dep
-0.2
-0.16
-0.12
-0.08
-0.04
0
0.04
0.08
0.12
0.16
-3 -2 -1 0 1 2 3
GDP
per c
apita
Fix_dep
C. Market size D. Market activity 1
E. Market activity 2
-0.16
-0.12
-0.08
-0.04
0
0.04
0.08
0.12
0.16
-2.0 -1.6 -1.2 -0.8 -0.4 0 0.4 0.8 1.2 1.6 2.0
Mkt_size
GDP
per c
apita
-0.20
-0.12
-0.04
0.04
0.12
0.20
-3 -2 -1 0 1 2 3
GDP
per c
apita
Mkt_activ
-0.25
-0.20
-0.15
-0.10
-0.05
0
0.05
0.10
0.15
0.20
-3 -2 -1 0 1 2 3
Mkt_activ 2
GDP
per c
apita
0
Source: Prepared by the authors.Note: The solid line in each graph represents the estimated conditional expectation function value of the respective financial
development variable. The dashed lines indicate 95% confidence intervals of these estimated values.

107CEPAL Review N° 128 • August 2019
Filipe de Morais Cangussu Pessoa, Marcelo José Braga and Gabriel Alves de Sampaio Morais
As described by Hamilton (2001), it is possible to calculate the value of any z of interest from the values of ϑ={β0,β1,...,β6,ζ,g1,σ}, denoted as z*. This calculation is the inference about the conditional expectation function value μ(z*) when the explanatory variables assume the value represented by z* and when the parameters assume the value estimated by the model.
Thus, figure 1A plots � [μ(Dep_Vista)|YT ] against Vari_dep, figure 1B � [μ(Fix_Dep)|YT ] against Fix_dep, figure 1C � [μ(Tam_Merc)|YT ] against Mkt_size, figure 1D � [μ(Mkt_activ1)|YT ] against Mkt_activ1 and figure 1E � [μ(Mkt_activ2)|YT ] against Mkt_activ2. The dashed lines indicate 95% confidence intervals.
As shown in figures 1A and 1B, Vari_dep begins to have significant effects on levels of state GDP per capita only once it reaches values of around -1 and, in the case of Fix_dep this occurs for values just below -1. The effect is then positive and significant up to values of 0.5. The gradient appears to even out before 0.5 for Vari_dep and 0.8 for Fix_dep, after which the effect is less significant, as evidenced by the smoother and more horizontal gradient, similar to that seen with values less than -1.
Although the Mkt_size indicator (see figure 1C) follows a similar pattern, a more pronounced oscillation is observed for values from -1.6 to -0.4. Although there are positive effects on state GDP per capita, they are less intense and are observed in a narrower band of Mkt_size, from -0.4 to 0.2.
Figure 1D shows an inverted U pattern for the relationship between Mkt_activ1 and state GDP per capita, with a positive effect from around -1 to 0. The effect then becomes negative, before turning positive again from around 0.5 onwards.
Finally, figure 1E charts a pattern that is qualitatively similar to those displayed in figures 1A, 1B and 1C. When the value of Mkt_activ2 is between -2 and -0.5, it has a positive but less significant effect on state GDP per capita. For values between -0.5 and 0.2, a positive and significant effect is shown. Above this value, the gradient is gentler but still positive, reflecting the limit to which Mkt_activ2 can affect state GDP per capita.
In short, in the general context of the Brazilian reality, it is not possible to reject the existence of a non-linear relationship between financial development and economic growth, which becomes significant at intermediate and high values of financial development. In addition, when the proxy variable Mkt_activ1 is used, financial development reaches an inflection point, after which its effect on economic growth diminishes. According to Stengos and Liang (2004), one possible explanation for this inflection point is that when market activity reaches a certain level, financial intermediaries find it more difficult to finance lucrative projects and, consequently, end up financing less profitable projects. This results in a less efficient allocation of resources, which translates into lower economic growth.
From an empirical point of view, an initial hypothesis to explain the results obtained relates to the income levels of the Brazilian states. These results are similar to those found by Rioja and Valev (2004b), which classify countries into three different groups according to income level. In regions characterized by low income levels, most of which include very poor countries, increases in the level of financial development did not have statistically significant effects on economic growth. In middle-income regions, changes in the level of financial development are clearly the most effective at producing positive impacts on economic growth. Finally, in high-income regions, additional increases in the level of financial development have a positive effect on economic growth, albeit a small one.
Jalilian and Kirkpatrick (2005) also segment the effects of financial development on economic growth, indicating that financial development generates economic growth in low-income countries, but that this is not the case in high-income countries. Chen, Wu and Wen (2013) study the relationship between financial development and economic growth in Chinese provinces and produce results opposite to those of Jalilian and Kirkpatrick (2005), namely that financial development has a marked positive effect on economic growth in high-income provinces, but a pronounced negative effect on low-income provinces. According to Xu (2000), financial development has a negative impact on economic growth in low- and middle-income countries, but this does not occur in the high-income group of countries. Masten, Coricelli and Masten (2008) obtain similar results.

108 CEPAL Review N° 128 • August 2019
Economic growth and financial development in Brazil: a flexible regression model approach
A second hypothesis is linked to the level of financial development of the Brazilian states. In this regard, Minier (2003) argues that while financial development and economic growth are positively correlated in countries with a high level of financial development, this correlation does not seem to be maintained in countries where the level of financial development is low. Rioja and Valev (2004a) also argue that the relationship between financial development and economic growth varies according to the country’s level of financial development. Specifically, the study revealed that financial development had a significant positive impact on economic growth in countries with medium and high levels of financial development, but a negligible effect in countries with low levels of financial development.
From the theoretical point of view, there are three perspectives that can explain the results. The first one of these was developed by Bencivenga, Smith and Starr (1995). According to the model developed by these authors, the transaction costs incurred in the financial intermediation process have a direct impact on economic growth. Economies with high transaction costs have at their disposal short-gestation capital production technologies. Thus, reductions in transactions costs can lead to the use of longer gestation capital production technologies that are more transaction-intensive, and to an increase in the interest rates on savings. However, such reductions do not necessarily result in a higher economic growth rate. This is because an increase in the liquidity of financial markets can cause a change in the composition of savings, which favours the holding of financial assets at the expense of the initiation of new capital investment. When this effect is large enough, improvements in the liquidity of financial markets will reduce the economic growth rate. Conversely, if sufficiently large reductions in transactions costs lead to the adoption of longer maturity capital investments of sufficiently greater productivity, then capital market improvements will enhance economic growth.
The second perspective relates to the work of Hung (2009), whose theoretical model demonstrates that financial development is capable of making loans viable for consumption and investment purposes. While investment loans promote economic growth, consumer loans have the opposite effect. Consequently, the effect of financial development on economic growth depends on the relative magnitude of these two different channels. The main result of the model reveals that the initial level of financial development plays a key role in determining the relative magnitudes of the two channels that affect economic growth, generating non-linear relationships between financial development and economic growth.
Lastly, the third aspect refers to the model of Deidda and Fattouh (2002), in which financial intermediation emerges and produces effects on economic growth only when the income of an economy reaches a certain level. According to Deidda, compared to self-financing, financial intermediaries allocate savings —net of transactions costs— to more productive investments. However, whenever firms operate a technology that is more productive and more capital-intensive than that available to households, the growth effect of financial development is ambiguous.
This result, which is in principle contradictory, can be explained by the fact that a more capital-intensive technology might pay a higher return to savers, even if the costs of financial intermediation are so high that production, and thus growth, fall relative to self-financing. Consequently, households might prefer to save through intermediaries instead of self-financing investments, even when consumption of resources by the financial sector yields a lower growth rate than would be the case in a self-financing situation.
The overlapping generations structure of the model is the key to the incentive mechanism for households. While the generation responsible for the transition enjoys a higher return on savings, the consequences of the possibly negative growth effect of financial development are felt by future generations of workers. Thus, if financial development reduces growth, these workers will receive lower incomes than they would have under self-financing.
Furthermore, whenever the process of financial development is sustainable, the credit market becomes more competitive and efficient over time and thus favours economic growth (Deidda, 2006).

109CEPAL Review N° 128 • August 2019
Filipe de Morais Cangussu Pessoa, Marcelo José Braga and Gabriel Alves de Sampaio Morais
IV. Conclusions
The relationship between financial development and economic growth has been extensively discussed in the literature, particularly as regards the supply-leading or demand-following debate. However, it is only in recent years that the supposedly linear functional form of this relationship has been questioned, with it being argued that it depends above all on a region’s level of income and of financial development.
This study therefore attempts to analyse the functional form of the relationship in the case of Brazil, through a panel of the country’s 27 states covering the period from 1995 to 2014. For this purpose, the flexible regression model developed by Hamilton (2001) was applied. This model consists of a parametric approach in which a functional form is not applied, a priori, to the relationship between the explanatory variable and the dependent variable. This methodology makes it possible to explicitly test whether the functional form found is linear or non-linear.
The results obtained show that there is a positive non-linear relationship between financial development and economic growth for the five financial development indicators used. The overall impact of financial development on economic growth was shown to be positive and significant for intermediate to high levels of financial development. The exception was the financial market activity indicator comprising the ratio of credit transactions to state GDP, which revealed a decreasing effect on economic growth under high levels of financial development, evidenced by an inverted U-shaped relationship, similar to the results produced by Stengos and Liang (2004).
One possible explanation for this inflection point is that when market activity reaches a certain level, financial intermediaries find it more difficult to finance lucrative projects and, consequently, end up financing less profitable projects. This results in a less efficient allocation of resources, which translates into lower economic growth.
In light of the above, it appears that regional inequalities between Brazilian states end up influencing the effect financial development has on economic growth, since two well-defined forms of the relationship between these variables have been identified. In one, financial development is limited and has little effect on economic growth, while in the other, the level of financial development is medium or high and has a positive and significant impact on economic growth.
In this regard, the results support the argument that policies aimed at promoting financial development cannot be implemented homogeneously throughout the national territory, since they will have different effects on economic growth. In other words, different regions cannot be treated as if they were identical.
This indicates a need to prioritize policies to increase income through financial development in regions where such development is limited, given that, when intermediate or high levels of financial development are reached, it is these regions that reap the greatest rewards in terms of economic growth. Moreover, fostering financial development policies in regions where such development is already high could have an adverse impact, negatively affecting economic growth.
The main limitations of the study are that the proxy variables for financial development only capture the banking sector, neglecting the portion of financial development related to the capital market, and they only cover depository units, excluding other financial intermediaries such as development agencies; savings and loan associations; exchange bureaus; development banks; investment banks; mortgage companies; central credit unions; credit institutions; credit, financing and investment firms; building societies; and microfinance firms.
However, if the analysis were carried out in terms of volume of resources and not of omitted agents, this distortion would be greater, since it excludes, for example, investment banks and the capital market which, according to Assaf Neto (2015), are the main drivers of medium- and long-term credit in

110 CEPAL Review N° 128 • August 2019
Economic growth and financial development in Brazil: a flexible regression model approach
the market and responsible for providing the economy with permanent resources by extending loans to those agents lacking resources for investment in working capital and fixed capital. Nevertheless, this limitation does not appear to have a qualitative effect on the results, since in the theoretical and empirical literature financial agents are treated in a homogeneous manner when defining the term “financial development”. As Levine (1997) notes, since they play a key role in the financial system of an economy, financial agents will promote “financial development” by reducing transaction and information costs between savers and investors.
Another limitation of the study is that the empirical model specification used accepts the results presented to date regarding the one-way causality of financial development on economic growth in Brazil (Arraes and Teles (2000), Monte and Távora Júnior (2000), Matos (2002), Marques Jr. and Porto Jr. (2004), Rocha and Nakane (2007) and Missio, Jayme Jr. and Oliveira (2010)). In this regard, the non-linear relationships identified presuppose unilateral causality between the variables.
This article and previous research on the subject provide some guidelines for future studies. The first is the need for more in-depth regional studies, since financial development is inextricably linked to institutional and economic factors that are specific to each region. The second is that, while most studies focus on determining the impact of financial development on economic growth, little attention has been paid to the factors that may or may not bring about financial development. Analysis of how government intervention and sector-specific policies of liberalization or financial repression affect financial development would fill a gap in the literature. Lastly, new proxies must be developed to capture other aspects of financial development in order to shed light on other points of view and give new impetus to research on the subject.
Bibliography
Arraes, R. and V. Teles (2000), “Endogeneidade e exogeneidade do crescimento econômico: uma análise comparativa entre Nordeste, Brasil e países selecionados”, Revista Econômica do Nordeste, No. 31, Special Issue, Fortaleza, Technical Office for Economic Studies of the Northeast (ETENE).
Assaf Neto, A. (2015), Mercado financeiro, São Paulo, Atlas.Barro, R. (1991), “Economic growth in a cross section of countries”, Quarterly Journal of Economics, vol. 106,
No. 2, Oxford, Oxford University Press.Bencivenga, V. and B. Smith (1991), “Financial intermediation and endogenous growth”, Review of Economic
Studies, vol. 58, No. 2, Oxford, Oxford University Press.Bencivenga, V., B. Smith and R. Starr (1996), “Equity markets, transaction costs, and capital accumulation:
an illustration”, World Bank Economic Review, vol. 10, No. 2, Washington, D.C., World Bank.(1995), “Transactions costs, technological choice, and endogenous growth”, Journal of Economic Theory, vol. 67, No. 1, Amsterdam, Elsevier.
Blackburn, K. and V. Hung (1998), “A theory of growth, financial development and trade”, Economica, vol. 65, No. 257, Hoboken, Wiley.
Chandavarkar, A. (1992), “Of finance and development: neglected and unsettled questions”, World Development, vol. 20, vol. 1, Amsterdam, Elsevier.
Chen, K., L. Wu and J. Wen. (2013), “The relationship between finance and growth in China”, Global Finance Journal, vol. 12, No. 1, Amsterdam, Elsevier.
Cintra, M. (2009), “Crédito público e desenvolvimento econômico: a experiência brasileira”, Ensaios sobre Economia Financeira, F. Ferreira and B. Meirelles (orgs.), Rio de Janeiro, Brazilian National Bank for Economic and Social Development (BNDES).
Crocco, M., F. Santos and P. Amaral (2009), “The spatial structure of the financial development in Brazil”, Texto para Discussão CEDEPLAR-UFMG, No. 361, Belo Horizonte, Federal University of Minas Gerais.
Dahl, C. and G. González-Rivera (2003), “Testing for neglected non-linearity in regression models based on the theory of random fields”, Journal of Econometrics, vol. 114, No. 1, Amsterdam, Elsevier.

111CEPAL Review N° 128 • August 2019
Filipe de Morais Cangussu Pessoa, Marcelo José Braga and Gabriel Alves de Sampaio Morais
De Gregorio, J. and P. Guidotti (1995), “Financial development and economic growth”, World Development, vol. 23, No. 3, Amsterdam, Elsevier.
Deidda, L. (2006), “Interaction between economic and financial development”, Journal of Monetary Economics, vol. 53, No. 2, Amsterdam, Elsevier.
Deidda, L. and B. Fattouh (2002), “Non-linearity between finance and growth”, Economics Letters, vol. 74, No. 3, Amsterdam, Elsevier.
Goldsmith, R. (1969), Financial Structure and Development, New Haven, Yale University Press.Greenwood, J. and B. Jovanovic (1990), “Financial development, growth, and the distribution of income”,
Journal of Political Economy, vol. 98, No. 5, Chicago, Chicago University Press.Gurley, J. and E. Shaw (1955), “Financial aspects of economic development”, The American Economic
Review, vol. 45.Hamilton, J. (2001), “A parametric approach to flexible nonlinear inference”, Econometrica, vol. 69, No. 3,
Hoboken, Wiley. Hung, F. (2009), “Explaining the nonlinear effects of financial development on economic growth”, Journal of
Economics, vol. 97, No. 1, New York, Springer.Jalilian, H. and C. Kirkpatrick (2005), “Does financial development contribute to poverty reduction?”, Journal
of Development Studies, vol. 41, No. 4, Abingdon, Taylor & Francis.Johnston, J. and J. Dinardo (1997), Métodos Econométricos, Lisbon, McGraw-Hill.King, R. and R. Levine (1993a), “Finance and growth: Schumpeter might be right”, Quarterly Journal of
Economics, vol. 108, No. 3, Oxford, Oxford University Press.(1993b), “Finance, entrepreneurship, and growth: theory and evidence”, Journal of Monetary Economics, vol. 32, No. 3, Amsterdam, Elsevier.
Kuznets, S. (1955), “Economic growth and income inequality”, The American Economic Review, vol. 45, No. 1, Nashville, American Economic Association.
Lawrence, P. (2006), “Finance and development: why should causation matter?”, Journal of International Development, vol. 18, No. 7, Hoboken, Wiley.
Levine, R. (1998), “The legal environment, banks, and long-run economic growth”, Journal of Money, Credit and Banking, vol. 30, No. 3, Ohio, Ohio State University Press.(1997), “Financial development and economic growth: views and agenda”, Journal of Economic Literature, vol. 35, Nashville, American Economic Association.
Lucas Jr., R. (1988), “On the mechanics of economic development”, Journal of Monetary Economics, vol. 22, No. 1, Amsterdam, Elsevier.
Marques Jr., T. and S. Porto Jr. (2004), “Desenvolvimento financeiro e crescimento econômico no Brasil – Uma avaliação econométrica”, Trabalho para Discussão PPGE/UFRGS, No. 11, Porto Alegre, Federal University of Rio Grande do Sul.
Masten, A., F. Coricelli and I. Masten (2008), “Non-linear growth effects of financial development: does financial integration matter?”, Journal of International Money and Finance, vol. 27, No. 2, Amsterdam, Elsevier.
Matos, O. de (2002), “Desenvolvimento do sistema financeiro e crescimento econômico no Brasil: evidências de causalidade”, Trabalhos para Discussão, No. 49, Brasilia, Central Bank of Brazil.
McKinnon, R. (1973), Money and Capital in Economic Development, Washington, D.C., The Brookings Institution.Minier, J. (2003), “Are small stock markets different?”, Journal of Monetary Economics, vol. 50, No. 7,
Amsterdam, Elsevier.Missio, F., F. Jayme Jr. and A. Oliveira (2010), “Desenvolvimento financeiro e crescimento econômico: teoria
e evidência empírica para os estados brasileiros (1995-2004)”, Textos para Discussão CEDEPLAR-UFMG, No. 379, Belo Horizonte, Federal University of Minas Gerais [online] http://www.cedeplar.ufmg.br/pesquisas/td/TD 379.pdf.
Modenesi, A. (2010), “Política monetária no Brasil pós plano real (1995-2008): um breve retrospecto”, Economia & Tecnologia, vol. 21, Curitiba, Federal University of Parana.
Monte, P. and J. Távora Júnior (2000), “Fontes de financiamento do Nordeste e o produto interno bruto da região”, Revista Econômica do Nordeste, vol. 31, Special Issue, Fortaleza, Technical Office for Economic Studies of the Northeast (ETENE).
Morais, J. (2008), “Programas especiais de crédito para micro, pequenas e médias empresas: BNDES, PGER e fundos constitucionais de financiamento”, Políticas de Incentivo à Inovação Tecnológica no Brasil, J. de Negri and L. Kubota. (orgs.), Brasilia, Institute of Applied Economic Research (IPEA).

112 CEPAL Review N° 128 • August 2019
Economic growth and financial development in Brazil: a flexible regression model approach
Murinde, V. (1996), “Financial markets and endogenous growth: an econometric analysis for Pacific Basin countries”, Financial Development and Economic Growth: Theory and Experiences from Developing Countries, N. Hermes and R. Lensink (eds.), Abingdon, Routledge.
Murinde, V. and F. Eng (1994a), “Financial development and economic growth in Singapore: demand following or supply leading?”, Applied Financial Economics, vol. 4, No. 6, Abingdon, Taylor & Francis.(1994b), “Financial restructuring and economic growth in Singapore”, Savings and Development, vol. 18, No. 2, Giordano Dell’Amore Foundation.
Pagano, M. (1993), “Financial markets and growth: an overview”, European Economic Review, vol. 37, No. 2–3, Amsterdam, Elsevier.
Patrick, H. (1966), “Financial development and economic growth in underdeveloped countries”, Economic Development and Cultural Change, vol. 14, No. 2, Chicago, University of Chicago Press.
Rioja, F. and N. Valev (2004a), “Does one size fit all?: A reexamination of the finance and growth relationship”, Journal of Development Economics, vol. 74, No. 2, Amsterdam, Elsevier.(2004b), “Finance and the sources of growth at various stages of economic development”, Economic Inquiry, vol. 42, No. 1, Hoboken, Wiley.
Robinson, J. (1952), The Rate of Interest and Other Essays, London, Macmillan.Rocha, B. and M. Nakane (2007), “Sistema financeiro e desenvolvimento econômico: evidências de causalidade
em um painel para o Brasil”, Proceedings of the 35th Brazilian Economics Meeting, Pernambuco, Brazilian Association of Graduate Programs in Economics (ANPEC).
Rousseau, L. and P. Wachtel (2001), “Inflation, financial development, and growth”, Economic Theory, Dynamics and Markets: Essays in Honor of Ryuzo Sato, T. Negishi, R. Ramachandran and K. Mino (eds.), Boston, Kluwer.
Romer, P. (1990), “Endogenous technological change”, Journal of Political Economy, vol. 98, No. 5, Chicago, Chicago University Press.(1986), “Increasing returns and long-run growth”, Journal of Political Economy, vol. 94, No. 5, Chicago, Chicago University Press.
Roubini, N. and X. Sala-i-Martin (1992), “Financial repression and economic growth”, Journal of Development Economics, vol. 39, No. 1, Amsterdam, Elsevier.
Saint-Paul, G. (1992), “Technological choice, financial markets and economic development”, European Economic Review, vol. 36, No. 4, Amsterdam, Elsevier.
Schumpeter, J. (1934), The Theory of Economic Development: An Inquiry into Profits, Capital, Credit, Interest, and the Business Cycle, Cambridge, Harvard University Press.
Shaw, E. (1973), Financial Deepening in Economic Development, New York, Oxford University Press.Shen, C. and others (2011), “Roles played by financial development in economic growth: application of the
flexible regression model”, Empirical Economics, vol. 41, No. 1, Berlin, Springer.Singh, A. and B. Weisse (1998), “Emerging stock markets, portfolio capital flows and long-term economic
growth: micro and macroeconomic perspectives”, World Development, vol. 26, No. 4, Amsterdam, Elsevier.Stengos, T. and Z. Liang (2004), “Financial intermediation and economic growth: a semiparametric approach”,
C. Diebolt and C. Kyrtsou (eds.), New Trends in Macroeconomics, Berlin, Springer.Stern, N. (1989), “The economics of development: a survey”, The Economic Journal, vol. 99, No. 397,
Hoboken, Wiley.Stiglitz, J. (1994), “The role of the state in financial markets”, Proceedings of The World Bank Conference on
Development Economics, Washington D.C., World Bank.Stulz, R. (2000), “Does financial structure matter for economic growth? A corporate finance perspective”
[online] http://citeseerx.ist.psu.edu/viewdoc/download?doi=10.1.1.18.9116&rep=rep1&type=pdf.Wooldridge, J. (2001), Econometric Analysis of Cross Section and Panel Data, Cambridge, MIT Press.Xu, Z. (2000), “Financial development, investment, and economic growth”, Economic Inquiry, vol. 38, No. 2,
Hoboken, Wiley.

The importance of terms of trade in the Colombian economy
Andrés Felipe Oviedo Gómez and Lya Paola Sierra Suárez
Abstract
Commodities represent the lion’s share of Colombia’s exports, and the terms of trade are directly determined by the prices of these commodities, making a detailed analysis of this variable’s impacts on the country’s economy essential. This paper examines the effects of terms-of-trade shocks on output, investment, consumption, the trade balance, the real exchange rate and inflation in Colombia. An extensive database comprising 129 variables of economic activity in 2001–2016 was used, along with a FAVAR model. The results suggest that terms-of-trade shocks have significant impacts on the Colombian economy, as they explain roughly 5% of the variation in the country’s economic activity, 8% in investment, 6% in the trade balance and 1% in the real exchange rate.
Keywords
Terms of trade, international trade, economic conditions, economic development, econometric models, Colombia
JEL classification
F14, F41, O54
Authors
Andrés Felipe Oviedo Gómez is a Professor at Universidad del Valle, Colombia. Email: [email protected].
Lya Paola Sierra Suárez is an Associate Professor in the Department of Economics at Pontificia Universidad Javeriana in Cali, Colombia. Email: [email protected].

114 CEPAL Review N° 128 • August 2019
The importance of terms of trade in the Colombian economy
I. Introduction
The terms of trade represent the ratio of a country’s export prices to its import prices, which indicates the purchasing capacity generated by exports. The exogenous nature of the terms of trade sheds light on the effects of external shocks on different economic sectors.
A large percentage of the exports of many developing countries, unlike those of industrialized countries, consists of raw materials or commodities, which makes them more vulnerable to terms-of-trade shocks. According to Fernández, González and Rodríguez (2015), the average percentage of commodities exported by developing countries is more than double that of industrialized countries. By their very nature, commodity prices are highly volatile because of relatively inelastic supply and demand1 in the short term (Sinnot, Nash and de la Torre, 2010). According to the same authors, terms-of-trade volatility is highest for fuel-exporting countries, followed by other commodity exporters and then by countries that specialize in manufacturing exports. The economic effects of terms-of-trade shocks do not depend solely on their magnitude and the type of product exported, but also on the openness of the economy to international markets. According to Ortiz (2016), since the 1990s several South American countries have implemented the neo-liberal model without diversifying production, which has increased these economies’ exposure to external disturbances. As a result, these disturbances have had an immediate impact on public revenues and fiscal aggregates (World Bank, 2000).
Terms-of-trade shocks are especially significant for Colombia given that in 2015, exports accounted for 15% of GDP (World Bank, 2016) and commodities accounted for 80% of these exports. Oil (40%), coal (13%), coffee (7%) and nickel (1%) represented more than half of the country’s exports.2
The aim of this paper is to quantify and explain the effects of terms-of-trade shocks on macroeconomic variables in Colombia, mainly output, investment, consumption, the trade balance, the real exchange rate and inflation. The methodology used combines vector autoregressive models and dynamic factor models. It was proposed by Bernanke, Boivin and Eliasz (2005) and is called the factor-augmented vector autoregressive (FAVAR) approach. The advantage of FAVAR models is that they use countless macroeconomic variables and eliminate the data limits of VAR models, which guarantees a broader analysis of the effects of terms of trade on economic activity. They also reduce the anomalies that could generate omitted-variable biases.
For this analysis, in addition to the above-mentioned variables, 129 quarterly macroeconomic series corresponding to 2001–2016 were used. Given the apparent absence until now of empirical research that employs FAVAR models, or that reflects such extensive use of economic variables in the analysis of terms-of-trade shocks, the main aim of this article is to provide a broader perspective of the relative importance of the terms of trade for different macroeconomic variables in Colombia.
After the introduction, the paper is divided as follows: section II includes a literature review of studies previously carried out at the international level and in Colombia; section III defines the terms of trade, explains how they are modelled and describes the trends they have reflected in recent years, as well as their link with the main macroeconomic variables in Colombia; section IV includes a description of the empirical methodology used; section V presents the data and section VI includes an analysis of the empirical results. Lastly, section VII presents the conclusions.
II. Literature review
This section describes the studies carried out by different authors on the impact of terms-of-trade shocks in developed and emerging economies for which commodities represent a large percentage of exports.
1 See Roberts and Schlenker (2013) for more information on supply and demand elasticity.2 Information obtained from the National Administrative Department of Statistics (DANE).

115CEPAL Review N° 128 • August 2019
Andrés Felipe Oviedo Gómez and Lya Paola Sierra Suárez
On the basis of the assumption that commodity-exporting countries are more likely to feel the effects of terms-of-trade shocks, several authors have observed that different economic aggregates such as GDP, investment, consumption and the exchange rate are the most affected variables, but the magnitude of the impact is determined by the economic characteristics of the country or by the methodology used. In the 1990s, Mendoza (1995) examined the relationship between terms of trade and business cycles, using a theoretical model applied to 23 developing countries and 7 industrialized countries. The results show that terms-of-trade shocks explain between 37% and 56% of the actual variability of GDP in developing countries, compared with 33% in industrialized countries. Schmitt-Grohé and Uribe (2015) developed a model similar to that of Mendoza (1995) and estimated structural vector autoregression (SVAR) using data from 38 poor and emerging countries to evaluate the effect of the terms of trade. The theoretical model indicates that terms-of-trade shocks account for about 30% on average of the variation in output, consumption and investment in those countries. By contrast, the empirical results of the SVAR model point to a variation of roughly 10% in these aggregates. These results are consistent with those obtained by Broda (2004), who concluded, on the basis of an analysis of 75 developing countries, that terms-of-trade shocks account for less than 10% of real GDP volatility.
The evidence shows a greater impact of terms-of-trade shocks in developing countries which export mainly commodities, although the effect of variations in the prices of these products in oil-exporting developed countries is also significant. Andrews and Rees (2009) conducted a study to examine the effects of the terms of trade on the Australian economy and concluded that if the volatility of annual terms of trade growth was greater by one standard deviation, the volatility of shocks to annual GDP growth and annual inflation would be 1.1 percentage points and 1.2 percentage points greater, respectively. Meanwhile, Jääskelä and Smith (2013), also focusing on Australia, used a VAR model to observe the response of inflation, output, interest rates and exchange rates to three types of external terms-of-trade shocks. The results show that the terms-of-trade shocks explain two thirds of the variation in the real exchange rate, but less than one fifth of the variation in the other variables. On the basis of the same methodology used by Jääskelä and Smith (2013), Karagedikli and Price (2013) concluded that external terms-of-trade shocks explain around 20% of the fluctuations in GDP in New Zealand. In the case of Canada, Charnavoki and Dolado (2014) proposed a structural dynamic factor model to identify the main global shocks that drive world commodity prices. The results indicate that a positive global demand shock leads to an improvement of 0.04% in the terms of trade.
Latin America is especially likely to suffer from the effects of terms-of-trade shocks as most of its countries are dependent on commodities, which accounted for more than 80% of the region’s total exports in 2014. According to Ben Zeev, Pappa and Vicondoa (2016) —on the basis of the theoretical model used in Schmitt-Grohé and Uribe (2015) and a VAR model— the terms of trade explain, on average, 25% of output fluctuations in both the theoretical and empirical models for Argentina, Brazil, Chile, Colombia, Ecuador, Mexico and Peru. Izquierdo, Romero and Talvi (2008) examined terms-of-trade fluctuations in Argentina, the Bolivarian Republic of Venezuela, Brazil, Chile, Colombia, Mexico and Peru, and concluded that an increase of almost two percentage points in the terms of trade generates an increase in GDP growth of just 0.21% in the second quarter following a shock. Meanwhile, Ahmed (2003) found that terms-of-trade shocks explain, on average, less than 8% of output fluctuations for Argentina, the Bolivarian Republic of Venezuela, Brazil, Chile, Colombia and Mexico. On the basis of a variance decomposition applied to Peru, Castillo and Salas (2012) concluded that terms-of-trade shocks explained approximately 90% of the fluctuations in output, investment and consumption at the 10-year horizon.
Despite the importance of the terms of trade in commodity-dependent economies, there are few studies on Colombia that evaluate the impact of terms-of-trade shocks on economic activity. In general, the effects of terms-of-trade shocks on macroeconomic variables are evaluated separately in specialized literature. For example, Arteaga, Granados and Joya (2013) analyse the impact of the terms of trade on the real exchange rate. Meanwhile, Gaviria (1993) examines the effect of terms-of-trade shocks on private saving, and Parra (2008) and Hernández (2013) evaluate the impact of fluctuations in the terms

116 CEPAL Review N° 128 • August 2019
The importance of terms of trade in the Colombian economy
of trade on Colombia’s GDP. It is important to highlight the work of Hernández (2013), who concluded that the terms of trade account for between 27% and 33% of the quarterly variability in GDP. Hence, although there are papers which analyse the impacts of the terms of trade on different variables, for the time being there are no studies which incorporate a broad set of variables that largely describe national economic activity or that evaluate the responses of these variables to fluctuations in the terms of trade. This research paper seeks to close this gap, using a FAVAR model which, unlike vector autoregressive models, allows the estimation of the dynamic responses of a large number of home variables to foreign shocks (Mumtaz and Surico, 2009). Moreover, it aims to provide an alternative to the disconnect between the theoretical and empirical models, as outlined by Schmitt-Grohé and Uribe (2015) and Aguirre (2011), who advise the application of another methodology that guarantees a better interpretation of data.
III. Terms of trade and the Colombian economy
What follows is a descriptive analysis of the terms of trade in Colombia and the variables most affected by terms-of-trade shocks, by authors such as Hernández (2013), Schmitt-Grohé and Uribe (2015) and Castillo and Salas (2012).
The data that will be used to model the terms of trade derive from the index developed by the central bank (Bank of the Republic) using implicit prices and based on the methodology of the chained Paasche index proposed by Garavito and others (2011). Equation (1) shows the general structure of the terms-of-trade index (ITI) through the ratio of the chained Paasche index of export prices (IPX,t) to that of import prices (IPM,t) for the period t:
ITIt = IPX,t
IPM,t ∙100 (1)
On the basis of this methodology, figure 1 shows the terms-of-trade index of Colombia. The most significant piece of information shown in the figure is the improvement in the terms of trade from the 2000 decade onward. According to authors such as Jenkins (2011) and Sierra (2015), this derived from the boom in commodity prices resulting from the increase in demand from China and India and the decline in global manufactured goods prices in the first decade of the twenty-first century. Most Latin American countries became the largest suppliers for Asian countries as a result of this strengthening of their terms of trade. The figure also shows a deterioration in the terms of trade in mid-2008 owing to the global financial crisis, and another decline in 2014 stemming from the sharp drop in oil prices.
Figure 1 Colombia: terms-of-trade indices, 1995–2016
60
80
100
120
140
160
180
200
1996 1998 2000 2002 2004 2006 2008 2010 2012 2014 2016
Source: Bank of the Republic of Colombia, 2016.

117CEPAL Review N° 128 • August 2019
Andrés Felipe Oviedo Gómez and Lya Paola Sierra Suárez
Given the large share of commodities in Colombia’s exports, the relationship between the prices of these commodities and the terms of trade is analysed graphically. Figure 2 shows the prices of coffee3 (dashed line) and of oil4 (solid line) in Colombia in 1980–2016. These products are highlighted because they have accounted for the largest share of Colombian exports in the past few decades. Coffee became a symbol of the national economy in the 1970s thanks to the coffee bonanza, as it represented more than 50% of total exports (60% in the late 1970s) (Cano and others, 2012). Between 1980 and 2016 we compute a correlation of 0.57 between the terms-of-trade index and coffee prices, compared with 0.37 with regard to oil prices. Nonetheless, the share of oil in total exports rose sharply in the mid-1990s, and since 1995, oil has been Colombia’s main export. In the past three decades (1995–2016), we have calculated a positive correlation of 0.88 between the terms of trade and oil prices, compared with 0.65 with regard to coffee prices. This indicates that fluctuations in the oil price now play an important role in the evaluation of the terms of trade in Colombia.
Figure 2 Oil and coffee prices, 1980–2016
(US$ per barrel and per pound)
-2
-1
0
1
2
3
4
1980 1985 1990 1995 2000 2005 2010 2015
Oil pricesCoffee prices
Source: International Monetary Fund (IMF).
With regard to the other commodities exported by Colombia, such as coal and nickel, we have calculated correlation of these prices to the terms of trade of 0.7 and 0.4 for the period between 1980 and 2016, respectively.
According to the above-mentioned literature, the terms of trade also affect the following variables: GDP, investment (gross fixed capital formation), total consumption, the trade balance, the real exchange rate index and total inflation. Figure 3 shows the trends in these variables in recent years. In the period between 2001 and 2016, our calculation of the correlation between the terms of trade and these variables reveals a positive value of 0.5 for GDP, which is close to the 0.35 determined by Hernández (2013). There is also a positive correlation between the terms of trade and investment (0.59) and consumption (0.54). According to Parra (2008), terms-of-trade shocks result in stronger investment and consumption owing to the reallocation of capital to productive areas. Meanwhile, we computed a high positive correlation of 0.82 between the terms of trade and the trade balance, and a negative correlation of 0.9 between the terms of trade and the real exchange rate index. This result is in line with that obtained by Poncela, Senra and Sierra (2017) who concluded, for example, that the income derived
3 Coffee prices correspond to the cash price of Colombian mild arabica, of the International Coffee Organization, New York, in US$ per pound.
4 Oil prices correspond to the simple average of three spot prices: Dated Brent, WTI and Dubai Fateh, in US$ per barrel.

118 CEPAL Review N° 128 • August 2019
The importance of terms of trade in the Colombian economy
from stronger oil prices generates an influx in foreign currency that in turn causes the real appreciation of the peso versus the dollar. Lastly, our calculation of the correlation between the terms of trade and inflation reflects a negative value of -0.7.
Figure 3 Trend in variables, 2001–2016
70
80
90
100
110
120
130
140
2002 2004 2006 2008 2010 2012 2014
A. GDP(Billions of pesos, constant at 2005 prices)
8
12
16
20
24
28
32
36
40
2002 2004 2006 2008 2010 2012 2014
B. InvestmentGross �xed capital formation
(Billions of pesos)
0
10
20
30
40
50
60
2002 2004 2006 2008 2010 2012 2014
C. Trade balance(Billions of pesos)
90
100
110
120
130
140
150
160
2002 2004 2006 2008 2010 2012 2014
D. Real exchange rate index (2010=100)(With respect to 18 International Monetary Fund
(IMF) member countries)
0
2
4
6
8
10
2002 2004 2006 2008 2010 2012 2014
E. In�ation(Year-on-year variation in consumer price index)
60
70
80
90
100
110
120
2002 2004 2006 2008 2010 2012 2014
F. Total consumption(Billions of pesos)
Source: Bank of the Republic of Colombia and National Administrative Department of Statistics (DANE).

119CEPAL Review N° 128 • August 2019
Andrés Felipe Oviedo Gómez and Lya Paola Sierra Suárez
The impact of a positive terms-of-trade shock on each variable is explained below.
Given the relationship between the terms of trade and the different economic aggregates in Colombia, and in light of their exogenous nature, a positive terms-of-trade shock owing to, for example, stronger export (commodity) prices generates inflows of foreign currency into the country. This in turn incentivizes applications for credit, especially in the sector benefiting from the boom, in this case commodities, and favours investment as a result. Stronger inflows of foreign currency boost all sectors that produce commodities (directly and indirectly) and consumption, and as indicated by Hernández (2013), increase financial sector profits and government income (higher tax revenues). The local currency appreciates in real terms, first because of nominal appreciation owing to foreign currency inflows, and second because of higher prices resulting from stronger aggregate demand. An indirect negative effect, which has been overlooked often in the analysis of terms-of-trade impacts, is the weight of the real appreciation of local currency on the competitiveness of the export sector, which leads to a decline in value added and employment in these sectors (see Sierra and Manrique, 2014; Peláez and Sierra, 2016). The methodology proposed for this study incorporates all interactions of the economy with positive and negative effects, depending on the sector, in the face of a positive terms-of-trade shock, and determines the net impact of the shock on the overall economy.
IV. Methodology
The following section describes the empirical methodology used to observe the effect of terms-of-trade shocks on different national macroeconomic variables. The FAVAR methodology of Bernanke, Boivin and Eliaz (2005) is employed, as it can be used to evaluate the persistence of exogenous shocks over time through the impulse response functions of a large number of macroeconomic variables. Unlike VAR models, it incorporates factors that provide enough information to broadly capture and identify the simultaneous movements of economic activity. It also partly reduces dimensionality problems.
1. FAVAR models
Yt is an Mx1 vector of economic variables that are observable or of interest: terms of trade, output, investment, consumption, trade balance, exchange rate and inflation, for t = 1, 2, ...T periods. It can be concluded, as is normally the case with VAR models, that there is additional information not fully captured by Yt and that may be relevant to modelling the dynamics of this series. Nonetheless, this set of data that is excluded because of the limits of the empirical model can be summarized by a Kx1 vector of unobservable factors, Ft. The (Ft,Yt) dynamic may be represented by a VAR model, as shown in the following equation (2):
FtYt
= Φ(L) Ft–1Yt–1
+ vt (2)
where Φ(L) is a conformable lag polynomial of finite order d, and the error term, vt, is mean zero with covariance matrix Q.
To estimate the factors, Ft, dynamic factor models —originally proposed by Geweke (1976) and developed extensively by Stock and Watson (2002, 2005, 2011)— are used. The static representation of these models is as follows:
Xt = ΛFt + et (3)

120 CEPAL Review N° 128 • August 2019
The importance of terms of trade in the Colombian economy
where Xt is an Nx1 vector that contains a broad data set (129 observable time series, which do not include the variables of interest). It is assumed that this vector of information Xt can be represented as the sum of two unobservable components: one or some components common to all variables, Ft, and an idiosyncratic component, et, specific to each variable. In equation (3), Λ is an NxK matrix of factor loadings (the term ΛFt refers to common components of Xt) and the error term, et, is mean zero with normal distribution, with dimension Nx1. This last term may present weak cross-correlation to the extent that it captures the idiosyncratic component.5
In keeping with Bernanke, Boivin and Eliasz (2005), the FAVAR model is based on a two-step estimation method: the first step consists of the estimation of the spaces spanned by the factors, through k principal components of Xt, and the second step involves the estimation of the equation (2) through the standard vector autoregressive method, which requires the replacement of Ft with Ft (estimated factors). This method is characterized by its computational simplicity and strong robustness for cross-correlation in the error component (Stock and Watson, 2005). Forni and others (2000, 2005) demonstrate the coherence of the principal component predictor when the number of series N and the dimension T tend to infinity. Meanwhile, Bai and Ng (2002) state that the estimates are coherent when min {N,T } is 40 or larger.
The information criteria proposed by Bai and Ng (2002) are used to determine the number of factors to include in the second step. The generalized impulse response functions proposed by Pesaran and Shin (1998) are also estimated: unlike the impulse response functions determined by the Cholesky method, these are invariant to the ordering of the variables in the VAR.
V. Data
The database used comprises the variables mentioned previously (terms of trade, output, investment, consumption, trade balance, exchange rate and inflation) and 129 macroeconomic series that represent different categories of the Colombian economy. The number of variables per category is indicated in parentheses: economic activity (23), external sector (23), real exchange rate (5), prices (31), monetary aggregates (16), total national employment (6), non-financial public sector (7), foreign investment inflows into Colombia (12) and interest rates (6). The study includes a balanced panel composed of quarterly data for 2001–2016. The period was selected first on the basis of the availability of data with no methodological changes and because it excludes the turning point in the 1990s of the opening of Colombia’s economy, which increased exposure to external shocks. The period following 2001 is also interesting as it includes the impact on Latin American countries’ terms of trade when China became a member of the World Trade Organization (WTO) in 2001, as indicated in section III. The period was characterized by the strong growth of Asian economies, mainly China, which boosted the terms of trade of Latin American countries (Sierra, 2015).
Before transforming the series, outliers were eliminated, in keeping with Stock and Watson (2002), who state that those data change the estimation method of the estimated factors for principal components, as they significantly increase the value of variance. Therefore, time series regression with ARIMA noise, missing values and outliers, developed by Gómez and Maravall (1998), is used to
automatically detect outliers. This method uses specification: lnXi,t =θi(B)
Δϕi(B)εit + outliers, where Φi(B)
is an autoregressive polynomial of order pi, θi(B) is a moving-average polynomial of order qi with the backwards operator B and Δ is the differencing operator (1–B).
5 Both Ft and et can follow an autoregressive process, although this is not taken into account in this study.

121CEPAL Review N° 128 • August 2019
Andrés Felipe Oviedo Gómez and Lya Paola Sierra Suárez
The model described in section IV explains that the Xt variable matrix must be stationary, and thus before the estimation of the model a unit root test was carried out with intercepts and trends, using the tests suggested by Dickey and Fuller (1979) and Phillips and Perron (1988). Annex A1 includes information on the variables of interest and the 129 series used and their respective transformations. Lastly, after being converted to stationary, the series are standardized to reflect sample mean zero and variance equal to one, in keeping with Stock and Watson (2011).
VI. Empirical results
This section describes the results obtained from the estimation of the FAVAR model (equation (2)) outlined in section IV. The estimation defined Yt observable variables and extracted Ft unobservable factors of the 129 remaining series. This section is divided into four subsections: estimation of factors, impulse response functions, variance decomposition and robustness tests.
1. Estimation of the number of factors
Of the three penalty functions proposed by Bai and Ng (2002), the first two include four factors, while nine factors are used in the third. Table 1 summarizes the results of the information criteria.
Table 1 Number of estimated factors using the information criteria of Bai and Ng (2002)
Sample Period Number of observations IC1 IC1 IC1
Complete First quarter of 2001 to first quarter of 2016 61 4 4 9
Source: Prepared by the authors.Note: IC stands for information criteria.
As indicated, the first principal component is chosen from the block of remaining variables (129) and through the analysis of the principal components. It explains approximately 18% of the variance of this group, as outlined in table 2, and is labelled factor 1 or real exchange rate, owing to its weight in the series and the correlation of 0.7 with the real exchange rate index. The following factor accounts for approximately 16% of variance and is labelled factor 2 or monetary aggregates, owing to its weight in monetary aggregates and the positive correlation of 0.7 with the M1 variable. Meanwhile, factor 3, which explains roughly 13% of variance, corresponds to prices in light of the positive correlation of 0.5 with the series of the consumer price and producer price indices. Factor 4, which accounts for roughly 10% of variance, refers to the economic activity resulting from the positive correlation of 0.5 with the consumption and GDP growth variables. The first four factors described account for roughly 57% of total variance. Each factor from number five onward explains less than 5% of variance, which supports the selection of four factors.

122 CEPAL Review N° 128 • August 2019
The importance of terms of trade in the Colombian economy
Table 2 Factors derived from the analysis of principal components
Factor number Value Difference Proportion Cumulative value Cumulative proportion
1 18.117920 2.40323 0.1342 18.11792 0.1342
2 15.714690 2.41727 0.1164 33.83262 0.2506
3 13.297420 3.52985 0.0985 47.13004 0.3491
4 9.767571 3.08406 0.0724 56.89761 0.4215
5 6.683512 0.945658 0.0495 63.58112 0.4710
6 5.737855 0.587268 0.0425 69.31898 0.5135
7 5.150586 0.624079 0.0382 74.46956 0.5516
Source: Prepared by the authors.
2. Impulse response functions
Figures 4, 5 and 6 show the results of the estimation of accumulated impulse responses to generalized positive shocks in the terms of trade index (TTIt ) for three observable macroeconomic series (investment, It; trade balance, TBt; and total consumption, Ct) with a 95% confidence interval and over a period of 10 quarters. This involves the selection of four factors (real exchange rate, monetary aggregates, prices and economic activity) and three lags, given that the model is robust and consistent in the evaluation of the assumptions for residuals (see annex A2). The results reveal a significant positive effect of the terms of trade on economic activity (factor simulating GDP), investment and the trade balance. By contrast, with regard to the real exchange rate (factor simulating the real exchange rate index) a significant negative effect is observed, while for prices (factor representing inflation) and total consumption, the impact is insignificant.
Figure 4 Accumulated impulse response of economic activity and investment to generalized
one standard deviation innovations in the terms-of-trade index
-2
0
2
4
6
1 2 3 4 5 6 7 8 9 10
A. Accumulated response of economic activity to terms-of-trade innovations
Stan
dard
dev
iatio
n
Quarters
Economic activity95% confidence band

123CEPAL Review N° 128 • August 2019
Andrés Felipe Oviedo Gómez and Lya Paola Sierra Suárez
B. Accumulated response of investment to terms-of-trade innovations
Stan
dard
dev
iatio
n
Quarters
-0.4
0
0.4
0.8
1.2
1 2 3 4 5 6 7 8 9 10
Invesment95% confidence band
Source: Prepared by the authors.
Figure 5 Accumulated impulse response of the trade balance and real exchange rate
to generalized one standard deviation innovations in the terms-of-trade index
A. Accumulated response of the trade balance to terms-of-trade innovations
Stan
dard
dev
iatio
n
Quarters
-0.4
0
0.4
0.8
1.2
1.6
2.0
1 2 3 4 5 6 7 8 9 10
Trade balance95% confidence band
Figure 4 (concluded)

124 CEPAL Review N° 128 • August 2019
The importance of terms of trade in the Colombian economy
B. Accumulated response of the exchange rate to terms-of-trade innovations
Stan
dard
dev
iatio
n
Quarters
-8
-4
0
4
1 2 3 4 5 6 7 8 9 10
Exchange rate95% confidence band
Source: Prepared by the authors.
Figure 6 Accumulated impulse response of monetary aggregates, prices (inflation) and total
consumption to generalized one standard deviation innovations in the terms-of-trade index
A. Accumulated response of monetary aggregates to terms-of-trade innovations
Stan
dard
dev
iatio
n
Quarters
-6
-4
-2
0
2
4
1 2 3 4 5 6 7 8 9 10
Monetary aggregates95% confidence band
Figure 5 (concluded)

125CEPAL Review N° 128 • August 2019
Andrés Felipe Oviedo Gómez and Lya Paola Sierra Suárez
B. Accumulated response of prices to terms-of-trade innovations
Stan
dard
dev
iatio
n
Quarters
-4
-2
0
2
4
6
1 2 3 4 5 6 7 8 9 10
Prices95% confidence band
C. Accumulated response of total consumption to terms-of-trade innovations
Stan
dard
dev
iatio
n
Quarters
-1.5
-1.0
-0.5
0
0.5
1.0
1.5
1 2 3 4 5 6 7 8 9 10
Total consumption95% confidence band
Source: Prepared by the authors.
In general, responses are coherent and comprehensible and based on economic theory, but different from the results obtained by other authors in terms of the magnitude of the impact. With regard to economic activity, the results suggest that a positive shock affecting the terms-of-trade index begins to be significant from the first quarter and lasts for a total of four. If the positive shock in the terms of trade derives from stronger export prices, the increase in economic activity resulting from that shock can be considered temporary, not permanent, as explained by Parra (2008). With regard to investment, the response is considered significant in the second quarter, but the effect of the shock lasts only a short while, just one quarter. This can be explained by the fact that the positive terms-of-trade shock directly and favourably affects the country’s output through the trade balance, which boosts income and subsequently investment. In other words, investment is subject to the terms-of-trade impact through variations in output or income.
Figure 6 (concluded)

126 CEPAL Review N° 128 • August 2019
The importance of terms of trade in the Colombian economy
Meanwhile, the impact on the trade balance is significant and positive, and lasts approximately five quarters from the beginning of the shock onward. This effect is the result of the positive terms-of-trade shock triggering an increase in the domestic production of exported goods. Observation of the real exchange rate indicates an inverse and prolonged response (approximately three quarters), which results in appreciation of the local currency versus the dollar because of strong foreign exchange inflows into the country. The short-term effect of this appreciation on manufacturing sectors depends on the exposure of each sector to external markets and the composition of inputs (imported or domestic). According to Sierra and Manrique (2014) and Peláez and Sierra (2016), the real appreciation of the peso negatively affected 50% of industrial value added (18 sectors) and 31% of total employment (18 sectors) in 2000–2010. Meanwhile, it positively affected 4% of total value added (4 sectors) and 3% of total manufacturing employment (7 sectors). Nonetheless, this appreciation had no significant impact on 38 sectors that account for 45% of the total value added of manufactured goods or on 34 sectors that represent 66% of the total employment in the manufacturing sector.
Lastly, an analysis of the remaining factors, monetary aggregates, prices and total consumption, leads to the conclusion that a terms-of-trade shock does not have a significant impact on those variables. This is supported by Parra (2008), who found that the effects of terms-of-trade shocks in the 2000 decade resulted in appreciation of the local currency given the revaluation of the dollar that lasted until 2008. After analysing consumption, he inferred that the terms-of-trade shocks did not alter aggregate price levels. This means that the increase in oil prices in 2003–2014 and the strong appreciation of the peso did not give way to inflation. Therefore, it is important to highlight that inflation is not triggered by external shocks in this particular case.
Overall, the results show that the terms of trade have a significant impact on a set of macroeconomic variables, which largely summarize the behaviour of economic activity coherently and in line with expectations.
3. Variance decomposition
Error variance decomposition indicates how much movement in a series derives from specific innovations compared with those relating to the other variables included in the model. In other words, this methodology captures the different components that help to isolate the percentage change in each variable because of the innovation, which makes it easier to identify the relative dependence of each variable on the rest. The method used is Cholesky orthogonalization applied to FAVAR residuals.
Cholesky decomposition assumes the ordering of variables according to their degree of contemporaneous endogeneity. The variables are thus organized from most endogenous to most exogenous as follows: economic activity, total consumption, investment, prices, monetary aggregates, trade balance, real exchange rate and terms-of-trade index. In the case of Colombia we assume exogeneity in the terms of trade, for three reasons: Colombia is a relatively small open economy that does not influence international prices; as indicated in section III, there is a strong correlation between the terms of trade and oil prices, which are determined at the international level; and lastly, there is a study that demonstrates the exogeneity of the terms of trade of Latin American countries (see Ben Zeev, Pappa and Vicondoa, 2016).
The results of the variance decomposition with a finite horizon of 20 quarters are summarized in table 3. They show that 5% of the variability of economic activity is explained by changes in the terms of trade. Consumption and monetary aggregates also reflect variability of 5%. Meanwhile, variability of the trade balance, prices and the real exchange rate are 6%, 4% and 1%, respectively. Lastly, investment reflects variability of 8% owing to changes in the terms of trade.

127CEPAL Review N° 128 • August 2019
Andrés Felipe Oviedo Gómez and Lya Paola Sierra Suárez
Table 3 Variance decomposition of selected variables of interest
Variables Percentage of variance explained by the terms of trade
Economic activity (GDP) 5.00
Total consumption 5.00
Monetary aggregates 5.00
Trade balance 6.00
Prices (inflation) 4.00
Real exchange rate 1.00
Investment 8.00
Source: Prepared by the authors.
Investment is undoubtedly the variable most affected by terms-of-trade shocks, and accounts for one quarter of GDP. An improvement in the terms of trade boosts investment, especially in the commodity export sector, because marginal profitability is a function of projected export prices. Our results are not in line with those obtained for other countries by authors such as Castillo and Salas (2012), according to whom terms-of-trade shocks explain roughly 90% of fluctuations in output, investment and consumption at the 10-year horizon for the Peruvian economy. Hernández (2013) concluded that 27%–30% of variations in Colombian output were explained by the terms of trade. Meanwhile, Arteaga, Granados and Joya (2013) determined that an increase in terms of trade caused a decline of 50% in the real exchange rate. Although our results coincide with those of other studies relating to the effects of the terms of trade on variables, the magnitude of the impact is smaller.
For authors such as Hernández (2013), Schmitt-Grohé and Uribe (2015) and Broda (2004), the magnitude of the impact of terms-of-trade shocks on different economic aggregates varies significantly, owing mainly to the methods used. Simulation-based models, such as the one developed by Mendoza (1995), indicate that terms-of-trade shocks have significant impacts on the economic activity of the countries reviewed, while VAR models reveal similar but smaller effects. It is argued that the disconnect between the two methodologies is the result of the scarcity of data or of the lags used in the empirical models. In other words, the model suffers from lag-truncation bias (Chari, Kehoe and McGrattan, 2008). The main advantage of FAVAR models, as an alternative to the methods mentioned previously, is the use of a large number of variables of economic activity, which allows them to capture more of the indirect effects of terms-of-trade shocks on economic activity. According to Stock and Watson (2005), FAVAR models reduce the probability of omitted variables, a common problem encountered with SVAR models, so the inclusion of a large number of economic series favours estimates by covering most structural shocks to an economy. In this study, the four estimated factors explain roughly 60% of the variance of the economic series used.
4. Robustness tests
In the following robustness test, the economic activity and real exchange rate factors have been replaced by GDP (measured in trillions of pesos, constant at 2005 prices) and by the real exchange rate index measured for 18 IMF member countries, respectively. The estimation of impulse response functions is shown in figure 7, and indicates that a positive shock for the terms-of-trade index has a favourable and significant impact on GDP, but this does not last as long as that of economic activity. Meanwhile, investment reflects two significant positive effects, one in the second quarter and the other in the fifth quarter, both of a short duration. The trade balance reacts positively and significantly for a longer period

128 CEPAL Review N° 128 • August 2019
The importance of terms of trade in the Colombian economy
than in the previous model, while the response of the real exchange rate index is the same as that of the estimated real exchange rate, albeit shorter. Lastly, monetary aggregates, prices and total consumption do not reflect any significant changes in light of a terms-of-trade shock, as shown in the previous results. In short, on the basis of the estimates of impulse response functions following the replacement of the economic activity and real exchange rate factors with the corresponding series, it can be inferred that there is no significant difference compared with the main model described.
Figure 7 Accumulated impulse response of GDP, investment, the trade balance, the real
exchange rate index, monetary aggregates, prices and total consumption to generalized one standard deviation innovations in the terms-of-trade index
A. Accumulated response of GDP to terms-of-trade index innovations
B. Accumulated response of investment to terms-of-trade index innovations
C. Accumulated response of the trade balance to terms-of-trade index innovations
D. Accumulated response of the real exchange rateindex to terms-of-trade index innovations
Stan
dard
dev
iatio
n
Quarters Quarters
Quarters Quarters
Stan
dard
dev
iatio
n
Stan
dard
dev
iatio
n
Stan
dard
dev
iatio
n
-1
0
1
2
3
2 4 6 8 10 12 14-0.5
0
0.5
1.0
1.5
2.0
2.5
2 4 6 8 10 12 14
-1
0
1
2
3
4
2 4 6 8 10 12 14
-2
-1
0
1
2 4 6 8 10 12 14-3
GDP95% confidence band Investment95% confidence band
Trade balance95% confidence band Real exchange95% confidence band

129CEPAL Review N° 128 • August 2019
Andrés Felipe Oviedo Gómez and Lya Paola Sierra Suárez
E. Cumulative response of monetary aggregatesto terms-of-trade index innovations
F. Cumulative response of prices to terms-of-trade index innovations
G. Cumulative response of total consumption to terms-of-trade index innovations
Stan
dard
dev
iatio
n
Quarters Quarters
Quarters
Stan
dard
dev
iatio
n
Stan
dard
dev
iatio
n
-4
0
4
8
2 4 6 8 10 12 14-8
-4
0
4
8
12
16
2 4 6 8 10 12 14
-1
0
1
2
3
2 4 6 8 10 12 14
-8
Monetary aggregates95% confidence band Prices95% confidence band
Total consumption95% confidence band
Source: Prepared by the authors.
The application of variance decomposition indicates that the terms of trade explain 6% of variance in GDP, 9% in investment, 10% in the trade balance, 2% in the real exchange rate, 5% in monetary aggregates, 5% in prices and 4% in total consumption. There were slight increases in comparison with the estimates of the model with four factors, mainly the trade balance.
Lastly, and with a view to isolating the effects of export and import prices, the second robustness test estimates the impulse response functions of the positive impulses generated by the export and import price indices, respectively. The results described in annex A3 indicate that a positive shock of the export price index generates positive and significant effects on economic activity, investment and the trade balance, and a negative and significant effect on the exchange rate. Moreover, the variance decomposition (see table 1 in section VI) shows that investment reflects the greatest variance (6%) in light of a shock for the terms-of-trade index. Meanwhile, a positive shock for the import price index
Figure 7 (concluded)

130 CEPAL Review N° 128 • August 2019
The importance of terms of trade in the Colombian economy
generates positive and significant effects on economic activity, investment, the exchange rate and prices. However, there were significant negative effects on the trade balance. On the basis of variance decomposition (see table 1), the greatest impact appears to have been felt by prices (7%), followed by investment (5%). Note that the results are similar to those obtained through the use of the main model. The export price index generates effects similar to the terms-of-trade index in terms of sign and duration.
VII. Conclusions
The aim of this article is to analyse the impact of terms-of-trade shocks on the Colombian economy, in which commodities represent a large share of exports. It was based on the fact that previous studies had not analysed the persistence and impact of exogenous shocks resulting from variations in goods export and import prices on the different economic aggregates. Therefore, a large number of quarterly series for 2001–2016 were used to capture a considerable share of the different economic sectors in Colombia and thus make the most of the advantages of the FAVAR model to provide a more detailed explanation of the effect of these innovations on the economy.
The results show that terms-of-trade shocks have a significant impact on economic activity, investment, the real exchange rate and the trade balance. The characteristics of exported products and the openness of the economy play a key role in determining the impact, but in the case of Colombia it is evident that the terms of trade have a decisive effect on the economic variables described, especially investment. The use of a FAVAR model guarantees the analysis of impulse response functions of the macroeconomic series of interest, which show that a positive shock produces a boom in economic activity over four periods, appreciation of the real exchange rate over three periods and growth in the trade balance over six periods. Investment reflects an increase that lasts less than one quarter. Meanwhile, the variance decomposition analysis generates data showing that for 20 periods following the terms-of-trade shock, these terms of trade explain 8% of the variance in investment, 6% in the trade balance, 5% in economic activity and 1% in the real exchange rate.
Bibliography
Aguirre, E. (2011), “Essays on exchange rates and emerging markets”, doctoral thesis, New York, Columbia University.
Ahmed, S. (2003), “Sources of economic fluctuations in Latin America and implications for choice of exchange rate regimes”, Journal of Development Economics, vol. 72, No. 1, Amsterdam, Elsevier.
Andrews, D. and D. Rees (2009), “Macroeconomic volatility and terms of trade shocks”, Research Discussion Paper, No. 2009–05, Reserve Bank of Australia (RBA).
Arteaga, C., J. Granados and J. Joya (2013), “El comportamiento del tipo de cambio real en Colombia: ¿explicado por sus fundamentales?”, Ensayos sobre Política Económica, vol. 31, No. 72, Amsterdam, Elsevier.
Bai, J. and S. Ng (2002), “Determining the number of factors in approximate factor models”, Econometrica, vol. 70, No. 1, Hoboken, Wiley.
Ben Zeev, N., E. Pappa and A. Vicondoa (2016), “Emerging economies business cycles: the role of the terms of trade revisited”, Working Paper, No. 1610, Beerseba, Ben-Gurion University of the Negev.
Bernanke, B., J. Boivin and P. Eliasz (2005), “Measuring the effects of monetary policy: a factor-augmented vector autoregressive (FAVAR) approach”, The Quarterly Journal of Economics, vol. 120, No. 1, Oxford, Oxford University Press.
Broda, C. (2004), “Terms of trade and exchange rate regimes in developing countries”, Journal of International Economics, vol. 63, No. 1, Amsterdam, Elsevier.
Cano, G. and others (2012), “El mercado mundial del café y su impacto en Colombia”, Working Paper, No. 710, Bogotá, Central Bank of Colombia.

131CEPAL Review N° 128 • August 2019
Andrés Felipe Oviedo Gómez and Lya Paola Sierra Suárez
Castillo, P. and J. Salas (2012), Los términos de intercambio como impulsores de fluctuaciones económicas en economías en desarrollo: estudio empírico, Mexico City, Centre for Latin American Monetary Studies (CEMLA).
Chari, V., P. Kehoe and E. McGrattan (2008), “Are structural VARs with long-run restrictions useful in developing business cycle theory?”, Journal of Monetary Economics, vol. 55, No. 8, Amsterdam, Elsevier.
Charnavoki, V. and J. Dolado (2014), “The effects of global shocks on small commodity-exporting economies: lessons from Canada”, American Economic Journal: Macroeconomics, vol. 6, No. 2, Nashville, American Economic Association.
Dickey, D. and W. Fuller (1979), “Distribution of the estimators for autoregressive time series with a unit root”, Journal of the American Statistical Association, vol. 74, No. 366a, Abingdon, Taylor & Francis.
Fernández, A., A. González and D. Rodríguez (2015), “Sharing a ride on the commodities roller coaster: common factors in business cycles of emerging economies”, Working Paper, No. 915, Bogotá, Central Bank of Colombia.
Forni, M. and others (2005), “The generalized dynamic factor model: one-sided estimation and forecasting”, Journal of the American Statistical Association, vol. 100, No. 471, Abingdon, Taylor & Francis.(2000), “The generalized dynamic-factor model: identification and estimation”, The Review of Economics and Statistics, vol. 82, No. 4, Cambridge, MIT Press.
Garavito, A. and others (2011), “Construcción del índice de términos de intercambio para Colombia”, Working Paper, No. 639, Bogotá, Central Bank of Colombia.
Gaviria, A. (1993), “El ahorro privado y los términos de intercambio: el caso colombiano”, Ensayos sobre Política Económica, vol. 12, No. 23, Bogotá, Central Bank of Colombia.
Geweke, J. (1978), The Dynamic Factor Analysis of Economic Time Series Models, University of Wisconsin. Gómez, V. and A. Maravall (1998), “Seasonal adjustment and signal extraction in economic time series”,
Documento de Trabajo, No. 9809, Madrid, Bank of Spain.Hernández, G. (2013), “Terms of trade and output fluctuations in Colombia”, CEPAL Review, No. 110
(LC/G.2572-P), Economic Commission for Latin America and the Caribbean (ECLAC).Izquierdo, A., R. Romero and E. Talvi (2008), “Booms and busts in Latin America: the role of external factors”,
Working Paper, No. 631, Washington, D.C., Inter-American Development Bank (IDB).Jääskelä, J. and P. Smith (2013), “Terms of trade shocks: what are they and what do they do?”, Economic Record,
vol. 89, No. 285, Hoboken, Wiley.Jenkins, R. (2011), “The ‘China effect’ on commodity prices and Latin American export earnings”, CEPAL Review,
No. 103 (LC/G.2487-P), Economic Commission for Latin America and the Caribbean (ECLAC).Karagedikli, O. and G. Price (2012), “Identifying terms of trade shocks and their transmission to the New Zealand
economy” [online] http://docs.business.auckland.ac.nz/Doc/Paper-10_Gael.pdf.Mendoza, E. (1995), “The terms of trade, the real exchange rate, and economic fluctuations”, International
Economic Review, vol. 36, No. 1, Hoboken, Wiley.Mumtaz, H. and P. Surico (2009), “The transmission of international shocks: a factor-augmented VAR
approach”, Journal of Money, Credit and Banking, vol. 41, No. s1, Hoboken, Wiley.Ortiz, C. (2016), Diversificación productiva y crecimiento económico: enfoques teóricos y análisis del desarrollo
socio-económico de Colombia, Cali, Universidad del Valle.Parra, J. (2008), “Hechos estilizados de la economía colombiana: fundamentos empíricos para la construcción
y evaluación de un modelo DSGE”, Working Paper, No. 509, Bogotá, Central Bank of Colombia.Peláez, J. and L. Sierra (2016), “Does industrial employment react to movements in the real exchange rate?
An empirical analysis for Colombia, 2000–2010”, Latin American Journal of Economics, vol. 53, No. 1, Santiago, Pontifical Catholic University of Chile.
Pesaran, H. and Y. Shin (1998), “Generalized impulse response analysis in linear multivariate models”, Economics Letters, vol. 58, No. 1, Amsterdam, Elsevier.
Phillips, P. and P. Perron (1988), “Testing for a unit root in time series regression”, Biometrika, vol. 75, No. 2, Oxford, Oxford University Press.
Poncela, P., E. Senra and L. Sierra (2017), “Long-term links between raw materials prices, real exchange and relative de-industrialization in a commodity-dependent economy: empirical evidence of ‘Dutch disease’ in Colombia”, Empirical Economics, vol. 52, No. 2, New York, Springer.
Roberts, M. and W. Schlenker (2013), “Identifying supply and demand elasticities of agricultural commodities: implications for the US ethanol mandate”, The American Economic Review, vol. 103, No. 6, Nashville, American Economic Association.
Schmitt-Grohé, S. and M. Uribe (2015), “How important are terms of trade shocks?”, NBER Working Paper, No. 21253, Cambridge, Massachusetts, National Bureau of Economic Research (NBER).

132 CEPAL Review N° 128 • August 2019
The importance of terms of trade in the Colombian economy
Sierra, L. (2015), “¿Qué tanto afecta Asia a Latinoamérica?: el canal de las materias primas”, Las relaciones económicas entre América Latina y Asia: hacia la construcción de una nueva inserción internacional, M. de Miranda and J. Peláez (comps.), Cali, Pontificia Universidad Javeriana de Cali.
Sierra, L. and L. Manrique (2014), “A first approach to the impact of the real exchange rate on industrial sectors in Colombia”, CEPAL Review, No. 114 (LC/G.2629-P), Santiago, Economic Commission for Latin America and the Caribbean (ECLAC).
Sinnott, E., J. Nash and A. de la Torre (2010), Natural resources in Latin America and the Caribbean: beyond booms and busts?, Washington, D.C., World Bank.
Spatafora, N. and A. Warner (1999), “Macroeconomic and sectoral effects of terms-of-trade shocks: the experience of the oil-exporting developing countries”, IMF Working Paper, No. 99/134, Washington, D.C, International Monetary Fund (IMF).
Stock, J. and M. Watson (2011), “Dynamic factor models”, Oxford Handbook of Economic Forecasting, M. Clements and D. Hendry (eds.), Oxford, Oxford University Press. (2005), “Implications of dynamic factor models for VAR analysis”, NBER Working Paper, No. 11467, Cambridge, Massachusetts, National Bureau of Economic Research (NBER).(2002), “Macroeconomic forecasting using diffusion indexes”, Journal of Business & Economic Statistics, vol. 20, No. 2, Abingdon, Taylor & Francis.
World Bank (2016), “Exports of goods and services (% of GDP)” [online] https://data.worldbank.org/indicator/NE.EXP.GNFS.ZS?locations=CO. (2000), Securing our Future in a Global Economy, Washington, D.C.

133CEPAL Review N° 128 • August 2019
Andrés Felipe Oviedo Gómez and Lya Paola Sierra Suárez
Annex A1
The series were taken from the Bank of the Republic, the National Administrative Department of Statistics (DANE), the Ministry of Finance and Public Credit and the International Monetary Fund (IMF). The change in each series is outlined as follows: 1 — No change; 2 — Logarithm; 3 — First difference; 4 — First difference of the logarithm.
Table A1.1 Description of the variables of interest
Number Variable Source Change1 Terms-of-trade index Bank of the Republic 4
2 GDP DANE 4
3 Total consumption DANE 4
4 Gross fixed capital formation (Investment) DANE 4
5 Trade balance (Billions of pesos) Bank of the Republic 4
6 Exchange rate with respect to 18 IMF member countries Bank of the Republic 4
7 Total inflation Bank of the Republic 4
Source: Prepared by the authors, on the basis of data from Bank of the Republic, National Administrative Department of Statistics (DANE), Ministry of Finance and Public Credit and International Monetary Fund (IMF).
Table A1.2 Description of the 129 series used
Number Variable Source ChangeEconomic activity at constant prices (Billions of pesos)
1 GDP growth DANE 1
2 Index of real manufacturing industry output DANE 4
3 Industrial goods output: grey cement (tons) DANE 4
4 Industrial goods output: assembled vehicles (quantity) DANE 4
5 Industrial goods output: sugar (tons) DANE 2
6 Government final consumption DANE 2
7 Household final consumption DANE 2
8 Consumption of durable goods (Percentage) DANE 1
9 Consumption of non-durable goods (Percentage) DANE 1
10 Consumption of semi-durable goods (Percentage) DANE 1
11 Consumption of services (Percentage) DANE 1
12 Domestic final demand DANE 4
13 Gross capital formation DANE 4
14 Gross capital formation: agriculture, forestry, hunting and fishing DANE 1
15 Gross capital formation: construction DANE 1
16 Gross capital formation: transport equipment DANE 1
17 Gross capital formation: machinery and equipment DANE 1
18 Gross capital formation: civil engineering works DANE 1
19 Gross capital formation: services DANE 1
20 Changes in inventories DANE 1
21 Total domestic debt Ministry of Finance and Public Credit 4
22 Domestic debt: expenditure Ministry of Finance and Public Credit 4
23 Domestic debt: repayment Ministry of Finance and Public Credit 2

134 CEPAL Review N° 128 • August 2019
The importance of terms of trade in the Colombian economy
Number Variable Source ChangeExternal sector (Billions of pesos)
24 External debt Ministry of Finance and Public Credit 4
25 Total exports DANE 4
26 Coffee exports DANE 4
27 Coffee exports (metric tons) DANE 4
28 Coal exports DANE 4
29 Coal exports (metric tons) DANE 2
30 Nickel exports DANE 4
31 Nickel exports (metric tons) DANE 2
32 Exports of oil and its derivatives DANE 4
33 Exports of oil and its derivatives (metric tons) DANE 4
34 Total traditional exports DANE 4
35 Total non-traditional exports DANE 4
36 Total imports DANE 4
37 Imports of intermediate goods and commodities: agricultural sector DANE 4
38 Imports of intermediate goods and commodities: industrial sector DANE 4
39 Imports of intermediate goods and commodities: fuels DANE 4
40 Capital goods imports: agricultural sector DANE 4
41 Capital goods imports: industrial sector DANE 4
42 Capital goods imports: transport equipment DANE 4
43 Capital goods imports: construction materials DANE 4
44 Consumer goods imports: durable goods DANE 4
45 Consumer goods imports: non-durable goods DANE 4
46 Index of imported high-value goods IMF 4
Real exchange rate
47 Exchange rate, total trade: external trade data Bank of the Republic 4
48 Exchange rate, total trade: producer price index data Bank of the Republic 4
49 Exchange rate, non-traditional: external trade data Bank of the Republic 4
50 Exchange rate, non-traditional: producer price index data Bank of the Republic 4
51 Exchange rate, indicator of competitiveness in the United States market Bank of the Republic 4
Prices: consumer price index (CPI)
52 Total DANE 4
53 Food DANE 3
54 Communications DANE 3
55 Leisure DANE 3
56 Clothing DANE 3
57 Education DANE 4
58 Other expenditure DANE 4
59 Health DANE 4
60 Transport DANE 4
61 Housing DANE 4
62 Annual variation Bank of the Republic 3
63 Regulated goods Bank of the Republic 4
64 Regulated goods: annual variation Bank of the Republic 4
65 Tradable goods Bank of the Republic 4
66 Non-tradable goods Bank of the Republic 4
67 Non-tradable goods: annual variation Bank of the Republic 4
Table A1.2 (continued)

135CEPAL Review N° 128 • August 2019
Andrés Felipe Oviedo Gómez and Lya Paola Sierra Suárez
Number Variable Source ChangePrices: producer price index (PPI)
68 Classification by economic use or purpose: capital goods DANE 4
69 Classification by economic use or purpose: final consumption DANE 4
70 Classification by economic use or purpose: intermediate consumption DANE 4
71 Classification by economic use or purpose: construction materials DANE 4
72 Domestic supply DANE 4
73 Domestic supply: agriculture, livestock, hunting, forestry and fishing DANE 4
74 Domestic supply: industry DANE 4
75 Domestic supply: mining DANE 4
76 Domestic production DANE 4
77 Domestic production: agriculture, livestock, hunting, forestry and fishing DANE 4
78 Domestic production: industry DANE 4
79 Domestic production: mining DANE 4
80 Origin: produced and consumed DANE 4
81 Origin: exported DANE 4
82 Origin: imported DANE 4
Monetary aggregates (Billions of pesos)
83 Monetary base: cash Bank of the Republic 4
84 Monetary base: bank reserves Bank of the Republic 4
85 Total monetary base Bank of the Republic 4
86 Bonds Bank of the Republic 4
87 Current accounts: private sector Bank of the Republic 4
88 Current accounts: public sector Bank of the Republic 4
89 Current accounts: total Bank of the Republic 4
90 Near money: savings accounts Bank of the Republic 4
91 Near money: certificates of deposit Bank of the Republic 2
92 Near money: total Bank of the Republic 4
93 Fiduciary deposits Bank of the Republic 4
94 Demand deposits Bank of the Republic 4
95 M1 Bank of the Republic 4
96 M2 Bank of the Republic 4
97 M3 Bank of the Republic 4
98 Current account deposits + near money + bonds + demand deposits + repurchase agreements + fiduciary deposits + certificates of deposit: total liabilities to be covered by reserves
Bank of the Republic 4
Total national employment
99 Unemployed (Thousands) DANE 4
100 Inactive (Thousands) DANE 4
101 Employed (Thousands) DANE 4
102 Unemployment rate DANE 4
103 Participation rate DANE 4
104 Employment rate DANE 4
Non-financial public sector (Billions of pesos)
105 Deficit or surplus Ministry of Finance and Public Credit 3
106 Domestic financing Ministry of Finance and Public Credit 3
107 Deficit or surplus, non-financial public companies Ministry of Finance and Public Credit 1
108 Expenditure Ministry of Finance and Public Credit 4
109 Income Ministry of Finance and Public Credit 4
110 Interest Ministry of Finance and Public Credit 4
111 External financing Ministry of Finance and Public Credit 1
Figure A1.2 (continued)

136 CEPAL Review N° 128 • August 2019
The importance of terms of trade in the Colombian economy
Number Variable Source ChangeForeign direct investment flows into Colombia (Billions of pesos)
112 Oil sector Bank of the Republic 3
113 Manufacturing Bank of the Republic 4
114 Total foreign direct investment flows Bank of the Republic 4
115 Agriculture, hunting, forestry and fishing Bank of the Republic 1
116 Commerce, restaurants and hotels Bank of the Republic 1
117 Construction Bank of the Republic 1
118 Electricity, gas and water Bank of the Republic 1
119 Mines and quarries Bank of the Republic 1
120 Financial and business services Bank of the Republic 1
121 Community-based services Bank of the Republic 1
122 Transport, storage and communications Bank of the Republic 1
123 Subtotal, remaining sectors Bank of the Republic 2
Interest rates
124 Monthly deposit interest rate Bank of the Republic 3
125 External interest rate: preferential rate Bank of the Republic 3
126 Lending rate of the Bank of the Republic Bank of the Republic 1
127 Total lending rate Bank of the Republic 1
128 Intervention rate of the Bank of the Republic Bank of the Republic 1
129 Lending rate excluding treasury operations Bank of the Republic 1
Source: Prepared by the authors, on the basis of data from Bank of the Republic, National Administrative Department of Statistics (DANE), Ministry of Finance and Public Credit and International Monetary Fund (IMF).
Table A1.2 (concluded)

137CEPAL Review N° 128 • August 2019
Andrés Felipe Oviedo Gómez and Lya Paola Sierra Suárez
Annex A2
Table A2.1 contains information on the number of lags according to the selection criterion. Three lags were used given that the model for this value is robust and consistent in the evaluation of the assumptions for residuals.
Table A2.1 Lag selection criteria
Criterion LRT FPE AIC SC HQ
Number of lags 4 4 4 0 1
Source: Prepared by the authors.Note: LRT: likelihood ratio test; FPE: final prediction error; AIC: Akaike information criterion; SC: Schwarz information criterion;
HQ: Hannan-Quinn information criterion.
Table A2.2 shows the test for autocorrelation (Lagrange Multiplier test) in residuals.
Table A2.2 Test for autocorrelation (Lagrange Multiplier test)
Period Lagrange Multiplier statistic (LM-Stat) p-value
1 79.74127 0.0886
2 75.90989 0.1464
3 69.67821 0.2924
4 66.85996 0.3791
5 67.29289 0.3651
6 47.04699 0.9447
7 74.02127 0.1836
Source: Prepared by the authors.Note: Null hypothesis: there is no correlation between the residuals.

138 CEPAL Review N° 128 • August 2019
The importance of terms of trade in the Colombian economy
Annex A3Figure A3.1
Accumulated impulse response functions of economic activity, investment, trade balance, exchange rate, prices, monetary aggregates and total consumption to generalized one standard
deviation innovations in the export price index
A. Response of economic activity to EPI B. Response of investment to EPI
C. Response of the trade balance to EPI D. Response of the exchange rate to EPI
Stan
dard
dev
iatio
n
Quarters Quarters
Quarters Quarters
Stan
dard
dev
iatio
n
Stan
dard
dev
iatio
n
Stan
dard
dev
iatio
n
Accumulated response to Cholesky one standard deviation innovations ±2
-1
0
1
2
3
4
5
6
1 2 3 4 5 6 7 8 9 10-0.4
0
0.4
0.8
1.2
1 2 3 4 5 6 7 8 9 10
-0.5
0
0.5
1.0
1.5
2.0
1 2 3 4 5 6 7 8 9 10-8
-6
-4
-2
0
2
4
1 2 3 4 5 6 7 8 9 10
Economic activity95% confidence band Investment95% confidence band
Trade balance95% confidence band Exchange rate95% confidence band

139CEPAL Review N° 128 • August 2019
Andrés Felipe Oviedo Gómez and Lya Paola Sierra Suárez
E. Response of monetary aggregates to EPI F. Response of prices to EPI
Quarters Quarters
Stan
dard
dev
iatio
n
Stan
dard
dev
iatio
n
-4
-2
0
2
4
1 2 3 4 5 6 7 8 9 10-4
-2
0
2
4
6
1 2 3 4 5 6 7 8 9 10
-1.5
-1.0
-0.5
0
0.5
1.0
1.5
1 2 3 4 5 6 7 8 9 10
G. Response of total consumption to EPI
Quarters
Stan
dard
dev
iatio
n
Monetary aggregates95% confidence band Prices95% confidence band
Total consumption95% confidence band
Source: Prepared by the authors.Note: EPI is the export price index.
Figure A3.2 Accumulated impulse response functions of economic activity, investment, trade balance,
exchange rate, prices, monetary aggregates and total consumption to generalized one standard deviation innovations in the import price index
A. Response of economic activity to IPI B. Response of investment to IPI
Stan
dard
dev
iatio
n
Quarters Quarters
Stan
dard
dev
iatio
n
Accumulated response to Cholesky one standard deviation innovations ±2
-2
-1
0
1
2
3
4
5
1 2 3 4 5 6 7 8 9 10
-4
0
4
8
1 2 3 4 5 6 7 8 9 10-8
Economic activity95% confidence band Investment95% confidence band
Figure A3.1 (concluded)

140 CEPAL Review N° 128 • August 2019
The importance of terms of trade in the Colombian economy
E. Response of monetary aggregates to IPI F. Response of prices to IPI
Quarters Quarters
Stan
dard
dev
iatio
n
Stan
dard
dev
iatio
n
G. Response of total consumption to IPI
Quarters
Stan
dard
dev
iatio
n
C. Response of the trade balance to IPI D. Response of the exchange rate to IPI
Quarters Quarters
Stan
dard
dev
iatio
n
Stan
dard
dev
iatio
n
-2.0
-1.5
-1.0
-0.5
0
0.5
1 2 3 4 5 6 7 8 9 100
2
4
6
8
10
12
1 2 3 4 5 6 7 8 9 10
-6
-4
-2
0
2
4
1 2 3 4 5 6 7 8 9 10-4
-2
0
2
4
6
1 2 3 4 5 6 7 8 9 10
-1.5
-1.0
-0.5
0
0.5
1.0
1 2 3 4 5 6 7 8 9 10
Trade balance95% confidence band Exchange rate95% confidence band
Monetary aggregates95% confidence band Prices95% confidence band
Total consumption95% confidence band
Source: Prepared by the authors.Note: IPI is the import price index.
Figure A3.2 (concluded)

141CEPAL Review N° 128 • August 2019
Andrés Felipe Oviedo Gómez and Lya Paola Sierra Suárez
Table A3.1 Variance decomposition of selected variables of interest
Variable Percentage of variance explained by export price index
Percentage of variance explained by import price index
Economic activity (GDP) 4.00 2.00
Total consumption 3.00 3.00
Monetary aggregates 2.00 3.00
Trade balance 4.00 1.00
Prices (inflation) 1.00 7.00
Real exchange rate 1.00 2.00
Investment 6.00 5.00
Source: Prepared by the authors.

Short- and long-term ex post evaluation of community-based environmental initiatives in Chile
Cristian Mardones
Abstract
This study contributes to the limited literature on environmental impact assessments by undertaking an ex post evaluation of a programme to improve the environment through various community-based initiatives that promote education and citizen participation in Chile. In line with the selection criteria for the projects and the nature of the data available, the instrumental variables method is used to determine this programme’s effect on perceived problems associated with multiple environmental issues. The results reveal that, in the short term, only the perception of odour pollution improves, while, in the long term, the impact on that issue increases twofold and the perception of air pollution and pollution caused by stray dogs both improve by a similar magnitude.
Keywords
Environment, environmental protection, community participation, programmes of action, project financing, evaluation, sustainable development, Chile
JEL classification
Q5, C26
Author
Cristian Mardones is an associate professor with the Department of Industrial Engineering of the University of Concepción (Chile). Email: [email protected].

144 CEPAL Review N° 128 • August 2019
Short- and long-term ex post evaluation of community-based environmental initiatives in Chile
I. Introduction
Community-based environmental initiatives arise from a sense of community and individuals’ motivation (Rees and Bamberg, 2014). According to Bamberg, Rees and Seebauer (2015), participation in these types of projects is underpinned by collective efficacy beliefs, identification with the group and individuals’ participative efficacy beliefs. Waylen and others (2010) show that initiatives in which local institutions participate are more likely to be successful and, moreover, that an approach is needed that arises from within the community and is then extended to businesses and government (Walker and Devine-Wright, 2008). Blum (2008) notes that these initiatives are primarily linked to environmental education, conservation and engagement. Peters, Fudge and Sinclair (2010) describe green travel, recycling, energy efficiency and biodiversity initiatives. Pujadas and Castillo (2007) assert that the local population’s participation is fundamental for the sustainable use of natural resources. Méndez-López and others (2014) evaluate local participation in the creation, design and implementation of the management plans of different conservation schemes in Mexico. The fact that community-based environmental initiatives encompass such a large number of issues shows that they have become increasingly important and commonly-used tools for mitigating environmental damage. However, the empirical literature has not settled the question of how to quantify the impact that can be attributed solely to this type of initiative (Feser, 2013).
To address this problem, impact evaluation methodologies, also known as ex post evaluations, can be used. These methodologies seek to identify the causal effect of a programme by comparing the result within the participating units with what the result would have been in the same units if they had not participated in the programme. However, this type of evaluation is difficult to carry out because it is impossible to observe both results at the same time. Fortunately, over the last three decades different statistical methods have been developed to estimate the counterfactual situation. According to Blundell and Costa Dias (2009), these methods can be classified on the basis of whether they use experimental, quasi-experimental and non-experimental designs.
This article seeks to contribute to this line of research by evaluating the causative impact of a Chilean environmental programme implemented through the Environmental Protection Fund (FPA), administered by the Ministry of the Environment. Each year this Fund awards grants to finance projects developed by social organizations to raise greater public awareness and appreciation of the environment by promoting environmental education and citizen participation.
Normally, the outcome variable to evaluate this type of programme should be the target population’s perception of environmental quality before and after each of the implemented projects. However, for this study it would be very difficult to identify the impact of the projects, given the considerable variety of those financed by FPA. Therefore, in terms of the methodological approach, one or several outcome variables common to all the projects must be established to carry out a general assessment of the programme. In addition, the beneficiaries of this programme are not selected randomly by FPA from among the social organizations, rather organizations put themselves forward (self-selection) and are chosen on the basis of the quality of the project. Consequently, any viable strategy for the ex post evaluation of the FPA programme (quasi-experimental or non-experimental design) must take into account the fact that the selection criteria vary depending on the year of implementation, the number of applications, changes to the programme, available resources and the geographical area in question. All these factors make it difficult to create control groups for the financed projects. Moreover, since there are no records of the outcome variables (perception of problems related to various environmental issues) or of the characteristics of the applicant organizations that did not receive financing, once a project has been implemented neither a quasi-experimental evaluation strategy based on difference-in-difference techniques nor a non-experimental evaluation using matching techniques or a regression discontinuity design can be applied.1
1 Furthermore, only a few projects receive financing each year (approximately 200) and the number has fallen quite close to the cut-off point, so this technique would not be useful either.

145CEPAL Review N° 128 • August 2019
Cristian Mardones
Fortunately, the programme’s participation criteria mean that an impact identification strategy, using instrumental variables, can be adopted. This technique corresponds to a non-experimental design that tries to isolate a programme’s impact when unobservable factors included in the error term of the regression are related to participation.2 To apply it, an exogenous variable must be found that affects participation in the programme but that is not correlated with other variables which may affect the result. Under these conditions, the technique produces consistent estimates of the programme’s impact. Specifically, this study takes advantage of the fact that social organizations require Internet access for the online application process and, in addition, some approved projects have not been implemented or completed because the social organizations responsible have had difficulties in filling out the regular expenses declaration online that is required under the terms of the grant.
Using instrumental variables in studies that refer to an environmental issue is not new (see Frankel and Rose, 2005; Jeffords and Minkler, 2016; Sims, 2010; Lin and Liscow, 2013; Anger and Oberndorfer, 2008). However, a literature review reveals that this is the first study in which an ex post evaluation has been undertaken of an environment-improvement programme based on initiatives that promote education and community participation. Thus, determining the programme’s effectiveness will provide evidence to justify whether it should be pursued in Chile or modified, while at the same time it could have implications for programmes that foster community-based environmental initiatives in other countries.
II. Background to the Environmental Protection Fund (FPA) and available data
1. Description of the programme
The Environmental Protection Fund (FPA) is a programme developed by the Ministry of the Environment of Chile, the purpose of which is to finance, fully or partially, citizen initiatives, including community- or association-based projects, that seek to protect or restore the environment, promote sustainable development, preserve nature or conserve environmental heritage. The core principles of selected projects, which last a maximum of 11 months, should be to raise greater public awareness and appreciation of the environment, and promote environmental education and citizen participation.
The Fund finances projects covering multiple environmental issues, so no single outcome indicator can be applied to all projects. Specifically, initiatives financed by FPA may focus on composting, energy efficiency, climate change, decontamination and biodiversity conservation, among other issues.
The programme’s target population are social organizations that submit environment-related projects and meet the requirements established in the Fund’s rules. However, organizations’ projects are chosen on the basis of the sum of money required for each project and the total amount available each year.
The programme’s annual budget is one of the largest overseen by the Ministry of the Environment of Chile, so there is growing concern about ensuring the Fund’s effectiveness. However, neither of the previous two evaluations have been able to describe the counterfactual scenario adequately, so it has not been possible to identify the programme’s causal impact (Mardones, 2015).
2. Available data
An ex post impact evaluation can be greatly affected by data availability, in terms of both time and cost. For this reason, this study uses data from the National Socioeconomic Survey (CASEN) 2013 (Ministry of Social Development, 2013), which include individual-level information on the perception of environmental
2 These unobservable factors are typically associated with the motivation or cost-benefit analysis carried out by each unit to determine participation.

146 CEPAL Review N° 128 • August 2019
Short- and long-term ex post evaluation of community-based environmental initiatives in Chile
quality and involvement in social organizations, among many other variables. Specifically, information on various environmental problems are recorded in this survey under the variables of perception of noise pollution; air pollution; water pollution; visual pollution; litter and dirt; odour pollution; contamination from landfill sites close to residential areas; contamination owing to the failure of wastewater systems; pollution caused by stray dogs; and pests. For example, of those surveyed, 20.7% said that noise pollution was a problem, 17.4% that air pollution was an issue and 30.2% that pollution caused by stray dogs was a problem, while 30.7% said that they did not have any pollution problems.
To carry out the ex post evaluation, it would have been ideal to have information on changes in the perceptions of those communities that benefited from each of the projects. However, the data from the CASEN 2013 survey (Ministry of Social Development, 2013) only indicate whether individuals were involved in social organizations,3 but not if they were involved in organizations that received FPA funding. Consequently, an alternative method for establishing the effect funded projects had on the community is to carry out analysis at the level of the smallest administrative district, the comuna, not the individual level. To do this, the average is calculated of the indicator of perception of environmental quality of all survey respondents in the same district (the average sample size per district is around 670 people). Obviously, this makes it difficult to identify the impact of community-based environmental initiatives, but it could also be argued that if the proposed methodology does reveal an impact, then the specific effect on the local community that benefited from a project must have been reasonably significant to affect the average perception of the entire population of the district.
Meanwhile, the Ministry of the Environment of Chile has a database of the projects that were awarded FPA financing in 2013. According to official figures, 190 projects were selected, of which 13.7% were not completed. Applications covered nine environmental lines of action, although most of the projects focused on the areas of “climate change and environmental decontamination” and “biodiversity conservation” (see table 1). The average number of FPA projects per district was 0.48.
Table 1 Chile: projects financed by the Environmental Protection Fund (FPA), by lines of action, 2013
(Number of projects)
Line of actionSelected projects
Finalized Not finalized Total
Activities to disseminate and promote environmental networks 9 1 10
Production activities consistent with sustainable development 5 2 7
Climate change and environmental decontamination 65 7 72
Biodiversity conservation 34 4 38
Creating, maintaining and strengthening of environmental networks 15 5 20
Energy efficiency and non-conventional renewable energies 14 4 18
Waste management and restoration of spaces 4 1 5
Sharing of experiences related to environmental actions 7 1 8
Sustainable management of natural resources 11 1 12
Total 164 26 190
Source: Ministry of the Environment of Chile [online] http://www.fpa.mma.gob.cl/busqueda/busquedaPublica.php.
To define each of the districts, explanatory variables are included, constructed from the average values of the individual data taken from the CASEN 2013 survey.4 These variables are per capita income; the proportion of rural areas; the proportion of indigenous peoples; the proportion of the working population; the proportion of social organizations; the proportion of the labour force associated
3 Involvement in social organizations is low in Chile, as 74.4% of those surveyed are not involved in any type of organization. 4 Using the average value at the individual level in each district of the country.

147CEPAL Review N° 128 • August 2019
Cristian Mardones
with natural-resource-intensive production activities; and the number of FPA-financed projects per 1,000 inhabitants (endogenous explanatory variable). Projects lasted an average of 8.6 months and had to be completed before 30 November 2013, at the latest (see figure 1).5 Meanwhile, the CASEN 2013 survey data were collected between November 2013 and January 2014, so it is expected a priori that the perception of the positive effects of environmental initiatives are more likely to have been captured in later surveys. Consequently, the dichotomous variable, “date”, is included and given the value 1 if the majority of the individual surveys for a particular district were carried out in 2014.
Figure 1 Chile: month in which projects awarded grants by the Environmental Protection Fund (FPA)
began and ended, 2013(Number of projects)
0
20
40
60
80
100
120
Jan
Feb
Mar Apr
May Jun
Jul
Aug
Sep
Oct
Nov
Dec
Start month End month
Source: Prepared by the author.
High-profile community-based interventions, such as talks, workshops and infrastructure installation, are undertaken in the early stages of the vast majority of projects. Many projects also include dissemination activities that are carried out in the final stages of the implementation timetable, once the environmental intervention has been completed. Therefore, it seems reasonable to think that, if the number of FPA-financed projects carried out in 2013 per 1,000 inhabitants is used as the treatment variable, communities can perceive projects’ short-term effects before the completion date, which means that CASEN 2013 survey data can capture changes in environmental perceptions even if the data were collected between November 2013 and January 2014. However, as the effects of some projects may not have been captured by the environmental perceptions of the entire population of a district in that short period, it was decided to evaluate the long-term effects using the treatment variable “number of FPA-funded projects carried out in 2012 per 1,000 inhabitants”.
The instrumental variables included in the regressions are the proportion of people who complete formalities over the Internet; the proportion of people who search for information using the Internet;
5 However, given the need to follow up on some projects, a new line of action was added to FPA in 2017, under the tender for sustainable projects (Concurso Proyectos Sostenibles), which sought to finance sustainable, association- or community-based initiatives that would help to improve the environmental quality of the area, raise greater public awareness and appreciation of the environment, and include and promote environmental education and citizen participation. Funding was capped at 30 million pesos and the projects had to last at least 18 months, until 30 November 2018 (see [online] http://www.fpa.mma.gob.cl/concurso-proyecto-sostenible.php). It is hoped that, as a result of this initiative, these high-quality projects will eventually become self-sufficient.

148 CEPAL Review N° 128 • August 2019
Short- and long-term ex post evaluation of community-based environmental initiatives in Chile
and the proportion of the population with access to electricity in each district (see table 2). All these variables are presumably related to the fact that more FPA projects are carried out in one district and it is quite plausible that they are not related to the perception of environmental quality, so a priori they can be considered valid instruments. According to the FPA rules, the application and regular expense reports must be done online, which acts as a major barrier for some communities in districts with low levels of connectivity that wish to apply for the programme.
Table 2 Description of the statistical variables at the district level
Variable Description Observations Average Standard deviation Minimum Maximum
Dependent variables
environment1 Percentage of the population with problems due to noise pollution 324 0.1546 0.1210 0.0000 0.7118
environment2 Percentage of the population with problems due to air pollution 324 0.1560 0.1365 0.0000 0.7487
environment3 Percentage of the population with problems due to water pollution 324 0.0685 0.0866 0.0000 0.5804
environment4 Percentage of the population with problems due to visual pollution 324 0.0246 0.0383 0.0000 0.2882
environment5 Percentage of the population with problems due to litter and dirt 324 0.1397 0.0992 0.0000 0.4706
environment6 Percentage of the population with problems due to odour pollution 324 0.1748 0.1203 0.0000 0.7529
environment7Percentage of the population with problems due to contamination from landfill sites close to residential areas
324 0.0480 0.0466 0.0000 0.2996
environment8Percentage of the population with problems due to contamination owing to the failure of wastewater systems
324 0.0430 0.0476 0.0000 0.3264
environment9 Percentage of the population with problems due to pollution caused by stray dogs 324 0.2781 0.1418 0.0000 0.7703
environment10 Percentage of the population with problems due to pests 324 0.1069 0.0834 0.0000 0.3878
Explanatory variables
numberfpa Number of FPA-financed projects in 2013 per 1 000 inhabitants 324 0.0408 0.2923 0.0000 5.0505
numberfpa t-1 Number of FPA-financed projects in 2012 per 1 000 inhabitants 324 0.0473 0.2534 0.0000 3.3670
fpaspending Spending on FPA-financed projects in 2013 per 1 000 inhabitants (pesos) 324 500 669 4 057 635 0.0000 7.10E+07
percapincome Per capita income of the district (pesos) 324 208 551 108 836 97 079 1 110 263
rural Percentage of the population living in rural areas in the district 324 0.3492 0.2816 0.0000 1.0000
work Percentage of the district’s population who work 324 0.3914 0.0571 0.2257 0.6283
socialorganization Percentage of the district’s population who are involved in social organizations 324 0.1244 0.0821 0.0124 0.6152
naturalresources Percentage of workers in activities associated with natural resources in the district 324 0.1072 0.0711 0.0000 0.3377
indigenous Percentage of the district’s population who are indigenous peoples 324 0.1326 0.1828 0.0000 0.9611
date Percentage of surveys in the district that were undertaken mostly in 2014 324 0.2624 0.4406 0.0000 1.0000
Instrumental variables
electricity Percentage of the district’s population who have access to electricity 324 0.9912 0.0203 0.7980 1.0000
formalitiesinternet Percentage of the district’s population who complete formalities over the Internet 324 0.0683 0.0620 0.0000 0.4357
informationinternet Percentage of the district’s population who search for information using the Internet 324 0.3972 0.1166 0.1482 0.8577
Source: Prepared by the author, on the basis of Ministry of Social Development, “Resultados Encuesta CASEN 2013” [online] http://observatorio.ministeriodesarrollosocial.gob.cl/casen-multidimensional/casen/casen_2013.php, and the Ministry of the Environment of Chile [online] http://www.fpa.mma.gob.cl/busqueda/busquedaPublica.php.

149CEPAL Review N° 128 • August 2019
Cristian Mardones
The reason why this study includes all these explanatory variables is because, although to date there has not been a paper that evaluated community-based environmental initiatives using quantitative ex post evaluation techniques, some relatively similar studies have applied traditional econometric methods. A summary of these studies is presented in table A1.1 in the annex, which shows that there is no standard set of explanatory variables that are commonly used in quantitative assessments of environmental initiatives. Instead, each study uses a set of variables that are contingent on data availability and variables that intuitively explain the behaviour of the dependent variable. Therefore, it is not surprising that this paper does not discuss a theoretical model that establishes a relationship between the perception of environmental quality and the explanatory variables, or between the number of environmental projects and the instrumental variables.
Nevertheless, one can intuitively infer reasons why the perception of environmental quality could depend on some of the district’s features. For example, according to the environmental Kuznets curve, perception of environmental quality should vary with the community’s per capita income; the environmental quality should be better in districts where a higher percentage of the population live in rural areas; greater economic activity would be expected in districts where a higher percentage of the population is economically active, which could create environmental pressures; greater concern for social issues, including environmental matters, would be expected in districts where a higher percentage of the population are involved in social organizations; increased environmental pressure or, alternatively, greater concern for the sustainable management of natural resources would be expected in districts with a higher percentage of workers in activities associated with those resources; and greater concern for being environmentally friendly would be expected in districts where a higher percentage of the population are indigenous peoples. Meanwhile, the percentage of surveys that were carried out at the end of 2013 in the district could be negatively related to the perception of environmental improvement resulting from FPA projects, since the community has had less time to perceive its effects, compared to communities surveyed in January 2014.
Furthermore, it could also be argued that the instrumental variables (access to electricity, carrying out formalities over the Internet and searching for information using the Internet) are related to the endogenous explanatory variable “number of FPA-funded projects in 2013 per 1,000 inhabitants”. In this regard, according to the Ministry of the Environment staff responsible for the FPA programme, many approved projects have not been completed owing to technical difficulties faced by the organizations implementing them when submitting monthly expenditure reports, which must be done online. Thus, it is clear that lower rates of Internet connectivity in a district mean that projects are less likely to be submitted or completed, while these same characteristics should not affect perception of environmental quality, controlling for the proportion of rural areas in the district.
III. Methodology
The statistical technique chosen for an ex post impact evaluation depends on data availability, the time available for the evaluation and the programme’s characteristics, among other factors. A clear understanding of the programme’s assignment rule is also needed to justify why a particular technique is used (Blundell and Costa Dias, 2009). Considering the data available in this case and the programme’s assignment rule, the instrumental variables technique is the only option for this ex post evaluation.
The simplest way to obtain the instrumental variables estimator is to use the two-stage least squares (2SLS) method. The first step is to perform a linear regression of the variable participation in the programme, Pi, relative to instrumental variable, Zi, and observable characteristics, Xi. The second

150 CEPAL Review N° 128 • August 2019
Short- and long-term ex post evaluation of community-based environmental initiatives in Chile
step is to perform a linear regression of the outcome variable, Yi, relative to the values, Pi, predicted in the first step together with other observable characteristics, Xi. It is thus possible to estimate the average treatment effect, τIV.
Pi = λ + γ·Zi + δ·Xi + ui
Yi = α + β Xi +τ IV P̂ i + εi
However, the standard errors obtained using this method are not efficient, so both equations should be calculated together using maximum likelihood estimation routines.
In addition, some statistical tests are needed to support the use of instrumental variables. In particular, it must be demonstrated that the instruments used are not weak, in other words, that they have sufficient capacity to explain the behaviour of the endogenous variable associated with participation in the programme (Pi), since if the correlation with participation is low, the deviation of the estimated treatment effect from the true effect could be considerable. An F test can be used to test weak instruments; instrumental variables are deemed to be weak if the value of this test is less than 10 (Stock and Yogo, 2005). Meanwhile, in the case of multiple instruments, a J test for overidentifying restrictions can be carried out to determine whether instrumental variables are (partially) exogenous.
IV. Results
The individual regressions for each indicator of perception of environmental quality that include all the explanatory variables are set out in table 3. The regressions included in this table are those that passed the relevant statistical tests to confirm that the instrumental variables are not weak (F test) and to check the exogeneity of the instrumental variables (J test).
The results indicate that the FPA programme has only had a significant impact (at 5%) on reducing the perception of odour pollution. Perception of the other environmental issues is not affected by the programme. These results are robust to different specifications of explanatory variables (see tables 4 and 5).
To confirm the robustness of the programme’s impact in the short term, the original treatment variable was replaced with the variable “spending on FPA-financed projects in 2013 per 1 000 inhabitants” at the district level. Tables 6, 7 and 8 show that, with this new treatment variable, the programme still only reduces the perception of odour pollution and that the coefficients of the other explanatory variables are also very similar to those set out in tables 3, 4 and 5 above. Thus, the estimated short-term effect is robust to different methods of measuring the treatment variable.
A comparison of the estimates set out in tables 3, 4 and 5 with those made using the number of FPA-financed projects per 1,000 inhabitants in 2012 as the treatment variable, shown in tables 9, 10 and 11, reveals that when more time elapses before the survey of the perception of environmental improvements is carried out, this new treatment variable is significant in three environmental components. Thus, based on the information in table 9, it can be concluded that the programme’s long-term benefits are greater that its short-term ones. Specifically, in the original model, which has more explanatory variables and includes the number of FPA-financed projects per 1,000 inhabitants with data from 2013, presented in table 3, the coefficient associated with the variable of perception of odour pollution (environment6) is -0.0932, while the effect is nearly double (-0.1768) with the number of FPA-financed projects per 1,000 inhabitants in 2012 and, in addition, there is also a reduction in the perception of air pollution (environment2) and the perception of pollution caused by stray dogs (environment9) by very similar magnitudes (-0.1784 and -0.1791). These results are robust to different specifications of the explanatory variables (see tables 10 and 11).

151CEPAL Review N° 128 • August 2019
Cristian Mardones
Tab
le 3
C
hil
e: e
stim
ates
of
the
imp
act
of t
he
nu
mb
er o
f p
roje
cts
fin
ance
d b
y th
e En
viro
nm
enta
l Pr
otec
tion
Fu
nd
(FP
A)
p
er 1
,000
inh
abit
ants
, 201
3
Depe
nden
t var
iabl
een
viron
men
t1en
viron
men
t2en
viron
men
t3en
viron
men
t4en
viron
men
t5en
viron
men
t6en
viron
men
t7en
viron
men
t8en
viron
men
t9en
viron
men
t10
num
berfp
a0.
0299
-0.0
939
0.02
31-0
.006
7-0
.002
4-0
.093
2*-0
.004
1-0
.022
2-0
.090
10.
0289
(0.0
357)
(0.0
494)
(0.0
329)
(0.0
108)
(0.0
331)
(0.0
423)
(0.0
160)
(0.0
175)
(0.0
514)
(0.0
299)
perc
apin
com
e1.
5E-0
7*2.
5E-0
7**
8.2E
-08
1.3E
-07*
*-2
.2E-
07**
-2.8
E-07
**-1
.0E-
07**
-5.1
E-08
-3.1
E-07
**-1
.6E-
07**
(6.2
E-08
)(8
.6E-
08)
(5.7
E-08
)(1
.9E-
08)
(5.7
E-08
)(7
.4E-
08)
(2.8
E-08
)(3
.0E-
08)
(8.9
E-08
)(5
.2E-
08)
rura
l-0
.091
6**
-0.0
593
-0.0
229
-0.0
028
-0.0
872*
*-0
.057
3-0
.046
1**
0.00
51-0
.099
4*-0
.040
0
(0.0
289)
(0.0
400)
(0.0
267)
(0.0
087)
(0.0
268)
(0.0
343
(0.0
129)
(0.0
142)
(0.0
416)
(0.0
242)
work
0.61
28**
0.34
41-0
.156
30.
1406
**0.
3811
**0.
6477
**0.
0756
0.21
69**
0.42
54*
0.17
00
(0.1
293)
(0.1
793)
(0.1
194)
(0.0
391)
(0.1
201)
(0.1
536)
(0.0
580)
(0.0
635)
(0.1
865)
(0.1
085)
socia
lorg
aniza
tion
-0.0
133
0.06
070.
0505
0.00
51-0
.049
30.
0380
-0.0
207
-0.0
107
0.04
870.
0230
(0.0
961)
(0.1
333)
(0.0
888)
(0.0
291)
(0.0
892)
(0.1
142)
(0.0
431)
(0.0
472)
(0.1
387)
(0.0
806)
natu
ralre
sour
ces
-0.3
764*
*0.
1273
0.20
61*
-0.1
736*
*-0
.419
2**
0.30
14*
-0.1
611*
*-0
.179
4**
-0.1
540
0.03
22
(0.1
040)
(0.1
443)
(0.0
961)
(0.0
315)
(0.0
965)
(0.1
235)
(0.0
466)
(0.0
511)
(0.1
501)
(0.0
873)
indi
geno
us-0
.049
2-0
.083
6-0
.021
0-0
.003
30.
0157
-0.1
251*
*0.
0089
0.00
95-0
.069
7-0
.152
4**
(0.0
361)
(0.0
501)
(0.0
334)
(0.0
109)
(0.0
336)
(0.0
429)
(0.0
162)
(0.0
178)
(0.0
522)
(0.0
303)
date
0.00
310.
0009
0.00
240.
0046
-0.0
022
-0.0
114
-0.0
065
-0.0
027
-0.0
301
-0.0
057
(0.0
124)
(0.0
172)
(0.0
115)
(0.0
038)
(0.0
115)
(0.0
147)
(0.0
056)
(0.0
061)
(0.0
179)
(0.0
104)
cons
tant
-0.0
370
-0.0
158
0.09
33*
-0.0
385*
0.11
65*
-0.0
149
0.07
62**
-0.0
122
0.24
14**
0.10
07*
(0.0
513)
(0.0
712)
(0.0
474)
(0.0
155)
(0.0
477)
(0.0
609)
(0.0
230)
(0.0
252)
(0.0
740)
(0.0
430)
Adju
sted
R2
0.40
700.
1028
0.01
160.
4583
0.24
050.
1528
0.19
770.
0750
0.10
080.
1430
Inst
rum
enta
l var
iabl
es
elec
tricit
yye
sye
sye
sye
sye
sye
sye
sye
sye
sye
s
form
aliti
esin
tern
etno
yes
yes
nono
yes
noye
sye
sye
s
info
rmat
ioni
nter
net
noye
sye
sno
yes
yes
noye
sye
sye
s
Firs
t ste
p (w
eak
inst
rum
ents
)
F te
st
33.4
3**
44.5
6**
44.5
6**
33.4
3**
66.6
5**
44.5
6**
33.4
3**
44.5
6**
44.5
6**
44.5
6**
Over
iden
tifyin
g re
stric
tions
J te
st-
4.64
3.70
-2.
434.
65-
1.52
3.21
0.28
Sou
rce:
Pre
pare
d by
the
auth
or.
Not
e:
(*) s
igni
fican
t at 5
%; (
**) s
igni
fican
t at 1
%.

152 CEPAL Review N° 128 • August 2019
Short- and long-term ex post evaluation of community-based environmental initiatives in Chile
Tab
le 4
C
hil
e: e
stim
ates
of
the
imp
act
of t
he
nu
mb
er o
f p
roje
cts
fin
ance
d b
y th
e En
viro
nm
enta
l Pr
otec
tion
Fu
nd
(FP
A)
p
er 1
,000
inh
abit
ants
, 201
3 (a
lter
nat
ive
spec
ifica
tion
1)a
Depe
nden
t var
iabl
een
viron
men
t1en
viron
men
t2en
viron
men
t3en
viron
men
t4en
viron
men
t5en
viron
men
t6en
viron
men
t7en
viron
men
t8en
viron
men
t9en
viron
men
t10
num
berfp
a0.
0292
-0.0
910
0.02
57-0
.006
4-0
.005
1-0
.090
1*-0
.005
2-0
.022
8-0
.087
80.
0301
(0.0
350)
(0.0
484)
(0.0
323)
(0.0
106)
(0.0
325)
(0.0
415)
(0.0
157)
(0.0
172)
(0.0
504)
(0.0
293)
perc
apin
com
e1.
5E-0
7*2.
5E-0
7**
8.3E
-08
1.3E
-07*
*-2
.2E-
07**
-2.8
E-07
**-1
.0E-
07**
-5.1
E-08
-3.1
E-07
**-1
.5E-
07**
(6.2
E-08
)(8
.6E-
08)
(5.7
E-08
)(1
.9E-
08)
(5.7
E-08
)(7
.3E-
08)
(2.8
E-08
)(3
.0E-
08)
(8.9
E-08
)(5
.2E-
08)
rura
l-0
.092
7**
-0.0
540
-0.0
185
-0.0
024
-0.0
915*
*-0
.054
2-0
.048
0**
0.00
41-0
.095
1*-0
.038
0
(0.0
277)
(0.0
384)
(0.0
256)
(0.0
084)
(0.0
257)
(0.0
328)
(0.0
124)
(0.0
136)
(0.0
399)
(0.0
232)
work
0.61
71**
0.32
49-0
.172
40.
1390
**0.
3972
**0.
6334
**0.
0823
0.22
05**
0.40
99*
0.16
26
(0.1
246)
(0.1
726)
(0.1
150)
(0.0
377)
(0.1
156)
(0.1
478)
(0.0
559)
(0.0
612)
(0.1
796)
(0.1
045)
natu
ralre
sour
ces
-0.3
784*
*0.
1363
0.21
36*
-0.1
728*
*-0
.426
5**
0.30
71*
-0.1
641*
*-0
.181
0**
-0.1
468
0.03
56
(0.1
028)
(0.1
426)
(0.0
950)
(0.0
311)
(0.0
955)
(0.1
221)
(0.0
461)
(0.0
506)
(0.1
484)
(0.0
863)
indi
geno
us-0
.051
5-0
.073
0-0
.012
3-0
.002
40.
0073
-0.1
189*
*0.
0053
0.00
77-0
.061
2-0
.148
4**
(0.0
324)
(0.0
449)
(0.0
299)
(0.0
098)
(0.0
301)
(0.0
384)
(0.0
145)
(0.0
159)
(0.0
467)
(0.0
272)
date
0.00
300.
0011
0.00
260.
0047
-0.0
024
-0.0
113
-0.0
066
-0.0
027
-0.0
299
-0.0
056
(0.0
124)
(0.0
172)
(0.0
114)
(0.0
037)
(0.0
115)
(0.0
147)
(0.0
056)
(0.0
061)
(0.0
179)
(0.0
104)
cons
tant
-0.0
394
-0.0
052
0.10
22*
-0.0
376
0.10
77*
-0.0
073
0.07
26**
-0.0
141
0.25
00**
0.10
48**
(0.0
479)
(0.0
663)
(0.0
442)
(0.0
145)
(0.0
444)
(0.0
568)
(0.0
215)
(0.0
235)
(0.0
690)
(0.0
402)
Adju
sted
R2
0.40
870.
1064
0.01
450.
4599
0.24
270.
1563
0.19
940.
0774
0.10
410.
1232
Inst
rum
enta
l var
iabl
es
elec
tricit
yye
sye
sye
sye
sye
sye
sye
sye
sye
sye
s
form
aliti
esin
tern
etno
yes
yes
nono
yes
noye
sye
sye
s
info
rmat
ioni
nter
net
noye
sye
sno
yes
nono
yes
yes
yes
Firs
t ste
p (w
eak
inst
rum
ents
)
F te
st
138.
43**
46.2
2**
46.2
2**
138.
43**
69.1
6**
69.5
3**
138.
43**
46.2
2**
46.2
2**
46.2
2**
Over
iden
tifyin
g re
stric
tions
J te
st-
4.56
3.
63
- 2.
50
4.65
-
1.54
3.
17
0.27
Sou
rce:
Pre
pare
d by
the
auth
or.
Not
e:
(*) s
igni
fican
t at 5
%; (
**) s
igni
fican
t at 1
%.
a Th
e ex
plan
ator
y va
riabl
e “s
ocia
l org
aniz
atio
n” is
om
itted
from
this
tabl
e.

153CEPAL Review N° 128 • August 2019
Cristian Mardones
Tab
le 5
C
hil
e: e
stim
ates
of
the
imp
act
of t
he
nu
mb
er o
f p
roje
cts
fin
ance
d b
y th
e En
viro
nm
enta
l Pr
otec
tion
Fu
nd
(FP
A)
p
er 1
,000
inh
abit
ants
, 201
3 (a
lter
nat
ive
spec
ifica
tion
2)a
Depe
nden
t var
iabl
een
viron
men
t1en
viron
men
t2en
viron
men
t3en
viron
men
t4en
viron
men
t5en
viron
men
t6en
viron
men
t7en
viron
men
t8en
viron
men
t9en
viron
men
t10
num
berfp
a0.
0300
-0.0
887
0.02
78-0
.005
1-0
.004
5-0
.093
4*-0
.007
0-0
.023
1-0
.094
00.
0286
(0.0
353)
(0.0
488)
(0.0
326)
(0.0
107)
(0.0
328)
(0.0
419)
(0.0
159)
(0.0
173)
(0.0
511)
(0.0
296)
perc
apin
com
e1.
5E-0
7*2.
5E-0
7**
8.7E
-08
1.3E
-07*
*-2
.2E-
07**
-2.9
E-07
**-1
.1E-
07**
-5.5
E-08
-3.5
E-07
**-1
.6E-
07**
(5.9
E-08
)(8
.2E-
08)
(5.4
E-08
)(1
.8E-
08)
(5.5
E-08
)(7
.0E-
08)
(2.7
E-08
)(2
.9E-
08)
(8.5
E-08
)(4
.9E-
08)
rura
l-0
.093
0**
-0.0
544
-0.0
189
-0.0
027
-0.0
916*
*-0
.053
3-0
.047
5**
0.00
42-0
.093
3*-0
.037
6
(0.0
276)
(0.0
383)
(0.0
255)
(0.0
084)
(0.0
257)
(0.0
329)
(0.0
124)
(0.0
136)
(0.0
401)
(0.0
232)
work
0.61
26**
0.31
97-0
.178
80.
1320
**0.
3987
**0.
6506
**0.
0921
0.22
37**
0.45
11*
0.17
09
(0.1
244)
(0.1
723)
(0.1
149)
(0.0
378)
(0.1
155)
(0.1
479)
(0.0
559)
(0.0
611)
(0.1
804)
(0.1
044)
natu
ralre
sour
ces
-0.3
751*
*0.
1376
0.21
65*
-0.1
677*
*-0
.429
1**
0.29
47*
-0.1
714*
*-0
.184
0**
-0.1
797
0.02
95
(0.1
018)
(0.1
411)
(0.0
940)
(0.0
309)
(0.0
945)
(0.1
211)
(0.0
458)
(0.0
501)
(0.1
477)
(0.0
854)
indi
geno
us-0
.051
4-0
.073
7-0
.012
7-0
.002
20.
0067
-0.1
194*
*0.
0050
0.00
74-0
.063
3-0
.148
6**
(0.0
323)
(0.0
448)
(0.0
298)
(0.0
098)
(0.0
300)
(0.0
384)
(0.0
145)
(0.0
159)
(0.0
469)
(0.0
271)
cons
tant
-0.0
381
-0.0
033
0.10
44*
-0.0
356*
0.10
76*
-0.0
122
0.06
98**
-0.0
149
0.23
90**
0.10
25
(0.0
479)
(0.0
664)
(0.0
443)
(0.0
145)
(0.0
445)
(0.0
570)
(0.0
216)
(0.0
236)
(0.0
695)
(0.0
402)
Adju
sted
R2
0.41
060.
1102
0.01
810.
4584
0.24
490.
1561
0.19
780.
0796
0.09
670.
1259
Inst
rum
enta
l var
iabl
es
elec
tricit
yye
sye
sye
sye
sye
sye
sye
sye
sye
sye
s
form
aliti
esin
tern
etno
yes
yes
nono
yes
noye
sye
sno
info
rmat
ioni
nter
net
noye
sye
sno
yes
nono
yes
yes
yes
Firs
t ste
p (w
eak
inst
rum
ents
)
F te
st
134.
70**
44.9
2**
44.9
2**
134.
70**
67.5
8**
69.5
3**
138.
43**
44.9
2**
44.9
2**
67.5
8**
Over
iden
tifyin
g re
stric
tions
J te
st-
4.48
- 2.
55
0.37
-
1.68
4.
03
0.28
Sou
rce:
Pre
pare
d by
the
auth
or.
Not
e:
(*) s
igni
fican
t at 5
%; (
**) s
igni
fican
t at 1
%.
a Th
e ex
plan
ator
y va
riabl
e “d
ate”
is o
mitt
ed fr
om th
is ta
ble.

154 CEPAL Review N° 128 • August 2019
Short- and long-term ex post evaluation of community-based environmental initiatives in Chile
Tab
le 6
C
hil
e: e
stim
ates
of
the
imp
act
of s
pen
din
g as
soci
ated
wit
h p
roje
cts
fin
ance
d b
y th
e En
viro
nm
enta
l Pr
otec
tion
Fu
nd
(FP
A)
p
er 1
,000
inh
abit
ants
, 201
3
Depe
nden
t var
iabl
een
viron
men
t1en
viron
men
t2en
viron
men
t3en
viron
men
t4en
viron
men
t5en
viron
men
t6en
viron
men
t7en
viron
men
t8en
viron
men
t9en
viron
men
t10
fpas
pend
ing
2.2E
-09
-6.7
E-09
1.8E
-09
-4.8
E-10
-8.6
E-11
-6.6
E-09
*-3
.0E-
09-1
.6E-
09-6
.4E-
092.
1E-0
9
(2.6
E-09
)(3
.6E-
09)
(2.4
E-09
)(7
.8E-
10)
(2.4
E-09
)(3
.1E-
09)
(1.2
E-09
)(1
.3E-
09)
(3.7
E-09
)(2
.2E-
09)
perc
apin
com
e1.
5E-0
7*2.
5E-0
7**
8.2E
-08
1.3E
-07*
*-2
.2E-
07**
-2.7
E-07
**-1
.0E-
07**
-5.1
E-08
-3.1
E-07
**-1
.6E-
07**
(6.2
E-08
)(8
.6E-
08)
(5.7
E-08
)(1
.9E-
08)
(5.7
E-08
)(7
.4E-
08)
(2.8
E-08
)(3
.0E-
08)
(8.9
E-08
)(5
.2E-
08)
rura
l-0
.091
6**
-0.0
594
-0.0
231
-0.0
028
-0.0
874*
*-0
.057
5-0
.046
1**
0.00
50-0
.099
7*-0
.040
0
(0.0
288)
(0.0
401)
(0.0
267)
(0.0
087)
(0.0
268)
(0.0
344)
(0.0
129)
(0.0
142)
(0.0
417)
(0.0
242)
work
0.61
59**
0.33
27-0
.156
40.
1399
**0.
3787
**0.
6350
**0.
0752
0.21
38**
0.41
23*
0.17
30
(0.1
274)
(0.1
770)
(0.1
177)
(0.0
386)
(0.1
184)
(0.1
519)
(0.0
572)
(0.0
626)
(0.1
841)
(0.1
068)
socia
lorg
aniza
tion
-0.0
108
0.05
240.
0518
0.00
45-0
.050
00.
0295
-0.0
211
-0.0
128
0.04
020.
0254
(0.0
955)
(0.1
328)
(0.0
883)
(0.0
291)
(0.0
887)
(0.1
140)
(0.0
429)
(0.0
470)
(0.1
381)
(0.0
801)
natu
ralre
sour
ces
-0.3
756*
*0.
1250
0.20
69*
-0.1
738*
*-0
.419
1**
0.29
93*
-0.1
611*
*-0
.179
9**
-0.1
561
0.03
30
(0.1
039)
(0.1
445)
(0.0
961)
(0.0
314)
(0.0
966)
(0.1
240)
(0.0
466)
(0.0
511)
(0.1
503)
(0.0
872)
indi
geno
us-0
.048
7-0
.085
6-0
.029
4-0
.003
40.
0154
-0.1
273*
*0.
0088
0.00
90-0
.071
8-0
.151
8**
(0.0
360)
(0.0
500)
(0.0
332)
(0.0
109)
(0.0
334)
(0.0
429)
(0.0
161)
(0.0
177)
(0.0
520)
(0.0
302)
date
0.00
330.
0001
0.00
260.
0046
-0.0
022
-0.0
122
-0.0
065
-0.0
029
-0.0
308
-0.0
054
(0.0
124)
(0.0
173)
(0.0
115)
(0.0
038)
(0.0
115)
(0.0
148)
(0.0
056)
(0.0
061)
(0.0
180)
(0.0
104)
cons
tant
-0.0
385
-0.0
103
0.09
32*
-0.0
381*
0.11
75*
-0.0
088
0.07
64**
-0.0
107
0.24
77**
0.09
92*
(0.0
503)
(0.0
699)
(0.0
465)
(0.0
152)
(0.0
467)
(0.0
600)
(0.0
226)
(0.0
247)
(0.0
727)
(0.0
421)
Adju
sted
R2
0.40
800.
1004
0.01
290.
4580
0.24
020.
1467
0.19
720.
0759
0.09
840.
1229
Inst
rum
enta
l var
iabl
es
elec
tricit
yye
sye
sye
sye
sye
sye
sye
sye
sye
sye
s
form
aliti
esin
tern
etno
yes
yes
nono
yes
noye
sye
sye
s
info
rmat
ioni
nter
net
nono
yes
noye
sye
sno
yes
yes
yes
Firs
t ste
p (w
eak
inst
rum
ents
)
F te
st
127.
60**
64.0
1**
42.5
4**
127.
60**
63.6
2**
42.5
4**
127.
60**
42.5
4**
42.5
4**
42.5
4**
Over
iden
tifyin
g re
stric
tions
J te
st-
0.75
3.63
-2.
444.
80-
1.59
3.35
0.28
Sou
rce:
Pre
pare
d by
the
auth
or.
Not
e:
(*) s
igni
fican
t at 5
%; (
**) s
igni
fican
t at 1
%.

155CEPAL Review N° 128 • August 2019
Cristian Mardones
Tab
le 7
C
hil
e: e
stim
ates
of
the
imp
act
of s
pen
din
g as
soci
ated
wit
h p
roje
cts
fin
ance
d b
y th
e En
viro
nm
enta
l Pr
otec
tion
Fu
nd
(FP
A)
p
er 1
,000
inh
abit
ants
, 201
3 (a
lter
nat
ive
spec
ifica
tion
1)a
Depe
nden
t var
iabl
een
viron
men
t1en
viron
men
t2en
viron
men
t3en
viron
men
t4en
viron
men
t5en
viron
men
t6en
viron
men
t7en
viron
men
t8en
viron
men
t9en
viron
men
t10
fpas
pend
ing
2.1E
-09
-6.5
E-09
2.0E
-09
-4.6
E-10
-2.8
E-10
-6.6
E-09
*-3
.8E-
10-1
.6E-
09-6
.1E-
09-2
.2E-
09
(2.5
E-09
)(3
.5E-
09)
(2.3
E-09
)(7
.7E-
10)
(2.4
E-10
)(3
.0E-
09)
(1.1
E-09
)(1
.2E-
09)
(3.7
E-09
)(2
.1E-
09)
perc
apin
com
e1.
5E-0
7*2.
5E-0
7**
8.2E
-08
1.3E
-07*
*-2
.2E-
07**
-2.7
E-07
**-1
.2E-
07**
-5.1
E-08
-3.1
E-07
**-1
.6E-
07**
(6.2
E-08
)(8
.6E-
08)
(5.7
E-08
)(1
.9E-
08)
(5.7
E-08
)(7
.3E-
08)
(2.8
E-08
)(3
.0E-
08)
(8.9
E-08
)(5
.2E-
08)
rura
l-0
.092
5**
-0.0
549
-0.0
186
-0.0
024
-0.0
918*
*-0
.054
8-0
.048
0**
0.00
39-0
.096
1*-0
.037
8
(0.0
276)
(0.0
383)
(0.0
255)
(0.0
084)
(0.0
256)
(0.0
329)
(0.0
124)
(0.0
136)
(0.0
399)
(0.0
232)
work
0.61
94**
0.31
48-0
.172
80.
1385
**0.
3948
**0.
6269
**0.
0819
0.21
79**
0.39
96*
0.16
49
(0.1
232)
(0.1
711)
(0.1
138)
(0.0
373)
(0.1
144)
(0.1
469)
(0.0
553)
(0.0
606)
(0.1
780)
(0.1
033)
natu
ralre
sour
ces
-0.3
773*
*0.
1329
0.21
47*
-0.1
731*
*-0
.426
6**
0.30
37*
-0.1
643*
*-0
.181
8**
-0.1
500
0.03
68
(0.1
028)
(0.1
428)
(0.0
950)
(0.0
311)
(0.0
955)
(0.1
226)
(0.0
461)
(0.0
505)
(0.1
486)
(0.0
863)
indi
geno
us-0
.050
6-0
.076
7-0
.011
9-0
.002
60.
0067
-0.1
219*
*0.
0051
0.00
67-0
.064
8-0
.147
4**
(0.0
319)
(0.0
444)
(0.0
295)
(0.0
097)
(0.0
297)
(0.0
381)
(0.0
143)
(0.0
157)
(0.0
461)
(0.0
268)
date
0.00
330.
0003
0.00
290.
0046
-0.0
024
-0.0
121
-0.0
066
-0.0
029
-0.0
307
-0.0
053
(0.0
124)
(0.0
172)
(0.0
115)
(0.0
038)
(0.0
115)
(0.0
148)
(0.0
056)
(0.0
061)
(0.0
179)
(0.0
104)
cons
tant
-0.0
404
-0.0
006
0.10
23*
-0.0
373
0.10
87*
-0.0
042
0.07
27**
-0.0
129
0.25
47**
0.10
37**
(0.0
472)
(0.0
655)
(0.0
436)
(0.0
143)
**(0
.043
8)(0
.056
2)(0
.021
3)(0
.023
2)(0
.068
1)(0
.039
6)
Adju
sted
R2
0.40
980.
1044
0.01
580.
4596
0.24
230.
1496
0.19
870.
0782
0.10
170.
1248
Inst
rum
enta
l var
iabl
es
elec
tricit
yye
sye
sye
sye
sye
sye
sye
sye
sye
sye
s
form
aliti
esin
tern
etno
yes
yes
nono
yes
noye
sye
sye
s
info
rmat
ioni
nter
net
noye
sye
sno
yes
nono
yes
yes
yes
Firs
t ste
p (w
eak
inst
rum
ents
)
F te
st
131.
35**
43.7
9**
43.7
9**
131.
35**
64.5
9**
65.8
9**
131.
35**
43.7
9**
43.7
9**
43.7
9**
Over
iden
tifyin
g re
stric
tions
J te
st-
4.71
3.
56
- 2.
51
0.38
-
1.62
3.
31
0.27
Sou
rce:
Pre
pare
d by
the
auth
or.
Not
e:
(*) s
igni
fican
t at 5
%; (
**) s
igni
fican
t at 1
%.
a Th
e ex
plan
ator
y va
riabl
e “s
ocia
l org
aniz
atio
n” is
om
itted
from
this
tabl
e.

156 CEPAL Review N° 128 • August 2019
Short- and long-term ex post evaluation of community-based environmental initiatives in Chile
Tab
le 8
C
hil
e: e
stim
ates
of
the
imp
act
of s
pen
din
g as
soci
ated
wit
h p
roje
cts
fin
ance
d b
y th
e En
viro
nm
enta
l Pr
otec
tion
Fu
nd
(FP
A)
p
er 1
,000
inh
abit
ants
, 201
3 (a
lter
nat
ive
spec
ifica
tion
2)a
Depe
nden
t var
iabl
een
viron
men
t1en
viron
men
t2en
viron
men
t3en
viron
men
t4en
viron
men
t5en
viron
men
t6en
viron
men
t7en
viron
men
t8en
viron
men
t9en
viron
men
t10
fpas
pend
ing
2.2E
-09
-6.3
E-09
2.1E
-09
-3.7
E-10
-2.2
E-10
-6.8
E-09
*-5
.1E-
10-1
.6E-
09-6
.6E-
092.
1E-0
9
(2.6
E-09
)(3
.6E-
08)
(2.4
E-09
)(7
.8E-
10)
(2.4
E-09
)(3
.1E-
09)
(1.2
E-09
)(1
.3E-
09)
(3.7
E-09
)(2
.2E-
08)
perc
apin
com
e1.
5E-0
7*2.
5E-0
7**
8.7E
-08
1.3E
-07*
*2.
2E-0
7**
-2.9
E-07
**-1
.1E-
07**
-5.5
E-08
-3.5
E-07
**-1
.6E-
07**
(5.9
E-08
)(8
.2E-
08)
(5.4
E-08
)(1
.8E-
08)
(5.5
E-08
)(7
.0E-
08)
(2.7
E-08
)(2
.9E-
08)
(8.6
E-08
)(4
.9E-
08)
rura
l-0
.092
8**
-0.0
544
-0.0
191
-0.0
028
-0.0
919*
*-0
.053
9-0
.047
5**
0.00
40-0
.094
4*-0
.037
4
(0.0
276)
(0.0
383)
(0.0
255)
(0.0
084)
(0.0
256)
(0.0
330)
(0.0
124)
(0.0
136)
(0.0
401)
(0.0
231)
work
0.61
45**
0.31
03-0
.179
90.
1317
**0.
3959
**0.
6452
**0.
0917
0.22
12**
0.44
02*
0.17
26
(0.1
232)
(0.1
710)
(0.1
138)
(0.0
374)
(0.1
145)
(0.1
472)
(0.0
554)
(0.0
606)
(0.1
791)
(0.1
034)
natu
ralre
sour
ces
-0.3
736*
*0.
1335
0.21
81*
-0.1
679*
*-0
.429
1**
0.29
01*
-0.1
718*
*-0
.185
1**
-0.1
840
0.03
09
(0.1
017)
(0.1
412)
(0.0
940)
(0.0
309)
(0.0
946)
(0.1
217)
(0.0
458)
(0.0
501)
(0.1
479)
(0.0
854)
indi
geno
us-0
.050
4-0
.077
4-0
.012
2-0
.002
30.
0061
-0.1
225*
*0.
0048
0.00
63-0
.067
4-0
.147
7**
(0.0
319)
(0.0
442)
(0.0
294)
(0.0
097)
(0.0
296)
(0.0
381)
(0.0
143)
(0.0
157)
(0.0
463)
(0.0
267)
cons
tant
-0.0
391
0.00
120.
1046
*-0
.035
4*0.
1087
*-0
.009
30.
0700
**-0
.013
70.
2441
**0.
1016
(0.0
473)
(0.0
656)
(0.0
437)
(0.0
143)
(0.0
440)
(0.0
565)
(0.0
213)
(0.0
233)
(0.0
687)
(0.0
397)
Adju
sted
R2
0.41
160.
1084
0.01
930.
4582
0.24
440.
1488
0.19
680.
0803
0.09
390.
1275
Inst
rum
enta
l var
iabl
es
elec
tricit
yye
sye
sye
sye
sye
sye
sye
sye
sye
sye
s
form
aliti
esin
tern
etno
yes
yes
nono
yes
noye
sye
sye
s
info
rmat
ioni
nter
net
noye
sye
sno
yes
nono
yes
yes
yes
Firs
t ste
p (w
eak
inst
rum
ents
)
F te
st
126.
75**
42.2
8**
42.2
8**
126.
75**
63.1
9**
63.5
1**
126.
75**
42.2
8**
42.2
8**
42.2
8**
Over
iden
tifyin
g re
stric
tions
J te
st-
4.64
3.
35
- 2.
56
0.35
-
1.78
4.
23
0.28
Sou
rce:
Pre
pare
d by
the
auth
or.
Not
e:
(*) s
igni
fican
t at 5
%; (
**) s
igni
fican
t at 1
%.
a Th
e ex
plan
ator
y va
riabl
e “d
ate”
is o
mitt
ed fr
om th
is ta
ble.

157CEPAL Review N° 128 • August 2019
Cristian Mardones
Tab
le 9
C
hil
e: e
stim
ates
of
the
imp
act
of t
he
nu
mb
er o
f p
roje
cts
fin
ance
d b
y th
e En
viro
nm
enta
l Pr
otec
tion
Fu
nd
(FP
A)
p
er 1
,000
inh
abit
ants
, 201
2
Depe
nden
t var
iabl
een
viron
men
t1en
viron
men
t2en
viron
men
t3en
viron
men
t4en
viron
men
t5en
viron
men
t6en
viron
men
t7en
viron
men
t8en
viron
men
t9en
viron
men
t10
num
berfp
a t-1
0.05
26-0
.178
4*0.
0216
-0.0
118
-0.0
186
-0.1
768*
-0.0
073
-0.0
435
-0.1
791*
0.05
00
(0.0
633)
(0.0
871)
(0.0
566)
(0.0
190)
0.05
72(0
.075
5)(0
.028
1)(0
.030
8)(0
.089
8)(0
.051
8)
perc
apin
com
e1.
5E-0
7*2.
3E-0
7**
8.3E
-08
1.3E
-07*
*-2
.2E-
07**
-2.9
E-07
**-1
.0E-
07**
-5.4
E-08
-3.2
E-07
**-1
.5E-
07**
(6.3
E-08
)(8
.8E-
08)
(5.7
E-08
)(1
.9E-
08)
(5.8
E-08
)(7
.7E-
08)
(2.8
E-08
)(3
.2E-
08)
(9.1
E-08
)(5
.3E-
08)
rura
l-0
.095
7**
-0.0
443
-0.0
230
-0.0
019
-0.0
846*
*-0
.042
5-0
.045
6**
0.00
88-0
.083
7-0
.043
8
(0.0
304)
(0.0
426)
(0.0
277)
(0.0
091)
(0.0
279)
(0.0
370)
(0.0
135)
(0.0
151)
(0.0
440)
(0.0
254)
work
0.58
43**
0.45
50*
-0.1
477
0.14
70**
0.40
64**
0.75
69**
0.07
960.
2451
**0.
5441
*0.
1439
(0.1
509)
(0.2
102)
(0.1
367)
(0.0
453)
(0.1
378)
(0.1
824)
(0.0
670)
(0.0
744)
(0.2
168)
(0.1
251)
socia
lorg
aniza
tion
-0.0
092
0.05
040.
0578
0.00
42-0
.046
50.
0279
-0.0
213
-0.0
129
0.04
060.
0272
(0.0
960)
(0.1
352)
(0.0
879)
(0.0
288)
(0.0
885)
(0.1
173)
(0.0
427)
(0.0
478)
(0.1
394)
(0.0
804)
natu
ralre
sour
ces
-0.3
719*
*0.
1111
0.20
68*
-0.1
746*
*-0
.421
7**
0.28
57*
-0.1
617*
*-0
.183
4**
-0.1
705
0.03
64
(0.1
051)
(0.1
480)
(0.0
963)
(0.0
356)
(0.0
969)
(0.1
284)
(0.0
467)
(0.0
524)
(0.1
527)
(0.0
881)
indi
geno
us-0
.062
2-0
.037
9-0
.023
6-0
.000
40.
0224
-0.0
798*
*0.
0107
0.02
08-0
.022
7-0
.164
5**
(0.0
431)
(0.0
602)
(0.0
391)
(0.0
129)
(0.0
394)
(0.0
522)
(0.0
191)
(0.0
213)
(0.0
621)
(0.0
358)
date
0.00
00-0
.000
00.
0000
0.00
01-0
.000
0-0
.000
2-0
.000
1-0
.000
0-0
.000
4-0
.000
1
(0.0
001)
(0.0
002)
(0.0
001)
(0.0
000)
(0.0
001)
(0.0
002)
(0.0
001)
(0.0
001)
(0.0
002)
(0.0
001)
cons
tant
-8.7
263
3.99
75-5
.620
5-1
0.12
985.
9623
32.2
636
14.9
707
7.62
9274
.796
511
.190
6
(28.
5223
)(4
0.15
37)
(26.
1195
)(8
.563
9)(2
6.28
22)
(34.
8401
)(1
2.67
68)
(14.
2031
)(4
1.41
40)
(23.
8969
)
Adju
sted
R2
0.39
780.
0614
-0.0
187
0.45
830.
2397
0.09
000.
1990
0.03
530.
0751
0.10
98
Inst
rum
enta
l var
iabl
es
elec
tricit
yye
sye
sye
sye
sye
sye
sye
sye
sye
sye
s
form
aliti
esin
tern
etno
yes
yes
nono
yes
noye
sye
sye
s
info
rmat
ioni
nter
net
noye
sye
sno
yes
yes
noye
sye
sye
s
Firs
t ste
p (w
eak
inst
rum
ents
)
F te
st
49.0
9**
17.1
9**
17.1
9**
49.0
9**
25.6
7**
17.1
9**
49.0
9**
17.1
9**
17.1
9**
17.1
9**
Over
iden
tifyin
g re
stric
tions
J te
st-
3.68
4.07
-2.
333.
35-
1.00
2.13
0.27
Sou
rce:
Pre
pare
d by
the
auth
or.
Not
e:
(*) s
igni
fican
t at 5
%; (
**) s
igni
fican
t at 1
%.

158 CEPAL Review N° 128 • August 2019
Short- and long-term ex post evaluation of community-based environmental initiatives in Chile
Tab
le 1
0
Ch
ile:
est
imat
es o
f th
e im
pac
t of
th
e n
um
ber
of
pro
ject
s fi
nan
ced
by
the
Envi
ron
men
tal
Prot
ecti
on F
un
d (
FPA
)
per
1,0
00 in
hab
itan
ts, 2
012
(alt
ern
ativ
e sp
ecifi
cati
on 1
)a
Depe
nden
t var
iabl
een
viron
men
t1en
viron
men
t2en
viron
men
t3en
viron
men
t4en
viron
men
t5en
viron
men
t6en
viron
men
t7en
viron
men
t8en
viron
men
t9en
viron
men
t10
num
berfp
a t-1
0.05
17-0
.173
6*0.
0270
-0.0
114
-0.0
230
-0.1
546*
-0.0
093
-0.0
447
-0.1
753*
0.05
26
(0.0
626)
(0.0
859)
(0.0
560)
(0.0
188)
0.05
66(0
.074
8)(0
.027
8)(0
.030
5)(0
.088
7)(0
.053
0)
perc
apin
com
e1.
5E-0
7*2.
3E-0
7**
8.4E
-08
1.3E
-07*
*-2
.2E-
07**
-2.9
E-07
**-1
.0E-
07**
-5.4
E-08
-3.2
E-07
**-1
.5E-
07**
(6.3
E-08
)(8
.8E-
08)
(5.7
E-08
)(1
.9E-
08)
(5.8
E-08
)(7
.6E-
08)
(2.8
E-08
)(3
.1E-
08)
(9.1
E-08
)(5
.3E-
08)
rura
l-0
.096
4**
-0.0
402
-0.0
184
-0.0
016
-0.0
884*
*-0
.043
8-0
.047
3**
0.00
78-0
.080
5-0
.041
6
(0.0
293)
(0.0
410)
(0.0
267)
(0.0
088)
(0.0
269)
(0.0
354)
(0.0
130)
(0.0
146)
(0.0
424)
(0.0
245)
work
0.58
77**
0.43
56*
-0.1
696
0.14
54**
0.42
39**
0.71
62**
0.08
760.
2499
**0.
5288
*0.
1336
(0.1
462)
(0.2
035)
(0.1
325)
(0.0
439)
(0.1
337)
(0.1
759)
(0.0
650)
(0.0
722)
(0.2
100)
(0.1
215)
natu
ralre
sour
ces
-0.3
733*
*0.
1192
0.21
60*
-0.1
739*
*-0
.429
0**
0.29
21*
-0.1
651*
*-0
.185
4**
-0.1
642
0.04
08
(0.1
038)
(0.1
460)
(0.0
951)
(0.0
312)
(0.0
958)
(0.1
256)
(0.0
461)
(0.0
518)
(0.1
507)
(0.0
871)
indi
geno
us-0
.063
6-0
.030
3-0
.014
80.
0003
0.01
54-0
.084
1**
0.00
750.
0188
-0.0
166
-0.1
604*
*
(0.0
405)
(0.0
563)
(0.0
367)
(0.0
122)
(0.0
370)
(0.0
487)
(0.0
180)
(0.0
200)
(0.0
581)
(0.0
336)
date
0.00
38-0
.001
70.
0028
0.00
45-0
.002
9-0
.013
5-0
.006
7-0
.003
5-0
.032
8-0
.004
8
(0.0
126)
(0.0
177)
(0.0
115)
(0.0
038)
(0.0
116)
(0.0
152)
(0.0
056)
(0.0
063)
(0.0
182)
(0.0
105)
cons
tant
-0.0
278
-0.0
494
0.10
06-0
.040
10.
0967
-0.0
400
0.07
05-0
.025
90.
2024
*0.
1163
*
(0.0
570)
(0.0
793)
(0.0
516)
(0.0
171)
*(0
.052
1)(0
.068
6)(0
.025
3)(0
.028
1)(0
.081
8)(0
.047
3)
Adju
sted
R2
0.40
000.
0676
0.01
810.
4600
0.24
090.
1118
0.20
070.
0359
0.08
010.
1104
Inst
rum
enta
l var
iabl
es
elec
tricit
yye
sye
sye
sye
sye
sye
sye
sye
sye
sye
s
form
aliti
esin
tern
etno
yes
yes
nono
yes
noye
sye
sye
s
info
rmat
ioni
nter
net
noye
sye
sno
yes
yes
noye
sye
sye
s
Firs
t ste
p (w
eak
inst
rum
ents
)
F te
st
50.2
5**
17.5
8**
17.5
8**
50.2
5**
26.2
5**
17.5
8**
50.2
5**
17.5
8**
17.5
8**
17.5
8**
Over
iden
tifyin
g re
stric
tions
J te
st-
3.66
4.05
-2.
350.
60-
1.02
2.13
0.26
Sou
rce:
Pre
pare
d by
the
auth
or.
Not
e:
(*) s
igni
fican
t at 5
%; (
**) s
igni
fican
t at 1
%.
a Th
e ex
plan
ator
y va
riabl
e “s
ocia
l org
aniz
atio
n” is
om
itted
from
this
tabl
e.

159CEPAL Review N° 128 • August 2019
Cristian Mardones
Tab
le 1
1 C
hil
e: e
stim
ates
of
the
imp
act
of t
he
nu
mb
er o
f p
roje
cts
fin
ance
d b
y th
e En
viro
nm
enta
l Pr
otec
tion
Fu
nd
(FP
A)
p
er 1
,000
inh
abit
ants
, 201
2 (a
lter
nat
ive
spec
ifica
tion
2)a
Depe
nden
t var
iabl
een
viron
men
t1en
viron
men
t2en
viron
men
t3en
viron
men
t4en
viron
men
t5en
viron
men
t6en
viron
men
t7en
viron
men
t8en
viron
men
t9en
viron
men
t10
num
berfp
a t-1
0.05
36-0
.170
30.
0324
-0.0
092
-0.0
217
-0.1
619*
-0.0
126
-0.0
456
-0.1
904*
0.05
01
(0.0
636)
(0.0
877)
(0.0
571)
(0.0
191)
0.05
78(0
.076
5)(0
.028
4)(0
.031
2)(0
.091
6)(0
.052
4)
perc
apin
com
e1.
6E-0
7**
2.3E
-07*
*8.
9E-0
81.
3E-0
7**
-2.3
E-07
**-3
.1E-
07**
-1.1
E-07
**-6
.0E-
08*
-3.7
E-07
**-1
.6E-
07**
(6.0
E-08
)(8
.4E-
08)
(5.5
E-08
)(1
.8E-
08)
(5.5
E-08
)(7
.3E-
08)
(2.7
E-08
)(3
.0E-
08)
(8.8
E-08
)(5
.0E-
08)
rura
l-0
.096
8**
-0.0
408
-0.0
194
-0.0
021
-0.0
885*
*-0
.042
2-0
.046
7**
0.00
88-0
.077
1-0
.041
1
(0.0
293)
(0.0
411)
(0.0
268)
(0.0
088)
(0.0
270)
(0.0
356)
(0.0
131)
(0.0
146)
(0.0
429)
(0.0
245)
work
0.58
10**
0.43
21*
-0.1
810
0.13
74**
0.42
49**
0.74
13**
0.09
960.
2550
**0.
5856
**0.
1423
(0.1
478)
(0.2
057)
(0.1
340)
(0.0
445)
(0.1
354)
(0.1
786)
(0.0
659)
(0.0
732)
(0.2
148)
(0.1
229)
natu
ralre
sour
ces
-0.3
689*
*0.
1178
0.21
98*
-0.1
687*
*-0
.432
0**
0.27
63*
-0.1
729*
*-0
.189
3**
-0.2
021
0.03
52
(0.1
030)
(0.1
445)
(0.0
941)
(0.0
310)
(0.0
949)
(0.1
250)
(0.0
459)
(0.0
514)
(0.1
509)
(0.0
863)
indi
geno
us-0
.063
8-0
.032
0-0
.016
8-0
.000
00.
0144
-0.0
829
0.00
790.
0188
-0.0
148
-0.1
600*
*
(0.0
406)
(0.0
565)
(0.0
368)
(0.0
122)
(0.0
372)
(0.0
490)
(0.0
181)
(0.0
201)
(0.0
590)
(0.0
337)
cons
tant
-0.0
257
-0.0
476
0.10
47-0
.037
70.
0969
-0.0
475
0.06
69-0
.027
20.
1857
0.11
37*
(0.0
577)
(0.0
802)
(0.0
522)
(0.0
174)
(0.0
528)
(0.0
697)
(0.0
257)
(0.0
285)
(0.0
838)
(0.0
479)
Adju
sted
R2
0.40
120.
0730
0.02
330.
4590
0.24
340.
1065
0.19
880.
0361
0.06
38-0
.245
Inst
rum
enta
l var
iabl
es
elec
tricit
yye
sye
sye
sye
sye
sye
sye
sye
sye
sye
s
form
aliti
esin
tern
etno
yes
yes
nono
yes
noye
sye
sye
s
info
rmat
ioni
nter
net
noye
sye
sno
yes
yes
noye
sye
sye
s
Firs
t ste
p (w
eak
inst
rum
ents
)
F te
st
48.2
7**
16.6
6**
16.6
6**
48.2
7**
24.8
5**
16.6
6**
48.2
7**
16.6
6**
16.6
6**
16.6
6**
Over
iden
tifyin
g re
stric
tions
J te
st-
3.68
3.87
-2.
420.
57-
1.16
2.81
0.29
Sou
rce:
Pre
pare
d by
the
auth
or.
Not
e:
(*) s
igni
fican
t at 5
%; (
**) s
igni
fican
t at 1
%.
a Th
e ex
plan
ator
y va
riabl
e “d
ate”
is o
mitt
ed fr
om th
is ta
ble.

160 CEPAL Review N° 128 • August 2019
Short- and long-term ex post evaluation of community-based environmental initiatives in Chile
Furthermore, to validate the choice of method, it must be demonstrated that the instrumental variables are related to the endogenous explanatory variable but are not related to the dependent variable. In other words, the instruments do not need to explain the perception of environmental quality but, at the same time, the instrument must help to explain the number of FPA-financed projects or spending on FPA-financed projects per 1,000 inhabitants at the district level. As stated above, according to the Ministry of the Environment staff responsible for the programme, these projects are less likely to be completed successfully when it is difficult for project coordinators to submit expenditure reports because they do not have access to the Internet. The same argument could be used to substantiate the claim that communities without Internet access are less likely to submit projects for FPA financing. Therefore, districts where Internet access rates are higher, and whose population is more likely to carry out formalities over the Internet and to search for information using the Internet, are more likely to have a higher number of FPA-financed projects or spending associated with FPA-financed projects. Moreover, there is no apparent relationship between these instrumental variables and the perception of environmental quality variables. The results presented in tables 3-11 show that all the estimated regressions of the instrumental variables used meet the relevance test (F test) and the exogeneity test (J test). It can therefore be said that the instrumental variables are suitable for determining the programme’s impact.
Lastly, the effect of the other explanatory variables on the different indicators of perception of environmental quality is observed to be robust to the different specifications and treatment variables used. The higher the percentage of the population living in rural areas in a district, the lower the perception of noise pollution, litter and dirt, and contamination from landfill sites close to residential areas. The higher the percentage of workers with respect to the total population, the higher the perception of noise pollution, visual pollution, litter and dirt, odour pollution, contamination owing to the failure of wastewater systems and pollution caused by stray dogs. The higher the percentage of workers in activities associated with natural resources, the lower the perception of noise pollution, visual pollution, litter and dirt, contamination from landfill sites close to residential areas and contamination owing to the failure of wastewater systems, but also the higher the perception of water pollution and odour pollution (in all likelihood both are linked to livestock farming activities). The higher the percentage of indigenous peoples in the population of the district, the lower the perception of odour pollution and pests. Finally, the higher the per capita income in the district, the higher the perception of noise pollution, air pollution, visual pollution, but the lower the perception of litter and dirt, odour pollution, contamination from landfill sites close to residential areas, pollution caused by stray dogs and pests. Consequently, this last result indicates the existence of different Kuznets curves in Chile, depending on the type of pollution that is being analysed.
V. Conclusions
This study contributes empirical evidence to the existing literature on the evaluation and effectiveness of environmental policies that improve the allocation of resources in Chile. Moreover, it is innovative, as no previous studies have used quantitative ex post evaluation methodologies to determine the impact of community-based environmental initiatives in other countries.
As previous studies only use qualitative methodologies to address this problem, there is no standard set of explanatory variables that can be included in the specifications of the statistical regression models. However, a literature review was undertaken of traditional econometric methodologies applied to environmental issues, which revealed that explanatory variables are included depending on the context of each study. Consequently, the explanatory variables included in this paper were determined

161CEPAL Review N° 128 • August 2019
Cristian Mardones
by the information available in the database of the National Socioeconomic Survey (CASEN) of 2013, which allowed each district to be typified and the perception of environmental quality in each one to be monitored.
The results of the statistical tests show that the instruments used are suitable for estimating the impacts of the programme. Therefore, it can be concluded that the programme has a significant statistical impact only on reducing the perception of odour pollution in the short term, while perception of the other nine environmental components was not affected. In the long term, the estimated impact on perception of odour pollution increased twofold, and perception of air pollution and pollution caused by stray dogs both improved by a similar magnitude. These results seem reasonable given that 39.6% of the projects selected by FPA are related to the issues of climate change and environmental decontamination. However, a large number of projects do not appear to be having any significant impact and deal with the issues of biodiversity conservation (20.7%), environmental networks (18.9%), energy efficiency and non-conventional renewable energies (8.5%) and sustainable management of natural resources (6.7%), among others. Therefore, it is natural to conclude that resources must be reallocated to improve the impact of the FPA programme.
The study’s estimates also provide insight into the programme’s cost-effectiveness to improve perception of different environmental components. Given that the estimated short-term effect of the variable “number of FPA-financed projects per 1,000 inhabitants” is a reduction of 9.32% in the perception of odour pollution, if the number of FPA-finance projects is increased by one in a district with an average population of 53,312, the perception of odour pollution would be reduced by 0.175%, at an average cost per project of 2.25 million pesos, so 12.9 million pesos would have to be invested in order to reduce that perception by 1 percentage point in that particular district. Applying the same procedure reveals that, in the long term, the perception of odour pollution would be reduced by 0.332%, so only 6.78 million pesos would have to be invested to reduce that perception by 1 percentage point. At the same time 6.72 million pesos would have to be invested to reduce the perception of air pollution by 1 percentage point and 6.70 million pesos to reduce the perception of pollution caused by stray dogs by the same magnitude. Lastly, the cost-effectiveness indicator is infinite for each of the other environmental components, since no statistically significant impact is created.
One limitation of this study is that when a programme evaluation is carried out at the district level its impact cannot be identified accurately if the beneficiary population accounts for a relatively small percentage of the total population of the district. While it would have been ideal to have more data available to carry out the evaluation of the FPA programme, for example through the selection of a treatment group and a control group, this information has not been gathered because of the high cost of collecting data in territories far from the mainland, the difficulty of defining credible control groups and the low number of selected projects and non-selected projects, despite the fact that a study was carried out for the Ministry of the Environment which sets out the methodological design for collecting data and applying quasi-experimental and non-experimental techniques to evaluate this programme (Mardones, 2015). Consequently, this non-experimental evaluation using the instrumental variables method provides a general overview of the impact of the FPA programme at the district level and allows the programme’s cost-effectiveness to be determined very cheaply, since secondary information is used, thus constituting an interesting and useful empirical application for the ex post evaluation of environmental policies.

162 CEPAL Review N° 128 • August 2019
Short- and long-term ex post evaluation of community-based environmental initiatives in Chile
Bibliography
Anger, N. and U. Oberndorfer (2008), “Firm performance and employment in the EU emissions trading scheme: an empirical assessment for Germany”, Energy Policy, vol. 36, No. 1, Amsterdam, Elsevier.
Bamberg, S., J. Rees and S. Seebauer (2015), “Collective climate action: determinants of participation intention in community-based pro-environmental initiatives”, Journal of Environmental Psychology, vol. 43, Amsterdam, Elsevier.
Baptiste, A., C. Foley and R. Smardon (2015), “Understanding urban neighborhood differences in willingness to implement green infrastructure measures: a case study of Syracuse, NY”, Landscape and Urban Planning, vol. 136, Amsterdam, Elsevier.
Blum, N. (2008), “Environmental education in Costa Rica: building a framework for sustainable development?”, International Journal of Educational Development, vol. 28, No. 3, Amsterdam, Elsevier.
Blundell, R. and M. Costa Dias (2009), “Alternative approaches to evaluation in empirical microeconomics”, Journal of Human Resources, vol. 44, No. 3, Madison, University of Wisconsin Press.
Byrne, J., A. Lo and Y. Jianjun (2015), “Residents’ understanding of the role of green infrastructure for climate change adaptation in Hangzhou, China”, Landscape and Urban Planning, vol. 138, Amsterdam, Elsevier.
Carrus, G. and others (2015). “Go greener, feel better? The positive effects of biodiversity on the well-being of individuals visiting urban and peri-urban green areas”, Landscape and Urban Planning, vol. 134, Amsterdam, Elsevier.
Castro, A. and others (2011), “Social preferences regarding the delivery of ecosystem services in a semiarid Mediterranean region”, Journal of Arid Environments, vol. 75, No. 11, Amsterdam, Elsevier.
Dennis, M. and P. James (2016), “Site-specific factors in the production of local urban ecosystem services: a case study of community-managed green space”, Ecosystem Services, vol. 17, Amsterdam, Elsevier.
Derkzen, M., A. van Teeffelen and P. Verburg (2017), “Green infrastructure for urban climate adaptation: how do residents’ views on climate impacts and green infrastructure shape adaptation preferences?”, Landscape and Urban Planning, vol. 157, Amsterdam, Elsevier.
Eltayeb, T., S. Zailani and T. Ramayah (2011), “Green supply chain initiatives among certified companies in Malaysia and environmental sustainability: investigating the outcomes”, Resources, Conservation and Recycling, vol. 55, No. 5, Amsterdam, Elsevier.
Feser, E. (2013), “Isserman’s impact: quasi-experimental comparison group designs in regional research”, International Regional Science Review, vol. 36, No. 1, Thousand Oaks, SAGE.
Frankel, J. and A. Rose (2005), “Is trade good or bad for the environment? Sorting out the causality”, Review of Economics and Statistics, vol. 87, No. 1, Cambridge, MIT Press.
Imbens, G. and J. Wooldridge (2009), “Recent developments in the econometrics of program evaluation”, Journal of Economic Literature, vol. 47, No. 1, Nashville, American Economic Association.
Jeffords, C. and L. Minkler (2016), “Do constitutions matter? The effects of constitutional environmental rights provisions on environmental outcomes”, Kyklos, vol. 69, No. 2, Hoboken, Wiley.
Kang, K. and others (2012), “Consumers’ willingness to pay for green initiatives of the hotel industry”, International Journal of Hospitality Management, vol. 31, No. 2, Amsterdam, Elsevier.
Lin, C. and Z. Liscow (2013), “Endogeneity in the environmental Kuznets curve: an instrumental variables approach”, American Journal of Agricultural Economics, vol. 95, No. 2, Oxford, Oxford University Press.
Luan, C., C. Tien and W. Chen (2016), “Which “green” is better? An empirical study of the impact of green activities on firm performance”, Asia Pacific Management Review, vol. 21, No. 2, Amsterdam, Elsevier.
Mardones (2015), Guía metodológica para la evaluación ex-post de políticas ambientales, Santiago, Universidad de Concepción.
Marquart-Pyatt, S. (2012), “Contextual influences on environmental concerns cross-nationally: a multilevel investigation”, Social Science Research, vol. 41, No. 5, Amsterdam, Elsevier.
Méndez-López, M. and others (2014), “Local participation in biodiversity conservation initiatives: a comparative analysis of different models in South East Mexico”, Journal of Environmental Management, vol. 145, Amsterdam, Elsevier.
Ministry of Social Development (2013), “Resultados Encuesta CASEN 2013” [online] http://observatorio.ministeriodesarrollosocial.gob.cl/casen-multidimensional/casen/casen_2013.php.
Peters, M., S. Fudge and P. Sinclair (2010), “Mobilising community action towards a low-carbon future: opportunities and challenges for local government in the UK”, Energy Policy, vol. 38, No. 12, Amsterdam, Elsevier.

163CEPAL Review N° 128 • August 2019
Cristian Mardones
Pujadas, A. and A. Castillo (2007), “Social participation in conservation efforts: a case study of a biosphere reserve on private lands in Mexico”, Society & Natural Resources, vol. 20, No. 1, Abingdon, Taylor & Francis.
Rees, J. and S. Bamberg (2014), “Climate protection needs societal change: determinants of intention to participate in collective climate action”, European Journal of Social Psychology, vol. 44, No. 5, Hoboken, Wiley.
Sims, K. (2010), “Conservation and development: evidence from Thai protected areas”, Journal of Environmental Economics and Management, vol. 60, No. 2, Amsterdam, Elsevier.
Stock, J. and M. Yogo (2005), “Testing for weak instruments in linear IV regression”, Identification and Inference for Econometric Models: a Festschrift in Honor of Thomas Rothenberg, D. Andrews y J. Stock (eds.), New York, Cambridge University Press.
Walker, G. and P. Devine-Wright (2008), “Community renewable energy: what should it mean?”, Energy Policy, vol. 36, No. 2, Amsterdam, Elsevier.
Waylen, K. and others (2010), “Effect of local cultural context on the success of community-based conservation interventions”, Conservation Biology, vol. 24, No. 4, Hoboken, Wiley.
Zailani, S. and others (2015), “Green innovation adoption in automotive supply chain: the Malaysian case”, Journal of Cleaner Production, vol. 108, Amsterdam, Elsevier.

164 CEPAL Review N° 128 • August 2019
Short- and long-term ex post evaluation of community-based environmental initiatives in Chile
Annex A1Table A1.1
Summary of traditional econometric methodologies to evaluate environmental initiatives
Publication Country or territory Methodology Dependent variables Explanatory variables
Castro and others (2011)
Spain Probit and multiple linear regression
Willingness to pay for the maintenance of ecosystem services
Family income, education level, area that provides ecosystem services, visits to the protected area
Marquart-Pyatt (2012) 27 countries Multinomial logit Environmental threat awareness, environmental efficacy and willingness to pay
Ecological footprints, ecosystem well-being, sulfur dioxide emissions, carbon dioxide emissions and water quality
Baptiste, Foley and Smardon (2015)
United States Logit Willingness to implement green infrastructure in the case study
Green infrastructure knowledge, efficacy, influence factors and demographic variables
Byrne, Lo and Jianjun (2015)
China Multiple linear regression
Perceived benefits of urban tree planting
Awareness of climate change, concern about climate change, expected impact of climate change
Carrus and others (2015)
Italy Factor analysis Biodiversity level, location of green areas
Aggregate scores of benefits and well-being and perceived restorativeness score
Dennis and James (2016)
United Kingdom Multiple linear regression
Ecosystem service provision score Vegetation cover, food cultivation area
Derkzen, Van Teeffelen and Verburg (2017)
Netherlands Multinomial logit Concerns about heat waves, the notion of urban flooding, concern about flooding
Age, education
Eltayeb, Zailani and Ramayah (2011)
Malaysia Multiple linear regression
Environmental outcomes, economic outcomes, cost reductions and intangible outcomes
Green purchasing, environmentally-friendly design, reverse logistics
Kang and others (2012)
United States Multiple linear regression
Attitude of respondents to environmental concerns
Gender, income, age, level of education, civil status, work experience
Zailani and others (2015)
Malaysia Partial least squares Green innovation initiatives (green product innovation, green process innovation)
Market regulations, market demand, firms’ green initiatives
Luan, Tien and Chen (2016)
Taiwan Province of China
Multinomial logit Pollution prevention, green certifications, firms’ performance
Degree of research and development, degree of internationalization
Source: Prepared by the author.
Table A1.2 Chile: type, scope and duration of projects financed by the Environmental Protection Fund
(FPA) and completed, 2013
Type of project Scope Duration(months)
Environmental education Fishing village 6
Efficient management of organic waste Fishing village 10
Environmental study of wetlands Comuna 11
Environmental network of older persons Comuna 8
Assessment of solar energy and environmental education Comuna 10
Environmental education for social leaders Comuna 6
Creation of a sustainable park Comuna 9
Environmental education programme on organic agriculture Comuna 9
Preservation of endangered native species Comuna 6
Protection and conservation of wetlands Comuna 9
Eradication of exotic species Comuna 10
Virtual network of young people to care for the environment Comuna 10
Environmental education and conservation workshops Comuna 6
Creation of an environmental care demonstration centre Comuna 7
Wetland restoration Comuna 9
Waste recycling and composting Comuna 11
Green fair for sharing experiences and knowledge of environmental matters Comuna 8
Conservation of the native forest Comuna 11

165CEPAL Review N° 128 • August 2019
Cristian Mardones
Type of project Scope Duration(months)
Environmental education Comuna 9
Strengthening the comuna’s environmental network and disseminating environmental issues Comuna 10
Education and launch of a waste management and use system Comuna 9
Environmental education Comuna 9
Exchange of native species seeds and creation of a guide Comuna 10
Education and training on the efficient use of wood for heating Comuna 11
Environmental networks and ecological tours Comuna 6
Environmentally-friendly and efficient consumption workshops Comuna 9
University network for sustainable development Comuna 10
Environmental workshops, walks and fairs Comuna 9
Environmental workshops Comuna 10
Workshops and promotion of a bird watching festival Comuna 10
Environmental talks and recycling campaigns Comuna 9
Establishment of a community centre for environmental education and training local monitors Comuna 11
Installation of infrastructure to minimize solid waste and workshops Comuna 8
Training on environmental issues for social organizations’ leaders Comuna 6
Development of a workshop for environmentally-friendly training and art tours Comuna 6
Environmental education and training workshops Comuna 11
Creation of a physical space for environmental education focused on wetlands and conservation Comuna 11
Environmental workshop and preparation of eight television news bulletins Comuna 9
Preparation of environmental studies and ecotourism training Comuna 10
National meeting on protecting forestry and agricultural biodiversity Comuna 6
Recycling in educational establishments Comuna 8
Environmental education for conservation Comuna 9
Compiling information on the coastal area Comuna 8
Campaign to assess and care for the coastal sector Comuna 7
Establishment of recycling points and making them ready (recycling and composting) Comuna 9
Free environmental education cycling tours for citizens Comuna 6
Establishment of the Environmental Education and Innovation Centre Comuna 7
Reforestation with native tree species in areas vulnerable to erosion Comuna 7
Development of a virtual network for citizens organizations on environmental issues Comuna 9
Establishment of a workspace to collect, analyse and disseminate bioindicators for conservation
Comuna 10
Creation of a network of kindergartens to promote recycling and repurposing of waste Comuna 8
Design, development and management of a citizen environmental management plan Comuna 10
Determining human impact of mining and livestock farming on national reserve Comuna 6
Use of non-conventional renewable energies Indigenous community 9
Installation of sustainable hot water systems Indigenous community 7
Installation of sustainable hot water systems Indigenous community 10
Installation of solar energy systems Indigenous community 8
Protection of watershed and channelling water to the basin Indigenous community 7
Installation of solar energy systems Indigenous community 6
Protection of cultural heritage related producing medicinal herbs Indigenous community 9
Reviving traditional flora Indigenous community 10
Environmental restoration of the sector for education on Mapuche ancestral culture Indigenous community 9
Construction of family vegetable patches to preserve species Indigenous community 7
Installation of renewable energy systems Indigenous community 7
Installation of solar panels Indigenous community 10
Installation of renewable energy systems Indigenous community 11
Promoting understanding of biodiversity from the Mapuche worldview Indigenous community 8
Closure and reforestation of degraded sites with native species and medicinal herbs Indigenous community 6
Closure and reforestation of degraded sites with native species Indigenous community 8
Table A1.2 (continued)

166 CEPAL Review N° 128 • August 2019
Short- and long-term ex post evaluation of community-based environmental initiatives in Chile
Type of project Scope Duration(months)
Environmental training workshops with an intercultural approach Indigenous community 7
Management of organic and inorganic waste Indigenous community 11
Forest restoration and protection, with a video record Indigenous community 10
Installing and encouraging the use of solar energy systems in offices Indigenous community 10
Building a ruca (traditional Mapuche house) and installing waste management containers Indigenous community 9
Installation of solar panels Indigenous community 11
Promotion of ethno-tourism programme and development of an eco-park Indigenous community 9
Construction of a greenhouse and composting centre Indigenous community 9
Creation of a demonstration site with clean energy generation systems Indigenous community 8
Mitigating or reducing the environmental impact of pollution caused by tourists at the beach Indigenous community 6
Recovery of the native forest and its biodiversity to create a park Indigenous community 8
Installation of thermal solar system for domestic water heating Indigenous community 9
Installation of thermal solar system for domestic water heating and environmental education Indigenous community 9
Installation of thermal solar system for domestic water heating and environmental education Indigenous community 8
Agricultural crops Educational establishment 6
Water recycling to irrigate green areas Educational establishment 6
Water recycling to irrigate green areas Educational establishment 8
Marine conservation education Educational establishment 7
Environmental education to combat climate change Educational establishment 9
Solar energy demonstration module on a nature trail Educational establishment 9
Study of the climate and pollution in the comuna Educational establishment 9
Promotion local environmental management Educational establishment 9
Environmental education workshop Educational establishment 6
Environmental education Educational establishment 7
Installation of recycling and waste minimization infrastructure Educational establishment 8
Creation of an educational tool to address environmental issues Educational establishment 7
Environmental education developing activities outside the institution Educational establishment 8
Creation of an environmental education demonstration centre Educational establishment 9
Setting up of a laboratory and training for teachers, students and community members Educational establishment 8
Incentives for the use of environmentally-friendly diapers Educational establishment 8
Construction of greenhouses using plastic bottles Educational establishment 6
Installation of containers to collect rainwater to be recycled Educational establishment 10
Installation of a recycling point and environmentally-friendly plaza Educational establishment 9
Appreciation of nature through the cultivation of vegetables and medicinal herbs Educational establishment 7
Environmental education Various educational establishments 9
Theoretical and practical workshops on environmental education Various educational establishments 9
Knowledge and dissemination of endangered native species Various educational establishments 11
Network of school ecological groups Various educational establishments 9
Construction de biotopes in educational spaces Various educational establishments 8
Education on and dissemination of the National Climate Change Action Plan Various educational establishments 10
Recycling and waste reduction Various educational establishments 9
Environmental education network in schools Various educational establishments 9
Setting up forests as a “natural laboratory” for conservation Various educational establishments 11
Open air workshops and competitions Various educational establishments 7
Theatre play with an environmental protection theme Various educational establishments 6
Preparation of educational material for children on biodiversity and conservation Various educational establishments 9
Creation of a network of school ornithology groups Various educational establishments 8
Environmental education for the protection of wildlife in priority sites Various educational establishments 9
Development of an educational game on environmental issues to be used in educational centres
Various educational establishments 11
Installation of thermal solar panels for hot water Foundation 6
Training on and carrying out the recycling of household waste Neighbourhood association 7
Ecological farming activities Neighbourhood association 8
Table A1.2 (continued)

167CEPAL Review N° 128 • August 2019
Cristian Mardones
Type of project Scope Duration(months)
Ecological activities Neighbourhood association 8
Environmental education workshops on solar energy Neighbourhood association 9
Infrastructure for and training on recycling Neighbourhood association 11
Installation of a recycling centre and environmental education workshops Neighbourhood association 8
Installation of solar cookers Neighbourhood association 7
Recycling and composting Neighbourhood association 9
Solid waste management, afforestation and creation of vegetable plots Neighbourhood association 10
Installation of hot water solar collector and photovoltaic panels Neighbourhood association 9
Self-construction of dry toilets for waste disposal Neighbourhood association 8
Installation of solar energy system Neighbourhood association 7
Production of organic foods Neighbourhood association 11
Educational farm to cultivate endemic tree species Neighbourhood association 9
Comprehensive waste management Neighbourhood association 11
Construction of educational forest ecopaths and installation of a wind energy system Neighbourhood association 9
Implementation of ecospaces in kindergartens and environmental education Neighbourhood association 8
Planting native species to conserve water sources Neighbourhood association 11
Educational and processing station to produce compost and humus Neighbourhood association 11
Delivery of solar systems to heat water for the bathroom and kitchen Neighbourhood association 7
Delivery of solar systems to heat water for the bathroom and kitchen Neighbourhood association 6
Production of written and photographic material for environmental education workshops Neighbourhood association 8
Environmental education for solid waste management Neighbourhood association 6
Promotion of non-conventional renewable energies Various neighbourhood associations
9
Restoration of watersheds Various neighbourhood associations
10
Creation and equipment of educational spaces on plant nurseries and landscaping Town 9
Educational talks, recycling and composting Town 10
Training and recycling Town 7
Greenhouse installation, composting and recycling Town 10
Transformation of a cultural and sports centre into an energy-efficient, water-efficient sustainable centre with recycling and waste reduction and recycling Town 11
Dissemination and use of medicinal plants of the Mapuche people in the comuna Town 8
Establishment of an environmental round table for civil society in the Cajón del Maipo Town 11
Promotion and dissemination efforts to reduce and manage household solid waste Town 8
Efforts to encourage and workshops on sustainable use of water resources and wetland protection
Town 9
Comprehensive treatment of solid household waste with biodigesters Town 9
Ecopark construction and recycling Town 6
Conservation of endangered species Province 9
Community radio stations on environmental issues Province 9
Meeting of youth leaders on environmental issues Region 7
Efforts to protect the river shrimp Region 9
Production and storage of medicinal species needed for traditional Mapuche medicine Region 9
Sharing of experiences of using and applying non-conventional renewable energies Region 8
Environmental study of flora National reserve 11
Creation of a biodiversity conservation centre National reserve 11
Youth environmental networks Various comunas 7
Source: Prepared by the author, on the basis of data from the Ministry of the Environment of Chile.
Table A1.2 (concluded)


A multidimensional approach to the well-being of the population of the states of Mexico
Amilcar O. Fernández Domínguez and Denise Gómez Hernández
Abstract
This article adapts a multidimensional index of the well-being of the population in the Mexican States, based on the recommendations of the Commission on the Measurement of Economic Performance and Social Progress (CMEPSP). This study’s contributions can be summarized in three key points: (i) factor analysis of principal components is used, to allow for different weights of dimensions; (ii) consideration is given to inequality of material well-being within the population of each state, and; (iii) representative state data are considered for all dimensions. The results show that the dimensions of objective well-being have greater weights than the dimensions of subjective well-being, and that differences between weights of dimensions and indicators used are more important than their quantity or characteristics.
Keywords
Social welfare, measurement, statistical methodology, economic development, social development, development indicators, Mexico
JEL classification
I31, O54, C38, C43
Authors
Amilcar Orlian Fernández Domínguez is a lecturer and researcher with the Faculty of International Economics of the Autonomous University of Chihuahua (Mexico). Email: [email protected].
Denise Gómez Hernández is a lecturer and researcher with the Faculty of Accounting and Administration of the Autonomous University of Querétaro (Mexico). Email: [email protected].

170 CEPAL Review N° 128 • August 2019
A multidimensional approach to the well-being of the population of the states of Mexico
I. Introduction
The concept of multidimensional well-being has recently become more prominent, even though it has been implied in literature for some time. For example, Hicks (2002) and Nafziger (2005) cite a number of basic functionings related to well-being, such as adequate nutrition, the absence of premature mortality and the ability to appear in public without shame. The focus has largely been on material aspects of well-being; for instance, there have been vogues for certain objective measures such as the human development index (HDI) or reductions in the number of people living in poverty. Lately, however, there has been greater emphasis on the measurement of the intangible elements of multidimensional well-being (Bérenger and Verdier-Chouchane, 2007; Aiginger and Firgo, 2015; Arita, 2005), highlighting the importance of including a subjective well-being perspective in analysis.
Mexico’s goal of increasing residents’ living standards and well-being is clearly reflected in its 2013–2018 National Development Plan (Mexico, Government of, 2013). In this regard, OECD (2014) explains that in order to implement appropriate public policy, it is crucial that indicators properly reflect peoples’ well-being. The issue therefore revolves around two questions: who is most well-off and why. As regards the second question, literature offers various conceptions and theories regarding what well-being is and what its determinants are, ranging from Greek philosophers’ concepts of eudaemonia to the latest approaches built around capabilities and subjective well-being. The report prepared by Stiglitz, Sen and Fitoussi (2009) for the Commission on the Measurement of Economic Performance and Social Progress outlines a theoretical framework applicable to analysis of the multiple dimensions of well-being; these theoretical approaches are addressed in the second section of this article.
Turning back to the first question, Stiglitz, Sen and Fitoussi (2009) argue that the factors affecting a person’s well-being require both objective and subjective data. They offer a number of recommendations, including development of a single summary measure of well-being, and suggest that consideration of well-being should address three theoretical approaches or conceptions that are prominent in literature: the theory of capabilities, the theory of subjective well-being and the theory of fair allocations. They also highlight indicators relating to various aspects or dimensions that affect well-being, such as disposable income, consumption and wealth (which relate to the dimension of material well-being), and others that relate to health, education, personal activities, political engagement, social connections, the environment and insecurity.
In their report, Stiglitz, Sen and Fitoussi (2009) also emphasize the importance of considering certain limiting factors when constructing a composite indicator of well-being: the loss of information on inequalities resulting from the use of averages, arbitrary weighting procedures, arbitrary selection of information on the relative contribution of each dimension of well-being, and interpretation of changes in the indicator over time. They also mention the advantages of analysing data at the individual level rather than at the state or regional level (since, for example, this allows inequality to be explored).
These elements have been inadequately applied to Mexico. Some endeavours have created indicators to measure well-being in Mexico; the most recent and noteworthy contribution, given its multidimensional approach, is that of the Organization for Economic Cooperation and Development (OECD) (2015), which is based on the well-being indicators by state (Indicadores de Bienestar por entidad federativa) (produced by Mexico’s National Institute of Statistics and Geography (INEGI) and whose roots can be found in the OECD Better Life Index. However, this index has some limitations relating to the methodological elements mentioned by Stiglitz, Sen and Fitoussi (2009): it assumes that all dimensions are equally important in determining overall well-being, it does not capture the internal inequalities in each state1 and, although it uses subjective well-being data, they are not representative
1 Annex A1 shows that the construction of the index captures interstate inequality, but not necessarily inequality among a state’s population. For example, in using mean disposable income per household, the same value may be seen in two states, even if disposable income is distributed differently.

171CEPAL Review N° 128 • August 2019
Amilcar O. Fernández Domínguez and Denise Gómez Hernández
at state level. This study seeks to resolve these shortcomings by producing an indicator that: allows a different weight to be assigned to each dimension as recommended in the Handbook on Constructing Composite Indicators prepared by OECD (2008),2 attaches greater importance to inequality in line with Stiglitz, Sen and Fitoussi (2009), and uses data3 that is representative at state level.
This text is structured as follows: the second section deals briefly with the different conceptions and theories relating to well-being; the third section explains the methodology used to obtain the multidimensional well-being index, based on OECD (2008); the fourth section outlines the results obtained through this methodology and adapts other indicators to compare the differences that arise when considering different dimensions and indicators, as well as when allowing different weights; lastly, the fifth section provides some conclusions.
II. Conceptions and theories of well-being
The concept of well-being is complex and somewhat ambiguous. Any discussion of the topic must therefore begin with the various theories that have arisen since the Classical Greek concepts of eudaemonia and hedonism (Villatoro, 2012; Valencia and Cuervo, 1999). While the Greek philosophers’ approach accepts that material goods are required to achieve well-being, special emphasis is placed on the contribution of the intangible (the psychological facet of man) to fullness of life or experiential pleasure. Classical philosophy’s focus on human beings’ quest for fullness links it with subjective well-being, as will be addressed later; Bentham (2000) went so far as to argue that the principle of classical utility entailed a subjection of the individual to pleasure and pain experienced (and, therefore, to happiness acquired) as a result of his or her actions. Criticism of this utilitarian approach’s inability to assign values to the well-being of individuals or to make comparisons led welfarists to determine well-being on the basis of people’s choices from a set of alternatives (revealed preference) and to assign a numerical value to social states through social well-being functions (Villatoro, 2012).
For its part, the utilitarian approach to well-being linked to opulence scrutinizes an individual’s situation in relation to his or her access to goods and services; thus, the greater the access to goods and services —through higher income— the greater the well-being of the individual. Sen (1984) explains that this approach defines well-being too restrictively and, by limiting an individual’s well-being to fulfilment of desires (that is to say the individual obtains well-being from consumerism), it overlooks important elements.
These approaches are criticized for not describing the origin of the desires that lead to decision-making, in other words for not specifying the intrinsic value of well-being. For example, Rawls (1971) asserts that significant well-being could be achieved (from a utilitarian point of view) by permitting organized crime to operate and generate proceeds, entailing increased economic movement and greater violence. Therefore, Rawls (1971) proposes well-being based on social justice: well-being achieved by obtaining primary goods catalogued as natural (such as food or clothing) or social (such as freedom, rights, opportunities, income and institutions related to justice). This approach postulates that well-being comes from more equitable distribution and proposes an in-depth analysis of a number of theories of justice, such as the theory of fair allocations.
Based on Kolm’s (1997) criterion of equity in the absence of envy, the simplest efficient fair allocation is one in which all individuals are assigned the same set of goods; however, greater knowledge of the characteristics of the population and of available goods allows fair allocations to be made even
2 The handbook provides a number of analytical tools and recommendations for construction of composite indicators in 10 steps; for multivariate analysis and weighting, this study focuses on factor analysis of principal components and Cronbach’s alpha (the technical aspects are addressed in annex A1).
3 Mexico’s National Institute of Statistics and Geography (INEGI) mentions that politically, the country is organized into 32 states.

172 CEPAL Review N° 128 • August 2019
A multidimensional approach to the well-being of the population of the states of Mexico
if they vary from one individual to the next (Thomson, 2016). In other words, it is possible to allocate different goods to individuals in a society without them being worse off than they would have been if the same set of goods were allocated to everyone. In this respect, the theory of fair allocations allows neutral judgment, since each individual has a conception of the good, but it also has the shortcoming of assuming that the good will actually have the expected effect on each of the individuals (Wells, 2016).
As an alternative to these theories, the models regarding capabilities arose (Stiglitz, Sen and Fitoussi, 2009; Bérenger and Verdier-Chouchane, 2007), in which well-being is not achieved through the characteristics of the consumed good, as utility theory posits, or through the allocation and conception that the individual has of the good, as fair allocations theory proposes, but through the freedom that the person obtains from the capability to do or to be (Sen, 1984); that is to say, well-being comes from the functioning derived from the capability obtained from the good (Plata, 1999). According to Sen (1984), well-being is related to the individual’s freedom to function in a certain way; hence, goods must provide the individual with the ability to choose the way to function (to be or do) and not just to do things (Beckley, 2002). In this regard, a set of basic functionings provide the individual with well-being, such as being adequately nourished, avoiding premature mortality, appearing in public without shame, being happy and being free (Hicks, 2002; Nafziger, 2005). According to this approach, well-being goes beyond what is established in utility theory, hence the creation of the human development index by the United Nations Development Programme (UNDP) (Bérenger and Verdier-Chouchane, 2007).
Another group of authors employ a more complex approach, subjective well-being theory, which argues that the well-being of the individual as a human being depends on one’s own perception of different spheres or domains of life, influenced by both material (economic) and non-material aspects (Bonini, 2008; Rojas, 2005, 2007; Lever, 2004). Since well-being entails elements that cannot be quantified, such as emotional aspects, the proposal of this approach is to determine well-being through an indicator of life satisfaction or happiness obtained by asking the individual directly how satisfied or happy he or she is in life (Veenhoven, 2005).
Two important features of these theories stand out: well-being is multidimensional (it contains subjective and objective aspects), and the importance of each dimension in overall well-being is variable. Some authors (Villatoro, 2012; Krauss and Graham, 2013; Stiglitz, Sen and Fitoussi, 2009; Rojas, 2007), despite not rejecting the capabilities approach (or the objective aspect of well-being), stress the need to include the subjective sphere in well-being analyses, in spite of the difficulty this involves. Indeed, it would be beneficial to propose a measure of well-being that incorporates objective aspects (such as the levels of education, health and income considered in the capabilities approach) and subjective aspects (perception of satisfaction or happiness), in addition to examining the contribution of each of these aspects to the composition of individuals’ overall well-being.
Some publications have addressed the multidimensional nature of well-being. For example, Bérenger and Verdier-Chouchane (2007), in an international study, partially address the multidimensional nature of well-being in 170 countries through factor analysis and fuzzy sets theory, but only analyse the contribution of the objective dimension of well-being (quality of life and standards of living). In another international study that examines Mexico, Benvin, Rivera and Tromben (2016) incorporate the resource of time as a dimension of well-being which, in addition to having a direct impact on well-being, is correlated with other dimensions; however, as in the study by Bérenger and Verdier-Chouchane (2007), their multidimensional approach to well-being only encompasses objective aspects.
In contrast, in a local study in Mexico, Arita (2005) performs a multidimensional analysis considering subjective and objective aspects of well-being at the individual level. Her study offers a preliminary examination of the multidimensional nature of well-being in Mexico, as proposed by Stiglitz, Sen and Fitoussi (2009): through factor analysis, it provides information on the percentage change in well-being explained by each dimension. However, its results cannot be extrapolated to the entire nation, since it only includes information on the well-being of the residents of the city of Culiacán, in the state of Sinaloa.

173CEPAL Review N° 128 • August 2019
Amilcar O. Fernández Domínguez and Denise Gómez Hernández
Lastly, OECD (2015) offers a broader study, which also considers the multidimensional nature of well-being in Mexican states. The study is based on the framework of the OECD Better Life Index (which in turn stems from the recommendations of Stiglitz, Sen and Fitoussi, 2009) and on OECD and INEGI studies and databases on regional well-being. It provides recent information on twelve dimensions of well-being, as well as a global well-being index by state. However, the results cannot be considered entirely reliable if one takes into account the criticism and recommendations on creation of well-being indicators discussed above.
The OECD study (2015) presents a global well-being index by state, constructed from the mean and variance of Adjusted Mazziotta-Pareto Indices (AMPI) obtained for each dimension of well-being. All the indicators considered have the same importance, or weight, in the construction of the index. Each AMPI, in turn, is constructed from the mean and variance of normalized indicators, such as average disposable income. Therefore, by means of this methodology it is possible to obtain the same AMPI value4 for a dimension in two states that have different distributions. In addition, the data used in relation to subjective well-being indicators were taken from a survey performed by INEGI that was not representative at state level. Based on the above, it can be argued, firstly, that the OECD study arbitrarily attaches equal importance to each dimension of well-being and, secondly, that it pays less attention to inequality within each state, which is relevant in a country such as Mexico.
III. Methodology
The multidimensional index of well-being at state level (IMBE) has been constructed based on the recommendations in the OECD Handbook on Constructing Composite Indicators (2008) and the report by Stiglitz, Sen and Fitoussi (2009). Based on the OECD guidelines (2008), equation (1) is established:
IMBEi = ∑Wk (∑wjkxij ) (1)
where:
IMBEi is the multidimensional index of well-being of state i
Wk is the ratio of variance in the principal component k to total variance in the components considered in the construction
xij is the value of each indicator j for state i
wjk is the normalized weight for indicator j and component k
In order to calculate IMBEi, the values of Wk and wjk must first be determined, as obtained from factor analysis of principal components. However, before this it is necessary to analyse whether the xij indicators to be selected are related to each other, that is, whether they jointly explain the dimension of well-being to be determined. To this end, an exploratory (graphical) analysis of these indicators is performed to obtain a preliminary idea of the nature and magnitude of the relations between them. The limiting factors indicated by Stiglitz, Sen and Fitoussi (2009) are recognized using microdata at the individual level to obtain information concerning inequality, and the factor analysis technique is applied to allow for differences in the weighting factors for each dimension. In addition, measurable and representative state-level information on subjective well-being is used.
4 In a hypothetical example, a state whose inhabitants all have a value of 5 on a certain indicator will have the same state average as a state in which half the inhabitants have a value of 0 and the other half have 10 on the same indicator (in both cases a state average of 5 would be obtained).

174 CEPAL Review N° 128 • August 2019
A multidimensional approach to the well-being of the population of the states of Mexico
Consideration was given to constructing IMBEi based on the eight dimensions set down by Stiglitz, Sen and Fitoussi (2009). These authors suggest a broad list of indicators to consider in each dimension; however, owing to the relatively low number of observations (32 states) and the statistical restrictions of the methods used, the available indicators that were expected to contribute the most information on each dimension were incorporated into xij. The indicators used to construct IMBEi, listed in table 1, are: median total current income (income and wealth) (inghmed), disposable income adjusted for the state Gini coefficient (ingaj), median total annual household spending adjusted by consumption unit (gpcmed), mean reported health status (situsalud), mean access to health (accesalud), mean accumulated schooling (educ), mean satisfaction with activity performed (satisactiv), mean reported freedom of choice (libertad), mean satisfaction with social life (satissocial), air pollution (co2), and mean satisfaction with public safety (satissecure).
Table 1 Dimensions and indicators considered in each well-being index
Multidimensional index of well-being at state level (IMBE)a
BLI well-being index, based on the OECD Better Life Indexb
SoL well-being index, based on Bérenger and Verdier-Chouchanec
Dimensions Indicators Dimensions Indicators Dimensions IndicatorsMaterial living standards (income, consumption, wealth)
Median total current income*
Housing Rooms per person*; Dwellings with roofs made of resistant materials*
Material well-being
Gini coefficient of household disposable income per capita*
Disposable income adjusted for Gini coefficient*
Income Gini coefficient of disposable income*; Equivalized disposable income*; population living in poverty*; population living in extreme poverty*
Median current household income per capita*
Median total annual household spending adjusted for consumption units*
Employment Critical employment conditions*; labour informality*; unemployment*; employment*
Household disposable income per capita*
Health Health status** Access to services
Access to health services*; households with broadband access*; dwellings with access to basic services*
Total annual household spending adjusted for consumption units*
Access to health* Safety and security
Homicide*; confidence in police**; perception of insecurity**; crime rate*
Current household income adjusted for the Gini coefficient*
Education Accumulated schooling*
Education Levels of education*; school dropout rate*; Programme for International Student Assessment (PISA) Test*
Education Accumulated schooling*
Personal activities, including work
Satisfaction with activity performed**
Environment Air pollution*; waste disposal*
Political voice and governance
Freedom of choice** Civic engagement and governance
Civic and political engagement*; voter turnout*; confidence in application of law**; perception of absence of corruption**
Health Current health status**
Social connections and relationships
Satisfaction with social life**
Health Life expectancy at birth*; self-reported health**; obesity*; maternal mortality*; infant mortality*
Satisfaction with current health**
Environment (present and future)
Air pollution* Work-life balance
Satisfaction with leisure time**; employees who work long hours*
Access to health*
Insecurity (economic and physical)
Satisfaction with public safety**
Community (social connections)
Social support network** Subjective well-being
Self-reported life satisfaction-well-being**
Life satisfaction
Life satisfaction**
Source: Prepared by the authors, on the basis of Stiglitz, J., A. Sen and J. Fitoussi (2009), Report by the Commission on the Measurement of Economic Performance and Social Progress, Paris, The Commission, and Bérenger, V. and A. Verdier-Chouchane (2007), “Multidimensional measures of well-being: standard of living and quality of life across countries”, World Development, vol. 35, No. 7, Amsterdam, Elsevier.
Note: * Objective well-being indicator; ** subjective well-being indicator.a Based on Stiglitz, Sen and Fitoussi (2009).b Organization for Economic Cooperation and Development (OECD), 2015.c Bérenger and Verdier-Chouchane, 2007.

175CEPAL Review N° 128 • August 2019
Amilcar O. Fernández Domínguez and Denise Gómez Hernández
According to OECD (2008), factor analysis of principal components enables formation of a composite indicator that captures as much as possible of the information common to a group of variables, so that the composite indicator does not depend on the dimensionality of the data. For this reason, after graphical analysis of the xij indicators, the second step is to calculate the Cronbach coefficient alpha, which makes it possible to measure the reliability (a preliminary idea of contribution) of each indicator in the global well-being index and, in this way, to select the xij indicators that actually contribute significantly to IMBEi and that maintain the principle of parsimony. As a third step, correlations between the xij indicators are analysed, observing the multidimensionality of IMBEi. Subsequently, in the fourth step a factor analysis of principal components is performed (some technical notes regarding these steps are included in annex A1).
Lastly, in the fifth step, IMBEi is compared with other well-being indicators. This comparison can be seen in table 1: in the first column the dimensions and indicators included in the proposed IMBEi index are marked in bold, while the second and third columns show the dimensions and indicators of two additional indices, obtained using the same methodology of factor analysis of principal components, but adapted, respectively, from the multidimensional approach of the OECD Better Life Index (2015) (BLIi) and from the approach detailed by Bérenger and Verdier-Chouchane (2007) (SoLi).
1. Data
Given the availability of information at the microdata or state levels, there are two means of obtaining representative data for each state: (i) indicators based on information obtained directly from the state, which are not transformed and are used directly, and; (ii) indicators obtained from information at the individual level from surveyed households, transformed from state medians or means —as the case may be— weighted according to the adjustment (expansion) factor provided by INEGI. This expansion factor indicates how the national agency segments the total population by strata and primary sampling units, thus allowing estimates to be made from representative samples.
The data used in the analysis are from INEGI and OECD. Specifically, the inghmed, educ and accesalud indicators have been calculated from the Socioeconomic Conditions Module of the 2014 National Household Income and Expenditure Survey (ENIGH); the situsalud, satisactiv, libertad, satissocial and satissecure indicators, from the Self-Reported Well-Being Module (BIARE) 2014; the ingaj indicator, from 2014 OECD disposable income data and the INEGI Better Life Index project (Gini coefficient data); the gpcmed indicator has been calculated from the 2013 National Household Expenditure Survey (ENGASTO); and the co2 air pollution indicator from the INEGI Better Life Index project.
INEGI provides key variables that allow the information from the databases of the Socioeconomic Conditions Module and the Self-Reported Well-Being Module for the same person or household to be combined, in such a way that objective and subjective information on well-being can be analysed together. In addition, although the National Household Income and Expenditure Survey has been available since 1984, representative state-level Self-Reported Well-Being Module data have only been available since 2014. The other state data used to construct the BLIi index can be found in the INEGI Better Life Index project. The following section shows the results of the described analysis, performed using the Stata 13 software package.
IV. Results
1. Analysis of indicators
Once the indicators whose data were obtained at the individual level are transformed, graphical analysis of the relationships between them provides interesting insight. Figure 1 shows that, in general, there is a well-defined positive relationship between the first six indicators (median total current income, disposable

176 CEPAL Review N° 128 • August 2019
A multidimensional approach to the well-being of the population of the states of Mexico
income adjusted for the Gini coefficient, median consumer spending, health access, health status, and schooling). The indicators of income, health and education, corresponding to the six indicators mentioned above, make up the human development index. All the indicators, except current health status and including air pollution, relate to objective well-being. The rest of the indicators, which relate to subjective well-being, do not generally show a clearly defined relationship with other indicators, especially those of objective well-being. This may be because the subjective well-being indicators used deal with aspects of life that have little relation to labour or material matters.
Figure 1 Relationship between well-being indicators
Median total current income
Disposable income adjusted
for Gini coefficient
Median spending
Access to health
Schooling
Freedomof choice
5.0e+0.3
1.0e+0.4
1.5e+0.4
5.0e+0.3 1.0e+0.4 1.5e+0.4
5.0e+0.4
1.0e+0.5
1.5e+0.5
5.00e+0.4 1.00e+0.5 1.50e+0.5
200300400
200 300 400
0.20.40.60.8
0.2 0.4 0.6 0.8
0.700.750.800.85
0.70 0.75 0.80 0.85
8
10
12
8 10 12
8.08.28.48.6
8.0 8.2 8.4 8.6
8.89.09.29.4
8.8 9.0 9.2 9.4
7.5
8.0
8.5
7.5 8.0 8.5
0102030
0 10 20 30
567
5 6 7
Current health status
Satisfaction with activity performed
Satisfaction with social
life
Air pollution
Satisfaction with public
safety
Source: Prepared by the authors, on the basis of official data from the National Institute of Statistics and Geography (INEGI) and the Organization for Economic Cooperation and Development (OECD).
2. Cronbach coefficient alpha
In the second stage, a reliability test is performed using Cronbach’s alpha to verify that the chosen indicators xij provide information at the scale of the underlying variable “well-being” (or IMBEi). The Cronbach coefficient alpha is calculated with standardized data, since the indicators are in different units. Table 2 shows that average correlation between the 11 xij indicators is 0.4855, which is not very high, but Cronbach’s alpha is 0.9121. Although this value is relatively high, it is important to carry out contribution tests to verify that the indicators used contribute significantly and in the expected direction to the scale; it is also important to verify that the value obtained is not compromised by a failure to comply with the test assumptions.

177CEPAL Review N° 128 • August 2019
Amilcar O. Fernández Domínguez and Denise Gómez Hernández
Table 2 Cronbach’s alpha
Average inter-item correlation: 0.4855
Number of items in the scale: 11
Scale reliability coefficient: 0.9121
Source: Prepared by the authors, on the basis of data from the National Institute of Statistics and Geography (INEGI).
Table 3 shows information regarding the contribution and correlation of each indicator in the scale calculated using Cronbach’s alpha. The “Remarks” column indicates that for calculation of Cronbach’s alpha, information was obtained for each indicator from all 32 states of the country, meaning that no data was lost or omitted. The “Sign” column indicates the direction of each indicator on the scale built using Cronbach’s alpha, that is to say how each of them contributes to the well-being scale: a positive sign indicates that a higher value of the corresponding indicator relates to a higher value on the scale. As previously mentioned, the indicators have the sign that is expected in theory: greater well-being is reflected in higher median total current household income, more disposable income adjusted for the Gini coefficient, higher median consumer spending, greater accumulated schooling, greater access to health, better health status, greater satisfaction with the activity performed, greater freedom of choice, greater satisfaction with social life, less air pollution and greater satisfaction with public safety.
Table 3 Details of Cronbach’s alpha correlation
Indicator Remarks Sign ITCa IRCb IICc C-a contd
Median current household income per capita 32 + 0.8870 0.8554 0.4574 0.8940
Current household income adjusted for the Gini coefficient 32 + 0.8867 0.8550 0.4575 0.8940
Median adjusted total annual expenditure per person 32 + 0.8125 0.7629 0.4707 0.8989
Access to health 32 + 0.9207 0.8979 0.4514 0.8916
Current health status 32 + 0.6801 0.6040 0.4943 0.9072
Schooling 32 + 0.8230 0.7758 0.4688 0.8982
Satisfaction with activity performed 32 + 0.6354 0.5517 0.5023 0.9098
Freedom of choice 32 + 0.8367 0.7927 0.4664 0.8973
Satisfaction with social life 32 + 0.7361 0.6704 0.4843 0.9038
Air pollution 32 - 0.4234 0.3132 0.5401 0.9215
Satisfaction with public safety 32 + 0.3835 0.2699 0.5472 0.9236
Scale 0.4855 0.9121
Source: Prepared by the authors, on the basis of official data from the National Institute of Statistics and Geography (INEGI) and the Organization for Economic Cooperation and Development (OECD).
a Indicator-scale correlation.b Indicator-rest correlation.c Average inter-item correlation.d Contribution to Cronbach’s alpha if indicator omitted.
The correlation of each indicator with the scale obtained through Cronbach’s alpha of the 11 included indicators is indicated in the “ITC” column of table 3; in this case, the least correlated are satisfaction with public safety and air pollution. Since the inclusion of these indicators influences the scale obtained, it is useful to draw on the information in the “IRC” column (StataCorp, 2013), which indicates the correlation of each indicator with the scale obtained from the other 10; in this case the correlation of satisfaction with public safety and air pollution is even lower, suggesting that these indicators are not well adapted to the overall scale obtained.

178 CEPAL Review N° 128 • August 2019
A multidimensional approach to the well-being of the population of the states of Mexico
The “IIC” column in table 3 shows average correlations between the indicators, except for that appearing in the row in question; in this case, as previously mentioned, average correlation between the indicators is 0.4855, but if the satisfaction with public safety indicator or the air pollution indicator are omitted, average correlation increases to 0.5472 or 0.5401, respectively. Lastly, the “C-a cont” column provides information on the change in Cronbach’s alpha when an indicator is omitted; again, the omission of one of the two aforementioned indicators improves the scale obtained, since the alpha increases to 0.9236 or 0.9215, respectively.
An important aspect of these results is that, although the Cronbach’s alpha obtained is relatively high, the number of observations considered in the calculation is relatively low. Therefore, according to relevant literature, the reliability of the statistical analysis may be compromised. Specifically, Yurdugül (2008) argues that the reliability of the test depends not only on the number of observations, but also on the eigenvalue obtained through principal component analysis; according to Yurdugül’s Monte Carlo studies, a sample of 30 observations is reliable if the eigenvalue of the first component obtained through principal component analysis is higher than 6.00. If the test is performed using the data from this study, the eigenvalue of the first component is higher than six (see table 5), so it can be argued that the Cronbach coefficient alpha obtained is reliable.
The results obtained thus far present some items for discussion, and enable the study to proceed with confidence to factor analysis: although the indicators of satisfaction with public safety and air pollution do not provide a large amount of information on the scale obtained using the coefficient alpha, their omission does not increase the reliability of the scale significantly; similarly, the indicators of material living standards, education and health may be providing duplicated information. Nonetheless, none of these indicators xij, which are important in the theory of Stiglitz, Sen and Fitoussi (2009), compromise the validity of the statistical analysis, and they all provide information regarding the multiple dimensions of well-being. For these reasons, they have not been omitted from the subsequent analysis.
3. Principal components analysis
As mentioned above, OECD (2008) stresses the need for correlation among the indicators of interest xij; without this, there would be no sense in performing a factor analysis of principal components. With regard to the third stage of the analysis, the correlation matrix in table 4 confirms the existence of two main groups of indicators: on the one hand, material standards of living and indicators of the education and health dimensions are highly and significantly correlated, with low or non-significant correlation with the other indicators; on the other hand, there are significant (although not as marked) correlations between the remaining indicators, related to individuals’ satisfaction, supporting the decision not to omit them from the analysis. Another important aspect is that the signs of the correlations are as expected, according to theory and to what was discussed in the Cronbach’s alpha analysis. Thus, the set of indicators xij behaves as desired and is not expected to present problems in the factor analysis.
With regard to the fourth stage, table 5 shows the factor analysis of principal components of the selected indicators xij. The top portion of the results shows that information from the 11 indicators for the 32 states considered was used for the calculation. It is clear that, in accordance with the criteria presented in the methodology, only the first two factors should be used to construct the well-being index shown in equation (1), since they are the only ones that have an eigenvalue of more than 1 (column 2) and explain more than 60% of the total variance (columns 4 and 5). In order to confirm the existence of correlation between the indicators used, a test of independence among the indicators is performed; in other words, the null hypothesis is that the elements below the diagonal of the variance-covariance matrix have a value of 0, and it is rejected at 95%, as shown at the bottom of the table.

179CEPAL Review N° 128 • August 2019
Amilcar O. Fernández Domínguez and Denise Gómez Hernández
Table 4 Matrix of correlations between state-level well-being indicators
inghmed ingaj gpcmed accesalud situsalud educ satisactiv libertad satissocial co2
inghmed 1
ingaj 0.9806* 1
gpcmed 0.8467* 0.8709* 1
accesalud 0.8819* 0.8718* 0.8000* 1
situsalud 0.6512* 0.6549* 0.5576* 0.7082* 1
educ 0.9091* 0.9103* 0.7684* 0.8274* 0.7321* 1
satisactiv 0.3163 0.2969 0.3348 0.5404* 0.3204 0.3107 1
libertad 0.7030* 0.6991* 0.6328* 0.7464* 0.4850* 0.6753* 0.6096* 1
satissocial 0.5085* 0.5371* 0.4715* 0.5633* 0.2431 0.4146* 0.6493* 0.7337* 1
co2 -0.1810 -0.1440 -0.1839 -0.2881 -0.1874 0 -0.3584* -0.1461 -0.3723* 1
satissecure 0.1402 0.1502 0.0542 0.1610 -0.0818 0.0571 0.3623* 0.2837 0.4142* -0.5363*
Source: Prepared by the authors, on the basis of official data from the National Institute of Statistics and Geography (INEGI) and the Organization for Economic Cooperation and Development (OECD).
Note: The indicators are: median total current income (inghmed); disposable income adjusted for state Gini coefficient (ingaj); median total annual household spending adjusted for consumption units (gpcmed); mean access to health (accesalud); mean reported health status (situsalud); mean accumulated schooling (educ); mean satisfaction with activity performed (satisactiv); mean reported freedom of choice (libertad); mean satisfaction with social life (satissocial); air pollution (co2), and mean satisfaction with public safety (satissecure).
* Significant at 95%.
Table 5 Principal components analysis
Factor analysis/correlation Number of observations = 32
Method: principal component factors Retained factors = 2
Rotation: (unrotated) Number of parameters = 21
Factor Eigenvalue Difference Proportion CumulativeFactor1 6.31464 4.3883 0.5741 0.5741Factor2 1.92634 1.07485 0.1751 0.7492Factor3 0.85149 0.16178 0.0774 0.8266
Factor4 0.6897 0.25333 0.0627 0.8893
Factor5 0.43638 0.14494 0.0397 0.929
Factor6 0.29143 0.10878 0.0265 0.9555
Factor7 0.18265 0.03209 0.0166 0.9721
Factor8 0.15056 0.0605 0.0137 0.9857
Factor9 0.09006 0.03367 0.0082 0.9939
Factor10 0.05639 0.04603 0.0051 0.9991
Factor11 0.01036 - 0.0009 1.0000
Likelihood ratio (LR) test: independent vs. saturated: chi2(55) = 372.41 Prob>chi2 = 0.0000
Source: Prepared by the authors, on the basis of official data from the National Institute of Statistics and Geography (INEGI) and the Organization for Economic Cooperation and Development (OECD).
As mentioned in the previous section, the factors are rotated using the orthogonal varimax method, to subsequently obtain the normalized weightings or squared factor loadings wjk. The results of the rotation are shown in table 6. The upper portion of the table is similar to that of table 5, except that it is now indicated that the factors were rotated using the orthogonal varimax method. The second part of the table shows the variance of each factor (eigenvalue) and its ratio to the variance of both (Wk in equation (1)); the first factor is clearly the one with the highest weight (almost 70%). The third section of the table has several columns: the second and third columns show the loadings for the two factors already transformed through rotation. As shown, the magnitudes of the loadings separate the indicators in each factor according to what was discerned in the correlation matrix and the scatter diagrams: the indicators of material living standards, health and education have greater loadings in the first factor, and the rest of the indicators (except freedom of choice) have greater loadings in the second factor. The

180 CEPAL Review N° 128 • August 2019
A multidimensional approach to the well-being of the population of the states of Mexico
“Uniqueness” column indicates that these factors are not omitting a considerable part of the variance of any indicator; according to StataCorp (2013), a value of more than 0.6 is considered high. In this regard, the air pollution indicator is the one that loses the most information (around 46% of its variance) in the analysis and subsequent construction of the index.
Table 6 Varimax rotation and generation of weighting factors
Factor analysis/correlation Number of observations = 32
Method: principal component factors Retained factors = 2
Rotation: orthogonal varimax (Kaiser off) Number of parameters = 21
Factor Variance Proportion
Factor1 5.72645 0.6948
Factor2 2.51452 0.3052
Rotated factor loadings (pattern matrix) and unique variances
Variable FL1 FL2 Uniqueness FL1sq FL2sq FL1norm FL2norm
inghmed 0.9464 0.1399 0.0848 0.8956 0.0195 0.1564 0.0077
ingaj 0.952 0.1307 0.0766 0.9063 0.0170 0.1582 0.0067
gpcmed 0.8715 0.1237 0.2253 0.7595 0.0153 0.1326 0.0060
accesalud 0.8987 0.2901 0.1081 0.8076 0.0841 0.1410 0.0334
situsalud 0.7736 -0.0114 0.4014 0.5984 0.0001 0.1045 -
educ 0.948 0.0076 0.1013 0.8987 - 0.1569 -
satisactiv 0.3372 0.7001 0.3962 0.1137 0.4901 0.0198 0.1949
libertad 0.7275 0.4459 0.2719 0.5292 0.1988 0.0924 0.0790
satissocial 0.4628 0.7016 0.2935 0.2141 0.4922 0.0374 0.1957
CO2 -0.0314 -0.735 0.4587 0.0009 0.5402 0.0001 0.2148
satissecure -0.0457 0.8104 0.3412 0.0020 0.6567 0.0003 0.2611
Source: Prepared by the authors, on the basis of official data from the National Institute of Statistics and Geography (INEGI) and the Organization for Economic Cooperation and Development (OECD).
Note: FL*: factor loading 1 or 2; uniqueness: percentage of variance not explained by factors; FL*sq: squared loading; FL*norm: squared loading normalized by factor variance.
The indicators are: median total current income (inghmed); disposable income adjusted for state Gini coefficient (ingaj); median total annual household spending adjusted for consumption units (gpcmed); mean access to health (accesalud); mean reported health status (situsalud); mean accumulated schooling (educ); mean satisfaction with activity performed (satisactiv); mean reported freedom of choice (libertad); mean satisfaction with social life (satissocial); air pollution (CO2), and mean satisfaction with public safety (satissecure).
The fifth and sixth columns of table 6 show the squared loadings, and the last two columns show the normalized loadings, which will serve as weighting factors in the construction of the IMBEi presented in equation (1). As indicated by OECD (2008), it is evident that varimax rotation enables weights to be obtained for each xij indicator that are significant in a single factor; these weighting factors (wjk in equation (1)) are shown in bold, meaning that the indicators relating to material standards of living, education, health and freedom of choice must be included in the first factor and the rest of the indicators in the second.
Before constructing the well-being index, as mentioned in the section on methodology, the Kaiser-Meyer-Olkin (KMO) measure of the communality of the indicators is calculated, to support the validity of a factor analysis. According to the scale provided by Kaiser (1974), cited in StataCorp (2013), values between 0.80 and 0.89 are “meritorious” and values between 0.70 and 0.79 are “middling” but acceptable (OECD, 2008). The results presented in table 7 indicate that the measure of the factor used is acceptable, even though the last two indicators have a rather low value.

181CEPAL Review N° 128 • August 2019
Amilcar O. Fernández Domínguez and Denise Gómez Hernández
Table 7 Kaiser-Meyer-Olkin measure
Indicator Kaiser-Meyer-Olkin measure (KMO)inghmed 0.7370
ingaj 0.6843
gpcmed 0.7913
accesalud 0.919
situsalud 0.6634
educ 0.8887
satisactiv 0.6785
libertad 0.8087
satissocial 0.6356
CO2 0.2909
satissecure 0.3355
Total 0.7139
Source: Prepared by the authors.Note: The indicators are: median total current income (inghmed); disposable income
adjusted for state Gini coefficient (ingaj); median total annual household spending adjusted for consumption units (gpcmed); mean access to health (accesalud); mean reported health status (situsalud); mean accumulated schooling (educ); mean satisfaction with activity performed (satisactiv); mean reported freedom of choice (libertad); mean satisfaction with social life (satissocial); air pollution (CO2), and mean satisfaction with public safety (satissecure).
Finally, the well-being index for the 32 states is constructed on the basis of equation (1) and the Wk and wjk weighting factors from table 6. According to Aiginger and Firgo (2015), the index score is Min-Max normalized so that the state with the highest well-being score has 1 and the state with the lowest score has 0. The IMBEi of the states of Mexico is presented in figure 2, with the normalized value of IMBEi on the y scale and the 32 states ordered on the x scale from highest to the lowest level of well-being.
Figure 2 Mexico: multidimensional index of well-being at state level (IMBE), 2014
(Normalized values between 0 and 1)
0
0.2
0.4
0.6
0.8
1.0
Nuev
o Le
ónSo
nora
Baja
Cal
iforn
iaBa
ja C
alifo
rnia
Sur
Coah
uila
Colim
aCh
ihua
hua
Tam
aulip
asQu
inta
na R
ooSi
nalo
a
Naya
rit
Agua
scal
ient
esJa
lisco
Cam
pech
eDu
rang
oSa
n Lu
is P
otos
íZa
cate
cas
Taba
sco
Stat
e of M
exic
oHi
dalg
oGu
anaj
uato
Tlax
cala
Mor
elos
Vera
cruz
Guer
rero
Chia
pas
Pueb
laOa
xaca
Mex
ico
City
Quer
étar
o
Yuca
tán
Mic
hoac
án
Source: Prepared by the authors, on the basis of official data from the National Institute of Statistics and Geography (INEGI) and the Organization for Economic Cooperation and Development (OECD).

182 CEPAL Review N° 128 • August 2019
A multidimensional approach to the well-being of the population of the states of Mexico
Overall, it is shown that IMBEi reflects the relatively high weights assigned to the indicators of material living standards in the first component obtained through the principal component analysis and therefore also relatively high weights in the index. The states with the greatest well-being are Mexico City and Nuevo León, while the states with the lowest well-being are Puebla and Oaxaca. In addition, the well-being gaps divide the federative states into three groups: firstly, federative states with low well-being (less than 0.4), encompassing Oaxaca to San Luis Potosí; secondly, states with medium well-being (0.4 to 0.6), covering Durango to Yucatán, and; lastly, states with high well-being (more than 0.6), comprising Nayarit to Mexico City.
As the fifth stage of the aforementioned analysis, it is interesting to examine whether these results tally with the information provided by other indicators of well-being. To this end, a comparison is first made with the constructed indicators (the human development index and overall life satisfaction indicator) and then with the SoLi and BLIi indices. Figure 3 compares the IMBEi results with the 2012 state HDI (the most recent HDI provided by the United Nations Development Programme in Mexico), which groups income, education and health information, and also with the life satisfaction indicator provided by the 2014 Self-Reported Well-Being Module (BIARE).
Figure 3 Mexico: relationship of the multidimensional index of well-being at state level (IMBE) with the 2012 human development index (HDI) and with the life satisfaction indicator
of the 2014 Self-Reported Well-being Module (BIARE)
A. Relationship with the HDI B. Relationship with the BIARE life satisfaction indicator
PC: 0.8697KC: 0.7419
78.0
79.0
80.0
77.5
78.5
79.5
0.65 0.70 0.75 0.80 0.85
HDIMean of indicator
PC: 0.7306KC: 0.5484
78.0
79.0
80.0
77.5
78.5
79.5
8.07.4 7.6 7.8 8.2 8.4
Overall life satisfaction
Source: Prepared by the authors, on the basis of official data from the National Institute of Statistics and Geography (INEGI), the United Nations Development Programme (UNDP) and the Organization for Economic Cooperation and Development (OECD).
Note: PC: Pearson correlation; KC: Kendall’s tau coefficient.

183CEPAL Review N° 128 • August 2019
Amilcar O. Fernández Domínguez and Denise Gómez Hernández
Firstly, the Pearson correlation coefficient presented in figure 3 shows that both indicators have a positive relationship with the IMBEi, in other words a rise in one indicator is related to a rise in the other; this relationship is much more marked in the case of the human development index. On the other hand, Kendall’s tau coefficient of correlation indicates that the rank correlation between the indicators is not that high, that is to say the variation in state well-being is not regular for the two indicators considered in each case. The positions occupied by each state differ for each indicator, especially in comparison with the indicator of self-reported well-being. Thus far, it can be argued that these results confirm the importance of income in the overall well-being of the Mexican population, and they appear to support various studies’ findings regarding the low importance of income in individuals’ subjective well-being.
Regarding the indicators adapted from other approaches, the proposal of Bérenger and Verdier-Chouchane (2007) was taken into account (see table 1), adding the self-reported well-being dimension to perform a more suitable comparison5 with the IMBEi; as mentioned, this index is called SoLi because it is based on the dimensions of these authors’ standards of living indicator. The dimensions, indicators6 and process7 used to construct the OECD global well-being index (2015) were also employed, but instead of using the Adjusted Mazziotta-Pareto Indices (AMPI) to construct the dimensions8 and the overall well-being index, the same methodology used to obtain IMBEi was applied, namely factor analysis to obtain statistically different weights by dimension and indicator; this index was named BLIi, because it refers to data regarding the Better Life Index. For a more complete comparison, the 2014 index reported by OECD (2015) is also shown, simply referred to as the AMPI indicator.
As regards calculation of the indices, in the case of the SoLi index the indicators were assigned a similar weight (around 10%) through the factor analysis method; the lowest weights were those of life satisfaction (almost 8%) and health status (9.3%), while the highest was that for disposable income, at 13%. In the construction of the BLIi index the dimensions with the highest weights were environment (9%) and health (8.84%); The lowest weights were, apart from civic and political engagement (2.42%), those of the dimensions relating to subjective well-being: life satisfaction (3.73%), work-life balance (4.78%) and social connections (5.12%). Having obtained the weighting factors for each dimension, the respective indices were constructed, as presented in table 8.
Table 8 shows the value of each well-being indicator, as well as the rank of each state for each indicator. All indicators of well-being, except that of life satisfaction (BIARE), place Baja California Sur, Nuevo León and Sonora among the five states with the greatest well-being, and Chiapas, Guerrero, Oaxaca and Puebla among those with the lowest well-being. For their part, the IMBEi, SoLi and HDI indicators place the states at essentially the same well-being rank, with Mexico City and Nuevo León again among the best, and Chiapas and Oaxaca among the worst.
5 The reliability tests found that the Gini coefficient of disposable income indicator, in addition to not contributing to the underlying scale of Cronbach’s alpha, did not have a significant correlation with any other indicator, so it was not considered in the construction of the index; in this regard, tests were performed to verify reliability and fulfilment of the assumptions of the factor analysis by omitting this indicator, and no problem was found.
6 The most recent indicators available in the INEGI Better Life Index are considered. The indicators taken from the Self-Reported Well-Being Module, unlike those used by OECD (2015), are representative at the state level. To construct the dimensions, indicators whose relationship with well-being was negative (such as the poverty indicator) were transformed (multiplicative inverse) so that they all had a positive relationship with well-being.
7 This refers to the two stages in the construction of the global well-being index. In the first stage the dimensions are constructed from the corresponding indicators, and in the second stage the index is constructed from the dimensions obtained. Factor analysis was used in both cases.
8 For the states of Michoacán, Oaxaca and Sonora, the education dimension was constructed without using information from the Programme for International Student Assessment (PISA), because data was not available.

184 CEPAL Review N° 128 • August 2019
A multidimensional approach to the well-being of the population of the states of Mexico
Table 8 Mexico: well-being indicators for states
StateIMBE 2014 BLI 2014 SoL 2014 AMPI 2014 HDI 2012 BIARE 2014
Value Rank Value Rank Value Rank Value Rank Value Rank Value RankAguascalientes 78.95 15 109.95 12 100.19 14 103.7 11 0.7595 9 7.74 27
Baja California 79.65 4 110.02 8 101.18 4 102.3 12 0.7598 8 8.27 5
Baja California Sur 79.54 5 110.32 2 101.25 3 109.4 1 0.7762 4 8.29 4
Campeche 78.91 17 109.38 19 100.02 15 98.2 20 0.7490 15 7.76 25
Mexico City 80.10 1 110.03 7 102.05 1 100.1 15 0.8300 1 8.44 1
Chiapas 77.86 29 108.84 28 98.49 31 90 30 0.6672 32 7.94 16
Chihuahua 79.38 8 109.87 14 100.39 11 102.3 13 0.7344 19 8.32 2
Coahuila 79.46 6 110.08 5 100.77 6 105.7 6 0.7682 5 8.03 10
Colima 79.41 7 110.10 4 100.49 10 107.4 3 0.7631 6 7.77 24
Durango 78.82 18 109.74 17 99.84 19 102.1 14 0.7309 21 8.19 8
State of Mexico 78.35 22 109.08 23 99.92 17 94.5 26 0.7445 16 7.86 20
Guanajuato 78.23 24 109.35 20 99.51 23 95.5 24 0.7197 26 7.93 17
Guerrero 77.87 28 108.73 30 98.64 30 86 32 0.6794 31 7.74 26
Hidalgo 78.33 23 108.91 27 99.46 24 95.5 25 0.7229 24 7.96 14
Jalisco 78.92 16 110.02 9 100.21 13 104.4 9 0.7514 13 7.84 22
Michoacán 77.81 30 109.00 26 98.90 29 98.3 19 0.7001 29 7.64 30
Morelos 78.08 26 109.02 25 99.51 22 93.5 28 0.7494 14 7.66 29
Nayarit 79.17 13 109.99 10 99.98 16 105.6 8 0.7330 20 7.91 19
Nuevo León 80.00 2 110.95 1 101.46 2 107.6 2 0.7896 2 8.19 7
Oaxaca 77.65 32 108.54 32 98.30 32 87.9 31 0.6813 30 7.45 32
Puebla 77.74 31 108.72 31 98.93 28 93.2 29 0.7171 27 7.58 31
Querétaro 79.21 12 109.84 13 100.59 9 103.8 10 0.7601 7 8.26 6
Quinta Roo 79.25 10 109.88 15 100.64 8 100.1 16 0.7536 12 7.97 12
Sinaloa 79.22 11 110.07 6 100.25 12 106.4 5 0.7574 11 7.86 21
San Luis Potosí 78.53 19 109.31 21 99.65 20 98.2 21 0.7262 23 7.95 15
Sonora 79.67 3 110.17 3 101.08 5 106.6 4 0.7792 3 7.96 13
Tabasco 78.38 21 109.07 24 99.57 21 96.3 22 0.7416 17 7.91 18
Tamaulipas 79.31 9 109.97 11 100.70 7 105.7 7 0.7580 10 8.30 3
Tlaxcala 78.21 25 109.26 22 99.30 26 94.2 27 0.7271 22 7.82 23
Veracruz 78.07 27 108.80 29 99.05 27 96 23 0.7134 28 7.73 28
Yucatán 79.01 14 109.83 16 99.90 18 99.4 18 0.7393 18 8.02 11
Zacatecas 78.44 20 109.43 18 99.30 25 100.1 17 0.7200 25 8.07 9
Source: Prepared by the authors, on the basis of data from the National Institute of Statistics and Geography (INEGI), the United Nations Development Programme (UNDP) and the Organization for Economic Cooperation and Development (OECD).
Note: IMBE: multidimensional index of well-being at state level; BLI: well-being index based on the OECD Better Life Index (2015); SoL: well-being index based on the standards of living of Bérenger and Verdier-Chouchane (2007); AMPI: Adjusted Mazziotta-Pareto Index for 2014 as reported by OECD (2015); HDI: human development index; BIARE: life satisfaction indicator from the INEGI Self-Reported Well-being Module.
Figure 4 provides a clearer picture of the similarities and differences between the adapted indices and the AMPI indicator. Naturally, the greatest correlation is between IMBEi and SoLi. This is no surprise, since IMBEi differs only from SoLi in that it includes more indicators of subjective well-being, which had relatively lower weights in construction of the index. However, the correlation between IMBEi and the BLIi index is more interesting, given the significant differences in their construction; although they do not include the same number of dimensions and consider different quantities of indicators with distinct characteristics (except the objective or subjective characteristics of well-being), the correlation between the two is very high. Even when considering Kendall’s tau coefficient, the two indices rank the different states by well-being almost identically.

185CEPAL Review N° 128 • August 2019
Amilcar O. Fernández Domínguez and Denise Gómez Hernández
Figure 4 Mexico: relationship between different well-being indicators, 2014
A. IMBE and BLI indicators B. IMBE and SoL indicators
C. IMBE and AMPI indicators D. BLI and AMPI indicators
PC: 0.9384
KC: 0.7702
78.0
79.0
80.0
77.5
78.5
79.5
IMBE
100 150 200 250BLI
PC: 0.9628KC: 0.8589
78.0
79.0
80.0
77.5
78.5
79.5
IMBE
98 99 100 101 102SoL
PC: 0.8415KC: 0.6915
78.0
79.0
80.0
77.5
78.5
79.5
IMBE
85 90 95 100 105 110AMPI
Mean of indicator
PC: 0.7579KC: 0.6109
100
150
200
250BL
I
85 90 95 100 105 110AMPI
Source: Prepared by the authors, on the basis of official data from the National Institute of Statistics and Geography (INEGI) and the Organization for Economic Cooperation and Development (OECD).
Note: IMBE = multidimensional index of well-being at state level; BLI = well-being index based on the OECD Better Life Index (2015); SoL = well-being index based on the standards of living of Bérenger and Verdier-Chouchane (2007); AMPI = Adjusted Mazziotta-Pareto Index for 2014 as reported by the OECD (2015).
PC = Pearson correlation; KC = Kendall’s tau coefficient.
Upon comparison, as shown in figure 4, although positive variations in any indicator are related to positive variations in the AMPI, there is a significant difference in the positioning they take with respect to well-being of the states; even the BLIi index, which comprises essentially the same data as the AMPI index, shows considerable differences, as it allows for different weights of indicators and dimensions in overall well-being. The most noteworthy case is that of Mexico City, which in all indicators ranks number 1 for well-being, except in AMPI and BLIi, where it is close to the mean (positions 15 and 7, respectively). In fact, it is this difference in Mexico City’s well-being indicators that “penalizes” the correlation in figures 4C and 4D; the difference is explained by the fact that this state is ranked among the lowest in dimensions of subjective well-being, specifically in indicators of life satisfaction and work-life balance, and since these dimensions are more important in the AMPI than in the IMBEi or the BLIi, the overall well-being value for Mexico City is much lower in the case of the AMPI. This clear difference between BLIi and AMPI, and the similarity between BLIi and IMBEi, reaffirm the importance of considering sensitivity to weights when constructing indicators (Stiglitz, Sen and Fitoussi, 2009), even more so than the choice of variables, at least in the case of these indicators of well-being.
186 CEPAL Review N° 128 • August 2019
A multidimensional approach to the well-being of the population of the states of Mexico
V. Conclusions
The fact that Mexico is the fifteenth largest economy in the world in terms of gross domestic product (GDP) (according to World Bank data for 2015) and that more than half of its inhabitants are living in poverty shows just how complex it is to establish policies to improve well-being, at least in the short term, reflecting a conflict between economic growth and reductions in poverty and inequality (López, 2004). In the same vein, it is indisputable that a public policy to improve the well-being of the population that considers the components of well-being in isolation will achieve only limited success or fail entirely. Therefore, there is an inescapable need to consider various objective and subjective aspects when constructing well-being indicators, as stated in theory; in this regard, Stiglitz, Sen and Fitoussi (2009) make the most significant contribution concerning theoretical and practical recommendations for construction of such indicators.
Despite additional complications concerning measurement of subjective aspects of well-being, important progress has recently been made in Mexico through the INEGI self-reported well-being project, providing information on the overall well-being of the population at the national and state levels and insight into the relationships between the different dimensions of well-being. As a result of this information, noteworthy advances have also been made in construction of indicators of overall well-being, in addition to the human development index and the poverty indicators of the National Council for the Evaluation of Social Development Policy (CONEVAL); of these indicators, the most recent is that of OECD (2015), which, by including 35 indicators relating to 12 dimensions of well-being, considers complex and vast information regarding the overall well-being status of the Mexican population. However, this indicator does not attach importance to the weight of each dimension in the overall level of well-being, nor does it use subjective well-being indicators that are representative at the state level, and it ascribes little relevance to inequality, casting doubt on the suitability of making decisions based on its information. At the individual level, it is also reasonable to say that the different facets of well-being may differ in importance, since there is clear heterogeneity in the Mexican population in terms of income, education, access to services, time spent on work, leisure or culture, among other aspects. It is even possible to attribute some truth to the Maslowian position, in the sense of fundamentally allocating the material dimensions of well-being, such as access to food or health, with higher weights than other dimensions such as participation in social groups or living in a situation with lower levels of corruption.
This study therefore adapts a multidimensional well-being index to address the weaknesses identified in the OECD indicator, based on the recommendations of Stiglitz, Sen and Fitoussi (2009). If a purely statistical methodology is employed, the criticism of value judgments on the relative importance of each dimension is avoided, but there is still potential for such a differentiation in their weights. In addition, consideration of the approaches provided by other studies (Bérenger and Verdier-Chouchane, 2007; OECD, 2015) makes it possible to analyse the importance of including different weights, dimensions and indicators when constructing the well-being index. In this sense, the results show that the greatest differences appear when different weights are assigned to the dimensions, supporting the argument that they each have a different impact on well-being; even the possibility of changing weights is more important than selection of the indicators or dimensions themselves.
Another aspect that is evident is the relative importance of the dimensions and indicators related to material well-being, since in all cases they were more important than those related to subjective well-being; in this regard, it can be argued that these results highlight the validity of the human development index as an indicator of the well-being of the Mexican population. But this does not mean that subjective well-being is not important in the analysis. All the same, in the Mexican case, material well-being is perhaps more linked to other dimensions of well-being and, therefore, should be addressed as a priority. It is also important to note that, although a correlation analysis is performed, the question of causality between the dimensions of well-being is not addressed and therefore no conclusions can

187CEPAL Review N° 128 • August 2019
Amilcar O. Fernández Domínguez and Denise Gómez Hernández
be drawn as to whether indicators related to the dimension of material well-being (such as income) have a positive effect on subjective well-being. Until a conclusion can be reached, in a country where around half of the population suffers from some form of poverty, it would perhaps be more appropriate to have a well-being indicator that assigns a higher weight to scarcity of material goods.
Another aspect to consider is that, in order to enable comparison between states, as a starting point for each state dimensions are all weighted in the same way; returning to the argument regarding heterogeneity, this could be said to be a limiting factor of this study, since regional and state differences can be expected. For example, it can be argued that the population of southern states obtains well-being associated with environmental indicators that differs from that obtained by the population in areas where natural resources are scarce, such as Mexico City or the northern states. In this respect, analysis at the microdata level could provide information on the existence of differences in weighting of the dimensions between states, but that is beyond the scope of this study.
Bibliography
Aiginger, K. and M. Firgo (2015), “Regional competitiveness under new perspectives”, Policy Paper, No. 26, Vienna, WWW for Europe.
Arita, B. (2005), “La capacidad y el bienestar subjetivo como dimensiones de estudio de la calidad de vida”, Revista Colombiana de Psicología, vol. 14, Bogotá, National University of Colombia.
Beckley, H. (2002), “Capability as opportunity: how Amartya Sen revises equal opportunity”, Journal of Religious Ethics, vol. 30, No. 1, Hoboken, Wiley.
Bentham, J. (2000), An Introduction to the Principles of Morals and Legislation, Kitchener, Batoche Books.Benvin, E., E. Rivera and V. Tromben (2016), “A multidimensional time use and well-being index: a proposal for
Colombia, Ecuador, Mexico and Uruguay”, CEPAL Review, No. 118 (LC/G.2676-P), Santiago, Economic Commission for Latin America and the Caribbean (ECLAC).
Bérenger, V. and A. Verdier-Chouchane (2007), “Multidimensional measures of well-being: standard of living and quality of life across countries”, World Development, vol. 35, No. 7, Amsterdam, Elsevier.
Bonini, A. (2008), “Cross-national variation in individual life satisfaction: effects of national wealth, human development, and environmental conditions”, Social Indicators Research, vol. 87, No. 2, New York, Springer.
Chakravarty, S. and M. Lugo (2016), “Multidimensional indicators of inequality and poverty”, The Oxford Handbook of Well-being and Public Policy, M. Adler and M. Fleurbaey (eds.), New York, Oxford University Press.
Graham, J. (2006), “Congeneric and (essentially) tau-equivalent estimates of score reliability: what they are and how to use them”, Educational and Psychological Measurement, vol. 66, No. 6, Thousand Oaks, SAGE.
Hicks, D. (2002), “Gender, discrimination, and capability: insights from Amartya Sen”, The Journal of Religious Ethics, vol. 30, No. 1, Hoboken, Wiley.
Kaiser, H. (1974), “An index of factor simplicity”, Psychometrika, vol. 39, No. 1, New York, Springer.Kolm, S. (1997), Justice and Equity, Cambridge, MIT Press.Krauss, A. and C. Graham (2013), “Subjective wellbeing in Colombia: some insights on vulnerability, job
security, and relative incomes”, Policy Research Working Paper, No. 6672, Washington, D.C., World Bank.Lever, J. (2004), “Poverty and subjective well-being in Mexico”, Social Indicators Research, vol. 68, No. 1,
New York, Springer.López, J. (2004), “Pro-growth, pro-poor: is there a trade-off?”, Policy Research Working Paper, No. 3378,
Washington, D.C., World Bank.Mexico, Government of (2013), Plan Nacional de Desarrollo 2013–2018, Mexico City.Nafziger, E. (2005), Economic Development, Cambridge, Cambridge University Press.OECD (Organization for Economic Cooperation and Development) (2015), Measuring Well-being in Mexican
States, Paris, OECD Publishing. (2014), How’s Life in Your Region? Measuring Regional and Local Well-being for Policy Making, Paris, OECD Publishing.(2008), Handbook on Constructing Composite Indicators. Methodology and User Guide, Paris, OECD Publishing.

188 CEPAL Review N° 128 • August 2019
A multidimensional approach to the well-being of the population of the states of Mexico
Plata, L. (1999), “Amartya Sen y la economía del bienestar”, Estudios Económicos, vol. 14, No. 1, Mexico City, El Colegio de México.
Rawls, J. (1971), A Theory of Justice, Cambridge, Harvard University Press.Rojas, M. (2007), “The complexity of well-being: a life-satisfaction conception and a domains-of-life approach”,
Well-being in Developing Countries: from Theory to Research, I. Gough and J. McGregor (eds.), New York, Cambridge University Press.(2005), “¿Qué es desarrollo económico?”, La formación de economistas: ensayos en honor de Pepita Echandi, J. Vargas and Y. Xirinachs (eds.), San José, University of Costa Rica.
Sen, A. (1984), Resources, Values, and Development, Cambridge, Harvard University Press.StataCorp (2013), Stata Multivariate Statistics Reference Manual: Release 13, College Station, StataCorp LP.Stiglitz, J., A. Sen and J. Fitoussi (2009), Report by the Commission on the Measurement of Economic
Performance and Social Progress, Paris, The Commission.Tavakol, M. and R. Dennick (2011), “Making sense of Cronbach’s alpha”, International Journal of Medical
Education, vol. 2, Nottingham, Mayfair Publications.Thomson, W. (2016), “Fair allocation”, The Oxford Handbook of Well-being and Public Policy, M. Adler and
M. Fleurbaey (eds.), New York, Oxford University Press.Valencia, G. and J. Cuervo (1999), “Crítica a las bases éticas de la teoría neoclásica en la propuesta del
bienestar social de Amartya Sen”, Lecturas de Economía, No. 51, Medellín, University of Antioquia.Veenhoven, R. (2005), “Is life getting better? How long and happy people live in modern society”, European
Psychologist, vol. 10, No. 4, Boston, Hogrefe.Villatoro, P. (2012), “La medición del bienestar a través de indicadores subjetivos: una revisión”, Estudios
Estadísticos y Prospectivos series, No. 79 (LC/L.3515), Santiago, Economic Commission for Latin America and the Caribbean (ECLAC).
Wells, T. (2016), “Sen’s capability approach”, Internet Encyclopedia of Philosophy, J. Fieser and B. Dowden (eds.), Martin, University of Tennessee at Martin.
Yurdugül, H. (2008), “Minimum sample size for Cronbach’s coefficient alpha: a Monte-Carlo study”, Hacettepe University Journal of Education, vol. 35, Beytepe, Hacettepe University.

189CEPAL Review N° 128 • August 2019
Amilcar O. Fernández Domínguez and Denise Gómez Hernández
Annex A1
The OECD Handbook on Constructing Composite Indicators (2008) includes 10 steps: (i) development of the theoretical framework, (ii) data selection, (iii) imputation of missing data, (iv) multivariate analysis, (v) normalization, (vi) weighting and aggregation, (vii) sensitivity analysis, (viii) data screening, (ix) links to other indicators and (x) visualization of results. This article primarily addresses the technical recommendations of the fourth and sixth steps concerning factor analysis of principal components and Cronbach’s alpha.
The OECD (2008) mentions that Cronbach’s alpha is not a statistical test but a coefficient of reliability (internal consistency) based on the correlation between individual indicators. Thus, high correlation indicates that individual indicators measure the same underlying variable or dimension, in this case well-being. It should be noted that although calculation of Cronbach’s alpha allows the value of a scale to be obtained for each observation, using this scale as the underlying variable or dimension can lead to flawed conclusions. In this regard, some authors (such as Graham (2006) and Tavakol and Dennick (2011)) stress that Cronbach’s alpha should not be considered a uni-dimensional test, as it can be misleading if the underlying scale considers more than one dimension. Therefore, Tavakol and Dennick (2011) suggest using factor analysis to identify more than one dimension in a test.
Thus, considering that the scale obtained through Cronbach’s alpha is multidimensional, the suggestion of Tavakol and Dennick (2011) and OECD (2008) is followed, using factor analysis of principal components to construct the well-being indicator according to the weights obtained through this same method; although there are other approaches such as the axiomatic method and fuzzy set theory (Chakravarty and Lugo, 2016), factor analysis of principal components is easily applied and offers advantages in terms of interpretation of its results. To this end, OECD (2008) states that it is necessary to have relatively high correlation between the original variables xij; otherwise, it would not make sense to apply this approach. Therefore, after calculating Cronbach’s alpha, correlation analysis of the xij variables is performed to confirm that the relationships are statistically significant and have the expected sign, and to examine the groups of variables with the closest relationship that may be found at the time of the factor analysis.
After confirming the existence of significant correlations between the variables of interest, a factor analysis of principal components is performed to obtain Wk and wjk, used in equation (1), validated by means of the Kaiser-Meyer-Olkin measure. According to the OECD criteria (2008), the principal components are considered if they satisfy three conditions: (i) they are orthogonal and contribute at least 10% to the explanation of overall variance; (ii) they contain the largest proportion of variance accounted for with an eigenvalue of more than 1; (iii) they contribute cumulatively to the explanation of the overall variance by more than 60%. Subsequently, the weights are obtained from the squares of factor loadings normalized by the variance of the factor. These normalized weights are obtained from the rotated factors by means of the varimax method, in order to minimize the number of indicators in each factor and to have a simpler compositional structure of the factors used; in other words, this varimax rotation method transforms the original loadings (without rotation) without affecting the variance of the factors to improve their interpretation (StataCorp, 2013) and to facilitate the calculations in equation (1).


Inherited and social factors explaining early skills inequality: the case of Chilean children
Ricardo Rivas1
1 The author is grateful for the insights of anonymous reviewers of this paper. He would also like to thank Dr. Erin Leahey, who provided crucial assistance with the research. He was greatly aided by the comments of colleagues at the Social Inequality Workshop of the School of Sociology and by support from the Writing Skills Improvement Program of the University of Arizona.
Abstract
This article sets out to analyse differences in cognitive and non-cognitive skills between Chilean children. It first examines factors explaining the level of these skills and then goes on to distinguish between children from poor and non-poor households. The data are taken from the first Early Childhood Longitudinal Survey, which was analysed using logistic binary regression. This study finds that variables associated with the mother’s intelligence level and other socialization-related variables are statistically significant. However, separate statistical analysis for poor and non-poor households yields different effects of socialization. The main conclusion is that the mother’s skills are a relevant explanatory factor in both poor and non-poor children’s households. Nonetheless, unequal development of skills in early childhood is not due to inherited traits alone. Stimulation matters in poor households, while the mother’s education matters in non-poor households.
Keywords
Children, child development, households, economic conditions, social conditions, poverty, parent education, Chile
JEL classification
D31, I39, I24
Author
Ricardo Rivas is a Postdoctoral Researcher with the Centre for the Study of Social Conflict and Cohesion (COES) and the Research Center for Integrated Disaster Risk Management (CIGIDEN), Chile. Email: [email protected].

192 CEPAL Review N° 128 • August 2019
Inherited and social factors explaining early skills inequality: the case of Chilean children
I. Introduction
Inequality between children challenges the idea of merit. It is not sensible to explain unequal conditions at the beginning of our lives on the basis of individual traits linked to self-determination such as motivation and effort. Different factors operating in the very early stages of life condition future achievements (Baker-Henningham and López, 2010). There is evidence that brain formation critical to the normal development of cognitive and non-cognitive skills takes place between birth and the age of three (Vegas and Santibáñez, 2010). The present study focuses on the factors explaining unequal development of skills in early childhood.
There has been a significant volume of research into the causes underlying the unequal distribution of early cognitive and non-cognitive skills in developed countries. Prominent studies have considered both genetic aspects (Adkins and Guo, 2008) and different facets of children’s social environments (Mayer, 1997). In general, examination of the inequality of intellectual skills between children has turned on the classic nature versus nurture debate with regard to individual achievement (Currie, 2011).
This study looks at the tension between nature and nurture, controlling for other factors relevant to early childhood development in the social and economic realms. These aspects of children’s socialization are well worth considering, given the neoliberal regimes that have operated in developing countries over the last three decades. Chile is a good case study in this respect.
There has been previous research into Chilean children and their early skills. Noboa-Hidalgo and Urzúa (2012) demonstrated the importance of early education for cognitive and socioemotional development. Cortázar (2015) found that good results in standardized tests among children in fourth grade could mainly be explained by their past participation in early education programmes. Drawing on the same data used by Cortázar, Coddington, Mistry and Bailey (2014) replicated and tested a socioeconomic status model developed by American scholars to explain children’s cognitive abilities. Their findings yielded important information on social factors mediating the effect of material conditions on children’s receptive vocabulary. Taking these valuable studies into consideration, the present research raises similar questions. First, do the factors associated with inherited traits and socialization explain the different levels of cognitive and non-cognitive skills in Chilean children? Second, do these factors behave in different ways depending on the socioeconomic status of children’s households? Although this paper explores concerns similar to those of the aforementioned studies, it has two distinctive features. First, the dependent variable used is a more holistic measure of children’s skills, considering both cognitive and non-cognitive traits. Second, this study does not only take social and material conditions as its independent variables, but also considers an inherited trait, namely the cognitive level of children’s mothers.
II. Literature review and theoretical background
1. Inherited aspects of early skills
Genetics and the social environment are often studied together in the social sciences using an approach known as the gene-environment paradigm. Scholarly research from this perspective seeks to understand the environmental factors that may limit or enable genetic tendencies (Fletcher and Boardman, 2013). Some prominent examples include research that queries the interaction between people’s educational level and their body mass (Boardman and others, 2014) and how influential neighbourhood peers can be as regards alcohol consumption (Daw and others, 2013) or cigarette use (Daw and others, 2014), depending on adolescents’ genetic characteristics.

193CEPAL Review N° 128 • August 2019
Ricardo Rivas
However, there has been a great deal of debate around efforts to explain social inequality by inherited aspects. Social scientists still dismiss genetic aspects when considering social issues (Nisbett and others, 2012) or misconstrue the integration of social science and genomics (Conley and Rauscher, 2013). However, there are two aspects that empirical evidence confirms. First, intelligence is a human characteristic which is influenced by genetics and heritable aspects. Second, how strong the influence of genetic aspects on human behaviour is depends on social circumstances (Nisbett and others, 2012). The present study accepts the scientific consensus that intelligence has genetic elements.
When it comes to the findings regarding inherited traits, variables related to the mother’s intelligence are part of one of the testable models in this study, called the heritage model. In this regard, the first hypothesis proposed here is that the heritage model is significant in explaining the level of children’s skills, controlling for variables associated with their state of health.
2. Social aspects of early skills
Prominent studies have focused on phenomena such as seasonality affecting birth weight (Torche and Corvalan, 2010), natural disasters affecting mothers during pregnancy (Torche and Kleinhaus, 2012) and children’s cognitive development at preschool ages (Gómez and Yoshikawa, 2017).
In this regard, there are specific variables that this research has integrated into the socialization model. This is operationalized by considering various indicators. One is the age of the mother, which is associated with undesirable parenting traits such as restrictive language and infrequent learning activities (Jung, Fuller and Galindo, 2012). Another indicator is family structure, which might affect child development (McLanahan, 2009). Other variables stand in for cognitive stimulation characteristics, meaning practices and physical environments that stimulate children. Different theoretical models and methodological approaches have included these as variables affecting child development (Jung, Fuller and Galindo, 2012). Children’s stimulation is crucial during the first three years of life, according to neuroscience studies. Even the fetal environment and the mother’s behaviour during pregnancy have significant consequences for a child’s future development (Henrichs and others, 2011). Finally, there is a third aspect concerning the cultural capital in the child’s environment. Following Bourdieu’s definition of this type of capital, this is a dimension that might foster competence in socially valued areas of practice (Sallaz and Zavisca, 2007), and it has been operationalized for this study by taking the mother’s education level. This variable has proved important in other studies, which have demonstrated that low-educated mothers typically have poorer pregnancy outcomes, fewer cognitive skills and poorer socioemotional and behavioural skills (Doyle and others, 2009). The second hypothesis of this study is that the socialization model is significant because it explains children’s skill levels when health-related variables are controlled for.
3. Risk circumstances as control variables
According to Sen (1987), people need to exert their self-determination in order to develop their abilities and take advantage of opportunities. However, basic individual circumstances such as health, income and education are a necessary starting point. For Roemer (2000), different circumstances can be seen as advantages or disadvantages insofar as they are not related to individual responsibility or effort. In short, lack of capacity and opportunities beyond individuals’ control alter the prospects of success in self-determined pursuits (Mithaug, 1996). As previously mentioned, this specific study uses relevant variables to control for inherited and acquired traits explaining children’s early skills. These variables have been defined as risk circumstances potentially affecting their cognitive and non-cognitive development.

194 CEPAL Review N° 128 • August 2019
Inherited and social factors explaining early skills inequality: the case of Chilean children
Risk circumstances can be understood as biological and environmental conditions that increase the likelihood of negative developmental outcomes (Liaw and Brooks-Gunn, 1994). Research on child development has highlighted several risk factors that interactively influence the intellectual development of children. A number of leading scholars have given different names to this conditioning process: “cumulative risks” (Sameroff and others, 1993), “risk microsystem” (Ayoub and others, 2009) and “cumulative inequality” (Schafer, Ferraro and Mustillo, 2011).
Risk circumstances are associated with pregnancy, birth and the neonatal period. There is evidence that a stressful environment during the prenatal phase affects children’s developmental achievements (Henrichs and others, 2011). Furthermore, going by data from the Panel Study of Income Dynamics (PSID) survey in the United States, Conley and Bennet (2000) found that circumstances arising around the time of birth could have a lasting impact on outcomes measured even 19 years later. Birth weight was taken into account because of its demonstrated consequences for children’s life courses (Orchinik and others, 2011). For instance, low birth weight is associated with a 34% decrease in the probability of graduating from high school (Conley and Bennett, 2000). Another aspect is whether the pregnancy was risky or not from an obstetric perspective. These two aspects are an indirect approach to circumstances associated with the mother’s pregnancy, given the available data. Finally, an important risk circumstance is the poverty level of the households children live in. Poverty exerts effects on children’s future achievements in different ways (Kim and others, 2013). Poverty as an independent variable is analysed further in the following section.
4. The effects of nature and nurture depending on the socioeconomic context
Adkins and Guo (2008) have proposed a way of approaching this genetics-social environment debate. Their contention is that the influence of genetic aspects on an individual’s attainment interacts with social elements. Genetic traits have had different levels of influence over the course of human history. Thus, genetic factors may be supposed to have mattered considerably in hunter-gatherer societies. According to Guo and Stearns (2002), there is a difference between the level of genetic potential for intellectual development (in the form of innate and inherited mental ability) and the realization of this potential. The latter is conditioned by the social environment. For instance, it has been claimed that the strength of genetic influence on status outcomes depends on the level of inequality in a society (Adkins and Guo, 2008). Studying cognitive skills and their inherited genetic aspects, Nisbett and others (2012, p. 133) wrote that “it appears reasonable to conclude that the heritability of cognitive ability is attenuated among impoverished children and young adults in the United States”.
The second research question addresses the idea that the relationship between nature and nurture (genetics and socialization) might be different depending on material conditions. Accordingly, this phenomenon is observed in the context of poor and non-poor children’s households. As mentioned, it is necessary to understand the centrality of this variable in the light of the retrenchment of social welfare in developing countries in the last few decades. Neoliberal regimes and decreasing welfare benefits have boosted the role of income as the main indicator of individual and household well-being (Huber and Stephens, 2012). In the context of early childhood development, income and its social distribution matter (ECLAC, 2010).
Thus, observing the nature versus nurture dyad in different socioeconomic contexts is a way to take account of the unequal material circumstances in which children are raised and develop. Household poverty and its expected undesirable consequences for children are a disadvantage (Fergusson, Horwood and Boden, 2008). The effect of poverty has been demonstrated by other researchers (Kim and others, 2013). Furthermore, early childhood is the most crucial phase in life when it comes to the effects of family income on children’s future outcomes (Duncan, Kalil and Ziol-Guest, 2010). The relationship between material deprivation and the emotional aspects of parenting has also been

195CEPAL Review N° 128 • August 2019
Ricardo Rivas
investigated. Some research has found that poverty exerts its negative effects through the following: punitiveness (Conger and others, 1994), the level of organization of the household routine (Berry and others, 2016), low levels of support from parents (Hashima and Amato, 1994) and low investment in children’s enrichment items and activities (Kaushal, Magnuson and Waldfogel, 2011). Given this theoretical and empirical background, the third hypothesis of this study is that variables nested in both heritage and socialization models have a different statistical significance when the poverty level of a child’s household is controlled for.
III. The Chilean case
The status of Chile with respect to social inequality is controversial. Chile has attained positive results with macroeconomic indicators over the last two decades. Most notable perhaps is the greater equality of opportunity (Contreras and others, 2012). Furthermore, Chile has demonstrated the fluid social mobility characteristic of industrialized countries (Torche, 2005). On the other hand, it is one of the most unequal countries in Latin America and the most unequal among OECD members with respect to income distribution (UNDP, 2010).
There is evidence that income inequality can be explained by both unequal access to education and low investment in human capital. Unequal educational attainment at the post-secondary level has resulted in unequal monetary returns, explaining the high degree of wage inequality in the country (Contreras and Gallegos, 2011). Regarding human capital, there is evidence that low levels of tax revenue in Chile have restricted the scope of fiscal investment in human capital beyond the provision of schooling for low-income sectors, which has not contributed to the reduction of wage inequality (López and Miller, 2008).
There is evidence that the development of early skills is crucial. Consequently, governments should focus on improving the cognitive skills of populations in general (Hanushek and Wößmann, 2006). This recommendation appears sensible, considering that students in Chile obtain very poor results in international tests such as the Programme for International Student Assessment (PISA) and that the cognitive skills of the Chilean population are generally low, according to the International Adult Literacy Survey (IALS) (Brandt, 2010). Like resources of all kinds, skills are not equally distributed because of sharp differences by social background in the Chilean population (OECD/Statistics Canada, 2011).
In the social policy realm, there are reasons to question the approach to early childhood inequality in Chile. The need for government cash transfers to improve children’s household income has been continually asserted by the United Nations. In this regard, Chile is in line with the general Latin American situation of low overall investment in human capital (ECLAC, 2010).
IV. Data
The data source for this research is the first round of the Early Childhood Longitudinal Survey carried out by the Chilean government in 2010. It was the first national panel study in Chile to cover variables associated with the economic and social conditions of children’s households, psychological tests for children, psychological tests for mothers (or primary caregivers) and other contextual variables.
The sampling frame for these data is provided by official records of all Chilean children born between 1 March 2004 and 31 August 2009. Out of a sampling frame of 1,297,822 children, 30,000 were chosen by stratified random sampling. The stratification criteria were birth cohorts (2006, 2007, 2008 and 2009), sex and urban or rural area. Within these strata, each unit was chosen by systematic random sampling. After stratification, the sample included 13,895 children, who were evaluated and

196 CEPAL Review N° 128 • August 2019
Inherited and social factors explaining early skills inequality: the case of Chilean children
their respective caregivers surveyed. This sample was then narrowed down to all children who had been evaluated using the Battelle Developmental Inventory Test, which is for children aged from 6 months to 2 years old. Then, given the objectives of this research, it was necessary to discard cases with one or more of the following characteristics: (i) households with twin siblings presenting duplication and more complex issues and (ii) subjects for whom the survey was answered by someone other than the child’s biological mother. The latter restriction was decided on because there were questions of importance for the analysis that were put only to biological mothers. The analysis sample comprises 4,695 cases from the first round of the aforementioned longitudinal survey.
V. Measurement
The dependent variable is the Battelle test score, which represents children’s levels of development of cognitive and non-cognitive skills. In research into status attainment, cognitive and non-cognitive skills might be treated as required resources (using a process of distribution) and a set of explanatory variables. However, cognitive and non-cognitive skills can also be regarded as outcomes resulting from specific circumstances (Contreras and others, 2012), as in the present study.
More practically, children were tested with the Battelle Developmental Inventory Test for children aged from 6 months to 2 years old. Broadly, this test assesses skills related to social, psychomotor, communication and cognitive dimensions and assigns a score to each child (Berls and McEwen, 1999). Experts involved with the survey placed children into three categories by their Battelle test scores: deficient development, normal development and superior development. These categories were then reduced to two: normal-superior = 0 (94.72%) and deficient = 1. Thus, the dependent variable is a dichotomous variable.
All the independent variables have dummy dichotomous responses (0 = no; 1= yes). They are responses to behaviours or conditions (i.e. insufficient stimulation activities, mother’s Wais score test insufficient, etc.). It is important to describe the level of the mother’s intelligence as an independent variable. This was gauged using the Wechsler Adult Intelligence Scale (WAIS) test, which measures human intelligence in a way that takes account of non-intellective factors, among other features (Kaplan and Saccuzzo, 2009). The score for this test (applied to children’s natural mothers) serves to identify different levels of intelligence. For the dummy variable used in this case, 0 is a normal or superior level and 1 is a deficient level.
The control variables relate to children’s health and also have dummy dichotomous responses. It is important to know some details about the child household poverty measure, which is a control variable for responding to our second research question. Household poverty was measured as an absolute level, with households under the poverty line being considered poor. The poverty line is a specific amount of money (per capita) necessary to consume a minimum level of food and its calories. The amount is established each year, and that for 2009 was taken for this study. The absolute level was used to create a dummy variable where 0 is a non-poor household and 1 is a poor household.
As table 1 shows, each variable is presented for both the heritage and the socialization model. There are also control variables. The table shows the frequency distribution of each indicator across the two categories of the dependent variable.
VI. Strategy of analysis
The first step was a general diagnosis of the relationship between the independent variables and the outcome. A bivariate analysis was carried out using χ2. This testing is appropriate to the level of measurement of the variables in this investigation.

197CEPAL Review N° 128 • August 2019
Ricardo Rivas
The rest of the analysis was carried out to test the hypotheses referred to. The strategy of partitioning effects through causal models was used to test the first and second hypotheses. Given that the dependent variable is dichotomous, a binary logistic regression was run to estimate and test the heritage and socialization models. To ascertain how well the models fitted the data, the Bayesian information criterion (BIC) was used to evaluate the improvement with respect to the full model.
Paul Lazarsfeld’s elaboration paradigm was applied to test the third hypothesis. This involves partitioning cases into relevant categories in accordance with a theoretical rationale. All the models are estimated separately, considering children’s household poverty levels (poor households and non-poor households). Binary logistic regressions were used as in the previous step.
VII. Results
1. Bivariate analysis
Table 1 shows each independent variable in relation to the dependent dichotomous variable (children with normal or deficient skill levels). The percentages of cases with a positive response (yes = 1) for each specific variable are shown in parentheses. In the next columns, the percentages of children with a normal or deficient level are presented for each independent variable. Significant associations between an independent variable and the dependent one are indicated.
For instance, in the case of the “Mother’s numerical skills deficient” variable, 67.38% of the sample have this characteristic. Of those children with a normal level of skills, 66.76% have a mother with this characteristic. Of those children with a deficient level of skills, 75.81% do.
Table 1 Descriptive values and bivariate relationships between independent variables
and dependent variablesa
(Percentages)
Model and variables with positive response (percentages of population)
Children’s skill level (percentages of cases with a positive response for each variable)
Normal Deficient
Heritage model
Mother’s numerical skills deficient (67.38)* 66.76 75.81
Mother’s verbal skills deficient (36.19)* 34.52 58.87
Socialization model
Insufficient stimulation activities (9.42) 9.25 11.69
Insufficient stimulation environment (23.04)*** 22.12 35.48
Mother is young (6.66)*** 6.41 10.08
Biological father does not live with child (31.22)*** 30.78 37.1
Mother did not finish high school (35.44)*** 34.31 50.81
Control variables
Child had a low birth weight (6.41) 6.32 7.66
Mother had a high-risk pregnancy (12.43) 12.37 13.31
Poor household (35.94)* 35.32 44.35
N 4 447 248
Source: Prepared by the author, on the basis of data from the Early Childhood Longitudinal Survey, 2010.a Statistical significance levels: ***p<0.001, **p<0.01, and *p<0.05, derived from two-tailed χ2 tests of independent variables.

198 CEPAL Review N° 128 • August 2019
Inherited and social factors explaining early skills inequality: the case of Chilean children
In this bivariate analysis, there are significant associations between the dependent variable and most of the specific variables associated with the two models defined for this study. Specifically, in the heritage model, “Mother’s numerical skills deficient” and “Mother’s verbal skills deficient” have a significant association. In the socialization model, “Insufficient stimulation environment”, “Mother is young”, “Biological father does not live with child” and “Mother did not finish high school” have a significant association.
2. Multivariate analysis
The first research question is what factors explain children’s cognitive and non-cognitive skill levels. To address this question, three theoretical models were tested.
Table 2 shows all logistic regressions for the three models mentioned. When all independent variables are regressed on the dependent variable (full model), three variables within it are significant, namely “Insufficient stimulation environment” and “Mother’s verbal skills deficient”. The model in general is significant at p<0.05.
Table 2 Coefficients (standard errors) and odds ratios according to three logistic regression modelsa
Dependent variable: low skills (1 = yes; 0 = no)
Full model Socialization model Heritage model
β OR β OR β OR
Insufficient stimulation environment 0.42**(0.15)
1.04 0.49**(0.15)
1.63
Insufficient stimulation activities 0.04(0.21)
1.04 0.05(0.21)
1.05
Mother is young 0.15(0.24)
1.16 0.19(0.24)
1.23
Biological father does not live with child 0.29(0.14)
1.33 0.27(0.14)
1.31
Mother did not finish high school 0.27(0.15)
1.31(0.20)
0.52***(0.14)
1.68
Mother’s numerical skills deficient 0.13(0.16)
1.14 0.19(0.16)
1.21
Mother’s verbal skills deficient 0.80***(0.14)
2.23 0.92***(0.14)
2.52
Mother had a high-risk pregnancy 0.08(0.25)
1.08 0.11(0.19)
1.11 0.05(0.19)
1.05
Child had a low birth weight 0.07(0.25)
1.07 0.12(0.14)
1.13 0.13(0.25)
1.14
Poor household 0.12(0.14)
1.13 0.18(0.14)
1.2 0.21(0.14)
1.24
Constant -3.49(0.17)
0.03 -3.12(0.12)
0.04 -3.22(0.15)
0.04
Likelihood ratio (LR) χ2 80.37 46.07 61.15
Degrees of freedom 10 8 5
Bayesian information criterion 1.573 19.48 -20.18
Probability > χ2 0.00 0.00 0.00
N 3 620 3 620 3 620
Source: Prepared by the author, on the basis of data from the Early Childhood Longitudinal Survey, 2010.a Statistical significance levels: ***p<0.001; **p<0.01; *p<0.05 (two-tailed tests). Coefficients presented in lieu of log-odds ratios.
All constants are significant at p<0.01. β = coefficient. OR = odds ratio (change factor).

199CEPAL Review N° 128 • August 2019
Ricardo Rivas
Regarding the socialization model, the variables “Insufficient stimulation environment” and “Mother did not finish high school” are significant within it. With respect to the former, this is robust because it is still significant in the full model. The socialization model in general is significant at p<0.05.
Within the heritage model, the variable “Mother’s verbal skills deficient” is significant, as it is in the full model, indicating that it is a robust significant variable. The model as a whole is significant at p<0.05.
The Bayesian information criterion (BIC) was used to estimate the goodness of fit of the three different models. Considering only this criterion, in which a smaller number is better, the heritage model seems best (BIC = -20.18). Also, although some goodness of fit (LR χ2 ) is lost relative to the full model (80.37), the heritage model retains the second-highest value of LR χ2 (61.15).
It is possible to retain the first hypothesis, which states that the heritage model is significant in explaining the level of children’s skills when health-related variables are controlled for. The second hypothesis, which states that the socialization model is significant, can be also retained. However, the heritage model fits the data better than the latter.
Since the heritage model can be chosen as the explanatory model, it is worth interpreting its significant coefficient. When child health-related variables are controlled for, a child whose mother’s verbal skills are deficient is 3 times (OR = 2.52) as likely on average to have a low level of cognitive and non-cognitive skills than a child whose mother scores well for these skills.
To address the second research question, table 3 does reveal some differences between children living in poor versus non-poor households. In the former type of households, the socialization model is not significant. However, “Insufficient stimulation environment”, a variable associated with children’s socialization, is significant in the full model. The “Mother’s verbal skills deficient” variable is significant in the heritage model, as it is in the full model. This means that, controlling for health-related variables, a poor child whose mother’s verbal skills are deficient is 3 times (OR = 2.61) as likely on average to have a low level of cognitive and non-cognitive skills as a child whose mother scores well for these skills.
In the case of children living in non-poor households, all the models are significant. The “Mother did not finish high school” variable is significant in the socialization model, as it is in the full model. It can be predicted that, controlling for health-related variables, a non-poor child whose mother did not finish high school is twice (OR = 1.95) as likely on average to have a low level of cognitive and non-cognitive skills as a child whose mother did complete this level of education. Likewise, the “Mother’s verbal skills” variable is significant in the heritage model, as it is in the full model. It can be predicted that, controlling for health-related variables, a non-poor child whose mother’s verbal skills are deficient is twice (OR = 2.41) as likely on average to have a low level of cognitive and non-cognitive skills as a child whose mother scored well for these skills.
In general, the third hypothesis of this study, which states that variables from both the heritage and socialization models have a different statistical significance when the poverty level of the child’s household is controlled for, can be partially accepted. First, the socialization model is significant in non-poor households but not in poor countries. Second, the heritage model is significant for both types of households. However, the “Mother’s verbal skills deficient” variable has a greater effect on poor children.

200 CEPAL Review N° 128 • August 2019
Inherited and social factors explaining early skills inequality: the case of Chilean children
Table 3 Coefficients (standard errors) and odds ratios according to three logistic regression models
for poor and non-poor householdsa
Dependent variable: low skills (1 = yes; 0 = no)
Poor households Non-poor households
Full model Socialization model Heritage model Full model Socialization
model Heritage model
β OR β OR β OR β OR β OR β OR
Insufficient stimulation environment
0.51*(0.21) 1.67 0.61**
(0.21) 1.84 0.33(0.21) 1.39 0.39
(0.21) 1.48
Insufficient stimulation activities
-0.13(0.33) 0.88 -0.14
(0.33) 0.87 0.19(0.28) 1.21 0.19
(0.28) 1.21
Mother is young -0.29(0.04) 0.75 -0.19
(0.42) 0.83 0.36(0.29) 1.43 0.38
(0.29) 1.46
Biological father does not live with child
0.20(0.22) 1.22 0.10
(0.22) 1.11 0.32(0.19) 1.38 0.35
(0.19) 1.42
Mother did not finish high school
0.00(0.22) 1.0 0.28
(0.21) 1.32 0.46*(0.20) 1.58 0.67***
(0.19) 1.95
Mother’s numerical skills deficient
0.27(0.27) 1.31 0.31
(0.27) 1.36 0.03(0.20) 1.03 0.17
(0.19) 1.19
Mother’s verbal skills deficient 0.96***(0.23) 2.61 0.99***
(0.22) 2.69 0.68***(0.19) 1.97 0.088***
(0.18) 2.41
Mother had a high-risk pregnancy
0.19(0.28) 1.21 0.25
(0.27) 1.28 0.19(0.27) 1.21 -0.03
(0.29) 0.97 -0.03(0.29) 0.97 -0.09
(0.29) 0.91
Child had a low birth weight -0.02(0.39) 0.82 0.08
(0.39) 1.08 0.02(0.39) 1.02 0.14
(0.34) 1.15 0.15(0.33) 1.16 0.23
(0.33) 1.26
Constant -3.40(0.30) 0.03 -2.82
(0.19) 0.75 -3.22(0.26) 0.04 -3.5
(0.19) 0.03 -3.26(0.15) 0.04 -3.2
(0.17) 0.04
Likelihood ratio (LR) χ2 35.03 12.97 27.73 44.8 31.67 26.72
Degrees of freedom 9 7 4 9 7 4
Bayesian information criterion 29.5 37.2 0.95 24.9 22.6 4.3
Probability > χ2 0.0*** 0.07 0.0*** 0.0*** 0.0*** 0.0***
N 1 301 1 301 1 301 2 319 2 319 2 319
Source: Prepared by the author, on the basis of data from the Early Childhood Longitudinal Survey, 2010.a Statistical significance levels: ***p<0.001; **p<0.01; *p<0.05 (two-tailed tests). Coefficients presented in lieu of log-odds ratios.
All constants are significant at p<0.01. β = coefficient. OR = odds ratio (change factor).
VIII. Discussion and conclusion
Previous researchers have explored social aspects of children’s development and found that early education and quality of care matter in their own right (Cortázar, 2015) and mediate other phenomena such as household organization (Berry and others, 2016). This study explores similar concerns and aims to address two main questions. The first concerns the factors explaining inequality between children with respect to their early skills. The second is whether the effects exerted by these factors differ between poor and non-poor children’s households.
However, this study has some particular features, focusing as it does on a very early stage of childhood in a developing country using direct measures of children’s and their mothers’ abilities. In addition, these measures do not concentrate solely on children’s cognitive traits since, as other scholars have contended, non-cognitive traits matter as much as cognitive ones in their effects on children’s future achievements (Davies and others, 2016).
The findings of this study support the association of both inherited and social aspects with children’s early abilities. Among these aspects, poverty emerges as a variable in children’s development. However, further analysis was necessary to control for a number of other theoretically relevant variables.

201CEPAL Review N° 128 • August 2019
Ricardo Rivas
It has been confirmed that intelligence is genetically conditioned. Mothers’ verbal skills explain the skill levels of their children. This is a factor that has been shown to be very robust when different variables are controlled for. A clue to the mechanisms producing this effect is provided by the results of the research carried out by Leyva and Smith (2016), who find that low-income Chilean parents’ narrative styles in conversations about negative experiences exert a significant effect on the readiness skills of their children (Leyva and Smith, 2016).
Although socialization-related variables have a lesser explanatory effect, aspects like stimulation and the mother’s educational level are relevant in explaining the development of children’s skills. However, it needs to be borne in mind that the mother’s educational level and verbal cognitive skills are correlated, as Ayoub and others (2009) found. It will be for future research to establish the role of the mother’s educational level as part of a causal model incorporating variables similar to those used in this study. Previous research has furnished some ideas. For instance, a nation’s development level directly affects mothers’ educational level, which in turn affects children’s cognitive development (Sun and others, 2016).
When the aforementioned factors are observed, with the distinction made between poor and non-poor households, there are other aspects to take into account. The mother’s skills are a relevant explanatory factor in both poor and non-poor children’s households, having a greater explanatory effect in poor households. But it is not possible to state that unequal development of early childhood skills in Chile is due only to inherited traits. The tension between nature and nurture is present in poor and non-poor households, but in different ways. Besides the mother’s level of intelligence, stimulation matters in poor households, while the mother’s education matters in non-poor households.
This research supports the idea that genetics affects an individual’s attainments in the short term, in conjunction with aspects of the social environment. Poverty is not only a very difficult condition to reverse: it is also a situation that impedes efforts to break the intergenerational transmission of inequality. It is a cause for concern if the availability and quality of public services such as early education depend on families’ purchasing power. Poor children urgently need stimulating environments, which can mitigate genetic conditioning.
Poverty is evidently an impediment to equality of opportunities for children from a very early stage in life. Poor children are less likely to be able to compensate for inherited traits and develop the basic skills needed to interrupt the transmission of factors that reproduce social inequality. They need suitable conditions, which are very difficult to secure under the stress caused by material deprivation, in order to have early stimulation. This point connects the present study to other research that examines the effects of early education on children’s development.
It is important to emphasize that the findings of this study, focused as it is on young children, run counter to the claim that children’s prospects of thriving in life or achieving acceptable levels of social mobility are only a matter of merit. Advocates of merit as the main explanation for the level of inequality in Chile and other similar societies should embrace these facts and consider that it is not possible to analyse inequality of outcomes (i.e. income) without analysing inequality of conditions (i.e. early skills). This study provides evidence that should help lead the debate in that direction.
Two important limitations of this study concern the data available. First, the survey used for it does not yield any variables relating to the social environment beyond the household. This is an important limitation because other scholars have demonstrated that neighbourhood poverty variables significantly affect children’s development (McCoy and others, 2015). However, this limitation is a springboard for future research, which should extend the social environment concept and look for indicators related to public goods and social welfare. Second, early social circumstances, known as in utero conditions (i.e. the parents’ relationship, emotional support for the mother, exposure to stressful events, etc.), could not be observed further. Using birth weight and the riskiness of pregnancies as control variables was an indirect way of approaching this important period in children’s development. Unfortunately, a

202 CEPAL Review N° 128 • August 2019
Inherited and social factors explaining early skills inequality: the case of Chilean children
number of other variables were not part of the survey or were not presented in a suitable form. It is important to mention this limitation because there is enough evidence to show that this period of human development should be integrated into causal analyses of social inequality.
In conclusion, this research provides evidence that both inherited traits and socialization factors are explanatory features of the intergenerational transmission of inequality in Chile that are unrelated to self-determination traits, challenging merit as an explanation of social inequality in the first instance.
Bibliography
Adkins, D. and G. Guo (2008), “Societal development and the shifting influence of the genome on status attainment”, Research in Social Stratification and Mobility, vol. 26, No. 3, Amsterdam, Elsevier.
Alon, S. and M. Tienda (2007), “Diversity, opportunity, and the shifting meritocracy in higher education”, American Sociological Review, vol. 72, No. 4, Thousand Oaks, SAGE.
Ayoub, C. and others (2009), “Cognitive skill performance among young children living in poverty: risk, change, and the promotive effects of early head start”, Early Childhood Research Quarterly, vol. 24, No. 3, Amsterdam, Elsevier.
Baker-Henningham, H. and F. López (2010), “Early childhood stimulation interventions in developing countries: a comprehensive literature review”, IDB Working Paper, No. 213, Washington, D.C., Inter-American Development Bank (IDB).
Berls, A. and I. McEwen (1999), “Battelle developmental inventory”, Physical Therapy, vol. 79, No. 8, American Physical Therapy Association.
Berry, D. and others (2016), “Household chaos and children’s cognitive and socio-emotional development in early childhood: does childcare play a buffering role?”, Early Childhood Research Quarterly, vol. 34, Amsterdam, Elsevier.
Boardman, J. and others (2014), “Is the gene-environment interaction paradigm relevant to genome-wide studies? The case of education and body mass index”, Demography, vol. 51, No. 1, New York, Springer.
Boudon, R. (ed.) (1993), Paul F. Lazarsfeld: On Social Research and Its Language, Chicago, University of Chicago Press.(1974), Education, Opportunity, and Social Inequality: Changing Prospects in Western Society, New York, Wiley.
Brandt, N. (2010), “Chile: climbing on giants’ shoulders: better schools for all Chilean children”, OECD Working Paper, No. 784, Paris, Organization for Economic Cooperation and Development (OECD).
Burger, K. (2010), “How does early childhood care and education affect cognitive development? An international review of the effects of early interventions for children from different social backgrounds”, Early Childhood Research Quarterly, vol. 25, No. 2, Amsterdam, Elsevier.
Coddington, C., R. Mistry and A. Bailey (2014), “Socioeconomic status and receptive vocabulary development: replication of the parental investment model with Chilean preschoolers and their families”, Early Childhood Research Quarterly, vol. 29, No. 4, Amsterdam, Elsevier.
Conger, R. and others (1994), “Economic stress, coercive family process, and developmental problems of adolescents”, Child Development, vol. 65, No. 2, Hoboken, Wiley. (1992), “A family process model of economic hardship and adjustment of early adolescent boys”, Child Development, vol. 63, No. 3, Hoboken, Wiley.
Conley, D. (2009), “The promise and challenges of incorporating genetic data into longitudinal social science surveys and research”, Biodemography and Social Biology, vol. 55, No. 2, Abingdon, Taylor & Francis.
Conley, D. and N. Bennett (2000), “Is biology destiny? Birth weight and life chances”, American Sociological Review, vol. 65, No. 3, Thousand Oaks, SAGE.
Conley, D. and E. Rauscher (2013), “Genetic interactions with prenatal social environment: effects on academic and behavioral outcomes”, Journal of Health and Social Behavior, vol. 54, No. 1, Thousand Oaks, SAGE.
Contreras, D. and others (2012), “The evolution of opportunities for Children in Chile, 1990–2006”, CEPAL Review, No. 106 (LC/G.2518-P), Santiago, Economic Commission for Latin America and the Caribbean (ECLAC).
Contreras, D. and S. Gallegos (2011), “Wage inequality in Latin America: a decade of changes”, CEPAL Review, No. 103 (LC/G.2487-P), Santiago, Economic Commission for Latin America and the Caribbean (ECLAC).
Cortázar, A. (2015), “Long-term effects of public early childhood education on academic achievement in Chile”, Early Childhood Research Quarterly, vol. 32, Amsterdam, Elsevier.

203CEPAL Review N° 128 • August 2019
Ricardo Rivas
Currie, J. (2011), “Inequality at birth: some causes and consequences”, American Economic Review, vol. 101, No. 3, Nashville, Tennessee, American Economic Association.
Davies, S. and others (2016), “Using the early development instrument to examine cognitive and non-cognitive school readiness and elementary student achievement”, Early Childhood Research Quarterly, vol. 35, Amsterdam, Elsevier.
Davis-Kean, P. (2005), “The influence of parent education and family income on child achievement: the indirect role of parental expectations and the home environment”, Journal of Family Psychology, vol. 19, No. 2, Washington, D.C., American Psychological Association.
Daw, J. and others (2014), “The interactive effect of neighborhood peer cigarette use and 5HTTLPR genotype on individual cigarette use”, Addictive Behaviors, vol. 39, No. 12, Amsterdam, Elsevier.(2013), “Genetic sensitivity to peer behaviors: 5HTTLPR, smoking, and alcohol consumption”, Journal of Health and Social Behavior, vol. 54, No. 1, New York, SAGE.
Dodge, K., G. Pettit and J. Bates (1994), “Socialization mediators of the relation between socioeconomic status and child conduct problems”, Child Development, vol. 65, No. 2, Hoboken, Wiley.
Doyle, O. and others (2009), “Investing in early human development: timing and economic efficiency”, Economics & Human Biology, vol. 7, No. 1, Amsterdam, Elsevier.
Duncan, G., A. Kalil and K. Ziol-Guest (2010), “Early-childhood poverty and adult attainment, behavior, and health”, Child Development, vol. 81, No. 1, Hoboken, Wiley.
ECLAC (Economic Commission for Latin America and the Caribbean) (2010), Time for Equality. Closing Gaps, Opening Trails (LC/G.2432(SES.33/3)), Santiago.
Feinstein, L. (2003), “Inequality in the early cognitive development of British children in the 1970 cohort”, Economica, vol. 70, No. 277, Hoboken, Wiley.
Fergusson, D., L. Horwood and J. Boden (2008), “The transmission of social inequality: examination of the linkages between family socioeconomic status in childhood and educational achievement in young adulthood”, Research in Social Stratification and Mobility, vol. 26, No. 3, Amsterdam, Elsevier.
Filgueira, C. and F. Filgueira (2002), “Models of welfare and models of capitalism: the limits of transferability”, Models of Capitalism: Lessons for Latin America, E. Huber (ed.), University Park, Pennsylvania, Pennsylvania State University Press.
Fischer, C. and others (1996), Inequality by Design: Cracking the Bell Curve Myth, New Jersey, Princeton University Press.
Fletcher, J. and J. Boardman (2013), “Integrating work from genetics and the social sciences: an introduction”, Biodemography and Social Biology, vol. 59, No. 1, Abingdon, Taylor & Francis.
Freese, J. (2008), “Genetics and the social science explanation of individual outcomes”, American Journal of Sociology, vol. 114, No. 1, Chicago, University of Chicago Press.
Gómez, C. and H. Yoshikawa (2017), “Earthquake effects: estimating the relationship between exposure to the 2010 Chilean earthquake and preschool children’s early cognitive and executive function skills”, Early Childhood Research Quarterly, vol. 38, Amsterdam, Elsevier.
Guo, G. (2005), “Twin studies: what can they tell us about nature and nurture?”, Contexts, vol. 4, No. 3, Thousand Oaks, SAGE.
Guo, G. and K. Harris (2000), “The mechanisms mediating the effects of poverty on children’s intellectual development”, Demography, vol. 37, No. 4, New York, Springer.
Guo, G. and E. Stearns (2002), “The social influences on the realization of genetic potential for intellectual development”, Social Forces, vol. 80, No. 3, Oxford, Oxford University Press.
Hanushek, E. and L. Wößmann (2006), “Does educational tracking affect performance and inequality? Differences-in-differences evidence across countries”, The Economic Journal, vol. 116, No. 510, Hoboken, Wiley.
Hashima, P. and P. Amato (1994), “Poverty, social support, and parental behavior”, Child Development, vol. 65, No. 2, Hoboken, Wiley.
Hauser, R. (2002), “Meritocracy, cognitive ability and the sources of occupational success”, CDA Working Paper, No. 98–07, Madison, University of Wisconsin.
Henrichs, J. and others (2011), “Parental family stress during pregnancy and cognitive functioning in early childhood: the generation R study”, Early Childhood Research Quarterly, vol. 26, No. 3, Amsterdam, Elsevier.
Herrnstein, R. and C. Murray (1994), The Bell Curve, New York, Free Press.Huber, E. and J. Stephens (2012), Democracy and the Left: Social Policy and Inequality in Latin America,
Chicago, University of Chicago Press. Huston, A., V. McLoyd and C. García (1994), “Children and poverty: issues in contemporary research”, Child
Development, vol. 65, No. 2, Hoboken, Wiley.

204 CEPAL Review N° 128 • August 2019
Inherited and social factors explaining early skills inequality: the case of Chilean children
Jefferis, B., C. Power and C. Hertzman (2002), “Birth weight, childhood socioeconomic environment, and cognitive development in the 1958 British birth cohort study”, BMJ, vol. 325, London, The British Medical Journal.
Jung, S., B. Fuller and C. Galindo (2012), “Family functioning and early learning practices in immigrant homes”, Child Development, vol. 83, No. 5, Hoboken, Wiley.
Kaplan, R. and D. Saccuzzo (2009), Psychological Testing. Principles, Applications, and Issues, Belmont, Cengage Learning.
Karoly, L., M. Kilburn and J. Cannon (2005), Early Childhood Interventions: Proven Results, Future Promise, Santa Monica, Rand.
Kaushal, N., K. Magnuson and J. Waldfogel (2011), “How is family income related to investments in children’s learning?”, Whither Opportunity? Rising Inequality, Schools, and Children´s Life Chances, G. Duncan and R. Murnane (eds.), New York, Russell Sage Foundation/Spender Foundation.
Kim, P. and others (2013), “Effects of childhood poverty and chronic stress on emotion regulatory brain function in adulthood”, Proceedings of the National Academy of Sciences of the United States of America, vol. 110, No. 46, Washington, D.C., National Academy of Sciences of the United States of America.
Klebanov, P. and others (1998), “The contribution of neighborhood and family income to developmental test scores over the first three years of life”, Child Development, vol. 69, No. 5, Hoboken, Wiley.
Kohn, M. (1999), “Two visions of the relationship between social structure and personality: the ‘bell curve’ versus social structure and personality”, A Nation Divided: Diversity, Inequality and Community in American Society, P. Moen, D. Dempster and H. Walker (eds.), Ithaca, Cornell University Press.
Lareau, A. (2002), “Invisible inequality: social class and childrearing in black families and white families”, American Sociological Review, vol. 67, No. 5, Thousand Oaks, SAGE.
Leyva, D. and M. Smith (2016), “Beyond book reading: narrative participation styles in family reminiscing predict children’s print knowledge in low-income Chilean families”, Early Childhood Research Quarterly, vol. 37, Amsterdam, Elsevier.
Liaw, F. and J. Brooks-Gunn (1994), “Cumulative familial risks and low-birthweight children’s cognitive and behavioral development”, Journal of Clinical Child Psychology, vol. 23, No. 4, Abingdon, Taylor and Francis.
Lichter, D. (1997), “Poverty and inequality among children”, Annual Review of Sociology, vol. 23, Annual Reviews.López, R. and S. Miller (2008), “Chile: the unbearable burden of inequality”, World Development, vol. 36,
No. 12, Amsterdam, Elsevier.Mayer, S. (1997), What Money can’t Buy: Family Income and Children’s Life Chances, Cambridge,
Massachusetts, Harvard University Press.McCoy, D. and others (2015), “Neighborhood economic disadvantage and children’s cognitive and social-
emotional development: exploring Head Start classroom quality as a mediating mechanism”, Early Childhood Research Quarterly, vol. 32, Amsterdam, Elsevier.
McLanahan, S. (2009), “Fragile families and the reproduction of poverty”, The Annals of the American Academy of Political and Social Science, vol. 621, No. 1, Thousand Oaks, SAGE.
McLanahan, S. and C. Percheski (2008), “Family structure and the reproduction of inequalities”, Annual Review of Sociology, vol. 34, Annual Reviews.
McNamee, S. and R. Miller (2009), The Meritocracy Myth, Lanham, Maryland, Rowman & Littlefield. Mithaug, D. (1996), Equal Opportunity Theory, Thousand Oaks, SAGE.Moloney, M. (2005), “The Starting Gate: Birth Weight and Life Chances by Dalton Conley, Kate W. Strully,
Neil G. Bennett; Conceiving Risk, Bearing Responsibility: Fetal Alcohol Syndrome and the Diagnosis of Moral Disorder by Elizabeth M. Armstrong”, Social Forces, vol. 83, No. 4, Oxford, Oxford University Press.
Nisbett, R. and others (2012), “Intelligence: new findings and theoretical developments”, American Psychologist, vol. 67, No. 2, Washington, D.C., American Psychological Association.
Noboa-Hidalgo, G. and S. Urzúa (2012), “The effects of participation in public child care centers: evidence from Chile”, Journal of Human Capital, vol. 6, No. 1, Chicago, Chicago University Press.
OECD (Organization for Economic Cooperation and Development/Statistics Canada) (2011), Literacy for Life: Further Results from the Adult Literacy and Life Skills Survey, Paris, OECD Publishing.
Orchinik, L. and others (2011), “Cognitive outcomes for extremely preterm/extremely low birth weight children in kindergarten”, Journal of the International Neuropsychological Society, vol. 17, No. 6, Cambridge, Cambridge University Press.
Osborne, C. and S. McLanahan (2007), “Partnership instability and child well-being”, Journal of Marriage and Family, vol. 69, No. 4, Hoboken, Wiley.

205CEPAL Review N° 128 • August 2019
Ricardo Rivas
Padua, J. (2006), “Infancia y educación”, Convergencia, No. 40, Toluca, Autonomous University of the State of Mexico.
Roemer, J. (2000), “Equality of opportunity”, Meritocracy and Economic Inequality, K. Arrow, S. Bowles and S. Durlaf (eds.), New Jersey, Princeton University Press.
Ruzek, E. and others (2014), “The quality of toddler child care and cognitive skills at 24 months: propensity score analysis results from the ECLS-B”, Early Childhood Research Quarterly, vol. 29, No. 1, Amsterdam, Elsevier.
Sallaz, J. and J. Zavisca (2007), “Bourdieu in American sociology, 1980–2004”, Annual Review of Sociology, vol. 33, Annual Reviews.
Sameroff, A. (1986), “Environmental context of child development”, The Journal of Pediatrics, vol. 109, No. 1, Amsterdam, Elsevier.
Sameroff, A. and others (1993), “Stability of intelligence from preschool to adolescence: the influence of social and family risk factors”, Child Development, vol. 64, No. 1, Hoboken, Wiley. (1987), “Intelligence quotient scores of 4-year-old children: social-environmental risk factors”, Pediatrics, vol. 79, No. 3, Itasca, American Academy of Pediatrics.
Schafer, M., K. Ferraro and S. Mustillo (2011), “Children of misfortune: early adversity and cumulative inequality in perceived life trajectories”, American Journal of Sociology, vol. 116, No. 4, Chicago, Chicago University Press.
Sen, A. (1987), Commodities and Capabilities, New Delhi, Oxford University Press.Sun, J. and others (2016), “Factors related to parents’ engagement in cognitive and socio-emotional caregiving
in developing countries: results from multiple indicator cluster survey 3”, Early Childhood Research Quarterly, vol. 36, Amsterdam, Elsevier.
Torche, F. (2005), “Unequal but fluid: social mobility in Chile in comparative perspective”, American Sociological Review, Thousand Oaks, SAGE, vol. 70, No. 3.(2011), “The effect of maternal stress on birth outcomes: exploiting a natural experiment”, Demography, vol. 48, No. 4, New York, Springer.
Torche, F. and A. Corvalán (2010), “Seasonality of birth weight in Chile: environmental and socioeconomic factors”, Annals of Epidemiology, vol. 20, No. 11.
Torche, F. and K. Kleinhaus (2012), “Prenatal stress, gestational age and secondary sex ratio: the sex-specific effects of exposure to a natural disaster in early pregnancy”, Human Reproduction, vol. 27, No. 2, Oxford, Oxford University Press.
UNDP (United Nations Development Programme) (2010), Regional Human Development Report for Latin America and the Caribbean 2010. Acting on the future: breaking the intergenerational transmission of inequality, San José.
Vegas, E. and L. Santibáñez (2010), The promise of early childhood development in Latin America and the Caribbean, Washington, D.C., World Bank/Mayol.
Wagmiller, R. and others (2006), “The dynamics of economic disadvantage and children’s life chances”, American Sociological Review, vol. 71, No. 5, Thousand Oaks, SAGE.
Warren, R. (2015), “What do growing childhood socioeconomic inequalities mean for the future of inequalities in adult health?”, Minneapolis, University of Minnesota [online] http://www.rob-warren.com/uploads/4/5/1/2/45120697/2015.05.28_paper.pdf.


In order to facilitate the submission, consideration and publication of articles, the editorial board of the CEPAL Review has prepared the following information and suggestions to serve as a guide for future contributors.
The submission of an article implies an undertaking by the author not to submit it simultaneously to other publications. The copyright to all articles published in the Review shall be owned by the United Nations.
Each article will be reviewed by the editorial board, which may decide to submit it to external referees.
Papers should be submitted in the original language (English, French, Portuguese or Spanish). They will be translated into the appropriate language by the relevant eclac services.
Each article must be accompanied by a summary, no more than 150 words in length, giving a brief description of its subject matter and main conclusions.
Each article must also carry three jel (Journal of Economic Literature) classification codes. The JEL Classification Codes Guide is available online at www.aeaweb.org/jel/jel_class_system.php.
Papers should be no longer than 10,000 words, including the summary, notes and bibliography. Shorter papers will also be considered.
Articles should be sent by e-mail to [email protected] in Word format. Papers in pdf format will not be accepted.
Style guide:
Titles should not be excessively long.
Footnotes
— It is recommended that footnotes be kept to a minimum.
— It is recommended that footnotes not be used to cite bibliographical references; such references should preferably be incorporated into the text.
— Footnotes should be numbered consecutively using superscript Arabic numerals.
Tables, figures and equations
— It is recommended that tables and figures be kept to a minimum, avoiding any redundancy with the text.
— Equations should be written using the Office equation editor “MathType”; they should not be inserted as “pictures”.
— Tables, figures and other elements should be inserted at the end of the text in the format in which they were designed; they should not be inserted as “pictures”. Figures in Excel should include the corresponding worksheets.
— The location of tables and figures in the body of the article should be indicated in the appropriate place as follows:
Insert figure 1
Insert table 1
— Tables and figures should include an explicit and complete reference to their sources.
— Tables should indicate the period covered at the end of the title, and should indicate the units in which the data are expressed in a subtitle (in italics and between brackets).
— The symbols referred to in the “Explanatory notes” which appear on the page preceding the table of contents should be taken into account in the preparation of tables and figures.
— Footnotes to tables and figures should be ordered consecutively using superscript lower-case letters.
— Figures should be prepared bearing in mind that they will be printed in black and white.
Acronyms and abbreviations
— Acronyms and abbreviations should not be used unless absolutely necessary, in which case the full name should be written out the first time it occurs in the article.
Bibliography
— Bibliographical references should be directly related to the content of the article and should not be excessively long.
— At the end of the article, under the title “Bibliography”, all the necessary information should be included accurately and in alphabetical order by author: name of author(s), year of publication, full name of article (if any) and publication (including any subtitle), city of publication, publisher and, in the case of a periodical, month of publication.
The editorial board of the Review reserves the right to make any necessary editorial changes in the articles, including their titles.
Authors will receive a one-year courtesy subscription to the Review, plus 30 offprints of their article in Spanish and 30 in English, at the time of publication in each language.
Guidelinesfor contributorsto the CEPAL Review

Publicaciones recientes de la CEPAL ECLAC recent publications
www.cepal.org/publicaciones
Informes Anuales/Annual ReportsTambién disponibles para años anteriores/Issues for previous years also available
Estudio Económico de América Latina y el Caribe 2018Economic Survey of Latin America and the Caribbean 2018
Balance Preliminar de las Economías de América Latina y el Caribe 2018Preliminary Overview of the Economies of Latin America and the Caribbean 2018
Panorama Social de América Latina 2018Social Panorama of Latin America 2018
La Inversión Extranjera Directa en América Latina y el Caribe 2018Foreign Direct Investment in Latin America and the Caribbean 2018
Anuario Estadístico de América Latina y el Caribe 2018Statistical Yearbook for Latin America and the Caribbean 2018
Perspectivas del Comercio Internacional de América Latina y el Caribe 2018International Trade Outlook for Latin America and the Caribbean 2018

Hacia una agenda regional de desarrollo social inclusivoBases y propuesta inicial
Segunda Reunión de la Mesa Directiva de la Conferencia Regional sobre Desarrollo Social de América Latina y el CaribePanamá, 12 de septiembre de 2018
Des
arro
llo
Econ
ómic
o
Logros y desafíos de la integración centroamericanaAportes de la CEPAL
JORGE MARIO MARTÍNEZEditor
Textos seleccionados 2007-2018
Páginas SELECTAS DE LA CEPAL
Los cuidados en América Latina y el Caribe
Nicole Bidegain y Coral Calderón (compiladoras)
POR UN DESARROLLOSOSTENIBLE CON IGUALDAD
Des
arro
llo e
igua
ldad
: el p
ensa
mie
nto
de
la C
EPA
L en
su
sépt
imo
dec
enio
Desarrollo e igualdad:el pensamiento de la CEPAL
en su séptimo decenioTextos seleccionados del período 2008-2018
Ricardo Bielschowsky - Miguel Torres | compiladores
COLECCIÓN 70 AÑOS
El Pensamiento de la CEPAL/ECLAC Thinking
Libros y Documentos Institucionales/Institutional Books and Documents
Desarrollo e igualdad: el pensamiento de la CEPAL en su séptimo decenio. Textos seleccionados del período 2008-2018
La ineficiencia de la desigualdadThe Inefficiency of Inequality
Horizontes 2030: la igualdad en el centro del desarrollo sostenibleHorizons 2030: Equality at the centre of sustainable developmentHorizontes 2030: a igualdade no centro do desenvolvimento sustentável
Acuerdo Regional sobre el Acceso a la Información, la Participación Pública y el Acceso a la Justicia en Asuntos Ambientales en América Latina y el CaribeRegional Agreement on Access to Information, Public Participation and Justice in Environmental Matters in Latin America and the Caribbean
Hacia una agenda regional de desarrollo social inclusivo: bases y propuesta inicial Towards a regional agenda for inclusive social development: bases and initial proposal
Libros de la CEPAL/ECLAC Books
Logros y desafíos de la integración centroamericana: aportes de la CEPAL
Envejecimiento, personas mayores y Agenda 2030 para el Desarrollo Sostenible: perspectiva regional y de derechos humanos
La inclusión financiera para la inserción productiva y el papel de la banca de desarrollo
Páginas Selectas de la CEPAL/ECLAC Select Pages
Los cuidados en América Latina y el Caribe. Textos seleccionados 2007-2018
Empleo en América Latina y el Caribe. Textos seleccionados 2006-2017
Desarrollo inclusivo en América Latina. Textos seleccionados 2009-2016

a 30 años de
la aprobación de
la Convención sobre
los Derechos del Niño
América Latina y el Caribe
Mujeres afrodescendientes en América Latina y el Caribe
Deudas de igualdad
OBSERVATORIODEMOGRÁFICO
América Latinay el Caribe
DEMOGRAPHICOBSERVATORYLatin America and the Caribbean
ISSN 1990-424X
2 0 1 8
Proyecciones de Población
Population projections
20
18
OBS
ERVA
TORI
O D
EMO
GRÁ
FICO
• D
EMO
GRA
PHIC
OBS
ERVA
TORY
CEPL
/ECL
AC
Nº
2
Medición de la pobreza por ingresos
Actualización metodológica
y resultados
Metodologías de la CEPAL
Población
Nº 107ISSN 0303-1829
Comisión Económica para América Latina y el Caribe (CEPAL)Centro Latinoamericano y Caribeño de Demografía (CELADE)División de Población de la CEPAL
julio-diciembre 2018
AÑO XLV
La emigración española en tiempos de crisis (2008-2017): análisis comparado de los flujos a América Latina y EuropaAntía Pérez-CaramésEnrique Ortega-RiveraDiego López de Lera Josefina Domínguez-Mujica
Patrones de corresidencia con familiares en el Brasil, 1960-2010Mariana de Araújo CunhaSimone WajnmanCassio M. Turra
Brecha de participación económica entre hombres y mujeres y dividendo de género: factores determinantes no tradicionales captados en una muestra de paísesJorge A. Paz
Demanda demográfica de viviendas: proyección de los arreglos residenciales hasta 2030 a partir de la población destinataria de un programa de vivienda social de la Compañía de Desarrollo Habitacional y Urbano (CDHU) en el estado de São PauloCimar Alejandro Prieto AparicioGustavo Pedroso de Lima Brusse
Trayectorias conyugales y reproductivas después de disolverse la primera unión: un estudio sobre las mujeres de MontevideoMariana Fernández Soto
Mortalidad diferencial por accidentes de transporte terrestre en la República Bolivariana de Venezuela (1950-2017)Gustavo Alejandro Páez Silva
Revisión de los niveles de fecundidad estimados mediante la técnica P/F de Brass en el Brasil y sus macrorregiones, 1980, 1991 y 2000Denise Helena França MarquesJosé Alberto Magno de Carvalho
Análisis de la calidad de la edad declarada en los censos de población del UruguayMathías NathanMartín Koolhaas
La organización social de la movilidad poblacional Sur-Sur en el espacio urbano: ensayo sobre la franja de frontera amazónicaJuliana Mota de Siqueira
Linajes maternos en el Uruguay vulnerado: procesos demográficos y su correlato biográficoMateo Berri
notas de
ISSN 1564-4170
SERIE
266FINANCIAMIENTO PARA
EL DESARROLLO
Financiamiento para el
desarrollo en
América Latina
y el Caribe
La movilización
de recursos para
el desarrollo
medioambiental
Georgina Cipoletta Tomassian
Adriana Matos
Derechos de acceso en asuntos
ambientales en el Ecuador
Hacia el desarrollo de una actividad minera
respetuosa del entorno y las comunidades
Daniel Barragán
ISSN 1564-4170
SERIE
165MEDIO AMBIENTE Y DESARROLLO
La innovación exportadora en las pequeñas y medianas empresas Programas de apoyo y financiamiento en América Latina
Nanno Mulder Andrea Pellandra
ISSN 1564-4170
SERIE
138
COMERCIO INTERNACIONAL
Revista CEPAL/CEPAL Review
Coediciones/Co-editions Copublicaciones/Co-publications
Documentos de Proyectos Project Documents
Series de la CEPAL/ECLAC Series
Observatorio Demográfico Demographic Observatory
Notas de Población
Metodologías de la CEPAL

www.cepal.org/en/review
United Nations Publication • S.19-00154 • August 2019 • ISSN 0251-2920
Copyright © United Nations • Printed in Santiago
EDITORIAL BOARD
Osvaldo SunkelChairman
José Antonio Alonso
RenAto BAumAnn
luis BeccARiA
luis BéRtolA
luiz cARlos BResseR-PeReiRA
mARio cimoli
John coAtswoRth
RoBeRt Devlin
cARlos De miguel
RicARDo FFRench-DAvis
DAniel heymAnn
mARtín hoPenhAyn
Akio hosono
gRAcielA moguillAnsky
JuAn cARlos moReno-BRiD
José Antonio ocAmPo
cARlotA PéRez
geRt RosenthAl
PAul schReyeR
BARBARA stAllings
AnDRAs uthoFF
RoB vos
Miguel TorresEditor
ECONOMIC COMMISSION FOR LATIN AMERICA AND THE CARIBBEAN