Review - Repositorio Digital CEPAL
178
CEPAL Review Executive Secretary of ECLAC Gert Rosenthal Deputy Executive Secretary Carlos Massa d Director of the Review Aníbal Pinto Technical Secretary Eugenio Lahera UNITED NATIONS ECONOMIC COMMISSION FOR LATIN AMERICA AND THE CARIBBEAN SANTIAGO, CHILE, DECEMBER 1992
-
Upload
khangminh22 -
Category
Documents
-
view
0 -
download
0
Transcript of Review - Repositorio Digital CEPAL

CEPALReview
Executive Secretary o f ECLAC Gert Rosenthal
Deputy Executive Secretary Carlos Massa d
Director o f the Review Aníbal Pinto
Technical Secretary Eugenio Lahera
UNITED NATIONSECONOMIC COMMISSION FOR LATIN AMERICA AND THE CARIBBEAN
SANTIAGO, CHILE, DECEMBER 1992

CEPAL Review is prepared by the Secretariat of the Economic Commission for Latin America and the Caribbean. The views expressed in the signed articles, including the contributions of Secretariat staff members, however, represent the personal opinion of the authors and do not necessarily reflect the views of the Organization. The designations employed and the presentation of material in this publication do not imply the expression of any opinion whatsoever on the part of the Secretariat concerning the legal status of any country, territory, city or area or its authorities, or concerning the delimitation of its frontiers or boundaries,
Notes nnd explanation of symbols
The following symbols are used in tables in the/hmenvThree dots (...) indicate that data are not available or are not separately reported.A dash (—) indicates that the amount is nil or negligible.A blank space in a table means that the item in question is not applicable.A minus sign (-) indicates a deficit or decrease, unless otherwise specified.A point (.) is used to indicate decimals.A slash (/) indicates a crop year or fiscal year, e.g., 1970/1971.Use of a hyphen (-) between years, e.g., 1971-1973, indicates reference to the complete number of calendar years involved, including the beginning and end years.References to “tons” mean metric tons, and to “dollars”, United States dollars, unless otherwise stated.Unless otherwise stated, references to annual rates of growth or variation signify compound annual rates. Individual figures and percentages in tables do not necessarily add up to the corresponding totals, because of rounding.
LC/G.1748-P
December 1992
UNITED NATIONS PUBLICATION
ISSN 0251-2920 ISBN 92-1-121185-9
Applications for the right to reproduce this work or parts thereof are welcomed and should be sent to the Secretary of the Publications Board, United Nations Headquarters, New York, N.Y. 10017, U.S.A. Member States and their governmental institutions may reproduce this work without application, but are requested to mention the source and inform the United Nations of such reproduction.
Copyright © United Nations 1992All rights reserved T
Printed in Chile

C E P A LReview
Santiago, Chile December 1992 Number 48
CONTENTS
In search of another form of development. Pedro Sáinz and Alfredo Calcagno. 1
A new international industrial order. Michael Mortimore. 39
European investment in Latin America: an overview. Juan Alberto Fuentes. 61
An appraisal of recent intra-industry trade for Latin America. Renato Baumann. 83
Industrial policy in Central America. Larry Wilimore, 95
Participation and the environment. Tonci Tomic. 107
Self-financing water supply and sanitation services. Terence Lee and Andrei Jouravlev. 117
The social sciences without planning or revolution? Martin Hopenhayn. 129
Growth and income distribution in countries at intermediate stages of development.Eduard[]o Sarmiento. 141
Monetary policy and an open capital account. Roberto Zahler. 157
Guidelines for contributors to c e p a l Review. 167
Recent e c l a c publications 169


CEPAL REVIEW No. 48
In search of another form of development
Pedro Sáinz Alfredo Calcagno*
The prime importance given in the 1980s to analysis of the economic depression, external imbalances and inflation in Latin America has left in the background the profound economic, institutional and social changes which took place in this period. Under the inspiration of neoliberal ideas, the institutional and macroeconomic reforms served both to dismanllc the previous form of development and to try to establish a new one. There were transfers of wealth and alterations in the structure of production, income distribution, the relation between capital and labour, public and private functions, and the place of the region in the international economy. Some of these changes took place in connection with anti-inflationary or external debt service policies.
In the early 1990s, two countries seem to be coming close to a new form of development, with political stability and recovery of capital accumulation. In other countries, the policies followed have not managed to restore growth, price stability or previous levels of investment. The efforts to establish a new form of development confront various challenges: givingcoherence to the reform process, whose scope and sequence are problems that have not yet been solved; securing a steady expansion in exports and accumulation; and preventing the further consolidation of the present economic and social heterogeneity. In these circumstances, the countries which have not gone so far in this process ask themselves whether the accumulated experience, the nature of their economies and the changing international context might not make it advisable to adopt policies different from those of the pioneering countries.
Indeed, the measures which the latter are now taking suggest that considerations of political stability and economic potential will make it necessary to depart significantly -especially in aspects connected with equity and poverty- from the neoliberal form of development and establish instead another form closer to the proposals for changing production patterns with equity made by the ECLAC Secretariat,
*Pedro Sainz is Director of the EC1.AC Statistics and Projections Division, while Alfredo Calcagno is an Economic Affairs Officer in the same Division. The authors wish to express their gratitude for the collaboration of the staff members of the Division and the valuable comments made by Adolfo Gurrieri, Renato Baumann and Ricardo Bielschowsky on a preliminary version of this article.
IntroductionFor Latin America, the 1980s were more than just a lost decade from the point of view of development. The figures graphically show the abrupt interruption in growth of the product and capital accumulation after nearly 30 years of economic expansion and changes in production patterns (table 1). However, economic depression is not a synonym for immobility, and in recent years important qualitative changes have taken place in the Latin American economies and societies. This article will try to identify and interpret some of these changes, seeking to determine how far they represented a break in the form of development that prevailed since the war and how far they represented a new form of development capable of gaining stability and permanence.
This effort calls for the situation to be viewed from a certain time perspective, which is outlined in section I. Section II indicates the most significant changes which were hastened by the crisis of the 1980s and looks into the significance of these developments: were they the reversible result of short-term economic adjustments, or were they rather the characteristic sign of a new emerging form of development? This leads to the analysis of some similarities and differences between countries, with special attention to the situation of those which seem to have gone furthest towards a new form of development. Finally, section III indicates some challenges facing the various groups of countries in this process of change.
I From the post-war form of
development to the debt crisis
1. The post-war form o f development
Political and economic factors combined after the war to give rise to a stable form of development that replaced the form which ran into a situation of crisis between 1914 and 1945. In that period, conditions had already arisen in a number of countries which were favourable for spontaneous industrialization, in a process which furthered urbanization, development of the domestic market, the expansion of business groups and the middle-class strata, as well as the expansion of lower-class worker and urban groups; it

8 CEPAL REVIEW No. 48 Í December 1992
Table 1
LATIN AMERICA: GROSS DOMESTIC PRODUCT, BY TYPE OF EXPENDITURE, AT CONSTANT 1980 PRICES
(Annualgrowth rates)*
1950-1965 1965-1974 1974-1980 1980-1985 1985-1990 1950-1Í
Gross domestic product 5.3 6.2 5.1 0.3 1.8 4.8
Private consumption General government
4.7 6.5 5.5 -0.4 1.8 4.7
consumption Gross domestic
4.7 7,0 5.2 1.9 1.7 4.9
investment 5.0 8.9 4.7 -8.7 -0.2 4.7Exports 6.3 3.7 4.7 5.5 5.8 4.5Imports 3.1 8.7 5.7 -9.5 6.0 4.3
Source: ECLAC, on the basis of official data. a Calculated by regression.
was these social groups which were to provide support for the project of change. Between the end of the war and the early 1960s, in a group of Latin American countries which accounted for a high percentage of the region’s population, it proved possible to impart stability to a form of development whose features have'been described at length by e c l a c in other documents (e c l a c , 1985). Towards the mid-1960s, however, this form ran into serious difficulties, both domestically and in respect of external economic relations, and in the second half of the 1960s and the early 1970s, many efforts were made to overcome these difficulties (e c l a c , 1985).
In the early 1970s, a new form of economic change appeared to be taking shape in which greater expansion and diversification of exports was combined with domestic markets based on higher income concentration. In most cases, economic growth had speeded up. However, the new forms of social incorporation and exclusion implicit in this form of development needed more authoritarian governments and gave rise to acute political conflicts which in some cases even deteriorated into armed conflict.
These tendencies were affected by the 1973 oil crisis and its many sequels. In some cases, the rise in oil prices led to a trade deficit and the speeding up of inflation, both because of higher energy costs and because of the depreciation of the exchange rate. In others, however, it represented a windfall source of external and fiscal revenue. For the region as a whole, particularly important features were the
recycling of the so-called petrodollars and the period of external indebtedness covering the second half of the 1970s ( e c l a c , 1990a).
2. The entry onto the scene o f the transnational banks
The entry onto the scene of the private transnational banks gave rise to substantial changes in various fields. In the economic field, it seemed to provide a way out from the classical external constraint on growth. In the area of ideas, it represented strong pressure to liberalize markets and establish much greater trade and financial openness to the exterior, while in the institutional sphere it furthered the attempt to expand the field of action of the private sector and reduce that of the public sector.
In practice, the initial abundance of resources gave rise to very varied economic policies. In some countries, it served to give a fresh boost to the process of industrialization with heavy State intervention. In others, it served to put off the effects of stagnating production and the drop in investment, by keeping up the level of consumption through indebtedness and imports. Finally, in a third group of countries, the plentiful external credits obtained were reflected mainly in the capital account itself, in the form of capital flight.
Special mention should be made, in this respect, of the experiences of the countries of the Southern Cone of Latin America, where the abundance of

IN SEARCH OF ANOTHER FORM OF DEVELOPMENT / P. Sáinz and A. Calcagno 9
external resources was deliberately used to dismantle the previous development scheme. In these countries, in the mid-1970s, certain social and political groups and the armed forces considered that there were “socializing tendencies” at the very heart of the economic system which adversely affected their rights and freedoms by increasing the relative weight of the wage-earning sectors and the State. According to this diagnosis, the mete repressive actions of authoritarian governments would not be sufficient in the long run unless there were a radical change in the form of development and, thereby, in the relative weight of the various economic and social actors. In the Southern Cone countries, the action of the foreign banks and external financing made it possible to maintain an artificially low exchange rate, increase imports that took the place of domestic manufacturing production, develop a system of private financial capital that was largely speculative, change the structure of wealth in the countries, and promote the accumulation of financial resources abroad. This policy, combined with regressive income redistribution, gave rise to a reversal of trends in industrialization (table 2), especially in the sectors connected with the domestic market and accumulation.
In other countries, however, the entry on the scene of the foreign banks in the late 1970s had a different impact. In these countries, changes in production patterns continued to be vigorous and external credits served to further the industrialization process, with the State often retaining a guiding role in accumulation. The most notable case of this was in Brazil, where a large part of the external funds were channelled through the local development banking system. The process there contrasted in many respects with that which took place in the Southern Cone: the role of the State and its enterprises was heightened, the real value of the exchange rate was maintained, progress was made in the further enhancement of industrialization and in the integration of the industrial system, with a marked reduction in the need for imports, and substantial trade union forces arose, especially in the industrial area of São Paulo. In Mexico, Colombia, Paraguay and Ecuador too, the flows of external resources were associated with significant efforts to develop the infrastructure and production capacity.
It was only afterwards, with the debt crisis, that there was a tendency towards the generalization of tensions and of economic policy measures aimed
more or less explicitly at dismantling the previous development model. These measures were applied, however, in national situations which differed from each other in terms of the degree of operation of this form of development, and their effects were also therefore different.
3. The debt crisis
In 1982, as a result of the high level of accumulated indebtedness and the rise in international interest rates, interest commitments represented 41% of the total exports of goods and services of the region as a whole. In this situation, the abrupt cessation of fresh credits from the transnational banking system to the countries of the region led to a severe recessive adjustment which was to give rise to a complete turnaround in their external accounts. Thus, the region turned a trade deficit equivalent to 1.4% of its gross domestic product in 1980/1981 into a trade surplus, at constant 1980 values, equivalent to 7.5% of the region's gdp in 1983/1984. This reversal, which amounted to US$45 billion at current values, safeguarded the interests of the international financial system, but not those of the debtor countries, whose imports fell from 16.6% of the product in 1980/1981 to only 11% in 1983/1984, while -possibly an even more serious feature- their gross domestic investment went down from 24.3% of the product to only 15.9% between these two periods (figure 1).
Giving the lie to the diagnoses holding that the debt crisis was merely a short-term phenomenon, so that the extremely severe adjustment processes were justified by the expected rapid return of external credits, the negative net resource transfer has been an ongoing burden for the region, with the possible partial exception of the Central American and Caribbean countries (table 3). The impact of this transfer of resources abroad must not be underestimated;1 it represented heavy pressure on the public and private finances, from which it was transmitted, by various means and with different degrees of intensity, to the rest of society.
1 By way of comparison, it may be recalled that the German reparations after the First World War represented gross transfers (that is to say, partly financed from abroad) of 2.4 percentage points of the product between 1924 and 1932: a proportion which was substantially exceeded by a number of Latin American countries during the 1980s (table 3). See Reisen and von Trotsenburg, 1988.

10 CEPAL REVIEW No. 48 I December 1992
Table 2
ARGENTINA AND CHILE: MANUFACTURING SECTOR INDICATORS
IndicatorsArgentina Chile
1974 1982 1990 1972 1982 1990
Per capita manufacturing GDP, at constant values (indices) 100 66 57 100 69 93
Manufacturing GDP, as a percentage of total GDP 28.3 22.2 20.7 26.6 19.0 20.6
Share of metal products and machinery industries in total industrial production (%) 28.3 20.8 17.8 a 21.2 13.2 12.4b
Employment in industry, as a percentage of the economically active population (Greater Buenos Aires and Greater Santiago) 36,2 24.5 27.3 15.9 22.2
Source: ECLAC, on the basis of official data, and Central Bank of Chile, Boletín Mensual, various issues. 4 On the basis of figures at current prices. b 1989.
Figure 1
LATIN AMERICA: PRODUCT, INVESTMENT, EXPORTS AND IMPORTS, 1977-1984
(Billions o f 1980 dollars)
Source: ECLAC, on the basis of official data.
The impact of the external crisis on the public accounts took a number of forms. The most obvious effect was due to the public sector’s status of a net debtor, especially after the virtual nationalization of the private debt demanded for almost all the refinancing operations granted by the foreign banks. Likewise, the economic contraction and the reduction in imports adversely affected the tax base. Some countries had other fiscal costs in addition, due to the need to give greater fiscal incentives to exports or to collect lower duties on them. The devaluations to which a number of countries also resorted aggravated the fiscal burden in all those cases where the public sector had an external deficit. In general, efforts were made to offset the tendency towards the reduction of the tax base by levying new taxes or increasing the rates of existing ones, with ease and rapidity of tax collection being given priority over all other economic considerations or questions of equity, but even these “emergency” approaches often gave disappointing results because of shortcomings in the systems of collection. At the same time, in order to make up for the increase in financial outlays, cuts were made both in current expenditure (with depression of the real wages of public employees) and in investments, without distinguishing much between the sectors affected (education, health, housing, etc.).

IN SEARCH OF ANOTHER FORM OF DEVELOPMENT / P. Sáinz and A, Calcagno 11
Table 3
LATIN AMERICA AND THE CARIBBEAN (SELECTED COUNTRIES): NET RESOURCE TRANSFERS, 1970-1991 a
(Annual averages, as percentages o f the gross domestic product)
Countries 1970/1974 1975/1981 1982/1986 1987/1991
South America and MexicoArgentina -0.7 0.1 -5.2 -4.1Bolivia -2.0 2.8 -1.0 4.0Brazil 3.8 2.1 -3.0 -2.5Colombia 1.8 1.3 0.1 -4.2Chile 0.5 5.5 -3.6 -1.1Ecuador 2.4 3.3 -4.7 -2.6Mexico 1.4 1.6 -6.7 -1.3Paraguay 2.5 7.8 3.4 0.3Peru 1.5 1.2 -0.8 1.1Uruguay 0.2 4.3 -3.3 -2.9Venezuela -4.1 4.8 -8.3 -4.9
Central America and the CaribbeanCosta Rica 8.3 7.5 0.3 5.1El Salvador 1.4 1.0 2.5 4.1Guatemala 0.6 3.0 2.1 4.4Haiti 1.7 10.6 11.5 8.9Honduras 3.0 6.4 2.6 3.4Nicaragua 4.7 4.7 18.7 15.4bDominican Republic 4.0 2.7 0.9 -1.2
Source: ECLAC, on the basis of official data.* Corresponds to net capital movements, less net payments of profits and interest, at current values. b1987-1990.
In a number of countries, these changes in the structures of income and expenditure were still not sufficient to permit normal servicing of the public external debt. Nor was it possible to attain this through laborious renegotiations and efforts to secure “fresh money” from the transnational banks and the multilateral financing agencies. In view of this, the countries then resorted to the issue of domestic debt paper -which, in the precarious general economic situation, had to yield high interest rates and be of a short-term nature- and money issue. Ultimately, the external imbalance helped to speed up inflation and further financial instability, with all its negative implications for the volume of investment, income distribution and the public finances themselves. Thus, in a number of countries the effort to service an appreciable part of the external debt during the 1980s gave rise to such serious macroeconomic imbalances that they
led, inter alia, to a de facto moratorium in respect of a large part of the country’s external financial commitments.
The situation of countries whose exports were largely in the hands of the State was very different. In these countries, the increase in exports and the devaluation in real terms did not mean a worsening of the macroeconomic imbalances and monetary and financial tensions, but rather the contrary. Here, the direct receipt by the State of a large part of the foreign exchange earned from exports provided an important instrument for controlling the exchange market and monetary policy.
Naturally, the crisis in the region was not due solely to balance of payments disequilibria connected with the external debt, nor to the associated fiscal deficit, no matter how serious these aspects may have been: as already noted, the form of development had been encountering serious difficulties ever since the

12 CEPAL REVIEW No. 48 / December 1992
1960s. However, the external debt problem did have a decisive influence not only in sparking off the crisis, but also with regard to its subsequent evolution and the type of responses sought for it: it brought new issues and new actors into the countries’ processes of taking strategic decisions.
As is usual in situations of overindebtedness, once it becomes clear that what is involved is not merely a problem of liquidity, this means that the need for a drastic adjustment is accompanied by
pressures for structural reforms and transfers of wealth. Thus, the measures adopted to deal with the crisis soon went beyond the macroeconomic field and took on an institutional character which led to the questioning and modification of the role of the public sector, as well as of the trade and financial aspects of the countries’ form of incorporation in the international economy. In short, there was a movement towards changes in the basic elements of the form of development.
II
Towards a new form of development?
1. Dismantling one form o f development to build up another: the
political factor
The nature of the crisis, and the policies adopted to deal with it, heightened the economic and political difficulties that the previous form of development had been experiencing and were a decisive influence in its breakdown. Thus, the measures adopted reduced the vigour of the domestic market, lowering demand for consumer goods and especially for investment goods and thus taking away the impulse for industrialization. At the same time, the efforts to increase public outlays on external debt servicing took away resources from State activities which had previously provided decisive support for capital accumulation. Likewise, with the sharp reduction in public sector wages, the body of technocrats which had been in the process of formation and which was behind the most effective aspects of the economic and social activities of the State gradually left the public sector, which, although now partially dismantled and deprived of the necessary capacity for action, had to cope with ever greater problems, so that there was an increase in imbalances of every type. In this way, and to an ever increasing extent as the 1980s elapsed, a very serious situation arose in many countries because one form of development had ceased to function but it had not yet been possible to set in motion another one in its place.
The early years of the 1990s have been characterized, in terms of economic policy, by an appreciable degree of consensus among governments on
aspects which are of great importance for defining a form of development. Moreover, some countries seem to be resuming a process of accumulation within a political framework which is displaying growing stability. It therefore seems appropriate to see how far a new form of development is beginning to be shaped.
In order for the new style of development to be viable, it must be based on the restoration of a stable political pact and the recovery of the process of accumulation. Where this seems to be beginning to work, the political definitions (regarding the distribution of the fruits of the new model, the rules for its functioning, the new institutional framework and the composition of its political base) have preceded the achievement of even partial recovery of the accumulation process. These definitions will be largely determined by the power structure of the various social actors, which underwent considerable changes in the period of crisis and adjustment.
The external and internal circumstances described earlier increased the capacity of action of certain agents but reduced that of others. The weakness of industry and of the public sector affected the social groups which had given support and political stability to the previous form of development, especially the middle-level and trade union groups. At the other extreme, there were sectors which managed to sidestep the effects of the imbalances and sometimes were even able to take advantage of them because of their capacity for speculation. Generally speaking, these were the most transnationalized agents, with the greatest liquidity or access to credit, and those

IN SEARCH OF ANOTHER FORM OF DEVELOPMENT / P. Sâinz and A . Calcagno 13
which managed to secure significant transfers from the State (through nationalization of the private external debt, the measures to rescue the financial system, the liquidation of business debts, systems of subsidies or exemption from taxes, etc.). It was probably the external creditors, however, which gained most in power and importance in this period.
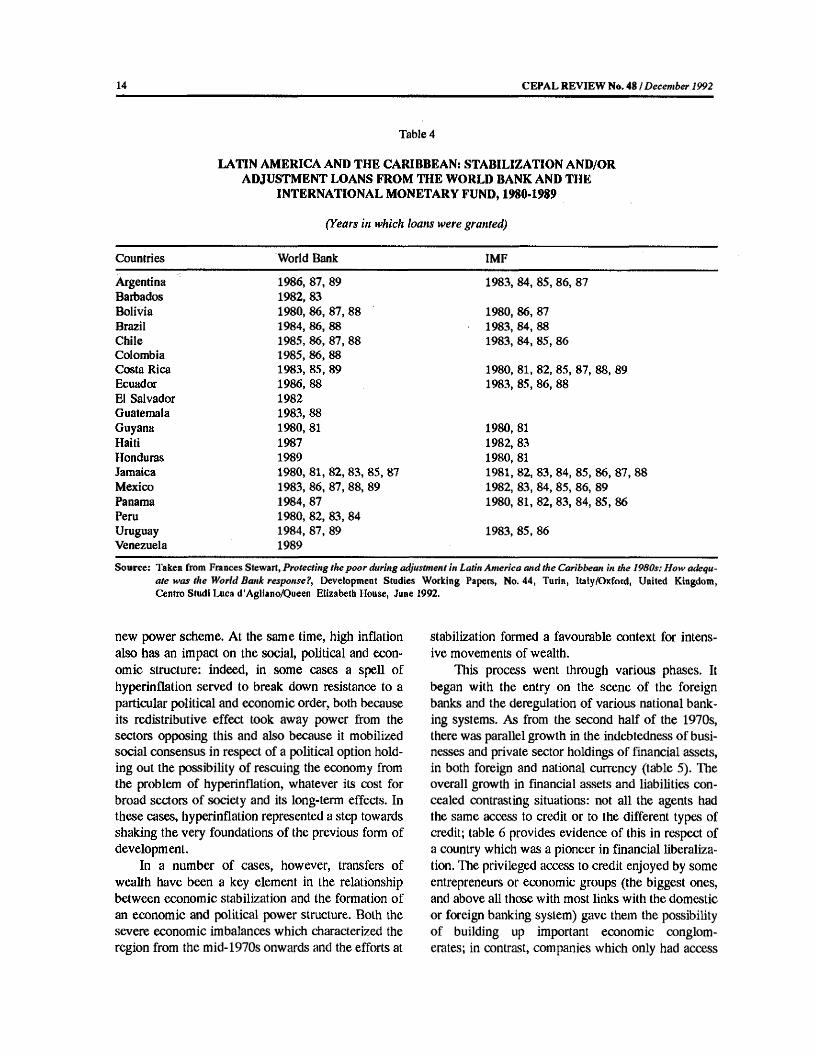
In the dismantling of the previous form of development and the definition of reforms designed to build a new one, the “creditors’ club” has played a central role. The international private banking system, the central actor in the debt problem; the United States Department of the Treasury; the governments of the developed countries, and the multilateral financial agencies -with their relatively high degree of coordination- laid down severe conditions for the Latin American countries in successive negotiations connected with the balance of payments. Table 4 lists the negotiations carried on by the IMF and the World Bank (e c l a c , 1990a, p. 40 et seq).
Some of the conditions were directly related with the most immediate interests of the creditor banks, which were extremely keen to reduce the risk of their loan portfolio, increase their profits, and improve their capital/assets ratio in the highly indebted developing countries. Among the conditions imposed were the assumption of the private debt by the State, the de-dollarization, of the debt with non-United States banks, the participation of the creditor banks in financial operations (such as arrangements for relending and capitalization of the external debt), and the generation of big trade surpluses, thanks to which (and to the ever-increasing indebtedness with international financial agencies) the banks collected a significant part of their interest, while at the same time reducing gross lending. There were also other conditions which can hardly be considered a direct response to the external payments crisis, however. They corresponded rather to strategic options by the creditor bloc, which took advantage of its strong position in the debt negotiations in order to force certain structural reforms in the debtor countries.
A typical example of the set of reforms demanded was the formulation made by James Baker in 1985: the countries which wanted to form part of the Baker Plan (thereby theoretically gaining access to a fresh flow of external credits) must “apply sound monetary and fiscal policies designed to reduce domestic imbalances and inflation and free resources for the private sector”; establish general freedom of
prices, with market values for the exchange rate, interest rates and wages; introduce reforms aimed at giving a leading role to private enterprise and the free functioning of the market -including reforms in respect of taxes, the labour market and the financial markets-, and carry out a process of greater economic openness which would favour both direct investment and the entry of capital and lead to freer trade (IM F , 1985). These proposals, which were,fully in keeping with the ideas and interests of powerful social and political sectors in the region which saw in them the basis for a new style of development, came to form part of the agenda of many Latin American governments. ■ .. >
Naturally, the countries have followed different paths, and the crisis and the policies associated with it have not caused the same degree of breakdown of the previous form of development in all cases. Ultimately, however, in almost all of them the new power structure has opened up the way for a rearrangement of the distribution of wealth based on the transfer of State assets to the private sector, the application of measures which completely reformulate labour legislation, and the consolidation of a new distribution of wealth and income. These lines of action were also in keeping with a new international context which demanded greater freedom of action for operations concerning trade, finance and external wealth.
2. Stabilization and transfer o f wealth
Control of inflationary processes is usually considered a prior condition for the restoration of any development process, whatever its form. T'his sequential view of the matter, however, tends to separate the question of stabilization from the qualitative development options and determinants, thus giving rise to somewhat mechanical conceptions of stabilization policies. This leads to the risk of leaving in a kind of limbo the relationship between stabilization and the formation of a new power scheme. Such a relationship, however, is neither simple nor unidirectional. Processes of very high inflation2 generally reflect an unresolved social, economic or political conflict. Consequently, the sustained control of these high rates of inflation calls for the stabilization of a
Qualitatively different from the more moderate types of inflation which in past decades were functional to a form of regulation o f growing economies.
14 CEPAL REVIEW No. 48 / December 1992
Table 4
LATIN AMERICA AND THE CARIBBEAN: STABILIZATION AND/OR ADJUSTMENT LOANS FROM THE WORLD BANK AND THE
INTERNATIONAL MONETARY FUND, 1980-1989
(Years in which loans were granted)
Countries World Bank IMF
Argentina 1986, 87, 89 1983, 84, 85, 86, 87Barbados 1982, 83Bolivia 1980,86,87,88 1980, 86, 87Brazil 1984, 86, 88 1983, 84, 88Chile 1985, 86, 87, 88 1983, 84, 85, 86Colombia 1985, 86, 88Costa Rica 1983, 85, 89 1980, 81, 82, 85, 87, 88, 89Ecuador 1986, 88 1983, 85, 86, 88El Salvador 1982Guatemala 1983, 88Guyana 1980, 81 1980, 81Haiti 1987 1982, 83Honduras 1989 1980, 81Jamaica 1980, 81, 82, 83, 85, 87 1981, 82, 83, 84, 85, 86, 87, 88Mexico 1983, 86, 87, 88, 89 1982, 83, 84, 85, 86, 89Panama 1984, 87 1980, 81, 82, 83, 84, 85, 86Peru 1980, 82, 83, 84Uruguay 1984, 87, 89 1983, 85, 86Venezuela 1989
Source: Taken from Frances Stewart, Protecting the poor during adjustment in Latin America and the Caribbean in the 1980s: How adequate was the World Bank response?, Development Studies Working Papers, No. 44, Turin, Italy/Oxford, United Kingdom, Centro Studi Luca d’Agliano/Queeti Elizabeth House, June 1992.
new power scheme. At the same time, high inflation also has an impact on the social, political and economic structure: indeed, in some cases a spell of hyperinflation served to break down resistance to a particular political and economic order, both because its redistributive effect took away power from the sectors opposing this and also because it mobilized social consensus in respect of a political option holding out the possibility of rescuing the economy from the problem of hyperinflation, whatever its cost for broad sectors of society and its long-term effects. In these cases, hyperinflation represented a step towards shaking the very foundations of the previous form of development.
In a number of cases, however, transfers of wealth have been a key element in the relationship between economic stabilization and the formation of an economic and political power structure. Both the severe economic imbalances which characterized the region from the mid-1970s onwards and the efforts at
stabilization formed a favourable context for intensive movements of wealth.
This process went through various phases. It began with the entry on the scene of the foreign banks and the deregulation of various national banking systems. As from the second half of the 1970s, there was parallel growth in the indebtedness of businesses and private sector holdings of financial assets, in both foreign and national currency (table 5). The overall growth in financial assets and liabilities concealed contrasting situations: not all the agents had the same access to credit or to the different types of credit; table 6 provides evidence of this in respect of a country which was a pioneer in financial liberalization. The privileged access to credit enjoyed by some entrepreneurs or economic groups (the biggest ones, and above all those with most links with the domestic or foreign banking system) gave them the possibility of building up important economic conglomerates; in contrast, companies which only had access

IN SEARCH OF ANOTHER FORM OF DEVELOPMENT / P. Sâinz and A. Calcagno 15
Table 5
LATIN AMERICA (SELECTED COUNTRIES): PRIVATE FINANCIAL ASSETS
(As percentages o f the gross domestic product)
Countries At end ofTerm, savings and foreign currency
deposits
Bankdepositsabroad
Otherfinancial
assets
Totalfinancial
assets
Argentina 1976 3.1 4.5 4.8 12.51980 15.3 4.7 2.9 23.01990 8.1 25.3 8.6 42.0
Costa R icaa 1976 12.9 4.5 0.0 b 17.31980 22.5 5.0 0.8 b 28.31990 25.9 19.1 5.7b 50.7
Chile 1976 4.9 4.6 6.9 16.41980 9.9 4.1 7.5 21.51990 23.6 15.3 30.0 68.8
Mexico 1976 17.1 3.2 10.0 30.31980 17.0 3.7 10.3 31.01990 19.7 8,6 18.7 46.9
Venezuela 1976 18.8 5.4 6.7 b 30.51980 24.3 20.2 7.8b 52.31990 25.5 34.9 3.2 b 63.6
Source: Central Banks of the respective countries, International Monetary Fund (IMF), and Bank for International Settlements (BIS). * Estimates based on IMF and BIS data. b Does not include publlc-sector securities.
to expensive short-term credit were adversely affected in their competitiveness and sometimes even their very survival was threatened. Likewise, the freeing of interest rates and of financial activity in general gave rise to new sources of profit for the agents with the greatest liquidity and access to a broad range of financial investments. In proportion as their financial assets increased, their portfolio decisions took on extraordinary importance for economic stability (such as the decision to take capital out of a country or repatriate it).
The debt crisis represented a second stage in the transfer of wealth. In this stage, the redistribution of assets among private agents was accompanied by a massive transfer from the public to the private sector. Through various expedients (exchange insurance, refinancing; guarantees, etc.) States assigned large amounts of resources to private enterprises and banks. In some cases, there was even nationalization (or virtual nationalization) of companies and banks that were in difficulties or were actually bankrupt. At the same time, the private sector continued to be the scene of intensive restructuring of wealth, encouraged by the crisis situation,
bankruptcies, financial and exchange market instability, and high and sharply changing rates of inflation.
Finally, policies aimed at generating trade surpluses or reducing inflation also influenced the distribution of wealth and income. These policies sought to restrict liquidity, to tie down some nominal variables, and to reduce the public sector’s financing needs. All of these measures had a substantial redistributive aspect: stabilization was by no means “neutral” in terms of the structure of property, income and power.
The control of liquidity is of course never completely uniform. For example, the Central Bank can cut down financing to banks (or to certain banks or certain banking operations) and to the Government, while keeping up money issue through the purchase of foreign exchange; in this way, it will be concentrating the creation of liquidity in certain export groups or groups that have access to external capital. Another measure to reduce liquidity taken in 1990 in Argentina and Brazil has even more obvious distributive effects: it involves the compulsory exchange of public debt paper or bank deposits, both

16 CEPAL REVIEW No. I December 1992
Table 6
ARGENTINA: FINANCING PROVIDED BY THE FINANCIAL SYSTEM TO THE MAIN PRIVATE-SECTOR DEBTORS, JUNE 1986
(Millions o f Australes, and percentages)
In foreign currency
At regu- Readjustable lated rate credits
Total financing on favour
able terms a
At free rate Total
Millions o f Australes 80 largest private debtors Rest of debtors
2 400 1 100
400 3 150
300590
3 1004 840
220 3 880
3 320 8 720
Total 3 500 3 550 890 7 940 4 100 12 040
Percentages80 largest private debtors Rest of debtors
72.312.6
12,036,1
9.06.8
93.455.5
6.644.5
100.0100.0
Total 29.1 29.5 7.4 65.9 34.1 100.0
Total value of production
(millions of 1984 Australes)
Employment (thousands
of jobs)
Total debt (millions of Australes)
Total manufacturing sector 51 private industrial firms b Percentage of total
3 989, 520
13.0
1 373.5 77.2
5.6
4 389 1 939
44.2
Source; Prepared on the basis of data from the Central Bank of the Argentine Republic and the 1985 National Economic Census by the National Institute of Statistics and Censuses (INDEC).
8 Foreign-currency financing was long-term, at prevailing international interest rates, and was generally covered by advantageous exchange insurance facilities; regulated rates were usually negative in real terms, while readjusts ble credits offered substantially more attractive terms and costs than those prevailing on the market.
b Included among the 80 biggest private debtors of the financial system.
of which were of a very short- term nature and had free interest rates, for other financial assets with longer terms and lower yields. This measure affected numerous savers and creditors of the State, although some of them were able to at least partially avoid the effects of this measure.
Generally speaking, when efforts have been made to control inflation this has involved fixing some key prices such as the exchange rate, public service tariffs, or nominal wages. If the rest of the prices continue to rise for some time, however, the “anchor” variables will gradually fall further and further behind, and it is possible that there will be a big change in relative prices, with its consequent effects on the various agents.
With regard to the public accounts, the stabilization programmes sought to reduce the operating deficit and even attain a surplus with which to help cope with the public debt burden and possibly also other outlays connected with structural reforms (such as the transition from a pension system based on the even-handed allotment of benefits to another system based on individual capitalization). Here, too, there were substantial distributive effects, as we shall see in section 4 below. In this sense, public expenditure was not reduced in a homogeneous manner: basically social expenditure contracted, whereas financial expenditure increased. With regard to revenue, income from direct taxes tended to fall, while that from indirect taxes tended to rise. Once again, the

IN SEARCH OF ANOTHER FORM OF DEVELOPMENT I P. Sái/iz and A. Calcagno 17
privatization process was important. The effects of the decision to privatize on the distribution of wealth were obvious, not only in terms of the relation between the public and private sectors, but also with regard to the ownership structure within the private sector itself. Foreign capital and local enterprises or economic groups which were able to weather the crisis on better terms and with greater liquidity or access to credit were able to consolidate their position within, the country through the purchase -often at prices below their real economic value- of important natural resources and public enterprises.
In the final analysis, the stabilization processes in which a number of countries have made substantial progress have not been limited to the mere restoration of some “basic macroeconomic balances” in the fiscal and external accounts. The actual measures taken have meant heavy transfers of income and wealth and have tended to crystallize (or stabilize) a new economic power structure.
Likewise, the stabilization of the political scheme and the economic power structure seem to have been essential elements in processes of price stabilization. On this basis, with the prospect of high profits, the most important private agents have in a number of cases modified some forms of behaviour which are of great importance in inflationary processes, such as their decisions on levels of prices and production, their activities in the exchange market, and their conduct in respect of tax payments.3
3. The relationship between capital and labour
A clear indicator of changes in the relationship between capital and labour is the evolution of the functional distribution of income. Although figures are not available for all the countries, and some of those which are available may be rather inaccurate, the general tendency points clearly towards a very marked deterioration for wage-earners.
In other words, these agents do not appear to have used their virtual power of veto in respect of political and economic decisions: “in order to maintain their status quo [the economic elites] resort to various forms of pressure on the decisionmaking centres of the public authorities, ranging from the occupation of key posts in public regulation of the economy to the use of destabilization of the currency and of domestic production as ways of pressuring in favour of their interests” (ECLAC, 1991a).
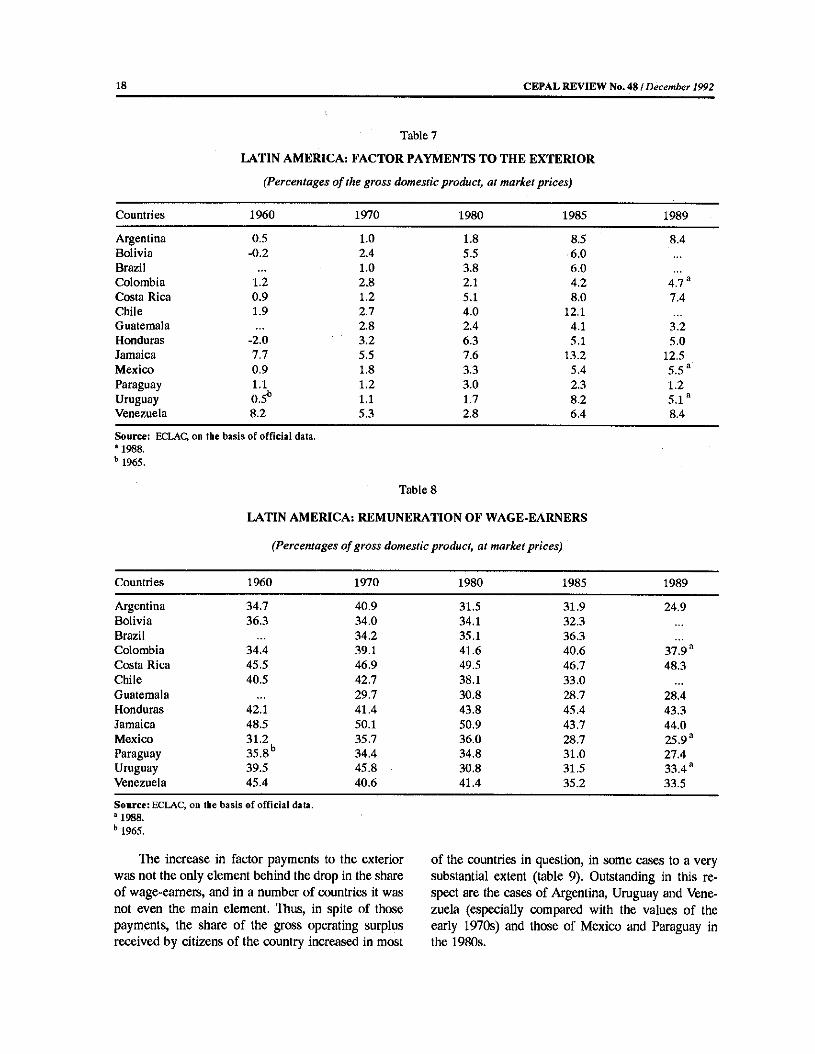
Tables 7, 8 and 9 show the evolution of the shares of the different forms of primary income in the gross domestic product. Between 1960 and 1989 there was a general increase in the part corresponding to factor payments to the exterior, because of the interest commitments on the external debt (table 7). This element, which was frequently only marginal during the 1960s, began to gain importance in most of the countries towards the end of the 1970s, and in the 1980s it increased considerably, due both to the magnitude of the interest due and the real devaluation in many countries.
The share of wage-eamers in the gross domestic product, which had improved in general terms up to the early 1970s, suffered a marked deterioration in the 1980s (table 8), to such a point that in the Southern Cone countries and Mexico it went down by more than 10 percentage points. In the Southern Cone countries, this deterioration dates from the mid- 1970s, when the military governments adopted lines of action which were liberal in the economic field and sharply repressive (especially with regard to wage-earners) in the political sphere. There were no significant changes in this tendency in the following decade, in spite of the process of democratization; thus, in the mid-1980s wage-eamers received only a little over 30% of the product (a figure which subsequently went down still further in Argentina), compared with over 40% in 1970. The severe compression of the share of wage-eamers was a central element in the breakdown of the previous form of development in those countries, which had been pioneers in industrialization strategies based on the domestic market and had reached a relatively high degree of social homogeneity. Although it was not always as marked as in those countries, the drop in the share of wage-earners was generalized in Latin America, especially during the 1980s. Among the countries for which information is available, it retained its previous level only in Costa Rica and Honduras. In all the other countries, the share of wage-earners in the g d p at the end of the 1980s was less than its 1970 value.4
4 Some studies are underway on the situation in this respect in mini-enterprises, which are not always reflected in the national accounts and in which there is both entrepreneurial income and wage payments.
18 CEPAL REVIEW No. 48 / December 1992
Table 7
LATIN AMERICA: FACTOR PAYMENTS TO THE EXTERIOR
(Percentages o f the gross domestic product, at market prices)
Countries 1960 1970 1980 1985 1989
Argentina 0.5 1.0 1.8 8.5 8.4Bolivia -0.2 2.4 5.5 6.0Brazil 1.0 3.8 6.0Colombia 1.2 2.8 2.1 4.2 4.7 aCosta Rica 0.9 1.2 5.1 8.0 7.4Chile 1.9 2.7 4.0 12.1Guatemala 2.8 2.4 4.1 3.2Honduras -2.0 3.2 6.3 5.1 5.0Jamaica 7.7 5.5 7.6 13.2 12.5Mexico 0.9 1.8 3.3 5.4 5.5 aParaguay 1.1 1.2 3.0 2.3 1.2Uruguay 0.5b 1.1 1.7 8.2 5.1aVenezuela 8.2 5.3 2.8 6.4 8.4
Source: ECLAC, on the basis of official data. * 1988. b 1965.
Table 8
LATIN AMERICA: REMUNERATION OF WAGE-EARNERS
(Percentages o f gross domestic product, at market prices)
Countries 1960 1970 1980 1985 1989
Argentina 34.7 40.9 31,5 31.9 24.9Bolivia 36.3 34.0 34.1 32.3Brazil 34.2 35.1 36.3Colombia 34.4 39.1 41.6 40.6 37.9Costa Rica 45.5 46.9 49.5 46.7 48,3Chile 40.5 42.7 38.1 33.0Guatemala 29.7 30.8 28.7 28.4Honduras 42.1 41.4 43.8 45.4 43.3Jamaica 48.5 50.1 50,9 43.7 44.0Mexico 31.2 35.7 36.0 28.7 25.9Paraguay 35.8 b 34.4 34.8 31.0 27.4Uruguay 39.5 45.8 30.8 31.5 33.4Venezuela 45.4 40.6 41.4 35.2 33.5
Source: ECLAC, on the basis of official data. * 1988. b 1965.
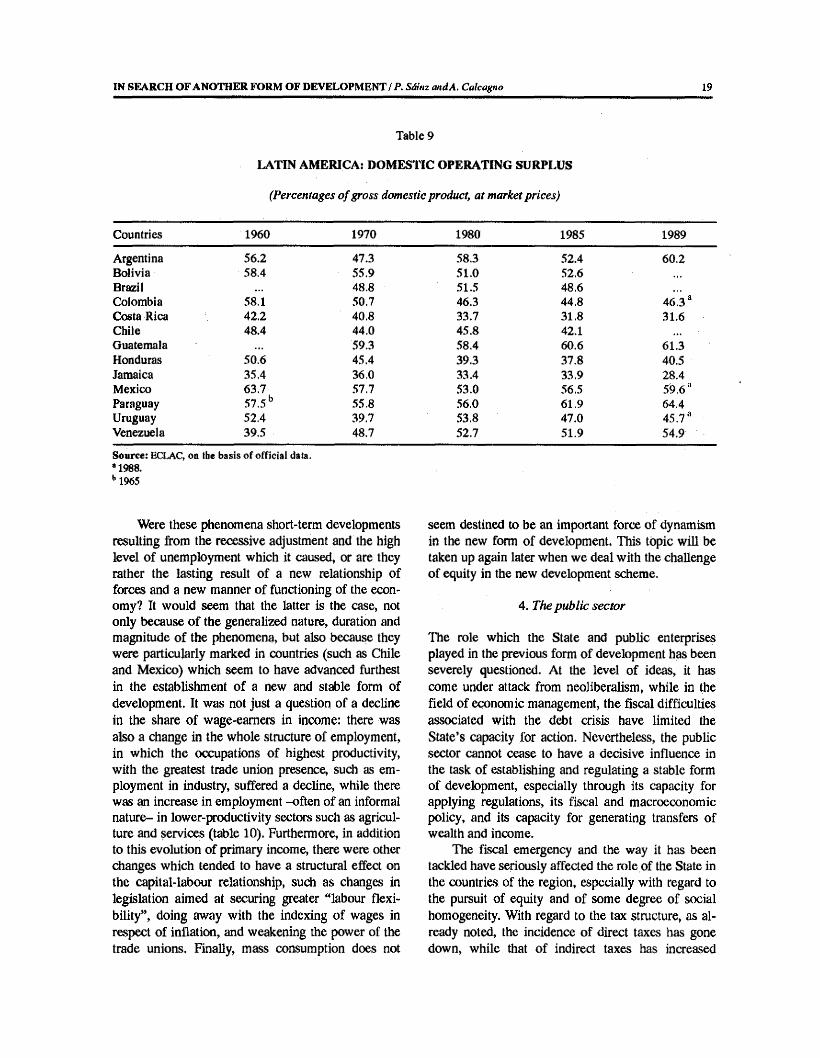
The increase in factor payments to the exterior was not the only element behind the drop in the share of wage-eamers, and in a number of countries it was not even the main element. Thus, in spite of those payments, the share of the gross operating surplus received by citizens of the country increased in most
of the countries in question, in some cases to a very substantial extent (table 9). Outstanding in this respect are the cases of Argentina, Uruguay and Venezuela (especially compared with the values of the early 1970s) and those of Mexico and Paraguay in the 1980s.
IN SEARCH OF ANOTHER FORM OF DEVELOPMENT / P. Sáinzm d . Calcagno 19
Table 9
LATIN AMERICA: DOMESTIC OPERATING SURPLUS
(Percentages o f gross domestic product, at market prices)
Countries 1960 1970 1980 1985 1989
Argentina 56.2 47.3 58.3 52.4 60.2Bolivia 58.4 55.9 51.0 52.6Brazil 48.8 51.5 48.6Colombia 58.1 50.7 46.3 44.8 46.3 aCosta Rica 42.2 40.8 33.7 31.8 31,6Chile 48.4 44.0 45.8 42.1Guatemala 1(t 59,3 58.4 60.6 61.3Honduras 50.6 45.4 39.3 37.8 40.5Jamaica 35.4 36.0 33.4 33.9 28.4Mexico 63.7 57.7 53.0 56.5 5^.6 aParaguay 57.5 b 55.8 56.0 61.9 64.4Uruguay 52.4 39.7 53.8 47.0 45,7 aVenezuela 39.5 48.7 52.7 51.9 54.9
Source: ECLAC, on the basis of official data. * 1988. b 1965
Were these phenomena short-term developments resulting from the recessive adjustment and the high level of unemployment which it caused, or are they rather the lasting result of a new relationship of forces and a new manner of functioning of the economy? It would seem that the latter is the case, not only because of the generalized nature, duration and magnitude of the phenomena, but also because they were particularly marked in countries (such as Chile and Mexico) which seem to have advanced furthest in the establishment of a new and stable form of development. It was not just a question of a decline in the share of wage-eamers in income: there was also a change in the whole structure of employment, in which the occupations of highest productivity, with the greatest trade union presence, such as employment in industry, suffered a decline, while there was an increase in employment -often of an informal nature- in lower-productivity sectors such as agriculture and services (table 10). Furthermore, in addition to this evolution of primary income, there were other changes which tended to have a structural effect on the capital-labour relationship, such as changes in legislation aimed at securing greater “labour flexibility”, doing away with the indexing of wages in respect of inflation, and weakening the power of the trade unions. Finally, mass consumption does not
seem destined to be an important force of dynamism in the new form of development. This topic will be taken up again later when we deal with the challenge of equity in the new development scheme.
4. The public sector
The role which the State and public enterprises played in the previous form of development has been severely questioned. At the level of ideas, it has come under attack from neoliberalism, while in the field of economic management, the fiscal difficulties associated with the debt crisis have limited the State’s capacity for action. Nevertheless, the public sector cannot cease to have a decisive influence in the task of establishing and regulating a stable form of development, especially through its capacity for applying regulations, its fiscal and macroeconomic policy, and its capacity for generating transfers of wealth and income.
The fiscal emergency and the way it has been tackled have seriously affected the role of the State in the countries of the region, especially with regard to the pursuit of equity and of some degree of social homogeneity. With regard to the tax structure, as already noted, the incidence of direct taxes has gone down, while that of indirect taxes has increased

20 CEPAL REVIEW No. 48 / December 1992
Table 10
LATIN AMERICA: STRUCTURE AND EVOLUTION OF EMPLOYMENT AND PRODUCT PER PERSON EMPLOYED, BY SECTORS
OF ACTIVITY, 1960-1985
Sector of activityAnnual average growth rates (%) Percentage structure
1960-1970 1970-1980 1980-1985 I960 1970 1980 1985
A. Employment
Total 2,0 2.6 2.8 100.0 100.0 100.0 100.0Agriculture a 0.2 1.1 2.7 50.2 42.1 36.2 36.0Industry b 3.4 2.7 -0.7 18.2 20.8 20.9 17.5Services c 3.6 4.1 4.5 31.6 37.1 42.9 46.5
B. Product per person employed
Total 3.3 2.9 -1.8 54 75 100 91Agriculture a 3.1 2.4 0.4 18 25 31 32Industry b 2.4 2.9 0.5 109 138 183 188Services c 1.9 1.9 -3.8 80 97 117 96
Source: Estimates prepared by the ECLAC Statistics and Projections Division on the basis of census data, household surveys, and official national accounts data of the countries.
a Includes agriculture, hunting, forestry and fishing. b Includes mining, manufacturing, electricity, gas, water and construction. e Includes transport and communications, commerce, and personal, social and community services.
(table 11). This tendency may be interpreted as the result of emergency policies designed to tackle urgent fiscal needs through a deficient system of tax collection in a context of high inflation: it would appear that preference has been given to the taxes which are easiest to collect, regardless of whether they are progressive or regressive. However, this tendency may also be due to an option less affected by the pressure of circumstances, since it has also been observed in countries which did not suffer from such urgent needs (such as Chile), and in a number of countries it seems to have persisted even after relative relief of their fiscal situation.
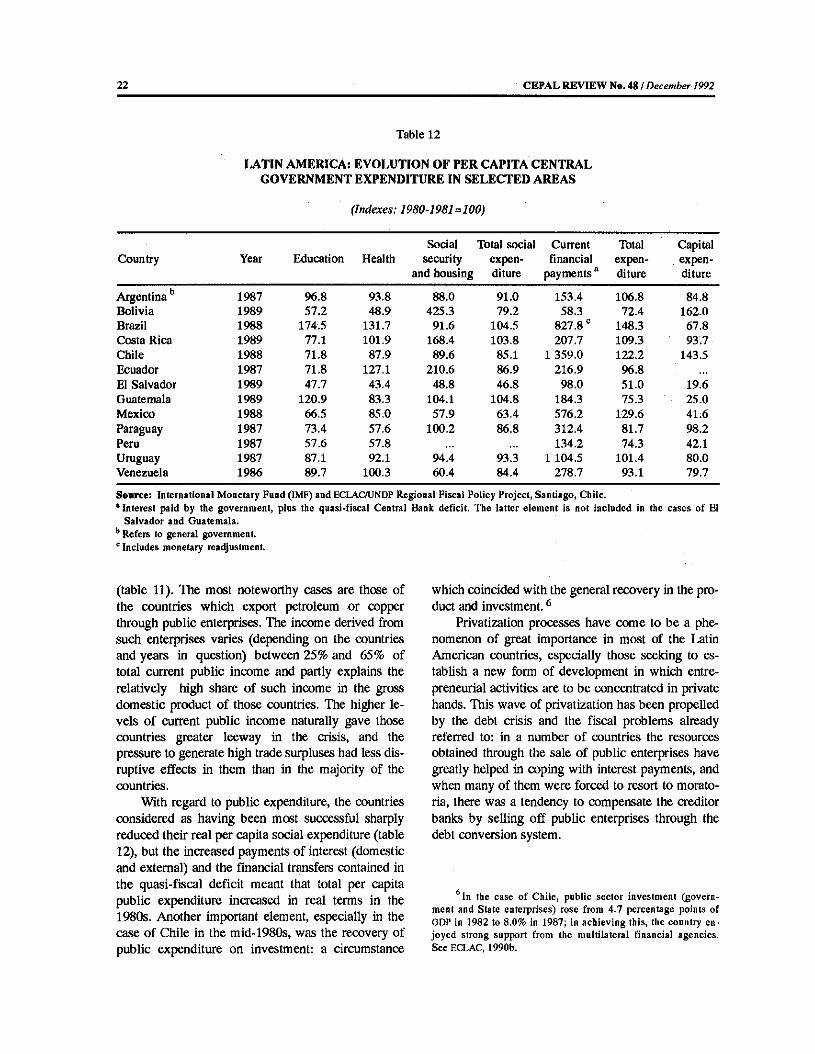
In the area of current expenditure, in almost all the countries there was a marked reduction in those outlays connected with social welfare (education, health and housing), thus further heightening the effects of the adverse primary distribution of income for the poorest groups. This drop has not been due to a generalized reduction in public expenditure, but rather to the restructuring of the latter to cope with the higher external and domestic interest payments and the subsidies given by governments in various
ways to private enterprises and banks affected by the crisis (table 12). The same reason is behind the considerable drop in public investment, which has naturally had repercussions on the maintenance and development of the infrastructure and the quality of public services. There has thus been a tendency towards the disappearance of an instrument of social incorporation and economic dynamism which had been of major importance in the former development model.
The countries considered to have been most successful in establishing the new form of development clearly display some of the features in question, but they also display some important special features. With regard to the tax structure, there has been a notable reduction in direct taxes and in the income of the public social security system (especially in Chile); however, these reductions have been offset by the evolution of indirect taxes and non-tax income 5
It should be noted that the direct taxes paid by public enterprises which exploit natural resources are considered to come within this category.

IN SEARCH OF ANOTHER FORM OF DEVELOPMENT I P. Sáinz attdA. Calcagno 21
Table 11
LATIN AMERICA: EVOLUTION OF THE TAX STRUCTURE, 1980-1989
(Percentages o f gross domestic product)
Countries Year Directtaxes
Indirecttaxes
Socialsecurity
Non-taxincome
Total current income
Argentina a 1980 4.5 12.1 5.2 3.4 25.2(general government) 1985 3.5 12.4 5.7 3.3 24.9
1988 3.3 10.6 5.7 2.5 22.1Bolivia b 1980 1.7 8.3 3.1 1.5 14.6(general government) 1985 0.3 11.3 1.8 0.9 143
1987 0.8 15.0 2.5 1.5 19,8Brazil a 1980 3.4 14.5 6.3 24.2 '(general government) 1985 4.8 11.2 5.5 21.5 '
1988 4.0 10.3 4.8 19.1 'Colombia b 1980 2.8 5.3 1.5 0.5 10.1(central government) 1985 3.2 5.4 1.5 0.5 10.6
1988 3.5 6.0 1.6 1.8 12.9Costa Rica b 1980 3.0 10,7 6.6 4.5 24.8(general government) 1985 3.2 13.0 6.8 2.3 25.3
1987 3.0 13.2 7.1 2.1 25.4Chile b 1980 5.4 13.4 5.6 8.5 d 32.9(general government) 1985 3.1 17.1 2.4 6.0 d 28.6
1988 2.5 15.2 1.7 12.3 d 31.7Ecuador c 1980 1.8 7.5 2.8 8.0 f 20.1(general government) 1985 1.6 .7.1 2.3 13.7 f 24.7
1987 1.9 8.0 2.3 6.6 1 18.8El Salvador a 1980 3.4 7.7 0.5(central government) 1985 2.4 9.5 1.4
1989 2.4 5.3 0.3Guatemala a 1980 1,5 8.6 1.3(central government) 1985 1.4 6.1 1.9
1989 2.3 7.2 2.0Haiti * 1980 1.5 7.8(central government) 1985 1.9 8.7
1987 1.7 8.3Mexico b 1980 5.8 5.5 2.8 4.7 f 18.8(central government) 1985 4.2 5.9 2.4 7.4 f 19.9
1988 4.9 6.4 2.4 5.2 f 18.9Nicaragua a 1980 3.1 15.1 2.1 3.0 23.3(central government) 1985 5,7 21.4 4,5 5.2 36.8
1986 6.4 20.9 3.9 5.6 36.8Paraguay a 1980 2.0 6.7 1.4 1.0 11.1(central government) 1985 1.6 5.5 1.0 1.5 9.6
1988 1.6 5.6 1.3 1.2 9.7Peru a 1980 5.0 10.9 1.8 2.3 20.0(central government) 1985 1.7 11.2 1.6 2.3 16.8
1987 2.2 6.8 2.0 0.4 11.4Dominican Republic a 1980 2.8 7.7 0.5 3.2 14.2(central government) 1985 2.4 8.5 0.4 1.0 12.3
1988 2.9 10.6 0.6 2.2 16.4Uruguay a 1980 3.2 12.6 5.2 1.2 22.3(central government) 1985 2.5 12.0 5,3 0.9 20.6
1988 3.0 12.6 6.2 1.4 23.4Venezuela b 1980 2.9 5.5 1.7 20.1 * 30,2(central government) 1985 3.8 6.2 0.8 16.7 e 27.5
1988 2.7 2.9 0.8 12.7 e 19.1
a Source: International Monetary Fund (IMF), Government Finance Statistics Yearbook, Washington, D.C.b Source: ECLAC/UNDP Regional Fiscal Policy Project, Santiago, Chile, c Tax income only. d Includes direct taxes on copper. * Source: Central Bank of Ecuador, National Accounts of Ecuador, and IMF. f Includes direct and indirect taxes on
petroleum. e Includes direct taxes on petroleum.
22 CEPAL REVIEW No. 48 / December 1992
Table 12
LATIN AMERICA: EVOLUTION OF PER CAPITA CENTRAL GOVERNMENT EXPENDITURE IN SELECTED AREAS
(Indexes: 2980-1981=100)
Country Year Education HealthSocial
security and housing
Total social expenditure
Current financial
payments a
Totalexpenditure
Capitalexpenditure
Argentina b 1987 96.8 93.8 88.0 91.0 153.4 106.8 84.8Bolivia 1989 57.2 48.9 425.3 79.2 58.3 72.4 162.0Brazil 1988 174.5 131.7 91.6 104.5 827.8 c 148.3 67.8Costa Rica 1989 77.1 101.9 168.4 103.8 207.7 109.3 93.7Chile 1988 71.8 87.9 89.6 85.1 1 359.0 122.2 143.5Ecuador 1987 71.8 127.1 210.6 86.9 216.9 96.8El Salvador 1989 47.7 43.4 48.8 46.8 98.0 51.0 19.6Guatemala 1989 120.9 83.3 104.1 104.8 184.3 75.3 25.0Mexico 1988 66.5 85.0 57.9 63.4 576.2 129.6 41.6Paraguay 1987 73.4 57.6 100.2 86.8 312.4 81.7 98.2Peru 1987 57.6 57.8 134.2 74.3 42.1Uruguay 1987 87.1 92.1 94.4 93.3 1 104.5 101.4 80.0Venezuela 1986 89.7 100.3 60.4 84.4 278.7 93.1 79.7
Source: International Monetary Fund (IM F) and ECLAC/UNDP Regional Fiscal Policy Project, Santiago, Chile.* Interest paid by the government, plus the quasi-fiscal Central Bank deficit. The latter element is not included in the cases of El
Salvador and Guatemala. b Refers to general government. c Includes monetary readjustment.
which coincided with the general recovery in the product and investment.6
Privatization processes have come to be a phenomenon of great importance in most of the Latin American countries, especially those seeking to establish a new form of development in which entrepreneurial activities are to be concentrated in private hands. This wave of privatization has been propelled by the debt crisis and the fiscal problems already referred to: in a number of countries the resources obtained through the sale of public enterprises have greatly helped in coping with interest payments, and when many of them were forced to resort to moratoria, there was a tendency to compensate the creditor banks by selling off public enterprises through the debt conversion system.
*In the case of Chile, public sector investment (government and State enterprises) rose from 4.7 percentage points of GDP in 1982 to 8,0% in 1987; in achieving this, the country enjoyed strong support from the multilateral financial agencies. See ECLAC, 1990b.
(table 11). The most noteworthy cases are those of the countries which export petroleum or copper through public enterprises. The income derived from such enterprises varies (depending on the countries and years in question) between 25% and 65% of total current public income and partly explains the relatively high share of such income in the gross domestic product of those countries. The higher levels of current public income naturally gave those countries greater leeway in the crisis, and the pressure to generate high trade surpluses had less disruptive effects in them than in the majority of the countries.
With regard to public expenditure, the countries considered as having been most successful sharply reduced their real per capita social expenditure (table12), but the increased payments of interest (domestic and external) and the financial transfers contained in the quasi-fiscal deficit meant that total per capita public expenditure increased in real terms in the 1980s, Another important element, especially in the case of Chile in the mid-1980s, was the recovery of public expenditure on investment: a circumstance

IN SEARCH OF ANOTHER FORM OF DEVELOPMENT / P. Sàinz and A. Calcagno 23
However, the privatization of public enterprises has not had as its only objectives those of providing resources for the State or reducing the external debt, in spite of the importance which these aspects have assumed in a number of countries. It has also been seen as a suitable way of attracting foreign capital, increasing investment, and improving efficiency in the production of goods or the provision of services. It has also been put forward as the only way of improving the often unsatisfactory functioning of such enterprises, considered to be an inherent feature of them when they belong to the State. This latter argument is sometimes unfair, however, since public enterprises have often been “sacrificed” by macro- economic policies or policies aimed at the indirect distribution of subsidies: thus, charges for public services were reduced in real terms as part of an anti- inflationary policy or one aimed at providing transfers (or else serious lags in payment were tolerated in respect of both public and private users); they were obliged to enter into external indebtedness when international reserves were required, but subsequently excluded from the exchange rate insurance granted to the private sector; and resources were taken away from them for the purpose of making investments in connection with the fiscal and external adjustments. In these circumstances, it is hardly surprising that public enterprises register deficits (the really surprising thing is that this has not always occurred in all cases), or that a privatization process which frees them of all these burdens and establishes high scales of charges rapidly causes them to produce substantial profits.
Thus, the discussion concerning privatization processes has been obscured by the fact that it has been focussed on the question of the deficit of public enterprises, considered to be undeniable proof of their inefficiency. Not only has the problem of these deficits not been considered in all its aspects, but the concept of efficiency also only makes sense in relation to a particular objective, which privatization may change. Indeed, either because of privatization processes or because the activities of private enterprises are progressively displacing the public sector in such areas as education, health, social security, housing or communications, we are witnessing in some cases the abandonment of the idea of public service and its replacement by that of commercial operations aimed primarily at the middle and high income sectors.
However, in the countries which have gone furthest in this new form of development -which, as we have seen, depend for the soundness of their public and external accounts on the activities of big State- owned export enterprises- such enterprises have so far been excluded from the privatization plans.
Finally -and this is rather paradoxical for a form of development which ardently supports “privatization” against “Statism”-, the countries which have progressed furthest with this new form do not display a reduction in the “size” of the State, as measured by its income7 or by its expenditure, as a proportion of the gross domestic product. Moreover, although they have carried out major processes of privatization of service companies, they have retained within the public sector the main companies producing exportable goods, and these continue to form one of the main bases of public income.8
5. The form o f incorporation in the international economy
Changing the form of incorporation in the international economy is a key element in building a new form of development. Trade openness is seen as the add test of the effiriency of economies and the main means of improving their competitiveness. The expansion of exports needed in order to cope with external payments must also serve as the motor for growth in an economy where the domestic market is losing its vigour, except in the high-income segments. With regard to imports, it is claimed that external competition must keep inflationary pressures in check and give a new climate of efficiency to local production. The need to compete in order to win external markets and maintain the position in the domestic market is claimed to be the necessary incentive for the modernization and restructuring of local production. There will be companies which will go bankrupt and sectors of production which will have to be abandoned, but this is seen as part of an indispensable process of “creative destruction” (Pérez, 1991).
On the contrary, it is these countries which display the biggest “fiscal pressure” in the region, if this is taken to include the fiscal income deriving from State enterprises.
8 This confirms the inappropriateness of discussing the economic function of the State merely in terms of “much” or “ little” State, as if the State were a homogeneous and divisible substance which, if injected in large quantities, would give rise to a “Statist” economy, and in modest doses to a “private” economy.

24 CEPAL REVIEW No. 48 iDecember 1992
With regard to capital movements, special importance is assigned to foreign direct investment, as a means of increasing overall investment, introducing technology, and opening up new markets. As well as the need for a context of political and economic stability, it is held that there must be a legal framework which favours the entry of capital, which means in particular providing guarantees in respect of sending profits abroad and repatriating capital. In a number of countries, new opportunities have also been opened up for this capital through capitalization of the external debt, privatization of public assets, and access to natural resources.
Latterly, the region has received significant amounts of foreign capital which, together with a decline in external interest rates, gave rise to a positive net transfer of resources in 1991, measured in current dollars, for the first time since 1982. The nature of these resources is no longer the same as in the 1970s, since voluntary bank credits continue to be few and far between. The two main sources are involuntary bank lending due to arrears in debt servicing (which are of substantial magnitude in the cases of Argentina and Brazil) and foreign investment, which has reached considerable levels in Chile and, more recently, in Mexico and Argentina. It should be noted that these new capital flows are concentrated in only a few countries: in 1990 and 1991, just three countries (Mexico, Argentina and Chile) received almost three-quarters of the net capital flow. Consequently, although these capital inflows reduced or reversed the negative outward transfer of resources in some countries, in others this still continues.
The reduction in outward transfers has permitted a number of countries to reduce the stringency of their efforts to adjust their external and public accounts, although this may be only a temporary situation in this respect (privatization processes, for example, only have effects for a short period of time). At all events, however, in these cases this reduction has played an appreciable part in reducing inflationary tensions and favouring a recovery in the level of activity.
In countries which currently lead the way in adopting a new form of development, such as Chile and Mexico, the flow of external capital has played a prime role. During the 1980s, Chile received substantial official credits which supported its economic recovery after the severe crisis of 1982-1983.
Subsequently, growing importance was assumed by private capital: up to the end of the 1980s, capital entering the country in response to the advantages provided by the external debt capitalization systems played the dominant role in this respect, while in the early 1990s short-term capital and new foreign direct investments began to be significant. In Mexico, the new inflow of capital came somewhat later, but it was on a very substantial scale. A change in the economic and political prospects at the end of the 1980s favoured the return of flight capital, and this was followed by a wave of direct and portfolio investments connected, inter alia, with the privatization of the banking system and other public enterprises.
In this way, there has been a change in the composition of foreign capital in a number of countries of the region, especially the two just mentioned. The contraction of the net flows of bank credit in the 1980s and the various mechanisms adopted in order to reduce bank debt, including conversion of the debt into capital and global agreements such as the Brady Plan, reduced the weight of external indebtedness from private sources compared with debt owed to official sources and the growing foreign direct investment. The effect that these changes will have on the balance of payments is not immediately clear. Bank debt reduction agreements under the Brady Plan are usually accompanied by an increase in official indebtedness and cash disbursements, and even though the final result is normally smaller indebtedness and/or lower interest rates on the outstanding balance, the maturities of the remaining debt are more difficult to restructure and it is less feasible to resort to arrears in interest payments. Reduction of the interest due does not necessarily mean lower debt servicing. Moreover, foreign direct investment will probably generate a flow of profits, and a numerical exercise effected for the Chilean case suggests that this flow may reach significant levels (table 13).
In Chile and Mexico, the inflow of foreign capital seems to be in line with the long-term prospects associated with the options for their insertion in external trade adopted by these two countries. In the case of Chile, there has been a steady expansion in the volume exported. Thus, at constant 1980 values, exports represented 12.6% of GDP in 1970, 23.1% in 1980, and 33.2% in 1990. In Mexico, the respective

IN SEARCH OF ANOTHER FORM OF DEVELOPMENT / P. Sâinz and A. Calcagno 25
Table 13
CHILE: FOREIGN DIRECT INVESTMENT (FDI). ESTIMATED LEVELS 1983-1991 AND PROJECTION FOR 1992-2000a
(Annual averages, in millions o f dollars)
Hypothesis of sustained profits Hypothesis of decreasing profits
1983-1990 1991-1995 1996-2000 1983-1990 1991-1995 1996-2000
Flow of FDI b 963 1 537 1 583 963 1 226 803
Capital entry under DL 600 34 5 5 34 5 5Capital entry under Chapter XIX 406 8 19 406 8 19Other 180 661 1 139 180 491 536Reinvestment of profits under Chapter XIX 343 863 420 343 721 242
Total cumulative fdiat end of period c 9 382 17 067 24 983 9 382 15 510 19 523
Chapter XIX 5 992 10 347 12 542 5 992 9 637 10 944Other 3 390 6 719 12 441 3 390 5 873 8 579
Profits obtained 774 2 793 4 340 774 2 020 2 215
Profits drawn 239 1 376 2 538 239 988 1 367
Profits obtained oncumulative fdi (%) 21.8 21.8 21.8 21.8 16.6 13.0
Profits drawn oncumulative fdi (%) 8.6 10.1 12.8 8.6 7.6 8.0
Profits drawn on fdiunder Chapter XIX 2 873 1 588 2 627 920
Profits drawn on other fd i 239 504 949 239 362 447
Profits drawn on accrued profits (%) 30.8 49.3 58.5 30.8 48.9 61.7
Profits drawn on flow of FDI (%) 24.8 89.6 160.3 24.8 80.6 170.3
Source: Prepared on the basis of data from the Central Bank and the Foreign Investments Committee of Chile and the US Department of Commerce.
s The limitations of the available statistics on foreign direct investment in Chite make it necessary to formulate hypotheses on the profits made and those reinvested. For the period 1983-1990, the reinvestment of profits obtained on FDI other than that effected under Chapter XIX was estimated from data for United States companies (US Department of Commerce, Survey o f Current Business, Washington, D.C., various issues). The profits generated were inferred from the remittances of profits effected and the reinvestment hypotheses. For subsequent years, two hypotheses were used: one assumed the continuation of the average rate of profits estimated for 1983-1990, while the other assumed a gradual decline to lower rates of profitability. In all cases it was assumed that the same rate of profitability also applied for FDI effected under Chapter XIX. For the period 1991-1999, it was assumed that 20% of the profits accruing on FDI under Chapter XIX and 50% of those accruing under other forms of FDI were reinvested.
b Figures based on balance of payments data, which register net FDI and do not include credits associated with FDI. Conversions under Chapter XIX were registered in this exercise (unlike the official figures) at a discount of between 15% and 5%.
c The starting point was the cumulative FDI up to the end of 1973, according to the figures of the Foreign Investments Committee of Chile; devaluation of foreign capital was not taken into account.

26 CEPAL REVIEW No. A%l December 1992
Figure 2
MEXICO: EVOLUTION OF EXPORTS,1970,1980 AND 1989
(Billions o f dollars)
Source: Estimates on the basis of primary data from the Latin American and Caribbean External Trade Data Bank (BADECEL). Statistics and Projections Division, ECLAC
Note: The classification was effected on the basis of the Standard International Trade Classification (SITC) at the three-digit level, in line with the criteria used by ECLAC in El comercio de manufacturas de América Latina: Evolución y estructura 1962-1989 (LC/R.1056, Santiago, Chile, September 1991) and in Intraindustry Trade: a Comparison between Latin America and some Industrial Countries (LC/R. 1101, Santiago, Chile, Statistics and Projections Division, November 1991).
values were 10%, 11.8% and 22.6%,9 In the case of Mexico, oil exports assumed notable importance as from 1980, but subsequently there was also a significant increase in exports of manufactures, especially those of medium and high technological content. The growth in Chile’s exports, in contrast,
9 These increases, although noteworthy, are by no means an isolated phenomenon in Latin America: even if Chile and Mexico are excluded, the region exported the equivalent of 15.3% of its gross domestic product in 1980 and 20,6% in 1990 (at constant 1980 values).
Figure 3
CHILE: EVOLUTION OF EXPORTS,1970,1980 AND 1989
(Billions of dollars)
1970 1980 1989
Source: Estimates on the basis of primary data from the Latin American and Caribbean External Trade Data Bank (BADECEL). Statistics and Projections Division, ECLAC
Note: The classification was effected on the basis of the Standarc International Trade Classification (SITC) at the three-digi level, in line with the criteria used by ECLAC in E! comerch de manufacturas de América Latina: Evolución y estructu ra 1962-1989 (LC/R.1056, Santiago, Chile, Septembe 1991) and in Intraindustry Trade: a Comparison betweet Latin America and some Industrial Countries (LC/R. 110J Santiago, Chile, Statistics and Projections Division November 1991).
has been based mainly on the country’s natural re sources (figures 2 and 3). In both cases, special in: portance is assigned to the trade integratio agreements with the United States. For Chile, th corresponding agreement is a reassertion of its aim < exporting to the developed countries, even though tf United States is not currently its main market (pu chases by Japan or the European Community ai more important). For Mexico, whose trade with tl United States already accounts for two-thirds of i total external trade, the North American Free Trat Agreement is seen as a decisive step forward in í outward-looking development strategy.
IN SEARCH OF ANOTHER FORM OF DEVELOPMENT / P. Sãnz and A. Calcagno 27
III
The challenges of the new form of development
The Latin American and Caribbean countries are seeking to shape a new form of development in these early years of the 1990s. Their efforts in this respect are at very different stages of progress. At one extreme, a few countries have managed to exceed the levels of per capita production of the early 1980s, have inflation under control and possess high levels of reserves, have significantly increased the percentage of their gross domestic product which they use for investment (although these percentages are still not very high), while their democratic processes show an appreciable degree of consensus and stability. At the other extreme, some countries are still struggling to stabilize their economies, still register low levels of capital accumulation, are only at the beginning of the process of reform of their institutions, and their democratic processes are subject to greater tensions.
The first-named countries seem to be on the threshold of consolidating a new form of development. As a result of the processes of institutional and macroeconomic reform of the 1970s and 1980s, they have inherited high percentages of the population in a situation of poverty, heavy concentration of income distribution and distribution of property, and economic dynamism closely linked to export growth. They must therefore consolidate their advances in democracy with greater equity, raise investment, and maintain their export growth and the macroeconomic balances obtained, within an international context which simultaneously offers relief and difficulties in connection with their economic policy.
The rest of the countries face the prospect of having to repeat the reform process of the first- named countries and having to solve major queries. On the one hand, since their economies generally display substantial differences from those of the first- named countries, and since changes have taken place in the meantime in the international context, the question arises of whether the policies required should not now be different. On the other hand, the question arises of whether the lessons of the 1980s can show them how to avoid the high costs in terms of equity and growth paid by the first-named countries.
In examining this set of challenges we shall first of all analyse the sequence of the reform process
in both the macroeconomic field and in the structural and institutional area. We shall then analyse the export process. In this respect, at least two different export structures may be distinguished in the first group of countries. We must ask ourselves what their medium and long-term prospects are, and how far these processes can be repeated in other countries. At the same time, in the short term the greater financial openness and the new international context are raising difficulties in respect of the export effort and the macroeconomy, and these must be explored. Next, we shall analyse the process of capital accumulation, which should be led by the private sector in the new context, although it is nevertheless essential to examine the scope and specific features of public action in this field. Finally, a review will be made of the consequences these reforms may have for equity, analysing both the experience of the countries which were pioneers in this field and also the possible repetition or modification of such experience in other countries.
1, The consistency of the reform process
There is a high degree of consensus among governments regarding the need to make reforms at the macroeconomic and institutional levels. In general terms, there is consensus on the need to maintain the macroeconomic balances and deregulate markets. The picture is not so clear, however, with regard to the timetable and scope that those reforms should have. The changing international scene raises continual challenges even for the countries which have progressed furthest in this process. Deciding on a timetable for reforms, clarifying their scope, and providing mechanisms to facilitate adaptation are currently major challenges in the establishment of a new form of development. In this respect, there is background information from recent years, together with theoretical proposals, which it seems worth compiling. For analytical reasons, we shall first present a sequence of reforms for the macroeconomic area, and then another sequence for the institutional area, followed by an analysis of the interrelations between them.

28 CEPAL REVIEW No. 48 / December 1992
The macroeconomic sequence would begin with a recessionary adjustment and stabilization, followed by a recovery in the level of activity which would subsequently be transformed into true growth, culminating in the distribution of the latter’s benefits. 'Die adjustment involves the classic measures already referred to for controlling domestic demand. It should make it possible both to cope with external payments and at the same time reduce inflationary pressures. Once this has been achieved, progress could be made in recovery, on the basis of the factors of production which were not destroyed but remained unused during the depression in the previous stage. In order for this recovery to be viable, however, it must be led by export growth or, in the absence of this, promoted through the inflow of capital; otherwise, a situation of strangulation could arise at the level of the balance of payments due to payments for external financial services or to the foreseeable recovery of imports, once the lowest point in the depression has been overcome.
When a situation of almost full employment of the existing resources is reached, the next step is growth based on the extension of production capacity through capital accumulation and the incorporation of technological progress. In order for the necessary increase in investment to take place, this stage would require a high rate of (external or internal) saving and the prospect of high profitability for capital, so that it would be advisable to postpone significant improvements in wage-earners* income. This latter element would be in keeping with a scheme in which exports form the dynamic nucleus: it would provide a “spurious” but nevertheless initially very useful form of competitiveness, avoid pressures on trade in basic consumer goods (by maintaining exportable surpluses or avoiding higher imports) and, in view of the subordinate place occupied in the growth strategy by the domestic market for such goods, it would not affect overall growth.
Finally, the growing prosperity would extend to ever-wider social groups, both through the progress that private enterprise would make towards true competitiveness which would enable it to improve wages, and through the action of the State, which would have more resources for tackling poverty and expanding social expenditure, as well as for the necessary incorporation of new technologies (expenditure on education, in particular). There will naturally be some overlapping of the various phases in
this sequence, which all form part of an overall strategy. In particular, many of the measures of a structural or institutional nature will begin to be applied from the start and will aim to plot courses for long-term development; they are often carried out gradually and extend over various stages of the macroeconomic sequence. This does not do away with the distinction between successive stages, emphasized by the reluctance of economic policy designers and the political authorities to “anticipate” reactivation before they consider that the stabilization process has been consolidated or to permit recovery of wage levels before achieving sustained growth.
In the area of structural and institutional reforms, some measures seem to be the subject of clear consensus, at least among the governments of the region. These measures are greater trade openness, deregulation of markets for goods, greater labour flexibility, and redimensioning of the State, especially through the privatization of public enterprises. Deregulation of financial systems and liberalization of capital flows from abroad could also be added to this list, albeit perhaps with a somewhat lower degree of consensus.
The most appropriate sequence for these reforms is a question which does not yet seem to have been settled. Studies carried out or sponsored by the World Bank in the 1980s (Choksi and Papagiorgiou (eds., 1986) propose the following sequence: i) achieve fiscal discipline; ii) deregulate the labour market;iii) liberalize trade in goods, including international trade; iv) liberalize the domestic financial market, and v) liberalize capital flows to and from the exterior. This sequence would reduce the risk that liberal reform processes might result in unsustainable imbalances, as occurred in the Southern Cone of Latin America in the early 1980s.
However, the structural reform processes as they have actually been taking place in reality seem to take advantage of available circumstances which are favourable for certain reforms, regardless of their place in a hypothetical planned sequence. Indeed, the action of the multilateral agencies themselves, which have furthered these reforms through their conditioned financial aid, has been directed towards promoting general liberalization at all levels without trying to establish any particular sequence. Moreover, sometimes these agencies have approved measures which are in contradiction to the first- named point, such as assumption by the State of

IN SEARCH OF ANOTHER FORM OF DEVELOPMENT / P. Sámz and A. Calcagno 29
private external indebtedness and maxi-devaluations, which have considerably affected the fiscal situation in most of the countries.
Consequently, in the area of structural reforms there does not appear to be any clear desirable sequence, although the application of the central measures is easier or more advisable during some of the stages in the macroeconomic sequence. Thus, greater flexibility in the labour field is facilitated during the recessionary adjustment, when it may be presented as a solution to unemployment and the trade unions are in a weakened state. Trade and financial openness, for their part, may act in support of the stabilizing efforts in the same stage, in the first case by discouraging price rises and in the second one by favouring freezing of the exchange rate. However, this combination (delay in adjusting the exchange rate, external competition, economic depression) may be too severe for broad sectors of production, in which case it would be less costly and more sustainable to progress with trade openness in a context of economic reactivation. Another basic reform for this form of development, namely, privatization processes, will play different roles in different stage of the process: during stabilization, they will provide fiscal resources at a time of low economic activity and hence low fiscal revenues, though these resources will be substantially smaller than those that would be received in a context of recovery or growth.
The question of the sequence to be followed raises a number of other queries in addition to those already noted. In the countries which have advanced furthest in the reform process there are still some doubts regarding the final achievement of changing production patterns with equity. What has been observed so far in these countries is a worsening of the situations of inequity, and there is a risk that a form of development which has not been aimed at social integration right from the start will consolidate a profoundly heterogeneous economy and society, instead of leading to the progressive uniformity of conditions of production and living.
In the other countries, this doubt is further compounded by other unknown quantities, because of the different economic structures and changes in the international situation. In particular, it is by no means clear that in these countries the sequence followed by the nations which have advanced furthest in the process will give the same fruits as regards the external
and fiscal balances. Since, in the countries which are least advanced in the reform process (unlike the cases of Chile and Mexico), expansion of exports and of fiscal revenue are generally not linked, the stabilization stage presents greater difficulties: if there is recession, it is very difficult to increase fiscal income, yet without such recession it is not possible to generate a trade surplus to overcome the current account deficit of the balance of payments. When priority has been given to the achievement of trade surpluses in such countries through a recessionary adjustment, this has given rise to an expansion of the money supply which it has not been possible to absorb with a fiscal surplus, thus aggravating inflationary pressures. The sale of domestic public debt instruments has represented a short-term palliative, but it has given rise to growing financial costs. Thus, in these countries not only were the conditions for an external surplus opposed to those for a fiscal surplus, but the effects of the former made the prospects of the latter ever more distant. The greater availability of foreign capital which exists in the 1990s (including increased recourse to involuntary financing)10 opens up the possibility of changing the sequence in question: to some extent, it would make it possible to combine reactivation with the adjustment by balancing the fiscal accounts with greater tax revenues and absorbing the trade surplus in advance. It is equally true, however, that an excessive inflow of capital may worsen monetary tensions and depress the real exchange rate.
10 Prudence is called for, however, in appraising lhe likely persistence of Ihese capital flows. They have been due both to domestic and external factors, some of which may only be of a temporary nature. Among the domestic factors are certain opportunities for windfall gains opened up by the privatization processes, the recovery of the stock exchanges and the relatively high interest rates, in dollar terms, in a context of widespread “exchange lag". Among the external factors are the United States recession and the efforts made to relieve it by the reduction of short-term interest rates. The domestic factors referred to may be exhausted quite naturally; at some time the most interesting public assets will have been sold, the recovery on previously depressed stock exchanges will have been completed, and there may he an exchange risk which will make domestic interest rates less attractive. With regard to the low United States interest rates, the likelihood of their persistence is an unknown quantity, in view of the disparities between short and long-term rates in that country and between the United States and European short-term rates, together with the persistence of imbalances in the federal budget of the United States.
30 CEPAL REVIEW No. 48 1 December 1992
Ultimately, the great challenges which must be faced in this reform process consist of the establishment of links between the timetable and scope of the reforms, on the one hand, and the international situation and the features of the national economies on the other.
2. The export process
As already noted, the expansion of exports will be called upon to play the role of the motor of growth, by filling the vacuum left by the contraction in mass domestic consumption. In addition to increasing imports, greater domestic competitiveness should be promoted. The challenges faced by this strategy are different from one country to another, depending on the type of specialization, the degree of progress made in introducing the new form of development, and the situation of each country vis-à-vis the changes in the international context.
In the countries which have advanced furthest in the new form of development, the inflow of capital has meant a good deal of relief for their external and fiscal accounts but has at the same time introduced tensions into their economic policies which affect the export strategy.
In these first years of the 1990s, Mexico has received over half the total net inflow of capital into the region (US$28.5 billion in 1990-1991, of the total of US$54.5 billion received by Latin America). Thanks to this inflow, it has been able to cover a growing current deficit and at the same time build up its international reserves. An outstanding feature of this evolution is the growth of the trade imbalance: between 1987 (the year in which there was marked opening-up of trade) and 1991, imports of goods grew by 207% in value terms, while exports only increased by 31%, and over this period of time the country went from a merchandise trade surplus of US$8.4 billion to a deficit of US$10.4 billion. An element which is by no means alien to this evolution is the persistent lag in the real exchange rate since 1987 (table 14), This evolution, made possible by the inflow of capital, has been associated with an active “crawling peg” policy designed to control inflation. Although the prospects for Mexican exports are favourable in view of the growth of investments and the free trade agreement with the United States and Canada, it will be necessary to evaluate the compatibility of this exchange policy and these capital
movements with the role of the motor of growth assigned to exports.
In the case of Chile, also, since 1988 there has been a progressive lag in the rate of devaluation with respect to the difference between domestic and international inflation (table 14); here, too, the inflow of capital has played a major role in this evolution. In Chile, however, the relative lag is much smaller than that registered in Mexico, there has been no interruption in the expansion of exports, and the trade balance continues to be positive, all of which might lead to doubts whether there really is an “exchange lag”. Nevertheless, however, it still raises a dilemma for economic policy. If the interest rate is reduced in order to discourage the inflow of capital, the economy may overheat; if this is not done, this will tend to depress the real exchange rate unless the government takes measures to support it -as it has indeed done to a certain extent- through the accumulation of reserves, which leads to expansion of the money supply or domestic public indebtedness greater than were desired. Ultimately, either inflationary pressures are generated, or the State ends up by simultaneously accumulating external assets and domestic liabilities -through which it absorbs the money issue- paying much higher interest rates on the latter than the rates it receives in respect of the former.
Another question which is probably more decisive for the development strategy is the composition of Chilean exports. At the present time, the government shows some interest in gradually modifying the specialization in primary commodities by incorporating products making more intensive use of skilled labour and with higher technological content, which give rise to more positive effects on the productive system, preserve the environment more effectively, and are less vulnerable to the deterioration of the terms of trade. The question here is to what extent the current macroeconomic circumstances -especially the tendency towards a progressive lag in the level of the exchange rate- are favourable to this diversification, especially in the absence of a selective export promotion policy.
For the other countries of the region, the export strategy raises even more fundamental queries. Above all, it may be asked whether the motive force presented by exports is not too small or too partial to propel certain countries along the path of sustainable and harmonious development, or, in other terms, to what extent the cases of new forms of incorporation

IN SEARCH OF ANOTHER FORM OF DEVELOPMENT / P. Sáinz and A. Calcagno 31
Table 14
LATIN AMERICA (FIVE COUNTRIES): TRENDS IN REAL EFFECTIVE EXCHANGE RATES a
(Indexes: 1987=100)
Countries 1987 1988 1989 1990 1991b
Argentina (WPI) 100 93 102 96 88(CPI) 100 108 134 96 65
Brazil (WPI) 100 90 75 64 78(CPI) 100 91 74 62 70
Chile (WPI) 100 116 108 114 107(CPI) 100 105 99 102 96
Mexico (WPI) 100 83 80 80 72(CPI) 100 81 75 73 65
Peru (CPI) 100 114 76 56 46
Source: ECLAC.8 These are averages of the effective exchange rates for exports and imports, calculated on the basis of the wholesale (WPI) or consumer
(CPI) price indexes. For Mexico, the free exchange rate was used. b Provisional figures.
in the external economy referred to earlier (Mexico and Chile) are models that can or should be imitated by other Latin American countries.
Economic integration with the United States and Canada, after the style of Mexico, may seem a natural form of evolution for Central American and Caribbean countries which already have a large part of their trade concentrated on the United States. In some of them, substantial outward-looking assembly industrialization is being developed. Although this gives rise to profound changes due to the boost it gives to the formation of local businessmen and a trained labour force, however, it has only limited effects on the productive system as a whole and can hardly develop structural or systemic competitiveness on its own. Indeed, one of the main “exports” of these countries to the United States consists of their own citizens who enter that country legally or illegally, giving rise to financial movements and demographic, cultural and political phenomena of considerable proportions.
Other countries, such as the members of m e r c o s u r and Chile, do not have such close links with the United States, since their trade is much more diversified. For these countries, the most important trade development potential may not be with the
United States, which in many lines of production is a competitor rather than a potential purchaser, whereas, in contrast, there are interesting prospects for developing trade among themselves. On the other hand, neither can an export approach based on the Chilean model -that is to say, an effort to base economic growth on rapid expansion of natural resource-based exports- be viewed as a model applicable to all situations, Even in the light of the substantial qualitative effects that expansion of exports may have, it is doubtful that exports can make up for sluggish domestic demand, especially in the larger countries of the region. Moreover, for a number of countries this specialization would represent a reversal of the diversity and complexity of the products exported (figures 4 and 5 show the cases of Brazil and Argentina).
A second query concerns the linking up of policies of greater openness and stabilization, which is a particularly delicate matter for countries which are passing through the first stages of the sequence examined earlier. In some countries, stabilization policies have resorted to deliberate lags in the real exchange rate, while in others (or the same countries also), the inflow of foreign capital has worked in the same direction. Thus, trade openness may give fewer

32 CEPAL REVIEW No. 48 / December 1992
Figure 4 Figure 5
BRAZIL: EVOLUTION OF EXPORTS,1970,1980 AND 1989
ARGENTINA: EVOLUTION OF EXPORTS,1970,1980 AND 1989
(Billions o f dollars) (Billions o f dollars)
Medium- and high-technology manufactures
Low-technology manufactures
N atu ral-resourc e-in tensive manufactures
Foodstuffs and raw materials
1970 1980 1989“I----------------1----------------1----------------r
10000
Medium- and high-technology manufactures
Low-technology manufactures
N a tu ral-res ou re e-in tensivemanufacturesFuels
Foodstuffs and raw materials
1970 1980 1989
Source: Estimates on the basis of primary data from the Latin American and Caribbean Externa) Trade Data Bank (BADECEL). Statistics and Projections Division, ECLAC
Note: The classification was effected on the basis of the Standard International Trade Classification (SITC) at the three-digit level, in line with the criteria used by ECLAC in El comercio de manufacturas de América Latina: Evolución y estructura 1962-1989 (LC/R.1056, Santiago, Chile, September 1991) and in Intraindustry Trade: a Comparison between Latin America and some Industrial Countries (LC/R. 1101, Santiago, Chile, Statistics and Projections Division, November 1991).
Source: Estimates on the basis of primary data from the Latin American and Caribbean External Trade Data Bank (BADECEL). Statistics and Projections Division, ECLAC
Note: The classification was effected on the basis of the Standard International Trade Classification (SITC) at the three-digit level, in line with the criteria used by ECLAC in El comercio de manufacturas de America Latina: Evolución y estructura 1962-1989 (LC/R.1056, Santiago, Chile, September 1991) and in Intraindustry Trade: a Comparison between Latin America and some Industrial Countries (LC/R. 1101, Santiago, Chile, Statistics and Projections Division, November 1991).
fruits than expected, or they may be different from what was hoped for. At least initially (except under truly even-handed integration agreements), for the Latin American countries greater openness means reducing their own tariff and para-tariff barriers to imports, without expecting the same thing to occur in their main markets, which on the contrary often apply protectionist policies. The effects of unilateral openness on exports are not clear. In order for expansion of exports to be of a sustained nature and to have a favourable effect on the organization and technological level of the economy as a whole, it must be based on growing “systemic” competitiveness. This, for its part, calls for a considerable investment effort, not only in specific export-oriented areas
of production, but also in the infrastructure, training and research, all of which requires deliberate and persistent public policies, which cannot be guaranteed to continue (especially in the stage of adjustment and stabilization), as well as time to bear fruit.
With regard to imports, their effects on the domestic production with which they compete may be excessively abrupt and intense. It must not be forgotten that most of the countries have passed or are still passing through a prolonged period of low investments in both physical capital and human capital. It must not be forgotten either that domestic enterprises -particularly small and medium-sized ones- usually have difficulty in gaining access to credit (especially long-term credit at moderate rates); that they

IN SEARCH OF ANOTHER FORM OF DEVELOPMENT IP. Sâinz and A. Calcagno 33
generally cannot rely on dynamic domestic demand which will allow them to operate on a more profitable scale; that they frequently do not enjoy the support of public industrial policies and protection against dumping, and that in some cases a depressed exchange rate deprives them of external markets and makes them even more vulnerable at the domestic level. Such conditions, which are rendered even more acute by recessionary adjustment policies, mean that opening up to imports may have the opposite effect to that desired, which is to raise the average productivity of the economy. Thus, it may cause the closure of industries which would have been viable in less adverse conditions, long before its possible positive effects on systemic competitiveness begin to show themselves. This would mean the loss of physical and human capital which it had taken decades to form, the disorganization of inter-industry relations, and the forced transfer of labour to informal services where workers will have a level of productivity much lower than the previous one, even if the latter was itself not totally satisfactory.
Finally, the exchange lag caused by the stabilization policy could affect the international insertion strategy by making the impact of imports more abrupt and immediate and causing the improvements in competitiveness on the export side to be slower and more hypothetical. Such improvements in any case require a substantial length of time to show themselves, at least if systemic competitiveness is sought. At the same time, the deterioration that would be caused in the trade balance could complicate stabilization efforts: dependence on a possibly unstable capital inflow would be heightened, and pressures could reappear in the exchange market. There would then be a danger of a resurgence of inflation due to the recovery in the real exchange rate, and/or the need for a new recession in order to restore the trade balance. The whole process of recovery and growth would be affected, and the redistributive stage would be put off once again.
3. The accumulation process
A central challenge in connection with economic growth is the recovery of capital accumulation after a number of years of low investment and even net disinvestment in productive, social and infrastructural sectors. Such recovery is indispensable, whatever the form of development chosen, and in many areas
the type of investment needed is not even specifically linked to a particular type of development. Thus, the steps needed in order to achieve structural competitiveness are no different from those needed for integrated development; the specific investments needed for creating export capacity in a given area are quite small compared with the total investments that a country must make under any development scheme (regardless of whether it is more outward- looking or more directed towards the domestic market): i.e., investments in the areas of energy, transport infrastructure, telecommunications, education, health, housing, research, basic industries, etc. The challenge is to find a way of restoring this investment within the selected form of development, although the latter has largely taken away the previous accumulation mechanisms, reducing in particular the function of the State and the public banking system (or a private banking system which followed public guidelines) in this field.
A situation like the present one offers new opportunities for private activity and profit: the transfer to the private sector of activities which are no longer considered public services; new forms of access to natural resources, through abandonment of the principle of State ownership of the subsoil and water resources; and indeed the long-standing postponement of public investments itself, which may mean that there are now big profits to be made through investment in some areas. Naturally, however, the attractiveness of these opportunities will be influenced by the perceived likely success or failure of a sufficiently dynamic external insertion process.
However, these opportunities do not always increase the accumulated capital in the country. In contrast, some of them may cause the strategies adopted by the main enterprises to be based more on expansion by taking advantage of transfers of wealth rather than on the establishment of new production capacity; this would be so, for example, in the case of the privatization of enterprises or resources currently in the hands of the State. On the other hand, the opportunity for private profit may be offset by other factors. One of them is deterioration of the physical infrastructure as well as of the educational and health systems. Such shortcomings adversely affect the development prospects of the country and undermine its competitiveness, so that there would appear to be a complementary relationship between recovery in

34 CEPAL REVIEW No. 48 / December 1992
public investment (not based on calculations of shortterm profitability) and private investment.
This would make it necessary to review the restrictions on non-finandal public expenditure which have characterized the recent evolution of most of the countries of the region. In order to achieve this without generating or increasing a fiscal deficit which it will be very difficult to finance, it will be necessary to increase fiscal income, and this may be strongly resisted, especially in situations of recession. Another obstacle to recovery of previous levels of investment is the virtual disappearance of development credit in a number of countries: it is by no means easy for long-term financing to arise spontaneously out of banking activities which are currently aimed at shortterm operations. Here, there would be an obvious role for the public banking system, but this would not only run counter to the monetary programmes applied in countries which are still seeking to achieve or consolidate relative price stability, but would also be out of keeping with the central options of the form of development. In some countries, efforts are being made to revitalize the financial markets as a means of financing enterprises, but the instruments available on such markets are only accessible to the biggest and most important economic agents, and even these are sometimes reluctant to resort to forms of financing which mean opening up their share capital.
An important aspect is that of the cumulative effects that could be caused by a gradual recovery in accumulation or, alternatively, the slowing-down or halting of the decline in investment. One of the factors which can have most influence in possibly slowing or halting this decline is the “wait and see*’ behaviour of businessmen: until they see a sustained growth trend which will bring them close to their installed production capacity, they will be reluctant to immobilize capital in the area of production (except perhaps in exploiting natural resources for export), preferring financial investments inside or outside the country. Thus, economic activity will continue to be depressed, and this will have a negative impact on fiscal income, thereby in turn making it more difficult to secure a recovery in public investment. Conversely, the resumption of the accumulation process may have positive effects on activity in general, on public income and investment, and on the behaviour of a business sector which to some extent lacks the will to invest although it has the necessary resources for this (table 5).
With regard to the resumption of the accumulation process, it may perhaps be insufficient -or at all events inefficient- to expect a spontaneous change in private sector behaviour, even in a relatively stabilized situation. Nor does it seem either sufficient or desirable to seek the recovery of investment through policies aimed at increasing private saving by raising real interest rates or making income distribution even more regressive. The Latin American experience suggests that such measures would not only not be effective in increasing saving,11 but would also aggravate what appears to be the main problem: i.e., the materialization of private investment which, in a number of countries, is generally speaking not currently constrained by a shortage of domestic saving or accumulated financial resources.
In short, the recovery of investment in the new form of development is by no means a relatively spontaneous phenomenon but will require an active yet different approach on the part of the public sector.
4. The challenge o f equity
Elsewhere in this article, emphasis has been placed on the importance of political factors both for dismantling the previous form of development and for making possible the installation of a new one. Such a new form of development will necessarily have to reproduce the political conditions for its functioning. From this point of view, special importance is assumed by the results it generates in terms of equity and the magnitude of poverty.
The features which have so far characterized the new form of development have aggravated inequity and poverty, which were already serious in the region, despite the dynamic growth and the efforts at social incorporation registered in the post-war decades. In recent years, there has been further accentuation of the concentration of income, wealth, consumption and economic power. Not only has there been unequal distribution of the costs of the crisis: if this were the only problem involved, the phenomenon would be limited to the duration of the latter. At a more fundamental level, however, the
11 See Massad, 1991. Studies which analyse the experience of other regions, both developed and developing, also highlight the feeble (or even negative) effects of higher interest rales on global saving. See Bouillot (1988) and Lee (1991).

IN SEARCH OF ANOTHER FORM OF DEVELOPMENT / P. SâtnzatidA. Calcagno 35
redefinition of the relations between capital and labour, between the private and public sectors, between the logic of the market and that of public service, between the financial and the real sectors, and between the outward-oriented sectors and those aimed at the domestic market have weakened the previous mechanisms of social incorporation and increased the heterogeneity of Latin American societies.
The challenge raised by inequity does not occur in the same terms in all countries. In the case of those which have advanced furthest in the new form of development, it is a question of seeing whether the deterioration in equity is reversible, and if so, by what means and in what spaces of time. For those which are in the first stages of the process, it is a question of seeing whether the aggravation of inequity can be avoided in the selected scheme of development, and if not, whether it can be tolerated within a democratic political framework.
In the first group of countries, the problem of inequity is severe. In Chile and Mexico, the functional distribution of income displays a marked decline in the share of wage-earners (table 8), consistent with the prolonged depression of real wages (figures 6 and 7). Likewise, examination of the distribution of consumption in Greater Santiago between 1968 and 1988 shows marked and growing concentration in the richest households, which are the only ones that improved their position over these 20 years. Moreover, an analysis by quintiles shows that in 80% of households, the poorer the family groups in question, the more serious the deterioration in their consumption in both relative and absolute terms (table 15). The seriousness of the situation may also be noted from the large proportion of the population of these countries living under the poverty line and the increase which this proportion is estimated to have registered in the 1980s, although comparable estimates for the end of the decade are not yet available for Mexico (table 16).
In a context of recovery and growth of the product, there will be forces that will tend more or less spontaneously to improve the situation of sectors adversely affected during the previous stages of the process of stabilization and reform. Among these “re-balancing” forces, mention may be made of the effects of stabilization on recipients of wages and pensions, who are generally left behind in periods of high inflation. An influence in the same direction is exerted by the reduction of unemployment, which
has favoured partial recovery of real wages in Chile (although not yet in Mexico). The scope of these tendencies may be limited, however, and in particular they may not reach the most underprivileged sectors which are excluded from the formal economy. At the same time, other forces may act in an opposite direction, and the dynamics of inequality itself may generate still more inequality. In particular, with the contraction in the social action of the State there is increasingly clear evidence of the existence of one type of education and health services for the poor and another for the middle and high income groups, with radically different quality and coverage; such evolution tends to aggravate and perpetuate conditions of social inequity. Likewise, the growth of informal employment compared with jobs in the public service and in industry tends to establish a new and predominantly urban form of marginality. Family groups which sink into this situation for prolonged periods tend to lose the background of training and socialization gained in the post-war decades.
When all is said and done, it does not seem that improvement in equity can be left to the spontaneous evolution of the form of development. This would appear to be the purpose of many social programmes which are being put into effect in Chile and Mexico. In Mexico, for example, a National Solidarity Programme is now in operation, while in Chile the democratic government has introduced tax reforms to finance greater social expenditure and has raised the minimum wage. The first results, in the case of Chile, show a slight reduction in the inequality of household income distribution (table 15). Here, a small reduction in the share of the richest quintile has made possible a by no means insignificant improvement in the income of the other sectors, especially the poorest households, although in fact this only means that the bottom quintile is now receiving 4.9% of total income instead of 4,6%. These amounts suggest that there is ample room for improving the situation of the underprivileged majority of the population at only modest cost to the wealthy classes, but it also indicates that at the present rate it will take many years to rescue a substantial part of the population from poverty. In order to avoid the crystallization of a dual society, progress in income distribution should be accompanied by an effort to improve the quality, coverage and homogeneity of public education, health, housing and social security services, thereby reversing to some extent the trends of recent years.

36 CEPAL REVIEW No. 481 December 1992
Table 15
CHILE: DISTRIBUTION OF CONSUMPTION AND HOUSEHOLD INCOME(Percentages)
Quintiles
Consumption
Distribution in Greater Santiago Variation at constant values
1968 1978 1988 1978/1968 1988/1978 1988/1968
I (poorest) 7.6 5.2 4.4 -37.6 -7.4 -42.3II 11.8 9.3 8.2 -28.1 -3.6 -30.7III 15.6 13.6 12.7 -20.5 2.1 -18.8IV 20.5 20.9 20.1 -7.0 5.2 -2.2V 44.5 51.0 54.6 4.5 17.1 22.4
Total 100.0 100.0 100.0 -8.8 9.4 -0.3
Household income
Distribution at national level Variation in real income
Sep.-Nov. 1989 Sep.-Nov. 1990 Sep.-Nov. 1990/Sep.-Nov. 1989
I (poorest) 4.6 4.9 6.7II 8.0 8.3 3.9III 11.3 11.5 2.0IV 16.6 17.1 3.2V 59.5 58.2 -2.0
Total 100.0 100.0 0.2
Source: National Statistical Institute (INE), Santiago, Chile, and ECLAC.
Figure 6
CHILE: EVOLUTION OF REAL WAGES
1970-1991 (1970 = 100) 1982-1991 (1982 = 100)
Wages in the construction sector
Source: ECLAC and PREALC, on the basis of official data and figures supplied by the Chilean Chamber of the Construction Industry.Note: The index of average wages and salaries (base April 1959) in figure 6-A is not comparable with the index of average remunerations
(base December 1982) in figure 6-B.

IN SEARCH OF ANOTHER FORM OF DEVELOPMENT IP. Sáitiz and A. Caicagno 37
Figure 7
MEXICO: EVOLUTION OF REAL WAGES, 1978-1991
(Indexes: 1978=100)
In the light of these experiences and in a somewhat different international context, the question that arises for the countries which are in the first stages of this process of reforms is whether it is possible to avoid or reduce the costs paid by the pioneering countries in terms of greater inequity. The fact is that in many of them income distribution is markedly more inequitable than one or two decades ago; reducing equity still further or even putting off an improvement in this respect until the last (and in any case hypothetical) stage of the process of economic change may endanger social stability and even longterm economic success, for the exclusion of a substantial part of the population from modern forms of life and suitable education and training not only undermines social cohesion but also reduces the possibilities of authentic competitiveness (or, if preferred, integrated development) of the countries in question.
In this connection the lower pressure for the transfer of resources abroad (because of the decline in international interest rates, debt reduction agreements, the inflow of private capital, and unilateral failure to keep up the external debt service) would appear to increase the leeway for economic policy management. As already noted, this would make it possible to put into effect an “adjustment with growth”: that is to say, an economic policy which takes advantage of the positive effects of economic
Table 16
CHILE AND MEXICO: MAGNITUDE OF POVERTY
(Percentages)
YearHouseholds in a state of
poverty a
Households in a state of indigence b
Chile 1970 17 31987 38 131990 35 11
Mexico 1970 34 121984 32 10
Source: ECLAC, on the basis of household surveys of the countries.
* Percentage of households whose income is less than twice the cost of a basic food shopping basket (includes the households in a state of indigence).h Percentage of households whose income is less than the cost of a basic food shopping basket.
recovery on fiscal revenue and the overall productivity of the economy by bringing the various sectors of production closer to full use of their installed capacity and putting them in a better position to progress with their modernization. Naturally, the orientation of reactivation and subsequent growth will depend on whether the present form of income distribution is maintained or changed and on the (progressive or regressive) means by which it is sought to improve government income.
Is it possible, as well as desirable, to apply an economic policy aimed at improving equity without further delay? On the one hand, when the share of wage-eamers, in the gross domestic product is only around (and sometimes even below) 30%, this reflects a basic macroeconomic and social imbalance which depresses and distorts domestic markets and discourages the pursuit of genuine competitiveness; such values not only correspond to levels far below the past figures for the region, but are also only about half those corresponding to the developed countries. Correcting this imbalance would appear to be both socially and economically necessary, although probably not always simple in political terms. On the other hand, the tax burden in Latin American and Caribbean countries is relatively low in comparative terms, especially with regard to the more progressive taxes. Here, too, governments can follow the Chilean and Mexican example and seek the,

38 CEPAL REVIEW No. 481 December 1992
“nationalization” of natural rents, which have played such an important part in stabilization and macro- economic management in those countries. It may be considered, then, that there is ample room for balancing the fiscal accounts without reducing -or even while increasing- public social expenditure and expenditure on the infrastructure. Such approaches would certainly give renewed vigor to domestic markets, especially for mass consumption goods, more rapidly than could be expected from the “model” sequence of economic reforms, for in this case, recovery, modernization and economic growth would not be propelled only by exports.
Naturally, in so far as governments tackle the challenges before them (especially that of equity) by making substantial changes in the process underway, this could lead to the establishment of a form of development different from the proposal examined in this article. Indeed, this is the central concern of the e c l a c Secretariat, which, especially in its documents entitled Changing production patterns with social equity and Equity and changing production patterns: an integrated approach, proposes a different form of development in which the process of modernization of production is widely extended and a central role is assigned to equity ( e c l a c , 1990c and 1992).
Bibliography
Bouillot, Isabelle (1988): Economie réelle et sphère financière, report to the Economie and Social Council, Journal Officiel de la République Française, November.
Choksi, Armeane and Demetris Papageorgiou (eds.)(1986): Economie Liberalization in Developing Countries, Cambridge, MA, Basil Blackwell.
ECLAC (Economic Commission for Latin America and the Caribbean) (1985): Change and crisis: Latin America and the Caribbean 1950-1984, Crisis and Development: the Present Situation and Future Prospects of Latin America and the Caribbean (LC/L. 332 (Sem. 22/3)), vol. I, Santiago, Chile, April.
(1990a): Latin America and the Caribbean. Optionsto Reduce the Debt Burden (LC/G. 1605 (SES. 23/5)), Santiago, Chile, March.
(1990b): Ajuste macroeconômico y finanzas públicas.Chile: 1982-1988, Serie Política Fiscal, No. 6 (LC/L. 566), Santiago, Chile, July.
(1990c): Changing Production Patterns with SocialEquity (LC/G. 1601-P), Santiago, Chile, March.
(1991a); La equidad política: marco conceptual,nudos críticos y líneas de acción (LC/R. 1093), Santiago, Chile, Social Development Division, December. (1991b): Intraindustry Trade: a Comparison Between Latin America and some Industrial Countries (LC/R. 1101), Santiago, Chile, Statistics and Projections Division, November.
(1991c): El comercio de manufacturas de AméricaLatina. Evolución y estructura 1962-1989 (LC/R, 1056), Santiago, Chile, September.
(1992): Social Equity and Changing Production Patterns: an Integrated Approach (LC/G. 1701), Santiago, Chile, February.
IMF (International Monetary Fund) (1985); Summary Proceedings, Annual Meeting 1985, Washington,D.C., October.
Lee, Jungsoo (1991): Financial sector and economic development: a survey, Economic and Development Resource Center Report Series, No. 55, Asian Development Bank, September.
Massad, Carlos (1991): El financiamiento del desarrollo industrial en un continente empobrecido, Industrialización y desarrollo tecnológico, Informe No. 11 (LC/G. 1682) Santiago, Chile, Joint ECLAC/UNIDO Industry and Technology Division, August.
Pérez, Carlota (1991): National System of Innovation, Competitiveness and Technology, Santiago, Chile, Joint ECLAC/UNIDO Industry and Technology Division, May.
Reisen, Helmut and Axel von Trotsenburg (1988): Developing Country Debt: the Budgetary and Transfer Problem, Paris, Organization for Economic Cooperation and Development (OECD).
Stewart, Frances (1992): Protecting the Poor During Adjustment in Latin America and the Caribbean in the 1980s. How Adequate Was the World Bank Response?, Development Studies Working Papers, No. 44, Turin, Italy/Oxford, United Kingdom, Centro Studi Luca d’Agliano/Queen Elizabeth House, June.

CEPAL REVIEW No. 48
A new international industrial order
M ichael M ortim ore*
There can be little doubt that the present international order, especially in the field of industry, is markedly different from that which existed at the beginning of the century, and even from the order existing after the last war. This new order is distinguished above all by the extraordinary intensity that international competition has assumed in it; by the fact that primarily it only involves a few thousand wortd-scale transnational corporations operating in half a dozen technologically advanced industries and another half dozen which are in full process of restructuring; by the fact that Its interest is centered on three markets (the United States, the European Economic Community and Japan), which together make up what is called “the Triad”; and by the fact that the power relations between the countries and the transnational corporations are in a process of continuous and ever more rapid change.
The most important changes are to be seen in the tendencies towards globalization and specialization which are clearly evident in international trade, and the trends towards globalization and regionalism which mark foreign direct investment. The reordering which has taken place within the Triad has placed the transnational corporations of Japan at its head, mainly at the expense of the United States transnationals.
•Specialist in transnational corporations in the Joint ECLAÇ/DESD Unit on Transnational Corporations.
IntroductionThe twentieth century has witnessed some of the most dramatic and traumatic upheavals in world history, yet toward the end of that century a broad consensus is taking shape with regard to the central features of the contemporary political economy. On the economic plane, it has become apparent that ‘the market’ is seen as the appropriate instrument for brokering competing interests. On the political plane, representative democracy is seen as the appropriate means for choosing between different political orientations. On the social plane, things are not as clear, however, it is evident that self-help is displacing governmental social welfare schemes. Common to all these elements of the growing consensus is the central fact that competition, in general, is being both heightened in intensity and channelled through mechanisms designed to reduce violent outcomes.
This new consensus is partly the result of the new power relations which have been taking form. In terms of international relations, the East-West and North-South dimensions of conflict have been resolved through abandonment due to the implosion of the Soviet bloc and the apparent dissolution of the Southern one. The new key issues in international relations are now those involving the new Triad of power, that is, the United States, the European Economic Community and Japan, which account for two- thirds of world g d p , four-fifths of outward stocks of foreign direct investment, and over two-thirds of world trade (C T C , 1991b, pp. 12 and 19). At the national level, the new power relations affect both the private and public sectors, leaving a clear sensation that business has increased its share of power and that the public sector’s influence has declined. The nature of the business/government relation is central, in distinct ways, to the dynamic of each Triad member (Ostry, 1990a).
A central part of this new consensus has been transmitted to the rest of the world in the form of the “Washington consensus” or the “Bank/Fund orthodoxy”, named after the constantly evolving influence of the World Bank and the International Monetary Fund.1 The principal aspects of that
1 The Economist, 1991b. A US official publication speaks of “a ‘market-friendly’ approach to development” in referring to the World Bank (Business America, 1991, p. 11).

40 CEPAL REVIEW No. 48 /December 1992
orthodoxy concern non-inflationary macroeconomic policy based on modest budget deficits and prudent monetary policy; greater openness to trade and foreign investment; and greater reliance on market forces as allocators of resources, especially in industry and agriculture.
An important phenomenon which has made itself evident towards the end of the twentieth century is the transnational corporation (TNC)-centric nature of the changes taking place. The transnationalization process (c t c , 1989) is manifest in the growing role of “global** t n c s (Ostry, 1990a) in most aspects of the contemporary international political economy. In 1985, just 600 t n c s , each with sales in that year greater than U$1 billion, were responsible for one- fifth of total (non-socialist bloc) industrial and agricultural value added. Their primary lines of business (as measured by sales) were concentrated in the petroleum (24.6%), machinery and equipment (24.5%), chemical (13.5%) and motor vehicle (12.6%) industries. More to the point, in 1986 ten of these tn c s controlled 66.2% of the world semiconductor market, nine others accounted for 89% of the world telecommunications market, and ten had an unspecified but majority share of the world computer market (c t c , 1989, chaps. II and III).
tn c s increasingly dominate international trade and investment flows, and an increasing proportion of such flows are becoming essentially internal operations of expanding global networks. Effectively, the “most recent decade was marked by increasing economic interdependence and globalization of markets through a rapid acceleration of trade and investment flows, the creation and diffusion of new technologies, the explosive growth of capital markets and financial market integration, and the conduct of business operations on a world-wide basis ... The prime actons in this globalization process obviously are multinational firms, through their waves of investment and corporate linkages, which allow them to operate on a worldwide basis” (Smeets, 1991, p. 57). As well as provoking greater inter-TNC rivalry, the high expenditure necessary to keep a t n c on the leading edge of technology paradoxically is fomenting the formation of a kind of strategic alliance referred to as “technoglobalism”, that is, new forms of international networking among t n c s in respect of research and development and technological matters (Ostry, 1991, p. 3).
The common denominator of all these changes has been heightened competition and increased concern for the rules of the game. The new competition has not affected all countries, industries or firms equally. In somewhat oversimplified terms, a handful of innovating Japanese-based firms operating in the automotive, semiconductor/computer, consumer electronics, office equipment, machine tools and other sectors have shocked their US- and European-based counterparts by overwhelming their world market positions and/or savagely penetrating their home markets. The European-based TNCs have seemed less reticent about attempting to stifle import competition by way of blatant trade restrictions, but the US-based ones have had a more difficult time reacting, since they were shaken out of their comfortable post-war oligopoly positions without being able to have recourse to the same level of government assistance as the European t n c s . Once the t n c s under attack understood that their situation was not to be remedied through permanent governmental assistance or by throwing capital resources into possible new scientific or technological breakthroughs, they began to face up to the task of improving their capacity to compete internationally. In this sense, the new era of international competition is based, initially, on a few thousand large and innovative tn c s in head-on competition over a dozen high-technology and/or trade-intensive industries serving three huge markets: the US, Europe and Japan. That laid the basis for what has become known as “industrial restructuring”, which is central to the new international industrial order.
As Kaplinsky (1989) has shown, industrial restructuring as a concept has at least four distinct interpretations. According to the French Regula- tionist school, industrial restructuring is the means of arriving at a sustainable path of accumulation based on a regime of accumulation which balances consumption, savings and investment and on a mode of regulation (institutional forms and social patterns of behaviour) which underwrites the accumulation regime (Aglietta, 1979, and Liepitz, 1987). The neo-Schumpeterian structuralists view it in terms of 50-year long-wave cycles of fundamental (or “heartland”) technological breakthroughs that sustain growth. Previous industrial growth cycles were based on textiles, steel, railroads

A NEW INTERNATIONAL INDUSTRIAL ORDER / M. Mortmore 41
and the internal combustion engine, while the current one is based on microelectronics (Freeman, Clark and Soete, 1982). Another interpretation sees the current transition in terms of the exhaustion of the mass production paradigm -that is to say, the production of standardized commodities through the use of special- purpose machinery and a rigid division of labour- and its replacement by a new flexible specialization paradigm based on smaller batches of differentiated products made with general-purpose flexible machinery and new forms of work organization (Piore and Sabel, 1984). Finally, another vision interprets the present situation in terms of a transition from “machinofacture” to “systemofacture”, that is to say, a new organizational practice in which the integration of the pro
ductive units via automation technology, new interfirm relations and integral work practices supersedes individualist orientations (Hoffman and Kaplinsky, 1988). Each of these interpretations captures some element of the essence of the new international industrial order taking form towards the end of the twentieth century.
In the rest of this article the topic of increased international competitiveness in the form of globalization, specialization and regionalism will be examined. The preponderant role of transnational corporations in the field of industrial restructuring is highlighted, especially with regard to the two principal areas where the increased international competition has been most evident, namely, trade and foreign direct investment.
I
Trends towards increased international competition: globalization, specialization and regionalism
In order to better comprehend the significance of the increased international competitiveness it is necessary initially to refer to the intrinsic nature of the evolution of capitalism and the modern industrial enterprise (Chandler Jr., 1990). The birth of the capitalist system of production coincided with the Industrial Revolution in Europe, particularly in England. As a result, personal capitalism in Britain, or the personal management of the family enterprise, became the epitome of the first phase of capitalist development based primarily on activities in the brewing, textiles, publishing and prints ing, shipbuilding, chemical and light machinery industries.
In the latter half of the nineteenth century a new form of capitalism made its appearance, principally in the United States and the rest of Europe: managerial capitalism. This was based on the recruitment of professional managers who undertook longer-term investments and implemented new organizational practices to gain bigger market shares. As Chandler explains, this model took two primary forms, competitive managerial capitalism, most evident in the United States, and cooperative managerial capitalism in Germany. In the United
States managerial capitalism was considered competitive because, after a convoluted struggle between government and business in which trust-busting was implemented in order to break up expanding private industrial empires, unabashed competition among mainly independent industrial entities became the norm for the expansion of manufacturing activities and carried this form of economy to world-class stature. At its core, the competitive advantage of Ameri- can-style managerial capitalism lay in innovation and a productive process based on exploiting economies of scale by way of heavy capital investment in long lines of production for standardized products, coupled with complementary investment in marketing and the development of strategies of global expansion. Its success during the twentieth century was symbolized by the mass production of the automobile as well as by the concern of others with “the American challenge” (Servan-Schreiber, 1967). Managerial capitalism eventually gave birth to the transnational corporation.
In general, the system of managerial capitalism which blossomed in Germany was similar to that in the United States; however, there were three very important differences (Chandler Jr., 1990,

42 CEPAL REVIEW No. 48 I December 1992
pp. 393-592). One was that the German variant was more centered on intermediate and capital goods (to the exclusion of consumer goods), most notably in the chemical and heavy machinery industries. Secondly, and related to the first difference, Germany’s competitive advantage as often as not related to economies of scope as to those of scale. Thirdly, and by far the most important, German capitalism was grounded on a cooperative approach to inter-firm (with suppliers and competitors) and intra-firm (with labour) relationships. Central to this cooperative approach was the concentration of capital or coordinated business operations by groups. It is said that the huge Deutsche Bank alone controls one-third of German manufacturing industry. These characteristics were particularly suited to the European situation, and helped Germany both to develop into the strongest industrial economy of Europe and also to face up to the American challenge at home and abroad.
However, cooperative managerial capitalism reached its fullest expression in Japan later in the twentieth century, and this Japanese version has been steamrolling international competitors in many strategic industries over the last decade or so. The Japanese “system”, as well as dominating limited-variety, large-batch mass production manufacturing, is achieving what was considered the impossible in the sense that it combines multi-variety, small-batch and more flexible lines of production with both lower costs and improved quality (Ozawa, 1991). Japanese industrial success seems to rest on a host of factors, of which two can be highlighted here. First, they have demonstrated a long-term strategic commitment to industrial innovation and upgrading, something Harvard Business School’s Professor Michael Porter considers the essence of competitive advantage (Porter, 1990a). Secondly, they have taken cooperation to new lengths. In terms of labour relations, this is reflected in salaries which to a certain extent correspond not so much to the productive task that the labourer is performing as to the ones that he is capable of performing. Most important of all, however, in terms of relations with other firms it is reflected in the formation of keiretsu, or strategic business alliances among the principal enterprises, so that most internationally competitive companies are organized in just six or so central business groupings, (as shown in table 1), which operate
with a good deal of governmental assistance in targeting their next prey.2 Instead of producing stagnant cartels, as the free-market entrepreneurship argument claims, this produces global winners (Ferguson, 1988). The burgeoning literature of the type of “Why Japan Keeps On Winning” (Fortune, 1991b, pp, 76-85) and “The Battle for Europe: Japan muscles in on the West and a shakeout begins” (Business Week, 1991, pp. 44-52) clearly suggests as much.
While it has been maintained that the fountain- head of international competitiveness is the capitalist mode of production as manifest in specific national variants, the argument can also be reduced to certain “market model” considerations (Ostry, 1991, pp. 4-5). Ostry distinguishes the US pluralist market economy from the continental European social market economies and the Japanese managerial market economy, highlighting differences in terms of the role of government, market failure, time horizons, the government/business interface, etc. The truth of the matter is that the Japanese managerial model has been savagely penetrating the US pluralist market economy and apparently is beginning to do the same with the continental European social market economy.
Porter’s “stages theory of competitive development”, as refined by Ozawa (Porter, 1990b; Ozawa, 1992), is quite relevant here. Porter defines the competitive development of national economies in terms of four stages, which he summarizes according to their central and sequential competitive features: i) factor-driven, ii) investment-driven, iii) innovation- driven and iv) wealth-driven. According to him, the first three stages involve successive upgrading of a nation’s competitive advantages and will normally be associated with progressively rising economic prosperity, whereas the fourth stage is usually characterized as one of drift and ultimately decline.
Natural resource-based activities and/or labour- intensive manufacturing are central to competitive advantages in the first stage, whereas the investment- driven stage is based on the manufacture of intermediate and capital goods (heavy industry and
2It should be noted that not all the most internationally
competitive Japanese firms are linked to these six groups. Notable exceptions include, for example, Honda, Matsushita and Sony.

JAPAN: MAIN COMPONENTS OF THE SIX BIGGEST BUSINESS GROUPS *
Table 1
(Includes only companies represented at monthly council meetings)
A. INDUSTRY Mitsubishi Mitsui Sumitomo Fuyo DKB Sanwa
Cars Mitsubishi Motors(69) Toyota Motorsb (6) Nissan Motors(20) Isuzu Motors(127) Daihatsu Motors (262)
Computers,electronics and electrical equipment
Mitsubishi Electric (49) Toshiba (29) NEC (40) Oki Electric Industry Yokogawa Electric Hitachi1, (12)
Fujitsu (63)Fuji Electric (259) Yaskawa Electric Mfg. Nippon Columbia Hitachib
Iwatsu Electric Sharp (134) Nitto Denko Kyocera (434) Hitachi b (12)
Metals Mitsubishi Steel Mfg (250) Mitsubishi Materials Mitsubishi Cable Industries
Japan Steel Works Mitsui Miningand Smelting (457)
Sumitomo Metal Industries (98) Sumitomo Metal Mining (327) Sumitomo Electric Industries (190) Sumitomo Light Metal Industries
NKK(130) Kawasaki Steel (152) Kobe Steelb (143)Japan Metals & Chemicals (340)Nippon LightMetal FurukawaFurukawa Electric (256)
Kobe Steelh (143) Nakayatna Steel Works Hitachi Metals Nisshin Steel (409) Hitachi Cable
Industrial equipment Mitsubishi Heavy Industries (70) Mitsubishi Kakoki
Mitsui Engineering and Shipbuilding
Sumitomo Heavy Industries (432)
Kubota (237) Nippon Seiko (485)
Niigata Engineering NTNIseki Hitachi ZosenEbara Shin Meiwa IndustryKawasaki Heavy IndustriesIshiwawajima-HarimaHeavy Industries (241)
Rubber and glass Asahi Glass (151) Nippon Sheet Glass Yokohama Rubber (449) Toyo Tire & Rubber
Chemicals Mitsubishi Kase (161) Mitsubishi Petrochemical (412) Mitsubishi Gas Chemical Mitsubishi Plastics IndustriesMitsubishi Kase Poly tec
Mitsui Toatsu Chemicals (386) Mitsui Petrochemical Industries
Sumitomo Chemicals (182)Sumitomo Bakelite
Showa Denko (314) Nippon Oil & Fats Kureha Chemical Industry
Kyowa Hakko Kogyo Denki Kagaku Kogyo Nippon Zeon Asahi Denka Kogyo Sankyo (438) Shiseido (410)Lion
Ube Industries (317) Tokuyoma Soda Hitachi Chemical Sekisui Chemical (276) Kansaj Paint Tañaba Seiyaku Fujisawa Pharmaceuticals
Fibresand textiles Mitsubishi Rayon Toray Industries (231) Nisshinbo Industries Toho Rayon
Asahi Chemical Industry (158)
Unitika Teijin (336)
Pulp and paper Mitsubishi Paper Mills Oji Paper (306) Sanyo-Kokusaku Pulp (405)
Honshu Paper(422)
A NEW
INTERN
ATIO
NA
L IN
DU
STRIAL
ORDER ¡M
. Mortim
ore

Table 1 (concluded)
A. INDUSTRY Mitsubishi Mitsui Sumitomo Fuyo DKB Sanwa
Cameras and optics Nikon Canon (104) Asahi Optical Hoya
Cement Onoda Cement (446) Sumitomo Cement Nihon Cement Chichibu Cement Osaka Cement
Oil and coal Mitsubishi Oil (325) Tonen(246) Showa Shell Sekiyu (139) Cosmo Oil (155)
Food and beverages Kiron Brewery (239) Kippon Flour Mills Nisshin Flour Milling Sapporo Breweries Nichirei (399)
Itoham Foods (421) Suntory
B. SERVICES Financial services Mitsubishi Bank
Mitsubishi Trust & BankingMeiji Mutual Life Tokio Marine & Fire
Mitsui TaiyoKobe BankMitsui Trust& Banking Mitsui Mutual Life Taisho Marine & Fire
Sumitomo Bank Sumitomo Trust & Banking
Sumitomo Life Sumitomo Marine & Fire
Fuji BankYasuda Trust & Banking Yasuda Mutnal Life Yasuda Fire & Marine
Dai-Ichi Kangyo Bank Asahi Mutual Life Taisei Fire & Marine Fukoku Mutual Life Nissan Fire & Marine Kankaku Securities Orient
Sanwa Bank Toyo Trust & Banking Nippon Life Orix
Trading and retailing Mitsubishi Mitsui
Mitsukoshi
Sumitomo Marubeni C. Itoh Nissho Iwaib Kanematsu KawashoSeibu DepartmentStores
Nissho Iwaib NichimenIwatani International Takashimaya
Construction Mitsubishi Construction Mitsui Construction Sanki Engineering
Sumitomo Construction Ta isei Shimizu Toyo Construction Obayashi Sekisui House Zenitaka
Real estate Mitsubishi Estate Mitsui Real Estate Development
Sumitomo Realty & Development
Tokyo Ta tern ono Tokyo Dome
Mtningand forestry Mitsui Mining Hokka ido Colliery & Steamship
Sumitomo Forestry Sumitomo Coal Mining
Shipping and transportation
Nippon Yusen Mitsubishi Warehouse & Transportation
MitsuiOSK Lines Mitsui Warehouse
Sumitomo Warehouse Showa Line Keihin Electric Express Railway Tobu Railway
Kawasaki Kisen Shibusawa Warehouse Nippon Expressb
Naivix Line HankyuNippon Express b
Source: Fortune, New York, The Time Inc. Magazine Company. 15 July 1991.1 The numbers in parentheses after certain firms indicate tbeir ranking, according to their sales, among the 500 biggest industrial companies in the world in 1991. b Companies affiliated with more than one group.
CEPAL REVIEW
No. 481 D
ecember 1992

A NEW INTERNATIONAL INDUSTRIAL ORDER IM. Mortimore 45
chemicals) and the construction of infrastructure (housing, transportation, communications and public works). The innovation-driven stage rests on research and development successes deriving from the abundant use of increasingly highly-qualified human capital. It would appear that while most developing countries are to be found in the factor- driven and, less evidently, in the investment-driven stages, most so-called developed countries are to be found in the more advanced phases of the investment-driven stage or in the earlier phases of the innovation-driven stage of competitive development. One might speculate that the United States has entered the wealth-driven stage characterized by drift and ultimately decline.
Ozawa has given life to this scheme by showing how the Japanese experience demonstrates the close inter-relatedness between structural upgrading, dynamic comparative advantage and foreign direct investment in a country where there is intensive use of the endowment of physical/human capital and technological progress. In this way, he makes it clear how a particular stage of competitive development is associated with a particular pattern of export competitiveness: the first stage is characterized by factor-based trade advantages in either primary commodities or labour-intensive goods; the investment-driven stage produces scale- based advantages in large-scale, capital-intensive goods; and the innovation-driven stage results in R & D-based advantages manifest in exports of more technologically sophisticated products. In this sense, economic growth and transformation are accompanied by the changing patterns of dynamic comparative advantage. It should be mentioned that these changes are not simply one-shot transformations, but result rather from progressive transitions characterized by the simultaneous rise and fall of particular economic activities, and they can be conceptualized as the shift in the centre of gravity of the economy as a whole.
Ozawa has also indicated how the nature and direction (inward or outward) of foreign direct investment changes in step with the structural transformation of the economy. The factor-driven stage results in inward f d i characterized as resource- or labour- seeking. The second (investment-driven) stage produces inward f d i in the capital and intermediate goods industries, while simultaneously
generating outward fd i in labour-intensive manufacturing in lower-wage countries and in resource extraction abroad for natural resource-scarce countries. Likewise, the transition to the innovation- driven stage brings about simultaneous inward fdi in technology-intensive industries and outward f d i in the intermediate goods industries. Based on this scheme, and utilizing the example of the explosive transformation of the Japanese economy during the twentieth century, Ozawa relates trade and foreign direct investment developments to Porter’s stages theory of competitive development, and such an approach can also be thought of as providing the framework for some of the major alterations taking place in global trade and investment flows.
Some indication of the magnitude of the changes taking place is given in figures 1 through 3, which deal with the import penetration, export performance and foreign trade balance of eight major US manufacturing industries, most of them considered “strategic” (o e c d , 1991), between 1970 ahd 1986. The message is Clear: imports by the US grew appreciably over this period, US exports to the o e c d countries suffered a notable decline, and the United States trade balance worsened significantly. Even a casual glance at the 1991 sales and profit figures of the Fortune 500 largest US industrial corporations is enough to show that 30 of the largest 60 corporations suffered a decline in sales compared to 1990, and 31 registered a decline in profits compared with the same year. The largest of the 500 companies in such important industries as motor vehicles and parts, computers/ office equipment, and industrial and farm equipment suffered severe losses of US$7.5 billion, US$2.8 billion and US$661 million, respectively (Fortune, 1992a).
Even if one considers the post-war years to be abnormal, and hence not a suitable basis for comparison (The Economist, 1991c), there is no hiding the pain for a humbled America. American concern to promote domestically-made products (the “Made in USA” campaign) is clearly justified (Dertouzos and others, 1989; Fortune, 1990). American industry, even in the high-technology sector, has lost ground in world markets and is suffering increased competition at home. Moreover, an increasing share of US domestic production is foreign-owned (United States

46 CEPAL REVIEW No. 4SI December 1992
Figure 1
UNITED STATES: IMPORTS OF SELECTED PRODUCTS, 1972 AND 1986
(As percentages o f the US market for each product)
goods computers and office equipment
Source: Based on information supplied by the US Department of Commerce, Bureau of International Commerce, Office of Trade Information and Analysis, supplemented with data given in its publication US Industrial Outlook, Washington, D.C., US Government Printing Office, 1988; and on information from the COMTAP data base of the Organization for Economic Cooperation and Development (OECD), cited in Dertouzos et al, 1989.
Department of Commerce, 1991). The negative trade situation is caused primarily by Japanese tn c s , which in 1990 were running surpluses in their trade with the US amounting to US$22.3 billion in computers and telecommunications equipment, US$20.5 billion in cars and trucks, and US$9 billion in industrial equipment, i.e., in three principal high-technology and/or trade-intensive industries. The increase in foreign investment in US production had to do more with European than Japanese tn c s , although in fact both were very active. It was Japan which made the
US feel most uncomfortable, however, and a serious rift was opened in this respect between the two countries (Fortune, 1991a, pp. 38-48).
It makes sense to place the US-Japan rift in the broader context of changes in international trade and its “neglected twin”, foreign direct investment (Julius, 1991). The globalization and specialization tendencies of international trade will be dealt with first, followed by the globalization and regionalization tendencies in the field of foreign direct investment.

A NEW INTERNATIONAL INDUSTRIAL ORDER / M. Mortimore 47
Figure 2
UNITED STATES: EXPORTS OF SELECTED PRODUCTS, 1970 AND 1986
(As percentages of the total OECD market for each product)
mobiles products aircraft electronic tools conductors,goods computers
and office equipment
Source: Based on information supplied by the US Department of Commerce, Bureau of International Commerce, Office of Trade Information and Analysts, supplemented with data given in its publication US Industrial Outlook, Washington, D.C., US Government Printing Office, 1988; and on information from the COMTAP data base of the Organization for Economic Cooperation and Development (OECD), cited in Dertouzos et al, 1989.

48 CEPAL REVIEW No. 48 Í December 1992
Figure 3
UNITED STATES: TRADE BALANCE FOR SELECTED PRODUCTS
(Billions o f current dollars)
Automobiles Chemical products20-,10-
0
-10
nnnnnnn uno-2 0 -1 —i— ,— 1— ¡— (—j— i < i T -f t i i v '"i
72 75 80 85 87
Civil aircraft Consumer electronic goods
Steel20-,
10 -
- 10 -
Tex tiles
r r x r Q r r c q jDIJU0üuU0'O'ü
-20-J—i—1—1—i—i—t— —[—(—!—t—,—i—i—. -3 0 —1—i—i—t~—i—i—p—t—i" i "i—i—i—>—i—«—i72 75 80 85 87 72 75 80 85 87
Source; Information supplied by the US Department of Commerce, Bureau of International Commerce, Office of Trade Information and Analysis. Cited in Dertouzos et al, 1989.

A NEW INTERNATIONAL INDUSTRIAL ORDER / M. Morilmore 49
II
Trends in international trade: globalization and specialization
The principal changes in the international trading system over the last few decades have been its notable expansion; the upsurge of major new exporters (Japan and the Asian n ic s); the opening-up of the United States market and, to a much lesser extent, the European Economic Community to increased import flows; and the increase in system tension or conflict associated with these changes.
An interesting industrial taxonomy has been developed for succinctly capturing the global changes in terms of country trade specialization (Pavitt, 1984 and 1988; Guerrieri, 1991). As well as confirming the principal winners (Asian n ic s , Japan) and losers (European Economic Community, u s a ) in world trade over the 1970-1989 period, this analysis offers an insight into the trade specialization taking place on the part of the EEC, Japan and the United States.
In general, as table 2 indicates, Japan and the United States underwent significant trade specialization during the period in question, whereas the EEC did not. Of the major countries, Japan has had the best trade performance over the last two decades and, as table 3 demonstrates, that success was manifest: i) in the doubling of its market shares in science- based sectors (fine chemicals, electronic components and telecommunications), that is to say, areas characterized by innovative activities which are directly linked to high research and development expenditures, which generate broad spillover effects on the whole economic system, and which serve as intermediate and capital inputs to a large number of other sectors, and ii) in considerable gains in specialized suppliers industries producing investment goods based on mechanical and instrument engineering, such as machine tools: that is to say, in activities characterized by the highly diversified supply of goods serving mainly as inputs for scale-intensive and supplier-dominated sectors, where there are significant economies of scope. Japanese trade specialization was particularly strong in the research and development-intensive electronic sectors (such as data processing systems, electronic components and
telecommunications), while Japanese firms moved decisively out of traditional sectors.3
The flip side of the Japanese advance in terms of its share of world trade in manufactures was represented by the US decline. It was precisely where the Japanese t n c s made the greatest inroads -electronics, and specialized suppliers industries- that the most negative results for US firms were registered. Table 2 shows that while US enterprises have succeeded in greatly furthering their specialization in the science-based sectors (except electronics), they have experienced increasing difficulties in transforming high-level scientific and research capability into innovative activities and products with significant commercial value in the other manufacturing sectors (table 2 ).4 Table 3, for its part, shows how US firms’ market shares in dynamic sectors crumbled. They suffered a kind of de-specialization in specialized suppliers and scale-intensive sectors (automobiles, consumer electronics and consumer durables, as well as the rubber and steel industries), the latter being areas characterized by oligopolistic industries with high capital intensity, wide economies of scale, high technical and managerial complexity and significant in-house engineering activities. Furthermore, US firms were not very successful in moving out of traditional sectors.
3 This paragraph and the following one are based largely on Guerrieri, 1991.
4 It should be reiterated that these changes are all relative. There is little doubt that the US as a whole is losing competitiveness, yet even the Economic Planning Agency of Japan has admitted that the US remains ahead in many leading high- technology industries. That Agency’s survey of 110 critical technologies in 1991 revealed that US firms led in 43, Japanese companies in 33, and European and other firms in the remaining 34 (The Economist, 1992c, p. 69).

50 CEPAL REVIEW No. 481 December 1992
Table 2
JAPAN, UNITED STATES AND EEC: SECTORAL DISTRIBUTION OF THEIR TOTAL EXPORTS OF MANUFACTURES, AS A
PERCENTAGE OF TOTAL OECD EXPORTS,1970-1973 AND 19H6-1989
Japan United States European Communitya
1970- 1986- 1970- ‘ 1986- 1970- 1986-1973 1989 1973 1989 1973 1989
Science-based 11.3 27.3 19.0 30.5 11.0 16.6Specialized suppliers 10.4 15.3 15.9 10.5 15.2 12.9Scale-intensive 53.8 46.4 23.4 21.4 31.2 30.7Resource-intensive 2.0 2.0 5.5 5.6 6.8 6.4Traditional 17.6 6.8 7,8 7.3 18.6 17.0Food industries 1.7 0.5 4.7 4.6 7.7 7.8Food items andagricultural raw materials 1.0 0.3 16.0 9.7 4.6 3.9All other 2.2 1.4 7.7 10.4 4.9 4.7
Total 100.0 100.0 100.0 100.0 100.0 100.0
Source: P. Guerrieri, Technological and trade competition: munity, University of Rome, mimeo, July 1991.
8 Nine members.
a comparative analysis of the United States, Japan and the European Com-
Table 3
JAPAN, UNITED STATES AND EEC: SHARES IN WORLD EXPORTS OF MANUFACTURES, BY SECTOR, 1970-1973 AND 1986-1989
(Percentages)
Japan United States European Community a
1970-1973
1986-1989
Variation
1970-1973
1986-1989
Variation
1970-1973
1986-1989
Variation
Science-based 8.5 16.4 7.9 27.1 20.1 -7.0 46.4 37.8 -8.6(R&D-intensiveelectronics)6 (9.4) (21.5) (12.1) (28.5) (19.5) (-9.0) (45.0) (29,0) (-16.0)Specializedsuppliers 7.0 15.7 8.7 20.3 12.7 -7.6 57.2 49.9 -7.3Scale-intensive 15.4 16.7 1.3 12.8 9.6 -3.1 51.7 47.4 -4.3Traditional 8.2 3.9 -4.3 6.9 ' 5.4 -1.5 50.4 42.5 -7.9
Total 9.0 11.6 2.6 13.5 11.3 .2.2 48.6 44.0 -4,7
Source: P, Guerrieri, Technological and trade competition: a comparative analysis of the United States, Japan and the European Community, University of Rome, mimeo, July 1991.
8 12 member countries.b Subsector of “science-based” which includes data processing equipment, electronic components and telecommunications equipment.

A NEW INTERNATIONAL INDUSTRIAL ORDER / M. Mortimore 51
Another way of defining winners and losers with regard to foreign trade over the last decade or so is that used by Mandeng (1991). Considering that economic growth has become more tradeintensive and that the dynamic elements are centered on large firms producing technologically complex manufactures for imperfectly competitive global markets, and that certain new players (Japan and the Asian n ic s ) are rapidly improving their trade performance (Ostry, 1990b), it makes sense to focus on the changes taking place in o e c d overall imports.
Fajnzylber, based on Mandeng, defines not only the “winners” who increased their market share between 1979 and 1988, but also analyses gains according to the principal products involved, in the sense that he distinguishes products enjoying increased global market shares from those that do not (Fajnzylber, 1991). In other words, “winner” countries can increase their market shares with “dynamic” products (the optimal situation of “rising stars”) or “declining” ones (a situation of vulnerability ascribed to “waning stars”). Conversely, “loser” countries might lose market shares with either “dynamic” products (a situation defined as “missed opportunities”) or “declining” ones (a situation called “retreat”). Naturally, the mix of products for virtually all countries contains examples of both kinds. The overall situation is, none the less, revealing, as is suggested by table 4.
Among the principal o e c d countries, Japan has clearly enjoyed the most important market gains and, more importantly, 80% of its exports are in the optimal situation, while virtually all are nonnatural resource-based manufactures. With few exceptions (Netherlands and the UK), the European Community members generally made minor market gains, but except for Portugal the “winners” faced many missed opportunities in their export performance, even though they exported mostly non-natural resource-based manufactures. Even more badly off were Australia and New Zealand, whose exports of natural resources or natural resource-based manufactures were characterized by situations of vulnerability or retreat. The United States, for its part, lost part of its market share because even fewer of its products were in an optimal situation and even more were in the category of “missed opportunities” than in the case of the Europeans, while a similar proportion of its export products were in retreat, in the face of the Japanese onslaught.
This dramatic shift in foreign trade performance by o e c d countries naturally provoked discontent on the part of the losers. The Europeans reacted positively, through accelerated integration in the form of the Europe 1992 initiative, and negatively through a policy of applying anti-dumping duties to the avalanche of finished products landing on their doorstep, supplementing this measure with fixed quantitative import restrictions. in certain sectors, such as automobiles. New initiatives in the field of merger and takeover policy are also worth noting (Julius, 1991, p. 12). Some of the principal effects were, first, to promote local assembly facilities by way of foreign direct investment and, second, to slowly raise the levels of local content in those facilities.5 Overall and in general, through bureaucratic procedures and trade restrictions the EEC members were made less penetrable and given more time to adjust.
The US economy was more penetrable, but the reaction of the United States was rather more combative, as it increasingly relied on unilateral strong- arm tactics, as manifest in the US Omnibus Trade and Competitiveness Act (the “Trade Act”) of 23 August 1988. This legislation allows the US Government to determine unilaterally what it defines as unfair trade practices and thereby bring to bear heavy pressures on trade partners. Although it was formally stated to be unrelated to the Trade Act, it was shortly after Japan was identified under Section 301 of that Act that US-Japanese conversations were begun under the Structural Impediments Initiative in order to overcome conflictive aspects of trade relations between the two countries. Thus, these unilateral tactics have resulted in a quid pro quo approach to bilateral negotiations which undermines the multilateral process, as well as an increase in product-specific protection in the US market. The Trade Act also reconfirmed an active private sector role in multilateral trade negotiations as well as specific trade remedy laws deriving from the “bottom-up” manner of dealing with anti-dumping concerns.
%With regard to this point and the following paragraph, see
Ostry (1990b, pp. 18-52) and Smeets (1991, pp. 66-69).

52 CEPAL REVIEW No. 48 / December 1992
SELECTED OECD COUNTRIES: EXPORT MARKET DYNAMICS,1979 AND 1988
Table 4
Share of OECD imports Classification of exports (%) Structure of exports (%)
ManufacturesPer- Missed --------------------
Exporting Country1979 1988
cen-tage
change
Optimal a
Vulnerable11
opportunities0
Retreatd
Naturalre
sourcesEnergy
Naturalre
sourcebased
Nonnatural
resourcebased
I. “Winners”Japan 4.63 8.15 76 80 4 11 5 - - 4 96Portugal 0.27 0.52 93 75 12 10 3 5 2 23 71Canada 4.48 4.91 10 43 15 27 15 9 9 29 52Italy 4.35 5.01 15 35 13 46 6 4 2 13 81Greece 0.29 0.33 14 29 26 27 17 22 7 19 52F. R. Germany 10.66 12.54 18 29 8 55 7 2 1 15 81France 5.93 6.41 8 23 11 54 12 9 1 21 68
II. “Losers”New Zealand 0.32 0.31 -3 31 25 10 34 45 2 34 18Netherlands 4.54 4.49 -1 24 14 41 19 14 11 27 49United Kingdom 5.25 5.24 20 17 51 12 7 11 16 66Australia 1.15 1.06 -8 18 57 6 18 38 19 27 14United States 10.23 10.07 -2 11 8 66 15 12 3 13 71
Source: Based on F. Fajnzylber, “International insertion and institutional renewal”, CEPAL Review, No. 44, August 1991, Table 2, pp. 142-143.
“ Favourable competitive position of products and high relative efficiency of country. b Unfavourable competitive position of products and high relative efficiency of country. c Favourable competitive position of products and low relative efficiency of country. d Unfavourable competitive position of products and low relative efficiency of country.
The example of the adjustment of the consumer electronics industry, which took place prior to the 1988 TVade Act, demonstrated that the US battery of trade management instruments, which included bilateral orderly marketing agreements and simple export quotas, was not then sufficient to save the industry (Jenkins, Sawchuk and Webster, 1989). The Trade Act captured the new perspective that was growing up among US t n c s facing import competition, that is to say, the need for “strategic” trade policy involving not simply protection but also “contingent” trade barriers for the home market in cases where foreign markets are protected (Milner and Yoffie, 1989). It represents a new kind of rearguard action on the trade front by US t n c s in
respect of the US-Japan rift and the urgent need for industrial restructuring. The US is no longer the world’s most enthusiastic champion of free trade, and it readily implements regional trade deals, bilateral arrangements, antidumping and countervailing duties and Section 301 actions in its trade relations (The Economist, 1992e, p. 72). Nonetheless, it has become clear that if US and European t n c s are to become or remain competitive, it will be by conscious industrial restructuring to improve international competitiveness, and not by home country trade restrictions or more managed trade in the motor vehicle and parts, semiconductor and machine tools industries or other strategic industries (Fortune, 1992b, pp. 96-97; Thurow, 1992).

A NEW INTERNATIONAL INDUSTRIAL ORDER / Af. Mortimore 53
III
Tendencies in foreign direct investment: globalization and regionalism
It is clear that important changes have also been taking place in terms of foreign direct investment. Global integration via trade flows was heavily reinforced in the 1980s by foreign direct investment flows, whose dynamism was superior to that of international trade and became a new engine of growth. As already mentioned, trade restrictions on imports often led to foreign direct investments on the part of the “aggressor”. The process of transnationalization has produced simultaneous tendencies in terms of globalization and regionalism. It should also be kept in mind that over half of the trade flows of the US and Japan are related to foreign direct investment, that is, they are intra-firm t n c operations.6 One can conceptualize these tendencies in terms of global strategies on the part of the t n c s , on the one hand, and regional supply or sales networks, on the other. System tension or conflict has also arisen due to the changes taking place in terms of global f d i flows.
During the 1980s, the principal developments in terms of foreign direct investments included the following (c t c , 1991a, p. 2):
— The stock of world foreign direct investment trebled to US$1 500 billion, compared with US$500 billion in 1980.
— The European Economic Community became the most important source of foreign investment flows: US$39 billion annually during 1985- 1989.
— The US became the most important host country for foreign investment: US$329 billion in 1988.
— The foreign investment of Japan increased sixfold to US$ 111 billion.
— About 80% of world foreign investment is concentrated in the US, the e e c and Japan.
6Dennis Encarnation argues that Japanese companies dominate bilateral trade both ways between the US and Japan. The high level of Japanese TNC intra-firm trade and the relatively low level of US FDI in Japan are the principal causes of the persistent trade surplus in Japan’s favour (Encarnation, 1992).
These characteristics of the foreign investment situation gave rise to the concept of the Triad, which was first used to convey the sense of concentration (67%) of world trade in the US, EEC and Japan (Ohmae, 1985) and is now found to be even more applicable to the concentration (80%) of the outward stocks of world foreign investment in those countries.
According to the United Nations Centre on Transnational Corporations (c t c , 1991b), there is a movement toward parity within the Triad. In the early 1980s, it would have been difficult to characterize the United States, the EEC and Japan as forming a Triad which dominated global foreign direct investment stocks and flows; the role of Japan was then relatively small, and the EEC was too fragmented, more a collection of 12 countries than an integrated regional economy. At that time, the United States was alone the single most important source and host country for foreign direct investment in the world economy. By the end of the 1980s, however, a Triad had indeed emerged, at least in terms of flow data. Behind this emergence of a tri-polar structure were the rapid growth of outward investment from Japan and the integration of the EEC, so that the latter now may properly be considered a single Triad member. While in 1990 the United States and the EEC were still jointly the most important Triad members, if current trends continue the e e c could eventually surpass the importance of the United States as the most important source and host region and Japan could, within the next decade, surpass the importance of the United States as a source country, likewise in terms of stock.
From a strategy point of view, the convergence of intra-Triad foreign direct investment relationships points to the growing importance attached to the Triad by t n c s . This strategy, often referred to as “globalization”, means that tn c s are increasingly considering their non-domestic Triad activities to be as important as their home-country operations. The recent strategy of Japanese t n c s to become “regional insiders” in each leg of the Triad is motivated by

54 CEPAL REVIEW No. 48 / December 1992
reasons of both efficiency (country specialization and regional economies of scale) and policy (extra-regional tariff and non-tariff barriers). If this strategy, which can be summarized as an obsession with markets rather than profits,7 proves successful, then the question arises as to whether e e c and US t n c s , in order to ensure competitive survival, will not also have to adopt a three-legged strategy, to cover each member of the Tiriad. Hie incentive to do so will be all the greater if regional trade blocs are strengthened in Europe, North America and Asia so that achieving “insider” status would be an important competitive advantage for gaining access to those markets.
In the context of such a scenario, the low level of investment by other countries in Japan stands out as a striking imbalance. This situation might eventually lead to increased pressures on Japan to open its economy to more foreign investment from the other two Ti*iad members. It would also be likely that the e e c and, in particular, the United States, would respond to this potential competitive threat to their t n c s by utilizing strategic trade and foreign-direct-investment policy tools, in an attempt to attain a “level playing field” for their bilateral foreign-direct-investment relationships with Japan (c t c , 1991a, pp. 43-44).
The regional tendencies which have accompanied the global trend refer to two distinct phenomena. Firstly, there is the perspective within the globalizing “one world” view that its principal components are three in number -the US, Europe and Japan- and that they require regional considerations. Secondly, there is the nature of the various supplier and marketing networks that have grown up around each Triad member.
The importance of thé regional tendency, in the first sense, is threefold. In the first place, globalizing
7 According to The Economist (1992d), Japanese pricing reverses Western practice. It is usual in the West to specify a product, then add up the cost of its components, including overheads and profit, to arrive at a selling price. Most Japanese companies, however, start with a target market share; they thenestimate what price will enable them to reach that share, after which they work backwards to push down the cost of everything that goes into the product, until the price is met. This tends not only to drive down costs but also (because it makes everyone re-think his bit of the product) to speed up innovation.
t n c s must develop and implement specific strategies for each major Triad market with regard to product design, marketing, distribution, supply networks, finance, trade, and foreign investment. Aside from dealing with market considerations concerning distinct consumer tastes and with differing Triad regulations on essentially technical topics such as product safety, entry-level or expanding non-resident t n c s must deal with potentially conflictive relations with host government rules on finance, trade and foreign investment. 8 As Agosin and Tussie have noted, hitherto unnoticed differences in institutional practices and relatively small shifts in relative competitiveness can have significant effects on international trade and investment flows. In an era of man-made comparative advantages, locational competition between countries or regions has emerged as a new and increasingly more contentious form of competition (Agosin and Tussie, 1992, p. 11).
In the second place, the high technology industries which have become the focus of international competition are not evenly distributed across the Triad or the globe, This means that, in an international context of increased competition within the private sector, governments inevitably attempt to “boost” their national or regional champions and make life difficult for their competitors.9 These measures can range from wholesale government- assisted “targeting” of other Triad markets (as the Japanese Ministry of International Tfade and Industry has done) to simpler government-assisted research and development programmes in specific areas (such as the European Strategic Programme for Research in Information Technology - e s p r it , or the US initiative for semiconductor technology- se m a t e c h ). Thus, at the industry level the business/government interface is an important element in intra-Triad relations.
8 See, for example, CTC/UNCTAD, 1991. For an innovative treatment of investment-related trade measures, see CTC, 1992, Part III, chapter XI.
oAccording to an OECD publication “there has in some
cases been a noticeable convergence between the interests of multinational enterprises and those of national governments. The convergence is reflected in the fact that the struggle for market shares, especially in leading-edge sectors, now transcends competition between corporations, to embrace rivalry between the different national socio-economic environments in which enterprises operate- environments which largely determine the economy’s competitiveness and which are shaped to an important degree by government policies’’ (see OECD, 1991, p, 8).

A NEW INTERNATIONA!, INDUSTRIAL ORDER IM. Mortmore 55
In the third place, the three Triad members have the strongest voices in defining the rules of the game with respect to the multilateral system, whether by way of the General Agreement on Tariffs and Trade (g a t t ), the Organization for, Economic Cooperation and Development (o e c d ), the Bank for International Settlements (bis) or the United Nations system. Increasingly, national or regional policies on exchange rates, interest rates, import protection, competition, external financing, etc. have tended to converge to a certain degree and have been the subject of periodic discussions by the Group of Seven industrialized countries (US, Canada, Germany, France, UK, Italy and Japan). Policy changes by Triad members in these areas could be very disruptive for the existing international macroeconomic situation, as witness
the decline of the dollar versus the Deutschmark and the Yen since 1985.
The relevance of the regional tendency within the Triad is that it highlights the importance and differential nature of the TNC/govemment interface at different levels: the corporation, the industry and the country or bloc. That assists in identifying the areas of possible system conflict within the Triad. One major source of possible conflict would be differing US and Japanese sensibilities regarding FDI. For example, the Japanese keiretsu system essentially keeps outside t n c s from operating successfully in the Japanese market, while Japanese t n c s are seen to be gobbling up US competitors in the United States through takeovers and mergers (Julius, 1991, p. 13).
IV
Final considerations
It is worth briefly analysing at this point the new nature of international competitiveness. A good beginning would be to rely less on classical trade-centered theories on comparative advantages of nations according to simple factor endowments and give more weight to the analysis of the new situation from the point of view of the competitive advantage of firms, emphasizing the importance of research and development, innovation and technology (Agosin and Tussie, 1992; Teece (ed.), 1987).10
The new situation is most clearly manifest in two separate and distinct areas. First, in strategic and technologically-sophisticated “leading edge” industries, such as microelectronics, biotechnology, new materials, robots/machine tools, computers/software, telecommunications, etc., competitive advantage is for the most part created by way of huge research and development investments and strategic alliances among advanced-technology t n c s , Siemens is a good example here, as figure 4 suggests.
Second, for the mature scale-based mass-produc- tion industries presently undergoing restructuring, such as automobiles, consumer electronics, textiles,
10 See The Economist, 1992a, pp. 17-20.
iron and steel, etc., competitive advantage is in large part acquired, through a mixture of technological advance and organizational innovation. A u n c t c publication on this subject maintains that the new best-practice manufacturing system has three broad dimensions. The first is technological and relates to the use of flexible, integrated automation technologies in all aspects of a firm’s activities. The second dimension is the incorporation of new management forms and production organization within firms, to permit the attainment of the standards of quality and flexibility now demanded by the marketplace. The third dimension encompasses a new set of relations between firms and their suppliers, based on cooperation and trust and reflecting a sharp break with the adversarial relations of the past. As the broad outlines and principal features of the new system are now becoming clear, it is likely that they will fundamentally influence international competition and economic development in the coming decades (CTC, 1990, pp. 2 and 9).
This new international competitiveness is also manifest in the increasingly footloose nature of international production by “global” t n c s 11 and
11 See, for example, Fortune, 1991c:, or Business Week,1990.

56 CEPAL REVIEW No. 48 / December 1992
Figure 4SIEM ENS A.G. AND ITS MAIN INTERNA TIO NA L CO O PERA TIO N
AGREEM ENTS IN TH E PERIO D 1984-1987
TELECO M M U NICATIO NS SEM ICONDUCTORS
• Ericsson (Sweden) * Western Digital (USA)• Toshiba (Japan) * Philips (Netherlands)* Philips (Netherlands) • Fuji (Japan)* Intel (USA) * General Electric (USA)* Corning Glass (USA) • Toshiba (Japan)* GTE (USA) * Thompson (France)* Xerox (USA) * General Electric (UK)• Cit-Alcatel (France) * Philips/Plessey (UK)* KTM (UK)
î îM ÿ l ï ; : :$e<|e raí Re pübîic o f Germany)
RO BO TICS / NEW M ATERIALS
• Fujitsu (Japan)• Corning Glass
(USA)
COM PUTERS AND SOFTW ARE
• Microsoft (USA)* Fujitsu (Japan)* World Logic Systems (USA)• Philips/Bull (UK)
Source: U nited Nations Centre on Transnational Corporations (CTC), on the basis of annual reports of the firms and other publicly available information. The information includes jo in t ventures in the area of research and developm ent and granting of licenses and subcontracting in the area of production (quoted in CTC,1989).

A NEW INTERNATIONAL INDUSTRIAL ORDER / M. Mortimore 57
the growing role of foreign direct investment (Cantwell and Dunning, 1991), A Group of Thirty report suggests that foreign direct investment now possesses the same potential for increasing growth and efficiency as that displayed by international trade in the 1950s and 1960s (Julius, 1991, p. 22). The increase in outsourcing by t n c s also reflects the global streamlining and/or specialization undertaken, by intemationally-competitive transnationals (The Economist, 1988, pp. 81-82, and 1991a, pp. 57-58).
In terms of the competitive advantage of nations, Porter points out that it is necessary to concentrate on specific competitive industries and industrial segments, that the only meaningful measure is productivity and that, when all is said and done, a nation’s competitiveness depends on the capacity of its industry to innovate and upgrade (Porter, 1990a, pp. 73 and 84-85). Ergas, for his part,, identifies three principal sets of factors which help explain the differing pace of innovation among countries: i) those that affect the inputs into innovation, such as the quality of a country’s scientific base, the presence of reseârch institutions and, above all, its educational level; ii) those that influence demand, such as receptive and sophisticated customers calling for constant innovation; and iii) an industrial structure that combines opportunities for intense competition with some mechanism to enable firms to share the financing and diffusion of scientific research (The Economist, 1992b, p. 21). Fajnzylber suggested that seven relevant indicators of international competitiveness, dealing mainly with exports of manufactures, growth of productiyity and research and development expenditures, demonstrated that a comparison of Japan, Germany and the US left Japan in first place, Germany second, and the US in third place (Fajnzylber, 1988, pp. 11-12). That seems to adequately reflect most opinions on the subject. It also indicates the central source of system friction.
In summary, available statistics and other information on foreign trade and investment suggest that
discernible trends in terms of globalization, specialization and regionalism are creating a new international context for competition. A one world/three poles perspective has helped promote convergence in respect of certain fundamental principles of international relations; however, that tendency has also been accompanied by one of increased system tension or friction, due to the fact that international competition for the first time is increasingly characterized by a head-on struggle by firms in the same industries for the same main markets, rather than a search for market niches. In essence, a thousand or so dominant TNCs are disputing half a dozen technologically - sophisticated industries, together with another half dozen which are undergoing active restructuring, and are focussed on the US, European and Japanese markets. The situation of the principal actors is not the same, however. The Japanese and German examples of cooperative managerial capitalism seem to be gaining the upper hand in the international competi- tiomwith US competitive managerial capitalism, and the competitive edge of Japanese and German industrialization is obliging US industry to react, that is, to restructure, in order to remain competitive. This is a situation qualitatively distinct from the industrial restructuring that took place in Western Europe in the 1950s and apparently is likely to take place in Eastern Europe during the 1990s. The situation is complicated, and the result has been system friction among the dominant countries.
This is the outline of the new international industrial order. In the context of a broad consensus on the central features of the contemporary political economy, increased competition among the dominant transnational corporations operating in the more dynamic industries is generating friction and conflict among the governments of the principal industrial countries. It is not at all clear whether these governments possess the capacity, the will or the foresight to deal actively with the situation, or whether it will be left to the market and “business” to'settle the matter.

58 CEPAL REVIEW No. 48 i December 1992
Bibliography
Aglietta, M. (1979): The theory of capitalist regulation, New Left Review, London.
Agosin, M. and Diana Tussie (1992): Globalization, regionalization and new dilemmas in trade policy for development, March, mimeo.
Business America (1991): World Bank: progress in developing world requires market-govemment interaction, vol. 112, No. 14, Washington, D.C., US Department of Commerce, 15 July.
Business Week (1990): The “stateless” world of manufacturing, New York, McGraw Hill Inc., 14 May.
(1991): The battle for Europe: Japan muscles in onthe West and a checkout begins. New York, McGraw Hill Inc., 3 June.
Cantwell, J.A. and J.H. Dunning (1991): Multinational enterprises, technology and the competitiveness of European industries, Aussenwirtschaft, No. 46, Heft I, Zurich, Rügger Verlag, April.
Chandler, Jr., Alfred D. (1990): Scale and Scope: the Dynamics o f Industrial Capitalism, Cambridge, MA, The Belknap Press of Harvard University Press.
CTC (United Nations Centre on Transnational Corporations) (1988): Transnational Corporations in World Development: Trends and Prospects, New York, United Nations publication, Sales No. E.88.II.A.7.
(1989): The process of transnationalization and transnational mergers, UNCTC Current Studies, No. 8, Series A, New York, February. United Nations publication, Sales No. E.89.II.A.4.
(1990): New approaches to best-practice manufacturing: the role of transnational corporations and implications for developing countries, UNCTC Current Studies, No. 12, series A, New York, February. United Nations publication, Sales No. E.90.II.A.13.
(1991a): Tripling of global investment driven byTriad competition, Transnationals, vol. 3, No. 1, New York, March.
(1991b): World Investment Report 1991: The Triadin Foreign Direct Investment, New York, July. United Nations publication, Sales No. E.91.II.A.12.
(1992): World Investment Report 1992: Transnational Corporations as Engines o f Growth, part III, chapter XI, New York. United Nations publication, Sales No. E.92.II.A.19.
CTC/UNCTAD (United Nations Centre on Transnational Corporations/United Nations Conference on Trade and Development) (1991): The Impact ofTrade- Related Investment Measures on Trade and Development: Theory, Evidence and Policy Implications, New York, United Nations publication, Sales No. E.91.II.A.19,
Dertouzos, Michael L. and others (1989): Made in America: Regaining the Productive Edge, Cambridge, MA, MIT Press.
Encamation, Dennis (1992): Rivals Beyond Trade: America versus Japan in Global Competition, New York, Cornell University Press.
Fajnzylber, Fernando (1988): International competitiveness: agreed goal, hard task, CEPAL Review, No. 36 (LC/G.1537-P), Santiago, Chile, December.
(1991): International insertion and institutional renewal, CEPAL Review, No, 44 (LC/G. 1667-P), Santiago, Chile, August.
Ferguson, Charles H. (1988): From the people who brought you voodoo economics, Harvard Business Review, Boston, MA, President a nd Fellows of Harvard College, May-June.
Fortune (1990): Is “Made in America” fading away?, New York, The Time Inc. Magazine Company, 24 September.
— (1991a): The big split: Japan vs. the US, vol. 123, No. 9, New York, The Time Inc. Magazine Company, 6 May.
— (1991b): Why Japan keeps on winning, vol. 124, No. 2, New York, The Time Inc. Magazine Company, 15 July.
(1991c), The global 500, vol. 124, No. 3, New York,The Time Inc. Magazine Company, 29 July.
— (1992a): Fortune 500 largest US industrial corporations, vol. 125, No. 8, New York, The Time Inc. Magazine Company, 20 April.
— (1992b): Trade: a dangerous fix for trade deficits, vol. 125, No. 9, New York, The Time Inc. Magazine Company, 4 May.
Freeman, C., J. Clark and L. Soete (1982): Unemployment and Technical Innovation: a Study o f Long Waves and Economic Development, Dover, NH, Frances Pinter Publishers Ltd.
Guerrieri, Paolo (1991): Technological and trade competition: a comparative analysis of the United States, Japan and the European Community, University of Rome, July, mimeo.
Hoffman, K. and R. Kaplinsky (1988): Driving Force: the Global Restructuring of Technology, Labor and Investment in the Automobile and Components Industries, Boulder, CO, Westview Press.
Jenkins, G. P., G. D. Sawchuk and Gloria Webster (1989): The consumer electronics industry in North America, Trade, Protectionism and Industrial Adjustment: Three North American Case Studies, Ottawa, September.

A NEW INTERNATIONAL INDUSTRIAL ORDER / M. Moriimore 59
Julius, DeAnne S. (1991): Foreign direct investment: the neglected twin of trade, Occasional Papers, No. 33, New York, Consultative Group on International Economic and Monetary Affairs (Group of Thirty).
Kaplinsky, Raphael (1989): Industrial restructuring in the global economy, IDS Bulletin, vol. 20, No. 4, Brighton, Institute of Development Studies, University of Sussex, October.
Lipietz, A. (1987): Mirages and Miracles: the Crisis of Global Fordism, London, Verso.
Mandeng, Ousmène Jacques (1991): International competitiveness and specialization, CEPAL Review, No. 45 (LC/G.1687-P), Santiago, Chile, December.
Milner, Helen V. and David B. Yoffie (1989): Between free trade and protectionism: strategic trade policy and a theory of corporate trade demands, International Organization, vol. 43, No. 2, Cambridge, MA, MIT Press, Spring.
OECD (Organization for Economic Co-operation and Development) (1991): Strategic Industries in a Global Economy: Policy Issues for the 1990’s, Paris.
Ohmae, K. (1985): Triad Power: the Coming Shape of Global Competition, New York, The Free Press.
Ostry, Sylvia (1990a): Government Æ Corporations in a Shrinking World: Trade and Innovation Policies in the United States; Europe and Japan, New York, Council on Foreign Relations Inc.
(1990b): The evolution of the world trading systemand the future of multilateralism, paper presented at the Joint Canada-Germany Symposium on Regional Integration in the World Economy, Kiel, 28 February-2 March, mimeo.
(1991) Technology and the global economy: international responses, paper presented at the International Policy Conference on Industry, Science and Technology in Canada, Montreal, OECD, 3-6 February, mimeo.
Ozawa, Terutomo (1991): Japan in a new phase of multinationalism and industrial upgrading: functional integration of trade, growth and FDI, Journal of World Trade, vol. 25, No. 1, Geneva, Werner Publishing Company Ltd., February.
— (1992): Foreign direct investment and economic development, Transnational Corporations, vol. 1, No. 1, New York, United Nations, February.
Pavitt, K. (1984): Sectoral patterns of technical change: towards a taxonomy and a theory, Research Policy, No. 13, Amsterdam, North-Holland Publishing Company.
— (1988): International patterns of technological accumulation, N. Hood and J.E. Vahlne (eds.), Strategies in Global Competition, London, Croom Helm.
Piore, M. and C.F. Sabel (1984): The Second Industrial Divide: Possibilities for Prosperity, New York, Basic Books.
Porter, Michael (1990a): The competitive advantage of nations, Harvard Business Review, vol. 90, No. 2, Boulder, CO, President and Fellows of Harvard College, March-April.
(1990b): The Competitive Advantage of Nations,New York, The Free Press.
Servan-Schreiber, Jean-Jacques (1967): Le défi américain, Paris, Denoel.
Smeets, Maarten (1991): Globalization and the trade policy response, Journal o f World Trade, vol. 24 No. 5, Geneva, Werner Publishing Company Ltd., February.
Teece, David J. (ed.) (1987): The Competitive Challenge: Strategies for Industrial Innovation and Renewal, Cambridge, MA, Ballinger Publishing Co.
The Economist (1988): More baskets, choicer eggs, London, The Economist Newspaper Ltd., 21 October.
(1991a): Manufacturing: the ins and outs of outing,London, The Economist Newspaper Ltd., 31 August,
(1991b): A survey of the IMF and the World Bank:sisters in the wood, London, The Economist Newspaper Ltd., 12 October.
(1991c): America: the old country, London, TheEconomist Newspaper Ltd., 26 October.
(1992a): Economic growth: explaining the mystery,London, The Economist Newspaper Ltd., 4 January.
(1992b): Innovation: the machinery of growth, London, The Economist Newspaper Ltd., 11 January.
— (1992c): Can America compete?, London, The Economist Newspaper Ltd., 18 January.
(1992d): Japanese business methods, London, TheEconomist Newspaper Ltd., 4 April.
(1992e): Free trade’s fading champion, London, TheEconomist Newspaper Ltd., 11 April.
Thurow, Lester (1992): Head to Head: the Coming Economic Battle among Japan, Europe, and America, New York, William Morrow & Co., Inc.
United States Department of Commerce (1988): U.S. Industrial Outlook 1988, Washington, D.C., Government Printing Office.
(1991): Foreign Direct Investment in the UnitedStates, Review and Analysis o f Current Developments, Washington, D.C., August.


CEPAL REVIEW No. 48
European investment in Latin America: an overview
Juan A Iberto Fuentes K. *
The macroeconomic policies implemented during the second half of the 1980s and early 1990s to promote economic stabilization and foster changes in the region’s production patterns have, in combination with the external debt renegotiation process, helped create favourable conditions for foreign investment from all sources -including Europe- in a growing number of Latin American countries. However, although the liberalization and deregulation initiatives that have accompanied these policies have opened up opportunities for foreign investment/European firms -whether already established in the region or planning to enter it- will have to make some adjustments if they are to make a genuine contribution to the enhancement of Latin America’s international competitiveness. These microeconomic adjustments, which have already beeti accomplished in some cases but are only beginning in others, will help focus national and entrepreneurial strategies on forging a diversified position -in terms of both trade and investment- for the Latin American countries in the world economy.
The above factors constitute the backdrop for this essay, which starts out with an analysis of some important traits of foreign investment in Latin America in general. It then goes on to assess the trends observed in European investment, in particular. In so doing, the author examines the effects of macroeconomic equilibria and debt-equity swaps, European firms’ contribution to exports of manufactures, the function Of sectoral policies, the role of European investment in services, and its presence in privatized companies within that sector.
* The author is an Economic Affairs Officer attached to the Office of the Executive Secretary o f ECLAC.
Adjustment and foreign investment in
Latin America1
An examination of foreign investment as a component of total investment in each Latin American country brings to light the difficulties which these countries have in attaining satisfactory levels of investment within the framework of their structural adjustment programmes (Corbo and Rojas, 1991; Fuentes, Í991b). The familiar problem of uncertain expectations (Keynes, 1936, chapter 12; Asimakopulos, 1991, pp. 73-76) has had. a major impact in this respect (Dornbusch, 1990). Against this backdrop, debt-equity swaps and privatizations may be regarded as subsidization mechanisms which help to trigger a flow of foreign investment in the face of what has been referred to as the “benevolent dictatorship of the status quo” (Dixit, 1992) -a status quo engendered by the postponement of investment decisions in situations where the level of risk (volatile yields) and discount rates are such that returns have to be above "normal” in order for investments to be undertaken at all.
In view of the investment opportunities created by the investment process itself (Scott, 1992), an increase in foreign investment may lead to an increase in total (domestic and foreign) investment. However, given the close ties which often exist among transnational corporations and between them and transnational banks, it may be supposed that foreign firms are better able to make use of swaps and privatization mechanisms, as well as of other investment opportunities, in cases where
I
1 This essay could not have been completed without the valuable assistance of staff members of the Joint ECLAC/CTC Unit on Transnational Corporations. The author is especially grateful for having been given access to the information and analyses contained in research papers currently being prepared by Michael Mortimore, Alvaro Calderón and Ricardo Bielschowsky. Most of the information presented here on European investment stock and flows, in particular, has been drawn from the study being conducted by A. Calderón.

62 CEPAL REVIEW No. 48 / December 1992
access to financing (in addition to technology) constitutes a major entry barrier.2
In any event, as in the case of total investment (e c l a c , 1990a, page 36), Latin America’s “lost decade” was a time when it lost ground in respect of foreign investment as well. Whereas between 1980 and 1984 the region received 12% of the foreign direct investment (hereafter referred to as f d i ) made by the world economy as a whole, the figure dropped to 7% between 1985 and 1987 and to 6% between 1988 and 1989 (c t c , 1991, page 4). As shown in figure 1, direct investment in the region as a whole was stagnant between 1983 and 1986 in nominal terms, which means that it declined in real terms. Portfolio investment not only diminished but actually turned into a negative flow.
It was not until 1986 that foreign (both direct and portfolio) investment began to recover, with debt-equity swaps and the success of the stabilization and adjustment process in some countries serving as the engines for this recovery. Thus, in countries where macroeconomic imbalances were less severe during the first half of the 1980s (e.g., Brazil and Colombia), the amount of incoming direct investment during those years was greater, while in countries suffering from more severe imbalances (such as Mexico, Chile and Argentina), it was less (see figure 2, based on table 1).
During the second half of the 1980s first Chile and then Mexico managed to consolidate their stabilization processes. These countries, along with Argentina and Brazil, also engaged in a large number of debt-equity swaps while at the same time making an effort, in most cases, to liberalize the conditions pertaining to incoming foreign investment. However, whereas Chile’s and Mexico’s intensive use of debt swaps triggered a heavy inward flow of direct
Figure 1
LATIN AMERICA: FOREIGN INVESTMENT, 1983-1990
(Billions o f dollars)
Source: International Monetary Fund (IMF), Balance o f Payments Statistics (several issues), New York.
investment which -thanks to the consolidation of the stabilization process in these countries and their determined adjustment efforts- then held its own and actually increased substantially during the ensuing years, the absence of a solidly-based stabilization process in Brazil prevented the sustained growth of foreign investment.3 In contrast, although Mexico and Chile stopped participating in debt swaps towards the close of the 1980s, foreign investment has continued to rise anyway.4
Argentina 5 and Venezuela,6 on the other hand, continued to engage in swaps and started to privatize State enterprises as well, which served as another vehicle for foreign investment. Smaller countries made less use of debt-swap mechanisms, and the growth of fd i and of exports in these countries therefore depended more on the advantages which
2This underscores the need to give more favourable treat
ment to national firms and to .undertake public investments that will strengthen the systemic foundations for their competitiveness in order to promote domestic investment (ECLAC, 1990a). Such treatment should be given, above all, to medium-scale and small firms through the establishment of institutional mechanisms to increase their access to financing (ECLAC, 1992a, chapter VII).
} In Brazil, debt swaps were carried out during the 1980s. Whereas such operations represented 27% of total FDI in 1982- 1985, they accounted for 61% in 1986-1989. In Mexico this stage was shorter; most swap activity was concentrated between 1986 and 1990, and new applications were not processed after 1988. In 1987 and. 1988, swaps accounted for 71% of FDI, but in 1989 and 1990, the figure was only 8% (Source: IMF, Balance o f Payments Statistics (various issues)).
4This suggests that some of the swap-related foreign investment seen in these countries might have taken place even without this subsidy.

EUROPEAN INVESTMENT IN LATIN AMERICA: AN OVERVIEW / J. A. Fuentes K. 63
Figure 2
LATIN AMERICA: FOREIGN DIRECT INVESTMENT, 1981-1990
(Percentage o f cumulative investment in each period)
Source: International Monetary Fund (IMF), Balance o f Payments Statistics (several issues), New York.
normally attract foreign investment to any given country, such as the supply of natural resources, inexpensive manpower, and preferential access to the United States market (Buitelaar and Fuentes, 1991), although it was usually contingent upon the prior implementation of a stabilization programme.
The significant increase in net capital inflows (to around US$36 billion) observed in 1991 (e c l a c , 1991b) probably marked the end of the downward trend in Latin America's share of the world’s total foreign investment. There are a number of reasons
5 In 1986 the mechanism set up by the Central Bank in its Directive A-532 of September 1984, which paved the way for an exchange subsidy and covered US$219.5 million of FDI during that year, probably had a major impact in this regard. In 1988 and1989, a decisive factor seems to have been the mechanism set in motion by Directive A-l 109 of 27 October 1987 (a discount on the public external debt along with a commitment to contribute 30% in the form of own resources) covering US$1.039 billion in direct investment, at least one fourth of which was domestic investment. In addition, directive A-l 194 of May 1988 (for Central Bank loans and rediscounts) permitted the conversion of US$488 million of debt, at an average discount of 66%, into direct investment, and another US$40 million in FDI was generated through the programme established by Directive A-1056 of July 1987, which was implemented during the second half of 1988. (Source: Joint ECLAC/CTC Unit on Transnational Corporations.)
6Swaps accounted for 86% of inward FDI in 1989; in1990, the figure was 67%. (Source: Central Bank of Venezuela.)
Table 1
LATIN AMERICA:a FOREIGN DIRECT INVESTMENT FLOWS, 1981-1990
(Millions o f dollars)
Countries 1981-1985 1986-1990
Argentina 1 239.7 4 766.0Bolivia 97.6 58.6Brazilb 8 720.1 6 255.0bColombia 2 716.5 2 273.0cCosta Rica 260.3 475.8Chile c 881.4 1 154.0Ecuador 238.0 387.0El Salvador*1 47.9 73.8 dGuatemala d 299.1 624.9 dHonduras d 77.7 153.0 dMexico 4 518.2 13 033.0Dominican Republic 209.0 487.9Panama 144.7 -59.4Paraguay 63.9 106.1Peru 80.5 173.0Venezuela 515.3 790.0Total 20 109.9 30 751.7 d
Source: International Monetary Fund (IMF), Balance o f Payments Statistics (several issues), New York.
a Uruguay is not included owing to lack of data for a number of the relevant years.bThe figure shown for the period 1986-1990 includes only an estimate of FDI for 1990.c Does not include debt-equity swaps valued at US$3.161 billion during the period 1985-1989.dDoes not include data for 1990; the figures for these three countries and the total for the period 1986-1990 are therefore underestimates.
for this, including short-term or cyclical factors, such as portfolio investment’s response to the prevailing interest rate spreads and the attractiveness of the undervalued shares being traded on Latin American stock exchanges. Above and beyond these cyclical reasons, however, it is feared that, in the absence of economic stabilization, countries have found it necessary to provide large subsidies via debt swaps or low-priced privatizations in order to attract foreign investment that they would otherwise not receive.
There are other factors, however, unrelated to subsidies or short-term considerations, such as well- established stabilization processes, external debt renegotiations and the institution of a clearly-defined development strategy, that undoubtedly help to foster more lasting expectations of a sort that will encourage economic agents to invest in the region. The resumption of growth and of a net positive flow of resources, in particular, could well have a decisive influence on European direct investment in the region (Pio, 1990).

64 CEPAL REVIEW No, 48 1 December 1992
II
European direct investment and how the crisis has influenced it7
In view of the gradual emergence and increasing importance of a triad composed of the United States, Western Europe (or the European Community) and Japan -which was the source of around 80% of the world’s total stock of f d i in the late 1980s- it is worth undertaking a fairly detailed analysis of the geographic origins of these capital flows (c t c , 1991). In 1990, Europe provided 10% less direct investment in Latin America than the United States did, but six times as much as Japan, and the situation had been much the same throughout the preceding decade (see table 2).
During the 1980s Germany generally maintained its position as the largest European source of investment in Latin America, accounting for about a quarter of total European investment in the region (see figure 3). While the smaller countries and those with a shorter history of foreign investment -particularly Switzerland and, to a lesser extent, Sweden- adopted what might be described as a more “reserved” attitude towards crisis-shaken Latin America (see table 3 and figure 3), both the United Kingdom and France increased their share of total European investment. A major reason for this, in both cases, was these countries’ intensive use of mechanisms for converting external debt paper into direct investments. These swap mechanisms enabled them to transform a high-risk asset whose returns were uncertain into a lower-risk, higher-yield asset (Ffrench-Davis, 1989).
As a result of the above factors, during the latter half of the 1980s the level of European direct investment came to depend upon the extent of European banks’ exposure in the region and reflected the availability of debt paper in the countries where European firms were located. Thus, the United Kingdom, whose creditor banks were most heavily involved in Chile and Mexico, became the largest European investor in these countries during the period in question (see table 4).
7 The figures cited In this section should be regarded as no more than very rough estimates, since they are based on country sources which use differing definitions of FDI.
Table 2
LATIN AMERICA: BREAKDOWN OF FDI STOCK, BY GEOGRAPHIC ORIGIN,
1980-1990a
(Percentages)
Origin 1980 1985 1989/1990
Western Europe 38.7 35.5 636.4United States 43.5 46.1 45.9Japan 6.3 6.4 6.0Other 11.5 12.0 11.7
Total 100.0 100.0 * 100.0
Source: Joint ECLAC/CTC Unit on Transnational Corporations. a The data shown are estimates based on information for Argentina (figures for 1989 are used in the place of data for 1990), Bolivia, Brazil, Colombia, Chile (1979 figures take the place of 1980 data), El Salvador, Guatemala (does not include 1990), Honduras (does not include 1980 or 1985), Mexico (1989 is used instead of 1990), Paraguay (does not include 1980), Peru, Dominican Republic (does not include 1980 or 1985) and Venezuela.
Figure 3
LATIN AMERICA: EUROPEAN DIRECT INVESTMENT, BY SOURCE,
1980 AND 1989/1990
(As percentages o f stock o f European f d i )
£ 3
Source: Joint ECLAC/CTC Unit on Transnational Corporations,
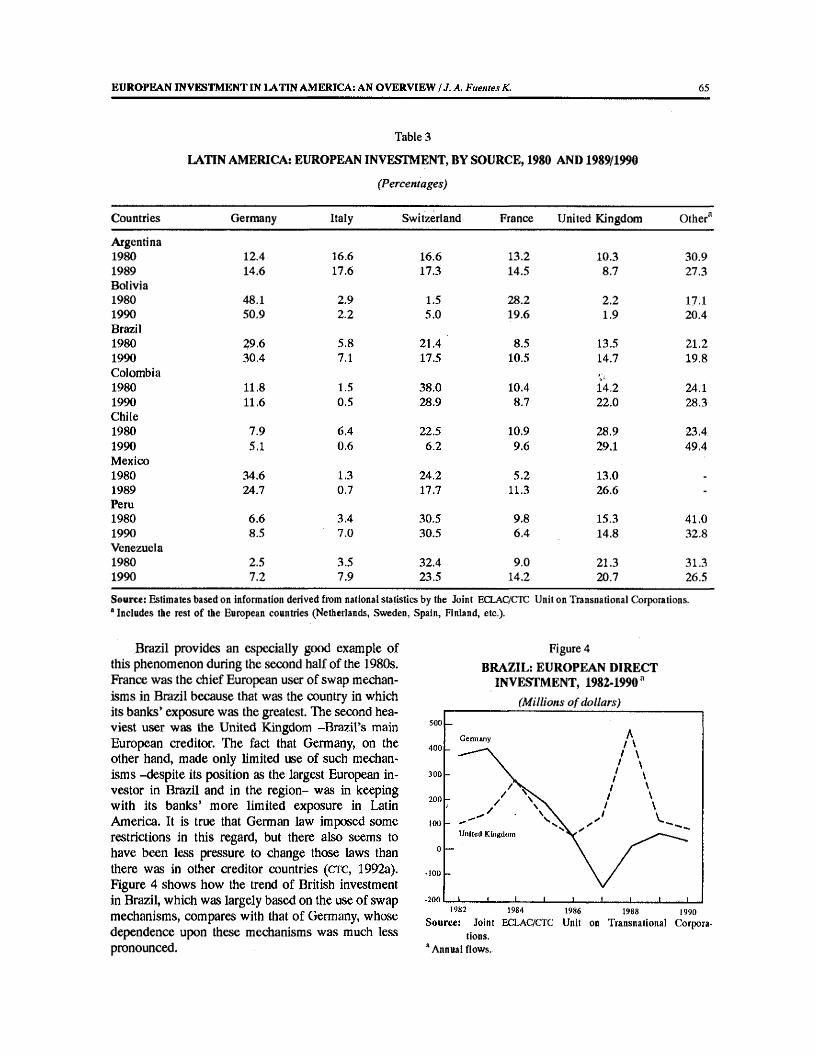
EUROPEAN INVESTMENT IN LATIN AMERICA: AN OVERVIEW /J . A. Fuentes K. 65
Table 3
LATIN AMERICA: EUROPEAN INVESTMENT, BY SOURCE, 1980 AND 1989/1990
(Percentages)
Countries Germany Italy Switzerland France United Kingdom Othera
Argentina1980 12.4 16.6 16.6 13.2 10.3 30.91989 14.6 17.6 17.3 14.5 8.7 27,3Bolivia1980 48.1 2.9 1.5 28.2 2.2 17.11990 50.9 2.2 5.0 19.6 1.9 20.4Brazil1980 29.6 5.8 21.4 8.5 13.5 21,21990 30.4 7.1 17.5 10.5 14.7 19.8Colombia1980 11.8 1.5 38.0 10.4 14.2 24.11990 11.6 0.5 28.9 8.7 22.0 28.3Chile1980 7.9 6.4 22.5 10.9 28,9 23.41990 5.1 0.6 6.2 9.6 29.1 49.4Mexico1980 34.6 1.3 24.2 5.2 13.0 -
1989 24.7 0.7 17.7 11.3 26.6 -
Peru1980 6.6 3.4 30.5 9.8 15.3 41.01990 8.5 7.0 30.5 6.4 14.8 32.8Venezuela1980 2.5 3.5 32.4 9.0 21.3 31.31990 7.2 7.9 23.5 14.2 20.7 26.5
Source: Estimates based on information derived from national statistics by the Joint ECLAC/CTC Unit on Transnational Corporations. a Includes the rest of the European countries (Netherlands, Sweden, Spain, Finland, etc.).
Brazil provides an especially good example of this phenomenon during the second half of the 1980s. France was the chief European user of swap mechanisms in Brazil because that was the country in which its banks* exposure was the greatest. The second heaviest user was the United Kingdom -Brazil’s main European creditor. The fact that Germany, on the other hand, made only limited use of such mechanisms -despite its position as the largest European investor in Brazil and in the region- was in keeping with its banks’ more limited exposure in Latin America. It is true that German law imposed some restrictions in this regard, but there also seems to have been less pressure to change those laws than there was in other creditor countries (c t c , 1992a), Figure 4 shows how the trend of British investment in Brazil, which was largely based on the use of swap mechanisms, compares with that of Germany, whose dependence upon these mechanisms was much less pronounced.
Figure 4BRAZIL: EUROPEAN DIRECT
INVESTMENT, 1982-1990 a(Millions o f dollars)
Source: Joint ECLAC/CTC Unit on Transnational Corporations.
a Annual flows.

66 CEPAL REVIEW No. 48 iDecember 1992
Table 4
LATIN AMERICA (FOUR COUNTRIES): SHARE OF EUROPEAN FDI IN TOTAL DEBT-FDI SWAPS
(Cumulative data for 1985-1989 and percentages)
SourceArgentina Brazil Chile Mexico
% % % %
Europe 44 40 34 32United Kingdom 2 (16) 6 (17) 14 (15) 14 (17)Germany 2 (?) 2 (7) 1 (3) 6 (2)France 5 (6) 11 (12) 4 (0) 3 (6)Spain 7 1 7 3Switzerland 8 (4) 6 (3) 5 (2) 2 (2)Italy 11 (4) 2 (1) 2 (1) 0 (2)Benelux 6 4 0 2Other 3 8 1 2
Rest o f world 56 60 66 68
Total 100 (100) 100 (100) 100 (100) 100 (100)
Source: Estimates based on figures supplied by the Joint ECLAC/CTC Unit on Transnational Corporations.Note: The bracketed figures refer to the percentage of each Latin American country’s total commercial bank debt with the banks of
each European country. The data (for 1987) correspond to commercial bank debt in the United Kingdom, Germany and France, and to Swiss and Italian commercial banks. (Source: World Debt Tables 1989-90, vol. 2, Washington, D.C., 1989; and World Bank, Financial Flows to Developing Countries. Carrent Developments, Quarterly Review, Washington, D.C., December 1991,)
In line with various European countries’ preexisting patterns of direct investment, European fd i was more heavily concentrated in the manufacturing sçctor than was fd i from other regions during the period in question (1980-1991), In fact, a negative correlation has been observed between German investment in developing countries and its natural- resource imports (Juhl, 1979). Furthermore, the United Kingdom’s oldest investments in Latin America tend to be concentrated in public services and to be associated with a subsequent disinvestment, although in some countries (including Brazil), it has retained its interest in the British-Netherlands oil company, Shell (Abreu, 1988). Even Swedish firms, which hail from a heavily natural resource- based manufacturing sector, have invested in Latin American electronics, metal products and machinery, and chemicals rather than in its mining sector (Blomstrom, Giorgi, Tansini and Zejan, 1987; Garcia,1989).
Thus, during the 1980s European direct investment’s share of total investment, when measured on a country-by-country basis, either held steady
(Argentina and Brazil) or increased (Mexico and Venezuela) in those countries where the lion’s share of fdi had been concentrated in the manufacturing sector in the past (see tables 5 and 9). In countries where there was a larger and growing percentage of total fd i in the mining sector (e.g., Chile, Colombia and Bolivia), European direct investment was concentrated in the secondary sector and -increasingly- in the services sector; 8 it did not, however, attain the same degree of dynamism as displayed by the rest of fd i in these countries’ primary sectors, and therefore lost ground in these cases. This is why European direct investment continues to be concentrated in the countries that have the largest manufacturing sectors.
gIt is significant that the percentage of total European di
rect investment in the primary sectors of Chile and Peru (about 10% in both countries at the start of the 1990s) is much smaller than the percentage of total foreign direct investment in this sector (35% in Peru and 51% in Chile). (Source; Joint ECLAC/CTC Unit on Transnational Corporations.)

EUROPEAN INVESTMENT IN LATIN AMERICA: AN OVERVIEW / J. A. Fuentes K. 67
The distribution of European direct investment among the countries of the region has also changed according to the speed of each country’s growth, thereby corroborating the positive correlation between growth and European investment or, in other words, the latter’s procyclical character. While Brazil remained the main destination for European direct investment, receiving over half the total stock of f d i, Mexico nudged Argentina out of second place as Argentina’s share shrank from 20% in 1980 to around 10% in 1989-1990 while Mexico’s climbed from about 14% to nearly 23%. Venezuela and Chile also increased their shares of inward European direct investment, although not as dramatically (see figure 5).
In keeping with Europe’s tendency to channel its FDI towards the more industrially developed countries rather than towards countries that rely more heavily on the extraction of their natural resources (note, in table 5, the steep drop in the percentage of Chile’s total fd i corresponding to European direct investment), only a very slight decline was observed in the percentage of European direct investment in Argentina, Brazil and Mexico (the three most highly industrialized countries in the region), which were receiving around 90% of the total stock of European direct investment by the close of the 1980s.9 The fact that this percentage has remained more or less constant can also be taken as an indication that there have been no major changes in European investment in the region, which, once established, has favoured the maintenance or modernization of existing plants over the implementation of new projects. Some studies on f d i in general appear to show that investment in the manufacturing sector -especially when directed towards a large market- tends to generate inertial forces that perpetuate the established pattern (Langhammer, 1991). Thus, just as the presence of risk may lead to the postponement of investment decisions (entry), in this case it would seem that the prospect of future returns on an existing investment discourages disinvestment (exit) even when there is a possibility of present losses (Dixit, 1992).
9 Although investment from other countries also continued to exhibit this type of concentration, it changed more than European investment did. The concentration of direct investment from the Ignited States in these same three countries was reduced by six percentage points (from 81% to 75%) and the concentration of Japanese investment was five points lower (dropping from 97% to 92%). (Source: Joint ECLAC/CTC Unit on Transnational Corporations.)
Table 5
SHARE OF EUROPEAN FDI IN TOTAL STOCK OF FDI IN EACH
COUNTRY
(Percentages)
Countries* 1980 1985 1989/90
Argentina 52.8 48.9 48.0Bolivia 13.7 11.6 10.3Brazil 47.3 42.9 49.6Chile 40.6 32.1 17.8Colombia 23.7 21.6 17,1El Salvador 14.2 17.8 17.5Mexico 23.1 23,8 26.3Peru 22.0 23,0 22.5Venezuela 17.4 24.3 28.5
Source: Joint ECLAC/CTC Unit on Transnational Corporations. a See footnote a of table 2.
60
50
40
30
20
10
0
Source: Joint ECLAC/CTC Unit on Transnational Corporations.
Figure 5
LATIN AMERICA: TOTAL EUROPEAN DIRECT INVESTMENT,
1980 AND 1989/1990
(Percentage breakdown of stock)
CD 1980
H i 1989/90

68 CEPAL REVIEW No. 48 / December 1992
The relative lack of growth in European direct investment in the region, as well as its increase in the United States and within the European Community itself, was also reflected in a steady decrease in the percentage of the total stock of such investment that was directed to Latin America during the period starting in the second half of the 1970s and ending at the close of the 1980s (see table 6). This points up a relative decline in the Latin American economies' importance to Europe, in contrast to their growing importance for the United States, and suggests that this situation could foreshadow a process of inter-American integration involving an expansion of United States investment and a decrease in European investment. Europe's trade profile has also weakened, with Latin America's percentage of the European Community’s total trade dropping from 6.7% in 1980 to 5.7% in 1990 ( e c l a c , 1992b).
Table 6
LATIN AMERICA: SHARE OF TOTAL FDI FROM EUROPE AND UNITED STATES,
1974-1989(Percentages)
Source 1974-1979 1980-1985 1986-1989
EuropeanCommunity 9.4 5.2 2.2Germany 13.8 7.5 4.0Spain 50.8 30.0 13.5France 14.0 7.5 2.1Italy 7.7 9.9 6.8Netherlands 8.5 4.1 2.1United Kingdom 5.6 2.7 0.8
United States 11.6 19.6 10.2
Source; Ministry of Economic Affairs and Finance of Spain and Spanish Agency for International Cooperation (AECJ), El vínculo Iberoamérica-Comunidaá Europea, Planes, políticas y estrategias de desarrollo, Madrid, March 1992 (table 6, p. 14).
I ll
The adjustment of European investment in Latin America
1. Global factors
Just as in the case of exports, f d i, too, can be expected to exhibit a certain degree of specificity based on each source-country's competitive strengths (Porter,1990), Aside from the specific types of characteristics attributable to differences in the quality and availability of natural, human and financial resources, there is some evidence to suggest that three “models” of entrepreneurial development are emerging (one for each of the three members of the investment triad mentioned earlier) which may be influencing corporate processes of adjustment and innovation in each of the corresponding countries or regions (Ostry, 1990). According to this view, when the European model, in particular, found that competition from the United States and, especially, Japan was threatening it with possible stagnation and recession at the start of the 1980s, its response took the form of an aggressive technological policy and the 1992 Single European Market (Ostry, 1990, pp. 70-72). The climate created by this uncertain transition in Europe and the crisis in Latin
America affected the performance of European firms having investments in the region during the 1980s. The following analysis of the position of the main goods-producing European companies in Latin America will use these firms' export performance as an indicator of their degree of adjustment and of their contribution to Latin America’s efforts to carve out a place for itself within the world economy.10
This analysis is based on information concerning the 500 largest firms in terms of sales and the region’s 100 largest exporters, and has been supplemented with data on major Argentine, Brazilian and Mexican companies (América Economía, 1990a and 1991b). This information provides further evidence of the oligopolistic nature of European investment in the region, its concentration in Brazil, and
10 A more exhaustive analysis -which would go beyond the bounds of this article- would call for an assessment of their contribution in terms of scarce inputs such as technology, management expertise, marketing know-how and capital, as well as their costs (Helleiner, 1989). Within this framework, such firms’ export performance would serve as a rough indicator -within certain limits- of their contribution to any increase in the competitiveness of each host country.

EUROPEAN INVESTMENT IN LATIN AMERICA: AN OVERVIEW / J. A. Fuentes K. 69
Germany’s position as the leading European source country. In 1989, more than half (34) of the 60 European firms with the largest sales were concentrated in Brazil, and a significant number of them (18) were to be found in Argentina, whereas only five were located in Mexico and just three were in Chile. Moreover, one-third (21) of these companies were German, 10 were from the United Kingdom, 8 from Italy, 5 from Switzerland, 5 from France, 4 from Sweden and the remainder from Spain, Finland and the Netherlands (América Economía, 1990a).
However, although 16 of the 100 national and foreign firms with the largest sales in Latin America in 1989 were European affiliates and these firms accounted for nearly 14% of the total value of this group’s sales, in 1990 there were only seven European affiliates among the 100 largest exporters and those seven accounted for less than 4% of the group’s total exports in terms of value (see table 7). In contrast, 22 of the 100 largest exporters were United States subsidiaries, and these companies contributed over 12.5% of the total value of the group’s exports (América Economía, 1991b).
There are three possible reasons for the European firms’ poorer showing in terms of exports. First of all, as became clear when the information on fd i was analysed at a more aggregated level, Europe’s lack of a competitive edge in natural resources and staple foods has been reflected in the limited nature of its foreign investment in these sectors, which have traditionally been export-oriented. Of the 60 main affiliates founded by European transnationals in the region, in 1989 only one was engaged in mining and two in drilling for oil (see table 8), while the producers of processed foods (including Nestlé) and tobacco were primarily oriented towards supplying the local market.
The European companies’ more limited involvement in natural resource-based activities may also be reducing their chances of forming strategic alliances with large Latin American export and foreign investment firms, most of which tend to be based in the mining and petroleum industries. Nevertheless, the presence of at least some room for cooperation is demonstrated by the fact that c e m e x (Cementos Mexicanos) and c o d e l c o (Corporación Nacional del Cobre de Chile) have investments in Europe and by the existence of what could be regarded as a strategic alliance between Petróleos de Venezuela s.a . (p d v s a ) and British Petroleum in connection
with the development and marketing of fluidized coal (América Economía, 1990b and 1991a).
The second possible reason for European firms’ poorer export performance is that Mexico, where the scale and percentage of United States investment is greater, made more rapid progress in terms of stabilization, trade liberalization and export growth during the period 1988-1991 than did countries such as Argentina and Brazil, where there are relatively more European companies. Given the geographic make-up of fd i in Mexico, more United States than European firms would have been both stimulated and pressured into competing and boosting their exports.
Specifically, the trade liberalization programme launched in Mexico during the second half of the 1980s was accompanied by a drive to liberalize the terms and conditions pertaining to incoming f d i . fdi in the maquila, or in-bond assembly, industry had been encouraged since 1973; in fact, at first this was the only sector in which 100% foreign ownership was permitted. Then, in 1985, the authorities began to take a more flexible attitude towards the application of laws relating to fd i in general, and in the following years investment was given a particularly strong stimulus in the form of debt-equity swaps. In 1989 and 1990 authorization for 100% foreign ownership was broadened to include a wide range of sectors within the Mexican economy. Similar steps were taken in other countries as well, such as Argentina and Venezuela, which, along with Chile, were the first countries to eliminate major restrictions on the repatriation of profits and capital.
A third possible reason for the export performance of European companies is that they have generally been slower than other transnational corporations to set up in-bond assembly activities in other countries or to incorporate new technologies as a means of adapting to today’s more competitive world -a world in which Japanese and South-East Asian corporations increasingly hold sway (Morti- more, 1992). Latin America’s remoteness, the ready supply of cheap labour to be found in North Africa and large-scale immigration probably account for the absence of European maquila operations in the region. This situation stands out in sharp contrast to the active involvement of United States and Japanese firms in northern Mexico and to the Republic of Korea’s recent concentration of investments in the maquila industry in Central America, particularly

70 CEPAL REVIEW No. 48 / December 1992
Table 7
LATIN AMERICA: SALES AND EXPORTS OF THE LARGEST UNITED STATES AND EUROPEAN FIRMS LOCATED IN THE REGION a
(Percentage share in sales and exports o f 100 largest companies)
1989 1990Major companies Number of firms
(%)Sales Number of firms
(%)Exports
European firms United States firms
1611
1411
722
413
Source: “Ranking 500," América Economía, Nc 44, Santiago, Chile, October 1990; “Ranking 100 exportadores”. América Economía, N“ 54, Santiago, Chile, September 1991,
a Includes only those companies that were among the top 500 firms in terms of sales in 1989. The weighting of companies in each country may vary due to exchange rate variations.
Table 8
LATIN AMERICA: SECTORAL DISTRIBUTION OF AFFILIATES OF LARGEST COMPANIES WITH EUROPEAN CAPITAL, 1989
Sector Germany Italy UnitedKingdom France
Nether- Switzer- lands land
Sweden Spain Finland Total
Mining 1 1Tobacco and food 2 1 3 6Textiles 1 1Construction 2 2Petroleum 2 2Chemicals 8 1 4 1 2 16Iron and steel 1 2 3Heavy equipment 3 1 4Motor vehicles 6 2 2 2 1 13Tyres 1 1 2Electronics 2 1 2 2 7Telecommunications 1 1 2Airlines 1 1
Total 21 8 10 4 2 7 4 1 3 60
Source: Calculated on the basis of “Ranking 500”, América Economía, N“ 44, Santiago, Chile, October 1990.
Guatemala (Choi, 1992). As for the idea that European companies are slower to incorporate new technologies, if this is true, then in view of each European country’s differing comparative advantages, the impact of this characteristic can be expected to vary from one sector to another. For example, a technological lag would tend to be more noticeable in the automobile and computer industries than in the chemical industry.
In short, the combined effect of lower European investment in natural resources; certain Latin American countries’ more rapid progress in terms of stabilization, liberalization and export promotion; and, possibly, slower technological rationalization and adjustment on the part of European firms has been reflected in a smaller percentage of large companies (in terms of sales) which have at the same time figured among the largest exporters, in the cases of Brazil

EUROPEAN INVESTMENT IN LATIN AMERICA: AN OVERVIEW /./. A. Fuentes K. 71
and Argentina, and, inversely, a larger percentage of firms among the major exporters in countries such as Mexico, Colombia and Chile. Thus, whereas only seven of the 500 largest corporations of Latin America (in terms of sales) in 1989 were in Mexico, this country had 13 of the region’s 100 largest exporters in 1990. The corresponding figures for Colombia are 2 and 8, respectively, and for Chile, 2 and 5. And of Mexico’s 13 major exporters, only two were European (Volkswagen and Renault), while Colombia and Chile had only one each (Shell and Río Tinto Zinc) (América Economía, 1991b and 1990a).
2. The impact o f sectoral policies
The sectoral policies adopted by some Latin American countries in the 1980s illustrate the interrelationship which, as the region’s integration into the world economy increases, arises between the behaviour of foreign investment and various policy tools, including foreign-exchange requirements, public-sector hiring, restrictions on the percentage of foreign ownership, rules of origin and regulations concerning promotion activities. These policies have been of particular importance in the chief sectoral destinations of European direct investment, such as the automobile, chemical and electronics industries.
Brazil’s automobile industry was the first to begin to export on a significant scale, thanks at least in part to a government incentive programme (Fritsch and Franco, 1991, p. 115), but its export growth flattened out in 1990 and 1991, precisely at the time that just the opposite was occurring in Mexico. Ever since 1983 the Mexican Government had been pursuing a programme designed to strengthen the automobile industry by ensuring its self-sufficiency in terms of foreign exchange and reducing the number of models produced (Peres, 1990, pp. 116-117). This reinforced an ongoing process of investment in and rationalization of existing factories in Mexico; at the same time, new plants were being built which, at first, were run by United States subsidiaries (Chrysler, Ford and General Motors). These enterprises benefited from their special ties to the United States market and, in particular, from the potential for intra-firm trade, while European (Volkswagen and Renault) and Japanese (Nissan) corporations lagged somewhat behind or encountered other difficulties.
By 1987, the Mexican subsidiaries of Chrysler, Ford and General Motors were already exporting between 44% and 61% of the motor vehicles they
produced, whereas Nissan was exporting only 18.7% and Volkswagen only 0.1% (Peres, 1990, pp. 5-6). Consequently, the sector’s promotion policy tended to favour investment from the United States, which was in a better position to meet the challenges facing it. It is likely that the trade liberalization policy, which was made more comprehensive in 1987-1988, had a similar effect. The European firms’ rationalization process did make headway, however, as was evidenced later on by the increased exports of Volkswagen, which became one of the region’s 20 largest exporters and was selling 34.3% of its output to buyers outside Mexico by 1990 (Expansión, 1991a). Meanwhile Renault, which had given up producing automobiles in Mexico in 1986, concentrated on exporting 100% of the motor vehicle parts it produced there.
Thus, European firms had to adapt to a set of rapidly changing circumstances which included heavy investment by their main competitors, macro- economic stabilization and trade liberalization policies, and sectoral requirements. This suggests that the trends observed in the automobile industry in Mexico are probably a reflection of a process of integration with the United States; it is also quite possible that United States investment may have played a predominant role in promoting that integration process (c t c , 1992b, p. 42).
In Brazil, on the other hand, European subsidiaries were the automobile industry’s top-ranked exporters in the mid-1980s. Nevertheless, United States firms do seem to have made some inroads during the decade, since they expanded their share of the major companies’ exports from 25.6% in 1980 to 34% ten years later.11 However, this all took place in the presence of severe macroeconomic imbalances (including an overvalued currency) which prompted a steep drop in exports of both trucks and automobiles despite their guaranteed access to some external markets. For example, notwithstanding their preferential access to a captive market (Italy), the Fiats produced in Brazil in 1990-1991 were less competitive and the firm’s ability to export those vehicles was therefore reduced. In this case, it is clear that, despite pre-existing investments, the absence of a stable economy ultimately cancelled out any stimulus which a sectoral policy could have generated.
11 The corporations taken into consideration here are the United States Big Three and Volkswagen, Fiat, Mercedes-Benz, Scania and Volvo. (Calculated on the basis of data supplied by the Joint ECLAC/CTC Unit on Transnational Corporations.)

72 CEPAL REVIEW No, 48 / December 1992
Macroeconomic disequilibria and differing longterm perspectives have also hindered the utilization of sectoral complementarity agreements between Argentina and Brazil. The significant level of direct investment from European sources in both countries -about half of the total stock of fd i in each case- could pave the way for both policy-led and investment-led economic integration (crc, 1992b, pp. 35-36). In particular, Volkswagen’s and Ford’s joint venture in a u t o l a t in a and the subregional perspective adopted by Nestlé (CTC, 1992b, p. 26) could serve as examples of convergent sectoral policies (in this case, involving the automobile and agribusiness sectors) and of investment-led integration, provided that trade and investment flows between the two countries are truly liberalized. In addition to the existing macroeconomic imbalances, differences among the governments of m e r c o s u r member countries with regard to regulations on and protection from competition from non-members (especially in relation to the automobile industry) have hampered efforts to arrive at common solutions (Worcel, 1992).
The chemical and electronics industries, for their part, illustrate the effects of policies that place varying degrees of restrictions on f d i access. In 1989, European enterprises played a leading role among the major corporations in the chemicals and petrochemicals sectors, particularly in Brazil and Argentina, but not in Mexico, where FDI -especially in petrochemicals- was restricted for strategic reasons. Even so, there were a considerable number of Mexican firms among the country’s main exporters, and they had a high export coefficient (an unweighted average of 50.4%) (Expansión, 1991a). Unlike the computer industry in Brazil, the technology required by the petrochemicals sector was neither overly complex nor captive, and firms’ competitive positions depended primarily on the supply of one natural resource: petroleum.
In Brazil’s electronics industry, European corporations turned in a better export performance than United States or Japanese firms did, even though the latter lead the field at the international level (Cantwell and Dunning, 1991). This is probably due to the fact that most of the European electronics firms were in the telecommunications subsector (Ericsson, Siemens and Pirelli), where, by mounting joint ventures which increased their percentage of Brazilian capital enough to meet the Brazilian Government’s standards regarding national ownership, they were able to win large contracts from t e l e b r a s (Fritsch and Franco, 1991, p. 93). These contracts enabled
them to generate economies of scale and, thus, to export.12 Faced with a partial restriction on f d i , European corporations were rewarded for their flexibility with attractive public-sector contracts. In the computer industry, on the other hand, strict requirements which staked out the entire domestic market for wholly Brazilian-owned firms limited the operational possibilities of such corporations as ibm while, at the same time, exacting technological requirements and protectionist policies limited Brazilian companies’ export opportunities.
Mexico’s electronics industry illustrates the potential importance of assembly (maquila) activities, where the prospects for greater integration and for endogenous technological development are uncertain when foreign firms holding an absolute technological advantage team up with weak national companies (Cantwell and Dunning, 1991). In this case, European corporations have lagged somewhat behind in terms of both their exports and their progress in making a maquila-based adjustment, whereas the three United States corporations have had a noticeably higher exports/sales coefficient (between 65.9% and 31.5%), as well as figuring among the 500 largest companies of Latin America and among Mexico’s principal exporters. In contrast, the only European corporation that has been ranked in both of these groups has had a much lower coefficient (4.5%), Furthermore, three Japanese exporters of television sets and other home electronics were also among Mexico’s five largest maquiladoras in 1990 (Expansión, 1991c).
3. New sectoral policy directions
As the process of deregulating and promoting foreign investment that was begun in Latin America in the latter part of the 1980s has proceeded, the traditional sorts of policies for regulating this type of investment at the sectoral level have begun to decline in significance. Two trends relating to European investment in the region are to be observed, however, that could take on increasing importance in respect of sectoral policy: the application of standards that discriminate against capital from specified geographical sources -as, in fact, rules of origin may well do- and sectoral f d i promotion.
12 The Philips corporation, for its part, was involved in the production of home electronics and had greater flexibility and access to imported inputs through its operations in the Manaus customs-free zone.

EUROPEAN INVESTMENT IN LATIN AMERICA: AN OVERVIEW / J. A. Fuentes K. 73
In spite of the possibility of having to make a difficult choice between exportation and national integration (Peres, 1990, chapter 3), in the case of Mexico's participation in n a ft a (North American Free Trade Agreement),13 it is ironic that the rules of origin are having much the same effect on Japanese and European firms as yesteryear’s national-content regulations did, with the difference that in this case they are discriminatory in nature. Generally speaking, they may have conflicting effects, and may give rise to any one of three different scenarios. First, given the need to export, the imposition of such standards could, within certain limits, contribute to the development of greater competitiveness, which would be reflected both in more exports and in more integrated and more efficient industrial sectors;14 this would tend to occur in the more industrialized countries. Second, they may promote the formation of enclaves of sectors that become integrated via intra-firm trade among foreign subsidiaries in the relevant countries; this would tend to occur in sectors where the technological lag separating national enterprises from foreign enterprises is considerable.
Third, the fact that such rules present obstacles or entail added costs may discourage export-oriented fd i and thereby promote its concentration in the larger markets. This may be of importance in the light of the Enterprise for the Americas initiative, under which national origin rules, when applied to capital, would in effect discriminate against countries where there is more non-United States f d i. Thus, there is a risk that national origin rules could become an increasingly restrictive and discriminatory sectoral policy tool, when what is wanted is just the opposite (Fuentes, 1991a). Furthermore, the growing use of
rules of origin for protectionist purposes provides a valid argument for setting common external tariffs as a way of reducing their impact. A danger also exists that other investment rules may be applied in a discriminatory manner, as in the case of mergers and acquisitions {Inside US Trade, 1992); given the absence of a multilateral framework in this area, however, regional agreements may serve as the foundation for subsequent multilateral accords (c t c , 1992b, pp. 44-45).
Even the largest corporations do not really examine the entire array of investment situations or opportunities that exist worldwide, however, but instead tend to follow in the steps of their competitors (Bélot and Weigel, 1991, p. 53). This constitutes an argument for the types of programmes which various developed countries (including a number of European countries and the European Community) have for promoting foreign investment. The European Community’s programme, in particular, provides assistance in the identification of sectors, countries and firms which may be suitable sites for projects and financing for research, investment and training (Commission of the European Communities, 1991). Nevertheless, the desirability of targeting promotion efforts, the existence of economies of scale in these activities, and the successful experiences of some countries (e.g., Costa Rica and the Dominican Republic) in attracting f d i to such sectors as textiles and electronics all point to the advisability of having sectoral promotion programmes for specific countries while, at the same time, linking and coordinating the promotion programmes of international agencies, developed nations and developing countries (Bélot and Weigel, 1991, pp. 56-57 and 64-65).
IV
Services, privatization and European investment
When the manufacturing sector’s growth began to slow to a standstill or even go into reverse in the 1980s, its relative share of fdi diminished in the vast
13 Signed by Canada, Mexico and the United States.14 This was the thrust of the investment decisions taken in
Mexico by Nissan, when it expanded its local production of automobile parts, and by Volkswagen, when it boosted its national content from 60% to 80% (Expansión, 1991b).
majority of the region’s countries (see table 9). This was coupled with an increase in the share of investment going to services in the larger countries (Argentina, Brazil, Peru and, especially, Mexico). In addition to a larger amount of foreign investment in its tourism industry, Mexico -along with Argentina, Chile and Venezuela- received a considerable flow of foreign investment in telecommunications as a

74 CEPAL REVIEW No. 481 December 1992
(Percentages)
Table 9
LATIN AMERICA: SECTORAL DISTRIBUTION OF TOTAL STOCK OF FDI, 1980 AND 1990
Countries Primary Secondary Tertiary Total
Argentina1980 14.9 62.8 22,3 100.01989 14.0 60.4 25.6 100.0Bolivia1980 67.2 14.8 18.0 100,01990 71.4 13.2 15.4 100.0Brazil1980 3.7 74.4 21.9 100.01990 2.9 69.3 27.8 100.0Chile1983 41.2 25.3 33.5 100.01990 50.6 19.8 29.6 100.0Colombia1980 6.1 70.7 22.9 100.01990 45.9 42.4 11.6 100.0Costa Rica1980 45.8 43.2 11.0 100.01990 51.8 36.4 11.8 100.0El Salvador1980 1.7 52.8 45.5 100.01990 1.3 54.2 44.5 100.0Mexico1980 5.1 77.5 17.4 100.01990 L9 62.3 35.8 100.0Panama1980 14.3 50.3 35.4 100.01990 9.0 25.1 65.9 100.0Peru1980 43.8 34.3 21.9 100.01990 34.7 34.2 31.1 100.0Venezuela1980 1.8 61.7 29.3 100.01990 5.0 70.7 16.3 100.0Source: Joint ECLAC/CTC Unit on Transnational Corporations.
result of the privatization of enterprises in this sector. The expansion of f d i in these countries’ services sectors is in keeping with trends worldwide, particularly in the case of European f d i (c t c , 1991, pp. 18-20). In the remaining countries -including Bolivia, Chile, Colombia and Costa Rica- the concentration of fd i in the primary sector became more pronounced, in line with the nature of their position in the international economy (i.e., a position based on the utilization of the region’s natural comparative advantages).
Investors’ interest in the services sector has been heightened in recent years by the region’s movement in the direction of deregulation and privatization,
which has major implications in terms of competition, technological performance and discrimination. Within services, the subsector of telecommunications has been a favourite destination for foreign investment because the privatization process in this industry has been coupled with large-scale investments in which the level of risk is lower and the returns higher thanks to regulatory frameworks that ensure some degree of monopoly control (exclusive or restricted licenses) along with high, predictable rates, while penalties are confined to withdrawal of the license (e c l a c , 1991a). In addition, there is the possibility of making a profit by obtaining part of the discount at

EUROPEAN INVESTMENT IN LATIN AMERICA: AN OVERVIEW /J. A. Fuentes K. 75
which external debt paper is swapped, in cases where such instruments are involved. Yet another attraction is the strong possibility that the shares of privatized companies will rise in value on both national and international stock exchanges. Accordingly, European investment in the privatization of telecommunications enterprises has been significant (see table 10).
These privatization processes have a number of noteworthy characteristics. First, with the exception of Techint, all the European firms that appear in table 10 are government-owned, which creates somewhat of a paradox in cases of privatization. Second, assuming that ownership of around 20% of a company’s stock can be taken as a meaningful indicator of controlling interest when dealing with consortia involving a number of participants,15 the presence of European firms would appear to be decisive in five of the seven cases of privatization considered. Third, Telefónica de España’s role in these processes has been considerable, since it has been involved in five of the seven cases, although with no more than a clearly minority interest in c a n t v of Venezuela. Fourth, the segmentation of these markets has not always stimulated competition, at least not via the opportunity it would give to the Government to compare the performances of companies in the same sector. Argentina did manage to do this by dividing up the market geographically, but Chile’s vertical division of the market between local and longdistance calls failed to ward off the danger of some degree of monopolistic control by Telefónica de España.
Finally, the privatization of telecommunications companies has altered their relationship with their
15 In Argentina, Telefónica de España and Techint are part of the Cointel group (in which Citicorp also has an interest), which controls 60% of the stock of Telefónica de Argentina. Meanwhile, a local group, J. P. Morgan, France Telecom and STET of Italy own 60% of the shares in Telecom Argentina.
In Mexico, France Telecom, together with a United States company (Southwestern Bell), forms part of a consortium which includes a local group and which, as a result of the privatization process, now owns 20% of the stock.
In Venezuela, Telefónica de España is part of a consortium which also includes two United States firms (GTE and AT&T) and local companies and which, thanks to the privatization process, now owns 40% of the stock.
traditional -usually European- equipment suppliers, and increased competition in this sector is anticipated. In Brazil, the end of the State monopoly on such services as data transmission, cellular telephones and the installation of telecommunications infrastructure has sparked competition among a wide array of Japanese, United States and European firms. In Mexico, too, the possibility exists that Telmex will discontinue the practice of purchasing most of its equipment from Swedish and French companies and will give more business to Japanese or United States enterprises in the future (Business Latin America,1991).
In view of the fact that access to financing can constitute a significant entry barrier, there is a danger that this factor will overshadow a company’s technological advantages in the minds of corporate decision-makers when they are weighing the pros and cons of entering new markets. In the case of Argentina (and of ENTEL in Chile), for example, the privatization process has been associated with debt-equity swaps. This has limited the number of offers, since bidders have to be able to acquire a considerable amount of debt paper; indeed, the entrepreneurial groups whose offers were accepted had to join forces with two banks (Morgan and Citibank) in order to accomplish this.
Another services industry which has been influenced by deregulation and privatization is the airlines. Apart from s a s , the Scandinavian airline, the only other European line with direct investments in Latin American airlines as of the beginning of 1992 was the Spanish airline, Iberia. As part of a determined strategy for consolidating its presence in the region, where it was serving 18 destinations in early 1992, Iberia acquired shares through regular commercial transactions in privately-owned companies that were not the leading airline in their respective home countries (Austral and Ladeco) while it became the major shareholder in others (Aerolíneas Argentinas and vi a s a ) through its participation in the privatization of these concerns (see table 11). The role of access to financing as an entry barrier was illustrated in the Argentine case, where the privatization operation involved cash payments, installment payments and the purchase of external debt paper; a number of subsequent delays and complications were indeed encountered owing to the consortia members’ difficulties in obtaining the necessary financial resources.
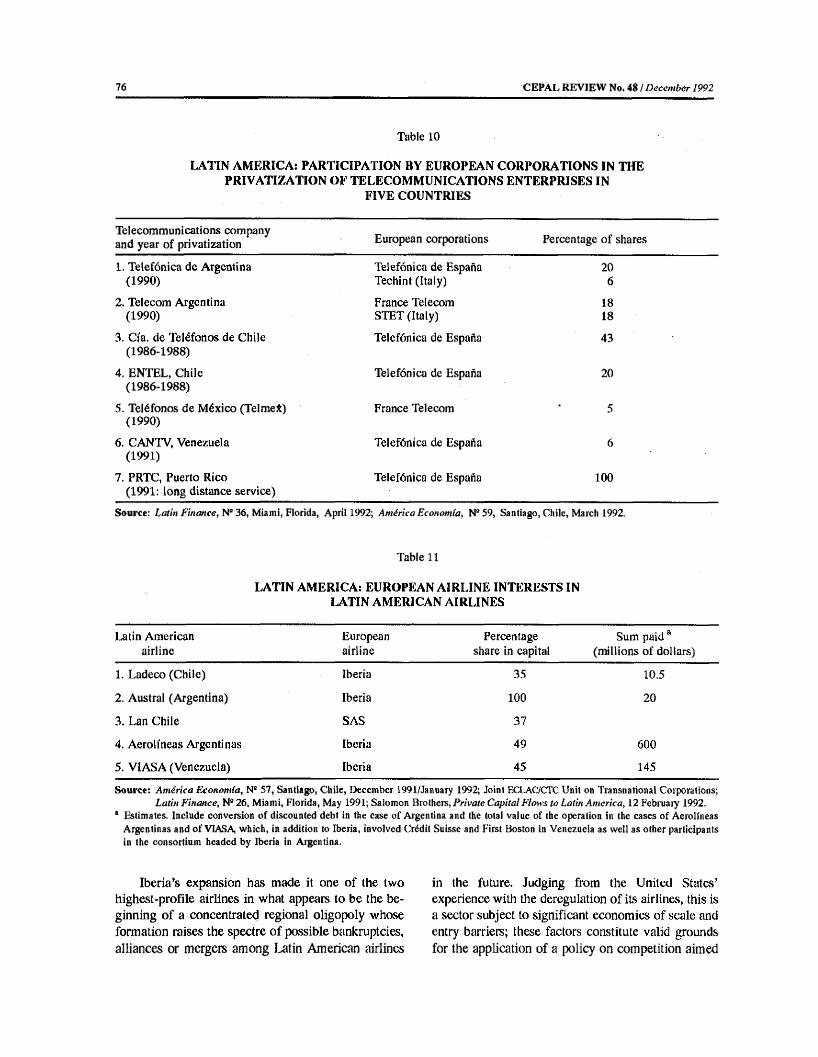
76 CEPAL REVIEW No. 48 i December 1992
Table 10
LATIN AMERICA: PARTICIPATION BY EUROPEAN CORPORATIONS IN THE PRIVATIZATION OF TELECOMMUNICATIONS ENTERPRISES IN
FIVE COUNTRIES
Telecommunications company and year of privatization European corporations Percentage of shares
1. Telefónica de Argentina (1990)
Telefonica de España Techint (Italy)
206
2. Telecom Argentina (1990)
France Telecom STET (Italy)
1818
3. Cía. de Teléfonos de Chile (1986-1988)
Telefónica de España 43
4. ENTEL, Chile (1986-1988)
Telefónica de España 20
5. Teléfonos de México (Telmelt) (1990)
France Telecom 5
6. CANTV, Venezuela (1991)
Telefónica de España 6
7. PRTC, Puerto Rico (1991: long distance service)
Telefónica de España 100
Source: Latin Finance, N°36, Miami, Florida, April 1992; América Economía, N“ 59, Santiago, Chile, March 1992.
Table U
LATIN AMERICA: EUROPEAN AIRLINE INTERESTS IN LATIN AMERICAN AIRLINES
Latin American European Percentage Sum paid aairline airline share in capital (millions of dollars)
1. Ladeco (Chile) Iberia 35 10.5
2. Austral (Argentina) Iberia 100 20
3. Lan Chile SAS 37
4. Aerolíneas Argentinas Iberia 49 600
5. VIASA (Venezuela) Iberia 45 145
Source: América Economía, N“ 57, Santiago, Chile, December 1991/January 1992; Joint ECLAC/CTC Unit on Transnational Corporations;Latin Finance, N° 26, Miami, Florida, May 1991; Salomon Brothers, Private Capital Flows to Latin America, 12 February 1992.
* Estimates. Include conversion of discounted debt in the case of Argentina and the total value of the operation in the cases of Aerolíneas Argentinas and of VIASA which, in addition to Iberia, involved Crédit Suisse and First Boston in Venezuela as well as other participants in the consortium headed by Iberia in Argentina.
Iberia’s expansion has made it one of the two highest-profile airlines in what appears to be the beginning of a concentrated regional oligopoly whose formation raises the spectre of possible bankruptcies, alliances or mergers among Latin American airlines
in the future. Judging from the United States’ experience with the deregulation of its airlines, this is a sector subject to significant economies of scale and entry barriers; these factors constitute valid grounds for the application of a policy on competition aimed

EUROPEAN INVESTMENT IN LATIN AMERICA: AN OVERVIEW i J. A. Fuentes K. 77
at regulating horizontal agreements concerning routes and vertical links between airlines and travel agencies (Bradburd and Ross, 1991). Moreover, in view of the transborder nature of the concentration process in this case, consideration should be given to the possibility of harmonizing or coordinating policies on deregulation and competition at the regional level. Events such as Japan's investment in Costa Rica's tourism industry and in its airline, Lufthansa’s conclusion of a cooperation agreement with Aerovías de México and its investment in a major tourism consortium in that country, and Iberia’s establishment of a regional office in the Dominican Republic could mark the beginnings of a gradual vertical integration of the airline and tourism industries (hotels, automobile rentals, domestic transportation) in the region, although this trend has not yet taken definite form.
In the case of tourism, two situations warrant discussion. First, Mexico and Cuba appear to have been the preferred destinations of tourism investment in recent years; part of the reason for this in the case of Mexico is the effect of debt-equity swaps in which British and Spanish investors have been deeply involved; Cuba, meanwhile, has seen an increase in Spanish investment in its hotel industry. Second, the growth of f d i in Cuba illustrates the extent to which I-atin America (including Cuba) has relaxed the laws on foreign investment.
Foreign banking in the region has probably been the sector of foreign investment most severely affected by the external debt crisis (e c l a c , 1989), as well as by a wave of bank nationalizations that began in Nicaragua in 1979, continued on to Mexico in 1982 and culminated in Peru in 1989. These processes were later reversed, but they none the less account for the absence of large-scale foreign banking operations on a regular basis in these three countries in the early 1990s. Meanwhile, the renegotiation of debt commitments with the commercial banking system and the relaxation of certain restrictions16 have opened up opportunities for some degree of expansion by foreign commercial banks in the rest of the countries.
16In the case of Brazil, for example, ah increase in the number of branch offices was authorized (see Bodin de Morães,1990).
At the start of the 1990s, the largest European banks in Latin America were from France and the United Kingdom, which were the most active European participants in the debt-equity swaps of the latter half of the 1980s. Table 12 ranks the largest foreign banks in the region according to the total amount of loans granted by their affiliates in each Latin American country. It will be noted that the list includes many European banks, in particular banks from: the United Kingdom (Lloyds Bank), France (Crédit Lyonnais), Spain (Santander), France and Italy (Sudameris) and Germany (Deutsche Bank). As of the early 1990s, these five banks all had large branches in Argentina and Brazil. In addition to the above banks, mention should be made of the presence maintained by banks from the Netherlands (Algemen Bank Nederland (a b n ) and Nederlandsche Middenstands Bank (n m b )) in various countries of the region and the importance of Italian banks (Banca N. del Lavoro, Banco di Napoli) in Argentina.
Spanish banks have also been playing a dynamic role in the region in the early years of this decade. In the aftermath of the debt crisis, these banks adopted a position which places greater emphasis on secondary-market debt conversions than on rescheduling, and as a result have reduced their exposure in the region to one- sixth of its former level (América Economía, 1989). The Spanish banking system also increased its investments in financial services in Mexico and turned Spain into the second-largest source (after the United Kingdom) of investment in financial services in Chile since 1974.17 The privatization of the banking system in Mexico did not spark an influx of foreign banks, although a Spanish bank does hold a minority interest in one of its newly privatized banks. Generally speaking, an intrare- gional liberalization of financial services in Latin America would find European banks in a particularly good position to take advantage of their presence in the region, although their degree of concentration would, on the other hand, justify considering the possibility of implementing a regionwide supervisory policy.
The importance of European banks in the region notwithstanding, United States banks have remained
17 The United Kingdom was the source of 39% of the investment made in financial services between 1974 and 1991 while Spain accounted for 28% (Source: Foreign Investment Committee (CiE) of Chile.)

78 CEPAL REVIEW No. 48 / December 1992
Table 12
LATIN AMERICA: MAIN FOREIGN COMMERCIAL BANKS, 1989 AND 1990
1989 1990
Rank3 Name Home country Rank3 Name Home country
1 Citibank United States 1 Citibank United States2 Sudameris France/Italy 2 Sudameris France/Italy3 Lloydsb United Kingdom 3 Boston United States4 Boston United States 4 Crédit Lyonnais France5 Santander Spain 5 Santander Spain6 Deutsche Bank Germany 6 Lloydsb United Kingdom7 Chase Manhattan United States 7 Deutsche Bank Germany
Source; América Economía, Santiago, Chile, October 1990 and October 1991.*The ranking shown here is a tentative one inasmuch as it is based on estimates and incomplete information for Argentina, Brazil,
Chile, Colombia, Ecuador, Mexico, Peru, Uruguay and Venezuela.hThe information for 1989 covers Lloyds’ operations in both Argentina and Brazil, whereas the information for 1990 includes its
Brazilian operations only; hence its descent from third place to sixth place in the ranking.
(América Economía, 1991b). Three of the five largestforeign financial institutions in Mexico in 1988 were European, but the overwhelming predominance of one United States enterprise in this group was attested to by the fact that the European institutions accounted for only 15% of the total value of the five enterprises’ operations for that year (e c l a c , 1990b).
in the lead (ECLAC, 1989), with first-ranked Citibank’s exposure being double that of Sudameris, the next largest lender. Moreover, if foreign banking operations in each country are considered separately, Citibank of Brazil and Citibank of Argentina turn out to be the largest foreign banks, followed by Sudameris and Lloyds in Brazil and Santander in Chile
y
Conclusions
There is some concern in Latin America about the possibility of European investment being diverted to other destinations. The causes for this concern are the creation of the Single European Market, the reunification of Germany, the support being provided to Central and Eastern Europe, and the move made by member countries of the European Free Trade Association (e f t a ) to join the European Community. Nevertheless, an analysis of f d i trends overall and particularly in countries such as Mexico and Chile up to 1991 actually points to a possible upturn and the gradual emergence of an increasingly favourable outlook for investment from Europe and the rest of the world in Latin America,
From a schematic viewpoint, this trend’s point of departure is a stage marked by the subsidization of
FDI via debt-equity swaps. In this case, the subsidy incorporated into such swaps tends to offset the perception of crisis-generated risk and can help to trigger a flow of f d i, especially from countries whose commercial banks are heavily exposed in the Latin American nation participating in the swap. Such fd i source-countries are attracted by the prospect of converting a low-yield, high-risk asset (debt paper) into a lower-risk and potentially higher-yield one (direct investment).
There will, of course, be less of a need to resort to such a subsidy in order to attract foreign investment as the region stabilizes its economies and consolidates its advances through fiscal reforms and successful external debt renegotiations, since this will make other investment opportunities more

EUROPEAN INVESTMENT IN LATIN AMERICA: AN OVERVIEW / J. A. Fuentes K. 79
attractive. For example, if share prices climb on the stock exchange in response to expectations of future growth, this will encourage inflows of foreign portfolio investment. Privatizations also help to attract portfolio investment and additional direct investment, not only because of the returns they themselves offer but also because of the signals which they send out regarding the relevant country’s development strategy.
It is possible that special treatment for domestic investment could also help to spur this type of investment, and both domestic and foreign investment could help open up other new investment opportunities. In any event, if a new, clearly-defined development strategy is seen to have taken hold, longer-term expectations of a sort conducive to foreign investment (particularly in new, longer lead- time direct investment projects) could be generated. As expectations continue to brighten, the region’s economic integration -whether at the hemispheric, subregional or bilateral level- could further reinforce movement in this positive direction.
As part of this process -which is either only just beginning or still incomplete in the great majority of Latin American countries- the nature of European investment in the region has been changing. First of all, European corporations (particularly British firms in Mexico and Chile, and French companies in Brazil) made considerable use of debt-equity conversion mechanisms during the second half of the 1980s. This fact, when considered in conjunction with German enterprises’ limited use of these mechanisms, indicates that the level of European commercial banks’ exposure in Latin America, rather than the returns to be had on direct investment per se, has been the chief determinant of the extent to which each European country has engaged in swaps and, hence, of the investments each has made in the region in the past.
Based on this dynamic, and with the aid of their pool of technological resources, European investors have followed a policy of holding their investment in Latin America’s rather sluggish manufacturing sectors at more or less constant levels. The status of these sectors, the predominance of European investment in countries (e.g., Argentina and Brazil) which made relatively less headway than others in carrying forward their stabilization and adjustment programmes during the second half of the 1980s, and the
implementation of what have in some cases been discriminatory sectoral policies compounded the situation created by the slower pace of modernization and export promotion programmes in European firms as compared to other foreign enterprises in the region. These firms’ export performance has begun to improve as policies designed to stabilize the economy and to change production patterns have promoted a more rapid rationalization of business enterprises in general, as in Mexico, or as a result of expectations that a progressive integration of all the Latin American countries into the world economy is inevitable.
In addition, European investment largely stayed away from natural resources -a major destination for foreign investment in many countries of the region- and its share of total fdi in these countries, and particularly in Chile, therefore declined. However, European capital subsequently increased its involvement in the services sector through debt swaps and, especially, privatizations. Noteworthy aspects in this last regard include the participation of government-owned European corporations and the expansion of Spanish investment in telecommunications, air transport and financial services. In view of the inflow of foreign investment which generally accompanies deregulation and liberalization drives in Latin America, the need arises to examine the questions of supervision and of regionwide policies on competition.
The Latin American countries are laying the groundwork for changes in their production patterns and for the entry of foreign investment by modifying their sectoral policies as well as their macroeconomic and trade policies. This process may be hampered, however, if restrictive investment regulations are put into effect which discriminate against certain geographic sources of capital, as may be the case with rules of origin; under such circumstances, the conclusion of free trade agreements or the formation of regional trade blocs may discourage European investment. It is hoped that transnational corporations’ progressive globalization of their activities will facilitate the harmonization of regulations on foreign investment so that they will serve as a foundation, rather than constituting a stumbling block, for a transparent economic order in which multilateral arrangements are the predominant force (c t c , 1992b, p. 45).

80 CEPAL REVIEW No, 481 December 1992
Bibliography
Abreu, M. (1988): British investment in Brazil: the relevant century, 1850-1950, Discussion Paper No. 192, Rio de Janeiro, Catholic University of Rio de Janeiro, Department of Economics.
América Economía (1989): No. 28, Santiago, Chile, December.
(1990a): No. 44, Santiago, Chile, October.— (1990b): No. 46, Santiago, Chile, December.— (1991a): No. 54, Santiago, Chile, September. (1991b): No. 55, Santiago, Chile, October. (1991/92): No. 57, Santiago, Chile, December-
January.— (1992): No. 59, Santiago, Chile, March.Asimakopulos, A. (1991): Keynes’s General Theory and
Accumulation, Cambridge, MA, Cambridge University Press.
Bélot, T. and D. R. Weigel (1991): Programs in Industrial Countries to Promote Foreign Direct Investment in Developing Countries, World Bank Technical Paper No. 155, Washington, D.C., World Bank.
Blomstrõm, M., E. Giorgi, R. Tansini and M. Zejan(1987): Inversiones nórdicas en América Latina, Gothenburg, Gothenburg University.
Bodin de Moraes, P. (1990): Foreign banks in the Brazilian economy during the 1980s, Discussion Paper No. 241, Rio de Janeiro, Catholic University of Rio de Janeiro, Department of Economics.
Bradburd, R. and D. Ross (1991): Regulation and Deregulation in Industrial Countries. Some Lessons for LDCs, Policy, Research and External Affairs Working Paper No. 699, Washington, D.C., World Bank, June.
Buitelaar, R. and J. A. Fuentes (1991): The competitiveness of the small economies of the region, CEPAL Review, No. 43 (LC/G.1654-P), Santiago, Chile, April.
Business Latin America (1991): New York, Business International Corporation, 19 August.
Cantwell, J. A. and J. Dunning (1991): Multinational enterprises, technology and competitiveness of European industries, Aussenwirtschaft, 49 Jahrgang, Heft 1, Zürich, Verlag Rüegger, April.
CEC (Commission of the European Communities) (1991): Dirección General XXIII, política de la empresa, comercio, turismo y economía social, dirección B, medidas comunitarias en favor de las empresas, Unidad 2, mejora de la cooperación y el desarrollo transnacional de las PYMES, Brussels, Centro de Cooperación Empresarial, November.
Choi, D. W. (1992): Las relaciones económicas entre América Latina y el Sudeste Asiático: de la inserción comercial hacia una integración productiva en la Cuenca del Pacífico, Santiago, Chile, April, mimeo.
Corbo, V. and P. Rojas (1991): World Bank-Supported Adjustment Programs. Country Performance and Effectiveness, Policy, Research, and External Affairs Working Papers, WPS 623, Washington, D.C., World Bank, March.
CTC (United Nations Centre on Transnational Corporations) (1991): World Investment Report 1991. The Triad and Foreign Direct Investment, New York. United Nations publication, Sales No. E.91.II.A.12.
(1992a): Transnational Banks and the External Indebtedness o f Developing Countries, UNCTC Current Studies, Series A, No. 22, New York. United Nations publication, Sales No. E.92.II.A.10.
(1992b): World Investment Report 1992. Transnational Corporations as Engines o f Growth, New York. United Nations publication, Sales No.E.92.II.A.19.
Dixit, A. (1992): Investment and hysteresis, The Journal of Economic Perspectives, vol. 6, NB 1, New York, American Economic Association, Winter.
Dornbusch, R. (1990): Policies to move from stabilization to growth, Proceedings of the World Bank. Annual Conference on Development Economics 1990, Washington, D.C., World Bank.
ECLAC (Economic Commission for Latin America and the Caribbean) (1989): Transnational Bank Behaviour and the International Debt Crisis, “Estudios e Informes de la CEPAL” series, No. 76, Santiago, Chile, Joint ECLAC/CTC Unit on Transnational Corporations. United Nations publication, Sales No. E.89.II.G.12.
(1990a): Changing Production Patterns with SocialEquity, Santiago, Chile. United Nations publication, Sales No. E.90.II.G.6.
(1990b): Directorio sobre inversión extranjera yempresas transnacionales: caso de México
(LC/R.865/Add.8), Santiago, Chile, 25 July.(1991a): Información y telecomunicaciones: vector de la transformación productiva con equidad. (Un libro verde de la CEPAL) (LC/R. 1102), Santiago, Chile, 18 December.
(1991b): Preliminary Overview of the Economy ofLatin America and the Caribbean, 1991 (LC/G.1696), Santiago, Chile, 18 December.
(1992a): Social Equity and Changing ProductionPatterns: an Integrated Approach (LC/G. 1701 (SES. 24/4)), Santiago, Chile, 6 February.
(1992b): La política comercial de la ComunidadEconómica Europea después de 1992: implicaciones para América Latina (LC/R.1139), Santiago, Chile, 28 April.

EUROPEAN INVESTMENT IN LATIN AMERICA: AN OVERVIEW / J. A. Fuentes K. 81
Expansión (1991a): vol, XXIII, No. 575, Mexico City, Expansión, S.A., 2 October.
(1991b): vol. XX111, No. 576, Mexico City, Expansión, S.A., 16 October
(1991c): vol. XXIII, No. 577, Mexico City, Expansión, S.A., 30 October.
Ffrench-Davis, R. (1989): Debt-Equity Swaps in Chile, Notas técnicas, CIEPLAN, No. 129, Santiago, Chile, Economic Research Corporation for Latin America (CIEPLAN), May.
Fritsch, W. and G. Franco (1991): Foreign Direct Invest- • ment in Brazil: its Impact on IndustrialRestructuring, Paris, Organization for Economic Co-operation and Development (OECD).
Fuentes, J. A. (1991a): Ajuste o inversión ¿La luz al final del túnel?, Banca Central, No. 11, Guatemala City, October-December.
(1991b): Reconciling subregional and hemisphericintegration, CEPAL Review, No. 45 (LC/G.1687-P), Santiago, Chile, December.
Garcia, Rigoberto (1989): Transnacionales e inversiones directas suecas en América Latina, Research Reports, No. 61, Stockholm, Institute of Latin American Studies, March.
Helleiner, G.K. (1989): Transnational corporations and direct foreign investment, H. Chenery and T.N. Srinivasan (eds.), Handbook of Development Economics, New York, Elsevier Science Publishing Co., Inc.
IMF (International Monetary Fund) (several years): Balance o f Payments Statistics, New York.
Inside U.S. Trade (1992): NAFTA Text on Investment, 27 March.
Juhl, P. (1979): On the sectoral patterns of West German manufacturing investment in less developed countries: the impact of firm size, factor intensities and protection, Weltwirtschaftliches Archiv, Band 115, Heft 3, Kiel, Institut fur Weltwirtschaft Kiel.
Keynes, J. M. (1936): The General Theory of Employment, Interest and Money, London, Macmillan Publishing Co.
Langhammer, R. J. (1991): Competition among developing countries for foreign investment in the eighties- Whom did OECD investors prefer?, Weltwirtschaftliches Archiv, Band 127, Heft 2, Kiel, Institut fur Weltwirtschaft Kiel.
Latin Finance (1991): No. 26, Miami, Florida, Latin American Financial Publications, Inc., April,
— (1992): No. 36, Miami, Florida, Latin American Financial Publications, Inc., April.
Mortimore, M. (1992): “TNCs and industrial restructuring in Latin America”, Santiago, Chile, Joint ECLAC/CTC Unit on Transnational Corporations, February, mimeo.
Ostry, S. (1990): Governments and Corporations in a Shrinking World, New York, Council of Foreign Relations Press.
Peres, W. (1990): Foreign Direct Investment and Industrial Development in Mexico, Paris, Organization for Economic Co-operation and Development (OECD).
Pio, A. (1990): The impact of the 1993 Single European Market on investment flows between the European Community and developing countries: the case of Latin America, The European Journal o f Development Research, vol. 2, No. 2, London, Frank Cass & Co. Ltd., December.
Porter, M. E. (1990): The Competitive Advantage o f Nations, New York, The Free Press.
Salomon Brothers (1992): Private Capital Flows to Latin America, 12 February,
Scott, M. F. G. (1992): Policy implications of a new view of economic growth, The Economic Journal, vol. 102, No. 412, Oxford, United Kingdom, Black- well Publishers, May.
Spain, Ministry of Economic Affairs and Finance/Spanish Agency for International Co-operation (AECI) (1992): El vínculo Iberoamérica- Comunidad Europea. Planes, políticas y estrategias de desarrollo, Conference of Ministers and Heads of Planning of Latin America and the Caribbean, Madrid, 22-26 March.
Worcel, G. (1992): El MERCOSUR en el período de la transición: funcionamiento institucional, participación empresarial e impacto sobre el comercio, Working Paper No. 44 (LC/BUE/L.126), Buenos Aires, ECLAC Office in Buenos Aires, May.
World Bank (1989): World Debt Tables 1989-90, vol. 2, Washington, D.C.
(1991): Financial Flows to Developing Countries.Current Developments, Quarterly Review, Washington, D.C., December.


CEPAL REVIEW No. 48
An appraisal of recent intra-industry trade for Latin America
Renato Baumann*
Available evidence shows that intra-industry trade has reached quite significant levels for Latin American countries in recent years. Complementarity of productive structures with regional partners and elsewhere is indicative of specific competitiveness and of capacity to gain access to particular markets. More intra-industry trade should, however, bring about gains in terms of specific sectoral specialization, while at the same time requiring constant technical updating of production, which is likely to affect factor income more intensely than if trade were less specialized.
High degrees of intra-industry trade might also affect trade policies and have considerable repercussions on related variables such as domestic relative prices, the public budget, sectoral policies and others, directly or indirectly linked to the growth of the national product.
Last but not least, increasing shares of intra-industry trade with regional partners and/or with non-Latin American countries are likely to have consequences for the process of regional integration.
This paper presents some recent estimates on the pattern of intra-industry trade in Latin America in the 1980s. Section 1 compares the rising trends registered in the region with the more stable o e c d pattern, in the following section a number of sectoral indexes for selected Latin American countries are discussed, while section III presents some final remarks.
•E co n o m ic A ffairs O ffice r in the ECLAC S tatistics and P rojections D ivision.
IntroductionAn increasing number of empirical students of international trade have realized that conventional trade theories fail to explain many aspects of recent trade relations. The most obvious shortcomings of the existing theoretical formulations stem from the facts that much of world trade is between (industrial) countries with similar factor endowments, that the expansion of trade in the post-war period has taken place without significant reallocation of resources or incom e-distribution effects, and that a large part of trade is of the intra-industry type, consisting of two- way trade in similar products.
The importance of taking these new features of trade into account goes beyond the purely academic perspective. Changes in the sectoral composition of trade may also bring about changes in the domestic effects of trade. Sectorally different elasticities, the possibility that agents in various sectors may have different propensities to save, the different intensities of second-round effects on aggregate output due to sectoral linkages, as well as other relevant aspects such as capital-ownership, market concentration, effectiveness of labour unions, etc., all help to alter the consequences that might follow from trade differentiation, affecting the rate of growth of the economy,
I Background evidence
Intra-industry trade1 is a result of the unprecedented boom in international trade flows in the 1960s, when trade relations among industrialized economies grew
1 We shall not deal in this article with the discussion about the most appropriate way of measuring intra-industry trade. In what follows, the indexes of intra-industry trade refer to Grubel- Lloyd indexes, as proposed in Grubei and Lloyd (1975). This type of index, in its total trade-weigh ted average version, is described as;
2 2 2 [ ( V + M ^ - I X ^ - M ^ I ]i j k
ITT = --------------------------------------------- X 100222 [X^ + Uijk\i j k
where X¡jt = exports of product i by country j to country Jt and M¡jk = imports of product i by country j from country k. This index is equal to one (i.e., trade is totally of the intra-industry type) in the limit case where X¡jt = M ^ for every i, j and k , or to zero (no intra-industry trade) at the opposite situation of no similarity between exports and imports of each product (Xiit Mijt).

84 CEPAL REVIEW No, 48 1 December 1992
at very high rates. Competition in wider markets, product differentiation, economies of scale stemming from regional integration -among other factors- have contributed to the new feature of two-way trading in industrial products.
There is a good deal of empirical evidence showing that intra-industry trade gained importance in the 1960s and 1970s, but more recent indicators point to relatively more stable patterns in the last decades. Table 1 shows that 7 of the 11 o e c d countries in the table had higher intra-industry trade (iiT) indexes in 1975 than in 1970, 9 countries had higher indexes in 1980 than in 1975, but only 5 registered higher levels in 1985 than in 1980, and even so for most countries the difference between the 1985 and the 1980 indexes was very small.
This suggests that for o e c d the iit indexes for a number of industries in several countries have halted their growth trend and in some cases may even have started to fall.
Significantly enough, the corresponding indicators for Latin America show a rather different performance, with increasing indexes of intra-industry trade in the last two decades. An overview of these trends is provided by the aggregate figures presented in table 2 for trade flows between Latin America and its two main partner regions, North America and Western Europe,2 which accounted in 1987, respectively, for 64% and 21% of total (exports plus imports) Latin American trade in manufactures. Unlike the indicators in table 1, the figures in table 2 show rising trends of intra-industry trade even after the 1982 crisis, which had so many drastic consequences for the region.
A number of reasons may be invoked to explain this situation of simultaneous stabilization of iit indexes in OECD countries and rising indexes for Latin American trade. The increasing share of manufactures in the latter region’s exports is only the most
2 Henceforth in this article, Latin America comprises the eleven member countries of ALAD1 (Latin American Integration Association) -Argentina, Bolivia, Brazil, Chile, Colombia, Ecuador, Mexico, Paraguay, Peru, Uruguay and Venezuela. Western Europe means the countries making up the European Economic Community (EEC) and the European Free TradeAssociation (EFTA) -Austria, Belgium- Luxembourg, Denmark, Finland, France, Greece, Ireland, Iceland, Italy, Netherlands, Norway, Portugal, Spain, United Kingdom, Sweden, Switzerland and West Germany. North America naturally means the aggregate figures for the USA and Canada, and Southeast Asia comprises Japan, South Korea, Taiwan, Philippines, Hong Kong, Malaysia, Singapore, Thailand and Indonesia.
obvious one, but limiting the analysis to this reason would mean an excessive emphasis on purely statistical effects.
Theory would suggest instead that the ratio of intra-industry trade to total trade between two countries (regions) should (caeieris paribus) be higher: a) the smaller the difference in per capita income between the two countries or regions; b) thé smaller the difference in factor endowment between them; c) the lower the trade barriers and transportation costs; d) the greater the product differentiation in each industry; e) the greater the economies of scale in the tradeables sector; and f) the greater the potential for technological or vertical differentiation, among other determining factors.
This is not the place to embark on the testing of these hypotheses. It is, however, worth emphasizing that the increasing indicators of intra-industry trade do suggest that at least some Latin American countries have achieved sectoral-specific competitiveness. This may be a result of the diversification of the structure of production of these economies, of the type of economic agents in each sector (foreign- owned firms might have contributed significantly to it), of specific bilateral trade agreements, or other reasons.
Be that as it may, the available evidence of different trade performance by different Latin American countries suggests that aggregate figures may be misleading and that it would be worthwhile considering country-specific indicators.
This is precisely what is done in table 3, which covers all s it c 3-digit industrialized products3 and hence includes a number of semimanufactures which are not comprised in the strict (s it c sections 5-8) definition of manufactures. Estimates in accordance with this strict definition would be even higher than those presented here.
It is worth noting, from the last two columns of table 3, that some of the trade flows have a strong (20% or more) component of trade of the intraindustry type. When only trade in sectors where transactions of industrialized products account for more than half of sectoral trade is considered, these
2These comprised a total of 96 industrial products accord
ing to SITC Rev. 1, which was used for the 1980 (and 1987 for Mexico) estimates, and a total of 138 products according to SITC Rev, 2, used for the 1988 (1987 for Brazil) estimates.

AN APPRAISAL OF RECENT INTRA-INDUSTRY TRADE FOR LATIN AMERICA / K. Baumann 85
Table 1
SELECTED OECD COUNTRIES: INDEXESa OF INTRA-INDUSTRY TRADE
1970 1975 1980 1985
United States 0.65 0.67 0.67 0.63Japan 0.40 0.29 0.31 0.30West Germany 0.62 0.62 0.69 0.70United Kingdom 0.66 0.74 0.83 0,81Canada 0,69 0.65 0.67 0.75Italy 0.63 0.66 0.71 0.68Belgium 0.81 0.86 0.87 0.90Netherlands 0.73 0.73 0.77 0.76Norway 0.62 0.69 0,61 0.63Finland 0.40 0.48 0.59 0.60Australia 0.33 0.37 0.41 0.39
Source; S. Globerman and J. W. Dean (1990), Recent trends in intra-industry trade and their implications for further trade liberalization, WeltwirtschaftUchesArchiv, Band 126, Heft 1, Kiel, Institut fiir Weltwirtschaft an der Universitàt Kiel, 1990, table 2, p. 29.
“Unadjusted Grubel-Lloyd indexes for S1TC section 3 plus SITC sections 5 to 9 (see Grubel and Lloyd, 1975).
Table 2
LATIN AMERICA: INTRA-INDUSTRY TRADE RATIOS*1 IN RESPECT OF TOTAL TRADE (%) BY PRODUCTS WITH NORTH AMERICA
AND WESTERN EUROPE IN 1970,1983 AND 1987
USA/Canada Western Europe
1970 1983 1987 1970 1983 1987
Total manufactures
Chemicals 2.6 9.4 12.8 2.0 6.5 8.6Machinery 3.6 6.5 10.1 3.8 7.1 8.8Transportation equipment 2.2 15.4 17.4 2.3 8.6 8.6
Other manufactures 2.6 5.3 9.0 1.3 4.2 9.5
Source: Estimates on the basis of the ECLAC database. a Grubel-Lloyd’s Total Trade-Weighted Average Index of Intra-Industry Trade
increasing importance of two-way trade for Latin American countries.
The figures presented in table 3 are high enough to justify taking them into consideration in the analyses for the region as a whole, for these six countries account for most of Latin America’s external trade. The basic reason for considering them separately is the very fact that their individual experiences in trade performance are quite different for each country. In the remainder of this article, we shall present the indexes of intra-industry trade for each of these countries separately.
shares may come close to 40% (as in Mexican trade with North America), and in a number of other cases (regional trade by Argentina, Brazil and Chile, Brazilian trade with North America, Colombian and Chilean trade with Southeast Asia) they account for more than one-fifth of bilateral trade flows.
The other interesting feature that emerges from table 3 is that the number (and hence the relative importance) of sectors where trade is mainly of the intra-industry type has, in several cases, increased quite markedly between 1980 and 1988, thus confirming the previous indications of

86 CEPAL REVIEW No. 48 i December 1992
Table 3
LATIN AMERICA (SIX COUNTRIES): RELATIVE IMPORTANCE OF SECTORS a WITH AN IIT INDEX b OF OVER 0.5
Countries
Number of sectors with IIT > 0.5
in bilateral trade
Relative weight (%) of sectors with IIT > 0.5
in bilateral trade
1980 1988Industrialized products Total trade
1980 19 88 1980 1988
ArgentinaNorth America 14 24 20.5 12.6 17.8 7.7Western Europe 6 14 1.9 4.9 1.3 2.1Southeast Asia 6 10 16.5 0.4 12.8 0.3Latin America 11 32 20.2 23.2 15.2 14.0
Brazil cNorth America 27 40 30.2 22.3 20.0 15.6Western Europe 10 8 12.0 2.6 8.2 1.6Southeast Asia 8 8 13.3 3.2 11.0 2.2Latin America 16 30 16.8 31.3 11.2 14.7
Mexico dNorth America 21 41 7.2 37.6 3.5 21.6Western Europe 5 4 0.4 0.6 0.4 0.5Southeast Asia 6 9 1.0 15.7 0.9 13.4Latin America 10 6 24.0 16.5 18.7 15.0
ColombiaNorth America 16 12 6.2 13.3 3.7 2.7Western Europe 3 3 1.8 0.8 1.6 0.2Southeast Asia * 2 1 3.7 23.9 3.7 20.2Latin America 16 6 11.5 7.7 10.1 1.5
ChileNorth America 8 14 3.0 28.1 1.9 3.2Western Europe 4 2 2.7 1.5 0.7 0.1Southeast Asia 1 3 0.0 21.3 0.0 1.1Latin America 6 6 7.1 28.2 3.1 5.7
UruguayNorth America 3 9 0.7 11.7 0.6 3.9Western Europe 4 4 2.0 1.3 1,4 0.5Southeast Asia 2 - - - - -Latin America 19 17 18.3 18.4 12.7 5.9
Source: Estimates based on the United Nations International Commodity Trade Data Base (COMTRADE). “SITC (3 digits).b ITT s Gmbel-Lloyd Total Trade-Weighted Average Index of Intra-Industry Trade. c 1987: SITC Rev. 2. d 1987: SITC Rev. 1.

AN APPRAISAL OF RECENT INTRA-INDUSTRY TRADE FOR LATIN AMERICA IR. Baumann 87
II
Sectoral indexes
The following presentation of recent estimates of iit indexes for some Latin American countries takes into account the already mentioned diversity of experiences (which is why individual country indexes are presented in respect of each bilateral trade flow with the regions considered here) as well as the weight of two-way trade in each of these trade flows, so that the analysis is limited to those sectors where a significant share of each bilateral trade flow is of the intra-industry type. We have arbitrarily set the level of significance at 50% of total bilateral trade.
The main objective of the present exercise is to try to identify, from the indexes of intra-industry trade, some indications of a structure of specialization in bilateral trade, for each of the trade flows considered.
Available theory is not much help for the appraisal of iit indexes in a multi-industry framework. Furthermore, as our sample comprises only sectors where intra-industry trade corresponds to more than half of the value of trade in each bilateral trade flow, it turns out that all the sectors presented here are considered to have significant two-way trade, so it does not make much sense to try to rank them by, say, the magnitude of the estimated indexes.
Instead, the methodological approach adopted here to identify a structure of specialization stresses the double perspective of stability and frequency of the indexes as indicative of such structure. It is assumed that in those industries where iit indexes remain high over time in bilateral trade one would expect either a relatively stable complementarity between the producers in the two countries, and/or, from the demand side, specific conditions of product differentiation and consumer behaviour that are maintained through different periods of time. Furthermore, it is also considered that -whatever the relative sectoral importance as defined by the value of trade- the incidence of high iit indexes per sector should of itself indicate those sectors where intra- iqdustry trade is more intense.
The outcome of this reasoning is that the analysis puts emphasis on those product groups with high iit indexes at the beginning and end of the last decade, as well as on the sectoral distribution of these indexes in 1988, the last year for which the data required for this calculation were available.
Table 4 summarizes the basic statistics with regard to the number of sectors with iit > 0.5 in 1980 and in 1988, at a 3-digit s it c product group classification. The previously mentioned o e c d pattern of stable sectoral indexes would perhaps suggest that it reflects a rather well-defined sectoral structure of production and trade, so that the margins for benefiting from additional economies of scale become narrow.
On the basis of the figures in table 4, a similar reasoning could perhaps be adopted for those product groups that present high iit indexes at the beginning and the end of the 1980s. The last column of table 4 shows that the number of industries that meet such requirements is small, in comparison with the number of industries with high iit indexes in either 1980 or 1988.
If it is expected that such an indicator may show a pattern of sectoral specialization, it comes as no surprise to find that it is in intraregional trade and (even more) in the trade flows between each of these countries and North America that the incidence of high iit in both years is most significant. The most striking figures refer to trade between Brazil, Mexico and Argentina with North America, and to trade between Brazil and Argentina and other Latin American countries.
The increasing sectoral and geographical diversification of the Latin American trade structure in recent years -compare, for instance, the figures given in table 3 for the number of sectors with iit > 0.5 and their relative weight in 1980 and 1988- certainly lies behind the relatively low figures of table 4. Be that as it may, it remains to identify those sectors for which there actually are indications of systematic significant two-way trade.
In order to make it easier to identify those sectors, the figures are presented grouped in 2-digit SITC classification. Table 5 shows the product divisions for which at least one (3-digit) product group registered iit > 0.5 in those two years.
One generic observation that may be made on the basis of table 5 is that by and large the product groups with systematically high iit indexes are manufactures (i.e., products classified in s it c sections 5-8), with the sole exceptions of tobacco manufactures and beverages in Argentina, preserved

88 CEPAL REVIEW No. 48 (December 1992
Table 4
LATIN AMERICA (SIX COUNTRIES): SITC 3-DIGIT PRODUCT GROUPS WITH AN IIT INDEX OF MORE
THAN 0.5 IN TOTAL BILATERAL SECTORAL TRADE, 1980 AND 1988
Number of product groups with IIT > 0.5
Trade between: and: 1980 1988 Bothyears
ArgentinaLatin America . 11 32 5North America 14 24 6Western Europe 6 14 1Southeast Asia 6 10 -
BrazilaLatin America 16 30 ■-■I-North America 27 40 12Western Europe 10 8 1Southeast Asia 8 8 1
Mexico aLatin America 10 6 1North America 21 41 8Western Europe 5 4 ■Southeast Asia 6 9 1
ChileLatin America 6 6North America 8 14 1Western Europe 4 2Southeast Asia 1 3 -
ColombiaLatin America 16 16 1North America 16 12 5Western Europe 3 3 -Southeast Asia 2 ' 1 -
UruguayLatin America 19 17 4North America 3 9 2Western Europe 4 4 -Southeast Asia 2 - -
Source: Estimates based on the United Nations International Commodity Trade Data Base (COMTRADE). * 1980 and 1987

AN APPRAISAL OF RECENT INTRA-INDUSTRY TRADE FOR LATIN AMERICA IR. Baumann 89
Table 5
LATIN AMERICA (SIX COUNTRIES): SITC 2-DIGIT DIVISIONS WITH AN IIT INDEX OF OVER 0.5 IN BOTH 1980 AND 1988 IN
TOTAL BILATERAL SECTORAL TRADE
Ttade between: and: SITC code Division
Argentina Latin America 12 Tobacco and tobacco manufactures59 Chemical materials and products88 Photographic apparatus, equipment and optical goods
North America 11 Beverages51 Organic chemicals52 Inorganic chemicals69 Manufactures of metal, n.e.s.
Western Europe 55 Essential oils and perfume materials
Brazil® Latin America 05 Vegetables and fruit (preserved)51 Organic chemicals66 Non-metallic mineral manufactures77 Electrical machinery85 Footwear87 Professional and scientific instruments88 Photographic apparatus
North America 63 Cork & wood manufactures65 Textile yam, fabrics66 Non-metallic mineral manufactures71 Power generating machinery76 Telecommunications equipment77 Electrical machinery78 Road vehicles79 Other transport equipment89 Miscellaneous manufactures
Western Europe 55 Essential oils and perfume materials
Southeast Asia 77 Electrical machinery
Mexico b Latin America 72 Machinery for specialized industriesNorth America 33 Petroleum (products)
53 Dyeing, tanning materials55 Essential oils and perfume materials65 Textile yam, fabrics72 Machinery for specialized industries82 Furniture84 Apparel and clothing89 Miscellaneous manufactures
Southeast Asia 59 Chemical materials, n.e.s.
Chile North America 64 Paper, paperboard
Colombia Latin America 67 Iron and steelNorth America 66 Non-metallic mineral manufactures
84 Apparel and clothing89 Miscellaneous manufactures
Uruguay Latin America 11 Beverages12 Tobacco and tobacco manufactures69 Manufactures of metal, n.e.s.
North America 65 Textile yam, fabrics82 Furniture
Source: Estimates based on the United Nations International Commodity Trade Data Base (COMTRADE). • 1980 and 1987 b 1980 and 1987: SITC Rev.l

90 CEPAL REVIEW No. 481 December 1992
vegetables and fruits in Brazil, and beverages and tobacco manufactures in Uruguay, which are often considered as semimanufactures.
A second broad observation is that most of the industries listed in table 5 are in sections 6 and 8 of the s it c , which means that they are producers of manufactured goods classified chiefly by material or producers of miscellaneous manufactured articles. Furthermore, it is worth noting that only in Brazil did the producers of machinery and transport equipment (s it c section 7) register high iit indexes in the two years. Indeed, this is the section with the highest number of references for that country. This is particularly surprising, because as is well known (e c l a c , 1991), Mexico was in 1987 not only the second biggest exporter of capital goods in Latin America, but also had the most intense trade (imports and exports) in those products with one single partner, the United States. This indicates that the intensification of two-way trade in capital goods between Mexico and North America is a relatively recent phenomenon, although an important one.
This suggests a well-defined structure of sectoral specialization, and the number of high iit indexes in bilateral trade with North America in comparison with the corresponding number of indexes for trade with Latin America gives rise to reservations regarding the hypotheses that put emphasis on geographical proximity as a major explanatory variable of intraindustry trade. The conclusion is that other factors matter, too.
It remains to evaluate the sectoral concentration of intra-industry trade in the recent period. In the 3-digit s it c product groups for which there are indications that throughout the decade more than half of each bilateral trade flow was of the intra-industry type, the indexes reported are overwhelmingly much higher than this limit. This reinforces the importance of the analysis, since it shows that two-way trade is quite predominant in several industries.
In order to get a broad view of the degree of sectoral concentration of intra-industry trade between each of the six countries and the four areas considered here towards the end of the decade, we have prepared statistics on the frequency of indexes over 0.5 for each trade flow at the 1-digit sitc classification level. This distribution is presented in table 6.
The first point to be noted with regard to the figures in table 6 is that -as already mentioned- the biggest incidence of intra-industry trade takes place in s i t c sections 5 to 8 . It is noticeable that in every
trade flow reported in that table there is indication of high iit in section 6, which comprises manufactures classified chiefly by material, the most significant for the present purposes being textile products, paper products and manufactures of metal.
High indexes of intra-industry trade may reflect complementarity of productive structures or (mainly for final consumption goods) substitutability in consumption patterns. The precise interpretation of the figures presented here calls for more detailed analysis at the product level. In broad terms, however, the incidence of high indexes of intra-industry trade in section 6 could in principle be interpreted as a reaffirmation of the region’s comparative advantage in natural resource-based products, which would explain most of the trade in paper products and manufactures of metal (as well as some textiles).
The second most frequent s i t c section in table 6
is that comprising miscellaneous manufactured articles, mainly apparel and shoes, toys, and photographic articles. The reasons behind the high indexes in these sectors might - i f one accepts the previous arguments- be linked to specific demand patterns and differentiation of final products. It is hard to say anything at this aggregate level: once again, there is a clear need for sector-specific analysis,
A third set of industries worth noting are those grouped in section 7 - machinery and transport equipment, mainly electrical and non-electrical machinery and road vehicles. This is where the highest incidence of two-way trade is found (between Brazil and North America), and there is also quite a high incidence in other trade flows, such as those between Brazil and Latin America, Argentina and Latin America, Argentina and North America, and Mexico and North America.4 Given the typical pattern of trade barriers adopted by these countries and the type of products included in this classification, one would expect that these high figures might refer to complementarity of production, more than anything else.
Finally, the figures in table 6 also show the incidence of intra-industry trade in s it c section 5, chemicals and related products, mainly essential oils and perfumes and organic and inorganic chemicals. There is a significant number of industries with intense iit in this section in trade flows between
4 In these first two cases, the Brazil-Argentina trade agreement certainly plays a major role.

AN APPRAISAL OF RECENT INTRA-INDUSTRY TRADE FOR LATIN AMERICA / R. Baumann 91
Table 6
LATIN AMERICA (SIX COUNTRIES): SITC REV. 2 SECTIONS (1 DIGIT) WITH IIT > 0.5 IN TOTAL BILATERAL
SECTORAL TRADE, 1988
Trade between: and: SITC code SectionNumber of
product groups with IIT > 0.5
Argentina Latin America 0 Food and live animals chiefly for food (3)1 Beverages and tobacco (3)5 Chemicals and related products (4)6 Manufactured goods classified chiefly by
material (4)7 Machinery and transport equipment (8)8 Miscellaneous manufactured articles (10)
North America 1 Beverages and tobacco (1)4 Animal and vegetable oils (1)5 Chemicals and related products (5)6 Manufactured goods classified chiefly by
material (10)7 Machinery and transport equipment (3)8 Miscellaneous manufactured articles (2)
Western Europe 0 Food and Uve animals chiefly for food (2)5 Chemicals and related products (3)6 Manufactured goods classified chiefly by
material (3)7 Machinery and transport equipment (3)8 Miscellaneous manufactured articles (3)
Southeast Asia 3 Mineral fuels, lubricants (1)5 V Chemicals and related products (1)6 Manufactured goods classified chiefly by
material (3)7 Machinery and transport equipment (3)8 Miscellaneous manufactured articles (2)
Brazil Latin America 0 Food and live animals chiefly for food (2)5 Chemicals and related products (4)6 Manufactured goods classified chiefly by
material (8)7 Machinery and transport equipment (9)8 Miscellaneous manufactured articles (?)
North America 1 Beverages and tobacco (1)5 Chemicals and related products (3)6 Manufactured goods classified chiefly by
material (11)7 Machinery and transport equipment (17)8 Miscellaneous manufactured articles (8)

92 CEPAL REVIEW No. 48 iDecember 1992
Table 6 (continued)
Trade between: and: SITC code SectionNumber of
product groups with iit >0.5
Western Europe 5 Chemicals and related products (1)6 Manufactured goods classified chiefly by
Material (2)7 Machinery and transport equipment (1)8 Miscellaneous manufactured articles (4)
Southeast Asia 6 Manufactured goods classified chieflybymaterial (4)
7 Machinery and transport equipment (3)8 Miscellaneous manufactured articles (1)
Mexico Latin America 5 Chemicals and related products (1)6 Manufactured goods classified chiefly by
material (1)7 Machinery and transport equipment (2)8 Miscellaneous manufactured articles (2)
North America 0 Food and live animals chiefly for food (1)2 Crude materials, inedible, except fuels (1)3 Mineral fuels, lubricants (2)5 Chemicals and related products (7)6 Manufactured goods classified chiefly by
material (13)7 Machinery and transport equipment (6)8 Miscellaneous manufactured articles (11)
Western Europe ti Food and live animals chiefly for food (1)6 Manufactured goods classified chiefly by
material (2)8 Miscellaneous manufactured articles (1)
Southeast Asia 5 Chemicals and related products (1)6 Manufactured goods classified chiefly by
material (3)7 Machinery and transport equipment (3)8 Miscellaneous manufactured articles (2)
Chile Latin America 2 Crude materials, inedible, except fuels (1)6 Manufactured goods classified chiefly by
material (3)7 Machinery and transport equipment (1)8 Miscellaneous manufactured articles (1)
North America 4 Animal and vegetable oils (1)5 Chemicals and related products (1)6 Manufactured goods classified chiefly by
material (9)8 Miscellaneous manufactured articles (3)

AN APPRAISAL OF RECENT INTRA-INDUSTRY TRADE FOR LATIN AMERICA IR. Baumann 93
Table 6 (conclusion)
Trade between: and: SITC code SectionNumber of
product groups with UT > 0.5
Western Europe 6 Manufactured goods classified chiefly by material (1)
8 Miscellaneous manufactured articles (1)
Southeast Asia 6 Manufactured goods classified chiefly by material (3)
Colombia Latin America 6 Manufactured goods classified chiefly by material (3)
7 Machi nèry and transport equipment (2)8 Miscellaneous manufactured articles (1)
North America 0 Food and live animals chiefly for food (1 )1 Beverages and tobacco (1)56
Chemicals and related products Manufactured goods classified chiefly by material
(1)
(4)8 Miscellaneous manufactured articles (5)
Western Europe 6 Manufactured goods classified chiefly by material (2)
8 Miscellaneous manufactured articles (1 )
Southeast Asia 6 Manufactured goods classified chiefly by material (1 )
Uruguay Latin America 1 Beverages and tobacco (2)4 Animal and vegetable oils (1)6 Manufactured goods classified chiefly by
material (9)8 Miscellaneous manufactured articles (5)
North America 5 Chemicals and related products (1)6 Manufactured goods classified chiefly by
material (6)8 Miscellaneous manufactured articles (2)
Western Europe 4 Animal and vegetable oils (1)6 Manufactured goods classified chiefly by
material (1)8 Miscellaneous manufactured articles (2)
Source: Estimates based on United Nations International Commodity Trade Data Base (COMTRADE).
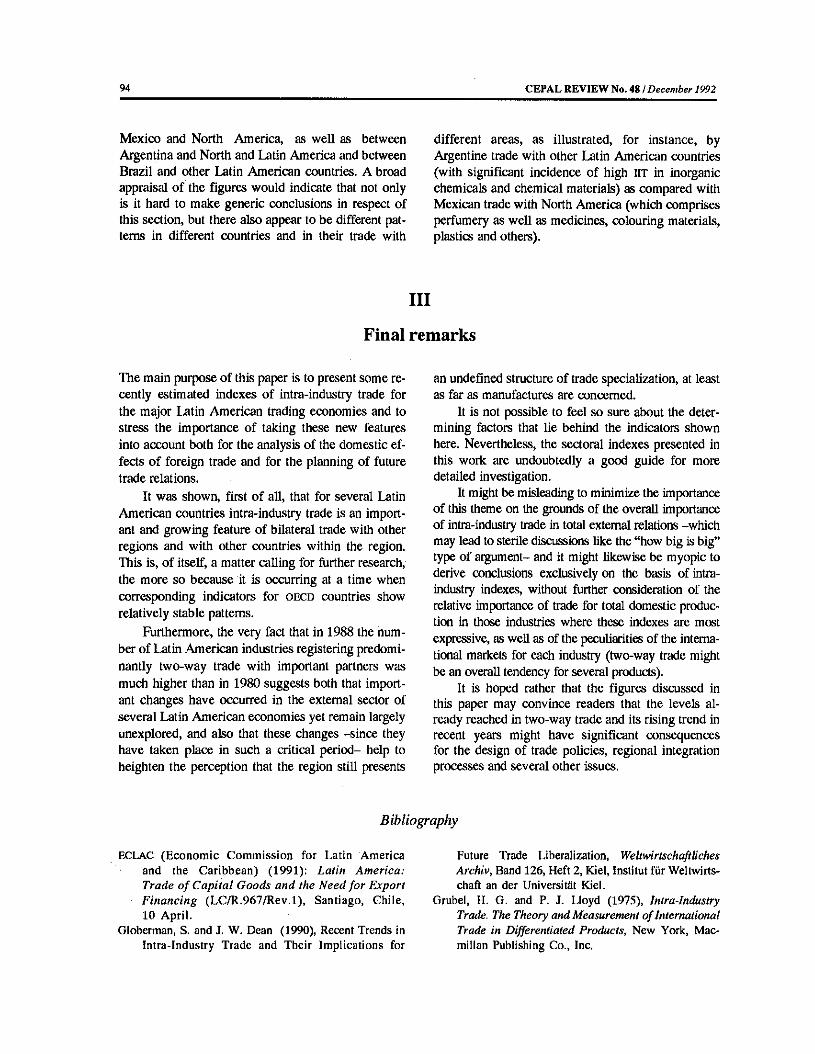
94 CEPAL REVIEW No. 481 December 1992
Mexico and North America, as well as between Argentina and North and Latin America and between Brazil and other Latin American countries. A broad appraisal of the figures would indicate that not only is it hard to make generic conclusions in respect of this section, but there also appear to be different patterns in different countries and in their trade with
different areas, as illustrated, for instance, by Argentine trade with other Latin American countries (with significant incidence of high iit in inorganic chemicals and chemical materials) as compared with Mexican trade with North America (which comprises perfumery as well as medicines, colouring materials, plastics and others).
I ll
Final remarks
The main purpose of this paper is to present some recently estimated indexes of intra-industry trade for the major Latin American trading economies and to stress the importance of taking these new features into account both for the analysis of the domestic effects of foreign trade and for the planning of future trade relations.
It was shown, first of all, that for several Latin American countries intra-industry trade is an important and growing feature of bilateral trade with other regions and with other countries within the region. This is, of itself, a matter calling for further research, the more so because it is occurring at a time when corresponding indicators for o e c d countries show relatively stable patterns.
Furthermore, the very fact that in 1988 the number of Latin American industries registering predominantly two-way trade with important partners was much higher than in 1980 suggests both that important changes have occurred in the external sector of several Latin American economies yet remain largely unexplored, and also that these changes -since they have taken place in such a critical period- help to heighten the perception that the region still presents
an undefined structure of trade specialization, at least as far as manufactures are concerned.
It is not possible to feel so sure about the determining factors that lie behind the indicators shown here. Nevertheless, the sectoral indexes presented in this work are undoubtedly a good guide for more detailed investigation.
It might be misleading to minimize the importance of this theme on the grounds of the overall importance of intra-industry trade in total external relations -which may lead to sterile discussions like the “how big is big” type of argument- and it might likewise be myopic to derive conclusions exclusively on the basis of intraindustry indexes, without further consideration of the relative importance of trade for total domestic production in those industries where these indexes are most expressive, as well as of the peculiarities of the international markets for each industry (two-way trade might be an overall tendency for several products).
It is hoped rather that the figures discussed in this paper may convince readers that the levels already reached in two-way trade and its rising trend in recent years might have significant consequences for the design of trade policies, regional integration processes and several other issues.
Bibliography
ECLAC (Economic Commission for Latin America and the Caribbean) (1991): Latin America: Trade o f Capital Goods and the Need for Export Financing (LC/R.967/Rev.l), Santiago, Chile, 10 April.
Globerman, S. and J. W. Dean (1990), Recent Trends in Intra-Industry Trade and Their Implications for
Future Trade Liberalization, Weltwirtschaftliches Archiv, Band 126, Heft 2, Kiel, Institut für Weltwirts- chaft an der Universitiit Kiel.
Grubel, H. G. and P. J. Lloyd (1975), Intra-Industry Trade. The Theory and Measurement o f International Trade in Differentiated Products, New York, Macmillan Publishing Co., Inc.

CEPAL REVIEW No. 48
Industrial policy in Central America
*Larry Willmore
The Central American countries have a 40-year tradition of cooperation based on bilateral and multilateral treaties, the most important of which is the General Treaty on Central American Economic Integration, under whose terms the Central American Common Market (cacm) was established in 1960. Nevertheless, the industrial policies pursued by these countries since that time are notable for their lack of uniformity.
This article provides a concise description of the policies in effect as of mid-1992 in five countries -Costa Rica, El Salvador, Guatemala, Honduras and Nicaragua- regarding foreign investment, the registration of new investments, tariff protection and extra-zona I export incentives, all of which influence the relative competitiveness of the subregion’s industrial enterprises. Other factors affecting these countries’ competitive positions, such as labour, power and water costs, are also discussed.
*The author is an Economic Affairs Officer working in the fields of industry and tourism at the eclac Subregional Headquarters for the Caribbean. This article is based on a report prepared by him for Project C A M /91/009 , executed by the United Nations Industrial Development Organization (unido), with funding from the Special Cooperation Programme for Central America (scp) of the United Nations Development Programme (UNDP).
IntroductionThe Central American governments have traditionally maintained an open-door policy on foreign investment and, in fact, have competed against one another to attract such investment. Today, however, there are important differences in the ways they treat foreign capital. Of the five countries studied, Guatemala is the only one that draws no distinction between domestic and foreign investment. In El Salvador and Honduras, small-scale foreign investment is prohibited. Nicaragua places some restrictions on all types of foreign investment, while Costa Rica, El Salvador and Honduras encourage it by providing preferential access to foreign exchange at the official exchange rate.
Bureaucratic red tape can be a stumbling block for both foreign and domestic investment. In Central America, it takes between 2-3 months (Costa Rica) and 12 months (Honduras) to register a new company. In New York, the same process takes four hours.
In small economies such as those of Central America, external tariffs often play a more influential role than market structure does in determining the type of competition that takes place because the prices of imports -whether real or potential- are what dictate the prices of local manufactures. No matter how concentrated production may be in a given industry, the possibility of importing serves as a regulatory mechanism by curbing the exercise of producers’ market power.
In the 1960s, these five countries maintained a joint external tariff to protect the industries of the Central American Common Market (c a c m ). In the late 1970s, Honduras withdrew from c a c m , negotiated bilateral treaties in its stead, and established its own external tariff. In the mid-1980s, the other four countries jettisoned their common external tariff and embarked on a unilateral tariff-reduction effort. Recently, however, all five countries have agreed to reestablish a common external tariff starting in early
1 Two decades ago, Gert Rosenthal said that “a kind of competition has arisen among the countries as they vie to attract such capital in an effort to enlarge their share of intraregional exports of manufactures. Hence, at the national level an open- door policy on foreign direct investment is pursued, and cases in which such investment is regulated or controlled are extremely rare’’. (Rosenthal, 1975, p. 273; the original árdele was published in 1972.) See also Willmore, 1976.

96 CEPAL REVIEW No, 48 / December 1992
1995. The new tariff will be of a less protectionist cast than its predecessor, with a 5% ad valorem floor and a 20% ad valorem ceiling.
Import restrictions and taxes generate an antiexport bias, since the incentives to produce for the domestic (or subregional) market then outweigh the attractions of exporting to other countries. All the countries in the subregion have tried to offset this bias, at least in part, by promoting non-traditional exports, especially manufactures.
Tire form of export promotion varies a great deal from one country to another within the subregion, but four of the five have temporary importation systems and all have customs-free manufacturing zones as well as incentives for exporters producing primarily
for protected local markets. Both the differences and similarities of the five countries’ policies in this field will be discussed in greater detail later on in this article.
Not only do the Central American countries have differing policies on foreign investment, company registration, tariff protection and export incentives; their labour, energy and water costs vary as well. Costa Rica has the highest wages -in fact, they are nearly twice as high as they are in the other countries; the price of electricity is fairly uniform, but gasoline is considerably more expensive in Nicaragua and Guatemala, diesel fuel is higher in Honduras and Guatemala, and drinking water costs more in Costa Rica and Honduras.
I
Foreign investment
Guatemala has no laws dealing specifically with foreign investment in the manufacturing sector, and Guatemalan-owned and foreign-owned companies therefore receive the same treatment before the law. There is, however, a voluntary register of United States-owned firms which wish to avail themselves of the guarantees provided under an agreement concluded between the Governments of Guatemala and the United States.
Costa Rica’s laws do not distinguish between domestic and foreign enterprises in the manufacturing sector either, but the Central Bank does maintain a roster of foreign investors. Companies which voluntarily register their foreign capital are given access to foreign exchange at the official rate for the following purposes: (i) loan payments (on both interest and principal), provided the loan’s term is not less than five years; (ii) repatriation of capital (usually after four years, although it can be done earlier); (iii) repatriation of profits, upon submission of an income tax statement; (iv) payments of royalties, subject to a 20% tax; and (v) payments for technical assistance, subject to a 30% tax and a 10% commission. Access to foreign exchange at the official rate is an important factor when there is a wide spread between the bank rate and the “black market” or parallel rate. In such instances, registered foreign enterprises have an advantage over unregistered
foreign firms -as well as over Costa Rican companies, since the latter do not have the option of registering their investments. Consequently, Costa Rican policy in this area -which is applied by the Central Bank via internal regulations rather than by the Executive through laws and executive orders- is biased in favour of foreign investment and is therefore discriminatory.
In Honduras, a new investment law passed by Congress in June 1992 holds that “foreign investment complements the effect of national investment in promoting economic development and merits non-discrim inatory treatment”. Two articles of the relevant statute are, however, discriminatory. First,1 article 20 stipulates that “small-scale industry and commerce are the exclusive domain of Hondurans and wholly Honduran-owned commercial companies”. There is as yet no regulation which defines what is meant by “small-scale”, but the limitation of foreign investment to large and medium-scale industry is potentially significant. Second, article 4 guarantees that investors will be able to purchase foreign exchange for the following purposes: the "importation of goods and services necessary for the operation of the company, including the payment of royalties, rents and technical assistance”; the “payment of debts contracted abroad to defray corporate operational expenses and of

INDUSTRIAL POLICY IN CENTRAL AMERICA t l . Willmore 97
the interest thereon”; and the “payment of dividends and the repatriation of capital on foreign investments registered under this Act”.
Although this article is biased in favour of foreign investment, inasmuch as only foreign investors are guaranteed access to foreign exchange for the repatriation (or expatriation) of their capital and profits, the advantage is minimal because the same article also authorizes the “...opening of foreign- currency accounts in banks within the national system” and provides that “national and foreign investors shall be able to withdraw their deposits, either in part or in their entirety, in the same currency in which they were made”.
Like the new legislation in Honduras, Salvadorian law contains a mix of foreign-investment restrictions and incentives. The 1950 Constitution states that “small-scale commerce and industry are the preserve of native Salvadorians and Central American natural persons”. Executive Order 505 of 15 December 1961 (Small-Scale Commerce and Industry Protection Act) defines “small” as any company with less than US$ 10.000 in capital and prohibits investment by foreigners except in “those industrial activities ... in which native-born Salvadorians or Central Americans are not engaged”; under such circumstances, a 10-year permit may be issued which may then be renewed upon its expiration provided that no Salvadorian companies are engaged in the same activity.
El Salvador's Foreign Investment Promotion and Guarantees Act requires that all foreign investment be registered with the Ministry of Economic Affairs. Registered foreign investment is provided with the following benefits, which are not granted to Salvadorian companies: (i) the right to have foreign-currency bank accounts which may not be converted into the local currency without the authorization of the account holder; (ii) income tax credits, covered by the company in which the investment has been made; and (iii) access to foreign exchange at the official exchange rate for the repatriation of profits, the repayment of external loans, as well as royalties and technical assistance up to a ceiling of 10% of net sales, and the repatriation of capital. These benefits are clearly more generous than those
provided in Costa Rica and similar to those granted by Honduras; be that as it may, their actual value to investors depends on there being a difference between the official and parallel exchange rates. No such difference currently exists in El Salvador, but one could arise in the future; if and when it does, then foreign entrepreneurs would have an advantage over Salvadorians.
At the present time foreigners may not legally invest in Nicaragua. A bill has been drafted, however, which would provide for the creation of a foreign investment commission whose job would be to approve or reject investors’ applications and to oversee their conduct thereafter. The National Assembly passed a version of this bill on 12 April 1991, but it was then vetoed by the Executive, primarily because it would have given the foreign investment commission nine members rather than the five members desired by the Executive. In the latter’s opinion, a commission whose members would include the Minister of Labour, the Director of the Nicaraguan Institute for Natural Resources and the Environment, a member of the Chamber of Industry and the mayor of the municipality in which the prospective investment would be located would make it quite difficult for any investment application to be approved. Under this law, the main benefits for investors, once their investment plan had been approved, would be:(i) “swift, adequate and effective compensation in the event of expropriation” and (ii) access to foreign exchange at the official exchange rate for the repatriation of profits and, after three years, capital. In addition, the foreign investment commission would be empowered to “grant exemptions, either in whole or in part, from the payment of taxes and customs duties”. Foreign investors would also, however, be required to convert their foreign-exchange export earnings into the local currency at the official exchange rate.
In summary, then, Costa Rica, El Salvador and Honduras encourage foreign investment by granting preferential access to foreign exchange at the official exchange rate, but El Salvador and Honduras exclude foreign investors from small-scale industry. Guatemala accords foreign investors the same treatment as Guatemalan investors are given, while Nicaragua places some restrictions on them.

98 CEPAL REVIEW No. 48 / December 1992
II
The establishment of new companies
New investments result in the creation of new companies, or the expansion of existing ones. The State bureaucracy may obstruct this process by making the registration of new companies costly and time-consuming. In a recent work, Hernando De Soto, author of the now famous book El otro sendero, cites the fact that “in Peru, it takes 289 days to register a new company, as compared to four hours in New York” as one of the causes of his country’s underdevelopment (De Soto, 1992).
In this sense, Central America is quite close to Peru and very far indeed from New York. In Honduras, the minimum amount of time needed to register a new company is 12 months, while in Guatemala it takes from 10 to 12 months. In both of these countries, the steps that a company must take if it wishes to increase its capital take almost as long and are
almost as costly as the procedures for founding a new company. The hurdles facing investors in El Salvador and Costa Rica are somewhat less formidable, since these countries permit the registration of open-end companies. The administrative procedures involved in their establishment take “only” four or five months in El Salvador and from two to three months in Costa Rica. Information could not be obtained on the procedures for registering companies or investments in Nicaragua.
Some Central American governments are aware that bureaucratic red tape is discouraging investment and are trying to streamline the system. The Guatemalan Congress has just passed a law which creates a “single window” for investors. Honduras’s Investment Act seeks to do the same thing.
I ll
Protection against imports
For more than three decades the Central American countries pursued an inward-looking development strategy. In line with this strategy, they levied high tariffs on final consumer goods and exempted imports of machinery, raw materials and intermediate goods for use in their manufacturing industries.
Today, the Central American countries have eliminated all tariff exemptions and specific duties (assessed by weight or unit) and are gradually lowering their ad valorem tariffs on imported goods that compete with local industry. These tariff reform efforts began in 1986 in Costa Rica, El Salvador and Guatemala, in 1987 in Nicaragua and in 1990 in Honduras. All five countries have taken numerous unilateral steps, but they have pledged to return to a common external tariff within two and one-half years.2 The new Central American tariff will be less protectionist in nature than its predecessor. It will have only four rates: 5% for
machinery, raw materials and intermediate goods not produced in the subregion; 10% for machinery, raw materials and intermediate goods produced in the subregion; 15% for final consumer goods not produced in the subregion; and 20% for final goods produced in the subregion.
Current tariff protection in the five countries and the levels planned for 1993, 1994 and 1995 are shown in table 1. The top rate, which would be 20% in 1995, does not preclude the application of higher excise taxes for fiscal or health reasons. Cigarettes and perfumes, for example, could be subject to a
2In section 28 of the San Salvador Declaration of 17 July
1991, the Central American presidents pledged to implement a uniform Central American tariff with a “20% ceiling and a floor of no less than 5%” on 31 December 1992; the countries may, however, formulate “a short list of products to which the agreed levels will be applied no later than 31 December 1994, for which purpose a tariff-reduction programme shall be established”.

INDUSTRIAL POLICY IN CENTRAL AMERICA / L. Will more 99
Table 1
CENTRAL AMERICA (FIVE COUNTRIES): IMPORT DUTIES
(Percentages)
1992 1993 1994 1995
Costa Rica 5 -46 a 5 - 40 5 - 31 5 - 20El Salvador 5 - 3 0 5 - 25 5 -2 0 5 - 20Guatemala 5 - 30 b 5 - 20 5 - 20 5 - 20Honduras 5 - 35 c 5 -20 5 - 20 5 - 20Nicaragua 5 - 60 d 5 -20 5 - 20 5 - 20
Source: Permanent Secretariat of the General Treaty on Central American Economic Integration (SIEGA), Políticas económicas vigentes en los países centroamericanos a enero de 1992, Guatemala City, February 1992, and information supplied by the Ministry of Economic Affairs of each country.
“ A temporary 2% surcharge on imports from outside the subregion was discontinued in March 1992. The Central Bank of Costa Rica required advance deposits until the end of 1991.
b Includes a 3% surcharge on imports from outside the subregion.c Includes a 5% across-the-board surcharge (except for machinery and equipment) and an additional 10% surcharge on final goods. d Includes excise taxes at rates of up to 40% which function much like import duties.
100% tariff rate, but if these items are produced locally for the domestic market, they will be subject to an 80% tax on their factory gate value. This measure will ensure that high customs tariffs do not become highly protective tariffs.3
Costa Rica currently has tariffs ranging from a 5% rate on machinery and parts to a 46% duty on “sensitive items” (textiles and footwear). For fiscal reasons, the Government maintains a tariff floor of 10% on imports of raw materials and intermediate goods. This puts Costa Rican industry at a disadvantage in competing with other Central American producers, but at least it is better off than it was in 1991, when the 10% floor also applied to machinery and parts and a 10-percentage-point surcharge was levied on all imports from outside the subregion. By the end of 1994 the country hopes to have its target tariff structure in place, which would be composed of ad valorem rates of between 5% and 20%.
El Salvador’s present import duties range from 5% to 25%, with the exception of textiles and
3 Section 28(2) of the San Salvador Declaration permits the preparation of “a limited list of exceptions comprised of products of a fiscal nature on which a tariff above 20% may be levied”. If such goods’ locally-produced (whether actual or potential) counterparts are exempted front the payment of these special tariffs, this provision could end up promoting the production of these “products of a fiscal nature”, which would entail a loss of tax revenue.
leather footwear, which are subject to rates of up to 30%. In mid-1993 the tariff ceiling is to be lowered to 20% (25% for textiles and footwear), and by June 1994 all tariff rates are to be between 5% and 20%. The Salvadorian Government does not impose quotas, surcharges or advance deposit requirements on imports and maintains a single, free-floating exchange rate,
Guatemala’s tariff structure is very similar to El Salvador’s. At the present time its rates go from 5% to 30% (including a three-percentage-point surcharge), but the Minister of Economic Affairs has slated a reduction of the top rate to 20% for early 1993.
Under Honduran law, tariff rates have already been brought down to a range of 5%-20%. However, five-percentage-point surcharges are applied to imports of all goods (except capital goods) and an another 10 percentage points are added to final consumer goods. Thus, in effect, Honduran producers are in the same position as Costa Rican producers in that they pay a minimum tariff of 10% on imports of raw materials and intermediate goods. It is not yet certain when these import surcharges will be discontinued, but it is supposed that they will be eliminated some time in 1993.
A number of past Honduran administrations, like some of their counterparts in other countries of the subregion, have on occasion made use of import licenses and export permits to protect certain producers or to help out consumers. It is therefore of

100 CEPAL REVIEW No. 48 / December 1992
interest to note that, under article 4 of the Investment Act, the current administration guarantees entrepreneurs “freedom to import and export goods and services without being required to obtain prior authorization or administrative permits” and pledges to uphold “the principle of free determination as it applies to the prices of the products or services they offer”.
Nicaragua lowered its tariff ceiling to 20% in 1990. At the same time, it introduced a number of selective consumption taxes (excise taxes). Many of these taxes, such as those levied on liquor, cigarettes,
soft drinks and beer, really are consumption taxes, because they apply to both locally-produced and imported products. Others, however, are actually selective tariff surcharges, since locally-produced goods are exempted. These “hidden” tariffs are charged on imports from any source (even within Central America) and can add up to 40 percentage points (as in the case of fancy biscuits and crackers) to the legally-established tariff. In any event, this is only a temporary measure, since these excise taxes are being lowered every six months and will have been phased out entirely by January 1993.
IV
Export incentives
The protection of the countries’ or the subregion’s markets creates two types of anti-export biases. The first stems from the fact that machinery, equipment, raw materials and intermediate goods are purchased at prices higher than the going rate on the international market; the higher the tariff floor is, the higher the cost of such inputs to the actual or potential exporter. The second bias arises out of the fact that a given product brings a higher price on the protected local market than it does on competitive export markets, thereby making import substitution more attractive than exporting. For these two reasons, the volume of exports is less than it would be under a free trade system.
1. Customs-free zones
The creation of customs-free zones for manufacturing activities is a way of eliminating much of this anti-export bias, at least for the industrial concerns located within them. Such zones exist in each of the five countries, although Honduras calls them by a different name (“export processing zones” (e pz s)), Nicaragua has passed no new legislation on this mechanism nor has it seen any recent investment of this type, but a customs-free zone which pre-dates the Sandinista Revolution does exist and is now run by a government agency called the People’s Industrial Corporation (c o ip ).
The companies in these special enclaves generally operate under a free trade system whereby they
have the right to buy inputs anywhere in the world, manage their accounts in whatever currencies they wish, and export their products to other countries. They also enjoy other privileges, such as lower taxes and freedom from the regulations applying to industry in the rest of the country. The key to success for a customs-free zone is authorization of duty-free importation of inputs on condition that they will subsequently be re-exported or used in manufacturing products for export. As one specialist in such customs-free zones has explained (Warr, 1989, p. 34), “Although the details of these provisions vary, a universal feature is the almost complete absence of either taxation or regulation of imports of intermediate goods into the zones”.
Costa Rican law does not fit in with this “universal feature” because the government protects the producers of inputs by permitting them to register complaints with the Bureau of Industry. If the Bureau finds that Costa Rican producers can match such imports in terms of price, quality and delivery times, then companies in the customs-free zones must “give priority” to locally-produced inputs.
These restrictions set Costa Rica apart from the rest of the world insofar as legal provisions pertaining to customs-free zones are concerned. Entrepreneurs who choose to set up shop in a zone of this sort do so primarily because of the possibility of becoming more competitive by remaining outside the country’s customs jurisdiction and being able to buy raw materials and intermediate goods of the desired

INDUSTRIAL POLICY IN CENTRAL AMERICA i L. Willmore 101
quality at the best possible price by seeking them out in any part of the world whatsoever. If Costa Rica were to enforce its laws strictly, these firms* competitive positions would suffer. And if the intention is not to apply the law, then it would be better to amend it so as not to discourage investors. What is more, the above-mentioned provision is entirely superfluous, since no firm is going to import inputs if it can acquire them locally on the same terms.
All the governments of the subregion grant 100% exemption from profits taxes to enterprises in the customs-free zones (see table 2). Many of them place a 10- to 12-year limit on these exemptions, but this is usually not enforced. The firms that set up operations in such customs-free zones are internationally mobile, or “footloose". Firms that shut down their operations in one country generally migrate to another country’s customs-free zone where conditions are better. Thus, the profits tax exemption is almost always renewed when its initial term expires. These footloose firms are also given at least partial exemption from other lesser taxes, such as land taxes and taxes on installed capacity.
Companies in the customs-free zones are given such privileges on condition that they export what they produce, that their output is used within the zone itself or that all imported products are re-exported. The laws of the Central America countries do, however, permit such companies to sell a portion of their output to buyers within their territories provided, of course, that all the corresponding duties are paid. In Guatemala up to 20% of such firms’ output may be sold on the local market, and in Costa Rica the figure is 40%. In El Salvador and Honduras the law sets no limit in this respect, but all prospective sales on the domestic market must first be approved by the Government (see table 2).
One condition which makes customs-free zones less attractive to footloose companies is the requirement that they be physically located within a certain area. The countries have shown themselves to be flexible on this point, however. At present, two-thirds of the nearly 100 firms operating in Costa Rica’s customs-free zones have built "satellite plants" outside the physical boundaries of the zones as a way of dealing with labour-recruitment difficulties or, in some cases, with problems of environmental pollution that make it advisable for them to move away from other industrial plants. In El Salvador, Executive Order No. 461 of 15 March 1990, which in effect constitutes a law on the country’s customs-free
zones and fiscal precincts, is more explicit in this regard; it states that "firms which export the whole of their output ... and which for technical reasons are not located within a customs-free zone may request that their premises bé declared a fiscal precinct ...” (article 20) and specifies that exporters operating within fiscal precincts shall enjoy the saipe tax incentives as those operating within customs-free zones (article 22).
2. Temporary importation
Temporary importation systems have some advantages over customs-free zones in that they permit plants which assemble imported inputs for subsequent exportation (“maquiladoras") to locate their facilities anywhere in the country. This allows them to make use of existing infrastructure and thus to avoid costly investments in new industrial complexes. This system is similar to El Salvador’s "fiscal precincts”, but is much more flexible. The entrepreneur must guarantee that these temporarily imported inputs will be exported within a specified time span, usually one year. No other restrictions are placed on such imports in the subregion. With the exception of El Salvador, the countries also permit duty-free importation of machinery and equipment. As in the case of firms within customs-free zones, each country exempts these assembly plants from profits taxes (see table 3).
Plants operating under the temporary importation system are prohibited from selling their products on the local market in Costa Rica and Honduras. El Salvador and Guatemala permit unlimited sales on the sole condition that the corresponding duties on the final product are paid. Maquila activities in El Salvador also receive a drawback equivalent to 8% of the value added, but only once the products have been exported to markets outside the subregion. For the time being Nicaragua has no specific laws on the subject, nor has any bill regarding such activities been drafted.
As a rule, temporary importation mechanisms have been devised as a way of assisting exporters who use many imported inputs and add little value to them within the national territory, but the laws of the Central American countries do not clearly set out the system’s eligibility requirements. One way of deciding whether a given concern is or is not a maquiladora is to determine how much value the activity adds to the product in question. In Guatemala, Executive

102 CEPAL REVIEW No. 48 / December 1992
Table 2
CENTRAL AMERICA (FOUR COUNTRIES): CUSTOMS-FREE INDUSTRIAL ZONES
Costa Rica El Salvador Guatemala Honduras
Tax exemptions Imports of machinery and inputs 100%a 100% 100% 100%
Profits 100%, 8 yrs 50%, 4 yrs
100%, 10 yrs renewable
100%, 12 yrs 100%
Sales on local market Up to 40%, subject to approval
Unlimited, subject to approval
Up to 20%, subject to approval
Unlimited “when the same sort of product is not produced in the country”, subject to approval
Source: The relevant legal provisions of each country.a No restrictions are usually placed on imports going into the zone, but imports of raw materials or inputs can be restricted if the Bureau
of Industry finds that Costa Rican producers can meet the importing compnies’ requirements in terms of price, quality and delivery times.
Table 3
CENTRAL AMERICA (FOUR COUNTRIES): TEMPORARY IMPORTATION SYSTEMS (MAQUILA ACTIVITIES, DRAWBACKS)
Costa Rica El Salvador Guatemala Honduras
Tax exemptionsImports of machinery 100% - 100% 100%
Imports of inputs 100% 100% 100% 100%
Profits 100%a 100%, 10 yrs, renewable
100%, 10 yrs 100%, 10 yrs
Sales to local market No Unlimited, with payment of corresponding taxes
Unlimited, with payment of corresponding taxes
No
Export incentives No Drawback of 8% of value added
No No
Source: The relevant legal provisions of each country.*In the case of registered foreign investments, a 15% tax is levied when profits are reptriated.
Order No. 29-89 defines maquila activities “as those devoted to the production and/or assembly of goods ... containing at least fifty-one per cent (51%) foreign merchandise”, or, in other words, a maximum of 49% national value added. The distinction between maquila and non-maquita activities is irrelevant in Guatemala, however, since any company can make use of the temporary customs-clearance system.
3. General incentives
Companies operating in customs-free zones or under temporary importation systems export almost all of their output. Even in cases where they are allowed to sell their goods on the local market, they must pay the same tariffs as those levied on firms located abroad. The vast majority of Central American manufacturing firms produce goods for the

INDUSTRIAL POLICY IN CENTRAL AMERICA / L. WHlmorc 103
Table 4
CENTRAL AMERICA (FIVE COUNTRIES): INCENTIVES FOR EXPORTS OF NON-TRADITIONAL MANUFACTURES
Costa Rica El Salvador Guatemala Honduras Nicaragua
Tax exemptionsImports of machinery and inputs 100% 100% 100% 100%
Profits 100%a - 100%, 10 yrs 100%, 10 yrs 80%
Taxes on exports - - 1.5% 1% -
Tax c r e d it c e r t i f ic a te s (CATs) Up to 12%
of fob value b- - - 15% Of FOB
value c
Cash drawbacks - 8% of fob value - -
Requirements Minimum 35% national value added
- - Provide at least 25 jobs directly
Export at least 25% of output
Source: The relevant legal provisions of each country,aIn the case of registered foreign investments, a 15% tax is levied when profits are repatriated. b Annual decreases will have phased out the CATs entirely by 1997. eTo be lowered to 10% in 1993, to 5% in 1995 and to zero in 1997.
protected local market, but some of them are in a position to export at least a portion of what they produce. All the countries in the subregion have more flexible legislation regarding these “part-time” exporters.
Table 4 provides an overview of the incentives for exports of non-traditional manufactures in each of the five countries. These incentives do not apply to exports going to other countries within the subregion, but they do apply to sales to companies in customs-free zones. Salvadorian law in this area is surely the most straightforward; it simply directs that a cash payment equivalent to “8% of fo b value [is to be granted] to offset import duties and other indirect taxes on export activity” (article 3 of Executive Order No. 460 of 15 March 1990). The law's simplicity is its main virtue, since it thus streamlines the corresponding administrative procedures. Furthermore, this system enables El Salvador to provide incentives to exporters without exempting them from import duties, thereby encouraging the use of locally-produced inputs. The system does have a
disadvantage, however: since not all inputs are subject to the same tariff rate and not all products face the same anti-export bias, the across-the-board drawback may be too much for some activities and too little for others.
The rest of the countries offer various sorts of incentives to exporters. All permit duty-free importation of machinery, equipment and inputs used in the production of goods for export. All the countries also provide these firms with exemptions (although to differing extents) from taxes on the profits they realize from their export activities. Nicaragua provides them with exemptions from 80% of such taxes only, while Guatemala and Honduras place a 10-year limit on such allowances.
Since 1972 Costa Rica has issued tax credit certificates, or ca ts, which originally were worth 15% of non-traditional exports’ fo b value (the value of the merchandise once on board the ship or airplane, not including freight or insurance charges). As this incentive has proven to be very costly to the government, however, it has decided to phase out cats over the
104 CEPAL REVIEW No. 48 / December 1992
next few years.4 Casta Rica currently offers cats equivalent to 8% of the f o b value of exports containing 35%-40% national value added, and an additional 1% for each five additional points of value added up to a maximum of 12% for exports incorporating 55% or more national value added. In Nicaragua, cats equal to 15% of exports’ f o b value are provided regardless of the amount of national value added. This may be an over-generous incentive for assembly or maquila activities, but it will be a short-lived one, since the rate is to be lowered to 10% in 1993, to 5% in 1995 and to zero in 1997.
Guatemala and Honduras are the only countries in the subregion which do not give either cash drawbacks or tax credit certificates to exporters of manufactures. They are also the only ones that tax such exports. The tax is a small one (1.5% and 1% of their value, respectively), but the fact that it exists at all does nothing to help eliminate the
anti-export bias, since it leaves open the possibility of a rate hike at some future date.
Two of the countries -E l Salvador and Guatemala- offer incentives to all exporters of non- traditional manufactures, no matter how small their export volumes or percentage of national value added. El Salvador’s Export Reactivation Act even offers incentives to exporters of traditional products (defined as coffee, sugar and cotton), provided that they process the goods enough to generate at least 30% added value. Costa Rica requires that exports have at least 35% national value added in order to be eligible for c a t incentives. Honduras limits these benefits to relatively large companies by requiring that the exports directly create at least 25 jobs. In Nicaragua, some potential exporters do not receive any encouragement whatsoever because existing incentives are only for firms that export at least 25% of their output.
y
Labour, energy and water costs
The minimum wages and workers’ benefits in effect in each Central American country are shown in table 5. It should be noted that the minimum wages cited in the table refer to the manufacturing sector as a whole rather than to specific companies. Many firms, especially the larger ones and those that export most of their output, pay higher wages, but they also hire people who are more highly skilled or who have greater training potential.
The range of wages and benefits in Central America is very wide. Wages are highest in Costa Rica; in fact, they are about double what they are in the other four countries. Legally-mandated annual vacation leave is fairly generous in Nicaragua (30 days), as is the number of public holidays (17 days). Total benefits, measured as a percentage of the base wage, are greater in Nicaragua (64%) than in any of
4 Hoffmaister (1992) estimates that between 1984 and 1989 each dollar’s worth of CATs generated US$ 1.34 in gross exports and US$ 0.80 in imported inputs which were then incorporated into the goods to be exported. Thus, on average, each dollar’s worth of subsidy generated only US$ 0.54 in net exports. During this period most non-traditional exports received 15% CATs, subject to the requirement that the products contain at least 35% national value added.
the other countries, partly because of the custom of giving workers a basket of staple foods for their families each month; the lowest levels are found in Honduras and El Salvador (27%).
The additional costs incurred by a company when it dismisses a person for reasons other than misconduct are not included in table 5. This legally-guaranteed severance payment is equivalent to one month’s wages per year of employment in all five countries.
Energy and water costs affect the competitiveness of the manufacturing sector in Central America, in addition to labour costs. Electricity rates do not vary a great deal from one country to another, but are highest in Guatemala, followed by Costa Rica and Nicaragua. Firms which are heavy consumers of electricity pay less per kWh, while those who use very little pay much more than the average amounts shown in table 5. It is also important to note that these prices do not include the cost of blackouts, which occur frequently in El Salvador and Nicaragua. Gasoline prices are substantially higher in Nicaragua and Guatemala, diesel fuel is costlier in Honduras and Guatemala, and drinking water is more expensive in Costa Rica and Honduras.

INDUSTRIAL POLICY IN CENTRAL AMERICA / L. Willmore 105
Table 5
CENTRAL AMERICA (FIVE COUNTRIES): COSTS OF LABOUR, ENERGY AND WATER a
Costa Rica El Salvador Guatemala Honduras N icaragua
Minimum monthly wage (dollars) 153.31 83.00 68.00 85.00b 76.00
Social security (%) 14.0 13.25 10.0 7.0 12.0Other taxes (%) 8.0 - 1.3 1.0 2.0Paid public holidays (days/year) 6 11 12 11 17 cPaid vacations (days/year) 15 IS* 15 10* 30Year-end bonus (days) 30 10 f 30 30 30Food basket (%) - - - - 26.3Total benefits (%) 36.7 26.6 28.5 27.3 64.2
Total cost per month (dollars) 209.57 105.08 87.38 108.20 124.79Work week (hours) 48 44 44 44 48Total cost per hour (dollars) 1.02 0.56 0.46 0.57 0.60
Exchange rate for the dollar 138.30 8.10 5.09 5.40 5.00Electricity (dollar/kWh) 8 0.06 0.05 0.07 0.05 0.06Regular gasoline (dollar/gallon) 1.29 1.45 1.76 1.32 1.90Diesel fuel (dollar/gallon) 1.09 0.87 1.17 1,19 1.10Drinking water (dollar/m3) h 0.60 0.08 0.11 0.31 0.10
Source: Permanent Secretariat of the General Treaty on Central American Economic Integration (S1ECA), Precios que inciden en tos costos de producción del sector industrial de tos países del istmo centroamericano a enero de 1992, Guatemala City, February 1992, and research by the author.
“The figures shown in this table correspond to early 1992.b Legal minimum wage for firms having over 15 employees; the minimum wage is 14% lower for firms having 6-15 employees and
30% lower for those with 5 or fewer employees. c Managua only; workers in the rest of Nicaragua are legally entitled to 15 paid holidays per year. d For annual vacation leave an additional payment equal to 30% of the worker’s wage is required.*For persons who have been employed for less than two years; workers who have been employed for two years receive 12 days of
paid vacation; those with three years receive 15 days; those with four years or more receive 20 days.fFor workers who have been employed for less than three years; workers employed for 3-10 years receive a bonus equivalent to 15
days’ wages; persons who have been employed for 10 years or more are legally entitled to a bonus equivalent to 18 days’ wages, s Approximate average for industrial use. h Cost in the capital city of each country.
Bibliography
De Soto, Hernando (1992): Para hacer empresa en democracia, Revista INCAE, vol. 5, No. 2, Costa Rica, Central American Institute of Business Administration (INCAE).
Hoffmaister, Alexander (1992): The cost of export subsidies: evidence from Costa Rica, IMF Staff Papers, vol. 39, No. 1, Washington, D.C., International Monetary Fund (IMF), March.
Rosenthal, Gert (1975): Algunos apuntes sobre el grado de participación de la inversión extranjera directa en el proceso de la integración centroamericana, Eduardo Lizano (ed.), La integración económica centroamericana, Lecturas 13, vol. I, Mexico City, Fondo de Cultura Económica.
Permanent Secretariat of the General Treaty on Central American Economic Integration (SIECA) (1992a):
Políticas económicas vigentes en los países centroamericanos a enero de 1992, Guatemala City, February.
(1992b): Precios que inciden en los costos de producción del sector industrial de los países del istmo centroamericano a enero de 1992, Guatemala City, February.
Warr, Peter (1989): Export processing zones and trade policy, Finance and Development, vol. 26, No. 2, Washington, D.C., International Monetary Fund (IMF)/World Bank, June.
Willmore, Larry (1976): Direct foreign investment in Central American manufacturing, World Development, vol. 4, No. 6, New York, Pergamon Press Ltd., June.

CEPAL REVIEW No. 48
Participation and the environment
*Tonci Tomic
The petroleum-based production pattern has ultimately proved to be a dead end as the deteriorating quality of natural resources -owing to the way they have been used and appropriated- has begun to cast doubt upon the pattern’s viability. Repeated soundings of alarm on this score have increasingly sensitized the population, thus creating a level of ecological awareness that has moved society to voice its ever more vehement rejection of a system which bases itself on the destruction or degradation of natural resources and, in so doing, jeopardizes the sustainability of the development process.
At the same time, a variety of factors -including such diverse elements as financial constraints and demands for the consolidation of democracy- have prompted a restructuring of the institutional system. One of the most immediate effects of this has been a downscaling of the State’s sphere of activity relative to the presence and action of civil society; one of its delayed effects has been the déconcentration of political power.
These two factors make it necessary to forge a link between the issues of environmental sustainability and societal participation in order to devise an approach capable of generating operative responses to the development challenge facing the countries of the region.
The author analyses a possible approach to environmental issues, puts forward a number of hypotheses regarding the social and institutional dynamic, gives his interpretation of the origin of political power and the forms it takes, and presents a number of action proposals. The article focuses on these issues within a rural setting, and for that reason the suggestions it contains are also made from a rural perspective; none the less, they can be extrapolated to other areas. The proposals made here deal with the steps that need to be taken before a sound, comprehensive effort can be mounted to halt the degradation of ecosystems and the deterioration of the region’s natural resources: something which simply cannot be accomplished without the active participation of the social sectors linked to these resources.
The au thor is a consultant to the Food and A griculture O rganization o f the U nited N ations (FAO).
IntroductionThe relationship between participation, the environment and sustainable development has extremely important implications for our future. As stated in the Rio Declaration on Environment and Development, “Environmental issues are best handled with the participation of all concerned citizens, at the relevant level. At the national level, each individual shall have appropriate access to information concerning the environment that is held by public authorities, including information on hazardous materials and activities in their communities, and the opportunity to participate in dedsion-making processes. States shall fatilitate and encourage public awareness and participation by making information widely available. Effective access to judicial and administrative proceedings, including redress and remedy, shall be provided.” 1 Clearly, however, a great deal remains to be done before these types of precepts can be put into practice. Indeed, working definitions of such concepts as “environment”, “participation” and “sustainable development” have yet to be agreed upon, and the lack of such definitions further obscures the ways in which these elements interact and the operational means that could be used to put them into practical effect. Nevertheless, demands for genuine, swift and effective incorporation of these dimensions into our daily lives are growing, as is the necessity of doing so in order to put a stop to processes of environmental degradation which may prove to be irreversible if the current situation is allowed to remain unchanged; an awareness of this fact is implicit in the Rio Declaration,
One major impediment to more comprehensive, precise conceptual and methodological work in this field is the lack of information, in a wide range of areas, on ecosystems and on the status of the environment and how it is changing. For example, many of the plants in the Amazon region have not yet been catalogued; consequently, the behaviour of these ecosystems is not fully understood and the potential pharmaceutical value of these unknown species cannot be assessed. This lack of information is a problem in respect of both baseline evaluations and environmental monitoring; in other words, we have
1 Principle 10 of the Rio Declaration on Environment and Development, which was signed by the Presidents of the nations represented at the recent United Nations Conference on Environment and Development (Brazil, June 1992).
108 CEPAL REVIEW No. 48 i December 1992
neither a full picture of the present status of the region’s agro-ecosystems nor institutionally tested systems or methodologies for collecting the information that would allow us to monitor qualitative and quantitative changes in these ecosystems and to evaluate the effects of different measures and policies.
The theoretical analysis of this subject requires an ability to work at very high levels of complexity and abstraction due to the specificity of many aspects of the processes involved, the vast number of variables to be dealt with, and the nature of their interaction, all of which is, in addition, skewed by their particular context. Otherwise, we run the risk of falling back on simplistic, overly linear definitions of the parts which the various social actors should play in forging a way of life and a system of production conducive to the sustainable development of forestry, agricultural and fishery resources.
The discussion contained in the following pages is intended to foster a debate based on a careful examination, within a specified context, of certain elements that will have to be taken into consideration when society, through the relevant agents, arrives at the point where it begins to undertake participatory action in respect of the sustainable development of the agricultural, forestry and fishery sectors.
Generally speaking, in regard to the link between participation and the environment, it will be argued that both the conventional political system and civil society can serve as platforms for social participation and that, given the constitutional char
acteristics of Latin American societies, both of these spheres need to be taken into account. It is important to bear in mind that these societies are overly socialized and marginalized 2 and, as a result, individuality3 is only just beginning to emerge as a fundamental element of civil society.
Today, there is a tendency to think that participation emanating from civil society is more “effective” or more “genuine” than conventional, indirect forms of participation. The problem with this is that Latin America’s civil societies are relatively weak agglomerations, whereas its traditional political system is stronger and more fully consolidated. The region must therefore channel some of its efforts towards strengthening its civil societies as a means of augmenting direct participation. At the same time, however, traditional forms of participation through political parties should not simply be discarded, since they can indirectly help to strengthen the various spheres of civil society itself. In summary, it is not a question of substituting one type of participation for another but rather of striving to integrate the two and to expand their potential range of action while recognizing the specific features of each of these forms within the Latin American context.
Within the scope of this analysis, and with a view to helping to lay the foundations for a sustainable form of agricultural and rural development, three fields are discussed in which steps could be taken to promote participation: information, technological progress and environmental monitoring.
I
Environmental issues and ways of addressing them
The deterioration and degradation of the region’s agricultural ecosystems pose a problem that could be described as being a “by-product” in that it is not the result of some social agent’s deliberate decision to damage the environment, but is instead an unsought effect of a certain way of appropriating and using natural resources. Stated in broader terms, we could describe the situation as being one in which the decisions taken by economic and political agents have generated negative externalities4 which have gone undetected by the market-based system of resource allocation and which, in consequence, this system
2Exaggerating somewhat for the sake of illustration, some
anthropologists have contended that our society’s mechanisms of social interaction still exhibit some of the traits of tribal societies.
3The term is used here to denote a particular set of complex traits (desires, aptitudes, creativity) which differentiate individuals from one another, rather than as a synonym for “individualism”.
4 Studies commissioned by the World Bank have shown that some policies, especially on credit and subsidies, have promoted the deforestation of the Amazon region without affording any major benefits to the countries concerned. See Mahar (1989) and Binswanger (1989).
PARTICIPATION AND THE ENVIRONMENT / T. Tomic 109
has failed to correct by assigning a value to environmental degradation.
This process has two starting points: one is structural in nature and is related to the social distribution of resources, while the other is of a functional character and is associated with resource use, chiefly in terms of technology.
One of the most contradictory aspects of the destruction of the environment is that even though it is a direct consequence of the environment’s economic exploitation, the cost of environmental deterioration is borne by society as a whole, rather than by the direct beneficiary of that exploitation. In the traditional approach to project evaluation, a resource’s value is estimated by calculating the net discounted income flow that it generates, assuming that the resource itself remains unchanged; consequently, this form of economic appraisal does not incorporate the resource’s destruction or deterioration as a project cost.5 It may therefore be supposed that many natu- ral-resource investment projects are “profitable” only because their evaluation has not included the costs associated with the destruction of the natural resources they are using.
Part of the problem has to do with the fact that the pace of technological innovation is outstripping the region’s capacity for institutional readjustment. Indeed, the rapid spread of technical progress and economic expansion seem to have occasioned more negative externalities than public and private institutions can handle.6
One of the stumbling-blocks in the search for solutions to environmental problems is the lack of a single, clear-cut origin from which a definite train of events can be traced. Many experts feel that the
5 It must be remembered that the taxes paid by the citizens of a given country represent the sum society is charging them for the exclusive right to draw the income generated by the resource in question and for the use of the relevant infrastructure (whose cost has been borne by society), without which this income could, in many cases, not be generated at all.
6 Kemp and Soete (1990) develop this idea, while Goran-Maler (1990) contends that, in accordance with the principle ofthermodynamics, as the pace of economic growth speeds up, the degradation of natural resources will also accelerate. Although this is true in a general sense, it overlooks the possibility of opening up new spheres of activity in connection with products that have no environmental impact (something analogous to the continuous upgrading and zero-fault processes to be observed intoday’s informa tics-based industry).
development style itself is the cause of ecosystem deterioration.7 This means that, in many cases, so- called “environmental problems” cannot be solved solely by means of environmental measures as such but instead call for efforts in a number of different areas, including, perhaps, economic measures or direct political action.
Second, devising a participatory strategy for addressing environmental problems is difficult because it is not clear which parties are in conflict with one another; i.e., we do not know exactly which sociopolitical agents are involved or which sphere or level is the most suitable for resolving a given dispute.
Third, the intertemporal character of the problem, 8 along with uncertainty as to what questions decision-makers need to ask, hamper policy-making and participation by the relevant agents. If the choice is expressed as being between approving or disapproving of environmental destruction and deterioration, the answer is obvious; but it is not so obvious that, under present real-world conditions, there really is an environmentally sustainable option which society is willing to accept, given the costs and benefits of the necessary changes and the social distribution of effort and of rewards.9
If we take the case of the destruction of the Amazon region as an example, the first questions that arise relate to deforestation and indiscriminate clearcutting, which are obviously the direct causes of the region’s destruction. How are we to continue developing and utilizing this ecosystem without destroying it? Are there viable alternatives to slash-and-burn agriculture? Is it possible to miné gold without using mercury? Are companies really willing to manage the Amazon rain forest in an
7See, in particular, the studies prepared by the Joint
ECLAC/UNEP Development and Environment Unit, especially those conducted by O. Sunkel, N. Gligo, G. Gallopin, P. Gutman, A. Herrera, H. Urtubia and I. Sachs, among others.
8This concept of intertemporality has arisen out of the various definitions of sustainability that have been advanced, particularly the one framed by the World Commission on Environment and Development (more commonly known as the Brundtland Commission), which is also the most generally accepted one. According to that definition, in order for there to be sustainability, natural resources must be used in ways that take into consideration both present needs and the needs of future generations.
ñAn intertemporal option is implicit in the concept of
sustainable development.

110 CEPAL REVIEW No. 48 ¡December 1992
environmentally sound manner? How are the costs (and benefits) of heightening the greenhouse effect to be distributed, given the role played by this ecosystem in its generation? These and other questions are particularly important, because the development of the Amazon jungle cannot be halted but only modified.
When the problem is stated in these terms, it may be seen that a number of the agents involved have at least two different roles: they are acting as citizens, who want the best for their country, and as economic agents, who need to produce or, depending on the particular case, at least survive. If the necessary strategy changes are made too swiftly, the consequences could range from lost profits to the disintegration of a social group.
This is, to some extent, the context of environmental issues in Latin American agriculture. The interests of some agents conflict with those of others, as do those of private agents and the State. Moreover, the amounts of political clout and influence wielded by the various groups differ substantially. The complexity of such issues is further increased by the agents’ dual roles and by the lack of dispute settlement mechanisms. Consequently, during the problem-identification stage it is very important to determine how the various agents are aligned so that realistic answers can be found for the above-mentioned questions and so that the resulting proposals can be implemented through a process of negotiation. This rough outline applies to all the various ecosystems found in the region, but it takes on special urgency in the case of the most fragile ones.
If these factors are not taken into consideration when dealing with environmental issues, attempted solutions may backfire. In a democratic system, decisions cannot be put into effect or maintained without the backing of real social agents, whether that support is channeled through the conventional political system or through civil society. In fact, if environmental problems are not approached with a sense of political realism -which is often no more than just plain common sense- the steps taken may prove to be counterproductive. For example, if the members of a community are simply asked whether they wish to continue the exploitation of the ecosystem or not, they will probably say that they want to continue utilizing it as they have in the past; if traditional
methods of exploitation do continue, however, the consequence may be the destruction of that ecosystem. Hence the need to use suitable methods for eliciting the opinions of the community and to apply those methods correctly.
The participation of the citizenry plays an essential part both in legitimizing the instruments used by society -through its democratically elected public officials- to deal with environmental issues and in arriving at decisions and taking direct action within the framework of the measures to be implemented.
At least three spheres of action are involved in the legitimization of such instruments:
(i) The law. The countries need to fashion a legal framework for environmental issues that will permit their institutionalization and, thus, the establishment of legal guidelines for resolving problems caused by conflicts of interest among individuals or between the State and private individuals which lead to the destruction or deterioration of the environment.
(ii) The economy. Policy incentives and disincentives or, when appropriate, regulations will have to be used in order to actually put into practice the thesis that the cost of ecosystemic degradation should be paid by those who benefit from that degradation or who bring it about.
(iii) Politics. The system’s capabilities for adopting structural solutions (such as altering the property structure or broadening and democratizing channels for political and civil participation) need to be upgraded. The current situation in the world being what it is, the latter step, in particular, involves promoting déconcentration, de-localization and, above all, decentralization; in other words, it entails strengthening regional and local forms of participation and social control.
Thus, it is a question of bringing problems and solutions closer to each other and of encouraging the people actually concerned to take part in the effort to improve their living conditions and their environment. Apart from any other considerations, it would simply be ineffective to approach such problems in any other way since, without the participation of all relevant actors, hierarchic democratic systems tend to promote uniformity and to display a disregard for regional or local characteristics, which must be taken into consideration in order to resolve environmental issues.

PARTICIPATION AND THE ENVIRONMENT / T. Tomic n i
II
Participation and power
While the connection between participation and power is obvious, since, when a person participates, what he or she is actually doing is exercising power, it is important to remember that participation can be channeled either through the political system or through dvil society.
A few words of explanation are perhaps called for here. Power can be defined in simple terms as “some degree of ability to direct society along a desired path, i.e., a situation in which one agent’s will to act prevails over that of other agents in society who have opposing ideas”. The “social will to act” -as an organizational phenomenon- resides primarily in political parties, with such parties being understood as broader expressions of the interests of given social groups which rise to political prominence when they reach a point where, besides having attained some awareness of their own identity, they “tend to see their interests as transcending their own particular milieu and interpret them as being the interests of other groups, i.e., when those interests are presented as a proposition for the whole of society”. “Thus, the panoply of leading players within the political realm is composed of political parties which, independently of their origin and of the set of institutions and individuals concerned, become actors because they are able to publicly express their social will. All such parties must confront the force of each other’s wills. This interaction is what is known as the alignment of political forces, which is what ultimately transforms the will to act into the ability to act. The alignment of political forces as such is therefore the axis of power; consequently, the attainment of societal dominance -power- is the shifting of a given alignment of political forces in one’s own direction” (Briones, 1990).
Therefore, any proposals to be made should take conventional political participation into consideration as a legitimate, widespread form of participation in Latin America’s societies; to that end, the formation of solid, stable party structures should be promoted as a way of consolidating and improving the region’s infant democracies and of dealing more effectively and
realistically with problems of ecosystemic destruction anddeterioration.10
This does not eliminate the need for political action to strengthen regional and local channels for institutional participation in the discussion and adoption of decisions leading to the institutional modification of the structure of the State. Moreover, any attempt to sidestep political parties would be naive, since in a sense this would be tantamount to assuming that neither the State nor the laws that govern it have any validity.
The other sphere of participation is that of civil society, which is largely composed of all those groups having a distinct identity that do not purport to be societal interpreters of the “majority” -a concept which is becoming increasingly difficult to define, given the vast array of differing interests and forms of expression to be found in society. Two factors warrant particular attention in this connection: the importance of establishing and strengthening organizations that will seek to protect the environment and of promoting sustainable long-term growth, and the need to find ways for different interest and pressure groups to arrive at agreements among themselves so that a positive-sum process can be initiated at a more general level.
An increasingly evident fact underlying the dynamic of interest-group formation is that apparently “no social group is capable of thinking for the whole of society on the basis of its own interests”. 11 Therefore, the guiding principle for our very necessary efforts to create mechanisms and channels for participation -at this stage, direct participation in decision-making- should be the need to devise consensus-based formulas, since the collective interest will necessarily be determined by an agreement that has been negotiated by the parties concerned once they have ceased to strive for uniformity and begun to seek out a synergic linkage among heterogenous elements.
10 There is probably a need for the parties to reform some of their basic conceptual aspects and to modernize so that they can adapt to new conditions and challenges, but they are already exhibiting some degree of awareness and concern about the degradation of the environment.
11 N. Lechner, cited by Koolen (1990).

112 CEPAL REVIEW No. 48 I December 1992
III
Types of societies and forms of participation
Recent history shows us that, following what different experts have described as the third, fourth or fifth industrial revolution,12 the more successful countries or groups of countries have been those which have done a better job of incorporating the civil society into national affairs. In other words, countries with weaker civil societies now appear to be less able to meet their population’s overall needs. Corroborative evidence for this statement is supplied by the collapse of socialist regimes in Europe and the demise of the military dictatorships which had dominated the political scene in Latin America for the past 20 years. Regardless of any specific achievements which these models may have attained in the past, the fact is that they are no longer even in the running. Interestingly enough, both of these models, by definition, were not based in the civil society; on the contrary, they were based on its systematic destruction.13
In contrast, the countries of Western Europe and North America -one of whose political traits is that they permit a greater degree of participation on the part of civil society- have been strengthened in various ways and means.
This is, in turn, related to what has been called the new technical/production paradigm14 -the paradigm towards which the developed world is now making a transition on the basis of a revitalized technological platform. From a political vantage point, in this new paradigm groups do not appear to be vying for absolute power; instead, what is emerging is the idea of a firm resolve to build a consensus within the realm of political action. In the economic/social domain, the paradigm appears to have no model whatsoever, but is instead associated with a number of
12 Regardless of the number chosen, the reference made here is to the changes that occurred worldwide during the 1970s and 1980s.
13 This statement is valid in theoretical terms, given the type of society in which these models were applied. In practical terms, however, a civil society did indeed exist, even if it had to go underground; in fact, it was precisely this civil society which, once it had regained some sort of communications link, exposed the authorities’ lack of legitimacy and their origin in these dictatorial/hierarchical models.
14 The studies conducted by Pérez (1989) on this subjectare of particular interest.
central focuses which can be summed up by the precepts of economic growth, democracy, social equity and participation, and environmental sustainability.
Latin America, however, has proven to be a political hybrid whose heterogeneity is its distinguishing feature: without being even remotely socialist, it is comprised of strong States and relatively weak, socially fragmented, poorly articulated civil societies.
None the less, the Latin American countries’ political systems and, in particular, their political parties are now in the throes of a legitimacy crisis. The most tangible evidence of this phenomenon is the appearance on the electoral scene of an “anti-party” vote which has made its presence felt in recent elections. Consequently, political parties are no longer the only path to the presidency of a country; there are other sources of legitimacy -such as fame, success, a reputation for honesty- and in some cases it is actually better to be viewed as having no political party connections. The explanation for this seems to be that the electorate has reached its saturation point with the system of political parties itself -for reasons ranging from ineffectiveness or excessive centralism to corruption-15 together with a feeling that the electorate is called to the voting booth to legitimize agreements and acts decided upon by the party leadership rather than to take political decisions.
Thus, in addition to socioeconomic marginality we now have political marginality as well, owing to the fact that the overly standardized structures and concepts upon which traditional parties have been founded have caused them to close ranks around internal groups, thereby losing their identity and legitimacy in the eyes of the party rank and file, even in the case of grassroots parties.
This has begun to spark a desire for modernization, especially within the framework of centre- left innovations. The question to be answered is therefore how to go about integrating all the social
15 It should be borne in mind that the State and, hence, political parties have seen their sphere of activity reduced while, on the other hand, the market has been gaining legitimacy as the main new mechanism of resource allocation. This development is associated with the process of replacement of paradigms.

PARTICIPATION AND THE ENVIRONMENT / T. Tomic 113
strata; otherwise, the populace’s poor opinion of the political party system will probably grow even worse.
This process of change can be expected to contribute, in the medium term, to the reform and readjustment of the political system, and it will probably help strengthen civil society as well; this is, after all, the direction in which the new “social pact” is carrying today’s world. Latin America cannot opt out of this process, just as it cannot escape the widespread re-emergence of democracy.
In sum, it has been observed that when a civil society is relatively solid, community participation occurs at the decision-making level and takes a direct
form, usually in regional and local forums. When the political system is strong, on the other hand, political parties intervene in such participation by playing a role in its legitimization, and the institutional framework for community participation tends to become centralized.
Those countries where the civil society is more developed and is therefore more fully incorporated into the country’s day-to-day affairs will be better equipped to meet the challenges posed by this new phase of development, and support for the consolidation of a reinvigorated civil society will bring the country closer to its goals of growth, social equity and sustainability.
IV
Participation and the environment: some proposals
The foregoing hypotheses suggest that efforts should chiefly be focused on designing strategies for stimulating the formation and reinforcement of civil society and on defining institutional channels for direct participation. Simply defining such channels is not enough, however. In the absence of a civil society in the process of consolidation, efforts to deal with environmental issues may be thrown into disarray, and existing conditions may grow even worse. Hence the need for ongoing action to promote the organization of social groups based on various identificatory criteria (e.g., corporate, territorial, ethnic or other interests), since only an organized society is capable of effective participation. At the same time, an equally determined effort must be made to build a transparent party system that will provide society with a vehicle for indirect participation.
A number of proposals regarding more specific spheres of action are presented below.
1. Dissemination and information
In dealing with environmental issues, and specifically those types of issues that arise in rural areas, the first step is to disseminate information as widely as possible throughout the various levels of society. Without information, decision-making capacity is sharply reduced, while the possibility of
manipulating public opinion increases. Therefore, it is extremely important for the populace to be well informed about the institutional system, its characteristics, the way it operates, and exactly what things users have a right to demand of it. It is also necessary for there to be a wide distribution of accurate information about the specific issues being addressed; only then can users become proficient in handling the relevant information, fully understanding the issues, realizing how those issues affect them, determining how to address them and with whom, and taking decisions in real-life situations. For example, peasant farmers, settlers and indigenous groups living in the Amazon region or those who obtain their livelihood from the mangrove swamps should know how the destruction of those ecosystems would affect them and the rest of the human race, what their strategic options are, which political and social agents are arrayed on each side of the issue, what specific proposals the State has made, and how any possible negotiations would be structured.
It is highly likely that the mere dissemination of information in a suitable manner, along with the interaction to which this would naturally lead, would be enough to spark an intense debate and to engender a genuine participatory process; unless this is done first, it might well be somewhat irresponsible to set in motion what would then be no more than imitative participatory processes.

114 CEPAL REVIEW No. 48 ÍDecember 1992
2. Technology
Technology constitutes a second area of action. If part of the environmental deterioration now taking place is seen as being the sum of the effects of a vast number of individual acts, then one of the most effective ways of participating in the conservation of the environment is for each agent -in this case, each farmer- to try to conserve his own farm, i.e., to try to manage each plot in a more sustainable fashion. And the way to do this is with technology. It is important for the user to play an active part in identifying, adapting and disseminating the technology to be applied.16 It is also essential, however, that technological research go beyond the bounds of the experimental station; the importance of such stations should be recognized, but the mere concept alone is not enough for this new stage of development. In addition, ways should be sought to start up an even- handed dialogue between technical experts and farmers. Thought could be given, for example, to the possibility of setting up experimental fields and of fostering an ongoing dialogue among the agents associated with specific ecosystems as a means of generating practical solutions for promoting the productive management of these ecosystems. (In fact, some experiments of this type are already being conducted in the region.)
Another promising approach is to have the users participate directly in such experiments so that, with the help of coordination provided by research institutes, universities and agribusinesses, the farmers themselves can head up the effort to find, adapt and select technology.
These and other forms of interaction among agents will enable agricultural producers -especially traditional peasant farmers and indigenous groups- to contribute their own expertise, which, it should be remembered, has permitted them to utilize the various ecosystems of the region for quite a long time in what, from an environmental standpoint, has been a fairly successful manner. Today we have an opportunity to rework the wealth of knowledge contained
16This applies to any sort of technology, whether highly advanced, traditional or any combination of the two; the important thing is for the technology to be geared to the area in which it is to be applied.
in the cultures of these social groups, to transform its empirical basis into a scientific one, and to disseminate it adequately.
3. Environmental monitoring
A third area of action, which is crucial in providing the system with feedback, is the design and implementation of an environmental monitoring system. This system would be supplied with information from existing databases and from the members of the community who use the relevant agro-ecosystems. An institutional mechanism would have to be set up for this purpose, preferably at the local level, which would in turn be coordinated by national bodies (e.g., natural resource institutes). These bodies would take in this information and design a set of indicators for use in monitoring changes in the relevant ecosystems in order to ascertain the status of these ecosystems and provide input for decision-making at that level. Indeed, it is simply not possible to deal with environmental issues in a consistent manner without an information and statistical monitoring system that will make it possible to quantify some of the variables concerned and to keep close track of the impact of the resources used and the policies applied in the ecosystems in question.
Finally, it is necessary to continue strengthening community organizations and forming groups of people who share a common identity. Special mention should be made here of the work being done in the region by non-governmental organizations and the Church, which have served as the real engines of community development. Now, with democracy’s re-emergence, the State can join in those efforts.
Taking action in the areas outlined in this article will make it possible to address many of the region’s environmental problems in a responsible, balanced manner. Such action needs to be taken in a way that will elicit broad-based participation and consensus so as to create a genuine willingness to solve these problems. The basic methodological approach should be to target activities that will set in motion participatory processes; this should help to refine the measures being implemented and to carry forward the efforts now being made to find ways of coping with new problems and challenges.

PARTICIPATION AND THE ENVIRONMENT I T. Tomic 115
Bibliography
Binswanger, H. (1989) Brazilian Policies that Encourage Deforestation in the Amazon, Working Paper No. 16, Washington, D.C., World Bank, Environment Department.
Briones, A. (1990): El zorro con espinas, Santiago, Chile, Editorial Documentas.
Goran-Maler, K. (1990): Economic theory and environment degradation: a survey of some problems, Revista de Análisis Económico, vol. 5, No. 2, Santiago, Chile, Latin American Institute of Social Theory and Social Studies (ILADES)/Georgetown University.
Kemp, R. and L. Soete (1990): Inside the “green box”: on the economics of technological change and the environment, Freeman and Soete (eds.), New
Exploration in the Economics o f Technical Change, London, Printer Publisher.
Koolen, R. (1990): “Algunos aspectos institucionales para un desarrollo sustentable en América Latina y el Caribe”, Santiago, Chile, Economie Commission for Latin America and the Caribbean (ECLACy United Nations Environment Programme (UNEP), mimeo.
Mahar, D. (1989): Government Policies and Deforestation in Brazil’s Amazon Region, Washington, D.C., World Bank.
Pérez, C. (1989): Technological Change, Competitive Restructuring and Institutional Reform in Developing Countries, Strategic Planning and Review Working Paper No. 4, Washington, D.C., World Bank,

CEPAL REVIEW No. 48
Self-financing water supply and sanitation services
Terence L ee A ndrei Jouravlev*
Financing investments in urban water supply and sanitation has been a perennial problem in all countries of Latin America and the Caribbean. The issue has increased in significance with the need to provide sewage treatment to reduce the gross pollution of many water bodies and to lessen the threat from waterborne diseases. In this paper, the authors explore, through a statistical analysis, the practicability of financing water supply and sanitation services from income generated by thé tariffs. Particular emphasis is placed on the possibility of the whole popuiation paying for sanitation services: an issue of some importance given the unequal distribution of income in most cites of the region.
The authors conclude that the available information on the costs of providing services, including the capital investment required to achieve universal coverage by the year 2Ó00 as well as sewage treatment, rehabilitation of existing systems, maintenance, and institutional development, indicates that financing such needs from tariffs is feasible, particularly if subsidies are provided to the poorest households.
* S taff members o f the ECLAC Natural Resources and Energy Division.
IntroductionThe cholera epidemic in Latin America during the last year has focussed attention on the deplorable state of excreta disposal in the majority of the cities of the region. The proportion of the population served by sewerage systems has increased in recent years, but not in the same proportion as the provision of water supply (e c l a c , 1990a). The lack of sewerage is compounded by the absence of sewage treatment. Only 10% of sewerage systems provide even partial treatment before discharge (p a h o , 1990a, p. 8), As a result, there is widespread contamination of the water bodies into which urban sewage is discharged and the easy transmission of diarrheal diseases through water or food is always a menacing possibility.
The financing of water supply and sewerage services is a perennial problem for most cities in Latin America. It is not only a question of financing the initial capital investment, but also of generating funds for the operation and maintenance of the systems once built. Moreover, the financial demands of water supply and sewerage systems are growing as population increases and water sources grow more distant and as it becomes increasingly necessary to dispose of human and industrial wastes safely.
A recent study shows that “the funding of capital investments in water-related projects is mainly provided from national sources” (e c l a c , 1990b, p. 53). Indeed, in the last decade more than 70% of capital funding for the expansion of water supply and sanitation services has come directly from such sources (PAHO/WHO, 1987, p. 25). During the International Water Supply and Sanitation Decade, the share of external funding, including loans, in capital investment in water supply and sanitation services has been lower for the countries of Latin America and the Caribbean, as a whole, than in the countries of Africa and Asia (w h o , 1987, p. 13). There is no reason to expect that the proportion of capital funding provided from external sources will increase in the 1990s.
In most countries of the region, the financing of water supply and sewerage systems is inadequate both to keep up with the needs of capital expansion for the growing urban population and for the maintenance of the existing systems. It is true that the provision of drinking water and sewerage services to

118 CEPAL REVIEW No. 481 December 1992
the urban population has increased in nominal terms, but the service provided is often very irregular and of questionable quality (pa h o , 1990a, p. 6). Not all countries have even managed to maintain the nominal levels of service reached in the past. In Buenos Aires, the proportion of the population served by the system operated by Obras Sanitarias de la Nación (o s n ) has steadily declined over the last fifty years. In 1947, 94% of the population lived in a dwelling with a connection to the water
supply system, in 1960 only 76% and by 1980 less than 60%. In the absence of provision of drinking water by OSN, the population of Buenos Aires has had to shift for itself. Sometimes this has led to the creation of local water supply systems providing good service, but in many cases the result has been recourse to sources of dubious quality and over- reliance on . individual excreta disposal systems with a high potential for contaminating aquifers (Brunstein, 1988).
I
Income from the provision of water supply and sewerage services
Historically, the contribution to the funding of water supply and sanitation projects derived from the income of operating companies has usually been very small: a direct consequence of unrealis- tically low tariffs on the one hand and inefficient commercial management on the other (table 1).
Cost recovery policy has seldom been applied in water supply and sanitation services even in urban areas. It is not surprising to find, therefore, that the bulk of capital funding for water supply and sanitation has come in most countries from genera] government revenues either directly or in the form of government guarantees for loans from the World Bank or the Inter-American Development Bank (ECLAC, 1990b). This source of capital funding has always fluctuated considerably with changes in political priorities and suffered from the effects of macroeconomic mismanagement. The severe recession between 1982 and 1983, the effects of which continue to be felt in many countries of the region, resulted in efforts to reduce the size of the public deficit which have reduced the flow of funds from general government revenues. At the same time, there has been a region-wide change in the perception of the role of the public sector in the economy which has led to a general reduction in the scope of government activities. In particular, increasing consideration is being given to the need for potentially revenue-generating public services to become either self-financing or to be transferred to the private sector.
With few exceptions, public sector water supply and sanitation companies have been incapable of compensating the reduction in government contributions to capital financing by generating more funds from revenues. The resulting shortfall in capital funding has severely affected not only expansion programmes, but also the operation and maintenance of existing systems. The poor financial state of many utilities can, to a considerable extent, be directly attributed to the failure to adopt a tariff policy which would generate revenues sufficient to cover the total costs of the provision of service. In Mexico, for example, the total cost of providing drinking water through house connections has been estimated at about 240 pesos/m3, whereas consumers are billed only some 40 pesos/m3 (Mexico, 1989, p. 183).
In recent years, some countries have managed to improve the financial situation of water supply and sanitation companies by following sound tariff policies. In Chile, 56% of the funds invested in water supply and sanitation services by the Servicio Nacional de Obras Sanitarias (s e n d o s ) over the period 1985-1989 were generated from tariff revenues, and the contribution of such revenues to capital funds increased from less than 49% in 1985 to almost 68% in 1989 (World Bank, 1989). In Brazil, the sector has been partially self-financing since the adoption of the “Plan Nacional de Saneamiento” ( p l a n a s a ) in 1971 (World Bank, 1989). Political difficulties in

SELF-FINANCING WATER SUPPLY AND SANITATION SERVICES / T. Lee and A. Jouravlev 119
Table 1
LATIN AMERICA AND THE CARIBBEAN, WATER SUPPLY: AVERAGE COST OF PRODUCTION AND AVERAGE TARIFFS, 1985
(1985 US dollars per cubic metre)
Country Average cost of production Average tariff Progressive tariffs
Argentina a 0.08 0.11 n/aBarbados 0.34 0.68 NoBahamas 0.37 1.10 YesBolivia n/a n/a Some areasBrazil a 0.06 0.10 n/aChile 0.12 0.08 YesColombia a 0.30 0,24 n/aCosta Rica 0.17 0.07 YesEcuador 0.09 1.81 YesEl Salvador 0.30 0.20 NoGuatemala n/a 0.11 NoGuyana 0.08 0.03 Some areasHaiti 0.18 0.28 -1.00 YesHonduras 0.20 0.26 YesMexico 1.50 0.12 YesNicaragua 0.14 0.38 YesPanama 0.07 0.29 YesParaguay 0.52 0.43 YesPeru 0.18 0.09 Some areasSuriname 0.60 0,80 Some areasUruguaya n/a 0.26 n/aVenezuelaa 0.58 0.34 n/a
Source: World Health Organization, Division of Environmental Health, CWS Unit, The International Drinking Water Supply and Sanitation Decade: Review o f Mid-Decade Progress (as at December 1985), CWS Series of Cooperative Action for the Decade, Geneva, September 1987.
a 1980.b 1980; in 1985 the average cost of water production was US$ 0.12 per cubic metre.
maintaining the tariff policy established under the Plan led to a serious reduction in self-sufficiency for a number of years, but in 1990 almost 80% of the capital needs of the sector were provided from the rotating funds, replenished from tariff revenues, established under p l a n a s a (World Bank, 1989).
It is not, however, the level of tariffs alone that determines the contribution of revenues to the funding of water supply and sanitation services. Tariffs are an essential ingredient in good financial and commercial management, but other factors are also important. Water pumped, but not accounted for,
reduces revenues and can also inflate the need for new investments. The experience of most water supply companies in the region indicates that high values of unaccounted-for water are the result of deficiencies in the commercial management, mainly problems in billing and the collection of payments and inadequate policies for dealing with overdue accounts, rather than being due solely to high rates of leakage in distribution systems (Yepes, 1990, p. 12). For example, it has been estimated in Mexico that of each 100 litres pumped in a typical distribution network, the user receives 60, is billed for 40, and finally only pays for 30. In addition, collection of the
120 CEPAL REVIEW No. i l l December 1992
payments due has been characterized by delays in billing of some 6-9 months (Mexico, 1989, p. 183),
Reducing such commercial losses does not usually involve high capital expenses, but it may require changes in management practice which are difficult to introduce in a bureaucratic environment. Better commercial management, however, can replace or postpone the need for new capital investments and also reduce production, pumping and treatment costs. A reduction of unaccounted- for water from 60% to 30% in a city growing at 3.5% per year would make it possible to postpone investments in new production facilities by up to 16 years.
Traditionally in Latin America and the Caribbean, the income of water supply and sanitation companies has been both small and variable. Cost recovery, however, has become an accepted principle for companies in the urban areas, although in practice it is seldom fully applied. In 1985, in nine of fifteen countries surveyed, tariffs in urban areas more than
covered water production costs, and of the nineteen countries providing information on tariff structures some fifteen claimed to apply progressive systems which penalize higher consumption either nationally or at least in some areas (table 1).
One of the more serious consequences of inadequate tariff structures, and an additional argument for adopting tariffs that fully reflect costs, is that low tariffs for drinking water supply and sewerage do not, as a rule, benefit those who most need them. It is usually the poor who, through the lack of investment, do not have adequate access to public drinking water supply and, as a result, are forced to buy water from private water sellers at prices far exceeding those charged by water supply companies. It has been estimated that the cost of water bought from water sellers is 17 times higher in Lima, Peru, from 17 to 100 times higher in Port-au-Prince, Haiti, and from 16 to 34 times higher in Tegucigalpa, Honduras than the price charged by the official water company (World Bank, 1988a).
II
Self-financing water supply and sanitation systems
Self-financing water supply and sanitation systems can be defined as those in which tariff revenues meet the total costs of operating and maintaining existing installations, cover the capital costs of expanding coverage to remove the existing deficit in services and to supply a growing population, provide a reasonable rate of return on the capital invested, and also cover the associated costs of providing adequate treatment of sewage before discharge into the environment. The adoption of such criteria for water supply and sanitation system management would not mean that companies could not borrow money from national banks, the multilateral development banks or any other lending institutions. It would mean, however, that the total costs of any loans would have to be paid from the revenues received from the sale of water and sewerage services. It would not preclude subsidies either, but any subsidies would be clearly explicit transfers for reasons of social policy, and must not be designed to make up for deficits due to poor management. Such an approach would also
pave the way for the companies to issue bonds or shares to the general investing public.
The tariff charged to customers would depend on a number of factors which affect long-term average and marginal costs, including the rate of interest for loans, the amortization period, the rate at which any existing deficit in the provision of services is made good, the growth rate of the population to be served, and the costs of operating and maintaining the existing works, among others. These factors will vary considerably from system to system, and consequently estimates for Latin America and the Caribbean as a whole or even for individual countries can be of only very limited usefulness. Estimates such as those made in this paper, however, can indicate the practicability of considering the application of a policy of self-financing from tariff revenue.
In order to explore the self-financing option, estimates of the required tariffs have been made on the basis of the known per capita unit costs of providing urban drinking water supply and sewerage services

SELF-FINANCING WATER SUPPLY AND SANITATION SERVICES / T. Lee and A. Jouravlev 121
Table 2
LATIN AMERICA AND THE CARIBBEAN: RANGE OF MONTHLY CHARGES REQUIRED TO COVER THE CAPITAL COSTS OF PROVIDING
DRINKING WATER SUPPLY AND SEWERAGE THROUGH HOUSE CONNECTIONS
(1985 US dollars per person served)
CountryDrinking Water Supply Sewerage
Minimum3 Average b Maximum0 Minimuma Average b Maximum0
Argentina 0.39 1.05 1.64 0.43 1.16 1.82Bolivia 0.28 0.75 1.18 0.32 0.87 1.36Brazil 0.32 0.87 1.36 0.36 0.99 1.54Chile 0.32 0.87 1.36 0.36 0.99 1.54Colombia 0.28 0.75 1.18 0.32 0.87 1.36Costa Rica 0.28 0.75 1.18 0.32 0.87 1.36Dominican Republic 0.32 0.87 1.36 0.36 0.99 1.54Ecuador 0.28 0.75 1.18 0.32 0.87 1.36El Salvador 0.28 0.75 1.18 0.32 0.87 1.36Guatemala 0.28 0.75 1.18 0.32 0.87 1.36Haiti 0.26 0.70 1.09 0.26 0.70 1.09Honduras 0.28 0.75 1.18 0.32 0.87 1.36Mexico 0.32 0.87 1.36 0.36 0.99 1.54Nicaragua 0.28 0.75 1:18 0.32 0,87 1.36Panama 0.32 0.87 1.36 0.36 0.99 1.54Paraguay 0.28 0.75 1.18 0.32 0.87 1.36Peru 0.28 0.75 1.18 0,32 0.87 1.36Uruguay 0.28 0.75 1.18 0.32 0.87 1.36Venezuela 0.43 1.16 1.82 0.43 1.16 1.82
Average 0.32 0.87 1.36 0.36 0.98 1.53
Source: Calculated on the basis of World Bank data. “Interest rate 2%, amortization period 75 years. b Average of all rates and periods. c Interest rate 10%, amortization period 25 years.
by house connections (w h o , 1987, p. 22). These estimates are based on the assumption that every customer will pay the full cost of maintaining his connection to the system in perpetuity, as well as operating costs. The amortized capital cost has been calculated using different real rates of interest (2% and 10%) and different repayment periods (25, 50 and 75 years). The calculations are presented individually for each country in terms of the lowest, highest and average charges to consumers which would be required to meet these costs (see appendix).
The estimates are presented in US dollars per month, both on the basis of a per capita monthly charge (table 2) and as a charge per cubic metre for those countries for which average water consumption data are available (table 3). In making these calculations, it is assumed that the new population to be served will be connected proportionately in each year up to the end of the century and that as the new customers receive a connection they will begin to pay on the same basis as the population connected at the beginning of the period. It is also assumed that everyone already connected will begin paying the

122 CEPAL REVIEW No. 481 December 1992
Table 3
LATIN AMERICA AND THE CARIBBEAN (SELECTED COUNTRIES): MONTHLY CHARGES NEEDED TO COVER THE CAPITAL COST OF PROVIDING
DRINKING WATER SUPPLY AND SEWERAGE THROUGH HOUSE CONNECTIONS
(1985 US dollars per cubic metre)
CountryDrinking water supply Sewerage
Minimumi*1 Averageb Maximum0 Minimum8 Average Maximum0
Argentina 0.03 0.08 0.12 0.03 0.08 0.13Bolivia 0.09 0.25 0.39 0.11 0.29 0.45Chile 0.06 0.16 0.25 0.07 0.18 0.28Colombia 0.08 0.21 0.32 0.09 0.24 0.37Costa Rica 0.05 0.12 0.19 0.05 0.14 0.22Ecuador 0.05 0.13 0.21 0.06 0.15 0.24El Salvador 0.05 0.15 0.23 0.06 0.17 0.26Guatemala 0.05 0.13 0.21 0.06 0.15 0.24Honduras 0.06 0.17 0.26 0.07 0.19 0.30Mexico 0.04 0.11 0.17 0.04 0.12 0.19Panama 0.04 0.10 0.16 0.04 0.12 0.18Paraguay 0.03 0.07 0.11 0.03 0.08 0.13Peru 0.04 0.10 0.16 0.04 0.11 0.18
Source: Calculations by the authors on the basis of levels of water consumption given in World Health Organization, Division of Environmental Health, Community Water Supply Unit, The International Drinking Water Supply and Sanitation Decade, Review of Mid- Decade Progress (as at December 1985), CWS Series of Cooperative Action for the Decade, Geneva, September 1987,
a Interest rate 2%, amortization period 75 years. b Average of alt rates and periods, c Interest rate 10%, amortization period 25 years.
full capital cost of his connection in 1989, the base year for the calculations.
The tariff levels which would have to be set for urban water supply and sanitation systems in order to cover capital costs do not appear to be very high. It must be remembered, however, that the estimated tariffs would only meet the amortized capital costs of existing installations. The total costs which the tariffs would have to meet would be higher if the criterion of total financial self-sufficiency is to be met.
These costs are equivalent to approximately one- quarter of the total cost (estimated to be US$94 000 million at 1985 prices) of achieving universal provision of both water supply and sanitation services for the urban population by the year 2000. The total cost of providing water supply and sewerage services includes a number of other items
as well as the replacement costs of the existing connections. These items include the capital investments needed to provide services to new customers, the rehabilitation of systems (many of which are in very bad condition), the costs of training staff and of institutional development and, finally, the cost of waste treatment. It is assumed that the cost of water treatment is included in the per capita estimates for providing drinking water supply. For Latin America and the Caribbean, on average, these costs would be equivalent to some 26% of the total cost of achieving universal provision of water supply and sanitation for the urban population by the year 2000.
The proportion of new capital investment which would be required for expansion so as to achieve complete coverage of the urban population with water supply and sanitation services varies considerably among countries. It is estimated to
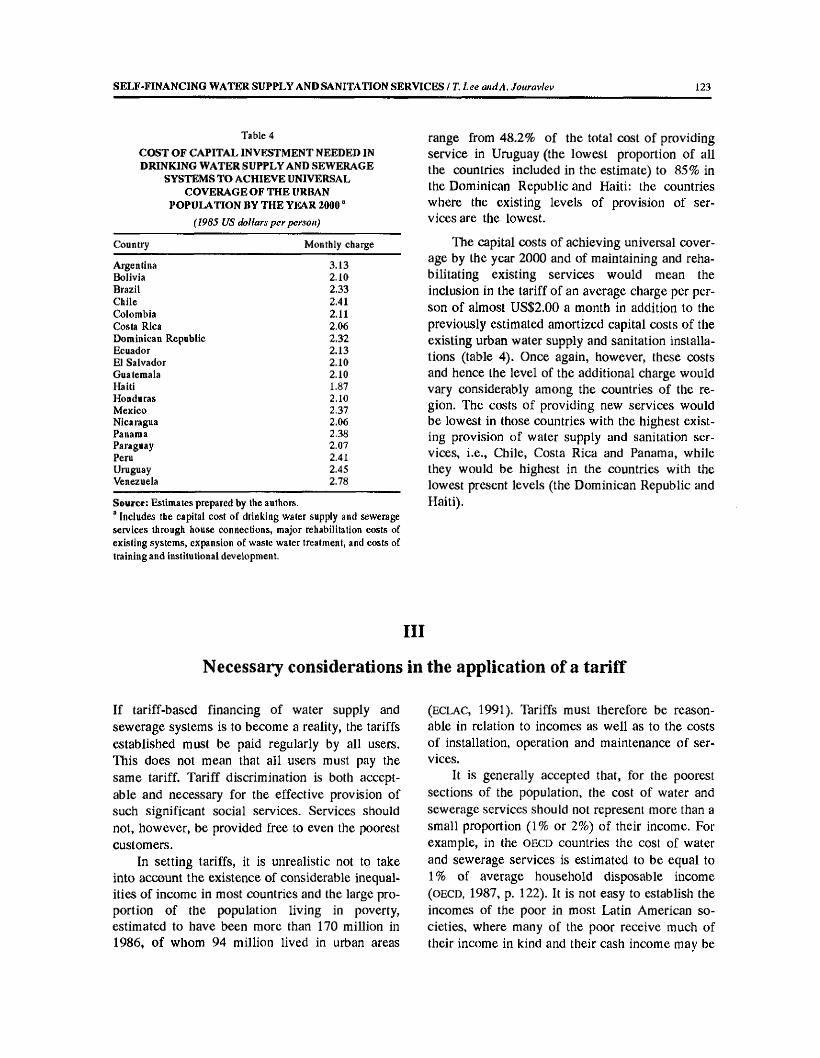
SELF-FINANCING WATER SUPPLY AND SANITATION SERVICES / T. Lee and A. Jouravlev 123
Table 4
COST OF CAPITAL INVESTMENT NEEDED IN DRINKING WATER SUPPLY AND SEWERAGE
SYSTEMS TO ACHIEVE UNIVERSAL COVERAGE OF THE URBAN
POPULATION BY THE YEAR 2000 a(1985 US dollars per person)
Country Monthly charge
Argentina 3.Í3Bolivia 2.10Brazil 2.33Chile 2.41Colombia 2.11Costa Rica 2.06Dominican Republic 2.32Ecuador 2.13El Salvador 2.10Guatemala 2.10Haiti 1.87Honduras 2.10Mexico 2.37Nicaragua 2.06Panama 2.38Paraguay 2.07Peru 2.41Uruguay 2.45Venezuela 2.78
Source: Estimates prepared by the authors. a Includes the capital cost of drinking water supply and sewerage services through house connections, major rehabilitation costs of existing systems, expansion of waste water treatment, and costs of training and institutional development.
range from 48.2% of the total cost of providing service in Uruguay (the lowest proportion of all the countries included in the estimate) to 85% in the Dominican Republic and Haiti: the countries where the existing levels of provision of services are the lowest.
The capital costs of achieving universal coverage by the year 2000 and of maintaining and rehabilitating existing services would mean the inclusion in the tariff of an average charge per person of almost US$2.00 a month in addition to the previously estimated amortized capital costs of the existing urban water supply and sanitation installations (table 4). Once again, however, these costs and hence the level of the additional charge would vary considerably among the countries of the region. The costs of providing new services would be lowest in those countries with the highest existing provision of water supply and sanitation services, i.e., Chile, Costa Rica and Panama, while they would be highest in the countries with the lowest present levels (the Dominican Republic and Haiti).
I ll
Necessary considerations in the application of a tariff
If tariff-based financing of water supply and sewerage systems is to become a reality, the tariffs established must be paid regularly by all users. This does not mean that all users must pay the same tariff. Tariff discrimination is both acceptable and necessary for the effective provision of such significant social services. Services should not, however, be provided free to even the poorest customers.
In setting tariffs, it is unrealistic not to take into account the existence of considerable inequalities of income in most countries and the large proportion of the population living in poverty, estimated to have been more than 170 million in 1986, of whom 94 million lived in urban areas
(e c l a c , 1991). Tariffs must therefore be reasonable in relation to incomes as well as to the costs of installation, operation and maintenance of services.
It is generally accepted that, for the poorest sections of the population, the cost of water and sewerage services should not represent more than a small proportion (1% or 2%) of their income. For example, in the o e c d countries the cost of water and sewerage services is estimated to be equal to 1% of average household disposable income ( o e c d , 1987, p. 122). It is not easy to establish the incomes of the poor in most Latin American societies, where many of the poor receive much of their income in kind and their cash income may be
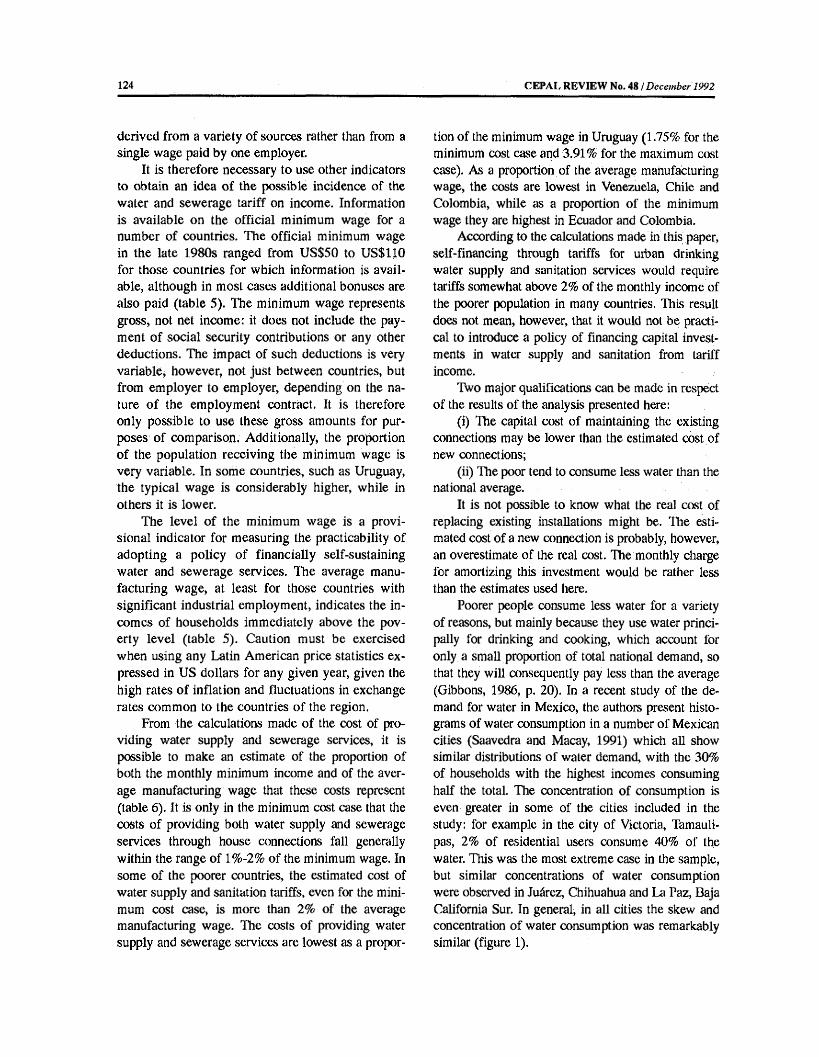
124 CEPAL REVIEW No. 48 i December 1992
derived from a variety of sources rather than from a single wage paid by one employer.
It is therefore necessary to use other indicators to obtain an idea of the possible incidence of the water and sewerage tariff on income. Information is available on the official minimum wage for a number of countries. The official minimum wage in the late 1980s ranged from US$50 to US$110 for those countries for which information is available, although in most cases additional bonuses are also paid (table 5). The minimum wage represents gross, not net income: it does not include the payment of social security contributions or any other deductions. The impact of such deductions is very variable, however, not just between countries, but from employer to employer, depending on the nature of the employment contract. It is therefore only possible to use these gross amounts for purposes of comparison. Additionally, the proportion of the population receiving the minimum wage is very variable. In some countries, such as Uruguay, the typical wage is considerably higher, while in others it is lower.
The level of the minimum wage is a provisional indicator for measuring the practicability of adopting a policy of financially self-sustaining water and sewerage services. The average manufacturing wage, at least for those countries with significant industrial employment, indicates the incomes of households immediately above the poverty level (table 5). Caution must be exercised when using any Latin American price statistics expressed in US dollars for any given year, given the high rates of inflation and fluctuations in exchange rates common to the countries of the region.
From the calculations made of the cost of providing water supply and sewerage services, it is possible to make an estimate of the proportion of both the monthly minimum income and of the average manufacturing wage that these costs represent (table 6). It is only in the minimum cost case that the costs of providing both water supply and sewerage services through house connections fall generally within the range of l%-2% of the minimum wage. In some of the poorer countries, the estimated cost of water supply and sanitation tariffs, even for the minimum cost case, is more than 2% of the average manufacturing wage. The costs of providing water supply and sewerage services are lowest as a propor
tion of the minimum wage in Uruguay (1.75% for the minimum cost case and 3.91% for the maximum cost case). As a proportion of the average manufacturing wage, the costs are lowest in Venezuela, Chile and Colombia, while as a proportion of the minimum wage they are highest in Ecuador and Colombia.
According to the calculations made in this paper, self-financing through tariffs for urban drinking water supply and sanitation services would require tariffs somewhat above 2% of the monthly income of the poorer population in many countries. This result does not mean, however, that it would not be practical to introduce a policy of financing capital investments in water supply and sanitation from tariff income.
Two major qualifications can be made in respect of the results of the analysis presented here:
(i) The capital cost of maintaining the existing connections may be lower than the estimated cost of new connections;
(ii) The poor tend to consume less water than the national average.
It is not possible to know what the real cost of replacing existing installations might be. The estimated cost of a new connection is probably, however, an overestimate of the real cost. The monthly charge for amortizing this investment would be rather less than the estimates used here.
Poorer people consume less water for a variety of reasons, but mainly because they use water principally for drinking and cooking, which account for only a small proportion of total national demand, so that they will consequently pay less than the average (Gibbons, 1986, p. 20). In a recent study of the demand for water in Mexico, the authors present histograms of water consumption in a number of Mexican cities (Saavedra and Macay, 1991) which all show similar distributions of water demand, with the 30% of households with the highest incomes consuming half the total. The concentration of consumption is even greater in some of the cities included in the study: for example in the city of Victoria, Tamauli- pas, 2% of residential users consume 40% of the water. This was the most extreme case in the sample, but similar concentrations of water consumption were observed in Juárez, Chihuahua and La Paz, Baja California Sur. In general, in all cities the skew and concentration of water consumption was remarkably similar (figure 1).

SELF-FINANCING WATER SUPPLY AND SANITATION SERVICES / T. Lee and A. Jouravlev 125
Table 5
LATIN AMERICA AND THE CARIBBEAN (SELECTED COUNTRIES): MONTHLY MINIMUM AND AVERAGE MANUFACTURING
WAGES, 1989-1990
(US dollars)
CountryMinimum Wage
(to nearest US$10)Average manufacturing
wage (US$ 1985)
Argentina 80 260Bolivia 170aBrazilb 100Chile c 60 320Colombia 90 410Costa Rica 180Dominican Republic 210aEcuador d 50 220aEl Salvador 270Guatemala 190Honduras 230Mexico e 110 270Panama 350Peruf 70 80Uruguay8 90 200Venezuela h 90 630'
Source: Business Latin America, March, 1991 and International Labour Organisation, 1988 Yearbook of Labour Statistics, 48th Issue, Geneva, 1989.
a 1984b Compulsory benefits add 50-80% to base wages. c Large companies pay a minimum of three times this sum. d Unskilled labour.e Mexico City and most border cities; elsewhere wages are slightly lower. r Private sector.3 In most sectors typical pay is higher.h In addition there are bonuses for food and transportation raising the minimum by 20%.1 1986.
Data on the consumption of water in Santiago, Chile also show a relationship between income and consumption, although the information is less precise. The population of metropolitan Santiago has universal access to drinking water through house connections. Within the metropolitan area, however, there are considerable differences in apparent per capita water consumption. In the municipalities with the highest proportion of high-income households, consumption is between 500 and 600 litres per capita per day, while in municipalities with lower average household incomes the per capita
consumption is between 100 and 200 litres (Icaza and Rodriguez, 1988).
The Mexican study and the Santiago data confirm the pattern of residential water consumption found in other earlier studies in quite disparate social and economic situations. The Johns Hopkins University Residential Water Use Project showed, for the United States, a clear relationship between the level of household income and and the demand for water (Howe and Linaweaver, 1967). The connection between income and residential demand for water, it was concluded, is due to the

126 CEPAL REVIEW No. 48 / December 1992
Table 6
LATIN AMERICA AND THE CARIBBEAN: MONTHLY CHARGES FOR DRINKING WATER SUPPLY AND SEWERAGE AS A PERCENTAGE OF THE MINIMUM
WAGE AND OF THE AVERAGE MANUFACTURING WAGE a
(Percentages)
Average manufacturing wage Minimum wage
CountryMinimum
costAverage
costMaximum
costMinimum
costAverage
costMaximum
cost
Argentina 0.67 1.20 1.68 2.17 3.91 5.47Bolivia 0.63 1.23 1.77Brazil 1.16 2.33 3.38Chile 0.39 0.75 1.08 2.07 4.02 5.77Colombia 0.26 0.51 0.74 1.21 2.34 3.37Costa Rica Dominican
0.57 1.14 1.65
Republic 0.55 1.11 1.61Ecuador 0.50 0.97 1.39 2.21 4.26 6.09El Salvador 0.40 0.78 1.12Guatemala 0.57 1.11 1.59Honduras 0.47 0.91 1.31Mexico 0.44 0.88 1.27 1.09 2.15 3.11Panama 0.34 0.68 0.98Peru 1.73 3.01 4.16 1.98 3.44 4.76Uruguay 0.71 1.23 1.69 1.59 2.73 3.75Venezuela 0.21 0.44 0.65 1.46 3.08 4.54
Source: Calculations by the authors.a Includes the capital cost of drinking water supply and sewerage services through house connections, major rehabilitation costs of existing
systems, expansion of waste water treatment and the costs of training and institutional development.
Figure 1
BREAKDOWN OF WATER CONSUMPTION IN MEXICAN CITIES
Percentage of residential users
Source: Based on Saavedra and Macay, 1991.
greater use in higher-income households of water- using appliances, the larger number of bathrooms per household, and the consumption of water for lawn sprinkling. A similar relationship between residential waterdemand and the level of household income has been observed in New Delhi, India (Lee, 1969).
The implications of this skewed pattern of residential water demand for tariff policy lie in the possibilities it raises for internal subsidies between the minority of high-income residential consumers and the rest of the community. Such crosssubsidies would not only provide benefits for the poor, but would also increase economic efficiency in the provision of water supply and sewerage services; consequently, they could be expected to raise social benefits more than they would decrease private benefits.
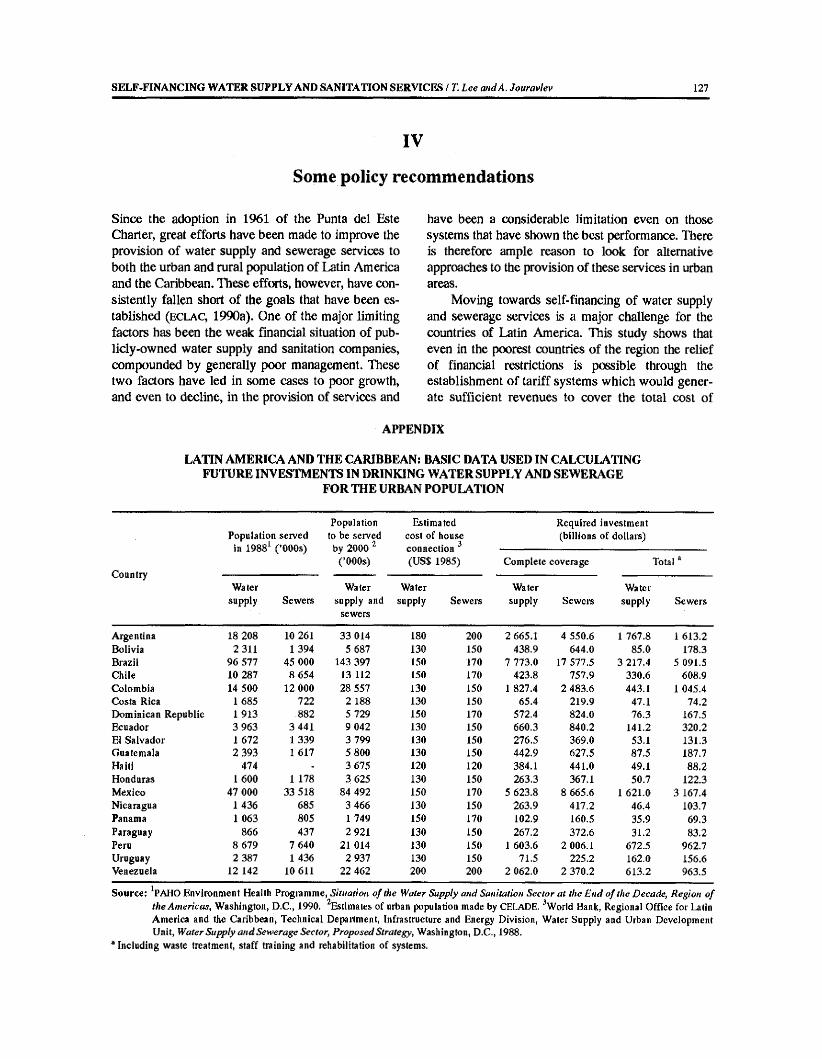
SELF-FINANCING WATER SUPPLY AND SANITATION SERVICES / T. Lee mdA.Jouravlev 127
IV
Some policy recommendations
Since the adoption in 1961 of the Punta del Este Charter, great efforts have been made to improve the provision of water supply and sewerage services to both the urban and rural population of Latin America and the Caribbean. These efforts, however, have consistently fallen short of the goals that have been established (e c l a c , 1990a). One of the major limiting factors has been the weak financial situation of publicly-owned water supply and sanitation companies, compounded by generally poor management. These two factors have led in some cases to poor growth, and even to decline, in the provision of services and
have been a considerable limitation even on those systems that have shown the best performance. There is therefore ample reason to look for alternative approaches to the provision of these services in urban areas.
Moving towards self-financing of water supply and sewerage services is a major challenge for the countries of Latin America. This study shows that even in the poorest countries of the region the relief of financial restrictions is possible through the establishment of tariff systems which would generate sufficient revenues to cover the total cost of
APPENDIX
LATIN AMERICA AND THE CARIBBEAN: BASIC DATA USED IN CALCULATING FUTURE INVESTMENTS IN DRINKING WATER SUPPLY AND SEWERAGE
FOR THE URBAN POPULATION
Population served in 19881 (’000s)
Country
Population to be served by 2000 2
( ’000s)
Estimated cost of house connection 3 (US$ 1985)
Required investment (billions of dollars)
Complete coverage Total
Watersupply Sewers
Water supply and
sewers
Watersupply Sewers
Watersupply Sewers
Watersupply Sewers
Argentina 18 20 8 10 261 33 014 180 200 2 665.1 4 550 .6 1 767 .8 1 613 .2Bolivia 2 311 1 394 5 687 130 150 438 .9 644 .0 85 .0 178.3Brazil 9 6 577 45 000 143 397 150 170 7 773 .0 17 577.5 3 217 .4 5 091.5Chile 10 287 8 654 13 112 150 170 423 .8 757 .9 330 .6 608 .9Colombia 14 500 12 000 28 557 130 150 1 827 .4 2 483 .6 443.1 1 045 .4Costa Rica 1 685 722 2 188 130 150 65 .4 219 .9 47.1 74 .2Dominican Republic 1 913 88 2 5 729 150 170 572.4 824 .0 76 .3 167.5Ecuador 3 963 3 441 9 042 130 150 660 .3 84 0 .2 141.2 320 .2El Salvador 1 67 2 1 339 3 799 130 150 276 .5 369 .0 53.1 131.3Guatemala 2 393 1 617 5 800 130 150 442 .9 627 .5 87 .5 187.7Haiti 474 - 3 675 120 120 384.1 441 .0 49.1 8 8 .2Honduras 1 60 0 1 178 3 625 130 150 263 .3 367.1 50 .7 122.3Mexico 47 000 33 518 84 492 150 170 5 623 .8 8 665 .6 1 6 2 1 .0 3 167.4Nicaragua 1 436 685 3 466 130 150 2 6 3 .9 417 .2 46.4 103.7Panama 1 063 805 1 749 150 170 102.9 160.5 35.9 69 .3Paraguay 866 437 2 921 130 150 2 6 7 .2 372 .6 31.2 83 .2Peru 8 679 7 640 21 014 130 150 1 603 .6 2 006.1 672.5 962 .7Uruguay 2 387 1 436 2 937 130 150 71.5 225 .2 162.0 156.6Venezuela 12 142 10 611 22 462 200 200 2 062 .0 2 370 .2 6 1 3 .2 963.5
Source: *PAHO Environment Health Programme, Situation of the Water Supply and Sanitation Sector at the End of the Decade, Region of the Americas, Washington, D.C., 1990. 2Estimates of urban population made by CELADE. 3World Bank, Regional Office for Latin America and the Caribbean, Technical Deprtment, Infrastructure and Energy Division, Water Supply and Urban Development Unit, Water Supply and Sewerage Sector, Proposed Strategy, Washington, D.C., 1988.
a Including waste treatment, staff training and rehabilitation of systems.
128 CEPAL REVIEW No. 48 i December 1992
providing house connections for both water supply and sewerage services to the whole population. The application of such a tariff structure would not be easy, however, and would require a considerable change in management attitudes and practices in the water supply and sanitation sector: a change which may not be possible without drastic institutional innovation.
Here lies one of the most potent arguments for privatization of water supply and sewerage services, although other types of institutional change may be as effective. Privatization does not necessarily involve the sale of whole systems to private entrepreneurs, although in many cases this may be the preferred alternative (Coing and Montano,1989). The
granting of concessions for the partial or total provision of services may be just as potent an innovating force and would equally demand that tariffs cover the costs of providing service.
What must be achieved is not privatization per se, but rather a situation where water supply and sanitation services become self- financing public utilities, regardless of who owns them. Without self- financing, investment and the provision of services will remain in deficit and the quality of service will remain deficient. Achieving an improvement in these fields is the great challenge for water supply and sanitation policy in Latin America and the Caribbean during this, the last decade of the Twentieth Century.
Bibliography
Brunstein, Fernando (1988) (ed.): Crisis y Servicios Públicos, Cuadernos de CEUR Nfi 23, Buenos Aires, Centro de Estudios Urbanos y Regionales (CEUR).
Coing, Henri and Iraida Montano (1989): Privatisation, une alternative à propos de l’eau? Brésil et Argentine, Cahiers des Amériques Latines, No: 8.
ECLAC (United Nations Economie Commission for Latin America and the Caribbean) (1990a): Drinking Water Supply and Sanitation in Latin America and the Caribbean since Punta del Este, (LC/G. 1591), Santiago, Chile, 22 March.
(1990b): Latin America and the Caribbean: Water-related Investments in the Eighties (LC/R.904), Santiago, Chile, 29 November.
(1991): Nota Sobre el Desarrollo Social en AméricaLatina (LC/L.633), Santiago, Chile.
Gibbons, Diane C. (1986): The Economic Value of Water Resources for the Future, Baltimore, Johns Hopkins University Press.
Howe, Charles W. and F. P. Linaweaver, Jr. (1967): The Impact of Price on Residential Water Demand and Its Relationship to System Design and Price Structure, Water Resources Research, Vol. 3, No. 1.
Icaza, Ana Maria and Alfredo Rodriguez (1988): Informe estudio de caso: agua potable, Santiago, Chile, SUR Profesionales Ltda., September.
ILO (International Labour Organisation) (1989): 1988 Yearbook of Labour Statistics, 48th Issue, Geneva.
Lee, Terence R. (1969) Residential Water Demand and Economic Development, University of Toronto, Department of Geography, Research Publications, No. 2, Toronto.
Mexico, Comisión Nacional del Agua (1989): El programa nacional de aprovechamiento del agua, 1989-1994, mimeo,
OECD (Organization for Economic Cooperation and Development) (1987): Pricing of Water Services, Paris.
PAHO (Pan American Health Organization)/WHO (1987):. International Drinking Water Supply and Sanitation
Decade, Regional Progress Report, Environmental Series, No. 6, Washington, D.C., Environmental Health Division.
(1990a): Environmental Factors Affecting HealthConditions in the Americas, Washington, D.C.
(1990b): Situation of the Water Supply and Sanitation Sector at the End of the Decade. Region of the Americas, Washington, D.C.
Saavedra, Jorge C., Gerardo Lugo and Mario G. Macay '(1991): Análisis de histogramas de consumo de agua potable en México, Ingeniería Hidráulica en México, Vol. VI, No. 1, January-April.
WHO (World Health Organization) (1987): The International Drinking Water Supply and Sanitation Decade: Review of mid-Decade Progress (as at December 1985), CWS Series of Cooperative Action for the Decade, Geneva, Division of Environmental Health, Community Water Supply Unit.
World Bank (1988a): World Development Report 1988, Washington, D.C.
(1988b): Water Supply and Sewerage Sector. Proposed Strategy, Washington, D.C., Regional Office for Latin America and the Caribbean, Technical Department, Infrastructure and Energy Division, Water Supply and Urban Development Unit.
(1989) Seminar on Innovation and Developmentin Water Supply Companies, San José, Costa Rica, December.
Yepes, Guillermo (1990): Management and Operational Practices o f Municipal and Regional Water and Sewerage Companies in Latin America and thé Caribbean, Infrastructure and Urban Development Papers, Report INU 61, Washington, D.C., World Bank.

CEPAL REVIEW No. 48
The social sciences without planning or revolution?
M artín Hopenhayn*
From the iate 1950s to the mid-1970s, Latin American social scientists saw themselves as important agents in the processes of change and modernization unfolding in the region’s societies. Inspired by the exuberance of the sweeping changes occurring in the modern-day world, many social scientists felt they were the best equipped not only to interpret the major political and socioeconomic processes taking place in the region, but also to deduce from those interpretations the policy directions in which Latin America’s national societies should plot their future course. The link between the generation of knowledge and active intervention in the real world -the link of organicity- was, for many, the chief element that legitimized the practice of the social sciences in the region. Based on extreme, highly illuminist self-images, such as those associated with the central-government planner or the revolutionary intellectual, many social scientists saw themselves as true links, or bridges, between science and power, or between the development of knowledge and the rationalization of the social order.
Today, these extreme images and the rationales underlying them are regarded as highly suspect, as is the notion of Organicity which in decades gone by constituted the context for the work being done in the social sciences in the region. What impact does this radical change have on current thinking about social processes? And towards what other modes of perception or cognitive approaches are Latin American social sciences turning now? In the following pages the author attempts to paint both a retrospective and prospective picture of this uncertain scenario.
* Ex pert on social development planning iii the ECLAC Social Development Division.
Refuted paradigms1. The crisis o f intelligibility and the crisis of
organicity
A great deal has been said about the crisis that has been affecting the social sciences in Latin America ever since the mid-1970s. This crisis has been interpreted in two main ways: as a crisis of intelligibility and as a crisis o f organicity.
The term crisis o f intelligibility refers to the fact that the social sciences are having increasing difficulty in encompassing the mounting complexity of the real world with their traditional tools. Mention is usually made in this connection of the loss of explanatory and orientational power of three of the most important paradigms which guided social scientists’ work from the 1950s to the mid-1970s: the e c l a c school of thought (developmentalism in its “original” form), orthodox Marxism and dependency theory. There are many oft-cited factors that can help account for this loss; they include the “anomalies” with which the real world confounded the theorists; the exhaustion of the possibilities suggested by the different versions of forward-looking proposals which were based on a positive assessment of endogenous development; the crisis of the populist State and of the associated State-as-planner’s various functions; the appearance of authoritarian regimes and State bureaucracies; the reconstitution of social classes and actors; the shift of an increasingly large portion of the labour force into the informal economy, along with the resulting increase in structural heterogeneity; and the challenges faced by newly-founded democracies during a time of economic adjustment and market expansion.1
I
1 See Vergara (1991). In the same vein, Heinz Soiintag and Norbert Lechner have said that, starting in the mid-1970s, modernization generated complex processes that simply did not fit into existing categories. One effect of the redefinition and increasing differentiation of social structures was that all-encompassing, generalized interpretations could no longer retain the specificity of these new complexities. See Son n ta g (1991) and Leclmer (1988), who also underscore the disintegrative effect of growing social complexity on lhe time-honoured paradigms of Latin American social science.
130 CEPAL REVIEW No. 48 / December 1992
By crisis o f organicity, social scientists mean the breakdown of the link between the production of knowledge and structural social change. The political and cultural defeat of the Left, and the political and technical defeat of developmentalism and its national variants, broke the organic (or so-called organic) linkage between the generation of knowledge and the radical transformation of societal structures. It has been said time and time again that social scientists in Latin America have, almost since the very outset, been preoccupied with the idea of social change and the ways in which they, as producers of knowledge, could help guide it. In the predominant paradigms to be found in social science literature, social change was characterized as leading to the modernization of the political, production, social and cultural structures o f the countries o f the region.2 However, under the onslaught of authoritarianism, followed by the more hegemonic onslaught of the neoliberal model, together with the disparagement of the Welfare State and the collapse of socialist models, in the eyes of many the Latin American social sciences were relegated to an historical backwater and seen as irrelevant in the modem world.
It is not necessary to refer to the postmodernist debate in order to talk about this crisis of intelligibility and organicity in the Latin American social sciences. Nor is there any need to have recourse to such concepts as “multiplicity” or “diversity” to sustain our concern about structural heterogeneity, or to fall back on the idea of “discontinuity” in order to understand truncated versions of modernization, or to hark back to the “crisis of meta-accounts” to feel lost in the absence of viable, comprehensive proposals for freeing the region from underdevelopment and poverty. Nor is it necessary to be an anti-illuminist to understand the forcefulness with which, following the Second World War, Latin American social scientists embodied the Western illuminist model of a producer of knowledge; this modern rider of the wave of progress, armed with an inexhaustible capacity for deciphering the nature of reason, would first identify the path o f reason in history and, finally, would deduce from that path, by virtue o f his powers o f reasoning, the best path into the future.
2They differed, however, in terms of development styles,i.e., with regard to what modernization really meant in terms of the distribution of political power, economic resources and social relations.
Nor need we resort to the anti-utopian discourse of the disenchanted to appreciate the psychological and even spiritual costs occasioned by the shattering of the image of a possible revolution: a revolution whose time of occurrence might be undetermined, but towards which, for many social scientists and intellectuals in general, all paths led; a revolution which, as an image, was clearly losing its ability to mobilize the masses and, as a form o f discourse, was becoming implausible.
2. Planning, revolution and the crisis of rationales
In the following pages we will attempt to situate these crises of intelligibility and organicity in the context of a few other terms: those of planning and revolution, on the one hand, and of crisis o f rationales on the other. This examination may lead to a different understanding of the connection between the crisis of paradigms and the crisis of organicity in the social sciences by avoiding postmodernist rhetoric while embracing postmodernism’s injunction to rela- tivize the concepts that have legitimized -and which, in some measure, continue to legitimize- social science praxis in the region.
In the decades during which the paradigmatic model of inward-looking development, of industrialization-oriented modernization and/or sociopolitical liberation had gained ascendency in the region, the concepts o f planning and revolution were the ones that were best able to encompass the deliberate intervention o f reason (technical and technological reason) in history. They were not, of course, the only normative concepts in the field, but they were the extreme images for the organicity of the social disciplines and the strongest images in terms of the intelligibility of social phenomena from the standpoint of structural change in Latin America’s societies.
Planning came to be thought of as the main tool of that great engine of change, the State-as-planner.3 For this actor, planning came to constitute an
a In the maximalist sense attributed to it by its apologists, part of which was incorporated into political imagery until the mid-1970s as the Statc-as-demiurge, meta-actor, leader of industrialization-oriented modernization, impartial arbiter of social conflicts and grand political unifier. It should be borne in mind that, because of the Latin American countries’ dependent, peripheral position and their belated development, very early on the State assumed a pivotal role in the modernization and development processes. (See Faletto, 1989; Gurrieri, 1987; Hopenhayn, 1991a.)

THE SOCIAL SCIENCES WITHOUT PLANNING OR REVOLUTION? / M, Hopenhayn 131
idealized nexus which, in principle, would enable it to forge a link between technical reasoning and political reasoning that would make the social sciences the agent of power-based technical intervention and enable them, to paraphrase Hegel, to make the rational more real and the real more rational. In this sense, planning was an archetype of the organicity of social knowledge and social change. The preferred instrument of modernization and of the dynamic link among the different agents of modernization, planning was made over, in the best illuminist tradition, into something akin to a science capable of plotting out the future.
In the case of revolution, the pretensions were even greater. Here, it was not merely a question of programming but rather of radically subverting an order that was holding back history (it was holding back production too, but, above all, social progress). Far closer to an ethic than to a technology, the revolution symbolized the social scientist’s total immersion in the struggle to establish a new order. Indeed, this was so much the case that a significant percentage of the literature of development and of the writings of sociologists, philosophers and political scientists during the 1960s and early 1970s were motivated by the idea of revolution. And if the discourse of the planner could be the embodiment of reason carried to its most detailed applications on behalf of the agent in power, revolutionary discourse aspired to being reason carried to its ultimate consequences in opposition to that power.
Thus situated at the two ends of the spectrum, planning and revolution defined the outer boundaries within which, in an infinity of combinations and mediating roles, social scientists came into their own for a few unforgettable decades. Both images -planning and revolution- were laden with “modern” reasoning and shot through with utopianism and illuminism.4
The crisis of these rationales has long been the object of a debate in which “critical humanists”, on one side, and “empirical functionalists”, on the other, have invested a great deal of energy, with the former devoting their efforts to a critique of formal instrumental reasoning and the latter to a critique of
4 Revolution was also, however, overlaid with non-modern, non-secularized movements: messianism, fundamentalism,providentialism and salvationism were all present in Latin American revolutionary discourse and sentiment.
normative substantive reasoning. Despite their tried and tested capacity for lucidity with regard to such critiques, the modem social sciences took a long time to reach the point of undertaking an in-depth critique of two other rationales, which were also very much a part of the modern-day world. We will refer to these two rationales as the illuminist matrix and the utopian matrix. When it finally did make its appearance, the most determined critique of illuminism and of utopianism arrived clothed in the discourse of postmodernism.
3. The illuminist matrix, planning and revolution
Critiques of the illuminist matrix have come from a variety of ideological quarters and have called a number of concepts into question: the idea of progress (and of progress elevated to a metaphysical rank), the notion of ideological vanguards, and the euphoria of integrative modernization.
The critique of the concept of progress -a fundamental element of illuminism- contends that history is not a straight, upward climb but rather a discontinuous, multi-directional process and that, consequently, a considerable amount of uncertainty exists as to the future course of events. Since history does not appear to be regulated by any clearly- defined internal rationality, its outcomes are unpredictable or, at least, provisional. From this vantage point, even thinking about the possibility of understanding the internal rationale of history -supposing, first of all, that such a thing exists- and, on that basis, of scientifically regulating society, the economy and the culture appears to be an overblown pretension with possible totalitarian implications.
This leads us to the demythologization of ideological vanguards. If history has no rational direction, no group can legitimately lay claim to the one-and- only objective interpretation of history and, on that basis, take unto itself the right to regulate all things. Neither the educational elite, nor science nor the State can therefore aspire to laying down all-inclusive guidelines or principles. Once we have chipped away at the idea of progress and of the existence of an underlying historical rationale, the vanguard’s face takes on the features of a despot.
This also partly undermines the legitimacy of the “strong” versions of normative planning and revolutionary change. Planning, in both its theoretical and

132 CEPAL REVIEW No* 48 / December 1992
practical forms, has been a point of encounter for science and the State. It assumes the existence of an historical rationale and, at the same time, believes in the possibility of manipulating that rationale with the help of a plan designed and promoted by a group which combines specialized knowledge with power. Unless society sees history as having a definite, positive direction and accepts the idea of a limited group having a scientific capability to “read” the present and effectively plot its future course, the State-as- planner and the normative planning which defines it have little claim to legitimacy.5 What appears illusory in this new “politico-cultural temple” is a hypostatic concept of the State as some sort of Hegelian synthesis which, independently of the vicissitudes of the moment, is always at the apex of historical rationality and is invariably the most appropriate leader for society. Today it is difficult to think of the current Latin American State as the agent of a harmonious unification of social interests.
The illuminist matrix of the image of a socialist revolution was also hard hit when history revealed the reversibility of socialism. It is true that as far back as the early 1960s the overthrow of progressive governments by right-wing military coups in Latin America cast doubt, from the standpoint of the power struggle, upon the supposed “historical inexorability” of the revolution. Moreover, as early as the mid-1970s social scientists had to seriously ask themselves up to what point the extreme image of a socialist revolution -an image defined by the Cuban revolution- could or should function as an intellectual superego. But it was the collapse of the socialist systems of the Eastern bloc in the late 1980s which dealt the crudest blow to the narcissistic image of a Leftist revolution. That was the turning point after which it became virtually impossible to associate at least that revolution with progress, with the liberation of human potentials, or with an improved development of the forces of production. These failures were so resounding that they divested the revolution of its supporting claim to being “right” about history.
5 The relationship is more dialectic than linear, however, and the political crises experienced by the State-as-planner as well as the grave doubts cast upon the effectiveness of planning itself have played a part in undermining the legitimacy of the principle of illuminist rationality and historical direction.
The crisis of the illuminist matrix raised doubts as to the validity of the theoretical/ideological models that had gathered so much momentum in the region during the 1960s, This was because -even though, during their heydays, capitalist developmentalism and Statist socialism represented antagonistic political interpretations- they both referred back to a normative planning model (whether for mixed economies or State economies) in which the plan represented the highest possible degree of rationality in terms of the direction of history. Do not both models retain the illuminist task of social emancipation (defined by developmentalism as modernization and emancipation from traditional or pre-capitalist forms of social reproduction, and defined by socialism as emancipation from international capital -imperialism- or oppressive production relations)? And is it not true that the State-as-planner plays such a crucial role in both images of social emancipation -whether in closing the technical gap or triumphing over domination- that both ideologies hold that their belief regarding the path of history only becomes real once it is embodied in the power of the State-as-planner to regulate society?
The critique of developmentalism and of socialism that can be deduced from the critique of the illuminist matrix is closely linked to the pro-market ideological offensive which gained in intensity the world over in the course of the 1980s. This mixture of anti-illuminism and anti-Statism can be summed up in a critique of the transformational function of political measures (except when directed towards privatization and economic deregulation) and a critique of State intervention in and regulation of economic relations.
Another reservation about the image of the socialist revolution or the practices of Statist planning -which is also derived from the anti-illuminist critique- has been formulated from a cultural standpoint and by some currently fashionable schools of democratic political theory. From the “culturalist” perspective, both planning and revolution are reproached for their ethnocentric bias: one because it imitates the development style and types of expectations prevalent in the industrialized world and hopes to impose that model on developing countries by working “from the top down”; the other because it takes as its model an emancipatory ideal peculiar to the European version of modernity which is incapable of adapting to the cultural identity of

THE SOCIAL SCIENCES WITHOUT PLANNING OR REVOLUTION? / M. Hopenhayn 133
the Latin American people. Thus, the critique of the illuminist matrix translates into a rejection of a reductionist imposition of an exogenously- induced development pattern or form of historical redemption.
From the standpoint of a renewed appreciation of democracy, the comprehensive scope of the State-as-planner or of some future socialist State (the pretension of moulding society) is called into question while, on the other hand, value is placed on the relative autonomy of civil society and on a sociopolitical order founded upon a broad-ranging social consensus. In this consensus-based order, the “direction of history” would not be determined solely by a central power made up of planners and revolutionary politicians, but by processes of negotiation and consensus among many social actors. From this viewpoint, the utopia of the socialist revolution or of the State-as-planner (as the axis and leader of a model of modernization) appear to be incompatible with a social democracy that encourages the proliferation and expression of a variety of rationales or forms of reasoning that have grown out of the social fabric; in some quarters, these rationales are referred to as the “logic of social movements”. 6 In the same vein, the call for social diversity and creativity is not directed towards strengthening the market as opposed to the State, but rather towards calling attention to the complexity of society, the variety of actors and the sociocultural costs of a form of modernization which has a leveling effect on society.
The archetypal images of planning and revolution cannot so easily be dissociated from the mythologization of progress, from the rational vanguard or from integrative modernization. If any of these three pillars is removed, these extreme images of the organicity of social knowledge begin to topple. This is because both the planner and the revolutionary made their “pleas” before the court of history as agents capable o f leading society by means of a process o f rationalization whose objective was to modernize its political, economic, social and cultural structures, i.e., to incorporate the whole o f society into the dynamic o f progress (or to place it firmly on the path o f history).
6 On social movements in general, see, among others, Jelin(ed.), 1987; Bailón (éd.), 1986; Touraine, 1984; and Calderón(éd.), 1986.
4. The utopian matrix, planning and revolution
The outbreak of the economic crisis of the early 1980s and the collapse of socialism in the face of the “market approach” in the late 1980s placed a firm upper limit on development and social change in terms of the historical conception of those phenomena as well as from the standpoint of theories of social change in Latin America. One unavoidable consequence of the imposition of this objective, exogenous limit by the crisis has been a weakening of the utopian matrix.7 But what elements of this matrix have been most conspicuous in the discourse of normative planning and of socialist revolution in Latin America?
In the praxis of normative planning, the outstanding trait is the exhaustive nature of its management of the tools of development; the desired object is complete correspondence between the plan -its objectives and terms- and its actual material expression. In this form of planning, the utopia is the actual possibility of planning a utopia, especially in association with the pretension of adjusting reality to fit the plan absolutely, or of extending its instrumentalist rationale to encompass the entire social fabric; the comprehensive regulation of the real world by the dictates of the production rationale, the agenda of economic modernization, the control of cross- sectoral equilibria and improvements as reflected in aggregate economic indicators.8
The critique of the utopian matrix also has two differing theoretical/ideological sides. On the one hand, utopian constructs are opposed on the basis of the coercive influence they may have on the real world; it is argued that the utopian referent, when allowed to govern and direct the present, closes off opportunities and imprisons the present in a strait- jacket. On the other hand, adherents of resurrected
yThis lerni is meant to denote a matrix oriented towards
the production of utopias, not a matrix which is utopian in the sense of being ideal.
8 *The pretension of normative planning, conceived of as an instrumentalist utopia, can be thought of as a way of subsuming political conflicts into formal structures. Within this framework, planning runs into the problem of its emergence as a “strategic" feature of a State-as-planner in the process of historical formalization (a process which will never be entirely completed). This is why planning’s legitimacy crisis cannot be divorced from the crisis of the Slate, especially in terms of an ideal construct.

134 CEPAL REVIEW No. 48 Í December 1992
forms of realism or political pragmatism contend that utopian thought distorts and oversimplifies the conflicts that actually do exist, skews the relationships among real forces and agents, and ends up confusing desires with fads. Let us examine these two fronts of the attack upon the utopian matrix, which may be launched from either the normative-planning or the revolutionary camp.
The first of these criticisms, which is directed at utopian determinism, has been formulated by neoliberal thinkers who originally drew their inspiration from Karl Popper’s critique of Plato, Hegel and socialism in general. This line of argument is that a model set forth on a normative basis, which therefore is intended to plot the overall course of history so as to move towards an objective that has been defined as valid for all, is simply incompatible with the maintenance of an “open” society, i.e., a society that is free to choose and to rectify its own fate (or to permit there to be as many fates as there are people within it). This attack on utopianism has been extended to include planning and the idea of revolution, since in this sense both present themselves as ways of “exercising power over the future”. A development process led “from above” or by a certain group, as might occur in the case of a State-as-planner or a revolutionary programme, would represent a threat to an “open society” from its very inception. The rational utopia lying behind such an image of the State, whereby the State embodies an “optimizing” rationale (which, as such, is also inexorable) would, from this standpoint, constitute the first step towards an over-regulated totalitarian regime directed by a power which, in its turn, perpetuates that regulation indefinitely.
This warning may well contain an element of paranoia and lend itself to liberal crusades which themselves could take on totalitarian overtones. But this does not mean that it should be taken lightly. These neoliberal fears present democratic thought with the challenge of re-thinking the image -or model- of the State-as-leader so that it will broaden its utopian horizon to include many different approaches (based on communication, solidarity, aesthetics, participation, etc.). Only by relativizing the utopian matrix (as utopian reductionism, whether formalistic or finalistic) can a sphere that has until now been largely pushed to the sidelines -i.e., social subjectivity- be incorporated into developmental
thought. This calls for a thorough-going reworking of the culture of modernization, since it is that culture which has served as the symbolic foundation for the construction of our image of the State-as-planner.
The second of these criticisms does not question the praxis of utopianism as such, but rather seeks to pinpoint its political and epistemological functions. Here the objection, which is raised by adherents of various ideological and theoretical positions, is to a utopia’s claims to feasibility and the fact that such claims distort the way in which the actual order is perceived.
The political aspect of this critique is linked to the recent reappearance of political realism. What is being questioned on this score is the maximalist tendency of any attempt to practice politics on the basis of a utopian vision, since such maximalism often leads to a lack of political realism that ultimately thwarts attempts to actually bring about a structural change in society. In this respect, utopianism is associated with the over-ideologization of which the Left has been guilty in decades gone by, when maximalist positions or the symbolic referent of the revolution would seem to have underestimated the true strength of the social forces opposing proposals for radical change.
The epistemological aspect of the critique is an objection to the confusion generated by the utopian matrix when it leads its adherents to regard present reality as no more than a necessary step along the path leading to that utopia. Reality is then something to be “read” as an ideal-in-the-making, which results in the neglect of many aspects and actors making up the real system that are not necessarily marching in the direction of this utopia. Utopianism thus reproduces, in a more earthly version, the old concept of providence which lasted even up to the rationalist megalomania of Hegel. From this illusory vantage point, once again, all that is real appears to be rational and all that is rational appears to be realizable: the subjective, expressive dimension of the people is once again bypassed.
The critique of the utopian matrix contends that the purpose of the utopia should be to serve as a reference point of intelligibility; it should permit a greater awareness of the objective limitations and repressed potentials of the present situation. The utopia is, then, a counterpoint that helps us to understand a given real-world situation and a horizon line which helps to plot a course of action that will carry us in a

THE SOCIAL SCIENCES WITHOUT PLANNING OR REVOLUTION? t M. Hopenhayn 135
direction indicated as desirable by that utopia. It is crucial, however, that this methodological function of the relevant utopia should be delimited so as to avoid lapsing into a type of idealization that blurs the differences between an idealized construct and the real world. Such confusion attributes an ontological standing to this utopia which it does not possess.
These political and epistemological criticisms are applicable both to the discourse of revolution and that of planning. It may be thought, for example, that the many functions assigned to the State-as-planner in its role as a meta-actor and a mega-actor and as society’s great leader and nexus are based on the supposition that social reality is pliant and can be harmonized by those on high and on the assumption that the State will continue to receive an increasing flow of resources. The idea that economic development could be combined with sweeping changes in social structures while giving rise to so little conflict that the State could settle disputes without any major difficulty does not appear to be in keeping with any realistic analysis of the Latin American societies. This utopian maximalist inspiration of the State-as- planner was also at work, albeit with very different contents and programmes, in the other great undertaking which won so many adherents among intellectuals and political activists in the 1960s: the socialist revolution.
As regards the confused ontological status of such utopias, it should be remembered that the socialist revolution and normative planning never saw themselves as utopian constructs (at least during the heyday of the concept and its application), but rather as a programme designed in accordance with the path o f history. This programme was, in both cases, a “schedule” for the State’s rationalization of society (with a more technical leaning in the case of planning and a more technological one in the case of the revolution), and it therefore saw political power as its repository.
However, in both cases the transition from ideal construct to action was carried out with little reference to reality. The dividing line between the ideal construct and perceived reality was blurred and confused. With the boom in planning set off in 1961 by the Alliance for Progress, what was real became ra- tionalizable and what was rational became realizable. Hegel again took the stage in the wave of euphoria that launched national development plans,
These plans not only seemed to be a bridge between the real world and utopia, between the possible and the desirable; their conscientiously instrumentalist rationality was used as a basis for painting a reality that was “ready and willing” to be sculpted into the planner’s vision of utopia. Time -along with the interests of some and the power of others- showed that the real world is neither so docile nor so linear, however.
In the production of images of the revolution, the call for political will was perhaps much more explicit than in the case of planning. At the same time, however, the image of the revolution was painted in such epic terms that, in many cases, it failed to grasp the true alignment of political forces. The fact that so many bloody military coups could take intellectuals and the Left by surprise reveals the lack of political realism for which the Latin American Left has been so severely reproached since that time. The epic character ascribed to the revolutionary process and the mythologization of the agent of revolution (militants, settlers, workers or guerrilla fighters) were elements of utopianization exhibited by apologists for radical social change.
How much of a part did the social sciences play in these forms of perception and these biases of intelligibility? To what extent did the production of social knowledge consti-uct and to what extent did it interpret the illuminist and utopian myths employed by normative planners and revolutionary ideologues? To what point did this maximalism of the normative planner (striving to control every aspect of the development process) and the revolutionary intellectual (striving to change every aspect of the relationships among agents of development) form part of the imagery of the social scientist during the formative decades of the Latin American social sciences? To what degree did these “ideal types” serve as motives and horizon lines for actual research, analytical thought, and education in the social sciences in Latin America up to the mid-1970s? And if the answers to all these questions must be affirmative, at least to a considerable degree, then to what extent is this still true today? How much movement is there against the tide of disenchantment and autocracy, how much of this effort has been transformed into new utopias and new models for “helping along” the interaction between science and power? At this point, in the heat of the moment of disenchantment and reformulations, it is difficult indeed to be sure.

136 CEPAL REVIEW No, 48 i December 1992
II
The social sciences armed with new rationalities: between signals and coivjectures
1. New approaches and perceptions
If there really is such a thing as culturar “death”, whereby, at a given point in time, it becomes impossible for society to generate fresh, renewed images of itself, we must not look to the social sciences to exorcise the prevailing indifference about the future or renunciation of grand collective undertakings. Social scientists have always been creators, in the sense o f being interpreters, of society’s movement (or of the many movements of social reality), but they must be able to draw upon the cultural energy that only society itself can generate as an essential raw material for their work. If today this energy is dimmed or cannot be harnessed, then the social scientist will have to develop a new type of clinical eye and will have to carry on with the help of nothing more than his own tattered or humbled awareness while he waits for society’s imagery to be reinvigorated by the next swing of the pendulum. He must remain alert, guard against the discursive obesity typical of those who really have little to say, and empathize with what is coming so that he will be able to comprehend new rationalities. And, at the same time, he will have to maintain a somewhat vitalistic perspective together with an incisive, critical outlook in which the best aspects of modern humanism survive.
The options now on the table seem to be leading towards new types of relationships between the social scientist and the object of his attention, between knowledge and reality. It may well be that the pendulum will swing part of the way back towards a healthy dose of illuminism and utopianism, which would help to dispel the excessively pragmatic bias that threatens to co-opt the work of social scientists, or to curb the uncritical apologias for the functions of the market that are now being churned out. We may also expect to see the extension of the concept of rationality to include such elements as society’s cultural self-production, newly-developed life strategies, the expressive, subjective phenomena set in motion by social actors, and the irrepressibly mestizo identity of Latin America. Some veins of postmodernist
discourse will have to be mined, such as the practices of expressing oneself in plural forms, perspectives, simulacrums or alternative scenarios. Social scientists will have to be more humble about the way they transmit knowledge, but they will also have to be mûre adventuresome in their experimentation with that knowledge. They will have to transfer the pluralism associated with political activity over to epi- stemological activity and maintain a pluralistic outlook in their role as social scientists. They will have to modify both form and content, both their personal attitude and their attitude towards their subject; indeed, they will have to become, for a time, that subject, to truly feel the emotions of disenchantment and perplexity on a personal basis and as experienced by their fellow men. Nothing should be ruled out as irrational or irrelevant. We must look closely at cultural nuances and profiles, the traits of sensitivity and personality, in a way that no planner or scientist of the revolution ever thought of doing.
It is not necessarily a question of finding the easy way out, of celebrating disenchantment, or of proclaiming that the social sciences have finally freed themselves from the “bonds” of reason, of Logos, of a commitment to history and to the end of history. Nor is it a question of reducing ethical problems to ambiguous aesthetics, or of reducing practical problems to being entirely a matter of individual choice. It is not, finally, a question of softening or evening out social and structural heterogeneity under the guise of that flattering epithet, “plasticity”.
But if the social sciences wish to go beyond the ritual exegesis presided over by university professors; if they wish to break the atomized, taxonomic mould with which research centres approach the acquisition of knowledge; if they wish to transcend the casuistic and find some link in the chain that allows social science praxis to free itself of the descriptive mould enveloping it; if they wish to take just a few steps beyond their technical consultancies for ministries and government departments, just a few steps beyond political marketing and opinion polls, just a few steps beyond the cult of the market and the life of a technocrat, just a few steps beyond all these

THE SOCIAL SCIENCES WITHOUT PLANNING OR REVOLUTION? / M. Hopenhayn 137
substitute or random links between social science and social life, then the social sciences will have to allow themselves to be contaminated just a bit with the new sensibilities being proclaimed in postmodernist discourse. This does not, however, mean that they must adopt a cool, laid-back view of problems which, as is almost always the case with major social issues in Latin America, have reached the boiling point.
2. Signals and conjectures 9
The above-mentioned loss of the utopian referent and of the horizon of communion between theory and practice, between the individual and history, has sent the Latin American social sciences into a kind of exile. So long as the theory of dependence, the image of a coming revolution or a developmentalist agenda were seen as valid or influential, we could convincingly posit a link between the intelligibility of social phenomena in the social sciences and political intervention in the social sphere. Major changes in theoretical thought -such as the decline of militant science, the fragmentation of a body of knowledge which had formerly at least purported to constitute a consistent whole, or the crisis of development models based on planning and sustained modernization- are continuously undermining this emancipatory mystique of the social scientist. Words which are now held as sacred may have been regarded as sacrilegious in the time of social scientists’ grand designs: minimalism, low profile, micro-project, interstice, small areas, shortterm, sustainability.
One might think that when expectations of a comprehensive approach and synthesis (in theory, too, but especially in the confluence of theory and politics, of the intellectual and the masses) die away, they would leave the field wide open for an instrumentalist rationale to spread unchecked throughout all spheres of social life -thereby reinforcing the inequities associated with the prevailing development pattern- without prompting even so much as an outcry. It might also be thought that the growing professionalization of the sociologist and political scientist, as well as their greater emphasis on pragmatism and technical considerations in their theoretical work, is a reflection of this trend.
9 This section is partially based on some passages contained in the article ¿Qué queda de positivo en el pensamiento negativo? Una perspectiva desde América Latina (Hopenhayn, 1991b, pp. 87-100).
How* then are critical functions based on social theory to be performed, today, in Latin America? What content should we give that theory, and what objects can we ascribe to it without falling into self- pitying pessimism or a paralyzing fatalism? Is it possible to return to a mode of theoretical activity in which criticism gives rise to the empowerment of liberating forces or traits within social reality, makes room for hopes of a more humane order, for the promotion of a more affirmative and less heteronomous culture, for the socialization of an ethic capable of “substantiating” development? If it is, then what signals has social science praxis sent out thus far that might foreshadow new and creative forms of criticism in the sense we have just described? In the following paragraphs I will attempt to take the first steps towards an answer to this last question.
a) The emergence o f new spheres and approaches in the fissures of the modernization process
It has been said that, because of the nature of newly emerging political, economic and technological conditions, hopes that the agendas of different groups and individuals can be merged into one grand agenda for changing society seem like a less and'less attainable dream. Nevertheless, alternative proposals or perspectives continue to arise which represent an incipient, interstitial attempt to get away from the illuminist paradigms of modernization while at the same time avoiding any identification with the status quo established by the mercantilization of social relations. Some of the emerging values embodied in these proposals merit discussion:
i) An appreciation of democracy as an order in which disputes are settled through dialogue, negotiation and consensus; as a necessary framework for linking the State with civil society in the least coercive way possible by stressing the importance of communication; as a political foundation for reconciling the technical and political dimensions of development, for striking a balance between planning and the market, and for accommodating local and national affairs; and as a springboard for social participation, the decentralization of decision-making and the affirmation of a “culture” of citizenship.
ii) A renewed appreciation of the social actors and the fabric of society and, in the same sense, for the polymorphism of civil society in the face of the leveling action of the State, which is in its turn the

138 CEPAL REVIEW No. 48 / December 1992
product of a determination to devise new forms of political activity in which political parties and clientage have less of a place and the cultural decisions of the relevant actors have a larger one.
iii) A fuller appreciation of so-called “new” social movements (or community groups or grassroots organizations) by virtue of the fact that these movements operate within the informal sphere of society at the community level; employ counter-hegemonic rationales which place emphasis on solidarity, resistance against authoritarianism, cooperativism, and autonomy or collective participation; and create situations in which social energies are not siphoned off by instrumentalist rationales or a logic of domination.
Of course, the above three viewpoints are as yet incipient or diffuse, and the social scientists who embrace them are, for the most part, former Leftists or developmentalists who have become disenchanted somewhere along the way. In a sense, they embody a critical yet not fatalistic view of reality. The appreciation of today’s new social movements reflects a concern with the establishment of collective identities whose rationales cannot be subsumed into the rationales of the market and of power; the renewed appreciation of social actors demonstrates a preference for more autonomous rationales of the social dynamic and for more consensual, open forms of political activity; and the appreciation of democracy, in a broad and very profound sense, also implies a desire to shape a democratic culture rather than simply establish a government elected by majority vote -in other words, an ideal form of citizenship in the best illuminist tradition.
The approaches that have grown out of these emerging values seem to share a common meta-value which might be described as the choice of a progressively democratic order whose progressivity is manifested in the fact that virtually all types of relationships are seen as lending themselves to democratization: not just the relationship between the State and civil society, but also those existing within any sort of institution (families, municipalities, schools, the workplace, public institutions, services) in any sphere whatsoever (politics, social matters, cultural affairs, economics and technology). In this context, the expansion of cognitive consciousness appears as a key element that is to be promoted in all areas of social interaction, from the household to politics, from the realm of personal communication
to that of government or business management, from cultural matters to the economy. It comes as no surprise, then, that in the epistemological approach chosen by those who share this meta-value of progressive democratization, an interdisciplinary focus and participatory research also seem to be preferred practices.
b) An “alternative” form o f development and criticism o f the instrumentalist model in Latin America
Adherents of the heterodox school of “alternative” development or “the other development” have stepped forth to challenge the instrumentalist model associated with the prevailing form of modernization in Latin America, This criticism comes from heterodox social scientists, many of whom are working in non-governmental agencies devoted to the study and promotion of community forms of social organization, appropriate technologies, participatory social policies, organic relationships with the environment, the spread of folk culture, respect for the identities of indigenous groups or the channeling of more attention to local phenomena and community or grassroots groups. They assert that the dominant development model (first the developmentalist or Statist model, later the neoliberal one) neglects the qualitative dimension of social life, “ethnocentri- cally” ignores ethnic and regional forms of expression and identities, and tends to imitate industrialized societies’ development patterns, which do such serious harm to the environment. In contrast, the paladins of alternative development are highly receptive to community, indigenous and, insofar as possible, unhierarchized efforts to promote development; they emphasize social development over economic development, cultural over technological development, and local over national development. In fact, their rejection of the instrumentalist rationale is so strong that they do not concern themselves with the major conflicts affecting the central government but instead restrict their attention to microcosms of social interaction where there appears to be a better chance of cleansing social relationships of their manipulatory vices.
Within this framework, a search is being made for an alternative way of re-connecting the outputs of the social sciences with the transformation of society. The locus of this re-connection has shifted, in this

THE SOCIAL SCIENCES WITHOUT PLANNING OR REVOLUTION? / M. Hopenhayn 139
case, from the State to civil society, from central planning to the promotion of community efforts, and from an economic focus to a sociocultural one. The social processes and actors focused on by social research in this context are, for the most part, not the ones that attracted the attention of the more prominent proponents of normative planning or socialist revolution. In terms of actors, concern is focused on urban informal and marginal sectors, groups that are victims of repression, ethnic minorities, women, community groups, countercultural movements and non-governmental organizations. As for the processes involved, special attention is devoted to those that include such elements as local participation in scattered suburban or rural areas; an affirmation of collective identities based on gender, ethnic origin or area; initiatives for putting up civil resistance to various types of authoritarian relationships between government institutions and communities; the use of forms of expression or communication to define new collective symbols; new cognitive practices, such as action-oriented or participatory research; new types of social aid programmes that assign recipients an active role; the use of traditional indigenous medical practices and alternative technologies; and even newly emerging schools of grassroots religious or spiritual thought.
c) Counter-hegemonic rationales: Something new or just a new substitute for social change?
“Criticar’ social scientists’ concern with studying and vindicating the new social movements, counterculture initiatives, forms of resistance to authoritarianism, ethnic minorities, community efforts to promote development and small-scale projects demonstrates that they are not content to confine their criticism to a mere gesture of rejection. It is in these counter-hegemonic activities that researchers who have embraced unconventional forms of study (regardless of whether they choose to call it action- oriented research or participatory research) seek out interstices providing an opportunity to counter the system. In these cases, the conversion of social knowledge into proposals for transforming society does not take the form o f a plan for establishing a utopia for the whole o f society in the future, but rather consists in the discovery o f "zones” or interstices within today’s society in which the democratization o f social relations can be carried forward,
these “zones” include everything from community- run soup kitchens and self-managed production workshops to less hierarchical forms of organization within modem business enterprises, as well as proposals regarding education, mass communications, ecology, constitutional reform, city management, and many other areas of activity.
The question arises, however, as to whether it is possible to design and build a different sort of societal order by multiplying these interstices throughout society. This reservation notwithstanding, it is well worth our while to take note of these signs, even if their existence is nothing more than a matter of conjecture for the moment, because they suggest that producers of social knowledge are attempting to recapture the will -albeit in a different form- to foster social change. First, the decision to look for new ways of thinking about research constitutes an effort to take up the challenge to reformulate the position and the commitment of the social researcher vis-à-vis his subject. Second, the identification and vindication of new actors and processes attest to a desire to regain the ideal of a role for the social scientist in the dynamics of social change and to channel theoretical work in that direction. Finally, the criticism of the status quo which is part of this rising tide of knowledge-producing activity and new perceptions has two facets: an attack on a critically-defined general order, and the highlighting of interstitial or peripheral processes whose rationales run counter to those that hold sway within that general order.
Perhaps these shifting focuses of the social scientist are stages in a transition towards as yet unformed paradigms. Perhaps the establishment of new referents in the future will oblige us to re-create elements which many enthusiastic postmodernists are currently hastening to bury in the sands of time. Crucial, long-standing concepts (e.g., alienation, exploitation), as well as such propositional concepts as integrative modernization or the redistribution of the fruits of technical progress, will sooner or later have to be recycled to provide inputs for new bodies of theory within the Latin American social sciences. Their recycling may also enrich schools of thought that are only now beginning to take shape by contributing new rationales and utopias-in-lhe-making, whether they turn out to be the utopia that some have sought to attribute to the new social movements (with their respect for diversity, local autonomy, and solidarity) or the utopia which could be unfolding within

140 CEPAL REVIEW No. 48 / December 1992
the new democracies, with their commitment to greater political participation, a greater role for citizens in the management of the country, and a more meaningful definition of citizenship itself, or new artistic and cultural forms and new survival strategies that have yet to be developed. And then it will no longer be normative planning or the socialist revolution that define the boundaries within which the legitimized self-image of the social scientist will be drawn.
It now appears to be essential for the social sciences to open up to new perceptions, erratic yet thought-provoking rationales which appear and
disappear at all points of the social fabric, rationalities which gradually work their way into new relationships of power and interchange, newly emerging actors and fragmentary processes. Allowing oneself to be contaminated by discourses which in times gone by might have earned themselves unyielding censure may be a useful exercise in opening up our sensibilities and fine-tuning the spirit. There is validity*, at least for the time being, in this odd combination of prudence and adventurousness, this opening up of perspectives, this experiment in knowing, this heterodoxy while awaiting new signs.
Bibliography
Bailón, Eduardo (ed.) (1986): Movimientos sociales y democracia: la fundación de un nuevo orden, Lima, DESCO.
Calderón, Fernando (ed.) (1986): Los movimientos sociales ante la crisis, Buenos Aires, Latín American Social Sciences Council (CLACSO).
Faletto, Enzo (1989): The specificity of the Latin American State, CEPAL R e v ie w , No. 38 (LC/G.1570-P), Santiago, Chile, August.
Gurrieri, Adolfo (1987): The validity of the State-as- planner in the current crisis, CEPAL Review, No, 31 (LC/G.1452), Santiago, Chile, April.
Hopenhayn, Martin (1991a): Crisis de legitimidad en el Estado planificador, Revista interamericana de planificación, vol. 24, No. 96, Puerto Rico, Sociedad Interamericana de Planificación (SIAP), October- December.
— (1991b): ¿Qué queda de positivo en el pensamiento negativo? Una perspectiva desde América Latina, Edgardo Lander (éd.), Modernidad y universalismo,
Caracas, United Nations Educational, Scientific and Cultural Organization (UNESCO)/EditórÍal Nueva Sociedad.
Jelin, Elizabeth (ed.) (1987): Movimientos sociales y democracia emergente, Buenos Aires, Centro Editor de América Latina.
Lechner, Norbert (1988): Los desafios de las ciencias sociales en América Latina, Santiago, Chile, Latin American Faculty of Social Sciences (FLACSO).
Sonntag, Heinz (1991); El estado de arte en las ciencias sociales latinoamericanas, Caracas, mimeo.
Touraine, Alain (1984): Nuevas pautas de acción colectiva en América Latina, Santiago, Chile, Regional Employment Programme for Latin America and the Caribbean (PREALC).
Vergara, Jorge (1991): Crisis y transformaciones de las ciencias sociales latinoamericanas, paper presented at the Ninth Seminar of the Epistemology and Politics Commission of CLACSO, Santiago, Chile, 28-29 November.

CEPAL REVIEW No. 48
Growth and income distribution in countries at intermediate stages of development
Eduardo Sarmiento*
This article analyses the relationship between growth and income distribution. The existence of a conflict between these two variables depends on a country’s level of development. Such conflicts arise during intermediate stages of development, when growth is led by savings, and tend to disappear when growth becomes a knowledge-led phenomenon. Part of the reason for this is that saving is much more concentrated than education and technology are. The author contends that the conflict is not insuperable, however; in practical terms, it can be corrected by means of fiscal and educational policy measures.
There is no formal framework for the analysis of income distribution, nor is there any theory that permits us to formulate general statements about its determinants or to establish their relative importance. The analytical approach to this subject has been primarily empirical and has focused on identifying the traits and policies of countries that have successfully reconciled these two variables, for subsequent comparison with countries that have not been successful in this regard. The results of these comparisons suggest that income distribution is determined by the nature of initial conditions and the sequencing of development policies. To some extent, all countries have taken the same steps, but in widely varying orders. More than in any other area, the results achieved in terms of income distribution are closely related to the logical order of events and actions.
*The author is Dean o f the School o f Economics at the Universidad de los Andes in Colombia.
IntroductionFor the past 40 years, Latin America’s development process has been marked by a conflict between two objectives: growth and social equity. The comparison of six Latin American countries presented in the report entitled Social Equity and Changing Production Patterns: an Integrated Approach (ECLAC, 1992, p. 39) shows that countries which have advanced in one of these directions have not made progress in the other (see table 1). Argentina and Uruguay have the highest levels of social equity and the lowest growth rates, while Brazil and Colombia have the highest growth rates and the lowest levels of social equity (see table 1).
The experience of the Asian economies has been quite different. Israel, the Republic of Korea and Taiwan have made significant advances in improving income distribution within an overall framework of progress. The difference lies less in the scope of the measures adopted than it does in the order of their implementation. In all three of these cases, the sequencing of distributive policies has been very similar. The development process was preceded by a comprehensive agrarian reform programme which, later on, was reflected in the countries’ industrial and overall urban structures. Industrialization was preceded and accompanied by a substantial increase in the entire population’s educational level. Consequently, the skilled members of the labour force were able to find positions in which they could put their training to better use. During the intermediate stages of development, ambitious social programmes were undertaken to ensure that the entire population’s basic needs were met, and extreme poverty was eliminated without seriously interfering with saving or growth.
Although it is true that in Latin America the same policies were tried, the order was different. Agrarian reform was initiated at a time when most of the population was already in the cities; its implementation was slow, it was subject to repeated interruptions, and its ultimate scope was no more than partial. The outcome was that the region did not manage to prevent its inequitable rural structures from being reproduced in urban areas. The elevation of educational levels was carried out in a piecemeal fashion. Skilled members of the labour force were unable to find positions where their training could be put to good use. And finally, social transfer programmes were carried out during incipient stages
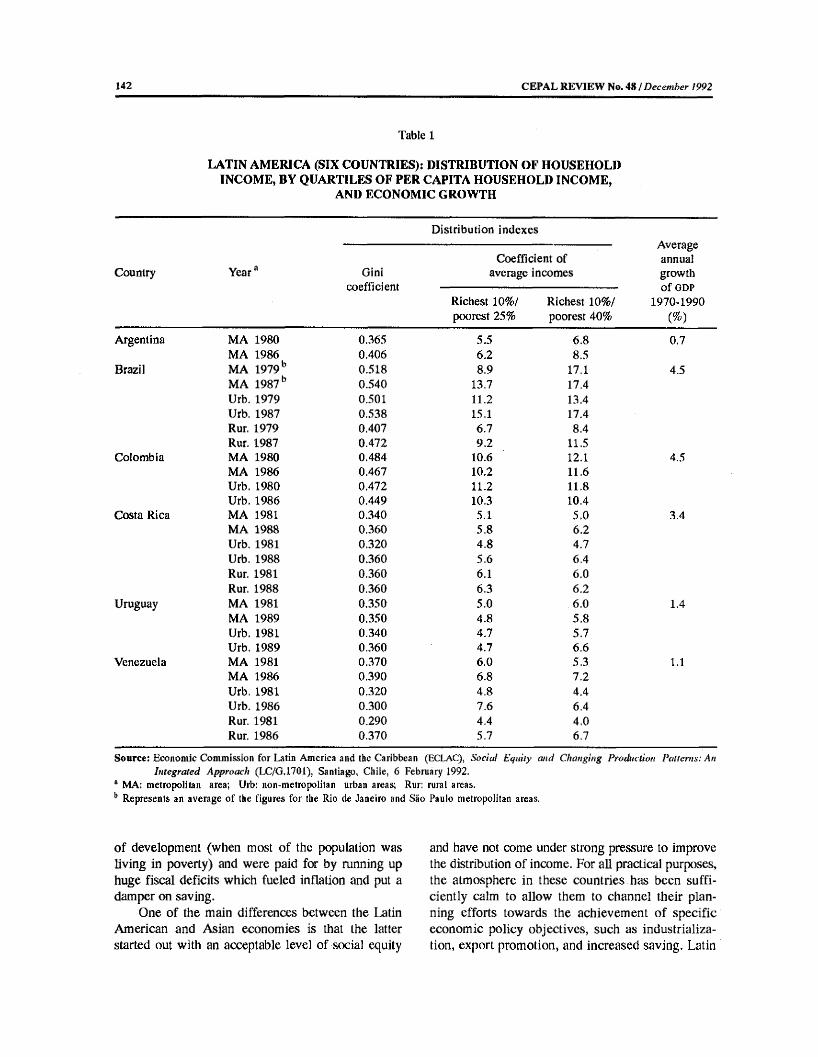
142 CEPAL REVIEW No. 481 December 1992
LATIN AMERICA (SIX COUNTRIES): DISTRIBUTION OF HOUSEHOLD INCOME, BY QUARTILES OF PER CAPITA HOUSEHOLD INCOME,
AND ECONOMIC GROWTH
Table 1
Distribution indexes
Country Yeara Ginicoefficient
Coefficient of average incomes
/w crage annual growth of GDP
1970-1990 (%)
Richest 10%/ poorest 25%
Richest 10%/ poorest 40%
Argentina MA 1980 0.365 5.5 6.8 0.7MA 1986 0.406 6.2 8.5
Brazil MA 1979b 0.518 8.9 17.1 4.5MA 1987 b 0.540 13.7 17.4Urb. 1979 0.501 11.2 13.4Urb. 1987 0.538 15,1 17.4Rur. 1979 0.407 6.7 8.4Rur. 1987 0.472 9.2 11.5
Colombia MA 1980 0.484 10.6 12.1 4.5MA 1986 0.467 10.2 11.6Urb. 1980 0.472 11.2 11.8Urb. 1986 0.449 10.3 10.4
Costa Rica MA 1981 0.340 5.1 5.0 3.4MA 1988 0.360 5.8 6.2Urb. 1981 0.320 4.8 4.7Urb. 1988 0.360 5,6 6.4Rur. 1981 0.360 6.1 6.0Rur. 1988 0.360 6.3 6.2
Uruguay MA 1981 0,350 5.0 6.0 1.4MA 1989 0.350 4.8 5.8Urb. 1981 0.340 4.7 5.7Urb. 1989 0.360 4.7 6.6
Venezuela MA 1981 0.370 6.0 5.3 1.1MA 1986 0.390 6.8 7.2Urb, 1981 0.320 4.8 4.4Urb. 1986 0.300 7.6 6.4Rur. 1981 0.290 4.4 4,0Rur. 1986 0.370 5.7 6.7
Source; Economic Commission for Latin America and the Caribbean (ECLAC), Social Equity and Changing Production Patterns: An Integrated Approach (LC/G.1701), Santiago, Chile, 6 February 1992.
a MA: metropolitan area; Urb: non-metropolitan urban areas; Rur: rural areas. b Represents an average of the figures for the Rio de Janeiro and São Paulo metropolitan areas.
of development (when most of the population was living in poverty) and were paid for by running up huge fiscal deficits which fueled inflation and put a damper on saving.
One of the main differences between the Latin American and Asian economies is that the latter started out with an acceptable level of social equity
and have not come under strong pressure to improve the distribution of income. For all practical purposes, the atmosphere in these countries has been sufficiently calm to allow them to channel their planning efforts towards the achievement of specific economic policy objectives, such as industrialization, export promotion, and increased saving. Latin

GROWTH AND INCOME DISTRIBUTION IN COUNTRIES AT INTERMEDIATE Sarmiento 143
America, on the other hand, has been subject to a great deal of pressure to mitigate unacceptably high income differentials, and to some extent this has contributed to the emergence of populist governments that have tried to come up with quick ways of changing the social structure* Their efforts have focused on raising wages, distributing property and increasing government spending by means of money creation. In most cases, these policies have weakened saving,
boosted inflation and slowed growth. Although the effects have varied from place to place, the outcome has usually been a decrease in both growth and social equity, and in many cases these policies have therefore ended up hurting precisely those groups they had been intended to help. And since powerful groups have better buffers against adversity, the costs of the resulting crisis situations have chiefly been borne by lower-income groups.
I
A profile of growth and social equity
Low- and middle-income countries have a very different development profile from that of high-income countries. In the latter, the engine of development is technology. Economic growth is brought about by the advance of knowledge and, in general, by rising labour productivity. The benefits of a process of this type are received by the workforce and human capital, since the remuneration of labour rises in relation to that of physical capital. It also gives rise to a highly competitive export structure thanks to increases in productivity and transfers of knowledge that pave the way for an improved international position and for diversification. Furthermore, high income levels make it likely that saving will be fairly evenly distributed throughout the entire population and will be responsive to interest rates; thus, it will not be very sensitive to income distribution. None the less, problems of equity do arise within the labour force, and to some extent this is inevitable in a capitalist system. The fact remains, however, that because the acceleration of the growth rate will be the result of a better utilization of knowledge and the creation of new jobs, it is reasonable to expect it to be accompanied by greater social equity.
In developed countries, growth is less dependent on investment. In addition, saving is more evenly distributed among the population and is fairly interest-rate elastic. Consequently, an increase in the growth rate will not conflict with an improvement in real wages, or in distribution in general.
Middle-income countries exhibit quite different traits. The engine of growth is savings, and progress is dependent upon its expansion and efficiency. There is also an inverse relationship between savings and
household income and, since this relationship is not very sensitive to market stimuli, an increase in saving will probably be coupled with a worsening of income distribution. In fact, this appears to be a source of serious conflict between growth and income distribution.
Our troubles do not stop here, however. Developing countries lack the capacity to convert savings into investment. Most equipment is imported and must be paid for with foreign currency. At the same time, their comparative advantages are in primary activities which have only limited prospects in external markets, do not generate strong linkages within the production sector, and do little to promote scientific and technological development. The externalities associated with exports are chiefly generated in activities of a certain level of complexity.
In order to achieve the type of external sector that will help sustain a dynamic process of capital formation, a country must export manufactures that have some technological content. Unfortunately, this type of export activity does not occur spontaneously, and developing countries are therefore clearly at a disadvantage in relation to countries that have a head start on them. Moreover, their ability to compete is based on their ability to pay lower wages than the developed countries can, and this poses a serious obstacle to improved income distribution. Hence, at this stage, exports of manufactures represent another source of conflict between the objectives of growth and social equity.
The foregoing clears up a number of questions. Developing countries must have higher levels of
144 CEPAL REVIEW No, 48 / December 1992
savings and lower real wages to sustain the same growth rates as the developed countries have. Under normal conditions, considerations of social equity place greater constraints on growth during intermediate stages of development. This sets up what appears to be a vicious circle: the countries are faced with greater inequalities but in order to rectify those inequalities, they must hold back their own progress; actually, what they need are special sorts of policy measures. The experiences of the Asian economies demonstrate that the outcome hinges on the State’s ability to take selective action in well-ordered sequences.
The studies conducted by Kuznets 40 years ago yielded a similar result: the relationship between growth and income distribution varied depending on the stage of development. However, our interpretation of these findings differs from this. Kuznets’ explanation of this phenomenon was based on a stylized argument relating to the differences between the levels of remuneration for factors of production in the traditional and modem sectors of the economy. According to this line of reasoning, during the initial phase of development economic growth would have a negative, but decreasing, impact on income distribution, while during the second phase it would have a positive and increasing effect. The changeover point would be reached when the modem sector accounted for about half of the country’s output. Hence, Kuznets saw the conflicts between growth and income distribution as being caused by dualism and, therefore, as affecting low-income countries in particular.
Our interpretation, on the other hand, relates to the structure of the development model itself. Furthermore, the results are not very applicable to low-income economies, where the constraint placed on saving is offset by low capital/output ratios and opportunities for developing exports of manufactures are few and far between. Actually, the economies in which constraints on saving and on exports of manufactures are severe are those of middle-income countries.
This statement is corroborated by the experiences of countries with a long record of development. During this century, these countries have seen both an improvement in income distribution and rising growth rates. Things did not always work that way, however. In the nineteenth century, income-
distribution indexes in various European countries and in the United States were similar to the present indexes of Brazil or Colombia (Williamson, 1991). In the specific case of the United States, the increase in saving and economic growth seen in the mid-nineteenth century was coupled with a sharp deterioration in social equity. The differences between the characteristics displayed during these two periods are clearly related to the countries’ structures of production. The link was very strong in the period before the industrial revolution, when growth was led by savings, and practically disappeared altogether in the period following that revolution, when growth came to be led chiefly by higher labour productivity and the development of new technologies.
In short, the nature of the conflict between growth and income distribution depends on the characteristics of the development process. During initial stages of development, it arises out of a situation of dualism; during intermediate stages, savings and exports are the source. Whereas in the first case we are dealing with a phenomenon over which the country has no control, in the second case the conflict can be addressed by means of appropriate State action taken in the proper sequence. This is how the Asian countries have managed to reconcile these two objectives much more satisfactorily than the Latin American countries. Finally, at advanced stages of development, the conflict tends to subside. The processing of knowledge into technology helps both to boost growth and to improve income distribution.
This does not mean that economies at intermediate stages of development cannot move forward without having a negative impact on social equity. Clearly, it is possible for a country to have low growth rates in combination with a relatively stable pattern of income distribution. The difficulty is to maintain high rates of economic growth while at the same time improving income distribution.
The solution does not lie in the forces of competition. On the contrary, the usual types of market- based formulas for stimulating growth actually work against an improvement in income distribution. Instead, the harmonization of these two objectives hinges upon some sort of fiscal policy action and the labour market.

GROWTH AND INCOME DISTRIBUTION IN COUNTRIES AT INTERMEDIATE. . . (E. Sarmiento 145
II
Factor payments
Income distribution is a reflection of the different levels of payment received by factors of production. Modifications in that distribution stem from changes in factor payments or changes in factor distribution. Thus, in the case of Colombia, for example, the cycles that have been observed in this respect are related to changes in factor prices while the trends are related to variations in factor distribution. Within such a context, it is not surprising that income distribution may vary in accordance with the characteristics of the development process. Growth is led by different factors at different stages of development: by land during initial stages, by capital during intermediate stages and by knowledge at advanced stages. Consequently, the way in which growth affects income distribution will depend upon how the benefits derived from those factors are distributed.
The factor of production with the greatest tendency towards concentration is land. Although this tendency is mitigated by the urbanization process, capital, too, exhibits high concentration indexes. As will be shown in the following section, it is much more unequally distributed than labour income is. The most equitable distribution is probably that of education and knowledge since, owing to the public nature of educational services, lower-income strata have greater access to education per unit of income. Moreover, training and knowledge are subject to externalities which are not confined to the direct recipients but instead benefit the whole of society.
The way that factors are distributed in the course of a development process is not independent of the initial conditions or of history. A large part of urban capital is made up of surpluses from the agricultural sector. The better the distribution of rural income, the better the distribution of urban ownership will be. Therefore, countries that have undergone radical agrarian reform processes have managed to build more equitable urban property structures. Furthermore, individuals who have more capital and higher incomes enjoy greater access to education. In other words, countries that started out on the road to development within a relatively equitable framework are in a position to achieve more satisfactory structures during advanced stages of development.
At this point the relationship between social equity and development stages seems clear. One essential aspect of a development profile is determined by which factors are given a high priority or are in short supply and their consequent levels of remuneration. Since growth exerts upward pressure on the prices of scarce factors, social equity will improve if these factors are distributed more evenly and will worsen if they are more concentrated. This principle is directly applicable by virtue of the simple fact that knowledge and education are more evenly distributed than labour income is, and labour income is more evenly distributed than capital and land. Hence, in land- and savings-led development models, economic growth is inversely correlated with income distribution, whereas in technology-led models, both objectives lie in the same direction.
A transition from one stage of development to a higher one produces changes in income distribution. This is Arthur Lewis’s famous dual-economy argument, on which the Kuznets curve is based. Suppose that under a feudal system the entire population was earning an income of $5.00; then, as a consequence of industrialization, some individuals are able to shift over to the modem sector of the economy and earn $10.00. Income dispersion -and, hence, income inequality- will increase at first and will then become more pronounced until the population is split evenly between the two sectors. Then it will begin to diminish and will disappear completely once the entire population has transferred over to the modern sector.
Something similar occurs during a transition from a savings-led model to a knowledge-led one. Generally speaking, an increase in equity can be expected, since knowledge and education are more evenly distributed than capital is. However, the change does not follow a straight line. As the wages of skilled workers rise relative to those of unskilled workers, the wage spread will widen at first and will continue to do so until the majority of the labour force has found employment in high-technology activities. As in the former case, after this point income distribution will tend to become increasingly equitable.
In our analysis it is helpful to distinguish between changes brought about by variations in remunerations and those attributable to the distribution

146 CEPAL REVIEW No. 48 i December 1992
of factors. The former are the main causes of changes in income distribution within the framework of a given development profile; in this case, a rise in the growth rate can be expected to affect income distribution according to the distribution of the scarcest factor. Changes in factor distribution, on the other hand, are most evident when an economy is moving from one stage of development to another. Thus, the transition from a feudal economy to a capital-led model and from there to a
knowledge-led one will lead to an improvement in income distribution. These changes are not linear, however. Since the population cannot move from one stage to another all at once, inequality will increase at first, but this effect will later be corrected.
These trends are not inevitable, however. The potential conflict between the two objectives can be overcome by means of strategic measures aimed at both factor payments and factor distribution.
III
Income distribution in Colombia
Perhaps one of the main difficulties in formulating an income-distribution theory lies in the fact that distribution is heavily influenced by the initial conditions in and characteristics of each economy. Earlier, we saw that the relationship between income distribution and growth is very different in middle- income economies and high-income economies. Since the behaviour of social variables is not the same everywhere, generalizations are subject to a great deal of uncertainty; less ambitious approaches are called for that combine empirical methods with theory. One option is to check theoretical hypotheses against the actual experiences of a given economy and then proceed to formulate general statements.
On this basis, we will now take a look at the determinants of income distribution in the light of Colombia’s experience. Although this path will not lead us to a general theory, it will help to set up an analytical methodology that could then be applied to other countries.
Research on income distribution in Colombia has been limited by the nature of the existing supply of information. Currently, the country has statistics drawn from household surveys, national accounts and other lesser sources which provide sufficient information to arrive at an acceptable estimate. The analysis of these figures should take into account the differing reliability of the various sources and should be carried out at a sufficient level of disaggregation to facilitate the identification of changes and policy measures.
The overall approach used in the following analysis is based on the methodological considerations
discussed in previous sections and is aimed at identifying alterations in income distribution caused by changes in factor payments and factor distribution. TYends will be measured at three different levels. First, the share of gross domestic product (g d p ) accounted for by income from labour and capital will be estimated. Second, we will analyse the incomes of wage earners and informal workers, as well as the earnings of large companies and of households. Third, we will examine the distribution of income from labour and capital. Finally, all of this information will be considered as a whole in order to analyse the overall trends in social equity within the Colombian economy.
Table 2 indicates the trends in the average income of the employed population in seven major cities and trends in per capita income. Based on the available information regarding the urban population and the employed workforce in these cities, an estimate of the share of urban g d p represented by urban labour income is also presented. This share, which had hovered around 50%, climbed during the period 1980-1983 and then fell sharply.
Table 3 contains information on wage earners’ incomes taken from national accounts. The trend in this category of income is quite similar to the movement seen in urban labour income. It fell a bit less steeply because the increase in informal employment offset a small part of the decrease in the wage earners’ share. In any event, in both series a sharp drop in labour’s share of national income was observed from 1983 on.

GROWTH AND INCOME DISTRIBUTION IN COUNTRIES AT INTERMEDIATE. . . /E . Sarmiento 147
Table 2
COLOMBIA (SEVEN CITIES): URBAN LABOUR INCOME IN PESOS AND ASA PERCENTAGE OF GROSS DOMESTIC PRODUCT, 1980-1988
(T e n s o f thousands o f p e s o s a n d p e rc e n ta g e s)
1980 1983 1985 1988
Average urban income*1 10.20 21,55 29.42 56,17Domestic income divided by total population3 4.94 9.02 14.1 31.6Labour force as a percentage of urban population 36.5 35.5 37.5 39.2Urban population as a percentage of total population 62.5 64.3 65.3 67.7Urban labour income as a percentage of urban gdp 47 55 51 47
Source: National Household Survey, National Bureau of Statistics (DANE) of Colombia.
Table 4 and figure 1 illustrate the trends in household labour income. Overall, the distribution did not vary significantly between 1980 and 1989, but it did fluctuate sharply, since it improved during the period 1980-1984 and worsened in 1984-1989; what is more, this last period includes a subperiod in which an upswing was observed (1985-1987) and another in which a downswing was recorded (1987-1989).
The information on capital rents cannot be compared with the information on labour income. The figures supplied by household surveys do not include retained earnings; hence, in general, the figures on capital gains are underestimates and are not comparable from one survey date to another. The available information on holders of financial claims and shareholders was used to make up for these shortcomings.
The information given in table 5 includes the Gini coefficients for checking accounts, bank-issued time deposit certificates ( c d t s ), savings deposits and constant purchasing-power unit (u p a c ) deposits. The figures show that, in all four cases, 10% of the depositors accounted for over 70% of these savings. Not even deposits in bank savings accounts, whose distribution is the least unequal, departed from this trend; their Gini coefficients were around 0.7.
8 In tens of thousands of Colombian pesos at current prices,
Table 3
COLOMBIA: LABOUR INCOME AS A PERCENTAGE OF GROSS DOMESTIC
PRODUCT AND REAL WAGES IN THE MANUFACTURING SECTOR,
1970-1987
YearLabour income as
a percentage o f GDP
Real wages in manufacturing
(index)
1970 39.0 102.41971 39.7 100.01972 39.3 96.21973 37.8 90.01974 37.2 85.41975 37,8 83.31976 37.1 85.41977 37.1 80.51978 39.7 89.91979 40.9 95.71980 41,6 96.51981 42.8 97.81982 43.1 101.11983 43.9 106.21984 43.4 113.91985 40.6 112.01986 38.2 114.61987 37.1 114.8
Source: National accounts.

148 CEPAL REVIEW No, 48 i December 1992
Table 4
COLOMBIA: DISTRIBUTION OF HOUSEHOLD LABOUR INCOME, BY DECILES OF PER CAPITA HOUSEHOLD INCOME
(Percentages)
Population 1976 1978 1980 1982 1983 1985 1987 1989
0-10 1.60 1.65 1.76 1.74 1.77 1.64 1.89 1.8110-20 2.59 2.78 2.87 2.94 2.99 2.89 3.26 3.0020-30 3.44 3.68 3.68 3.84 3.91 3.80 4.18 3.9130-40 4.33 4.66 4.57 4.77 4.85 4.75 5.14 4.7840-50 5.34 5.65 5.58 5.76 5.91 5.76 6.09 5.7950-60 6.68 6.96 6.86 7.10 7.25 7.07 7.46 7.0360-70 8.59 8.58 8.50 8.72 9.01 8.71 8.97 8.6470-80 11.73 11.29 11.28 11.29 11.71 11.38 11.37 11.1780-90 17.28 16.56 16.31 16.12 16.48 16.09 16.04 15.7590-100 38.42 38.18 38.58 37.72 36.13 37.91 35.59 38.13
100 100 100 100 100 100 100 100
Source: National Household Survey, National Bureau of Statistics (DANE) of Colombia.
Figure 1
COLOMBIA: GINI COEFFICIENTS FOR PER CAPITA HOUSEHOLD
LABOUR INCOME
Source: Table 4 and calculations by the author.
The available figures on business enterprises are even more disconcerting. According to a sampling of 20 firms conducted by the National Securities Commission, 1% of shareholders owned 88% of the stock, and the Gini coefficient
was above 0.9 in this case. This finding fits in with the information gathered by other institutions. In fact, a 1982 study on 72 firms listed on the Bogotá Stock Exchange found that 0.6% of the shareholders owned 80.5% of the stock (Colombia, 1982). It is difficult to imagine a higher level of concentration than this, but the trend is actually becoming more pronounced year by year. Table 6 shows that the Gini coefficient climbed throughout the period 1974-1989, and that between 1982 and 1989 it rose from 0.96 to 0.98, which signifies a state of almost absolute inequality.
Information on property trends is scanty and suffers from a lack of comparability. Even so, it is evident that its distribution became more concentrated during the 1980s. For all practical purposes, it can be assumed that capital rents followed the same pattern.
It is not hard to summarize the above results. Between 1980 and 1984 conditions in terms of social equity did not change significantly. While the shares of labour income and capital rents remained fairly constant, the distribution of labour income improved and that of capital grew worse. Starting in 1984, however, the situation began to change dramatically.

GROWTH AND INCOME DISTRIBUTION IN COUNTRIES AT INTERMEDIATE . . . I E . Sarmiento 149
COLOMBIA: GINI COEFFICIENTS OF CONCENTRATION, BY TYPE OF DEPOSITS IN MAJOR FINANCIAL INSTITUTIONS,
AT YEAR’S END, 1987-1989
Table 5
1987 1988 1989
BanksChecking accounts 0.8816 0.8818 0.8778Savings accounts 0.7016 0.7214 0.7111Term savings certificates (cdats) 0.794
0.7115 0,7205Time deposit certificates (cdts) 0.7523 0.5908
0.6172
Savings and housing loanassociations (CAVsfSavings deposits 0.8342 0.852 0.857Regular deposits 0.6067 0.852 0.857Constant-value savings 0.5892certificates (cavcs) 0.5964 0.6591
Financial institutionsTime deposit certificates 0.7042(cdts) 0.7242 0.7875
Portfolio transactions 0.8214 0.7401 0.8972
Source: Statistics Division, Su per in tendency of Banks of Colombia. * Constant purchasing-power units (UPACs).
Table 6
COLOMBIA: GINI COEFFICIENT OF CONCENTRATION FOR THE 20 MOST
HEAVILY TRADED FIRMS IN 1988, AS OF THE END OF EACH YEAR
Year Gini coefficienta
1974 0.8871978 0.91741980 0.94421982 0.95781984 0.95591986 0.96941988 0.97521989 0.9765
Source: Manual del Mercado Bursátil, Bogoti Stock Exchange, and corporate records, National Securities Commission.
a The coefficient shown for 1974 was calculated on the basis of 18 companies (Compañía Suramericana de Seguros and Proleche were not included).
The relative position of labour income deteriorated vis-à-vis capital rents. The share of the total represented by wage earners’ incomes shrank by about one point per year and that of independent informal groups’ incomes held more or less steady despite the fact that this sector created the most jobs during the period. The household distribution of labour income also worsened, but capital rents climbed sharply. The main beneficiaries were large companies, whose profits jumped from 18% to 22% in four years. For business firms as a whole, the concentration of capital increased considerably.
In sum, income distribution changed radically in the later 1980s. In the last five years, a deterioration in the situation has been observed at all levels. The distribution of labour income worsened and labour’s share shrank rapidly relative to that of capital. Moreover, the increase in capital rents was accounted for almost entirely by large firms, and the concentration of property became more pronounced.

150 CEPAL REVIEW No. 48 1 December 1992
IV
Trends and cycles
Long-term trends in income distribution are related to education, dualism and the concentration of capital. In Colombia, given the situation with regard to these factors, there is little hope of any significant change. Capital has consistently functioned as a factor of concentration. Dualism, for its part, does not appear to have had any major influence, since for the last ten years the Colombian economy has hovered around the cutoff point on the Kuznets curve. Tlie changes in wage dispersion brought about by economic progress have been relatively negligible. In fact, the only force that has systematically promoted an improvement in income distribution is the increase in educational levels and its spread throughout the majority of the population. Unfortunately, the effect of this trend has been reduced by the ineffectiveness of the education provided to low-income groups and the lack of a parallel process of economic development that would provide better jobs for the pool of skilled manpower.
In figure 1, two phases can be detected, with the dividing line between them being the year 1984. In the first of these phases, the distribution of labour income improved and in the second it deteriorated. The same thing occurred with the share of labour income and salaries in the g d p (see tables 2 and 3). This is no coincidence. In 1984 significant changes were made in the management and direction of the Colombian economy. Initially, a harsh adjustment programme was implemented in accordance with International Monetary Fund (IMF) guidelines, and
later various types of measures were adopted in an effort to set up a neoliberal model. More specifically, large devaluations were made, interest rates were kept high, indirect taxes were substituted for income and wealth taxes, and social spending was cut. These adjustments were reflected in declining real wages, the contraction of labour income’s share of g d p , and a worsening of the distribution of labour income.
The behaviour of income distribution confirms some of the statements made on the basis of theory. Long-term trends -which are a function of institutional variables such as education, dualism, demographic trends and the concentration of capital- can be accounted for by changes in the distribution of factors, while medium-term cycles are attributable to changes in factor prices.
Medium-term changes in income distribution have stemmed from macroeconomic variables. The deterioration seen in the late 1980s was closely linked to the implementation of a neoliberal model. Overall, the country’s high interest rates, high exchange rate and indirect taxation were inversely correlated with real wages. The labour market’s performance also had a strong influence on the distribution of labour income.
These adjustment policies and the institution of a neoliberal model were justified on the grounds that they were a means of speeding up growth. Their negative impacts on income distribution prompt us to ask whether there might not be other, less regressive means of accomplishing this. We will attempt to answer that question in the next section.
V
The nature of the conflict
Earlier, we saw how income distribution reacts to the variables associated with trends and cycles. The former include education, the concentration of property and dualism. The latter, on the other hand, are closely related to the labour market. Indeed, real wages are one of the main determinants of income distribution over the medium term. Within this context, the possi
bility of making income distribution more equitable is determined by our ability to upgrade education, cut down on the concentration of property and boost real wages.
This diagnosis is well known, although not in an explicit manner. All these tools have probably been utilized in Latin America in an attempt to improve

GROWTH AND INCOME DISTRIBUTION IN COUNTRIES AT INTERMEDIATE . . . / £ . Sarniento 151
income distribution. Many countries have undertaken various types of reforms to reduce the concentration of property, have instituted large increases in real wages and have broadened the coverage of educational services. Despite all this, they have made little progress in promoting greater equity, partly because many of these measures have led to a slowdown in economic growth or have triggered inflationary processes that ended up hurting the groups they were trying to help.
Table 7, which lists the chief determinants of growth and income distribution, reveals the presence of serious incompatibilities which to some extent confirm our initial statements: an increase in savings is incompatible with déconcentration of property and expansion of social spending, and industrial development based on exports of manufactures is incompatible with an improvement in real wages. Curiously enough, a model based on expansion of savings and exports of manufactures would lead to greater concentration of capital and lower wages.
There are also, however, factors which contribute to both growth and social equity at one and the same time. Perhaps the chief such factor is education. Expanding the coverage of education benefits poorer groups to a greater degree relative to their income, and thus constitutes a continuing force for the reduction of differences in opportunity. In addition, higher levels of education, in conjunction with a type of industrial development that enables an economy to absorb its more highly skilled labour force, raise labour productivity and increase labour’s share of national income while at the same time speeding up economic growth.
Table 7
FACTORS PROMOTING GROWTH AND MORE EQUITABLE
DISTRIBUTION
Growth' Improved income distribution
Savings Déconcentration of property
Technology Technological progress
Education Education
Exports of Higher wages and anmanufactures increase in labour income
as a percentage of nationalincome
Reduction of dualism Increased social spending
Dualism is another pivotal -but in some ways uncertain- factor. In Colombia, the economy is now somewhere near the bottom of the Kuznets curve. The modern sector employs about one half of the labour force, and variations in this respect have only a marginal effect on wage dispersion. In future, everything will hinge upon the nature of the country’s industrial development. If it is concentrated in large firms engaged in highly capital-intensive activities, then dispersion will increase. If, on the other hand, it is carried forward by medium-scale businesses which absorb a large proportion of the modern sector’s labour force, then dispersion will diminish.
VI
Social security
Perhaps the area in which this conflict stands out in sharpest relief is the social security system. One of the main mechanisms of savings creation is the income differential between the younger and older generations and the fact that younger generations devote a smaller share of their income to consumption. This process is seriously disrupted, however, by poorly-designed social security systems that channel the total amount of incoming payments to pensions.
When this is done, retirees’ incomes exceed the sum of contributions, and the difference represents a big loss in terms of savings.
The magnitude of this effect will depend on the size of the inter-generational income differential. If one generation’s income is twice that of the other (which might be considered as a minimum estimate) then the social security system’s implicit effect in terms of savings reduction will be equivalent to about

152 CEPAL REVIEW No. 48 / December 1992
half of the system’s obligated funds. Since these funds represent about 10% of gdp in the Southern Cone countries but only about 4% or 5% in the countries of the North, the cost of social security in terms of savings would amount to about five percentage points in the former and around two points in the latter. Overall figures corroborate these results. Thus, as a rule, an inverse relationship exists between payments into the social security system and saving rates.
Social security’s distributive capacity is unquestionable -in theory. In a growing economy, the older generations receive a lower income during their working life than the younger generations do. Retirement pensions tend to be lower than the active workforce’s wage levels; furthermore, individuals who make use of basic social services, such as health services, are generally disadvantaged in relation to the
rest of the population. In this sense, social security systems are an expression of solidarity that helps to improve the position of society’s underprivileged groups. The end result is quite different, however, in incipient systems that have a very low, single rate of coverage (Colombia’s social security system, for example, covers only 20% of the population). In such cases, the individuals covered by the system come from middle-income groups of skilled workers, civil servants and members of the armed forces, and the services provided by the system are often tailored to fit the requirements of middle-income groups rather than the basic needs of the majority of the population. Under these circumstances, serious doubts arise as to the distributive capacity of social security systems, since the transfers made to beneficiaries mirror the mean distribution of the population.
V II
Latin America’s dilemma
The Latin American economy is faced with a dilemma. On the one hand, countries that take direct action to improve income distribution end up seriously jeopardizing their growth. On the other, countries that increase their saving and exports in order to stimulate growth end up losing ground in terms of social equity.
The cycles observed during the period 1977- 1990 do not provide a great deal of information concerning the relationship between growth and equity in Colombia. Although the economy’s growth was led by savings, the increase in g d p was below its historical average, though that is not the point of conflict. Perhaps the best illustration of what we have been saying is to be found in the information for the period 1984-1990. The neoliberal policies implemented during the latter part of the 1980s heightened inequality without having any significant effect in terms of economic growth. Apparently, the dose of medicine administered to the economy was not large enough (whereas it was sufficient, for example, in the case of Chile). The
stimuli provided for capital, in particular, did not bring about the hoped-for increase in savings which, in combination with exports, would have boosted investment, essential imports and production activity. In order to spur the economy to grow at rates above its historical trend, policy-makers would have had to provide greater incentives for capital and to have allowed income distribution to deteriorate further.
These findings continue to engender skepticism. The market does not resolve the conflict between income distribution and growth. In middle-income economies, the result is low rates of saving and commodity specialization. But traditional sorts of government action have not been at all successful in reconciling these two objectives either. In some cases such action has promoted better income distribution by sacrificing growth, and in others it has stimulated growth at a heavy cost in terms of social equity. Fortunately, some avenues remain to be explored, or at least refined, and it is indeed possible, by means of external action, to reconcile the two objectives.

GROWTH AND INCOME DISTRIBUTION IN COUNTRIES AT INTERMEDIATE. . . /E . Sarmiento 153
VIII
Solutions
The conflict between growth and equity is less severe than is commonly thought. It is true that, within the framework of the usual sorts of market-based approaches, the only way to raise saving would be to permit a deterioration in social equity; if personal saving is interest-rate inelastic, then its expansion will be dependent upon a relative increase in the incomes of the higher-paid groups. But this does not occur within other, broader frameworks. There is evidence that saving is determined by the level of disposable income (Corbo and Schmidt-Hebbel, 1990). If this is so, then a tax increase designed to lower the fiscal deficit would help raise the economy’s overall saving rate.
The conflict’s impact on wages is not clear either. In developing countries, the educational levels of a considerable portion of the labour force are higher than those required in traditional sectors of the economy. If this part of the workforce shifts over into more complex activities, productivity will rise. If the relocated workers are not recompensed for this increase at all, or only in part, then advanced activities can pay wages equal to or higher than those paid by more traditional activities and yet still be paying lower wages than competitor countries are. This better utilization of manpower will thus permit the country to improve its international competitive position without sacrificing past remunerations.
The primary causes of the conflict between growth and distribution have to do with saving and exports of manufactures. In practice, attempts to use market-based measures to raise saving rates lead to a deterioration in income distribution. Similarly, the chances of expanding a country’s exports of manufactures depend on its ability to keep wage levels below those paid by countries with a longer tradition of technological development.
Thus, fiscal policy emerges as an effective means of resolving the apparent conflict between saving and distribution. Since consumption is a function of disposable income, tax hikes aimed at boosting investment or cutting the deficit will lead to an increase in saving. This will not be brought about through a deterioration in income distribution but rather through a reduction in the consumption levels of groups with greater tax-paying ability.
Similar steps could be taken in the area of social security. Expanding the system’s coverage, gearing its services to the satisfaction of basic needs and confining pensions to the poorest groups would help to improve income distribution. At the same time, this would prompt an increase in saving which the public sector could channel to investment or, if it wishes, to the private sector so that it could take charge of pensions above a certain level.
Likewise, education promises to be the principal means of preventing a conflict from arising between higher-technology exports and income distribution. The utilization of the educated labour force in more complex activities would raise productivity while still allowing wages to be kept below international levels in order to offset the disadvantages associated with the country’s technological lag without weakening the position of the sectors in question relative to traditional activities or the past.
The constraints imposed by considerations of social equity are not linear in nature. More rapid growth entails a relative increase in the incomes of younger groups who have a greater saving capacity, as well as facilitating the development of activities that provide greater opportunities for learning and the absorption of technology. Both of these factors help to give policy-makers more leeway in their efforts to correct anti-equity biases.
The experiences of countries with a long history of development confirm the observation that constraints on income distribution are greater during the beginning and intermediate stages of development. Over the long term, progress and modernization help reduce inequality. The progress made by Europe and the United States in the nineteenth century paved the way for their progress in improving social equity during the twentieth century. Hence, suspending economic growth is the worst way to go about improving income distribution, since the end result may be a deepening of inequalities.
Income distribution is affected by negative forces generated by market conditions, rather than by growth itself. Perhaps the most important of these factors is the tendency for capital to become increasingly concentrated. In an economy such as

154 CEPAL REVIEW No. 48 1 December 1992
Colombia's, in which the returns on capital are high and saving rises with the level of income and capital, the greater the capacity for reproducing wealth, the faster its rate of reproduction. The concentration of property generates forces that tend not only to perpetuate but also to heighten that concentration. The other negative force is marginalization. The market does not have the capability to disseminate the benefits of growth throughout the entire population; inevitably, a considerable portion of the populace is bypassed. As we saw earlier, these phenomena tend to be countered by factors such as education, which appears to be the most powerful means of improving income distribution.
It is clear, then, that greater economic growth does not necessarily cause income distribution to worsen and that fiscal policy and education can mitigate possible conflicts between the two objectives.
The chances of making further progress towards a more equitable distribution of income are determined by our ability to modify trends that have an adverse effect in terms of social equity. In principle, high wealth and inheritance taxes and strict antitrust laws can be expected to weaken the forces that promote concentration. Similarly, policies aimed at ensuring the satisfaction of basic needs and eliminating extreme poverty will help reduce marginalization. The next logical question is whether this can be ac
complished without interfering with economic growth and efficiency.
Part of the answer is to be found in the foregoing sections, where it is shown that heavier taxation of high-income groups will boost saving rates. Furthermore, if this is done through the use of wealth and inheritance taxes, then the degree of concentration will diminish.
A somewhat similar approach can be taken to the problems of marginalized sectors. Since higher- income groups have less of a propensity to consume, transfers to poorer groups can be expected to lower saving rates. This will not occur, however, if the vehicle for such transfers is higher income taxes, which usually reduce the consumption levels of high- income groups. Obviously, the success of this approach will depend on our ability to identify the target groups. In practice, the way to do this is to make the transfers in the form of social expenditure, which usually benefits the poorest groups more than would be expected in the light of their contribution to national income. In addition, with the help of appropriate programmes and well-designed follow-up surveys, policy-makers can control how much goes to each income group fairly accurately. Using such methods, they can ensure that the poorest 25% of the population receives 60% of those benefits and that the poorest 50% of the population obtains 90%.
IX
Conclusions
When we compare the experiences of countries with a long history of development and those of Latin America and Asia, we find empirical evidence that the conflict between growth and income distribution varies according to a country's stage of development. In the more advanced countries of Europe and the United States, this conflict was severe during the nineteenth century but abated in the twentieth century as these economies changed over to a knowledge-led model.
The situation in Latin America mirrors, to some extent, the conditions found in the above-mentioned countries in the nineteenth century. In the past 40 years, no country in the region has managed to surmount the conflict between growth and income
distribution. The Asian countries, in contrast, have been successful in moving towards both goals at the same time, thanks to the fact that they started off with relatively equitable conditions and have followed well-planned sequences of measures over extended periods of time.
The foregoing observations have clear policy implications inasmuch as the implementation of effective measures is a crucial factor in reconciling these two objectives in savings-led economies. By the same token, distributive policies cannot remain unchanged in different stages of development.
The history of the developed countries corroborates this analysis of the situation. Generally speaking, they have been modifying their distributive policies
GROWTH AND INCOME DISTRIBUTION IN COUNTRIES AT INTERMEDIATE. . . /E. Sarmiento 155
as they progress towards increasingly knowledge- based models, and in recent years have begun placing less emphasis on progressive tax structures, social security plans and social expenditure. It does not make sense, however, for middle-income countries to follow this same path of change and reform. Their traits and needs are much closer to those exhibited by today’s developed countries at the turn of the century.
It is often believed that economic growth is an obstacle to, or a trade-off of, income distribution. Observations of real-world situations do not bear this out. It has been found that, as a rule, the more advanced a country is, the better its income distribution will be. Theory tells us the same thing: expansion and modernization are in direct conflict only in economies suffering from an extreme case of dualism. From that point on, everything will hinge on the types of policies applied. At intermediate stages of development, the constraints imposed by considerations of equity can be mitigated by proper fiscal management and a strategy based on a combination of education and industrialization. What is more, these constraints tend to subside as countries attain higher growth rates and move on to more advanced stages of development. Finally, the possibility of such a conflict disappears once an economy reaches a stage where its development is based on the conversion of knowledge into technology; at this stage, economic growth and improved income distribution go hand in hand.
The above findings are encouraging, but not surprising. The countries of Asia and of Southern Europe have made advances in terms of both growth
and income distribution. It is usually not a question of choosing between State intervention and the market, since both are equally ineffective in harmonizing these two objectives. In practice, there are various types of State action, and its scope will depend upon the initial conditions and the sequencing of the measures to be applied. For example, in countries which did not carry out agrarian reforms and which lack an educated workforce, more aggressive redistributive policies are called for, and the potential for growth is probably lower. In general, appropriate fiscal policy, industrialization and education can be expected to ease the conflicts. A suitable policy mix involving action on these three fronts will help boost saving and exports of fairly complex manufactures without heightening the concentration of income or lowering real wages.
This conclusion should not come as a surprise to anyone. The Asian countries that have achieved high growth rates in combination with improvements in social equity have high saving rates, high levels of education and have made rapid progress in terms of industrialization. Perhaps the only difference between their policies and what we are proposing here is the tax structure. Many of the Asian countries started off with agrarian reforms that gave rise to a relatively equitable distribution of urban property. Consequently, for them, progressive tax structures were merely a method of sustaining or making a slight improvement in existing trends in the structure of property and income. In Latin America, on the other hand, broader-based action is called for in order to promote a swift change in that structure.
Bibliography
Colombia, Boisa de Bogota (1982): Estructura de accionistas y distribución de acciones de sociedades inscritas, Bogotá.
Corbo, V. and Klaus Schmidt-Hebbel (1990): Public policies and saving in Latin America, mimeo.
ECLAC (Economic Commission for Latin America and the Caribbean) (1992): Social Equity and Changing Production Patterns: An Integrated Approach(LC/G.1701), Santiago, Chile, 6 February.
Williamson, Jeffrey (1991): Inequality, Poverty and History, Cambridge, MA, Basil Blackwell.


CEPAL REVIEW No. 48
Monetary policy and an open capital account
R oberto Zahler*
In this paper the author analyses some of the difficulties encountered by monetary authorities when they are operating in a situation of international capital mobility; more specifically, he focuses on how two of their monetary policy objectives -controlling inflation and maintaining a stable exchange rate- may conflict.
It is generally agreed that a Central Bank’s main objective is to control inflation. In fact, the organizational modalities and monetary policies of Central Banks around the world are, in large part, a function of their efforts to find the best way of doing just that. However, despite the fact that this objective takes precedence over other goals, it would be erroneous to assume that price stability is a Central Bank’s only aim. Monetary authorities are often assigned other tasks as well; perhaps the most important of these is maintaining a stable exchange rate, but they may also include contributing to the achievement of a high and sustainable growth rate, ensuring the solvency of the financial system, and seeing to it that internal and external payments proceed normally. Obviously, these aims are not only related to the Central Bank's objective of curbing inflation, but are also interrelated. Thus, monetary policy constitutes a promising area of research, since fully satisfactory answers to many key questions in this field are still lacking.
This article does not seek to undertake a comprehensive analysis of the subject, but only to offer a number of ideas and suggestions regarding the assessment of Central Bankers’ policy options with a view to contributing to a more in-depth study of this topic.
*The author is President o f the Central Bank o f Chile. This article is based on a paper presented at the Fifty-fourth Meeting of Central Bank Governors o f Latin America and Spain (San Salvador, 5 May 1992). The author wishes to thank Rodrigo Vergara for his valuable assistance in its preparation.
Monetary policy in the absence of international capital
mobilityBefore proceeding to the analysis of the main topic of this article -i.e., monetary policy features and constraints within the context of an open capital account- it is important, from a methodological standpoint, to make a few observations about monetary policy outside of that context, since this will make it easier to understand the chief types of difficulties that arise when a country opens up its economy to international capital markets.
It is well known that in order to reduce inflation, over the long term it is necessary for the Central Bank to keep the growth of the monetary aggregates under strict control. The situation is complicated, however, by the instability usually displayed by the demand for money. If the demand for money is unstable, then a monetary policy that sets rigid targets for the growth of monetary aggregates in the short term will lead to sharp fluctuations in the interest rate, which will hurt both investment and the level of economic activity. It is precisely the short-term instability exhibited by the demand for money in various countries during the past decade that has given rise to a widespread tendency to employ a monetary policy strategy based on interest rate targets.
The unstable nature of the demand for money has been attributed to such factors as technological innovations in the financial market, the deregulation of that market starting in the late 1970s (Goldfeld, 1976; Judd and Scadding, 1982) and sharp swings in the cost of maintaining money holdings owing to a highly volatile inflation rate in the short term.1
In a monetary policy based on interest rate targets, interest rate guidelines are based on considerations of internal equilibrium (the desired inflation rate), and monetary aggregates essentially become
I
1 Strictly speaking, this last situation has to do with the instability exhibited by one of the arguments of the money demand function rather than the function itself.

158 CEPAL REVIEW No. 48 1 December 1992
endogenous.2 In this case, monetary figures are not an intermediate goal but rather a monetary policy indicator. In other words, short-term monetary trends are not a goal in themselves; instead, a very sharp increase in this variable is regarded as an indication, or even an alarm bell, that aggregate demand is growing very rapidly and that the economy therefore runs the risk of exceeding its targeted inflation rate.
Under these circumstances, the monetary authority can counteract inflationary pressures with an increase in the market’s interest rates, which it can bring about by raising the discount rate or the interest rate for open-market operations. The increase in the interest rate discourages expenditure on both investment and consumer goods, thereby easing
inflationary pressures. If the economy is showing signs of weakening and there are no inflationary pressures, then the same procedure can be used, but in reverse (the interest rate can be lowered).
Finally, mention should be made of the fact that, following the monetarist experiments of the early 1980s and in response to the increasingly compelling evidence that there is no stable relationship between money and nominal income, most of the countries have switched from a monetary policy based on targets for monetary aggregates to one based on interest-rate targets.3 Chile is no exception. The marked instability exhibited by the demand for money in Chile in the short term has made it advisable to base its monetary policy on interest rates.4
II
Monetary policy in the context of international capital mobility
1. Some thoughts regarding the costs and benefits o f opening up
the capital account
Opening up the capital account presents the monetary authority with a policy dilemma. In order to gain a better understanding of this situation, it would be well to start out with a brief discussion of the costs and benefits of this step. In the following analysis, we will assume that the opening of the capital account leads to a net inflow of capital, i.e., that the domestic interest rate, adjusted to take into account expectations of a devaluation and the risk involved in investing in the relevant country (country risk), is higher than the external rate. This assumption is made on the basis of the experiences of Chile, other Latin American countries, European nations such as Spain and Portugal, and others during the past few years.
2 The literature regarding optimum monetary policymaking has its origins, at least in a strict sense, in a well-known article by Poole (1970). Since that time, a large body of literature on the subject has been formed. Particularly noteworthy writings in this area include articles by B. Friedman (1975 and1988), Sargent and Wallace (1975) and McCallum (1981, 1985,1988 and 1990).
In a static model free of market imperfections, opening up the capital account is highly beneficial
Actually, it would not be accurate to say that the monetary policies of most of the countries are interest-rate policies in a strict sense. It would be more accurate to say that their main focus, at least in the short term, has shifted from control of monetary aggregates to interest rate targets. A good summary of monetary policy-making in the main industrialized countries may be found in Batten, Blackwell, Nocera and Ozeki (1989).
4 One of the main criticisms made of monetary policies based on interest rate targets is that the lack of a nominal "anchor” will lead to price indeterminacy. This is demonstrated quite thoroughly in a well-known article by Sargent and Wallace (1975). The main idea is that, since the money supply reacts passively to the demand for money, any inflationary expectations will be validated by the monetary authority. Thus, if expectations of inflation increase, private agents will act in accordance with that new level of expectation, and the Central Bank will provide the larger nominal quantity of money demanded by economic agents, thereby bearing out their expectations of higher inflation. McCallum (1981) disputes this finding, arguing that it is valid only if the interest rate is set at random, as is assumed by Sargent and Wallace. If the interest rate is set on the basis of some specific criterion, then the price indeterminacy disappears. Strictly speaking, if there is some rule for the interest rate, then a new equation is being introduced into the system, which would then give a single solution. In the case of Chile, for example, domestic macroeconomic equilibrium is the criterion used in setting the target level for the interest rate, and this, as noted above, can be expected to result in a given rate of inflation.

MONETARY POLICY AND AN OPEN CAPITAL ACCOUNT / R, Zahter 159
because it makes it possible to diversify risk and finance more investment, as well as replacing relatively expensive domestic savings with less expensive external savings. In other words, it makes the allocation of savings and investment resources more efficient. The problem with this approach is that it overlooks the costs associated with the transition (which may take quite a long time) from a state of equilibrium with a closed capital market to a similar state with an open capital market. The following analysis of these costs suggests that although it is desirable to move towards a more open capital account, we must be very careful when choosing the specific method of doing so and determining its pace, with a gradual movement in this direction appearing to be the most reasonable avenue to take. The experiences of a number of Latin American countries in the early 1980s are instructive. Indeed, in many cases, the external and domestic debt crises were associated with indiscriminate liberalization of regulations pertaining to external borrowing. In contrast, most of the member countries of the European Economic Community (e e c ) chose to open up their capital markets gradually, and gave themselves ample time to work up to total deregulation.
When the capital account is opened up, the domestic interest rate tends to descend until it is on a par with the going rates on the international market. 5 This raises investment and reduces domestic saving, which will then be reflected in a larger current account deficit on the balance of payments. The size of this deficit will depend on how large the spread between domestic and external interest rates was before liberalization and on how sensitive saving and investment are to interest-rate variations. The problem is that, if the capital market is opened up very rapidly and this precipitates a massive inflow of capital, the deficit on current account may reach untenable proportions in the medium term. If this occurs, then sooner or later -but probably sooner- the level of risk (country-risk) or expectations of a devaluation of the local currency will increase, and the capital flow will reverse direction and throw the country into a deep recession. In short, the monetary authority must make sure that the opening of the capital account does not produce a deficit on current account that
SA more detailed examination of arbitrage between domestic and external rates which takes expectations of devaluation and country-risk into consideration is presented in section 2.
cannot be sustained in the medium term, since this will not only have adverse consequences for real economic activity later on (when the net inflow of capital dries up) but will also often trigger an overreaction against the liberalization policy which will ultimately throw the entire process into reverse. It is therefore highly likely that if financial liberalization is carried out too hastily, the end result will be just the opposite of what was sought; in other words, the economy’s capital account will be more tightly closed than ever.
The statement that when the capital account is opened up, domestic and external interest rates tend towards equality often does not take into account the differing degrees of tradability of the various financial and real domestic assets or the fact that, unless there is a strong, across-the-board increase in investment, their “equality” may be achieved at the cost of sharp changes in domestic prices, 6 In a nutshell, a massive inflow of capital also exerts upward pressure on the prices of domestic assets. It is not at all uncommon for rising property, land and stock prices to be the first sign that a country is beginning to receive large amounts of foreign exchange in the form of massive capital inflows. This generates a wealth effect that further spurs consumption, thereby increasing the deficit on current account and, thus, the probability that the country will be faced with balance-of-payments problems in the future.
Clearly, however, a number of these arguments require some qualification. For example, the probability of a future balance-of-payments crisis is lower if saving is not very sensitive to the interest rate and the above-mentioned wealth effect is not produced. In this case, domestic saving would be affected only minimally, and the likelihood of a significant current account deficit on the balance of payments would be reduced. Hence, it is advisable to provide incentives to boost domestic saving during the liberalization process. Furthermore, if, in addition to complementing domestic saving, capital inflows help to increase production capacity -particularly in sectors producing internationally tradable goods- then the country will be covering itself in the event of a subsequent decline in capital inflows, and this too would reduce the probability of future balance-of-payments difficulties.
6 For a thorough explanation of this point, see Zahler and Valdivia (1987).

160 CEPAL REVIEW No. 48 iDecember 1992
It should be emphasized that these arguments do not invalidate the liberalization of the capital account. Rather, they merely point out that, while it is desirable for the country to establish an increasingly solid position for itself in international financial markets, it is crucial for policy-makers to understand that the success of this process depends, to a large extent, on their ability to avoid generating major disruptions in the national economy; consequently, financial liberalization must be carried out both carefully and gradually.
2. Monetary policy
When a country is opened up to international capital flows, the monetary authority’s ability to control interest rates and to use them to curb excess expenditure is reduced. This is because, if the domestic interest rate (defined as the rate which ensures that domestic spending will be in keeping with the targeted inflation rate) is higher than the external rate, an inflow of capital will be generated that will increase the economy’s liquidity and thus push down the interest rate, which will in turn lead to increased spending; as a result, the country may fail to achieve its inflation-control target. Moreover, the influx of capital will bring down the real exchange rate, paving the way for a larger current account deficit (which is the counterpart of a capital inflow). Of course, in order to keep inflation under control, the monetary authority may prevent the interest rate from dropping by sterilizing the incoming stream of foreign exchange; to do so, the Central Bank must be willing to buy up huge amounts of foreign exchange, or else allow the real exchange rate to fall. Obviously, the authority can also opt for a combination of sterilization and currency appreciation. If this last option is chosen, it should be borne in mind that very gradual adjustment of the exchange rate may generate expectations of a revaluation. As will be discussed later on, such expectations tend to exacerbate the problem even further.
Before moving on, we need to clarify the relationship between interest rate arbitrage and capital flows. To this end, the relationship may be presented in mathematical terms:
i = i* + E, (dev) + p (1)
where i is the nominal domestic interest rate, i* is the external rate, Et (dev) is the expectation of a
devaluation in percentage terms during period t, and p is a measure of country risk. The same equation expressed in real terms is:
r = r* + E, (dep) + p (2)
where r represents the real domestic interest rate, r* the real international interest rate, and Et (dep) the expectations of a real depreciation of the local currency.
Capital will flow into the country if the domestic interest rate is higher than the external rate after it is adjusted for expectations of devaluation and country risk, i.e., if the value on the left side of the above equations is greater than the right side. In other words, capital will enter the country if expected financial returns, adjusted to take account of the risk of investing in the country in question, are higher than the expected returns on investment in the source country. The combination of a rise in the domestic interest rate, reduced country risk, a drop in international interest rates or expectations of a currency revaluation (in response to improvements in the country’s external accounts or because it is believed that the exchange rate will be used as an anti-inflationary tool, for example) will boost capital inflows by making it more profitable to invest in that country.
It is now easy to appreciate the policy dilemma confronting the Central Banker who, on the one hand, has an objective of reducing inflation and, on the other hand, has an objective relating to the real exchange rate. If the interest rate that would be in line with his inflation target is higher than the international rate, then the resulting capital inflow will cause the real exchange rate to fall, thereby jeopardizing his achievement of his exchange-rate target. If the domestic interest rate is allowed to drop, then the attainment of both objectives is jeopardized, since the increased spending prompted by that lower rate will push up prices and push down the real exchange rate.
We might then ask ourselves: Why worry about the real exchange rate? Why not simply let it fall to a level where growing expectations of devaluation or increased country risk will offset the spread between domestic and external interest rates? The answer has to do with the types of forces that are producing the inflow of capital and, hence, the drop in the real exchange rate. If we were dealing with structural forces -such as a permanent improvement in external trade accounts, a change in the trend of foreign direct investment in the country, or greater access on a more

MONETARY POLICY AND AN OPEN CAPITAL ACCOUNT / R, Zahler 161
stable and sustained basis to international capital markets (due, for example, to political changes)- tben it would make no sense to cling to a real exchange rate above the new equilibrium level. However, if the forces stimulating an inflow of external resources -and the resulting drop in the real exchange rate- are of a temporary nature, then the situation is different. This is because the volatility of a key price such as the real exchange rate generally has an adverse effect on the inflation rate, trade flows and investment, due to the uncertainty it creates. In turn, lower levels of investment and trade have an adverse impact on the growth of the economy as a whole. Thus, it is better to smooth out movements in the real exchange rate that are transitory and will therefore be reversed in the near future. In support of this conclusion, it should be noted that there is abundant empirical evidence concerning the negative effects which exchange rate volatility has on investment.7 In any event, it is clear that the more developed a capital market’s hedging instruments are (options, futures, mutual credits), the less of a role the Central Bank will play in stabilizing the exchange rate, since the existence of such instruments enables private agents to protect themselves against unexpected fluctuations in the dollar on their own.
A word should also be said about the importance of the elasticities of external accounts (exports and imports) relative to the real exchange rate. In countries which primarily export raw materials and import capital goods, the trade balance will usually be fairly inelastic to the real exchange rate. A very sharp drop in the real exchange rate may therefore be required in order to stop excess foreign exchange from flowing into the country. In this case, the instability of the exchange rate and the negative impact on real economic activity will both be greater.
From a macroeconomic perspective, the consequences of an “excessive” inflow of capital on the level of the real exchange rate may be even more serious than the effects of greater exchange-rate volatility. If the exchange rate remains below equilibrium for too long, it will have at least two undesirable effects. First, the tradables sector of the economy may be hurt. As is well known, many of the economies that have met with success in recent years (especially the smaller ones) have based their
7 For a synthesis of the literature on the subject, see Servén and Solimano (1992).
development on the growth of their export sectors. This sector has been the leader of progress and of technological innovation in these countries and, as a result, has become a mainstay of their growth. An appreciated currency, if it remains so over a long period of time, can push businesses into bankruptcy and discourage investment in that sector, thereby slowing down development. Second, as mentioned earlier, sooner or later the value of the dollar can be expected to return to its long-term equilibrium level (or perhaps even climb above that value for a time), which will put pressure on prices and thus reduce the chances of keeping inflation under control.
It is worth taking a moment here to think about the nature of the exchange rate’s short-term deviations from its long-term level. We saw earlier that this constitutes grounds for intervention by the monetary authority, but how can the market err in determining what the long-term level of the exchange rate should be? If the long-term rate is higher than the short-term rate, then why is it that speculators do not buy foreign exchange in expectation of a rise in the exchange rate? Such action on the part of speculators would have a stabilizing effect, since it would cause the spot exchange rate to rise. There are at least two different answers to these questions. First, it could be argued that the market has less information than the monetary authority does. The Central Bank has more reliable balance-of-payments and capital-flow projections and, even more importantly, it knows for certain what it is going to do in the future. These projections give it a more accurate idea of exactly where the long-term equilibrium level for the real exchange rate is. Second, the speculator’s planning horizon is quite short. Speculators may believe that the exchange rate is going to climb within the next year, but what really concerns them is what it is going to do within the next month or the next few weeks. Hence, in the presence of an interest rate spread, they will continue to bring short-term capital into the country, thereby generating pressure for an appreciation of the currency in the immediate future. This type of situation is analogous to a speculative bubble. The price of domestic assets is temporarily higher than their underlying value. Speculators know this, but all that matters to them is that the bubble should not burst until they have completed the speculative transaction in question.
Although it is true that the monetary authority may have more information than is available to the market, however, its information is still limited, and

162 CEPAL REVIEW No. 48 / December 1992
holding on to a single exchange rate can therefore be dangerous. Instead, it may be best to use a currency band based on a benchmark exchange rate, such as those used by the European Monetary System.
If it is better to avoid temporary fluctuations in the real exchange rate, then the next question is: How can this be done without compromising efforts to hold inflation to its target level? One option might be to find a way of boosting domestic saving. A higher rate of saving makes it feasible to keep interest rates at a lower level, which will discourage capital inflows and thus forestall revaluation of the currency. However, although raising saving rates is certainly an attractive option and everything possible should be done to implement it, we also have to be realistic. Private saving’s response time is usually quite long, and it is therefore difficult to base the attempt to smooth out temporary exchange-rate fluctuations on this variable. Public saving might be a more suitable tool, but in many cases it is also quite difficult to change a budget once it has been passed by Congress. Furthermore, many budget items are quite inflexible, at least in the short run. Nor is it certain that it would be wise to alter the policy on fiscal expenditure in order to address a temporary phenomenon. In addition, the fiscal saving effort necessary to sustain a change of a few points in the real exchange rate may be politically and economically unfeasible. Finally, it should be noted -since we are talking about Central Banks- that fiscal savings measures are not decided by the monetary authority. Be that as it may, the important point is that if some way could be found to encourage national saving (private or public), the equilibrium level of the real exchange rate would be higher not only in the short run but also in the long term (or, at least, for as long as the higher saving rate is maintained). Thus, a policy aimed at raising saving rates will also have a positive impact in terms of monetary policy management, since it will give the authorities more leeway in their management of interest rates (and, thus, of aggregate domestic demand) without generating wide swings in the real exchange rate.
Another option that is often mentioned is the possibility of reducing tariffs in order to increase the demand for imports. Tariff policy should be based on a trade, taxation and long-term development strategy, however, not on cyclical circumstances. This is not to deny the importance of keeping tariffs low as a means of improving the system of resource allocation and contributing to the country’s growth; rather, all
that is being called into question here is the wisdom of modifying a country’s tariff policy in order to deal with a temporary oversupply of foreign exchange. Much the same can be said of proposals that the liberalization of the capital account should be hastened in order to facilitate an outflow of foreign exchange. Those who make such proposals have often forgotten that the scope and pace of the capital market’s liberalization should be determined on the basis of the development strategy and considerations of micro- economic efficiency (e.g., risk diversification) rather than transitory phenomena. On the other hand, a decision to ease restrictions on outbound capital flows as a way of dealing with an oversupply of foreign exchange will provide greater security for inflows of external financing. Consequently, the net effect on the exchange market of a move towards financial liberalization is uncertain.
Another option is for the Central Bank to buy up the foreign exchange as it enters the country and sterilize it through the sale of domestic debt. In fact, this is the most natural course of action when dealing with a temporary inflow of capital. However, the situation can become quite difficult if the sums involved are large and if the inflow lasts for longer than was initially projected. Under such circumstances, this type of intervention can siphon off a considerable portion of the Central Bank’s reserves. This happens because the Central Bank will invest this foreign exchange at the international rate on deposits, which, given the nature of the problem being addressed, is necessarily lower than the rate at which the Bank could place its domestic debt; in other words, the cost of the money is higher than its returns. These losses, which are part of what is known as the quasi-fiscal deficit, constitute dissavings for the public sector as a whole; they therefore lead to an increase in domestic spending, along with the inflationary pressures that entails. Moreover, if the loss sustained by the Central Bank is too large, it may compromise the Bank’s monetary policy in the future, when the time comes to service the debts it has incurred. If the Central Bank’s domestic debt should become so large as to threaten its solvency, then the Bank would be unable to place any more non-monetary debt. At that point, only two options would be left: fiscal support or higher inflation.
The Central Bank’s position becomes even more difficult if there are expectations of a revaluation. When it steps into the market to buy up foreign exchange, the Central Bank prevents the exchange rate

MONETARY POLICY AND AN OPEN CAPITAL ACCOUNT / R. Zahler 163
from dropping. However, if the situation is prolonged or if it seems likely that lasting changes have taken place in the exchange rate’s equilibrium level, then economic agents will begin to expect a revaluation. These expectations tip the arbitrage balance even further towards an increased capital inflow, since an expected revaluation lowers the expected cost of foreign borrowing, which spurs capital inflows. It also reduces the Central Bank’s ability to manage the interest rate and, hence, inflation. If, for example, the level of expenditure is felt to be too high, then the logical thing to do would be to raise the interest rate. However, this would further stimulate the inflow of capital. A drop in the interest rate, on the other hand, would help resolve the arbitrage problem, but it would also heighten domestic inflationary pressures. In essence, then, the problem faced by a Central Bank when it opens up the capital account is how to reconcile two objectives: controlling inflation and holding the real exchange rate within a specified range.
Clearly, it is a complex situation. The Central Bank sees its ability to conduct monetary policy diminishing at the same time that, in order to prop up the real exchange rate, it may be building up its reserves to higher levels than it would like. As we have already said, given the temporary 8 nature of the situation, it would not be wise to permit the exchange rate to fall so far that capital has no incentive at all to flow into the country. However, it would not be wise to lose control over short-term monetary policy either. This is why the countries that have found themselves in this situation have chosen to use a series of measures to discourage the inflow of shortterm capital -which is attracted primarily by interest rate differentials- and thus increase their control over monetary policy.
These measures seek to even out the cost of credit for all economic agents, which entails raising the cost of borrowing in foreign currency in order to discourage the inflow of capital. The most typical measures of this sort involve taxing or increasing the
oOf course, it is not so easy to tell the difference between
temporary and lasting changes, and this usually complicates the situation. If the Central Bank feels it is witnessing a temporary phenomenon, then it should defend the exchange rate. If, however, the market feels there is some significant probability that this situation is not transitory, then speculators will act on the assumption that a revaluation is likely, and this, as noted earlier, makes it even more difficult to manage the monetary variables.
reserve requirements of foreign-currency lenders. Raising the cost of external credit will narrow the spread between domestic and external interest rates, thereby slowing the inflow of capital. In effect, this places a “wedge” between the two interest rates which gives monetary policy-makers some ma- noeuvering room without forcing them to sacrifice their objective in regard to the exchange rate. In terms of the arbitrage equation:
i = i*(l + t) + Et (dev) + p (3)
where t represents the reserve requirement applying to external finance.
It should be noted that, by raising the international interest rate applicable to domestic economic agents, the establishment of reserve requirements for external credits tends to bring the external and domestic interest rates into line with one another. This restores control over monetary policy and, therefore, over inflation. Thus, as was said earlier, if the monetary authority allows capital to flow into the country unchecked, it is in effect applying the international interest rate to the domestic economy. However, this rate may not be consistent with the economy’s target inflation rate if it will cause consumption and investment to expand faster than aggregate supply. Applying a reserve requirement to external credits is one way that the monetary authority can raise the domestic level of the international interest rate and thus dampen inflationary pressures without having to buy up huge quantities of foreign exchange or allow the currency to appreciate sharply in real terms.
Although the main objective of a measure such as this is to control inflation, it also has desirable effects on the exchange rate. This is because when the cost of external borrowing rises, the inflow of capital will diminish, thus causing the exchange rate to climb -or to fall more slowly. Actually, the two effects are part of the same process, since a decrease in the inflow of capital helps to reduce aggregate demand (by undermining the viability of a lower interest rate) and to raise the exchange rate.
Another advantage of measures such as the institution of reserve requirements on external finance is that they give policy-makers time to decide whether a situation or event is temporary or permanent. It is obviously quite difficult to distinguish one from the other in many cases, and therefore the

164 CEPAL REVIEW No. 4H i December 1992
monetary authority usually needs time to obtain more precise information and analyses. For example, an increase in the flow of external financing may be due to the fact that the country is perceived as being in a better position than before -which could mean that it will receive a greater inflow of capital on an ongoing basis- or to a short-term circumstance, such as an interest rate spread, which cannot be expected to last. In the first case, the monetary authority should not try to prop up the exchange rate; in the second case, it should try to do so because it is dealing with a one-time situation. But how is it to know beforehand whether it is witnessing a permanent flow of external resources or simply a temporary movement? If the monetary authority regards short-term fluctuations in the exchange rate as undesirable, then it should wait, gather more information and see how events unfold before deciding what course of action to take in regard to the exchange rate. Once the Central Bank has a clear picture of the situation, it will be in a better position to take the appropriate steps.
Yet another advantage of reserve requirements for external finance is that they allow the monetary authority to draw a distinction, at least to some degree, between short- and long-term capital. Reserve requirements may be set for short-term capital flows while long-term capital is exempted, since the capital flowing into a country on a temporary basis due to interest rate differentials is essentially short-term capital; in other words, it may flow back out of the country at any time, especially if it is felt that conditions are about to change. This is the type of flow that destabilizes the exchange rate and that should therefore be discouraged. Long-term flows are, by definition, of a more permanent character and for that reason it is not in a country’s interest to hinder them. In practice, however, it is difficult to exempt longterm capital entirely, because a typical method of evading such requirements is to “disguise” short-term capital as long-term capital when it first enters a country. One way of dealing with this problem is to apply different marginal reserve requirements to holdings of differing terms. The longer the term, the lower the reserve requirement. The benefit of this method is that it limits the “leakages” from this mechanism; its cost is that truly long-term capital is also subject to the reserve requirement (although the average rate decreases as its term increases).
Reserve requirements and taxes on incoming capital also have other costs, however. First of all, the
practical experience of a number of countries indicates that the effect of this type of measure declines over time because the market slowly but surely finds ways of evading the higher cost of foreign-currency finance. One method of evasion is simply not to declare the external credit. The cost of this form of evasion will depend on the nature of the regulations and controls that are in place in the exchange and financial markets, but some leakage is inevitable. The longer a reserve requirement or other type of levy is in effect, the more ways of evading it are devised. The monetary authority must therefore be on the watch for them so that they can be prevented or, if possible, forestalled.
Second, reserve requirements or taxes have microeconomic costs because they make credit more expensive for domestic businesses and residents of the country. The basic (macroeconomic) rationale in respect of these mechanisms, however, is that the benefits of a more stable exchange rate (and, thus, of the maintenance of a deficit on current account in the medium term) and of a more satisfactory form of monetary management outweigh the above-mentioned costs.
Before drawing this discussion to a close, something should be said about the interest rate structure. Up to now, we have been talking about the interest “rate”, in the singular. This rate, as mentioned earlier, influences both aggregate demand and capital flows. It is important to realize, however, that the interest rate which affects aggregate demand is not the same rate that affects speculative capital flows. Speculative short-term capital reacts to the spread between shortterm domestic and external interest rates, since over longer periods the level of exchange risk will be very high. Aggregate demand, on the other hand, largely acts in response to the long-term interest rate. Considered in this light, the monetary authority’s dilemma in choosing whether to control inflation or the real exchange rate would appear to have a ready solution. In the presence of inflationary pressures, the authority should simply take steps to raise the longterm interest rate while keeping the short-term interest rate low. The high long-term rate would dampen aggregate demand, while the low short-term rate would discourage the entry of short-term capital. The problem with this, of course, is that the monetary authority cannot shape the interest rate structure exactly as it pleases, if the authority tries to push up long-term rates, short-term rates will inevitably rise
MONETARY POLICY AND AN OPEN CAPITAL ACCOUNT / R, Zahter 165
along with them to some extent. A tight monetary policy, for example, tends to produce an across- the-board increase in interest rates. Depending on expectations about the future and the size of the liquidity premium, it may well be the market, rather than the Central Bank, that will determine the slope of the interest rate’s return curve. Clearly, if the Central Bank could “shape” this return curve, it
would increase its monetary policy ’s degrees of freedom. Experience generally indicates, however, that little can be done in this respect and whatever action can be taken is unlikely to have a lasting effect. This leads to the conclusion that, in dealing with the type of problem being considered in this article, there is some justification for referring to the interest “rate” rather than “rates”.
I ll
Concluding remarks
The aim of this article has been to underscore some of the problems confronting a country’s monetary authority when the economy is wide open to external financial flows. Specifically, we have analysed what happens when a conflict arises between two of the Central Bank’s objectives: controlling inflation and maintaining a stable exchange rate. This dilemma is of increasing importance today since the countries of the region are receiving large amounts of foreign exchange in the form of repatriated capital at the same time that they are gaining -in some cases quite rapidly- increasing access to various sorts of voluntary external financing (although this does seem to be more volatile than in the past) and experiencing heavy inflows of capital in response to the extraordi
narily low interest rates being registered in the United States economy.
Opening up the capital account deprives the monetary authority of a degree of freedom in that the domestic interest rate cannot be very different from the external interest rate after adjusting it for expectations of devaluation. In this article we have discussed the problems this raises in terms of exchange policy, as well as the costs and benefits of various ways of recovering that lost degree of freedom. We have also analysed the costs and benefits of opening up the capital account and have suggested that a gradual approach in this area is preferable to hasty, unplanned processes which generally end in resounding failure.
Bibliography
Batten D ., M. Blackwell, I. Kim, S. Nocera and Y. Ozeki (1989): The Instruments and Operating Procedures for Conducting Monetary Policy in the Group o f Five Countries, IMF Working Paper (WP/89/57), Washington, D.C., International Monetary Fund, Treasurer’s Department, 21 July.
Friedman, Benjamin (1975): Targets, indicators and instruments of monetary policy, Journal of Monetary Economics, Amsterdam, North-Holi and Publishing Company, October.
(1988): Monetary policy without quantity variables,American Economic Review, vol. 78, No. 2, Nashville, TN, American Economic Association, May.
Goldfeld, Stephen (1976): The case of the missing money, Brookings Papers on Economic Activity, No. 3, Washington, D.C., The Brookings Institution.
Judd, John and John Scadding (1982): The search for a stable money demand function: a survey of the post- 1973 literature, Journal o f Economic Literature, vol. 20, No. 3, Nashville, TN, The American Economic Association, September.
McCallum, Bennett (1981): Price level determinacy with an interest rate policy rule and rational expectations, Journal of Monetary Economics, vol. 8, No. 3, Amsterdam, North-Holi and Publishing Company, November.
(1985): On consequences and criticisms of monetarytargeting, Journal o f Money Credit and Banking, No. 17, Columbus, OH, Ohio State University Press, November.
— (1988): Robustness properties of a rule for monetary policy, Carnegie Rochester Conference Series,
166 CEPAL REVIEW No. M l December 1992
vol. 29, Amsterdam, North-Hoiland Publishing Company, Fall.
(1990): Targets, indicators, and instruments ofmonetary policy, IMF Working Paper, Washington, D.C., International Monetary Fund, Research Department, April.
Poole, William (1970): Optimal choice of monetary policy instruments in a simple stochastic macro model, Quarterly Journal o f Economics, vol. 84, No. 2, Cambridge, MA, The President and Fellows of Harvard College, Harvard University, May.
Sargent, Thomas and Neil Wallace (1975): Rational expectations, the optimal monetary instrument, and the
optimal money supply rule, Journal o f Political Economy, vol. 83, No. 2, Chicago, IL, The University of Chicago Press, April.
Servén, Luis and Andrés Solimano (1992): Private investment and macroeconomic adjustment: asurvey, The World Bank Research Observer, No. 7, Washington, D.C., World Bank, January,
Zahler, Roberto and Mario Valdivia (1987): Asimetrías de la liberalización financiera y el problema de las deudas interna y externa, C. Massad and R. Zahler (eds.), Deuda interna y estabilidad financiera, Buenos Aires, Grupo Editor Latinoamericano.

G uidelines for contributors to CEPAL Review
The editorial board of the Review are always interested in encouraging the publication of articles which analyse the economic and social development of Latin America and the Caribbean. With this in mind, and in order to facilitate the presentation, consideration and publication of papers, they have prepared the following information and suggestions to serve as a guide to future contributors.
—The submission of an article assumes an undertaking by the author not to submit it simultaneously to other periodical publications.
—Papers should be submitted in Spanish, Portuguese or English. They willbe translated into the appropriate language by e c la c .
—Papers should not be longer than 33 double-spaced letter-size pages (USquarto), but shorter articles will also be considered. The original and one copyshould be submitted, as should the diskettes, if any (in ibm or compatible WordPerfect format).
—All contributions should be accompanied by a note clearly indicating the title of the paper, the name of the author, the institution he belongs to, and his address. Authors are also requested to send in a short summary of the article (no more than 250 words) giving a brief description of its subject matter and main conclusions.
—Footnotes should be kept to the minimum, while bibliographical references and direct quotations should be carefully checked, since they are the responsibility of the author. It is also recommended that the number of tables and figures should be reduced to the minimum and that they should not duplicate information given in the text.
—Special attention should be paid to the bibliography. All the necessary information must be correctly stated in each case (name of the author or authors, complete title (including any subtitle), publisher, city, month and year of publication and, in the case of a series, the title and corresponding volume number or part, etc.).
—The editorial board of the Review reserve the right to make any necessary revision or editorial changes required by the articles.
—Authors will receive a courtesy copy of the Review in which their article appears, plus 30 offprints of the article, both in Spanish and in English, at the time of publication in each language.


Recent ECLAC publications
Siglas latinoamericanas (I^tin American acronyms) (LC/G. 1727), Santiago, Chile, April 1992,379 pages.
This third edition has been prepared by the Library of the Economic Commission for Latin America and the Caribbean as a contribution to greater familiarity with Latin American institutions, in view of the extensive use made of this information in the region.
The information is presented in two sections, the first of which lists the acronyms in alphabetical order with the full titles of the institutions and, when necessary, their geographical location, while the second section gives a list of the bodies included, with their acronyms.
Although the listing of the acronyms in use in Latin America and the Caribbean is a constant concern of the ECLAC Library, this publication does not pretend to be exhaustive, and in future editions the Library will include entries from institutions which wish to contribute to this work.
Comercio intrazonal de ios países de la Asociación Latinoamericana de Integración, según capítulos de la Clasificación Uniforme para el Comercio Internacional, Revisión 2 (Intra-area trade of the member countries of the Latin American Integration Association, by divisions of the Standard International Trade Classification, Rev.2) (LC/G.1697-P), “Cuadernos Estadísticos de la COPAL” series, No. 17, Santiago, Chile, May 1992, 299 pages.
The economic integration of the countries of the region is a matter of permanent interest. Since the early 1960s, with the establishment of the Latin American Free Trade Association (LAFTA), subsequently replaced in 1980 by the Latin American Integration Association (ALADI), up to the recent agreement to form a Southern Common Market (MERCOSUR), various integration schemes have been tried out.
Measurements of the trade results of integration processes have generally been based on global figures for intra-area trade or for given groups of products. This publication seeks to give a homogeneous overall picture, at a relatively disaggregated level, of trade among the member countries of ALADI and among the members of MERCOSUR, as well as of trade by those groupings with their main trading partners outside the region: the United States and the European Economic Community (EEC). For this purpose, the presentation of the statistics is based, on the one hand, on the Standard International Trade Classification, Revision 2 (SITC, Rev.2), the layout of
which is universally accepted, and on the other hand on the data available as from 1983, when it was possible for the first time to collect information permitting the application of SITC Rev.2 to all the ALADI countries.
For each year between 1983 and 1990, 33 tables are given. Each of them, except the first and last tables, contains two divisions from the 63 included in SITC Rev.2. The first tabic, for its part, covers total trade in respect of all divisions, while the last table presents section 9 as a residual division (90). This makes it possible to present a picture of total intra-area trade and to analyse, for each country, the share of such trade in the corresponding country’s trade with the rest of the world, which may be viewed as an average coefficient of integration of the countries of the area. In all the tables, a line and a column were added in order to form a sub-matrix reflecting trade among the MERCOSUR countries and trade between the other seven countries and MERCOSUR. In this respect, it was taken into account that since the latter group of countries has only recently been formed, little written information is available on its activities.
It should be noted that the statistics given in this document correspond to exports FOB. As these data concern exports within ALADI, from the point of view of the importing countries these should be equal to a l a d i’s FOB imports, but this .is not always the case, and sometimes there are significant differences due to problems of registration. This should come as no surprise, as it also happens in the case of developed countries which could be expected to have high-quality statistics.
Finally, it should be noted that the statistical data come from the countries themselves. They are taken from customs registers maintained in line with the Nomenclature of the Customs Co-operation Council. They are supplied to ALADI on magnetic tape, and ALADI provides a copy to ECLAQ the two bodies arrange them according to their needs. In the case of ECLAC, the Statistics and Projections Division maintains the Latin American and Caribbean External Trade Data Bank (BADECEL), which includes several international classifications. The SITC, Rev.2, at its maximum (five-digit) disaggregation, has recently also been brought “on line”.
Caminos - Un nuevo enfoque para la gestion y conservación de redes viales (Roads - A new approach to road system management and conservation) (LC/L-693), Santiago, Chile, July 1992, 217 pages.
It is widely agreed that much of the road system of Latin America and the Caribbean leaves much to be desired because of the lack of timely conservation measures. The state of most roads is mediocre or positively bad, and the prevailing tendency is towards further rapid deterioration. Only a small proportion of the roads arc in good condition, but there is no guarantee that they will continue to be so. Some countries, however, are making an effort to

170 CEPAL REVIEW No. 481 December 1992
overcome this unfavourable situation, and some partial successes have been achieved in this respect, although it may be doubted whether these are really solid achievements that can be maintained for very long.
The life of roads seems to conform to an inexorable and repeated cycle of construction - inadequate conservation - degradation - destruction - reconstruction. The fundamental cause of this pernicious and extremely costly process is lack of conservation. The hard lessons learnt from the destruction of road systems which it was fondly imagined had become an integral part of each country’s permanent features seem to have given rise to serious meditation and a determination to correct past attitudes.
Preserving what we have inherited from previous generations or have even built up through our own efforts is an attitude which is timidly beginning to emerge in the region but is not yet suitably consolidated. For the present, the tendency simply to replace something old with something new seems to continue to prevail. In the case of road systems, the result of this attitude has been great eagerness to build roads, but little interest in conserving those already constructed. There are two main causes behind the present situation: the chronic lack of finance, and the ineffectiveness and inefficiency of the bodies responsible for roads.
Today, the situation has reached crisis point. The loss of value due to the deterioration of the existing road networks is greater than the amounts spent on building or improving roads. There is an urgent need for a reaction which can reverse this alarming situation by simultaneously tackling its two fundamental causes.
In seeking to achieve this, it is necessary to call into doubt two deep-rooted convictions which are implicit in the way roads have traditionally been treated. These are:
i) The idea that roads are a service that must necessarily be provided directly by the State, because the freedom of movement they provide for the population is considered to be a universal right.
ii) The conviction that the public sector is a suitable body for the production of goods and services.
The State has traditionally been the main provider of roads, constructing road systems to be placed at the free disposition of the entire national community. The use of such roads has mainly been entirely free, unlike the other components of the transport infrastructure, for which it has always been necessary to pay an explicit charge every time they are used. The only exceptions have been the countries which have a Road Fund financed from taxes specifically levied for this purpose, and the few highways on which tolls are charged.
The special treatment given to roads compared with other elements of the transport infrastructure may be due to the fact that it has not been possible to devise a fair and efficient system of charging for the service provided. This document appeals for due reflection on this matter and
proposes a solution which would put an end to the current unacceptable situation. Financing the road system from general taxes, as is the custom at present, amounts in practice to considering roads to be a sector that must necessarily be subsidized by the State. Long experience clearly indicates, however, that Latin American and Caribbean governments will never allocate sufficient resources for road conservation, since it will always be felt that there are other more pressing needs. While it is true that providing access to the whole of the national territory may well be seen as one of the duties of the State, there will be no obligation to ensure that the roads permitting such access are of a high standard. Thus, the users themselves would have to pay for the privilege of better roads, although subsidies might be provided, if necessary, for the lower-income sectors.
Charging for use of the road infrastructure is desirable, because in this way the costs are made explicit for users and the road transport system is placed on the same footing as the other forms of transport. Transparency is a necessary condition for better resource allocation in the economy.
The means of payment proposed here is the charging of tariffs that would be paid simultaneously with the cost of fuel. The amount of fuel consumed is an acceptable measure of the amount of “road service” used. This payment mechanism is of low cost and is quite closely related to the use made of roads. Such a tariff would be independent of any other fuel taxes which might exist and which might be used for purposes unconnected with the road system, the application of which is a matter for the sovereign decision of each country. The total amount collected in respect of this tariff could serve to establish a Road Fund to be used primarily for road conservation, which would thus enjoy assured stable financing regardless of political vicissitudes.
The capacity of the public sector to act as an effective and efficient producer of goods and services has been questioned for some time now. Once again, experience points to the contrary. Such aspects as low salaries, the lack of incentives for good performance, the virtual absence of any punishment for errors committed, and the prevalence of interminable pointless bureaucratic procedures mean that public bodies are rarely capable of flexible and effective action in the fields of management and production. The backbone of an official’s performance is his personal and professional probity, but while this virtue may be sufficient when it is a question of laying down rules, supervising their fulfilment or defending the interests of the community, it is not enough to ensure efficiency in the field of production.
A large part of the activities of a body responsible for providing road services involve production. It is necessary to carry out the physical work of road construction and conservation, or to prepare projects and studies either personally or by recruiting others. These activities are in no

RECENT ECLAC PUBLICATIONS 171
way different from those of a firm producing goods or services, regardless of whether it is public or private.
Basically, what this book proposes is to place road management and the related production activities in an environment where they can be carried out effectively and efficiently. In other words, what is proposed is that all the activities of management and physical operation of a road system should be carried out by road management companies. Only these companies can combine the qualities of autonomy and flexibility called for by the management and production processes, including the capacity to take decisions, sign contracts and reward or punish in a quick and responsive manner. Responsibility for safeguarding the interests of the community would remain with the appropriate circles: that is to say, the public administration.
Reorganization of the road sector also represents a great opportunity for institutional investors such as pension funds and life insurance companies. They could purchase through public tender the negotiable road management contracts proposed in this book and thereby enjoy a secure long-term investment.
A final consideration is that the current bad management of the road systems also has a very negative effect on the environment. While it is true that it is not possible to avoid the various forms of environmental damage resulting from the original construction of a road, it is perfectly possible to obviate the equally serious damage due to the vast number of road repair and rehabilitaion activities which are the result of shortcomings in road management and conservation.
La reestructuración de empresas públicas: el caso de los puertos de América Latina y el Caribe (Restructuring public enterprises: the case of Latin American and Caribbean ports) (LC/G.1691-P), “Cuadernos de la CEPAL” series, No. 68, Santiago, Chile, July 1992. 148 pages.
The public sector ports of Latin America and the Caribbean are faced with crises in almost all aspects of their activities. The consequences of the fact that ports are both owned and operated by the State are clearly visible in chronic overmanning, political constraints on the construction of installations in new locations and the relocation of certain activities to more suitable places, costly labour measures, low productivity, and tariffs far above international levels. Unless costs are reduced and productivity raised in many ports of the region, a decisive opportunity to increase the competitiveness of the region’s exports on international markets will be lost. The governments of Latin America and the Caribbean are therefore seeking to restructure their ports so that they can give better support to national economic growth objectives.
In order to achieve this, consideration has begun to be given to the idea of allowing the private sector to play a part in State-owned ports. The trend towards private-sector participation in port facilities and services is not merely an adjustment to cyclical factors, but represents growing recognition that the exclusive role of the State in the ports has led to unsuitable allocation of national resources, inflated the cost of the services provided, driven off private investments, restricted foreign exchange income, and undermined the capacity of publicly-owned ports to resist political pressures. It is considered that restructuring the public-sector ports would allow governments to free themselves from day-to-day decisions on commercial matters and devote more time to the formulation and implementation of suitable laws, rules and policies.
One of the main factors affecting the productivity and cost-effectiveness of State and privately owned ports is their respective labour system: the former have a bureaucratic system typical of the public sector, while the latter use market-oriented national legislation applicable both to ports that make a profit and those whose operations show a loss. The response of the employers to workers’ demands in public-sector ports is a political process that involves compliance with budgetary guidelines and allocations or justification of departures from them, whereas in the case of private ports what is involved is fundamentally the striking of a balance between such demands and product or service costs, competitiveness, labour productivity, and commercial profitability.
In order to avoid having to tackle labour problems, subsidies are often used in State-owned ports to pay the extra wage costs of the dockers, but these subsidies have the effect of reducing the competitiveness of the country’s exports on world markets. Moreover, governments have to be sensitive to the concerns of the workers and safeguard their interests by offering redundant labour other job opportunities, retraining programmes, early retirement inducements and compensation payments. In these circumstances, port workers, governments and private interests come to understand and share the difficult tasks facing this activity.
The fundamental reason for participation by the private sector in enterprises belonging to the public sector is the creation of a basis for competition, so that costs may be reduced and the quality of goods and services improved. Competition achieves these objectives because it obliges such enterprises to face commercial risks, the possibility of financial losses, and the danger of bankruptcy. Without competition, privatization would merely mean the transfer of port installations and services from a situation of total State control to one of complete control by the private sector, which would permit the latter to increase its profits without making any innovations in technology or services, or without improving productivity and cost-efficiency. In other words, even though private investors usually equate

172 CEPAL REVIEW No. 48 i December 1992
success with profits, competition would place limitations on their freedom to raise port charges unduly.
The key to establishing competition within and between ports is freedom to enter the market, although this cannot be absolute, since the number of possible locations for port and shipping terminals is limited.
In order to promote private sector participation in port installations and services, the government must adopt an institutional framework involving a new form of allocation of operational, administrative and planning functions between public sector bodies and private enterprises, as part of a market-oriented institutional structure, in order to ensure that the predominant port groups do not distort the trading environment in which business relations take place. In addition, it must establish a broad system of investment rules so that private investors will be free to invest and transfer capital and distribute revenue. The laws, regulations and policies making up this structure must precisely define the properties and services to which private firms will have access, provide clear guidelines for determining their value, safeguard the property rights of investors, and specify all the special advantages or privileges to be granted to citizens of the country where the port is located.
The main elements in this structure comprise the legal faculty of authorizing private participation, deregulation, decentralization, an anti-monopoly system, and the establishment of a public-sector body to balance competing interests in order to ensure that no group can use the market mechanisms to gain a monopoly situation. In the area of legal faculties, clear rules must be laid down for the approval of private-sector propositions, and there must be a firm presumption that more active participation will benefit the country through greater competition, so as to avoid the interminable problems and delays that arise when it is sought to comply with unclear regulations.
Generally speaking, deregulation may be interpreted as a process involving the elimination of government restrictions on the interaction of the market forces in respect of public and private sector economic activities. In the case of ports, this approach is needed in order to ensure that those providing services and facilities will operate in a trading environment of free supply and demand, profits and losses, freedom of entry and withdrawal, economies of scale, respect for the preferences and dislikes of clients, and the risk of bankruptcy. A total lack of rules, however, could lead to the commission of anti-commercial abuses by private firms. Consequently, governments must retain sufficient control over port activities, through anti-monopoly legislation, to ensure that none of the groups in the port environment can divorce themselves from the market forces and try to secure monopoly rents.
There is a wide variety of options for shared participation by governments and the private sector in publicly-owned ports: private stevedoring firms,management contracts, concessions, joint operations,authorization of private terminals to handle third-partycargo, conversion of public-sector ports into limited companies, or the outright sale of ports. Without a suitable institutional framework and a market-oriented labour system, however, the intervention of private enterprise may lead to many problems. State participation in a port incorporating private sector activities must continue through the institutional structure, the supervision of private-sector activities, sharing in the profits, incentive plans, and contractual agreements.
Much of the debate over private participation in portfacilities and services is of a political nature, rather thaneconomic, operational, technical or juridical. Indeed, as such participation means delegating government functions and faculties, it is a question of national sovereignty, often expressed in terms of economic independence and defensive capacity.
The port workers would be hired locally, since most Latin American and Caribbean countries have immigration laws that only permit the hiring of foreigners when the special skills required cannot be supplied by citizens of the home country. These regulations would in fact increase the level of public control through a suitably formulated institutional structure that limits and balances in a well-defined manner the influence of government bodies, dominant groups, and private enterprise. Ports which are leased or sold to foreign interests would still be subject to all the laws of the countries where they are located, and governments would lay down rules for commercial activities in order to protect matters considered to be of national interest, thereby permitting them to manage and operate them directly at times of national emergency.
Governments should act as catalysts and use the restructuring options which combine public and private participation with a market-oriented institutional structure in order to encourage, pressure and even oblige participants in port activities to innovate, compete and invest in order to secure constant improvements in productivity and cost-effectiveness. To this end, at the beginning of the restructuring process each Latin American or Caribbean government should appoint a director and form a team of highly appropriate persons, responsible for the restructuring of publicly owned ports, from the ministries of finance, trade, transport, public works and labour, as well as the Central Bank and the port administration. Measures to transfer port functions from the public to the private sector and to set up a market-oriented institutional framework will assuredly be applied by governments in a gradual manner.

ECLAC publications
ECONOMIC COMMISSION FOR LATIN AMERICA AND THE CARIBBEAN
Casilla 179-D Santiago do Chile
PERIODIC PUBLICATIONS
C E P A L Review
CEPAL Review first appeared in 1976 as part oí the Publications Programme of the Economic Commission for Latin America and the Caribbean, its aim being to make a contribution to the study of the economic and social development problems of the region. The views expressed in signed articles, including those by Secretariat staff members, are those of the authors and therefore do not necessarily reflect the point of view of the Organization.CEPAL Review is published in Spanish and English versions three times a year.
Annual subscription costs for 1993 are US$16 for the Spanish version and US$18 for the English version. The price of single issues is US$10 in both cases.The cost of a two-year subscription (1993-1994) is US$30 for Spanish-language version and US$34 for English.
Estudio Económico de Economic Survey ofAmérjca Latina y el Latin America andCaribe the Caribbean1980, 664 pp. 1980, 629 pp.1981, 863 pp. 1981, 837 pp.1982, vol. 1 693 pp. 1982, vol.! 658 pp.1982, vol. ii 199 pp. 1982, vol. II 186 pp.1983, v o it 694 pp. 1983, vol.! 686 pp.1983, vol. Il 179 pp. 1983, vol. II 166 pp.1984, vol. I 702 pp. 1984, vo it 685 pp.1984, vol. Il 233 pp. 1984, vol. II 216 pp.1985, 672 pp. 1985, 660 pp.1986, 734 pp. 1986, 729 pp.
1987, 692 pp. 1987, 685 pp,1988, 741 pp. 1988, 637 pp.1989, 821 pp. 1989, 678 pp.1990, vol. 1 260 pp. 1990, vol. 1 248 pp.1990, vol. It 590 pp. 1990, vol. II 472 pp.1991, vol. 1 299 pp.1991, vol. II 602 pp.
(Issues for previous years also available)
Anuario Estadístico de América Latina y el Caribe / Statistical Yearbook for Latín America and the Caribbean (bilingual)1980, 617 pp.1981, 727 pp.1982/1983, 749 pp.1984, 761 pp.1985, 792 pp.1986, 782 pp.
(Issues for previous years also available)
Libros de la C E P A L1 Manual de proyectos de desarrollo económico, 1958,
5th. ed. 1980,264 pp.1 Manual on economic development projects, 1958,
2nd. ed, 1972,242 pp.2 America Latina en el umbral de los años ochenta,
1979,2nd. ed. 1980,203 pp.3 Agua, desarrollo y medio ambiente en América Latina,
1980,443 pp.4 Los bancos transnacionales y el fmandamiento
externo de América Latina. La experiencia del Perú,1980,265 pp.
4 Transnational banks and the external finance of Latin America: the experience of Peru, 1985, 342 pp.
5 La dimension ambiental en los estilos de desarrollo de América Latina, Osvaldo Sunkel, 1981, 2nd. ed, 1984,136 pp.
6 La mujer y el desarrollo: guía para la planificación de programas y proyectos, 1984,115 pp.
6 Women and development: guidelines for programme and project planning, 1982, 3rd. ed. 1984,123 pp.
7 Africa y América Latina: perspectivas de ia cooperadón interregional, 1983, 286 pp.
8 Sobrevivencia campesina en ecosistemas de altura, vols, i y II, 1983,720 pp.
9 La mujer en el sector popular urbano. América Latina y el Caribe, 1984, 349 pp.
10 Avances en la interpretación ambientai del desarrollo agrícola de América Latina, 1985,236 pp.
1987, 714 pp.1988, 782 pp.1989, 770 pp.1990, 782 pp.1991, 856 pp.1992, 868 pp.
11 El decenio de la mujer en el escenario latinoamericano, 1986,216 pp,
11 The decade for women In Latín America and the Caribbean: background and prospects, 1988, 215 pp.
12 América Latina: sistema monetario internacional y financiamiento externo, 1986,416 pp.
12 Latín America: International monetary system and external financing, 1986,405 pp.
13 Raúl Prebisch: Un aporte al estudio de su pensamiento, 1987,146 pp,
14 Cooperativismo latinoamericano: antecedentes y perspectivas, 1989,371 pp.
15 CEPAL, 40 años (1948-1988), 1988, 85 pp.15 ECLAC 40 Years (1948-1988), 1989, 83 pp.16 América Latina en la economia mundial, 1988,321 pp.17 Gestión para el desarrollo de cuencas de alta montaña
en la zona andina, 1988,187 pp.18 Polñicas macroeconômicas y brecha externa: América
Latina en los años ochenta, 1989,201 pp.19 CEPAL, Bibliografía, 1948-1988,1989,648 pp,20 Desarrollo agrícola y participación campesina, 1989,
404 pp.21 Planificación y gestión dei desarrollo en áreas de
expansión de la frontera agropecuaria en América Latina, 1989,113 pp.
22 Transformación ocupacionat y crisis social en América Latina, 1989,243 pp.
23 La crisis urbana en América Latina y el Caribe: reflexiones sobre alternativas de solución, 1990, 197 pp.
24 The environmental dimension In development planning I, 1991, 302 pp.
25 Transformación productiva con equidad, 1990,3rd, ed. 1991,185 pp.
25 Changing production patterns with social equity, 1990, 3rd. ed, 1991,177 pp.
26 América Latina y el Caribe: opciones para reducir el peso de la deuda, 1990,118 pp.
26 Latín America and the Caribbean: options to reduce the debt burden, 1990,110 pp.
27 Los grandes cambios y la crisis. Impacto sobre la mujer en América Latina y el Caribe, 1991, 271 pp.
27 Major changes and crisis. The Impact on women in Latin America and the Caribbean, 1992, 279 pp.
28 A collection of documents on economic relations between the United States and Central America, 1906-1956,1991, 398 pp.
29 Inventarios y cuentas del patrimonio natural en América Latina y ei Caribe, 1991, 335 pp.
30 Evaluaciones del impacto ambiental en América Latina yelCaribe, 1991,232 pp.
31 El desarrollo sustentabie: transformación productiva, equidad y medio ambiente, 1991,146 pp,
31 Sustainable development: changing production patterns, social equity and the environment,1991,146 pp.
32 Equidad y transformación productiva: un enfoque integrado, 1993, 254 pp.
33 Educación y conocimiento: eje de ia transformación productiva con equidad, 1992, 269 pp.
33 Education and knowledge: basic pillars of changing production patterns with social equity, 1993, 257 pp.
34 Ensayos sobre coordinación de polñicas macroeconômicas, 1992, 249 pp.
MONOGRAPH SERIES
Cuadernos de la CE P A L1 América Latina: el nuevo escenario regional y
mundial/Latin America: the new regional and world setting, (bilingual), 1975,2nd. ed. 1985,103 pp.
2 Las evoluciones regionales de la estrategia internacional dei desarrollo, 1975, 2nd. ed. 1984, 73 pp.
2 Regional appraisals of the international development strategy, 1975,2nd. ed, 1985,82 pp.
3 Desarrollo humano, cambio social y crecimiento en América Latina, 1975, 2nd. ed. 1984,103 pp.
4 Relaciones comerciales, crisis monetaria e integración económica en América Latina, 1975, 85 pp.
5 Síntesis de la segunda evaluación regional déla estrategia internacional del desarrollo, 1975, 72 pp.
6 Dinero de valor constante. Concepto, problemas y experiencias, Jorge Rose, 1975, 2nd. ed. 1984, 43 pp.
7 La coyuntura internacional y el sector externo, 1975, 2nd. ed. 1983, 106 pp.
8 La industrialización latinoamericana en tos años setenta, 1975,2nd. ed. 1984,116 pp.
9 Dos estudios sobre inflación 1972-1974. La inflación en los países centrales. América Latina y la inflación importada, 1975,2nd. ed. 1984,57 pp,
s/n Canada and the foreign firm, D. Pollock, 1976,43 pp,10 Reactivación del mercado común centroamericano,
1976,2nd. ed. 1984,149 pp.11 Integración y cooperación entre países en desarrollo
en ei ámbito agrícola, Germánico Salgado, 1976, 2nd. ed. 1985,62 pp.
12 Temas del nuevo orden económico internacional, 1976, 2nd. ed. 1984, 85 pp.
13 En torno a las ideas de la CEPAL: desarrollo, industrialización y comercio exterior, 1977, 2nd. ed. 1985,57 pp.
14 En torno a las ideas de la CEPAL: problemas de la industrialización en América Latina, 1977, 2nd. ed. 1984,46 pp.
15 Los recursos hidráulicos de América Latina, informe regional, 1977,2nd. ed. 1984,75 pp.

15 The water resources of Latin America. Regional report, 1977,2nd. ed. 1985,79 pp.
16 Desarrollo y cambio social en América Latina, 1977, 2nd. ed. 1984,59 pp.
17 Estrategia internacional de desarrollo y establecimiento de un nuevo orden económico internacional, 1977, 3rd. ed. 1984,61 pp.
17 international development strategy and establishment of a new international economic order, 1977,3rd. ed. 1985,59 pp.
18 Raíces históricas de ias estructuras distributivas de América Latina, A. di Filippo, 1977, 2nd. ed. 1983, 64 pp.
19 Dos estudios sobre endeudamiento externo, C. Massad and R. Zahler, 1977, 2nd. ed. 1986,66 pp.
s/n United States - Latin American trade and financial relations: some policy recommendations,S. Weintraub, 1977,44 pp,
20 Tendencias y proyecciones a largo plazo del desarrollo económico de América Latina, 1978, 3rd. ed. 1985,134 pp.
21 25 años en la agricultura de América Latina: rasgos principales 1950-1975,1978,2nd. ed. 1983,124 pp.
22 Notas sobre la familia como unidad socioeconómica, Carlos A. Borsotti, 1978,2nd. ed. 1984,60 pp.
23 La organización de la información para la evaluación del desarrollo, Juan Sourrouille, 1978, 2nd. ed. 1984,61 pp.
24 Contabilidad nacional a precios constantes en América Latina, 1978,2nd. ed. 1983,60 pp.
s/n Energy in Latín America: The Historical Record, J. Mullen, 1978, 66 pp.
25 Ecuador: desafíos y logros de la política económica en ía fase de expansión petrolera, 1979, 2nd. ed. 1984, 153 pp.
26 Las transformaciones rurales en América Latina: ¿desarrollo social o marginación?, 1979, 2nd. ed. 1984,160 pp.
27 La dimensión de la pobreza en América Latina, Oscar Altimir, 1979,2nd. ed. 1983,89 pp.
28 Organización institucional para el control y manejo de la deuda externa. El caso chileno, Rodolfo Hoffman, 1979,35 pp.
29 La política monetaria y ei ajuste de la balanza de pagos: tres estudios, 1979, 2nd. ed. 1984,61 pp,
29 Monetary policy and balance of payments adjustment: three studies, 1979,60 pp.
30 América Latina: las evaluaciones regionales de la estrategia internacional del desarrollo en los años setenta, 1979,2nd. ed. 1982,237 pp.
31 Educación, imágenes y estitos de desarrollo, G. Rama, 1979, 2nd. ed. 1982,72 pp.
32 Movimientos internacionales de capitales, R. H. Arriazu, 1979, 2nd. ed. 1984,90 pp.
33 Informe sobre las inversiones directas extranjeras en América Latina, A. E. Calcagno, 1980,2nd. ed. 1982,114 pp.
34 Las fluctuaciones de la industria manufacturera argentina, 1950-1978, D. Heymann, 1980, 2nd. ed. 1984,234 pp.
35 Perspectivas de reajuste industrial: la Comunidad Económica Europea y tos países en desarrollo, B. Evers, G. de Groot and W. Wagenmans, 1980, 2nd. ed. 1984,69 pp.
36 Un análisis sobre la posibilidad de evaluar la solvencia crediticia de los países en desarrollo, A. Saieh, 1980,2nd. ed. 1984,82 pp.
37 Hacia los censos latinoamericanos de los años ochenta, 1981,146 pp.
s/n The economic relations of Latín America with Europe, 1980, 2nd. ed. 1983,156 pp.
38 Desarrollo regional argentino: la agricultura, J. Martin, 1981,2nd. ed. 1984,111 pp.
39 Estratificación y movilidad ocupacionai en América Latina, C. Filgueira and C, Geneletti, 1981, 2nd. ed. 1985,162 pp.
40 Programa de acción regional para América Latina en los años ochenta, 1981,2nd. ed. 1984,62 pp.
40 Regional programme of action for Latin America in the 1980$, 1981, 2nd. ed. 1984, 57 pp.
41 El desarrollo de América Latina y sus repercusiones en la educación. Alfabetismo y escolaridad básica, 1982,246 pp.
42 América Latina y la economía mundial del café, 1982, 95 pp.
43 El ciclo ganadero y la economía argentina, 1983,160 pp.
44 Las encuestas de hogares en América Latina, 1983,122 pp.
45 Las cuentas nacionales en América Latina y el Caribe, 1983,100 pp.
45 National accounts in Latin America and the Caribbean, 1983,97 pp.
46 Demanda de equipos para generación, transmisión y transformación eléctrica en América Latina, 1983, 193 pp.
47 La economía de América Latina en 1982: evolución general, política cambiaria y renegociación de ia deuda externa, 1984,104 pp.
48 Políticas de ajuste y renegociación de la deuda externa en América Latina, 1984,102 pp.
49 La economía de América Latina y el Caribe en 1983: evolución general, crisis y procesos de ajuste, 1985, 95 pp.
49 The economy of Latín America and the Caribbean In 1983: main trends, the impact of the crisis and the adjustment processes, 1985,93 pp.
50 La CEPAL, encarnación de una esperanza de América Latina, Hernán Santa Cruz, 1985,77 pp.
51 Hacia nuevas modalidades de cooperación económica entre América Latina y el Japón, 1986, 233 pp.
51 Towards new forms of economic co-operation between Latin America and Japan, 1987,245 pp.

52 Los conceptos básicos del transporte marítimo y la situación de la actividad en América Latina, 1986,112 pp.
52 Basic concepts of maritime transport and its present status In Latin America and the Caribbean, 1987,114pp.
53 Encuestas de ingresos y gastos. Conceptos y métodos en la experiencia latinoamericana. 1986,128 pp.
54 Crisis económica y polñicas de ajuste, estabilización y crecimiento, 1986,123 pp.
54 The economic crisis: policies for adjustment, stabilization and growth, 1986,125 pp.
55 El desarrolto de América Latina y el Caribe: escolios, requisitos y opciones, 1987,184 pp.
55 Latín American and Caribbean development: obstacles, requirements and options, 1987,184 pp.
56 Los bancos transnationales y el endeudamiento externo en la Argentina, 1987,112 pp.
57 Ei proceso de desarrollo de la pequeña y mediana empresa y su papel en el sistema industrial: el caso de Italia, 1988,112 pp.
58 La evolución de la economía de América Latina en1986.1988, 99 pp.
58 The evolution of the Latin American Economy in1986.1988, 95 pp.
59 Protectionism: regional negotiation and defence strategies, 1988,261 pp.
60 Industrialización en América Latina: de la “caja negra" al “casillero vacio" F. Fajnzylber, 1989, 2nd. ed. 1990,176 pp.
60 Industrialization in Latin America: from the “Black Box” to the "Empty Box", F. Fajnzylber,1990.172 pp.
61 Hacia un desarrollo sostenido en América Latina y el Caribe: restricciones y requisitos, 1989,94 pp.
61 Towards sustained development in Latin America and the Caribbean: restrictions and requisites,1989,93 pp,
62 La evolución de la economía de América Latina en1987.1989, 87 pp.
62 The evolution of the Latin American economy in 1987,1989,84 pp.
63 Elementos para el diseño de políticas industriales y tecnológicas en América Latina, 1990, 2nd. ed.1991.172 pp.
64 La industria de transporte regular internacional y la competltividad del comercio exterior de los países de América Latina y el Caribe, 1989,132 pp.
64 The International common-carrier transportation industry and the competitiveness of the foreign trade of the countries of Latin America and the Caribbean, 1989,116 pp.
65 Cambios estructurales en los puertos y la competitividad del comercio exterior de América Latina y el Caribe, 1991, 141 pp.
65 Structural Changes In Ports and the Competitiveness of Latin American and Caribbean Foreign Trade, 1990,126 pp.
66 The Caribbean: one and divisible, 1993, 207 pp.67 La transferencia de recursos externos de América
Latina en la posguerra, 1991, 92 pp.67 Postwar transfer of resources abroad by Latin
America, 1992,90 pp.68 La reestructuración de empresas públicas: el caso
de los puertos de América Latina y el Caribe, 1992, 148 pp.
68 The restructuring of publlc-sector enterprises: the case of Latin American and Caribbean ports,1992, 129 pp.
69 Las finanzas públicas de América Latina en la década de 1980,1993,100 pp.
69 Public Finances in Latín America In the 1980s,1993, 96 pp.
70 Canales, cadenas, corredores y competitividad: un enfoque sistémico y su aplicación a seis productos latinoamericanos de exportación, 1993, 183 pp.
Cuadernos Estadísticos de la C E P A L1 América Latina: relación de precios del intercambio,
1976,2nd. ed. 1984,66 pp.2 Indicadores del desarrollo económico y social en
América Latina, 1976,2nd. ed. 1984,179 pp.3 Series históricas del crecimiento de América Latina,
1978,2nd. ed. 1984,206 pp;4 Estadísticas sobre la estructura del gasto de consumo
délos hogares según finalidad del gasto, por grupos de ingreso, 1978,110 pp. (Out ot print; replaced by No. 8 below)
5 El balance de pagos de América Latina, 1950-1977, 1979,2nd. ed. 1984,164 pp.
6 Distribución regional del producto interno bruto sectorial en los países de América Latina, 1981, 2nd, ed. 1985,68 pp.
7 Tablas de insumo-producto en América Latina, 1983, 383 pp.
8 Estructura del gasto de consumo de los hogares según finalidad del gasto, por grupos de ingreso,1984,146 pp.
9 Origen y destino del comercio exterior de los países de la Asociación Latinoamericana de integración y del Mercado Común Centroamericano, 1985,546 pp.
10 América Latina: balance de pagos, 1950-1984,1986, 357 pp.
11 Ei comercio exterior de bienes de capitai en América Latina, 1986,288 pp.
12 América Latina: indices del comercio exterior, 1970-1984,1987, 355 pp.

13 América Latina: comercio exterior según la clasificación industrial internacional uniforme de todas las actividades económicas, 1987, Vol. I, 675 pp; Vol. II, 675 pp.
14 La distribución del ingreso en Colombia. Antecedentes estadísticos y características socioeconómicas de los receptores, 1988,156 pp.
15 América Latina y el Caribe: series regionales de cuentas nacionales a precios constantes de 1980, 1991,245 pp.
16 Origen y destino del comercio exterior de los países de la Asocidón Latinoamericana de Integración, 1991, 190 pp.
17 Comercio intrazonal de ios países de la Asociación de Integración, según capítulos de la clasificación uniforme para el comercio internacional, revisión 2, 1992, 299 pp.
Estudios e Informes de la C E P A L
1 Nicaragua: el impacto de la mutación política, 1981, 2nd. ed. 1982,126 pp.
2 Perú 1968-1977: la política económica en un proceso de cambio global, 1981,2nd. ed. 1982,166 pp.
3 La industrialización de América Latina y la cooperación internacional, 1981, 170 pp. (Out of print, will not be reprinted.)
4 Estilos de desarrollo, modernización y medio ambiente en la agricultura latinoamericana, 1981, 4th. ed. 1984, 130 pp.
5 El desarrollo de América Latina en los años ochenta, 1981,2nd. ed. 1982,153 pp.
5 Latin American development in the 1980$, 1981, 2nd. ed. 1982,134 pp.
6 Proyecciones del desarrollo latinoamericano en ios añosochenta, 1981, 3rd. ed. 1985,96 pp.
6 Latín American development projections for the 1980$, 1982,2nd. ed. 1983,89 pp.
7 Las relaciones económicas externas de América Latina en los años ochenta, 1981, 2nd. ed. 1982,180 pp.
8 integración y cooperación regionales en ¡os años ochenta, 1982,2nd. ed. 1982,174 pp.
9 Estrategias de desarrollo sectorial para los años ochenta: industria y agricultura, 1981, 2nd, ed. 1985,100 pp,
10 Dinámica dei subempleo en América Latina. PREALC, 1981,2nd. ed. 1985,101 pp.
11 Estilos de desarrollo de ta industria manufacturera y medio ambiente en América Latina, 1982, 2nd. ed. 1984, 178 pp.
12 Relaciones económicas de América Latina con los países miembros del “Consejo de Asistencia Mutua Económica”, 1982,154 pp.
13 Campesinado y desarrollo agrícola en Bolivia, 1982, 175 pp.
14 El sector extemo: indicadores y análisis de sus fluctuaciones. El caso argentino, 1982, 2nd. ed. 1985,216 pp.
15 Ingeniería y consultoria en Brasil y el Grupo Andino, 1982,320 pp.
16 Cinco estudbs sobre la situación de la mujer en América Latina, 1982, 2nd. ed. 1985,178 pp.
16 Five studies on the situation of women in Latin America, 1983,2nd. ed. 1984,188 pp.
17 Cuentas nacionales y producto material en América Latina, 1982,129 pp.
18 El financiamiento de las exportaciones en América Latina, 1983,212 pp.
19 Medición del empleo y de los ingresos rurales, 1982, 2nd. ed. 1983,173 pp.
19 Measurement of employment and income in rural areas, 1983,184 pp.
20 Efectos macroeconômicos de cambios en las barreras al comercio y al movimiento de capitales: un modelo de simulación, 1982, 68 pp,
21 La empresa pública en la economía: la experiencia argentina, 1982,2nd, ed. 1985,134 pp.
22 Las empresas transnacionales en ia economía de Chile, 1974-1980,1983,178 pp.
23 La gestión y la informática en las empresas ferroviarias de América Latina y España, 1983,195 pp.
24 Establecimiento de empresas de reparación y mantenimiento de contenedores en América Latina y el Caribe, 1983,314 pp.
24 Establishing container repair and maintenance enterprises in Latin America and the Caribbean, 1983,236 pp.
25 Agua potable y saneamiento ambiental en América Latina, 1981-1990/Drinklng water supply and sanitation in Latin America, 1981-1990 (bilingual), 1983,140 pp.
26 Los bancos transnacionaies, el estado y el endeudamiento externo en Bolivia, 1983, 282 pp.
27 Política económica y procesos de desarrollo. La experiencia argentina entre 1976 y 1981, 1983, 157 pp.
28 Estilos de desarrollo, energía y medio ambiente: un estudio de caso exploratorio, 1983,129 pp.
29 Empresas transnacionaies en la industria de alimentos. El caso argentino: cereales y carne, 1983, 93 pp.
30 Industrialización en Centroamérica, 1960-1980,1983,168 pp.
31 Dos estudios sobre empresas transnacionaies en Brasil, 1983,141 pp.
32 La crisis económica internacional y su repercusión en América Latina, 1983,81 pp.
33 La agricultura campesina en sus relaciones con ia industria, 1984, 120 pp,

34 Cooperación econômica entre Brasil y el Grupo Andino: el caso de los minerales y metales no ferrosos, 1983,148 pp.
35 La agricultura campesina y el mercado de alimentos: la dependencia externa y sus efectos en una economía abierta, 1984,201 pp.
36 El capital extranjero en ia economía peruana, 1984, 178 pp.
37 Dos estudios sobre política arancelaria, 1984,96 pp.38 Estabilización y liberalización económica en el Cono
Sur, 1984,193 pp.39 La agricultura campesina y el mercado de alimentos: el
caso de Haití y el de la República Dominicana, 1984, 255 pp.
40 La industria siderúrgica latinoamericana: tendencias y potencial, 1984,280 pp.
41 La presencia de las empresas transnacionales en la economia ecuatoriana, 1984,77 pp.
42 Precios, salados y empleo en la Argentina: estadísticas económicas de corto plazo, 1984,378 pp.
43 El desarrollo de la seguridad social en América Latina, 1985,348 pp.
44 Market structure, firm size and Brazilian exports, 1985, 104 pp.
45 La planificación del transporte en países de América Latina, 1985, 247 pp.
46 La crisis en América Latina: su evaluación y perspectivas, 1985,119 pp.
47 La juventud en América Latina y el Caribe, 1985,181 pp.
48 Desarrollo de los recursos mineros de América Latina, 1985,145 pp.
48 Development of the mining resources of Latin America, 1989,160 pp.
49 Las relaciones económicas internacionales de América Latina y la cooperación regional, 1985, 224 pp.
50 América Latina y la economía mundial del algodón, 1985,122 pp.
51 Comercio y cooperación entre países de América Latina y países miembros del CAME, 1985,90 pp.
52 Trade relations between Brazil and the United Sfafes, 1985,148 pp.
53 Los recursos hídricos de América Latina y el Caribe y su aprovechamiento, 1985,138 pp.
53 The water resources of Latin America and the Caribbean and their utilization, 1985,135 pp.
54 La pobreza en América Latina: dimensiones y políticas, 1985,155 pp.
55 Políticas de promoción de exportaciones en algunos países de América Latina, 1985, 207 pp.
56 Las empresas transnacionales en la Argentina, 1986,222 pp.
57 El desarrollo frutícola y forestal en Chile y sus derivaciones sociales, 1986,227 pp.
58 El cultivo del algodón y la soya en el Paraguay y sus derivactones sociales, 1986,141 pp.
59 Expansión del cultivo de ia caña de azúcar y de la ganadería en el nordeste del Brasil: un examen del papel de la política pública y de sus derivaciones económicas y sociales, 1986,164 pp.
60 Las empresas transnacionales en el desarrollo colombiano, 1986,212 pp,
61 Las empresas transnacionales en la economia del Paraguay, 1987,115 pp.
62 Problemas de la industria latinoamericana en la fase crítica, 1986,113 pp.
63 Relaciones económicas internacionales y cooperación regional de América Latina y el Caribe, 1987,272 pp,
63 International economic relations and regional co-operation In Latin America and the Caribbean, 1987,267 pp.
64 Tres ensayos sobre inflación y políticas de estabilización, 1986,201 pp.
65 La industria farmacéutica y farmoquimica: desarrollo histórico y posibilidades futuras. Argentina, Brasil y México, 1987, 177 pp.
66 Dos estudios sobre América Latina y el Caribe y la economía internacional, 1987,125 pp.
67 Reestructuración de la industria automotriz mundial y perspectivas para América Latina, 1987,232 pp.
68 Cooperación latinoamericana en servicios:antecedentes y perspectivas, 1988,155 pp.
69 Desarrollo y transformación: estrategia para superarla pobreza, 1988,114 pp.
69 Dsvslopment and change: strategies forvanquishing poverty, 1988,114 pp.
70 La evolución económica del Japón y su impacto en América Latina, 1988,88 pp.
70 The economic evolution of Japan and itsimpact on Latin America, 1990,79 pp.
71 La gestion de los recursos hídricos en América Latina y el Caribe, 1989,256 pp,
72 La evolución del problema de la deuda externa en América Latina y el Caribe, 1988,77 pp.
72 The evolution of the external debt problem in Latin America and the Caribbean, 1988,69 pp.
73 Agricultura, comercio exterior y cooperacióninternacional, 1988,83 pp,
73 Agriculture, external trade and International co-operation, 1989,79 pp.
74 Reestructuración industrial y cambio tecnológico: consecuencias para América Latina, 1989,105 pp.
75 El medio ambiente como factor de desarrollo, 1989, 2nd. ed. 1991,123 pp.
76 El comportamiento de los bancos transnacionales y ia crisis internacional de endeudamiento, 1989,214 pp.
76 Transnational bank behaviour and the international debt crisis, 1989,198 pp.
77 Los recursos hídricos de América Latina y del Caribe: planificación, desastres naturales y contaminación,1990,266 pp.
77 The water resources of Latin America and the Caribbean - Planning hazards and pollution, 1990, 252 pp.
78 La apertura financiera en Chile y et comportamiento de los bancos transnacionales, 1990,132 pp.
79 La industria de bienes de capital enAmérca Latina y el Caribe: su desarrollo en un marco de cooperación regional, 1991,235 pp.
80 Impacto ambiental de la contaminación hídrica producida por la Refinería Estatal Esmeraldas: análisis técnico-económico, 1991,189 pp.
81 Magnitud de la pobreza en América Latina en los años ochenta, 1991,177 pp,
82 América Latina y el Caribe: el manejo de la escasez de agua, 1991, 148 pp.
83 Reestructuración y desarrollo de la industria automotriz mexicana en los años ochenta: evolución y perspectivas, 1992,191 pp.
84 La transformación de ia producción en Chile: cuatro ensayos de interpretación, 1993, 372 pp.
85 Inversión extranjera y empresas transnationales en la economía de Chile (1974-1989). Proyectos de inversión y estrategias de las empresas transnationales, 1992, 257 pp.
86 Inversión extranjera y empresas transnationales en la economía de Chile (1974-1989). El papel del capital extranjero y la estrategia nacional de desarrollo, 1992, 163 pp.
87 Análisis de cadenas agroindustriales en Ecuador y Perú, 1993, 294 pp.
88 El comercio de manufacturas de América Latina. Evolución y estructura 1962-1989,1993,150, pp,
89 El impacto económico y social de las migraciones en centroamérica, 1993,78 pp.
Serie INFOPLAN: Temas Especiales del Desarrollo1 Resúmenes de documentos sobre deuda externa,
1986,324 pp,2 Resúmenes de documentos sobre cooperación entre
países en desarrollo, 1986,189 pp.3 Resúmenes de documentos sobre recursos hídricos,
1987,290 pp.4 Resúmenes de documentos sobre planificación y
medio ambiente, 1987,111 pp.5 Resúmenes de documentos sobre integración
económica en América Latina y el Caribe, 1987, 273 pp.
6 Resúmenes de documentos sobre cooperación entre países en desarrollo, Uparte, 1988,146 pp.
7 Documentos sobre privatización con énfasis en América Latina, 1991, 82 pp.
8 Reseñas de documentos sobre desarrollo ambientalmente sustentable, 1992, 217 pp.

^ J l j j* \^ u ^Ju^ l ♦ ff tj l «lito I ^ VJJJ * jL ^ J l /jm i lm |l ^*Vl J j .lwH ¿p£*ri
• ■-Vr y >’ Jr* r y Cr11 f* ' *1*** 1 r* 1 ; J* “ **' jî
tflf.JHÍt*fr[¿¡¿fcJ»*
«&ia*»nutittiïin*«fl«ioiî»mij#*». jifíi«is»H* ffl«*in*Rrtí«wá-ai*i»«.
HOW TO OBTAIN UNITED NATIONS PUBLICATIONS
United Nations publications may be’ obtained from bookstores and distributors th roughout the world. Consult your bookstore or w rite to: United Nations, Sales Section, New York or Geneva.
COMMENT SE PROCURER LES PUBLICATIONS DES NATIONS UNIES
Les publications des Nations Unies sont en vente dans les librairies et les agences dépositaires du m onde entier. Informez-vous auprès de votre libraire ou adressez-vous à : Nations Unies, Section des ventes, New York ou Genève.
K A K n o n y M H T K H 3 A A H H A O P T A H H 3A U .H H O B T iX U lH H E H H M X H A 1I.H H
HaaaKHff Opr&HHaauKH OftT.ennnenHbix HauHft mow ho KyitHTb b khhjkhsix Mara- 3HHax h areHTCTBax ao e c tx paftoH&x Mupa. HaBoawre cnpaaxH 06 h3A*hhiix a sauieM KHHsaiov MarasHHe h/ik nmuHTe no anpecy : OpraHMsauHir OO-beflHHíHHbix H auuA, CexitHn no nponaw e HonanuA, Hbco-Hopb h/ih XCeueBa.
COMO CONSEGUIR PUBLICACIONES DE LAS NACIONES UNIDAS
Las publicaciones de las Naciones Unidas están en venta en librerías y casas d istribuidoras en todas partes del m undo. C onsulte a su librero o diríjase a: Naciones Unidas, Sección de Ventas, Nueva York o G inebra.
Publications of the Economic Commission for Latin America and the Caribbean (ECLAC) and those of the Latin American and the Caribbean Institute for Economic and Social Planning (ILPES) can be ordered from your local distributor or directly through:
United Nations Publications United Nations PublicationsSales Section, — DC-2-866 Sales SectionNew York, NY, 10017 Palais des NationsU SA 1211 Geneve 10, Switzerland
Distribution Unit CEPAL — Casilla 179-D Santiago, Chile