Centrifugal Modeling of the Relationship between Tunnel ...
21
Citation: Luo, W.; Yuan, D.; Jin, D.; Lu, P.; Chen, J.; Yang, G. Centrifugal Modeling of the Relationship between Tunnel Face Support Pressure and Ground Deformation in Water-Rich Sandy Soil. Appl. Sci. 2022, 12, 5802. https://doi.org/ 10.3390/app12125802 Academic Editor: Craig T. Simmons Received: 9 May 2022 Accepted: 3 June 2022 Published: 7 June 2022 Publisher’s Note: MDPI stays neutral with regard to jurisdictional claims in published maps and institutional affil- iations. Copyright: © 2022 by the authors. Licensee MDPI, Basel, Switzerland. This article is an open access article distributed under the terms and conditions of the Creative Commons Attribution (CC BY) license (https:// creativecommons.org/licenses/by/ 4.0/). applied sciences Article Centrifugal Modeling of the Relationship between Tunnel Face Support Pressure and Ground Deformation in Water-Rich Sandy Soil Weiping Luo 1,2, * , Dajun Yuan 1,2 , Dalong Jin 1,2 , Ping Lu 1,2 , Jian Chen 3,4 and Gongbiao Yang 3,4 1 Key Laboratory of Urban Underground Engineering of the Education Ministry, Beijing Jiaotong University, Beijing 100044, China; [email protected] (D.Y.); [email protected] (D.J.); [email protected] (P.L.) 2 School of Civil Engineering, Beijing Jiaotong University, Beijing 100044, China 3 China Railway 14th Bureau Group Co., Ltd., Jinan 250101, China; [email protected] (J.C.); [email protected] (G.Y.) 4 China Railway Construction Underwater Shield Tunnel Engineering Laboratory, Jinan 250101, China * Correspondence: [email protected] Abstract: To investigate the ground deformation induced by the variation of excess/insufficient support pressure in water-rich sandy soil, a series of centrifuge tests in tunnels located at cover over diameter (C/D) ratios equal to 0.5, 1.0 and 1.5 were carried out. The soil pressure, pore pressure, maximum surface displacement and the ground movement induced by reduced/increased support pressure were investigated. The results show that when the burial depth is large (≥1.5 D), the ground deformation caused by the support pressure is difficult to extend to the surface. When the burial depth is shallow (<1.5 D), the ground disturbance range induced by excess support pressure is approximately fishtail-shaped while it is approximately chimney-shaped induced by insufficient support pressure. For the former, the surface disturbance range can extend horizontally to about twice the buried depth beyond the front of the face and the maximum heave occurred at a distance of approximately buried depth beyond the front of the excavation face. For the latter, the surface disturbance range can extend horizontally to about buried depth beyond the front of the face which was larger than that in dry sandy soil. Based on the centrifuge test, the ground deformation mechanism was analyzed compared with previous studies and a supporting pressure control coefficient was proposed to conduct quantitative analysis of surface displacement induced by support pressure. Finally, the control of support pressure based on the surface displacement was discussed to provide some advice for practical engineering. Keywords: excess/insufficient support pressure; water-rich sand; centrifugal model tests; ground deformation 1. Introduction With the continuous advancement of urbanization, many large-diameter shield tunnels have been built in Shanghai, Nanjing, Wuhan and other cities in China. During the construction of shield tunneling, it’s the support pressure that counteracts the effective earth pressure and water pressure. Ground deformation at the front of the tunnel face that occurs immediately before the shield tunnel’s arrival is due to the imbalance of the support pressure at the tunnel face, which is approximately accounted for 10–20% of the total displacement induced by shield tunneling [1,2]. The assessment of ground deformation induced by support pressure is still one of the keys to ensuring the control of excavation face especially in the urban area, where too large/small ground deformation can easily lead to accidents [3–5]. Therefore, it is of great significance to clarify the range of excavation face support pressure and its influence on ground deformation during shield tunneling [6,7]. Over the decades, numerous studies including theoretical, experimental and numerical have been performed to investigate the stability of the excavation face and its influence Appl. Sci. 2022, 12, 5802. https://doi.org/10.3390/app12125802 https://www.mdpi.com/journal/applsci
-
Upload
khangminh22 -
Category
Documents
-
view
6 -
download
0
Transcript of Centrifugal Modeling of the Relationship between Tunnel ...

Citation: Luo, W.; Yuan, D.; Jin, D.;
Lu, P.; Chen, J.; Yang, G. Centrifugal
Modeling of the Relationship
between Tunnel Face Support
Pressure and Ground Deformation in
Water-Rich Sandy Soil. Appl. Sci.
2022, 12, 5802. https://doi.org/
10.3390/app12125802
Academic Editor: Craig T. Simmons
Received: 9 May 2022
Accepted: 3 June 2022
Published: 7 June 2022
Publisher’s Note: MDPI stays neutral
with regard to jurisdictional claims in
published maps and institutional affil-
iations.
Copyright: © 2022 by the authors.
Licensee MDPI, Basel, Switzerland.
This article is an open access article
distributed under the terms and
conditions of the Creative Commons
Attribution (CC BY) license (https://
creativecommons.org/licenses/by/
4.0/).
applied sciences
Article
Centrifugal Modeling of the Relationship between Tunnel FaceSupport Pressure and Ground Deformation in Water-RichSandy SoilWeiping Luo 1,2,* , Dajun Yuan 1,2, Dalong Jin 1,2, Ping Lu 1,2 , Jian Chen 3,4 and Gongbiao Yang 3,4
1 Key Laboratory of Urban Underground Engineering of the Education Ministry, Beijing Jiaotong University,Beijing 100044, China; [email protected] (D.Y.); [email protected] (D.J.); [email protected] (P.L.)
2 School of Civil Engineering, Beijing Jiaotong University, Beijing 100044, China3 China Railway 14th Bureau Group Co., Ltd., Jinan 250101, China; [email protected] (J.C.);
[email protected] (G.Y.)4 China Railway Construction Underwater Shield Tunnel Engineering Laboratory, Jinan 250101, China* Correspondence: [email protected]
Abstract: To investigate the ground deformation induced by the variation of excess/insufficientsupport pressure in water-rich sandy soil, a series of centrifuge tests in tunnels located at cover overdiameter (C/D) ratios equal to 0.5, 1.0 and 1.5 were carried out. The soil pressure, pore pressure,maximum surface displacement and the ground movement induced by reduced/increased supportpressure were investigated. The results show that when the burial depth is large (≥1.5 D), theground deformation caused by the support pressure is difficult to extend to the surface. Whenthe burial depth is shallow (<1.5 D), the ground disturbance range induced by excess supportpressure is approximately fishtail-shaped while it is approximately chimney-shaped induced byinsufficient support pressure. For the former, the surface disturbance range can extend horizontallyto about twice the buried depth beyond the front of the face and the maximum heave occurred ata distance of approximately buried depth beyond the front of the excavation face. For the latter,the surface disturbance range can extend horizontally to about buried depth beyond the front ofthe face which was larger than that in dry sandy soil. Based on the centrifuge test, the grounddeformation mechanism was analyzed compared with previous studies and a supporting pressurecontrol coefficient was proposed to conduct quantitative analysis of surface displacement inducedby support pressure. Finally, the control of support pressure based on the surface displacement wasdiscussed to provide some advice for practical engineering.
Keywords: excess/insufficient support pressure; water-rich sand; centrifugal model tests; grounddeformation
1. Introduction
With the continuous advancement of urbanization, many large-diameter shield tunnelshave been built in Shanghai, Nanjing, Wuhan and other cities in China. During theconstruction of shield tunneling, it’s the support pressure that counteracts the effectiveearth pressure and water pressure. Ground deformation at the front of the tunnel face thatoccurs immediately before the shield tunnel’s arrival is due to the imbalance of the supportpressure at the tunnel face, which is approximately accounted for 10–20% of the totaldisplacement induced by shield tunneling [1,2]. The assessment of ground deformationinduced by support pressure is still one of the keys to ensuring the control of excavationface especially in the urban area, where too large/small ground deformation can easily leadto accidents [3–5]. Therefore, it is of great significance to clarify the range of excavation facesupport pressure and its influence on ground deformation during shield tunneling [6,7].
Over the decades, numerous studies including theoretical, experimental and numericalhave been performed to investigate the stability of the excavation face and its influence
Appl. Sci. 2022, 12, 5802. https://doi.org/10.3390/app12125802 https://www.mdpi.com/journal/applsci

Appl. Sci. 2022, 12, 5802 2 of 21
on the ground deformation [8–12]. Since the experimental method is still an effectiveand intuitive way to study the phenomenon and failure mechanism of face stability, a lotof laboratory models have been conducted by researchers [7,13]. An original laboratoryreduced-scale model of earth pressure balanced shield was carried out by [14] to investigatethe mechanisms of face collapse and blow-out of tunnels driven in soft grounds. Severalcentrifuge model tests and three-dimensional finite element analyses have been conductedto study the passive failure mechanisms of tunnel face for tunnels located at different coverover diameter (C/D) ratios [15–17]. In addition, the influence of the advanced status ofEPBS machine [18], the steady state seepage [19], the soil density [20] and water content [21],etc., on the face failure mechanism and ground displacements were also investigated byconducting a series of the centrifuge or constant gravity tests.
In parallel with these experimental studies, many analytical models for calculatingthe stability of the face have been proposed. Among these, limit analysis and limit equi-librium approaches are the most typical methods to predict the support pressure of faceactive/passive failure [22–24]. They have been used extensively and extended in many sub-sequent works. To further assess the capability of theoretical models, centrifuge tests wereperformed on a small-scale model in dry sand [25]. Additionally, some semi-analytical [26]or empirical [27] methods have been proposed to calculate the displacement induced bytunneling. Ref. [28] describes a new modified prediction method of surface settlementfor Xi’an Metro, which can take into account the support pressure of the shield head atthe tunnel face. Ref. [29] proposed an approach to estimate three-dimensional grounddisplacements induced by shield tunneling using the superposition method, advocatingconsideration of the support pressure during shield tunneling.
As for numerical simulation, three-dimensional (3D) discrete element method (DEM)using PFC3D [30], the finite difference method based on FLAC3D [31,32], the finite elementmethod using PLAXIS 3D [33], COMSOL [34], etc. [35,36], were applied to analyze the facestability and ground deformation. However, the validity of numerical analyses should bechecked, either by in situ measurements or by laboratory model tests since it’s generallydifficult to adopt the proper constitutive model and parameters of the materials to modelthe real state of the tunnel.
Although many studies have been carried out to investigate the support pressureat the limit state of the excavation face, the study of surface displacement induced byan excess/insufficient support pressure especially the quantitative analysis is relativelyrare and most of the studies are analytical solutions based on the upper bound theorem andnumerical simulation [37]. Furthermore, the extent of ground movement associated witha reduced/increased support pressure is not yet well known. Additionally, the mentionedabove studies were focused on clay, cohesive soil or dry sand. Different from those soils, thesand especially in water-rich are the soils whose self-weight forces may themselves causecollapse. Tunneling in such soil can easily induce excessive displacement, even blow-out orcollapse of the ground.
As there have been limited studies (especially the experimental study) on the rela-tionship between the ground displacement and the support pressure in water-rich sandsoil, a satisfactory understanding of the ground deformation mechanism, together with areliable way for calculating maximum displacement induced by the support pressure, isstill limited. In this paper, to investigate the ground deformation induced by the variation ofexcess/insufficient support pressure in water-rich sandy soil, six groups of centrifuge testsin tunnels located at cover over diameter (C/D) ratios equal to 0.5, 1.0 and 1.5 were carriedout to investigate the ground deformation induced by the variation of excess/insufficientsupport pressure. The soil and pore pressure, maximum surface displacement and theground movement induced by reduced/increased support pressure were investigated.Based on the centrifuge test, the ground deformation mechanism was analyzed comparedwith previous studies and a supporting pressure control coefficient was proposed to con-duct quantitative analysis of surface deformation caused by support pressure. Finally, the
Appl. Sci. 2022, 12, 5802 3 of 21
determination of support pressure based on the surface deformation control was discussedto provide some advice for practical engineering.
2. Centrifuge Model Test
For models carried out with soils under gravity conditions, it is well known that itis unfortunately impossible to satisfy all the necessary similitude conditions relative tosoil behavior. However, to reveal the real state of soil stress and deformation, it is crucialto replicate the in situ soil stress field properly. Centrifuge model tests are valuable insimulating a correct prototype situation in the laboratory, which has been widely used ingeotechnical engineering [15,19]. In view of this, centrifuge model tests were carried out toinvestigate the ground deformation mechanism induced by an excess/insufficient supportpressure in this study.
2.1. Model Setup
The centrifuge tests were carried out on the TK-C500 geotechnical centrifuge of TianjinResearch Institute for Water Transport Engineering, M.O.T, which has a rotating arm ofapproximately 10 m in diameter. The space of the hanging basket is 1.4 m (length) × 1.5 m(width) × 1.5 m (height) and the maximum modeling capacity of the centrifuge reaches500 g.t.
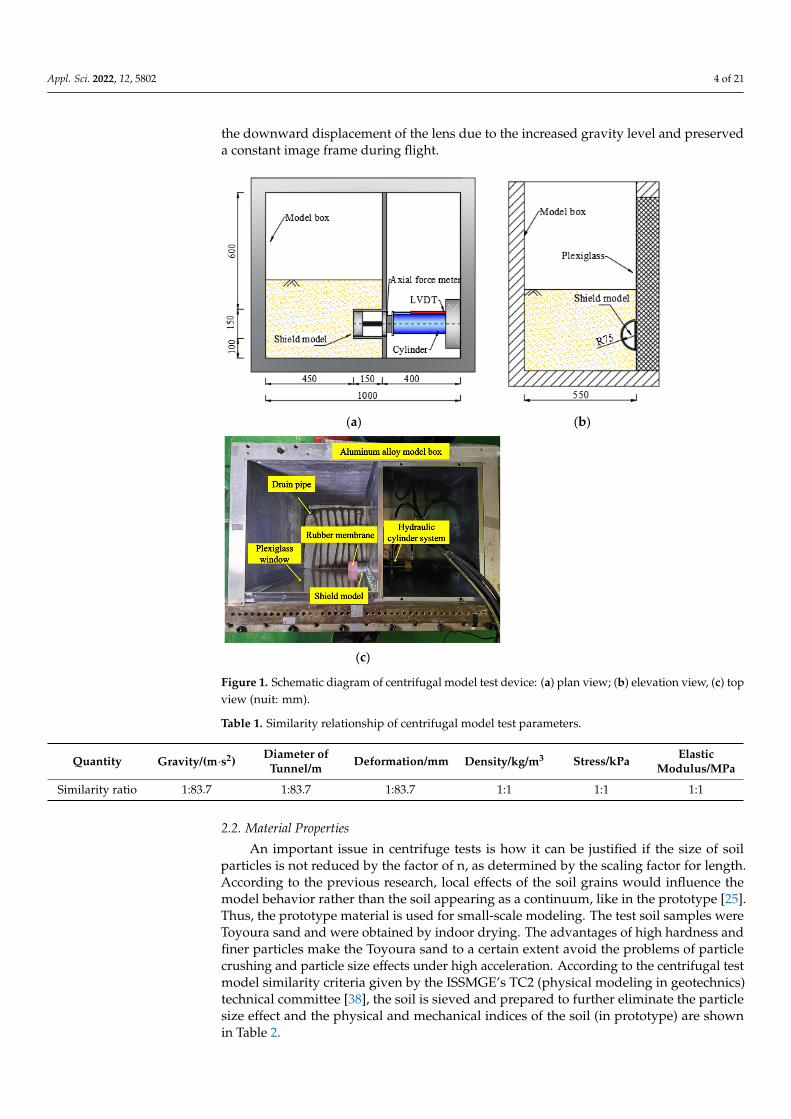
Figure 1 shows the plan and elevation views of the centrifuge model setup whichillustrated the position of the tunnel concerning the boundaries of the model box. In thetests, to minimize boundary conditions, the minimum net distance between the tunnel andlateral boundary is about 3.2 D (D represents the diameter of the tunnel). By making use ofsymmetry, half of the tunnel cross-section was considered to observe the soil deformationduring the test. The tunnel was placed adjacent to the plexiglass which is the tunnel’svertical plane of symmetry. The plexiglass served the purpose for ease of PIV controlmarker placement while reducing the friction between the front face and the sand.
In this test, face support was provided by a semi-circular faceplate of aluminumwith a thickness of 3 mm, of which the stiff was enough so that the deformation of thelining during the centrifuge tests is negligible. The diameter of the faceplate was 150 mm,corresponding to 12.56 m in the prototype. The plate could be moved back or forth bymeans of a linear actuator and a load cell as well as an LVDT transducer was attachedbehind the faceplate to measure the support pressure and piston displacement. It shouldbe noted that the faceplate was slightly smaller than the lining to reduce the frictionbetween the lining and the plate. The epoxy coating was used to protect the strain gaugesfrom abrasion. Moreover, teflon strips were adhered to the inner side of the lining andthe perimeter of the faceplate to reduce friction. To estimate the friction under elevatedacceleration, a calibration test without soil was carried out, where the friction force wasmeasured by moving the piston backward under the same elevated acceleration level asthe normal tests were conducted. As a consequence, a constant friction force of about 10 Nwas used to correct the measured data from the load cell. Additionally, to prevent ingressof sand (an additional source of friction), the perimeter of the tunnel face was coveredwith a rubber membrane which is the pink part in front of the excavation face as shown inFigure 1c. The membrane was fitted with enough slackness to avoid an influence on thesoil-tunnel face interaction during the displacement of the faceplate.
In a centrifuge, the small-scale model is subjected to an acceleration filed n timesgreater than the earth’s gravity acceleration constant, g, which implies that a 1/n scalemodel will behave like its full-scale prototype. To replicate the in situ soil stress of a 12.56 mlarge-diameter tunnel, an acceleration of 83.7 g was applied in this study. The similarity ofeach experimental variable is shown in Table 1.
Additionally, a digital still camera was attached to a rigid frame, with the cameralens inserted through a tightly fitting iron block. Besides, the small gap between lens andfitting was filled with layers of strips to provide a stable mount which can help avoided
Appl. Sci. 2022, 12, 5802 4 of 21
the downward displacement of the lens due to the increased gravity level and preserveda constant image frame during flight.
Appl. Sci. 2022, 12, x FOR PEER REVIEW 3 of 22
were investigated. Based on the centrifuge test, the ground deformation mechanism was analyzed compared with previous studies and a supporting pressure control coefficient was proposed to conduct quantitative analysis of surface deformation caused by support pressure. Finally, the determination of support pressure based on the surface deformation control was discussed to provide some advice for practical engineering.
2. Centrifuge Model Test For models carried out with soils under gravity conditions, it is well known that it is
unfortunately impossible to satisfy all the necessary similitude conditions relative to soil behavior. However, to reveal the real state of soil stress and deformation, it is crucial to replicate the in situ soil stress field properly. Centrifuge model tests are valuable in simulating a correct prototype situation in the laboratory, which has been widely used in geotechnical engineering [15,19]. In view of this, centrifuge model tests were carried out to investigate the ground deformation mechanism induced by an excess/insufficient support pressure in this study.
2.1. Model Setup The centrifuge tests were carried out on the TK-C500 geotechnical centrifuge of
Tianjin Research Institute for Water Transport Engineering, M.O.T, which has a rotating arm of approximately 10 m in diameter. The space of the hanging basket is 1.4 m (length) × 1.5 m (width) × 1.5 m (height) and the maximum modeling capacity of the centrifuge reaches 500 g.t.
Figure 1 shows the plan and elevation views of the centrifuge model setup which illustrated the position of the tunnel concerning the boundaries of the model box. In the tests, to minimize boundary conditions, the minimum net distance between the tunnel and lateral boundary is about 3.2 D (D represents the diameter of the tunnel). By making use of symmetry, half of the tunnel cross-section was considered to observe the soil deformation during the test. The tunnel was placed adjacent to the plexiglass which is the tunnel’s vertical plane of symmetry. The plexiglass served the purpose for ease of PIV control marker placement while reducing the friction between the front face and the sand.
(a) (b)
Appl. Sci. 2022, 12, x FOR PEER REVIEW 4 of 22
(c)
Figure 1. Schematic diagram of centrifugal model test device: (a) plan view; (b) elevation view, (c) top view (nuit: mm).
In this test, face support was provided by a semi-circular faceplate of aluminum with a thickness of 3 mm, of which the stiff was enough so that the deformation of the lining during the centrifuge tests is negligible. The diameter of the faceplate was 150 mm, corresponding to 12.56 m in the prototype. The plate could be moved back or forth by means of a linear actuator and a load cell as well as an LVDT transducer was attached behind the faceplate to measure the support pressure and piston displacement. It should be noted that the faceplate was slightly smaller than the lining to reduce the friction between the lining and the plate. The epoxy coating was used to protect the strain gauges from abrasion. Moreover, teflon strips were adhered to the inner side of the lining and the perimeter of the faceplate to reduce friction. To estimate the friction under elevated acceleration, a calibration test without soil was carried out, where the friction force was measured by moving the piston backward under the same elevated acceleration level as the normal tests were conducted. As a consequence, a constant friction force of about 10 N was used to correct the measured data from the load cell. Additionally, to prevent ingress of sand (an additional source of friction), the perimeter of the tunnel face was covered with a rubber membrane which is the pink part in front of the excavation face as shown in Figure 1c. The membrane was fitted with enough slackness to avoid an influence on the soil-tunnel face interaction during the displacement of the faceplate.
In a centrifuge, the small-scale model is subjected to an acceleration filed n times greater than the earth’s gravity acceleration constant, g, which implies that a 1/n scale model will behave like its full-scale prototype. To replicate the in situ soil stress of a 12.56 m large-diameter tunnel, an acceleration of 83.7 g was applied in this study. The similarity of each experimental variable is shown in Table 1.
Table 1. Similarity relationship of centrifugal model test parameters.
Quantity Gravity/(m·
s2) Diameter of Tunnel/m
Deformation/mm
Density/kg/m3
Stress/kPa
Elastic Modulus/MPa
Similarity ratio 1:83.7 1:83.7 1:83.7 1:1 1:1 1:1
Additionally, a digital still camera was attached to a rigid frame, with the camera lens inserted through a tightly fitting iron block. Besides, the small gap between lens and fitting was filled with layers of strips to provide a stable mount which can help avoided the downward displacement of the lens due to the increased gravity level and preserved a constant image frame during flight.
Figure 1. Schematic diagram of centrifugal model test device: (a) plan view; (b) elevation view, (c) topview (nuit: mm).
Table 1. Similarity relationship of centrifugal model test parameters.
Quantity Gravity/(m·s2)Diameter of
Tunnel/m Deformation/mm Density/kg/m3 Stress/kPa ElasticModulus/MPa
Similarity ratio 1:83.7 1:83.7 1:83.7 1:1 1:1 1:1
2.2. Material Properties
An important issue in centrifuge tests is how it can be justified if the size of soilparticles is not reduced by the factor of n, as determined by the scaling factor for length.According to the previous research, local effects of the soil grains would influence themodel behavior rather than the soil appearing as a continuum, like in the prototype [25].Thus, the prototype material is used for small-scale modeling. The test soil samples wereToyoura sand and were obtained by indoor drying. The advantages of high hardness andfiner particles make the Toyoura sand to a certain extent avoid the problems of particlecrushing and particle size effects under high acceleration. According to the centrifugal testmodel similarity criteria given by the ISSMGE’s TC2 (physical modeling in geotechnics)technical committee [38], the soil is sieved and prepared to further eliminate the particlesize effect and the physical and mechanical indices of the soil (in prototype) are shownin Table 2.

Appl. Sci. 2022, 12, 5802 5 of 21
Table 2. Mechanical parameters of sands.
MaterialDry
Density/ρd(kg/m3)
ElasticModu-lus/E
(MPa)
Poisson’sRatio/v
Cohesive/c(kPa)
FrictionalAngel/ϕ
(◦)Porosity/n
AverageParticleSize /d50
(mm)
MaximumPorosity/emax
MinimumPorosity/emin
Sand 1460 20 0.3 0 30 0.46 0.2 0.97 0.61
2.3. Monitoring Scheme
Assessment of the settlement induced by support pressure was conducted throughseveral physical modeling tests in the greenfield condition. Particle image velocimetry(PIV) and close-range photogrammetry are widely accepted to monitor the subsurface soildisplacement on the vertical plane of symmetry [7,39]. The transverse surface displacementswere monitored using laser sensors as Figure 2 shows at Sections L5 to L8 respectivelyalong the direction perpendicular to the axis of the tunnel as indicated in Figure 3. Thelongitudinal surface displacements were monitored by L1 to L4 and can also be deducedfrom the PIV results.
Appl. Sci. 2022, 12, x FOR PEER REVIEW 5 of 22
2.2. Material Properties An important issue in centrifuge tests is how it can be justified if the size of soil
particles is not reduced by the factor of n, as determined by the scaling factor for length. According to the previous research, local effects of the soil grains would influence the model behavior rather than the soil appearing as a continuum, like in the prototype [25]. Thus, the prototype material is used for small-scale modeling. The test soil samples were Toyoura sand and were obtained by indoor drying. The advantages of high hardness and finer particles make the Toyoura sand to a certain extent avoid the problems of particle crushing and particle size effects under high acceleration. According to the centrifugal test model similarity criteria given by the ISSMGE’s TC2 (physical modeling in geotechnics) technical committee [38], the soil is sieved and prepared to further eliminate the particle size effect and the physical and mechanical indices of the soil (in prototype) are shown in Table 2.
Table 2. Mechanical parameters of sands.
Material Dry Density/ρd (kg/m3)
Elastic Modulus/E (MPa
Poisson’s Ratio/v
Cohesive/c (kPa)
Frictional Angel/φ (°)
Porosity/n Average
Particle Size /d50 (mm)
Maximum Porosity/emax
Minimum Porosity/emin
Sand 1460 20 0.3 0 30 0.46 0.2 0.97 0.61
2.3. Monitoring Scheme Assessment of the settlement induced by support pressure was conducted through
several physical modeling tests in the greenfield condition. Particle image velocimetry (PIV) and close-range photogrammetry are widely accepted to monitor the subsurface soil displacement on the vertical plane of symmetry [7,39]. The transverse surface displacements were monitored using laser sensors as Figure 2 shows at Sections L5 to L8 respectively along the direction perpendicular to the axis of the tunnel as indicated in Figure 3. The longitudinal surface displacements were monitored by L1 to L4 and can also be deduced from the PIV results.
Figure 2. Laser displacement sensor used for monitoring the surface displacement. Figure 2. Laser displacement sensor used for monitoring the surface displacement.
Appl. Sci. 2022, 12, x FOR PEER REVIEW 6 of 22
Figure 3. The layout of the surface displacement sensors (mm).
In addition, the tunnel face pressure was given by an internal load cell in the tunnel face block as described in the previous section. Horizontal displacement of tunnel face was measured by LVDT attached to the actuator support. Figure 4 present the layout of the earth pressure sensors and pore water pressure sensors which were buried in the soil to monitor the change of the earth and water pressure in front of the tunnel face.
(a)
(b)
P1
100
5050
75
505050
P2S4
S1S2S3
50
1D0.
35D
P1
100
7575
7575 505050
P2S4
S1S2S3
1D0.
9D
Figure 3. The layout of the surface displacement sensors (mm).
In addition, the tunnel face pressure was given by an internal load cell in the tunnelface block as described in the previous section. Horizontal displacement of tunnel face wasmeasured by LVDT attached to the actuator support. Figure 4 present the layout of theearth pressure sensors and pore water pressure sensors which were buried in the soil tomonitor the change of the earth and water pressure in front of the tunnel face.

Appl. Sci. 2022, 12, 5802 6 of 21
Appl. Sci. 2022, 12, x FOR PEER REVIEW 6 of 22
Figure 3. The layout of the surface displacement sensors (mm).
In addition, the tunnel face pressure was given by an internal load cell in the tunnel face block as described in the previous section. Horizontal displacement of tunnel face was measured by LVDT attached to the actuator support. Figure 4 present the layout of the earth pressure sensors and pore water pressure sensors which were buried in the soil to monitor the change of the earth and water pressure in front of the tunnel face.
(a)
(b)
P1
100
5050
75
505050
P2S4
S1S2S3
50
1D0.
35D
P1
100
7575
7575 505050
P2S4
S1S2S3
1D0.
9D
Appl. Sci. 2022, 12, x FOR PEER REVIEW 7 of 22
(c)
Figure 4. The layout of the pressure sensors (mm): (a) 0.5 D; (b) 1.0 D; (c) 1.5 D (nuit: mm).
2.4. Test Procedure Three tunneling cases with different C/D ratios equal to 0.5, 1.0 and 1.5 were carried
out in water-rich sand to study the influence of support pressure on ground deformation. All tests were conducted in the following five stages: (1) The test equipment was assembled and the waterproof treatment was conducted.
Then, the sand is layered in the model box by the sand rain method, the flow rate is about 1.5 kg/min, and the falling distance is 500 mm. The earth pressure sensors as well as pore pressure sensors were embedded in predetermined positions. The sand spraying is stopped when the predetermined covering thickness C is reached, and the water pipe network at the bottom of the model box is saturated and infiltrated to the design water level.
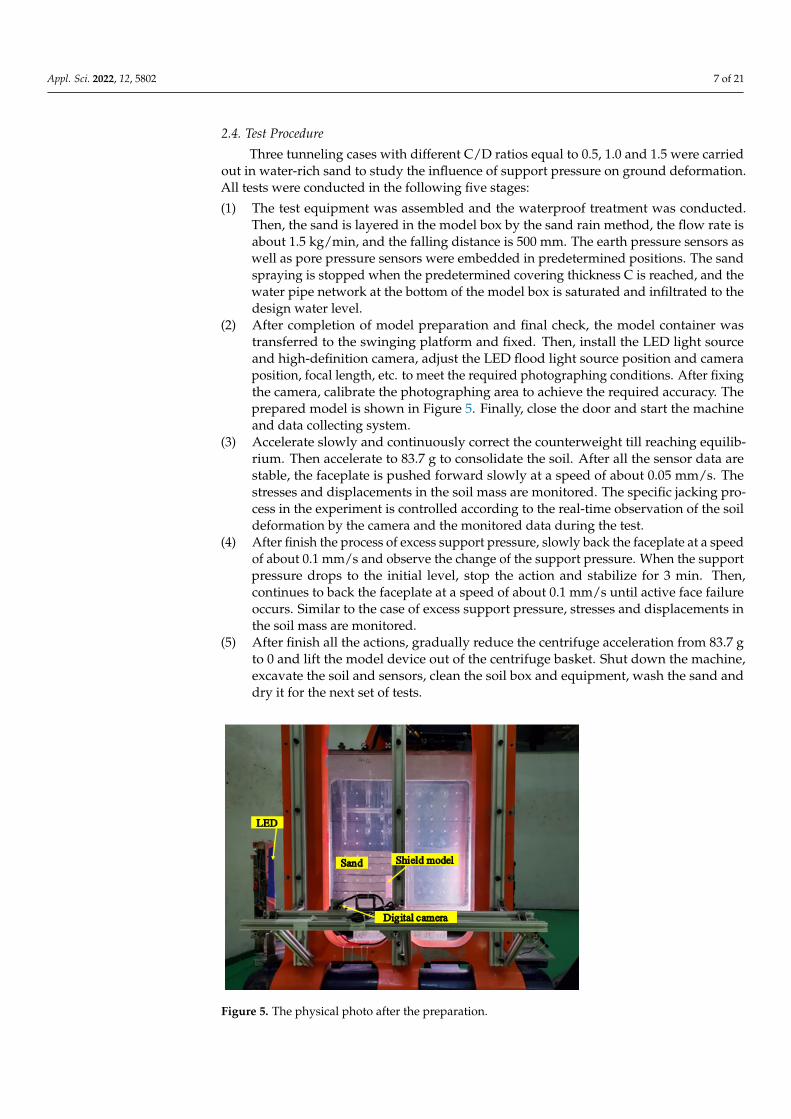
(2) After completion of model preparation and final check, the model container was transferred to the swinging platform and fixed. Then, install the LED light source and high-definition camera, adjust the LED flood light source position and camera position, focal length, etc. to meet the required photographing conditions. After fixing the camera, calibrate the photographing area to achieve the required accuracy. The prepared model is shown in Figure 5. Finally, close the door and start the machine and data collecting system.
(3) Accelerate slowly and continuously correct the counterweight till reaching equilibrium. Then accelerate to 83.7 g to consolidate the soil. After all the sensor data are stable, the faceplate is pushed forward slowly at a speed of about 0.05 mm/s. The stresses and displacements in the soil mass are monitored. The specific jacking process in the experiment is controlled according to the real-time observation of the soil deformation by the camera and the monitored data during the test.
(4) After finish the process of excess support pressure, slowly back the faceplate at a speed of about 0.1 mm/s and observe the change of the support pressure. When the support pressure drops to the initial level, stop the action and stabilize for 3 min. Then, continues to back the faceplate at a speed of about 0.1 mm/s until active face failure occurs. Similar to the case of excess support pressure, stresses and displacements in the soil mass are monitored.
P1
100
7575
100
505050
P2S4
S1S2S3
125
1D1.
35D
Micro earth pressure sensor (Vertical soil pressure) Micro pore pressure sensorMicro earth pressure sensor
(Lateral soil pressure)
Figure 4. The layout of the pressure sensors (mm): (a) 0.5 D; (b) 1.0 D; (c) 1.5 D (nuit: mm).
Appl. Sci. 2022, 12, 5802 7 of 21
2.4. Test Procedure
Three tunneling cases with different C/D ratios equal to 0.5, 1.0 and 1.5 were carriedout in water-rich sand to study the influence of support pressure on ground deformation.All tests were conducted in the following five stages:
(1) The test equipment was assembled and the waterproof treatment was conducted.Then, the sand is layered in the model box by the sand rain method, the flow rate isabout 1.5 kg/min, and the falling distance is 500 mm. The earth pressure sensors aswell as pore pressure sensors were embedded in predetermined positions. The sandspraying is stopped when the predetermined covering thickness C is reached, and thewater pipe network at the bottom of the model box is saturated and infiltrated to thedesign water level.
(2) After completion of model preparation and final check, the model container wastransferred to the swinging platform and fixed. Then, install the LED light sourceand high-definition camera, adjust the LED flood light source position and cameraposition, focal length, etc. to meet the required photographing conditions. After fixingthe camera, calibrate the photographing area to achieve the required accuracy. Theprepared model is shown in Figure 5. Finally, close the door and start the machineand data collecting system.
(3) Accelerate slowly and continuously correct the counterweight till reaching equilib-rium. Then accelerate to 83.7 g to consolidate the soil. After all the sensor data arestable, the faceplate is pushed forward slowly at a speed of about 0.05 mm/s. Thestresses and displacements in the soil mass are monitored. The specific jacking pro-cess in the experiment is controlled according to the real-time observation of the soildeformation by the camera and the monitored data during the test.
(4) After finish the process of excess support pressure, slowly back the faceplate at a speedof about 0.1 mm/s and observe the change of the support pressure. When the supportpressure drops to the initial level, stop the action and stabilize for 3 min. Then,continues to back the faceplate at a speed of about 0.1 mm/s until active face failureoccurs. Similar to the case of excess support pressure, stresses and displacements inthe soil mass are monitored.
(5) After finish all the actions, gradually reduce the centrifuge acceleration from 83.7 gto 0 and lift the model device out of the centrifuge basket. Shut down the machine,excavate the soil and sensors, clean the soil box and equipment, wash the sand anddry it for the next set of tests.
Appl. Sci. 2022, 12, x FOR PEER REVIEW 8 of 22
(5) After finish all the actions, gradually reduce the centrifuge acceleration from 83.7 g to 0 and lift the model device out of the centrifuge basket. Shut down the machine, excavate the soil and sensors, clean the soil box and equipment, wash the sand and dry it for the next set of tests.
Figure 5. The physical photo after the preparation.
3. Test Results The experimental results on support pressure and soil pressure, pore pressure as well
as ground deformation during the test are presented in this section. The model was accelerated up to 83.7 g in progressive steps, which corresponds to a prototype tunnel of 12.56 m in diameter. Centrifuge model tests have been carried out for three overburden-to-diameter ratios: C/D equals 0.5, 1.0 and 1.5 which means the prototype overburden above tunnel crown was about 6.28 m, 12.56 m, and 18.84 m, respectively. For simplification, all test results shown herein are in prototype scale unless otherwise stated. Additionally, it should be noted that the definition of the support pressure sP is as follows:
2 28 8( )t m s
sF F FPD Dπ π
−= = Excessive Condition (1)
2 28 8( )t m s
sF F FPD Dπ π
+= = Insufficient Condition (2)
where sP is the support pressure, tF is the total support force, mF is the measured support force via the load cell, sF is the friction between the faceplate and the shell which is about 10 N as mentioned in Section 2.1, D is the diameter of the model tunnel.
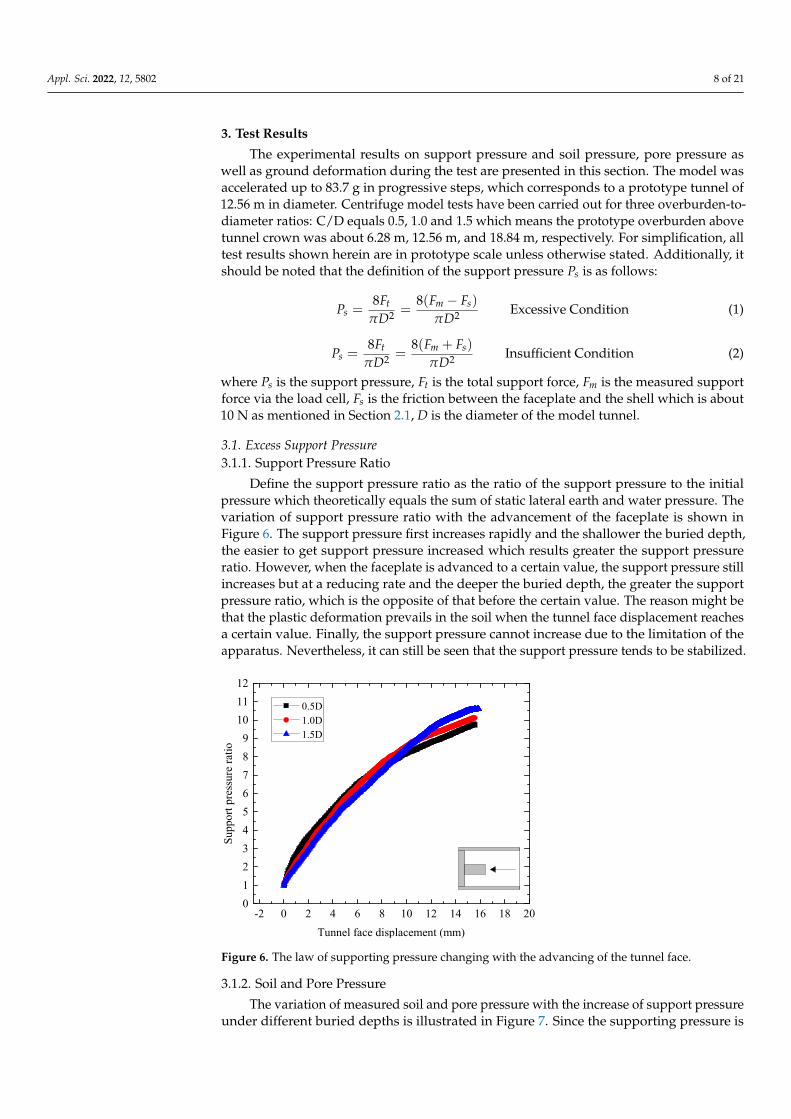
3.1. Excess Support Pressure 3.1.1. Support Pressure Ratio
Define the support pressure ratio as the ratio of the support pressure to the initial pressure which theoretically equals the sum of static lateral earth and water pressure. The variation of support pressure ratio with the advancement of the faceplate is shown in Figure 6. The support pressure first increases rapidly and the shallower the buried depth, the easier to get support pressure increased which results greater the support pressure ratio. However, when the faceplate is advanced to a certain value, the support pressure still increases but at a reducing rate and the deeper the buried depth, the greater the support pressure ratio, which is the opposite of that before the certain value. The reason
Figure 5. The physical photo after the preparation.
Appl. Sci. 2022, 12, 5802 8 of 21
3. Test Results
The experimental results on support pressure and soil pressure, pore pressure aswell as ground deformation during the test are presented in this section. The model wasaccelerated up to 83.7 g in progressive steps, which corresponds to a prototype tunnel of12.56 m in diameter. Centrifuge model tests have been carried out for three overburden-to-diameter ratios: C/D equals 0.5, 1.0 and 1.5 which means the prototype overburden abovetunnel crown was about 6.28 m, 12.56 m, and 18.84 m, respectively. For simplification, alltest results shown herein are in prototype scale unless otherwise stated. Additionally, itshould be noted that the definition of the support pressure Ps is as follows:
Ps =8Ft
πD2 =8(Fm − Fs)
πD2 Excessive Condition (1)
Ps =8Ft
πD2 =8(Fm + Fs)
πD2 Insufficient Condition (2)
where Ps is the support pressure, Ft is the total support force, Fm is the measured supportforce via the load cell, Fs is the friction between the faceplate and the shell which is about10 N as mentioned in Section 2.1, D is the diameter of the model tunnel.
3.1. Excess Support Pressure3.1.1. Support Pressure Ratio
Define the support pressure ratio as the ratio of the support pressure to the initialpressure which theoretically equals the sum of static lateral earth and water pressure. Thevariation of support pressure ratio with the advancement of the faceplate is shown inFigure 6. The support pressure first increases rapidly and the shallower the buried depth,the easier to get support pressure increased which results greater the support pressureratio. However, when the faceplate is advanced to a certain value, the support pressure stillincreases but at a reducing rate and the deeper the buried depth, the greater the supportpressure ratio, which is the opposite of that before the certain value. The reason might bethat the plastic deformation prevails in the soil when the tunnel face displacement reachesa certain value. Finally, the support pressure cannot increase due to the limitation of theapparatus. Nevertheless, it can still be seen that the support pressure tends to be stabilized.
Appl. Sci. 2022, 12, x FOR PEER REVIEW 9 of 22
might be that the plastic deformation prevails in the soil when the tunnel face displacement reaches a certain value. Finally, the support pressure cannot increase due to the limitation of the apparatus. Nevertheless, it can still be seen that the support pressure tends to be stabilized.
-2 0 2 4 6 8 10 12 14 16 18 200123456789
101112
0.5D 1.0D 1.5D
Supp
ort p
ress
ure
ratio
Tunnel face displacement (mm) Figure 6. The law of supporting pressure changing with the advancing of the tunnel face.
3.1.2. Soil and Pore Pressure The variation of measured soil and pore pressure with the increase of support
pressure under different buried depths is illustrated in Figure 7. Since the supporting pressure is much larger than other pressures, it is demonstrated as the x-axis. As it can be seen, all the pore pressures almost change very little indicating that the support pressure has little influence on it. In particular, the pore water pressure at P2 in the buried depth of 1.0 D was missing due to the failure of the sensor while the pore water pressure at P1 increased because the location has been changed due to the squeeze of the soil. The pore water pressure in the case of the tunnel located at cover over diameter (C/D) ratios equal to 0.5 and 1.5 reduced slightly due to the water leakage caused by improper sealing of the excavation surface in the late period when the support pressure is very large. It can also be proved by the leaked water found in the hydraulic cylinder system after the test. In terms of stresses, the advancement of face results in an increase of the soil pressure at most positions. In the buried depth of 0.5 D, the measured lateral soil pressure at S1 and S3 are equal to and half of the support pressure respectively while that in a tunnel located at C/D ratio equals to 1.0 D and 1.5 D was much less than the support pressure. The reason may be that the position of S1 and S3 are in front of the excavation face in the buried depth of 0.5 D while they are above the excavation face in the buried depth of 1.0 D and 1.5 D. This is also why the vertical soil pressure at S2 in the tunnel located at C/D ratio equals to 0.5 D almost keeps stable while in a tunnel located at C/D ratio equals to 1.0 D and 1.5 D it increases with the increase of support pressure and is approximately equal to the lateral soil pressure at S1. In addition, the pressure values of S1 and S3 are very close at the buried depth of 1.5 D, but there is a big difference between them in the tunnel located at C/D ratio equals 0.5 D and 1.0 D. This phenomenon can be explained by the fact that the greater the buried depth, the denser the soil and the better the efficiency of force transmission.
Figure 6. The law of supporting pressure changing with the advancing of the tunnel face.
3.1.2. Soil and Pore Pressure
The variation of measured soil and pore pressure with the increase of support pressureunder different buried depths is illustrated in Figure 7. Since the supporting pressure is

Appl. Sci. 2022, 12, 5802 9 of 21
much larger than other pressures, it is demonstrated as the x-axis. As it can be seen, allthe pore pressures almost change very little indicating that the support pressure has littleinfluence on it. In particular, the pore water pressure at P2 in the buried depth of 1.0 Dwas missing due to the failure of the sensor while the pore water pressure at P1 increasedbecause the location has been changed due to the squeeze of the soil. The pore waterpressure in the case of the tunnel located at cover over diameter (C/D) ratios equal to0.5 and 1.5 reduced slightly due to the water leakage caused by improper sealing of theexcavation surface in the late period when the support pressure is very large. It can alsobe proved by the leaked water found in the hydraulic cylinder system after the test. Interms of stresses, the advancement of face results in an increase of the soil pressure at mostpositions. In the buried depth of 0.5 D, the measured lateral soil pressure at S1 and S3 areequal to and half of the support pressure respectively while that in a tunnel located at C/Dratio equals to 1.0 D and 1.5 D was much less than the support pressure. The reason may bethat the position of S1 and S3 are in front of the excavation face in the buried depth of 0.5 Dwhile they are above the excavation face in the buried depth of 1.0 D and 1.5 D. This is alsowhy the vertical soil pressure at S2 in the tunnel located at C/D ratio equals to 0.5 D almostkeeps stable while in a tunnel located at C/D ratio equals to 1.0 D and 1.5 D it increaseswith the increase of support pressure and is approximately equal to the lateral soil pressureat S1. In addition, the pressure values of S1 and S3 are very close at the buried depth of1.5 D, but there is a big difference between them in the tunnel located at C/D ratio equals0.5 D and 1.0 D. This phenomenon can be explained by the fact that the greater the burieddepth, the denser the soil and the better the efficiency of force transmission.Appl. Sci. 2022, 12, x FOR PEER REVIEW 10 of 22
(a)
(b)
(c)
Figure 7. The variation of soil and pore pressures with the support pressure (excess support pressure):(a) 0.5 D; (b) 1.0 D; (c) 1.5 D.

Appl. Sci. 2022, 12, 5802 10 of 21
3.1.3. Maximum Heave
Figure 8 presents the evolution of the maximum ground surface heave during theincrease of support pressure at different buried depths. The location of the maximum upliftposition monitored on the surface is basically near L3. It can be seen from Figure 8 that atburied depths of 0.5 D and 1 D, the surface heaves firstly increase slowly as the supportpressure increases. After the pressure reaches a certain limit, the heaves begin to increasesharply. However, at the buried depth of 1.5 D, the surface uplift has not changed much,and there is no inflection point similar to the relationship curve at the buried depth of0.5 D and 1.0 D, indicating that the induced ground deformation is difficult to extend tothe surface.
Appl. Sci. 2022, 12, x FOR PEER REVIEW 11 of 22
Figure 7. The variation of soil and pore pressures with the support pressure (excess support pressure: (a) 0.5 D; (b) 1.0 D; (c) 1.5 D.
3.1.3. Maximum Heave Figure 8 presents the evolution of the maximum ground surface heave during the
increase of support pressure at different buried depths. The location of the maximum uplift position monitored on the surface is basically near L3. It can be seen from Figure 8 that at buried depths of 0.5 D and 1 D, the surface heaves firstly increase slowly as the support pressure increases. After the pressure reaches a certain limit, the heaves begin to increase sharply. However, at the buried depth of 1.5 D, the surface uplift has not changed much, and there is no inflection point similar to the relationship curve at the buried depth of 0.5 D and 1.0 D, indicating that the induced ground deformation is difficult to extend to the surface.
0 10 20 30 40 50 60 70 800123456789
101112
Supp
ort p
ress
ure
ratio
Maximum heave (mm)
0.5D 1.0D 1.5D
Figure 8. Curves of the heaving and face support pressure.
3.1.4. Measurement of Soil Deformation with PIV Particle Image Velocimetry (PIV) was adopted to monitor subsurface soil
displacement on the vertical plane of symmetry in the test, which can enable displacement measurement at potentially thousands of points of the model with high accuracy by tracking the soil texture within a digital image and through successive images to monitor subsurface soil displacement on the vertical plane of symmetry. The PIV results are presented in the experimental type scale.
The ground movement when the support pressure reaches the maximum value, that is, when the faceplate advances to the maximum value under different buried depths are shown in Figure 9. As it can be seen, the disturbance range of the ground induced by the excavation face advancement is roughly shaped “fishtail”, which will be discussed in Section 4.1. It should be pointed that there exists a settlement area above the face. This phenomenon is attributed to the soil particles slide induced by the advancement of the faceplate, which imposes a squeezing effect on the soil at the face and accelerated the soil particles in front of the excavation to tend to squeeze forward and upward as a whole. As a result, the soil above the excavation surface is also disturbed and tends to slide forward and downward, which in turn causes the surface settlement directly above the excavation surface. In addition, the PIV analysis shows that the soil deformation characteristics are consistent with the results monitored by the laser displacement sensor that the ground movement can extend to the surface at both burial depths of 0.5 D and 1.0 D while it is difficult for the tunnel located at C/D ratio equals to 1.5 to extend to the surface. For the
Figure 8. Curves of the heaving and face support pressure.
3.1.4. Measurement of Soil Deformation with PIV
Particle Image Velocimetry (PIV) was adopted to monitor subsurface soil displacementon the vertical plane of symmetry in the test, which can enable displacement measurementat potentially thousands of points of the model with high accuracy by tracking the soiltexture within a digital image and through successive images to monitor subsurface soildisplacement on the vertical plane of symmetry. The PIV results are presented in theexperimental type scale.
The ground movement when the support pressure reaches the maximum value, thatis, when the faceplate advances to the maximum value under different buried depths areshown in Figure 9. As it can be seen, the disturbance range of the ground induced bythe excavation face advancement is roughly shaped “fishtail”, which will be discussed inSection 4.1. It should be pointed that there exists a settlement area above the face. Thisphenomenon is attributed to the soil particles slide induced by the advancement of thefaceplate, which imposes a squeezing effect on the soil at the face and accelerated the soilparticles in front of the excavation to tend to squeeze forward and upward as a whole. Asa result, the soil above the excavation surface is also disturbed and tends to slide forwardand downward, which in turn causes the surface settlement directly above the excavationsurface. In addition, the PIV analysis shows that the soil deformation characteristics areconsistent with the results monitored by the laser displacement sensor that the groundmovement can extend to the surface at both burial depths of 0.5 D and 1.0 D while it isdifficult for the tunnel located at C/D ratio equals to 1.5 to extend to the surface. For thecase where the ground movements propagate to the surface, the settlement area and theheaved area will be specifically discussed in Section 4.1.

Appl. Sci. 2022, 12, 5802 11 of 21
Appl. Sci. 2022, 12, x FOR PEER REVIEW 12 of 22
case where the ground movements propagate to the surface, the settlement area and the heaved area will be specifically discussed in Section 4.1.
Figure 9. Characteristic vector diagram of ground deformation under different buried depths (excess support pressure).
3.2. Insufficient Support Pressure 3.2.1. Support Pressure Ratio
The variation of the support pressure ratio with the backward displacement of the faceplate is shown in Figure 10. The support pressure firstly decreases steeply to the minimum value immediately after initialization of the faceplate displacement and then slightly increases gradually to a steady state. The support pressure reaches its limit within a small excavation face displacement. The greater the buried depth, the greater the displacement of the excavation face when reaching the limit support pressure.
-2 0 2 4 6 8 10 12 14 16 180.65
0.70
0.75
0.80
0.85
0.90
0.95
1.00
1.05
Supp
ort p
ress
ure
ratio
Tunnel face displacement (mm)
0.5D 1.0D 1.5D
Figure 10. The law of supporting pressure changing with the backward of the tunnel face.
3.2.2. Soil and Pore Pressure Different from that the support pressure increases steadily with the advancement of
the face. In the case of insufficient support pressure, there exists a relatively greater fluctuation in support pressure as the faceplate is going backward. Therefore, it is not appropriate to use support pressure as the x-axis. Figure 11 illustrated the soil pressure, pore pressure and support pressure change over time. Similar to the support pressure, the soil pressure dropped remarkably with the backward displacement of the faceplate. As the face displacement continued, the pressure approached a steady value. In terms of pore
Figure 9. Characteristic vector diagram of ground deformation under different buried depths (excesssupport pressure).
3.2. Insufficient Support Pressure3.2.1. Support Pressure Ratio
The variation of the support pressure ratio with the backward displacement of thefaceplate is shown in Figure 10. The support pressure firstly decreases steeply to the mini-mum value immediately after initialization of the faceplate displacement and then slightlyincreases gradually to a steady state. The support pressure reaches its limit within a smallexcavation face displacement. The greater the buried depth, the greater the displacementof the excavation face when reaching the limit support pressure.
Appl. Sci. 2022, 12, x FOR PEER REVIEW 12 of 22
case where the ground movements propagate to the surface, the settlement area and the heaved area will be specifically discussed in Section 4.1.
Figure 9. Characteristic vector diagram of ground deformation under different buried depths (excess support pressure).
3.2. Insufficient Support Pressure 3.2.1. Support Pressure Ratio
The variation of the support pressure ratio with the backward displacement of the faceplate is shown in Figure 10. The support pressure firstly decreases steeply to the minimum value immediately after initialization of the faceplate displacement and then slightly increases gradually to a steady state. The support pressure reaches its limit within a small excavation face displacement. The greater the buried depth, the greater the displacement of the excavation face when reaching the limit support pressure.
-2 0 2 4 6 8 10 12 14 16 180.65
0.70
0.75
0.80
0.85
0.90
0.95
1.00
1.05
Supp
ort p
ress
ure
ratio
Tunnel face displacement (mm)
0.5D 1.0D 1.5D
Figure 10. The law of supporting pressure changing with the backward of the tunnel face.
3.2.2. Soil and Pore Pressure Different from that the support pressure increases steadily with the advancement of
the face. In the case of insufficient support pressure, there exists a relatively greater fluctuation in support pressure as the faceplate is going backward. Therefore, it is not appropriate to use support pressure as the x-axis. Figure 11 illustrated the soil pressure, pore pressure and support pressure change over time. Similar to the support pressure, the soil pressure dropped remarkably with the backward displacement of the faceplate. As the face displacement continued, the pressure approached a steady value. In terms of pore
Figure 10. The law of supporting pressure changing with the backward of the tunnel face.
3.2.2. Soil and Pore Pressure
Different from that the support pressure increases steadily with the advancementof the face. In the case of insufficient support pressure, there exists a relatively greaterfluctuation in support pressure as the faceplate is going backward. Therefore, it is notappropriate to use support pressure as the x-axis. Figure 11 illustrated the soil pressure,pore pressure and support pressure change over time. Similar to the support pressure, thesoil pressure dropped remarkably with the backward displacement of the faceplate. Asthe face displacement continued, the pressure approached a steady value. In terms of porepressure, it can be found a slight increase at P1 and P2, indicating that the support pressuresimilarly has little influence on it.

Appl. Sci. 2022, 12, 5802 12 of 21
Appl. Sci. 2022, 12, x FOR PEER REVIEW 13 of 22
pressure, it can be found a slight increase at P1 and P2, indicating that the support pressure similarly has little influence on it.
(a)
(b)
(c)
Figure 11. The variation of soil and pore pressures with the support pressure (insufficient supportpressure): (a) 0.5 D; (b) 1.0 D; (c) 1.5 D.

Appl. Sci. 2022, 12, 5802 13 of 21
3.2.3. Maximum Heave
Figure 12 presents the evolution of the maximum ground surface settlement duringthe decrease of support pressure at different buried depths. The maximum ground surfacesettlement was observed to increase slowly initially and then increased significantly asthe support pressure reached the limit state. The greater the buried depth, the larger thesettlement at the point of the limit state. Furthermore, it can be found that the supportpressure drops to the limit value within a small value. Once reaching the limit state, theground deformation was very sensitive to the variation of the face displacement, the grounddeformation expands rapidly while the support pressure keeps constant.
Appl. Sci. 2022, 12, x FOR PEER REVIEW 14 of 22
Figure 11. The variation of soil and pore pressures with the support pressure (insufficient support pressure: (a) 0.5 D; (b) 1.0 D; (c) 1.5 D.
3.2.3. Maximum Heave Figure 12 presents the evolution of the maximum ground surface settlement during
the decrease of support pressure at different buried depths. The maximum ground surface settlement was observed to increase slowly initially and then increased significantly as the support pressure reached the limit state. The greater the buried depth, the larger the settlement at the point of the limit state. Furthermore, it can be found that the support pressure drops to the limit value within a small value. Once reaching the limit state, the ground deformation was very sensitive to the variation of the face displacement, the ground deformation expands rapidly while the support pressure keeps constant.
0 20 40 60 80 100 120 140 160 180 200 220 2400.60
0.65
0.70
0.75
0.80
0.85
0.90
0.95
1.00
Supp
ort p
ress
ure
ratio
Maximum settlement (mm)
0.5D 1.0D 1.5D
Figure 12. Curves of the settlement and support pressure.
3.2.4. Measurement of Soil Deformation with PIV The displacement field for different overburden-to-diameter ratios is compared in
Figure 13, which is when the displacement of the faceplate is approximately 2 mm and the support pressure reaches its limit value in each buried depth. Usually, failure initiates near the tunnel face and propagates toward the ground surface until either a stabilizing arch is formed, or it reaches the ground surface causing a cavein [25]. For shallower tunnels located at C/D ratio equals to 0.5 and 1.0, a wedge-prism failure mechanism occurs in front of the tunnel face, and the failure zone has expanded to the ground surface while for deeper tunnels located at C/D ratio equaling to 1.5, it is difficult to expand to the ground surface which means the arch effect still exists [40]. For the latter, the ground movement appeared in a narrow vertical band only. Besides, at smaller overburden-to-diameter ratios, the extent of the chimney was wider, especially near the ground surface.
Figure 12. Curves of the settlement and support pressure.
3.2.4. Measurement of Soil Deformation with PIV
The displacement field for different overburden-to-diameter ratios is compared inFigure 13, which is when the displacement of the faceplate is approximately 2 mm and thesupport pressure reaches its limit value in each buried depth. Usually, failure initiates nearthe tunnel face and propagates toward the ground surface until either a stabilizing archis formed, or it reaches the ground surface causing a cavein [25]. For shallower tunnelslocated at C/D ratio equals to 0.5 and 1.0, a wedge-prism failure mechanism occurs infront of the tunnel face, and the failure zone has expanded to the ground surface while fordeeper tunnels located at C/D ratio equaling to 1.5, it is difficult to expand to the groundsurface which means the arch effect still exists [40]. For the latter, the ground movementappeared in a narrow vertical band only. Besides, at smaller overburden-to-diameter ratios,the extent of the chimney was wider, especially near the ground surface.
Appl. Sci. 2022, 12, x FOR PEER REVIEW 14 of 22
Figure 11. The variation of soil and pore pressures with the support pressure (insufficient support pressure: (a) 0.5 D; (b) 1.0 D; (c) 1.5 D.
3.2.3. Maximum Heave Figure 12 presents the evolution of the maximum ground surface settlement during
the decrease of support pressure at different buried depths. The maximum ground surface settlement was observed to increase slowly initially and then increased significantly as the support pressure reached the limit state. The greater the buried depth, the larger the settlement at the point of the limit state. Furthermore, it can be found that the support pressure drops to the limit value within a small value. Once reaching the limit state, the ground deformation was very sensitive to the variation of the face displacement, the ground deformation expands rapidly while the support pressure keeps constant.
0 20 40 60 80 100 120 140 160 180 200 220 2400.60
0.65
0.70
0.75
0.80
0.85
0.90
0.95
1.00
Supp
ort p
ress
ure
ratio
Maximum settlement (mm)
0.5D 1.0D 1.5D
Figure 12. Curves of the settlement and support pressure.
3.2.4. Measurement of Soil Deformation with PIV The displacement field for different overburden-to-diameter ratios is compared in
Figure 13, which is when the displacement of the faceplate is approximately 2 mm and the support pressure reaches its limit value in each buried depth. Usually, failure initiates near the tunnel face and propagates toward the ground surface until either a stabilizing arch is formed, or it reaches the ground surface causing a cavein [25]. For shallower tunnels located at C/D ratio equals to 0.5 and 1.0, a wedge-prism failure mechanism occurs in front of the tunnel face, and the failure zone has expanded to the ground surface while for deeper tunnels located at C/D ratio equaling to 1.5, it is difficult to expand to the ground surface which means the arch effect still exists [40]. For the latter, the ground movement appeared in a narrow vertical band only. Besides, at smaller overburden-to-diameter ratios, the extent of the chimney was wider, especially near the ground surface.
Figure 13. Characteristic vector diagram of ground deformation under different buried depths(insufficient support pressure).
Appl. Sci. 2022, 12, 5802 14 of 21
4. Discussion4.1. Ground Deformation Mechanism
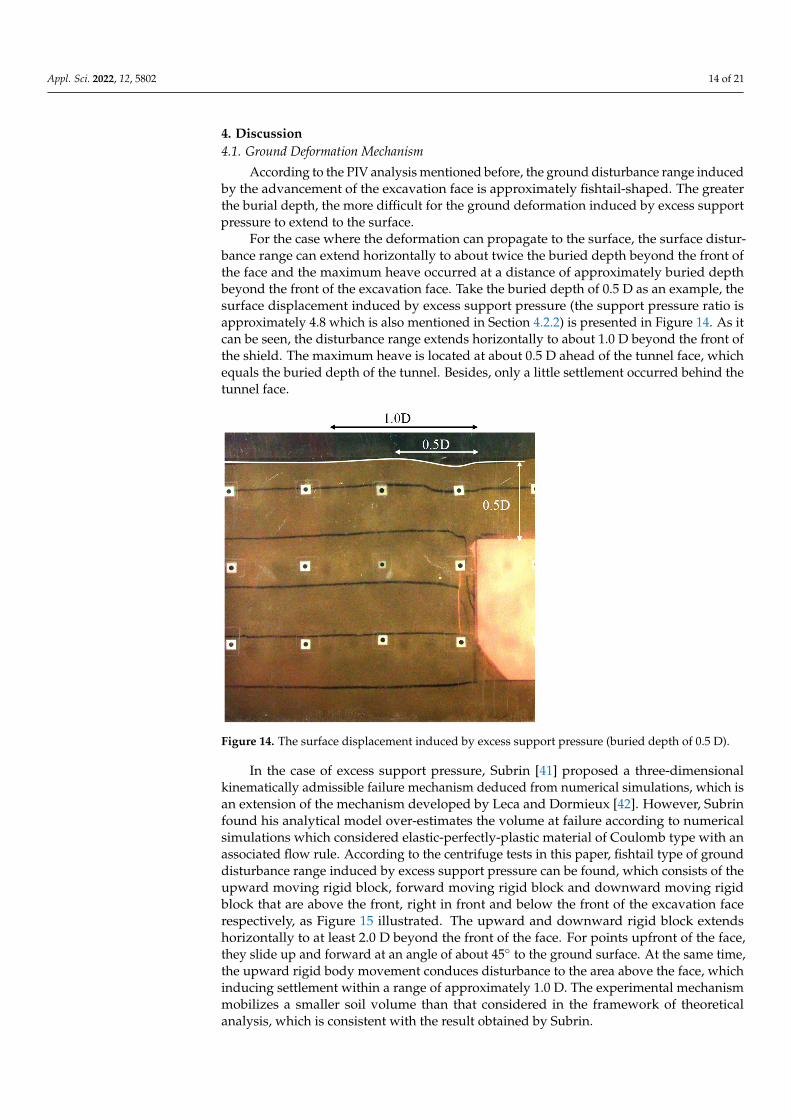
According to the PIV analysis mentioned before, the ground disturbance range inducedby the advancement of the excavation face is approximately fishtail-shaped. The greaterthe burial depth, the more difficult for the ground deformation induced by excess supportpressure to extend to the surface.
For the case where the deformation can propagate to the surface, the surface distur-bance range can extend horizontally to about twice the buried depth beyond the front ofthe face and the maximum heave occurred at a distance of approximately buried depthbeyond the front of the excavation face. Take the buried depth of 0.5 D as an example, thesurface displacement induced by excess support pressure (the support pressure ratio isapproximately 4.8 which is also mentioned in Section 4.2.2) is presented in Figure 14. As itcan be seen, the disturbance range extends horizontally to about 1.0 D beyond the front ofthe shield. The maximum heave is located at about 0.5 D ahead of the tunnel face, whichequals the buried depth of the tunnel. Besides, only a little settlement occurred behind thetunnel face.
Appl. Sci. 2022, 12, x FOR PEER REVIEW 15 of 22
Figure 13. Characteristic vector diagram of ground deformation under different buried depths (insufficient support pressure).
4. Discussion 4.1. Ground Deformation Mechanism
According to the PIV analysis mentioned before, the ground disturbance range induced by the advancement of the excavation face is approximately fishtail-shaped. The greater the burial depth, the more difficult for the ground deformation induced by excess support pressure to extend to the surface.
For the case where the deformation can propagate to the surface, the surface disturbance range can extend horizontally to about twice the buried depth beyond the front of the face and the maximum heave occurred at a distance of approximately buried depth beyond the front of the excavation face. Take the buried depth of 0.5 D as an example, the surface displacement induced by excess support pressure (the support pressure ratio is approximately 4.8 which is also mentioned in Section 4.2.2) is presented in Figure 14. As it can be seen, the disturbance range extends horizontally to about 1.0 D beyond the front of the shield. The maximum heave is located at about 0.5 D ahead of the tunnel face, which equals the buried depth of the tunnel. Besides, only a little settlement occurred behind the tunnel face.
Figure 14. The surface displacement induced by excess support pressure (buried depth of 0.5 D).
In the case of excess support pressure, Subrin [41] proposed a three-dimensional kinematically admissible failure mechanism deduced from numerical simulations, which is an extension of the mechanism developed by Leca and Dormieux [42]. However, Subrin found his analytical model over-estimates the volume at failure according to numerical simulations which considered elastic-perfectly-plastic material of Coulomb type with an associated flow rule. According to the centrifuge tests in this paper, fishtail type of ground disturbance range induced by excess support pressure can be found, which consists of the upward moving rigid block, forward moving rigid block and downward moving rigid block that are above the front, right in front and below the front of the excavation face respectively, as Figure 15 illustrated. The upward and downward rigid block extends horizontally to at least 2.0 D beyond the front of the face. For points upfront of the face, they slide up and forward at an angle of about 45° to the ground surface. At the same time, the upward rigid body movement conduces disturbance to the area above the face,
Figure 14. The surface displacement induced by excess support pressure (buried depth of 0.5 D).
In the case of excess support pressure, Subrin [41] proposed a three-dimensionalkinematically admissible failure mechanism deduced from numerical simulations, which isan extension of the mechanism developed by Leca and Dormieux [42]. However, Subrinfound his analytical model over-estimates the volume at failure according to numericalsimulations which considered elastic-perfectly-plastic material of Coulomb type with anassociated flow rule. According to the centrifuge tests in this paper, fishtail type of grounddisturbance range induced by excess support pressure can be found, which consists of theupward moving rigid block, forward moving rigid block and downward moving rigidblock that are above the front, right in front and below the front of the excavation facerespectively, as Figure 15 illustrated. The upward and downward rigid block extendshorizontally to at least 2.0 D beyond the front of the face. For points upfront of the face,they slide up and forward at an angle of about 45◦ to the ground surface. At the same time,the upward rigid body movement conduces disturbance to the area above the face, whichinducing settlement within a range of approximately 1.0 D. The experimental mechanismmobilizes a smaller soil volume than that considered in the framework of theoreticalanalysis, which is consistent with the result obtained by Subrin.
Appl. Sci. 2022, 12, 5802 15 of 21
Appl. Sci. 2022, 12, x FOR PEER REVIEW 16 of 22
which inducing settlement within a range of approximately 1.0 D. The experimental mechanism mobilizes a smaller soil volume than that considered in the framework of theoretical analysis, which is consistent with the result obtained by Subrin.
Figure 15. Ground deformation induced by excess support pressure.
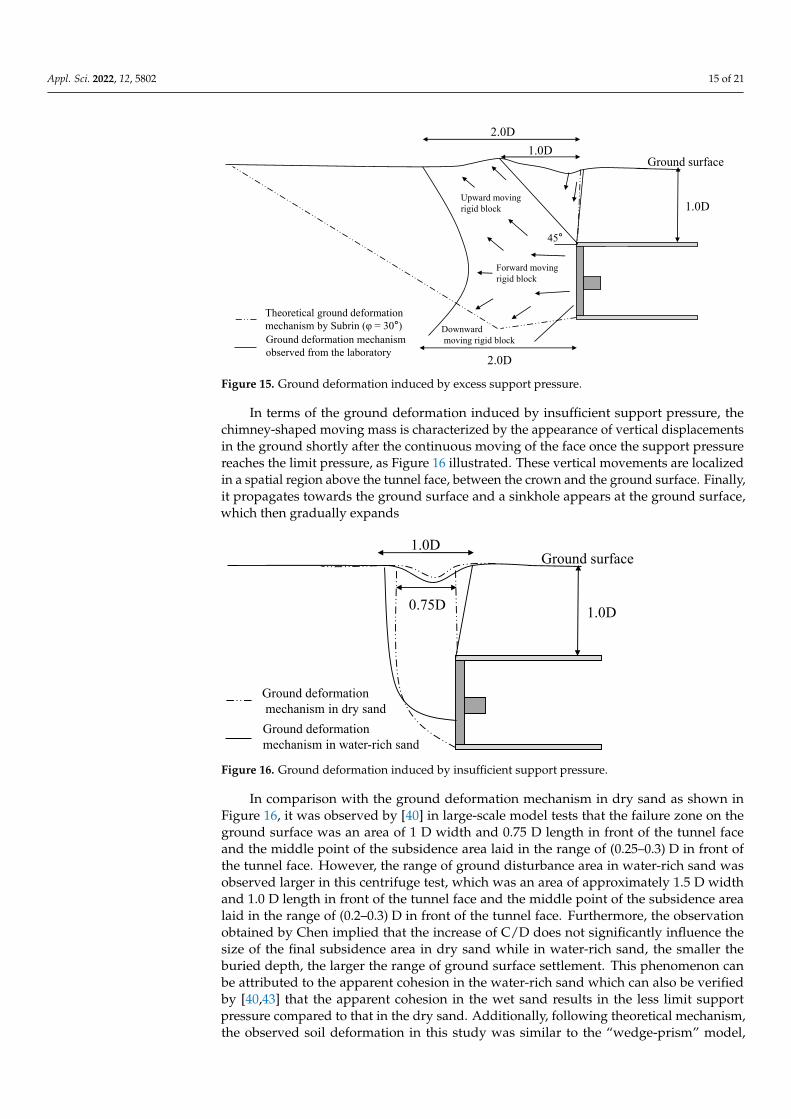
In terms of the ground deformation induced by insufficient support pressure, the chimney-shaped moving mass is characterized by the appearance of vertical displacements in the ground shortly after the continuous moving of the face once the support pressure reaches the limit pressure, as Figure 16 illustrated. These vertical movements are localized in a spatial region above the tunnel face, between the crown and the ground surface. Finally, it propagates towards the ground surface and a sinkhole appears at the ground surface, which then gradually expands
Figure 16. Ground deformation induced by insufficient support pressure.
In comparison with the ground deformation mechanism in dry sand as shown in Fig, 16, it was observed by [40] in large-scale model tests that the failure zone on the ground surface was an area of 1D width and 0.75D length in front of the tunnel face and the middle point of the subsidence area laid in the range of (0.25–0.3)D in front of the tunnel face. However, the range of ground disturbance area in water-rich sand was observed larger in this centrifuge test, which was an area of approximately 1.5D width and 1.0D length in front of the tunnel face and the middle point of the subsidence area laid in the range of (0.2–0.3)D in front of the tunnel face. Furthermore, the observation obtained by Chen implied that the increase of C/D does not significantly influence the size of the final
1.0D
Ground deformation mechanism observed from the laboratory
Upward movingrigid block
Downwardmoving rigid block
Forward moving rigid block
1.0D2.0D
Ground surface
Theoretical ground deformation mechanism by Subrin (φ = 30°)
2.0D
45°
1.0D
Ground deformation mechanism in water-rich sand
1.0D
0.75D
Ground surface
Ground deformationmechanism in dry sand
Figure 15. Ground deformation induced by excess support pressure.
In terms of the ground deformation induced by insufficient support pressure, thechimney-shaped moving mass is characterized by the appearance of vertical displacementsin the ground shortly after the continuous moving of the face once the support pressurereaches the limit pressure, as Figure 16 illustrated. These vertical movements are localizedin a spatial region above the tunnel face, between the crown and the ground surface. Finally,it propagates towards the ground surface and a sinkhole appears at the ground surface,which then gradually expands
Appl. Sci. 2022, 12, x FOR PEER REVIEW 16 of 22
which inducing settlement within a range of approximately 1.0 D. The experimental mechanism mobilizes a smaller soil volume than that considered in the framework of theoretical analysis, which is consistent with the result obtained by Subrin.
Figure 15. Ground deformation induced by excess support pressure.
In terms of the ground deformation induced by insufficient support pressure, the chimney-shaped moving mass is characterized by the appearance of vertical displacements in the ground shortly after the continuous moving of the face once the support pressure reaches the limit pressure, as Figure 16 illustrated. These vertical movements are localized in a spatial region above the tunnel face, between the crown and the ground surface. Finally, it propagates towards the ground surface and a sinkhole appears at the ground surface, which then gradually expands
Figure 16. Ground deformation induced by insufficient support pressure.
In comparison with the ground deformation mechanism in dry sand as shown in Fig, 16, it was observed by [40] in large-scale model tests that the failure zone on the ground surface was an area of 1D width and 0.75D length in front of the tunnel face and the middle point of the subsidence area laid in the range of (0.25–0.3)D in front of the tunnel face. However, the range of ground disturbance area in water-rich sand was observed larger in this centrifuge test, which was an area of approximately 1.5D width and 1.0D length in front of the tunnel face and the middle point of the subsidence area laid in the range of (0.2–0.3)D in front of the tunnel face. Furthermore, the observation obtained by Chen implied that the increase of C/D does not significantly influence the size of the final
1.0D
Ground deformation mechanism observed from the laboratory
Upward movingrigid block
Downwardmoving rigid block
Forward moving rigid block
1.0D2.0D
Ground surface
Theoretical ground deformation mechanism by Subrin (φ = 30°)
2.0D
45°
1.0D
Ground deformation mechanism in water-rich sand
1.0D
0.75D
Ground surface
Ground deformationmechanism in dry sand
Figure 16. Ground deformation induced by insufficient support pressure.
In comparison with the ground deformation mechanism in dry sand as shown inFigure 16, it was observed by [40] in large-scale model tests that the failure zone on theground surface was an area of 1 D width and 0.75 D length in front of the tunnel faceand the middle point of the subsidence area laid in the range of (0.25–0.3) D in front ofthe tunnel face. However, the range of ground disturbance area in water-rich sand wasobserved larger in this centrifuge test, which was an area of approximately 1.5 D widthand 1.0 D length in front of the tunnel face and the middle point of the subsidence arealaid in the range of (0.2–0.3) D in front of the tunnel face. Furthermore, the observationobtained by Chen implied that the increase of C/D does not significantly influence thesize of the final subsidence area in dry sand while in water-rich sand, the smaller theburied depth, the larger the range of ground surface settlement. This phenomenon canbe attributed to the apparent cohesion in the water-rich sand which can also be verifiedby [40,43] that the apparent cohesion in the wet sand results in the less limit supportpressure compared to that in the dry sand. Additionally, following theoretical mechanism,the observed soil deformation in this study was similar to the “wedge-prism” model,

Appl. Sci. 2022, 12, 5802 16 of 21
described by [44], consisting of two block elements: a prismatic wedge in front of the tunnelface with a prismatic chimney on top reaching the ground surface, which were also verifiedin other experiments, e.g., [43].
4.2. Surface Displacement4.2.1. Settlement Trough Width
According to previous studies, the transverse ground surface settlement trough overa tunnel can be described by a normal probability curve [27], which is widely accepted andmodified by many researchers [45,46], shown as the following equation:
Sv = Svmax exp(− x2
2i2) (3)
in which Sv is the vertical settlement at the distance x from the tunnel axis line, Svmax is themaximum vertical settlement generally located directly above the tunnel axis. i aline to thepoints of inflection of the settlement trough, which is also named settlement trough widthand can be described as [47]:
i = Kz (4)
where z is the depth of the tunnel and K is an empirical constant that is equal to 0.5–0.6 forcohesive soils, 0.2–0.3 for granular soils, 0.4–0.5 for stiff clay soils, and finally 0.6–0.7 forsilty clay soils.
For the sandy soil in water-rich, the observed sinkhole induced by insufficient supportpressure is shown in Figure 17, which demonstrates a narrow settlement trough width.Surface settlement in the transverse cross-section of the tunnel, derived from the lasersensor is shown in Figure 18. By fitting test data, a value of 0.25 for the settlement troughwidth is obtained.
Appl. Sci. 2022, 12, x FOR PEER REVIEW 17 of 22
subsidence area in dry sand while in water-rich sand, the smaller the buried depth, the larger the range of ground surface settlement. This phenomenon can be attributed to the apparent cohesion in the water-rich sand which can also be verified by [40,43] that the apparent cohesion in the wet sand results in the less limit support pressure compared to that in the dry sand. Additionally, following theoretical mechanism, the observed soil deformation in this study was similar to the “wedge-prism” model, described by [44], consisting of two block elements: a prismatic wedge in front of the tunnel face with a prismatic chimney on top reaching the ground surface, which were also verified in other experiments, e.g. [43].
4.2. Surface Displacement 4.2.1. Settlement Trough Width
According to previous studies, the transverse ground surface settlement trough over a tunnel can be described by a normal probability curve [27], which is widely accepted and modified by many researchers [45,46], shown as the following equation:
2
max 2exp( )2v vxS Si
= − (3)
in which vS is the vertical settlement at the distance x from the tunnel axis line, maxvS is the maximum vertical settlement generally located directly above the tunnel axis. i aline to the points of inflection of the settlement trough, which is also named settlement trough width and can be described as [47]:
i Kz= (4)
where z is the depth of the tunnel and K is an empirical constant that is equal to 0.5–0.6 for cohesive soils, 0.2–0.3 for granular soils, 0.4–0.5 for stiff clay soils, and finally 0.6–0.7 for silty clay soils.
For the sandy soil in water-rich, the observed sinkhole induced by insufficient support pressure is shown in Figure 17, which demonstrates a narrow settlement trough width. Surface settlement in the transverse cross-section of the tunnel, derived from the laser sensor is shown in Figure 18. By fitting test data, a value of 0.25 for the settlement trough width is obtained.
Figure 17. The sinkhole induced by insufficient support pressure. Figure 17. The sinkhole induced by insufficient support pressure.
Appl. Sci. 2022, 12, x FOR PEER REVIEW 18 of 22
-40 -30 -20 -10 0 10 20 30 40-90
-80
-70
-60
-50
-40
-30
-20
-10
0
0.5D Measured 1.0D Measured 1.5D Measured 0.5D Predicted 1.0D Predicted 1.5D Predicted
Settl
emen
t (m
m)
Transverse Distance (m) Figure 18. Settlement trough under different buried depths.
4.2.2. Relationship between Support Pressure and Maximum Displacement As previously mentioned, a normal probability curve to describe the transverse
ground surface settlement trough over a tunnel was proposed by Peck, the maximum settlement is equal to:
max 2vVSiπ
= (5)
where V is ground loss volume induced by tunneling construction. Based on the above analysis, it was found that the surface deformation has a strong
correlation with supporting pressure and buried depth. To carry out a quantitative analysis of the relationship between the support pressure and maximum displacement, the ground loss volume V in this paper is described as:
2
0 4PV m DP
πΔ= (6)
where m is the supporting pressure control coefficient related to the buried depth of the tunnel, D is the diameter of the tunnel, 0P is the initial pressure on the excavation which equals the sum of static water and lateral earth pressure, PΔ is the support pressure difference, for the excessive condition, it’s 0-sP P , for the insufficient condition it’s 0- sP P .
In this study, only the ground deformation before the excavation face reaches the limit state was investigated since it is not useful for practical engineering to clarify the relationship between displacement and support pressure beyond the limit pressure. Therefore, based on the centrifuge test, it was found that the relationships between the maximum surface displacement with support pressure are almost linear as Figure 19 illustrated. The proposed supporting pressure control coefficient m can be derived as a function of buried depth.
Figure 18. Settlement trough under different buried depths.

Appl. Sci. 2022, 12, 5802 17 of 21
4.2.2. Relationship between Support Pressure and Maximum Displacement
As previously mentioned, a normal probability curve to describe the transverse groundsurface settlement trough over a tunnel was proposed by Peck, the maximum settlement isequal to:
Svmax =V√2πi
(5)
where V is ground loss volume induced by tunneling construction.Based on the above analysis, it was found that the surface deformation has a strong
correlation with supporting pressure and buried depth. To carry out a quantitative analysisof the relationship between the support pressure and maximum displacement, the groundloss volume V in this paper is described as:
V = m∆PP0
π
4D2 (6)
where m is the supporting pressure control coefficient related to the buried depth of thetunnel, D is the diameter of the tunnel, P0 is the initial pressure on the excavation whichequals the sum of static water and lateral earth pressure, ∆P is the support pressuredifference, for the excessive condition, it’s Ps − P0, for the insufficient condition it’s P0 − Ps.
In this study, only the ground deformation before the excavation face reaches the limitstate was investigated since it is not useful for practical engineering to clarify the relation-ship between displacement and support pressure beyond the limit pressure. Therefore,based on the centrifuge test, it was found that the relationships between the maximumsurface displacement with support pressure are almost linear as Figure 19 illustrated.The proposed supporting pressure control coefficient m can be derived as a function ofburied depth.
Appl. Sci. 2022, 12, x FOR PEER REVIEW 19 of 22
0 1 2 3 4 5 6 7
0
2
4
6
8
10
12
14
Max
imum
hea
ve (m
m)
Support pressure ratio
0.5D Measured 1.0D Measured 1.5D Measured 0.5D Predicted m = 0.075 1.0D Predicted m = 0.085 1.5D Predicted m = 0.095
0.60 0.65 0.70 0.75 0.80 0.85 0.90 0.95 1.0002468
1012141618202224
Max
imum
Set
tlem
ent (
mm
)
Support pressure ratio
0.5D Measured 1.0D Measured 1.5D Measured 0.5D Predicted m = 1.2 1.0D Predicted m = 3.0 1.5D Predicted m = 5.5
(a) (b)
Figure 19. The relationship between support pressure ratio and maximum surface displacement: (a) excess support pressure; (b) insufficient support pressure.
Additionally, the critical displacement where the deformation no longer changes linearly is different under various conditions. For excess support pressure, the critical heave is approximately equaled to 9 mm (only buried depth of 0.5 D and 1.0 D can be obtained) but at different support pressure ratios which are approximately 4.8 and 6 respectively. It can be inferred that the greater the buried depth, the greater the support pressure ratio required. For insufficient support pressure, the maximum critical settlement varies from approximately 8.5 mm to 22 mm and the related support pressure ratio varies from approximately 0.8 to 0.67 as C/D changes from 0.5 to 1.5, which indicates that the greater the buried depth, the greater the maximum critical settlement and the smaller the related support pressure ratio.
4.3. Control of Support Pressure Based on the Surface Displacement In the complex urban environment, especially in areas with high requirements for
ground deformation, it is not enough to control the support pressure only by the pressure value of the limit state. Generally, during the construction of shield tunneling, the deformation caused by the support pressure of the excavation face accounts for 10% to 20% of the total deformation [1,2]. Therefore, reasonable determination of the support pressure can effectively control the ground deformation in front of the excavation face.
According to the results obtained in this paper, when the pressure increases to about 1 to 4 times the initial pressure, there exists a slight heave on the ground surface, and when the pressure continues to increase to more than 5 times, the surface deformation begins to increase significantly. However, at the same time, it will also bring about the surface settlement directly above the excavation face. Furthermore, when the burial depth is large (≥1.5D), the ground deformation caused by the excess support pressure is difficult to extend to the surface, but it will cause great disturbance in the ground, which may affect the structures in the ground. Therefore, the effect of reducing the initial settlement by increasing the support pressure is limited, and may even further cause greater surface settlement directly above the excavation surface. In the case of insufficient support pressure, the ground deformation is more sensitive compared with the excess support pressure. The shallower the buried depth, the more sensitive the ground deformation as well as the greater the range of ground deformation disturbance. In addition, when the buried depth of the tunnel is large, the ground deformation does not extend to the surface once the support pressure reaches the limit value, but as the excavation surface displacement continues to increase, the ground deformation begins to increase sharply. Hence, when the buried depth is shallow, the support pressure needs to be strictly
Figure 19. The relationship between support pressure ratio and maximum surface displacement:(a) excess support pressure; (b) insufficient support pressure.
Additionally, the critical displacement where the deformation no longer changeslinearly is different under various conditions. For excess support pressure, the criticalheave is approximately equaled to 9 mm (only buried depth of 0.5 D and 1.0 D canbe obtained) but at different support pressure ratios which are approximately 4.8 and6 respectively. It can be inferred that the greater the buried depth, the greater the supportpressure ratio required. For insufficient support pressure, the maximum critical settlementvaries from approximately 8.5 mm to 22 mm and the related support pressure ratio variesfrom approximately 0.8 to 0.67 as C/D changes from 0.5 to 1.5, which indicates that the

Appl. Sci. 2022, 12, 5802 18 of 21
greater the buried depth, the greater the maximum critical settlement and the smaller therelated support pressure ratio.
4.3. Control of Support Pressure Based on the Surface Displacement
In the complex urban environment, especially in areas with high requirements forground deformation, it is not enough to control the support pressure only by the pressurevalue of the limit state. Generally, during the construction of shield tunneling, the deforma-tion caused by the support pressure of the excavation face accounts for 10% to 20% of thetotal deformation [1,2]. Therefore, reasonable determination of the support pressure caneffectively control the ground deformation in front of the excavation face.
According to the results obtained in this paper, when the pressure increases to about1 to 4 times the initial pressure, there exists a slight heave on the ground surface, andwhen the pressure continues to increase to more than 5 times, the surface deformationbegins to increase significantly. However, at the same time, it will also bring about thesurface settlement directly above the excavation face. Furthermore, when the burial depthis large (≥1.5D), the ground deformation caused by the excess support pressure is difficultto extend to the surface, but it will cause great disturbance in the ground, which may affectthe structures in the ground. Therefore, the effect of reducing the initial settlement byincreasing the support pressure is limited, and may even further cause greater surfacesettlement directly above the excavation surface. In the case of insufficient support pressure,the ground deformation is more sensitive compared with the excess support pressure. Theshallower the buried depth, the more sensitive the ground deformation as well as the greaterthe range of ground deformation disturbance. In addition, when the buried depth of thetunnel is large, the ground deformation does not extend to the surface once the supportpressure reaches the limit value, but as the excavation surface displacement continues toincrease, the ground deformation begins to increase sharply. Hence, when the buried depthis shallow, the support pressure needs to be strictly controlled to avoid being insufficient.When the burial depth is large (≥1.5D), if the supporting pressure is insufficient, it isnecessary to pay attention to the discharge amount of soil to avoid further accelerating theground deformation disturbance.
In practical engineering, the limit of maximum ground surface displacement inducedby supporting pressure can be determined by the standard applied in the project. The sup-porting pressure control coefficient m can be derivated through the data of the test sectionand then the determined relationship between the support pressure and the maximumsurface deformation can provide theoretical guidance for construction. However, it needsimprovement and greater applicability through a lot of engineering practices.
5. Conclusions
A series of centrifuge tests in tunnels located at cover over diameter (C/D) ratiosequal to 0.5, 1.0 and 1.5 were carried out to investigate the ground deformation inducedby the variation of excess/insufficient support pressure. The soil pressure, pore pressure,maximum surface displacement and the ground movement induced by reduced/increasedsupport pressure were investigated. Based on the centrifuge test, the ground deformationmechanism was analyzed compared with previous studies and a supporting pressurecontrol coefficient was proposed to conduct quantitative analysis of surface deformationinduced by support pressure. Finally, the control of support pressure based on the sur-face deformation was discussed to provide some advice for practical engineering. Thenumerical investigation will be carried out in the future. The key findings in this paper aresummarized as follow:
(1) The ground disturbance range induced by excess support pressure is approximatelyfishtail-shaped. When the burial depth is shallow (<1.5D), the surface disturbancerange can extend horizontally to about twice buried depth beyond the front of theface and the maximum heave occurred at a distance of approximately buried depthbeyond the front of the excavation face. However, when the burial depth is large

Appl. Sci. 2022, 12, 5802 19 of 21
(≥1.5D), the ground deformation caused by the excess support pressure is difficult toextend to the surface, but it will cause great disturbance in the ground.
(2) The ground disturbance range induced by insufficient support pressure is approxi-mately chimney-shaped. The range of ground disturbance area in water-rich sandsoil induced by insufficient support pressure was observed to extend horizontally toabout buried depth beyond the front of the face which was larger than that in drysand soil. The shallower the buried depth, the more sensitive the ground deformationas well as the greater the range of ground surface settlement.
(3) A supporting pressure control coefficient which is related to buried depth is proposedto quantitatively describe the relationships between the surface displacement withsupport pressure and the relationship was found linear before the excavation facereaching the limit state.
(4) The effect of reducing the initial settlement by increasing the support pressure islimited, and may even further cause greater surface settlement directly above theexcavation surface. In comparison, the ground deformation is more sensitive in thecase of insufficient support pressure. For shallow tunnels, the support pressure needsto be strictly controlled to avoid being insufficient while for deep tunnels, if thesupporting pressure is insufficient, it is necessary to pay attention to the dischargeamount of soil to avoid further accelerating the ground deformation disturbance.
Author Contributions: Conceptualization, W.L. and D.Y.; methodology, P.L.; software, W.L.; validation,P.L. and D.J.; formal analysis, W.L.; investigation, W.L. and P.L.; resources, J.C. and G.Y.; datacuration, W.L. and P.L.; writing—original draft preparation, W.L.; writing—review and editing, P.L.;visualization, D.J.; supervision, D.Y.; project administration, J.C.; funding acquisition, D.Y. and D.J.All authors have read and agreed to the published version of the manuscript.
Funding: This study was supported by the National Natural Science Foundation of China underGrant No. 52008021, the Key Project of High-speed Rail Joint Fund of National Natural ScienceFoundation of China under Grant No. U1834208.
Institutional Review Board Statement: Not applicable.
Informed Consent Statement: Not applicable.
Data Availability Statement: The data presented in this study are available from the correspondingauthor upon request.
Acknowledgments: The authors gratefully acknowledge financial support from the National NaturalScience Foundation of China under Grant No. 52008021, the Key Project of High-speed Rail JointFund of National Natural Science Foundation of China under Grant No. U1834208. Appreciate forthe support by the CSC scholarship.
Conflicts of Interest: The authors declare no conflict of interest.
References1. Zhang, C.; Cai, Y.; Zhu, W. Numerical Study and Field Monitoring of the Ground Deformation Induced by Large Slurry Shield
Tunnelling in Sandy Cobble Ground. Adv. Civ. Eng. 2019, 2019, 4145721. [CrossRef]2. Yuan, D.J.; Yin, F.; Wang, H.W.; Qingfei, H.; Heng, X. Study of soil disturbance caused by super-large diameter slurry shield
tunnelling. Chin. J. Rock Mech. Eng. 2009, 28, 2074–2080. (In Chinese)3. Yuan, D.J.; Huang, Q.F.; Wang, Y. Risk Analysis and Countermeasures of Nanjing Yangtze River Tunnel During Large Diameter
Slurry Shield Tunneling. In Proceedings of the 2009 International Symposium on Risk Control and Management of Design,Construction and Operation in Underground Engineering, Dalian, China, 20–22 October 2009; pp. 190–193.
4. Luo, W.; Yuan, D.; Jin, D.; Lu, P.; Chen, J. Optimal Control of Slurry Pressure during Shield Tunnelling Based on Random Forestand Particle Swarm Optimization. Comput. Model. Eng. Sci. 2021, 128, 109–127. [CrossRef]
5. Jin, D.; Yuan, D.; Liu, S.; Li, X.; Luo, W. Performance of Existing Subway Tunnels Undercrossed by Four Closely Spaced ShieldTunnels. J. Perform. Constr. Facil. 2018, 33, 04018099. [CrossRef]
6. Yuan, D.; Luo, W.; Jin, D.; Lu, P. Hydraulic fracturing pressure of concentric double-layered cylinder in cohesive soil. Front. Struct.Civ. Eng. 2021, 15, 937–947. [CrossRef]
7. Lu, P.; Yuan, D.; Chen, J.; Jin, D.; Wu, J.; Luo, W. Face Stability Analysis of Slurry Shield Tunnels in Rock-Soil Interface MixedGround. KSCE J. Civ. Eng. 2021, 25, 2250–2260. [CrossRef]

Appl. Sci. 2022, 12, 5802 20 of 21
8. Jin, D.; Zhang, Z.; Yuan, D. Effect of dynamic cutterhead on face stability in EPB shield tunneling. Tunn. Undergr. Space Technol.2021, 110, 103827. [CrossRef]
9. Mollon, G.; Dias, D.; Soubra, A.-H. Probabilistic analyses of tunneling-induced ground movements. Acta Geotech. 2013, 8,181–199. [CrossRef]
10. Abdel-Sayed, G.; Salib, S.R. Minimum depth of soil cover above soil–steel bridges. J. Geotech. Geoenvironmental Eng. 2002, 128,672–681. [CrossRef]
11. Yeau, K.Y.; Sezen, H.; Fox, P.J. Simulation of behavior of in-service metal culverts. J. Pipeline Syst. Eng. Pract. 2014, 5, 04013016. [CrossRef]12. Brachman, R.W.I.; Elshimi, T.M.; Mak, A.C.; Moore, I.D. Testing and Analysis of a Deep-Corrugated Large-Span Box Culvert prior
to Burial. J. Bridg. Eng. 2012, 17, 81–88. [CrossRef]13. Lei, H.; Zhang, Y.; Hu, Y.; Liu, Y. Model test and discrete element method simulation of shield tunneling face stability in
transparent clay. Front. Struct. Civ. Eng. 2021, 15, 147–166. [CrossRef]14. Berthoz, N.; Branque, D.; Subrin, D.; Wong, H.; Humbert, E. Face failure in homogeneous and stratified soft ground: Theoretical
and experimental approaches on 1g EPBS reduced scale model. Tunn. Undergr. Space Technol. 2012, 30, 25–37. [CrossRef]15. Wong, K.; Sing, W.K.; Chen, Y.; Bian, X. Centrifuge and numerical investigation of passive failure of tunnel face in sand.
Tunn. Undergr. Space Technol. 2012, 28, 297–303. [CrossRef]16. Ng, C.; Wong, K. Investigation of passive failure and deformation mechanisms due to tunnelling in clay. Can. Geotech. J. 2013, 50,
359–372. [CrossRef]17. Kasper, T.; Meschke, G. A numerical study of the effect of soil and grout material properties and cover depth in shield tunnelling.
Comput. Geotech. 2006, 33, 234–247. [CrossRef]18. Hu, X.; Fu, W.; Ju, J.W.; He, C.; Fang, Y.; Wang, J. Face stability conditions in granular soils during the advancing and stopping of
earth-pressure-balanced-shield machine. Tunn. Undergr. Space Technol. 2021, 109, 103755. [CrossRef]19. Chen, R.; Yin, X.; Tang, L.; Chen, Y. Centrifugal model tests on face failure of earth pressure balance shield induced by steady
state seepage in saturated sandy silt ground. Tunn. Undergr. Space Technol. 2018, 81, 315–325. [CrossRef]20. Franza, A.; Marshall, A.M.; Zhou, B. Greenfield tunnelling in sands: The effects of soil density and relative depth. Geotechnique
2019, 69, 297–307. [CrossRef]21. Soranzo, E.; Tamagnini, R.; Wu, W. Face stability of shallow tunnels in partially saturated soil: Centrifuge testing and numerical
analysis. Geotechnique 2015, 65, 454–467. [CrossRef]22. Davis, E.H.; Gunn, M.J.; Mair, R.J.; Seneviratine, H.N. The stability of shallow tunnels and underground openings in cohesive
material. Geotechnique 1980, 30, 397–416. [CrossRef]23. Anagnostou, G.; Kovári, K. The face stability of slurry-shield-driven tunnels. Tunn. Undergr. Space Technol. 1994, 9,
165–174. [CrossRef]24. Mollon, G.; Dias, D.; Soubra, A.-H. Face Stability Analysis of Circular Tunnels Driven by a Pressurized Shield. J. Geotech.
Geoenvironmental Eng. 2009, 136, 215–229. [CrossRef]25. Idinger, G.; Aklik, P.; Wu, W.; Borja, R.I. Centrifuge model test on the face stability of shallow tunnel. Acta Geotech. 2011, 6,
105–117. [CrossRef]26. Verruijt, A.; Booker, J.R. Surface settlements due to deformation of a tunnel in an elastic half plane. Géotechnique 1998, 48,
709–713. [CrossRef]27. Peck, R.B. Deep Excavations and Tunneling in Soft Ground. Proc. 7th ICSMFE 1969, 225–290. Available online: https://ci.nii.ac.
jp/naid/10012600540/ (accessed on 8 May 2022).28. Zhu, C.; Li, N. Prediction and analysis of surface settlement due to shield tunneling for Xi’an Metro. Can. Geotech. J. 2017, 54,
529–546. [CrossRef]29. Jin, D.; Shen, X.; Yuan, D. Theoretical analysis of three-dimensional ground displacements induced by shield tunneling.
Appl. Math. Model. 2020, 79, 85–105.30. Zhang, Z.; Hu, X.; Scott, K.D. A discrete numerical approach for modeling face stability in slurry shield tunnelling in soft soils.
Comput. Geotech. 2011, 38, 94–104. [CrossRef]31. Zhang, C.; Han, K.; Zhang, D. Face stability analysis of shallow circular tunnels in cohesive–frictional soils. Tunn. Undergr.
Space Technol. 2015, 50, 345–357. [CrossRef]32. Pan, Q.; Dias, D. The effect of pore water pressure on tunnel face stability. Int. J. Numer. Anal. Methods Geomech. 2016, 40,
2123–2136. [CrossRef]33. Zhang, P.; Chen, R.-P.; Wu, H.-N.; Liu, Y. Ground settlement induced by tunneling crossing interface of water-bearing mixed
ground: A lesson from Changsha, China. Tunn. Undergr. Space Technol. 2020, 96, 103224. [CrossRef]34. Yin, X.; Chen, R.; Meng, F.; Ding, Z.; Cui, Y.; Hedayat, A.; Mooney, M. Face stability of slurry-driven shield with permeable filter
cake. Tunn. Undergr. Space Technol. 2021, 111, 103841. [CrossRef]35. Maleska, T.; Beben, D. Numerical analysis of a soil-steel bridge during backfilling using various shell models. Eng. Struct. 2019,
196, 109358. [CrossRef]36. Aydingun, O.; Adalier, K. Numerical analysis of seismically induced liquefaction in earth embankment foundations. Part I.
Benchmark model. Can. Geotech. J. 2003, 40, 753–765. [CrossRef]37. Chen, R.; Zhang, P.; Wu, H.; Wang, Z.; Zhong, Z. Prediction of shield tunneling-induced ground settlement using machine
learning techniques. Front. Struct. Civ. Eng. 2019, 13, 1363–1378. [CrossRef]

Appl. Sci. 2022, 12, 5802 21 of 21
38. Garnier, J.; Gaudin, C.; Springman, S.M.; Culligan, P.J.; Goodings, D.; Konig, D.; Kutter, B.; Phillips, R.; Randolph, M.F.; Thorel, L.Catalogue of scaling laws and similitude questions in geotechnical centrifuge modelling. Int. J. Phys. Model. Geotech. 2007, 7,1–23. [CrossRef]
39. Chapman, D.N.; Ahn, S.K.; Hunt, D.V. Investigating ground movements caused by the construction of multiple tunnels in softground using laboratory model tests. Can. Geotech. J. 2007, 44, 631–643. [CrossRef]
40. Chen, R.-P.; Li, J.; Kong, L.-G.; Tang, L.-J. Experimental study on face instability of shield tunnel in sand. Tunn. Undergr.Space Technol. 2013, 33, 12–21. [CrossRef]
41. Subrin, D. Etudes Théoriques sur la Stabilité et le Comportement des Tunnels Renforcés par Boulonnage. Ph.D. Thesis, InstitutNational des Sciences Appliquées de Lyon, Villeurbanne, France, 2002.
42. Leca, E.; Dormieux, L. Upper and lower bound solutions for the face stability of shallow circular tunnels in frictional material.Geotechnique 1990, 40, 581–606. [CrossRef]
43. Chambon, P.; Corté, J. Shallow Tunnels in Cohesionless Soil: Stability of Tunnel Face. J. Geotech. Eng. 1994, 120, 1148–1165. [CrossRef]44. Horn, N. Horizontaler erddruck auf senkrechte abschlussflächen von tunnelröhren. Landeskonferenz Der Ung. Tiefbauindustrie
1961, 7, 16.45. Zhang, P.; Yin, Z.-Y.; Chen, R.-P. Analytical and Semi-Analytical Solutions for Describing Tunneling-Induced Transverse and
Longitudinal Settlement Troughs. Int. J. Géomeéch. 2020, 20, 04020126. [CrossRef]46. Zhao, C.; Lavasan, A.A.; Barciaga, T.; Schanz, T. Mechanized tunneling induced ground movement and its dependency on the
tunnel volume loss and soil properties. Int. J. Numer. Anal. Methods Géoméch. 2019, 43, 781–800. [CrossRef]47. O’Reilly, M.P.; New, B.M. Settlements above Tunnels in the United Kingdom-Their Magnitude and Prediction. 1982. Available
online: https://trid.trb.org/view/186714 (accessed on 8 May 2022).