Cause of kinematic differences during centrifugal and centripetal saccades
12
Cause of kinematic differences during centrifugal and centripetal saccades Ansgar R. Koene * , Casper J. Erkelens Department Physics of Man, Faculty of Physics and Astronomy, Utrecht University, Princetonplein 5, 3584 CC Utrecht, Netherlands Received 22 October 2001; received in revised form 9 April 2002 Abstract Measurements of eye movements have shown that centrifugal movements (i.e. away from the primary position) have a lower maximum velocity and a longer duration than centripetal movements (i.e. toward the primary position) of the same size. In 1988 Pelisson proposed that these kinematic differences might be caused by differences in the neural command signals, oculomotor mechanics or a combination of the two. By using the result of muscle force measurements that were made in recent years (Orbit TM 1.8 Gaze mechanics simulation, Ei- dactics, San Francisco, 1999) we simulated the muscle forces during centrifugal and centripetal saccades. Based on these simulations we show that the cause of the kinematic differences between the centrifugal and centripetal saccades is the non-linear force–velocity relationship (i.e. muscle viscosity) of the muscles. Ó 2002 Elsevier Science Ltd. All rights reserved. Keywords: Saccade kinematics; Oculomotor plant; Centripetal; Centrifugal; Simulation 1. Introduction Studies of saccade velocity profiles by Abel, Dell’Osso, Daroff, and Parker (1979), Collewijn, Erke- lens, and Steinman (1988), Eggert, Mezger, Robinson, and Straube (1999), Pelisson and Prablanc (1988) and Rottach, Das, Wohlgemuth, Zivotofsky, and Leigh (1998) have shown that the kinematics of saccadic eye movements differ for movements towards the primary position (centripetal movements) and movements away from the primary position (centrifugal movements). In his 1988 paper Pelisson proposed that the observed ki- nematic differences might be caused either by the neural command signals or the oculomotor mechanics, or a combination of the two. Regarding the neural command signals it has been known for many years (Robinson, 1964) that for a sac- cade to occur, a pulse-step signal must be sent from oculomotor nuclei to the extraocular muscles; a high frequency phasic activity (pulse) is required for the eyes to move quickly against high viscous forces and a regular tonic activity (step) to hold the eyes at their new posi- tion against elastic restoring forces. The known ana- tomical connections between the pulse generator for horizontal saccades and the muscles suggest that the antagonistic pair of muscles is organized in a push– pull arrangement (see Fuchs, Kaneko, & Scudder, 1985). As a consequence, the phasic command would appar- ently produce opposite but proportional modulations of firing frequency in the agonist (pulse of activation, Fig. 1) and in the antagonist muscles (pulse of deacti- vation, Fig. 1). However electrophysiological recordings from motoneurons in monkey have shown that for sac- cade amplitudes larger then 10° antagonist motoneurons are totally inhibited irrespective of initial eye orientation (Cullen & Guitton, 1997; Fuchs & Lushei, 1970; Rob- inson, 1970). Therefore the intensity of the deactivation is equal to the tonic activity at the beginning of the saccade (Fig. 1). Since the tonic activity increases with the ocular deviation toward the muscle concerned, the deactivation of the antagonist muscle is proportional to the initial eye deviation in the opposite direction to the saccade (off direction). Thus the smaller the initial eye position in the off direction (i.e. the smaller the initial centripetal component) the smaller the deactivation step becomes. Pelisson and Prablanc argued that this loss of * Corresponding author. Fax: +31-30-25-22-664. E-mail address: [email protected] (A.R. Koene). 0042-6989/02/$ - see front matter Ó 2002 Elsevier Science Ltd. All rights reserved. PII:S0042-6989(02)00110-4 www.elsevier.com/locate/visres Vision Research 42 (2002) 1797–1808
-
Upload
nottingham -
Category
Documents
-
view
2 -
download
0
Transcript of Cause of kinematic differences during centrifugal and centripetal saccades
Cause of kinematic differences during centrifugaland centripetal saccades
Ansgar R. Koene *, Casper J. Erkelens
Department Physics of Man, Faculty of Physics and Astronomy, Utrecht University, Princetonplein 5, 3584 CC Utrecht, Netherlands
Received 22 October 2001; received in revised form 9 April 2002
Abstract
Measurements of eye movements have shown that centrifugal movements (i.e. away from the primary position) have a lower
maximum velocity and a longer duration than centripetal movements (i.e. toward the primary position) of the same size. In 1988
Pelisson proposed that these kinematic differences might be caused by differences in the neural command signals, oculomotor
mechanics or a combination of the two.
By using the result of muscle force measurements that were made in recent years (OrbitTM1.8 Gaze mechanics simulation, Ei-
dactics, San Francisco, 1999) we simulated the muscle forces during centrifugal and centripetal saccades. Based on these simulations
we show that the cause of the kinematic differences between the centrifugal and centripetal saccades is the non-linear force–velocity
relationship (i.e. muscle viscosity) of the muscles.
� 2002 Elsevier Science Ltd. All rights reserved.
Keywords: Saccade kinematics; Oculomotor plant; Centripetal; Centrifugal; Simulation
1. Introduction
Studies of saccade velocity profiles by Abel,Dell’Osso, Daroff, and Parker (1979), Collewijn, Erke-lens, and Steinman (1988), Eggert, Mezger, Robinson,and Straube (1999), Pelisson and Prablanc (1988) andRottach, Das, Wohlgemuth, Zivotofsky, and Leigh(1998) have shown that the kinematics of saccadic eyemovements differ for movements towards the primaryposition (centripetal movements) and movements awayfrom the primary position (centrifugal movements). Inhis 1988 paper Pelisson proposed that the observed ki-nematic differences might be caused either by the neuralcommand signals or the oculomotor mechanics, or acombination of the two.
Regarding the neural command signals it has beenknown for many years (Robinson, 1964) that for a sac-cade to occur, a pulse-step signal must be sent fromoculomotor nuclei to the extraocular muscles; a highfrequency phasic activity (pulse) is required for the eyesto move quickly against high viscous forces and a regular
tonic activity (step) to hold the eyes at their new posi-tion against elastic restoring forces. The known ana-tomical connections between the pulse generator forhorizontal saccades and the muscles suggest that theantagonistic pair of muscles is organized in a push–pull arrangement (see Fuchs, Kaneko, & Scudder, 1985).As a consequence, the phasic command would appar-ently produce opposite but proportional modulationsof firing frequency in the agonist (pulse of activation,Fig. 1) and in the antagonist muscles (pulse of deacti-vation, Fig. 1). However electrophysiological recordingsfrom motoneurons in monkey have shown that for sac-cade amplitudes larger then 10� antagonist motoneuronsare totally inhibited irrespective of initial eye orientation(Cullen & Guitton, 1997; Fuchs & Lushei, 1970; Rob-inson, 1970). Therefore the intensity of the deactivationis equal to the tonic activity at the beginning of thesaccade (Fig. 1). Since the tonic activity increases withthe ocular deviation toward the muscle concerned, thedeactivation of the antagonist muscle is proportional tothe initial eye deviation in the opposite direction to thesaccade (off direction). Thus the smaller the initial eyeposition in the off direction (i.e. the smaller the initialcentripetal component) the smaller the deactivation stepbecomes. Pelisson and Prablanc argued that this loss of
*Corresponding author. Fax: +31-30-25-22-664.
E-mail address: [email protected] (A.R. Koene).
0042-6989/02/$ - see front matter � 2002 Elsevier Science Ltd. All rights reserved.
PII: S0042-6989 (02 )00110-4
www.elsevier.com/locate/visres
Vision Research 42 (2002) 1797–1808

signal between premotor burst neurons and motoneu-rons, related to the low tonic activity of the latter andproportional to initial eye position, is a reasonable ex-planation of the observed increase of maximum saccadevelocity with initial centripetal component.
Pelisson and Prablanc went on to describe some ofthe mechanical non-linearities that have been foundat the level of the ocular mechanics. In cat (Robin-son, 1964) and in man (Collins, Lennerstrand, & Bach-Y-Rita, 1975a; Collins, O’Meara, & Scott, 1975b;Miller & Robinson, 1984; Miller, Pavlovski, & Shama-eva, 1999) extraocular muscles have non-linear length–tension relationships, with increased stiffness of thestretched (antagonist) muscle with ocular deviation. Theviscous properties of the mechanical plant also seemnon-linear (Collins et al., 1975a; Cook & Stark, 1968).They therefore felt that accurate simulations of theoculomotor plant are required to assess the effect ofthese mechanical non-linearities and of their complexinterplay on the kinematics of saccades initiated fromdifferent initial positions.
Pelisson and Prablanc concluded that although thenon-linearity of neural commands seems to be a rea-sonable explanation of the observed velocity changes,peripheral non-linearities cannot yet be ruled out.
In the 13 years since Collewijn et al. (1988) and Pel-isson and Prablanc (1988) published their findings agreat deal of work has been done on deriving bettermodels of the oculomotor control system that drivessaccades (Gancarz & Grossberg, 1998; Quaia, Lefevre,& Optican, 1999) and new data has allowed the con-struction of more detailed models of the ocular me-
chanics (Miller et al., 1999). The degree to which thedifference in centrifugal and centripetal saccade kine-matics is caused by neural signal saturation or eye plantmechanics, however, has as yet remained unanswered.
Answering this question may help us to gain moreinsight into the way in which the signal driving thesaccades is modulated to account for starting positiondifferences.
In this paper we investigate the degree to which themechanical and the neural non-linearities contribute tothe kinematic differences between centrifugal and cen-tripetal saccades. Based on the velocity profiles of cen-trifugal and centripetal saccades we calculate the forcesand muscle innervations during these eye movements.For the calculation of the forces in the muscles, and thecorresponding muscle innervations, we used a model ofthe eye plant based on the work by Clark and Stark(1974a,b), Collins et al. (1975a), Pfann, Keller, andMiller (1995) and Robinson and Zuber (1981) and thedata from implanted force transducer experiments pub-lished by Miller and Robins (1992), Miller et al. (1999)and Pfann et al. (1995). In contrast to these earlierstudies, however, we did not use the model to synthesizeeye movements frommuscle innervation profiles. Insteadwe inverted the model to allow us to calculate the muscleinnervations and muscle forces from eye movementprofiles. An overview of the step-wise process of calcu-lating the muscle forces and innervation during saccadesis shown in Fig. 2. At each step we compared the force(innervation) profiles that were calculated for the cen-trifugal saccade with the corresponding profiles for thecentripetal saccade and correlate this with the kinematicdifferences.
2. Method
In order to determine the contributions of the me-chanical and neural properties of the saccade system tothe kinematic differences between centrifugal and cen-tripetal saccades we measured the eye movements andused a model of the eye plant, based on implanted forcetransducer data from Miller et al. (1999), to simulate theforces acting on the eye during these saccades.
The total force acting on the eye (Ftotal) was found bytaking the second derivative of the measured eye posi-tion profiles (resulting in eye acceleration profiles) andapplying Newton’s third law. The passive forces (Fpassive),
Fig. 2. Step-wise process of calculating muscle forces and innervation during saccades.
Fig. 1. Schematic representation of the pulse-step signal sent to the
agonist and antagonist muscles.
1798 A.R. Koene, C.J. Erkelens / Vision Research 42 (2002) 1797–1808
which include the muscle elasticity, orbital viscosity andorbital elasticity and which depends directly on eyeorientation and velocity properties, were derived fromthe measured eye movement profiles using the eye plantmodel. To find the actively generated forces (Factive),which depend directly on the muscle innervation andwhich includes the contractile and viscous muscle pro-perties, we subtracted Fpassive from Ftotal. We then usedthe eye plant model to find the innervation of the mus-cles that generated Factive.
2.1. Experimental procedures
The eye movements were recorded using the magneticsearch coil technique (Collewijn, Van der Mark, &Jansen, 1975; Robinson, 1963). The movements of theright eye were sampled at 500 Hz and stored by acomputer. The subject sat within the magnetic fieldswith his head immobilized with a bite bar. The five vi-sual targets were back-projected onto a flat screen at thehight of the subjects eyes. The visual targets were Xs(24.5’ of visual angle) and were constantly visiblethroughout the experiment. The subject was seated 1:5m in front of the screen such that the right eye wasaligned with the central target. The targets were posi-tioned at 10� and 20� to the right and to the left of thecentral target. The subject made self paced saccadesbetween each of these targets. Velocity profiles werecomputed by taking the first derivative of the measuredeye position profiles. The eye movements between pointsof equal eccentricity were then pooled together to de-termine the mean eye movement profile (and standarddeviation) for saccades between these two respectivepoints. We also averaged over adducting and abduc-ting eye movements in order to remove (average out)movement directional effects caused by inequalities be-tween the lateral and medial rectus muscles. For theremainder of the work only the average movement pro-files were used. The acceleration ðaÞ profiles of these av-eraged eye movements were computed by taking thederivative of the velocity ðxÞ profiles ða ¼ dx=dtÞ.
The total force acting on the eye was determined fromthe acceleration profiles by applying Newton’s third law.The moment of inertia of the eye was assumed to be4:3� 10�5 gf s2/deg which is the average value for hu-mans as reported by Clark and Stark (1974a).
The model of the eye plant that was used to simulatethe forces acting on the eye is given in Section 2.2.
2.2. The eye plant model
The Hill-type mechanistic model of the horizontalsaccadic system which is used in our work was based onsimilar models that were previously developed by Clarkand Stark, 1974a,b; Collins et al. (1975a); Pfann et al.(1995) and Robinson and Zuber (1981). Most of the
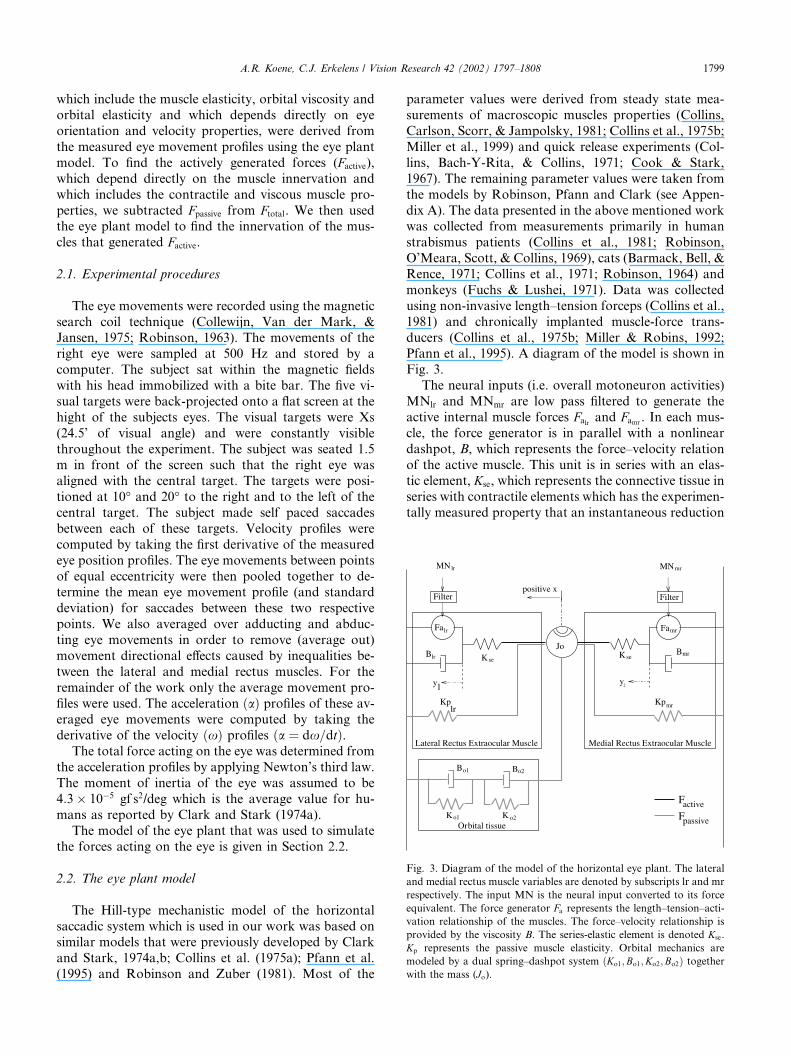
parameter values were derived from steady state mea-surements of macroscopic muscles properties (Collins,Carlson, Scorr, & Jampolsky, 1981; Collins et al., 1975b;Miller et al., 1999) and quick release experiments (Col-lins, Bach-Y-Rita, & Collins, 1971; Cook & Stark,1967). The remaining parameter values were taken fromthe models by Robinson, Pfann and Clark (see Appen-dix A). The data presented in the above mentioned workwas collected from measurements primarily in humanstrabismus patients (Collins et al., 1981; Robinson,O’Meara, Scott, & Collins, 1969), cats (Barmack, Bell, &Rence, 1971; Collins et al., 1971; Robinson, 1964) andmonkeys (Fuchs & Lushei, 1971). Data was collectedusing non-invasive length–tension forceps (Collins et al.,1981) and chronically implanted muscle-force trans-ducers (Collins et al., 1975b; Miller & Robins, 1992;Pfann et al., 1995). A diagram of the model is shown inFig. 3.
The neural inputs (i.e. overall motoneuron activities)MNlr and MNmr are low pass filtered to generate theactive internal muscle forces Falr and Famr
. In each mus-cle, the force generator is in parallel with a nonlineardashpot, B, which represents the force–velocity relationof the active muscle. This unit is in series with an elas-tic element, Kse, which represents the connective tissue inseries with contractile elements which has the experimen-tally measured property that an instantaneous reduction
Fig. 3. Diagram of the model of the horizontal eye plant. The lateral
and medial rectus muscle variables are denoted by subscripts lr and mr
respectively. The input MN is the neural input converted to its force
equivalent. The force generator Fa represents the length–tension–acti-
vation relationship of the muscles. The force–velocity relationship is
provided by the viscosity B. The series-elastic element is denoted Kse.
Kp represents the passive muscle elasticity. Orbital mechanics are
modeled by a dual spring–dashpot system ðKo1;Bo1;Ko2;Bo2Þ togetherwith the mass (Jo).
A.R. Koene, C.J. Erkelens / Vision Research 42 (2002) 1797–1808 1799

in load results in an instantaneous change in musclelength (i.e. the characteristics of a spring). This group ofmechanical elements is in parallel with an elastic ele-ment, Kp, which represents the passive elastic propertiesof the muscle. Both Fa and Kp are non-linear. Thesemuscle models are combined with a dual mass–spring–dashpot ðKo1;Bo1;Ko2;Bo2; JoÞ (Robinson, Bach-y-Rita,& Lennerstrand, 1975) representation of the orbit tomodel the horizontal saccadic system. Since the contri-bution of the vertical and oblique muscles to horizontaleye movements is negligible they have been lumped to-gether with the model of the orbit. This simplification isof the same order of magnitude as the simplification thatboth horizontal muscles were taken to be of equal ef-fective strength.
A more precise description of the model and the pa-rameter values that were used is given in Appendix A.
3. Results
The eye movement measurements showed the samepattern of saccade duration, skewness and maximumspeed differences between the centrifugal and centripetalsaccades as reported by Collewijn et al. (1988) andPelisson and Prablanc (1988). The average position andvelocity profiles for the saccades between primary po-sition (central target) and 20� eccentric are shown in Fig.4. The results for the saccades between the primaryposition and 10� eccentric and between 10� and 20� ec-centric showed the same characteristics and will there-fore not be shown here.
Fpassive, the force generated by the muscle elasticity(Kp) and the orbital tissue ðBo;KoÞ, depends only on eyeorientation and velocity. The model of the eye planttherefore allowed us to compute Fpassive from the mea-sured eye movement data as shown in Eq. (1)
FpassiveðtÞ ¼ FplrðhðtÞÞ � FpmrðhðtÞÞ � FoðhðtÞÞ; ð1Þ
where Fplr , Fpmrand Fo are the muscle elasticity and or-
bital tissue forces as defined in Appendix A. Fig. 5shows the change in Fpassive during centripetal and cen-trifugal saccades. Fig. 6 shows the change in Factiveduring centripetal and centrifugal saccades which wasfound by subtracting Fpassive from Ftotal.
We show the change in force rather than the actualforce since this makes it easier to compare the forcesduring centrifugal and centripetal saccades. No relevantinformation is lost by doing this since the steady stateforces, i.e. the initial offset, of Factive and Fpassive canceleach other and therefore do not contribute to the gen-eration of eye movements. The profiles of Factive andFpassive look similar because, as we show in Section 3.1,the profile of Fpassive is a consequence of Factive. Themuscle innervation that, according to our eye plantmodel, generates Factive is shown in Figs. 7 and 8. Thismuscle innervation was calculated by using a gradient
Fig. 4. Average velocity profiles for the centrifugal and centripetal
saccades between the central position and the target at 20� eccentricity.The characteristic difference in maximum saccade velocity (A) and
saccade duration (B) are indicated.
Fig. 5. Change in total passive force Fpassive during centripetal and
centrifugal saccades between the central position and the target at 20�eccentricity. ‘A’ indicates the difference in maximum change in Fpassive.‘B’ indicates the difference in duration until steady state is reached.
Fig. 6. Change in total active force Factive during centripetal and cen-
trifugal saccades between the central position and the target at 20�eccentricity. ‘A’ indicates the difference in maximum change in Factive.‘B’ indicates the difference in duration until steady state is reached.
1800 A.R. Koene, C.J. Erkelens / Vision Research 42 (2002) 1797–1808

descent search algorithm to find the innervations thatwould generate Factive when used as input to our eyeplant model. The search space was reduced to a singledimension by the constraint that the activity change inantagonist is derived from the the activity change in theagonist via inhibitory inter-neurons in the brain stem(Cullen & Guitton, 1997; Hikosaka, Igusa, Nakao, &Shimazu, 1978; Igusa, Sasaki, & Shimazu, 1980; Rob-inson, Bach-y-Rita, et al., 1975; Scudder, 1988; Strass-man, Highstein, & McCrea, 1986a,b; Yoshida, Berthoz,Vidal, & McCrea, 1982).
The muscle innervations calculated by us, and shownin Figs. 7 and 8, are given in grams of force (gf) ratherthan spikes per second because the force–length–inner-vation relationship (Miller et al., 1999; Collins et al.,1981; Miller & Robinson, 1984), which determines Falrand Famr
, gives muscle innervation in grams of force. Theinnervation of the muscles is defined as the isometric
developed force (Fa) the muscle would generate if it wereset at primary position length. This muscle innervation,although given in grams of force, is always directly re-lated to the neural activity coming to the muscle.
3.1. Analysis of the Fpassive profiles
The force profiles in Fig. 5 reveal that Fpassive followsthe same pattern as the velocity profiles for centrifugaland centripetal saccades. During centripetal saccades thepassive-force profiles show a greater maximum change(Fig. 5‘A’) and a faster return to a steady state (Fig. 5‘B’)than during centrifugal saccades.
As we will now show, however, the direction in whichthe passive force pulls the eye is such that an increase inpassive force corresponds to a reduction in the net-forcedriving the eye movement. Since the viscous force al-ways acts opposite to the movement direction it is ob-vious that this component of the passive force should actto reduce movement velocity. The effect of the elasticforces however is less intuitive. The elastic forces pull theeye towards the central position, helping the eye move-ment during centripetal saccades and hindering themovement during centrifugal saccades. As the eye movesfurther away from the central position during centrifu-gal eye movements the passive elastic forces increaseand counteract the centrifugal movement more strongly.As the eye moves closer to the central position duringcentripetal eye movements the strength of the elasticforces decreases, reducing its positive contribution to theeye movement. The change in passive force thereforeacts to reduce the acceleration of the eye during cen-trifugal saccades as well as during centripetal saccades.Thus the greater maximum change in passive forceduring centripetal saccades as compared to centrifugalones (Fig. 5) causes the passive force to slow down thecentripetal saccade more then it does the centrifugalsaccade.
If the difference in the forces Fpassive were the primarycontribution to the difference in movement profilesduring centripetal and centrifugal saccades, the centrif-ugal saccade would reach the greater maximum velocity.Since the velocity profiles show the reverse situation, i.e.a greater maximum velocity during centripetal saccadesthan during centrifugal ones, we must conclude that thecause of the observed difference in velocity profiles mustlie somewhere in the active forces Factive.
Rather than being the cause of the difference in cen-trifugal and centripetal velocity profiles the difference inFpassive during these eye movements is a consequence ofthe kinematic differences. The reason why Fpassive followsthe eye movement profiles so linearly is because taken asa muscle pair the nonlinearities of the individual passivemuscle elasticities cancel each other making Fpassivequasi-linear (Robinson et al., 1969). Since the orbitaltissue forces included in Fpassive, both the elasticity and
Fig. 8. Change in total neural muscle activity during centrifugal and
centripetal saccades between the central position and the target at 20�eccentricity. ‘A’ indicates the (lack of) difference in maximum change
in muscle activity.
Fig. 7. Muscle innervation profiles showing the strength of agonist
and antagonist activity during the saccade. ‘A’ indicates the difference
in antagonist deactivation pulse amplitude between centripetal and
centrifugal saccades. ‘B’ indicates the difference in initial agonist ac-
tivity while ‘C’ indicates the difference in maximum agonist activity.
‘C–B’ therefore indicates the difference in agonist pulse amplitude
between the centripetal and centrifugal saccades.
A.R. Koene, C.J. Erkelens / Vision Research 42 (2002) 1797–1808 1801

viscosity components, are also linear with respect to eyeorientation the change in Fpassive during an eye move-ment is independent of the starting orientation.
3.2. Analysis of the Factive profiles
The active force profiles in Fig. 6 illustrate the changein Factive during centrifugal and centripetal saccades.During centripetal saccades the active-force profilesshows a greater maximum change (Fig. 6‘A’) and returnto a steady state faster (Fig. 6‘B’) than during centrifu-gal saccades. These characteristics are almost identicalto those seen in the passive force profiles of Fig. 5. Forthe active force however the change in force contributespositively to the eye movement. The greater change inFactive during centripetal movements, as compared to thechange in Factive during centrifugal movements, causes agreater acceleration of the eye. This, in combinationwith the previous results concerning Fpassive, leads us toconclude that the cause of the velocity difference duringcentrifugal and centripetal saccades has to do with theproperties of Factive. We now evaluate the contributionsof the muscle innervation, the length–tension–innerva-tion relation and the force–velocity relation of themuscles to the difference in Factive during centrifugal andcentripetal saccades. By comparing these we will showthat eventhough Factive is generated by the neural inner-vation of the muscles, the difference in Factive duringcentripetal and centrifugal saccades is due to mechanicalinfluences on the generation of Factive and not due todifferences between the neural signals.
3.2.1. Neural activityThe reduction in antagonist muscle deactivation step
that Pelisson and Prablanc (1988) suggested as a possi-ble cause of the kinematic differences between centrifu-gal and centripetal saccades can clearly be seen in themuscle innervation patterns shown in Fig. 7‘A’. Whatthe figure also shows however is that the pulse in agonistmuscle innervation is greater during centrifugal saccadesthan during centripetal ones (7‘C–B’). The reason forthis increase in agonist innervation can be found in thenon-linear relation between eye orientation and the re-quired muscle activity to maintain fixation. Fig. 9 showsthe muscle innervation values that were given by Milleret al. (1999) for fixation at various eye orientations. Dueto this relationship between muscle innervation and eyeorientation the agonist muscle must increase its activitymore during a centrifugal eye movement (Fig. 9‘A’) thanduring a centripetal one (Fig. 9‘B’), resulting in a greateragonist pulse. The reduction in antagonist deactivationstep (Fig. 7‘A’) is therefore compensated by the increasein agonist pulse (Fig. 7‘C–B’). The total effect of thereduction of the deactivation pulse in the antagonist andthe increase in agonist activity can be seen in Fig. 8which shows the change in total muscle innervation
during centrifugal and centripetal saccades. Since themuscle-innervation-change profiles (Fig. 8) are almostidentical for the centrifugal and centripetal saccades, theneural activity patterns cannot explain the observedvelocity differences during centrifugal and centripetalsaccades.
In order to show that this is not an artifact of ourchoice of eye plant model, Appendix B gives a moredetailed analysis of the relation between the requiredchange in steady-state muscle innervation (i.e. activity inthe tonic neurons) and the muscle innervation changeduring a saccade.
3.2.2. Length–tension–innervation relationThe length–tension–innervation relation of the mus-
cles was measured by Collins et al. (1975b), Miller et al.(1999), Robinson (1975) and is shown in Fig. 10. De-pending on the degree of muscle stretch (i.e. the orien-tation of the eye) the force–innervation relation isaltered as indicated by the different curves in Fig. 10.Due to the non-linearity of the force–innervation curvesthe same step in innervation change will result in dif-ferent sized steps in force change depending on theinitial eye orientation and muscle innervation (Fig.10‘B–A’).
The effect of this length–tension–innervation relationon centripetal and centrifugal saccades (i.e. the con-tractile force changes) can be seen in Fig. 11, whichshows the simulated change in total force generation (i.e.change in Falr � Famr
in Fig. 7) resulting from the muscleinnervation profiles during centrifugal and centripetalsaccades (Fig. 7). Even though there was no difference inthe maximum change in total innervation (Fig. 7‘A’)between the centrifugal and centripetal saccades, there is
Fig. 9. Muscle innervation during fixation as a function of eye ori-
entation for the two horizontal muscles, i.e. the medial and lateral
rectus muscles. ‘A’ indicates the step in agonist muscle innervation
increase during a centrifugal saccade of 20� away from the central
position. ‘B’ indicates the step in agonist muscle innervation increase
during a centripetal saccade of 20� towards the central position. The
inset ‘A–B’ shows the difference between ‘A’ and ‘B’. (Data fromMiller
et al., 1999.)
1802 A.R. Koene, C.J. Erkelens / Vision Research 42 (2002) 1797–1808

a clearly discernable difference in the resulting maximumchange in contractile force (Fig. 11‘A’).
The length–tension–innervation relation results in alarger maximum change in contractile force duringcentrifugal saccades than during centripetal ones (Fig.11‘A’). This is contrary to the difference in Factive wherewe found that the maximum change in Factive is greaterfor centripetal than for centrifugal saccades (Fig. 6‘A’).The cause of the difference in Factive and thus the cause ofthe kinematic differences during centripetal and cen-trifugal saccades, therefore, can not be in the length–tension–innervation relationship of the muscles.
3.2.3. Force–velocity relationThe force–velocity relationship of the muscles (Blr
and Bmr in Fig. 3) describes the viscous force generated
in the muscles as a function of the rate of muscleshortening (lengthening).
The muscle viscosity relationship that was derived byHilll (1938) and which was also used in the models byClark and Stark (1974a,b), Cook and Stark, 1967 andPfann et al. (1995) is as follows:
Fviscous ¼ Bdydt
; where
B ¼
3FaHvmax
; when the muscle expands
1:25Fa
Hvmaxþ dy
dv
; when the muscle contracts
8>>>><>>>>:
ð2Þ
where Hvmax¼ 900 deg/s is the Hill constant character-
izing the relationship to the maximum rate of muscleshortening, Fa is the contractile force of the muscle anddy=dt is the rate of muscle shortening (lengthening).
The viscous forces in both muscles act against themovement direction. Thus the net viscous force actingon the system is the sum of the viscous forces. This is animportant difference between the viscous forces and theelastic and contractile forces, which act in opposite di-rections in both muscles. The net viscosity coefficient Bis therefore a function of Falr þ Famr
(Fig. 12). In addi-tion, the viscous force is a function of the contractionrate (dy=dt). The value of the viscosity coefficient B istherefore only of importance during the actual saccade(period ‘A’ in Fig. 12).
When we simulate the viscous forces in the musclesusing Eq. (2), we find that the net viscous forces duringcentrifugal saccades reach a much greater maximumforce then during centripetal saccades (Fig. 13‘A’). Sub-tracting the viscous force, which acts to slow down theeye movement, from the contractile muscle force resultsin the net muscle force profiles shown in Fig. 14. Duringcentripetal saccades the resulting force profiles (Fig. 14)show a greater maximum change (Fig. 14‘A’) and return
Fig. 10. Force–length–innervation curves showing the relationship
between the contractile force generated by an extraocular muscle and
its neural innervation for various degrees of muscle stretch (eye ori-
entations). ‘A’ indicates the step in contractile muscle force resulting
from a 10 gf increase of innervation when the eye is oriented 20�rightward with an initial activity level of 20 gf. ‘B’ indicates the step in
contractile muscle force resulting from a 10 gf increase in muscle
innervation when the eye is oriented 20� leftward with an initial inn-
ervation level of 40 gf. The inset ‘B–A’ indicates the difference between
‘A’ and ‘B’. (Data from Miller et al., 1999.)
Fig. 11. Change in total contractile force (and muscle innervation)
during centripetal and centrifugal saccades between the central posi-
tion and the target at 20� eccentricity. ‘A’ indicates the difference in
maximum change in generated contractile force.
Fig. 12. Sum of contractile forces Falr and Famrduring centrifugal and
centripetal saccades between the central position and the target at 20�eccentricity. ‘A’ indicates the period during which the muscle con-
traction rate dy=dt is most significant.
A.R. Koene, C.J. Erkelens / Vision Research 42 (2002) 1797–1808 1803

to steady state faster (Fig. 14‘B’) than during centrifugalsaccades. This agrees with the maximum velocity andduration characteristics of centripetal and centrifugalsaccades. We therefore conclude that the cause of thekinematic differences between centrifugal and centripetalsaccades is in the muscle viscosity.
4. Discussion
The intention of the present study was to determinethe cause of the kinematic differences between sac-cades going away from the primary position and sac-cades going towards the primary position. In otherwords, what causes centrifugal saccades to have a lowermaximum velocity and a longer duration than centrip-etal saccades?
We measured the eye movements during centrifugaland centripetal saccades and used a model of the eyeplant to simulate the muscle and orbital tissue forces
acting on the eye during these saccades. Using the re-sulting force profiles and the data on muscle propertiesfrom experiments by Collins et al. (1975a,b), Miller andRobinson (1984), Miller et al. (1999), Robinson (1975),and Robinson and Zuber (1981), we showed that thecontribution of the passive forces (i.e. the muscle elas-ticity and orbital tissue elasticity and viscosity) to thekinematics of centrifugal and centripetal saccades dif-fers only as a result of the difference in movement pro-files. In addition, we showed that the contribution ofthe passive forces to the ocular kinematics favors thecentrifugal saccades. From this we concluded that thepassive forces can not be the cause of the kinematicdifferences.
Next we investigated the active forces, i.e. the musclecontractile force and the muscle viscosity, which bothdepend directly on the innervation of the muscles. Bysynthesizing the muscle innervation that would be re-quired to produce the active forces we showed that thetotal change in muscle innervation during centrifugaland centripetal saccades is near identical and cantherefore not be the cause of the kinematic differences.Based on the length–tension–innervation relationship ofthe eye muscles that was reported by Miller et al. (1999)and Robinson (1975) we showed that the contractileforces resulting from the innervation change are greaterduring centrifugal saccades than during centripetal ones.The contractile length–tension–innervation relationshipcan therefore not be the cause of the observed kinematicdifferences either. The muscle viscosity was investigatednext. We found that, due to the non-linear characteris-tics of the muscle viscosity as described by Clark andStark (1974a,b), Cook and Stark (1967), Hilll (1938) andPfann et al. (1995) the viscous force is much greaterduring centrifugal movements than during centripetalones. This means that the muscle viscosity slows downthe eye movement more during centrifugal movementsresulting in a lower maximum velocity.
The muscle viscosity was the only force that showed adifference between centrifugal and centripetal saccadeswhich could explain the observed difference in saccadekinematics. We therefore conclude that the cause of thekinematic differences during centrifugal and centripetalsaccades is the non-linear force–velocity relationship ofthe muscles.
4.1. Implications for the saccade generator
It is generally accepted that during saccades the onlyfeedback signal available to the system is some kind ofefference copy signal which either encodes eye orienta-tion (Robinson, Bach-y-Rita, et al., 1975) or eye dis-placement (Jurgens, Becker, & Kornhuber, 1981). Anydeviations in the eye movements that are not reflected inthe muscle innervation, such as mechanical defects, cantherefore only be detected if they effect the amplitude
Fig. 14. The result of subtracting the total viscous muscle force from
the total change in contractile muscle force during centripetal and
centrifugal saccades between the central position and the target at 20�eccentricity. ‘A’ indicates the difference in maximum change in the
resulting force. ‘B’ indicates the difference in duration until steady state
is reached.
Fig. 13. Total viscous force during centripetal and centrifugal saccades
between the central position and the target at 20� eccentricity. ‘A’ in-
dicates the difference in maximum viscous force.
1804 A.R. Koene, C.J. Erkelens / Vision Research 42 (2002) 1797–1808

and/or duration of the saccade. The result of our currentinvestigation is that the difference between centrifugaland centripetal saccades has its cause in the mechanicsof the eye plant, specifically the muscle viscosity. Thedifference in saccade kinematics is not reflected in theneural feedback signal. Since the amplitude of the sac-cades is not effected either the only way that the saccadicsystem could measure these kinematic differences is ifthe centrifugal saccade is sufficiently slow so that thedifference in duration interferes with the functioning ofthe visual system. From the data by Collewijn et al.(1988), the difference in saccade duration for saccades ofup to 30� is less than 25 ms. Considering that the min-imal inter-saccadic interval during rapid search is ap-proximately 135 ms (Becker & Juergens, 1979) it isimprobable that a difference in saccade duration of(less than) 25 ms is noticeable. We therefore concludethat the saccadic system is unable to detect the kine-matic differences between centrifugal and centripetalsaccades.
4.2. Implications for starting position dependent modula-tion
In Section 3.2 and Appendix B we showed that re-gardless of the lower bound cutoff of the antagonistsignal the total change in muscle innervation during cen-trifugal and centripetal saccades is nearly identical. Thereason why centrifugal and centripetal saccades have thesame pattern in total change in muscle innervation isbecause the difference in antagonist signal cutoff is com-pensated by the position dependent increase in agonistsignal for centrifugal saccades. According to the morerecent models of the saccade generator (Quaia et al.,1999), the superior colliculus generates a saccade drivesignal, based on the desired displacement of the eye, andthis signal is then modulated by a signal from the cere-bellum to compensate for position-dependent differences.The difference in agonist pulse activity (which compen-sates the cutoff effect) would thus have to be the resultsof the modulation signal from the cerebellum. Using thesame method as we did (see Appendix B) to find thedifference in agonist pulse activity during centripetaland centrifugal saccades may therefore provide a usefultool to quantify the modulation signal sent by the cer-ebellum.
4.3. Conclusion
By using the results of force measurements that weremade in recent years (Miller et al., 1999) we were ableto simulate the muscle forces during centrifugal andcentripetal saccades. Using this simulation we foundthat the cause of the kinematic differences betweencentrifugal and centripetal saccades is in the muscleviscosity.
Appendix A. The eye plant model
This appendix describes the implementation of theeye plant model.
As shown in Fig. 3 the model of the eye plant consistsof three distinct parts, the passive orbital tissue (in-cluding the moment of inertia of the eye ball) and thetwo horizontal extraocular muscles. For simplicity themodels of the lateral and medial rectus muscles areidentical. The four percent difference in muscle strengthbetween the lateral and medial rectus muscles which isreported by Miller et al. (1999) was not included in ourmodel.
The moment of inertia of the orbit was taken from(Clark & Stark, 1974a) giving a value of J ¼ 4:3e� 5,gf s2/deg. The orbital tissue force parameters were cho-sen such that the stead-state muscle forces given inMiller et al. (1999) would result in fixation (this deter-mines Ko) while the time constants (s1, s2 and s3) werechosen as an average of the values given by other au-thors (Robinson & Zuber, 1981; Collins et al., 1981;Clark & Stark, 1974b). The orbital tissue force is givenby the following equation:
FoðhðtÞÞ ¼ Ko hðtÞ�
þ ðs1 þ s2ÞdhðtÞdt
þ s1s2d2hðtÞdt2
�
� s3dFoðhðtÞÞ
dt
where s1 ¼ Bo1=Ko1 ¼ 50 ms, s2 ¼ Bo2=Ko2 ¼ 140 ms,s3 ¼ ðBo1 þ Bo2Þ=ðKo1 þ Ko2Þ ¼ 80 ms and Ko ¼ ðKo1
Ko2Þ=ðKo1 þ Ko2Þ ¼ 0:27 gf/deg.The passive elastic force of the muscles was deter-
mined by fitting the data presented in (Miller et al.,1999). For the lateral and medial rectus muscles thisworks out to:
FplrðhðtÞÞ ¼ 0:002ðmaxð0;�hðtÞ þ 35ÞÞ2;Fpmr
ðhðtÞÞ ¼ 0:002ðmaxð0; hðtÞ þ 35ÞÞ2:
For the series elastic stiffness we took the average ofthe values given in Clark and Stark (1974a), Collins et al.(1975a), Pfann et al. (1995) and Robinson and Zuber(1981) resulting in Kse ¼ 2 gf/deg. The muscle activationand deactivation time constants sa and sd, which deter-mine the low-pass filter characteristic between themotoneuron activity and the muscle contraction, weretaken from (Clark & Stark, 1974b; Pfann et al., 1995) as4 and 8 ms respectively. The change in muscle activity (I)as function of the motoneuron activity is given by:
dIðtÞdt
¼ 1
sa=dðIðtÞ �MNðtÞÞ
The active contractile force generated by the muscleswas determined using a polynomial approximation(Faðh; IÞ ¼ adlþ bI þ cIdl . . ., where dl is the percentage
A.R. Koene, C.J. Erkelens / Vision Research 42 (2002) 1797–1808 1805

change in muscle length in relation to its relaxed length)of the length–tension–innervation data provided by(Miller et al., 1999) (Fig. 10). For the lateral rectusmuscle dllrðhÞ ¼ �ð53:5=80Þh þ 13:25, for the medialrectus muscle dlmrðhÞ ¼ ð53:5=80Þh þ 13:25.
The muscle viscosities (Blr and Bmr) determining theforce–velocity relationship were based on the modelpresented in (Pfann et al., 1995) and look as follows:
Blr ¼
3FalrHvmax
; ifdy1dt
< 0
1:25Falr
Hvmaxþ dy1
dt
; otherwise
8>>>><>>>>:
Bmr ¼
3Famr
Hvmax
; ifdy2dt
> 0
1:25Famr
Hvmax� dy2
dt
; otherwise
8>>>><>>>>:
where Hvmax¼ 900 deg/s is the Hill constant character-
izing the relationship to the maximum rate of muscleshortening.
Using these model parameters the relationship of eyemovement to muscle innervation is given by the fol-lowing differential equations:
dxdt
¼ 1
Jð�FoðhðtÞÞ þ FplrðhðtÞÞ þ Kseðy1ðtÞ � hðtÞÞ
� FpmrðhðtÞÞ � KseðhðtÞ � y2ðtÞÞÞ
dy1dt
¼ Falr þ KseðhðtÞ � y1ðtÞÞBlr
;
dy2dt
¼ �Famrþ KseðhðtÞ � y2ðtÞÞ
Bmr
Appendix B. Neural activity profiles during saccades
The motoneuron activity (MN), i.e. muscle innerva-tion, is generally assumed to be the sum of the tonicneuron activity (TN) and the burst neuron activity (ex-citatory EBN for agonist, inhibitory IBN for antagonist)(Gancarz & Grossberg, 1998; Robinson, Bach-y-Rita,et al., 1975; Scudder, 1988).
MNagonist ¼ TNagonist þ EBNagonist; and
MNantagonist ¼ maxð0;TNantagonist � IBNantagonistÞ; with
TNagonistðT Þ ¼ TNagonistð0Þ þ aZ T
0
EBNagonistðtÞdt;
TNantagonistðT Þ ¼ TNantagonistð0Þ � bZ T
0
IBNantagonistðtÞdt;
where a and b are synaptic gain factors and T is theduration of the saccade.
Tonic neuron activities at the beginning and end ofsaccades (i.e. the steady-state values) are known fromthe data by Miller et al. (1999, Fig. 9). Assuming thatthe shape of the burst neuron activity profile is the samefor centrifugal and centripetal saccades, i.e. any differ-ence in motoneuron activity is the result of the lower-bound cutoff effect described by Pelisson and Prablanc(1988) (see Section 1), the only free parameters that areleft are a and b. Different values of a and b result indifferent MN profile shapes, altering the hight of thepulse part in the pulse-step profile. The values that wechose for our main work were chosen to give a pulse-step profile whose shape corresponds to the data re-ported by Collins et al. (1975a), Cullen and Guitton(1997), Robinson, Bach-y-Rita, et al. (1975) and Rob-inson (1975). To test the effect of different a and b valueswe varied a and b from 4 to 32 in steps of 4. Values of alarger than 32 cause the MN profiles to loose the pulse-step shape reported in the literature (Collins et al.,1975a; Cullen & Guitton, 1997; Robinson, Bach-y-Rita,et al., 1975). The values we used in the main text werea ¼ 16 and b ¼ 16.
The maximum change in total activity during thecentripetal saccade became larger than the maximumchange in activity during centrifugal saccade when a >16 and b < 16. This difference was greatest when thegain factors a ¼ 4, b ¼ 32 were chosen. When a < 16and b > 16 the maximum change in activity was largerduring the centrifugal saccade then during the centrip-etal saccade. This difference was greatest when the gainfactors a ¼ 32, b ¼ 4 were chosen. Fig. 15 shows thetotal change muscle innervation profiles during cen-tripetal and centrifugal saccades for these a, b pairs forsaccades between the central target and a target at 20�eccentricity.
In order to see if the greater maximum change inmuscle innervation during the centripetal saccade thatwas achieved when a ¼ 32 and b ¼ 4 could explain the
Fig. 15. Total change in muscle innervation during centripetal and
centrifugal saccades between the central target and a target at 20�eccentricity. The arrows indicate the maximum difference in total
muscle innervation change for each pair of aðaÞ and bðbÞ values.
1806 A.R. Koene, C.J. Erkelens / Vision Research 42 (2002) 1797–1808

difference in velocity profiles during centripetal andcentrifugal saccades we also simulated the contractilemuscle forces that would result from these muscle inn-ervation profiles.
As we can see from Fig. 10 the non-linear force–length–activity relation (Fig. 10) of the muscles, whichfavors the centrifugal eye movement (Section 3.2), hasresulted in total contractile muscle force changes withthe same maximum value for both the centripetal andcentrifugal eye movements (Fig. 16 a ¼ 32, b ¼ 4).
References
Abel, A., Dell’Osso, L. F., Daroff, R. B., & Parker, L. (1979). Saccades
in extremes of lateral gaze. Investigative Ophthalmology and Visual
Science, 18, 324–327.
Barmack, N. H., Bell, C. C., & Rence, B. G. (1971). Tension and rate
of tension development during isometric responses of extraocular
muscles. Journal of Neurophysiology, 34, 1072–1079.
Becker, W., & Juergens, R. (1979). An analysis of the saccadic system
by means of double step stimuli. Vision Research, 19, 967–983.
Clark, M. R., & Stark, L. (1974a). Control of human eye movements:
I. Modeling of extraocular muscle. Mathematical Biosciences, 20,
191–211.
Clark, M. R., & Stark, L. (1974b). Control of human eye movements:
II. A model for the extraocular plant mechanism. Mathematical
Biosciences, 20, 213–238.
Collewijn, H., Erkelens, C. J., & Steinman, R. M. (1988). Binocular co-
ordination of human horizontal saccadic eye movements. Journal
of Physiology, 404, 157–182.
Collewijn, H., Van der Mark, F., & Jansen, T. C. (1975). Precise
recording of human eye movements. Vision Research, 15, 447–450.
Collins, C. C., Bach-Y-Rita, P., & Collins, C. C. (Eds.). (1971). The
control of eye movements (pp. 283–325). New York: Academic
Press.
Collins, C. C., Carlson, M. R., Scorr, A. B., & Jampolsky, A. (1981).
Extraocular muscle forces in normal human subjects. Investigative
Ophthalmology and Visual Science, 20, 652–664.
Collins, C. C., Lennerstrand, G., & Bach-Y-Rita, P. (Eds.). (1975a).
Proceedings of the international symposium, Wenner-Gren Center,
Stockholm, June 4–6, Basic mechanisms of ocular motility and their
clinical implications (pp. 145–180). Oxford: Pergamon Press.
Collins, C. C., O’Meara, D., & Scott, A. B. (1975b). Muscle tension
during unrestrained human eye movements. Journal of Physiology,
245, 351–369.
Cook, G., & Stark, L. (1967). Derivation of a model for the human
eye-positioning mechanism. Bulletin of Mathematical Biophysics,
29, 153.
Cook, G., & Stark, L. (1968). The human eye movement mechanism.
Experiments, modeling, and model testing. Archives of Ophthal-
mology, 79, 428–436.
Cullen, C. A., & Guitton, D. (1997). Analysis of Primate IBN Spike
Trains Using System identification techniques. I. Relationship to
eye movement dynamics during head-fixed saccades. Journal of
Neurophysiology, 78, 3259–3282.
Eggert, T., Mezger, F., Robinson, F., Straube, A. (1999). Orbital
position dependency is different for the gain of externally and
internally triggered saccades. NeuroReport, 10, 2665–2670.
Fuchs, A. F., & Lushei, E. S. (1970). Firing patterns of abducens
neurons of alert monkeys in relationship to horizontal eye
movements. Journal of Neurophysiology, 33, 382–392.
Fuchs, A. F., & Lushei, E. S. (1971). Development of isometric
tension in simian extraocular muscle. Journal of Physiology, 219,
155–166.
Fuchs, A. F., Kaneko, C. R. S., & Scudder, C. A. (1985). Brainstem
control of saccadic eye movements. Annual Review of Neuroscience,
8, 307–337.
Gancarz, G., & Grossberg, S. (1998). A neural model of the saccade
generator in the reticular formation. Neural Networks, 11, 1159–
1174.
Hikosaka, O., Igusa, Y., Nakao, S., & Shimazu, H. (1978). Direct
inhibitory synaptic linkage of pontomedullary reticular burst
neurons with abducens motoneurons in the cat. Experimental
Brain Research, 33, 337–352.
Hilll, A. V. (1938). The heat of shortening and the dynamic constants
of muscle. Proceedings of Royal Society, 126B, 136–195.
Igusa, Y., Sasaki, S., & Shimazu, H. (1980). Excitatory premotor
burst neurons in the cat pontine reticular formation related to
the quick phase of vestibular nystagmus. Brain Research, 182,
451–456.
Jurgens, R., Becker, W., & Kornhuber, H. (1981). Natural and
drug-induced variation of velocity and duration of human
saccadic eye movements: evidence for control of the neural
pulse generator by local feedback. Biological Cybernetics, 39,
87–96.
Miller, J. M., Pavlovski, D. S., & Shamaeva, I. (1999).OrbitTM1.8 Gaze
mechanics simulation. San Francisco: Eidactics.
Miller, J. M., & Robins, D. (1992). Extraocular muscle forces in alert
monkey. Vision Research, 32, 1099–1113.
Miller, J. M., & Robinson, D. A. (1984). A model of the mechanics of
binocular alignment. Computers and Biomedical Research, 17, 436–
470.
Pelisson, D., & Prablanc, C. (1988). Kinematics of centrifugal and
centripetal saccadic eye movements in man. Vision Research, 28,
87–94.
Pfann, K. D., Keller, E. L., & Miller, J. M. (1995). New models of
the oculomotor mechanics based on data obtained with chronic
muscle force transducers. Annals of Biomedical Engineering, 23,
346–358.
Quaia, C., Lefevre, P., & Optican, L. M. (1999). Model of the control
of saccades by superior colliculus and cerebellum. Journal of
Neurophysiology, 82, 999–1018.
Robinson, D. A. (1963). A method of measuring eye movements using
a search coil in a magnetic field. IEEE Transactions of Biomedical
Engineering, 10, 137–145.
Robinson, D. A. (1964). The mechanisms of human saccadic eye
movement. Journal of Physiology––London, 174, 245–264.
Robinson, D. A. (1970). Oculomotor unit behavior in the monkey.
Journal of Neurophysiology, 33, 393–404.
Fig. 16. Total change in generated contractile force in the muscles
during centripetal and centrifugal saccades between targets at the
central position and 20� eccentric.
A.R. Koene, C.J. Erkelens / Vision Research 42 (2002) 1797–1808 1807
Robinson, D. A. (1975). A quantitative analysis of extraocular
muscle cooperation and squint. Investigative Ophthalmology, 14,
801–825.
Robinson, D. A., Bach-y-Rita, P., & Lennerstrand, G. (Eds.). (1975).
Basic mechanisms of ocular motility and their clinical implication.
Oxford: Pergamon.
Robinson, D. A., O’Meara, D. M., Scott, A. B., & Collins, C. C.
(1969). Mechanical components of human eye movements. Journal
of Applied Physiology, 26, 548–553.
Robinson, D. A., & Zuber, B. L. (Eds.). (1981). Models of oculomotor
behavior and control (pp. 21–42). Boca Raton: CRC Press.
Rottach, K. G., Das, V. E., Wohlgemuth, W., Zivotofsky, A. Z., &
Leigh, R. J. (1998). Properties of horizontal saccades accompanied
by blink. Journal of Neurophysiology, 79, 2895–2902.
Scudder, C. A. (1988). A new local feedback model of the saccadic
burst generator. Journal of Neurophysiology, 59, 1455–1475.
Strassman, A., Highstein, S. M., & McCrea, R. A. (1986a). Anatomy
and physiology of saccadic burst neurons in the alert squirrel
monkey. I. Excitatory burst neurons. Journal of Comparative
Neurology, 249, 337–357.
Strassman, A., Highstein, S. M., & McCrea, R. A. (1986b). Anatomy
and physiology of saccadic burst neurons in the alert squirrel
monkey. II. Inhibitory burst neurons. Journal of Comparative
Neurology, 249, 358–380.
Yoshida, K., Berthoz, A., Vidal, P. P., & McCrea, R. A. (1982).
Morphological and physiological characteristics of inhibitory burst
neurons controlling rapid eye movements on the alert cat. Journal
of Neurophysiology, 48, 761–784.
1808 A.R. Koene, C.J. Erkelens / Vision Research 42 (2002) 1797–1808