Deep reef research with a submersible: living pleurotomarian slit-shells
Upload
independentCategory
view
1download
0
s in thelse bulketers of the
Journal of Colloid and Interface Science 259 (2003) 209–222www.elsevier.com/locate/jcis
Capillary condensation of a binary mixture in slit-like pores
Katarzyna Bucior,a,∗ Andrzej Patrykiejew,a Orest Pizio,b and Stefan Sokołowskia
a Department for the Modeling of Physico-Chemical Processes, Maria Curie-Skłodowska University, 20031 Lublin, Polandb Institute of Chemistry, UNAM, Mexico, D.F., Mexico
Received 26 March 2002; accepted 16 December 2002
Abstract
We investigate the capillary condensation of two model fluid mixtures in slit-like pores, which exhibit different demixing propertiebulk phase. The interactions between adsorbate particles are modeled by using Lennard-Jones(12,6) potentials and the adsorbing potentiaare of the Lennard-Jones(9,3) type. The calculations are performed for different pore widths and at different concentrations of thgas, by means of density functional theory. We evaluate the capillary phase diagrams and discuss their dependence on the parammodel. Our calculations indicate that a binary mixture confined to a slit-like pore may exhibit rich phase behavior. 2003 Elsevier Science (USA). All rights reserved.
it aeenofthatrve
andco-sa-on-d tod bystateeti-ma-rousstrys ise-fectct-
rial
ofof
ssesingear
avein
idcalughbeendgeg a
ca-ge in
ayver,tion
thehaseuchingennon ofbi-
ityions
1. Introduction
Single-component fluids confined within pores exhibwide range of phase behavior [1]. The competition betwfluid–solid and fluid–fluid interactions leads to new kindsphase transitions (e.g., wetting and layering transitions)are not found in bulk systems. Moreover, we also obseshifts in locations of usual phase transitions (freezingcondensation). In particular, the shift in the liquid–vaporexistence curve is commonly known as capillary condention. The theoretical interest in the phase transitions of cfined fluids is to understand the physical phenomena andetermine how the surface phase transitions are affectepore geometry and size, fluid–pore interactions, and theconditions of an adsorbate. In addition to purely theorcal interest, knowledge of the physics of phase transfortions is also important for many applications, because poadsorbents are widely used in several branches of induIn practice, the design of the majority of such processestill largely empirical, with little theoretical basis. Therfore an improved understanding of the confinement efon the equilibrium composition of an adsorbed (or reaing) mixture could lead to improvements of those industprocesses.
From an application point of view, investigationadsorption of fluid mixtures is more important than that
* Corresponding author.E-mail address:[email protected] (K. Bucior).
0021-9797/03/$ – see front matter 2003 Elsevier Science (USA). All rights rdoi:10.1016/S0021-9797(02)00203-5
.
single-component fluids, because in technological proceone usually deals with fluid mixtures. It is thus not surpristhat the number of works devoted to that problem grows yby year; cf. Refs. [1–6]. In particular, several studies hbeen carried out with mixtures of simple fluids confinedslit-like and cylindrical pores [2,7–15].
The description of the phase behavior of bulk flumixtures is one of the challenging problems of statistithermodynamics [16–20]. However, it appears that althoseveral possible bulk phase diagram topologies haveplaced into a number of categories [20,21], our knowleconcerning microscopic features responsible for yieldingiven category is still far from satisfactory.
The confinement of a mixture leads to further complitions in its phase behavior. First, there can occur a chanfluid composition due to its confinement. This change mbe discontinuous during capillary condensation. Moreoadditional lines connected to the variation in the composiwithin consecutive adsorbed layers may also appear onphase diagram. Consequently, the modification of the pdiagram of a mixture due to its confinement may be mmore drastic than for a single-component fluid. Accordto our best knowledge, only very little attention has bepaid in the literature to that problem so far. In particular,studies have been reported leading to the determinatiopossible topologies of the phase diagrams for confinednary fluids.
The main aim of this work is to apply the densfunctional approach to the description of phase transit
eserved.

210 K. Bucior et al. / Journal of Colloid and Interface Science 259 (2003) 209–222
onsposeichdelthe
thetheronly
ofnals isat thpicthetric19,eennalthe
ialsode
bingiresoiceudyhase
nentvia
ks
ac-of aures
ourpo-
al
orenar
that
tere
idnsgateodelndmefluid
odel
theBe-
e fi-ted
of
in confined fluids and to investigate how these transitidepend on the parameters of the model. For this purwe use a very simple model of a binary mixture, whis known in the literature [19,20] as the so-called moof symmetric binary mixture. This model assumes allspecies to be of the same size (and, thus, it ignoresinfluence of size parameters on phase behavior). Furthe interactions between like particles are equal andthe interaction between unlike particles, i.e., particlesdifferent species, is different. Moreover, the functioform of the potentials between like and unlike specieassumed to be the same. At the moment we demand thinterparticle potentials between fluid particles are isotroand that the wall–particle potentials depend only ondistance from the wall. Note that the model of symmebinary mixture was applied to study adsorption [3,13,22–24] on solids, as well as to study an interface betwtwo demixing fluids [25–28]. For reasons of computatiotraceability, we reduce the number of parameters ofmodel to a minimum by assuming that fluid–solid potentare independent of adsorbate species. The applied mis very simple and does not describe any real adsorsystem. However, its principal advantage is that it requa minimum number of parameters and therefore its chseems to provide the best starting point for initiating a stconcerning determination of the possible categories of ptransformations in confined binary mixtures.
2. Theory
The system studied by us consists of a two-compofluid of spherical particles of species 1 and 2 interactinga truncated Lennard-Jones (LJ) potential [19,23],
(1)uij (r) =uLJij (r), r < rij,cut,
0, r rij,cut,
(2)uLJij (r) = 4εij
[(σij
r
)12
−(σij
r
)6],
whererij,cut is the cutoff distance. Following previous wor[19–23] all size parametersσij are equal toσ and ε11 =ε22 = ε. However, the energy parameter of unlike intertion, ε12, is set small enough to ensure phase separationmixture over a certain region of temperatures and press[13,19,23]. Throughout this work the parametersσ andε aretaken as units of length and energy, respectively. In allcalculations the cutoff distance was the same for all comnents,rij,cut = 2.5.
The fluid is confined in a slit-like pore of widthH .Both pore walls,α = 1,2, are identical and exert identicpotentialsv′(z) on the particles of both kinds of species,
(3)v′(z) = ε(gs)[(z0/z)
9 − (z0/z)3],
wherez is distance from the wall. Thus, the total gas-penergy is the sum of the contributions [3] due to two pla
,
e
l
walls, located atz = 0 andz = H , v(z) = v′(z)+ v′(H − z).The model calculations have been performed assumingz0 = 0.5 for both components.
In the majority of the calculations the energy parameεgs has been set to 10 (in units ofε). In some cases whave also carried out the calculations forεgs= 5. The reasonfor such a choice is the following. We would like to avoany possibility of layering, as well as wetting transitiowithin the investigated temperature range and to investithe effects solely due to capillary condensation. The mof the adsorption potential is an obvious simplification aidealization. However, the aim of this work is to reveal sogeneral schemes of the phase behavior of the confinedand for this purpose we want to reduce the number of mparameters to a minimum.
The local densities,ρi(r), of speciesi = 1,2 are com-puted according to a density functional approach. Inpresent study we use the theory derived by Rosenfeld.cause this theory is quite standard [29–31], we write thnal equations only. The density profile equation, evaluaby minimizing the excess grand canonical potential
Ω =∫
drΦ
[ρ1(r), ρ2(r)
] − Φ[ρb1, ρb2]
−2∑
i=1
∫dr
µi
[ρi(r)− ρbi
] − ρi(r)v(z)
(4)
+ 1
2
2∑i,j=1
∫dr
∫dr′ [ρj (r′)ρi(r)− ρbjρbi
]× u
(att)ij
(|r − r′|),reads
ln[ρi(r)/ρbi
] = − 1
kT
4∑a=1
∫ ∂Φ
∂na(r′)−
(∂Φ
∂na
)ρ(r′)=ρbi
×wa
(|r − r′|)dr′
− 1
kT
2∑a=1
∫ ∂Φ
∂nva(r′)
wa
(|r − r′|)dr′
− vi(r)/kT
(5)
+2∑
j=1
∫dr′ [ρj (r′) − ρbj
]u(att)ij
(|r − r′|).In the above,µi is the configurational chemical potentialcomponenti, ρbi is the density of theith component in abulk fluid in equilibrium with the confined system,Φ is thefree energy functional of hard spheres [29],
Φ/kT = −n0 ln(1− n2)
(6)+ n1n2 − nv1 · nv2 + n2[n22 − nv2 · nv2]
2,
4π(1− n2) 24π(1− n3)

K. Bucior et al. / Journal of Colloid and Interface Science 259 (2003) 209–222 211
s,
de-e-rd-
g toulk
on,tionher-
dsheeen
M9,ase65e
dingre
M9of
ple-a
s,
s of
cer
re-ples
s
Theiroopstion. Atteau
ase,llyop
ightivestheedofresischesntireriumch.
and the quantitiesna and nva are the averaged densitiegiven by
(7a)na(r1) =2∑
i=1
∫dr2ρi(r2)wa(r12), a = 0,1,2,3,
(7b)nva(r1) =2∑
i=1
∫dr2ρi(r1 + r2)wva(r2), a = 1,2,
wherewa(r, σ ), a = 0,1,2,3 (scalar quantities), andwva(r),a = 1,2 (vector quantities), are the weight functions. Thefinitions of the weight functions are given in Ref. [29]. Morover, u(att)
ij (r) denotes the attractive part of the LennaJones potential [1], defined as [32]
(8)u(att)ij (r) =
−εij , r < rij,min,
uij (r), r rij,min,
whererij,min = 21/6σ .The relationship betweenµi andρbi is
µi/kT = − ln(1− n3)+ (σ/2)n2/(1− n3)
+ (σ/2)2[n1/(1− n3)+ (1/8π)n2
2
/((1− n3)
2)]+ (σ/2)3
[n0/(1− n3)+ n1n2/(1− n3)
2
+ (1/12π)n32/(1− n3)
3](9)+
∑j=1,2
ρbj
∫druatt
ij (r),
where the average densities are calculated accordinEqs. (7), with local densities equal to the corresponding bdensities.
The method of integration of the density profile equatiEq. (5), applied by us was based on a standard iteraprocedure. We have also assumed that the hard-spdiameters are equal toσ , and introduced the reduced temperature,T ∗ = kT /ε.
3. Results and discussion
We have performed our study for two model fluiexhibiting different phase behavior in the bulk phase. Tenergy parameter of the Lennard-Jones potential betwunlike particles was equal toε12/k = 0.65 and 0.9 (inunits ofε). These systems are abbreviated as M65 andrespectively. Figure 1 shows examples of the bulk phdiagrams. Figure 1a is for the symmetric mixture M(at mole fractionx = 0.5), whereas Fig. 1b displays thcoexistence envelope for the symmetric M9 fluid.
The system M65 belongs to the second class (accorto Wilding’s classification [20]) and the critical temperatuat equimolar composition is aboutT ∗
c ≈ 1.08. The bulkreduced critical temperature for the second systemis higher and equals approximately 1.23. In the casesystem M65 and at temperatures lower than the tripoint temperature,Tt ≈ 1.02, the condensation leads to
e
Fig. 1. Bulk phase diagrams for symmetric binary mixture: (a)ε12 = 0.65,(b) ε12 = 0.9. T ∗
t and T ∗ct are the triple and tricritical temperature
respectively.
demixed phase. In contrast, within the investigated rangetemperatures, condensation in system M9 atx = 0.5 leadsto a mixed liquid. The demixing in system M9 takes plaat fairly high densities; theλ line is at densities much highethan those displayed in Fig. 1b. For example, atT ∗ = 0.7,demixing occurs atρb = ρb1 + ρb2 = 0.9886.
We begin our discussion with the presentation of thesults obtained for system M65. Figure 2a displays examof the adsorption isotherms,
(10)Γ = Γ1 + Γ2,
(11)Γi = 1
H
H∫0
dzρi(z),
inside the pore of widthH = 5. The consecutive isothermhave been evaluated at equimolar (x = 0.5) bulk gas phasecomposition at temperatures betweenT ∗ = 0.8 and 1.075.We observe here the appearance of hysteresis loops.character changes, however. At low temperatures the lbegin at low values of adsorption and end at adsorpvalues corresponding to an almost completely filled porehigher temperatures, however, the loops begin at the plain the adsorption isotherm. With a temperature increthe equilibrium transition point shifts toward, and finaflows together with, the beginning of the hysteresis lo(i.e., with the end of the desorption branch). Further insinto the character of the observed phase transformation gFig. 2b. The curves plotted here illustrate changes incomposition of the confined fluid, i.e., the selectivity, definasS = Γ1/Γ , during adsorption. Similarly as in the caseadsorption isotherms we observe the existence of hysteloops. At higher temperatures the entire desorption branin Figs. 2a and 2b become stable, whereas the eadsorption branch becomes metastable; i.e., the equilibtransition point shifts to the end of the desorption bran

212 K. Bucior et al. / Journal of Colloid and Interface Science 259 (2003) 209–222
eson bran
Fig. 2. Adsorption isotherms (a) and selectivities (b) for model fluid M65 at equimolar bulk composition in the poreH = 5. The values of reduced temperaturare given in the figure. Thick dotted lines denote equilibrium transition. At higher temperatures the demixing occurs at the end of the desorptich.(c) Examples of the dependence ofΩ on the configurational chemical potential at two temperatures. For a discussion, see the text.
enranald
sulandt. Atf
std by
tiontion.larythethe
The locus of the equilibrium transition point has bedetermined by analyzing the dependence of the excess gcanonical potentialΩ versus the configurational chemicpotentials of both components,µi (in the case considerein Figs. 2a and 2b,µ1 = µ2). In Fig. 2c we show anexample of such analysis. The top panel shows the reat T ∗ = 1. Two curves corresponding to the adsorptiondesorption branches of the adsorption isotherm intersecslightly higher temperature,T ∗ = 1.02, cf. bottom panel o
d
t
Fig. 2c, the situation is different: two branches ofΩ meettangentially. AtT ∗ = 1 the transition inside the pore is juthe usual capillary condensation, which is accompaniea change in composition, whereas atT ∗ = 1.02 there is nochange in the amount of adsorbed fluid at the transipoint, but the adsorbate undergoes a demixing transiIn other words, with a temperature increase, the capilcondensation transforms into a demixing transition andphase behavior of the system is quite analogous to

K. Bucior et al. / Journal of Colloid and Interface Science 259 (2003) 209–222 213
rerylongefore
beenin (a
The; theingstabl
theionthethe
inghtly
itiontonts,are
ntly
erat isher,nttion
s atngble.
blelescal.in
ird-asthement.id,
wn
calm
elec-n in-ase.
topat
-intsr-
thepo-nderad-
g thents,ocus
withalp
l oflingingbothThen isthe
after
mp
ist.
Fig. 3. Examples of density profiles for model fluid M65 in the poH = 0.65. (a) Functionsρi(z) for components 1 and 2 at the capillacondensation point, evaluated by iterating the density profile equation athe adsorption (ads) and desorption (des) branches. (b) Total profiles b(solid line) and after (dashed line) capillary condensation; they haveevaluated at the same conditions as the curves in (a). The temperatureand (b) is slightly lower than the tricritical temperature. (c, d) Profilesρi(z),i = 1,2, at a temperature slightly higher than the tricritical temperature.bulk gas density in (c) is such that the demixing transition just beginstwo profiles are identical. The bulk density in (d) is higher and demixoccurs. The dashed line represents profiles corresponding to a metabranch of the adsorption isotherm.
behavior of the third class of bulk systems, according toclassification proposed by Wilding et al. [20]. Our estimatof the tricritical temperature (i.e., the temperature atend of the condensation and demixing transition and atbeginning of the solely demixing transition) isT ∗
tc ≈ 1.01.Figure 3 illustrates the changes in fluid structure dur
the transition. Parts a and b are at temperatures sliglower than the tricritical temperature,T ∗ = 0.96. All profileshave been plotted at the bulk density equal to the transpoint density,ρb = 0.02609. The profiles correspondingthe adsorption branch are identical for both componebut the profiles corresponding to the desorption branchdifferent for the first and second components. Evide(cf. Fig. 3b), the total density profile,ρ(z) = ρ1(z) + ρ2(z)
is significantly lower on the adsorption branch. In othwords, Figs. 3a and 3b reflect capillary condensation thaccompanied by demixing. At a temperature slightly higthan the tricritical temperature,T ∗ = 1.05 (Figs. 3c and 3d)the situation is different. At the equilibrium transition poiall the profiles evaluated for adsorption and desorp
)
e
branches are identical. The demixing process just beginbulk densityρb = 0.06258 and proceeds continuously alothe desorption branch, which is thermodynamically staConsequently, at slightly higher bulk density,ρb = 0.06558,the density profiles of both components on the stadesorption branch differ from each other, but the profion the metastable adsorption branch are still identiConcluding, the capillary condensation in system M65poreH = 5 leads to a phase diagram characteristic of thclass behavior according to Wilding et al. [20], wherethe bulk fluid exhibits phase behavior characteristic ofsecond class of the phase diagrams. Thus, fluid confinecan qualitatively change the phase behavior of a system
Calculations of adsorption from an equimolar bulk flucarried out for narrower pores withH = 3, have led toa conclusion similar to that for the pores withH = 5(for the sake of brevity, the relevant curves are not shohere). The tricritical temperature for theH = 3 pores equalsT ∗
tc ≈ 0.905. It is thus lower (as expected) than the tricrititemperature for theH = 5 pores. The entire phase diagrafor H = 3 pores is qualitatively the same as forH = 5 pores.
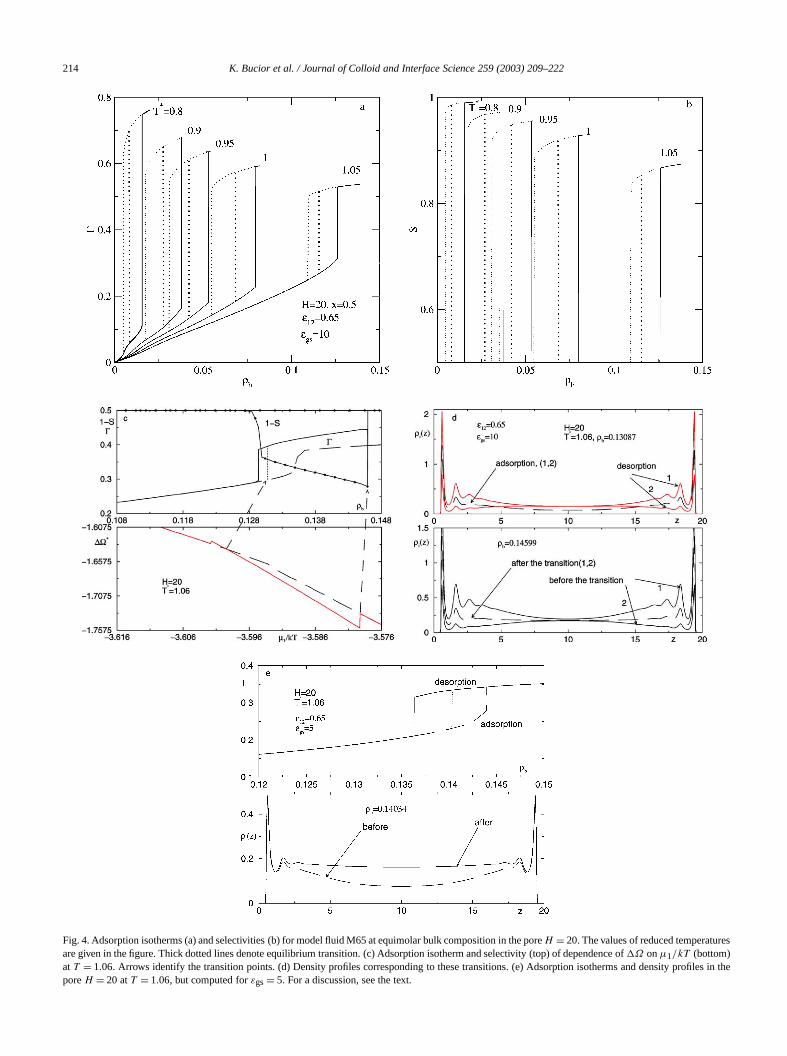
In the case of a wide pore,H = 20, the situation is differ-ent; cf. Figs. 4a and 4b. The adsorption isotherms and stivities exhibit hysteresis loops at all temperatures showthe figure. Up to temperatureT ∗ = 1.05, capillary condensation is accompanied by demixing of the condensed phHowever, at a marginally higher temperature,T ∗ = 1.06,the shape of the adsorption isotherm is surprising. Thepanel in Fig. 4c shows part of the adsorption isothermT ∗ = 1.06 within the region of bulk densities in the vicinity of the phase transition. The curves decorated with podenote the values of 1− S. The bottom panel displays coresponding plots of the excess grand potential versuschemical potential of the first component (the chemicaltentials of both components are the same in the case ustudy). Dashed lines denote curves obtained along thesorption branch, whereas solid lines denote curves alondesorption branch. Dashed arrows identify transition poiand the dotted line inside the hysteresis loop shows the lof the equilibrium transition point.
To analyze the obtained results we support ourselvesplots of the local density; cf. Fig. 4d. At a bulk density equto ρb = 0.13087 the adsorption isotherm exhibits a jumconnected with condensation and demixing; cf. top paneFig. 4d. The capillary condensation is connected to the filof the inner part of the pore. Instantaneously, demixoccurs at the pore walls, whereas the concentrations ofcomponents at the pore center are almost identical.difference in adsorption before and after condensationot large; however, cf. Fig. 4c. Before condensationadsorption per pore volume is about 0.298, whereascondensation, it is 0.394. The selectivity changes fromS =0.5 to S = 0.646. However, there is also a second juin the adsorption isotherm at bulk densityρb = 0.14599that is close to the bulk dew point density. This jumpconnected to thelowering of the total adsorption effec
214 K. Bucior et al. / Journal of Colloid and Interface Science 259 (2003) 209–222
Fig. 4. Adsorption isotherms (a) and selectivities (b) for model fluid M65 at equimolar bulk composition in the poreH = 20. The values of reduced temperaturesare given in the figure. Thick dotted lines denote equilibrium transition. (c) Adsorption isotherm and selectivity (top) of dependence ofΩ onµ1/kT (bottom)at T = 1.06. Arrows identify the transition points. (d) Density profiles corresponding to these transitions. (e) Adsorption isotherms and density profiles intheporeH = 20 atT = 1.06, but computed forεgs= 5. For a discussion, see the text.
K. Bucior et al. / Journal of Colloid and Interface Science 259 (2003) 209–222 215
l of
phas
ternge
icleula-fortstheare
le-werbyromti-hus,clas
ins.nly,rbedthe
se oion.65 a
fineplestiesonve
itted
rethe
oftheantion
indi-tionta-
en-
uidd
arygasthe
finedt-the
-re ane (cf.co-om
pera-o of
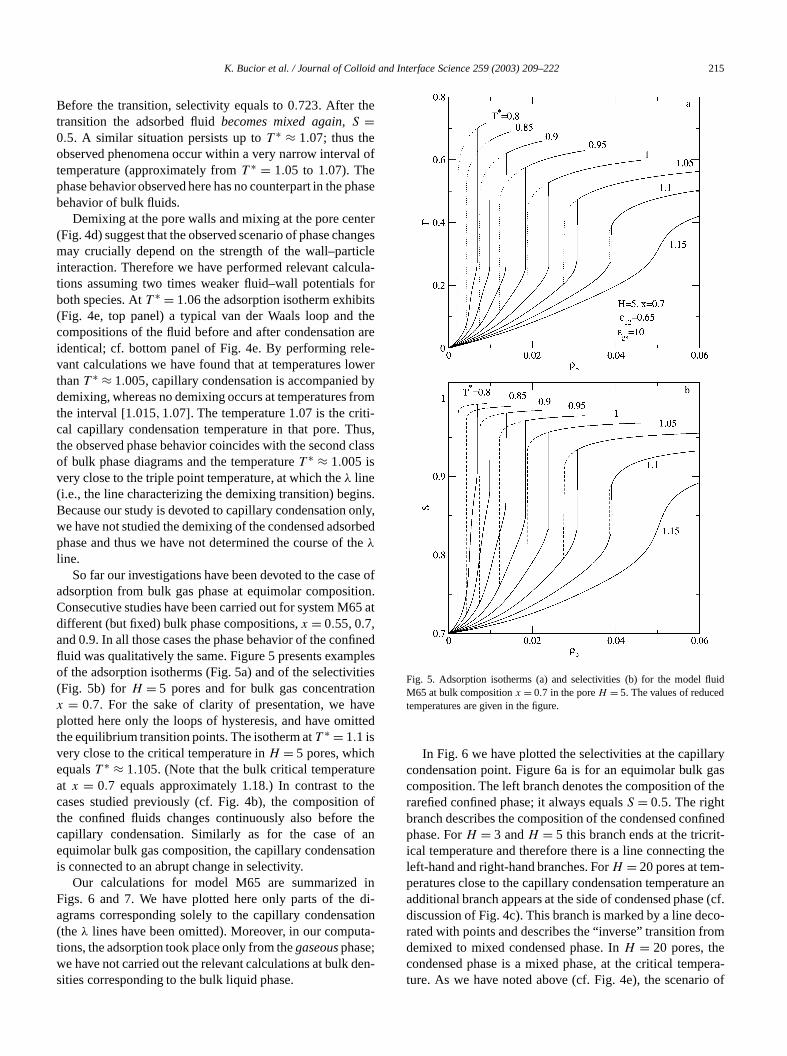
Before the transition, selectivity equals to 0.723. After thetransition the adsorbed fluidbecomes mixed again, S =0.5. A similar situation persists up toT ∗ ≈ 1.07; thus theobserved phenomena occur within a very narrow intervatemperature (approximately fromT ∗ = 1.05 to 1.07). Thephase behavior observed here has no counterpart in thebehavior of bulk fluids.
Demixing at the pore walls and mixing at the pore cen(Fig. 4d) suggest that the observed scenario of phase chamay crucially depend on the strength of the wall–partinteraction. Therefore we have performed relevant calctions assuming two times weaker fluid–wall potentialsboth species. AtT ∗ = 1.06 the adsorption isotherm exhibi(Fig. 4e, top panel) a typical van der Waals loop andcompositions of the fluid before and after condensationidentical; cf. bottom panel of Fig. 4e. By performing revant calculations we have found that at temperatures lothanT ∗ ≈ 1.005, capillary condensation is accompanieddemixing, whereas no demixing occurs at temperatures fthe interval[1.015,1.07]. The temperature 1.07 is the crical capillary condensation temperature in that pore. Tthe observed phase behavior coincides with the secondof bulk phase diagrams and the temperatureT ∗ ≈ 1.005 isvery close to the triple point temperature, at which theλ line(i.e., the line characterizing the demixing transition) begBecause our study is devoted to capillary condensation owe have not studied the demixing of the condensed adsophase and thus we have not determined the course ofλline.
So far our investigations have been devoted to the caadsorption from bulk gas phase at equimolar compositConsecutive studies have been carried out for system Mdifferent (but fixed) bulk phase compositions,x = 0.55, 0.7,and 0.9. In all those cases the phase behavior of the confluid was qualitatively the same. Figure 5 presents examof the adsorption isotherms (Fig. 5a) and of the selectivi(Fig. 5b) for H = 5 pores and for bulk gas concentratix = 0.7. For the sake of clarity of presentation, we haplotted here only the loops of hysteresis, and have omthe equilibrium transition points. The isotherm atT ∗ = 1.1 isvery close to the critical temperature inH = 5 pores, whichequalsT ∗ ≈ 1.105. (Note that the bulk critical temperatuat x = 0.7 equals approximately 1.18.) In contrast tocases studied previously (cf. Fig. 4b), the compositionthe confined fluids changes continuously also beforecapillary condensation. Similarly as for the case ofequimolar bulk gas composition, the capillary condensais connected to an abrupt change in selectivity.
Our calculations for model M65 are summarizedFigs. 6 and 7. We have plotted here only parts of theagrams corresponding solely to the capillary condensa(theλ lines have been omitted). Moreover, in our computions, the adsorption took place only from thegaseousphase;we have not carried out the relevant calculations at bulk dsities corresponding to the bulk liquid phase.
e
s
s
f
t
d
Fig. 5. Adsorption isotherms (a) and selectivities (b) for the model flM65 at bulk compositionx = 0.7 in the poreH = 5. The values of reducetemperatures are given in the figure.
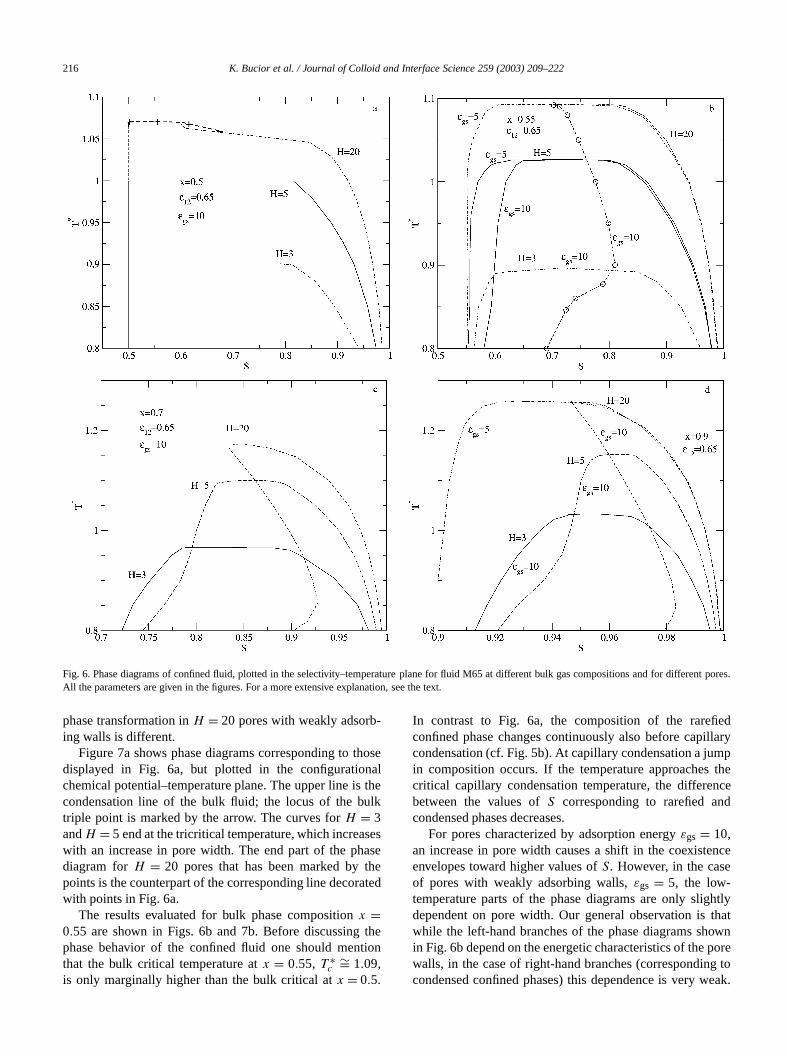
In Fig. 6 we have plotted the selectivities at the capillcondensation point. Figure 6a is for an equimolar bulkcomposition. The left branch denotes the composition ofrarefied confined phase; it always equalsS = 0.5. The rightbranch describes the composition of the condensed conphase. ForH = 3 andH = 5 this branch ends at the tricriical temperature and therefore there is a line connectingleft-hand and right-hand branches. ForH = 20 pores at temperatures close to the capillary condensation temperatuadditional branch appears at the side of condensed phasdiscussion of Fig. 4c). This branch is marked by a line derated with points and describes the “inverse” transition frdemixed to mixed condensed phase. InH = 20 pores, thecondensed phase is a mixed phase, at the critical temture. As we have noted above (cf. Fig. 4e), the scenari
216 K. Bucior et al. / Journal of Colloid and Interface Science 259 (2003) 209–222
en
Fig. 6. Phase diagrams of confined fluid, plotted in the selectivity–temperature plane for fluid M65 at different bulk gas compositions and for differt pores.All the parameters are given in the figures. For a more extensive explanation, see the text.-
hosnal
theulk
sesasetheated
thetion
edillarympthe
nced
encee
htlythatownporeg toeak.
phase transformation inH = 20 pores with weakly adsorbing walls is different.
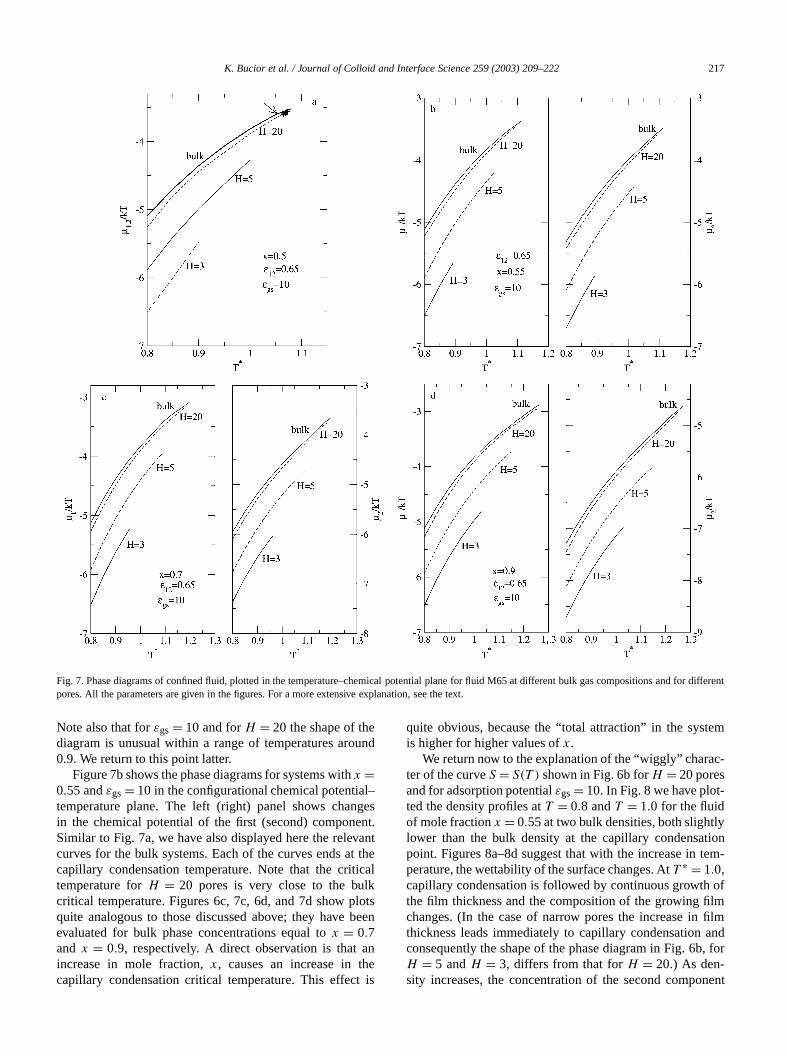
Figure 7a shows phase diagrams corresponding to tdisplayed in Fig. 6a, but plotted in the configuratiochemical potential–temperature plane. The upper line iscondensation line of the bulk fluid; the locus of the btriple point is marked by the arrow. The curves forH = 3andH = 5 end at the tricritical temperature, which increawith an increase in pore width. The end part of the phdiagram forH = 20 pores that has been marked bypoints is the counterpart of the corresponding line decorwith points in Fig. 6a.
The results evaluated for bulk phase compositionx =0.55 are shown in Figs. 6b and 7b. Before discussingphase behavior of the confined fluid one should menthat the bulk critical temperature atx = 0.55, T ∗
c∼= 1.09,
is only marginally higher than the bulk critical atx = 0.5.
e
In contrast to Fig. 6a, the composition of the rareficonfined phase changes continuously also before capcondensation (cf. Fig. 5b). At capillary condensation a juin composition occurs. If the temperature approachescritical capillary condensation temperature, the differebetween the values ofS corresponding to rarefied ancondensed phases decreases.
For pores characterized by adsorption energyεgs = 10,an increase in pore width causes a shift in the coexistenvelopes toward higher values ofS. However, in the casof pores with weakly adsorbing walls,εgs = 5, the low-temperature parts of the phase diagrams are only sligdependent on pore width. Our general observation iswhile the left-hand branches of the phase diagrams shin Fig. 6b depend on the energetic characteristics of thewalls, in the case of right-hand branches (correspondincondensed confined phases) this dependence is very w
K. Bucior et al. / Journal of Colloid and Interface Science 259 (2003) 209–222 217
r di
Fig. 7. Phase diagrams of confined fluid, plotted in the temperature–chemical potential plane for fluid M65 at different bulk gas compositions and fofferentpores. All the parameters are given in the figures. For a more extensive explanation, see the text.eund
l–ges
ent.vantt theicallklotsbee
ane
t is
tem
c-
-
ytionem-
oflmfilmand, for
nent
Note also that forεgs = 10 and forH = 20 the shape of thdiagram is unusual within a range of temperatures aro0.9. We return to this point latter.
Figure 7b shows the phase diagrams for systems withx =0.55 andεgs= 10 in the configurational chemical potentiatemperature plane. The left (right) panel shows chanin the chemical potential of the first (second) componSimilar to Fig. 7a, we have also displayed here the relecurves for the bulk systems. Each of the curves ends acapillary condensation temperature. Note that the crittemperature forH = 20 pores is very close to the bucritical temperature. Figures 6c, 7c, 6d, and 7d show pquite analogous to those discussed above; they haveevaluated for bulk phase concentrations equal tox = 0.7and x = 0.9, respectively. A direct observation is thatincrease in mole fraction,x, causes an increase in thcapillary condensation critical temperature. This effec
n
quite obvious, because the “total attraction” in the sysis higher for higher values ofx.
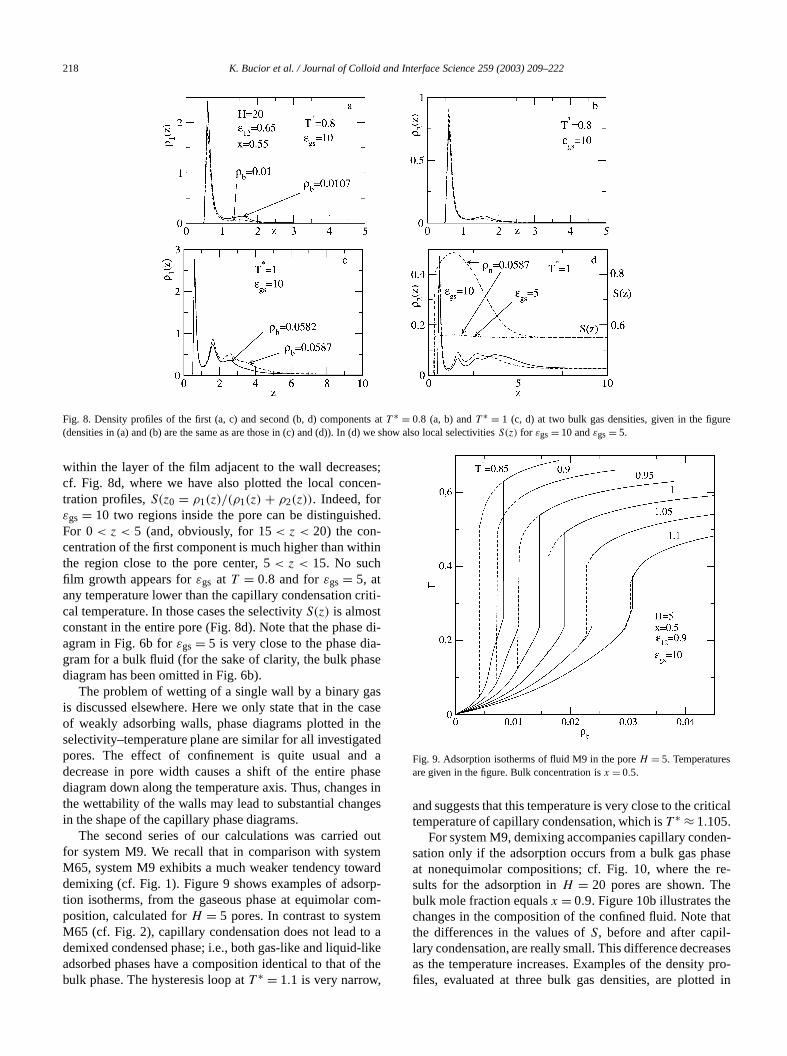
We return now to the explanation of the “wiggly” charater of the curveS = S(T ) shown in Fig. 6b forH = 20 poresand for adsorption potentialεgs= 10. In Fig. 8 we have plotted the density profiles atT = 0.8 andT = 1.0 for the fluidof mole fractionx = 0.55 at two bulk densities, both slightllower than the bulk density at the capillary condensapoint. Figures 8a–8d suggest that with the increase in tperature, the wettability of the surface changes. AtT ∗ = 1.0,capillary condensation is followed by continuous growththe film thickness and the composition of the growing fichanges. (In the case of narrow pores the increase inthickness leads immediately to capillary condensationconsequently the shape of the phase diagram in Fig. 6bH = 5 andH = 3, differs from that forH = 20.) As den-sity increases, the concentration of the second compo
218 K. Bucior et al. / Journal of Colloid and Interface Science 259 (2003) 209–222
re
Fig. 8. Density profiles of the first (a, c) and second (b, d) components atT ∗ = 0.8 (a, b) andT ∗ = 1 (c, d) at two bulk gas densities, given in the figu(densities in (a) and (b) are the same as are those in (c) and (d)). In (d) we show also local selectivitiesS(z) for εgs= 10 andεgs= 5.es;en-
ed.
hin
riti-
e di-a-se
ascastheted
d ahasees inges
outemardrp-om
mo a-likef the
itical
en-asere-eethat-asespro-
d in
within the layer of the film adjacent to the wall decreascf. Fig. 8d, where we have also plotted the local conctration profiles,S(z0 = ρ1(z)/(ρ1(z) + ρ2(z)). Indeed, forεgs = 10 two regions inside the pore can be distinguishFor 0< z < 5 (and, obviously, for 15< z < 20) the con-centration of the first component is much higher than witthe region close to the pore center, 5< z < 15. No suchfilm growth appears forεgs at T = 0.8 and forεgs = 5, atany temperature lower than the capillary condensation ccal temperature. In those cases the selectivityS(z) is almostconstant in the entire pore (Fig. 8d). Note that the phasagram in Fig. 6b forεgs = 5 is very close to the phase digram for a bulk fluid (for the sake of clarity, the bulk phadiagram has been omitted in Fig. 6b).
The problem of wetting of a single wall by a binary gis discussed elsewhere. Here we only state that in theof weakly adsorbing walls, phase diagrams plotted inselectivity–temperature plane are similar for all investigapores. The effect of confinement is quite usual andecrease in pore width causes a shift of the entire pdiagram down along the temperature axis. Thus, changthe wettability of the walls may lead to substantial chanin the shape of the capillary phase diagrams.
The second series of our calculations was carriedfor system M9. We recall that in comparison with systM65, system M9 exhibits a much weaker tendency towdemixing (cf. Fig. 1). Figure 9 shows examples of adsotion isotherms, from the gaseous phase at equimolar cposition, calculated forH = 5 pores. In contrast to systeM65 (cf. Fig. 2), capillary condensation does not lead tdemixed condensed phase; i.e., both gas-like and liquidadsorbed phases have a composition identical to that obulk phase. The hysteresis loop atT ∗ = 1.1 is very narrow,
e
-
Fig. 9. Adsorption isotherms of fluid M9 in the poreH = 5. Temperaturesare given in the figure. Bulk concentration isx = 0.5.
and suggests that this temperature is very close to the crtemperature of capillary condensation, which isT ∗ ≈ 1.105.
For system M9, demixing accompanies capillary condsation only if the adsorption occurs from a bulk gas phat nonequimolar compositions; cf. Fig. 10, where thesults for the adsorption inH = 20 pores are shown. Thbulk mole fraction equalsx = 0.9. Figure 10b illustrates thchanges in the composition of the confined fluid. Notethe differences in the values ofS, before and after capillary condensation, are really small. This difference decreas the temperature increases. Examples of the densityfiles, evaluated at three bulk gas densities, are plotte

K. Bucior et al. / Journal of Colloid and Interface Science 259 (2003) 209–222 219
es
Fig. 10. Adsorption isotherms (a) and selectivities (b) for model fluid M9 at bulk compositionx = 0.9 in the poreH = 20. The values of reduced temperaturare given in the figure.m-dings atms ofithond
ins in
nalc of
lues
ingfore
ture
Fig. 10c. The left panel shows the profiles of the first coponent, whereas the right panel shows the corresponprofiles of the second component. There are two profileρb = 0.02505; the latter bulk density is just an equilibriudensity at the capillary condensation point. The shapethe local densities for both species are quite similar. Wan increase in bulk density, the concentration of the seccomponent decreases.
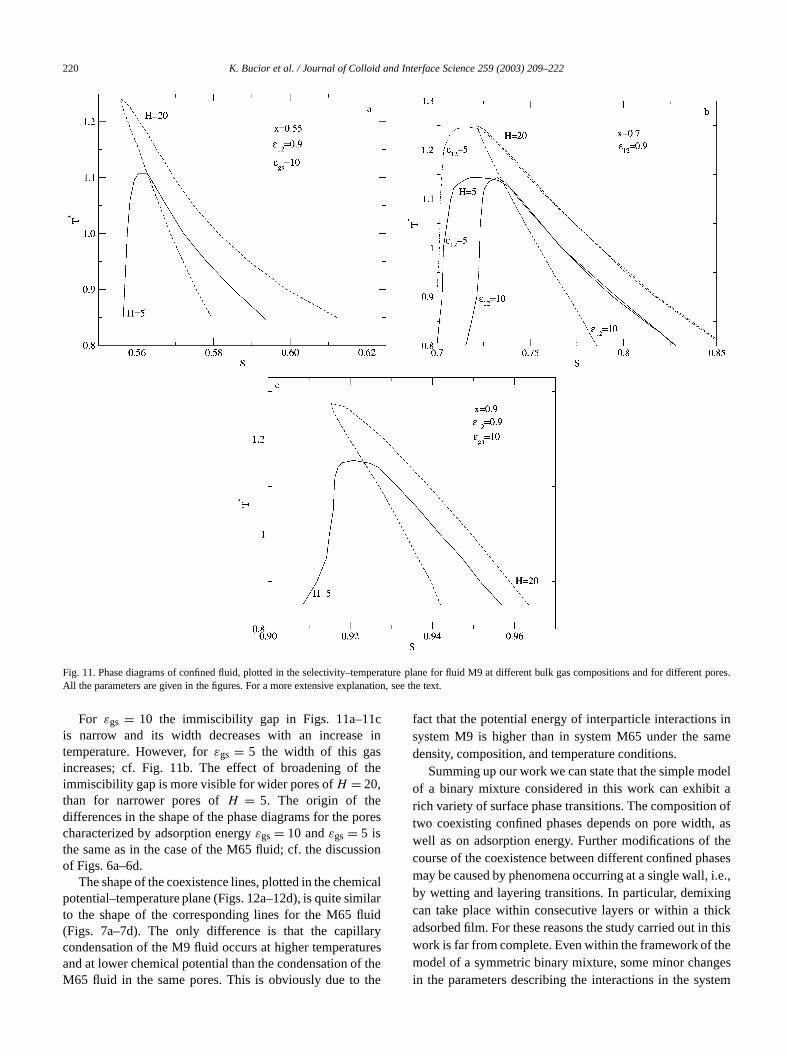
Our calculations for system M9 are summarizedFigs. 11 and 12. Those figures present phase diagram
the selectivity–temperature (Fig. 11) and configuratiochemical potential–temperature planes. Parts a, b, andthese figures have been evaluated for the following vaof bulk mole fraction:x = 0.55, x = 0.7, and x = 0.9,respectively. There is no demixing for adsorption occurrfrom a gas phase at equimolar composition and therethe phase diagram evaluated at bulk compositionx = 0.5has been plotted only in the chemical potential–temperaplane (Fig. 12d).
220 K. Bucior et al. / Journal of Colloid and Interface Science 259 (2003) 209–222
en
Fig. 11. Phase diagrams of confined fluid, plotted in the selectivity–temperature plane for fluid M9 at different bulk gas compositions and for differt pores.All the parameters are given in the figures. For a more extensive explanation, see the text.cin
the
ore
sion
icailar
uidaryuresf thethe
s inme
delt an of, astheases, i.e.,ingickthis
hegestem
For εgs = 10 the immiscibility gap in Figs. 11a–11is narrow and its width decreases with an increasetemperature. However, forεgs = 5 the width of this gasincreases; cf. Fig. 11b. The effect of broadening ofimmiscibility gap is more visible for wider pores ofH = 20,than for narrower pores ofH = 5. The origin of thedifferences in the shape of the phase diagrams for the pcharacterized by adsorption energyεgs = 10 andεgs = 5 isthe same as in the case of the M65 fluid; cf. the discusof Figs. 6a–6d.
The shape of the coexistence lines, plotted in the chempotential–temperature plane (Figs. 12a–12d), is quite simto the shape of the corresponding lines for the M65 fl(Figs. 7a–7d). The only difference is that the capillcondensation of the M9 fluid occurs at higher temperatand at lower chemical potential than the condensation oM65 fluid in the same pores. This is obviously due to
s
l
fact that the potential energy of interparticle interactionsystem M9 is higher than in system M65 under the sadensity, composition, and temperature conditions.
Summing up our work we can state that the simple moof a binary mixture considered in this work can exhibirich variety of surface phase transitions. The compositiotwo coexisting confined phases depends on pore widthwell as on adsorption energy. Further modifications ofcourse of the coexistence between different confined phmay be caused by phenomena occurring at a single wallby wetting and layering transitions. In particular, demixcan take place within consecutive layers or within a thadsorbed film. For these reasons the study carried out inwork is far from complete. Even within the framework of tmodel of a symmetric binary mixture, some minor chanin the parameters describing the interactions in the sys

K. Bucior et al. / Journal of Colloid and Interface Science 259 (2003) 209–222 221
r dif
Fig. 12. Phase diagrams of confined fluid, plotted in the temperature–chemical potential plane for fluid 9 at different bulk gas compositions and foferentpores. All parameters are given in the figures. For a more extensive explanation, see the text.ese
der
13
1)
000)
167
.orp-
i,
89
403.2,
84
r-
may lead to quite new categories of phase behavior. All thproblems are under study in our laboratory.
Acknowledgment
This work has been supported by KBN of Poland unGrant No. 4T09A15824.
References
[1] M. Sliwinska-Bartkowiak, S.L. Sowers, K.E. Gubbins, Langmuir(1996) 1182.
[2] N. Choudhury, S.K. Ghosh, Phys. Rev. E 64 (2001), 02 1206.[3] F. Schmid, N.B. Wilding, Phys. Rev. E 63 (2001) 1201.[4] Y.K. Tovbin, L.K. Zhidkova, V.N. Komarov, Russ. Chem. B 50 (200
786.
[5] A.V. Shevade, S.Y. Jiang, K.E. Gubbins, J. Chem. Phys. 113 (26933.
[6] F. Bulnes, A.J. Ramirez-Pastor, V.D. Pereyra, J. Mol. Catal. A(2001) 129.
[7] R.F. Cracknell, D. Nicholson, N. Quirke, Mol. Phys. 80 (1993) 885[8] R.F. Cracknell, D. Nicholson, A.S.R. Tennison, J. Bromhead, Ads
tion 2 (1996) 193.[9] G.S. Heffelfinger, Z. Tan, K.E. Gubbins, U. Marini Bettolo Marcon
F. van Swol, Mol. Simul. 2 (1989) 393.[10] G.S. Heffelfinger, F. van Swol, K.E. Gubbins, J. Chem. Phys.
(1988) 5202.[11] S. Jiang, K.E. Gubbins, P.B. Balbuena, J. Phys. Chem. 98 (1994) 2[12] K. Bucior, A. Patrykiejew, O. Pizio, S. Sokołowski, Mol. Phys. 200
in press.[13] W.T. Gózdz, K.E. Gubbins, A.Z. Panagiotopoulos, Mol. Phys.
(1995) 825.[14] S. Sokołowski, J. Fischer, Mol. Phys. 71 (1990) 393.[15] Z. Tan, K.E. Gubbins, J. Phys. Chem. 96 (1992) 845.[16] J.S. Rolwinson, F.L. Swinton, Liquids and Liquid Mixtures, Butte
worth, London, 1982.

222 K. Bucior et al. / Journal of Colloid and Interface Science 259 (2003) 209–222
3.
01)
.Ser.
Rev.
769.
971)
[17] A. Vidales, A.L. Benavides, A. Gil-Villegas, Mol. Phys. 99 (2001) 70[18] J.-L. Wang, G.-W. Wu, R.J. Sadus, Mol. Phys. 98 (2000) 715.[19] G. Kahl, E. Schöll-Paschinger, A. Lang, Monats. Chem. 132 (20
1413.[20] N.B. Wilding, F. Schmid, P. Nielaba, Phys. Rev. E 58 (1998) 2201[21] P.H. Van Konynenburg, R.L. Scott, Philos. Trans. R. Soc. London
A 298 (1980) 495.[22] E. Schöll-Paschinger, D. Levesque, J.-J. Weis, G. Kahl, Phys.
E 64 (2001), 01 10502.[23] E. Parchinger, G. Kahl, Phys. Rev. E 61 (2000) 5330.[24] L. Tremblay, S.M. Socol, S. Lacelle, Phys. Rev. E 61 (2000) 656.
[25] P.A. Gordon, E.D. Glandt, J. Chem. Phys. 105 (1996) 4257.[26] S. Iatsevitch, F. Forstmann, J. Phys. Condens. Matter 13 (2001) 4[27] M. Wendland, Fluid Phase Equilib. 147 (1998) 105.[28] J. Stecki, S. Toxvaerd, J. Chem. Phys. 102 (1995) 7163;
J. Stecki, S. Toxvaerd, J. Chem. Phys. 103 (1995) 4352;J. Stecki, S. Toxvaerd, J. Chem. Phys. 103 (1995) 9763.
[29] Y. Rosenfeld, Phys. Rev. Lett. 63 (1989) 980.[30] S. Roth, S. Dietrich, Phys. Rev. E 62 (2000) 6926.[31] M. Schmidt, Phys. Rev. E 62 (2000) 3799.[32] J.D. Weeks, D. Chandler, H.C. Andersen, J. Chem. Phys. 54 (1
5237.
Copyright © 2022 FDOKUMEN