El libro negro del emprendedor Fernando Trias de Bes Capitulos
CALIBRATION OF A DETAILED BES MODEL TO MEASURED DATA USING AN EVIDENCE-BASED ANALYTICAL OPTIMISATION APPROACH
Daniel Coakley1, Paul Raftery2, Padraig Molloy1 and Gearóid White2
1Dept. of Mechanical and Biomedical Engineering, NUI, Galway, Ireland 2Irish Research Unit for Sustainable Energy (IRUSE), Galway, Ireland
[email protected], [email protected], [email protected]
ABSTRACT This paper outlines a methodology for the calibration of detailed building energy simulation (BES) models using an analytical optimisation approach. The approach combines evidence-based model development with statistical Monte-Carlo based optimisation techniques. The first stages of the proposed calibration methodology are applied to a 700m2 naturally-ventilated library building using short-term monitored BMS and sensor data. The paper concludes with a discussion of how this methodology differs from existing approaches and the benefits it offers over traditional calibration techniques.
INTRODUCTION Whole building energy models provide a means of understanding building operation as well as optimising performance. Simulation tools, such as EnergyPlus, represent continuous, stochastic processes in buildings by discrete time-step, deterministic model estimations. The built environment is complex and influenced by a large number of independent and interdependent variables. Thus, it is difficult to achieve an accurate representation of real-world building operation in a model. By ‘calibrating’ the model to measured data, we aim to achieve more accurate and reliable representation of the building. A review of current literature on this topic has revealed that there is no generally accepted method by which building energy models should be calibrated (T. A. Reddy 2006).
Uses of Calibrated Simulation Energy Simulation tools have been used since the early 1960’s to analyse the thermal behaviour and energy consumption in buildings. Initially, they were primarily used in the design stage to optimise the design of the building envelope and HVAC systems. More recently, building energy simulation (BES) models have been employed in the post-construction stage of the building life-cycle for a number of purposes, such as:
Building Continuous Commissioning (Claridge 2004; Liu et al. 2003)
Building Operation Optimisation (Sun & A. Reddy 2005)
Simulation-assisted Building Control (Clarke et al. 1993; Coffey et al. 2010)
Technical and economical evaluation of Energy Conservation Measures (ECM’s) (Waltz 2000; Iqbal & Al-Homoud 2007)
In order for BES models to be used with any degree of confidence, it is necessary that the existing model closely represent the actual behaviour of the building under study. Therefore, the purpose of model calibration is to reduce the discrepancies between building energy simulation (BES) and measured building performance.
Problems with Calibrated Simulation According to Tupper et al. (2011), modellers rarely complete accurate, quality calibration of energy models for existing buildings due to:
The lack of understanding and consistent use of standardized methods.
Building energy modelling being an over-specified problem
The expense and time needed to obtain the required hourly sub-metered data, which is usually not available.
The lack of integrated tools and automated methods that could assist calibration
Since the calibration problem is itself over-parameterised and under-determined, it is impossible to find an exact, unique solution. As a result, calibration methodologies and results are often not discussed in detail in many case studies and an approach in which the analyst tunes, or "fudges" (Troncoso 1997), some of the myriad parameters until the model meets the acceptance criteria is commonly used. ‘Furthermore, when a model is established as being calibrated (i.e. the user reports that the accuracy for electricity consumption is ±5% per month), the author does not reveal the techniques used other than stating the final result. Hourly and daily values are seldom reported. In cases where error estimates are presented, the methods and equations used to obtain comparisons are not.’ (Haberl & Bou-Saada 1998). These ad-hoc, subjective approaches are not systematic and not explicitly evidence-based.
Proceedings of Building Simulation 2011: 12th Conference of International Building Performance Simulation Association, Sydney, 14-16 November.
- 374 -
LITERATURE REVIEW The calibration of a forward building energy simulation program, involving numerous input parameters to commonly available building energy data is a highly under-determined problem. This yields a non-unique solution (Carroll & Hitchcock 1993). As highlighted by Kaplan et al. (1990), it will never be possible to identify the exact solution to the calibration problem. Furthermore, limiting ourselves to a unique plausible solution would make the prediction accuracy of the calibrated model questionable. Moreover, calibration requires a dynamic matching over one year between computed and measured values and not a static one at one condition (T. A. Reddy 2006).
Graphical Model Calibration To date, the calibration of models to monthly measured data has been the preferred approach. This method relies on simple data comparison techniques such as bar-charts and monthly percent difference time-series graphs. The issue of determining where errors exist between measured and simulated performance is simple when using monthly or diurnal plots. Unfortunately, at hourly levels of calibration, many of the traditional graphical techniques become overwhelmed with too many data points which make it difficult to determine the central tendency of black clouds of data points (Haberl & Bou-Saada 1998).
Statistical Optimisation Approach A mathematical formulation process has been suggested to find a solution whereby a value and weighting is assigned to certain known or measurable parameters (Carroll & Hitchcock 1993). By using an objective function approach, the aim is to find a solution that minimises mean square errors between measured and simulated energy use data while conforming to these weighted values. More recently, a methodology has been developed whereby best-guess estimates are assigned to a heuristically defined set of influential parameters (T. A. Reddy et al. 2007). These are then subject to a Monte-Carlo (MC) simulation involving thousands of simulation trials to find a set of promising vector solutions. Simulations are carried out using the DOE-2 software and calibrated to monthly utility bills. However, this methodology uses building and HVAC templates, and thus, does not account for the fact that each building is unique. In addition, it does not provide the analyst with a comparison between measured and simulated building performance at a detailed level (e.g., energy consumption at a sub-utilities level). Thus, it is not an acceptable approach if the aim is to obtain detailed results to drive the development of simulation tools and best practice modelling techniques.
Despite its limitations, this study provides an excellent basis for further work on analytical optimisation of the calibration process.
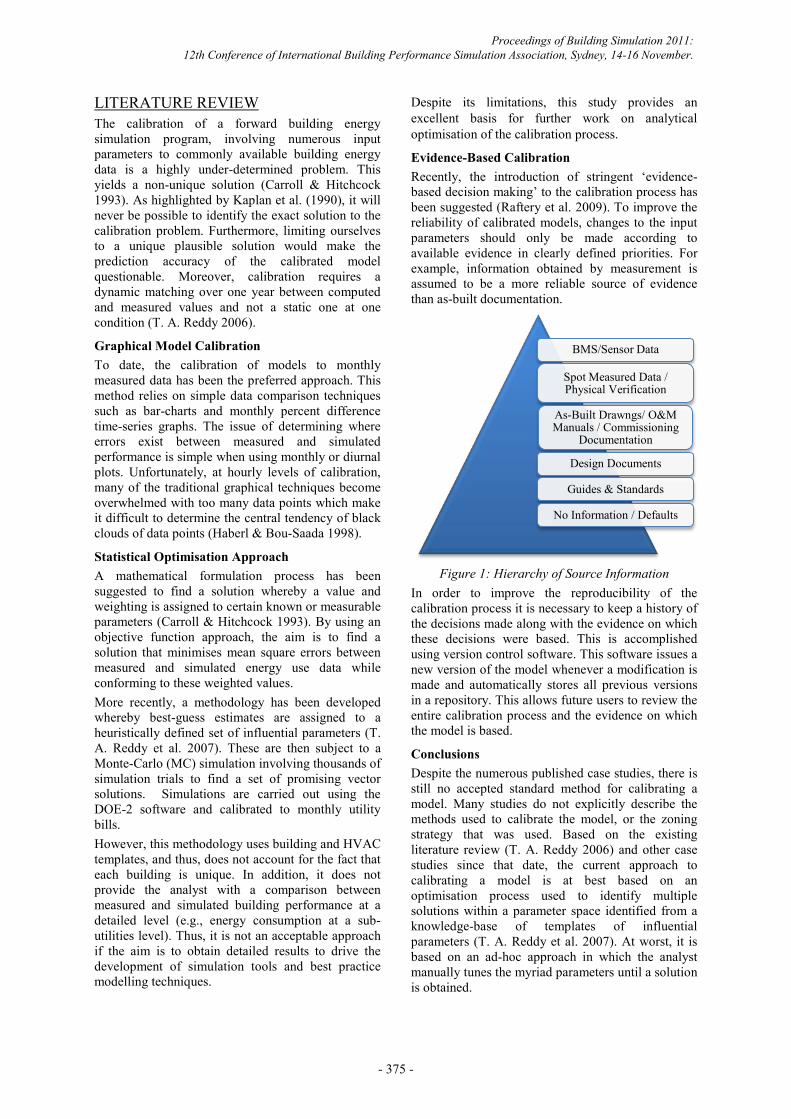
Evidence-Based Calibration Recently, the introduction of stringent ‘evidence-based decision making’ to the calibration process has been suggested (Raftery et al. 2009). To improve the reliability of calibrated models, changes to the input parameters should only be made according to available evidence in clearly defined priorities. For example, information obtained by measurement is assumed to be a more reliable source of evidence than as-built documentation.
Figure 1: Hierarchy of Source Information In order to improve the reproducibility of the calibration process it is necessary to keep a history of the decisions made along with the evidence on which these decisions were based. This is accomplished using version control software. This software issues a new version of the model whenever a modification is made and automatically stores all previous versions in a repository. This allows future users to review the entire calibration process and the evidence on which the model is based.
Conclusions Despite the numerous published case studies, there is still no accepted standard method for calibrating a model. Many studies do not explicitly describe the methods used to calibrate the model, or the zoning strategy that was used. Based on the existing literature review (T. A. Reddy 2006) and other case studies since that date, the current approach to calibrating a model is at best based on an optimisation process used to identify multiple solutions within a parameter space identified from a knowledge-base of templates of influential parameters (T. A. Reddy et al. 2007). At worst, it is based on an ad-hoc approach in which the analyst manually tunes the myriad parameters until a solution is obtained.
BMS/Sensor Data
Spot Measured Data / Physical Verification
As-Built Drawngs/ O&M Manuals / Commissioning
Documentation
Design Documents
Guides & Standards
No Information / Defaults
Proceedings of Building Simulation 2011: 12th Conference of International Building Performance Simulation Association, Sydney, 14-16 November.
- 375 -
Optional
METHODOLOGY This paper proposes an analytical optimisation approach for the calibration of detailed Building Energy Simulation (BES) models. In order to avoid an over-reliance on analyst knowledge and judgement, this methodology follows a clear evidence-based structure and proven statistical methods. This can be broken down into the following steps:
1. Data Gathering / Building Audit. 2. Evidence-based BES model development. 3. Bounded Grid Search 4. Refined Grid Search (Optional) 5. Uncertainty Analysis
The methodology described below is intended solely for the advancement of calibration research and is not suggested for commercial adoption in its current form due to the significant levels of time and resources required. An initial Building Energy Simulation (BES) model of the building is developed. The analyst collects data pertaining to the building construction, systems and operating schedules over time and uses this information to evolve the BES model. Version control software tracks model evolution along with the relevant evidence where available. This process continues until all readily available sources of building information have been exhausted.
Best-guess estimates and probability density functions are applied to the input parameters based on the hierarchy of source information. A Monte-Carlo simulation process generates a set of random parameter vector trials. Finally, EnergyPlus performs a batch simulation of the above trials and a goodness-of-fit analysis reveals the most promising set of solutions that satisfy the objective function.
Data Gathering / Building Audit In order to create an accurate representation of the chosen building within the BES software, it is necessary to first gather and record the building geometry data, environmental & weather data, HVAC system specifications and detailed load/occupancy schedules.
Building Description Data: Gather comprehensive data pertaining to the building and its systems. Sources of this information may include, but are not limited to, the following:
Building Information Model (BIM) As-Built Drawings Operation & Maintenance (O&M) Manuals Surveys and Interviews
Building Audit: Check that the as-built drawings and O&M manuals conform to the actual structure and systems. Check that the required data monitoring and recording systems are in place and are operational.
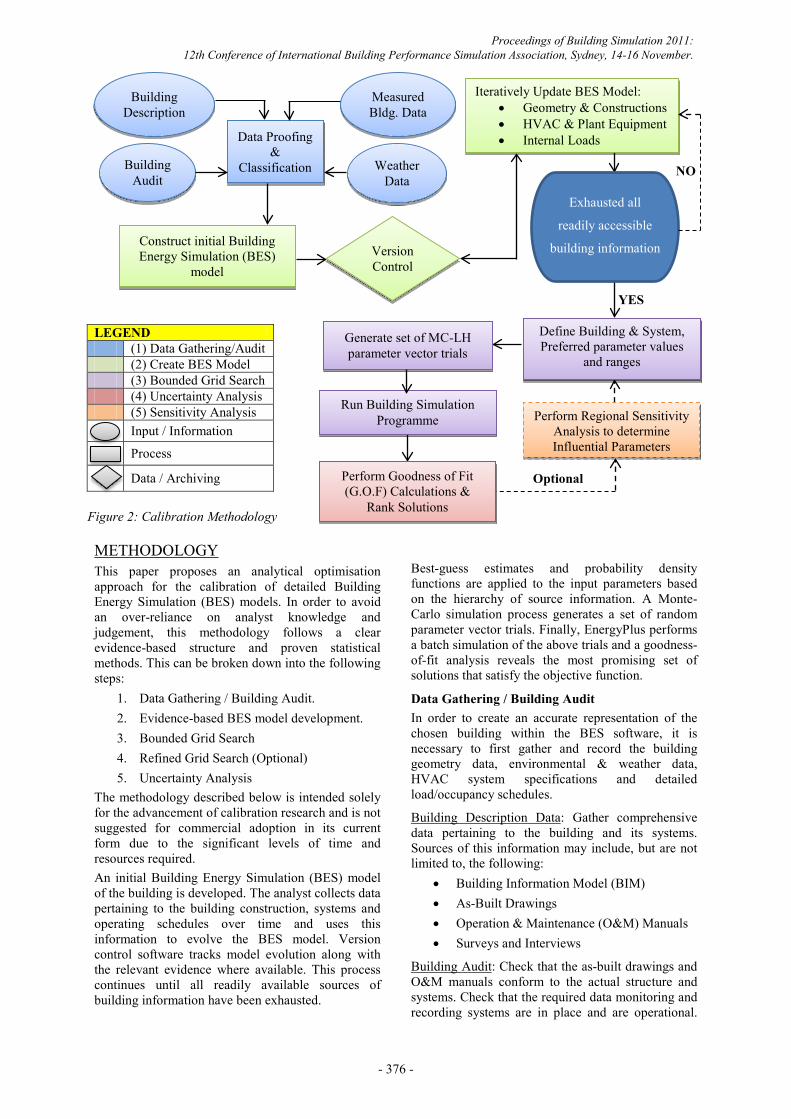
LEGEND (1) Data Gathering/Audit (2) Create BES Model (3) Bounded Grid Search (4) Uncertainty Analysis (5) Sensitivity Analysis Input / Information Process Data / Archiving
Figure 2: Calibration Methodology
Building Audit
Building Description
Weather Data
Data Proofing &
Classification
Measured Bldg. Data
Construct initial Building Energy Simulation (BES)
model Version Control
Iteratively Update BES Model: Geometry & Constructions HVAC & Plant Equipment Internal Loads
Exhausted all
readily accessible
building information
NO
YES
Perform Goodness of Fit (G.O.F) Calculations &
Rank Solutions
Define Building & System, Preferred parameter values
and ranges
Generate set of MC-LH parameter vector trials
Perform Regional Sensitivity Analysis to determine Influential Parameters
Run Building Simulation Programme
Proceedings of Building Simulation 2011: 12th Conference of International Building Performance Simulation Association, Sydney, 14-16 November.
- 376 -
Perform additional building audits as necessary to account for any changes to building or system specification.
Continuous monitoring and data recording during calibration period: Perform regular audits to determine actual occupancy and equipment load schedules. Once data has been collected over a number of days/weeks at selected intervals, typical values may be assigned to the schedules for different time periods.
Weather Data: Accurate weather data for the calibration period is required to simulate building response to external conditions. Ideally, this data is measured at a local weather station. This station should maintain a historical record of environmental variables (as per EnergyPlus ‘epw’ weather file requirements) measured in hourly intervals (or more frequently) over at least one year.
Data Proofing and Classification: Using visual or statistical screening methods, check that the data coming from the BMS and monitoring devices is of the required standard for final hourly calibration as per ASHRAE Guideline 14-2002. Install any extra equipment/sensors where necessary. Data is then classified based on the deemed reliability of its source (Figure 1). These classifications are used to assign expected ranges of variation in the later stages of the methodology.
Evidence-Based BES Model Development This methodology calls for an iterative evidence-based evolution of the initial BES model. This approach is as follows:
Construct Initial BES Model: Using the information gathered in Stage 1, create the initial 3D geometric model of the building and internal HVAC systems. This model will serve as the starting point.
Iteratively Update Model: At this stage of the process, the analyst begins to make iterative changes to the model based on the initial building database along with information acquired on a continuous basis:
Building Management System (BMS) logs Regular Surveys and Audits
Version control software tracks each model revision. The software provides a description of the revision and references the evidence that supports the change made in that revision.
Bounded Grid Search This stage of the statistical calibration methodology involves fixing the ranges of variability of continuous parameters to reduce the dimensionality of the search space. This is followed by a random sampling Latin-Hypercube Monte-Carlo (LHMC) method to identify promising regions of local optima. The requires the following steps;
Define best-guess estimates for all unknown variables based on knowledge of the building and systems.
Define the range of variation for unknown input variables based on data classification information. The following ranges provide a reasonable basis for initial simulation trials;
Measured Data (± 0%) Spot-Measured Data (± 2.5%) Drawings/ O&M’s /Commissioning
Documents (± 10%) Design Documents (± 15%) Guides and Standards (± 30%) No Information (± 40%)
For continuous parameters, ranges of variation are characterised by probability density functions bounded by upper 95th and lower 5th probability threshold values. Discrete variables are characterized by minimum, maximum and base-case values. The analyst must also account for multi-dimensional variables, such as occupancy schedules, which are dependent on time of day, day of week as well as time of year. Such parameters may be discretized for specified periods and assigned ranges of variation based on available information.
Monte-Carlo Simulation: In a Monte Carlo analysis, a large number of evaluations of the model are performed with randomly sampled model inputs (A. Saltelli et al. 2000). This involves the following main steps;
Generation of a sample from each probability density function (pdf)
Evaluation of the model for each element of the sample.
Result analysis. Using the Monte-Carlo approach produces an input sample such as;
=
( )
( )
( )
( )
( )
( )
( )
( )
( )
( )
( )
( )
Where; z represents the input variables, N the sample size and M the corresponding vector solution matrix.
Run Simulation: Run batch EnergyPlus simulation for each of the LHMC trials. This generates the desired output vector, Y, for each row of matrix (1):
Equation (1) Monte-Carlo Vector Matrix
Proceedings of Building Simulation 2011: 12th Conference of International Building Performance Simulation Association, Sydney, 14-16 November.
- 377 -
=
For this study, the author recommends a batch of 100,000 simulation trials based on a single-zone BES model.
Uncertainty Analysis Since calibration is a highly underdetermined problem, more than one solution may satisfy the objective function. In addition, it is erroneous to assume that a solution that satisfies the objective function is therefore implicitly correct. This is due to the many degrees of freedom that may produce good calibration overall even though the individual parameters may be incorrectly identified. Therefore, this step involves ranking the solutions based on statistical goodness-of-fit (GOF) criteria. This involves the calculation of the following dimensionless indices for each model (ASHRAE 14 2002);
(%) = ( )
( ) [A]
(%) =
( )
[B]
Where; and are the respective measured and simulated data points for each model instance i; n is the number of data points and is the average of the measured data points. A GOF is then calculated for each; GOF
= + + ( ) ( )
+ +( )
GOF
= B + + ( )B ( )
+ +( )
Where, ‘A’ represents Coefficient of Variation of the Root Mean Square Error (CV RMSE); ‘B’ represents Normalised Mean Bias Error (NMBE); wkWh and wkWh(H) are weighted ratios which represent the ratio of the annual cost of electricity and hot water use, respectively, in kWh divided by the total annual utility cost; wdeg is a weighted ratio which represents the mean zone air temperature (average room temperature weighted by room volume where multiple room temperature sensors are present) in oC; and (wkWh+wkWh(H) +wdeg=1)
The weighting applied to wdeg is at the discretion of the analyst. Its inclusion in the calibration criteria negates the risk of choosing a less representative
BES model. Since, the ‘best solution’ will depend on the weighting assigned to the CV and NMBE indices; we therefore introduce a consolidated index as follows;
GOF = ( + )
( + )
/
Where (wCV + wNMBE = 1). Using these indices, we can filter out parameter vectors that result in high GOF numbers. Simulation trials with lower GOF numbers represent parameter vectors that provide a closer match to measured utility data. Depending on the results of the uncertainty analysis, the analyst may perform a further refinement of the coarse grid simulation. Section 5.4.2.4 of the ASHRAE-14 document (ASHRAE 14 2002) stipulates that the calibrated computer simulation model should be accurate to within 10% for the NMBE and 30% for CV(RMSE) relative to hourly measured data. In case a calibration run yields relatively few solutions (<0.1% of total) meeting these criteria, the analyst should consider re-evaluating the stipulated ranges of variation of some of the influential parameters. This entails performing a Regional Sensitivity Analysis to determine the influential variables that require re-evaluation.
Regional Sensitivity Analysis (Optional) A test for statistical significance of each input factor may be carried out using a Monte Carlo Filtering (MCF) approach, as described by A. Saltelli (A Saltelli 2004). This process ranks variables based on output influence. The analyst may then further investigate these variables within the BES model and revise their respective ranges of variation, if necessary. By narrowing the ranges of variation of influential variables and freezing weak parameters, the analyst may perform a more robust search of the refined parameter space. Step 4 is repeated to determine the GOF of the refined solutions. However, it is unclear at this time whether a sensitivity analysis will produce significant improvements in model accuracy. In addition, high-dimensional model sensitivity analysis requires the application of advanced techniques to account for their complex interaction structure. Hence, this discussion on the subject is limited to the above provided reference. Conclusions The above methodology returns numerous solutions that satisfy the calibration criteria. These solutions are then ranked and filtered according to statistical goodness-of-fit indices. The top 100 are then selected as the final ‘set of calibrated solutions’.
Equation (2) Monte-Carlo Output Vector
Proceedings of Building Simulation 2011: 12th Conference of International Building Performance Simulation Association, Sydney, 14-16 November.
- 378 -

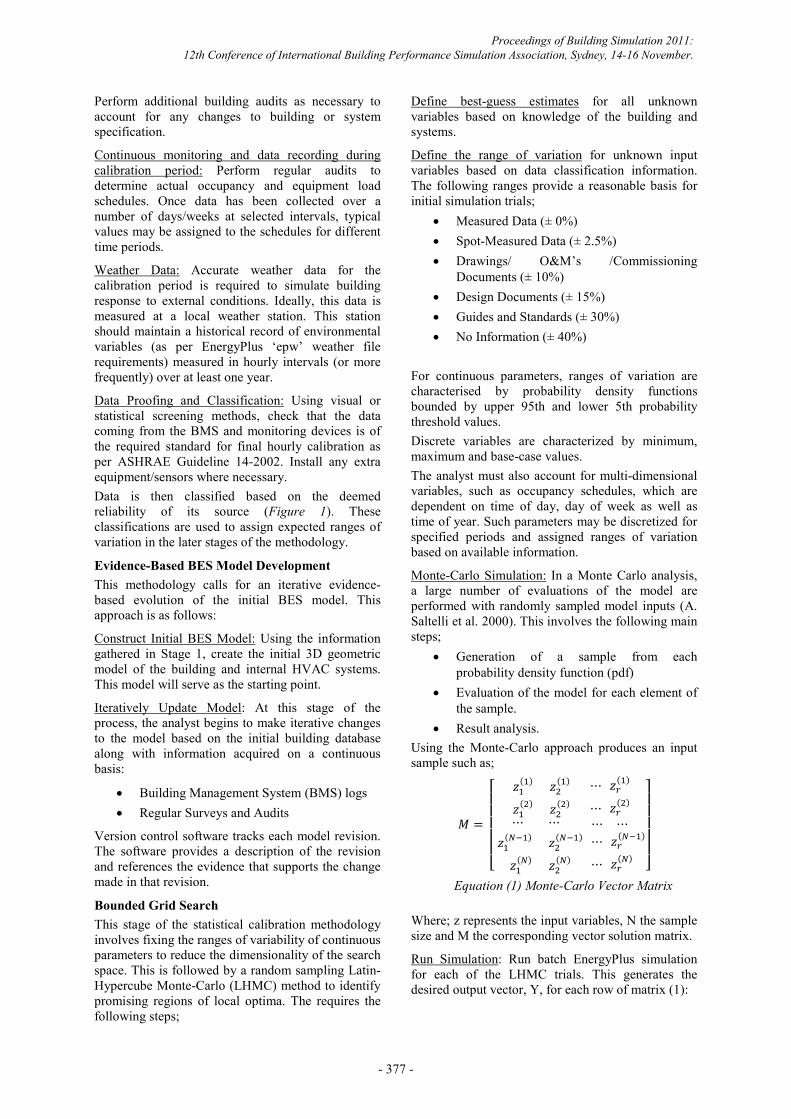
CASE STUDY NUI, Galway Nursing Library The Nursing Library is a newly constructed building at the National University of Ireland, Galway located in Galway, Ireland. The 3-storey building contains a library and study areas, as well as a computer room on the ground floor. It has a gross floor area of 700m2 and was completed in 2009.
The building is currently a focus of research in areas such as whole building energy simulation, energy performance of earth tube systems, and calibrated CFD modelling of naturally ventilated spaces.HVAC systems This mixed mode building has a dedicated outside air system (DOAS) for ventilation and automatically (or manually) operated windows for natural ventilation in most areas. The DOAS draws air through an earth tube system to temper the air in the winter and summer months. Stand-alone direct exchange units cool the computer rooms. Convective hot water baseboard heaters maintain indoor temperatures outside of the summer months. Campus-wide district hot water supplies all of the heating systems in the building. It is possible to simulate all of these HVAC systems in whole building energy simulation tools such as EnergyPlus. However, it is expected that a naturally ventilated building would be quite difficult to calibrate to a reasonable level of accuracy due to the variability of parameters on which energy consumption is highly dependent, such as wind driven infiltration through windows. Furthermore, the building’s size and the zones that are partially below grade will increase the impact of 2- and 3-dimensional heat transfer effects when compared to larger buildings.
Stock information and measured data The existing BMS monitors a significant number of points in this building. These include:
Space temperature (oC) Space CO2 levels (ppm) Electrical Energy Consumption (kWh)
Heat Energy Consumption (kWh) However, initially the data was not archived for a sufficient period to be of use in annual calibration of whole building energy models. The BMS was modified to archive this data in April 2011. The electrical panel also explicitly separates electricity consumption by end-use (e.g. HVAC, lighting and plug loads). Also, it should be noted that the location of the building ensures easy access for site surveys and further measurement. The quality of stock information about the building is very high due to its recent construction, and the attention paid to the building during commissioning by researchers at the National University of Ireland, Galway. High quality as-built drawings and detailed information on materials and constructions are available. In addition, O&M information and detailed design criteria is available for all the HVAC equipment.
Data Gathering / Audit In addition to the metering discussed above, the following have now been installed;
(i) Weather Station, measuring;
Dry-bul Relative humidity (± 2%); Barometric pressure (± 50Pa). Wind speed [±0.1ms-1 (0.3 – 10ms-1); ± 1% (
10 - 55ms-1); ± 2% (> 55ms-1)]; Wind speed -3s gust [(±0.1ms-1 (0.3 – 10ms-
1); ± 1% ( 10 - 55ms-1); ± 2% (> 55ms-1)]; Wind direction [± 2% (>5ms-1)]; Global Solar Irradiance (<5%); Diffuse Solar Radiation (<15%) Barometric pressure (± 50Pa).
(ii) Uni-directional infra-red people counter at sole building entrance measuring cumulative light beam interruptions.
(iii) Data Logger, measuring; Inlet/Outlet Low-Pressure Hot Water
; Ground Earth Tube Inlet/Outlet Temperature
In addition to the above metering, the building also underwent an extensive audit. Surveys were conducted to measure and verify (where possible);
Building materials & constructions Building geometry HVAC & plant equipment HVAC schedules
Figure 3: NUI, Galway Nursing Library
Proceedings of Building Simulation 2011: 12th Conference of International Building Performance Simulation Association, Sydney, 14-16 November.
- 379 -
Regular surveys are carried out to identify patterns for;
Electrical equipment & operating schedules Lighting load and operating schedules Occupancy schedules
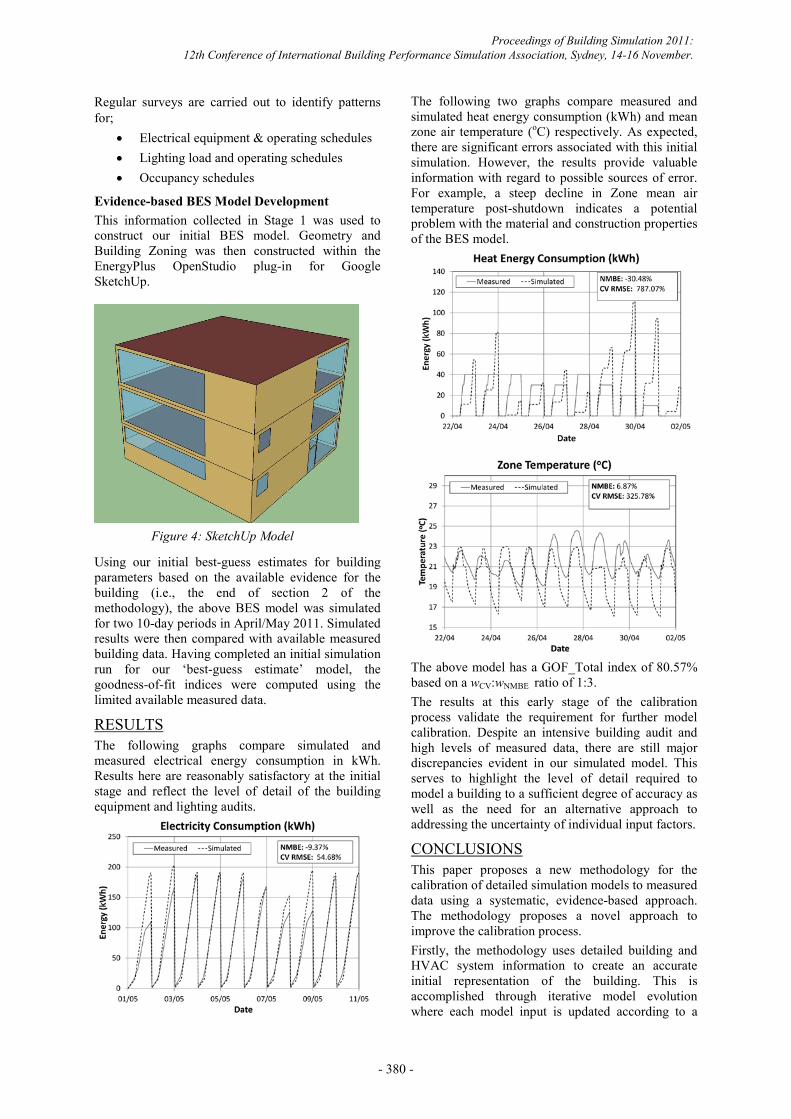
Evidence-based BES Model Development This information collected in Stage 1 was used to construct our initial BES model. Geometry and Building Zoning was then constructed within the EnergyPlus OpenStudio plug-in for Google SketchUp.
Using our initial best-guess estimates for building parameters based on the available evidence for the building (i.e., the end of section 2 of the methodology), the above BES model was simulated for two 10-day periods in April/May 2011. Simulated results were then compared with available measured building data. Having completed an initial simulation run for our ‘best-guess estimate’ model, the goodness-of-fit indices were computed using the limited available measured data.
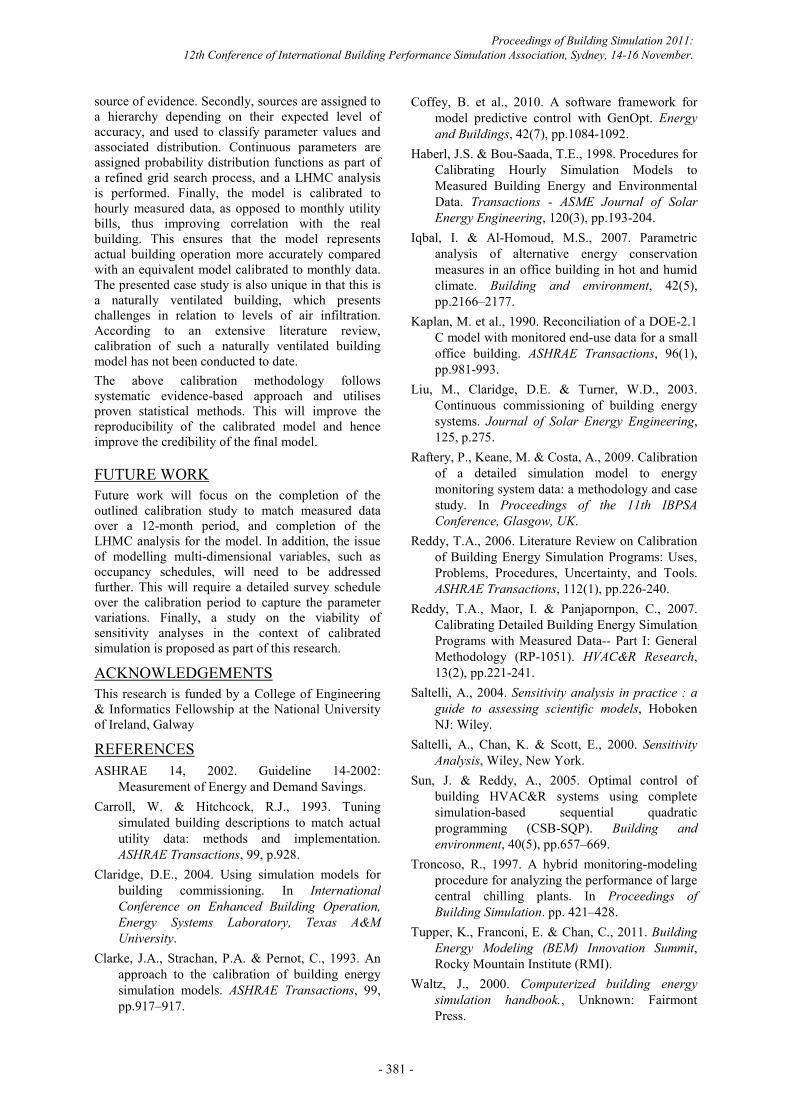
RESULTS The following graphs compare simulated and measured electrical energy consumption in kWh. Results here are reasonably satisfactory at the initial stage and reflect the level of detail of the building equipment and lighting audits.
The following two graphs compare measured and simulated heat energy consumption (kWh) and mean zone air temperature (oC) respectively. As expected, there are significant errors associated with this initial simulation. However, the results provide valuable information with regard to possible sources of error. For example, a steep decline in Zone mean air temperature post-shutdown indicates a potential problem with the material and construction properties of the BES model.
The above model has a GOF_Total index of 80.57% based on a wCV:wNMBE ratio of 1:3. The results at this early stage of the calibration process validate the requirement for further model calibration. Despite an intensive building audit and high levels of measured data, there are still major discrepancies evident in our simulated model. This serves to highlight the level of detail required to model a building to a sufficient degree of accuracy as well as the need for an alternative approach to addressing the uncertainty of individual input factors.
CONCLUSIONS This paper proposes a new methodology for the calibration of detailed simulation models to measured data using a systematic, evidence-based approach. The methodology proposes a novel approach to improve the calibration process. Firstly, the methodology uses detailed building and HVAC system information to create an accurate initial representation of the building. This is accomplished through iterative model evolution where each model input is updated according to a
Figure 4: SketchUp Model
Proceedings of Building Simulation 2011: 12th Conference of International Building Performance Simulation Association, Sydney, 14-16 November.
- 380 -
source of evidence. Secondly, sources are assigned to a hierarchy depending on their expected level of accuracy, and used to classify parameter values and associated distribution. Continuous parameters are assigned probability distribution functions as part of a refined grid search process, and a LHMC analysis is performed. Finally, the model is calibrated to hourly measured data, as opposed to monthly utility bills, thus improving correlation with the real building. This ensures that the model represents actual building operation more accurately compared with an equivalent model calibrated to monthly data. The presented case study is also unique in that this is a naturally ventilated building, which presents challenges in relation to levels of air infiltration. According to an extensive literature review, calibration of such a naturally ventilated building model has not been conducted to date. The above calibration methodology follows systematic evidence-based approach and utilises proven statistical methods. This will improve the reproducibility of the calibrated model and hence improve the credibility of the final model.
FUTURE WORK Future work will focus on the completion of the outlined calibration study to match measured data over a 12-month period, and completion of the LHMC analysis for the model. In addition, the issue of modelling multi-dimensional variables, such as occupancy schedules, will need to be addressed further. This will require a detailed survey schedule over the calibration period to capture the parameter variations. Finally, a study on the viability of sensitivity analyses in the context of calibrated simulation is proposed as part of this research.
ACKNOWLEDGEMENTS This research is funded by a College of Engineering & Informatics Fellowship at the National University of Ireland, Galway
REFERENCES ASHRAE 14, 2002. Guideline 14-2002:
Measurement of Energy and Demand Savings. Carroll, W. & Hitchcock, R.J., 1993. Tuning
simulated building descriptions to match actual utility data: methods and implementation. ASHRAE Transactions, 99, p.928.
Claridge, D.E., 2004. Using simulation models for building commissioning. In International Conference on Enhanced Building Operation, Energy Systems Laboratory, Texas A&M University.
Clarke, J.A., Strachan, P.A. & Pernot, C., 1993. An approach to the calibration of building energy simulation models. ASHRAE Transactions, 99, pp.917–917.
Coffey, B. et al., 2010. A software framework for model predictive control with GenOpt. Energy and Buildings, 42(7), pp.1084-1092.
Haberl, J.S. & Bou-Saada, T.E., 1998. Procedures for Calibrating Hourly Simulation Models to Measured Building Energy and Environmental Data. Transactions - ASME Journal of Solar Energy Engineering, 120(3), pp.193-204.
Iqbal, I. & Al-Homoud, M.S., 2007. Parametric analysis of alternative energy conservation measures in an office building in hot and humid climate. Building and environment, 42(5), pp.2166–2177.
Kaplan, M. et al., 1990. Reconciliation of a DOE-2.1 C model with monitored end-use data for a small office building. ASHRAE Transactions, 96(1), pp.981-993.
Liu, M., Claridge, D.E. & Turner, W.D., 2003. Continuous commissioning of building energy systems. Journal of Solar Energy Engineering, 125, p.275.
Raftery, P., Keane, M. & Costa, A., 2009. Calibration of a detailed simulation model to energy monitoring system data: a methodology and case study. In Proceedings of the 11th IBPSA Conference, Glasgow, UK.
Reddy, T.A., 2006. Literature Review on Calibration of Building Energy Simulation Programs: Uses, Problems, Procedures, Uncertainty, and Tools. ASHRAE Transactions, 112(1), pp.226-240.
Reddy, T.A., Maor, I. & Panjapornpon, C., 2007. Calibrating Detailed Building Energy Simulation Programs with Measured Data-- Part I: General Methodology (RP-1051). HVAC&R Research, 13(2), pp.221-241.
Saltelli, A., 2004. Sensitivity analysis in practice : a guide to assessing scientific models, Hoboken NJ: Wiley.
Saltelli, A., Chan, K. & Scott, E., 2000. Sensitivity Analysis, Wiley, New York.
Sun, J. & Reddy, A., 2005. Optimal control of building HVAC&R systems using complete simulation-based sequential quadratic programming (CSB-SQP). Building and environment, 40(5), pp.657–669.
Troncoso, R., 1997. A hybrid monitoring-modeling procedure for analyzing the performance of large central chilling plants. In Proceedings of Building Simulation. pp. 421–428.
Tupper, K., Franconi, E. & Chan, C., 2011. Building Energy Modeling (BEM) Innovation Summit, Rocky Mountain Institute (RMI).
Waltz, J., 2000. Computerized building energy simulation handbook., Unknown: Fairmont Press.
Proceedings of Building Simulation 2011: 12th Conference of International Building Performance Simulation Association, Sydney, 14-16 November.
- 381 -
Copyright © 2022 FDOKUMEN