Calcium-mediated modulation of Pseudomonas mendocina NR802 biofilm influences the phenanthrene...
9
Colloids and Surfaces B: Biointerfaces 114 (2014) 301–309 Contents lists available at ScienceDirect Colloids and Surfaces B: Biointerfaces jou rn al hom epage: www.elsevier.com/locate/colsurfb Calcium-mediated modulation of Pseudomonas mendocina NR802 biofilm influences the phenanthrene degradation Neelam Mangwani a,1 , Sudhir K. Shukla b,1 , T. Subba Rao b , Surajit Das a,∗ a Laboratory of Environmental Microbiology & Ecology (LEnME), Department of Life Science, National Institute of Technology, Rourkela 769008, Odisha, India b Biofouling & Biofilm Processes Section, Water & Steam Chemistry Division, BARC Facilities, Kalpakkam 603102, Tamil Nadu, India a r t i c l e i n f o Article history: Received 5 February 2013 Received in revised form 1 October 2013 Accepted 2 October 2013 Available online 24 October 2013 Keywords: Biofilm Degradation Extracellular polymeric substances Phenanthrene Roughness coefficient a b s t r a c t A potential biofilm forming and phenanthrene utilizing marine bacterium Pseudomonas mendocina NR802 was isolated from Rushukulya, Odisha, East Coast of India. The effect of Ca 2+ and Mg 2+ on biofilm growth and phenanthrene degradation was evaluated. Among the various tested concentrations, 20 mM of Ca 2+ and Mg 2+ showed a significant enhancement in biofilm production by the bacterium. The SEM-EDAX study showed that the elemental composition of the biofilm varied significantly when grown in the presence of Ca 2+ and Mg 2+ . The CSLM analysis of biofilms grown in the presence of 20 mM Ca 2+ and Mg 2+ reveal the critical role of these ions on biofilm architectural parameters such as total biomass, biofilm thickness, roughness coefficient and surface to biovolume ratio. Ca 2+ was found to enhance the extracellular polymeric substances (EPS) production and phenanthrene degradation. Ca 2+ enhanced the biofilm growth in a dose dependent manner, whereas Mg 2+ significantly increased the cell growth in biofilm. More than 15% increase in phenanthrene degradation was observed when biofilm was grown in the presence of an additional 20 mM Ca 2+ . This study also supports the fundamental role of Ca 2+ in biofilm growth, architecture as well as biofilm-mediated pollutant degradation. © 2013 Elsevier B.V. All rights reserved. 1. Introduction Biofilms are multilayered, three dimensional sessile structures encapsulated in a hydrated extracellular polymeric substances (EPS) on a substratum [1]. Biofilm-EPS is a rich matrix of polysaccharides, proteins and nucleic acids [2,3]. Microorganisms modify their immediate milieu by producing EPS which influence physiochemical characteristics and modify surface activities. The structure of EPS is complex and its content in biofilm varies with environmental factors, nutrient availability and physiochemical conditions [4,5]. Among several ions, Ca 2+ and Mg 2+ bind to the majority of the EPS components in a biofilm matrix [6]. Ca 2+ is an imperative regulatory molecule in bacterial signaling [7]. In biofilm-coupled growth, Ca 2+ plays a crucial role in regulating the production of many extracellular enzymes [8]. Increasing Ca 2+ con- centration augment the cohesiveness of the biofilm as indicated by a lower detachment rate. In the marine environment, surfaces are often enriched with Ca 2+ due to sedimentary deposits or in associ- ation with other marine organisms [9]. Therefore, Ca 2+ may be one of the factors that marine bacteria sense during biofilm-associated ∗ Corresponding author. Tel.: +91 661 2462684; fax: +91 661 2462022. E-mail address: [email protected] (S. Das). 1 Equal contributors. growth [9,10]. Ca 2+ is also involved in specific and non-specific interactions between cells and the substrate. Ca 2+ binding pro- teins are often involved in bacterial adhesion and are important for cell–cell aggregation [11]. Ca 2+ acts as a sensory ion, modulating gene expression of biofilm-associated components with simulta- neous ionic cross-bridging molecule binding to matrix materials [9,12]. Mg 2+ also affects the growth of biofilm by cross-linking the cells and EPS matrix of biofilm [13]. Apart from electrostatic interaction between EPS, both Ca 2+ and Mg 2+ influence the biofilm structure as well as function [14]. Contamination of natural water bodies with organic chemi- cals and toxic pollutant has become an environmental issue [15]. Marine sediments and coastal waters are often contaminated with a variety of polycyclic aromatic hydrocarbons (PAHs). PAHs are haz- ardous to humans due to their toxicity and carcinogenic effects [16]. Phenanthrene is a PAH, listed as a primary pollutant by US Environ- mental Protection Agency (EPA) [17]. An area around petroleum refineries and oil transportation is often contaminated by phenan- threne, which is harmful to aquatic life. It is also produced during an incomplete burning of products like coal, oil, gas, and garbage [18]. Commercially, phenanthrene is used to make dyes, plastics, pesticides, explosives, drugs like bile acids and steroids. However, PAHs and other organic contaminants can be degraded depending on the environment and associated abiotic and biotic pro- cesses, such as volatilization, photo-oxidation, chemical oxidation, 0927-7765/$ – see front matter © 2013 Elsevier B.V. All rights reserved. http://dx.doi.org/10.1016/j.colsurfb.2013.10.003
Transcript of Calcium-mediated modulation of Pseudomonas mendocina NR802 biofilm influences the phenanthrene...

Cb
Na
Ib
a
ARRAA
KBDEPR
1
e(pmpsecmabpcaoao
0h
Colloids and Surfaces B: Biointerfaces 114 (2014) 301– 309
Contents lists available at ScienceDirect
Colloids and Surfaces B: Biointerfaces
jou rn al hom epage: www.elsev ier .com/ locate /co lsur fb
alcium-mediated modulation of Pseudomonas mendocina NR802iofilm influences the phenanthrene degradation
eelam Mangwania,1, Sudhir K. Shuklab,1, T. Subba Raob, Surajit Dasa,∗
Laboratory of Environmental Microbiology & Ecology (LEnME), Department of Life Science, National Institute of Technology, Rourkela 769008, Odisha,ndiaBiofouling & Biofilm Processes Section, Water & Steam Chemistry Division, BARC Facilities, Kalpakkam 603102, Tamil Nadu, India
r t i c l e i n f o
rticle history:eceived 5 February 2013eceived in revised form 1 October 2013ccepted 2 October 2013vailable online 24 October 2013
eywords:iofilm
a b s t r a c t
A potential biofilm forming and phenanthrene utilizing marine bacterium Pseudomonas mendocina NR802was isolated from Rushukulya, Odisha, East Coast of India. The effect of Ca2+ and Mg2+ on biofilm growthand phenanthrene degradation was evaluated. Among the various tested concentrations, 20 mM of Ca2+
and Mg2+ showed a significant enhancement in biofilm production by the bacterium. The SEM-EDAXstudy showed that the elemental composition of the biofilm varied significantly when grown in thepresence of Ca2+ and Mg2+. The CSLM analysis of biofilms grown in the presence of 20 mM Ca2+ andMg2+ reveal the critical role of these ions on biofilm architectural parameters such as total biomass,
2+
egradationxtracellular polymeric substanceshenanthreneoughness coefficientbiofilm thickness, roughness coefficient and surface to biovolume ratio. Ca was found to enhance theextracellular polymeric substances (EPS) production and phenanthrene degradation. Ca2+ enhanced thebiofilm growth in a dose dependent manner, whereas Mg2+ significantly increased the cell growth inbiofilm. More than 15% increase in phenanthrene degradation was observed when biofilm was grownin the presence of an additional 20 mM Ca2+. This study also supports the fundamental role of Ca2+ inbiofilm growth, architecture as well as biofilm-mediated pollutant degradation.
. Introduction
Biofilms are multilayered, three dimensional sessile structuresncapsulated in a hydrated extracellular polymeric substancesEPS) on a substratum [1]. Biofilm-EPS is a rich matrix ofolysaccharides, proteins and nucleic acids [2,3]. Microorganismsodify their immediate milieu by producing EPS which influence
hysiochemical characteristics and modify surface activities. Thetructure of EPS is complex and its content in biofilm varies withnvironmental factors, nutrient availability and physiochemicalonditions [4,5]. Among several ions, Ca2+ and Mg2+ bind to theajority of the EPS components in a biofilm matrix [6]. Ca2+ is
n imperative regulatory molecule in bacterial signaling [7]. Iniofilm-coupled growth, Ca2+ plays a crucial role in regulating theroduction of many extracellular enzymes [8]. Increasing Ca2+ con-entration augment the cohesiveness of the biofilm as indicated by
lower detachment rate. In the marine environment, surfaces are
ften enriched with Ca2+ due to sedimentary deposits or in associ-tion with other marine organisms [9]. Therefore, Ca2+ may be onef the factors that marine bacteria sense during biofilm-associated∗ Corresponding author. Tel.: +91 661 2462684; fax: +91 661 2462022.E-mail address: [email protected] (S. Das).
1 Equal contributors.
927-7765/$ – see front matter © 2013 Elsevier B.V. All rights reserved.ttp://dx.doi.org/10.1016/j.colsurfb.2013.10.003
© 2013 Elsevier B.V. All rights reserved.
growth [9,10]. Ca2+ is also involved in specific and non-specificinteractions between cells and the substrate. Ca2+ binding pro-teins are often involved in bacterial adhesion and are important forcell–cell aggregation [11]. Ca2+ acts as a sensory ion, modulatinggene expression of biofilm-associated components with simulta-neous ionic cross-bridging molecule binding to matrix materials[9,12]. Mg2+ also affects the growth of biofilm by cross-linkingthe cells and EPS matrix of biofilm [13]. Apart from electrostaticinteraction between EPS, both Ca2+ and Mg2+ influence the biofilmstructure as well as function [14].
Contamination of natural water bodies with organic chemi-cals and toxic pollutant has become an environmental issue [15].Marine sediments and coastal waters are often contaminated witha variety of polycyclic aromatic hydrocarbons (PAHs). PAHs are haz-ardous to humans due to their toxicity and carcinogenic effects [16].Phenanthrene is a PAH, listed as a primary pollutant by US Environ-mental Protection Agency (EPA) [17]. An area around petroleumrefineries and oil transportation is often contaminated by phenan-threne, which is harmful to aquatic life. It is also produced duringan incomplete burning of products like coal, oil, gas, and garbage[18]. Commercially, phenanthrene is used to make dyes, plastics,
pesticides, explosives, drugs like bile acids and steroids. However,PAHs and other organic contaminants can be degraded dependingon the environment and associated abiotic and biotic pro-cesses, such as volatilization, photo-oxidation, chemical oxidation,
3 aces B
bbPbeimobicrvcIattet
datEfotased
2
2c
psa1M11111wdeIBwgitmrwSM(w
02 N. Mangwani et al. / Colloids and Surf
ioaccumulation and microbial degradation. Microbial activity haseen recognized as one of the most influential and effective cause ofAHs removal from the environment [19,20]. Several studies haveeen conducted with microbial consortia and diverse bacterial gen-ra have been isolated from the polluted areas [15]. However, littlenformation is available on the microbial communities from the
arine environment and their role in the biodegradation of toxicrganic contaminants [21]. Furthermore, the ability of bacterialiofilms to degrade poly-aromatic compounds was not addressed
n detail, because of the preferential application of planktoniculture for bioremediation. Although, biofilm-forming bacteria rep-esent efficient and safer alternatives of planktonic bacteria, iniew of the stress resistance, high cell density and many asso-iated biomolecules which can enhance the biodegradation [22].n the marine environment, submerged surfaces are often associ-ted with biofilms and cause biofouling [23]. Moreover, most ofhe marine bacteria fall under viable, yet unculturable group, thushere is an immediate need to explore different marine habitat forxploring the microbial diversity for implication in bioremediationechnology [24].
The aim of the present study was to evaluate the possible role ofivalent ions (Ca2+ and Mg2+) on biofilm development, architecturend degradation of phenanthrene. A biofilm forming marine bac-erium Pseudomonas mendocina NR802 was isolated from Odisha,ast Coast of India. P. mendocina NR802 biofilm was investigatedor its potential towards degradation of phenanthrene and effectf Ca2+ and Mg2+ on biofilm growth. The current findings illustratehat the presence of Ca2+ enhances the cell aggregation and surfacettachment, which is attributed to increased production of EPS withimultaneous increase in phenanthrene degradation. The findingsstablish the crucial role of Ca2+ in biofilm growth and pollutantegradation in the marine environment.
. Materials and methods
.1. Isolation and identification of bacterial strain and cultureonditions
P. mendocina NR802 was isolated from marine water sam-le collected from Rushukulya, Odisha, East coast of India byelective enrichment with phenanthrene (environmental temper-ture 37.03 ◦C; salinity 8 psu) in May 2011. For initial screening,
ml of water sample was transferred to the 100 ml Basal Saltedium (BSM) (per liter—15 g NaCl, 0.8 g KH2PO4, 1.2 g K2HPO4,
.0 g NH4NO3, 0.2 gMgSO4·7H2O, 50 mg FeCl3, 20 mg CaCl2,
.0 mg MnSO4, 0.2 mg Na2MoO4, and pH 7.2) supplemented with00 mg/l of PAHs. It was incubated in dark at 37 ◦C, aeration,60 rpm for 15 days. For further enrichment of consortia, after5 days, 1 ml inoculum was transferred to BSM supplementedith 200 mg/l of phenanthrene. After 15 days, it was seriallyiluted and 100 �l aliquot was spread onto sea water nutri-nt agar plates supplemented with 50 mg/l of phenanthrene.solated colonies with distinct morphology were streaked onSM-agar plates of phenanthrene and incubated 37 ◦C. Growthas monitored for 3–10 days [25]. Isolates that were able to
row on phenanthrene were selected for further biofilm stud-es. The screening for biofilm formation was performed by glassube assay and biofilm growth was quantified after 48 h by
icrotiter plate assay following O’Toole and Kolter [26]. The luxu-iant biofilm forming and phenanthrene utilizing bacterial isolateas identified by partial 16S rRNA gene sequencing using 16
universal primer-16S-27F (5′ to 3′-AGAGTTTGATCMTGGCTCAG, = A or C) and 16S-1492R (5′ to 3′- ACGGCTACCTTGTTACGA)
Sigma Aldrich, Bangalore, India). The partial gene sequence dataere compiled and consensus sequence (1359 bp) was obtained
: Biointerfaces 114 (2014) 301– 309
by using BioEdit sequence alignment editor and examined forsequence homology with the archived 16S rDNA sequencesfrom GenBank at www.ncbi.nlm.nih.gov/nucleotide, employing theBLAST. For phylogenetic analyses, reference sequences requiredfor comparison were downloaded from the GenBank database(http://www.ncbi.nlm.nih.gov/Genbank). The aligned sequenceswere then checked for gaps manually, and saved as per molecularevolutionary genetics analysis (MEGA) format using MEGA 5 soft-ware [27]. Phylogenetic tree was constructed by neighbor joiningDNA distance method using MEGA 5. The resultant tree topologieswere evaluated by bootstrap analysis [28] of neighbor joining datasets based on 1000 re-samplings. The partial sequence of the 16SrRNA gene of the isolate was submitted to NCBI GenBank and theassigned accession number is JX273777.
The culture was maintained in Luria Bertani broth (LB) andall the experiments were performed in either LB or in a mini-mal medium-TRIS supplemented with 0.2% Glucose (TRIS-G), at37 ◦C under static conditions. Constituents of the 1 l TRIS mediumwas as follows; Tris (hydroxymethyl)aminomethane 6.057 g,Tris HCl 7.88 g, NaCl (4.675 g), KCl (1.4912 g), NH4Cl (1.0698 g),Na2SO4 (4.261 g), MgCl2·6H2O (2.033 g), CaCl2·2H2O (0.294 g),NaH2PO4·2H2O (40 mg), Ferrus ammonium-citrate (4.8 mg/l) and100 �l of trace elements stock solution (5 mM Zinc sulphateheptahydrate, 5 mM manganese chloride-tetrahydrate, 10 mMBoric acid, 1 mM Nickel chloride hexahydrate, 1.5 mM sodiummolybdate–dehydrate). Culture media were supplemented withfilter sterile CaCl2 and MgCl2 at various concentrations (i.e. 5 mM,10 mM and 20 mM) as per the experimental design.
2.2. Biofilm growth kinetics by Microtiter plate assay
Biofilm formation was assayed by microtiter plate assay mea-suring the bacterial adhered to microtiter wells. The biofilm growthpattern of the isolate was monitored for 48 h. The strain P. men-docina NR802 was grown in LB medium. Cells from mid log phasewere harvested and washed with phosphate buffer saline (PBS)twice. The cell pellet was resuspended in LB broth and finalabsorbance was adjusted to 0.5 at OD600. 10 �l of the cell sus-pension was transferred to the microtiter plate wells with 190 �lof LB medium. At regular time intervals (4 h, 12 h, 18 h 24 h, 40 hand 48 h), the plate was washed with phosphate buffer saline (PBS)twice, air dried and stained with 0.2% (w/v) crystal violet for 5 min.After 5 min, the plate was washed twice, air dried and the cell boundcrystal violet was dissolved with 95% ethanol. After 30 min, OD wasmeasured at 570 nm using 96 well plate reader (Multiskan, ThermoLabsystems, Beverly, MA, USA).
In order to study the effect of Ca2+ and Mg2+ on the biofilmgrowth, different concentrations of Ca2+ and Mg2+ i.e. 5 mM, 10 mMand 20 mM were prepared by adding filter sterilized CaCl2 andMgCl2 in TRIS-G medium. All the experiments were performed intriplicates.
2.3. Confocal scanning laser microscopy (CSLM) studies andimage analysis
Staining with the Syto9 and ConA-TRITC followed by CSLMstudies was performed to monitor the biofilm architecture of P.mendocina NR802 grown on glass slides under various growthmedia (i.e. LB media, TRIS-G and TRIS- with 20 mM of Ca2+ andMg2+). Cells from mid log phase were harvested by centrifugationat 6000 rpm at 4 ◦C for 10 min and washed twice with PBS. The cellpellet was resuspended in LB and OD was adjusted to 0.5 at 600 nm.
This cell suspension was diluted in 1:100 in respective media (i.e.LB media, TRIS-G and TRIS- with 20 mM of Ca2+ and Mg2+) and3 ml of the diluted suspension was transferred to six well cell cul-ture plates (Tarson, India). A sterile glass slide (2 cm × 2 cm) was
aces B
pis0tS1itb((6Awci(ttafro(c
2a
hw7pcS
2
L5latcaiwgcTbwMfdfpptstto
N. Mangwani et al. / Colloids and Surf
laced in each well in order to grow the biofilm. The plate wasncubated at 37 ◦C for 48 h under static condition. After 48 h thelides were removed gently, washed with PBS and then stained with.02% acridine orange for 5 min and washed again with PBS. Forhe analysis of live cells and EPS, biofilms were stained with 5 �Myto9 (in saline) which binds with nucleic acids in live cells and00 �g/ml of ConA-TRITC (concanavalin A-tetramethylrhodamine
sothiocyanate) in 0.1 M Sodium bicarbonate, pH 8.3 which bindso the EPS of biofilms [29]. A thin cover slip was placed over theiofilms and mounted upside down over the objective lens of CSLMTCS-SP2-AOBS) equipped with DM IRE 2 inverted microscopeLeica Microsystems, Hessen, Wetzlar, Germany). Water immersed3X objective lens with 1.2 NA was used to image the biofilms.ll the images were taken by scanning a frame of 512 × 512 pixelsith the laser beam in the x, y plane. About 10 image stacks were
ollected randomly from different points in order to get the signif-cant data. Each image stacks were collected with 1.33 pinhole sizearbitrary unit) and each optical slice were taken at 1 �m z-intervalo construct the 3D image of stacks. Biofilm parameters (averagehickness, maximum thickness, total biomass, average colony size,verage colony volume, average fractional dimension, average sur-ace area of biomass in each image stack, surface to biovolumeatio and roughness coefficient) were quantified by the analysisf image-stacks using COMSTAT [30]. Imaris (version 6.2) softwareBitsplane, Zurich, Switzerland) was used to differentiate the liveell biomass (green) and EPS (red) within the biofilm matrix.
.4. Scanning electron microscopy (SEM) and energy dispersivenalysis X-ray (SEM-EDAX)
The glass slides with biofilm were fixed with 2.5% glutaralde-yde (in PBS, pH 7.2) at 4 ◦C for 12 h, washed with PBS and post fixedith 1% aqueous solution of tannic acid and dehydrated with 30%,
0% and 100% alcohol. Subsequently, the slides were coated withlatinum and were analyzed using scanning electron microscopyoupled with energy dispersive X-ray spectroscopy (Jeol T-330canning Electron Microscope, Germany) [31].
.5. Biodegradation of phenanthrene
A single pure colony was picked up and grown overnight inB medium. 500 �l of mid-log phase culture were inoculated into
ml of TRIS medium with phenanthrene (100 mg/l). The inocu-ated tubes were kept in an orbital shaker incubator at 160 rpmt 37 ◦C for 7 days. After 7 days, 200 �l (OD600 = 0.2) of this cul-ure was transferred to screw capped glass tubes with glass beads,ontaining 2 ml of respective media (LB, TRIS, 20 mM Mg2+-TRISnd 20 mM-Ca2+ TRIS media, supplemented with 1% glucose). Afterncubation at 37 ◦C for 48 h without shaking, free planktonic cells
ere carefully removed from the tubes and biofilm grown on thelass beads was rinsed once with sterile PBS. 5 ml of TRIS mediumontaining phenanthrene (100 mg/l) was then added to each tube.he tubes were incubated at 37 ◦C for 7 days. After 7 days of incu-ation, the residual concentration of phenanthrene was extractedith an equal volume of n-hexane (Spectrophotometric grade,erck, India). After vortexing the culture mixture with n-hexane
or 2 min, it was centrifuged at 6000 rpm for 10 min to remove cellebris and to separate aqueous and organic phases [19]. Hexanerom the extract was allowed to evaporate and the residual com-ound was re-suspended in 5 ml of n-hexane. Concentration ofhenanthrene was determined in a UV/Vis spectrophotometer inerms of absorbance at 292 nm. The residual amount was read on a
tandard curve of phenanthrene (dissolve in n-hexane). The controlubes without any inoculum were similarly treated. All degrada-ion experiments were performed in triplicates and at each pointf time residual phenanthrene was extracted from entire tubes.: Biointerfaces 114 (2014) 301– 309 303
Initial phenanthrene degradation experiments were carried out inbiofilm grown in LB and degradation was monitored for 15 days.
2.6. Statistical analysis
All data are expressed as mean ± standard deviation (S.D) ofthe triplicate experimental data. A two-tailed Student’s t-test wasused to determine the differences in biofilm formation betweenthe groups. For the biofilm assay (n = 3), P value of <0.05 was takenas significant. Whereas, for the COMSTAT analysis data (n = 10), Pvalue of <0.005 was considered significant. One way ANOVA wasperformed to find the significance of differences in phenanthrenedegradation by bacterium in different medium compositions. Pvalue <0.05 was considered significant.
3. Results and discussion
3.1. Isolation and identification of the bacterial strain
After selective enrichment, 50 isolates with different colonymorphologies were first screened for utilization of phenanthreneas carbon source. Eight isolates which were able to grow on thephenanthrene agar plate were screened for biofilm by glass tubeassay and the biofilm growth (Supplementary Fig. 1A and B) wasquantified after 48 h by microtiter plate assay. The most efficientbiofilm producing strain was chosen for molecular identificationand further experiments. A phylogenetic tree was constructedby the neighbor joining method based on 16S rRNA partial genesequence. The selected isolate was identified as P. mendocina NR802(Supplementary Fig. 2).
3.2. Biofilm growth study of the isolate Pseudomonas mendocinaNR802
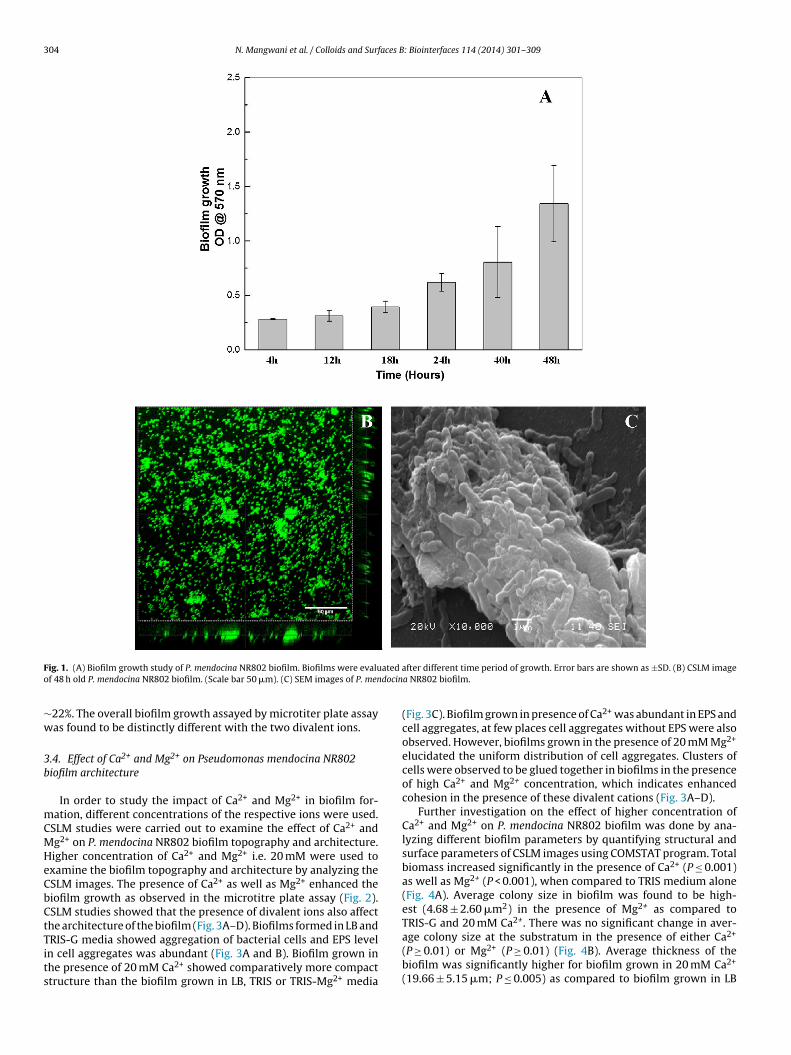
P. mendocina NR802 biofilm growth was monitored over theperiod of 48 h at different time intervals using the microtiter plateassay. The biofilm growth was measured in terms of the absorbanceof the dissolved crystal violet dye from microtiter plates. P. men-docina NR802 biofilm growth was found to increase with time upto 48 h (Fig. 1A). The biofilm growth was found to be maximumafter 48 h of growth. Since P. mendocina NR802 showed maximumbiofilm growth at 48 h, the same time was chosen for further exper-iments.
P. mendocina NR802 biofilm grown on glass cover slips for 48 hin LB media was observed under CSLM. Fig. 1B shows acridineorange stained 48 h old P. mendocina NR802 biofilm. Many develop-ing micro-colonies were seen in the biofilm which were randomlyscattered in space. Cell aggregates with distinct voids and a hetero-geneous mass of biofilm was observed. Analysis of SEM images alsorevealed the presence of cell aggregates, voids and dense biomassencrusted in EPS matrix (Fig. 1C).
3.3. Effect of Ca2+ and Mg2+ on Pseudomonas mendocina NR802biofilm development
Effect of Ca2+ and Mg2+ on P. mendocina NR802 biofilm devel-opment was investigated by microtitre plate assay using a minimalmedium and TRIS-G. Three concentrations of Ca2+ and Mg2+ viz.5 mM, 10 mM and 20 mM were chosen. Fig. 2 shows that biofilmformation of P. mendocina NR802 was increased significantly(P ≤ 0.001) with increase in Ca2+ concentration. Biofilm growthwas comparatively high in TRIS-G medium as compared to LB. The
increase was proportional to Ca2+ concentrations. There was nosignificant enhancement of the biofilm growth up to 10 mM Mg2+(Fig. 2). However, 20 mM Mg2+ triggered the biofilm growth sig-nificantly (P ≤ 0.05) with an enhancement of the biofilm growth by
304 N. Mangwani et al. / Colloids and Surfaces B: Biointerfaces 114 (2014) 301– 309
F ated
o docin
∼w
3b
mCMHeCbCtTits
ig. 1. (A) Biofilm growth study of P. mendocina NR802 biofilm. Biofilms were evaluf 48 h old P. mendocina NR802 biofilm. (Scale bar 50 �m). (C) SEM images of P. men
22%. The overall biofilm growth assayed by microtiter plate assayas found to be distinctly different with the two divalent ions.
.4. Effect of Ca2+ and Mg2+ on Pseudomonas mendocina NR802iofilm architecture
In order to study the impact of Ca2+ and Mg2+ in biofilm for-ation, different concentrations of the respective ions were used.
SLM studies were carried out to examine the effect of Ca2+ andg2+ on P. mendocina NR802 biofilm topography and architecture.igher concentration of Ca2+ and Mg2+ i.e. 20 mM were used toxamine the biofilm topography and architecture by analyzing theSLM images. The presence of Ca2+ as well as Mg2+ enhanced theiofilm growth as observed in the microtitre plate assay (Fig. 2).SLM studies showed that the presence of divalent ions also affecthe architecture of the biofilm (Fig. 3A–D). Biofilms formed in LB and
RIS-G media showed aggregation of bacterial cells and EPS leveln cell aggregates was abundant (Fig. 3A and B). Biofilm grown inhe presence of 20 mM Ca2+ showed comparatively more compacttructure than the biofilm grown in LB, TRIS or TRIS-Mg2+ mediaafter different time period of growth. Error bars are shown as ±SD. (B) CSLM imagea NR802 biofilm.
(Fig. 3C). Biofilm grown in presence of Ca2+ was abundant in EPS andcell aggregates, at few places cell aggregates without EPS were alsoobserved. However, biofilms grown in the presence of 20 mM Mg2+
elucidated the uniform distribution of cell aggregates. Clusters ofcells were observed to be glued together in biofilms in the presenceof high Ca2+ and Mg2+ concentration, which indicates enhancedcohesion in the presence of these divalent cations (Fig. 3A–D).
Further investigation on the effect of higher concentration ofCa2+ and Mg2+ on P. mendocina NR802 biofilm was done by ana-lyzing different biofilm parameters by quantifying structural andsurface parameters of CSLM images using COMSTAT program. Totalbiomass increased significantly in the presence of Ca2+ (P ≤ 0.001)as well as Mg2+ (P < 0.001), when compared to TRIS medium alone(Fig. 4A). Average colony size in biofilm was found to be high-est (4.68 ± 2.60 �m2) in the presence of Mg2+ as compared toTRIS-G and 20 mM Ca2+. There was no significant change in aver-
age colony size at the substratum in the presence of either Ca2+(P ≥ 0.01) or Mg2+ (P ≥ 0.01) (Fig. 4B). Average thickness of thebiofilm was significantly higher for biofilm grown in 20 mM Ca2+
(19.66 ± 5.15 �m; P ≤ 0.005) as compared to biofilm grown in LB
N. Mangwani et al. / Colloids and Surfaces B
0.0
0.5
1.0
1.5
2.0
2.5
*
*
Bio
film
gro
wth
O
D @
570
nm
Ca2+
Mg2+
LB TRIS-G 5 mM 10 mM 2 0 mM
*
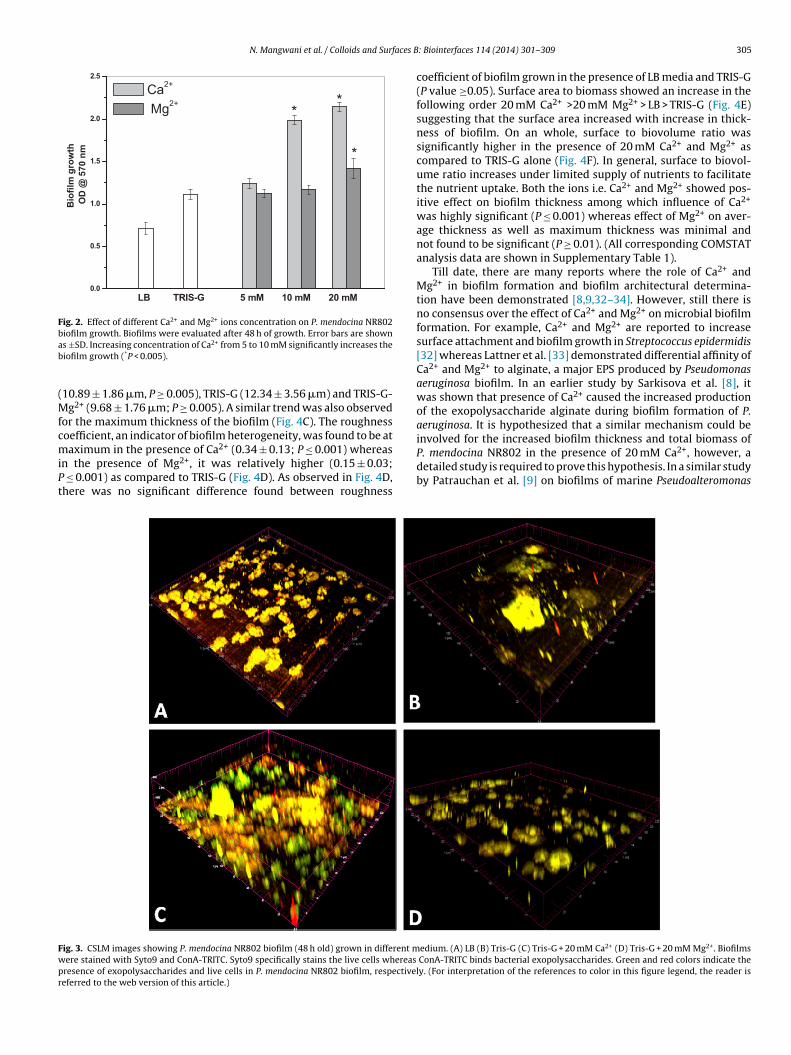
Fig. 2. Effect of different Ca2+ and Mg2+ ions concentration on P. mendocina NR802biofilm growth. Biofilms were evaluated after 48 h of growth. Error bars are shownab
(MfcmiPt
2+
Fwpr
s ±SD. Increasing concentration of Ca2+ from 5 to 10 mM significantly increases theiofilm growth (*P < 0.005).
10.89 ± 1.86 �m, P ≥ 0.005), TRIS-G (12.34 ± 3.56 �m) and TRIS-G-g2+ (9.68 ± 1.76 �m; P ≥ 0.005). A similar trend was also observed
or the maximum thickness of the biofilm (Fig. 4C). The roughnessoefficient, an indicator of biofilm heterogeneity, was found to be at
2+
aximum in the presence of Ca (0.34 ± 0.13; P ≤ 0.001) whereasn the presence of Mg2+, it was relatively higher (0.15 ± 0.03;≤ 0.001) as compared to TRIS-G (Fig. 4D). As observed in Fig. 4D,here was no significant difference found between roughness
ig. 3. CSLM images showing P. mendocina NR802 biofilm (48 h old) grown in different mere stained with Syto9 and ConA-TRITC. Syto9 specifically stains the live cells whereasresence of exopolysaccharides and live cells in P. mendocina NR802 biofilm, respectiveleferred to the web version of this article.)
: Biointerfaces 114 (2014) 301– 309 305
coefficient of biofilm grown in the presence of LB media and TRIS-G(P value ≥0.05). Surface area to biomass showed an increase in thefollowing order 20 mM Ca2+ >20 mM Mg2+ > LB > TRIS-G (Fig. 4E)suggesting that the surface area increased with increase in thick-ness of biofilm. On an whole, surface to biovolume ratio wassignificantly higher in the presence of 20 mM Ca2+ and Mg2+ ascompared to TRIS-G alone (Fig. 4F). In general, surface to biovol-ume ratio increases under limited supply of nutrients to facilitatethe nutrient uptake. Both the ions i.e. Ca2+ and Mg2+ showed pos-itive effect on biofilm thickness among which influence of Ca2+
was highly significant (P ≤ 0.001) whereas effect of Mg2+ on aver-age thickness as well as maximum thickness was minimal andnot found to be significant (P ≥ 0.01). (All corresponding COMSTATanalysis data are shown in Supplementary Table 1).
Till date, there are many reports where the role of Ca2+ andMg2+ in biofilm formation and biofilm architectural determina-tion have been demonstrated [8,9,32–34]. However, still there isno consensus over the effect of Ca2+ and Mg2+ on microbial biofilmformation. For example, Ca2+ and Mg2+ are reported to increasesurface attachment and biofilm growth in Streptococcus epidermidis[32] whereas Lattner et al. [33] demonstrated differential affinity ofCa2+ and Mg2+ to alginate, a major EPS produced by Pseudomonasaeruginosa biofilm. In an earlier study by Sarkisova et al. [8], itwas shown that presence of Ca2+ caused the increased productionof the exopolysaccharide alginate during biofilm formation of P.aeruginosa. It is hypothesized that a similar mechanism could beinvolved for the increased biofilm thickness and total biomass of
P. mendocina NR802 in the presence of 20 mM Ca , however, adetailed study is required to prove this hypothesis. In a similar studyby Patrauchan et al. [9] on biofilms of marine Pseudoalteromonasedium. (A) LB (B) Tris-G (C) Tris-G + 20 mM Ca2+ (D) Tris-G + 20 mM Mg2+ . Biofilms ConA-TRITC binds bacterial exopolysaccharides. Green and red colors indicate they. (For interpretation of the references to color in this figure legend, the reader is

306 N. Mangwani et al. / Colloids and Surfaces B: Biointerfaces 114 (2014) 301– 309
Fig. 4. Biofilm parameters of P. mendocina NR802 biofilm grown in presence of different medium (A) total biomass (B) average colony size (C) average and maximum biofilmt olumeT d live
b the p
sga
isgw
hickness (D) roughness coefficient (E) average surface area and (F) surface to biovRIS where no Ca2+ or Mg2+ was added (G) comparison of total biofilm biomass aniomass due to the presence of biofilm cells (Syto9 stained); Grey box: biomass due
p., it was found that Ca2+ acts as a global regulator in biofilmrowth and cause considerable changes in biofilm matrix, cellularnd extracellular protein composition.
In order to investigate the underlying reason behind the increase
n total biomass in the presence of both the divalent ions, CSLMtudy of the P. mendocina NR802 biofilm was performed using thereen fluorescent nucleic acid dye Syto9 and TRITC dye conjugatedith concanavalin A (ConA). Increase in thickness of biofilm mightratio. *P < 0.005 and **P < 0.001, n = 10 as compared with control biofilm grown incells embedded in biofilm matrix in the presence of different medium. White box:resence of exopolysaccharide (Con A stained).
also be due to the accumulation of dead cells [35]. Syto9 specif-ically stains the live cells whereas ConA (a lectin) binds to alphalinked mannose residues, a common component of oligosaccha-ride of many glycoproteins and bacterial exopolysaccharides [29].
ConA binding is indicative of the presence of glycoproteins.CSLM images (Fig. 3A–D) and COMSTAT analysis (Fig. 4G)showed that there was a significant increase in the live cell fractionand surface attachment in the presence of 20 mM of Ca2+ and Mg2+,

aces B: Biointerfaces 114 (2014) 301– 309 307
stftewribiatgowp
3b
TiwtowGgaymiweobs
gialaawCitnuaCeM“5tpbs
3
t
3d 5d 7d 10 d 15 d
10
20
30
40
50
60
70
80
90
100
Res
idua
l Phe
nant
hren
e (%
)
Number of da ys
A
LB TRIS TRIS+Mg TRIS+Ca0
5
10
15
20
25
30
35
40Residual phenanthren e EPS/Cells ratio
Res
idua
l Phe
nant
hren
e (m
g/L) B
-1
0
1
2
3
4
5
6
EPS/Cells R
atio
Fig. 5. Residual phenanthrene concentration in media (A) phenanthrene degrada-tion by P. mendocina NR802 biofilm grown in medium. Degradation was monitoredfor 15 days. The residual phenanthrene was extracted using n-hexane. (B) Effectof Ca2+ and Mg2+ on phenanthrene degradation by P. mendocina NR802 in 7 days.Biofilm was grown in different media i.e. LB media, TRIS-G and TRIS- with 20 mMof Mg2+ and Ca2+. After 48 h of biofilm growth in respective media, planktonic cells
N. Mangwani et al. / Colloids and Surf
uggesting that the accumulation of dead cells was not a reason forhe increase in biofilm thickness. However, in both the cases the dif-erent trend was observed for Syto9 and ConA. Fig. 4G shows thatotal biomass due to fraction of live cells was highest in the pres-nce of 20 mM Mg2+. Mg2+ has many growth regulatory functions,hich potentially influence the bacterial adhesion and growth indi-
ectly by affecting physiology. Styo9 stained biomass was reducedn presence of 20 mM Ca2+ with simultaneous increase in ConAiomass was observe. The higher ConA/Syto9 ratio (1.40 ± 0.90)
ndicates enhanced EPS production in the presence of Ca2+ (Fig. 3Cnd 4G). On the contrary, this ratio was significantly decreased inhe presence of Mg2+ (0.91 ± 1.38), which denotes enhanced cellrowth rather than EPS secretion as was observed in the presencef Ca2+. Hence, CSLM study manifest that different mechanismsere responsible for the enhancement in biofilm production in theresence of two divalent ions (i.e. Ca2+ and Mg2+).
.5. SEM-EDAX analysis of Pseudomonas mendocina NR802iofilm
The EDAX microanalysis of P. mendocina NR802 biofilm grown inRIS-G, 20 mM Ca2+ and 20 mM Mg2+ showed a significant increasen the levels of Ca2+ and Mg2+. Elemental composition (percentage
eight) of Ca2+ and Mg2+ was found to be 7.34% and 4.72%, respec-ively, when P. mendocina NR802 biofilm grown in the presencef 20 mM Ca2+, (Supplementary Table 2). The notable percentageeight of Mg2+ (1.85%) was present in biofilm when grown in TRIS-
alone, whereas Ca2+ was below detection limit. However, biofilmrown in the presence of 20 mM Mg2+ percentage weight of Mg2+
nd Ca2+ was found to be 1.75% and 1.93%, respectively. EDAX anal-sis results show that increase in the concentration of Ca2+ in theedium, increased the percentage weight of both Ca2+ and Mg2+
n the biofilm, but higher Mg2+ did not influence the percentageeight, suggesting that Mg2+ was not involved in biosorption. How-
ver, higher Ca2+ can simultaneously increase the biosorption ofther ions. Therefore, analysis of biofilm by EDAX illustrates thatoth Ca2+ and Mg2+ influence the biofilm elemental compositionignificantly.
COMSTAT analysis of CSLM images and EDAX analysis sug-est that both Ca2+ and Mg2+ influence the biofilm architecturen a dynamic way. Total biomass of the biofilm was positivelyffected by Ca2+ (P ≤ 0.001) and Mg2+ (P ≤ 0.001), however, under-ying the mechanism seems to be different. Physiological responsend biofilm heterogeneity were different in both the cases. Aver-ge thickness, roughness coefficient and surface to biovolume ratioas considerably higher for biofilm grown in the presence of 20 mMa2+ suggesting that the ions can critically influence heterogene-
ty of the biofilm. The surface to volume ratio increases in ordero optimize access to the limited supply of nutrients. There was aoteworthy difference in Ca2+ concentration in the biofilm formednder different growth media. The EDAX micro analysis showedn increased percentage of Ca2+ in the biofilm grown at 20 mMa2+. Mg2+ involves in physiology of cell for example many keynzymes require Mg2+ for their catalytic activity hence enhancedg2+ might trigger the higher metabolism which reflected in higher
cells to EPS ratio” as observed from the CSLM study (Fig. 4G andB). Both Ca2+ and Mg2+ ions cause increase in biofilm growth byheir affinity towards biofilm associated EPS. However, it might beossible that electrostatic interactions between divalent ions andiofilm constituents are not the sole major determinants of biofilmtructure.
.6. Degradation studies with phenanthrene
Phenanthrene biodegradation was determined by quantifyinghe amount of phenanthrene remaining in the culture medium
were removed and TRIS media with 100 mg/l of phenanthrene was added. EPS to livecells ratios are shown to indicate the correlation between phenanthrene degradationand EPS/cells ratio in biofilm grown in respective media.
at different time interval and monitored for 15 days (Fig. 5A).The initial rate of degradation by biofilm was marginal, how-ever, after 72 h of biofilm growth in TRIS supplemented with100 mg/l of phenanthrene the degradation rate was higher. Thestrain was able to degrade up to 87 ± 1.34% of phenanthrene in15 days. Initial delay in degradation by biofilms may be due tothe lag phase, diffusion of phenanthrene through the extracel-lular matrix of the biofilms. To evaluate the effect of Mg2+ andCa2+ on phenanthrene degradation the biofilm was grown in LB,TRIS, 20 mM Mg2+ TRIS and 20 mM Ca2+ TRIS. The degradationwas monitored for 7 days and the residual phenanthrene wasextracted using n-hexane. Fig. 5B shows the residual phenan-threne and EPS to cells ratio in the respective media. With 100 mg/lphenanthrene concentration at zero time the residual phenan-threne after 7 days of incubation was found to be 27.25 ± 0.04 mg/l,
24.86 ± 5.99 mg/l, 32.66 ± 2.64 mg/l and 17.07 ± 4.37 mg/l for LB,TRIS, 20 mM Mg2+ and 20 mM Ca2+, respectively (Fig. 5B), withthe corresponding degradation of phenanthrene at 72.4 ± 0.04%,75.13 ± 5.99%, 67.33 ± 2.64% and 82.9 ± 4.37%. One-way ANOVA
3 aces B
adirscah
ipdotf[tlbcwoTEibmoap1CCsdf[pdPTrcipm
4
mIoiHcnlpmotsbT
[[[[[
[
[[[
[
[[[[[
[
[
08 N. Mangwani et al. / Colloids and Surf
nalysis showed that differences between the mean values degra-ation of phenanthrene were significant (P < 0.05). Fig. 5B also
ndicates that there was a negative correlation between EPS to cellsatio and phenanthrene degradation. Biofilm grown in TRIS-Mg2+
howed lower EPS/cells ratio and less phenanthrene degradation, inontrast biofilm grown in TRIS-Ca2+ showed higher EPS/cells rationd more phenanthrene degradation. In other words, biofilm withigher EPS content showed more degradation.
Several marine bacteria Novosphingobium, Neptunomonas, Sph-ngomonas and Pseudomonas have been studied for degradation ofhenanthrene [36–38]. The bottleneck of the phenanthrene degra-ation study was the poor growth rate due to limited availabilityf the PAH substrates in the aqueous phase. In order to improvehe availability of phenanthrene for enhanced degradation, dif-erent types of ionic and non-ionic surfactants have been used37,39]. The results from current study showed that biofilms havehe potential for the bioremediation of hydrophobic organic pol-utants such as PAHs. The major problem associated with PAHsioremediation is their hydrophobicity and low availability to theell. However, biofilms can efficiently increase the availability asell as biodegradability of such compounds. Reports are available
n the binding of biofilm EPS to PAHs and heavy metals [40,41].he acidic sugar may increase the availability of PAHs to the cell.PS having large number of acidic sugar moieties show strong bind-ng affinities to the hydrophobic compounds [42]. Biofilm mediatedioremediation can be efficiently employed for the removal ofany toxic hydrophobic pollutants. In the present study, biofilm
f P. mendocina NR802 grown in the presence of 20 mM Ca2+ wasble to degrade 82.9 ± 4.37% of phenanthrene in 7 days as com-ared to biofilm grown in LB (72 ± 0.04%). There was approximately5% enhancement in phenanthrene biodegradation with highera2+ concentration. This study shows that the presence of 20 mMa2+ resulted in enhanced EPS production per cell, which in turnhowed enhancement in biofilm-mediated phenanthrene degra-ation by P. mendocina NR802. This may also be attributed to theact that seawater contains significant amount of Ca2+ and Mg2+
43], which possibly render the marine bacteria for enhanced EPSroduction. Our findings corroborate with the studies by Srinan-an et al. [44] where they studied differential effects of nutrients onaracoccus sp. biofilm and biofilm-mediated denitrification activity.hey isolated Paracoccus sp. from a denitrifying reactor sludge. Theyeported considerable increase in denitrification activity for Para-occus sp. biofilm when grown in presence of Ca2+ and Mg2+. Hence,t can be inferred that biofilm may influence the fate of other com-ounds (e.g. PAHs) in their vicinity depending on its own dynamicetabolic machinery and chemical composition.
. Conclusion
In the present study, PAHs degrading and biofilm formingarine bacterium P. mendocina NR802 was isolated and identified.
ts biofilm forming ability was monitored at various concentrationsf Ca2+ and Mg2+. In the presence of 20 mM Ca2+, ∼2-fold increasen the total biofilm mass of P. mendocina NR802 was observed.owever, Mg2+ did not influence the biofilm growth up to 10 mMoncentration but at 20 mM concentration significant increase wasoticed. CSLM images show that biofilm grown at 20 mM Ca2+ show
arge fraction of glycoproteins as well as exopolysaccharides. Theresence of Ca2+ enhanced the cell aggregation and surface attach-ent of the cells to the substratum. The presence of a large fraction
f EPS may be attributed to increased cell attachment with simul-
aneous increase in secretion of exopolysaccharides. There was aignificant difference in the architecture and average thickness ofiofilm formed by P. mendocina NR802 when grown in LB, TRIS,RIS-20 mM Ca2+ and TRIS-20 mM Mg2+. Ca2+ and Mg2+ may be[
[[
: Biointerfaces 114 (2014) 301– 309
responsible for the formation of a protruding subpopulation ofcells at different frequencies contributing to the variation in biofilmarchitecture. When, the biofilm was grown in the presence of Ca2+,notable increase in phenanthrene degradation was observed. Theresults of this study show the crucial role of Ca2+ in biofilm devel-opment and subsequent biodegradation of organic pollutants.
Contribution of authors
N.M., S.K.S., T.S.R and S.D. designed the experiments. N.M. car-ried out the isolation, characterization, SEM-EDAX and degradationexperiments. S.K.S. and N.M. processed and analysed the CSLM data.N.M., S.K.S., T.S.R. and S.D. contributed towards interpretation ofresults and manuscript writing.
Acknowledgment
The authors would like to acknowledge the authorities of NIT,Rourkela and BARC facilities of IGCAR, Kalpakkam for providingfacilities. N.M. gratefully acknowledges the receipt of fellowshipfrom Ministry of Human Resource Development, Government ofIndia for doctoral research. S.D. thanks the Department of Biotech-nology, Government of India for research grants on biofilm basedenhanced bioremediation.
Appendix A. Supplementary data
Supplementary data associated with this article can befound, in the online version, at http://dx.doi.org/10.1016/j.colsurfb.2013.10.003.
References
[1] J.H. Priester, A.M. Horst, L.C. Van De Werfhorst, J.L. Saleta, L.A.K. Mertes, P.A.Holden, J. Microbiol. Methods 68 (2007) 577.
[2] K. Jain, S. Parida, N. Mangwani, H.R. Dash, S. Das, Ann. Microbiol. (2013),http://dx.doi.org/10.1007/s13213-013-0618-9, in press.
[3] H.L. Stoodley, P. Stoodley, Curr. Opin. Biotech. 13 (2002) 228.[4] S. Moller, D.R. Korber, G.M. Wolfaardt, S. Molin, D.E. Caldwell, Appl. Environ.
Microbiol. 63 (1997) 2432.[5] S. Malamis, A. Andreadakis, Bioresour. Technol. 100 (2009) 3350.[6] A.W. Decho, Ecol. Eng. 36 (2010) 137.[7] D.C. Dominguez, Mol. Microbiol. 54 (2004) 291.[8] S. Sarkisova, M. Patrauchan, D. Berglund, D. Nivens, M. Franklin, J. Bacteriol. 187
(2005) 4327.[9] M.A. Patrauchan, S. Sarkisova, K. Sauer, M.J. Franklin, Microbiol. 151 (2005)
2885.10] G.G. Geesey, B. Wigglesworth-Cooksey, K.E. Cooksey, Biofouling 15 (2000) 195.11] M. Espinosa-Urgel, A. Salido, J.L. Ramos, J. Bacteriol. 182 (2000) 2363.12] I.B. Holland, H.E. Jones, A.K. Campbell, A. Jacq, Biochimie 81 (1999) 901.13] B. Song, L.G. Leff, Microbiol. Res. 161 (2006) 355.14] N. Kucerka, E. Papp-Szabo, M.P. Nieh, T.A. Harroun, S.R. Schooling, J. Pencer, E.A.
Nicholson, T.J. Beveridge, J. Katsaras, J. Phys. Chem. B 112 (2008) 8057.15] L. Daane, I. Harjono, G. Zylstra, M. Häggblom, Appl. Environ. Microbiol. 67 (2001)
2683.16] C.A. Menzie, B.B. Potocki, J. Santodonato, Environ. Sci. Technol. 26 (1992) 1278.17] M.A. Heithcamp, C.E. Cerniglia, Appl. Environ. Microbiol. 54 (1988) 1612.18] X.Q. Tao, G.N. Lu, J.P. Liu, T. Li, L.N. Yang, Int. J. Environ. Res. Public Health 6
(2009) 2470.19] O.S. Obayori, M.O. Ilori, S.A. Adebusoye, G.O. Oyetibo, O.O. Amund, World J.
Microbiol. Biotechnol. 24 (2008) 2639.20] A. Janbandhu, M. Fulekar, J. Hazard. Mater. 187 (2011) 333.21] T.J. McGenity, B.D. Folwell, B.A. McKew, Aquat. Biosyst. 8 (2012) 10.22] R. Singh, D. Paul, R.K. Jain, Trends Microbiol. 14 (2006) 389.23] S. Dobretsov, M. Teplitski, V. Paul, Biofouling 25 (2009) 413.24] H.R. Dash, N. Mangwani, J. Chakraborty, S. Kumari, S. Das, Appl. Microbiol.
Biotechnol. 97 (2013) 561.25] H.P. Zhao, Q.S. Wu, L. Wang, X.T. Zhao, H.W. Gao, J. Hazard. Mater. 164 (2009)
863.26] G.A. O’Toole, R. Kolter, Mol. Microbiol. 28 (1998) 449.
27] K. Tamura, D. Peterson, N. Peterson, G. Stecher, M. Nei, S. Kumar, Mol. Biol. Evol.28 (2011) 2731.28] J. Felsenstein, Evolution (1985) 783.29] M.M. Baum, A. Kainovic, T. O’Keeffe, R. Pandita, K. McDonald, S. Wu, P. Webster,
BMC Microbial. 9 (2009) 103.

aces B
[
[
[[[[[[
[
[
[
N. Mangwani et al. / Colloids and Surf
30] A. Heydorn, A.T. Nielsen, M. Hentzer, C. Sternberg, M. Givskov, B.K. Ersbøll, S.Molin, Microbiology 146 (2000) 2395.
31] G. Guibaud, D. Bhatia, P. d’Abzac, I. Bourven, F. Bordas, E.D. van Hullebusch, P.Lens, J. Taiwan Inst. Chem. Eng. 43 (2012) 444.
32] W.M. Dunne, E.M. Burd, Immunology 36 (1992) 1019.
33] D. Lattner, H.C. Flemming, C. Mayer, Int. J. Biol. Macromol. 33 (2003) 81.34] S.K. Shukla, T.S. Rao, Colloids Surf., B 103 (2013) 448.35] Y. Tanji, Y. Morono, A. Soejima, K. Hori, H. Unno, J. Biosci. Bioeng. 88 (1999) 551.36] A. Haritash, C. Kaushik, J. Hazard. Mater. 169 (2009) 1.37] J.L. Li, B.H. Chen, J. Hazard. Mater. 162 (2009) 66.[[[
[
: Biointerfaces 114 (2014) 301– 309 309
38] A. Pedetta, K. Pouyte, M.K. Herrera Seitz, P.A. Babay, M. Espinosa, M. Costagliola,C.A. Studdert, S.R. Peressutti, Int. Biodeter. Biodegr. 84 (2012) 161.
39] P. Cuny, J. Faucet, M. Acquaviva, J.C. Bertrand, M. Gilewicz, Lett. Appl. Microbiol.29 (1999) 242.
40] A. Pal, A. Paul, Ind. J. Microbiol. 48 (2008) 49.
41] C. Jia, P. Li, X. Li, P. Tai, W. Liu, Z. Gong, Process Biochem. 46 (2011) 1627.42] X. Pan, J. Liu, D. Zhang, Colloids Surf., B 80 (2010) 103.43] T.S. Rao, A.J. Kora, P. Chandramohan, B.S. Panigrahi, S.V. Narasimhan, Biofouling25 (2009) 581.44] C.S. Srinandan, V. Jadav, D. Cecilia, A.S. Nerurkar, Biofouling 26 (2010) 449.