Generic Overlapping Cracks in Polymers: Modeling of Interaction
Upload
independentCategory
view
0download
0
2005;65:2097-2107. Cancer Res Krisiti Rothermund, Kenneth Rogulski, Elaine Fernandes, et al. Two C-Myc Target Genes with Overlapping Functions
Independent Restoration of Multiple Phenotypes by−C-Myc
Updated version
http://cancerres.aacrjournals.org/content/65/6/2097
Access the most recent version of this article at:
Material
Supplementary
http://cancerres.aacrjournals.org/content/suppl/2005/04/01/65.6.2097.DC1.html
Access the most recent supplemental material at:
Cited Articles
http://cancerres.aacrjournals.org/content/65/6/2097.full.html#ref-list-1
This article cites by 59 articles, 35 of which you can access for free at:
Citing articles
http://cancerres.aacrjournals.org/content/65/6/2097.full.html#related-urls
This article has been cited by 10 HighWire-hosted articles. Access the articles at:
E-mail alerts related to this article or journal.Sign up to receive free email-alerts
Subscriptions
Reprints and
To order reprints of this article or to subscribe to the journal, contact the AACR Publications
Permissions
To request permission to re-use all or part of this article, contact the AACR Publications
Research. on October 3, 2014. © 2005 American Association for Cancercancerres.aacrjournals.org Downloaded from
Research. on October 3, 2014. © 2005 American Association for Cancercancerres.aacrjournals.org Downloaded from

C-Myc–Independent Restoration of Multiple Phenotypes by Two
C-Myc Target Genes with Overlapping Functions
Krisiti Rothermund,1Kenneth Rogulski,
1Elaine Fernandes,
1Amy Whiting,
4John Sedivy,
4
Lixia Pu,1and Edward V. Prochownik
1,2,3
1Section of Hematology/Oncology, Children’s Hospital of Pittsburgh; 2University of Pittsburgh Cancer Institute; 3Department of MolecularGenetics and Biochemistry, University of Pittsburgh Medical Center, Pittsburgh, Pennsylvania; and 4Department of Molecular Biology,Brown University, Providence, Rhode Island
Abstract
C-MYC , a transforming oncogene that is frequently overex-pressed in many human cancers, regulates a variety ofnormal functions including cell cycle progression, apoptosis,and maintenance of cell size, morphology, and genomicintegrity. Many target genes are modulated by c-Myc, andsome can recapitulate a limited number of the abovefunctions. Because most of these have been assessed in cellswhich also express endogenous c-Myc, however, it is not clearto what extent its proper regulation is also required. Weshow here that, in c-Myc nullizygous cells, two direct targetgenes, MT-MC1 and HMG-I , could each recapitulate multiplec-Myc phenotypes. Although these differ somewhat for thetwo genes, substantial overlap and cooperativity exist. Theenforced expression of these two genes was also associatedwith the differential deregulation of some previouslydescribed c-Myc target genes, indicating the presence of acomplex molecular circuitry. These observations argue that,despite the great diversity of gene regulation by c-Myc, many,although not all, of its functions can be phenocopied by asmall subset of key downstream target genes. The approachdescribed here should permit the identification of othertarget genes capable of further c-Myc–independent comple-mentation. (Cancer Res 2005; 65(6): 2097-107)
Introduction
Members of the Myc oncoprotein family are frequently overex-pressed in human cancers (1). All of these, including c-Myc, themost commonly involved member, are basic helix-loop-helix leucinezipper transcription factors, which regulate the transcription ofnumerous genes involved in various functions relevant totransformation (2, 3). Furthermore, the control of these genes byc-Myc can be either positive or negative (4–12). The importance ofc-Myc as a general transcription factor is underscored by recentstudies suggesting that as much as 10% to 15% of the expressedgenome may be at least partially c-Myc-responsive (9, 13). c-Mycoverexpressing cells often display morphologic abnormalities, cellsize differences, aberrant cell cycle control, loss of growth factorresponsiveness, inability to differentiate, enhanced sensitivity toproapoptotic stimuli, and genomic instability (14–27).
Although the complete catalog of c-Myc target genes has notbeen studied in detail, some genes, when individually overex-pressed, can recapitulate a limited number of the c-Mycphenotypes described above (23, 28–38). The restricted functionsof these target gene products, however, has supported the idea thatmultiple, functionally redundant genes, acting in concert, arenecessary to impart the complex c-Myc phenotype. A majorchallenge is to determine which of these genes comprise theminimal functional subset and whether it is unique or inter-changeable with other such subsets. Another challenge is todetermine whether the restricted c-Myc-like properties impartedby individual targets require assistance in the form of concurrentexpression of endogenous c-Myc and/or of its other downstreamtargets.The direct c-Myc target gene, MT-MC1 , encodes a nuclear
protein with homology to certain DNA helicases (38). Unlike thelimited functions of other c-Myc target genes described above,overexpression of MT-MC1 leads to morphologic alterations,enhanced apoptosis, promotion of cell cycle progression, inhibitionof differentiation, induction of genomic instability, transformation,and the regulation of some c-Myc target genes. Thus, MT-MC1 isunique among c-Myc targets by virtue of its ability to recapitulatea global c-Myc phenotype.Another direct c-Myc target gene, HMG-I/Y, encodes two isoforms
of the high-mobility group of chromatin modifying nuclear proteins(39–41). These proteins, HMG-I and HMG-Y, arise as a result ofalternate mRNA splicing, differ by an 11 amino acid insertion in theformer, and seem to possess identical functions (39). In addition totheir role in chromatinmaintenance, HMG-I/Yproteins also interactwith and modify the activities of a number of transcription factorsand may participate in DNA repair activities (reviewed in ref. 42).HMG-I/Y levels correlate with proliferation and their overexpressionis associated with some experimental and naturally occurring tumortypes, a number of which also overexpress c-Myc (43–48). Consistentwith this association, HMG-I overexpression can lead to trans-formation both in vitro and in vivo (33, 49). Overall, however, HMG-I’sc-Myc-like properties seem somewhat more restricted than thoseof MT-MC1.The above functions of MT-MC1 and HMG-I suggest that they
play important and perhaps central roles in orchestrating thecomplex c-Myc phenotype. However, because all of the cell types inwhich these proteins have been studied also express endogenousc-Myc, it remains unclear whether their effects are totallyindependent of c-Myc or require its concurrent expression andthus the proper regulation of additional downstream targets. Thefunctional relatedness of MT-MC1 and HMG-I also remainsundefined.Knockout (KO) cells are a line of rat fibroblasts, which as a
consequence of gene targeting, express neither endogenous c-Myc
Note: Supplementary data for this article are available at Cancer Research Online(http://cancerres.aacrjournals.org/).
Requests for reprints: Edward V. Prochownik, Section of Hematology/Oncology,Children’s Hospital of Pittsburgh, Rangos Research Center, Room 2100, 3460 FifthAvenue, Pittsburgh, PA 15213. Phone: 412-692-6797; Fax: 412-692-5228; E-mail:[email protected].
#2005 American Association for Cancer Research.
www.aacrjournals.org 2097 Cancer Res 2005; 65: (6). March 15, 2005
Research Article
Research. on October 3, 2014. © 2005 American Association for Cancercancerres.aacrjournals.org Downloaded from

nor other c-Myc family members (50, 51). Unlike other cells, inwhich inactivation of c-Myc results in the abrupt cessation of cellcycle progression and growth arrest (52), KO cells proliferate, albeitat a markedly reduced rate compared with the parental cell linefrom which they are derived (50). KO cells have thus been ofconsiderable use in assessing both the functional consequences ofc-Myc loss and in determining whether and to what extent othergenes can substitute for c-Myc (29, 31, 35, 51, 53).Because MT-MC1 and HMG-I can mimic some of the above-
described c-Myc phenotypes, we have now asked whether they canalso do so in KO cells and whether their effects are unique,complementary, or additive. As presented below, our results showthat many, although not all, of the phenotypes imparted by MT-MC1 and HMG-I are indeed mimicked in KO cells and aretherefore c-Myc–independent. Furthermore, whereas some of thephenotypes imparted by each gene are distinct, they also displayfunctional redundancy and cooperation. Thus, despite thecomplexity of both the c-Myc genotype and phenotype, significantc-Myc–independent recapitulation of the latter can be achievedwith only two of its downstream targets.
Materials and Methods
Cell Lines. The rat fibroblast cell lines TGR1 and its ‘‘knockout’’derivative (HO16.4c, or ‘‘KO’’ cells) have been previously described (50). The
latter were derived by homologous recombination with a c-Myc targeting
vector, and express neither endogenous c-Myc nor other c-Myc family
members such as N-Myc and L-Myc. Propagation and transfection of theamphotropic Phoenix-A retroviral packaging cell line have been previously
described (51). All cell lines were routinely maintained in standard growth
medium consisting of DMEM supplemented with 10% FCS, glutamine, andpenicillin plus streptomycin as described (all from Life Technologies, Grand
Island, NY; refs. 38, 51). KO cells were also periodically cultured in the
presence of 250 Ag/mL G-418 (Life Technologies). Growth curves were done
in 12-well tissue culture plates. Each cell line was plated in standard growthmedium at 8 � 103 cells per well. At various times thereafter, triplicate
wells were trypsinized and the average number of viable cells per well was
determined by trypan blue exclusion using a hemacytometer. Soft agar
colony assays were done as previously described (38), with all coloniesbeing enumerated after 10 to 12 days and plating at 4 � 103 cells/60 mm
dish. When measuring colony formation by slowly growing cells, cultures
were fed weekly and evaluated after 4 weeks.Retroviral Constructs, Packaging, and Infection. Full-length murine
MT-MC1 was amplified from the pSVLneoMT-MT-MC1 vector (38) by
PCR using primers containing engineered Xho I restriction sites.
Following digestion with XhoI, the product was isolated from a 2%agarose gel and ligated into the unique XhoI site of the bicistronic
pBabe-MN-IRES-GFP vector (51), which had been previously modified by
inserting a c-Myc epitope tag containing an optimized Kozak consensus
site. The resultant vector thus contained the MT-MC1 coding regionfused in-frame at its 5V-end with the c-Myc epitope tag. The correct
orientation and reading frame of the insert was confirmed by DNA
sequencing. The construct, or the starting parental vector, was then
transiently expressed in Phoenix-A packaging cells following transfectionwith LipofectAMINE (Life Technologies).
The human HMG-I coding region was also amplified by PCR using
primers containing XhoI sites. After isolation and XhoI digestion, the cDNAfragment was cloned into a modified form of the above-described retroviral
vector in which the enhanced green fluorescent protein (GFP) coding
sequence had been replaced with that of dsRed (BD Biosciences/Clontech,
Inc., Palo Alto, CA) and in which the c-Myc epitope tag had been fused tothe 3V-end of the HMG-I cDNA. Phoenix-A transfection efficiencies with
both retroviral vectors, as well as their starting parental vectors, routinely
exceeded 50% and were monitored by observing GFP-positive or dsRed-
positive cells at 48 hours. Viral supernatants were harvested between 48 and
72 hours, filtered, and used to infect KO cells in the presence of 8 Ag/mLPolybrene (Sigma, St Louis, MO) for 24 hours. KO transduction efficiencies
were generally 20% to 40% based on GFP or dsRed positivity of the
recipient cells 72 hours post-infection. Cells were then sorted and analyzed
with a Becton Dickinson FACSVantage SE flow cytometer equipped withthe FACSDiVa Option and CellQuest software. The cytometer was equipped
with an INNOVA Enterprise Laser (Coherent, Inc., Santa Clara, CA). Cells
were excited at a wavelength of 488 nm. GFP signals were collected on the
FL1 (FITC) detector with a 530/30 bandpass filter and dsRed signals werecollected on the FL2 (PE) detector with a 585/42 filter. Sorting gates were
first drawn around FSC and SSC populations to eliminate obvious
nonviable cells and debris. A subsequent gate was set on FL1- or FL2-
positive cells. A post-sort analysis was done to determine the purity ofsorted cells, which, in all cases, exceeded 95%. This was also confirmed by
direct visual inspection of the sorted cells using fluorescence microscopy.
The resulting cell lines were designated KO-MT-MC1, KO-HMG-I, or KO-MT-MC1/HMG-I to denote single or double transductants, respectively. The
latter cell line was derived by transduction of early passage KO-MT-MC1
cells with the HMG-I encoding retroviral vector. Cell lines arising from
transduction with the individual parental enhanced GFP- or dsRed-encoding retroviral vectors were used as controls for KO-MT-MC1 and KO-
MT-MC1/HMG-I cells, respectively, whereas a dual-transduced cell line was
used as the control for KO-MT-MC1/HMG-I cells. In all cases, these control
lines are referred to as ‘‘KO-vector’’ cells; their behaviors were identical toone another and were indistinguishable from nontransduced KO cells (data
not shown).
Filamentous Actin Staining. Cells were cultured in 8-well chambers
(Lab Tek Chamber Slides, Nalge-Nunc, Naperville, IL) at 37jC for 24 hours,
washed thrice with PBS, and fixed with 3.7% formaldehyde in PBS at room
temperature for 10 minutes. Slides were then washed three additional times
with PBS. Cells were permeabilized with imidazole lysis buffer [10 mmol/L
imidazole (pH 7.15), 40 mmol/L KCl, 10 mmol/L EDTA, 0.2% Triton X-100]
for 15 minutes and then stained in the same buffer containing 0.5% bovine
serum albumin and 3 units/mL of Oregon green phalloidin 514 (Molecular
Probes, Eugene, OR) for 35 minutes in the dark at room temperature. After
washing thrice with PBS, cells were counterstained at room temperature for
5 minutes with 100 mmol/L 4V,6-diamidino-2-phenylindole in the dark.
Following an additional wash in PBS, slides were treated with antifade
reagent (Molecular Probes) before applying coverslips. Cells were observed
with a Nikon Eclipse E800 fluorescent microscope equipped with a FITC
filter. Stained nuclei were visualized using a 4V,6-diamidino-2-phenylindole
filter. Superimposed images (�100) were acquired using the Magnafire 2.1
program.
Cell Size Determinations. Adherent cells in mid-log phase growth werewashed twice with PBS and trypsinized. An aliquot was stained with
propidium iodide and analyzed by flow cytometry to ensure that each cell
line contained equal populations of cells in G0/G1, S, and G2-M phases. Theremaining cells were resuspended in cell culture medium in the presence of
trypan blue. The diameters of at least 2,500 individual cells per sample were
determined on at least three separate occasions with a Vi-Cell Viability
Analyzer (model 1.0, Becton-Coulter, Inc., Miami, FL) and the results werepooled. A video imaging system was used to distinguish viable and dead
cells, with only the former being included in the final total. In all cases,
viability exceeded 95%.
Statistical analysis used the software package SPSS (version 11.5, SPSS,Inc. Chicago, IL). ANOVA and Kruskal-Wallace procedures were used for
comparisons among the various cell lines. The Tukey HSD procedure was
used for post hoc pairwise comparisons between pairs of groups.
Protein and RNA Analyses. The expression of myc epitope-tagged MT-MC1 and HMG-I in KO cells was routinely monitored by Western analyses
of total cell lysates as previously described (38). Briefly, 50 Ag of total
protein was resolved on 12% polyacrylamide-SDS gels and transferred topolyvinylidene difluoride membranes (Millipore, Bedford, MA). After
blocking with 5% dried milk in PBS + 2.5% Tween 20, the blot was
incubated with a 1:500 dilution of the 9E10 anti-c-Myc monoclonal
antibody (#sc-40, Santa Cruz Biotechnology, Santa Cruz, CA). As a controlfor protein loading, blots were also probed with an anti-h-tubulin
Cancer Research
Cancer Res 2005; 65: (6). March 15, 2005 2098 www.aacrjournals.org
Research. on October 3, 2014. © 2005 American Association for Cancercancerres.aacrjournals.org Downloaded from
monoclonal antibody (#05-661, Upstate Biotechnology, Lake Placid, NY).After extensive washing in PBS + 2.5% Tween 20 blots were incubated with
a 1:2,500 dilution of horseradish peroxidase-conjugated goat anti-mouse
IgG (#sc-2005, Santa Cruz), washed in PBS + 2.5% Tween 20, and developed
using a ‘‘Western Lightning’’ chemiluminescence kit (Perkin-Elmer LifeSciences, Boston, MA) according to the directions of the supplier.
Northern blots (5 Ag total RNA/lane) were prepared as previously
described (22, 38). Probes consisted of 32P-labeled cDNAs, or synthetic
oligonucleotides, 38 to 40 nucleotides in length. Conditions for hybridiza-tion in Ultra Hyb (Ambion, Austin, TX) and post-hybridization washings
have been previously described (23, 38).
For quantitative real-time PCR analyses, a Quantitect SYBR Green kit
(Qiagen, Inc., Valencia, CA) was used. Total RNA (50 ng) from each cell linewas reverse-transcribed and the product subsequently amplified in a total
volume of 20 AL in the presence of 1 Amol/L concentrations of each PCR
primer (ca. 100 ng per reaction). Each primer set was synthesized so as tospan an intron in the corresponding target gene. A list of PCR primers is
included in Supplementary Table 1. The initial real-time syntheses were
done for 20 minutes at 50jC. PCR reactions were done in a LightCycler 2.0
apparatus (Roche Diagnostics, Indianapolis, IN) using a 15-minuteactivation step at 95jC. A total of 40 cycles of PCR were then carried out
using a 15-second denaturation step at 94jC, 20 seconds of annealing at
55jC, and 30 seconds of extension at 72jC. All reactions were done a
minimum of three times. Relative quantifications comparing the levels ofeach target RNA with that of the glyceraldehyde-3-phosphate dehydroge-
nase reference were done using Lightcycler quantification software version
4.0. An amplification efficiency of 2 was used in the analysis.
Results
MT-MC1 and HMG-I Alter the Morphology of KnockoutCells. In order to study the c-Myc–independent consequences ofMT-MC1 and/or HMG-I overexpression, we infected KO cells withretroviruses encoding each of these epitope-tagged proteins. In thefirst case, the bicistronic retroviral vector also encoded enhancedGFP under the control of an internal ribosome entry site, whereasin the second case, the vector encoded dsRed variant of Discosomasp. red fluorescent protein (BD Biosciences/Clontech). The differ-ences in emission/excitation spectra of the two fluorescentproteins allowed for pure, pooled populations of sequentiallytransduced cells to be readily isolated by fluorescence-activatedcell sorting. As controls, KO cells were also infected singly orsequentially with the empty parental retroviruses and isolated inthe same way. Transduced cell lines were then examined for theexpression of MT-MC1 and HMG-I by Western blotting. As seen inFig. 1A , these cells (hereafter designated KO-MT-MC1, KO-HMG-I,and KO-MT-MC1/HMG-I cells) expressed high levels of bothproteins. As expected, KO-vector cells expressed neither protein(Fig. 1A).5
Northern analyses of the above cell lines showed thatendogenous MT-MC1 and HMG-I transcripts were expressed atlow to undetectable levels relative to those present in retrovirallytransduced cells (Fig. 1B). However, the levels of these lattertranscripts were comparable to the endogenous levels seen in 32Dmyeloid cells, particularly those with deregulated c-Myc expres-sion. Thus, the retroviral transduction of both MT-MC1 and HMG-Iin KO cells resulted in levels of expression attainable in other celltypes.Compared with parental TGR1 cells, KO cells possess a
flattened, ‘‘cuboidal’’ morphology and occupy a larger surface area.
This phenotype can be rescued by the overexpression of c-Myc orother members of the Myc family (50, 51). In order to determinewhether this phenotype could also be rescued by MT-MC1 andHMG-I in a c-Myc–independent manner, we compared themorphologies of the above cell lines, as well as that of the TGR1parental cell line using Oregon green-conjugated phalloidin. Thiscyclic peptide derivative of the mushroom Amanita phalloidesselectively binds to filamentous actin (F-actin) to reveal its typicalcable-like pattern in fibroblasts (54). In TGR1 cultures, F-actincables were invariably oriented parallel to the main axes of thehighly elongated cells (Fig. 1C). In addition, the pattern wassomewhat indistinct, most likely owing to the greater relativethickness of the cells. In three separate experiments, virtually allthe cells showed this typical fibroblastoid pattern. In contrast, theF-actin patterns of nearly all KO and KO-vector cells, weredistinctly different, with a much better defined cable network thatwas longer, seemingly thicker, and more randomly arrayed. Thisstaining also clearly emphasized the larger surface area of the cells.Reconstitution with c-Myc resulted in a correction of themorphologic defect in 42% of the cells.We next asked whether the expression of MT-MC1 and HMG-I
could alter the morphology of KO cells. In the first case, MT-MC1promoted the reversion of 22% of KO cells; the morphology ofthese was virtually indistinguishable from that of TGR1 and KO-c-Myc cells. HMG-I also promoted morphologic changes invirtually all cells. However, the appearance of these cells wasdistinctly different, as they retained the overall cuboidal appear-ance of KO cells, whereas at the same time appearing less spreadout and showing a less well-defined F-actin cable patternreminiscent of TGR1 cells. A greater amount of intense F-actinstaining was also observed at the edges of pseudopods.Finally, 61% of KO-MT-MC1/HMG-I showed morphologies
characteristic of each of the previously described cell linesexpressing the individual proteins. From these results, we concludethat MT-MC1 and HMG-I each alters the structure of KO cells indistinct ways and that these changes are c-Myc–independent.Correction of the Growth Defect of Knockout Cells by MT-
MC1 and HMG-I. KO cells divide significantly more slowly thaneither parental TGR1 cells or TGR1 cells with a single c-Myc allele(50). We and others have previously shown that c-Myc and othermembers of the Myc family can rescue this growth defect (50, 51).In order to determine whether MT-MC1 and HMG-I could affectthe growth rate of KO cells, we examined this property in each ofthe transduced cell lines within 2 weeks of their derivation. As seenin Fig. 2A , KO-MT-MC1 cells initially grew at the same slow rate asKO and KO-vector cells (doubling times, ca. 50-60 hours). However,upon longer in vitro propagation (ca. 10-12 weeks), these cellsreproducibly acquired a markedly accelerated growth rate (Fig.2B).In contrast, even the earliest passage KO-HMG-I and KO-MT-MC1/HMG-I cells showed rapid growth rates (doubling times, ca. 14-16hours; Fig. 2A). This was seen in several independent experiments,thus indicating that it was a general and direct consequence of theHMG-I’s ectopic expression. Furthermore, unlike KO-c-Myc cells,which underwent massive apoptosis upon reaching saturationdensity, KO-HMG-I and KO-MT-MC1/HMG-I cells continued toproliferate, ultimately attaining a 6- to 8-fold higher saturationdensity, and remaining viable without any evidence of apoptosiseven following serum deprivation (Fig. 2C and data not shown).Thus, MT-MC1 and HMG-I each rescues the growth defect of KOcells, but does so in distinct ways, with HMG-I’s effect beingimmediate and dominant over that of MT-MC1.5 Unpublished observations.
Restoration of Multiple c-Myc Phenotypes
www.aacrjournals.org 2099 Cancer Res 2005; 65: (6). March 15, 2005
Research. on October 3, 2014. © 2005 American Association for Cancercancerres.aacrjournals.org Downloaded from

Both TGR1 and KO cells are quite resistant to apoptosisfollowing serum deprivation. In contrast, KO-c-Myc cells are highlyprone to apoptosis even when maintained in serum-containingmedium at high density (ref. 51 and Fig. 2C). Interestingly, neitherMT-MC1 nor HMG-I altered the intrinsic resistance of KO cells toserum deprivation (data not shown). Thus, despite the effects ofthese two c-Myc target genes on cell growth, they exerted nosignificant effect on survival under conditions in which c-Myc itselfis highly proapoptotic.Differential Effects of MT-MC1 and HMG-I on Genomic
Integrity. c-Myc overexpressing cells often show genomic instabil-ity. Depending on the cell type, this can be manifested by anincrease in chromosomal number, by frequent chromosomal breaksand translocations, by the amplification of certain genomic loci, orby the introduction of point mutations resulting from high levels ofoxidative DNA damage (20, 22–24, 55, 56). We and others haveshown that tetraploidy can be induced in c-Myc-overexpressingdiploid cells if they are exposed to mitotic spindle poisons, if thep53 tumor suppressor is inactivated, or if the G2-M mitotic cyclin,cyclin B1, is deregulated (20, 22, 23). The ability of c-Myc to conferthis property is time-dependent, suggesting that at least some
aspects of the c-Myc-mediated loss of genomic integrity are indirectand stochastic in nature (22, 23, 57). More recently, we have shownthat MT-MC1 overexpression also leads to tetraploidy. As in thecase of c-Myc, this occurs following exposure to mitotic spindlepoisons but can also arise spontaneously during the course ofin vitro passage (ref. 38 and data not shown).In order to investigate the consequences of MT-MC1 and HMG-I
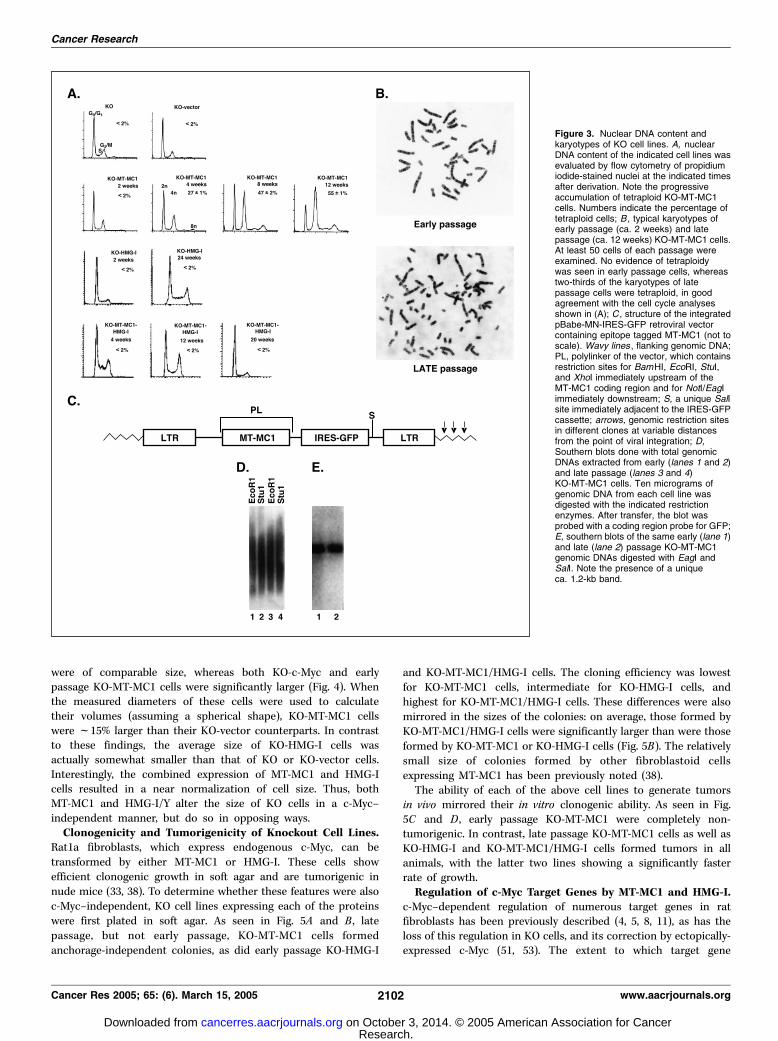
overexpression on genomic integrity, we periodically assessed theDNA content of the various KO cell lines. As seen in Fig. 3A , KO andKO-vector cells remained diploid over the course of the study, as didKO-HMG-I cells. In contrast, although early passage KO-MT-MC1cells were initially diploid, they became progressively moretetraploid with continued propagation (Fig. 3A and B). Dependingupon the experiment, this first became evident 4 to 8 weeks after thederivation of the cell line. Interestingly, no evidence of tetraploidywas seen in KO-MT-MC1/HMG-I cells even when propagated for >6months. We conclude that onlyMT-MC1 has the ability to noticeablyaffect genomic stability and that it does so in a c-Myc–independentmanner. Like c-Myc, MT-MC1 seems to modulate chromosomalnumber indirectly, as evidenced by the fact that tetraploidy occursonly after prolonged in vitro passage.
Figure 1. Expression of MT-MC1 andHMG-I, and F-actin staining patternsin various fibroblast lines. A, expression ofMT-MC1 and HMG-I. Western blotsfrom the indicated cell lines were usedto detect Myc-epitope-tagged MT-MC1and HMG-I; bottom, the same blot probedfor tubulin expression as a control forprotein loading; B, comparisons ofMT-MC1 and HMG-I transcript levels.Northern analyses were done on theindicated cell lines. c-Myc-overexpressing32D murine myeloid cells (32D-c-Myc cells)or control 32D (32D-neo cells; ref. 38) wereincluded as controls to show thec-Myc-mediated induction of endogenousMT-MC1 and HMG-I. Note that the formerconsists of two transcripts, which ariseby alternate polyadenylation site selection(38). Glyceraldehyde-3-phosphatedehydrogenase was included as a controlfor RNA loading. The larger MT-MC1 andHMG-I transcripts in the fibroblast lines aredue to their being encoded by the retroviralgenome; C, F-actin staining patterns.Each of the indicated cell lines was stainedwith Oregon green-conjugated phalloidin.KO-c-Myc cells were derived bytransduction with the same enhancedGFP-encoding bicistronic retroviral vectorand have been previously described (51).TGR1 cells are the parental c-Myc+/+fibroblasts from which the KO line wasderived (50). Numbers indicate the percentof cells from at least three separateexperiments (F 1 SE) demonstratingmorphologies distinct from that of KO cells.In each case, percentages were calculatedfrom 100 to 200 cells per group.
Cancer Research
Cancer Res 2005; 65: (6). March 15, 2005 2100 www.aacrjournals.org
Research. on October 3, 2014. © 2005 American Association for Cancercancerres.aacrjournals.org Downloaded from

The delayed effect of MT-MC1 on growth could have resultedfrom the expansion of a single KO clone or small number of clones
as a consequence of retroviral activation of a growth-enhancing
gene or the inactivation of a growth suppressor. Arguing against
this was the observation that enhanced KO-vector cell proliferationwas never observed and that the delayed onset of KO-MT-MC1
rapid growth was seen on several independent occasions (data not
shown). However, to examine this directly, we asked whether latepassage KO-MT-MC1 cells might show evidence of unique
retroviral integration sites. Southern blots from both early and
late passage KO-MT-MC1 cells using the GFP coding region as aprobe produced a diffuse signal, indicative of multiple retroviral
insertion sites within each cell population (Fig. 3C and D). In
contrast, digestion of DNA with enzymes whose recognition sitesflanked the IRES-GFP cassette in the retroviral genome produced a
single autoradiographic band (Fig. 3E). We conclude that MT-
MC1’s ability to accelerate growth did not arise from a proliferative
advantage conferred upon a small subset of retrovirally transducedclones.MT-MC1 and HMG-I Affect Cell Size in Opposite Ways.
Another feature of c-Myc is its ability to promote an increase inthe size and mass of certain cell types (18, 19, 27). This mayrelate to c-Myc’s ability to up-regulate the expression of genesinvolved in ribosomal biogenesis and metabolism and to itsinduction of RNA polymerase III-mediated transcription (58). Todetermine whether MT-MC1 and HMG-I could exert a similareffect, we compared the sizes of the various KO cell lines. Cellswere harvested in mid-log phase growth and their cell cycleprofiles were determined by propidium iodide staining prior tomeasuring their sizes (data not shown). Each cell line containedcomparable G0/G1, S, and G2-M populations and were fullydiploid, thus eliminating the possibility that any observed sizedifferences could be due to unequal cell cycle distributionprofiles. When analyzed in this way, KO and KO-vector cells
Figure 2. Growth rates of KO cell lines.A, growth rates of the indicated cell lineswere compared f2 weeks after theirderivation. The doubling times of the KOcell line and all three KO-vector cell lineswas estimated to be 50 to 60 hours,whereas TGR1 cells had a doubling timeof ca. 20 hours as previously described(50, 51). Early passage KO-MT-MC1 cellshad a doubling time similar to that of KOand KO-vector cells, whereas KO-HMG-I,KO-MT-MC1/HMG-I, and KO-c-Myc cellsgrew significantly faster (doubling time, ca.14-18.5 hours). Although difficult toappreciate due to the linear nature of theabscissa, all of the cell lines except KO,KO-vector, and KO-MT-MC1 increased tobetween 8 � 104 and 1.6 � 10 5 from days1 to 3, and continued to increaseexponentially until reaching saturationdensity; B, growth rates of KO-MT-MC1and KO-vector cells were compared 12weeks after their derivation. The doublingtime of the former cell line was 22 to 24hours. In all cases, the results show theaverage number of cells determined intriplicate experiments F 1 SE;C, phase-contrast micrographs of cellmonolayers taken 6 days after platingequivalent numbers of cells. Note thatsignificant numbers of KO-c-Myc cellsare undergoing apoptosis even beforereaching complete confluence.
Restoration of Multiple c-Myc Phenotypes
www.aacrjournals.org 2101 Cancer Res 2005; 65: (6). March 15, 2005
Research. on October 3, 2014. © 2005 American Association for Cancercancerres.aacrjournals.org Downloaded from
were of comparable size, whereas both KO-c-Myc and earlypassage KO-MT-MC1 cells were significantly larger (Fig. 4). Whenthe measured diameters of these cells were used to calculatetheir volumes (assuming a spherical shape), KO-MT-MC1 cellswere f15% larger than their KO-vector counterparts. In contrastto these findings, the average size of KO-HMG-I cells wasactually somewhat smaller than that of KO or KO-vector cells.Interestingly, the combined expression of MT-MC1 and HMG-Icells resulted in a near normalization of cell size. Thus, bothMT-MC1 and HMG-I/Y alter the size of KO cells in a c-Myc–independent manner, but do so in opposing ways.Clonogenicity and Tumorigenicity of Knockout Cell Lines.
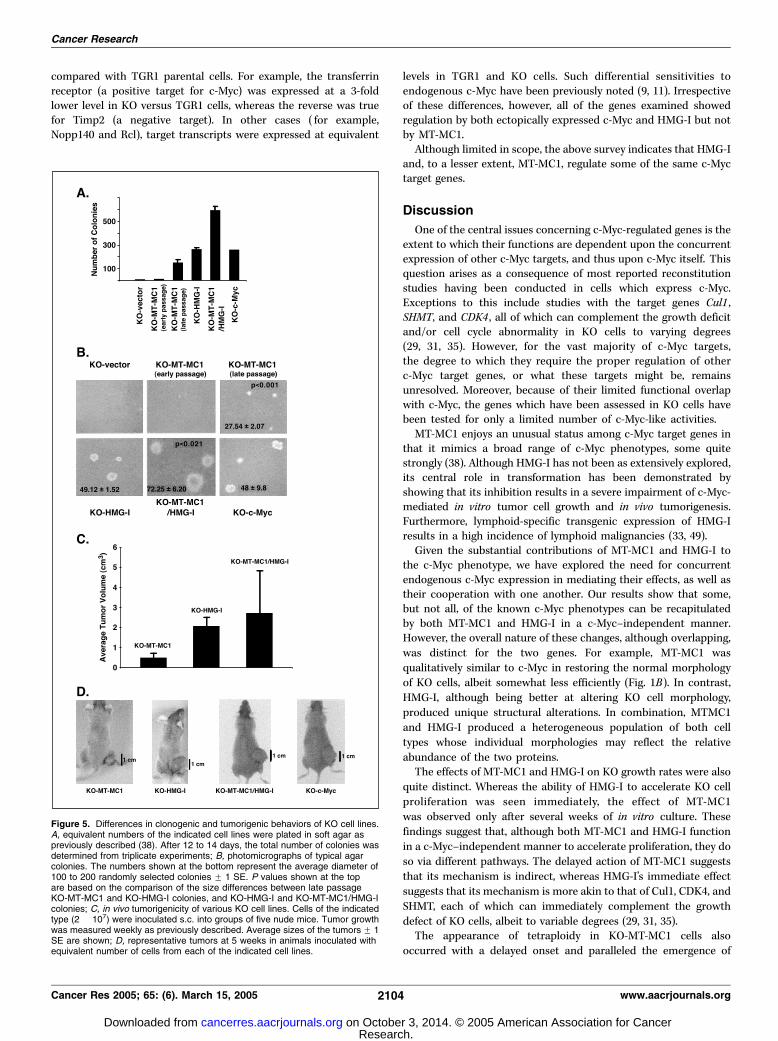
Rat1a fibroblasts, which express endogenous c-Myc, can betransformed by either MT-MC1 or HMG-I. These cells showefficient clonogenic growth in soft agar and are tumorigenic innude mice (33, 38). To determine whether these features were alsoc-Myc–independent, KO cell lines expressing each of the proteinswere first plated in soft agar. As seen in Fig. 5A and B , latepassage, but not early passage, KO-MT-MC1 cells formedanchorage-independent colonies, as did early passage KO-HMG-I
and KO-MT-MC1/HMG-I cells. The cloning efficiency was lowestfor KO-MT-MC1 cells, intermediate for KO-HMG-I cells, andhighest for KO-MT-MC1/HMG-I cells. These differences were alsomirrored in the sizes of the colonies: on average, those formed byKO-MT-MC1/HMG-I cells were significantly larger than were thoseformed by KO-MT-MC1 or KO-HMG-I cells (Fig. 5B). The relativelysmall size of colonies formed by other fibroblastoid cellsexpressing MT-MC1 has been previously noted (38).The ability of each of the above cell lines to generate tumors
in vivo mirrored their in vitro clonogenic ability. As seen in Fig.5C and D , early passage KO-MT-MC1 were completely non-tumorigenic. In contrast, late passage KO-MT-MC1 cells as well asKO-HMG-I and KO-MT-MC1/HMG-I cells formed tumors in allanimals, with the latter two lines showing a significantly fasterrate of growth.Regulation of c-Myc Target Genes by MT-MC1 and HMG-I.
c-Myc–dependent regulation of numerous target genes in ratfibroblasts has been previously described (4, 5, 8, 11), as has theloss of this regulation in KO cells, and its correction by ectopically-expressed c-Myc (51, 53). The extent to which target gene
Figure 3. Nuclear DNA content andkaryotypes of KO cell lines. A, nuclearDNA content of the indicated cell lines wasevaluated by flow cytometry of propidiumiodide-stained nuclei at the indicated timesafter derivation. Note the progressiveaccumulation of tetraploid KO-MT-MC1cells. Numbers indicate the percentage oftetraploid cells; B , typical karyotypes ofearly passage (ca. 2 weeks) and latepassage (ca. 12 weeks) KO-MT-MC1 cells.At least 50 cells of each passage wereexamined. No evidence of tetraploidywas seen in early passage cells, whereastwo-thirds of the karyotypes of latepassage cells were tetraploid, in goodagreement with the cell cycle analysesshown in (A); C , structure of the integratedpBabe-MN-IRES-GFP retroviral vectorcontaining epitope tagged MT-MC1 (not toscale). Wavy lines , flanking genomic DNA;PL, polylinker of the vector, which containsrestriction sites for BamHI, EcoRI, StuI,and XhoI immediately upstream of theMT-MC1 coding region and for NotI/EagIimmediately downstream; S, a unique SalIsite immediately adjacent to the IRES-GFPcassette; arrows, genomic restriction sitesin different clones at variable distancesfrom the point of viral integration; D,Southern blots done with total genomicDNAs extracted from early (lanes 1 and 2)and late passage (lanes 3 and 4)KO-MT-MC1 cells. Ten micrograms ofgenomic DNA from each cell line wasdigested with the indicated restrictionenzymes. After transfer, the blot wasprobed with a coding region probe for GFP;E, southern blots of the same early (lane 1)and late (lane 2) passage KO-MT-MC1genomic DNAs digested with EagI andSalI. Note the presence of a uniqueca. 1.2-kb band.
Cancer Research
Cancer Res 2005; 65: (6). March 15, 2005 2102 www.aacrjournals.org
Research. on October 3, 2014. © 2005 American Association for Cancercancerres.aacrjournals.org Downloaded from

regulation by c-Myc occurs is dependent upon its affinity forgenomic binding sites and its level of expression (9).The above cell lines afforded the opportunity to determine
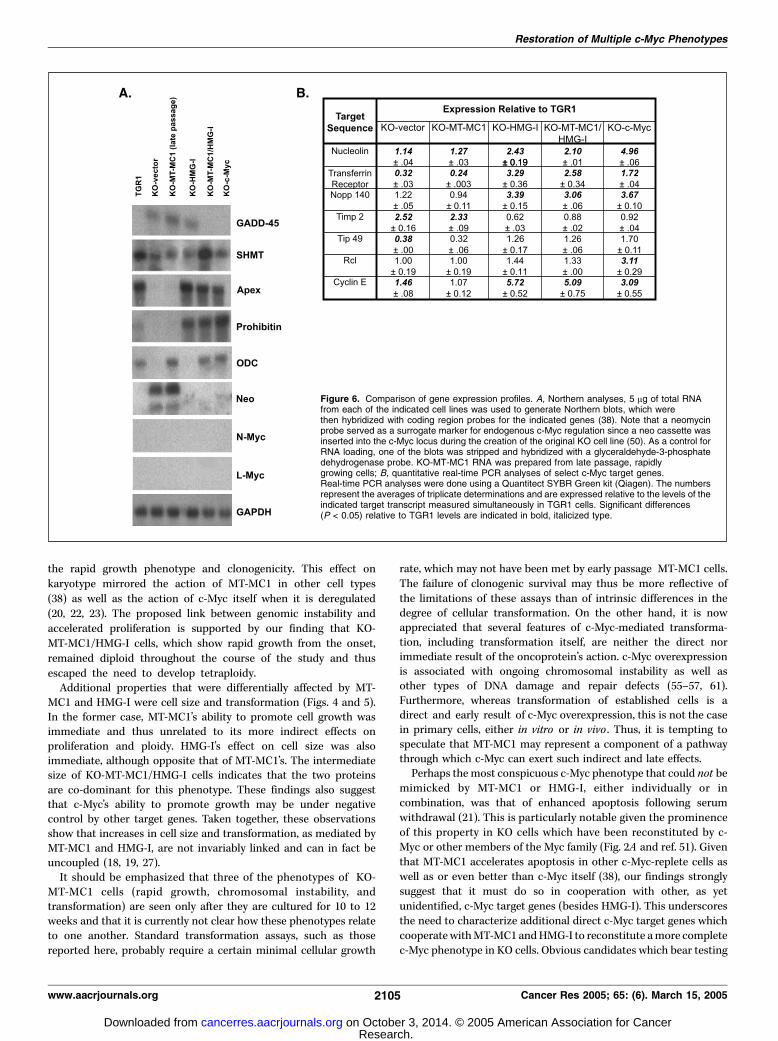
whether functional complementation of c-Myc phenotypes by MT-MC1 and HMG-I was associated with altered expression of c-Myctarget genes. To this end, we used a combination of Northernblotting and quantitative real-time PCR to examine the relativeexpression of a select subset of previously described c-Myc targetgenes (11). In the former case (Fig. 6A), the normal expressionpattern of most of the genes tested in parental TGR1 cells was lostin KO-vector cells and restored in KO-c-Myc cells. A typicalexample was seen in the case of gadd45 , which is a negative c-Myctarget (59). In KO-vector cells, gadd45 transcripts were increasedrelative to those in TGR1 cells, where they were barely detectable,whereas in KO-c-Myc cells, gadd45 transcripts were stronglysuppressed. Interestingly, neither MT-MC1 nor HMG-I repressedgadd45 transcript levels when expressed individually, whereas theircombined expression proved highly effective.The serine hydroxymethyl transferase (SHMT) gene is a
positive target for c-Myc (35). As expected, KO cells expressedlower levels of SHMT than did parental TGR1 cells. Ectopicexpression of c-Myc, MT-MC1, or HMG-I individually resulted in aminimal or modest increase in SHMT transcript levels. Incontrast, and in a manner reminiscent of the regulation describedabove for gadd45 , MT-MC1 and HMG-I in combination provedhighly effective at restoring SHMT transcript levels.
Two additional c-Myc targets, Apex and Prohibitin (11), showedsimilar patterns of expression; in both cases, reduced expression inKO cells was restored to normal or supra-normal levels only byHMG-I or c-Myc. This contrasted with another c-Myc target,ornithine decarboxylase, whose expression in KO cells wasrestored by MT-MC1 and c-Myc, but not by HMG-I.c-Myc negatively regulates its own promoter (ref. 60 and
references therein). Functional c-Myc transcripts are not expressedin KO cells due to the replacement of c-Myc coding sequences witha neo expression cassette (50). Neo transcripts thus serve as asurrogate marker of c-Myc promoter activity (51). As expected, neotranscripts were not detected in parental TGR1 cells but wereexpressed at high levels in KO cells, indicating that the c-Myc
promoter was active. MT-MC1 did not affect the levels of neo
transcripts, whereas both HMG-I, and c-Myc resulted in significant
repression, as did the combined expression of MT-MC1 and HMG-I.Thus, both HMG-I and c-Myc were capable of down-regulating the
c-Myc promoter.Finally, we examined each of the cell lines for expression of
N-Myc and L-Myc, which can substitute for c-Myc to restore arapid growth phenotype to KO cells (51). Neither of thesetranscripts were detected.Quantitative real-time PCR was next used to assess the
regulation of several additional genes which were expressed atlevels too low to be accurately quantified by Northern analyses(Fig. 6B). Some, but not all of these, were altered in KO cells
Figure 4. Cell size comparisons of KO cell lines. Each ofthe indicated cell lines was harvested in log-phasegrowth from cultures demonstrating z95% viability.Propidium iodide staining was done to confirm that all celllines contained equal proportions of G0/G1, S, and G2-Mpopulations. Size determinations were done with aVi-Cell Viability Analyzer (Beckman-Coulter). Numbersabove the histograms indicate the average cell diameterF 1 SE. P values are derived from comparison with theKO parental line using Student’s two-tailed t test.
Restoration of Multiple c-Myc Phenotypes
www.aacrjournals.org 2103 Cancer Res 2005; 65: (6). March 15, 2005
Research. on October 3, 2014. © 2005 American Association for Cancercancerres.aacrjournals.org Downloaded from
compared with TGR1 parental cells. For example, the transferrinreceptor (a positive target for c-Myc) was expressed at a 3-foldlower level in KO versus TGR1 cells, whereas the reverse was truefor Timp2 (a negative target). In other cases ( for example,Nopp140 and Rcl), target transcripts were expressed at equivalent
levels in TGR1 and KO cells. Such differential sensitivities toendogenous c-Myc have been previously noted (9, 11). Irrespectiveof these differences, however, all of the genes examined showedregulation by both ectopically expressed c-Myc and HMG-I but notby MT-MC1.Although limited in scope, the above survey indicates that HMG-I
and, to a lesser extent, MT-MC1, regulate some of the same c-Myctarget genes.
Discussion
One of the central issues concerning c-Myc-regulated genes is theextent to which their functions are dependent upon the concurrentexpression of other c-Myc targets, and thus upon c-Myc itself. Thisquestion arises as a consequence of most reported reconstitutionstudies having been conducted in cells which express c-Myc.Exceptions to this include studies with the target genes Cul1 ,SHMT, and CDK4 , all of which can complement the growth deficitand/or cell cycle abnormality in KO cells to varying degrees(29, 31, 35). However, for the vast majority of c-Myc targets,the degree to which they require the proper regulation of otherc-Myc target genes, or what these targets might be, remainsunresolved. Moreover, because of their limited functional overlapwith c-Myc, the genes which have been assessed in KO cells havebeen tested for only a limited number of c-Myc-like activities.MT-MC1 enjoys an unusual status among c-Myc target genes in
that it mimics a broad range of c-Myc phenotypes, some quitestrongly (38). Although HMG-I has not been as extensively explored,its central role in transformation has been demonstrated byshowing that its inhibition results in a severe impairment of c-Myc-mediated in vitro tumor cell growth and in vivo tumorigenesis.Furthermore, lymphoid-specific transgenic expression of HMG-Iresults in a high incidence of lymphoid malignancies (33, 49).Given the substantial contributions of MT-MC1 and HMG-I to
the c-Myc phenotype, we have explored the need for concurrentendogenous c-Myc expression in mediating their effects, as well astheir cooperation with one another. Our results show that some,but not all, of the known c-Myc phenotypes can be recapitulatedby both MT-MC1 and HMG-I in a c-Myc–independent manner.However, the overall nature of these changes, although overlapping,
was distinct for the two genes. For example, MT-MC1 was
qualitatively similar to c-Myc in restoring the normal morphologyof KO cells, albeit somewhat less efficiently (Fig. 1B). In contrast,
HMG-I, although being better at altering KO cell morphology,
produced unique structural alterations. In combination, MTMC1
and HMG-I produced a heterogeneous population of both cell
types whose individual morphologies may reflect the relative
abundance of the two proteins.The effects of MT-MC1 and HMG-I on KO growth rates were also
quite distinct. Whereas the ability of HMG-I to accelerate KO cell
proliferation was seen immediately, the effect of MT-MC1
was observed only after several weeks of in vitro culture. These
findings suggest that, although both MT-MC1 and HMG-I function
in a c-Myc–independent manner to accelerate proliferation, they do
so via different pathways. The delayed action of MT-MC1 suggests
that its mechanism is indirect, whereas HMG-I’s immediate effect
suggests that its mechanism is more akin to that of Cul1, CDK4, and
SHMT, each of which can immediately complement the growth
defect of KO cells, albeit to variable degrees (29, 31, 35).The appearance of tetraploidy in KO-MT-MC1 cells also
occurred with a delayed onset and paralleled the emergence of
Figure 5. Differences in clonogenic and tumorigenic behaviors of KO cell lines.A, equivalent numbers of the indicated cell lines were plated in soft agar aspreviously described (38). After 12 to 14 days, the total number of colonies wasdetermined from triplicate experiments; B, photomicrographs of typical agarcolonies. The numbers shown at the bottom represent the average diameter of100 to 200 randomly selected colonies F 1 SE. P values shown at the topare based on the comparison of the size differences between late passageKO-MT-MC1 and KO-HMG-I colonies, and KO-HMG-I and KO-MT-MC1/HMG-Icolonies; C, in vivo tumorigenicity of various KO cell lines. Cells of the indicatedtype (2 � 107) were inoculated s.c. into groups of five nude mice. Tumor growthwas measured weekly as previously described. Average sizes of the tumors F 1SE are shown; D, representative tumors at 5 weeks in animals inoculated withequivalent number of cells from each of the indicated cell lines.
Cancer Research
Cancer Res 2005; 65: (6). March 15, 2005 2104 www.aacrjournals.org
Research. on October 3, 2014. © 2005 American Association for Cancercancerres.aacrjournals.org Downloaded from
the rapid growth phenotype and clonogenicity. This effect on
karyotype mirrored the action of MT-MC1 in other cell types
(38) as well as the action of c-Myc itself when it is deregulated
(20, 22, 23). The proposed link between genomic instability andaccelerated proliferation is supported by our finding that KO-
MT-MC1/HMG-I cells, which show rapid growth from the onset,
remained diploid throughout the course of the study and thus
escaped the need to develop tetraploidy.Additional properties that were differentially affected by MT-
MC1 and HMG-I were cell size and transformation (Figs. 4 and 5).In the former case, MT-MC1’s ability to promote cell growth wasimmediate and thus unrelated to its more indirect effects onproliferation and ploidy. HMG-I’s effect on cell size was alsoimmediate, although opposite that of MT-MC1’s. The intermediatesize of KO-MT-MC1/HMG-I cells indicates that the two proteinsare co-dominant for this phenotype. These findings also suggestthat c-Myc’s ability to promote growth may be under negativecontrol by other target genes. Taken together, these observationsshow that increases in cell size and transformation, as mediated byMT-MC1 and HMG-I, are not invariably linked and can in fact beuncoupled (18, 19, 27).It should be emphasized that three of the phenotypes of KO-
MT-MC1 cells (rapid growth, chromosomal instability, andtransformation) are seen only after they are cultured for 10 to 12weeks and that it is currently not clear how these phenotypes relateto one another. Standard transformation assays, such as thosereported here, probably require a certain minimal cellular growth
rate, which may not have been met by early passage MT-MC1 cells.The failure of clonogenic survival may thus be more reflective ofthe limitations of these assays than of intrinsic differences in thedegree of cellular transformation. On the other hand, it is nowappreciated that several features of c-Myc-mediated transforma-tion, including transformation itself, are neither the direct norimmediate result of the oncoprotein’s action. c-Myc overexpressionis associated with ongoing chromosomal instability as well asother types of DNA damage and repair defects (55–57, 61).Furthermore, whereas transformation of established cells is adirect and early result of c-Myc overexpression, this is not the casein primary cells, either in vitro or in vivo . Thus, it is tempting tospeculate that MT-MC1 may represent a component of a pathwaythrough which c-Myc can exert such indirect and late effects.Perhaps the most conspicuous c-Myc phenotype that could not be
mimicked by MT-MC1 or HMG-I, either individually or incombination, was that of enhanced apoptosis following serumwithdrawal (21). This is particularly notable given the prominenceof this property in KO cells which have been reconstituted by c-Myc or other members of the Myc family (Fig. 2A and ref. 51). Giventhat MT-MC1 accelerates apoptosis in other c-Myc-replete cells aswell as or even better than c-Myc itself (38), our findings stronglysuggest that it must do so in cooperation with other, as yetunidentified, c-Myc target genes (besides HMG-I). This underscoresthe need to characterize additional direct c-Myc target genes whichcooperatewithMT-MC1 andHMG-I to reconstitute amore completec-Myc phenotype in KO cells. Obvious candidates which bear testing
Figure 6. Comparison of gene expression profiles. A, Northern analyses, 5 Ag of total RNAfrom each of the indicated cell lines was used to generate Northern blots, which werethen hybridized with coding region probes for the indicated genes (38). Note that a neomycinprobe served as a surrogate marker for endogenous c-Myc regulation since a neo cassette wasinserted into the c-Myc locus during the creation of the original KO cell line (50). As a control forRNA loading, one of the blots was stripped and hybridized with a glyceraldehyde-3-phosphatedehydrogenase probe. KO-MT-MC1 RNA was prepared from late passage, rapidlygrowing cells; B, quantitative real-time PCR analyses of select c-Myc target genes.Real-time PCR analyses were done using a Quantitect SYBR Green kit (Qiagen). The numbersrepresent the averages of triplicate determinations and are expressed relative to the levels of theindicated target transcript measured simultaneously in TGR1 cells. Significant differences(P < 0.05) relative to TGR1 levels are indicated in bold, italicized type.
Restoration of Multiple c-Myc Phenotypes
www.aacrjournals.org 2105 Cancer Res 2005; 65: (6). March 15, 2005
Research. on October 3, 2014. © 2005 American Association for Cancercancerres.aacrjournals.org Downloaded from
include those already known to impart a strongly proapoptoticresponse in c-Myc-expressing cells such as ornithine decarboxylaseand Bax (28, 62). The cell lines described here should prove useful inevaluating the contributions of these additional genes.Our limited Northern and quantitative real-time PCR analyses
have indicated that overexpression of MT-MC1 and/or HMG-I can,in some cases, lead to the deregulation of other c-Myc target genes.These results suggest the existence of regulatory circuits in whichcertain genes are subject to control by c-Myc as well as theproducts of some of its direct targets, although not necessarily inan identical manner. The ability of HMG-I to promote chromatinremodeling (39–41) is certainly consistent with such a proposedrole as are recent DNA microarray results indicating that some ofthe genes under the control of MT-MC1 and HMG-I consistof previously described c-Myc targets.6,7 Somewhat surprising was
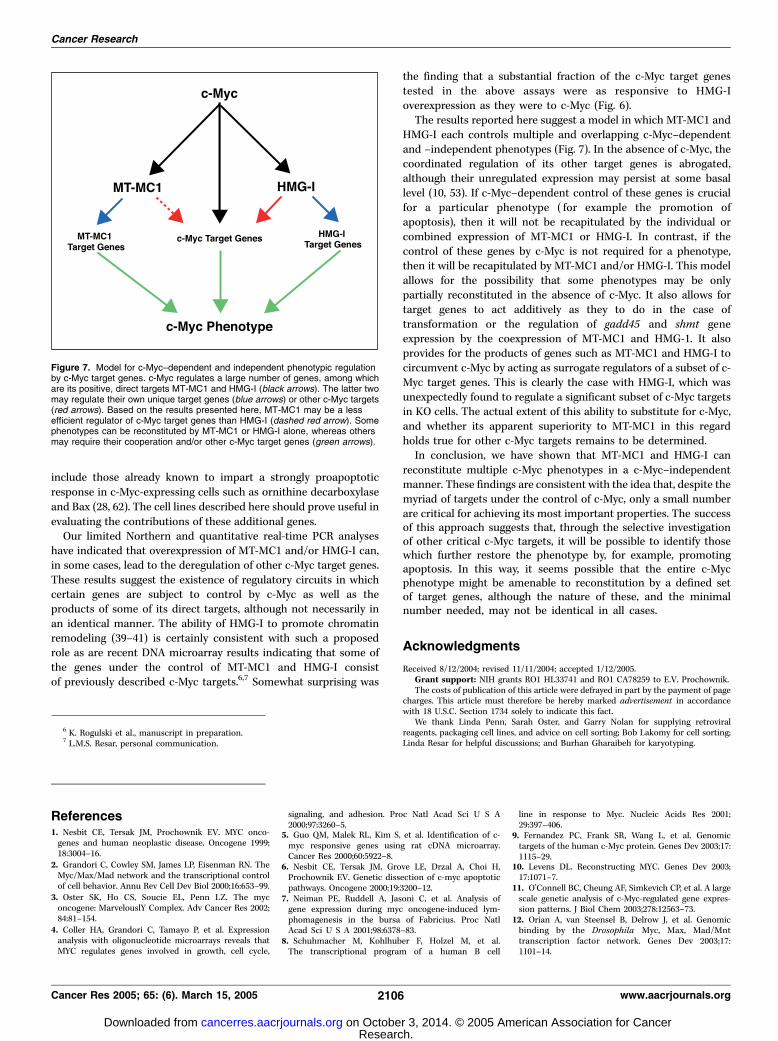
the finding that a substantial fraction of the c-Myc target genestested in the above assays were as responsive to HMG-Ioverexpression as they were to c-Myc (Fig. 6).The results reported here suggest a model in which MT-MC1 and
HMG-I each controls multiple and overlapping c-Myc–dependentand –independent phenotypes (Fig. 7). In the absence of c-Myc, thecoordinated regulation of its other target genes is abrogated,although their unregulated expression may persist at some basallevel (10, 53). If c-Myc–dependent control of these genes is crucialfor a particular phenotype ( for example the promotion ofapoptosis), then it will not be recapitulated by the individual orcombined expression of MT-MC1 or HMG-I. In contrast, if thecontrol of these genes by c-Myc is not required for a phenotype,then it will be recapitulated by MT-MC1 and/or HMG-I. This modelallows for the possibility that some phenotypes may be onlypartially reconstituted in the absence of c-Myc. It also allows fortarget genes to act additively as they to do in the case oftransformation or the regulation of gadd45 and shmt geneexpression by the coexpression of MT-MC1 and HMG-1. It alsoprovides for the products of genes such as MT-MC1 and HMG-I tocircumvent c-Myc by acting as surrogate regulators of a subset of c-Myc target genes. This is clearly the case with HMG-I, which wasunexpectedly found to regulate a significant subset of c-Myc targetsin KO cells. The actual extent of this ability to substitute for c-Myc,and whether its apparent superiority to MT-MC1 in this regardholds true for other c-Myc targets remains to be determined.In conclusion, we have shown that MT-MC1 and HMG-I can
reconstitute multiple c-Myc phenotypes in a c-Myc–independentmanner. These findings are consistent with the idea that, despite themyriad of targets under the control of c-Myc, only a small numberare critical for achieving its most important properties. The successof this approach suggests that, through the selective investigationof other critical c-Myc targets, it will be possible to identify thosewhich further restore the phenotype by, for example, promotingapoptosis. In this way, it seems possible that the entire c-Mycphenotype might be amenable to reconstitution by a defined setof target genes, although the nature of these, and the minimalnumber needed, may not be identical in all cases.
Acknowledgments
Received 8/12/2004; revised 11/11/2004; accepted 1/12/2005.Grant support: NIH grants RO1 HL33741 and RO1 CA78259 to E.V. Prochownik.The costs of publication of this article were defrayed in part by the payment of page
charges. This article must therefore be hereby marked advertisement in accordancewith 18 U.S.C. Section 1734 solely to indicate this fact.
We thank Linda Penn, Sarah Oster, and Garry Nolan for supplying retroviralreagents, packaging cell lines, and advice on cell sorting; Bob Lakomy for cell sorting;Linda Resar for helpful discussions; and Burhan Gharaibeh for karyotyping.
Figure 7. Model for c-Myc–dependent and independent phenotypic regulationby c-Myc target genes. c-Myc regulates a large number of genes, among whichare its positive, direct targets MT-MC1 and HMG-I (black arrows). The latter twomay regulate their own unique target genes (blue arrows) or other c-Myc targets(red arrows). Based on the results presented here, MT-MC1 may be a lessefficient regulator of c-Myc target genes than HMG-I (dashed red arrow). Somephenotypes can be reconstituted by MT-MC1 or HMG-I alone, whereas othersmay require their cooperation and/or other c-Myc target genes (green arrows).
6 K. Rogulski et al., manuscript in preparation.7 L.M.S. Resar, personal communication.
References1. Nesbit CE, Tersak JM, Prochownik EV. MYC onco-genes and human neoplastic disease. Oncogene 1999;18:3004–16.
2. Grandori C, Cowley SM, James LP, Eisenman RN. TheMyc/Max/Mad network and the transcriptional controlof cell behavior. Annu Rev Cell Dev Biol 2000;16:653–99.
3. Oster SK, Ho CS, Soucie EL, Penn LZ. The myconcogene: MarvelouslY Complex. Adv Cancer Res 2002;84:81–154.
4. Coller HA, Grandori C, Tamayo P, et al. Expressionanalysis with oligonucleotide microarrays reveals thatMYC regulates genes involved in growth, cell cycle,
signaling, and adhesion. Proc Natl Acad Sci U S A2000;97:3260–5.
5. Guo QM, Malek RL, Kim S, et al. Identification of c-myc responsive genes using rat cDNA microarray.Cancer Res 2000;60:5922–8.
6. Nesbit CE, Tersak JM, Grove LE, Drzal A, Choi H,Prochownik EV. Genetic dissection of c-myc apoptoticpathways. Oncogene 2000;19:3200–12.
7. Neiman PE, Ruddell A, Jasoni C, et al. Analysis ofgene expression during myc oncogene-induced lym-phomagenesis in the bursa of Fabricius. Proc NatlAcad Sci U S A 2001;98:6378–83.
8. Schuhmacher M, Kohlhuber F, Holzel M, et al.The transcriptional program of a human B cell
line in response to Myc. Nucleic Acids Res 2001;29:397–406.
9. Fernandez PC, Frank SR, Wang L, et al. Genomictargets of the human c-Myc protein. Genes Dev 2003;17:1115–29.
10. Levens DL. Reconstructing MYC. Genes Dev 2003;17:1071–7.
11. O’Connell BC, Cheung AF, Simkevich CP, et al. A largescale genetic analysis of c-Myc-regulated gene expres-sion patterns. J Biol Chem 2003;278:12563–73.
12. Orian A, van Steensel B, Delrow J, et al. Genomicbinding by the Drosophila Myc, Max, Mad/Mnttranscription factor network. Genes Dev 2003;17:1101–14.
Cancer Research
Cancer Res 2005; 65: (6). March 15, 2005 2106 www.aacrjournals.org
Research. on October 3, 2014. © 2005 American Association for Cancercancerres.aacrjournals.org Downloaded from
13. Li Z, Van Calcar S, Qu C, Cavenee WK, Zhang MQ,Ren B. A global transcriptional regulatory role for c-Mycin Burkitt’s lymphoma cells. Proc Natl Acad Sci U S A2003;100:8164–6.
14. Coppola JA, Cole MD. Constitutive c-myc onco-gene expression blocks mouse erythroleukaemia celldifferentiation but not commitment. Nature 1986;320:760–3.
15. Prochownik EV, Kukowska J. Deregulated expressionof c-myc by murine erythroleukaemia cells preventsdifferentiation. Nature 1986;322:848–50.
16. Stern DF, Roberts AB, Roche NS, Sporn MB,Weinberg RA. Differential responsiveness of myc- andras-transfected cells to growth factors: selectivestimulation of myc-transfected cells by epidermalgrowth factor. Mol Cell Biol 1986;6:870–7.
17. Prochownik EV, Kukowska J, Rodgers C. c-mycantisense transcripts accelerate differentiation andinhibit G1 progression in murine erythroleukemia cells.Mol Cell Biol 1988;8:3683–95.
18. Iritani BM, Eisenman RN. c-Myc enhances proteinsynthesis and cell size during B lymphocyte develop-ment. Proc Natl Acad Sci U S A 1999;96:13180–4.
19. Johnston LA, Prober DA, Edgar BA, Eisenman RN,Gallant P. Drosophila myc regulates cellular growthduring development. Cell 1999;98:779–90.
20. Li Q, Dang CV. c-Myc overexpression uncouples DNAreplication from mitosis. Mol Cell Biol 1999;19:5339–51.
21. Prendergast GC. Mechanisms of apoptosis by c-Myc.Oncogene 1999;18:2967–87.
22. Yin XY, Grove L, Datta NS, Long MW, ProchownikEV. C-myc overexpression and p53 loss cooperate topromote genomic instability. Oncogene 1999;18:1177–84.
23. Yin XY, Grove L, Datta NS, Katula K, Long MW,Prochownik EV. Inverse regulation of cyclin B1 by c-Myc and p53 and induction of tetraploidy by cyclinB1 overexpression. Cancer Res 2001;61:6487–93.
24. Fest T, Mougey V, Dalstein V, et al. c-MYC over-expression in Ba/F3 cells simultaneously elicits ge-nomic instability and apoptosis. Oncogene 2002;21:2981–90.
25. Obaya AJ, Kotenko I, Cole MD, Sedivy JM. The proto-oncogene c-myc acts through the cyclin-dependentkinase (Cdk) inhibitor p27(Kip1) to facilitate theactivation of Cdk4/6 and early G(1) phase progression.J Biol Chem 2002;277:31263–9.
26. Schorl C, Sedivy JM. Loss of protooncogene c-Mycfunction impedes G1 phase progression both before andafter the restriction point. Mol Biol Cell 2003;4:823–35.
27. Maines JZ, Stevens LM, Tong X, Stein D. DrosophiladMyc is required for ovary cell growth and endorepli-cation. Development 2004;131:775–86.
28. Packham G, Cleveland JL. Ornithine decarboxylase isa mediator of c-Myc-induced apoptosis. Mol Cell Biol1994;14:5741–7.
29. Hermeking H, Rago C, Schuhmacher M, et al.Identification of CDK4 as a target of c-MYC. Proc NatlAcad Sci U S A 2000;97:2229–34.
30. Lewis BC, Prescott JE, Campbell SE, Shim H, OrlowskiRZ, Dang CV. Tumor induction by the c-Myc target
genes rcl and lactate dehydrogenase A. Cancer Res2000;60:6178–83.
31. O’Hagan RC, Ohh M, David G, et al. Myc-enhancedexpression of Cul1 promotes ubiquitin-dependentproteolysis and cell cycle progression. Genes Dev2000;4:2185–91.
32. Wood LJ, Maher JF, Bunton TE, Resar LM. Theoncogenic properties of the HMG-I gene family. CancerRes 2000;60:4256–61.
33. Wood LJ, Mukherjee M, Dolde CE, et al. HMG-I/Y, anew c-Myc target gene and potential oncogene. Mol CellBiol 2000;20:5490–502.
34. Prescott JE, Osthus RC, Lee LA, et al. A novel c-Myc-responsive gene, JPO1, participates in neoplastictransformation. J Biol Chem 2001;276:48276–84.
35. Nikiforov MA, Chandriani S, O’Connell B, et al. Afunctional screen for Myc-responsive genes revealsserine hydroxymethyltransferase, a major source ofthe one-carbon unit for cell metabolism. Mol Cell Biol2002;22:5793–800.
36. Wonsey DR, Zeller KI, Dang CV. The c-Myc targetgene PRDX3 is required for mitochondrial homeosta-sis and neoplastic transformation. Proc Natl Acad SciU S A 2002;99:6649–54.
37. Lewis BC, Shim H, Li Q, et al. Identification ofputative c-Myc-responsive genes: characterization ofrcl, a novel growth-related gene. Mol Cell Biol 1997;17:4967–78.
38. Yin X, Grove L, Rogulski K, Prochownik EV. Myctarget in myeloid cells-1, a novel c-Myc target,recapitulates multiple c-Myc phenotypes. J Biol Chem2002;277:19998–20010.
39. Johnson KR, Cook SA, Davisson MT. Localization ofthe murine gene and two related sequences encodinghigh-mobility-group I and Y proteins. Genomics 1992;12:503–9.
40. Friedmann M, Holth LT, Zoghbi HY, Reeves R.Organization, inducible-expression and chromosomelocalization of the human HMG-I(Y) nonhistone proteingene. Nucleic Acids Res 1993;21:4259–67.
41. Reeves R, Beckerbauer L. HMG-I/Y proteins: flexibleregulators of transcription and chromatin structure.Biochim Biophys Acta 2001;1519:13–29.
42. Homurra F, Katabami M, Leaner VD, et al. HMG-I/Yis a c-Jun/activator protein-1 target gene and isnecessary for c-Jun-induced anchorage-independentgrowth in Rat1a cells. Mol Cancer Res 2004;2:305–14.
43. Ram TG, Reeves R, Hosick HL. Elevated high mobilitygroup-I(Y) gene expression is associated with progres-sive transformation of mouse mammary epithelial cells.Cancer Res 1993;53:2655–60.
44. Tamimi Y, van der Poel HG, Denyn MM, et al.Increased expression of high mobility group proteinI(Y) in high grade prostatic cancer determined by in situhybridization. Cancer Res 1993;5512–6.
45. Chiappetta G, Manfioletti G, Pentimalli F, et al. Highmobility group HMGI(Y) protein expression in humancolorectal hyperplastic and neoplastic diseases. Int JCancer 2001;91:147–51.
46. Rajeswari MR, Singh D, Jain A, Ray R. Elevatedlevels of high-mobility-group chromosomal proteins,
HMGA1, in murine skin carcinoma. Cancer Lett 2001;173:93–9.
47. Dolde CE, Mukherjee M, Cho C, Resar LM. HMG-I/Yin human breast cancer cell lines. Breast Cancer ResTreat 2002;71:181–9.
48. Leman ES, Madigan MC, Brunagel G, Takaha N,Coffey DS, Getzenberg RH. Nuclear matrix localizationof high mobility group protein I(Y) in a transgenicmouse model for prostate cancer. J Cell Biochem 2003;88:599–608.
49. Xu Y, Sumter TF, Bhattacharya R, et al. The HMG-Ioncogene causes highly penetrant, aggressive lymphoidmalignancy in transgenic mice and is overexpressed inhuman leukemia. Cancer Res 2004;64:3371–5.
50. Mateyak MK, Obaya AJ, Adachi S, Sedivy JM.Phenotypes of c-Myc-deficient rat fibroblasts isolatedby targeted homologous recombination. Cell GrowthDiffer 1997;8:1039–48.
51. Landay M, Oster SK, Khosravi F, et al. Promotion ofgrowth and apoptosis in c-myc nullizygous fibroblastsby other members of the myc oncoprotein family. CellDeath Differ 2000;7:697–705.
52. de Alboran IM, O’Hagan RC, Gartner F, et al. Analysisof C-MYC function in normal cells via conditional gene-targeted mutation. Immunity 2001;14:45–55.
53. Bush A, Mateyak M, Dugan K, et al. c-myc null cellsmisregulate cad and gadd45 but not other proposed c-Myc targets. Genes Dev 1998;12:3797–802.
54. Small J, Rottner K, Hahne P, Anderson KI. Visual-ising the actin cytoskeleton. Microsc Res Tech 1999;47:3–17.
55. Vafa O, Wade M, Kern S, et al. c-Myc caninduce DNA damage, increase reactive oxygenspecies, and mitigate p53 function: a mechanismfor oncogene-induced genetic instability. Mol Cell2002;9:1031–44.
56. Karlsson A, Deb-Basu D, Cherry A, Turner S, Ford J,Felsher DW. Defective double-strand DNA breakrepair and chromosomal translocations by MYCoverexpression. Proc Natl Acad Sci U S A 2003;100:9974–9.
57. Karlsson A, Giuriato S, Tang F, Fung-Weier J, Levan G,Felsher DW. Genomically complex lymphomas undergosustained tumor regression upon MYC inactivationunless they acquire novel chromosomal translocations.Blood 2003;101:2797–803.
58. Gomez-Roman N, Grandori C, Eisenman RN, WhiteRJ. Direct activation of RNA polymerase III transcrip-tion by c-Myc. Nature 2003;421:290–4.
59. Marhin WW, Chen S, Facchini LM, Fornace AJ Jr,Penn LZ. Myc represses the growth arrest gene gadd45.Oncogene 1997;14:2825–34.
60. Luo Q, Li J, Cenkci B, Kretzner L. Autorepression of c-myc requires both initiator and E2F-binding siteelements and cooperation with the p107 gene product.Oncogene 2004;23:1088–97.
61. Soucek L, Evan G. Myc—is this the oncogene fromhell? Cancer Cell 2002;1:406–8.
62. Mitchell KO, Ricci MS, Miyashita T, et al. Bax is atranscriptional target and mediator of c-myc-inducedapoptosis. Cancer Res 2000;60:6318–25.
Restoration of Multiple c-Myc Phenotypes
www.aacrjournals.org 2107 Cancer Res 2005; 65: (6). March 15, 2005
Research. on October 3, 2014. © 2005 American Association for Cancercancerres.aacrjournals.org Downloaded from
Copyright © 2022 FDOKUMEN