Myc Prevents Apoptosis and Enhances Endoreduplication Induced by Paclitaxel
15
Myc Prevents Apoptosis and Enhances Endoreduplication Induced by Paclitaxel Giuliana Gatti 1 , Giovanna Maresca 2 , Manuela Natoli 2 , Fulvio Florenzano 2 , Angelo Nicolin 1 , Armando Felsani 2,3 *, Igea D’Agnano 2 * 1 Department of Pharmacology, University of Milan, Milan, Italy, 2 CNR, Institute of Neurobiology and Molecular Medicine, European Brain Research Institute, S. Lucia Foundation, Rome, Italy, 3 Genomnia, Milan, Italy Abstract Background: The role of the MYC oncogene in the apoptotic pathways is not fully understood. MYC has been reported to protect cells from apoptosis activation but also to sensitize cells to apoptotic stimuli. We have previously demonstrated that the down-regulation of Myc protein activates apoptosis in melanoma cells and increases the susceptibility of cells to various antitumoral treatments. Beyond the well-known role in the G1RS transition, MYC is also involved in the G2-M cell cycle phases regulation. Methodology/Principal Findings: In this study we have investigated how MYC could influence cell survival signalling during G2 and M phases. We used the microtubules damaging agent paclitaxel (PTX), to arrest the cells in the M phase, in a p53 mutated melanoma cell line with modulated Myc level and activity. An overexpression of Myc protein is able to increase endoreduplication favoring the survival of cells exposed to antimitotic poisoning. The PTX-induced endoreduplication is associated in Myc overexpressing cells with a reduced expression of MAD2, essential component of the molecular core of the spindle assembly checkpoint (SAC), indicating an impairment of this checkpoint. In addition, for the first time we have localized Myc protein at the spindle poles (centrosomes) during pro-metaphase in different cell lines. Conclusions: The presence of Myc at the poles during the prometaphase could be necessary for the Myc-mediated attenuation of the SAC and the subsequent induction of endoreduplication. In addition, our data strongly suggest that the use of taxane in antitumor therapeutic strategies should be rationally based on the molecular profile of the individual tumor by specifically analyzing Myc expression levels. Citation: Gatti G, Maresca G, Natoli M, Florenzano F, Nicolin A, et al. (2009) Myc Prevents Apoptosis and Enhances Endoreduplication Induced by Paclitaxel. PLoS ONE 4(5): e5442. doi:10.1371/journal.pone.0005442 Editor: Ingemar T. Ernberg, Karolinska Institutet, Sweden Received July 23, 2008; Accepted March 22, 2009; Published May 6, 2009 Copyright: ß 2009 Gatti et al. This is an open-access article distributed under the terms of the Creative Commons Attribution License, which permits unrestricted use, distribution, and reproduction in any medium, provided the original author and source are credited. Funding: Partially supported by grants from Ministero della Salute (to ID), from European Union, EU FP6 Project LIINTOP Contract number LSHB-CT-2006-037499 and from Regione Lazio-Filas: Sviluppo della ricerca sul cervello. GM is recipient of a fellowship from Regione Lazio-Filas: Sviluppo della ricerca sul cervello. The funders had no role in study design, data collection and analysis, decision to publish, or preparation of the manuscript. Competing Interests: The authors have declared that no competing interests exist. * E-mail: [email protected] (AF); [email protected] (ID) Introduction The MYC oncogene is an extensively studied gene, implicated in various cellular processes including growth, proliferation, loss of differentiation and cell death. It has been widely ascertained that MYC gene encodes a transcription factor, which trans-activates many genes involved in the regulation of the cell cycle progression [1–4]. Although many reported on involvement of MYC in the apoptotic pathways, the mechanism of its action is not yet fully understood [5–8]. The ability of Myc to trigger apoptosis may represent a key to the control of tumor development. Apoptosis might be an intrinsic safety mechanism to limit the life of a cell with upregulated MYC expression, thus preventing further transformation. However, loss of this function through any additional mutation that prevents Myc from promoting apoptotic events will impact on cell survival. It strongly correlates with Myc expression to allow continued proliferation, mutation and cancer evolution of the affected clones. Even though under appropriate conditions Myc overexpression can lead to apoptosis [5,6,9], also the down-regulation of Myc can sensitize the cells to the induction of apoptosis [10–14]. Our group as well have previously demonstrated that the Myc down-regulation is able to activate apoptosis and to sensitize melanoma cells to different antineoplas- tic agents [15–17]. The activation of different cell cycle checkpoints in the various cell cycle compartments functions as mechanisms of cellular surveillance and protects cells from genomic instability and deleterious effects induced by genotoxic agents [18,19]. MYC overexpression influences cell cycle checkpoints, allowing some tumor cells to survive drug treatment and favoring the selection of a subpopulation with increased genomic instability and drug resistance or with a more aggressive tumor phenotype [5]. This effect has been attributed to the ability of MYC to induce DNA damage, promote gross chromosomal rearrangements, induce inappropriate cell cycle progression and impair DNA repair [20]. An alternative mechanism by which Myc can regulate prolifera- tion in normal cells and cause genomic instability in tumors has been suggested by Dalla Favera group in that Myc controls DNA replication in a non-transcriptional way [21]. Myc has also been recently recognized as an important regulator of ‘‘stemness’’ as it is PLoS ONE | www.plosone.org 1 May 2009 | Volume 4 | Issue 5 | e5442
Transcript of Myc Prevents Apoptosis and Enhances Endoreduplication Induced by Paclitaxel

Myc Prevents Apoptosis and EnhancesEndoreduplication Induced by PaclitaxelGiuliana Gatti1, Giovanna Maresca2, Manuela Natoli2, Fulvio Florenzano2, Angelo Nicolin1, Armando
Felsani2,3*, Igea D’Agnano2*
1 Department of Pharmacology, University of Milan, Milan, Italy, 2 CNR, Institute of Neurobiology and Molecular Medicine, European Brain Research Institute, S. Lucia
Foundation, Rome, Italy, 3 Genomnia, Milan, Italy
Abstract
Background: The role of the MYC oncogene in the apoptotic pathways is not fully understood. MYC has been reported toprotect cells from apoptosis activation but also to sensitize cells to apoptotic stimuli. We have previously demonstrated thatthe down-regulation of Myc protein activates apoptosis in melanoma cells and increases the susceptibility of cells to variousantitumoral treatments. Beyond the well-known role in the G1RS transition, MYC is also involved in the G2-M cell cyclephases regulation.
Methodology/Principal Findings: In this study we have investigated how MYC could influence cell survival signalling duringG2 and M phases. We used the microtubules damaging agent paclitaxel (PTX), to arrest the cells in the M phase, in a p53mutated melanoma cell line with modulated Myc level and activity. An overexpression of Myc protein is able to increaseendoreduplication favoring the survival of cells exposed to antimitotic poisoning. The PTX-induced endoreduplication isassociated in Myc overexpressing cells with a reduced expression of MAD2, essential component of the molecular core ofthe spindle assembly checkpoint (SAC), indicating an impairment of this checkpoint. In addition, for the first time we havelocalized Myc protein at the spindle poles (centrosomes) during pro-metaphase in different cell lines.
Conclusions: The presence of Myc at the poles during the prometaphase could be necessary for the Myc-mediatedattenuation of the SAC and the subsequent induction of endoreduplication. In addition, our data strongly suggest that theuse of taxane in antitumor therapeutic strategies should be rationally based on the molecular profile of the individual tumorby specifically analyzing Myc expression levels.
Citation: Gatti G, Maresca G, Natoli M, Florenzano F, Nicolin A, et al. (2009) Myc Prevents Apoptosis and Enhances Endoreduplication Induced by Paclitaxel. PLoSONE 4(5): e5442. doi:10.1371/journal.pone.0005442
Editor: Ingemar T. Ernberg, Karolinska Institutet, Sweden
Received July 23, 2008; Accepted March 22, 2009; Published May 6, 2009
Copyright: � 2009 Gatti et al. This is an open-access article distributed under the terms of the Creative Commons Attribution License, which permitsunrestricted use, distribution, and reproduction in any medium, provided the original author and source are credited.
Funding: Partially supported by grants from Ministero della Salute (to ID), from European Union, EU FP6 Project LIINTOP Contract number LSHB-CT-2006-037499and from Regione Lazio-Filas: Sviluppo della ricerca sul cervello. GM is recipient of a fellowship from Regione Lazio-Filas: Sviluppo della ricerca sul cervello. Thefunders had no role in study design, data collection and analysis, decision to publish, or preparation of the manuscript.
Competing Interests: The authors have declared that no competing interests exist.
* E-mail: [email protected] (AF); [email protected] (ID)
Introduction
The MYC oncogene is an extensively studied gene, implicated in
various cellular processes including growth, proliferation, loss of
differentiation and cell death. It has been widely ascertained that
MYC gene encodes a transcription factor, which trans-activates
many genes involved in the regulation of the cell cycle progression
[1–4]. Although many reported on involvement of MYC in the
apoptotic pathways, the mechanism of its action is not yet fully
understood [5–8]. The ability of Myc to trigger apoptosis may
represent a key to the control of tumor development. Apoptosis
might be an intrinsic safety mechanism to limit the life of a cell
with upregulated MYC expression, thus preventing further
transformation. However, loss of this function through any
additional mutation that prevents Myc from promoting apoptotic
events will impact on cell survival. It strongly correlates with Myc
expression to allow continued proliferation, mutation and cancer
evolution of the affected clones. Even though under appropriate
conditions Myc overexpression can lead to apoptosis [5,6,9], also
the down-regulation of Myc can sensitize the cells to the induction
of apoptosis [10–14]. Our group as well have previously
demonstrated that the Myc down-regulation is able to activate
apoptosis and to sensitize melanoma cells to different antineoplas-
tic agents [15–17].
The activation of different cell cycle checkpoints in the various
cell cycle compartments functions as mechanisms of cellular
surveillance and protects cells from genomic instability and
deleterious effects induced by genotoxic agents [18,19]. MYC
overexpression influences cell cycle checkpoints, allowing some
tumor cells to survive drug treatment and favoring the selection of
a subpopulation with increased genomic instability and drug
resistance or with a more aggressive tumor phenotype [5]. This
effect has been attributed to the ability of MYC to induce DNA
damage, promote gross chromosomal rearrangements, induce
inappropriate cell cycle progression and impair DNA repair [20].
An alternative mechanism by which Myc can regulate prolifera-
tion in normal cells and cause genomic instability in tumors has
been suggested by Dalla Favera group in that Myc controls DNA
replication in a non-transcriptional way [21]. Myc has also been
recently recognized as an important regulator of ‘‘stemness’’ as it is
PLoS ONE | www.plosone.org 1 May 2009 | Volume 4 | Issue 5 | e5442

able both to activate an embryonic stem cell-like transcriptional
module and, when ectopically expressed, to increase the cancer
stem cell fraction and enhance tumorigenicity [22,23]. In addition,
when Myc overexpressing cells are exposed to mitotic spindle
poisoning, rather than resulting in the typical G2-M arrest seen in
control cells, an aberrant round of DNA synthesis, without an
intervening mitosis (endoreduplication), occurs producing an
aneuploid state [24]. However, the exact mechanism through
which Myc mediates this response is only partially characterized.
Normal human fibroblasts stimulated with MYC traverse the G1
and S cell cycle phases and then arrest in the G2 phase becoming
frequently aneuploid probably because of endoreduplication [25].
It has been characterized a Myc domain which regulates G2 arrest
[26]. Some checkpoints monitor proper assembly of the mitotic
spindle and prevent abnormal segregation of chromosomes during
the metaphase to anaphase transition [27]. Myc oncoprotein
attenuates the spindle assembly checkpoint (SAC) specifically
activated by microtubules inhibitors and induces polyploid cells
[28]. In addition, in HeLa cells a-tubulin molecules bound Myc
protein, probably functioning as reservoir to sequester and release
the Myc protein [29].
The aim of this study was to investigate the potential role of
Myc in the survival signalling during G2 and M phases. We
hypothesized that by reducing Myc expression the cells may not
progress through M phase, arresting in the G2 phase and may
activate the apoptotic program. We used the taxane paclitaxel
(PTX) to block cells in the M phase and examined how the
modulation of Myc could influence activation of apoptotic
pathways in the G2 and M phases.
In order to distinguish the effective role of Myc from that
exerted by p53 in microtubules damaged cells we chose a cellular
model in which p53 is mutated and therefore unable to be
activated after damage. We showed that Myc overexpression is
able to reduce apoptosis and enhance endoreduplication induced
by PTX in the p53-mutated M14 melanoma cell line. In addition,
we localize Myc protein at the centrosomes during prometaphase.
The presence of Myc at the spindle poles during the prometaphase
could be necessary for the Myc-mediated attenuation of the SAC
and the subsequent induction of endoreduplication.
Materials and Methods
Cell cultures and transfectionsM14 human melanoma cell line (control cells) was cultured in
RPMI-1640 medium supplemented with 10% fetal calf serum
(Hyclone), L-glutamine (1%) and antibiotics at 37uC in a 5%
CO2/95% air atmosphere in a humidified incubator.
M14 cell clones stably expressing an ecdysone-inducible MYC
antisense mRNA were maintained in RPMI-1640, as above, in the
presence of both G418 (GIBCO) and Zeocyn (Invitrogen) [16].
Ponasterone A (Invitrogen) was used to induce the MYC AS RNA
transcription in pINDc-myc AS clone, with a dose of 20 mM every
24 h. The Myc down-regulated cells are called Myc(2) cells
throughout the paper.
Generation of stable MYC overexpressing cell clones (called
Myc(+) throughout the paper) was achieved by transfecting the
control M14 cell line with the pCDNA3-hMyc plasmid expressing
the full-length MYC coding sequence driven by the CMV
promoter. Forty-eight hours after transfection, the cells were
selected for 3 weeks in the presence of G418 (800 mg/mL).
C2C12 (American Type Culture Collection, CRL 1772) and
C2C12-Myc [30] cells were propagated in proliferation Dulbec-
co’s Modified Eagle’s Medium (DMEM, GIBCO) with 4,5 g/ml
of glucose, supplemented with 20% fetal calf serum (Hyclone),
20 mmol L-glutamine and antibiotics. The cultures were grown at
37uC under a humidified atmosphere of air with 5% CO2.
Caco2 cells (INSERM, Villejuif, France) were subcultured at
50% density in a 90% air/10% CO2 atmosphere in DMEM
containing 25 mM glucose, 3.7 g/L NaHCO3 and supplemented
with 4 mM L-glutamine, 1% non essential amino acids,
antibiotics, and 10% heat-inactivated foetal calf serum (Hyclone).
HeLa cells were subcultured in a 95% air/5% CO2 atmosphere
in DMEM containing 25 mM glucose, 3.7 g/L NaHCO3 and
supplemented with 2 mM L-glutamine, antibiotics, and 10% heat-
inactivated foetal calf serum (Hyclone).
TreatmentsTo arrest the cells in the mitotic compartment we used
paclitaxel (PTX). 16105 cells for each M14 cell line were seeded
in 12-wells plates. Twenty-four hours after seeding, the MYC AS
clone was induced with ponasterone; and after further 24 h all the
three M14 cell lines were exposed to PTX for 24 and 48 h. At
each time-point, cells were harvested and counted by using the
trypan blue dye exclusion test.
C2C12 cells, diluted (1:13) and plated the day before, were
treated for 15 h with PTX 100 nM. Cells were harvested, pooled
with the culture supernatant, washed once in PBS and fixed in
70% ethanol for cell cycle analysis.
To inhibit Myc expression we also used a siRNA technology.
The siRNA used were purchased from Qiagen: Hs_MYC_5
(#SI00300902), Hs_MYC_7 (#SI02662611), Hs_MYC_9
(#SI03101847), Hs_LOC731404_4 (#SI03528896) targeting
different areas of MYC mRNA and AllStars (#1027280), a
nonsilencing siRNA with no homology to any known mammalian
gene, as negative control.
For the transfection procedure, M14 control cells were seeded in
complete medium and 24 h after seeding cells were transfected
with siRNA using the HiPerFect Transfection Reagent (Qiagen),
according to the manufacturer’s instructions. Briefly, siRNAs were
incubated in serum-free medium with HiPerFect Transfection
Reagent for 10 min at room temperature. Subsequently, the
mixture was diluted with medium and added to each well. The
final concentration of each siRNAs in each well was 25 nM.
To inhibit Myc transcriptional activity we used the Max(77-85)
peptide previously validated [31] and synthesized by Cambridge
Peptides (Birmingham, UK). Twenty-four hours after seeding
Max(77-85) was added to the M14 control cells at the
concentration of 25 mM, giving this dose every 12 h. After 36 h
of exposure to the peptide cells were treated with PTX 30 nM for
24 h in the presence of the peptide.
qRT-PCRM14 control cells were seeded in complete medium and after
the different treatments cells were harvested and total RNA was
extracted with the SV Total RNA Isolation System (Promega),
including a DNase treatment before elution from the column.
RNA (0.5 mg) was reverse-transcribed for 50 min at 42uC in a 40-
mL reaction containing 200 ng of random hexamers (Amersham),
56 first-strand buffer (Invitrogen), 10 mM DTT, 0.25 mM
deoxynucleotides (0.25 mM each dATP, dGTP, dCTP, dTTP,
Invitrogen), 400 units of M-MLV RT (Invitrogen).
Equal amount of cDNA was taken for a subsequent quantitative
real-time PCR carried out using an Applied Biosystems 7900HT
Fast Real-Time PCR System instrument. Each PCR reaction
contained sense and antisense primers at a concentration of
200 nM and the relevant UPL probe (Universal Probe Library,
Roche) at a concentration of 100 nM in a final volume of 12 mL of
FastStart Universal Probe Master (ROX) Reaction Mix (Roche).
Myc Overexpression and Death
PLoS ONE | www.plosone.org 2 May 2009 | Volume 4 | Issue 5 | e5442

The following sense and anti-sense primers and the relevant
UPL probes were used: GAPDH (GenBank NM_002046.3)
AGCCACATCGCTCAGACA and GCCCAATACGACCAA-
ATCC, UPL probe #60; MYC (GenBank NM_002467.3)
TTTTTCGGGTAGTGGAAAACC and TTCCTGTTGGTG-
AAGCTAACG, UPL probe #75; INFG (GenBank NM_000619.2)
GGCATTTTGAAGAATTGGAAAG and TTTGGATGCTCT-
GGTCATCTT, UPL probe #21.
Apoptosis assaysApoptosis was monitored by annexin V binding, measuring the
mitochondrial membrane potential (DQ) and determining the
activation of caspase 3.
Cells were harvested, pooled with the supernatant, washed once in
PBS and processed for the different assays. Annexin V assay was
carried out using the Vybrant Apoptosis assay kit #2 (Invitrogen)
following the manufacturer’s protocol and samples analyzed by FACS.
For the measurement of the DQ the JC-1 staining was used [32].
After washing in PBS, cells were incubated with JC-1 2.5 mg/ml
for 20 min at room temperature, in the dark. After two washes in
PBS samples were immediately analyzed by FACS. As control, we
used a depolarized sample treated with ionophore Valynomicin for
further 15 min after JC-1 staining.
Caspase-3 activation was analyzed by the Enz-check kit
(Invitrogen) following manufacturer’s kit protocol.
Cell cycle analysisCell cycle analysis was performed by both propidium iodide (PI)
staining and pulse-chase bromodeoxyuridine (BrdU, Sigma)
incorporation as previously described [15].
For the BrdU pulse-chase experiments, a pulse of 10 mM BrdU
was added to the cell culture during the last 30 min before
harvesting. Afterwards, BrdU-free medium was added to the cell
culture and analysis performed every 2 h for further 24 h. Anti-
BrdU (BD Biosciences, Italy) and FITC-conjugated F(ab9)2 rabbit
anti-mouse IgG (DAKO) antibodies were used to detect the BrdU.
MPM-2 stainingMitotic cells were identified by staining with MPM-2, a mitosis
specific marker. Control, Myc(2) and Myc(+) cell lines were
exposed for increasing times (6, 12, 18, 24, 30, 42 h) to 30 nM
PTX. At each indicated time, cells were harvested, washed in PBS
and fixed overnight in 70% ethanol at 220uC. Cells were then
rehydrated in ice-cold PBS for 10 min and permeabilized in
medium plus 20% FCS and 0.5% Tween 20 for 10 min. The
samples were then incubated with anti-phospho-Ser/Thr-Pro/
MPM-2 conjugated with fluorescin-5-Ex,succinimidyl ester (Up-
state) in medium containing 20% FCS and 0.06% Tween 20 at
room temperature for 1 h. After three washes with PBS, cells were
stained overnight with 5 mg/ml PI and 75 KU/mL RNase in PBS.
Samples were then analyzed by FACS.
Accumulation of the cells in the G0/G1 phaseFor the G0/G1 phase arrest the control M14 cells were treated
with the antibiotic rapamycin (100 nM 24 h), which reduces cell
proliferation. Treatment with rapamycin was performed giving the
cells the dose before starting the PTX exposure.
Western blot analysisThe M14 control, Myc(2) and Myc(+) cells were treated with
PTX 30 nM for 8 h, time at which apoptosis was not yet evident
in order to avoid any interference with protein expression due to
cell death. Untreated and treated cells were incubated in UREA
buffer (8 M Urea, 100 mM NaH2PO4, 10 mM Tris pH 8), for
30 min on ice and then briefly sonicated. Proteins were subjected
to SDS–polyacrylamide gels electrophoresis. The resolved proteins
were blotted overnight to a nitrocellulose membrane, and the
membranes were blocked in PBS 16 containing 5% NFM (Non-
Fat Milk) for at least 1 h. Blots were then incubated with the
following primary anti-human antibodies, Santa Cruz Biotechnol-
ogy: anti-Myc polyclonal antibody (N262), anti-Myc monoclonal
antibody (9E10), anti-p-c-Myc polyclonal antibody (Thr58/Ser62),
anti-p-cdc2 polyclonal antibody (Tyr15), anti-cdc25C monoclonal
antibody (H-6), anti-mad2 polyclonal antibody (FL-205), anti-
Cyclin B1 polyclonal antibody (H-433), anti-p55 CDC polyclonal
antibody (H-175); Dako: anti-bcl-2 monoclonal antibody (clone
124); Calbiochem: anti-cdc2 polyclonal antibody (Ab1); Chemicon
International: anti-GAPDH monoclonal antibody (6C5), anti-
BUBR1 monoclonal antibody (8G1); Oncogene Research: anti-
HSP72/73 monoclonal antibody (Ab1). The relative amount of
transferred protein in a given sample was quantified by scanning
Xrays films and by estimating the relative arbitrary density units
using the ImageQuant software. Each sample was normalized to
the relative HSP 72/73, or GAPDH content and relative protein
amount was calculated by referring Myc(2) and Myc(+) to the
control untreated sample, and each treated sample to the
correspondent untreated cells.
To study the kinetics of cyclin B1 degradation in the presence of
PTX we analyzed cyclin B1 levels of expression in the M14
control, Myc(2) and Myc(+) cells at different times of PTX exposure
(0, 2, 4, 6, 8, 10, 12, 14, 16, 18, 20 h) by using the anti-Cyclin B1
polyclonal antibody (H-433; Santa Cruz Biotechnology).
Immunofluorescence analysis and uptake of thefluorescent peptide
M14 Myc(+) cells were seeded on coverglass supports in
complete medium. Cells fixed with methanol were permeabilized
in PBS containing 0.5% Tween 20 and blocked in 5% NFM. Myc
was detected using the anti-Myc antibody 9E10 from Santa Cruz
Biotechnology. Alexa Fluor 594 Goat anti-mouse was used as
secondary antibodies. Antibodies were diluted in PBS containing
2% BSA and 0.1% Tween 20 and washes were carried out in PBS
containing 0.3% BSA and 0.1% Tween 20 (washing buffer). Cells
were then re-blocked in PBS containing 5% NFM and then
incubated with the anti-a-Tubulin (DM 1A, Sigma) and with the
FITC-goat anti-mouse F(ab9)2 (Dako) antibody. After six washes
with washing buffer the nuclei were stained with 1 mg/ml DAPI
for 30 sec in PBS. Finally, cells were washed in PBS, briefly rinsed
in ddH2O and glasses were mounted in ProLong Gold anti-Fade
Reagent (Molecular Probes). Images were acquired through a
fluorescence microscope Olimpus BX51.
To study the localization of Myc at the spindle poles we used a
confocal laser scanning microscope (TCS SP5; Leica Microsystem,
Wetzlar, Germany). The spindle poles were visualized by using c-
tubulin which is widely employed as marker for microtubule
organizing centers [33]. The study was performed in four different
cell lines (M14, Caco2, C2C12-Myc, HeLa). The antibodies used
were: anti-Myc (monoclonal 9E10, polyclonal N262 and A14,
from Santa Cruz Biotechnology; monoclonal 3C7, Chemicon) and
anti c-tubulin (Santa Cruz Biotechnology). The secondary
antibodies were: Alexa Fluor 594 Goat anti-mouse IgG, Alexa
Fluor 555 Donkey anti-rabbit IgG and Alexa Fluor 488 Goat anti-
rabbit F(ab9)2 fragment antibodies. In order to avoid any possible
cross-talk between secondary antibodies we chose antibodies
generated in Donkey, a species known to show negligible
crossreactivity, or F(ab9)2 fragments. To exclude cross-talk
between the emission spectra of fluorophores we acquired confocal
Myc Overexpression and Death
PLoS ONE | www.plosone.org 3 May 2009 | Volume 4 | Issue 5 | e5442

images using the sequential acquisition modality. Brightness and
contrast of the acquired images were adjusted, and .tiff files of
separated and merged channels were exported using Leica
Application Suite 6000. Figures were generated using Adobe
Photoshop 7.0 and Adobe Illustrator 10.
To study the intracellular uptake and localization of the
fluorescent Max(77-85) peptide, M14 control cells were seeded
on m-slides 8 well (ibidi GmbH, Germany) in complete medium.
After 24 h the TRITC-conjugated Max(77-85) peptide was added
for 6 h in Optimem (Gibco). The medium was then replaced by
fresh peptide-free Optimem containing HOECHST 33342 (Sigma
Aldrich) at the concentration of 1 mg/ml and the cells were
immediately analyzed by confocal microscopy as described above.
Results
Myc overexpression prevents the inhibitory effectproduced by PTX in M14 melanoma cell proliferation
In this study we investigated the role of the MYC gene in the
survival signalling during G2 and M phases. As death activator in
such cell cycle phases we used the disruptor of microtubules PTX
that is known to arrest the cells in the mitotic phase. We used two
cell clones derived from the melanoma M14 cell line in which we
modulated the expression of Myc protein. To reduce the levels of
Myc expression, we employed the M14 pINDc-myc AS cell clone
stably expressing a hormone/inducible MYC antisense RNA
(named throughout this paper Myc(2) cells when treated with
ponasterone as indicated in Materials and Methods) that we
previously described [16]. We excluded that inducing antisense
RNA in M14 cells caused interferon (IFN) signalling by studying
the expression level of IFNc mRNA after ponasterone induction of
the MYC AS RNA (Figure S1). To overexpress Myc in the same
cell line, M14 cells were transfected with the pCDNA3-hMyc.
G418-resistant clones were isolated after a selection period of 3
weeks and their Myc expression levels were analyzed by Western
blotting (data not shown). Figure 1A shows Western blot analysis of
two out of ten of Myc overexpressing cell clones (clones 1 and 2).
These two clones show a Myc protein increment of about 3-fold.
In the figure are also shown the level of expression of Myc protein
in the Myc(2) cells. As previously reported, 48 h of ponasterone
exposure reduced the Myc level by more than 2-fold as compared
to the parental M14 cell line (control cells) [16].
To choose the optimal concentration of PTX to use in our
experiments we calculated the PTX IC50 value in control cells
using four different PTX doses (1, 10, 30 and 100 nM) (data not
shown). The PTX dose of 30 nM was chosen as optimal dose since
represents the IC50 in our experimental model. Figure 1B shows
the effect of 30 nM PTX on cell growth rate of the Myc(2) and of
the two Myc overexpressing clones compared to the control cell
line. PTX inhibits cell proliferation in control cells by about 70%
after 48 h of exposure. The PTX growth inhibitory effect was
enhanced in Myc(2) cells, achieving values of about 90%. On the
other hand, overexpression of Myc reduced the inhibitory effect
produced by PTX on cell growth with inhibition of about 40%,
indicating that Myc could play a central role in the survival
mechanisms of such cells. Since the two Myc overexpressing clones
showed similar levels of Myc and similar response to PTX in terms
of cell growth, we chose to use for further experiments only the
clone 1, referred throughout this paper as Myc(+) cells.
Myc overexpression prevents apoptosis induced bymicrotubules damage
High level of inhibition of Myc(2) cell growth produced by PTX
was consistent with the marked activation of apoptosis induced by
the drug. The measurement of apoptosis using Annexin V
(Figure 2A) revealed that in control cells the disruption of
microtubules by PTX induces a 21% cell death after 24 h of
exposure to the drug. Apoptosis increased up to about 43% when
Myc was down-regulated. Conversely, overexpression of Myc
reduced the PTX-induced cell death down to about 15.5%.
Figure 2B shows that PTX activated the death signaling via
mitochondria, as demonstrated by the measurement of the
mitochondrial membrane potential. Untreated and PTX-treated
cells were stained with the lipophilic cationic fluorescent probe JC-
1, which localizes into the mitochondria and reports the
mitochondrial membrane potential. The down-regulation of
Myc induced per se a depolarization of the mitochondrial
membrane, as shown by the decrease of DWm (0.5 vs 0.7 in
control cells), while overexpression of the oncoprotein did not alter
significantly the DWm (0.69 vs 0.7 in control cells). PTX treatment
decreased mitochondrial membrane potential by 21% in control
cells (DWm = 0.54) and by 60% in Myc(2) cells (DWm = 0.2),
indicating a synergism between PTX treatment and Myc
reduction. The Myc(+) cells exposed to PTX showed instead a
DWm very similar to the Myc(+) untreated cells (DWm = 0.6 vs 0.69
in untreated Myc(+) cells).
The depolarization effect shown in Myc(2) cells is consistent
with the activation in the same cells of caspase 3 after 24 h PTX
exposure (Figure 2C). We demonstrated the activation of caspase 3
in Myc down-regulated cells also using the siRNA methodology.
M14 control cells were transfected for 24 h with four distinct
siRNAs, targeting different areas of the MYC mRNA (siMyc5,
siMyc7, siMyc9, siMyc LOC). We first verified the efficacy of such
siRNAs on the expression of MYC mRNA as shown in Figure S2A.
The strongest inhibition was elicited by the siMyc LOC. siMyc5
and siMyc7 showed a good inhibitory effect, while siMyc9 did not
display any inhibitory activity. On the basis of the qRT-PCR
results we chose, for further experiments, the siMyc LOC. To
increase the efficacy of MYC silencing we also mixed the most
effective siRNAs (siMyc Mix). In Figure S2B is reported the
expression of MYC mRNA after silencing using siMyc Mix. As
negative control the AllStars siRNA was employed in each
experiment.
Treatment of M14 MYC silenced cells with PTX induced the
activation of caspase 3 after 24 h of exposure (Figure 2C).
Since PTX treatment induces phosphorylation of the anti-
apoptotic protein Bcl-2 [34], we analyzed Bcl-2 status by western
blot analysis. As expected, PTX induced Bcl-2 phosphorylation in
control cells. Such phosphorylation was still evident in Myc(2)
cells, even though the overall level of expression of Bcl-2 was
markedly reduced. By contrast, in Myc(+) cells the Bcl-2 was not
phosphorylated after PTX treatment and only a slight decrease in
its expression level was observed (Figure 2D).
Myc overexpression enhances the endoreduplicationprimed by PTX
To investigate the mechanism underlying the activation of
apoptosis during the G2 and M phases in Myc(2) cells we studied
distribution of control, Myc(2) and Myc(+) cells in the different cell
cycle compartments after exposure to PTX 30 nM for 24 h. PTX
arrested about 50% of the control cells in the G2/M phases. The
inhibition of Myc expression reduced the percentage of M14 cells
arrested in G2/M to 27%; while, overexpression of Myc resulted
in a more evident arrest in G2/M after PTX (62%, data not
shown). The Myc(2) cells, consistent with the reduced G2/M
accumulation after PTX treatment, showed a reduced cell
percentage in the .4N region (2% vs 14% in control cells, data
not shown). These data indicate that the higher activation of
Myc Overexpression and Death
PLoS ONE | www.plosone.org 4 May 2009 | Volume 4 | Issue 5 | e5442

apoptosis following PTX treatment in Myc(2) cells could be
associated with the prevention of PTX-induced endoreduplication.
PTX produces a non-complete arrest in mitosis. The cells which
adapt to the PTX-induced damage can escape this block entering
in a post-mitotic status G1-like [35], with an interphase
morphology and the ability to replicate, and hence duplicate
DNA (endoreduplication) reaching a DNA content .4N. To
clarify this point we performed a bromodeoxyuridine (BrdU)
pulse-chase experiment with the three cell lines treated or not with
PTX. After PTX treatment, cells were exposed to BrdU for a pulse
of 30 min. BrdU incorporation was monitored immediately at the
end of BrdU exposure and after 6 and 12 h. Figure 3A shows that
down-regulation of Myc prevented PTX-induced endoreduplica-
tion compared to control cells. This effect was evident at the end of
the PTX treatment (coincident with the end of the BrdU
incorporation) and was maintained for subsequent 6 and 12 h,
suggesting it was irreversible. By contrast, Myc(+) cells exhibited a
higher percentage of .4N cells compared to control cells.
To confirm that the down-regulation of Myc prevented PTX-
induced endoreduplication we also performed a BrdU incorpora-
tion experiment after silencing of the MYC mRNA in M14 cells.
Figure 3B demonstrates that two different siRNA MYC silencing
were able to block PTX-induced endoreduplication.
To demonstrate further that the inhibition of Myc avoids PTX-
induced endoreduplication, we blocked Myc transcriptional
activity using Max(77-85), as previously reported [31]. This
peptide interferes with Myc-Max heterodimerization, resulting in
impaired Myc transcriptional activity. A 48 h treatment of control
cells with the Max(77-85) peptide significantly inhibited the
transcription of two Myc target genes, nucleolin and ODC1,
without affecting expression level of Myc protein (data not shown).
Figure 3C shows that inhibition of the Myc-Max heterodimeriza-
tion prevented PTX-induced endoreduplication. As control
treatment we used a scrambled peptide sequence (see [31]), which
did not elicit any effect on the endoreplicative process primed by
PTX exposure. In conclusion, these data suggested that the Myc-
induced endoreduplication was dependent on Myc-Max hetero-
dimerization.
Next we investigated the endoreduplication process using the
non-tumoral mouse C2C12 cells (displaying barely detectable
levels of Myc) and C2C12-Myc, overexpressing the Myc protein
[30]. Figure 3D shows that, the PTX treatment elicited a relevant
percentage of endoreduplication in C2C12-Myc cells (about 30%)
as compared to parental C2C12 (about 2%). The PTX-induced
apoptosis was also significantly higher in the C2C12 cells (about
17%) compared to the C2C12-Myc cells (about 2%).
To exclude the possibility that the apoptotic threshold could be
lowered by the G0/G1 block produced by Myc down-regulation,
we examined activation of the apoptotic pathway in control cells
arrested in G0/G1 phase. To accumulate the cells in G0/G1 we
used the antibiotic rapamycin which is known to arrest cells in this
cell cycle compartment. Rapamycin, even accumulating the cells
in the G0/G1 phase (71.4%), did not increase the level of
apoptosis induced by PTX (Figure 4A). Interestingly, apoptosis was
slightly decreased in rapamycin-treated cells (about 13%) com-
pared to control cells (about 21% – see Figure 2A). Furthermore,
Figure 1. Reduced antiproliferative effect of PTX in Myc overexpressig M14 cells. (A) Levels of Myc protein in the Myc(2) and Mycoverexpressing clones as detected by Western blot analysis using anti-Myc N262 polyclonal antibody. Each lane was loaded with 70 mg of proteinsfrom cell lysate. HSP 72/73 was used as a loading control. The experiment was repeated three times showing similar results. A representative blot ispresented. (B) Cell growth curves of control, Myc(2) and Myc overexpressing clone 1 and 2 exposed to the PTX dose of 30 nM (o—o), untreated cells(¤--¤). Bars, standard deviation. Arrow indicates starting of PTX treatment.doi:10.1371/journal.pone.0005442.g001
Myc Overexpression and Death
PLoS ONE | www.plosone.org 5 May 2009 | Volume 4 | Issue 5 | e5442

Figure 2. Myc overexpression prevents apoptosis in melanoma cells. (A) Detection of apoptosis by Annexin V vs propidium iodide assay asevaluated by flow cytometry after 24 h of PTX exposure. The mean percentages6SD reported in each cytogram represent early apoptotic (upperleft), late apoptotic (upper right), necrotic (low right) and living (low left) cells. The cytograms reported are representative of three differentexperiments with similar results. (B) Mitochondrial membrane potential analyzed by JC-1 staining. DWm in untreated and PTX treated cells are shown.Valinomycin (Val) was used as positive control to detect depolarized mitochondrial membrane potential. Data are average of at least three separateexperiments. Bars represent standard deviation. (C) Caspase 3 activity evaluated by the Enz-check kit in control, Myc(2), Myc(+) and MYC silenced M14cells after 24 h exposure to PTX. Data are reported as percent increase vs untreated cells and are average of three separate experiments. Barsrepresent standard deviation. (D) Western blot analysis of bcl-2 protein expression in the three cell lines after PTX treatment. Each lane was loadedwith 40 mg of proteins from cell lysate. The experiment was repeated three times showing similar results. A representative blot is shown.doi:10.1371/journal.pone.0005442.g002
Myc Overexpression and Death
PLoS ONE | www.plosone.org 6 May 2009 | Volume 4 | Issue 5 | e5442
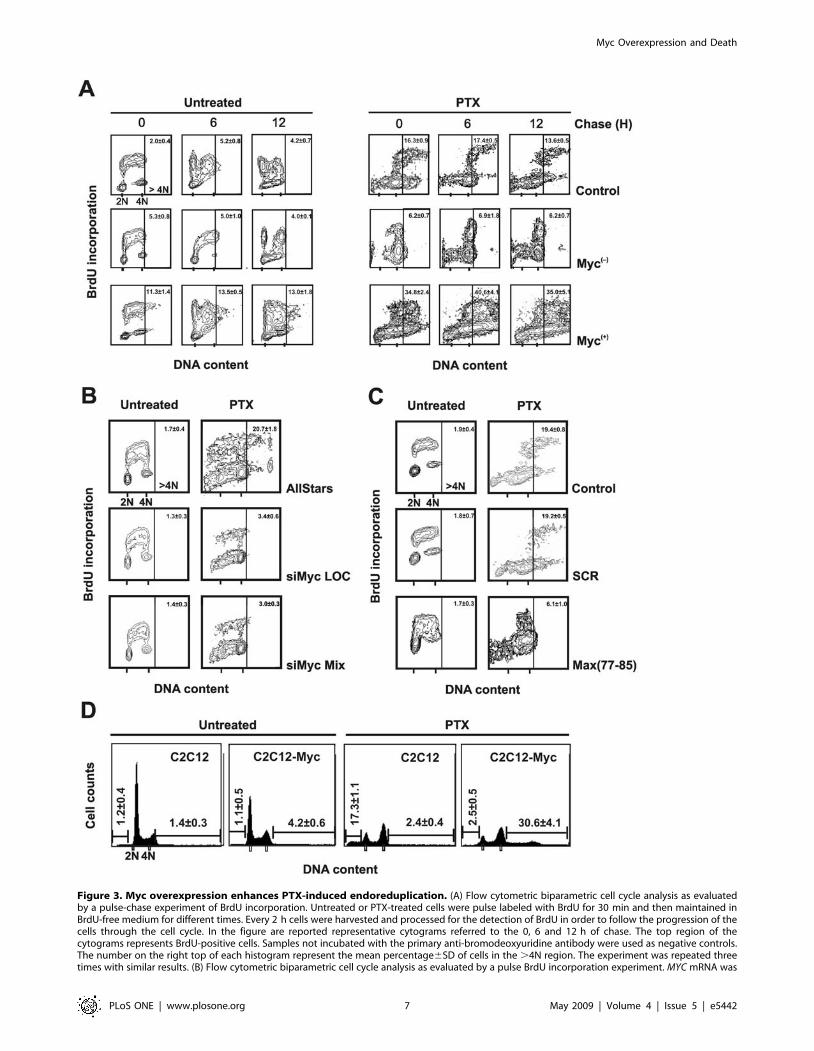
Figure 3. Myc overexpression enhances PTX-induced endoreduplication. (A) Flow cytometric biparametric cell cycle analysis as evaluatedby a pulse-chase experiment of BrdU incorporation. Untreated or PTX-treated cells were pulse labeled with BrdU for 30 min and then maintained inBrdU-free medium for different times. Every 2 h cells were harvested and processed for the detection of BrdU in order to follow the progression of thecells through the cell cycle. In the figure are reported representative cytograms referred to the 0, 6 and 12 h of chase. The top region of thecytograms represents BrdU-positive cells. Samples not incubated with the primary anti-bromodeoxyuridine antibody were used as negative controls.The number on the right top of each histogram represent the mean percentage6SD of cells in the .4N region. The experiment was repeated threetimes with similar results. (B) Flow cytometric biparametric cell cycle analysis as evaluated by a pulse BrdU incorporation experiment. MYC mRNA was
Myc Overexpression and Death
PLoS ONE | www.plosone.org 7 May 2009 | Volume 4 | Issue 5 | e5442

endoreduplication was not inhibited by the rapamycin-induced
G0/G1 block, further supporting the hypothesis that the down-
regulation of Myc may be directly responsible of the inhibition of
PTX-induced endoreduplication (Figure 4B).
Myc down-regulation prevents G2RM transitionTo measure cell entry from G2 phase into mitosis we used
MPM2 staining and FACS analysis to calculate the mitotic index.
The anti-MPM2 antibodies are a valuable tool for studying
regulation of mitotic events since it recognises a subset of mitosis-
specific phosphoproteins. Figure 5A shows that control and Myc(+)
cells transiently synchronized in M phase, 24 h after treatment
with PTX. After this transient mitotic delay, both control and
Myc(+) cells exited mitosis, as revealed by their decreased positivity
for the MPM2 antigen. The differences in the kinetics of mitotic
slippage between control and Myc(+) cells are more evident when
the values of MPM2 positivity were normalized to the percentages
of apoptotic cells measured in each sample (Figure S3). On the
contrary, only few Myc(2) cells showed a very slight increase of
positivity for MPM2 antigen up to 42 h of PTX treatment. It is
likely that the inhibition of Myc expression prevented these cells to
enter the M phase thus arresting them in the G2 phase. These
results are consistent with the block of endoreduplication observed
in BrdU pulse-chase experiments (see. Figure 3).
To further support these results we analyzed protein levels of
cyclin B1 as a measure of the G2RM transition in the presence of
PTX. In Figure 5B are reported the western blot analysis in
control, Myc(2) and Myc(+) cells of cyclin B1 evaluated at the
indicated time from PTX exposure. Consistent with the very low
mitotic index is the stabilization of cyclin B1 up to 20 h of PTX
exposure in the Myc down-regulated cells demonstrating that the
absence of Myc protein prevents the transition of the cells from the
G2 to the M phase. By contrast, both control and Myc(+) cells did
not show any relevant differences in the kinetics of cyclin B1
degradation up to 20 h of PTX exposure.
Next we examined in the three cell lines, with or without 24 h
treatment with PTX, the expression levels and phosphorylation
status of a number of proteins involved in the regulation of the G2
checkpoint (Figure 5C). The amount of Myc was distinctive of each
cell line, as expected, and decreased following PTX treatment.
PTX induced an increase of the phosphorylated Myc. All the lane
of p-Myc were normalized for the total amount of the Myc protein
in each cell line. Then the phosphorylation in all PTX-treated cells
were compared to the control treated cells. Myc(2) cells show a
higher level of Myc phosphorylation than the control cells and this
is associated with absence of endoreduplication (see Figure 3).
Conversely, in the Myc(+) cells, showing a higher level of
endoreduplication, the amount of Myc present in PTX-treated
cells is scarcely phosphorylated. We consider the level of Myc
phosphorylation inversely proportional to the ability of the cells to
endoreduplicate, bypassing the mitotic PTX-induced arrest.
The level of cyclin B1 increased in all the three cell lines after
PTX exposure. The amount of cdc2 decreased in Myc(2) cells and
instead did not change in Myc(+) cells compared to control cells.
cdc2 level in Myc(2) cells was increased about 2-fold in PTX
treatment, while it was not affected in control and Myc(+) cells.
The phosphorylation status of cdc2 in control cells increased 1.5-
fold after PTX treatment, indicating a reduction of the kinase
activity induced by microtubule damage. By contrast, in Myc(+)
cells cdc2 did not appear to be phosphorylated after PTX
treatment, supporting the hypothesis that Myc overexpression may
allow bypassing the PTX-mediated arrest in mitosis, thus
increasing the amount of endoreduplication. After PTX treatment,
in the control and Myc(2) cells the phosphorylation status of the
mitosis-inducing phosphatase Cdc25C and of cdc2 increased
together, while in the Myc(+) cells the very low level of cdc25C
phosphorylation correspond to a very low cdc2 phosphorylation.
A quantitative densitometric analysis of the amount of the
specific protein analyzed in each sample was performed for each
blot and the results are reported in the Figure S4A.
Myc localizes at the spindle poles in prometaphaseTo investigate the status of the mitotic spindle assembly
checkpoint (SAC) we initially studied the expression level of some
protein involved in the regulation of this checkpoint. In Figure 6A
is reported the western blotting of three proteins which monitor
the SAC. Expression level of the MAD2 protein follows the levels
of Myc, increasing when Myc is overexpressed and decreasing,
instead, with the Myc down-regulation, confirming that Myc
regulates the transcription of MAD2. Following PTX treatment
MAD2 increased in control cells and slight increased in Myc(2)
cells, indicating that it may be necessary for the PTX-induced
activation of the SAC. Conversely, MAD2 decreased significa-
tively in the Myc(+) cells treated with PTX, suggesting that the
overexpression of Myc may weaken the mitotic checkpoint. As for
MAD2 the expression level of BubR1 decreases in Myc down-
regulated cells, while it increases when Myc is up-regulated.
Conversely, it does not significantly change after PTX in all the
three cell lines. p55 CDC, homologous of the yeast Cdc20, was
found decreased in the Myc down-regulated cells. A statistical
densitometric analysis for each blot presented in Figure 5C is
reported in the Figure S4B.
To go insight the involvement of Myc in the SAC we studied the
Myc intracellular localization during the mitotic process. Figure 6B
shows Myc protein localization in Myc(+) cells at three subsequent
phases during mitosis. During the prophase Myc immunofluores-
cence appeared distributed in subnuclear domains in a number of
intensely fluorescent spots which tended to aggregate, during the
subsequent prometaphase the immunofluorescence intensity
decreased throughout the nucleus with the exception of the
spindle poles, and finally faded away during the anaphase.
Figure 6C show the selective localization of Myc at the centrosome
silenced using two different siRNAs in M14 cells for 24 h and then exposed to PTX for further 24 h. As control we used the AllStars siRNA (seeMaterials and methods for details). During the last 30 min of PTX treatment, BrdU was added to the medium. After the pulse labeling the cells wereharvested and fixed in ethanol 70% for further processing. In the figure are reported representative cytograms for each treatment. The number on theright top of each histogram represent the mean percentage6SD of cells in the .4N region. The experiment was repeated three times with similarresults. (C) Flow cytometric biparametric cell cycle analysis as evaluated by a pulse BrdU incorporation experiment. M14 control cells were exposedfor 48 h to the Max(77-85) peptide and to the scrambled (SCR) peptide used as control. After 24 h of peptides treatment the cells were exposed toPTX for additional 24 h. During the last 30 min of treatment, BrdU was added to the medium of untreated and PTX-treated cells. After the pulselabeling the cells were harvested and fixed in ethanol 70% for further processing. In the figure are reported representative cytograms for eachtreatment. The number on the right top of each histogram represent the mean percentage6SD of cells in the .4N region. The experiment wasrepeated three times with similar results. (D) DNA content profiles in C2C12 and C2C12-Myc cell lines treated or not with PTX. The numbers reportedon the left and on the right of each histograms represents the mean percentage6SD of hypodiploid and of .4N cells, respectively. The experimentwas repeated three times with similar results.doi:10.1371/journal.pone.0005442.g003
Myc Overexpression and Death
PLoS ONE | www.plosone.org 8 May 2009 | Volume 4 | Issue 5 | e5442
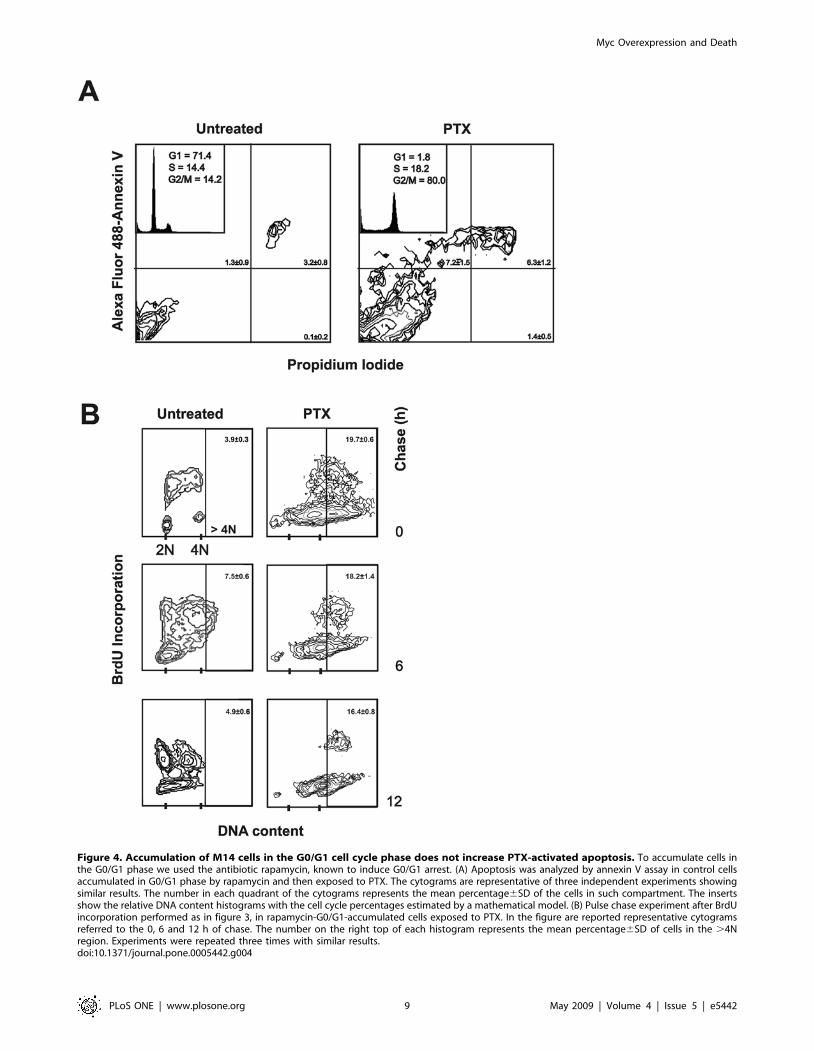
Figure 4. Accumulation of M14 cells in the G0/G1 cell cycle phase does not increase PTX-activated apoptosis. To accumulate cells inthe G0/G1 phase we used the antibiotic rapamycin, known to induce G0/G1 arrest. (A) Apoptosis was analyzed by annexin V assay in control cellsaccumulated in G0/G1 phase by rapamycin and then exposed to PTX. The cytograms are representative of three independent experiments showingsimilar results. The number in each quadrant of the cytograms represents the mean percentage6SD of the cells in such compartment. The insertsshow the relative DNA content histograms with the cell cycle percentages estimated by a mathematical model. (B) Pulse chase experiment after BrdUincorporation performed as in figure 3, in rapamycin-G0/G1-accumulated cells exposed to PTX. In the figure are reported representative cytogramsreferred to the 0, 6 and 12 h of chase. The number on the right top of each histogram represents the mean percentage6SD of cells in the .4Nregion. Experiments were repeated three times with similar results.doi:10.1371/journal.pone.0005442.g004
Myc Overexpression and Death
PLoS ONE | www.plosone.org 9 May 2009 | Volume 4 | Issue 5 | e5442

during the prometaphase in different cell lines (M14, Caco2,
C2C12-Myc and HeLa). We verified that co-localization of Myc
with c-tubulin occurred only during the prometaphase (data not
shown). The prometaphase-specific localization of Myc at the
centrosome suggests a direct role of Myc in the mechanism
controlling the endoreduplication. The same prometaphase-
specific localization of Myc was observed also, even if more
faintly, in the M14 control and Myc(2) cells (data not shown).
The prometaphase specific localization of Myc was visible using
both the 9E10 (see Figure 6B and C) and the A14 (data not shown)
antibodies, but not the N262 and the 3C7 antibodies (Figure S5).
Since the 9E10 and A14 antibodies both recognized the C-
terminal domain of the Myc protein while the N262 and the 3C7
are directed versus the N-terminus of the protein, the most feasible
explanation is that Myc may interacts through its N-terminus with
an unknown protein of the centrosome. This hypothesis is
explained in the scheme of the Myc protein reported in Figure S6.
Next we examined the prometaphase-specific Myc localization
by using a non-immunologic technique. For this purpose we
studied the intracellular distribution of TRITC-conjugated
Max(77-85) and SCR peptides, described above [31]. Control
cells were incubated for 6 h with the fluorescent peptides and
immediately analyzed by confocal microscopy. Figure 6D shows
the intracellular distribution of the Max(77-85) and the SCR
fluorescent peptides. The Max(77-85) peptide, which specifically
binds Myc protein, during the prometaphase was visibly
concentrated at a position which strongly reminded the two
spindle poles, while the control fluorescent SCR signal was diffuse
in the cytoplasm.
Discussion
In this study we demonstrate that the activity of Myc reduces
the PTX-induced apoptosis and enhances the endoreduplication
primed by the disruption of microtubules. We have used three
different strategies to modulate negatively Myc activity in our
cellular model, the melanoma derived M14 cell line. First we used
a cell clone in which the expression of Myc is down-regulated by
an inducible MYC anti-sense RNA using the Drosophila hormone
ecdysone [16]. Secondly we silenced MYC mRNA in M14 cells by
using siRNA directed to MYC mRNA. The third approach was to
inhibit Myc transcriptional activity with the Max(77-85) peptide
Figure 5. Myc down-regulation prevents cell entry into M phase. (A) Mitotic index as estimated by MPM2 positivity evaluated by flowcytometry. Cells were exposed to PTX for the indicated times and then harvested and processed for MPM2 immunofluorescence. Samples notincubated with the primary anti-MPM-2 antibody were used as negative controls. Percentages of MPM-2 positive cells were estimated by setting amarker on the control untreated cells in each MPM-2/DNA content cytogram and calculated by the method of 2–5% of background. Data are averageof three different experiments with similar results (bars, SD). e = control, * = Myc(+), &= Myc(2). (B) Western blot analysis of cyclin B1 in the three M14cell lines at the indicated time after PTX exposure. Each lane was loaded with 40 mg of proteins from cell lysates. The experiment was repeated threetimes showing similar results. A representative blot for each protein is reported. (C) Western blot analysis of the indicated protein in the three celllines with or without 8 h exposure to PTX. Each lane was loaded with 80 mg of proteins from cell lysates. The relative amount of transferred protein ina given sample was quantified by estimating the relative arbitrary density units normalized to GAPDH content. In this blot Myc protein was detectedby the monoclonal antibody 9E10. The experiment was repeated three times showing similar results. A representative blot for each protein isreported.doi:10.1371/journal.pone.0005442.g005
Myc Overexpression and Death
PLoS ONE | www.plosone.org 10 May 2009 | Volume 4 | Issue 5 | e5442
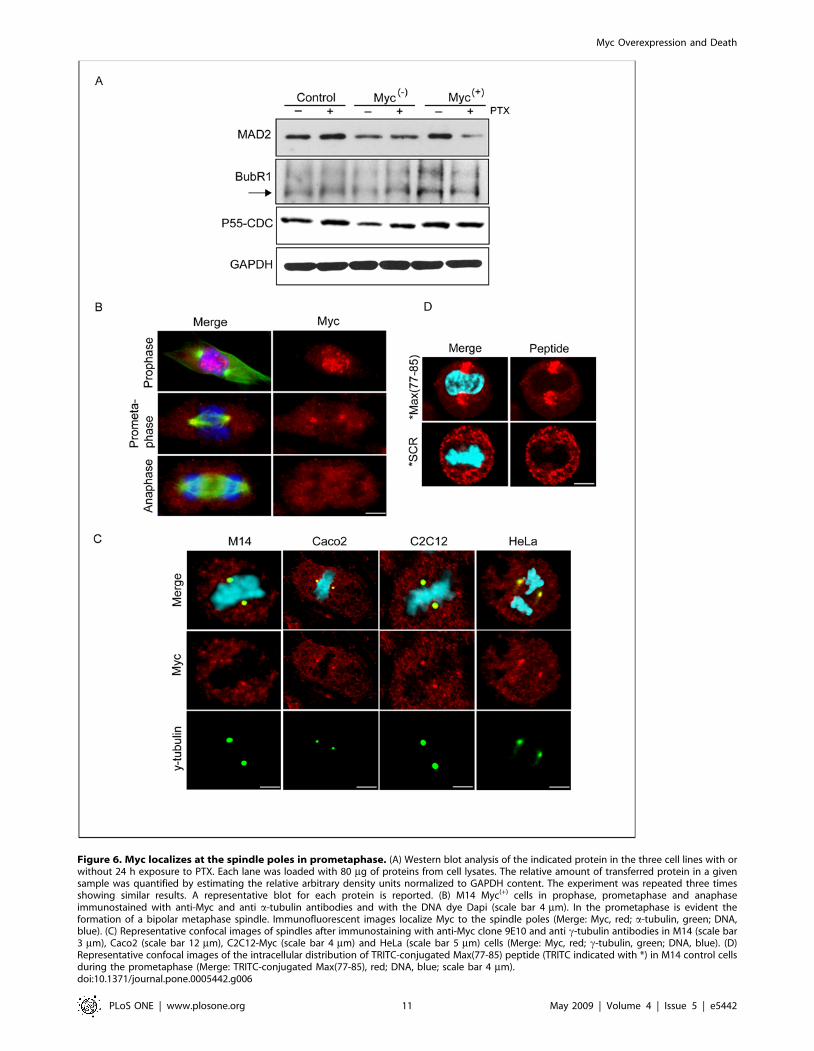
Figure 6. Myc localizes at the spindle poles in prometaphase. (A) Western blot analysis of the indicated protein in the three cell lines with orwithout 24 h exposure to PTX. Each lane was loaded with 80 mg of proteins from cell lysates. The relative amount of transferred protein in a givensample was quantified by estimating the relative arbitrary density units normalized to GAPDH content. The experiment was repeated three timesshowing similar results. A representative blot for each protein is reported. (B) M14 Myc(+) cells in prophase, prometaphase and anaphaseimmunostained with anti-Myc and anti a-tubulin antibodies and with the DNA dye Dapi (scale bar 4 mm). In the prometaphase is evident theformation of a bipolar metaphase spindle. Immunofluorescent images localize Myc to the spindle poles (Merge: Myc, red; a-tubulin, green; DNA,blue). (C) Representative confocal images of spindles after immunostaining with anti-Myc clone 9E10 and anti c-tubulin antibodies in M14 (scale bar3 mm), Caco2 (scale bar 12 mm), C2C12-Myc (scale bar 4 mm) and HeLa (scale bar 5 mm) cells (Merge: Myc, red; c-tubulin, green; DNA, blue). (D)Representative confocal images of the intracellular distribution of TRITC-conjugated Max(77-85) peptide (TRITC indicated with *) in M14 control cellsduring the prometaphase (Merge: TRITC-conjugated Max(77-85), red; DNA, blue; scale bar 4 mm).doi:10.1371/journal.pone.0005442.g006
Myc Overexpression and Death
PLoS ONE | www.plosone.org 11 May 2009 | Volume 4 | Issue 5 | e5442
that blocks Myc-Max heterodimerization reducing the activity of
promoters activated by Myc and decreasing the expression of Myc
gene targets [31]. Inhibition of Myc transcriptional activity using
these peptides without significantly altering the expression level of
the oncoprotein, allowed us to separate effects of Myc that are not
dependent on its transcriptional activity.
To simulate a Myc overexpression status, we selected M14
clones that stably express 3-fold higher level of Myc protein than
the parental cell line.
Here we have focused on the role of MYC gene in the survival
signaling during the G2 and M phases. To activate apoptosis in
these phases of cell cycle, we used PTX, a drug that induces
suppression of spindle microtubule dynamics and inhibits mitosis
occurrence [35]. We show that Myc overexpression protects cells
from PTX-induced apoptosis and enhances endoreduplication
primed by PTX. We have previously reported that the down-
regulation of Myc in melanoma cells is able to activate apoptosis
[16] and to increase the apoptotic response to a variety of
anticancer treatments including cis-platin [36], c-irradiation [15],
melphalan [17], thus enhancing their antitumoral effect. Also
Chow and colleagues [13] reported that the down-regulation of
Myc determines the sensitivity of acute myeloid leukemia to the 2-
Methoxyestradiol which displays antitumoral activity. Our data
are also in agreement with Zhang and colleagues [11] who
demonstrated that Myc down-regulation sensitize medulloblasto-
ma cells to resveratrol-induced apoptosis. On the other hand,
Evan and his colleagues have repeatedly demonstrated that MYC
gene overexpression enhances apoptosis upon survival factors
deprivation [5,6,9]. Also Sheen et al. [37] demonstrated that
ectopic overexpression of MYC sensitizes normal human mam-
mary epithelial cells to c-irradiation-induced apoptosis, even
though they observed an attenuation of the mitotic checkpoint.
It is important to note that substantial differences exist between the
cellular model utilized by Sheen and colleagues and the melanoma
model used by us as in our melanoma model, p53 is mutated [15].
Since it has been demonstrated that MYC gene is negatively
regulated by p53 [38,39] we deliberately chose a p53-mutated cell
line in order to study the effective activity of Myc on cell survival
avoiding the involvement of the tumor suppressor protein, p53
that is widely known to activate apoptotic cell death. Adhikary and
Eilers [2] reviewed two main distinct pathways through which
Myc can induce apoptosis either in a p53-dependent or -
independent manner. The first consists in Myc induction of the
expression of p19ARF which stabilizes p53 [40,41], and the
second in the promotion by Myc of the cytochrome C release from
mitochondria in a p53-independent manner [42]. The latter
pathway is partly mediated by the BH3-only protein Bim, which is
also induced by Myc [43]. However, both p19ARF and Bim are
not direct target of Myc and their mechanism of activation has not
completely clarified [44]. On the other hand, an exogenous
expression of Myc promotes proliferative activity of the cells and
confers them a survival advantage. As support to this conclusion is
the measurement of the cell cycle phase’s length of the three cell
lines, obtained by BrdU pulse-chase experiments: Myc(+) cells
show a shorter cell cycle length (13 h) than the control (16 h),
while the Myc(2) cells have a very prolonged cell cycle duration
(26 h) (data not shown).
We also show that treatment with rapamycin, which is known to
arrest cells in G0/G1 did not increase apoptosis after PTX
exposure. It may have rather a preventive effect demonstrating
that is not the arrest in G0/G1 which favors the activation of
apoptosis. These findings further support the hypothesis that the
inhibition of Myc protein may be directly responsible for the
enhancement of PTX-induced apoptosis.
The cellular response to PTX includes besides cell death
another remarkable phenotype, which is the DNA endoreduplica-
tion of arrested mitotic cells. Our results support the idea that the
overexpression of Myc may cause a weakening of the spindle
checkpoint, explaining the marked increase in endoreduplication
observed in Myc(+) cells exposed to PTX. We hypothesized that
Myc down-regulation could allow restoring the mitotic checkpoint
preventing aberrant mitoses. Indeed, either the decrease of Myc
expression or the inhibition of Myc-Max heterodimerization
impairs PTX-induced endoreduplication. This is in agreement
with Zanet and colleagues [45], who demonstrated that the
suppression of Myc activity in epidermis impaired the keratino-
cytes endoreduplication required for the cell enlargement that
occurs during normal post-mitotic differentiation.
Many tumor cells have only partially functional cell cycle
checkpoints, which may influence the cytotoxic effect of antitumor
drugs. This effect may be either p53 dependent or p53
independent [46]. In tumor cells that frequently have nonfunc-
tional p53, DNA- or microtubules-damage principally leads to cell
cycle arrest in the M phase due to prevention of the activation of
the master mitotic kinase Cdk1/Cdc2 [47,48]. Cells are effectively
arrested in prometaphase and a molecular device, the spindle
assembly checkpoint (SAC), whose components localize at
kinetochores, function as a ‘‘proofreading network’’ by creating
a diffusible signal indispensable to delay anaphase progression thus
ensuring the prevention of aberrant mitosis. The diffusible signal
operated by the SAC consists of two main molecules, BubR1
(costitutively bound to Bub3) and MAD2 that together forms the
mitotic checkpoint complex, the critical effector of the SAC. This
complex binds and inhibits another protein, p55 CDC (eukaryotic
homologue of the yeast cdc20). p55 CDC is the essential activator
of the anaphase-promoting complex (APC), an E3-ubiquitin ligase,
that finally targets, for degradation by the proteasome, cyclin B
and other proteins that need to be degraded at the right time to
allow the cells to proceed to anaphase [49]. Our data show that
the M14 control cells possess a functioning SAC since MAD2 level
increases after PTX treatment and only few cells escape the
mitotic arrest produced by the PTX activity. According to data
reported by Menssen and colleagues [50] who demonstrated that
MAD2 is transcriptionally regulated by Myc, in our model MAD2
expression levels increased when Myc was up-regulated, converse-
ly a reduced expression of MAD2 was obtained in Myc(2) cells.
Consistently with the hypothesis that the up-regulation of Myc
could interfere with the SAC function, MAD2 expression
decreased in Myc(+) cells exposed to PTX. Wassmann and
colleagues have reported that MAD2 protein is highly phosphor-
ylated when cells escape from nocodazole-induced checkpoint
arrest reducing its level of expression [51]. The decreased
expression of MAD2 found in Myc(+) cells after PTX treatment
could be ascribed to the MAD2 phosphorylation which occurs in
the cells which escape PTX-induced checkpoint arrest. On the
other hand, MAD2 level does not significantly change in Myc(2)
cells after PTX exposure. This is likely due to the arrest of the cells
in the G2 phase, which probably prevents the activation of the
SAC. This conclusion is supported by the analysis of the mitotic
index evaluated by MPM2 FACS positivity and by the kinetics of
cyclin B1 degradation during PTX exposure; in fact Myc(2) cells
show a low mitotic index after PTX exposure, which instead is
higher in control and Myc(+) cells. These data are consistent with
stabilization of cyclin B1 during PTX exposure, further demon-
strating that the Myc(2) cells do not underwent the mitotic slippage
which occurs during PTX treatment.
Importantly we show for the first time that Myc localizes at the
spindle poles during the prometaphase. This selective localization
Myc Overexpression and Death
PLoS ONE | www.plosone.org 12 May 2009 | Volume 4 | Issue 5 | e5442

have been observed in four different tissue-derived cell lines
implying that spindle poles localization is a conserved mechanism.
The selective localization in the prometaphase stage confirmed in
four different cell lines strongly suggest the possibility of a
functional binding to an unknown protein. In addition, this
localization is only detected using antibodies that recognize the C-
terminal domain of Myc protein, indicating that its binding to the
spindle pole structures occurs through the N-terminal domain to a
still unidentified protein. One possibility is that Myc could bind the
microtubules and the a-tubulin. Interestingly, Alexandrova and
colleagues [29] have demonstrated that the N-terminal domain of
Myc associates with the a-tubulin molecule and microtubules. It is
known that the Myc-a-tubulin interaction is disrupted during
mitosis by a specific phosphorylation of Myc at Thr-58, suggesting
that the loss of such interaction at mitosis may be a physiological
requirement for cell division [52]. We hypothesize that the
presence of Myc at the centrosomes during the prometaphase
could be necessary for the Myc-mediated attenuation of the SAC
and the subsequent induction of endoreduplication. This hypoth-
esis is schematized in Figure 7.
In addition, our data strongly suggest that the use of taxane in
antitumor therapeutic strategies should be rationally based on the
molecular profile of the individual tumor by specifically analyzing
Myc expression levels.
Supporting Information
Figure S1 MYC antisense RNA does not induce INFcexpression. Quantitative RT-PCR analysis of IFNc mRNA levels
in the control, Myc(2), after induction of MYC AS RNA, and Myc
overexpressing cells. The amounts of IFNc mRNA were
normalized to the GAPDH housekeeping gene. Data are reported
as mRNA quantification relative to control cells and are average of
three separate experiments. Bars represent standard deviation.
Found at: doi:10.1371/journal.pone.0005442.s001 (0.61 MB TIF)
Figure S2 Efficacy of different siRNAs on MYC mRNA
expression in M14 cells. (A) Quantitative RT-PCR analysis of
MYC mRNA levels in the control cells transfected for 24 h with a
dose of 25 nM of four distinct siRNAs (siMyc5, siMyc7, siMyc9,
siMycLOC). The amounts of MYC mRNA were normalized to the
GAPDH housekeeping gene. Data are reported as mRNA
quantification relative to control cells transfected with the negative
control AllStars siRNA and are average of three separate
experiments. Bars represent standard deviation. (B) Quantitative
RT-PCR analysis of MYC mRNA levels in the control cells
transfected for 24 h with a mix of siMyc5, siMyc7 and siMycLOC
(siMyc Mix), at the total dose of 25 nM. The amounts of MYC
mRNA were normalized to the GAPDH housekeeping gene. Data
are reported as mRNA quantification relative to control cells
transfected with the negative control AllStars siRNA and are average
of three separate experiments. Bars represent standard deviation.
Found at: doi:10.1371/journal.pone.0005442.s002 (0.38 MB TIF)
Figure S3 Mitotic index values normalized on the fraction of
apoptosis. The histograms show the mitotic index values measured
24 h after PTX exposure in the three cell lines normalized to the
relative percentages of apoptosis (evaluated by annexin-V assay) at
the same time of treatment. Data are average of three different
experiments (bars, SD).
Found at: doi:10.1371/journal.pone.0005442.s003 (0.43 MB TIF)
Figure S4 Densitometric analysis of Western Blots. (A) The
histograms show the relative quantification analysis of the
indicated proteins in figure 5C by estimating the arbitrary density
units normalized against the corresponding loading control
content. Data are reported as relative protein amount and are
average of two or three separate experiments. Bars represent
standard deviation. 1 = Control; 2 = Control+PTX; 3 = Myc(2);
4 = Myc(2)+PTX; 5 = Myc(+); 6 = Myc(+)+PTX. (B) The histograms
show the relative quantification analysis of the indicated proteins
in figure 6A by estimating the arbitrary density units normalized
Figure 7. Model of the hypothetical role of Myc in the survival signaling of cells after microtubules stabilization induced by PTX inG2 and M phases. Overexpression of Myc impairs the mitotic checkpoint, promoting endoreduplication. We hypothesize that this activity displayedby Myc is manifested by the localization of Myc at spindle poles during the prometaphase. Conversely, the Myc down-regulated cells (Myc(2)), afterPTX treatment, are blocked by the checkpoint and undergo apoptosis preventing endoreduplication.doi:10.1371/journal.pone.0005442.g007
Myc Overexpression and Death
PLoS ONE | www.plosone.org 13 May 2009 | Volume 4 | Issue 5 | e5442

against the corresponding loading control content. Data are
reported as relative protein amount and are average of two or
three separate experiments. Bars represent standard deviation.
1 = Control; 2 = Control+PTX; 3 = Myc(2); 4 = Myc(2)+PTX;
5 = Myc(+); 6 = Myc(+)+PTX.
Found at: doi:10.1371/journal.pone.0005442.s004 (0.02 MB
PDF)
Figure S5 Myc protein localization. Immunofluorecence images
of HeLa cells immunostained with anti-myc antibodies recogniz-
ing the N-terminal domain of Myc protein. Merged: Myc, red; c-
tubulin, Green; DNA, blue (scale bar 4 mm).
Found at: doi:10.1371/journal.pone.0005442.s005 (0.69 MB TIF)
Figure S6 Scheme of Myc domains. The scheme reported draws
the exact epitopes of each anti-Myc antibody (monoclonal 9E10
and polyclonal A14 directed versus the C-terminal domain;
polyclonal N262 and monoclonal 3C7, directed versus the N-
terminal domain) used in the immunofluorescence experiments.
The numbers represent the sequence position of aminoacids. Myc-
Box domains are: I, II, III. BR, Basic Region. HLH, Helix-Loop-
Helix. LZ, Leucine Zipper.
Found at: doi:10.1371/journal.pone.0005442.s006 (0.41 MB TIF)
Acknowledgments
We thank Flavia Zucco for her continuous and great support during this
work; Marek Michalak for critical reading of the manuscript
Author Contributions
Conceived and designed the experiments: ID. Performed the experiments:
GG GM MN FF ID. Analyzed the data: GG FF ID. Contributed reagents/
materials/analysis tools: AN AF ID. Wrote the paper: ID.
References
1. Amati B, Alevizopoulos K, Vlach J (1998) Myc and the cell cycle. Front Biosci 3:d250–d268.
2. Adhikary S, Eilers M (2005) Transcriptional regulation and transformation by
Myc proteins. Nat Rev Mol Cell Biol 6: 635–645.
3. Hanson KD, Shichiri M, Follansbee MR, Sedivy JM (1994) Effects of c-myc
expression on cell cycle progression. Mol Cell Biol 14: 5748–5755.
4. Ryan KM, Birnie GD (1996) Myc oncogenes: the enigmatic family. Biochem J314: 713–721.
5. Pelengaris S, Khan M, Evan G (2002) c-MYC: more than just a matter of life
and death. Nat Rev Cancer 2: 764–776.
6. Evan GI, Wyllie AH, Gilbert CS, Littlewood TD, Land H, et al. (1992)
Induction of apoptosis in fibroblasts by c-myc protein. Cell 69: 119–128.
7. Nesbit CE, Tersak JM, Grove LE, Drzal A, Choi H, et al. (2000) Geneticdissection of c-myc apoptotic pathways. Oncogene 19: 3200–3212.
8. Nilsson JA, Cleveland JL (2003) Myc pathways provoking cell suicide and
cancer. Oncogene 22: 9007–9021.
9. Juin P, Hunt A, Littlewood T, Griffiths B, Swigart LB, et al. (2002) c-Myc
functionally cooperates with Bax to induce apoptosis. Mol Cell Biol 22:
6158–6169.
10. Ayala-Torres S, Zhou F, Thompson EB (1999) Apoptosis induced by oxysterol
in CEM cells is associated with negative regulation of c-myc. Exp Cell Res 246:
193–202.
11. Zhang P, Li H, Wu ML, Chen XY, Kong QY, et al. (2006) c-Myc
downregulation: a critical molecular event in resveratrol-induced cell cycle
arrest and apoptosis of human medulloblastoma cells. J Neurooncol 80:123–131.
12. Wang YH, Liu S, Zhang G, Zhou CQ, Zhu HX, et al. (2005) Knockdown of c-Myc expression by RNAi inhibits MCF-7 breast tumor cells growth in vitro and
in vivo. Breast Cancer Res 7: R220–R228.
13. Chow JM, Liu CR, Lin CP, Lee CN, Cheng YC, et al. (2008) Downregulation ofc-Myc determines sensitivity to 2-methoxyestradiol-induced apoptosis in human
acute myeloid leukemia. Exp Hematol 36: 140–148.
14. Biroccio A, Benassi B, Amodei S, Gabellini C, Del Bufalo D, et al. (2001) c-Mycdown-regulation increases susceptibility to cisplatin through reactive oxygen
species-mediated apoptosis in M14 human melanoma cells. Mol Pharmacol 60:
174–182.
15. Bucci B, D’Agnano I, Amendola D, Citti A, Raza GH, et al. (2005) Myc down-
regulation sensitizes melanoma cells to radiotherapy by inhibiting MLH1 andMSH2 mismatch repair proteins. Clin Cancer Res 11: 2756–2767.
16. D’Agnano I, Valentini A, Fornari C, Bucci B, Starace G, et al. (2001) Myc
down-regulation induces apoptosis in M14 melanoma cells by increasingp27(kip1) levels. Oncogene 20: 2814–2825.
17. Greco C, D’Agnano I, Vitelli G, Vona R, Marino M, et al. (2006) c-MYC
deregulation is involved in melphalan resistance of multiple myeloma: role ofPDGF-BB. Int J Immunopathol Pharmacol 19: 67–79.
18. Michor F, Iwasa Y, Nowak MA (2004) Dynamics of cancer progression. Nat Rev
Cancer 4: 197–205.
19. Beckman RA, Loeb LA (2005) Genetic instability in cancer: theory andexperiment. Semin Cancer Biol 15: 423–435.
20. Wade M, Wahl GM (2006) c-Myc, genome instability, and tumorigenesis: thedevil is in the details. Curr Top Microbiol Immunol 302: 169–203.
21. Dominguez-Sola D, Ying CY, Grandori C, Ruggiero L, Chen B, et al. (2007)
Non-transcriptional control of DNA replication by c-Myc. Nature 448: 445–451.
22. Kidder BL, Yang J, Palmer S (2008) Stat3 and c-Myc genome-wide promoteroccupancy in embryonic stem cells. PLoS ONE 3: e3932.
23. Wong DJ, Liu H, Ridky TW, Cassarino D, Segal E, et al. (2008) Module map of
stem cell genes guides creation of epithelial cancer stem cells. Cell Stem Cell 2:333–344.
24. Prochownik EV, Li Y (2007) The ever expanding role for c-Myc in promotinggenomic instability. Cell Cycle 6: 1024–1029.
25. Felsher DW, Zetterberg A, Zhu J, Tlsty T, Bishop JM (2000) Overexpression ofMYC causes p53-dependent G2 arrest of normal fibroblasts. Proc Natl Acad
Sci U S A 97: 10544–10548.
26. Cowling VH, Chandriani S, Whitfield ML, Cole MD (2006) A conserved Mycprotein domain, MBIV, regulates DNA binding, apoptosis, transformation, and
G2 arrest. Mol Cell Biol 26: 4226–4239.
27. Taylor SS, Scott MI, Holland AJ (2004) The spindle checkpoint: a qualitycontrol mechanism which ensures accurate chromosome segregation. Chromo-
some Res 12: 599–616.
28. Li Q, Dang CV (1999) c-Myc overexpression uncouples DNA replication from
mitosis. Mol Cell Biol 19: 5339–5351.
29. Alexandrova N, Niklinski J, Bliskovsky V, Otterson GA, Blake M, et al. (1995)The N-terminal domain of c-Myc associates with alpha-tubulin and microtu-
bules in vivo and in vitro. Mol Cell Biol 15: 5188–5195.
30. Crescenzi M, Crouch DH, Tato F (1994) Transformation by myc preventsfusion but not biochemical differentiation of C2C12 myoblasts: mechanisms of
phenotypic correction in mixed culture with normal cells. J Cell Biol 125:1137–1145.
31. D’Agnano I, Valentini A, Gatti G, Chersi A, Felsani A (2007) Oligopeptides
impairing the Myc-Max heterodimerization inhibit lung cancer cell proliferation
by reducing Myc transcriptional activity. J Cell Physiol 210: 72–80.
32. Salvioli S, Ardizzoni A, Franceschi C, Cossarizza A (1997) JC-1, but not
DiOC6(3) or rhodamine 123, is a reliable fluorescent probe to assess delta psi
changes in intact cells: implications for studies on mitochondrial functionalityduring apoptosis. FEBS Lett 411: 77–82.
33. Job D, Valiron O, Oakley B (2003) Microtubule nucleation. Curr Opin Cell Biol
15: 111–117.
34. Asnaghi L, Calastretti A, Bevilacqua A, D’Agnano I, Gatti G, et al. (2004) Bcl-2phosphorylation and apoptosis activated by damaged microtubules require
mTOR and are regulated by Akt. Oncogene 23: 5781–5791.
35. Abal M, Andreu JM, Barasoain I (2003) Taxanes: microtubule and centrosometargets, and cell cycle dependent mechanisms of action. Curr Cancer Drug
Targets 3: 193–203.
36. Citro G, D’Agnano I, Leonetti C, Perini R, Bucci B, et al. (1998) c-myc antisense
oligodeoxynucleotides enhance the efficacy of cisplatin in melanoma chemo-therapy in vitro and in nude mice. Cancer Res 58: 283–289.
37. Sheen JH, Woo JK, Dickson RB (2003) c-Myc alters the DNA damage-induced
G2/M arrest in human mammary epithelial cells. Br J Cancer 89: 1479–1485.
38. Levy N, Yonish Rouach E, Oren M, Kimchi A (1993) Complementation bywild-type p53 of interleukin-6 effects on M1 cells: induction of cell cycle exit and
cooperativity with c-myc suppression. Mol Cell Biol 13: 7942–7952.
39. Sachdeva M, Zhu S, Wu F, Wu H, Walia V, et al. (2009) p53 represses c-Mycthrough induction of the tumor suppressor miR-145. Proc Natl Acad Sci U S A
106: 3207–3212.
40. Eischen CM, Weber JD, Roussel MF, Sherr CJ, Cleveland JL (1999) Disruptionof the ARF-Mdm2-p53 tumor suppressor pathway in Myc-induced lymphoma-
genesis. Genes Dev 13: 2658–2669.
41. Zindy F, Eischen CM, Randle DH, Kamijo T, Cleveland JL, et al. (1998) Myc
signaling via the ARF tumor suppressor regulates p53-dependent apoptosis andimmortalization. Genes Dev 12: 2424–2433.
42. Juin P, Hueber AO, Littlewood T, Evan G (1999) c-Myc-induced sensitization to
apoptosis is mediated through cytochrome c release. Genes Dev 13: 1367–1381.
43. Egle A, Harris AW, Bouillet P, Cory S (2004) Bim is a suppressor of Myc-induced mouse B cell leukemia. Proc Natl Acad Sci U S A 101: 6164–6169.
44. Baudino TA, Maclean KH, Brennan J, Parganas E, Yang C, et al. (2003) Myc-
mediated proliferation and lymphomagenesis, but not apoptosis, are compro-mised by E2f1 loss. Mol Cell 11: 905–914.
45. Zanet J, Pibre S, Jacquet C, Ramirez A, de Alboran IM, et al. (2005)
Endogenous Myc controls mammalian epidermal cell size, hyperproliferation,endoreplication and stem cell amplification. J Cell Sci 118: 1693–1704.
Myc Overexpression and Death
PLoS ONE | www.plosone.org 14 May 2009 | Volume 4 | Issue 5 | e5442

46. Taylor WR, Stark GR (2001) Regulation of the G2/M transition by p53.
Oncogene 20: 1803–1815.
47. Peng CY, Graves PR, Thoma RS, Wu Z, Shaw AS, et al. (1997) Mitotic and G2
checkpoint control: regulation of 14-3-3 protein binding by phosphorylation of
Cdc25C on serine-216. Science 277: 1501–1505.
48. Mullan PB, Quinn JE, Gilmore PM, McWilliams S, Andrews H, et al. (2001)
BRCA1 and GADD45 mediated G2/M cell cycle arrest in response to
antimicrotubule agents. Oncogene 20: 6123–6131.
49. Murray AW (2004) Recycling the cell cycle: cyclins revisited. Cell 116: 221–234.
50. Menssen A, Epanchintsev A, Lodygin D, Rezaei N, Jung P, et al. (2007) c-MYC
delays prometaphase by direct transactivation of MAD2 and BubR1:identification of mechanisms underlying c-MYC-induced DNA damage and
chromosomal instability. Cell Cycle 6: 339–352.
51. Wassmann K, Liberal V, Benezra R (2003) Mad2 phosphorylation regulates itsassociation with Mad1 and the APC/C. EMBO J 22: 797–806.
52. Niklinski J, Claassen G, Meyers C, Gregory MA, Allegra CJ, et al. (2000)Disruption of Myc-tubulin interaction by hyperphosphorylation of c-Myc during
mitosis or by constitutive hyperphosphorylation of mutant c-Myc in Burkitt’s
lymphoma. Mol Cell Biol 20: 5276–5284.
Myc Overexpression and Death
PLoS ONE | www.plosone.org 15 May 2009 | Volume 4 | Issue 5 | e5442