The overlapping of national IC and innovation systems
21
The overlapping of national IC and innovation systems Jose-Luis Hervas-Oliver MIN, Universidad Politecnica de Valencia, Valencia, Spain and International Programs, Florida State University, Tallahassee, Florida, USA Ronald Rojas MIN, Universidad Politecnica de Valencia, Valencia, Spain Blanca-Maria Martins Universidad Politecnica de Catalunya, Barcelona, Spain, and Roberto Cervello ´-Royo Departamento Econonı ´a y Ciencias Sociales, Universidad Polite ´cnica de Valencia, Valencia, Spain Abstract Purpose – This paper aims to present a focus for identifying the convergence between the theory of the intellectual capital of nations and that of the National Systems of Innovation from the literature of innovation systems, with the aim of providing a more robust theoretical framework to explore the drivers of intangibles and the policies which foster competitiveness through the development of the national intellectual capital platforms. Design/methodology/approach – Selecting 28 indicators which best fit the analyzed theoretic principles and taking into account the member countries of the European Union as a sample (15) with the data taken from the IMD, a simple analysis of the seven-year (2000-2006) window was carried out to compare the intangibles pointed out in the two aforementioned perspectives. Findings – The homogeneity of the results using models of measurement of intellectual capital of countries with those obtained through the models of the National Systems of Innovation prove the considerable convergence between these two theoretic fields, validating the hypotheses proposed in the study. Research limitations/implications – The system provided is not an exhaustive use of all the available measures and countries. A more comprehensive practical application on more countries and indicators would be necessary to validate the model. Practical implications – The study has implications for the business, politicians and academia. The study opens new lines of research in the sense that it advocates a theoretical approximation and the integration of the abundant literature on the National Systems of Innovation as basic drivers to explain the intangibles at a macro level, their management and politics related to the maintaining and renewal of said assets of intellectual capital. Originality/value – To the best of the authors’ knowledge, so far no study analyzing this convergence has been designed or published. This paper extends and adds robustness to the national IC measurement model to help policymakers and scholars. Keywords Intellectual capital, National cultures, Innovation, European Union Paper type Research paper The current issue and full text archive of this journal is available at www.emeraldinsight.com/1469-1930.htm This paper is part of the project ECO2010-17318 (ECON), “Analisis de la Innovacion Empresarial a trave ´s de la Capacidad de Absorcio ´n Tecnolo ´gica ... ”, Direccion General de Investigacio ´n y Gestio ´n del Plan Nacional de I þ D þ I, Ministerio de Ciencia e Innovacio ´n, Spanish Government. The authors are also thankful for financial support provided by the Institu Ignaci Villalonga d’Economia i Empresa, Vale `ncia. The usual disclaimers apply. National IC and innovation systems 111 Journal of Intellectual Capital Vol. 12 No. 1, 2011 pp. 111-131 q Emerald Group Publishing Limited 1469-1930 DOI 10.1108/14691931111097935
-
Upload
independent -
Category
Documents
-
view
0 -
download
0
Transcript of The overlapping of national IC and innovation systems
The overlapping of national ICand innovation systems
Jose-Luis Hervas-OliverMIN, Universidad Politecnica de Valencia, Valencia, Spain and
International Programs, Florida State University, Tallahassee, Florida, USA
Ronald RojasMIN, Universidad Politecnica de Valencia, Valencia, Spain
Blanca-Maria MartinsUniversidad Politecnica de Catalunya, Barcelona, Spain, and
Roberto Cervello-RoyoDepartamento Econonıa y Ciencias Sociales,
Universidad Politecnica de Valencia, Valencia, Spain
AbstractPurpose – This paper aims to present a focus for identifying the convergence between the theory ofthe intellectual capital of nations and that of the National Systems of Innovation from the literature ofinnovation systems, with the aim of providing a more robust theoretical framework to explore thedrivers of intangibles and the policies which foster competitiveness through the development of thenational intellectual capital platforms.
Design/methodology/approach – Selecting 28 indicators which best fit the analyzed theoreticprinciples and taking into account the member countries of the European Union as a sample (15) withthe data taken from the IMD, a simple analysis of the seven-year (2000-2006) window was carried outto compare the intangibles pointed out in the two aforementioned perspectives.
Findings – The homogeneity of the results using models of measurement of intellectual capital ofcountries with those obtained through the models of the National Systems of Innovation prove theconsiderable convergence between these two theoretic fields, validating the hypotheses proposed inthe study.
Research limitations/implications – The system provided is not an exhaustive use of all theavailable measures and countries. A more comprehensive practical application on more countries andindicators would be necessary to validate the model.
Practical implications – The study has implications for the business, politicians and academia.The study opens new lines of research in the sense that it advocates a theoretical approximation andthe integration of the abundant literature on the National Systems of Innovation as basic drivers toexplain the intangibles at a macro level, their management and politics related to the maintaining andrenewal of said assets of intellectual capital.
Originality/value – To the best of the authors’ knowledge, so far no study analyzing thisconvergence has been designed or published. This paper extends and adds robustness to the nationalIC measurement model to help policymakers and scholars.
Keywords Intellectual capital, National cultures, Innovation, European Union
Paper type Research paper
The current issue and full text archive of this journal is available at
www.emeraldinsight.com/1469-1930.htm
This paper is part of the project ECO2010-17318 (ECON), “Analisis de la Innovacion Empresariala traves de la Capacidad de Absorcion Tecnologica . . . ”, Direccion General de Investigacion yGestion del Plan Nacional de I þ D þ I, Ministerio de Ciencia e Innovacion, SpanishGovernment. The authors are also thankful for financial support provided by the Institu IgnaciVillalonga d’Economia i Empresa, Valencia. The usual disclaimers apply.
National IC andinnovation
systems
111
Journal of Intellectual CapitalVol. 12 No. 1, 2011
pp. 111-131q Emerald Group Publishing Limited
1469-1930DOI 10.1108/14691931111097935

1. IntroductionThe innovative and competitive capacity of nations has been analyzed from distincteconomic perspectives of which intellectual capital (IC) and National Systems ofInnovation (NSI) stand out. In the literature on IC there are diverse works which tacklethe differences in innovator and competitive output of territories from said intangibleperspectives in distinct ambits: national (e.g. Edvinsson and Stenfelt, 1999; EdnaPasher and Associates, 1999; Bontis, 2004; Stahle and Bounfour, 2008, among others),regional (Viedma, 1999, 2002; Robert Huggins Associates, 2002), city-wise (Edvinssonand Malone, 1997; Viedma, 2003) and regional clusters (Hervas-Oliver and Dalmau,2006; Smedlund and Poyhonen, 2005).
This literature of the NSI has also realized a meritorious contribution in themeasurement of the innovator effort and the performance of countries (e.g.Lundvall, 1992; Nelson, 1993; Edquist, 1997). Following this line of thought, itmust be pointed out that more than four decades ago the differences in the level ofdevelopment of countries, due principally to their technological differences wasalready understood (Gerschenkron, 1962). Since then, the Evolutionist authors (e.g.Freeman et al., 1982; Fagerberg, 1987) and other academics pertaining to the NewTheory of Growth (e.g. Romer, 1990) have developed a considerable quantity ofworks directed toward the analysis of the differences between levels ofdevelopment and growth of countries.
Nevertheless, and independent from the literature that we have examined of themodels of measurement of IC as well as that of the NSI, there is not enough empiricevidence regarding the principal drivers or determining factors of the economicprosperity of countries (Edquist, 2005), nor under which logical structures they areconfigured (Pomeda et al., 2002; Fagerberg and Srholec, 2008). Likewise, there is apotential convergence between these two theoretic frameworks (Stahle and Poyhonen,2005; Hervas-Oliver and Dalmau, 2007) curiously due to the fact that all of theindicators included in prestigious reports on innovation (as for example, the EuropeanInnovation Scoreboard) are of an intangible nature.
Thus, in this report, we have developed a comparative analysis directed toward thecountries (15) that are members of the European Community with the objective ofclarifying the following questions:
(1) Is there a convergence or divergence between the theory of IC and that of theNSI?
(2) What are the principal drivers of economic development and growth in thesecountries?
Put differently, this article presents a focus for identifying the convergence between thetheory of the IC of nations and that of the NSI from the literature of innovation systems,with the aim to provide a more robust theoretical framework to explore the drivers ofintangibles and the policies which foster competitiveness through the development ofthe national IC platforms. In order to fulfill these objectives, this article is structured inthe following manner. In the second section we briefly tackle the theoreticalfoundations of IC and of the NSI. Afterwards, in the third section, we describe theempiric analysis and interpret the results. Finally, in the last section, we present theconclusions and the implications.
JIC12,1
112

2. Theoretical frameworkThere are prestigious organisms of an international nature that periodically carry outdiverse studies not directly addressed towards measuring IC nor towards the NSI. Twoof these are the World Economic Forum (WEF), which publishes the GlobalCompetitiveness Index (Sala-i-Martin and Artadi, 2004) among other indexes, and theInstitute for Management Development (IMD) which publishes an annual oncompetitiveness called World Competitiveness Yearbook (WCY).
The Global Competitiveness Index[1] (Sala-i-Martin and Artadi, 2004) is an integralindex that uses the microeconomic and macroeconomic characteristics of economies todetermine their level of productivity. The pillars of competitiveness are formed by:institutions[2], physical infrastructures, macroeconomic stability, personal security,human capital, efficiency of labor and goods markets, technological availability,market size, sophistication of the firm and innovation. Prior to the GlobalCompetitiveness Index, the World Economic Forum published the CurrentCompetitive Index, designed by Porter (2001), which focused principally onmicroeconomic aspects for the competitive measuring of economies. In fact, saidmodel had a significant empiric correlation between the score of the indexes ofcompetitiveness of the countries and their gross domestic product (GDP) per capita,results that corroborate the robustness of the index and its reliability in measuringcompetitiveness. Analogically, the World Competitiveness Yearbook (Institute forManagement Development, 2004) contains similar criteria based on micro andmacroeconomic foundations of competitiveness, represented in the following fourblocks: economic performance, governmental efficiency, efficiency of the firm, andinfrastructure.
Although competitiveness is not totally identical to the measurement of IC, nor tothe innovative capacity of economies, the indexes cited above use a holistic focus forcompetitiveness measuring. Consequently, these can be employed as a useful base fordesigning composite indexes ideal for measuring these two theoretic fields. In the sameline, Stahle and Poyhonen (2005) suggest that the differences between the measurementof competitiveness and of IC lie in the fact that the competitiveness of an economy(expressed generally by the GDP per capita) is created from the national knowledgebase (IC of a country).
2.1 IC2.1.1 IC centered on the firm. The majority of the models of measurement of IC haveserved as a support for companies in the complex task of measuring their intangibleassets with the purpose, primarily, of informing third parties about the value of theseassets. The Invisible Balance Sheet, The Skandia Navigator, The Balanced Scorecard,The Value Explorer, Intellectual Capital Index and Intellectual Capital Audit areamong the most outstanding models. It is worthy of note that there is no unique modelof IC. This is because the majority of models are associated with the corporate strategyof the firm and, in accordance, with the importance that is given to each factor. Hence,each organization establishes the most convenient indicators for measuring saidcapitals (Nevado and Lopez, 2002).
Likewise, there are diverse methodological guides and regulations stipulated byvarious entities and countries (principally members of the European Union, see Table I)regarding the accounting systems of the IC of companies (and to a lesser degree, in
National IC andinnovation
systems
113

public administrations and in universities). The fundamental proposition of saiddictates, which are adapted to the local circumstances and business culture of eachcountry, is to serve as a tool for drawing up a declaration of IC.
2.1.2 National IC and the EIS. Although IC has been the object of many studies formore than two decades, the analysis of it from a territorial perspective is more recent.In the words of Bontis (2004) the greater part of the IC research has been centered onparticular companies more than, at a macro level, on units such as regions or countries.
The measuring of IC at a national level is a tool that serves for analyzing andcomparing the competences and capacities which an economy has. These analyses canaid in the adoption of policies and practices to integrally promote economic development(Malhotra, 2003). Authors such as Stahle and Bounfour (2008) maintain that the focus ofanalysis of IC on a national scale should be on the actual effects of IC and that, for thisanalysis, these effects need to be identified in national statistics and numeric data.
The revision of the IC literature at a national level shows, although with distinctdenominations and some modifications, that each model generally breaks up IC intothree generic blocks: human capital, structural capital and relational capital, followingthe classical structure of the Skandia model (see Tables II and III). Another common
Year Country Entity Regulations/guidelines
1998 Spain University Institute EuroforumEscorial
Intellectus model
2001 Denmark Danish Parliament The Danish guidelines
2002 Germany German Accounting StandardsCommittee
German Accounting Standards“GAS 12”
2002 Austriaa Ministry for Education, Scienceand Culture
Austrian Universities Act 2002
Austrian Research Centres ARC Intellectual Capital Report
2002 Norway Norwegian Association ofFinancial Analysts
Guidelines for reporting onknowledge capital
2002 Spain, France, Finland,Sweden, Denmark andNorway
European Commission VFramework Programme
MERITUM Project
2004 European Union European Commission RICARDIS: ReportingIntellectual Capital to AugmentResearch, Development andInnovation in SMEs
2004 New Zealandb Local Government StakeholderPanel
Intellectual Capital Disclosure“ICD Index”
2005 Japan Japanese Ministry of Economy Guidelines for disclosure of IA-based management
2005 Australia Society for KnowledgeEconomics
Guiding Principles on ExtendedPerformance Management
Notes: aAimed at universities (not companies); baimed at local authorities (not companies)Source: Own, based on RICARDIS (European Commission)
Table I.Guidelines and models toreport IC in organizations
JIC12,1
114

denominator of said models is that of the choice of indicators, and the assigning of aweight when necessary, is made depending on the personal criteria of the author. Also,some models consist of a great number of indicators and depend on the distinct criteriaof quality and content of the national/regional statistics systems (Klein, 2000). Thismakes their practicality more difficult. In conclusion, we proved that although all themodels address the measuring of IC by means of very similar indicators, there is not aconsensus (nor sufficient contrasted empirical evidence) on which indicators – norunder what logical structure they are shaped (Pomeda et al., 2002) – are the ones thatreally determine the innovative capacity and competitiveness of countries.
Country Author/year Structure
European Union Bounfour (2003) Resources, processes and outputsAndriessen and Stam (2004) Human, structural and relational
Spain Martins and Viedma (2005) Region’s competitiveness intellectual capitalplatform and microcluster’s competitivenessintellectual capital frame
OECD Hervas-Oliver and Dalmau (2007) Human and educational, technologicalinfrastructure, linkages, firm’s strategies,business policy, social block, market block,economic performance
51 countries Stahle and Bounfour (2008) Economic performance, governmentefficiency, business efficiency, andinfrastructure on a national level (structurefrom IMD competitiveness report
Source: Own
Table II.Principal models of the IC
of countries
StructureFrom Skandia Navigator
Country Author/year Financial Human Market ProcessRenewal anddevelopment Others
Sweden Stenfelt et al.(1996); Rembe(1999) £ £ £ £
Israel Edna Pasher andAssociates (1999) £ £ £ £
Malaysia Bontis et al.(2000) £ £ £ £ £
Spain Pomeda et al.(2002) £
Technologicaland social
Arab region Bontis (2004) £ £ £ £ £
Nordiccountries
Yen-Yun andEdvinsson (2008) £ £ £ £
Source: Own
Table III.Principal models of the IC
of countries
National IC andinnovation
systems
115

Following the model proposed by Hervas-Oliver and Dalmau (2007), the measuringof the IC of a region/country should be based on the following points:
. Macro aspects: the essential component to be considered is infrastructure (Porter,1990; Romer, 1990; Nelson, 1993; Furman et al., 2002) – the cultural values ofknowledge based on the universities, the R&D centers, the qualifications ofhuman resources, etc.
. Micro aspects, such as the strategic aptitudes and entrepreneurial spirit of the localcompanies, the presence of clusters –which promote innovation and knowledgegenerated from interaction – and to be closely connected with the macro aspects.
. Meso-interactions, which connect the macro and micro aspects, refer principallyto the local and regional dimension.
. A theoretic framework based on different, but complementary, perspectives forintegrating the elements in the model.
The index and metrics should be put into context within the nature of the country orregion, and measured and adjusted to the view of the territorial stakeholders. Withinthis line of thought, the authors have developed a regional/national index formeasuring IC, made up of the following blocks: human and educational, technologicalinfrastructure, interactions, strategies of the firm, business politics, social block,market block, and economic yield.
2.2 European Innovation Scoreboard: matching resultsGiven the EU’s aim to become “the most competitive and dynamic knowledge-basedeconomy in the world” by 2010, new instruments have been necessary to measure theevolution towards this target. Within this action scope, the European InnovationScoreboard (EIS) is the principal instrument to track EU’s innovation performance. TheEIS was conceived as part of the new method of intervention of the EuropeanCommission (EC) set by the Lisbon Agenda in 2000, the “open method of coordination”,whose premise is to strengthen the logic of “mutual learning, benchmarking, bestpractice and peer pressure to achieve objectives” (Regent, 2002, p. 20). It allowscomparative assessment of the innovation performance of EU member states andaccession candidates as well as of a couple of global competitors –e.g. Japan and theUS and, more recently, the BRICs. In a nutshell, the EIS can be defined as “the range ofmeasures produced to benchmark the EU countries’ innovation performance”(Celikel-Esser et al., 2008, p. 16).
Since its first publication in 2000, the EIS has undergone systematic changes in bothits dimensions – pulling along changes in the number and scope of the indicators –and countries covered. The main trends in development of the EIS methodology havebeen driven by one or more of the following factors:
. to measure new forms on innovation;
. to assess overall innovation performance;
. to improve the comparability at national, regional and international levels; and
. to measure progress and changes over time.
Up until 2007 the indicators were grouped into two main categories, inputs and outputs.
JIC12,1
116

For the EIS 2008 the methodology was revised[3] and the number of categoriesincreased from the former two to three (enablers, firm activities and outputs),displaying seven dimensions and 29 indicators (see Table IV). The purpose of thisrevision was to have dimensions that bring together a set of related indicators to give abalanced assessment of the innovation performance in that dimension. The categoriesand dimensions have been designed to accommodate the diversity of differentinnovation processes and models that occur in different national contexts.
Indicators for the EIS 2008-2010
EnablersHuman resources S&E and SSH graduates per 1,000 population aged 20-29 (first
stage of tertiary education)S&E and SSH doctorate graduates per 1,000 aged 25-34(secondary stage of tertiary education)Population with tertiary education per 100 population aged 25-64Participation in lifelong learning per 100 population aged 25-64
Finance and support Public R&D expenditures (% of GDP)Venture capital (% of GDP)Private credit (% of GDP)Broadband access by firms (% of firms)
Firm activitiesFirm investments Business R&D expenditures (% of GDP)
IT expenditures (% of GDP)Non-R&D innovation expenditures (% of GDP)
Linkages and entrepreneurship SMEs innovating in-house (% of SMEs)Innovative SMEs collaborating with others (% of SMEs)Firm renewal (SME entries plus exits) (% of SMEs)Public-private co-publications per million population
Through-puts EPO patents per million populationCommunity trade-marks per million populationCommunity designs per million populationTechnology balance of payments flows (% of GDP)
OutputsInnovators SMEs introducing product or process innovations (% of SMEs)
SMEs introducing marketing or organizational innovations (% ofSMEs)Resource efficiency innovators, unweighted average of:† Share of innovators where innovation has significantly
reduced labor costs (% of firms)† Share of innovators where innovation has significantly
reduced the use of materials and energy (% of firms)Economic effects Employment in medium-high and high-tech manufacturing (% of
workforce)Employment in knowledge-intensive services (% of workforce)Medium and high-tech manufacturing exports (% of totalexports)Knowledge-intensive services exports (% of total servicesexports)New-to-market sales (% of turnover)New-to-firm sales (% of turnover)
Table IV.Dimensions of innovationperformance captured in
the EIS
National IC andinnovation
systems
117
It is thus considered that the above-described dimensions form the core of nationalinnovation performance. In addition, there are wider socio-economic factors thatinfluence innovation, such as the role of governments, markets, social factors and thedemand and acceptance of innovation. Certainly, the complexity, dynamics and theidiosyncratic nature of innovation makes its measurement and assessment particularlydifficult, especially if it is assumed rather than intellectual gymnastics an effectiveinstrument for informing policy formulation. As Fagerberg and Srholec (2008) pointedout, differences in nature, geography and history influence the ability of a country todevelop a well-functioning NSI.
A major bulk of the EIS indicators, however, are still better suited to capture thescience-based innovation; only some improvements that are made in the EIS-2008 captureindicators that reflect the core ideas of the user and open innovation models. For instance,the new indicators included in the EIS-2008 first of all focus on the better reflection of theprivate-public cooperation (co-publications per million population), firm renewal (SMEsentries and exits; percent of SMEs), the use of private credit (relative to GDP), the roletechnological innovators (percent of SMEs), the improvement of resource efficiencyindicators (the use of labor, energy and materials), development knowledge-intensiveservices exports (percent of total services exports), etc. Summarizing, in the new EISversion there is much more focus on SMEs, finance and activities such as design. Thelatter give insights about the shift towards creative industries.
Ultimately, the changes in the choice of the initial indicators and the improvementsof the EIS methodology reflect changes in understanding of the innovation process anddevelopment of innovation models. Accordingly, the development of the EISmethodology and its logics shall be regarded as work-in-progress. In fact, how to dealwith measuring new forms of innovation, assessing overall innovation performance,improving comparability at national, regional and international levels and measuringprogress and changes over time will continue to challenge EIS methodological issuesas new ways of innovating upsurge and the geography of competitiveness andco-opetition evolves.
Likewise, Figure 1, comparing the indicators of the EIS 2008 with those included inthe IC model developed by Hervas-Oliver and Dalmau (2007), shows a significantoverlapping in the indicators of both two frameworks. Except for three of the eightblocks making up the IC model – business policy, social block and economicperformance – the indicators are very similar – if not identical – to its counterparts ofthe EIS. This is a simply matching exercise which shows how similar are the ICmodels, the innovation ones and also those measuring growth and competitiveness:basically they are built on intangibles.
2.3. National Systems of InnovationThe term National Systems of Innovation (NSI) was coined by Freeman (1987) whodefined it as “the network of public and private institutions whose activities andinteractions initiate, import, modify and disseminate new technologies”.
Furman et al. (2002), integrating various economic cores, developed the model ofNational Innovative Capacity, which was designed from the following three researchareas: the endogenous growth theory driven by the ideas of Romer (1990); Porter’s(1990) cluster theory of the competitive advantage of countries, and the literature ofthe national systems of innovation which began with Nelson (1993). The
JIC12,1
118

endogenous growth theory driven by ideas is based on the knowledge stock of allthe economy and on the size of the labor pool in R&D, emphasizing, at theaggregate level, the relationship between certain factors which support and createthe flow of new ideas in an economy. These factors, among others, are the input inR&D such as employed scientists, R&D expenditures or the quality of the highereducation system.
Following Edquist (2005, pp. 201-203) there are two great gaps in the nationalinnovations systems research which merit more empiric attention by researchers:
Figure 1.Convergence between the
EIS (2008) and the ICModel of Hervas-Oliver
and Dalmau
National IC andinnovation
systems
119

(1) The problem of specifying the boundaries or limits of the NSI, referring to theidentification of their constituent determinants or factors.
(2) The NSI has been used more as a concept or a label than as an analytical tool.For example, Galli and Teubal (1997), Liu and White (2001), Hekkert and Negro(2009) highlight the scarcity of works that relate theoretic arguments with theempiric in this ambit. In addition, this lack of information will determine thetype of data to be gathered in the empiric work.
Regarding the configuration of the NSI boundaries or limits, various works havementioned some activities: R&D, implementation, purpose, education and interactions(Liu and White, 2001), or functions: create new knowledge, guide the direction of thesearch process, supply resources, create positive external economies, and facilitate theformation of markets ( Johnson and Jacobsson, 2003; Bergek et al., 2008). However, it isdifficult to follow a holistic focus (Edquist, 2005) and at the same time, specify the exactdeterminants of innovation when the analysis method of the structure of the NSI isshown to be insufficient (Chaminade and Edquist, 2005).
Following this line of thought, Fagerberg and Srholec (2008) found, using factoranalysis, empiric evidence of the following four factors or constituent components in anNSI: innovation system (IS), development, government, the political system and thedegree of “openness”. Said authors recognize that the key factors – those thatcontribute to the explanation of variance to a higher degree – are the first two.
According to Hervas-Oliver and Dalmau (2007), and applying their ideas toconstruct an NSI index, resources based views (micro) and regional development(meso) can complement the economic views (macro) in order to form a more integraltheoretic framework. All of the parts implicated in the process of value creationthrough the knowledge platform, contained in the NSI, are like flows of knowledge thatare transferred and diffused through the different economic layers and levels. Inaddition, these knowledge flows increase and contribute to the territorial knowledgestock of each country. They can also be partially protected by isolation mechanisms(Rumelt, 1984). In this context, said isolation mechanisms might be the history,language, culture, beliefs, the assumed and other antecedents on a national scalebesides the visions and expectations of the stakeholders (politicians, government,groups of experts, commercial associations, governmental agencies, and regionalgovernments among others). All of these factors and agents, acting as a social system,support and generate innovation, i.e., “institutions” (in the sense of Nelson, 2008) orsocial complexity (Piore and Sabel, 1984; Brusco, 1986). This term refers to mutualconfidence, to the assumed and common values held by a community of people(Harrison, 1992; Russo, 1997) who ensure the appropriate internal connection and alsoestablish the basis for innovation (Lundvall, 1992).
Also, the concept of NSI ought to be related to the principal theoretic perspectivessuch as resource-based views (e.g. Penrose, 1959; Peteraf, 1993) and activity-basedviews (Porter, 1980, 1985) of the strategy of the firm. These theories also have beenlinked to the territorial concept, especially in relation to cluster regions, although in thiscontext, they can be extended to countries. Studied from resource-based views, there isan explicit agreement on the existence of resources and capacities, internal toward theterritory and external towards localized firms (Harrison, 1994; Foss, 1996; Lawson,1999; Maskell and Malmberg, 1999). Analogously, from activity-based views, Porter
JIC12,1
120

(1980, 1985) has also underlined the benefits of the configuration of the value chain ofthe firm with the availability of territorial resources. All of these strategic ideasregarding territories and their influence on the firm offer an integrated perspective inwhich not only are the regional elements taken into account, but also the strategies ofthe firm, i.e., the meso and micro aspects complementing the macro focus. Theactivities included in the system of value creation of a country, region or a territory arelinked to the resources (belonging to a territory) put into action by the firm (what thefirm does) and connected by interactions (the form in which the firm employs theavailable territorial knowledge). We insist on the idea of territories in the sense that,although certain technologic elements can be classified as macro (belonging to theinfrastructure of public research, such as the universities), the important interactionsthat lead to innovation are carried out in the regional ambit (Ronde and Hussler, 2005),i.e., at the meso level.
The idea of interactions is emphasized by the perspective of the Triple Helix(Etzkowitz and Leydesdorff, 2000) because of the crucial importance of interactionbetween universities, firms and other institutions; or the situations in which industry,universities and public organisms serve as interrelated hubs in the process of thecreation of new firms, and in the establishing of a critical mass to explain innovation.Interactions or linkages have been presented as a way to connect firms and industriesand also as a means to link technologic infrastructure (principally public) to the privatesector. These interactions ought to be situated more in a meso framework, local orregional. Interactions promote organizational learning because knowledge is sharedwith other firms and institutions linked to the network (McEvily and Zaheer, 1999).Likewise, the capacities linked to the network (networking) are the key factor ininnovation (Benner, 2003; Balconi et al., 2004) and, following Ronde and Hussler (2005,p. 1163), the motor of regional innovative capacity seems to reside in the relationshipsdeveloped between the actors (or agents) and the territory.
Consequently, taking into account the theoretic principles of the literature on the ICof a nation and that of the national systems of innovation, the following proposition isstated:
P1. There is a considerable convergence in the structure, the measurement andthe assessment indicators between the models of IC of a nation and the NSI. Inthis vain, intangibles, measured by the NSI and competitiveness framework,determine the competitive capacity of economies and their platform ofintellectual capital.
3. Empiric design: sample and resultsThe sample of the available data of all the variables is taken from the IMD databaseput together for the member countries of the European Community (15). The timeperiod considered is from 2000 to 2006. An average is constructed with data from theseven years covered, and afterwards, the variables are standardized.
The variables selected from the IMD[4] and shown in the following list and werechosen for their fit with the theory of the models for the measurement of the IC ofcountries (Andriessen and Stam, 2005; Hervas-Oliver and Dalmau, 2007), and themodels for the measurement of the NSI (Sala-i-Martin and Artadi, 2004; Porter, 2001;Fagerberg and Srholec, 2008; European Commission, 2004, 2008):
National IC andinnovation
systems
121

. Pupil-teacher ration (primary education).
. Pupil-teacher ration (secondary education).
. Secondary school enrollment.
. Educational system.
. University education.
. Qualified engineers.
. Entrepreneurship.
. Employee training.
. Competent senior managers.
. Brain drain.
. Flexibility and adaptability.
. Inage abroad.
. Justice.
. Sustainable development.
. Basic research.
. Youth interest in science.
. Total R&D personnel in nationwide per capita.
. Total R&D personnel in business per capita.
. Venture capital.
. Competition legislation.
. Development and application of technology.
. Bureaucracy.
. Intellectual property rights.
. International transactions.
. Knowledge transfer.
. Technological cooperation.
. Total public expenditure on education.
. Total expenditure on R&D.
See explanation of variables in the Appendix (Table AI).How are we going to carry out the analysis? First of all, this paper is not creating or
developing a new model, due to the fact that the literature does not lack models. Themain gap in the literature is the weak linkage with other economic perspectives thathave been exploring the explanation of growth, such as the innovation systemsliterature. In this vain, the paper uses intangible indicators obtained from thecompetitiveness and the innovation systems perspectives (see Nelson, 1993; Metcalfe,1995; Edquist, 2005; Fagerberg and Srholec, 2008 and the IMD and WEF reports) tocreate a simple and generic IC system. Thus, simple statistics are made in order to findaverages during the time period covered and then the indicators are standardized (seeHervas-Oliver and Dalmau (2006) or Andriessen (2004)) and aggregated, with no
JIC12,1
122

weight, to each country. Therefore, the paper shows a national IC system ranking madeof NSI-Competitiveness intangible indicators, with no distinction or any block or othernon-empirical classification.
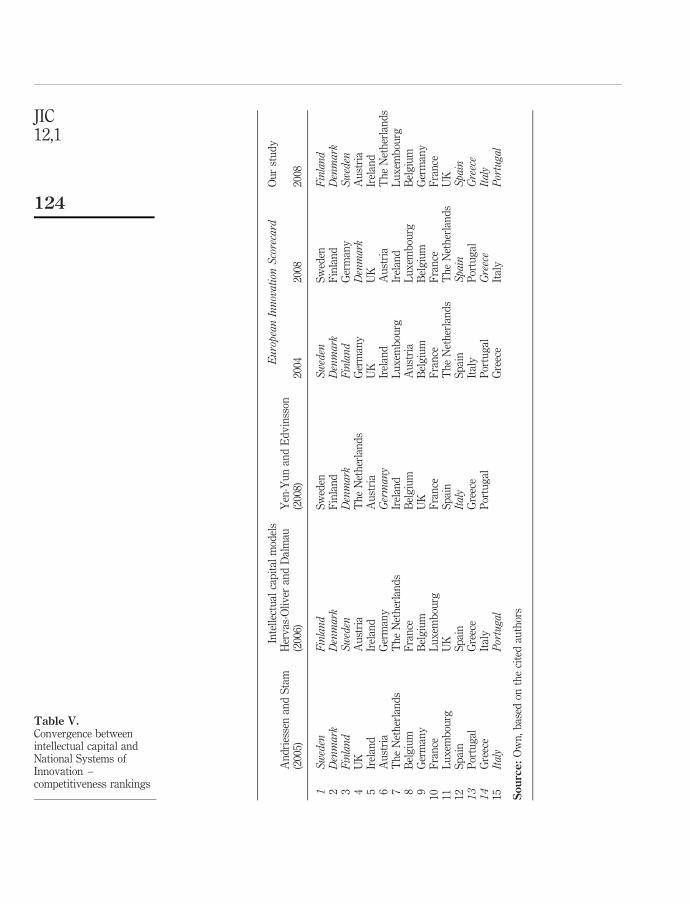
The recorded statistical results from these 28 indicators for the time frame of sevenyears prove a ranking of IC measured by variables based on the NSI for the membercountries (15) of the European Union. Our results, the same as in the rankings of themodels for the measurement of the IC of countries (see Andriessen and Stam, 2005;Hervas-Oliver and Dalmau, 2007; Yen-Yun and Edvinsson, 2008) and those of theNational Systems of Innovation (see European Commission, 2004, 2008), show that:
. The Nordic countries (Finland, Denmark, and Sweden) occupy the lead positionsof the EU rankings (15).
. The southern countries (Spain, Greece, Italy and Portugal) occupy the lastpositions of the EU rankings (15).
Consequently, the homogeneity in the empiric results based on the models of the ICs ofnations and that of the NSI prove the considerable convergence between these twotheoretic fields, confirming the stated proposition (see Table V).
4. ConclusionsThis article presents a focus for identifying the convergence or divergence between thetheory of the IC of nations and that of the NSI, rooted in the innovation perspective andthe growth theory. Therefore, the work tackled the two theoretic fields, emphasizingmainly the diverse methods of measurement, with the purpose of realizing a conceptualintegration. After selecting the 28 indicators which best fit the analyzed theoreticprinciples and taking into account the member countries of the European Union as asample (15) with the data taken from the IMD, covering a six-year (2000-2006) window,the convergence exercise was carried out. It is important to remark the fact that thispaper did not offer a new IC model due to the fact that there are abundant in theliterature and most of them lack of theoretical fundamentals.
The results, expressed through the ranking of IC based on the NSI, determine thatthe Nordic countries (Finland, Denmark, and Sweden) occupy the lead positions of theEU rankings (15). Likewise, the southern countries (Spain, Greece, Italy and Portugal)occupy the last positions of the EU rankings (15).
The homogeneity of our results, in which intangibles from competitiveness-NSIwere used, with those of other models of measurement of IC of countries (Andriessenand Stam, 2005; Hervas-Oliver and Dalmau, 2007; Yen-Yun and Edvinsson, 2008), aswell as with those obtained through the models of the National Systems of Innovation(European Commission, 2004, 2008) prove the considerable convergence between thesetwo theoretic fields, confirming the propositions posed in our study.
The paper offers interesting implications for the Academia. The paper points outthe fact that the IC of nations can be nurtured and reinforced from other economicperspectives which have been conducting important efforts in order to explore thedeterminants of competitiveness, growth and knowledge creation in nationaleconomies. In this vain, fruitful results and richer assumptions can be obtained froma cross-field integration, providing a more comprehensive theoretical framework tounderstand intangibles and growth. Second, the traditional break up of national ICbased on relational, structural and human, although useful and practical, can be
National IC andinnovation
systems
123
Inte
llec
tual
cap
ital
mod
els
EuropeanInnovation
Scorecard
Ou
rst
ud
yA
nd
ries
sen
and
Sta
m(2
005)
Her
vas
-Oli
ver
and
Dal
mau
(200
6)Y
en-Y
un
and
Ed
vin
sson
(200
8)20
0420
0820
08
1Sweden
Finland
Sw
eden
Sweden
Sw
eden
Finland
2Denmark
Denmark
Fin
lan
dDenmark
Fin
lan
dDenmark
3Finland
Sweden
Denmark
Finland
Ger
man
ySweden
4U
KA
ust
ria
Th
eN
eth
erla
nd
sG
erm
any
Denmark
Au
stri
a5
Irel
and
Irel
and
Au
stri
aU
KU
KIr
elan
d6
Au
stri
aG
erm
any
Germany
Irel
and
Au
stri
aT
he
Net
her
lan
ds
7T
he
Net
her
lan
ds
Th
eN
eth
erla
nd
sIr
elan
dL
ux
emb
ourg
Irel
and
Lu
xem
bou
rg8
Bel
giu
mF
ran
ceB
elg
ium
Au
stri
aL
ux
emb
ourg
Bel
giu
m9
Ger
man
yB
elg
ium
UK
Bel
giu
mB
elg
ium
Ger
man
y10
Fra
nce
Lu
xem
bou
rgF
ran
ceF
ran
ceF
ran
ceF
ran
ce11
Lu
xem
bou
rgU
KS
pai
nT
he
Net
her
lan
ds
Th
eN
eth
erla
nd
sU
K12
Sp
ain
Sp
ain
Italy
Sp
ain
Spain
Spain
13
Por
tug
alG
reec
eG
reec
eIt
aly
Por
tug
alGreece
14
Gre
ece
Ital
yP
ortu
gal
Por
tug
alGreece
Italy
15Italy
Portugal
Gre
ece
Ital
yPortugal
Source:
Ow
n,
bas
edon
the
cite
dau
thor
s
Table V.Convergence betweenintellectual capital andNational Systems ofInnovation –competitiveness rankings
JIC12,1
124
questioned due to the fact that similar results are obtained in IC national modelswithout any classification or weight give to any block. Put differently, it seems thatfurther reclassification of the blocks of national IC systems can be developed in order toprovide a more comprehensive and economic-friendly tool for policymakers. In ouropinion, an approach towards the above-mentioned economic perspectives’fundamentals (or blocks, in IC terminology) could enrich the IC of nation’sclassification.
The study opens new lines of research in the sense that it advocates a theoreticalapproximation and the integration of the abundant literature on the NSI as basicdrivers to explain the intangibles at a macro level, their management and politicsrelated to the maintaining and renewal of said assets of IC. Nevertheless, morefine-grained information and data are necessary to try to reflect the new economicshifts. For instance, in the new EIS version, there is a special focus on SMEs, financesources and collective activities such as design. All these new requirements should alsobe included in the national IC versions. For future research, it seems necessary todevelop a joint agenda integrating the NSI with the IC of nations. In addition, the sameexercise can be made to try to integrate the IC of firms and their innovation capability.
Notes
1. The Global Competitive Index unifies the two indexes currently produced by the WorldEconomic Forum: the Growth Competitiveness Index (McArthur and Sachs, 2001) and theBusiness Competitive Index (Porter, 2001) which has also been published for several years.
2. Institutions means, according to Nelson (2008), “the basic rules of the games”; i.e., the basicrules of the functioning of an economy, norms, regulations ( justice, legal system,bureaucracy, effectiveness of politics, etc.). We use the word “government” in this article torefer to the system of government-governance of the institutions.
3. For a comprehensive view on EIS criticism and further recommendations for improvementsee Hollanders and van Cruysen (2008, Annex 1).
4. We are really thankful to the IMD for data providing and the UPV for financial support topurchase and maintain the database. In order to have further advance in the field, we canshare the information of the database for research purposes.
References
Andriessen, D.G. (2004), Making Sense of Intellectual Capital, Butterworth-Heinemann,Burlington, MA (PhD thesis, Nyenrode University, Breukelen).
Andriessen, D.G. and Stam, C.D. (2004), “The intellectual capital of the European Union”, Centrefor Research and Intellectual Capital, Inholland University of Professional Education,Diedem, The Netherlands.
Andriessen, D.G. and Stam, C.D. (2005), “Intellectual capital of the European Union”, workingpaper presented at the 7th World Congress on the Management of Intellectual Capital andInnovation, Ontario.
ARC Seibersdorf Research GmbH (2002), Intellectual Capital Report 2002, Knowledge Shapes theFuture, Seibersdorf, Vienna.
Balconi, M., Breschi, S. and Lissoni, F. (2004), “Networks of inventors and the location ofacademic research: an exploration of Italian patent data”, Research Policy, Vol. 33 No. 11,pp. 127-45.
National IC andinnovation
systems
125

Benner, C. (2003), “Learning communities in a learning region: the soft infrastructure ofcross-firm learning networks in Silicon Valley”, Environment and Planning A, Vol. 35No. 10, pp. 1809-30.
Bergek, A., Jacobsson, S., Carlsson, B., Lindmark, S. and Rickne, A. (2008), “Analyzing thefunctional dynamics of technological innovation systems: a scheme of analysis”, ResearchPolicy, Vol. 37 No. 3, pp. 407-29.
Bontis, N. (2004), “National Intellectual Capital Index: a United Nations initiative for the Arabregion”, Journal of Intellectual Capital, Vol. 5 No. 1, pp. 13-39.
Bontis, N., Keow, W. and Richardson, S. (2000), “Intellectual capital and the nature of business inMalaysia”, Journal of Intellectual Capital, Vol. 1 No. 1, pp. 85-100.
Bounfour, A. (2003), The Management of Intangibles, Routledge, London.
Brusco, S. (1986), “Small firms and industrial districts: the experience of Italy”, EconomiaInternazionale, Vol. 39 Nos 2-4, pp. 98-103.
Celikel-Esser, F., Villalba, E. and Tarantola, S. (2008), “The Lisbon strategy and development ofmetrics to measure innovation in Europe”, Yearbook on Productivity 2007, StatisticsSweden, Orebro, pp. 7-33, available at: www.scb.se/statistik/_publikationer/OV9999_2007A01_BR_01_X76BR0801.pdf (accessed September 25, 2010).
Chaminade, C. and Edquist, C. (2005), “From theory to practice: the use of the systems ofinnovation. Approach in innovation policy”, in Hage, J. and Meeus, M. (Eds), Innovation,Science, and Institutional Change, Oxford University Press, Oxford, pp. 141-62.
Edna Pasher and Associates (1999), The Intellectual Capital of the State of Israel: A Look to theFuture, Edna Pasher and Associates, Herzlia Pitauch.
Edquist, C. (1997), Systems of Innovations: Technologies, Institutions and Organizations, Printer,London.
Edquist, C. (2005), “Systems of innovation: perspectives and challenges”, in Fagerberg, J.,Mowery, D. and Nelson, R.R. (Eds), The Oxford Handbook of Innovation, OxfordPublishers, Oxford.
Edvinsson, L. and Malone, M.S. (1997), Intellectual Capital: Realizing Your Company’s True Valueby Finding Its Hidden Brainpower, HarperBusiness, New York, NY.
Edvinsson, L. and Stenfelt, C. (1999), “Intellectual capital of nations for future wealth creation”,Journal of Human Resource Costing and Accounting, Vol. 4 No. 1, pp. 21-33.
Etzkowitz, H. and Leydesdorff, L. (2000), “The dynamics of innovation from national systemsand ‘Mode 2’ to a triple helix of university-industry-government relations”, ResearchPolicy, Vol. 29 No. 2, pp. 109-23.
European Commission (2004), RICARDIS: Reporting Intellectual Capital to Augment Research,Development and Innovation in SMEs, European Commission, Brussels.
European Commission (2008), European Innovation Scoreboard, European Commission,Brussels.
Fagerberg, J. (1987), “A technology gap approach to why growth rates differ”, Research Policy,Vol. 16 Nos 2-4, pp. 87-99.
Fagerberg, J. and Srholec, M. (2008), “National innovation systems, capabilities and economicdevelopment”, Research Policy, Vol. 37 No. 9, pp. 1417-35.
Foss, N.J. (1996), “Higher-order industrial capabilities and competitive advantage”, Journal ofIndustry Studies, Vol. 3 No. 1, pp. 1-20.
Freeman, C. (1987), Technology Policy and Economic Performance: Lessons from Japan, Pinter,London.
JIC12,1
126
Freeman, C., Clark, J. and Soete, L.G. (1982), Unemployment and Technical Innovation: A Study ofLong Waves and Economic Development, Pinter, London.
Furman, J.L., Porter, M.E. and Stern, S. (2002), “The determinants of national innovativecapacity”, Research Policy, Vol. 31 No. 8, pp. 899-933.
Galli, R. and Teubal, M. (1997), Paradigmatic Shifts in National Innovation Systems, PinterPublishers, London.
German Accounting Standards Committee (2002), GAS 12 Non-current Intangible Assets,German Accounting Standards Committee, Berlin.
Gerschenkron, A. (1962), Economic Backwardness in Historical Perspective, The Belknap Press,Cambridge, MA.
Harrison, B. (1992), “Industrial districts: old wine in new bottles?”, Regional Studies, Vol. 26 No. 5,pp. 469-83.
Harrison, B. (1994), Lean and Mean, Basic Books, New York, NY.
Hekkert, M.P. and Negro, S.O. (2009), “Functions of innovation systems as a framework tounderstand sustainable technological change: empirical evidence for earlier claims”,Technological Forecasting and Social Change, Vol. 76 No. 4, pp. 584-94.
Hervas-Oliver, J.L. and Dalmau, J.I. (2007), “Which IC components explain national IC stocks?”,Journal of Intellectual Capital, Vol. 8 No. 3, pp. 444-69.
Hervas-Oliver, J.L. and Dalmau, P. (2006), “How to measure IC in clusters: empirical evidence”,Journal of Intellectual Capital, Vol. 7 No. 3, pp. 354-80.
Hollanders, H. and van Cruysen, A. (2008), “Rethinking the European Innovation Scoreboard:recommendations for further improvements”, Improving the European InnovationScoreboard Methodology, Brussels, June 16, Inno-Metrics (revised input paper for theworkshop).
Institute for Management Development (2004), The World Competitiveness Yearbook, Institutefor Management Development, Lausanne.
Johnson, A. and Jacobsson, S. (2003), “The emergence of a growth industry: a comparativeanalysis of the German, Dutch and Swedish wind turbine industries”, in Metcalfe, S. andCantner, U. (Eds), Transformations and Development: Schumpeterian Perspectives,Physical/Springer, Heidelberg.
Klein, P.A. (2000), “National statistics, portrait of the value floor”, Journal of Economy, No. 34,pp. 445-52.
Lawson, C. (1999), “Towards a competence theory of the region”, Cambridge Journal ofEconomics, Vol. 23 No. 2, pp. 151-66.
Liu, X. and White, S. (2001), “Comparing innovation systems: a framework and application toChina’s transitional context”, Research Policy, Vol. 30 No. 7, pp. 1091-114.
Lundvall, B.A. (1992), National Systems of Innovation: Towards a Theory of Innovation andInteractive Learning, Pinter Publishers, London.
McArthur, J. and Sachs, J. (2001), “The Growth Competitive Index: measuring technologicaladvancement and the stages of development”, in Porter, M.E. and Sachs, J.D. (Eds),The Global Competitiveness Report 2001-2002, Word Economic Forum, Geneva.
McEvily, B. and Zaheer, A. (1999), “Bridging ties: a source of firm heterogeneity in competitivecapabilities”, Strategic Management Journal, Vol. 20 No. 12, pp. 1133-56.
Malhotra, Y. (2003), “Managing and measuring knowledge assets in the public sector”, workingpaper, Syracuse University, Syracuse, New York, NY.
National IC andinnovation
systems
127

Martins, B. and Viedma, J. (2005), “The region’s intellectual capital benchmarking system:tapping into a region’s economic growth potential from an intellectual capital view”,Reporting e controlli per le pubbliche amministrazioni. L’ evoluzione italiana e la prospettivainternazionale, Economy and Business Faculty, Universidad de Ferrara, Forli, November.
Maskell, P. and Malmberg, A. (1999), “Localised learning and industrial competitiveness”,Cambridge Journal of Economics, Vol. 23 No. 2, pp. 167-85.
Metcalfe, S. (1995), “The economic foundations of technology policy: equilibrium andevolutionary perspectives”, in Stoneman, P. (Ed.), Handbook of the Economics ofInnovation and Technological Change, Blackwell Publishers, Oxford/Cambridge, MA.
Nelson, R.R. (1993), National Innovation Systems: A Comparative Analysis, Oxford UniversityPress, New York, NY.
Nelson, R.R. (2008), “What enables rapid economic progress: what are the needed institutions?”,Research Policy, Vol. 37 No. 1, pp. 1-11.
Nevado, D. and Lopez, V. (2002), El capital intelectual: valoracion y medicion, Prentice-Hall,Englewood Cliffs, NJ.
Penrose, E. (1959), The Theory of the Growth of the Firm, Wiley, New York, NY.
Peteraf, M. (1993), “The corner-stones of competitive advantage: a resource-based view”,Strategic Management Journal, Vol. 14 No. 3, pp. 179-91.
Piore, M. and Sabel, C. (1984), The Second Industrial Divide, Basic Books, New York, NY.
Pomeda, J.R., Moreno, C.M. and Martil, L.V. (2002), “Towards an intellectual capital report ofMadrid: new insights and developments”, paper presented at The Transparent Enterprise,The Value of Intangibles, Madrid, November 25-26.
Porter, M. (1980), Competitive Strategy. Techniques for Analyzing Industries and Competitors,Free Press, New York, NY.
Porter, M. (1985), Competitive Advantage, Free Press, New York, NY.
Porter, M. (1990), The Competitive Advantage of Nations, The Free Press, New York, NY.
Porter, M. (2001), “The business competitiveness index”, The Global Competitiveness Report,World Economic Forum, Geneva.
Regent, S. (2002), The Open Method of Co-ordination: A Supranational Form of Governance?,DP/137/2002, International Institute for Labour Studies (ILO), Geneva, available at: www.ilo.org (accessed September 26, 2010).
Rembe, A. (1999), Invest in Sweden: Report 1999, Halls offset AB, Stockholm.
Robert Huggins Associates (2002), World Knowledge Competitiveness Index 2002:Benchmarking the Globe’s High Performing Regions, Robert Huggins Associates,Pontypridd.
Romer, P.M. (1990), “Endogenous technological change”, Journal of Political Economy, Vol. 98No. 5, pp. 71-102.
Ronde, P. and Hussler, C. (2005), “Innovation in regions: what does really matter?”, ResearchPolicy, Vol. 34 No. 8, pp. 1150-72.
Rumelt, R.P. (1984), “Towards a strategic theory of the firm”, in Lamb, R.E. (Ed.), CompetitiveStrategic Management, Prentice-Hall, Englewood Cliffs, NJ.
Russo, M. (1997), “Relazioni tra imprese e svolupo locale”, Economia e Politica Industriale, Vol. 93,pp. 105-37.
Sala-i-Martin, X. and Artadi, E.V. (2004), “The global competitiveness index”, The GlobalCompetitiveness Report, World Economic Forum, Geneva.
JIC12,1
128
Smedlund, A. and Poyhonen, A. (2005), “Intellectual capital creation in regions: a knowledge systemapproach”, in Bounfour, M. and Edvinsson, L. (Eds), Intellectual Capital for Communities,Nations and Regions, Cities, Districts, Elsevier-Butterworth-Heinemann, Burlington, MA.
Stahle, P. and Bounfour, A. (2008), “Understanding dynamics of intellectual capital”, Journal ofIntellectual Capital, Vol. 9 No. 2, pp. 164-77.
Stahle, P. and Poyhonene, A. (2005), “Intellectual capital and national competitiveness: a criticalexamination. Case Finland”, Proceedings of 6th European Conference of KnowledgeManagement (ECKM), University of Limerick, ECKM.
Stenfelt, C. et al. (1996), Welfare and Security for Future Generations, Market Academy,Stockholm University, Stockholm.
Viedma, J.M. (1999), “ICBS intellectual capital benchmarking system”, paper presented at the3rd World Congress on Intellectual Capital, McMaster University, Hamilton.
Viedma, J.M. (2002), “SCBS social capital benchmarking system”, paper presented at the5th World Congress on Intellectual Capital, McMaster University, Hamilton.
Viedma, J.M. (2003), “CICBS: cities’ intellectual capital benchmarking system. A methodologyand a framework for measuring and managing intellectual capital of cities. a practicalapplication in the City of Mataro”, paper presented at the 6th World Congress onIntellectual Capital, McMaster University, Hamilton.
Yen-Yun, C. and Edvinsson, L. (2008), “National intellectual capital: comparison of the Nordiccountries”, Journal of Intellectual Capital, Vol. 9 No. 4, pp. 525-45.
Further reading
Bounfour, A. and Edvinsson, L. (2004), IC for Communities, Nations, Regions, Cities, and OtherCommunities, Butterworth-Heinemann, Boston, MA.
Danish Agency for Trade and Industry, Ministry of Trade and Industry (2000), “A guideline forintellectual capital statements – a key to knowledge management”, available at: www.pnbukh.dk/site/10186.htm (accessed October 20, 2009).
Edquist, C. and Johnson, B. (1997), “Institutions and organisations in systems of innovation”,in Edquist, C. (Ed.), Systems of Innovation, Pinter, London, pp. 41-63.
European Commission (2001), European Innovation Scoreboard, European Commission, Brussels.
Hair, J.F. Jr, Anderson, R.E., Tatham, L.T. and Black, W.C. (1995), Multivariate Data Analysis,4th ed., Prentice-Hall, Upper Saddle River, NJ.
Norwegian Association of Financial Analyst (2002), “Guidelines for reporting on knowledgecapital”, available at: www.larvik.kommune.no; www.finansalytiker.no; www.nordicinnovation.net
Porter, M. (1998), “Clusters and the new economics of competition”, Harvard Business Review,Vol. 76 No. 6, pp. 77-90.
Proyecto Intellectus (2003), Modelo Intellectus: Medicion y Gestion del Capital Intelectual, Centrode Investigacion sobre la Sociedad del Conocimiento (CIC), Madrid.
Proyecto Meritum (2002), “Directrices para la gestion y difusion sobre intangibles: informe decapital intelectual”, available at: www.uam.es/proyectosinv/meritum/Link%20Guidelines%20Meritum/version%20espanola%20completa.pdf
Society for Knowledge Economics (2005), Australian Guiding Principles on Extended PerformanceManagement: A Guide to Better Managing, Measuring and Reporting Knowledge-IntensiveOrganisational Resources, Society for Knowledge Economics, Crows Nest.
National IC andinnovation
systems
129

Appendix
Variable Description
1 Pupil-teacher ratio (primary education) Ratio of students to teaching staff
2 Pupil-teacher ratio (secondary education) Ratio of students to teaching staff
3 Secondary school enrollment Percentage of population that has attained at leasttertiary education for persons 25-34
4 Educational system The educational system meets the needs of acompetitive economy
5 University education University education meets the needs of acompetitive economy
6 Qualified engineers Qualified engineers are available in your labormarket
7 Entrepreneurship Entrepreneurship of managers is widespread inbusiness
8 Employee training Employee training is high priority in companies
9 Competent senior managers Competent senior managers are readily available
10 Brain drain Brain drain (well-educated and skilled people) doesnot hinder competitiveness in your economy
11 Flexibility and adaptability Flexibility and adaptability of people are high whenfaced with new challenges
12 Image abroad The image abroad of your country encouragesbusiness development
13 Justice Justice is fairly administered
14 Sustainable development Sustainable development is a priority in companies
15 Basic research Basic research does not enhance long-termeconomic development
16 Youth interest in science Youth interest in science is strong
17 Total R&D personnel nation-wide per capita Full-time equivalent (FTE) per 1,000 people
18 Total R&D personnel in business per capita Full-time equivalent (FTE) per 1,000 people
19 Venture capital Venture capital is easily available for businessdevelopment
20 Competition legislation Competition legislation is efficient in preventingunfair competition
21 Development and application of technology Development and application of technology aresupported by the legal environment
22 Bureaucracy Bureaucracy does not hinder business activity
23 Intellectual property rights Intellectual property rights are adequately enforced
24 International transactions International transactions can be freely negotiatedwith foreign partners
25 Knowledge transfer Knowledge transfer is highly developed betweencompanies and universities
26 Technological cooperation Technological cooperation between companies isdeveloped
27 Total public expenditure on education $US per capita
28 Total expenditure on R&D Percentage of GDP
Source: Own, from IMD
Table AI.Description of thevariables
JIC12,1
130

About the authorsJose-Luis Hervas-Oliver has a PhD from the Universidad Politecnica de Valencia (Spain) and hasbeen published in the Journal of Economic Geography, Entrepreneurship and RegionalDevelopment, European Planning Studies, International Journal of Technology Management,International Journal of Information Management, Asian Journal of Technology Management,Journal of Intellectual Capital, among others. He is Assistant Professor at the Florida StateUniversity, International Programs and Professor at the Universidad Politecnica de Valencia(Spain). His research interests are in innovation systems, clusters, economic geography,competitiveness and business strategy. Jose-Luis Hervas-Oliver is the corresponding author andcan be contacted at: [email protected]
Ronald Rojas has recently gained his PhD from the Universidad Politecnica de Valencia(Spain). His research interests are in innovation systems, clusters, economic geography,competitiveness and business strategy.
Blanca-Maria Martins obtained her PhD from the Universidad Politecnica de Catalunya(Spain). Her research interests are in intellectual capital, intangibles and competitiveness. She isvery active managing international projects, especially in Europe on IC systems.
Roberto Cervello-Royo is Assistant Professor at the Economics and Social SciencesDepartment in the Universidad Politecnica de Valencia, Spain. He has been Research Fellow inthe Department of Real Estate and Planning, University of Reading during 2007. He is authorand co-author of several papers and books concerning regional and urban economics, landeconomics and management sciences.
National IC andinnovation
systems
131
To purchase reprints of this article please e-mail: [email protected] visit our web site for further details: www.emeraldinsight.com/reprints