Concilia Palamitica s. XIV (art. in Enc. orthodoxa 37, 2015)

INTERNATIONAL HYDROGRAPHIC REVIEW MAY 2014
THE
INTERNATIONAL
HYDROGRAPHIC
REVIEW
INTERNATIONAL HYDROGRAPHIC ORGANIZATION
MONACO
Publication P-1
No. 11 MAY 2014

2
INTERNATIONAL HYDROGRAPHIC REVIEW MAY 2014
© Copyright International Hydrographic Organization [2014]
This work is copyright. Apart from any use permitted in accordance with the Berne Conven-tion for the Protection of Literary and Artistic Works (1886), and except in the circumstances described below, no part may be translated, reproduced by any process, adapted, communi-cated or commercially exploited without prior written permission from the International Hydrographic Bureau (IHB). Copyright in some of the material in this publication may be owned by another party and permission for the translation and/or reproduction of that material must be obtained from the owner.
This document or partial material from this document may be translated, reproduced or distributed for general information, on no more than a cost recovery basis. Copies may not be sold or distributed for profit or gain without prior written agreement of the IHB and any other copyright holders.
In the event that this document or partial material from this document is reproduced, translated or distributed under the terms described above, the following statements are to be included:
“Material from IHO publication [reference to extract: Title, Edition] is reproduced with the permission of the International Hydrographic Bureau (IHB) (Permission No ……./…) acting for the International Hydrographic Organization (IHO), which does not accept responsibility for the correctness of the material as reproduced: in case of doubt, the IHO’s authentic text shall prevail. The incorporation of material sourced from IHO shall not be construed as constitut‐ing an endorsement by IHO of this product.”
“This [document/publication] is a translation of IHO [document/publication] [name]. The IHO has not checked this translation and therefore takes no responsibility for its accuracy. In case of doubt the source version of [name] in [language] should be consulted.”
The IHO Logo or other identifiers shall not be used in any derived product without prior written permission from the IHB.

3
INTERNATIONAL HYDROGRAPHIC REVIEW MAY 2014
By Ian HALLS, Editor
- No Solace from SOLAS.
by : Ian RUSSEL (UK)
□ Editorial
□ Articles
- The AGS 61 “CABO DE HORNOS” New Chilean Scientific Research Vessel.
by : Captain Fernando MINGRAM (Chile)
□ Notes
555
777
212121
313131
494949
- Next generation paper chart.
by : Ian HALLS (Australia)
- Research on the design of survey lines in a marine magnetic survey
by : Gang BIAN (China) Wei XIA (China) Shaohua JIN (China) Fumin XIAO (China) Xinxuan SUN (China) Yang CUI (China)
- IC-ENC ENC Validation Training Course.
by : Laura TYZACK (Greece) Panagiotis GKIONIS (Greece)
535353

4
INTERNATIONAL HYDROGRAPHIC REVIEW MAY 2014
Page intentionally left blank

5
INTERNATIONAL HYDROGRAPHIC REVIEW MAY 2014
Editorial
This edition comprises three Articles and two Notes. The first Article discusses the need for continued survey and charting in key oceanic areas. Despite all the modern technology available, mishaps at sea continue to occur. As ships become larger in size and venture further away from regularly surveyed routes, there is a constant need for hydrographic agencies to provide hydrographic services, capability and up-to-date, comprehensive nautical products. The paper identifies a number of key issues regarding navigation safety and the associated risks. The author also provides examples of technologies to help fill data gaps and describes some risk assessment initiatives being undertaken to prioritise activities. The second Article is penned by myself. The Australian Hydrographic Office (AHO) is currently updating its information management and production systems. Having recently achieved full ENC coverage of its waters, the AHO is stepping out and actively encouraging nautical chart users to adopt ENCs for navigation. The AHO will cease production of its Raster Navigation Chart (RNC) in July 2014 bringing to a close an interim electronic charting solution introduced in the early 2000’s. As the uptake of ENCs continues, together with the challenge of supporting paper nautical chart and ENC production and distribution, I have raised the question regarding multiple data portrayals for charting products and the possibility to create a new paper chart product that is derived from the ENC data with a predominant S-52 (ECDIS) portrayal as well as possible plotting options – HO and user. Our third Article outlines a method to improve the precision and efficiency of marine magnetic surveys. Using detailed simulations, the authors identify evaluation methods using magnetic anomaly maps the interpolation precision between survey lines to assist in determining optimal survey line configuration. The first of the two Notes provides the rationale for the Chilean Navy to purchase a new scientific research vessel. The Note provides a brief history of the marine research programme and a description of the vessel along with examples of survey and oceanographic expeditions to test the vessel’s capability. The second Note reviews the latest ENC validation training course established by IC-ENC and provides real-world examples of issues with ENC encoding inconsisten-cies. The paper describes the role IC-ENC and the close relationship with HOs to rectify the issues. Australia has a local IC-ENC presence and I support this training initiative. This is a valuable resource that IC-ENC provide in improving ENC data qual-ity and identifying issues with adjoining ENCs produced by other Nations. This course would be very useful for HO ENC production staff to undertake. On behalf of the Editorial Board, I hope that this edition is of interest to you. Thank you to the authors for your contributions and to my colleagues who provided peer reviews for the articles in this edition.
Ian W. Halls Editor

6
INTERNATIONAL HYDROGRAPHIC REVIEW MAY 2014
Page intentionally left blank

7
INTERNATIONAL HYDROGRAPHIC REVIEW MAY 2014
NO SOLACE FROM SOLAS
The Effects that Deeper Draughts and the ENC are having on Safe Navigation
By Ian RUSSELL (FRICS, MNI - UK)
Abstract
Résumé
Resumen
Chapter V Regulation 9 of the SOLAS Convention, annexed for reference, requires contracting governments to provide hydrographic services. Many signatories cannot provide these unaided. This is despite the fact that new cruise ship itineraries and trade routes are being established in their waters for increasingly larger and deeper draught vessels. This article reviews a number of chart related casualties. These demonstrate that no chart, paper or digital, is infallible. This emphasizes the urgent need for new and better hydrographic data collection in some key oceanic areas. Potential innovative solutions for data acquisition and hydrographic capacity building strategies are considered.
La règle 9 du chapitre V de la convention pour la sauvegarde de la vie humaine en mer (SOLAS), annexée à titre de référence, impose aux gouvernements contractants de fournir des services hydrographiques. Un grand nombre de signataires ne peuvent fournir ces services sans aide. Et ce, en dépit du fait que de nouvelles routes commerciales et de nouveaux itinéraires pour les navires de croisière soient adoptées dans leurs eaux pour des navires de plus en plus grands et aux tirants d’eau de plus en plus importants. Cet article examine un certain nombre de pertes liées aux cartes marines. Ces dernières illustrent le fait qu’aucune carte, papier ou numérique, n’est infaillible. Ceci souligne le besoin urgent de recueillir des nouvelles données hydrographiques de meilleure qualité dans certaines zones océaniques clés. Des solutions potentiellement innovantes pour l’acquisition des données et des stratégies de renforcement des capacités hydrographiques sont examinées.
El Capítulo V de la Regla 9 de la Convención SOLAS, que se adjunta como referencia, requiere que los gobiernos contratantes proporcionen servicios hidrográficos. Muchos signatarios se ven ante la imposibilidad de proporcionar dichos servicios sin ayuda. Esto sucede a pesar del hecho que se están estableciendo nuevos itinerarios para los buques de cruceros y que se están estableciendo rutas comerciales en sus aguas para buques cada vez mayores y de calado más profundo. Este artículo examina un número de accidentes desafortunados relacionados con las cartas. Estos demuestran que ninguna carta, ya sea de papel o digital, es infalible. Lo anterior destaca la urgente necesidad de contar con una colección de datos hidrográficos nueva y mejor en algunas zonas oceáni-cas clave. Se consideran posibles soluciones innovadoras para la adquisición de datos y para nuevas estrategias de creación de capacidades hidrográficas.
8
INTERNATIONAL HYDROGRAPHIC REVIEW MAY 2014
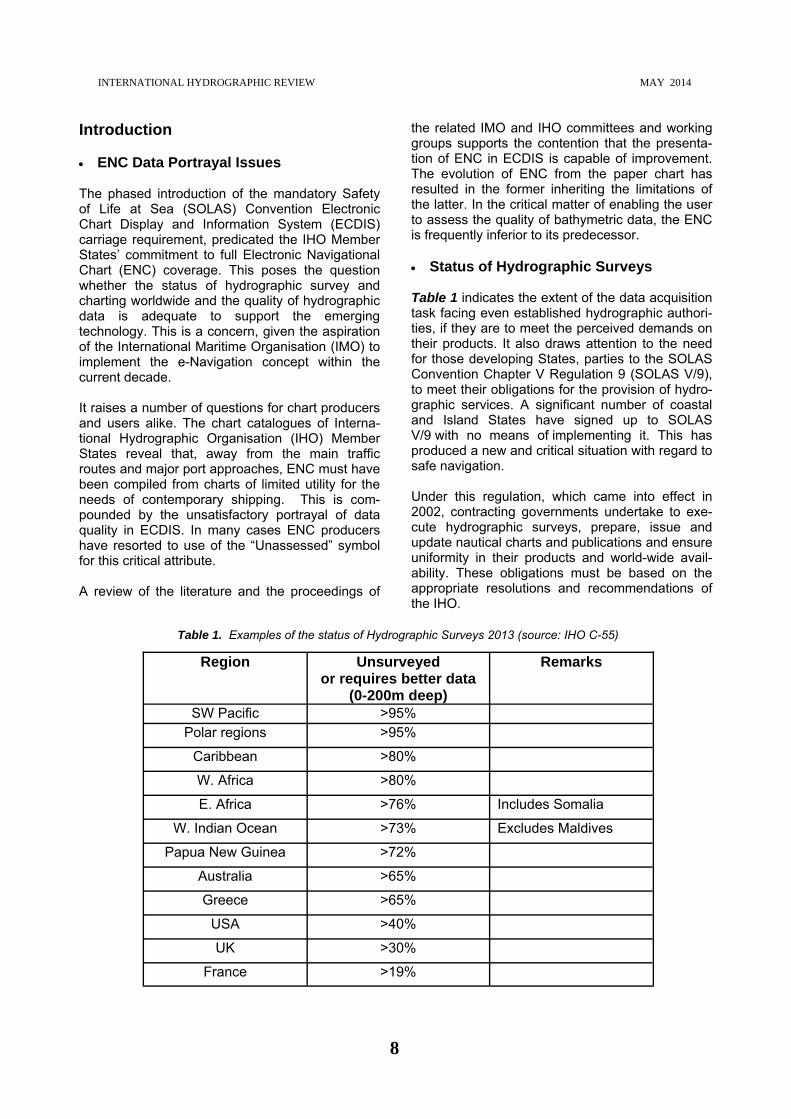
Introduction ENC Data Portrayal Issues The phased introduction of the mandatory Safety of Life at Sea (SOLAS) Convention Electronic Chart Display and Information System (ECDIS) carriage requirement, predicated the IHO Member States’ commitment to full Electronic Navigational Chart (ENC) coverage. This poses the question whether the status of hydrographic survey and charting worldwide and the quality of hydrographic data is adequate to support the emerging technology. This is a concern, given the aspiration of the International Maritime Organisation (IMO) to implement the e-Navigation concept within the current decade. It raises a number of questions for chart producers and users alike. The chart catalogues of Interna-tional Hydrographic Organisation (IHO) Member States reveal that, away from the main traffic routes and major port approaches, ENC must have been compiled from charts of limited utility for the needs of contemporary shipping. This is com-pounded by the unsatisfactory portrayal of data quality in ECDIS. In many cases ENC producers have resorted to use of the “Unassessed” symbol for this critical attribute. A review of the literature and the proceedings of
the related IMO and IHO committees and working groups supports the contention that the presenta-tion of ENC in ECDIS is capable of improvement. The evolution of ENC from the paper chart has resulted in the former inheriting the limitations of the latter. In the critical matter of enabling the user to assess the quality of bathymetric data, the ENC is frequently inferior to its predecessor. Status of Hydrographic Surveys Table 1 indicates the extent of the data acquisition task facing even established hydrographic authori-ties, if they are to meet the perceived demands on their products. It also draws attention to the need for those developing States, parties to the SOLAS Convention Chapter V Regulation 9 (SOLAS V/9), to meet their obligations for the provision of hydro-graphic services. A significant number of coastal and Island States have signed up to SOLAS V/9 with no means of implementing it. This has produced a new and critical situation with regard to safe navigation. Under this regulation, which came into effect in 2002, contracting governments undertake to exe-cute hydrographic surveys, prepare, issue and update nautical charts and publications and ensure uniformity in their products and world-wide avail-ability. These obligations must be based on the appropriate resolutions and recommendations of the IHO.
Region Unsurveyed or requires better data
(0-200m deep)
Remarks
SW Pacific >95% Polar regions >95%
Caribbean >80%
W. Africa >80%
E. Africa >76% Includes Somalia
W. Indian Ocean >73% Excludes Maldives
Papua New Guinea >72%
Australia >65%
Greece >65%
USA >40%
UK >30%
France >19%
Table 1. Examples of the status of Hydrographic Surveys 2013 (source: IHO C-55)

9
INTERNATIONAL HYDROGRAPHIC REVIEW MAY 2014
The International Hydrographic Bureau (IHB), as the Secretariat of the IHO, provides guidance, advice and support in all hydrographic areas, in particular to those countries interested in establish-ing or expanding their hydrographic capabilities in order to fully satisfy the obligations of the new regulation. The IHO Capacity Building Strategy policy document was published in 2006 to provide guidance on the implementation of this remit. The strategy is currently under review as discussed later. The advent of deeper draught shipping has in-creased the urgency for national programmes to review and upgrade coverage based on surveys carried out before the development of sidescan sonar and multi-beam echo sounder (MBES). The increasing tendency of cruise liners to seek new routes, anchorages, and port calls, has high-lighted the need for more rigorous survey of areas which were originally explored in the nineteenth century. This is a major challenge for developing hydrographic services in the Caribbean, Indian Ocean and SW Pacific areas.
The projected increase in commodity shipments to and from the emerging economies and the continu-ing search for and exploitation of new mineral de-posits is having similar consequences elsewhere e.g. Indonesia, Papua New Guinea and the South China Sea. Significantly there is no information available on the status of hydrographic surveying in Indonesia or the disputed Paracel and Spratly Islands in the South China Sea. An example of some of the work needed else-where, is that for updating the 1970’s single beam echo sounder surveys of the Malacca Strait. This has been requested by the International Chamber of Shipping (ICS). It would significantly enhance the utility of the proposed Malacca and Singapore Straits Marine Electronic Highway. Commercial survey companies have the capacity to undertake the work if funding is forthcoming. Deeper Ships Dangerous Seas Table 2 shows the progressive increase in the size of vessels.
Table 2. Progressive increase in the size of vessels. The dimensions of those now at sea and on order, reflect the shipping industry’s response to changing operational and trading patterns.

10
INTERNATIONAL HYDROGRAPHIC REVIEW MAY 2014
Contemporary vessel draughts have dictated the survey and charting requirements and the depth criteria for the definition of a dangerous wreck. For UKHO this is currently 28m (15 fathoms). Until 1960 it was only 14.6m (8 fathoms). Despite a steady increase in the length of cruise ships the draught of the current vessels in service has not increased proportionately and averages 8.4m. The increased length will mean that unless host ports can expand and deepen berthing areas and approach channels, more attention will need to be given to surveying roadstead anchorages. An example of the work required is shown in Figure 1.
Cruise ships are now venturing into increasingly remote and poorly charted areas such as the Polar Regions, SW Pacific, Indian Ocean and the Carib-bean. Itineraries that seek to provide optimum passenger experience could have unintended consequences. Cruise Ship Crashes An example of what such ventures may lead to occurred in January 1971 when the French pas-senger liner Antilles (l.o.a.183m, beam 24.4m and
draught 8m), recently converted into a cruise ship, on passage from La Guaria in Venezuela to Barba-dos, struck an uncharted reef half a mile off the NW coast of Mustique in the passage which separates that island from Baliceaux in the Grenadine Islands. As the ship proceeded at a speed of 16 knots, the impact caused her to break in two, catch fire and become a total loss. The passage being attempted was through appar-ently open water, with charted depths of 13 and 16 metres some 3½ cables (640m) wide, between two rock outcrops, in a coral and reef-strewn area last surveyed in the 19th century. This followed an alteration to the planned voyage. It was authorised by the master in order, as the subsequent legal proceedings revealed, 'to provide his passengers with a better look at this enchanting isle’ and was consistent with his desire to implement the Owner's policy of making Antilles' cruises enter-taining and unique. Two decades later another ocean liner undertaking a cruise provided a further example of the danger involved in such a vessel operating in inshore wa-ters. In August 1992, Queen Elizabeth 2 (l.o.a. 294m ((63 ft), beam 32m (105 ft), draught 9.85m (32 ft)) grounded on uncharted and previously un-surveyed rocks to the south of Cuttyhunk Island, off the east coast of the USA. She was then on passage from Martha's Vineyard to New York. In trying to make up time for an ETA at her next port of call, speed was increased to about 25 knots. This was not warranted by the general depth of water and induced 4 feet of squat. Consequently the vessel grounded on rocks which a subsequent survey found to have a least depth of 33 and 34 feet. The charted least depth in the vicinity was 39 feet; this was confirmed by the re-survey. The na-ture of the seabed was shown as rock. The owners of the QE2 sued the USA for negligence on the part of the charting authority for failing to carry out a more thorough hydrographic survey of the area. In particular, they claimed that the 39 foot sounding had not been examined. The charting authority stated that there was no reason to develop the 39 foot sounding further because it was outside the normal shipping lanes and that in 1939, when the area had last been surveyed, large vessels such as the QE2 never frequented those waters. The court accepted this argument and dismissed the claim. In April 2000, the “Adventure” cruise ship World Discoverer (l.o.a. 87m, beam 15m, draught 4.57m) grounded on a large allegedly uncharted rock or
Figure 1. Antigua 2011 - Full seafloor coverage of St John’s Harbour and St John’s Roads (last surveyed in 1849)
Source UKHO [1] presentation to Meso-American and Caribbean Hydrographic Commission. Extract from Admiralty Chart 2065 © Crown Copyright and/or database rights. Reproduced by permission of the Controller of Her Majesty’s Stationery Office and the UK Hydrographic Office (www.ukho.gov.uk)

11
INTERNATIONAL HYDROGRAPHIC REVIEW MAY 2014
reef in Sandfly Passage, Solomon Islands. The ship was fatally holed and the master beached her in Roderick Dhow Bay, where the hulk remains.
Neither the Australian Hydrographic Service nor the UK Hydrographic Office, the Primary Charting Authority, has any record of the incident. The stranded wreck of World Discover is clearly visible on Google Earth, but is not shown on the latest (2012) edition of chart BA 1713. The Pacific Island Pilot, current at the date of the incident, advises that; “Deep-draught vessels should not attempt the passage owing to the reefs in the N entrance.” The latest (2007) edition of the Pilot directs vessels west of Mid Reef; passing clear of the 9.1m patch. This remains the least depth shown in the passage other than the reef itself. Uncharted Rock Such dangers also exist for large cargo vessels navigating in poorly charted waters to service the exploitation of newly-found mineral resources. A prime example occurred in late 2010. The bulk carrier Noble Hawk (l.o.a.190m (623 ft), beam 33m (108 ft), draught 12.5m (41 ft)), starting a passage to China from Pulau Mabuli on Halmahera Island in Eastern Indonesia, grounded on an uncharted 5m (16 ft) shoal. The surrounding depths were 29 to 32 fms (53 to 58m). Her course lay across Teluk Buli which is much encumbered with islets, reefs and shoals. She was loaded with nickel ore embarked from a berthing facility somewhere on
the coast of the bay, which does not seem to have been charted. However, jetties with vessels along-side and a large ship offshore can be seen on Google Earth. As can what appear to be open cast mineral workings.
Early in 2012 the Indonesian Navy Hydrographic Service (DISHIDROS) carried out a single beam
and sidescan sonar survey of the grounding site and found a least depth of 3m (10 feet) and an adjacent depth of 15.3m (8fm 2 feet) in general depths of 50m (27fms). Mindful of the significant activity of large cruise ships and bulk carriers in these waters, DISHIDROS recommended the installation of a navigation beacon on the feature. It is uncertain whether or not this recommendation has yet been acted upon. Oceanic Dangers The significant draughts in the Table 2 are those of the large cargo vessels which now exceed 17m and are as much as 24.5m. New Panamax vessels transiting the Caribbean may not be able to do so with the same confidence as their predecessors. Elsewhere ULCC and large bulk carriers are vulnerable to an encounter with an uncharted seamount rising close to the surface. In the deep areas of the ocean, most mariners consider that there is little chance of such a mishap. Unfortu-nately, this is a misconception. In 1973 the cargo ship Muirfield, with a draught of 16m, was on passage from the Cape of Good Hope to Selat Sunda. There was a 2-3m swell running when she struck the top of a seamount, 75
Figure 3. Sketch map derived from Chart BA 2788 showing position of grounding in relation to Noble Hawk’s departure point, adjacent depths and shoal areas.
Figure 2. Portion of chart BA 1713 current at the time of the grounding showing the shoals in the northern entrance to Sandfly passage, on which it is presumed World Discover struck and her final resting place in Roderick Dhu Bay. [2].
Extract from Admiralty Chart 1713 © Crown Copyright and/or database rights. Reproduced by permission of the Controller of Her Majesty’s Stationery Office and the UK Hydrographic Office (www.ukho.gov.uk)

12
INTERNATIONAL HYDROGRAPHIC REVIEW MAY 2014
miles south west of the Cocos Islands. A subse-quent survey showed this to be half a mile in extent; with a least depth of 18m in charted depths of over 5,000 metres. Two further examples of navigationally significant seamounts, discovered in the South Atlantic and Indian Ocean, include Vema Seamount (with a charted depth of 11 metres - about 1,000 km west-north-west of Cape Town) and Walters Shoal Seamount (with a charted depth of 15 metres - about 400 nautical miles south of Madagascar). These seamounts rise up from ocean depths of about 4,000 and 2,000 metres respectively. More than 90% of all seamounts greater than 1km in height (estimated to be more than100,000) are unobserved by either ship soundings or satellite gravity [3]. This observation is consistent with the statement in IHO publication C-55 that renewed attention needs to be given to the disproving of vigias especially adjacent to the maritime shipping routes in the Pacific and adjacent seas. The dan-ger to submarine navigation is self evident. This is exemplified by the incident involving a nuclear powered submarine of the US Pacific fleet that collided with a seamount about 364 nautical miles southeast of Guam. The submarine was travelling at maximum speed at a depth of 525 feet (160 m). The seamount that she struck did not appear on the chart in use at the time of the accident. Other charts available for use showed an area of "discoloured water", an indica-tion of the probable presence of a seamount. The US Navy investigation [4] determined that informa-tion regarding the seamount should have been transferred to the charts in use; particularly given the relatively uncharted nature of the ocean area that was being transited and that the failure to do so represented a failure to follow proper proce-dures. Fortunately the pressure hull was not breached enabling the submarine to surface and be escorted to Guam for temporary repairs. Caveat Navigator This submarine accident is indicative of the fact that the failure to make proper use of limited charted information, whether on paper or a screen, applies as much to the bridge personnel of naval vessels as to those of commercial vessels. The unsatisfactory portrayal of the reliability of charted information in ECDIS means even more caution needs to be currently exercised by mariners when away from regular routes. Two further examples, although separated by more than 40 years, are pertinent to this general discussion.
In June 1970 a fleet auxiliary vessel of the Royal Navy, the tanker Ennerdale, (l.o.a. 744 ft (227m), beam 98 ft (30m), draught 40 ft (12m)) struck a rock pinnacle about 8 miles NNE of Port Victoria in the Seychelles. This opened up her starboard side, causing her to heel over and settle on the seabed. The pinnacle, which was charted at 9fms (16.5m), lay adjacent to a 10fm sounding in gen-eral depths of 13 to 16fms. The vessel, travelling at 12kts, was crossing a line of pinnacles and islet outcrops which extend north eastwards from the north tip of the Island of Mahé within the 20 fathom line. The chart in use was compiled from a 19th century (lead line) survey, as clearly stated in the title block. Considering this fact the least depth of water over the pinnacle (subsequently established at 10.8m (35ft)) may well not have been shown on the chart in use. However, there was sufficient indication on the chart that shoaler water may well have existed in the vicinity. The prime cause of the accident, leading to a total loss of the vessel, was poor execution of the navigational departure plan, which would otherwise have taken the vessel clear of the danger. A far more recent incident took place in January 2013, when a mine counter-measures vessel USS Guardian (l.o.a. 68m (224 ft), beam 12m (39 ft), draught 4m (13 ft)) ran aground on Tubbataha reef in the Sulu Sea. On the coastal scale Digital Nautical Chart (DNC) being used the reef was positioned 8 miles to the east of its correct position, in contradiction to the general scale DNC and the standard paper chart. Unfortunately, the approved voyage plan in the Voyage Management System used the coastal DNC and no attempt was made to investigate the discrepancy. This decision was based on the supposition that it was well known 'that general charts are inaccurate', a remark which, aided by the bridge team's prefer-ence to rely on the DNC rather than to take correc-tive action when a light on the reef was raised, resulted in the total loss of the ship. The focus for future survey effort: some examples Traffic Routing Traffic surveys using the satellite Automatic Identi-fication System (AIS) can provide preliminary indications of where future data acquisition effort might need to focus. This can be augmented in consultation with the IMO and representative

13
INTERNATIONAL HYDROGRAPHIC REVIEW MAY 2014
industry bodies such as, the International Chamber of Shipping (ICS), the International Association of Independent Tanker Owners (INTERTANKO), the International Association of Dry Cargo (INTERCARGO), and the Baltic and International Maritime Council (BIMCO).
In Figure 4, AIS data marks the route through Papua New Guinea waters from Eastern Australian to Asian ports and substantiates the assessment that:
Papua New Guinea is experiencing a marked increase in the volume of international ship traffic through its waters. It is estimated that some 7,360 ships transited its waters in 2012. The majority of this traffic was to and from ports on the eastern seaboard of Australia. There are growing risks to the safety of navigation and protection of the sensitive marine environment associated with this increasing traffic. Areas of particular concern are Jomard Entrance and the area east of Rossel Island. However, the quality (Zone of Confidence or ZOC) of the hydrographic surveys in the Jomard Entrance area is category "C". Therefore, it would be necessary to improve hydrographic information available for the area, before any ship routeing systems are established.
C-55 notes that the banks and vigias near Coetivy Island (Seychelles) lie on the flanks of a trans-ocean sea-lane and require thorough examination. This route is used by ships transiting the Mozambique Channel and turning eastward north of Madagascar. Similarly surveys are required south of Mauritius as ships divert eastwards from the shortest route to the Gulf to avoid pirates as evident from Figure 5.
The French Hydrographic Service (SHOM) completed a route survey in the Mozambique Channel in 2010 for the Western Indian Ocean (WIO) Marine Highway. SHOM is deploying a survey vessel to the Indian Ocean again in 2014 and there is mention of a survey en-route of a possible gap (unspecified) in the Highway. Recent (2012) Satellite AIS data (refer Figure 5) clearly shows where survey priorities should lie. Even though the situation in the Mozambique Channel is probably understated as vessels frequently turn off their AIS to avoid revealing their position to pirates. Ships diverting south of Mauritius now pass closer to that island to embark or disembark security personnel. The pattern of risk to the region’s ecosystems has therefore changed, increasing the exposure of the south coast of Madagascar, Mauritius, Rodrigues and the Maldives. In hindsight the route survey in the Mozambique Channel was perhaps not the best use of limited deep water multibeam survey resources. The WIO Marine Highway Development (MHD) project participants’ proposal to establish a new recom-mended route for all ships in the Mozambique Channel was rejected by IMO Member Sates. The route would have been approximately 1,000 miles long. The compelling need for the measure was
Figure 4. Ship traffic in the vicinity of Jomard Entrance, Papua New Guinea
Taken from NAV 59/INF.3 31 May 2013 [5] Extract of Chart Aus 4621 Copyright Commonwealth of Australia (2011). Used with permission of the Australian Hydrographic Service.
Figure 5. Satellite AIS data in the WIO Marine Highway Development area
Image from presentation by South African Marine Safety Agency (SAMSA) on the results of the Global Environ-mental Facility (GEF) - Western Indian Ocean Marine High-way Development and Coastal and Marine Contamination Prevention Project.

14
INTERNATIONAL HYDROGRAPHIC REVIEW MAY 2014
unclear. No statistical evidence had been provided regarding shipping casualties or near misses. This omission made it very difficult to quantify the antici-pated benefit that the proposal might have delivered. The route would have needlessly denied the full use of a wide deep water channel. It was felt that concentrating shipping into restricted lanes could potentially have increased the risk of collision. The refusal of the IMO to designate a recom-mended route through the Mozambique Channel could have unintended consequences for any fu-ture international effort to focus survey effort on routes rather than the traditional area sur-veys. Although the Mozambique Channel was not a typical case, the World Bank’s assessment [6] of the WIO MHD project found that ‘the relevance of the marine highway concept to increase the safety and efficiency of navigation in the Mozambique Channel is questionable’ and that ‘The Mozam-bique Channel is not appropriate for such a scheme for two reasons: it is wide (400 km wide at the narrowest point), and the density of the traffic is relatively low’. Need and Risk Assessment The figures used to determine percentages of the seas and oceans remaining poorly charted or not
at all, while alarming, are perhaps unrepresenta-tive of the practical situation. Rather what is needed is a figure for that portion of useable sea space suitable for shipping that is in urgent need of survey. As a starting point one might refer to the routes in UKHO’s NP136 (Ocean Passages for the World). An example of which is given in Figure 6. Details of current and potential cruise ship destina-tions can be sought from operators. Analysis is required of the likely demands for updated charts to support emerging new trading patterns. These will be associated with developing exploitation and shipment of mineral resources and hydro carbons and with consumer demand and export growth in the emerging economies of this decade and beyond. It should not be automatically assumed that all charts compiled from single beam echo sounder surveys are no longer fit for purpose. Particularly if used with appropriate discernment and where relevant, complemented by modern aids to collision avoidance such as masthead CCTV and forward looking sonar. An alternative to the latter in inshore tropical waters and when entering and leaving harbour, might be a bow lookout with Polaroid glasses. Such measures, complementing the existing careful and informed appraisal of legacy data by Hydrographic Offices, could well result in some reduction in the perceived magni-tude of the re-survey requirement.
Figure 6. Ocean routes in the Western Indian Ocean marine Highway Development project area
Source: Admiralty Ocean Passages for the World NP136 4th Edition. Extract from Admiralty Chart 4071 © Crown Copyright. Reproduced by permission of the Controller of Her Majesty’s Stationery Office and the UK Hydrographic Office (www.ukho.gov.uk).

15
INTERNATIONAL HYDROGRAPHIC REVIEW MAY 2014
For example, an enduring Hydrography Risk Assessment Framework [7], such as that estab-lished for a South West Pacific maritime infrastruc-ture comprises the following:
a) A Regional Risk Assessment; b) An Economic Impact Analysis; and c) A Regional Risk Assessment Implementation
Plan and funding mechanism agreed by donors/key stakeholders
This assessment process seems to be a pragmatic and commercially relevant method to prioritise the survey needs of the Small Island Developing States, scattered throughout the region. It is nota-ble that this initiative is led not by a Hydrographic Office; but by the New Zealand Ministry of Foreign Affairs and Trade, Aid Programme. Filling in the White Space The President of the Directing Committee of the IHB acknowledges that alternatives to the deploy-ment of survey ships must be found for “Filling in the White Space on Charts and Ocean Maps” [8]. This is in the interest not only of safety of naviga-tion but to service the wider blue economy. Against this background, any viable alternative methods of obtaining suitable depth information in a cost effective and reliable manner should be investigated and promoted. Satellite Derived Bathymetry In the opinion of the IHB [9], shallow water bathym-etry derived from multi-spectral imagery, should be considered as a potential technology for obtaining bathymetry for charting purposes in areas where existing surveys are poor or non-existent. Bathy-metric and other useful environmental data can be derived extremely cost effectively by this means. However, the information content of these data must be well understood and not regarded as a replacement for acoustic, Light Detection and Ranging (LiDAR) or other high resolution surveying sensors. Over the past decade, there have been significant advances in the methods used to derive bathym-etry from multi-spectral satellite imagery. It is now acknowledged that Satellite Derived Bathymetry (SDB) has the potential to make substantial improvements to otherwise inadequate charts. It can provide useful hydrographic data in areas where existing charting is based on little or no hydrographic surveying and there is little prospect of conventional surveys being conducted in the reasonable future.
Crowd Sourcing Crowd sourced bathymetric (CSB) data from ships of opportunity and recreational vessels can be used to check and supplement SDB; as well as provide inshore and ocean bathymetry independ-ently. Currently there are issues about data quality, reliability and chart producers’ liability. The IHB is being invited to address these by producing standards and methods of qualifying and identify-ing CSB data if used for charting inshore waters. Passage soundings have been and remain a useful source of information for the nautical cartographer and ocean mapper. CSB updates this process and UKHO is a major participant in CSB trials in Antarctica [10]. Participating cruise ships, belonging to the International Association of Antarctic Tour Operators (IAATO), have been fitted with the ARGUS CSB system which plugs into the vessel’s navigation system and echo sounder. Data is recorded and down loaded virtually autono-mously with minimal crew involvement. Successful surveys have also been carried out in uncharted Antarctic waters by an IAATO yacht Xplore [11], provided with survey systems and with a SHOM hydrographer embarked. The results were of charting quality. IAATO has clearly identi-fied the potential for suitably equipped yachts and cruise ship tenders to complement the survey efforts of government vessels, particularly in inshore waters. Trials with a hydrographic data logger are taking place this year under an IHB/Professional Yachting Association (PYA) initiative. The ideal would be to see the system installed in every professionally crewed ship.
Figure 7. Luxury yacht providing Antarctic cruises Source IAATO presentation to Hydrographic Commission on Antarctica Meeting December 2013

16
INTERNATIONAL HYDROGRAPHIC REVIEW MAY 2014
Invisible Data Large bathymetric data sets from both commercial and scientific sources remain inaccessible to chart-ing authorities for various reasons. A system needs to be devised which at least acknowledges that such data exists and might in time become generally available; if necessary at a price. This would certainly not equate to the cost of a repeat survey. Coastal States should always endeavour to get data from Hydrographic Surveys and Marine Scientific Research conducted within their EEZ. This is not always straight forward, as interpreta-tion of the UNCLOS provisions concerning the collection of marine scientific data and Hydro-graphic Surveying is a contentious area. Addition-ally, as C-55 states; “… failure to apply IHO S-44 criteria in Marine Scientific Research and offshore industrial surveys leads to the loss of opportunity data for SOLAS charting purposes”. Meeting the SOLAS V/9 Challenge IHO Initiatives The IHB’s response to its mandate under SOLAS V/9 was to establish a Capacity Building Commit-tee (CBC), which first met in 2003. This is now the Capacity Building Sub-Committee (CBSC) of the Inter-Regional Coordination Committee (IRCC). The CBC replaced the previous Technical Assis-tance Coordination Committee whose remit was narrowly focused on specific education, training and limited equipment provision. The CBC drew up the more broadly based Capacity Building Strategy of the IHO (published in 2006). This better re-flected the IHO’s contribution to safety of naviga-tion as complementing that of IMO and the Interna-tional Association of Lighthouse Authorities (IALA). At the last International Hydrographic Conference (IHC) in 2012 the CSBC was tasked to review the strategy and report to Member States at the Extraordinary IHC in October 2014. This injunction perhaps reflects the fact that earlier capacity building initiatives have been unavailing and unsustainable. It is now recognised that these did not engage top decision makers; but rather assumed that Hydrography per se was self-evidently beneficial to the national well being. That said, reports from the IHO Technical Visits to the Caribbean region in 2006 and subsequent ones to E Africa, Madagascar, Seychelles and Mauritius in 2011/12 clearly reflect a new approach.
The conclusion [12] from the comprehensive IHO technical assessment visits to the Caribbean region in 2006 bears setting out in full in the context of this discussion. It exemplifies the challenge confronting all developing coastal States bordering busy seaways and included in the itineraries of cruise ship operators.
“This mission covered a sea area of immense international and regional significance. It encompassed many of the main passages from the Atlantic into the Caribbean and onwards to the Gulf of Mexico and Panama Canal. The countries bordering these strategic seaways are small island states or dependen-cies dealing with a multitude of challenges to good governance with limited financial and human resources. Their coastal waters are traversed by some of the biggest passenger-carrying vessels in the world, yet a significant percentage of those waters have not been surveyed since the nineteenth century. It is imperative that the countries visited are as-sisted to implement appropriate and sustain-able arrangements to meet their obligations under SOLAS Chapter V.”
Subsequent initiatives by the member States of the Regional Hydrographic Commission (RHC), in cooperation with UKHO and NOAA have made some advances in improving charting and other Marine Safety Information (MSI) services, in particular around Antigua, British Virgin Islands and in Belize/Honduras. This suggests that the revised strategy of staged and focused technical assistance and engagement of top decision makers is starting to pay off. Despite this improve-ment, efforts to establish effective MSI capabilities remain heavily dependent on outside technical assistance and responsible national agencies continue to be under-resourced. There is a similar pattern in the waters of East Africa and the West Indian Ocean where US, India and France are undertaking surveys and providing technical assistance. A series of IHO Technical visits in 2011 and 2012 established that local MSI capability is limited and that Capacity Building (CB) needs a regional component. There was a consen-sus among visit teams that pooling of survey equipment for deployment in craft of opportunity could be beneficial.

17
INTERNATIONAL HYDROGRAPHIC REVIEW MAY 2014
Non-compliance with SOLAS V/9 Coastal States, in the regions identified in C-55 as poorly charted, are generally signatories to the SOLAS Convention, but do not appear to have accepted their obligations for provision of Hydro-graphic Services. Many have invested in offshore surveys and costly technical and legal advice to establish entitlement to an extended continental shelf (ECS) beyond 200M. This is understandable and was driven by the time limit imposed on sub-missions as well as the prospect of gaining access to additional seabed resources. The SOLAS requirement to ensure the safety of navigation within existing maritime zones has clearly not engaged decision makers to the same extent. In most cases the momentum generated by the ECS submission process and the raising of aware-ness of maritime matters was not sustained. Consequently it did not translate into the neces-sary government actions required to fulfil national SOLAS obligations despite attempts by donor agencies to demonstrate the connection. The unfortunate reality has been that donor funded projects have rarely been sustainable. Boats and equipment have gradually fallen victim to the climate and lack of maintenance. Trained person-nel have moved on, unable to fully exercise their new-found skills. Accessory funding has not been forthcoming and most projects focused on techni-cal provision rather than institution strengthening and encouraging top level government support. Recipients have failed to take ownership of projects or to shoulder any financial burden.
Concerted Action by International Organisations
The need for collective action between all organi-sations with responsibility for safety of life at sea and the protection of the marine environment has now been recognised. The latter, more than the potential for loss of life or property, seems to at-tract the attention of Coastal States’ governments and funding agencies. Hence the Global Environ-mental Facility was persuaded to finance both the Malacca and Singapore Straits and WIO Marine Highways demonstrations to minimise the risk of collision involving the VLCC and other vessels constrained by size, transiting those waters. At the last International Hydrographic Conference in 2012, it was agreed that IHO member States should commit to working with IMO Member States to promote the need for improved hydrographic survey and nautical charting services as required by SOLAS V/ 9 and to provide support through the respective IHO and IMO capacity building programmes. The IHB has since held a Capacity Building coordination meeting with IMO, IOC, WMO, IALA and others and has called particular attention of Regional Hydrographic Commissions (RHC) to the initiation of the IALA World Wide Academy [13]. The objectives of the Academy un-der the headings of Awareness, Assessment, Analysis and Actions serve as a template for capacity building to which the IHO subscribes in its own capacity building strategy. At the 2013 meeting of the CSBC the UK, drawing on findings from recent meetings of those RHC for which it is CB co-ordinator and noting the dramatic increase in demand for CB made the following points:
a) That initial assessments of CB requirements be jointly compiled as one ‘Country Profile’ by IMO, IALA and IHO;
b) That both IHO and IALA should become part of the team for the IMO Member State Audit Scheme;
c) The need for a top down approach;
d) Acknowledgement that IHO member States should derive CB benefits as well as contributing to the needs of non-members.
Risk Assessment – Economic Benefit New Zealand has developed a risk assessment and cost benefit methodology to enable informed
Figure 8. Antigua and Barbuda Coastguard craft with MBES and a positioning and motion sensing system temporarily fitted
Source UKHO presentation to Meso American and Carib-bean Hydrographic Commission 2011

18
INTERNATIONAL HYDROGRAPHIC REVIEW MAY 2014
decision making about investment in improving charting and MSI for Island States in the SW Pacific. This seems to be a very sensible approach and much more likely to result in Government, Donor and Stakeholder engagement. An initial assessment of through traffic, local trading pat-terns and the increasing number of cruise ship visits in Vanuatu (New Hebrides), has concluded that updating of the charts and improvements to and/or refurbishment of aids to navigation would yield significant economic benefit. As a result a survey programme has been initiated and work is currently in progress. Industry co-operation As an example Carnival Australia (the largest cruise ship operator in the Pacific) is to develop a public-private partnership that aims to foster linkages between the cruise ship industry and local economic development opportunities. Carnival has identified the need for improved maritime safety information (MSI) and that the major barrier to expansion of cruise ship activity in Vanuatu, Tonga and Fiji is the lack of accurate and adequate charting. The above approaches may well be something that should be looked at in the Caribbean. It is encour-aging to note that in 2011 a Marine Superintendent from a Cruise Ship operator participated in a meet-ing of the RHC. The company’s ships are over 1,000 feet (305m) in length with a draught of 27 feet (8.2m) and carry a total of 4,000 passengers and crew. Surveys such as those of St John’s Anti-gua cited earlier (see Figure 1) are clearly a response to the needs of such vessels. The IHO has for some time encouraged coopera-tion with industry and representatives of commer-cial survey companies and equipment manufactur-ers have enjoyed observer status at meetings of IHO committees, Working Groups and RHC. They have also participated in workshops and training courses. Suggestions have been put to the IHO Inter-Regional Coordinating Committee for an industry contribution to the successful implementa-tion of an enduring Capacity Building policy. These include exploiting the industry’s association with donor organisations, full participation in education and training provision, addressing the issue of sustainability and ultimately collaborating with developing States in the identification of survey needs, procurement of survey services and the design and execution of surveys.
Too much technology In the digital age there seems to be a perception that developing countries can bypass the essential learning curve of traditional survey and cartogra-phy and move directly to multibeam E/S surveys and ENC production. This was an unrealised expectation of the Hydrographic and Maritime Safety Information (MSI) components of the WIO Marine Highway Development Project. There is concern even in established Hydrographic Offices, that the automation of many critical cartographic functions could adversely affect product quality. In order to meet the IHO commitment to full ENC coverage it is considered that CB has been skewed towards training in ENC production. This is phase 3 of the IHO CB strategy. It should have been preceded by enabling the collection and circulation of nautical information, necessary to maintain existing charts and publications up to date. This then would be followed by the creation of a surveying capability. The feasibility of implementing phase 3 is acknowledged to be questionable. Bi-lateral agreements for charting can provide easier solutions in production and distribution of ENC through Regional Electronic Chart Coordination Centres.
Conclusions
The unsatisfactory state of global hydrographic data and resulting poor quality of global charting undermines the improvements to the safety of navigation anticipated from ECDIS. It will require concerted action from all coastal and Island States Parties to the SOLAS convention to remedy this. For many signatories to the convention, the need to honour their undertakings for the provision of hydrographic services is not a high priority. There are more urgent demands on slender human and financial resources. Any attempt to create a global network of indigenous cartographic and hydro-graphic entities for the production of even usage band 5 and 6 ENC, is unlikely attract the required support from governments. The current review of the IHO Capacity Building strategy is therefore welcomed.
The decline in national hydrographic survey assets is permanent. A mechanism needs to be found to harness the resources of the commercial sector to fill the gap. The successful outcome from the Introduction to Hydrographic Surveying and Nauti-cal Charting training course in Antigua (see Figure 1) showed what could be achieved in this respect.

19
INTERNATIONAL HYDROGRAPHIC REVIEW MAY 2014
The wider use of SDB could prove cost effect and attractive to cash strapped administrations, particu-larly in many small-island developing States. CSB also has merit as in Antarctica and to verify SDB elsewhere. Gravity anomalies inferred from satellite altimetry can assist in the eradication or confirmation of vigias as potential dangers on ocean routes.
It is never going to be possible to fill in all the “white spaces” on the charts and consequently a rigorous and informed analysis of need and alloca-tion of survey resources is necessary. The prototype Hydrographic Risk Assessment method-ology developed by New Zealand to assist decision makers to prioritise hydrographic surveys is one solution to this problem. The WIO Marine Highway Development Project was an ambitious attempt to focus survey effort; but was only partially successful. The hydrographic component failed to identify the actual rather than the perceived route survey requirements. Increasingly, as in Australia and Oceania, the shipping industry is likely to have to accept more routing restrictions. This will place the onus on the littoral states to install and maintain the necessary aids to naviga-tion and MSI infrastructure.
The implementation of SOLAS Chapter V concerns all aspects of navigational safety; of which the maintenance of nautical charts and publications and the dissemination of safety critical navigational information is but one. It is therefore essential that all international bodies with responsibilities for oversight of safe navigation coordinate their regulatory, promotional and mentoring activities. This is particularly important when raising awareness of maritime safety issues with govern-ments and funding agencies. Past attempts at capacity building have been largely unavailing because recipient countries have not taken owner-ship of these initiatives. References [1] Survey undertaken by instructors and students on an IHO capacity building training course http://www.iho.int/mtg_docs/rhc/MACHC/MACHC12/MACHC12-CB_Antigua_Hydrographic_Course_Report_Final.pdf viewed February 2014 [2] http://www.artificialowl.net/2009/07/what-happened-to-world-discoverer.html viewed March 2014 [3] Sandwell D.T. and Wessel P. (2010) Seamount Discovery Tool Aids Navigation to Uncharted
Seafloor Features. Oceanography, Vol. 23, Num-ber 1. [4] Accident Investigation findings http://navysite.de/ssn/ssn711.htm viewed 11 February 2014. [5] IMO NAV 59/INF.3 31 May 2013 submission by Australian and Papua New Guinea Growing ship-ping traffic through the environmentally sensitive waters of Papua New Guinea. [6] World Bank. 2013. Africa - GEF- Western Indian Ocean Marine Highway Development and Coastal and Marine Contamination Prevention Project. Washington DC; http://documents.worldbank.org/curated/en/2013/06/17899495/africa-gef-western-indian-ocean-marine-highway-development-coastal-marine-contamination-prevention-project viewed December 2013. [7] Activity Design Document (ADD): South-West Pacific Regional Hydrography Programme http://www.iho.int/mtg_docs/com_wg/CBC/CBSC10/CBSC10-15A-LINZ%20Activity%20Design%20Document%20-%20CBSC%20Jun%2012.pdf viewed December 2013. [8] Ward R. Filling in the White Space on Charts and Ocean Maps, Hydro International September 2013, vol.19, No. 6. [9] IHB Paper to 5th meeting of IHO-Inter Regional Coordination Committee document IRCC5-11A http://www.iho.int/mtg_docs/com_wg/IRCC/IRCC5/IRCC5_Docs.htm viewed 20 January 2014. [10] UKHO paper IRCC5-11B http://iho.int/mtg_docs/com_wg/IRCC/IRCC5/IRCC5-11B-Crowd_Source_Bathymetry.pdf viewed January 2014. [11] http://www.iho.int/mtg_docs/rhc/HCA/HCA13/Presentations/HCA13-06.3A_IAATO_Report_presentation.pdf viewed 22 Jan 14 [12] Technical Visits to Caribbean states http://www.iho.int/mtg_docs/CB/CBA/Technical%20visits/TV07/Second_phase_Caribbean_States.pdf viewed 23 December 2013. [13] IALA WWA Programme Manager presentation

20
INTERNATIONAL HYDROGRAPHIC REVIEW MAY 2014
e-Navigation Underway Conference 2013 http://www.e-navigation.net/index.php?page=the-role-of-the-iala-world viewed February 2014. Biography of the Author Ian RUSSELL is a Fellow of the Royal Institution of Chartered Surveyors and Member of the Nautical Institute. Ian has 25 years experience of hydro-graphic surveys for nautical charting. He is a former Senior lecturer in Hydrography at Southampton Solent University with previous consultancy assign-ments including hydrographic aspects of marine casualties and implementation of UNCLOS article 76. [email protected]

21
INTERNATIONAL HYDROGRAPHIC REVIEW MAY 2014
NEXT GENERATION PAPER CHART
By Ian HALLS (Australia)
Abstract
Résumé
Throughout the ages, the navigation chart has adapted to meet the requirements of the mariner to ensure safety of navigation. The portrayal of chart information and its physical presentation on manuscript materials have also changed through innovation and human factors. In more recent times, the work of the International Hydrographic Organization (IHO) has established various standards to provide consistency to charting products to meet a truly global requirement. The transition from a manuscript to a digital electronic navigation world continues at a rapid pace. A new generation of users are more familiar and comfortable with electronic technology. One of the challenges facing the IHO is the future of the paper nautical chart. The ongoing need for paper charts is not the issue dis-cussed in this paper. What is discussed, however, is the portrayal of chart data and the way in which paper charts may be generated in the future. The issue requires careful con-sideration to reduce Hydrographic Office (HO) production burdens, maintain relevance and meet the customers' expectations.
"In matters of style, swim with the current; in matters of principle, stand like a rock.” Thomas Jefferson.
Au cours des siècles, la carte de navigation a évolué pour répondre aux besoins du navi-gateur afin d’assurer la sécurité de la navigation. La visualisation des renseignements cartographiques et leur présentation physique sur les supports papier ont également changé du fait des innovations et des facteurs humains. Plus récemment, les travaux de l’Organisation hydrographique internationale (OHI) ont établi différentes normes pour ren-dre cohérents les produits cartographiques en vue de répondre à un besoin véritablement global. La transition de la navigation avec des documents papier au monde de la naviga-tion électronique numérique se poursuit à un rythme soutenu. La nouvelle génération d’u-tilisateurs est plus familiarisée et plus à l’aise avec la technologie électronique. Un des défis auxquels l’OHI doit faire face est l’avenir de la carte marine papier. Le besoin conti-nu de cartes papier n’est pas le sujet de cet article. Ce qui y est abordé, cependant, est la visualisation des données cartographiques et la façon dont les cartes papier pourront être produites à l’avenir. Cette question requiert un examen minutieux afin de diminuer les coûts de production des Services hydrographiques (SH), de préserver la pertinence et de répondre aux attentes des clients.
« Sur les questions de style, nage avec le courant, sur les questions de principe, soit solide comme un roc ». Thomas Jefferson.
22
INTERNATIONAL HYDROGRAPHIC REVIEW MAY 2014
Resumen
A través de los tiempos, la carta de navegación se ha adaptado para satisfacer los requi-sitos del navegante con el fin de garantizar la seguridad de la navegación. La representa-ción de información cartográfica y su presentación física en materiales manuscritos han cambiado también mediante la innovación y los factores humanos. En tiempos más recientes, el trabajo de la Organización Hidrográfica Internacional (OHI) ha consistido en establecer varias normas con el fin de proporcionar coherencia a los productos cartográfi-cos para que satisfagan realmente un requisito global. La transición de un manuscrito a un mundo digital de navegación electrónica sigue avanzando a un ritmo rápido. Una nueva generación de usuarios se siente más familiarizada y cómoda con la tecnología electrónica. Uno de los desafíos a los que se enfrenta la OHI es el futuro de la carta náuti-ca de papel. La necesidad continua de cartas de papel no es el tema que se trata en este artículo. Sin embargo, de lo que se trata, es de la representación de los datos de las cartas y del modo en el que podrán generarse las cartas de papel en el futuro. Este tema merece una cuidadosa consideración para reducir los gastos de producción del Servicio Hidrográfico (SH), mantener su pertinencia y satisfacer las expectativas de los usuarios.
"En cuestiones de estilo, nada con la corriente; en cuestiones de principio, mantente firme como una roca.” Thomas Jefferson.

23
INTERNATIONAL HYDROGRAPHIC REVIEW MAY 2014
1. A TALE OF PORTRAYALS From the very earliest recordings of sailing direc-tions (periploi), to the 15th and 16th century porto-lans of the Venetians and Genoese, through to the current paper nautical charts, the depiction of chart detail has been an art form to serve a multitude of navigation purposes. The description and portrayal of real, fictitious, cosmological and embellished detail, was subject to the current school of thought, the imagination of the cartographers, the dominant cultural influences, the artists and the adventurers. Improvements in navigation methods and technol-ogy, the ages of discovery and enlightenment and more understanding of the real world combined with innovative charting practices and tools, have influenced the portrayal of information and the physical construction of navigation charts as sup-position gradually retreated in the face of knowl-edge. 1.1 Paper Charts The depiction of the current paper nautical chart is the result of some decades of cooperative stan-dardisation effort championed by the IHO and de-scribed in the Regulations for International (INT) Charts and Chart Specifications of the IHO (known as S-4) [(IHB, 2013(a)]. This publication provides the framework for modern paper chart construc-tion, colours, symbology and supporting textual information (Figure 1). S-4 is supported by a num-ber of technical specifications such as INT1 (Symbols, Abbreviations and Terms used on Charts), INT2 (Borders, Graduations, Grids and
Linear Scales) and INT3 (Use of Symbols and Abbreviations). Whilst the IHO has adopted Karte 1 (INT1) pro-duced by the German Federal Maritime and Hydro-graphic Agency (BSH, 2011), a single, global specification for paper chart symbology has been elusive with many individual HOs developing their own version of INT1 (e.g. UKHO Chart 5011, NOAA U.S. Chart No. 1, Canada Chart No. 1, etc.). Fortunately, these documents basically follow the IHO INT1 content and structure, and include additional symbols and abbreviations that have been locally adopted within a national context. The key issue is that a mariner looking at charts pro-duced by different HOs can interpret the charted features correctly through generally adopted por-trayal standards. The S-4 specification is maintained by the IHO’s Chart Standardization and Paper Chart Working Group (CSPCWG). The CSPCWG has a set of defined objectives, operating procedures and guid-ing principles within its Terms of Reference (IHB, 2013(b)). Due to the diligence of the working group members over many years and the implementation of modern, advanced chart production software, S-4 and INT1 are mature specifications. Changes to S-4 are relatively minor and are implemented to support new charting requirements (e.g. Archi-pelagic Sea Lanes and various sensitive areas). 1.2. Electronic Charts With the development of electronic charting in the late 1980s, the IHO soon realised that S-4 and its technical components (INT1 and INT2) would not
Figure 1. A typical INT1 paper chart portrayal Extract of Chart Aus 28 Copyright Commonwealth of Australia (2008). Used with permission of the Australian Hydrographic Service.

24
INTERNATIONAL HYDROGRAPHIC REVIEW MAY 2014
satisfy computerised chart display for the Elec-tronic Chart Display and Information System (ECDIS). For this reason, a new data portrayal specification needed to be developed. The Specifi-cations for Chart Content and Display Aspects of ECDIS (S-52), describes the technical require-ments for information display, symbology, environ-mental condition colour palettes, display screen configurations and various calibrations. S-52 in-cludes Annex A - the Presentation Library (PL) (IHB, 2010(a)), and is maintained by the IHO’s Digital Information Portrayal Working Group (DIPWG). The objective of this group is to maintain the IHO's specification for colours, symbols and display rules used to show Electronic Navigation Chart (ENC) information on ECDIS in a safe and ergonomic manner (see Figure 2). The member-ship of these working groups reflects wide interna-tional cooperation and this resulted in the general global acceptance of their resultant work. Rather than being a paper-based portrayal specifi-cation such as INT1, the PL is provided in a ma-chine-readable format so that electronic chart manufacturers can use it in their technology. The use of a standard set of symbology instructions should minimise the interpretation of symbology rules. This unfortunately is not always the case and a number of system manufacturers have either implemented the library with their own coding inter-pretations or developed their own libraries creating inconsistency issues with ENC data portrayal (Mohasseb, 2013). Through intensive stakeholder
engagement, the IHO and ECDIS manufacturers continue to address and improve these interpreta-tions with the aim of minimising encoding and por-trayal variation and ambiguity. 2. THE CHALLENGE OF TWO CHART WORLDS In the late 1980s when ECDIS was first conceptu-alised and the early systems were being proto-typed, there was much speculation about the fu-ture of the paper chart. It was not uncommon to hear early statements that paper charts would not exist beyond 2000. It has hard to believe that after 20 years, the paper chart is still a preferred naviga-tion tool by many mariners. The continued preference for the paper chart in an ever-increasing electronic age is the result of a number of factors:
Users are familiar with long-used, paper chart products. Often user’s charts are marked up with historical routes or other important infor-mation;
HOs have taken a long time to achieve a sat-
isfactory level of ENC coverage. This has meant that HOs need to produce and main-tain multiple products, often using multiple production systems that compound complex issues in production and maintenance work-
Figure 2. S-52 portrayal of the same area depicted in Figure 1 Extract of ENC Cell AU5XX24 Copyright Commonwealth of Australia (2008). Used with permission of the Australian Hydrographic Service.

25
INTERNATIONAL HYDROGRAPHIC REVIEW MAY 2014
flows, training, competency and technology and data refresh;
The legislative process of the International
Maritime Organization (IMO) has taken many years to mandate compulsory use of ECDIS resulting in a slower uptake of ECDIS tech-nology and the necessary formal training of mariners to appreciate the technology and gain the necessary competencies;
Official ENC data is used predominantly in
type-approved ECDIS on large ships. A sig-nificant market segment doesn’t require ECDIS technology (e.g. recreational users, fishing, small commercial vessels). For these users, official ENCs, non-official vector charts, raster charts and paper charts can all be used to meet their requirements;
Many mariners are so familiar with the paper
chart that a change in presentation, function-ality and trust in technology can be difficult to embrace;
The variety of cheaper electronic charting
systems (ECS) product offerings, the varying levels of data quality and competitive busi-ness interests lead to a confused electronic chart market-place.
3. PAPER CHARTS AND SAFETY OF LIFE AT SEA (SOLAS) CONVENTION The adoption at the IMO's Maritime Safety Com-mittee 86th session (MSC86) of the amendments to SOLAS (IMO, 1974) regarding mandatory car-riage for ECDIS equipment for ocean-going ships has an important impact on the future need for pa-per nautical charts (see Figure 3). Under the SO-LAS revisions, the decision must be made either to fit vessels with dual or single ECDIS. Both must comply with the ECDIS performance standard and will require a back-up plan whose demands will vary between flag States. In the dual-ECDIS case, bridge staff will be able to significantly reduce (in some cases down to zero) their use of paper charts. In the single-ECDIS case, they will likely keep the paper chart as backup. In Australia, the Australian Maritime Safety Author-ity (AMSA) released Marine Notice 7/2012 outlin-ing Guidance of ECDIS for ships calling at Austra-lian Ports. In accordance with IMO resolutions, AMSA considers the following will meet the back-up requirements for ECDIS (AMSA, 2012):
“An independent, fully compliant sec-ond ECDIS unit, connected to ship’s main and emergency power supply and connected to systems providing continuous position fixing capability; or
Figure 3. ECDIS Compliance Dates for SOLAS (UKHO, 2013)

26
INTERNATIONAL HYDROGRAPHIC REVIEW MAY 2014
Adequate and up to date paper charts (including relevant large scale charts) necessary for the intended voyage.”
The IHO describes a nautical chart in S-66 (IHB, 2010(b)) as:
“Nautical charts are special purpose maps specifically designed to meet the requirements of marine navigation, showing amongst other things depths, nature of the seabed, elevations, con-figuration and characteristics of the coast, dangers, and aids to navigation. Nautical charts provide a graphical rep-resentation of relevant information to mariners for executing safe navigation. Nautical charts are available in ana-logue form as paper charts, or digitally as electronic charts.”
A key component of nautical charting world-wide is standardisation of portrayal. This is emphasised in IMO SOLAS Chapter V Regulation 9, para. 3 (IMO, 1974):
“ensure the greatest possible uniformity in charts and nautical publications and to take into account, whenever possible, relevant international resolutions and recommendations.”
4. THE FUTURE OF PAPER CHARTS Given the changes to the implementation of ECDIS, what is the future of the paper chart? In a 2011 article, the then UKHO CEO, Mike Robinson, expressed a view that paper charts would still be used for many years, even if they were only used in a "get me home" scenario. Despite a prediction that the sale of UKHO digital charts will exceed the sale of paper charts around 2018, there will still be a requirement to provide paper chart products to meet the varied usages and this will continue to be a production and maintenance issue for all HOs (Robinson, 2011). In a world that is rapidly changing in technology (in matters of style, swim with the current), along with a technically-savvy younger generation of users, it is time to look critically at what the paper chart represents and how it can be provided in different ways to a changing user-base without compromis-ing navigational safety (in matters of principle, stand like a rock).
4.1. Official ENC-Derived Paper Charts If a paper nautical chart is to exist in the future, what should it look like? Is it practical or economi-cally feasible for HOs to continue to publish paper chart products with different portrayals? Will this be confusing to the market place? Irrespective of the ENC/paper chart equivalency, many HOs can produce INT1 paper charts fairly easily from an ENC source. The primary hydro-graphic software vendors all provide an INT1 paper chart output. Hence, there is no impediment to this capability continuing. However, as uptake of ENCs continue, can users be expected to put up with two different portrayals of the fundamental navigation data? An alternative approach is for HOs to publish paper charts with a predominantly S-52 (ENC) presentation and transition away from the traditional INT1 portrayal. To assist in the adoption of electronic charts, the author believes that there is merit in considering the need to transition INT1 paper chart portrayal to a S-52 style portrayal. From a practical production aspect and debatably a customer perspective, it makes little sense to retain two separate product portrayals. In a small and limited customer market, the major HO production software vendors all sup-port S-52 portrayal in their symbol libraries. All of the software systems are relatively mature and whilst they can support both INT1 and S-52, a tran-sition to one portrayal specification can utilise the best of both specifications (e.g S-52 for colours and symbols, INT1 for graticules, marginalia, title blocks and text, etc.). As part of the IHO’s S-100 family of product specifications, S-4 could/should be replaced by a new S-10x Product Specification: ENC-Derived Paper Chart. 4.2. User-generated Non-official paper charts In the world of "apps", it should be possible for us-ers to create and print their own ENC-derived charts. These charts can be plotted from the users own ECDIS or ECS technology where the ENC data has already been purchased. In this case the plot could be generated from the System ENC (SENC) or from the purchased ENC product. HOs will need to consider a pricing model for the ENC to include some level of cost recovery for user-sourced plotting. Chart agents and other value added resellers may also provide a plotting ser-vice.

27
INTERNATIONAL HYDROGRAPHIC REVIEW MAY 2014
5. S-100 PRODUCT SPECIFICATION FOR A ENC-DERIVED PAPER CHART The traditional paper chart specifications are well described through S-4, INT1 and national variants. However, for the portrayal of ENC data on a paper format, it is recommended that a new S-10x prod-uct specification within S-100 be developed and managed either by a sub-group of one of the current IHO portrayal working groups or by a new technical working group. The purpose of the new product specification is to establish the minimum requirements for the portrayal of ENC data on a manuscript format whilst maintaining an appropri-ate level of maritime navigation safety. In develop-ing such a specification, a number of issues need to be considered. 5.1 Data portrayal S-52 specifications were designed for computer displays and not paper output. Hence, the ENC portrayal will not be aesthetic to the eye from a traditional paper chart user perspective. New sym-bols would need to be added to account for carto-graphic features such as a compass rose. With increased uptake of ENCs, users should be more familiar with ENC portrayal and so over time, por-trayal interpretation issues should also reduce. To assist mariners with ENC portrayal, the UKHO has already issued the ECDIS version of INT1 - NP5012 Admiralty Guide to ENC Symbols used in ECDIS (UKHO, 2012). 5.2 Paper Plot Layout Elements Certain “elements” need to be included in the plot layout to assist the mariner using the derived pa-per chart: Graticule: Simplified latitude and longitude grid/graticule
Scale bar: Simplified scale bar
Marginalia: Plot date, ENC EN/ER update status, Geographic extents, Producer agency ENC cell names used as the source, copyright and dis-claimer statements.
Scale: The scale of the plot will be determined by various user-defined options – paper size, area coverage, etc. Some warning notation may be re-quired if the inappropriate navigation usage or ENC scale is used for plotting. This may be similar to the “overscale” warning currently shown on ECDIS displays.
Available data: Where ENC coverage is not fully available, the paper plot may contain Raster Nauti-cal Chart (RNC) content. The ENC content should always take precedence and some rules will be required to stop users from plotting RNC versions of the large portions of paper charts.
Data Content: similar to S-52, a minimum content of ENC data (e.g. Base) is required. The user should then have the ability to add extra content to the display. Projection: At a certain scale, the output plot should be projected to aid the intended usage. For large scale situational awareness, a UTM projec-tion may be best. For scales smaller than 1:75,000 where the chart may be used for course plotting and navigation, the plot should be output in a Mer-cator projection.
Colours: S-52 provides various colour palettes. For paper chart plots, the “bright-day” palette is likely to be the preferred colour palette.
Symbology: S-52 supports a simplified and tradi-tional symbology palette. The user should be able to select the palette they are most familiar with. Some additional cartographic symbols will need to be developed.
Explanatory/Cautionary Notes: These notes are provided to assist the mariner to interpret potential navigational issues (e.g. chart omissions, dangers, etc.) or provide advice on where to find additional information (e.g. maritime boundaries). In the ENC, these notes are provided as text and/or picture files. Rather than plot the note content on the pa-per copy, the user could be given the option to print any relevant files separately. 6. PLOTTING SERVICES HOs can continue to provide plotting services for official paper charts. In many cases, chart plotting is now undertaken using Print on Demand (POD) technology rather than offset lithographic printing. POD provides options for plotting charts as either traditional INT1 portrayal or ENC-derived portrayal at large formats. Most users do not have access to large A0 plotters. Hence, large format plotting, from an economic perspective will remain with the HO, any contractors or potentially chart agents or specialist service agencies. Most users will only have access to A3/A4 printers at most. The chal-lenge for using A0 plotters on vessels is the main-tenance of consumables (i.e. inks and paper) which can be bulky, messy, expensive and sus-ceptible to temperature and humidity.

28
INTERNATIONAL HYDROGRAPHIC REVIEW MAY 2014
7. LEGAL ISSUES If a paper chart is plotted from the official HO-published ENC or RNC data, or from an approved SENC, and it has been output using the minimum required portrayal settings, it should be deemed suitable as an official and legal product. Some cri-teria may need to be established to ensure that the plotted output is legible in terms of scale and colours (rather than a grayscale printout). 8. CONCLUSIONS The increasing adoption of ENCs and the changes in mandatory carriage requirements for SOLAS vessels will result in mariners using a product that has significant portrayal and capability departures from the traditional INT1 paper chart and derived raster navigation products currently in the market place. Should users have to put up with multiple navigation chart portrayals or should there be only one product portrayal based predominantly on the ENC with additional portrayal functionality to pro-vide "cartographic representations"? The author does not question the ongoing need for paper charts - only how paper chart content should be portrayed to users. At all times the principle of safety of navigation cannot be compromised, but this doesn't preclude looking at opportunities to streamline the production or to simplify the provi-sion of derived paper products from an official ENC source. There is no doubt that such considerations will spark debate. However, from experience of witnessing the battle that some HOs had with the ECS entrepreneurs of the early 1990s, the IHO needs to decide if this really is an issue and be on the front foot in defining an appropriate specifica-tion. Otherwise, industry will dictate the capability. The opinions expressed in this paper are those of the author and do not necessarily reflect those of the Hydrographer of Australia or the Royal Austra-lian Navy. 9. REFERENCES AMSA, 2012. Guidance on ECDIS for ships calling at Australian ports, Marine Notice 7/2012, Austra-lian Maritime Safety Authority. BSH, 2011. Karte 1 (INT1) Symbols, Abbreviations and Terms Used on Charts, 7th Edition, German Federal Maritime and Hydrographic Agency (Bundesamt für Seeschifffahrt und Hydrographie), 2011.
IHB, 2010(a). Specifications for Chart Content and Display Aspects of ECDIS (S-52) (including Annex A IHO Presentation Library for ECDIS (PL) Ed. 3.4, January 2008), Ed. 6.0, March 2010. IHB, 2010(b). Facts about Electronic Charts and Carriage Requirements (S-66), Ed. 1.0.0, January 2010. IHB, 2013(a). Regulations for International (INT) Charts and Chart Specifications of the IHO (S-4), Ed. 4.4.0, September 2013. IHB, 2013(b). Chart Standardization and Paper Chart WG (CSPCWG) Terms of Reference, w w w . i h o . i n t / m t g _ d o c s / c o m _ w g / T O R /CSPCWG_TOR.pdf, viewed 1/6/2013. IMO, 1974. International Convention for the Safety of Life at Sea (SOLAS) as amended, London. http://www.imo.org/ourwork/facilitation/documents/s o l a s % 2 0 v % 2 0 o n % 2 0 s a f e t y % 2 0 o f %20navigation.pdf viewed 20 Dec 2013. Mohasseb, M. Anomalous ECDIS Operations, In-ternational Hydrographic Review, No. 9, May 2013, pp47-52. Robinson, M. UKHO strives for worldwide leader-ship in hydrographic information, Hydro INTERNA-TIONAL, Vol. 15, No. 1, January/February 2011. UKHO, 2012. Admiralty Guide to ENC Symbols used in ECDIS, NP5012, 1st Edition, 2012. UKHO, 2013. http://www.ukho.gov.uk/Media/News/Pages/What_Mandation_Means.aspx viewed 18 Dec 2013. 10. BIOGRAPHY OF THE AUTHOR Ian HALLS commenced work at the Australian Hydrographic Office (AHO) in 1979 as a trainee nautical cartographer and has been involved in the development of nautical data management and chart production systems since the mid-1980s. This period included serving several years on IHO ECDIS/S-57 technical committees. He is a past Director of HSA Systems Pty Ltd and resumed working at the AHO in 2009 after 15 years in pri-vate industry undertaking systems engineering, hydrographic surveying and charting activities. He is currently managing the military hydrographic data, products and services section of the AHO. Ian is also working with a small dedicated team to sustain the Digital Hydrographic Database solution developed in early 2000. This involves the

29
INTERNATIONAL HYDROGRAPHIC REVIEW MAY 2014
software, hardware and ICT refresh of the various source data receipt, validated data, production, distribution, and workflow sub-systems using an enterprise architecture approach. [email protected]

30
INTERNATIONAL HYDROGRAPHIC REVIEW MAY 2014
Page intentionally left blank

31
INTERNATIONAL HYDROGRAPHIC REVIEW MAY 2014
RESEARCH ON THE DESIGN OF SURVEY LINES IN A MARINE MAGNETIC SURVEY
By BIAN Gang, XIA Wei , JIN Shaohua, XIAO Fumin, SUN Xinxuan, CUI Yang Department of Hydrography and Cartography, Dalian Naval Academy (China)
Abstract
Résumé
Resumen
The planning of a marine magnetic survey requires careful consideration in the design of the survey lines to ensure the results of the survey meet expected standards. This paper describes various evaluation methods to determine an optimal survey line layout for a marine magnetic survey that conforms to Chinese marine magnetic survey Standards. Various survey line layouts are tested using simulated data to evaluate the interpolation precision between neighbouring survey lines and the magnetic anomaly map. The test results provide a recommended process to determine the rationality and the optimal layout of the survey line pattern for undertaking marine magnetic surveys.
La planification d’un levé magnétique marin requiert un examen minutieux de la conception des profils de sonde pour assurer que les résultats du levé répondent aux normes attendues. Cet article décrit différentes méthodes d’évaluation en vue de déterminer une présentation de profil de sonde optimale pour un levé magnétique marin qui soit conforme aux normes des levés magnétiques marins chinois. Diverses présentations de profils de sonde sont testées à l’aide de données simulées dans le but d’évaluer la précision de l’interpolation entre profils de sonde voisins et la carte des anomalies magnétiques Les résultats des tests permettent de recommander un processus pour déterminer la rationalité et la présentation optimale du schéma de profil de sonde afin d’entreprendre des levés magnétiques marins.
La planificación de un levantamiento magnético marino requiere una cuidadosa considera-ción en el diseño de las trayectorias a seguir para garantizar que los resultados del levantamiento cumplan las normas esperadas. Este artículo describe los diversos métodos de evaluación para determinar una disposición óptima de las trayectorias para un levanta-miento magnético marino que sea conforme a las normas chinas de levantamientos magnéticos marinos. Se han efectuado pruebas sobre varias disposiciones de trayectorias, utilizando datos simulados para evaluar la precisión de la interpolación entre trayectorias vecinas y el mapa de anomalías magnéticas. Los resultados de las pruebas proporcionan un proceso recomendado para determinar la racionalidad y la disposición óptima del patrón de trayectorias para llevar cabo levantamientos magnéticos marinos.

32
INTERNATIONAL HYDROGRAPHIC REVIEW MAY 2014
1. INTRODUCTION The planning of a marine magnetic survey line uses a series of crossing main survey lines and reference survey lines to provide an optimal survey network. However blank areas can exist between survey lines. Thus the design of the survey line pattern is a primary requirement for marine mag-netic surveys and is important in the assurance of survey precision and efficiency. There are similarities and differences between ma-rine magnetic surveys and other marine surveys. In a bathymetric survey, the fair chart mostly com-prises depth points and derived depth contours assist as a secondary portrayal. In a marine mag-netic or a marine gravity survey, the final survey product is mainly represented by contours, which is called a marine magnetic anomaly map or ma-rine gravity anomaly map. Similarly, compared to a marine gravity survey, the spatial variations of magnetic anomaly values are rapid and complex. Therefore, the design of the survey lines in a marine magnetic survey is even more important than in a marine gravity survey. The design of the survey lines is discussed in this paper and the requirements in the design of survey lines are described in the Specifications for Marine Magnetic Surveys in China (refer to Table 1). Table 1: The line spacing in different survey order given by Specifications for Marine Magnetic Survey
In Table 1, the survey precision requirements are listed in each Order (the precision is calculated by the crossing point of main lines and reference lines). However, the required precision of the mag-netic anomaly map (being the survey product) is not prescribed. The line spacing in each survey Order is decided by the corresponding survey scale (corresponding distance of 1cm on survey map), rather than by the characteristics of the magnetic anomaly. Therefore some problems exist when undertaking a practical survey. On the one hand, for certain magnetic anomaly map preci-sions, the corresponding survey Order is unknown. On the other hand, if the survey Order is given
according to Table 1, the precision of the magnetic anomaly map can not be evaluated. Applying the survey line requirements from Table 1, two kinds of unsatisfactory results will be produced: (1) Survey lines spacing will be too dense. Although the requirement of the survey pre-cision can be satisfied, the work load and the total survey expense will be significantly increased and the survey efficiency will be correspondingly de-creased; and (2) the survey lines spacing will be too sparse, so the requirement of the magnetic anomaly map precision will not be met, the ex-tended measurement work will have to be devel-oped and the survey efficiency will also decrease.
After analysis and investigation, the authors con-sider that the precision of survey points and the magnetic anomaly map must also be prescribed. This can meet the needs of different practical ap-plications such as military, navigation, science re-search, geological exploration, marine exploitation, underwater detection, marine engineering etc. Given the unambiguous precision of the marine magnetic anomaly map, the appropriate survey line spacing can be determined by the surveying engineer, and the practical magnetic characteris-tics fully considered.
Two basic problems exist in the survey line layout: (1) What is an optimal survey line layout? (2) How can we design optimized survey lines? Therefore three detailed problems must be analyzed and dis-cussed: (1) the influence of survey line direction; (2) the influence of survey line spacing, and (3) the factors that can be applied to describe these influ-ences. In this paper, the problems above have been resolved and methods have been tested us-ing simulated data.
2. THE EVALUATION METHODS OF THE SURVEY LINE LAYOUT A magnetic anomaly contour map is the main product from a marine magnetic survey. The spatial distributions of the magnetic anomaly in a survey area can be distinguished and the magnetic anomaly information provided for different applica-tions. To obtain spatial distributions of the magnetic anomaly between survey lines, observed values on a survey line can be used to interpolate the values between two neighbouring lines. The interpolating precision can be applied to reflect the representative capability of the magnetic anomaly in a survey area. Accordingly, the magnetic anomaly map and the interpolating precision can been used to evaluate the rationality of the survey line layout.

33
INTERNATIONAL HYDROGRAPHIC REVIEW MAY 2014
2.1 Evaluation with magnetic anomaly map A marine magnetic anomaly map is the most intui-tive and expressive output from a marine magnetic survey. Reviewing the magnetic anomaly map, the general trend and distribution of the magnetic anomaly can be distinguished, and any significant magnetic anomaly can be determined by the mag-netic anomaly contours. Evaluating the magnetic anomaly map means that we can compare a simulated magnetic anomaly map with a true magnetic anomaly map obtained by a given survey line layout. The rationality of the survey line layout can be evaluated by the display of the output map to determine if the survey requirements are met. After analysis and discussion, evaluating standards can be detailed as follows: (1) Magnetic anomaly maps are considered to be consistent, whereby the general trend of the magnetic anomaly can be determined and the detailed magnetic anomaly in the given magnitude can be identified. (2) Magnetic anomaly maps are considered to be basically consistent, whereby the general trend of the magnetic anomaly can be approximately deter-mined and the detailed magnetic anomaly in the given magnitude can usually be identified. (3) Magnetic anomaly maps are considered to be basically consistent, whereby the general trend of magnetic anomaly can be approximately deter-mined, but the detailed magnetic anomaly in the given magnitude is difficult to identify. (4) Magnetic anomaly maps are considered to be inconsistent, whereby the general trend of the magnetic anomaly can not be determined and the detailed magnetic anomaly in the given magnitude cannot be identified. In the Standards above, when the magnetic anom-aly map contrast accords with (1) or (2), consider-ing the survey error, the survey line layout is con-sidered rational. When the magnetic anomaly map contrast accords with (3) or (4), the survey line layout is considered irrational.
2.2 Evaluation with interpolation precision between two neighbouring lines 2.2.1 The concept of the interpolation between two neighbouring lines and its precision The marine magnetic survey line pattern consists of main survey lines and reference lines (a refer-ence line is also called a cut line or tie line in an aeromagnetic survey). To plot a magnetic anomaly map, the magnetic anomaly information of the blank area between survey lines must be interpo-lated. Therefore the plotting precisions of the magnetic anomaly map are estimated by the preci-sion of observed data and interpolated data. However, the interpolating precision is mainly determined by variable characteristics of the mag-netic anomaly and survey line spacing. So the main aim of the survey line layout is to determine the survey line spacing. By controlling and adjust-ing the interpolating precision, the given precision of the survey product can be determined. The requirement of the survey line layout is related to the requirement of interpolating precision. To meet different interpolating precisions, the survey line layout can be different. Hence, the interpolating precision is an important value to determine the rationality of the survey line layout. Actually, the designed reference lines can be adopted to evaluate the interpolating precision. The middle point of two neighboring survey lines can be used to estimate the interpolating precision.
Figure 1: The sketch map of evaluating with the middle point In Figure 1, the number of main lines (Ln) and ref-erence lines (Cn) is m and n in a survey area. The main lines are perpendicular to reference lines, and main line spacing is d, and there are m´n cross points.

34
INTERNATIONAL HYDROGRAPHIC REVIEW MAY 2014
On each reference line, middle point P is selected as a reference point to evaluate the interpolating precision. For each reference point, the difference between the interpolated value and the true value t can be obtained.
In expression (1), TI represents the magnetic anomaly value which is interpolated by the corre-sponding observed value on two neighboring sur-vey lines. TR is true value of middle point observed on the reference line. As the interpolated magnetic anomaly value TI and true value TR on the refer-ence line is irrelevant, we can derive the following formula.
In expression (2), mt represents the mean square error (MSE) of the magnetic anomaly difference, mI is MSE of the interpolated value, mR is the interpo-lation precision of the observation value. The MSE of interpolated value mI can be analyzed in the following text. Linear interpolating is a com-mon method in survey processing, so the next formula is expressed as follows.
In expression (3), T1 and T2 represent the observed values on two neighboring main lines which cross a reference line. ε is the correspond-ing model error, which can be obtained by linear interpolation. With a different interpolating method, the model error can be different. Because the observed values on each main line are independ-ent, the law of propagation of errors is followed.
The expression above denotes the relation of the precision and interpolated value. With (5) and (2), then:
This expression reflects the relation of the MSE of the magnetic anomaly difference, the MSE of the observation and the linear interpolation model error. mt and mT can be calculated through observed data of the whole survey area. That is,
In expression (7), the number of the reference points P is N. The number of main lines and refer-ence lines is m and n, which are crossed, so refer-
ence points can be expressed as N=(m-1)×n.
In expression (8), ∆ is the difference of the observed value of the reference point, which are respectively obtained by the main and reference lines. Through expression (6), the precision of the linear interpolation model error of the whole survey area can be obtained.
The linear variation characteristics of the magnetic anomaly can be reflected directly. The smaller the number of mε, and hence, the smaller the survey line spacing, the better the linear characteristics of the magnetic anomaly. From the expressions above, a precise control situation can be analyzed. For example, when the requirement of the magnetic anomaly interpolation precision is less than the observation precision, mI
≤ mR, and expression (5) becomes.
The requirement of the linear interpolation model error of the whole survey area is.
(1)
(2)
(3)
(4)
(5)
(6)
(7)
(8)
(9)
(10)
(11)

35
INTERNATIONAL HYDROGRAPHIC REVIEW MAY 2014
Combining expression (6), expression(11)now becomes:
The requirement of the precision will be:
2.2.2 The interpolation model error and its expression In Figure 2, the direction of the reference line is along the axis X, where x1, x2 are the coordinates of observed magnetic anomaly values in neighbor-ing survey lines, and xp is the coordinate of the middle point along the reference line. The coordi-nate along the main survey lines are the same.
Figure 2: The sketch map of linear interpolation between lines Suppose that the magnetic anomaly function is expressed as T(x), which is deemed as the true value. In interval (x1, x2), the differential coefficient is (n+1). On the middle point xp of the reference line, the function T(x) can be expanded as a Taylor series.
In expression above, Rn(x) is the interpolation residual part.
Neglecting the non-linear part in function T(x), when n>2, expression (14) simplifies to:
The expression, is the non-linear part of function T(x) and T˝(ξ) is the gradient of T(x) along the X axis. Combined with expression (13) and (14), the observed values T(x1) and T(x2) in neighboring main lines of point x1 and x2 can be expressed as follows.
(15)
(16) When the linear interpolation is adopted, the magnetic anomaly value T(xp) ́ on the interpolating point can be expressed as:
When expression (15) and (16) are adopted in expression (17) and compared to T(xp), the interpolating model error on point xp is:
For x2–x1=d, expression (18) can be finally concluded as:
From expression (18), the conclusion is that the larger the survey line spacing, the smaller the interpolation precision will be. This also leads to an increased complication in the variation of the magnetic anomaly gradient. This is consistent with the analysis described in the Section 3. Expression (19) is deduced based on the direction of the reference line along the X axis. Actually expression (19) can represent the interpolation error in any direction of the reference line.
(12)
(13)
(14)
(17)
(18)
(19)

36
INTERNATIONAL HYDROGRAPHIC REVIEW MAY 2014
Combined with the evaluation methods above, the rationality of the survey line layout can also be evaluated. The error sources of the magnetic anomaly map and the description of its precision are listed in Table 2.
Table 2: The error sources of magnetic anomaly map and the description of its precision
3. INFLUENCE OF SURVEY LINE LAYOUT ON SURVEY RESULT In designing the marine magnetic survey, the sur-vey line layout includes the determination of the survey line direction and spacing. The evaluation method can be used to evaluate the rationality of the survey line layout. The known (from prior surveys) magnetic anomaly maps have been adopted. When different survey line layouts are applied and simulated magnetic surveys carried out, the interpolation precisions are calculated and the magnetic anomaly contour maps are plotted with simulated data. The change of interpolation precisions and comparisons of the magnetic anomaly maps are analyzed to deter-mine the influence of the survey line layout on the overall survey result.
The background data for simulations have been introduced and analyzed. The simulation and analysis are divided into three types:
1. The influence of the survey line layout on the interpolation precision (without the observation noise).
2. The influence of the survey line layout on the magnetic anomaly map (without the observation noise).
3. The influence of the survey line layout on the interpolation precision and magnetic anomaly map (with the observation noise).
These types of simulation have been confirmed and complement each other. 3.1 Analyzing of background data for simulations The magnetic anomaly maps of uniform distribu-tion (Simulation background A, in Figure 3) and non-uniform distribution (Simulation background B, in Figure 4) have been adopted as background data to simulate and analyze. The data sources respectively are marine magnetic surveys of a certain area in 2002 and 2006. Corresponding cor-rections have been completed and the grid data of 50m×50m have been interpolated, which are taken as real data in later simulations.
(a) Contour interval 5 nT
(b) Contour interval 10 nT
0 2000 4000 6000 8000 10000 12000 14000 16000 18000 200000
2000
4000
6000
8000
10000
X(m)
Y(m)
0 2000 4000 6000 8000 10000 12000 14000 16000 18000 200000
2000
4000
6000
8000
10000
Y(m)
X(m)
0 2000 4000 6000 8000 10000 12000 14000 16000 18000 200000
2000
4000
6000
8000
10000
Y(m)
X(m)
Figure 3: Magnetic anomaly map for simulation background A (contour interval 10 nT)
Figure 4(a) and (b): Magnetic anomaly map for simulation background B

37
INTERNATIONAL HYDROGRAPHIC REVIEW MAY 2014
The contour interval in Figure 4(a) is 5nT and is too dense to compare, so the contour interval of 10nT has been selected (Figure 4(b)) for compari-son and analysis. From Figure 4, the distribution of the magnetic anomaly is uniform, the maximum is 50.90nT, the minimum is -128.06nT, and the average is -40.23nT. The direction of the magnetic anomaly gradient is 153.89°.
3.2 Influence of survey line layout on interpola-tion precision (without observation noise) The influence of the survey line layout on the survey result can be divided into the impacts of the survey line direction and the survey line spacing. Therefore, different survey line directions and survey line spacing have been simulated and calculated. For analysis and outcomes, the repre-sentative simulation schemes are listed in Table 3. The sketch map of survey line direction shown as in Figure 5 ( a is the angle of total gradient direc-
tion of the magnetic anomaly and the X axis). Table 3: Simulation scheme of influence of survey line
layout
The aim of the simulations above are: (1) The im-pact of the survey line spacing on interpolation precision with the same survey line direction.(2) The impact of different survey line directions on the interpolation precision with the same survey line spacing. The simulation scheme above has been conducted without observation noise (mR=0), so combined with formulae (2) and (5).
(20)
The magnetic anomaly map of simulation background A (in Figure 3) is the known magnetic map and the influence of the survey line layout has been analyzed. The interval of the simulated survey points is 50m and the reference line spacing is 1000m. The simulation has been completed according to Table 3 with the results listed in Table 4 and charted in Figure 6.
Table 4: The interpolation precision in different survey line layouts of simulation background A(Unit nT)
Figure 5: The sketch map of survey line direction

38
INTERNATIONAL HYDROGRAPHIC REVIEW MAY 2014
The magnetic anomaly map of simulation background B (in Figure 4) is the known magnetic map and the influence of the survey line layout has also been analyzed. The interval of the simulated survey points is 50m and the reference line spacing is 1000m. The simulation has been completed according to Table 3 with the results listed in Table 5 and charted in Figure 7.
In Figure 6 (corresponding to Table 4 results) and Figure 7 (corresponding to Table 5 results), there are large discrepancies in the interpolation preci-sion in different survey line directions. The maximum discrepancy is 2.19nT in simulation background A (uniform distribution) and 4.21nT in simulation background B (non-uniform distribution). Therefore, the significance of the selection of the survey line direction has been adequately explained.
The conclusions from the simulations are:
The highest interpolation precision is obtained when the survey line direction is the total gradient direction. The lowest interpolation precision ap-pears along the perpendicular of the total gradient. The closer the survey line direction to the total gra-dient direction, the higher the interpolation preci-sion. Meanwhile, the discrepancy of the interpola-tion precision in a certain survey line direction will increase as the survey line spacing increases.
Table 5: The interpolation precision in different survey line layouts of simulation background A(Unit nT)
0 0.1 0.2 0.3 0.4 0.5 0.6 0.7 0.8 0.9 1 1.1 1.2 1.3 1.4 1.5 1.6 1.7 1.8 1.9 2 2.10
0.10.20.30.40.50.60.70.80.9
11.11.21.31.41.51.61.71.81.9
22.12.22.32.42.52.62.72.82.9
33.13.23.33.43.5
The line Spacing(km)
)T
he in
terp
olat
ion
prec
ison
of
mag
neti
c an
omal
y(nT
)
Total gradient
The axis X
The axis Y
Perpendicluar to total gradient
0 0.1 0.2 0.3 0.4 0.5 0.6 0.7 0.8 0.9 1 1.1 1.2 1.3 1.4 1.5 1.6 1.7 1.8 1.9 2 2.1 2.20
0.20.40.60.8
11.21.41.61.8
22.22.42.62.8
33.23.43.63.8
44.24.44.64.8
55.25.45.65.8
66.26.46.66.8
7
The line Spacing(km)
)T
he in
terp
olat
ion
prec
ison
of
mag
neti
c an
omal
y(nT
)
Total gradient
The axis X
The axis Y
Perpendicluar to total gradient
Figure 7: The interpolation precision in different survey line layouts of simulation background B
Figure 6: The interpolation precision in different survey line layouts of simulation background A

39
INTERNATIONAL HYDROGRAPHIC REVIEW MAY 2014
3.3 Influence of survey line layout on magnetic anomaly map (without observation noise) To analyze the influence of the survey line layout on the magnetic anomaly map and discuss the consistency of interpolation precision, contrastive simulation and analysis have been carried out. Based on the background B simulation, in which the non-uniform distribution magnetic anomaly has
been adopted, the simulation content and the aims are listed in Table 6. The simulated magnetic anomaly maps and the comparative results are shown in Figures 8 to 12. For comparison purposes, the known and simulated magnetic anomaly maps have been plotted together in the same map display - the known magnetic anomaly contours are plotted as solid lines and the simulated magnetic anomaly contours are plotted as dashed lines. The contour interval is 10nT.
Table 6: Simulation scheme of influence on magnetic anomaly map
0 2000 4000 6000 8000 10000 12000 14000 16000 18000 200000
2000
4000
6000
8000
10000
X(m)
Y(m)0 2000 4000 6000 8000 10000 12000 14000 16000 18000 20000
0
2000
4000
6000
8000
10000
X(m)
Y(m)
Simulation N°1 (Line spacing is 0.3km) Simulation N°2 (Line spacing is 0.9km)

40
INTERNATIONAL HYDROGRAPHIC REVIEW MAY 2014
Simulation No.3 (Line spacing is 1.2km) Simulation No.4 (Line spacing is 1.93km)
Simulation No.5 (Line direction is the total gradient) Simulation No.6 (Line direction is the Axis X)
Simulation No.7 (Line direction is the Axis Y) Simulation No.8 (Line direction is Perpendicular to total gradient)
Simulation No.9 (Line direction is the total gradient) Simulation No.10 (Line direction is the Axis X)
0 2000 4000 6000 8000 10000 12000 14000 16000 18000 200000
2000
4000
6000
8000
10000
Y(m)
X(m)
0 2000 4000 6000 8000 10000 12000 14000 16000 18000 200000
2000
4000
6000
8000
10000X(m)
Y(m)
0 2000 4000 6000 8000 10000 12000 14000 16000 18000 200000
2000
4000
6000
8000
10000
X(m)
Y(m)0 2000 4000 6000 8000 10000 12000 14000 16000 18000 20000
0
2000
4000
6000
8000
10000
Y(m)
X(m)
0 2000 4000 6000 8000 10000 12000 14000 16000 18000 200000
2000
4000
6000
8000
10000
X(m)
Y(m)
0 2000 4000 6000 8000 10000 12000 14000 16000 18000 200000
2000
4000
6000
8000
10000
X(m)
Y(m)
0 2000 4000 6000 8000 10000 12000 14000 16000 18000 200000
2000
4000
6000
8000
10000
Y(m)
X(m)
0 2000 4000 6000 8000 10000 12000 14000 16000 18000 200000
2000
4000
6000
8000
10000X(m)
Y(m)
Figure 8: The comparison of simulated map and known map for simulations No.1 to No.4 (survey line direction is the total gradient)
Figure 9: The comparison of simulated map and known map for simulations No.5 to No.8 (survey line spacing is 1km)
Figure 10: The comparison of simulated map and known map for simulations No.9 to No.12 (survey line spacing is 1km)

41
INTERNATIONAL HYDROGRAPHIC REVIEW MAY 2014
As shown in Figure 8 (corresponding to simula-tions No.1 - No.4), if the survey line direction is fixed (the total gradient direction has been adopted), the discrepancy between the simulated magnetic anomaly map with different survey line spacing and the known magnetic anomaly map can be detected. There is better agreement between the simulated map and the known map (only few magnetic anomalies have been lost), if the survey line spacing is less than 1.2km (MI=1nT). The worst difference will be found in simulation No.4, when the survey line spacing is more than 1.9km. Although the general trend of the magnetic anomaly can be approximately determined, distortion exists in the magnetic anom-aly map. This distortion is relative and can be detected if the discrepancy is more than 2nT for a contour interval of 10nT, which is 1/5 of the contour interval in this paper. As shown in Figure 9 (corresponding to simulation No.5 - No.8) and Figure 10 (corresponding to simulation No.9 - No.12), if the survey line spacing is fixed, the discrepancy between the simulated
magnetic anomaly map in different survey line directions and the known magnetic anomaly map can be detected. For results of simulations No. 6 – No. 12, when the survey line spacing is less than 1km, the variation of the interpolation precision in the different survey line direction is 0.74~2.03. When the simulated magnetic anomaly map and the known magnetic anomaly map is coincident, little discrepancy between the contours can be detected in a few areas. However, the variation of interpolation precision in different survey line directions range from 0.74 to 2.03. When the survey line spacing is more than 2km, the larger discrepancy will be found between the simulated map and the known map, and the distortion is distinct. Comparing the magnetic anomaly maps of the simulations No.1 to No. 12, the interpolation precision creates consistent magnetic anomaly maps. The higher the interpolation precision, the smaller the distortion is detected and the agree-ment improves.
Simulation No.13 (Line direction is the total gradient) Simulation No.14 (Line direction is the Axis X)
Simulation No.15 (Line direction is the total gradient) Simulation No.16 (Line direction is the Axis X)
0 2000 4000 6000 8000 10000 12000 14000 16000 18000 200000
2000
4000
6000
8000
10000
X(m)
Y(m)0 2000 4000 6000 8000 10000 12000 14000 16000 18000 20000
0
2000
4000
6000
8000
10000
X(m)
Y(m)
0 2000 4000 6000 8000 10000 12000 14000 16000 18000 200000
2000
4000
6000
8000
10000X(m)
Y(m)0 2000 4000 6000 8000 10000 12000 14000 16000 18000 20000
0
2000
4000
6000
8000
10000X(m)
Y(m)
Figure 11: The comparison of simulated map and known map for simulation No.13 to No.16 (interpolation precision is less than 1nT)

42
INTERNATIONAL HYDROGRAPHIC REVIEW MAY 2014
Results of the simulations No.13 to No. 20 are analyzed, and the matching characteristics of the survey line direction and the survey line spacing discussed. As Shown in Figure 11 (corresponding to simulations No.13 to No.16) and despite the survey line spacing and survey line directions be-ing different, the interpolation precisions are almost the same, and the simulated and known maps are coincident. For example, the interpolation precision where the survey line spacing is 1.2km in total gra-dient direction and 0.6km perpendicular of the total gradient direction are equal (1nT). Line numbers along the latter will be twice the former. The same result is in simulation No.17 to No.20 (as shown in Figure 14). To obtain the interpolation precision of 2nT, the survey line spacing is 1.9km in total gradi-ent and 0.8km perpendicular of the total gradient. The line numbers will be doubled. So the maximum line spacing along a certain survey line direction will meet the requirement of interpolation precision. Line numbers are mini-mized when survey lines are designed along the total gradient.
3.4 Influence of survey line layout on interpola-tion precision and magnetic anomaly map (with observation noise) In survey practice, observation errors inevitably exist. To simulate closer to the real survey practice, the observation error of normal distribu-tion have been added in the representative simula-tions above and simulation scheme are listed in Table 7. Table 7: Simulation scheme with observation noise
0 2000 4000 6000 8000 10000 12000 14000 16000 18000 200000
2000
4000
6000
8000
10000X(m)
Y(m)
0 2000 4000 6000 8000 10000 12000 14000 16000 18000 200000
2000
4000
6000
8000
10000X(m)
Y(m)
Simulation No.17 (Line direction is the total gradient) Simulation No.18 (Line direction is the Axis X)
0 2000 4000 6000 8000 10000 12000 14000 16000 18000 200000
2000
4000
6000
8000
10000
X(m)
Y(m)0 2000 4000 6000 8000 10000 12000 14000 16000 18000 20000
0
2000
4000
6000
8000
10000
X(m)
Y(m)
Simulation No.19 (Line direction is the total gradient) Simulation No.20 (Line direction is the Axis X)
Figure 12: The comparison of simulated map and known map for simulation No.17 to No.20 (interpolation precision is less than 2nT)

43
INTERNATIONAL HYDROGRAPHIC REVIEW MAY 2014
The simulation aims of Table 7 are described below. With the observation noise added: (1) The consistency of interpolation precision and magnetic anomaly map is verified; and (2) the law of
propagation of errors have been validated for the interpolation precision. The detailed simulation results have been listed in Table 8 and Figure 13 and 14.
No. Noise magnitude
Survey line spacing
Survey line direction
Total gradient Axis X Axis Y Perpendicular of total gradient
mt mR mI mt mR mI mt mR mI mt mR mI
21
1.0nT
0.5km 1.24 0.98 0.76 1.37 0.98 0.96 1.40 1.01 0.97 1.47 1.02 1.06
22 1.0km 1.27 1.00 0.78 1.40 1.00 0.98 1.53 1.00 1.16 2.35 0.99 2.13
23 1.5km 1.70 1.02 1.36 2.01 0.99 1.74 2.51 0.99 2.31 3.72 1.00 3.58
24 2.0km 2.41 1.00 2.20 3.19 1.02 3.02 5.19 0.99 5.10 5.89 1.00 5.80
25
1.4nT
0.5km 1.74 1.40 1.03 1.75 1.41 1.04 1.76 1.41 1.05 1.83 1.41 1.18
26 1.0km 1.76 1.39 1.07 1.79 1.38 1.15 2.02 1.41 1.45 2.53 1.40 2.11
27 1.5km 1.97 1.39 1.40 2.22 1.42 1.70 2.85 1.40 2.48 4.91 1.41 4.70
28 2.0km 2.78 1.42 2.39 3.49 1.42 3.18 4.59 1.42 4.36 5.96 1.41 5.79
Table 8: The interpolation precisions in different survey line layouts of simulation background B (With the observation noise)
Simulation No.21 (Line spacing is 0.5km) Simulation No.22 (Line spacing is 1 km)
Simulation No.23 (Line spacing is 1.5km) Simulation No.24 (Line spacing is 2.0km)
0 2000 4000 6000 8000 10000 12000 14000 16000 18000 200000
2000
4000
6000
8000
10000
X(m)
Y(m)0 2000 4000 6000 8000 10000 12000 14000 16000 18000 20000
0
2000
4000
6000
8000
10000X(m)
Y(m)
0 2000 4000 6000 8000 10000 12000 14000 16000 18000 200000
2000
4000
6000
8000
10000
X(m)
Y(m)0 2000 4000 6000 8000 10000 12000 14000 16000 18000 20000
0
2000
4000
6000
8000
10000
X(m)
Y(m)
Figure 13: The comparison of simulated map and known map for simulation No.21 to No.24 (the observation noise is 1nT, line direction is total gradient)

44
INTERNATIONAL HYDROGRAPHIC REVIEW MAY 2014
In Table 8, , can be calculated by the difference of the reference points between the interpolated value and the observed value with observation noise. mR can be calculated by cross points of the main lines and the reference lines with observation noise. mI can be calculated by the difference of the reference points between the interpolated value by the main lines with the observation noise and the observed value in the reference lines without the observation noise. The law of propagation of errors (See formulae (2)) has been verified by the numerical values in Table 9. A comparison of the interpolation precision, with and without observation noise added, is shown in Figure 15. As shown in Figure 15 and Table 8, the obvious differences can be detected in the interpolation precision of different survey line layouts between the survey line spacing and observation noise. Meanwhile the agreement between the magnetic anomaly maps can be perfectly reflected by the corresponding interpolation precision. By increas-ing the observation noise to obtain the same interpolation precision, the corresponding survey line spacing must be decreased. For example, if survey lines are designed along the total gradient,
to obtain the interpolation precision of 1nT, the survey line spacing must be less than 1km with observation noise of 1nT and 1.4nT.
4. THE SURVEY LINE DESIGN METHOD Based on the analysis above, we can conclude that the interpolation precision can be applied in the evaluation of the rationality of the survey line layout. Further, it can be used to optimize the survey line layout for marine magnetic surveys.
Simulation No.25 (Line spacing is 0.5km) Simulation No.26 (Line spacing is 1 km)
Simulation No.27 (Line spacing is 1.5km) Simulation No.28 (Line spacing is 2.0km)
0 2000 4000 6000 8000 10000 12000 14000 16000 18000 200000
2000
4000
6000
8000
10000
X(m)
Y(m)0 2000 4000 6000 8000 10000 12000 14000 16000 18000 20000
0
2000
4000
6000
8000
10000X(m)
Y(m)
0 2000 4000 6000 8000 10000 12000 14000 16000 18000 200000
2000
4000
6000
8000
10000X(m)
Y(m)0 2000 4000 6000 8000 10000 12000 14000 16000 18000 20000
0
2000
4000
6000
8000
10000
X(m)
Y(m)
Figure 14: The comparison of simulated map and known map for simulation No.21 to No.24 (the observation noise is 1.44nT, line direction is total gradient)
tm
0.5 0.7 0.9 1.1 1.3 1.5 1.7 1.9 20.4
0.6
0.8
1
1.2
1.4
1.6
1.8
2
2.2
2.4
The ling spacing(km)
()
The
inte
rpol
atio
n pr
ecis
ion
of m
agne
tic
anom
aly
nT
The nosie is 1nT
The noise is 2nT
without noise
Figure 15: The comparison map of the interpolation precision with and without observation noise
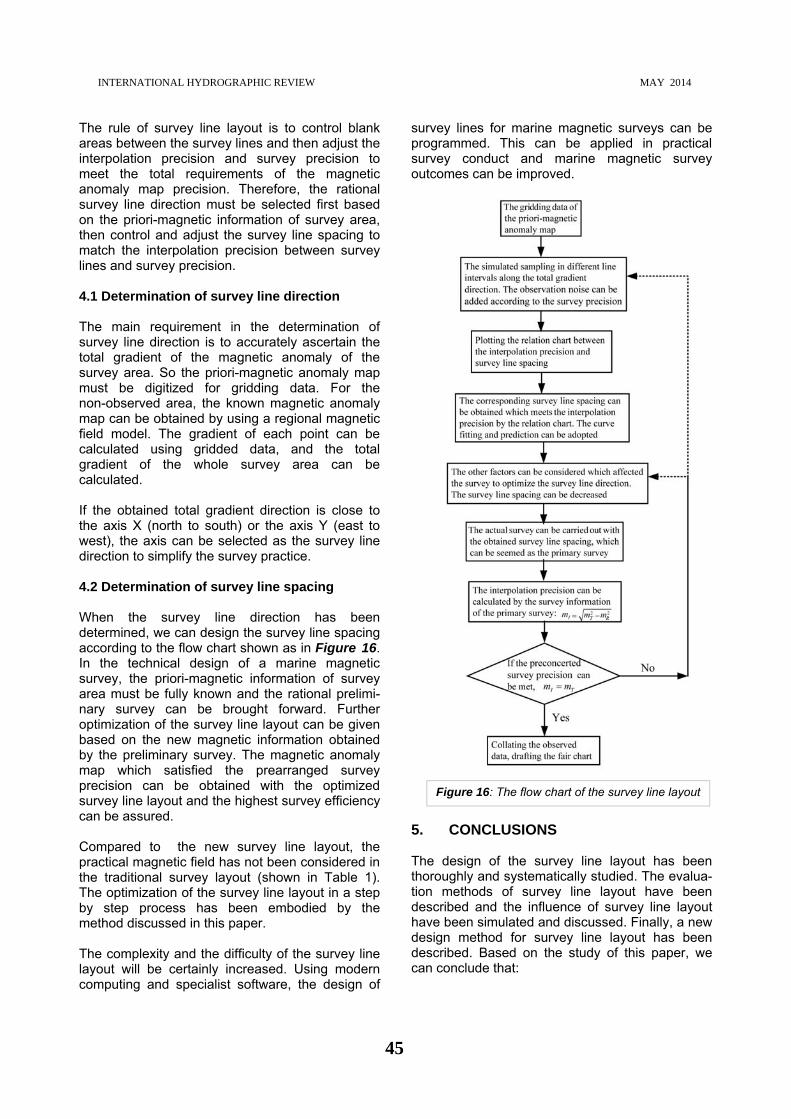
45
INTERNATIONAL HYDROGRAPHIC REVIEW MAY 2014
The rule of survey line layout is to control blank areas between the survey lines and then adjust the interpolation precision and survey precision to meet the total requirements of the magnetic anomaly map precision. Therefore, the rational survey line direction must be selected first based on the priori-magnetic information of survey area, then control and adjust the survey line spacing to match the interpolation precision between survey lines and survey precision. 4.1 Determination of survey line direction The main requirement in the determination of survey line direction is to accurately ascertain the total gradient of the magnetic anomaly of the survey area. So the priori-magnetic anomaly map must be digitized for gridding data. For the non-observed area, the known magnetic anomaly map can be obtained by using a regional magnetic field model. The gradient of each point can be calculated using gridded data, and the total gradient of the whole survey area can be calculated. If the obtained total gradient direction is close to the axis X (north to south) or the axis Y (east to west), the axis can be selected as the survey line direction to simplify the survey practice. 4.2 Determination of survey line spacing When the survey line direction has been determined, we can design the survey line spacing according to the flow chart shown as in Figure 16. In the technical design of a marine magnetic survey, the priori-magnetic information of survey area must be fully known and the rational prelimi-nary survey can be brought forward. Further optimization of the survey line layout can be given based on the new magnetic information obtained by the preliminary survey. The magnetic anomaly map which satisfied the prearranged survey precision can be obtained with the optimized survey line layout and the highest survey efficiency can be assured. Compared to the new survey line layout, the practical magnetic field has not been considered in the traditional survey layout (shown in Table 1). The optimization of the survey line layout in a step by step process has been embodied by the method discussed in this paper. The complexity and the difficulty of the survey line layout will be certainly increased. Using modern computing and specialist software, the design of
survey lines for marine magnetic surveys can be programmed. This can be applied in practical survey conduct and marine magnetic survey outcomes can be improved.
5. CONCLUSIONS The design of the survey line layout has been thoroughly and systematically studied. The evalua-tion methods of survey line layout have been described and the influence of survey line layout have been simulated and discussed. Finally, a new design method for survey line layout has been described. Based on the study of this paper, we can conclude that:
Figure 16: The flow chart of the survey line layout

46
INTERNATIONAL HYDROGRAPHIC REVIEW MAY 2014
(1) The evaluation method of magnetic anomaly map and interpolation precision between the sur-vey lines can be effectively applied in evaluation of the rationality of survey line layout. (2) The highest interpolation precision can be ob-tained if survey lines are designed along the total gradient. By increasing the survey line spacing, the difference of the interpolation precision between different survey line directions will also be in-creased. However, regard to certain survey line direction, the interpolation precision will be differ-ent, which will decrease with increasing the survey line spacing. (3) The value of the interpolation precision and magnetic anomaly map is consistent in evaluation of the rationality of survey line layout. The higher the interpolation precision, the less distortion in the magnetic anomaly map and the more the agree-ment will be. Meanwhile the simulation with obser-vation noise shows that the interpolation precision is in accord with the law of propagation of errors and the theoretical analysis of the interpolation precision is inosculated. (4) The integral research of the survey line layout shows that the new method of the survey line lay-out described is rational and feasible. An optimiza-tion of survey line layout in a step by step has been described, which is in accord with survey practice. 6. REFERENCES BIAN Gang, LIU Yanchun,YU Bo (2008). “The
Evaluation of Interpolation Residual Precision with Midpoint of Reference Lines in Marine Mag-netic Survey”, Journal of Geodesy and Geody-namics, 28(3), pp. 96~99.
E.C. Boumweester adg A.W. Heemink (1993).
“Optimal Line Spacing in Hydrographic Survey”, International Hydrographic Review, LXX(1), pp. 37~48.
HUANG Motao, ZHAI Guojun, OUYANG Yong-
zong (2006). “Research On Error Compensation in Marine Magnetic Survey”, Journal of Geomat-ics and Information Science of Wuhan University, 31(7), pp. 603~606.
LIANG Kailong and LIU Yanchun (1996). Marine
Gravity and Magnetic Survey, Publishing House
of Surveying and Mapping, China. LIU Yanchun (2004). The Spatial Constructer of
the Marine Sounding and Data Processing, Publishing House of Surveying and Mapping, China.
LIU Yanchun and XIAO Fumin (2006).The
conspectus of the Hydrography, Publishing House of Surveying and Mapping, China.
LIU Yanchun, LI Mingsan, HUANG Motao
(2001). “The Rank-Defect Adjustment Model for Survey-line Systematic Errors in Marine Survey Net”, Journal of Geomatics and Information Science of Wuhan University, 26(3), pp. 533~538.
National Supervisor Bureau for Quality
Technique (1998). The Criteria of Hydrographic Survey. Chinese criteria press, China.
7. BIOGRAPHIES OF THE AUTHORS Dr BIAN Gang has been a lecturer in the Depart-ment of Hydrography & Cartography of the Dalian Naval Academy since 2011. He received his Doc-tor’s degree in Geodesy and Surveying Engineer-ing Subject in 2008. He worked on the naval train-ing ship fleet from 2009 to 2011 and was appointed as the navigation officer of training ship SHI Chang. He is engaged in hydrographic surveying theory and data processing and has extensive ex-perience in marine magnetic survey practice and data processing. Email: [email protected]. Cell phone: +8613387859531 Professor Dr XIA Wei is the Associate Professor in the Department of Hydrography & Cartography of Dalian Naval Academy. He worked in the Naval Survey Troop from 2001 to 2002 which? where? he was appointed as the substitute captain of the survey unit. He has worked as a lecturer in the Department of Hydrography & Cartography of the Dalian Naval Academy since 2003 and researched hydrographic surveying theory and data process-ing. He received his Doctor’s degree in Geodesy and Surveying Engineering in 2009. He has exten-sive experience in multibeam sounding survey practice and data processing. Email: [email protected]. Cell phone: +8613998545423

47
INTERNATIONAL HYDROGRAPHIC REVIEW MAY 2014
Dr JIN Shaohua has been a lecturer in the Depart-ment of Hydrography & Cartography of the Dalian Naval Academy since 2006. He worked in the Naval Survey Troop from 2004 to 2005 and was appointed as the substitute captain of the survey unit. He is engaged in hydrographic surveying theory and data processing. He received his Doctor’s degree in Geodesy and Surveying Engineering in 2011. He has extensive experience in marine magnetic survey practice and data processing. Email: [email protected]. Cell phone: +8613840933021 Professor Dr XIAO Fumin is the Associate Pro-fessor in the Department of Hydrography & Cartog-raphy of the Dalian Naval Academy. He worked in the Naval Survey Troop from 1989 to1994 which? where he was appointed as the substitute captain of the survey unit. He has been a lecturer in the Department of Hydrography & Cartography of the Dalian Naval Academy since 1995 and researched hydrographic surveying theory and data process-ing. He received his Doctor’s degree in Geodesy and Surveying Engineering Subject in 2007. He is currently the Associate Professor of the depart-ment and has extensive experience in hydro-graphic surveying practice and data processing. Email: [email protected]. Cell phone: +8613842695886 Dr SUN Xinxuan has been a lecturer in the De-partment of Hydrography & Cartography of the Dalian Naval Academy since 2005. He worked in the Naval Survey Troop from 1999 to 2002 where which? he was appointed as the captain of survey unit. He is engaged in hydrographic surveying theory and data processing. He obtained his Doctor’s degree in Geodesy and Surveying Engineering Subject in 2009. He has extensive experience in chart datum transfer theory and algorithms. Email: [email protected]. Cell phone: +8618640862069 Dr CUI Yang has been a lecturer in the Depart-ment of Hydrography & Cartography of the Dalian Naval Academy since 2006. She worked in the Naval Survey Troop from 2004 to 2005 and was appointed as the substitute captain of the survey unit. She is engaged in marine geodesy survey theory and data processing. She obtained her Doctor’s degree in Geodesy and Surveying Engineering in 2013. She has extensive experi-ence in marine geodesy survey practice and data processing. Email: [email protected]. Cell phone: +8613998435151

48
INTERNATIONAL HYDROGRAPHIC REVIEW MAY 2014
Page intentionally left blank

49
INTERNATIONAL HYDROGRAPHIC REVIEW MAY 2014
THE AGS 61 “CABO DE HORNOS” NEW CHILEAN SCIENTIFIC RESEARCH VESSEL
By Fernando Mingram, Captain (Ret.) Executive Secretary, National Oceanographic Committee –CONA
On the 1st July 2013, a new Chilean Scientific Research Vessel “Cabo de Hornos” initiated her research activities. Operated by the Chilean Navy, she constitutes a sound change in modernization, equipment and capabilities with respect to the previous naval oceanographic vessels and the limited resources that have existed within other national institutions (see Figure 1).
Figure 1. Cabo de Hornos
1. ORIGIN OF THE PROJECT Marine Scientific Research in Chile Chile is an oceanic country that includes an oceanic islands system, fiords and austral channels together with the Antarctic Territory. This particularity demands Chile to have in place a sustainable scientific marine research development, not just to improve knowledge but to make a responsible use and appropriate management of the natural resources without affecting the ecosystem. The history of the marine research in Chile contains several benchmarks in which the Chilean Navy has had an outstanding participation with its ships and personnel. One of these benchmarks was the initiative proposed by the Navy to the Government in 1970, to establish a National Oceanographic Committee (CONA). The formation of this committee constitutes a pioneer decision worth highlighting. The Committee is chaired by the Director of the Chilean Navy Hydrographic and Oceanographic Service, in his capacity as the National Authority in Oceanography. Actually, 29 members - Universities and State Organizations – form the CONA which has had an active role in its 42 years of existence, having been recognized as the research and marine science coordination and enhancing reference institution in Chile. An example of this was the creation, in 1994, of the CIMAR Program (Marine Research Cruises in Remote Areas). The general objective of this Program is to study with a multidisci-plinary vision the oceanographic, marine biodiversity, ocean-atmosphere interaction and submarine morphology in remote areas, where the marine environment knowledge has a

50
INTERNATIONAL HYDROGRAPHIC REVIEW MAY 2014
strong influence in the sustainable socio-economic development of local communities and the country in general, through annual cruises. CIMAR constitutes a reference example of integration and cooperation between the Chilean Navy – through its vessels and SHOA – with universities and research centers, facilitating the start-up to hundreds of projects, scientific publications, presentations at marine national and international Science Congresses, together with the support for Pre and Post grade Thesis for Bachelors in Science and PhDs. The Need for an Oceanographic Vessel The shortage of adequate marine research, oceanographic and fishery platforms has been a recurrent subject in the Chilean marine sciences environment. For a long time, through different documents and discussions, SHOA and CONA jointly with the national marine scientific community, have expressed the need to have an oceanographic vessel to satisfy national research needs. In September 1992, the former “Thomas Washington” from Scripps, USA, a vessel of the 1960’s with over a million nautical miles sailed was received by Chile. With the name AGOR “Vidal Gormaz”, she started her service in the Chilean Navy with an oceanographic research role until 2010. Different attempts to obtain better platforms did not progress. Nevertheless, SHOA continued to work on a project to replace the old “Vidal Gormaz” by another used vessel or through the building of a new platform. SHOA developed and established the High Level Requirements, a fundamental step in the definition of the characteristic and capabilities such an eventual platform should have to fulfill the national requirements. The “Medusa” Project In May 2007, the Navy’s CNO decided to hand the Project to the Naval Program, Research and Develop-ment Directorate, with the name “Medusa” to which the fishery research component was incorporated. On the 28th December 2007, a contract was signed between the Chilean Navy and ASMAR for the construction of an Oceanographic Vessel. ASMAR hired SKIPTEKNISK company for the ship’s design based on the final needs definition; WARTSILA for the development and acquisition of the propulsion system and KONGSBERG for the acoustic sensors. In July 2008 the shipyard started building the ship in Talcahuano, Chile. In February 2010, with the vessel ready for her launching and baptism, an 8.8 Richter scale earthquake and related tsunami affected Talcahuano, causing severe damage to the shipyard and the brand new platform was left sunken over a sand bank at the end of the dock, after the passage of the tsunami. This extremely complex event affected the project, the shipyard, the Navy and the country. Insurances were activated and the recovery of the platform started. After preparatory hard work that took several weeks in the field with the support of specialized machines, on the 28th January 2011 the MAMMOET, a Netherland company con-ducted a titanic maneuver to revert the situation and left the vessel afloat and in conditions to repair all damages and to continue the construction. 2. AGS 61 “CABO DE HORNOS” – CHARACTERISTICS She is a 74.1m in length and 15.6m in the beam with a deadweight of 3,000 tons and 35 days of autonomy without being replenished. With a crew of 9 Officers and 34 enlisted personnel, she can carry up to 25 scientists on board. She has three labs, acoustic and special sensors’ room, 10 and a 40 cubic m freezers with adjustable temperature ranging from +5°C to -30°C; three jib cranes one of which has a 30 tons type “A” frame at the stern; three telescopic cranes with a 12 tons capacity, 13 winches for oceanographic, geology and fishing gears; three multibeam echosounders; a sub bottom profiler, a sound speed profiler, an Acoustic Doppler Current Profiler (ADCP), multi-frequency sonar for biomass classification; short and long range omni-directional biomass scan sonar; high precision acoustic positioning sub-system with transpond-ers; monitoring wireless network system, sensors and data synchronization and control sub-system; submarine telephone UQC, radars and echosounders for navigational purposes and a variety of meteoro-logical instruments that collects data automatically in digital format. It worth highlighting that the vessel “Cabo de Hornos” is an ultra silent vessel, complying with ICES 209 acoustic standard, that means that she can sail at a distance of 20 meters from a fish school without being notices by the fishes.

51
INTERNATIONAL HYDROGRAPHIC REVIEW MAY 2014
3. THE “CABO DE HORNOS” ACTIVITIES The first “Cabo de Hornos” mission was the project “CIMAR Fiordos 19”, which took place from 01 to 20 July, in the area delimited by the Reloncaví estuary and the Guafo gulf and included base line studies to continue the population of the existing data bases such as bio-oceanographic processes; primary, bacte-ria and zooplankton production and sediment studies in different areas identified as impor-tant for the sciences development. Samples were taken at 17 oceanographic stations in the area, together with samples of the main rivers. The activities were conducted by 18 researchers of different universities and 5 specialist of SHOA (see Figure 2).
During August, “Cabo de Hornos” conducted her first fishery research cruise to evaluate three different types of hake spawning stock in the austral oceanic waters. This project was funded by the Fishery Research Fund and executed by the Fishery Development Institute together with two invited researchers of the Pontifical Catholic University of Valparaiso, for the gathering of the oceanographic data (see Figure 3).
Figure 3. Fishery research onboard Cabo de Hornos
Figure 2. Study Area CIMAR Cruise
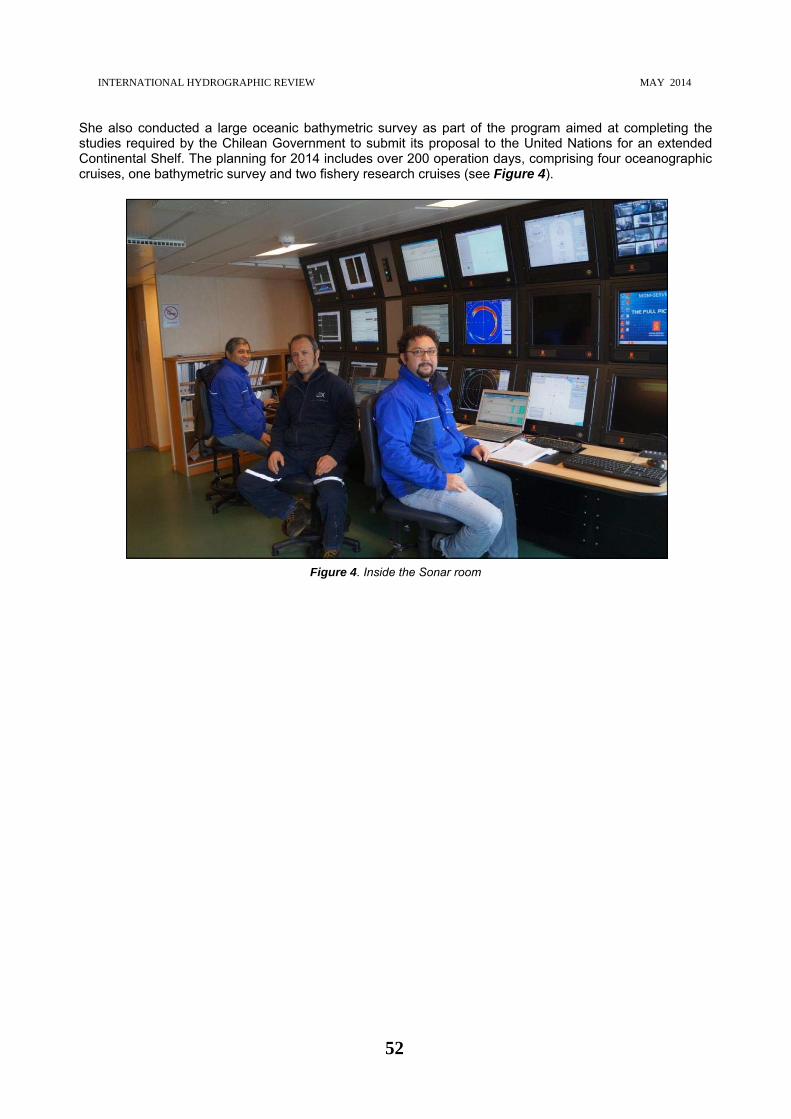
52
INTERNATIONAL HYDROGRAPHIC REVIEW MAY 2014
She also conducted a large oceanic bathymetric survey as part of the program aimed at completing the studies required by the Chilean Government to submit its proposal to the United Nations for an extended Continental Shelf. The planning for 2014 includes over 200 operation days, comprising four oceanographic cruises, one bathymetric survey and two fishery research cruises (see Figure 4).
Figure 4. Inside the Sonar room

53
INTERNATIONAL HYDROGRAPHIC REVIEW MAY 2014
IC-ENC ENC VALIDATION TRAINING COURSE By Laura TYZACK (IC-ENC)
& Panagiotis GKIONIS (Hellenic Navy Hydrographic Service)
Abstract The International Centre for ENCs (IC-ENC) was set up in 2002 with a remit to harmonise the production and distribution of high quality ENCs. This Note provides an insight into IC-ENC, its validation processes, and the new ENC Validation Training Course. It is jointly authored by Lt.Cdr. Panagiotis Gkionis (Hellenic Navy Hydrographic Service, ENC Validation Training Course delegate) and Miss Laura Tyzack (IC-ENC Data Validator). Introduction to IC-ENC IC-ENC is a Regional ENC Coordinating Centre (RENC), established to support the achieve-ment of the IHO’s Worldwide Electronic Navigational Chart Database (WEND) Principles. IC-ENC is a low cost, not for profit RENC which was set up in 2002. IC-ENC’s role, as an international centre of ENC excellence, is to assist Hydrographic Offices (HOs) to harmonise their production and distribution of ENCs. IC-ENC does this by providing four main services to HOs:
ENC Production Support Independent ENC Validation ENC Distribution ENC Revenue Management
IC-ENC has 12 members of staff across two offices - the headquarters in the United Kingdom and a regional office in Australia. It has 29 member HOs at present, with new nations joining on a regular basis. IC-ENC now has a folio of over 5000 ENCs which are validated on a regular basis. Figure 1 shows the current IC-ENC membership.
Figure 1 – Current IC-ENC membership

54
INTERNATIONAL HYDROGRAPHIC REVIEW MAY 2014
IC-ENC is controlled by its members. The members meet annually through a Steering Committee meeting to discuss strategic issues, agree on policies and set the budget. There are also Technical and Commercial Working Groups held each year, attended by both IC-ENC staff and member HOs, which recommend policies to the Steering Committee. IC-ENC Validation IC-ENC’s approach to validation is to consider the impact of any issues, identified during the validation process, on the end user of the ENC product, the mariner. This is achieved through the use of policies, IHO documentation, and working practices to assist the IC-ENC Validator in the quality assurance of each ENC that is produced by the member HOs. The working practices set out the validation procedures, which include conformance to S-57 and S-58 IHO standards, vertical and horizontal consistency, and assessment of ENC display on ECDIS. IC-ENC members then receive a comprehensive feedback report for each proc-essed ENC. These reports highlight any data issues including recommendations for improvement. IC-ENC members have access to the IC-ENC Errors Database, a database of validation tool errors, which explains each error’s meaning, significance and action to take. This helps the HO to interpret the error and to assist with their own production and internal validation. IC-ENC checks an ENC’s data structure against both S-57 and S-58 standards, and also its data content by making a visual assessment. IC-ENC uses several validation software tools to assist in the validation of each ENC, including 7Cs Analyzer and Designer, dKart Inspector, and two ECDIS systems. Each validation software tool generates log files of error messages, which are then inspected and classified according to IC-ENCs policy regarding the impact to the user. The IC-ENC Errors Database is used by the IC-ENC Validator to assist the validation process. A sample page is shown in Figure 2.
Figure 2 – Sample page from IC-ENC Errors Database

55
INTERNATIONAL HYDROGRAPHIC REVIEW MAY 2014
Further assessment is made to identify any gaps or overlaps between adjoining cells, and a visual assess-ment is made of the vertical and horizontal consistency of the ENCs in the area. This is done by accounting for the purpose of the ENC, voyage routes, prominent navigation features and so on, always with the navigator in mind. Several examples of these visual assessments are shown in Figures 3-4. Figure 3 shows an example of where a single HO has produced two adjoining cells of the same usage band which overlap one another. Overlaps or gaps in data can cause serious problems for ECDIS users, so IC-ENC would ask for immediate action to remove the overlap before it is released for use. Figure 4 shows the two cells after the overlap has been removed.
Figure 3 – Overlap in data identified using dKart Inspector 6.0
Figure 4 – Resolved overlap

56
INTERNATIONAL HYDROGRAPHIC REVIEW MAY 2014
Figure 5 shows an example of where a single HO has produced two adjacent usage band ENCs, but one of them is less up-to-date than the other, resulting in misaligned TSS objects. This is a good example of a problem for which IC-ENC would have asked for an immediate corrective action, given the importance of TSS objects.
Figure 5 – Misalignment of two Traffic Separation Scheme (TSS) objects Each ENC is then visually assessed using two widely used ECDIS. The assessment includes checking the clarity, consistency, application of SCAMIN (density of features when zooming in and out), and general usability of the ENC. Figure 6 shows an example of where two different HOs have produced neighbouring ENCs, but the different policies on the use of SCAMIN has resulted in a dataset which is not consistent. The ENC to the west does not have SCAMIN attributed to the soundings, resulting in a cluttered display in the shoaler areas, whereas the ENC to the east has a SCAMIN value attributed that is too large, resulting in the soundings being entirely removed from the display. This is a good example of an issue where IC-ENC would liaise with the HOs in order to achieve a more consistent display for the mariner, with each HO receiving individual advice about their implementation of SCAMIN.
Figure 6 – Different implementations of SCAMIN

57
INTERNATIONAL HYDROGRAPHIC REVIEW MAY 2014
Additional checks include the assessment of datums, compilation scales, additional word (.txt) and picture files (.tif), and CATZOC suitability. If there are any issues for which improvements are possible, the validator will make an assessment of the impact to the mariner and classify findings accordingly in the Validation Report. An example of a Validation Report is shown in Figure 7.
Figure 7 – Example P007 Validation Report Once an ENC has been accepted for release by the producing nation and IC-ENC, IC-ENC makes it avail-able to its Value Added Resellers (VARs). These VAR companies bring together ENCs from a variety of sources, and have developed commercial services that supply ENCs to users. The VARs therefore manage this element of the distribution chain, ensuring IC-ENC remains focused on data quality. Eight VARs are currently appointed (IC-ENC welcomes new applicants), and the variety of competing VAR services
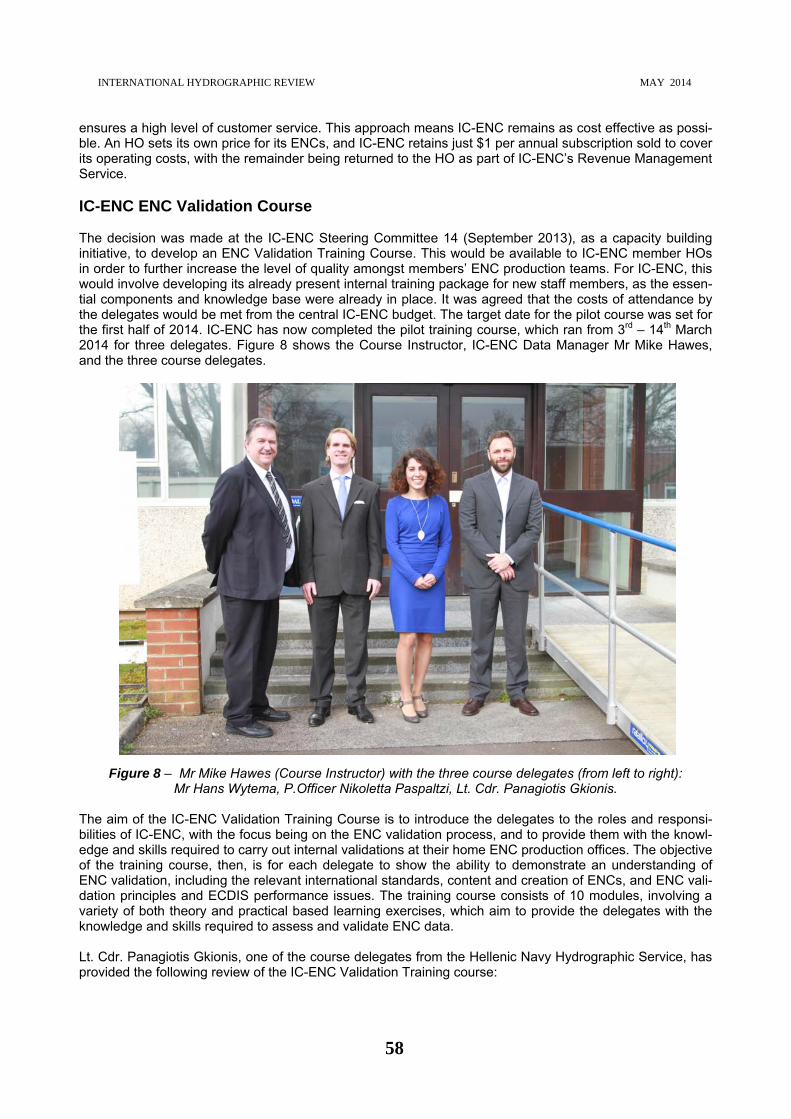
58
INTERNATIONAL HYDROGRAPHIC REVIEW MAY 2014
ensures a high level of customer service. This approach means IC-ENC remains as cost effective as possi-ble. An HO sets its own price for its ENCs, and IC-ENC retains just $1 per annual subscription sold to cover its operating costs, with the remainder being returned to the HO as part of IC-ENC’s Revenue Management Service. IC-ENC ENC Validation Course The decision was made at the IC-ENC Steering Committee 14 (September 2013), as a capacity building initiative, to develop an ENC Validation Training Course. This would be available to IC-ENC member HOs in order to further increase the level of quality amongst members’ ENC production teams. For IC-ENC, this would involve developing its already present internal training package for new staff members, as the essen-tial components and knowledge base were already in place. It was agreed that the costs of attendance by the delegates would be met from the central IC-ENC budget. The target date for the pilot course was set for the first half of 2014. IC-ENC has now completed the pilot training course, which ran from 3rd – 14th March 2014 for three delegates. Figure 8 shows the Course Instructor, IC-ENC Data Manager Mr Mike Hawes, and the three course delegates.
Figure 8 – Mr Mike Hawes (Course Instructor) with the three course delegates (from left to right): Mr Hans Wytema, P.Officer Nikoletta Paspaltzi, Lt. Cdr. Panagiotis Gkionis.
The aim of the IC-ENC Validation Training Course is to introduce the delegates to the roles and responsi-bilities of IC-ENC, with the focus being on the ENC validation process, and to provide them with the knowl-edge and skills required to carry out internal validations at their home ENC production offices. The objective of the training course, then, is for each delegate to show the ability to demonstrate an understanding of ENC validation, including the relevant international standards, content and creation of ENCs, and ENC vali-dation principles and ECDIS performance issues. The training course consists of 10 modules, involving a variety of both theory and practical based learning exercises, which aim to provide the delegates with the knowledge and skills required to assess and validate ENC data. Lt. Cdr. Panagiotis Gkionis, one of the course delegates from the Hellenic Navy Hydrographic Service, has provided the following review of the IC-ENC Validation Training course:

59
INTERNATIONAL HYDROGRAPHIC REVIEW MAY 2014
“An excellent course, suits from novice to confident validator level. It definitely improved my knowledge of how IC-ENC deals with ENC data, as well as my ability to use validation tools and better understand IC-ENC recommended actions for ENC improvement. Instruction was excellent and gave a lot of time to personal tuition and hands-on training. I would recommend this course to all HOs in need of ENC validation training for their staff. During the pilot course, the trainees were introduced to the IC-ENC status, governance and financial frame-work, its roles and responsibilities, as well as its current and future technology. Basic background informa-tion and IHO documentation (including S-57 component documents – ENC Product Specification, Use of the Object Catalogue for ENC, Object/Attribute Catalogue) related to data validation were presented, before the whole IC-ENC validation process (IC-ENC, 2013) was theoretically and practically demonstrated. Initially, the methodology and tools for uploading/downloading of datasets exchanged between IC-ENC and HOs (Exchange Sets) was described, together with an overview of the applicable data flow/management scheme. Then, the trainees were demonstrated the ENC registration procedure and basic checks for data corruption and non-sequential updates through the IC-ENC in-house developed database and software. A series of checks according to the S-57 and S-58 (IHO, 2011) standards and specifications were exercised both in the classroom using dedicated software suites (dKart Inspector, Editor and SevenCs’ Analyzer, Designer, Optimiser, Manager) as well as at the IC-ENC facilities with cells being actually validated. Variations from the S-57 and S-58 Standards (errors/warnings) are identified through the IC-ENC Errors Database/Lists and classified according to the impact to the mariner. Consistency checks of data between ENCs within a given region were also widely demonstrated. The trainees learnt how to assess data at the boundaries of adjoining ENCs that have identical compilation scales and to assess data against larger and smaller-scaled ENCs which overlap it. The validation procedure continues with the utilisation of two widely used ECDIS to ensure a safe representation of the chart data for the mariner through a clear, consistent and seamless ENC display. ECDIS are also used for identification of issues related with the application of the SCAMIN attribute. Finally, issues related with ENC data gaps/holes, overlapping data, generalisation, vertex reduction, text files and .tif files’ display were discussed through case studies. All error/warning messages (per processed ENC file) produced by the validation software together with any identified issues from the validator’s visual assessment, consistency and ECDIS checks are compiled in a comprehensive Validation Report which is sent to each IC-ENC member.” Future of IC-ENC IC-ENC will continue to provide a valuable service to its members. IC-ENC is actively seeking to increase its membership, and thus its ENC coverage, which will bring greater economies of scale to its operations, and further financial efficiencies. Additionally, following the recent success of the pilot IC-ENC Validation Training Course, IC-ENC aims to continue to provide further training opportunities to its members, aimed at improving the understanding of ENC validation. For more information, please visit the IC-ENC website at www.ic-enc.org. References IC-ENC (2013). Explanation of IC-ENC Validation Processes, viewed 24 March 2014, http://www.ic-enc.org/validation. International Hydrographic Organisation (2000). Transfer Standard for Digital Hydrographic Data, viewed 25 March 2014, http://www.iho.int/iho_pubs /IHO_Download.htm.

60
INTERNATIONAL HYDROGRAPHIC REVIEW MAY 2014
International Hydrographic Organisation (2011). Recommended ENC Validation Checks, viewed 25 March 2014, http://www.iho.int/iho_pubs/IHO_Download.htm. International Hydrographic Organisation (2012). Data Protection Scheme, viewed 25 March 2014, http://www.iho.int/iho_pubs/IHO_Download.htm. Biographies of the Authors Laura TYZACK is a Data Validator for IC-ENC. She joined IC-ENC in July 2013, previously working in a datafill team within the UKHO since August 2012. She achieved a BSc (Hons) degree in Geography in July 2012 at Bath Spa University. This formed her interest in cartography and the decision to join the UKHO, as well as become a member of the British Cartographic Society. Aside from cartography, she also has a strong interest in cultural geography. Email: [email protected]. Panagiotis GKIONIS has been working for the Hellenic Navy since 1994. Following training at the Hellenic Naval Academy, he embarked on his seagoing career in 1998. For the next 14 years he found him-self within warfare appointments onboard frigates and gunboats, qualifying primarily as a Navigating Officer. He took up his current appointment as an Assistant Head of the Research and Planning Department onboard the Hellenic Navy Hydrographic Service (HNHS), following the completion of an ‘MSc Hydrography’ programme in 2012. Following his training at the IC-ENC Validation Training Course, he is a member of the HNHS data validation team. Email: [email protected]
Copyright © 2022 FDOKUMEN