BVR YEAR BOOK 节选翻译(Selected) (一)
179
BVR YEAR BOOK 节选翻译(Selected) (一) By IACVA (China) Copyright: Business Valuation Resources (BVR), licensed to IACVA for translation into Chinese.
-
Upload
khangminh22 -
Category
Documents
-
view
2 -
download
0
Transcript of BVR YEAR BOOK 节选翻译(Selected) (一)

BVRYEAR BOOK节选翻译(Selected)
(一)
By IACVA (China)
Copyright: Business Valuation Resources (BVR), licensed to IACVA for translation into Chinese.

声明:本资料由 IACVA(中国)组织会员翻译。企业价值评估资源网(BVR)持有版权并授权 IACVA
翻译和使用。未经版权所有者许可不得复制、出版。本资料仅供阅读学习,不能作为业务指导和专业
意见。
我们尊重企业价值评估资源网(BVR)的原文著作权并感谢其对 IACVA(中国)翻译活动的支持,感
谢所有积极参与翻译活动的会员。感谢他们辛勤的努力以促进企业价值评估知识和信息的传播。
在此特别感谢以下活动参与者:
朱军、邓艳芳、文豪、李翔、胡东全、鲁国平、阮咏华、蒋东勇、包秋鸣、梁瑞莹、邵唯实、葛朔、
程永海、石慧、程海伦、姚青思、王本楠和王思遥。
Statement: The contents in this publication are translated by IACVA (China) members. Business
Valuation Resources (BVR) holds the copyright for the content and licenses it for translation andredistribution in Chinese to IACVA. No articles may be reproduced or published without permission of thecopyright owner. This information may only be used for references. It is not intended to be practicalguidance or professional advice.
We want to thank Business Valuation Resources (BVR) and our members for their support. Specifically,the following members participated in this endeavor. Their contributions made this publication possible.For any comments, please e-mail us at: [email protected].
Translators and proof-readers (no particular order):
Jun Zhu, YanFang Deng, Hao Wen, Xiang Li, DongQuan Hu, Guoping Lu, YongHua Ruan, DongYong Jiang,QiuMing Bao, RuiYing Liang, WeiShi Shao, Shuo Ge, YongHai Cheng, Hui Shi, HaiLun Cheng, QingSiYao, BenNan Wang and SiYao Wang.
Copyright: Business Valuation Resources (BVR), licensed to IACVA for translation into Chinese.

目 录
(Table of Contents)
用公司债券收益率度量规模溢价的替代方法……………………………………4
用收益法评估家庭有限合伙企业的最新观点……………………………………15
规模效应依然存在吗?来源于 Pratt 和 Grabowski 新的分析…………………28
达摩达兰对估值与定价的讨论及企业价值评估的观点…………………………31
达摩达兰警告“评估师”正在变成“定价者”……………………………………… 44
如何评估包含不动产的企业价值?………………………………………………51
帮助客户最大化实现并购协同价值………………………………………………64
隐含的私营企业定价曲线(IPCPM)K0= (FCFF1/P)+g(2015 版)………………75
跳出模型——跨国企业评估……………………………………………………… 95
一个被遗忘的统计概念解释了倍数可能错误的原因……………………………116
以离婚为目的的评估:久经检验的十项原则……………………………………129
美国税务法庭对专家见证税务事项的影响………………………………………136
行业协会可以成为很好的补偿费用数据来源……………………………………142
预览行业资本成本新基准资源……………………………………………………152
评估酒店的机会和特别思考………………………………………………………163

用公司债券收益率度量规模溢价的替代方法
©IACVA(CHINA) - BVR 1
Alternative Model Uses Corporate Bond Yields to
Measure a Size Premium
用公司债券收益率度量规模溢价的
替代方法
作者: Michael Dobner翻译:胡东全(广东中联羊城资产评估有限公司)
阮咏华(北京中企华资产评估有限责任公司)
姚青思
编者按:BVU 邀请读者对本文提出的使用预测数据估算规模溢价的观点中可能存在的问
题进行反馈。作者系普华永道会计师事务所的合伙人,在这篇文章中介绍了如何运用公司债券
收益曲线检测和估算规模溢价。对此您怎么看?请通过电子邮件将您的反馈发送到
[email protected]。我们将在后续文章中分享我们收到的反馈意见。谢谢您的帮助!
Editor’s note: BVU invites reader feedback on this article that proposes the use of prospective
data in measuring a size premium, assuming one exists. The author, a partner at
PricewaterhouseCoopers, describes how the use of corporate bond yields can help to detect and
measure the size premium. What do you think? Send your feedback by email to
[email protected]. We will share the feedback we receive in a follow‐up article. Thanks for
your help!
Alternative Model Uses Corporate Bond Yields to Measure a Size Premium
©IACVA(CHINA) - BVR 2
评估人员通常依靠资本资产定价模型(CAPM)来估计权益成本。在 CAPM模型下,风
险归因于单一因素,即“贝塔系数(β)”。β系数是 CAPM的假设中唯一的风险报酬的体现,
用于度量系统性风险。尽管如此,评估人员在估算权益成本时经常会将“规模溢价”调整考虑在
内。规模溢价的基础源于规模较小公司的历史观测值,通常用市值或收入等基础指标来衡量公
司规模的大小,据此得到的权益成本高于根据 CAPM测算出来的权益成本。
Valuation practitioners commonly rely on the capital asset pricing model (CAPM) to estimate
cost of equity. Under CAPM, risk is attributed to a single factor, “beta,” which measures systematic
risk, the only type of risk theoretically rewarded under CAPM’s assumptions. Despite this,
practitioners frequently include a “size premium” adjustment in their cost of equity estimates. The
basis for the size premium is derived from historical observations that smaller companies, measured
by market capitalization or fundamental metrics such as revenue, have a larger cost of equity than
predicted under CAPM.
然而,越来越多地通过历史数据度量的“规模溢价”被批评为有缺陷,静态,且缺少可靠的
基础和经济学理论。其中一种观点认为,估算中存在“幸存者偏差”。也就是说,由于未将那些
已经倒闭的公司囊括在内,测算出的小公司的平均收益会相对偏高。另外,“一月效应”也引起
了广泛关注,研究显示,大多数溢价都缘于每年的一月份。此外, 近的学术研究表明,众多
市场中的规模溢价(基于历史数据的估算)持续消失,这就使得以这种方式处理小公司相较于
大公司所具有的独特估值问题的可靠性更加让人怀疑。还应该注意到,这种通过历史数据估算
规模溢价的方式对可能影响规模溢价大小的经济条件的变化不敏感。
Increasingly, however, the “size premium” measured through historical data has been criticized
as being flawed, static, and lacking a credible fundamental or economic basis. One of the
measurement concerns raised is the existence of a “survival bias” in the measurement. That is, the
average return on small companies is biased upward as it does not include those companies that
disappeared. Another measurement concern is the “January effect.” According to research, most of
the premium is attributed to January of each year. In addition, recent scholarly research points to
the disappearance of the size premium (as measured based on historical data) in numerous markets
for sustained periods of time, further raising doubts as to its reliability for addressing the unique
valuation aspects of small companies versus large companies. The historical measurement is also
not responsive to changes in economic conditions that may affect the magnitude of the size
premium.
如果可以,我想提出一种基于未来预期数据而不是历史数据来估算规模溢价的方法。这种
方法涉及使用公司债券收益曲线检测企业规模是否对投资者要求的收益有影响。我认为这种方

用公司债券收益率度量规模溢价的替代方法
©IACVA(CHINA) - BVR 3
法有助于评估人员确认规模溢价是否存在,在为规模溢价的估算提供更加科学可靠的基础的同
时,也能够反映经济条件的变化。
I propose an alternative approach that would rely on prospective data rather than historical
data in measuring the size premium, if it actually exists. This approach involves the use of corporate
bond yields to detect whether the size of an enterprise has an impact on the yield requested by
investors. I believe that the approach could help to confirm valuation analysts’ intuition of an
existence of a size premium, while providing a more solid scientific basis to the measurement of
such premium as well as enabling reflection of changing economic conditions.
背景
1992年 6月,Eugene F. Fama 和 Kenneth R. French 发表了他们对 CAPM的里程碑式的
研究,报告称很大一部分的投资组合回报率可以用除“beta”之外的因素来解释,尤其是市值
(“规模”)和所占市场份额(“价值”)。 他们的观点与 K.C. Chan 和 N. Chen 早前提出的,
规模在解释大、小公司收益差异过程中成为财务困境的代名词的观点相呼应。
Background. In June 1992, Eugene F. Fama and Kenneth R. French published their landmark
study of the CAPM, reporting that a significant proportion of portfolio returns could be explained
by factors other than “beta,” notably its market cap (“size”) and book/market ratio (“value”). Their
work echoed the work of K.C. Chan and N. Chen, who had earlier commented that size appeared to
be a proxy for financial distress in explaining differences in the returns of large and small
companies.
随后,研究人员发现美国以外的市场(包括加拿大,欧洲和亚洲)的规模溢价明显。这使
得评估从业者感到通过在 CAPM中增加所谓的“规模溢价”以“纠正”它,不能完全反映小公司
的风险。商业出版物,如 Ibbotson的 SBBI(股票,债券,票据和通货膨胀,估值版)和 Duff
&Phelps 风险溢价报告,已经通过为评估师提供基于不同规模的股权收益之间的历史回报的
估计值满足了这一需求。
Subsequently, researchers have identified size premiums evident in markets outside the United
States, including Canada, Europe, and Asia. This led valuation practitioners who felt that the CAPM
does not fully reflect the risk of small companies to add a so‐called “size premium” to the CAPM to
“correct” it. Commercial publications, such as Ibbotson’s SBBI (Stocks, Bonds, Bills and Inflation,
Valuation Edition) and the Duff & Phelps Risk Premium Report, have fulfilled that need by
providing valuators with estimates from historical returns on the historical spreads between equity
returns based on size.
Alternative Model Uses Corporate Bond Yields to Measure a Size Premium
©IACVA(CHINA) - BVR 4
学术界一直批评规模溢价,因为它违反了 CAPM的基本前提并被认为存在理论缺陷。尽
管如此,评估从业人员已经采用规模溢价作为唯一可用的实用方法来解释小公司与大公司相比
的风险,特别是北美地区。
Academics have always been critical of the size premium, as it violates the basic premise of
CAPM and was seen as theoretically flawed. Valuation practitioners, especially in North America,
have adopted the use of the size premium as the only available, practical way to account for the risk
of a small entity compared to a large entity, notwithstanding the theoretical flaw of this method.
如前所述,评估师用来估算规模溢价的方法主要源于 Ibbotson 和 Duff&Phelps。我们注
意到这两个方式下产生的估计数存在相当大的差异。考虑到权益成本对这种溢价的敏感程度,
从业人员开始质疑,当小公司是评估主体的时候,这种溢价是否是一种令人满意的应对 CAPM
风险低估的方法。 近几个研究人员声称,自 1980年代以来众多市场的规模效应已经消失,
导致规模溢价越来越遭受质疑。例如,Dimson,Marsh和 Staunton在 19个国家的规模溢价
研究中宣告了“规模效应的全球逆转”。
As indicated previously, the two main sources used by valuators to measure the size premium
are Ibbotson and Duff & Phelps. We note that there is considerable variability in the estimates
generated by these two sources. Given how sensitive the cost of equity is to this premium,
practitioners have started to question whether this premium is a satisfactory method of addressing
the underestimation of risk associated with the use of CAPM where small companies are the subject
of valuation. Adding to the “troubles” of the size premium is the fact that several researchers have
recently asserted that the size effect has disappeared from a number of markets since the 1980s. For
example, Dimson, Marsh, and Staunton report a “global reversal of the size effect” in their study of
size premiums in 19 countries.
上述担忧已导致一些主要的评估从业者放弃使用规模溢价。例如,Aswath Damodaran
教授(纽约大学斯特恩商学院)自称是一个规模溢价“否认者”。他这样说:
如果我认为小盘股比大盘股风险更大,我有义务考虑基础或经济原因,并将它们纳入我的
风险回报模型或模型的参数中。添加一个小额溢价让我受打击,不仅是调整预期收益时的草率
(和高错误),更是从基本面建立数据反映内在价值的放弃。 我认为调整流动性的预期收益是
有意义的,而且我认为我们这样做的能力正在提高,因为我们可以获得更多的流动性数据和更
好的数据模型。
The above concerns have led some leading valuation practitioners to abandon the use of size
premium. For example, Prof. Aswath Damodaran (Stern Business School at New York University) is

用公司债券收益率度量规模溢价的替代方法
©IACVA(CHINA) - BVR 5
a self‐proclaimed size premium “denier.” He is quoted as saying:
If I believe that small cap stocks are riskier than large stocks, I have an obligation to think of
fundamental or economic reasons why and build those into my risk and return model or into the
parameters of the model. Adding a small cap premium strikes me as not only a sloppy (and high
error) way of adjusting expected returns but an abdication of the mission in intrinsic valuation,
which is to build up your numbers from fundamentals. I do think that it makes sense to adjust your
expected returns for liquidity, and I think our capacity to do so is improving as we get access to
more data on liquidity and better models for incorporating that data.
并不是所有的评估从业者都推崇规模溢价。例如,在德国,评估从业人员通常不使用规模
溢价。在 2010年的“会计与金融应用研究”期刊上,Jorg Baetge教授说:“根据 1995年 4月到
2008年 3月的实证研究,除了理论上的保留,规模溢价应当从评估目的中解除。
Not all valuation practitioners recommend or rely upon size premiums. In Germany, for
example, size premiums are not commonly used by valuation practitioners. Writing in the Journal
of Applied Research in Accounting and Finance in 2010, Prof. Dr. Jorg Baetge said: “In addition to
theoretical reservations, size premiums should be dismissed for valuation purposes based on the
empirical evidence for the research period April 1995 to March 2008.”
考虑到这一时期可能太短,Baetge 教授研究了 1979 年至 1990 年和 1969 年至 1992 年期
间的实证结果,发现没有统计上显著的规模溢价。他总结道:“通过附加的规模风险溢价对标
的资产基于 CAPM得出的折现率予以调整,这种方式只会增加对评估可靠性和正确性的怀疑。
总之,由于与实证研究结果相矛盾,规模溢价于企业价值评估中的应用在德国应该予以摒弃。”
Recognizing that this period might be too short, Prof. Baetge looked at empirical findings for
periods from 1979 to 1990 and 1969 to 1992, finding no statistically significant size premiums. He
concludes: “Adjusting the CAPM‐based discount rate with an additional risk premium for the size
of the valuation target can therefore only raise substantial doubt about the reliability and validity of
the valuation. In summary, size premiums in corporate valuation should be dismissed in Germany,
but due to contradicting empirical results elsewhere, not only there.”
Mathijs A. van Kijk 对这些论述表示赞同,他对规模效应的相关文献发表评论:“那些可
能为规模效应提供解释的理论,既非充分发展的,也未经系统验证过。新的研究能够打破当前
在金融学术研究领域的僵局,这对于我们理解资产定价,以及对我们开展事件研究、绩效评估
和资本成本的估计都具有重要的启示。”

Alternative Model Uses Corporate Bond Yields to Measure a Size Premium
©IACVA(CHINA) - BVR 6
These observations and others have been echoed by Mathijs A. van Kijk, who concluded a
recent review of the size effect literature with the observation that “theories that potentially provide
explanations for the size effect have neither been sufficiently developed nor systematically tested.
New research could break the current deadlock in an area of the academic finance literature that has
important implications for our understanding of asset pricing and our approach to carrying out
event studies, performance evaluation, and cost of capital estimation.”
一些支持规模溢价存在的学者认为这是经济条件的函数。换言之,规模溢价在“坏时期”
增加,并在“好时机”收缩,这符合经济直觉。然而,目前度量规模溢价的模型(基于历史数据)
是静态的,因此不能反映经济条件的变化。
Some academics who support the existence of a size premium suggest that it is a function of
economic conditions. In other words, the size premium increases during “bad times” and shrinks
during “good times.” This is consistent with economic intuition. However, the current models for
measuring size premiums (on a historical basis) are not dynamic and thus are not responsive to
changes in economic conditions.
替代方法
我的假设是,如果投资者认为规模是一个风险因素,他们不仅会要求更高的股票回报率,
更会要求更高的企业债券回报率。换句话说,如果企业的规模增加风险,它应该影响企业的所
有利益相关者(即股东和债券持有人)。
Alternative method. My hypothesis is that, if investors see size as a risk factor, they would
reflect this not only in their request for a higher return in stocks, but also in a higher return of
corporate bonds. In other words, if the size of an enterprise increases risk, it should affect all
stakeholders of an enterprise (i.e., shareholders and bond holders).
通过公司债券估算规模效应的优势是,它们的回报率可以从市场中收集(即到期收益率)。
因此,如果规模效应存在,解释到期收益率的模型应该包括企业价值规模作为其解释性因素之
一,我们期望企业的规模和企业债券到期收益率负相关。
The advantage of measuring the size effect through corporate bonds is the fact that their rates
of return can be gleaned from market data (i.e., yield to maturity). Thus, if the size effect is a reality,
a model that explains yield to maturity should include as one of its explanatory factors the size of
the enterprise value, and we should expect a negative correlation between the size of the enterprise
and the yield to maturity of the bond issues by the respective enterprise.
为了检验这个假设,我建立了一个回归模型。为此,我使用了超过 2000家公司债券的数

用公司债券收益率度量规模溢价的替代方法
©IACVA(CHINA) - BVR 7
据。所选用的债券都有评级,以避免可能导致偏离公平市场价值而难以偿付的问题。通过一个
繁琐的分析我得出结论,四个变量提供了到期收益率 好的解释。这些变量包括企业价值。我
对 2013年 9月的数据进行了回归分析,得到了超过 83%的相关因子。所有这四个变量都发现
具有统计显著性。特别是企业价值的 t统计量超过 19。
To test the hypothesis, I developed a regression model. To this end, I used data on over 2,000
corporate bonds. All the bonds used had an investment grade to avoid the issues of solvency that
may cause deviation from the definition of fair market value. Through a tedious analysis, I
concluded that four variables provide the best explanation to the yield to maturity. These variables
include enterprise value. I ran the regression on September 2013 data and obtained a correlation
factor of over 83%. All the four variables were found to be strongly statistically significant. In
particular, the enterprise value had a t‐statistic of over 19.
发现企业价值以对数方式对债券收益率产生负面影响,直到价值约 1500亿美元(即,当
企业价值超过 1500亿美元时,对债券收益率没有进一步的统计显著影响)。
The enterprise value was found to negatively impact the bond yield in a logarithmic manner up
to a value of approximately $150 billion (i.e., where the value exceeds $150 billion, there is no
further statistically significant impact on the yield).
这些变量不构成企业价值对债券收益率的影响。换句话说,投资者根据自身价值评估安全
风险,然后加上一个仅仅是企业价值函数的溢价,而不受其他风险因素的影响。这是很重要的,
因为它允许我们分离企业价值的影响,如果企业价值的影响与其他风险因素相互影响,这将是
一个艰巨的任务。
The variables were found not to affect the impact of the enterprise value on the yield. In other
words, investors appear to assess the risk of a security on its own merits and then add on top a
premium for size that is only a function of the enterprise value and is not affected by other risk
factors. This is important, as it allows us to isolate the impact of enterprise value, which would be a
difficult task if the effect of enterprise value interacts with other risk factors.
回归分析的结论符合所有影响系数估计的有效性的假设。换言之,测得的系数没有偏差。
特别值得注意的是,在模型中使用的解释变量被认为是相互独立的,这一事实进一步印证了规
模因素和其他风险因素之间无相互作用。
The concluded regression was found to comply with all the assumptions that impact the
validity of the coefficient estimate. In other words, the measured coefficients are not biased. Of
particular note is the fact that the explanatory variables used in the model were found to be
Alternative Model Uses Corporate Bond Yields to Measure a Size Premium
©IACVA(CHINA) - BVR 8
independent of each other, which provides further support to the finding regarding the lack of
interaction between the size factor and other risk factors.
回归分析的结论使我们能够通过在所述回归模型中使用企业价值的系数来测量任何企业
价值规模的规模溢价。该模型测量的规模溢价反映了投资者在特定时间点(与历史测量相反)
的回报要求。模型的参数需要定期更新以反映经济条件和投资者态度的变化。因此我的模型在
本质上是动态的(与基于历史数据的模型的静态本质相反)。
The concluded regression allows us to measure the size premium for any enterprise value size
by using the coefficient of the enterprise value in the said regression. The size premium measured
by this model is reflective of investors’ return requirements at a particular point in time (as opposed
to historical measurement). The parameters of the model need to be updated periodically to reflect
changes in economic conditions and investors’ attitudes. Thus my model is dynamic in nature (as
opposed to the static nature of the historical models).
方法应用
接下来的问题是:我们如何在权益成本中应用这种规模溢价的测量方法?评估师普遍接受
的方法是运用权益和债券回报率的波动率。这种方法由 Damodaran教授在衡量国家风险方面
制定,并已被估价机构普遍采用(我们在加拿大普华永道使用这种方法)。为了应用这种方法,
我们使用 Ibbotson测量的股票和长期债券的标准差。 新数据显示两者之间的比率为 2.43。
Applying the method. The next question is: How do we apply this measure of size premium in
the cost of equity? A commonly accepted way by valuators is to apply the volatility ratio of equity
and bond return. This methodology has been developed by Professor Damodaran in the measure of
country risk and has been generally adopted by the valuation community (we use this methodology
at PwC Canada). To apply this methodology, we use the Ibbotson measure of standard deviation for
stocks and long‐term bonds. The latest data suggest a ratio of between the two of 2.43.
基于上述,我的模型表明,截至 2013年 9月债务成本和权益成本均存在溢价,具体如下
表所示:
Based on the foregoing, my model suggests that, as of September 2013, the premiums shown in the
exhibit existed for the cost of debt and cost of equity.

用公司债券收益率度量规模溢价的替代方法
©IACVA(CHINA) - BVR 9
债务成本和权益成本溢价
企业价值(百万美元) 债务成本规模溢价(%) 权益成本规模溢价(%)
5 2.45 3.67
10 2.28 3.42
100 1.74 2.60
1,000 1.19 1.78
10,000 0.64 0.96
20,000 0.48 0.72
30,000 0.38 0.57
50,000 0.26 0.39
150,000 ‐ ‐
如图所示,小企业的规模溢价显著低于历史数据模型计算的溢价。例如,1000 万美元的
企业价值,Duff&Phelps基于历史数据模型测量出来的规模溢价为 10.01%,而我的模型测量
出来为 3.42%;10亿美元的企业价值,在 Duff&Phelps的模型中规模溢价为 4.94%,而在我
的模型中只有 1.78%。
As shown in the exhibit, the size premiums at the low end are significantly below the
premiums suggested by the historical models. For example, the D&P size premium for a
$10 million enterprise value is 10.01% versus 3.42% in my model. At a $1 billion enterprise
value, D&P suggests a premium of 4.94% versus only 1.78% in my model.
数据来源
[1] Jorge Baetge, Hans Jurgen Kirsch, Peter Koelen, Roland Schulz, “On the Myth of Size Premiums in
Corporate Valuation: Some Empirical Evidence From the German Stock Market,” The Journal of Applied
Research in Accounting and Finance, Volume 5, Issue 1, 2010, p. 10.
[2] Rolf Banz, “The Relationship Between Return and Market Value of Common Stock,” Journal

Alternative Model Uses Corporate Bond Yields to Measure a Size Premium
©IACVA(CHINA) - BVR 10
ofFinancial Economics, Vol. 9, 1981, pp. 3‐18.
[3] Michael Cain, “A Literature Review of the Size Effect,” Nov. 16, 2010.
[4] K.C. Chan and N. Chen, “Structural and Return Characteristics of Small and Large Firms,” Journal of
Finance, Vol. 46, 1991, pp. 1467‐1484.
[5] Sungjun Cho, “The Size Premium: What Role Does Macroeconomic Risk Play?” April 13, 2013.
[6] Aswath Damodaran, “Musings on Markets: Alternatives to CAPM, Pt. 2,”
aswathdamodaran.blogspot.com/2011/04/alternatives‐to‐capmpart‐2‐proxy.html.
[7] E. Dimson and P. Marsh, “Murphy’s Law and Market Anomalies,” Journal of Portfolio Management,
Vol. 25, 1991, pp. 53‐69.
[8] Ilia D. Dichev, “Is the Risk of Bankruptcy a Systematic Risk?” Journal of Finance, Vol. 53 (1998), pp.
1131‐1147.
[9] Duff & Phelps, Risk Premium Report.
[10] Philip Gharghori, Howard Chan, and Robert Faff, “Default Risk and Equity Returns: Australian
Evidence,” December 2008.
[11] Roger Grabowski and David King, “Equity Risk Premium” in Robert Reilly and Robert P. Schweihs,
eds., The Handbook of Business Valuation and Intellectual Property Analysis, New York, McGrawHill, 2004,
pp. 3‐29.
[12] Ibbotson Associates, Stocks, Bonds, Bills & Inflation Valuation Yearbook.
[13] Hao Jiang, and Takeshi Yamada, “The Impact of International Institutional Investors on Local Equity
Prices: Reversal of the Size Premium,” Financial Analysts Journal, No. 6, Vol. 67, November/ December 2011,
pp. 61‐76.
[14] David King, “Do Data Biases Cause the Small Stock Premium?” Business Valuation Review, June
2003, pp. 56‐61.
[15] Kimberly L.A. Linebarger, “Adjusting Values for Differences in Size,” in Shannon Pratt, ed., Business
Discounts and Premiums, 2nd Edition, 2009, p. 329.
[16] Carlos A. Mello‐e‐Souza, “Bankruptcy Happens: A Study of the Mechanics of Distress‐Driven CAPM
Anomalies,” Jan. 25, 2002.
[17] Shannon Pratt and Roger Grabowski, Cost of Capital: Applications and Examples, 4th edition,

用公司债券收益率度量规模溢价的替代方法
©IACVA(CHINA) - BVR 11
Hoboken, NJ, John Wiley & Sons, 2010, chapters 13 and 14.
[18] Jeffrey S. Tarbell, “The Small Company Risk Premium: Does It Really Exist?” American Society of
Appraisers, 18th Annual Advanced Business Valuation Conference, New Orleans, October 1999; Republished
in James R. Hitchner, Financial Valuation: Applications and Models, 2nd edition, Hoboken, NJ, John Wiley,
2006.
[19] Mathijs A. van Kijk, “Is Size Dead? A Review of the Size Effect in Equity Returns,” working paper,
March 6, 2007.
[20 Mathijs A. van Kijk, “The Size Effect Paradox,” July 2007.
[21] Maria Vassalou and Yuhang Xing, “Default Risk in Equity Returns,” Journal of Finance, Vol. LIX, No.
2, April 2004, pp. 831‐868.
后,使用我的方法时,我建议在债务成本风险和权益成本风险中分别考虑规模溢价。由
于我没有发现其他风险因素影响规模效应的证据,因此我不建议将其纳入权益风险溢价。也就
是说,我不建议将系统风险因素 beta考虑进规模溢价。
Finally, using my methodology, I would suggest that the size premium be added to the
cost of debt and the cost equity risk respectively. Since I did not find evidence that other
risk factors influence the size effect, I do not suggest including it in the equity risk premium.
That is, I do not suggest applying a beta to the size premium.
Michael Dobner是普华永道咨询和交易集团的合伙人。他在诉讼支持和企业价值评估方面
有超过 30年的经验。他还担任普华永道加拿大许可管理实践的国家领导。Michael已经在法院
和其他准司法机构中就各种各样的商业纠纷获得资格。他在涉及收购价格和估值争议的案件中
担任仲裁员。可通过 [email protected]和 416‐815‐5055联系他。
Michael Dobner is a partner in Pricewaterhouse Coopers’ Consulting & Deals Group. He has
over 30 years’ experience in litigation support and business valuation. He is also acting as the
National Leader of the Licensing Management practice for PwC Canada. Michael has been qualified
as an expert in court and other quasi‐judicial bodies regarding a large variety of commercial disputes.
He has served as an arbitrator in cases involving disputes over purchase price and valuation. He can
be reached at [email protected] and 416‐815‐5055.
用收益法评估家庭有限合伙企业的 新观点
©IACVA(CHINA) - BVR 1
A Fresh Look at Using the Income Approach to Valuing FLPS
用收益法评估家庭有限合伙企业的
新观点
作者:Stuart Weiss, CPA/ABV翻译:蒋东勇 (北京北方亚事资产评估有限责任公司)
鲁国平(上海东洲资产评估有限公司湖北分公司)
校对:邓艳芳 (中联资产评估集团有限公司)
当我在评估一家家庭有限合伙企业(FLP)的少数股东权益价值时,我会采用收益法,但
我不喜欢这样做。FLP的利润分配往往没有规律,经常性利润也是不确定的。而且,我不得不
猜测 FLP何时会被清算:5年,10年,还是永远不会。顺便问一下,五年或 10年后资产的价
值是多少?它以每年 3%的速度升值吗?谁知道呢?通常,连不动产估价师都不愿意去担风险,
所以我怎么会知道?对我来说,这意味着收益法只不过是个猜迷游戏。
我宁愿使用一种替代的方法来评估此类资产,通常借助房地产估价师或者经纪人的帮助,
并采用企业价值评估(杂志)和 Partnership Profiles(一家在美国的评估数据研究股份公司)公
布的折扣率。这本质上是结合了资产基础法和市场法。
净资产价值法。在研讨会上,研讨会从成本法评估开始。成本法被认为是评估有限合伙企
业 常用的方法。该方法并不是基于特定的可比成交案例,而是通过计算合伙企业的资产净值

A Fresh Look at Using the Income Approach to Valuing FLPs
©IACVA(CHINA) - BVR 2
(NAV),并且运用基于研究的缺少控制权(DLOC)和缺少流通性(DLOM)的平均折扣率。
净资产价值法有什么问题吗?
• 忽视创收能力;
• 没有量化未来收益;
• 完全依赖于研究的平均值;
• 不适用非控制性权益。
因此,由于少数股东权益持有人不会强迫出售 FLP股权, 所以不应该使用净资产价值法.
主要是因为净资产价值法不适用对平均值的比较,所以法院不喜欢这种方法,
收益法。采用收益法,你预测现金流量,假设租金、经营费用、利息收入等增长。接下来,
创建两个或三个场景:FLP持续经营,5年和 10年后清算。
折现率是根据合伙企业资产的风险属性和可比投资对象要求的资产收益率求出的。使用的
数据有两个主要来源:房地产投资信托基金(REITs)和房地产有限合伙上市公司(RELPs)。随
着时间的推移,跟踪记录 REIT 收益率的范围从 20 年到 40 年。它跟踪记录 RELPs 的数据,
将数据按照无负债到低负债,中等负债到高负债,分配利润和不分配利润的合伙企业分开。
风险累加法的等式通常是无风险利率加上不动产风险溢价加上特定的风险溢价。
让我们举个例子。假设净资产价值为 200,000美元。让我们也假设折现率采用 REIT的数
据是 13%和 RELP 的数据是 17%。Partnership Profiles采用平均值,折现率为 15%。让我们
假设长期增长率为 2%,代表 1%的股权价值。
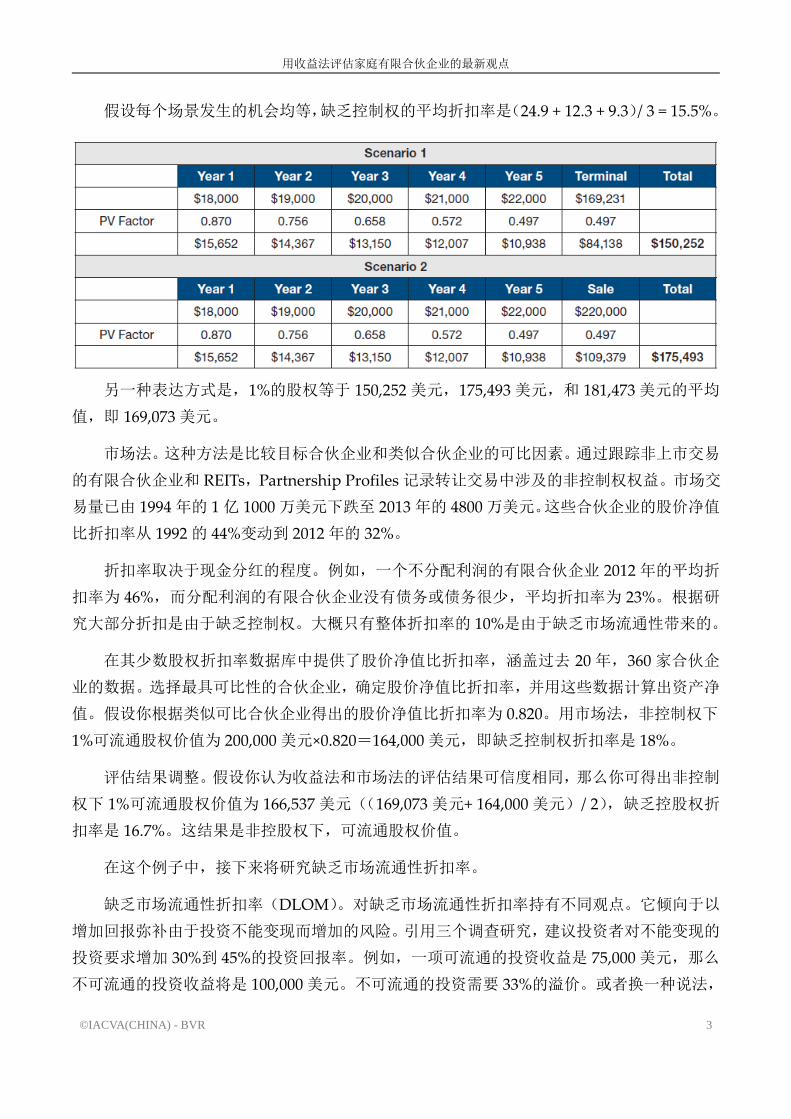
三种场景。在第一种场景,假定一项资产永久存在。使用 15%折现率和 2%的长期增长率,
终值等于第五年现金流除以 0.13(0.15 ‐0.02)。在这个场景中忽略年中惯例。净现值(NPV)
为 150,252美元。由于资产净值为 200,000美元,这反映了 49,748美元或 24.9%的缺乏控制权
折扣。
在第二种场景,假设 5 年后 FLP 清算,这项资产将被出售。增值的资产价值加现金减负
债及交易成本后净额为 220,000美元。净现值是 175,493美元。由于资产净值为 200,000美元,
这反映了 12.3%的缺乏控制权折扣率。
在第三种场景,假设 10年后 FLP清算,这项资产被出售。增值的资产价值加现金减负债
及交易成本后的净额为 300,000美元。净现值是 181,473美元。由于资产净值为 200,000美元,
缺乏控制权折扣率为 9.3%。
用收益法评估家庭有限合伙企业的 新观点
©IACVA(CHINA) - BVR 3
假设每个场景发生的机会均等,缺乏控制权的平均折扣率是(24.9 + 12.3 + 9.3)/ 3 = 15.5%。
另一种表达方式是,1%的股权等于 150,252 美元,175,493 美元,和 181,473美元的平均
值,即 169,073美元。
市场法。这种方法是比较目标合伙企业和类似合伙企业的可比因素。通过跟踪非上市交易
的有限合伙企业和 REITs,Partnership Profiles记录转让交易中涉及的非控制权权益。市场交
易量已由 1994年的 1亿 1000万美元下跌至 2013年的 4800万美元。这些合伙企业的股价净值
比折扣率从 1992的 44%变动到 2012年的 32%。
折扣率取决于现金分红的程度。例如,一个不分配利润的有限合伙企业 2012年的平均折
扣率为 46%,而分配利润的有限合伙企业没有债务或债务很少,平均折扣率为 23%。根据研
究大部分折扣是由于缺乏控制权。大概只有整体折扣率的 10%是由于缺乏市场流通性带来的。
在其少数股权折扣率数据库中提供了股价净值比折扣率,涵盖过去 20年,360 家合伙企
业的数据。选择 具可比性的合伙企业,确定股价净值比折扣率,并用这些数据计算出资产净
值。假设你根据类似可比合伙企业得出的股价净值比折扣率为 0.820。用市场法,非控制权下
1%可流通股权价值为 200,000美元×0.820=164,000美元,即缺乏控制权折扣率是 18%。
评估结果调整。假设你认为收益法和市场法的评估结果可信度相同,那么你可得出非控制
权下 1%可流通股权价值为 166,537 美元((169,073 美元+ 164,000 美元)/ 2),缺乏控股权折
扣率是 16.7%。这结果是非控股权下,可流通股权价值。
在这个例子中,接下来将研究缺乏市场流通性折扣率。
缺乏市场流通性折扣率(DLOM)。对缺乏市场流通性折扣率持有不同观点。它倾向于以
增加回报弥补由于投资不能变现而增加的风险。引用三个调查研究,建议投资者对不能变现的
投资要求增加 30%到 45%的投资回报率。例如,一项可流通的投资收益是 75,000美元,那么
不可流通的投资收益将是 100,000美元。不可流通的投资需要 33%的溢价。或者换一种说法,

A Fresh Look at Using the Income Approach to Valuing FLPs
©IACVA(CHINA) - BVR 4
100,000美元的缺少流通性价值,需要 25%的折扣率,得出可流通性价值。
第一项研究着眼于私募股权收益与上市股票收益的比较。引用剑桥联合研究顾问公司的数
据,在过去的 25 年里,私人持有的股份平均收益率为 18.7%,公开上市的小盘股平均收益率
为 12.9%。 相比而言,私人持有的股份获得 45%的增值收益((0.187 ‐0.129)/ 0.129)。
在第二项分析中,着眼于限制性股票的研究,并发现限制性股票股价的收益比上市公司股
价的收益平均增加约 30%。
第三项分析是比较长期和短期政府债券的平均收益率。对于长期债券要有同样的市场流通
性,投资者要求提高收益率。过去 30年里,平均增值收益率达到 39%。
利用上述三项研究,增值收益率分别是 45%,30%和 39%,平均为 38%,即缺少流通性折
扣率为 27%。
终结果。缺少控制权的可流通的 1%股权价值为 166,537美元,经 27%的缺少流通性折
扣率调整后的价值是 121,572美元。
很幸运我能有机会跟布鲁斯∙约翰逊交谈,美国评估师协会认证评估师(The American
Society of Appraisers ,ASA)(曼罗帕克&约翰逊公司),《家庭有限合伙价值评估综合指南》
的合著者、曼罗帕克&约翰逊公司也是此次 FLP评估研讨会的共同赞助单位。
斯图亚特∙韦斯:我过去常说我不愿意用收益法,因为我得不到足够的资料。这就好比当
管理层不做收益预测时,却试图用现金流折现法。而且,它只会增加费用,所以我不去用收益
法。我的想法错了吗?
布鲁斯∙约翰逊:正是这种想法改变了我。我第一次在税务法庭作证时,我用的收益法,
但没用市场法。我面对的专家用了两种方法。我认为他这两种方法用的比较随意,当我把我的
收益法和他的收益法比较时,法官也可以看到他这两种方法用的比较随意。但是,到了市场法
时,我没有可比较的。我不得不攻击他的一些假设。
对于一个 FLP,市场法很有道理。你可以找到可比企业——看看他们的股价净值比和非控
股可流通性价值。现在,很多人试着使用收益法资本化股利。但是资本化是用于无限寿命期的
公司。大多数 FLPs的寿命是有限期的。即使普通合伙人没有声明清算日期,投资者也会假设
七至八年左右的清算时间。你需要两项数据:回报率和你的未来收益,通常可以由 DCF模型
量化。你打算得到的年收入是多少(如果有的话),清算时的价值是多少?很多 FLPs 达不到
20至 30年期限,即将资产出售,或有人死亡。
通常情况下,我们考虑两种场景,5 年清算和 10 年清算。截至清算之日,我们有不动产
的市场价值。我们所要做的就是预测升值率。预测合伙企业的年收入相当简单,然后预测不动

用收益法评估家庭有限合伙企业的 新观点
©IACVA(CHINA) - BVR 5
产每年升值 3%到 5%,五年后出售的价值。
斯图亚特∙韦斯:我做的评估项目好像更古怪些。有收入但是不分配利润。你认为有现金
流就有能力支付股利或实际支付股利吗?
布鲁斯∙约翰逊:我们假设有支付能力。你必须要么预测分配利润,要么说明收益的流向。
企业获得的收益必须被再投资于其他资产。我认为这更明确和更容易解释,国税局颁布的税则
第 59‐60条指的是公司的创收能力。因此,我们预测 100%的利润支付,在 5年或 10年后清算。
斯图亚特∙韦斯:它们是纳税中间实体,你做税收调整了吗?
布鲁斯∙约翰逊:没有做调整。我们发现,他们是低创收单位,大部分收益在清算时产生。
国税局已经不喜欢 FLPs了,提出税收影响的问题,国税局会提出其他问题,所以我们恰好不
能考虑税收问题。
斯图亚特∙韦斯:我注意到你取市场法和收益法各 50%的权重。通常情况下,对于一个普
通企业,会给收益法比较高的权重。你做了 50‐50的权重是想使案例简单些吗?
布鲁斯∙约翰逊:不是。在那种情况下,我们通常都这么取权重。市场法和收益法的结果
应该相当接近,所以取多少权重不重要。有时,Partnership Profiles数据中的合伙企业比我的
评估标的好。这些企业规模更大,历史更长,所以我可能给收益法比较高的权重。
斯图亚特∙韦斯:为了获得缺少市场流通性折扣,你在风险投资数据上花了很多时间。但
是你没有注重常规公司的分析。
布鲁斯∙约翰逊:我们已经在这方面做了 20年的研究。实际上国税局给我们打过电话,说
喜欢我们的研究。通常,我们的缺少流通性折扣率约为 25%。就总体折扣率来说,我们 终得
出可流通的证券在 30% ‐35 %的范围内,收益性房地产在 35%至 40 %的范围内,而非收益性
房地产在 40% 至 50 %的范围。
我见证了第一个 FLP 法庭案,国税局想以折扣率辩论,而我以收益率辩论。没有人知道
什么是公平的折扣率,但人们都知道可自由兑换债券(Convertible Debenture),债券,股票
能获得多少收益。如果你的收益率是 15%到 20%,可能很合理,但如果是一个 30%至 40 %的
收益率,那么你的折现就糟糕了。我喜欢与国税局讨论收益率,而不是折扣率太高或太低。
斯图亚特∙韦斯:世界各地对 FLPs和折现法持什么样的观点?折现法将会广泛应用,还是
仍然存在被立法取消的风险?
布鲁斯∙约翰逊:因为折现法是一个非常成功的规划工具,所以我认为折现法一直受到威
胁。美国财政部每年都建议废除折现法,但都未通过。每个人都使用折现法,并且已经受到了

A Fresh Look at Using the Income Approach to Valuing FLPs
©IACVA(CHINA) - BVR 6
法庭的支持。国税局使用折现法比较成功的地方是处理没有正确设立 FLPs,不把 FLPs 视为
公平交易实体的人。
更多信息。 近,约翰逊在为企业价值评估资源网召开的网络研讨会上,更详细的论述了
他 的 方 法 , 用 实 证 法 确 定 缺 少 市 场 流 通 性 折 扣 。 网 络 研 讨 会 的 记 录 可 以 在
bvresources.com/training网址上找到。
斯图亚特∙韦斯,注册会计师/认证的企业价值评估师,是波特兰的企业价值评估师,可以
通过 [email protected]或 503‐223‐3142联系到他。

用收益法评估家庭有限合伙企业的 新观点
©BVR 7
A Fresh Look at Using the Income Approach to Valuing FLPs
By Stuart Weiss, CPA/ABV
When I value minority interests in a family limited partnership (FLP), I will do an
income approach, but I will not enjoy it. All too frequently, the FLP does not generate
regular distributions or regular profits. Plus, I’ll have to guess when the FLP is going to be
liquidated: five years, 10 years, or perhaps never. By the way, what will the property be
worth in five years—or 10 years? Is it appreciating at a 3% annual rate? Who knows?
Usually not even the real estate appraiser is willing to go out on a limb, so how am I
supposed to know? To me, this means an income approach is nothing more than a guessing
game.
What I prefer to do is use an alternative approach where I value the asset (usually with
the help of a real estate appraisal or brokerage statement) and take the appropriate
discounts with the help of BVR and Partnership Profiles data. This is essentially a
combination of the asset approach and the market approach.
A few weeks ago, I sat in on Partnership Profiles’ excellent one‐day seminar on valuing
FLPs. Afterward I decided I need an attitude adjustment regarding the income approach.
NAV method. During the seminar, Partnership Profiles starts with an asset approach
to value, which it calls the most commonly used method to value limited partnerships. The
approach calculates the net asset value (NAV) of the partnership and applies average
discounts for lack of control (DLOC) and lack of marketability (DLOM) based on studies,
not specifically comparable transactions.
What’s wrong with this NAV method? Partnership Profiles doesn’t like it because the
method:
Ignores income‐generating ability;
Doesn’t quantify future benefits;
Relies on overall averages from studies; and
Is inappropriate for noncontrolling interests.

A Fresh Look at Using the Income Approach to Valuing FLPs
©BVR 8
Thus, since a minority interest holder cannot compel the sale of the FLP, the
NAV method should not be used. The courts don’t like the method either primarily
because of inadequate comparisons to averages.
Income approach. Using the income method, you make a forecast of cash flows,
making assumptions for increases in rent, operating expenses, interest income, and so on.
Next, you create two or three scenarios: that the FLP continues into perpetuity, that it is
liquidated in five years and in 10 years.
A discount rate is developed based upon the risk attributes of the assets owned in the
partnership and the required return on assets relative to comparable investments. There are
two primary sources of data: REITs and publicly held real estate limited partnerships
(RELPs). Partnership Profiles keeps track of REIT rates of return over time horizons ranging
from 20 to 40 years. It keeps track of the data for RELPs and splits the data among no to low
debt, moderate to high debt, and distributing and nondistributing partnerships.
A build‐up method is used that equals the risk‐free rate plus a real estate risk premium
plus a specific risk premium.
Let’s take an example. Assume that net asset value is $200,000. Let’s also assume the
discount using REIT data is 13% and the discount using RELP data is 17%. Partnership
Profiles takes an average and arrives at a discount rate of 15%. Let’s also assume that
long‐term growth is 2% and the value represents a 1% interest.
Three scenarios. In the first scenario, assume a property will be held into perpetuity.
Using the 15% discount rate and 2% long‐term growth rate, the terminal value equals
fifth‐year cash flow divided by 0.13 (0.15 ‐ 0.02). Ignore the midyear convention for this
example. The net present value (NPV) is $150,252. Since NAV is $200,000, this represents a
discount for lack of control of $49,748, or 24.9%.
In the second scenario, assume the property will be sold and the FLP will be liquidated
in Year 5. The appreciated property plus cash less liabilities and transaction costs will net
$220,000. The NPV is $175,493. Since NAV is $200,000, this represents a DLOC of 12.3%.
In the third scenario, assume the property will be sold and the FLP will be liquidated
in Year 10. The appreciated property plus cash less liabilities and transaction costs will net
用收益法评估家庭有限合伙企业的 新观点
©BVR 9
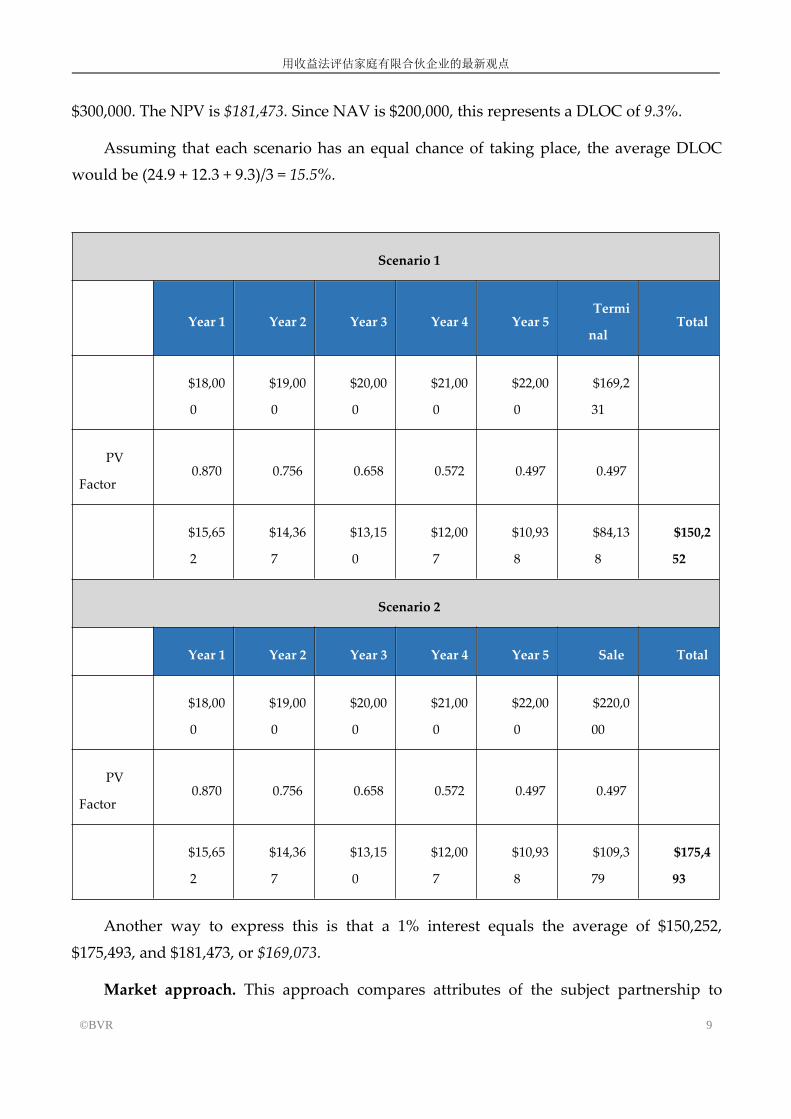
$300,000. The NPV is $181,473. Since NAV is $200,000, this represents a DLOC of 9.3%.
Assuming that each scenario has an equal chance of taking place, the average DLOC
would be (24.9 + 12.3 + 9.3)/3 = 15.5%.
Scenario 1
Year 1 Year 2 Year 3 Year 4 Year 5Termi
nalTotal
$18,00
0
$19,00
0
$20,00
0
$21,00
0
$22,00
0
$169,2
31
PV
Factor0.870 0.756 0.658 0.572 0.497 0.497
$15,65
2
$14,36
7
$13,15
0
$12,00
7
$10,93
8
$84,13
8
$150,2
52
Scenario 2
Year 1 Year 2 Year 3 Year 4 Year 5 Sale Total
$18,00
0
$19,00
0
$20,00
0
$21,00
0
$22,00
0
$220,0
00
PV
Factor0.870 0.756 0.658 0.572 0.497 0.497
$15,65
2
$14,36
7
$13,15
0
$12,00
7
$10,93
8
$109,3
79
$175,4
93
Another way to express this is that a 1% interest equals the average of $150,252,
$175,493, and $181,473, or $169,073.
Market approach. This approach compares attributes of the subject partnership to

A Fresh Look at Using the Income Approach to Valuing FLPs
©BVR 10
partnerships of similar attributes. Partnership Profiles keeps track of resale transactions
involving noncontrolling interests in nontraded publicly held limited partnerships and
REITS. Trading volume in this market has declined from $110 million in 1994 to $48 million
in 2013. Price‐to‐NAV discounts on these partnerships ranged from 44% in 1992 to 32% in
2012.
The discount depends on the degree of cash distributions. For example, a
nondistributing LP discount averaged 46% in 2012, compared to a distributing partnership
with little or no debt, which had an average discount of 23%. According to Partnership
Profiles, most of the discount is due to lack of control. Perhaps 10% of the overall discount
is due to lack of marketability.
Partnership Profiles offers price‐to‐NAV discounts in its Minority Interest Discount
Database. Data are available over the past 20 years and include 360 partnerships. Select the
most comparable partnerships, determine the price‐to‐NAV discount, and apply that
number to the subject NAV. Assume you arrive at 0.820 based on your examination of the
partnerships that are similar to the subject FLP. Using a market approach, the value of a 1%
noncontrolling marketable interest is $200,000 × 0.820 = $164,000 or a DLOC of 18%.
Reconciliation. Assuming you have equal faith in the income and market approaches,
then you arrive at $166,537 (($169,073 + $164,000)/2) for the value of a 1% noncontrolling
marketable interest, which is an effective DLOC of 16.7%. The result: a noncontrolling,
marketable interest.
The next step in this example is to develop the DLOM.
DLOM. Partnership Profiles has a different perspective on DLOM. It prefers to look at
it as the increased return required to compensate for the increased risk of an illiquid
investment. Citing three research studies, Partnership Profiles suggests that investors
require a 30%‐to‐45% increase in their rate of return for an illiquid investment. For example,
a marketable investment that returns $75,000 would have to return $100,000 if
nonmarketable. That’s a 33% premium required for a nonmarketable investment. Or, if you
prefer, a $100,000 value that is nonmarketable is discounted 25% to arrive at a
nonmarketable value.
The first study looks at private equity versus public equity returns. Quoting from
Cambridge Associates LLC, Partnership Profiles notes that privately held stocks have

用收益法评估家庭有限合伙企业的 新观点
©BVR 11
returned an average of 18.7% over the past 25 years compared to publicly traded small
stocks, which returned 12.9%, for an incremental return of 45% ((0.187 ‐ 0.129)/0.129).
In its second analysis, Partnership Profiles looks at restricted stock studies and found
that the average increase between the return using the restricted stock price and the return
using the publicly traded price was about 30%.
The third analysis compares average long‐term to short‐term government bond returns.
For a long‐term bond to be equally marketable, investors demand an increase in the rate of
return. Over the past 30 years, the average incremental return has been 39%.
Using the three studies, the incremental returns are 45%, 30%, and 39%, or an average
of 38% in incremental return—which equates to a DLOM of 27%.
Final result. Applying the 27% DLOM to the $166,537 value of the 1% noncontrolling
marketable interest yields a DLOM‐adjusted value of $121,572.
I was fortunate to have the chance to speak with Bruce Johnson, ASA (Munroe, Park &
Johnson Inc.), co‐author of the Comprehensive Guide for the Valuation of Family Limited
Partnerships. Munroe, Park & Johnson is also the co‐sponsor of the Partnership Profiles FLP
Valuation seminars.
Stuart Weiss: I used to say I’m not going to do an income approach because I don’t
have enough information. It would be like trying to do a DCF when management
doesn’t do projections. Besides, it’s just going to add to the fee, so I’m not going to do it.
What’s wrong with my thinking?
Bruce Johnson: This is what changed me. The first time I testified in Tax Court, I had
an income approach but not a market approach. The expert that I went against had both. I
thought he had taken liberties with both approaches, and when I compared my income
approach to his income approach the judge could see that. But when it came to the market
approach, there was nothing to compare it to. I just had to attack some of his assumptions.
With an FLP, the market approach makes a lot of sense. You can find comparable
entities out there—looking at their price‐to‐NAV ratios and get a noncontrolling marketable
value. Now, with the income approach, a lot of people try to capitalize dividends, but
capitalizing is for a company that has an infinite life. Most FLPs have a finite life. Even
when the general partner has not announced a liquidation date, investors assume about a

A Fresh Look at Using the Income Approach to Valuing FLPs
©BVR 12
seven‐to‐eight‐year liquidation horizon. You need two things: a rate of return and your
future benefit, which can usually be quantified by looking at a DCF model. What is the
annual income you’re going to get (if any) and what is the value at liquidation? A lot of
these don’t make it to their 20‐to‐30‐year terms. The property gets sold, or somebody dies.
Typically, we use two scenarios, a five‐year liquidation and a 10‐year liquidation. We
have the real estate market value as of the date of liquidation. All we have to do is forecast
the appreciation rate. It’s fairly straightforward to forecast the annual income generated by
the partnership and then what it would sell for in five years if it appreciates at 3% to 5%.
SW: It just seems like the ones that I do are much more erratic. There might be
income but no distribution. Do you assume that the cash flow is the ability to pay the
dividend or the actual dividend?
BJ:We assume the ability to pay. You either have to forecast the distribution of income
or show where that income is going. It’s got to be reinvested in some other asset. I think it’s
more straightforward and easier to explain, and IRS Revenue Ruling 59‐60 refers to the
income‐generating ability of the company. So we forecast 100% of the profit being paid out,
with the liquidation in five or 10 years.
SW: Because they are pass‐through entities, do you do a tax adjustment?
BJ: No, we don’t. We find that they are low‐income‐producing entities and most of the
return is in the liquidation. Raising the tax‐affecting issue with the IRS raises another issue
when they already don’t like FLPs, so we just don’t get into that issue.
SW: I noticed that you weight the market and income approach 50‐50. Typically, in a
regular business you would weight the income approach higher. Did you do 50‐50 to
make it a simple example?
BJ: No, that’s what we normally do here. The market and income approaches should
come out fairly close, so it doesn’t matter what the weight is. Sometimes, the Partnership
Profiles data have better partnerships than my subject. They’re bigger and have a longer
history, so I might weight the income approach higher.
SW: You spend a lot of time on the venture capital data for DLOM. But you don’t see
that in the analysis of regular companies.
BJ: We’ve been doing it for 20 years and actually had the IRS call us and tell us that

用收益法评估家庭有限合伙企业的 新观点
©BVR 13
they like it. Usually, our DLOMs are about 25%. We end up with marketable securities at
the 30%‐to‐35% range, income producing real estate in the 35%‐to‐40% range, and
non‐income‐producing real estate in a 40%‐to‐50% range as far as total discounts.
I testified in the first FLP case to go to court, and the IRS wanted to argue discounts,
and I argued rate of return. Nobody knows what a fair discount is, but everybody knows
what they can get in a CD, in bonds, in stocks. If your rate of return is 15% to 20%, you’re
probably pretty reasonable, but if it’s a 30%‐to‐40% return, then you’ve discounted the heck
out of it. I like to get the IRS in a discussion about rates of return, not whether the discount
is too high or too low.
SW: Where does the world stand in terms of FLPs and discounts? Are discounts
going to be around, or are they still under threat of being legislated out?
BJ: They’re a very successful planning tool, so I think they’re always under threat.
Every year, the Treasury Department proposes to eliminate them, but it never gets passed.
Everybody uses them, and they’ve been held up in court. Where the IRS has been more
successful is with people who don’t set FLPs up correctly and don’t treat them as
arm’s‐length entities.
For more information. Johnson recently conducted a webinar for Business Valuation
Resources where he discusses his approach in more detail. A recording of the webinar,
Using the Empirical Method for Determining DLOMs, is available at
BVResources.com/training.
Stuart Weiss, CPA/ABV, is a business valuation practitioner in Portland, Ore. He can be
reached at [email protected] or 503‐223‐3142.

规模效应依然存在吗? 来源于 Pratt 和 Grabowski 新的分析
©IACVA(CHINA) - BVR 1
Does the Size Effect StillExist? New Analysis From Pratt and Grabowski
规模效应依然存在吗?来源于 Pratt 和Grabowski 新的分析
翻译:包秋鸣(上海财瑞资产评估有限公司)
在即将出版的第五版《资本成本:应用和案例》(作者:香农.普拉特, 香农.普拉特评估
有限责任公司,FASA, 罗杰.格拉鲍夫斯基,FASA,道衡公司)一书中,揭示了关于检验规
模溢价存在性的新分析新。
In the upcoming fifth edition of their essential book, Cost of Capital: Applications and
Examples, Shannon Pratt, FASA (Shannon Pratt Valuations), and Roger Grabowski, FASA
(Duff & Phelps), reveal new analysis that examines the existence of the size premium.
背景: 在评估目的下为了制定权益资本估计的时候,一个公司的规模因素成为最重要的
风险因素之一。长期以来,小型公司的股票已经证明了其风险要高于大型公司的股票。上述证
明是合理的,因为大型公司比小型公司拥有确定性的优势。因此,投资者在对小型公司进行投
资的时候,要求享有更高的收益回报,用以作为对补偿的风险。这就是规模溢价的定义,并且

Does the Size Effect Still Exist? New Analysis From Pratt and Grabowski
©IACVA(CHINA) - BVR 2
规模溢价对折现率具有重要的影响。所以对企业估值有显著的效应。
Background. A company’s size is one of the most important elements of risk to
consider when developing cost of equity estimates for valuation purposes. Over the long
haul, small company stocks have proved to be riskier than large company stocks. This
makes sense because larger companies have certain advantages over smaller companies.
Therefore, investors require a greater return on investment in small companies to
compensate for that risk. This is what the size premium is about, and it can have a material
effect on the discount rate—and therefore a significant effect on the valuation of a
company.
近几年来,许多研究者已经调查规模效应并得到了不同的结论。Ibbotson协会通过使用了
追溯到1926年的数据来测算小型公司的溢价。Fama‐French的5个不同时期的SMB研究(上市
公司规模因子的模拟组合收益率)表明(建议)对于规模效应的证明是“薄弱”。在不久前,小
公司股票的总体收益回报要低于大公司。鉴于上述意见,规模效应的存在性已经受到挑战,并
且对于一些法庭和国税局来说,规模效应已经成为了一个问题(议题)。
Over the years, many researchers have investigated the size effect and reached
different conclusions. Ibbotson Associates measures the small stock premium using data
that go back to 1926. Fama‐French’s study of “small‐minus‐big” (SMB) returns over five
different periods suggested that the evidence for a size effect is “weak.” Not long ago, small
company stocks were providing lower overall returns than large company stocks. In light
of all this, the existence of the size effect has been challenged, and it has even become an
issue with some courts and the IRS.
规模溢价的确消失了吗?
Has the size premium indeed vanished?
仍在较劲。罗杰.格拉鲍夫斯基在最近的美国评估师协会高级商业评估会议中的发言时说
到“我们认为规模溢价仍然很好的存在”。“当通过五年平均净利润来衡量规模的时候,规模依
然是一项非常重要的风险溢价”。下图展示了从 1963年至 2012年和 1990年至 2012年的规模
效应。
Still kicking. “We see that the size premium is still alive and well,” said Grabowski,
speaking at the recent ASA Advanced Business Valuation Conference. “Size, when size is
measured by five‐year average net income, is still a very important risk premium.” The
exhibit shows the size effect from recent periods: 1963‐2012 and also 1990‐2012.

规模效应依然存在吗? 来源于 Pratt 和 Grabowski 新的分析
©IACVA(CHINA) - BVR 3
在承认了对于规模溢价的存在性产生质疑的研究后(Banz在 1981年的论文是第一个质疑
规模溢价的),香农.普拉特和罗杰.格拉鲍夫斯基对于该问题进行了深入的探索和研究。
Acknowledging research that has questioned the existence of the size premium (the
Banz paper of 1981 was the first to question the size premium), Pratt and Grabowski delved
deep into the issue.
罗杰.格拉鲍夫斯基说:“我们扩大了分析范围,并且我们从各个时期观察各种各样的排列”。
“也就是说,小公司需要多久会获得比大公司更高的收益率, 这才是规模溢价的本质”。他们
提出的数据显示,在 2002年至 2012年这十年期间,每个月小公司拥有比大公司更高的回报。
“这是最广泛的数据分析,不仅仅是其他人研究的总结,但实际的数据帮助你去理解和解释规
模溢价是怎么个情况”他说。
“We expanded the analysis and we looked at all kinds of permutations from every
period of time,” Grabowski says. “That is, how often do small companies earn a higher rate
of return than big companies? That’s really the essence of the size premium.” They came up
with statistics that show that, even with 10‐year holding periods during 2000‐2012, everymonth small companies had higher returns than big companies. “This is the most extensive
analysis of data—not just a summary of other peoples’ studies but actual data—to help you
understand and explain what goes on with the size premium,” he says.
当然,当规模溢价在特定期间内被测算的时候它会变化甚至是负数。但是正如香农.普拉
特和罗杰.格拉鲍夫斯基新的分析显示,随着时间的推移,小股票会跑赢大公司股票,因为小
公司股票的风险更高,这也就意味着对于规模的调整的确是合理的。
Of course, the size premium will vary and may even be negative when measured over
certain periods. But as the new Pratt and Grabowski analysis shows, small stocks on
average over time do outperform large stocks because of their greater risks, which means
that an adjustment for size is indeed appropriate.

达摩达兰对估值与定价的讨论及企业价值评估的观点
©IACVA(CHINA) - BVR 1
Damodaran Discusses Value Versus
Price and His View of the BVWorld
达摩达兰对估值与定价的讨论
及企业价值评估的观点
翻译:朱军(中和资产评估有限公司)
蒋东勇(北京北方亚事资产评估有限公司)
编者注:阿斯沃斯∙达摩达兰说(纽约大学Stern商学院):“你是在估值还是定价?差别是什么?
在这一点上的混乱是当今许多评估问题的根源。” BusinessValuationUpdate (BVU)最近采访了目前
在评估领域最受尊敬达摩达兰博士,讨论价值与价格的关系。在访谈中,我们的谈话扩展到其他话题,
他有一些非常鲜明的见解。他的话可能会让你大吃一惊。
BVU:为什么价格与价值的概念很重要?
阿斯沃斯∙达摩达兰博士:“价值”和“价格”是被银行家、评估师和分析师基本上混用的两个词汇。
我认为它们是两个截然不同的概念,由不同的力量决定和驱动,应该区别对待。
我相信在大部分被认为是估值的评估业务中,不是估值而是定价。实际上,评估师被要求估计某

Damodaran Discusses Value Versus Price and His View of the BV World
©IACVA(CHINA) - BVR 2
人在交易中需要支付的金额时,这是一个定价需求。如果有一笔交易要达成,尽管可以建立一个估值
模型支持结果,评估师通常做的工作是对一项资产定价,而不是对资产估值。因此,我们需要理解价
值和价格的差别,是什么驱动这两个概念,为何它们产生不同的结果,评估师应该如何做,这是本次
讨论的基本问题。
编者注:达摩达兰博士所指会议是9月10日在纽约的一次现场活动。
BVU:在你心目中,区别是什么?
阿斯沃斯∙达摩达兰:资产的价值基于它的基本面:现金流、增长和风险。这是所有评估书籍,包
括我的书籍和评估课程中强调的。我们采用“内在价值”这样的词来描述它,用评估工具如折现现金流
(DCF)来估算它。
同一资产的价格基于需求与供给,仅此而已。诚然,基本面在确定需求与供给两方面扮演着重要
角色,但这些也受到情绪、动量甚至非理性力量的作用。过去二十年里,行为金融学的许多成果就是
解释这些因素的。
在一个完全有效的市场中,二者可能没有差别,因为价格迟早等于价值。但在低效和有摩擦的市
场中,价格可能会不同于价值。在九月的演讲中,我将首先讲到价值的驱动因素以及如何考虑价值。
然后会分析我觉得我们不经常讨论的问题:定价过程。是什么驱动定价过程?为这些问题打开一扇窗:
情绪如何影响价格?动量如何影响价格?你还不得不考虑市场操纵,交易限制,流动性问题,以及其
他改变价格的因素,我们往往在估值中忽视或粉饰这些因素。
在阐述了这两个过程之后,我将会考虑价格和价值是两个完全不同数值的可能性。如果你的工作
是给一项资产赋值,首先要决定任务是估值还是定价。要描绘两者的差别,可以考虑一个房地产经纪
人的任务是卖掉我的房子,如果我要房地产经纪人给房子标上个数字,他或她必须找到一个能够出售
的价格,而不是房子的内在价值。
BVU:在你评估的公司中,你是怎么看待价格和价值?
阿斯沃斯∙达摩达兰:过去几年我评估过的公司,比如苹果、推特、脸书、特斯拉,是为了发现价
值(或至少我的估值)与价格如何区分的实验性分析。例如:我对Twitter的评估开始于上市前——
并不是说估值正确,而是提供思考估值的框架——随着我更了解这家公司,看我的估值随时间如何改
变。对比我的估值和Twitter的股价,观察其如何变化及导致这些变化的原因。对于Twitter盈利公告,
我发现投资人的反应和争论在定价环境和估值情境下完全不同。在这个过程中,我认为,尤其是那些
被新闻报道广为追随的公司,价格驱动因素经常和基本面无关,价格与价值可能长期间偏离。
BVU:这不影响投资的传统哲学吗?
阿斯沃斯∙达摩达兰:过去的投资逻辑是基于这样的推理,至少由BenGraham和高级专家宣讲的

达摩达兰对估值与定价的讨论及企业价值评估的观点
©IACVA(CHINA) - BVR 3
是这样,即如果你做好功课,买一些被低估的东西,就会得到回报。我 30年前,第一次做评估时就
是这么认为的。我所要做的就是得到正确的价值,并获得报酬。30年来我发现并不总这样,主要是由
于定价过程有自身的逻辑。令我吃惊的,我发现在很长的一个期间内,我可以得到正确的价值,但价
格在一段时间内是错位的。
我还发现,如果你是一个价值投资者,需要承担忽略定价过程的风险;要成为一个成功的价值
投资者,不能轻视交易者(定价的人)。我注意到市场上的一个现象,我们倾向于加入各自的圈子,
投资人圈子或交易商圈子,价值圈子或定价圈子,而没有试图相互理解。
我习惯有规律地评估一些公司,用于对比评估过程和定价过程。我认为,作为一个成功的投资
者和评估师,既要理解估值过程是如何运作的(价值投资者如何思考),也要理解定价过程是如何
运作的(交易商如何思考)。
BVU:确定“公允价值”的概念是什么?
阿斯沃斯∙达摩达兰:我一直认为公允价值会计处理是一个矛盾概念,其最终在财务报表中的使
用,既不符合公允价值的目标,也不符合基本的会计准则。我还认为会计的公允价值有一个根本性
的问题,源自于它要求会计人员做什么,以及要求他们如何支持会计数字。当我读有关公允价值的
会计准则(公认会计准则或国际财务报告准则)时,我被要求做的是估算“市场参与者”在一项企业
权益的无关联交易中将支付的多少。这听起来像一个定价任务,而不是估值任务。然而,这些会计
准则要求会计师用内在价值模型来支持这些数字,这既前后矛盾又不公允。难怪会计从业人员经常
觉得困惑,他们逆向设计估值模型去证明可能原本不合理的价格是合理的。我想如果这一点被澄清,
我们都会好过些。
BVU:听起来像是带来了更多的麻烦。
阿斯沃斯∙达摩达兰:我认为这是我们在评估业务中面临的许多困难的核心。我们很容易感到困
惑陷入思考,当实际是定价的工作,我们莫名其妙的用了估值方法。我建议评估人员应该看看具体
的评估任务,并询问是被要求定价还是估值。如果是定价,当可以用倍数/可比案例时,为什么要用
现金流、贴现率和增长率建立复杂的估值模型?如果你的工作是估值,为什么要浪费时间在调查可
比交易案例上面?
BVU:所以可能存在很大分歧了?
阿斯沃斯∙达摩达兰:我认为价格和价值之间存在差异,整个估值行业都是建立在这种假设之上。
毕竟,如果市场是有效的,我们就不需要成千上万的分析师和基金经理了,对不对?我也相信,如
果你错误理解任务(应该做评估时却做定价,或者相反),可能会犯一些严重的错误。
另外,我们必须更直接的对待评估偏见。如果你从事评估行业,靠做评估得到报酬,那没有什么

Damodaran Discusses Value Versus Price and His View of the BV World
©IACVA(CHINA) - BVR 4
错。因为这就是为什么它是一个职业。然而,事实上,你获取到报酬的过程确实造成偏见,不是因为
你不诚实,而因为你是人类。评估行业几乎都喜欢强调公允和客观性,但是在评估纠纷中,你为一方
或另一方面工作,可能即做不到客观也做不到公正。这是一个可悲的事实,在大多数的评估业务中,
客户在寻求你的价值观点时心中已经有了一个数字,施加压力让你为这个数字背书。我也知道很多评
估师会抵制这种压力,但是抵制的程度限于你不失去所有评估业务。这是个有偏见的过程,如果我们
接受了这个事实,并公开、坦诚的面对,我们的处境会好些。
BVU:评估数据必须可辩护吗?有人问,对数值合理必须有故事吗,特别是在法庭上?
阿斯沃斯∙达摩达兰:如果为一项交易做评估,可辩护性不是个问题。衡量评估好坏的唯
一标准是这项交易是否以这个估值成交。如果你谈论的是“可辩护”,通常是指司法为目的的
评估。那么问题就变为法律上的可辩护性,不论好坏,差的评估可能在法律上能够辩护,好
的评估却不能。这是因为法院系统过于看重程序,而轻视合理性。因此,坚持长期使用评估
程序(特别是过去法庭案例)的评估师,与采用创新的、更好的评估方法的评估师相比,可
能有更多机会在评估见证时进行辩护。我认为,良好的评估应该由可靠的描述支持,司法评
估特别缺乏这些。相反,评估被专门设计为对应检查表格上的每项内容,这样处理是为了做
出的评估在法律上更容易被辩护。
当评估只是数字游戏时,就会变得脆弱和受到操控。比如,如果我用10%的增长率达到200万美
元的估值,但没有依据支持这个增长率,也没有什么可以妨碍你。如果你是在争论的另一方,使用15%
的增长率,估值为300万美元。在法律环境中,你可能会以折中(妥协)告终,这会带来不愉快的影
响,使两种估值的分歧进一步加大。
BVU:谈到描述,我有更可信的故事并有支撑数据,难道我不具备优势吗?
阿斯沃斯∙达摩达兰:我希望那是真的。从我的上面的回答可以看出,我对司法评估是持
悲观态度的。记得几年前,我在宾夕法尼亚大学的一次会议上给特拉华法院法官做评估演讲。
我用一个问题开始演讲:你们法庭需要法律上可辩护的评估还是好的评估?法官一开始感到
困惑,但后来在我使用多个例子后便理解了。在这些例子中,我让他们在法律上可辩护的路
径和更合理的路径之间做选择,以此来展示这些不同。
很容易证明,那些强加了法律辩护能力的评估案例(我不指出他们,但你可以列出自己的清单)
实际上是无意义的,但是却因为有先例而被接受了。因此,如果你是一个法律事项的评估师,你将面
对这个难题:是应该创造性做出更有说服力、共识支持的评估呢?还是应该规避风险,用过去被接受
的方式评估?如果你想在法庭上获胜,我建议你做后者。
BVU:有解决办法吗?
阿斯沃斯∙达摩达兰:评估博弈有一个简单的解决方案。如果你真的拥有一个资产的公允价值,那

达摩达兰对估值与定价的讨论及企业价值评估的观点
©IACVA(CHINA) - BVR 5
么你应该在买价和卖价之间保持中立,对吗?假使我们尝试这样做:在税务法庭上,如果你是纳税人
的评估师,并给出企业价值,如果国税局以这个价格认购企业,你会同意吗?相反,如果你是国税局,
并认定了我的企业价值,你应该愿意以那个价格从我手中收购企业,对不对?强迫人们用真金白银来
支持其估值,是分离“显示”评估值和真实评估值的一个办法。
在我的人生中,我只做过三次专家证人,第一次是因为我不太了解,第二次是因为我为被告感到
遗憾,而第三次是为了帮助朋友。对这三次经历我感到遗憾的原因有两个。第一个是我很难理解律师
的逻辑和诉讼。第二个原因是,我知道,无论我多么好心,我发现在见证时所说的事情都会感到后悔
或今后不愿意辩解。不用说,我已经吸取了教训,今后不打算再做专家证人。我很荣幸能够做出这样
的选择,但不是每个人都能这样。
BVU:你为什么把评估摆在首位?
阿斯沃斯∙达摩达兰:我会告诉你这是一种结合讲故事和数据分析的事情。我不想成为一名会计师
或模型编制人。只是数字驱动我。我不想成为一个战略分析师,因为要讲太多的故事。所以从某种意
义上说,我想做的事情是将商业创造力(提出优秀的评估理念)与数据领域的内容联系起来。我把评
估描述成故事和数字之间的桥梁,我喜欢既使用左脑,又使用右脑的感觉。
如果你想做出高水平评估,你必须能够完整描述你的思路。在过程中,应该使得关注数值的人和
关注描述的人都满意。如果你是擅长描述的人,评估强制你遵守规则;如果你是关注数值的人,你要
考虑描述的技巧。
BVU:你怎么看待企业价值评估行业?特别是关于它的碎片性。
阿斯沃斯∙达摩达兰:作为一个局外人,我对评估行业的两个方面感到惊讶。一方面,评估是遵守
规则和规则导向的,也许是因为很多评估是为司法和会计场合服务,而不是为交易服务;另一方面,
价值评估的准则制定者和看门人,同时也是游戏的参与者,即他们也提供企业评估服务。我认为这会
造成两个问题。首先是利益冲突,如果你已经建立了事实上的规则,规定如何估算折现率,流动性折
扣,或控制权溢价,并正在从规则中赚钱,你基本不会有动机去质疑或改变规则。其次会使评估过程
静态化,变革会遇到困难和阻碍。
由于没有担任评估师的工作,我无法理解或评价评估师的压力,我也有优势,挑战现在的做事方
法,我不会失去什么。我在评估会议做演讲和为企业价值评估(杂志)(Business Valuation Review
(journal))做会话专题,原因之一是他们允许我作为一个无政府主义者,那么我唯一的工作就是动摇现
状。可能我不总是正确的,甚至很多时候是错误的,但我相信,开放的辩论和讨论既有的惯例只会改
进评估程序。
我也认为在这个过程中,程序的严苛创造出一堆评估证书,每个团体都声称由高水准人员和正确

Damodaran Discusses Value Versus Price and His View of the BV World
©IACVA(CHINA) - BVR 6
的准则组成。估值原理很简单,对程序的分歧不应该妨碍对原理的理解。
BVU:答案是什么?
阿斯沃斯∙达摩达兰:一种解决方案是有更多的原则驱动评估和较少的规则驱动评估。这将要求所
有相关方,包括法院和会计规则制定者,同意接受更广泛的方法矩阵来处理日常估值事务。我们需要
更多的公开辩论和更大的意愿改变规则,即使这意味着削弱一些评估服务的业务量。
BVU:每个专业组织制定自己的规则。
阿斯沃斯∙达摩达兰:这是肯定的,但是如果你从事的不是规则驱动程序的行业,规则就不那么重
要了。例如,房地产行业。可以建立规则让房地产经纪人遵循规则定价,但我不知道这些规则;但是
即使存在规则,也远没有起作用,因为你的最终目的是卖房子,而不是按照规则定价。回到我前面的
观点,使评估更多的原则驱动和更少的规则驱动能缓解大部分的问题。
BVU:回到价格与价值的问题,你有什么建议?
阿斯沃斯∙达摩达兰:我建议,如果你是一名评估师,用你最近的五个估值项目做个测试。我想
让你想想每个评估任务是什么。你是在为交易做估值吗?是为司法解决、税务法庭或是会计目的的公
允价值?勾画出你做评估时的动机。然后问自己,在给定的动机下,你的使命是什么?是为公司定价
还是评估公司价值?再看你实际做的评估,看看你做的是否和使命一致,如果不是,将会如何影响你
得出的数值。
我不能说每个人有相同的使命,但我们每个人在评估一项资产价值时都有一个使命,我所
推崇的是,在开始按评估规则得到数值时,应该诚实面对使命。

达摩达兰对估值与定价的讨论及企业价值评估的观点
©BVR 7
Damodaran Discusses Value Versus Price and His View of the BV
World
Editor’s note: Are you valuing or pricing? What’s the difference? Confusion over this point is at the
root of many of the problems that arise in valuation today, says Aswath Damodaran (Stern School of
Business, New York University). BVU recently sat down with Dr. Damodaran, one of the most
respected voices in valuation today, to discuss value versus price. Along the way, our conversation
branched out into other topics that he has some very definite opinions about. What he says may
surprise you.
BVU:Why is the concept of price versus value important?
Dr. Aswath Damodaran: “Value” and “price” are two words that get used almost
interchangeably by bankers, appraisers, and analysts. I think that they are two very different
concepts, determined and driven by different forces, and should be differentiated.
I believe that much of what passes for valuation in the appraisal business is not valuation but
pricing. In effect, you are asked to estimate what someone else will pay for that business right now,
which is a pricing imperative. Even though you may create a valuation model to back up that
number, your job as an appraiser often is—if you have a transaction to do—to price an asset, not
value it. So we need to understand that there is a contrast between value and price, what drives
these two concepts, why they might yield different numbers, and what to do when they do. This is
basically what my session is about.
Editor’s note: The session Dr. Damodaran is referring to is a special live event he conducted on
September 10 in New York City.
BVU:What, in your mind, is the distinction?
AD: The value of an asset is based on its fundamentals: its cash flows, its growth, its risk. It is
what you find emphasized in all valuation books, including mine, and valuation classes. We use
words like “intrinsic value” to describe it and tools such as discounted cash flow valuation (DCF) to
estimate it.
The price of that same asset is based on demand and supply, nothing more, nothing less. It is
true that fundamentals play a role in determining both demand and supply, but these are also a
function of mood, momentum, and even irrational forces. Much of the work that has been done in

Damodaran Discusses Value Versus Price and His View of the BV World
©BVR 8
behavioral finance over the last two decades is about highlighting these forces.
In a purely efficient market, the distinction may not matter because the price will equal the
value, sooner rather than later. But in markets where you have inefficiencies and frictions, the price
can be different from the value. In the September presentation, I will first talk about the drivers of
value and how we think about value. Then I will look at something I don’t think we spend enough
time on: the pricing process. What is it that drives the pricing process? There you have to open the
door to questions such as: How does mood affect prices? What about momentum? You also have to
look at market manipulation, trading constraints, liquidity issues, and other factors that move prices
that we tend to either ignore in valuation or gloss over.
After laying out these two processes, I am going to start with the proposition that it’s possible
that price and value are two very different numbers. And if your job is to attach a number to an
asset, you first have to decide whether your job is to value it or price it. To provide an illustration of
the distinction, consider the task faced by a realtor, whose job it is to sell my house. If I ask the
realtor to put a number on that house, he or she has to find a price at which it will sell, not its
intrinsic value.
BVU:What do you see in terms of value versus price in the companies you value?
AD: The companies I’ve been valuing for the last few years—Apple, Twitter, Facebook,
Tesla—act as lab experiments to show how value (or at least my estimate of it) and price can
diverge. For example, with Twitter, I will start with my pre‐IPO valuation—not that I’m saying it’s
the right valuation, but it provides a framework for thinking about valuation—and look at how my
estimate of value has changed over time, as I have learned more about the company. I contrast it
with Twitter’s price and how it has changed over time and what caused those changes. With
Twitter’s earnings announcements, I look at what investors are reacting to and argue that those
reactions can be very different in a pricing environment as opposed to a valuation one. In the
process, I will argue that, especially with companies that are in the news and widely followed, what
drives the price often has nothing to do with fundamentals and that the price can move away from
value for extended periods.
BVU: Doesn’t this affect the traditional philosophy of investing?
AD: The old‐time value investing philosophy, at least as laid out by Ben Graham and preached
by its high priests, is built on the presumption that, if you do your homework and buy something
that is undervalued, you’ll be rewarded. That’s what I used to believe 30 years ago when I first

达摩达兰对估值与定价的讨论及企业价值评估的观点
©BVR 9
started doing valuations. All I had to do was get the value right and I was going to get rewarded.
I’ve discovered over the last 30 years that that does not always happen, largely because the pricing
process has a mind of its own. Much to my dismay, I have discovered that I can be right about value
and wrong about price for extended periods.
I have also learned that, if you are a value investor, you ignore the pricing process at your own
peril and that, to be a successful value investor, I cannot treat traders (pricers) with disdain. One of
the patterns that I notice in markets is that we tend to go into our respective camps, the investor
camp or the trading camp, the value camp or the pricing camp, and that we do not try to
understand each other.
I use the companies that I value regularly to draw the contrast between the valuation process
and the pricing process. I argue that, to be a successful investor and appraiser, you need to have an
understanding both of how the value process works (and how value investors think) and how the
pricing process works (and how traders react).
BVU:What about the concept of determining ‘fair value’?
AD: I have always argued that fair value accounting is an oxymoron and that we will end up
with financial statements that neither fulfill our fair value objectives nor meet basic accounting
principles. I also think that fair value accounting has a fundamental problem, stemming from what
it asks accountants to do and how it asks them to back up their numbers. When I read the
accounting rules that govern fair value accounting (either in GAAP or IFRS), it seems to me that
what I am being asked to do is estimate what a “market participant” will pay for a business in an
arm’s‐length transaction. That sounds to me like a pricing mission, not a valuation one. However,
these accounting rules require accountants to back up the numbers that they come up with with
intrinsic valuation models; that is both inconsistent and unfair. No wonder accounting practitioners
often find themselves facing the quandary of having to reverse‐engineer valuation models to justify
prices that may be unjustifiable. I think we would all be better off if the mission were clarified.
BVU: Sounds like a recipe for trouble.
AD: I think it’s at the core of so many difficulties we face in the appraisal business. We can
easily get confused into thinking we are somehow valuing things when in fact our job is to price
them. I suggest that appraisers should look at their specific appraisal tasks and ask whether they are
being asked to price or value assets. If it is the former, why build elaborate valuation models with
cash flows, discount rates, and growth rates, when a multiple/comparables will do the job for you?

Damodaran Discusses Value Versus Price and His View of the BV World
©BVR 10
If your job is valuation, why waste your time examining what the comparables are trading at?
BVU: So there’s the possibility that there’s a big gap?
AD: I believe that there is a gap between price and value, and I believe that the entire valuation
profession is built on that assumption. After all, if markets were efficient, we would not need the
thousands of analysts and portfolio managers out there, right? I also believe that if you mistake
your mission (doing pricing when you should be doing valuation, or vice versa), you can make
some serious errors.
As a side note, we also have to start dealing with bias in valuations more directly. If you are in
the appraisal business, you are getting paid to do appraisals. There is nothing wrong with that. That
is what makes it a business. However, the fact that you are being paid does create bias in the
process, not because you are being dishonest, but because you are human. As much as the appraisal
business likes to emphasize fairness and objectivity, you can be neither when you are working for
one side or the other in an appraisal dispute. It is a sad truth that, in most appraisals, the client who
seeks your opinion about value already has a number in mind and will put pressure on you to back
up that number. I also know that many appraisers push back against this pressure, but there are
limits to how much you can push back without losing all of your business. We would all be better
off if we accepted the fact that this is a biased process and were open and upfront about those
biases.
BVU: Don’t the numbers have to be defensible? Doesn’t there have to be a story—some
narrative—behind the numbers that makes sense, especially in court?
AD: If you are valuing for a transaction, then defensibility is not even an issue. The only
measure of whether a value is OK is whether a transaction occurs at that value. If you are talking
about “defensible,” you are generally talking about valuations done for legal purposes. The
question then becomes one of legal defensibility, and, for better or worse, you can have bad
valuations that are legally defensible and good ones that are not. That is because the court system
puts too much weight on precedence and too little on good sense. Thus, an appraiser who sticks
with an estimation procedure that has been used for an extended period (especially in past court
cases) has a better chance of being able to defend his or her valuation on the witness stand than one
who comes up with a creative, much better estimation procedure. I believe that good valuations
should be backed up by solid narratives, and I find legal valuations particularly lacking in those.
Instead, what I see are valuations designed to check off boxes on the legal valuation checklist, items
that have been dealt with because they make the valuation more legally defensible.
达摩达兰对估值与定价的讨论及企业价值评估的观点
©BVR 11
When valuation becomes all about the number crunching, it becomes fragile and subject to
manipulation. Thus, if I use a 10% growth rate to arrive at a value of $2 million but have no
narrative to back up that growth rate, there is nothing that prevents you, if you are on the other side
of the argument, from using a 15% growth rate and estimating the value to be $3 million. And, in a
legal setting, you will probably end up splitting the difference, which has the unpleasant effect of
driving the two valuations further apart.
BVU: Talking about narrative, if I’m in court and my story is more believable and I can back
it up with numbers, won’t I have the edge?
AD: I wish that were true. As you can see from my last response, I’m very cynical about legal
valuations. I remember giving a valuation presentation to the Delaware Court judges at a
conference a few years ago at the University of Pennsylvania. I started my session off with a
question: In your courtroom, do you want a legally defensible valuation or a good valuation? The
judges were puzzled initially but understood the point I was trying to make after I used multiple
examples, where I made them choose between the legally defensible path and a more sensible path,
to illustrate the difference.
It is easy to show that valuation practices (I won’t name them, but you can make your own list)
that have become embedded as legally defensible often make no sense any more but are accepted
because they have been used before. Thus, if you are an appraiser in a legal setting, here is your
conundrum: Should I be creative and try to come up with a good narrative, backed up by a
common‐sense valuation? Or should I be risk averse and do what’s been accepted in the past? I
suggest that you do the latter if you want to win in a courtroom.
BVU: Is there a solution?
AD: There is a simple solution to valuation game playing. If you truly have a fair value for an
asset, you should be indifferent between buying at that price and selling at it, right? What if we
tried this: If you are the valuation appraiser for a taxpayer in tax court and you come up with a
value for the business, would you be OK if the IRS offered to buy your business at that price?
Conversely, if you are the IRS and claim a value for my business, you should be willing to take it off
my hands at that value, right? Forcing people to actually back up their valuations with real money
is one way that you can separate “show” valuations from real valuations.
I have been an expert witness only three times in my life, the first because I did not know better,
the second because I felt sorry for the defendant, and the third to help a friend; I have regretted all

Damodaran Discusses Value Versus Price and His View of the BV World
©BVR 12
three experiences for two reasons. The first is that I have difficulty understanding lawyers in terms
of their logic and action. The second is that I know that, no matter how well intentioned I am, I will
find myself saying things on the witness stand that I will either come to regret or be unwilling to
defend later in my life. Needless to say, I have learned my lesson and don’t plan ever to do expert
witness work in the future. I am lucky enough to be able to make that choice, but not everyone is.
BVU:Why did you get into valuation in the first place?
AD: I’ll tell you, it’s the narrative/numbers thing. I didn’t want to become an accountant or
model builder. It’s too numbers‐driven for me. I didn’t want to be a strategist because it’s too much
storytelling. So, in a sense, I wanted something that would help me connect the creative component
of business—coming up with great valuation ideas with the discipline of numbers. I describe
valuation as the bridge between narrative and numbers, and I enjoy using both sides of my brain.
If you do a good valuation, it should tell a story. In the process, it makes both sides, the
numbers people and the narrative people, better. If you’re a storyteller, it forces you to be
disciplined. If you’re a numbers person, it makes you think about the narrative.
BVU: What are your thoughts about the business valuation profession? Especially about the
fragmented nature of it.
AD: As an outsider, I have been surprised by two aspects of the appraisal business. The first is
in how rigid and rule‐driven it is, perhaps because so many appraisal valuations are for legal or
accounting settings rather than for transactions. The second is that the rulewriters and gatekeepers
in valuation appraisal seem to be players in the game, i.e., they are in the business of providing
valuation services. I think this creates two problems. The first is a conflict of interest, where, if you
have created the de facto rule for how to estimate discount rates, liquidity discounts, or control
premiums, and are making money off that rule, you have little incentive to see challenges to it. The
second is that it makes the process static, where change is difficult and discouraged.
While not having worked as an appraiser means that I don’t understand or appreciate the
pressures that appraisers are under, I also have the advantage of having nothing to lose from
challenging the way things are done. One reason I talk at valuation conferences and do these
sessions for BVR is that they allow me to act as an anarchist whose sole job is to shake up the status
quo. I may not always be right or even right most of the time, but I believe that an open debate and
discussion of established practices can only improve the valuation process.
I also think that the rigidity in the process is what creates the alphabet soup of valuation
达摩达兰对估值与定价的讨论及企业价值评估的观点
©BVR 13
credentials out there, with each group claiming the high ground and that it has the right set of rules.
Valuation principles are simple, and disagreements about processes should not get in the way of
appreciating the principles.
BVU:What’s the answer?
AD: One solution is to have more principle‐driven valuation and less rule‐driven valuation.
This will require all concerned, including courts and accounting rule makers, to agree on accepting
a wider array of approaches to dealing with day‐to‐day valuation concerns. I also think we need
more open debate and a greater willingness to change rules, even if it means undercutting the
business practices of some appraisal services.
BVU: Every profession sets its own rules.
AD: That’s certainly true, but the rules matter less if you are in a profession where rules don’t
drive the process. As an example, consider real estate. It is possible that there are rules that realtors
have to follow in pricing houses, but I am not aware of these rules, and, even if they did exist, they
matter far less since your end game is selling houses, not to price them to meet the rules. Going
back to my earlier point, making appraisals more principle‐driven and less rule‐driven may
alleviate most of the problem.
BVU: Getting back to the price‐versus‐value issue, what’s your advice?
AD: I suggest that, if you are an appraiser, you take your last five valuations for a test drive. I
would like you to think about what your mission was with each valuation. Were you doing a
valuation for a transaction? Was it for a legal setting, a tax court, or for accounting fair value?
Outline the motive that you had when you did the valuation. Then ask yourself: Was your mission,
given that motive, to price the company or to value the company? And then look at the actual
valuation that you did. See if what you did was consistent with your mission and, if not, how it
might have impacted the numbers you came up with.
I’m not saying that everybody has the same mission. But each of us has a mission when
assessing the value of an asset, and what I’m pushing for is for us to be honest about what the
mission is before we start putting numbers down and drawing on valuation rules.

达摩达兰警告“评估师”正在变成“定价者”
©IACVA(CHINA) - BVR 1
Damodaran’s Warning Signs That a
‘Valuer’ is Becoming a ‘Pricer’
达摩达兰警告“评估师”正在变成“定价者”
翻译:朱军 (中和资产评估有限公司)
梁瑞莹(广东中联羊城资产评估有限公司)
企业价值评估师应当谨慎看待自己的工作,明确定价和对企业评估或资产的评估的区别。
这是达摩达兰教授(纽约大学 Stern 商学院)在 BVR 关于定价和评估的一个 3 小时特别研讨
会上对公众(现场和网络听众)的忠告。
作为一个令人兴奋和有趣的演讲者,达摩达兰感到定价和评估的差异正在逐步扩大。他认
为:这暗示市场不是有效的,对于价格和估值的对比导致我们“在 80%的情况下采用错误的工
具。我们在帮倒忙,并经常使用那些本不应使用的定价方法。”
他指出,当我们谈论估值时,我们主要考虑基本面;当我们谈论定价时,我们在考虑基本
面、驱动力和情绪——围绕供求关系的市场决定因素。“在同一个时刻,你可能会给同一个资
产两个非常不同的定价。”他说到。
估值伪装。达摩达兰还指出,许多定价决定被伪装成估值。例如,投资银行家近期对阿里
巴巴做出了$1550亿的定价。这给人们一种“这个定价是根据评估模型计算的”的错觉,具有很
强的迷惑性。他指出,事实上,他们给出的是一个 IPO的价格。

Damodaran’s Warning Signs That a ‘Valuer’ is Becoming a ‘Pricer’
©IACVA(CHINA) - BVR 2
他进一步举例:当一个房地产经纪人(比如说加州的 LaJolla)查看可比物业并调整差异
时,他是在定价格。此处没有任何类似缺乏市场性折扣或其他因素的对于“价值”的调整。这就
是一个价格,“没有人说:‘我认为这个价格太高,所以我们会按较低的价格卖给你’”。
另一个案例是用基于 EBITDA 乘数作为终值的 DCF“评估”。“这就是男扮女装的评估”,
达摩达兰开玩笑说。“采用一个精致的定价方案,聚焦未来 5年的现金流,然后终值的乘数中
扔进了其他因素”。他担心,任何依赖于终值的评估结论就是类似价格导向的“评估”。
风险投资基金退出价值是另一个例子。正是使用“退出”这个术语,清楚地说明了使用者假
想了一个针对特定潜在购买群体的定价行为。市场乘数是针对 终价格(而不是价值)设计的。
达摩达兰认为,对投资人更好的服务是“努力弥合价格和价值的差距”,这比试图判断“价
格是否完全由基本面驱动”要好。“你可以到 Omaha的价值投资神庙去,哪里的人们认为,一
旦所有低智商的人们计算出真正的价值,正义(和回报)将被传播。
试图附加如“控制”、“协同”或“战略考虑” 这类词汇,通过溢价或折扣来定价时,价值经
常被混淆。“当这些词汇出现在交易世界里,我认为意味着买家超额支付了,”达摩达兰说。“但
你知道价值谈判中什么词比‘战略’更糟糕吗?中国!这是一个‘转移注意力的武器’,导致人们
对一项估值追加成千上万”。
警示标志。许多其他因素使“评估师”“极度兴奋”成为“定价者”。达摩达兰列出了一些典型
的警示标志:
前几年负现金流。达摩达兰提到他的新学生由前几年负现金流引发的错误。他说,“你必须在
后几年用不成比例的正现金流,但除非你认为 Gordon增长模型是唯一的方法,否则价值应该由未来的
现金流驱动”。初创公司的收入报告的数据对于评估基本上是无意义的。“它就像在你 6岁的学校报告单
上看到一个差的分数,就断言你不会考入大学一样”。相反地,真正的问题是判断在此刻(标的公司)
的成熟度。
终值增长率。他说,“没有人会用 10000列的 Excel计算评估值,所以, 后增长率还是由永
续的经济增长率决定,这个判断将决定评估值”。
货币因素对估值的影响。这点似乎比较复杂,比如,无风险收益率现在对于瑞士法郎是 0.5%,
对于巴西雷亚尔是 9%,这是因为通货膨胀。所以,相对于一家瑞士公司,一项巴西的资产的现金流应
该大大高于可比公司,瑞士是通货紧缩的。虽然巴西公司有较高的现金流,但价值被较高的折现率稀释
了。
治理效率。如果公司不能从增长中产生价值,治理结构能更新管理吗?否则,考虑终值计算
中‘g’接近‘r’,就像是假设了一个无穷尽的 ATM提款机。

达摩达兰警告“评估师”正在变成“定价者”
©IACVA(CHINA) - BVR 3
有效税率加入终值。“定价”的一个警示标志发生在税率处理上。“前期采用实际税率如 15%没
有问题”,他说,“但一直采用这个税率水平到永续,那就像是假设管理层将停职在联邦监狱中”。“终值”
事实上将是一个终止“价格”。
初创企业预测。在定价替代评估方面,初创企业是最差的领域。这些企业的管理者经常存在:
(1)现有资产不产生现金流;(2)无法评价风险、发展到成熟的时间、预期增长率,以及其他财务指
标。他总结到:“当 CEO说他们不能肯定企业是否能生存到这个月末时,得出评估基础参数是很困难的”。
生存风险。“折现率不能用来解释失败的风险,只能用于持续经营的结果。”他说,“但对于初
创企业,生存风险经常在 80%或更高。这时,无论价格是多少,你评估的是清算价值。”
最高增长率高于无风险率。“如果你采用 2.5%的无风险报酬率,能选择最大的增长率也是
2.5%。”达摩达兰相信,在进行定价决策前,“在终值计算中,不能割裂地考虑通货膨胀和经济增长率(现
在最好的预期是美元计价的 10年期政府债券利率)。”
个别(谨慎性)风险。达摩达兰提及近期一家委内瑞拉公司评估的后续事件,同期出现的风
险是政府可能要对该公司国有化。问题是是否要调整折现率以反映这项风险。他认为很难用个别风险的
方式反映这种特定情形。他建议在不做任何个别风险考虑时计算价值和现金流,然后再用独特的折扣来
解释。
“品质增长”。品质增长在判断“评估师能否认定一家公司确实是块玉石企业”的讨论中,被
特别认同的一个概念。当然,除了金融世界外,“珍品”用于评价一件物品时,是有可以公认的
价值尺度的。但在评估王国里,“品质增长是一种罕见的特例”,达摩达兰进一步发挥道。
他定义品质增长是一家公司靠自身而不是从短期效率或兼并进行再投资。他分享自己的观
点说,‘描述和数字’结合起来讲述了评估背后的故事,定标尺是很难的。“我们没有能力赋予一
家公司较高的增长率,但是,快速增长必须再投入很多,同时,众多再投资项目必须获得成功。
投资的高回报是例外情形而不是规律。这在公司规模较小时是有可能的—就是谷歌和苹果公司
最终也会发展慢下来”。任何达到真正资本回报增长高峰的“故事”都是罕见的动听的传闻,品
质增长是非常罕见的。
终极目标。对于大多数企业价值评估师来说,交易方采用的相对“飘忽不定”价格基础是无
益的。事实上,作为一个“纯评估师”,达摩达兰认为对于评估人员来说,价值、耐力、对同行
压力的免疫力等关键素养是必须的。“明确什么促使你作为专业人员将使你选择反映价值基本
面的评估途径。”

达摩达兰警告“评估师”正在变成“定价者”
©BVR 5
Damodaran’s Warning Signs That a ‘Valuer’ Is Becoming a ‘Pricer’
Business appraisers should look carefully at their work to clarify the distinction
between pricing and valuing a business or asset. That was one of the key points Dr. Aswath
Damodaran (New York University, Stern School of Business) made to an audience (both
live and via webcast) during a special three‐hour BVR workshop on price versus value.
Always an exciting and interesting speaker, Damodaran feels there is a growing
difference between price and value. This implies that markets are not efficient, and what
drives the price versus the value leads us “to use the wrong toolkit 80% of the time. We do
a disservice, and often are led to pricing methodologies that should make us cringe,” he
states.
He points out that, when we talk about valuation, we’re talking about fundamentals.
When we talk about price, we’re talking about fundamentals plus momentum plus
mood—market determinants around the idea of supply and demand. “You can get two
very different prices on the same asset at the same moment,” he observes.
Valuation masquerade. Damodaran also points out that many pricing decisions only
pretend to be valuations. For example, the bankers recently put a price on Alibaba of $155
billion. The illusion that this price came out of a valuation model creates a great deal of
confusion. In reality, he says, what they did was set an IPO price.
To further illustrate, when a real estate agent in, say, LaJolla, Calif., looks at
comparable properties and adjusts for differences, it is to set a price. There aren’t any other
adjustments to “value” similar to discounts for lack of marketability or other factors. It’s
just a price, and “no one says ‘I think this price is too high so we’ll sell it to you at a lower
value.’”
Another example is DCF “valuations” that rely on EBITDA multiples at terminal value.
“These are valuations in drag,” Damodaran jokes. “It’s an elaborate pricing scheme where
for five years the focus is on cash flow and then a terminal multiple of some other factor is
thrown in.” He worries that any “valuation” that relies on a terminal value calculation is
similarly price‐oriented.
Venture capital fund exit values are another example. Just by the use of the term “exit,”
it’s clear that the user is envisioning a pricing event to a specific group of potential buyers.
Damodaran’s Warning Signs That a ‘Valuer’ is Becoming a ‘Pricer’
©BVR 6
The market multiple is designed to envision this ultimate price—not value.
Investors are better served by focusing on “what closes the gap between price and
value” than they are by trying to determine whether the price is entirely driven by
fundamentals, Damodaran claims. “You can travel to the pantheon of value investing in
Omaha where the belief is that once all the less intelligent people figure out true value,
justice (and returns) will be delivered.”
Value is often confused by attempts to price around words with premiums or
discounts attached to them, such as “control,” “synergy,” or “strategic considerations.”
“When words like this come out in the transaction world, I assume it means that the buyer
has overpaid,” Damodaran says. “But you know what word is even worse than ‘strategic’
in a price discussion? China! This is a ‘weapon of mass distraction’ that causes people to
add billions to a valuation.”
Warning signs. Many other factors cause “valuers” to “freak out” and become
“pricers.” Here is Damodaran’s current list of some typical warning signs:
• Early‐year negative cash flow. Damodaran refers to his new students who get stumped by negative
cash flow in the early years. “You need disproportionate positive cash flows in the later years, but unless
you’re stuck with the Gordon growth model as your only approach, the value is still driven by future
cash flows,” he says. A fixation on the earnings report from a startup firm is almost meaningless to the
valuation. “It’s like seeing one bad grade on your six‐year‐old’s school report card and concluding that
she’ll never go to college.” Instead, the real question is the determination of the point of maturity.
• Terminal growth rates. “No one goes out 10,000 columns in Excel to calculate value,” he says, so
eventually the growth rate has to settle into the perpetual economic growth rate and that judgment will
determine value.
• Valuations influenced by currency issues. This seems complicated because, for instance, the risk‐free
rate for the Swiss franc is currently 0.5%, and it’s around 9% for the Brazilian reals. This is because of
inflation. As a result, your cash flows for a Brazilian asset should be much higher for a comparable
company than they would be for a Swiss company where there’s actual deflation. You get to take the
higher cash flows, but then it’s taken away by a higher discount rate.
• Governance effectiveness. If the company stops producing value from growth, is the governance
structure capable of replacing management? Otherwise, “adding terminal value as ‘g’ gets closer to ‘r’ is
a pretend version of going to an infinite ATM machine,” Damodaran says.

达摩达兰警告“评估师”正在变成“定价者”
©BVR 7
• Effective tax rates carried into terminal value. A warning sign that “pricing” is occurring is the tax rate.
“Go ahead and use an effective tax rate such as 15% for the early years if you want,” he says. “But if you
leave the tax rate at that level in perpetuity, you have to assume also that management will end up in a
federal penitentiary.” And your terminal “value” will be actually a terminal “price.”
• Early entrepreneurial projections. Startups are among the worst places where pricing replaces
valuation. Startup managers often: (1) have no cash flows from existing assets; and (2) have no basis to
evaluate their risk, time to maturity, expected growth, or any other financial indicator. “It’s tough to
derive valuation metrics when the CEO is saying that they’re not sure they will survive until the end of
the month,” he concludes.
• Survival risk. “Discount rates were never devised to account for the risk of failure; they only work
for the going concern result,” he says. “But, for start‐ups, the survival risk is often 80% or more. After
that, you’re dealing with liquidation value, whatever the price is.”
• Maximum growth rates higher than risk‐free rates. “If you’re using 2.5% as your risk‐free rate now, the
maximum terminal growth rate you can use is also 2.5%,” Damodaran believes. “You can’t separate the
idea of inflation plus economic growth (currently best predicted in US dollars by the 10‐year T‐bill rate)
from the idea of terminal value” without moving into pricing decisions.
• Unique discreet risk. Damodaran mentions a recent valuation of a Venezuelan company that was
succeeding—and at the same time creating the risk that the government might nationalize it. The
question was whether to adjust the discount rate to reflect this risk—but he suggests that unique
situations such as this can’t easily be reflected in this manner. He suggests calculating the value and cash
flow without any consideration of unique risks such as this and then accounting for unusual discounts
separately afterward.
‘Quality growth.’ The concept of “quality growth” was an especially resonant segment
in the program as discussion ensued around how analysts conclude that a company is,
indeed, a true gem. Certainly, beyond the world of finance, “rarity” is commensurate with
the value placed on an object. And in the valuation realm “quality growth is a rare
exception,” Damodaran put forth.
He went on to define quality growth as a company’s success in reinvestment in itself
rather than gains from short‐term efficiencies or acquisitions. He shared his view that the
“narrative and the numbers” join together to tell the story behind any valuation because, he
explained, scaling up is hard to do. “Neither you nor I have the power to endow a company

Damodaran’s Warning Signs That a ‘Valuer’ is Becoming a ‘Pricer’
©BVR 8
with a high growth rate,” he says. “But, to grow fast, you have to reinvest a lot, and reinvest
successfully in multiple projects at the same time. This high return on investment is the
exception rather than the rule. Doing it as companies scale is even less likely—even the
Googles and the Apples eventually run out of steam.” Any “story” that culminates in truly
high returns on capital is a riveting tale achieving elusive—and very rare—quality growth.
Final point. For most business appraisers, the relatively “anchorless” bases used by
traders on price seem anathema. In fact, to be a “pure” valuer, Damodaran feels the key
personality traits of faith in value, patience, and immunity to peer pressure are essential.
“Understanding what makes you tick as a professional will allow you to pick the
approaches that reflect the fundamentals of value.”
To watch Damodaran’s stimulating and inspiring workshop, go to bvresources.com/pastevents.asp. The
webcast is entitled “Price and Value: Discerning the Difference, an Advanced Workshop.”
如何评估包含房地产的企业价值?
©IACVA(CHINA) - BVR 1
How Do You Value A Business That
Also Owns Real Estate?
如何评估包含房地产的企业价值?
翻译:葛朔(开元资产评估有限公司(北京)
评估工作的重难点是评估企业价值,其中更为复杂的是评估拥有房地产的企业。如何评估
拥有房地产的企业价值?
Franz Ross 是少数同时拥有房地产及企业价值评估资格证的专业人士,其持有 CBA,
CVA,以及MRICS,特别是在物业估值领域。Ross擅长评估拥有房地产的企业价值,如便利
店、饭店、宾馆、护理站、高尔夫培训班、采石场、电厂以及湖泊的商业价值。
尽管评估对拥有房地产的企业采用不同分类方法,但他们都面临因房地产的特殊性给予评
估工作的挑战。该挑战难点体现为分摊评估结果。评估人员需要按照房地产价值、家居及设备
(FF&E)以及商业价值对评估结果进行分摊。Ross是纽约 Buffalo 区 First Niagara Bank 的
副总裁,他认为分摊评估结果时应该立足于买方卖方的思考出发点,即买方更关注实物资产的
总价格,而非分配的单项价格。

How Do You Value A Business That Also Owns Real Estate?
©IACVA(CHINA) - BVR 2
数据匮乏:
评估人员评估拥有房地产的商业价值时,工作难点是收集交易案例数据,尤其是评估便利
店。现实房地产交易案例中,房地产通常是被卖方出租或者第三方房东出租。而很多知名房地
产交易案例数据库提供的案例信息仅能体现该房地产的商业价值,不能体现该房地产的房地产
价值。但 Pratt’s Stats数据库(www.bvresources.com/prattsstats) 能够很好的帮助解决此类
问题。另外 Pratt’s Stats数据库的优势是能提供设备的资本化率以及无形资产的资本化率。Ross
认为该数据库可以应用于超额收益模型(EEM),因为 EEM模型的核心是分解 EBITDA以及
投资回报率。
Pratt’s Stats 数据库最大的优势是可以获取可比的房产价格。所有的资料只能打印出来阅
读,在 Excel中下载并没有给出明细。表 1是数据库中的一份交易报告示例。“资产负债表财
务状况”能显示该交易的购买价是否可以分摊至具体单项。
表 1.房地产交易报告示例
买家 信息来源
标的名字 N/A经纪人 Coyle,Michael
商业描述 加油站里的便利店经纪人公司 CenterPoint Business Advisors
SIC行业编码 5411 零售店
NAICS行业编码 447110 加油站里的便利店
便利店位置 美国,NH区,Lincoln
运营时间 50
员工数量 5
利润表财务状况资产负债表财
务状况交易数据
是否是近整年的数据 是是否是近期数
据否交易开始日 2012.5.4
数据是否有被重述 否
是买卖双方是
否同意对购买
价进行分摊
是交易成交日 2013.4.26
利润表日 2011.12.31资产负债表日 2013.4.26销售天数 357
销售净额 $2,759,041现金及现金等
价物$0询价结果 $225,000
营业成本 $2,448,170应收账款 $0市场投资价值 $65,000
营业利润 $310,871存货 $41,471预计负债 $0
年付租金 $50,000其他流动资产 $0就业相关价值 $0
持有者补偿 $0其他流动资产
合计$41,471
不构成竞争的
价值$0
其他运营费用 $218,245固定资产 $65,000支付金额 $65,000
非现金支付的费用 $11,726房地产 $400,000销售股票还是 资产

如何评估包含房地产的企业价值?
©IACVA(CHINA) - BVR 3
资产
合计运营费用 $279,971无性资产 $0公司类型 S企业
营业利润 $30,900其他非流动资
产$0
是否有就业/咨
询合同否
利息费用 $12,596总资产 $506,471此交易是否有
潜在租赁否
EBT $18,304长期负债 $0租赁关系中是
否有续订权否
税费 $0总负债 $0
净利润 $18,304所有者权益 $506,471
交易信息
附注中是否有附加代价 无附注中是否有
个人担保无
条款
注意:固定资产购买价$65,000,房地
产购买价$400,000
潜在租期(月) N/A租赁形式 N/A
不构成竞争的时期(月) 60不构成竞争的
范围描述
加油站便利店周
边 40英里外
就业/咨询合同的描述
额外描述:
购买价的分摊情况:存货$41,471,固定资产$65,000,房地产$400,000,总资产$506,471;房地产为 72英亩,2,612平方英尺的建筑物。加油站预
计需要投入$120,000
评估乘数 盈利比例 杠杆比率
MVIC/net sales(MVIC
为market value of
invested capital)
投入资本的市场价值/净
销售额
0.02边际净收入 0.01固定费用偿付
比率2.45
MVIc/gross profit
投入资本的市场价值/毛
利0.21边际运营费用 0.01长期负债/资产 0
MVIC/EBITDA
投入资本的市场价值
/EBITDA
1.52边际毛利 0.11长期负债/所有
者权益0
MVIC/EBIT
投入资本的市场价值
/EBIT
2.1资产回报率 0.04
MVIC/Discretionary 1.52所有者权益回 0.04

How Do You Value A Business That Also Owns Real Estate?
©IACVA(CHINA) - BVR 4
Earnings
投入资本的市场价值/自
由支配的收入
报率
MVIC/Book Value of
Invested Capital
投入资本的市场价值/投
入资本的账面净值
0.13
盈利 流动比率 营运比率
EBITDA $42,626流动比率 N/A总资产周转率 5.45
Discretionary Earnings
自由支配的收入$42,626速度比率 N/A
固定资产周转
率42.45
存货周转率 66.53
找到类似可比报告后,在投入资本的市场价值中增加房地产价值,评估人员可以得到拥有
房地产的企业商业价值。如果持有方可以有租金收入,需要在 EBITDA的金额调增租金金额,
得到 EBITDAR。由 EBITDAR 除以 (投入资本的市场价值+房地产价格)可得到投资该企业
的投资回报率
数据使用时注意事项
Ross提到他近期了解到的评估人员错误使用数据库的案例:房地产评估人员在计算可持
续经营状态下健身中心的投资回报率时,评估主体是含房产的房地产价值,但从数据库中选择
的可比案例均不含房地产的房地产价值。同时房地产评估人员在计算投资回报率时,没有考虑
该房地产所带来无形资产的商业价值。
Ross 表示在计算 EBITDAR 时,评估人员需要调整持有者的补偿金额。根据评估主体的
商业价值,持有者的佣金范围灵活,因此持有者补偿金额范围也灵活不确定。但是评估人员应
该按照可比的市场价格调整持有者补偿金额,即按照雇佣同级别经理的金额进行补偿。
假设市场中有两家宾馆,这两家宾馆具有相同的收入以及费用,且均配备 100个房间。但
第一家宾馆持有者补偿金额是 30,000美元,第二家宾馆的持有者补偿金额是 150,000美元。评
估人员的工作是将费用标准化。假定市场中宾馆的毛利为 100,000美元,因此第一家宾馆的持
有者补偿金额需要调增 70,000美元,宾馆 EBITDAR 减少 70,000美元;第二家宾馆的持有者
补偿成本需要减少 50,000美元,宾馆 EBITDAR增加 50,000 美元。分别进行调整后,这两家
宾馆的盈利才跟市场情况趋同,其 EBITDAR具有可比性。
Ross表示他对拥有房地产的企业进行商业价值评估时会利用Pratt’s Stats数据库中查到的
租金信息以及房产的投资回报率信息。基于 Pratt’s Stats数据库庞大的数据信息,且在评估假

如何评估包含房地产的企业价值?
©IACVA(CHINA) - BVR 5
设房地产能够持续经营环境下,他能够得到该条件下房地产价值以及相应的投资回报率。但同
时他也表示由于该方法存在假设前提,他仅在二次以及三次复核时会采用此方法。
在市场交易中,买方卖方会就持续经营总价会进行激烈讨论。但上述方法在确定房地产价
值和商业价值分摊比例时不具有普适性。买方卖方可能会为了增加房地产价值以及商业贷款金
额,刻意增加房地产分摊比例(降低商业价值)。在某些情况,买方卖方也会为了特殊目的降
低房地产分摊比例(增加商业价值),如买方为了少向当地税务机关申报应纳税金额。需要注
意的是,卖方的应交所得税政策也会影响分摊比例。
总金额的分摊:
评估人员应注意分摊可持续经营状态下的评估总金额。例如针对会计核算以及财务报告用
途的购买价分摊。如企业向银行筹资,有些地区的法律法规仅限制企业房地产的贷款比例(LTV
贷款/金额),不限制银行对家具设备以及无形资产贷款比例。尽管在实际操作中,银行也会
就企业拥有的家具设备以及无形资产发放贷款。
Ross提倡使用调整后的超额收益模型。他构建的模型(TEEM)较其他调整后的超额收益
模型有相似之处,但不同之处是他的模型可以清晰的体现单项价值、收入成分以及投资回报率。
具体对比可以参见“Pratt and Niculita’s Valuing a Business”。
2012年 6月,Ross在 BVR官网就该模型发布简单的案例解释文章,文章解释资产的组成、
拥有房地产企业的商业价值以及分摊的单项金额。这一目的是为了帮助行业内人员更好地理解
该模型。
假设评估人员需要对面积为 1500平方英尺,具有商业价值和房地产价值的便利店评估。
已知该便利店临近旅游线路,交通流量是 14,000 辆每天。与该便利店具有竞争关系的是半英
里处的一元店,但两家商店的竞争力不激烈。预计便利店周边近期不会开办新的零售商店。已
知该便利店状况良好,已于 3年前完成重大装修改造。便利店配备新的地下油料管道。便利店
所属地区的平均租金为每平方英尺 45美元。
拥有房地产的商业价值评估
该便利店备考毛利是 475,000美元,利润乘数是 2.5。因此该商铺的价值是 1,187,500美元,
总运营费用约为 312,000美元,预计 EBITDAR为 163,000美元。根据 Pratt’s Stats数据库查到
的可比案例,该商铺的资本化率为 13.5%(7.41*EBITDAR乘数)。据此得出该便利店的评估
值为 1,207,400 美元(163,000/0.135)。基于 GPM 权重是 40%,EBITDAR 资本化率权重是
60%,得出该商铺价值约为 1,200,000美元。因此有效资本化率为 13.58%。
表格 2是对上述案例的解释。

How Do You Value A Business That Also Owns Real Estate?
©IACVA(CHINA) - BVR 6
首先分项解释案例中使用的数据:
备考 EBITDA:表格最后一栏的数据为根据历史数据分析得到的标准 EBITDAR,即
163,000美元。
房地产租金:已知此类便利店经常用于出租,通过对该地区的市场可比案例分析,得知便
利店租金为 45美元每平方英尺(租金信息来源包括 LoopNet‐美国最大的在线商业房产租售网
站)。根据 Pratt’s Stats 数据库,可得租金/毛利的比例。因此备考租金为$45 * 1,500 = $67,500。
房地产投资回报率:在 CoStar数据库中可以获取便利店的房地产投资回报率。大部分房
地产投资回报率为 7%~8%。根据便利店售卖的物品可以得知其房地产投资回报率为 8.5%。考
虑到房地产租金(67,500美元)未考虑空置以及预留情况,因此需要在此基础增加 100基点的
溢价,得出房地产投资回报率为 8.5%+1%=9.5%。
房地产价值:根据租金以及房地产投资回报率,得出房地产价值为 710,000$。
($67,500/0.095)。
家具设备价值:资产负债表显示折旧是$160,000
家具设备的收入: Ross 提出由于家具设备的使用寿命短于房地产,因此家具设备的投资
比房地产投资风险高。在本案例,评估人员没有在 EBITDAR中剔除空置量。因此简化计算投
资回报率的方法是在房地产投资回报率中增加风险溢价,同时结合偿债基金公式计算更新设备
所需资金,即在房地产投资回报率的基础上溢价 300~700基点。本案例的处理方式是在房地产
Exhibit 2. 合计超额收益模型 (TEEM)
加油站下设便利店
房地产价值 家具设备&私
人资产
无形 资产以
及分摊商誉
基于商业价值的房地产价
值
1A 评估价值 $710,000
V=I/R
$160,000
折旧成本
$330,000
独立计算
$1,200,000
根据权重计算
2A EBITDAR
分摊
$67,500
1,500SF @
45/SF
$23,200
I=V*R
$72,300
超额收益
$163,000
备考 EBITDAR
3A 资本化率 9.50%
基于 市场计
算的租金比例
14.50%
租 金 比 例
+500基点
21.91%
R = I / R
13.58%
R = I / V

如何评估包含房地产的企业价值?
©IACVA(CHINA) - BVR 7
投资回报率基础上增加 500 基点,即投资回报率为 14.50%。因此可得到家具设备在备考
EBITDAR分配金额为 23,200$,即$160,000 * 0.145。
无形资产价值:除了无形资产外,其余单项价值已从总价中分摊出。因此可以利用总价扣
减单项资产,计算无形资产价值。RECE总价—房地产价值—家具设备=$330,000
无形资产投资回报率:通过上述溢价部分数量以及溢价金额,我们可以计算得出无形资产
的投资回报率,即$720,000/$330,000=21.91%。一般商誉的投资回报率为 20%~30%。因此计算
得到的投资回报率(22%)具有合理性。
利用此超额收益模型有如下优点:
逻辑:该方法是基于在房地产评估理论和商业评估理论。
灵活:模型用途灵活,不单一。评估人员可结合其他评估方法得到评估模型中的变量。 利
用 TEEM 模型可以分配总价,计算投资回报率,并对 EBITDAR分配。TEEM模型也可用于
复核其他模型的评估结果。
协同作用:当进行合理假设,评估人员可以得到合乎逻辑且可信的结论。
房地产评估人员可以使用 Pratt’s Stats数据库评估拥有房地产的企业商业价值。考虑到该
企业涉及无形资产,因此评估人员可以通过评估房地产以及房地产商业价值,评估小型企业无
形资产。

How Do You Value A Business That Also Owns Real Estate?
©BVR 8
How Do You Value a Business That Also Owns Real Estate?
Valuing a business is difficult enough, but when you throw real estate into the mix you have an
even more complex assignment. Where does the value of the business stop and the value of the real
estate begin?
Franz Ross, CBA, CVA, MRICS, one of few appraisers credentialed in both real estate and
business valuation, specializes in the valuation of such properties. Variously referred to as complex
properties, special purpose properties, or—Ross’s preference—real estate‐centered enterprises (or
RECEs), they typically include properties such as convenience stores, restaurants, hotels, nursing
homes, golf courses, quarries, power plants, and the like.
Whatever you call these entities, they present a challenge to business valuation experts and real
estate appraisers alike. The difficulty is in allocating the overall going concern value into its three
components: (1) the real estate; (2) the furniture, fixtures, and equipment (FF&E); and (3) the
business enterprise. Ross, a complex asset specialist and vice president at First Niagara Bank, N.A.,
Buffalo, N.Y., points out that, while allocations are important, the total value is foremost in the
minds of the buyer and seller. “When someone is buying, they’re really not worried about the
allocations—they look at the total price,” he says.
Scarce data. For appraisers, finding the data for comps is difficult. Some property types, such
as convenience stores, are especially challenging. But “Pratt’s Stats
(www.bvresources.com/prattsstats) is an excellent source for this property type (and others) since
none of the well‐known real estate data sources publishes these data,” says Ross. “Most Pratt’s Stats
transactions do not include real estate, since usually only the business assets are acquired, with the
real estate being leased either from the seller or from an unrelated landlord. For this majority of the
transactions, Pratt’s Stats is an excellent source for adopting a capitalization rate for the equipment
and the intangible assets acquired.” Segmenting of EBITDA and cap rates by asset type is central to
the excess earnings method (EEM) that Ross advocates.
“But the jewels in Pratt’s Stats are the comps where the real estate is known to have been
acquired along with the business assets,” Ross continues. “You have to print out the comps and
read them. Doing a download in Excel won’t give this detail.” Exhibit 1 has an example of a
transaction report from Pratt’s Stats that includes real estate. In the “Asset Data” section, if the deal
is checked to be a purchase price allocation and there’s a figure on the real estate line, that dollar
figure is the allocated value of the real estate.

如何评估包含房地产的企业价值?
©BVR 9
“When you find a comp like this, you need to add the real estate price to the published MVIC
price to get the total price of the RECE,” Ross says. “Also, if there was a rent (perhaps there is a
related real estate holding company), the rent should be added back to EBITDA to create EBITDAR.
The cap rate for the RECE can then be found by dividing EBITDAR by (MVIC + Real Estate Price).”
Take caution with the data. Some real estate appraisers are using Pratt’s Stats, but they are not
using it correctly. “I saw a recent example of a fitness center where they used Pratt’s Stats in the
appraisal as their source for the cap rate for the going concern—including the real estate,” he says.
“The trouble was, they neglected to notice—or decided it wasn’t important—that virtually all of the

How Do You Value A Business That Also Owns Real Estate?
©BVR 10
comps didn’t include real estate.” They also neglected to use the plentiful data in Pratt’s Stats to
estimate a realistic cap rate for the business value (intangibles).
Ross notes that, when making adjustments to arrive at EBITDAR, you may need to adjust the
owner’s compensation line. Owners can and should pay themselves as much or as little as they
want, subject to the ability of the business to pay the compensation. But appraisers need to adjust
the owner’s comp to the market cost to hire a general manager to take on the role typically fulfilled
by the owner. Ross gives this example:
Consider two 100‐room hotel comparables that generate identical revenues and expenses
except that the owner of one hotel draws just $30,000 in compensation and the second hotel owner
draws $150,000. It is the appraiser’s job to normalize this expense. If the market total compensation
for a hotel GM is $100,000, then the first hotel needs to adjust the compensation upward by $70,000,
which will reduce that hotel’s EBITDAR by the same amount. The second hotel would need to
make a $50,000 downward adjustment to owner comp, increasing EBITDAR by a like amount. The
true profitability of both hotels is now adjusted to market, and their EBITDAR will now also be
identical.
“I will also sometimes impute a real estate value when Pratt’s Stats shows the rent [when the
real estate did not sell] and I have good data for real estate cap rates for that type of property,” he
says. “By imputing a real estate value, I can estimate a somewhat hypothetical total going‐concern
value, and total going‐concern cap rate, since Pratt’s Stats has plenty of data with which to calculate
the cap rate on the business assets. But I don’t use this technique except as a second or third check
on value, since it uses a hypothetical real estate value.”
In a market transaction, the total going‐concern price is arrived at only after intense
negotiations between buyer and seller. Ross warns that the same statement cannot necessarily be
made regarding reported asset allocations. The buyer and seller might have agreed to a very high
real estate allocation (and corresponding low business asset allocation) to maximize the real estate
value and the bank mortgage loan. In other situations, the driving force on allocations may be to
minimize the real estate value (and maximize the value of the business assets) for the sole purpose
of fooling the local tax assessor into not raising—or to minimize the increase to—the property’s
assessed valuation, thereby minimizing future property taxes for the buyer. Income tax
considerations of the seller also may impact allocations.
Allocating the total value. Allocation of the total going concern value into its components is
important for several reasons. One is purchase price allocation for accounting and reporting

如何评估包含房地产的企业价值?
©BVR 11
purposes. Also, there’s the issue of financing, as Ross mentions. Regulations require banks to
adhere to loan‐to‐value (LTV) considerations on real estate only. The regulations do not consider
LTV for FF&E or intangibles (though banks may also loan against those assets).
Ross is a proponent of the excess earnings method, and he designed a model that he calls the
total excess earnings model (TEEM). His model is similar to other EEM models, as detailed in Pratt
and Niculita’s Valuing a Business,1 except that his model clearly shows where each value, income
component, and cap rate were derived.
The best way to illustrate this methodology is by example. Ross presented a similar example
during a BVR webinar in July 2012.2With this information and the development of cap rates for the
component assets, the total value of the RECE and allocations may be estimated.
You are appraising a 1,500‐square‐foot convenience store, including real estate and business.
The property is on a well‐travelled route, and traffic counts are 14,000 vehicles per day. The nearest
competitor is a dollar store a half mile away. Competition is considered moderate, and no new retail
development is planned in the immediate neighborhood. The store is in good condition and
received a significant remodel three years ago. New underground fiberglass fuel tanks were also
installed. An analysis of rents for C‐stores indicates smaller stores in your area average $45 per
square foot net rent.
RECE valuation. Pro forma gross profits are $475,000, and data from Pratt’s Stats indicate a
gross profit multiplier of 2.5x, which indicates a value of $1,187,500. Total operating expenses are
estimated at $312,000, resulting in forecasted EBITDAR of $163,000. Pratt’s Stats has several RECE
comps, and the capitalization rate indicated for the subject by these comps is 13.5% (which is a 7.41x
EBITDAR multiplier). The capitalization of EBITDAR results in a value of $1,207,400 (163,000/0.135).
Giving 40% weight to the GPM and 60% weight to capitalization of EBITDAR results in a reconciled
value of $1,200,000 (rounded). The effective capitalization rate is slightly higher, at 13.58%, after
reconciling the two approaches to value.
Exhibit 2 has the completed filled‐in model for this example. The inputs and calculations are
summarized first. (Note: The numbers given for this example are only used for illustrative
purposes.)
Combined pro forma EBITDA. The last column shows the total normalized EBITDAR of $163,000
that was developed from the historical financials and analysis of the local market.
Real estate rent. C‐stores are often leased, and analysis of regional comparable data indicates

How Do You Value A Business That Also Owns Real Estate?
©BVR 12
rent for the subject at $45 per square foot, net for the 1,500‐square‐foot store. Sources for rents
include Loopnet. Pratt’s Stats can also develop rents based on the metric: rent as a percentage of
gross profit. Pro forma rents are $45 × 1,500 = $67,500.
Real estate cap rate. Real estate cap rates for C‐stores can be found at CoStar. Cap rates for most
real estate property types are currently in the 7%‐to‐8% range. Data indicate 8.5% would be typical
for a leased C‐store that sells. A premium of 100 basis points is added to account for the fact that the
rent of $67,500 has not been discounted for a vacancy rate or reserves, as real estate appraisers
typically do. Therefore, our cap rate is 8.5% + 1% = 9.5%.
Real estate value. Using the rent allocation and the real estate cap rate, the value of the real estate
component is $710,000 ($67,500/0.095).
FF&E (equipment) value. Our subject’s balance sheet shows a depreciated cost of $160,000, and
this is considered reasonable.
Income to FF&E. Ross notes that FF&E cap rates are riskier than real estate cap rates because
these assets have shorter lives than real estate. In this example, reserves are not subtracted from any
EBITDAR columns. A simplified method to calculate the cap rate is to add a premium over the real
estate rate to account for the sinking fund needed to replace equipment as necessary. The premium
range is 300 to 700 basis points over the real estate cap rate. A premium of 500 basis points is
adopted in this example, resulting in a cap rate of 14.50%. Applying this rate to the value of the
FF&E results in a pro forma EBITDAR allocation of $23,200 to this component ($160,000 × 0.145).
EBITDAR allocation to intangibles. This is the “excess earnings” that give the TEEM model its
name. From the combined pro forma of $163,000, subtract the income to the real estate and FF&E,
which results in excess earnings of $72,300.

如何评估包含房地产的企业价值?
©BVR 13
Value of intangibles. All allocated values are known except for the intangible business value. This
missing puzzle piece is found via subtraction (total RECE value less the value of real estate and
FF&E) and is $330,000.
Intangibles cap rate. This cap rate is calculated by the model, as we already know the amount of
excess earnings and the value of the excess earnings. The calculation is $72,300/$330,000, which
equals 21.91%. Typical goodwill cap rates are usually in a range of 20% to 30%. With the subject at
22%, this appears to be a very reasonable number.
The use of the excess earnings method has a number of advantages:
Logical: The method is grounded in both real estate‐ and BV‐accepted appraisal theories.
Flexible: There is no single way to use the model. The appraiser should input values found via
other approaches. You can solve for whichever variables are most difficult to find the necessary
data. TEEM will find the missing inputs (which may be component values, cap rates, or the
allocation of EBITDAR). TEEM can also be used as a test of allocation methods used by others.
Synergistic: The model has the feel of a Rubik’s Cube or jigsaw puzzle. When reasonable
assumptions are made, logical and believable conclusions follow. The pieces of the puzzle almost
magically fit together.
Real estate appraisers are becoming more familiar with sources such as Pratt’s Stats to help
them appraise RECEs. Meanwhile, the recent requirement for more business valuations from
designated business valuators by the Small Business Administration (SBA) has made it necessary
for them to gain a greater understanding of real estate and of the combined value of the
components of a RECE. It’s important to recognize that the valuation of the intangible assets is
somewhat hypothetical when it is a part of a larger sale of a RECE, including real estate.
Annotation
1. Shannon P. Pratt, with Alina V. Niculita, Valuing A Business—The Analysis and Appraisal of Closely
Held Companies, 5th ed. (New York: McGraw Hill, 2008), 331‐348.
2. “Challenges in Valuing Real Property: What to Do When a Business Owns Real Estate,” Franz Ross
and Alina Niculita, presenters, July 19, 2012. An archived version of this webinar is available at
www.bvresources.com/pastevents.asp.
帮助客户最大化实现并购协同价值
©IACVA(CHINA) - BVR 1
Help Clients Squeeze the Most ValueOut of M&A Synergy
帮助客户最大化实现并购
协同价值
翻译:文豪,王思遥(中南财经政法大学)
程永海(银信资产评估有限公司浙江分公司)
随着经济的发展,企业并购活动也逐渐增多。一些公司收购其他公司,是因为他们认为把
两家公司合并,能够带来公司价值的增长。通过分析交易预期产生的各种协同效应,评估师能
够帮助买方确认他们期望得到的价值。
你可能会问:识别和评估所有潜在的协同效应有何意义?毕竟,买方没有兴趣为卖方摆在
桌面上的所有东西付钱。为什么不直接评估目标公司的公平市场价值?
回答这个问题最好的方法就是通过一个例子来说明。全球商业咨询公司 FTI 咨询公司的
Jeff Litvak 和 Brent Miller 向我们提供了一个假设的案例研究,展示了这种方法的关键概念和优
点。两人都在芝加哥的 FIT 执业,Litvak 是董事总经理,Miller 是资深总监。他们介绍的这个
案例研究,是最近进行的企业评估资源网络研讨会的一部分。
首先,有三种不同的协同:成本,增长和财务。每一个都要单独地进行检查和评估,因为
他们有不同的风险特征。并且,合并后的有些变化根本不是真正的协同,而是与控制权有关,
需要单独进行审查。这个案例研究侧重于确定和估算实际的协同效应。
案例背景
买方公司和卖方公司都是美国的汽车零部件制造商。吸引买方的是卖方在南美恰好有一个
分销网络。买方公司已经确定卖方公司 4 千万美元的独立价值,也就是说,不考虑买方可能带

Time-Tested Ways to Build a Defensible Divorce Valuation
©IACVA(CHINA) - BVR 2
来的任何变化或协同效应。如果买方进行了收购,它打算做一些不同的事情来创造价值:
增记卖方资产价值获得折旧费用增加的好处
通过削减一些后台任务来减少卖方一般行政管理成本
重新与卖方的一些供应商进行谈判,以获得更优惠的条件
加强卖方的营销工作
利用卖方在南美的分销网络在该市场上推出新产品
从“控制”变革着手
第一步是从买家正在寻求的改变入手。这些改变代表着协同价值和控制价值。协同价值是
通过两个公司的整合而产生的,也就是说,价值只能通过两个实体的实际组合来实现。而控制
价值不需要通过两个实体的实际组合就可以实现的。
在这个案例中,第一个改变是增记卖方的资产账面价值,这是一种协同效应,它基于收购
方必须实际整合企业以真正从折旧费用增加中获利。第二个改变是消减一般行政管理成本,这
也是一种建立在实际整合基础上才能产生协同效应。
重新谈判卖方的供应商合同则更像是一个控制变革,因为没有迹象表明必须整合公司才能
实现这一点。同样,加强卖方的营销工作也是一项控制变革,因为它不需要整合。另一方面,
使用卖方在南美的分销网络推出新产品是一种协同效应,买方需要将该网络整合到现有的运营
中来执行此策略。可以说,协同与控制这两个问题的界限并不总是明确的。这取决于具体的情
况和事实。协同效应的一些变化可能与控制有关。例如,买方并不总是需要通过整合卖方才能
降低一般行政管理成本。有时是卖方存在一些浪费且效率低下的做法,仅通过卖方现有的后台
业务精简就可以实现一般行政管理成本节约,而无需将卖方和买方整合起来。这是一个潜在的
控制变革而不是协同效应的例子。
同样,如果你认为两家公司的整合可以提供额外的购买力和杠杆作用于谈判中使得可以重
新谈判供应商合约,这就是协同变革而不是控制变革。
因此,需要仔细地审视那些你试图想要公司作出的变化(那些能为公司创造价值的变化)
的具体内容。关键的一点在于,目标公司是基于自身产生的变化,还是因为收购其他公司而引
起的重大变化。这是判断是否是控制变革还是协同变革的基准。
所以你做的哪些变革与控制价值相关?这些价值和与之相关的资本会根据卖方的加权平
均资本进行贴现。然而,这就假定了与之相关的风险不会低于也不会高于卖方的整体风险。这

帮助客户最大化实现并购协同价值
©IACVA(CHINA) - BVR 3
样做的原因是这些变革是为了改善目标公司而不是整合在一起。因为他是你的目标,你就要弄
清楚实现控制改进的风险是什么。
不同的风险水平。一旦确定了不同类型的变革和协同效应的收益,下一步就是确定与每个
协同作用相关的风险水平。在这种情况下我们确定了三种不同的协同效应:成本、增长和财务。
通常,财务协同效应(某种情况下的税收优惠)的风险较低,成本节约的风险会高一些。另一
方面,增长协同效应可能代表着非常高的风险。比如,对于买方公司来说在全新的市场上推出
全新的产品的风险是非常高的。
因为有不同程度的风险,所以不能简单地用基础的协同效应评估方法。你需要对每种协同
效应进行评估。在本案例研究中,假定买卖双方的加权平均资本分别为 10%和 16%。当公司
整合起来时,整合后的公司加权平均资本成本则为 12%。
财务协同效应。在该案例中,第一个好处就是能获得税收协同效应。在未来三年,增记资
产将每年增加折旧费用 600 万美元。你需要考察能够实际利用折旧增加的可能性,来确定与协
同效应相关的风险水平。
在本案例中,买方的税前收入一直超过 1500 万美元,大于每年所预期增加的折旧费用 600
万美元。这表明实现税收节约的风险相对较低。但是这并不是实际确定的。如果买方的税前收
入一直为 1 亿美元,而且没有预期收购卖方公司将降低收益,情况将有所不同。在这种情况下,
税前收入远远超过 600 万美元的额外折旧费用,就可以肯定地确定税收优惠完全能够实现。
但是在这种情况下,因为税前收入并没有高得多,所以存在一定程度的风险。基于此,在
这种情况下,你所面临的风险与买方偿债能力相关的风险是可比的。因此,用来折现税收协同
效应产生的现金流量的折现率,应该是合并后公司的债务成本。
需要注意的是,使用的是合并后公司的债务成本,而不仅仅是买方公司的债务成本,因为
协同效应涉及到两个企业的组合。你需要根据两个企业合并在一起后面临的不同风险来确定这
些相关现金流的风险。
削减成本的协同作用 下一个协同分析是买方计划通过消减卖方的一些后台运作(如:
会计、人力资源、采购)以期达到成本降低的目的。买方预计与这种变化有关的任何节约的实
现至少还需要两年。另一问题是:这种协同效应的实现到底存有多大风险?在这种情况下,这些削
减成本的特别努力与其他一体化公司制定的成本削减措施相较而言,不会特别复杂。因此,你
会认为实现这些成本削减措施与公司投资资本的现金流的风险水平不相上下。所以,你就会考
虑把合并公司的加权平均资本成本用于削减成本产生的现金流的折现。
在这种情况下,由于买方预计需要两年才能降低一般管理费用,所以在头两年,预计不存在
协同效应(见表 1)。并且,所利用的折现率是整合后的公司 12%的加权平均资本成本,而非买

Time-Tested Ways to Build a Defensible Divorce Valuation
©IACVA(CHINA) - BVR 4
成本节约型协同效应的预测 第一、二年没有协同价值,这段时间留给企业实现协同效应
第一年 第二年 第三年 第四年 第五年 永续价值
预计的节约成本 $ ‐ $ ‐ $ 1.0 $ 1.1 $ 1.1
受影响后的现金流 $ ‐ $ ‐ $ 0.6 $ 0.6 $ 0.7 $ 7.6
折 现 后 的 现 金 流
(@12%)
$ ‐ $ ‐ $ 0.5 $ 0.4 $ 0.4 $ 4.5
企业价值 $ 5.8
以合并后公司的 WACC12%折现而不是买方的 10%
方 10%或卖方 16%的加权平均资本成本。当你发现与这一变化相联系的风险与整合后的公司
整体有关时,你就应当关注整合后的公司。
新产品/市场协同
在该案例中,最后的协同效应来自使用目标公司现有的分销网络。买方购买目标公司的目
的是期望在新市场中推出一个新产品。
买方通过市场调查发现,购买汽车零部件的顾客也恰好是山地车爱好者,因此认为,存在
向购买其汽车零部件的顾客出售山地车的机会。通过这个特别的并购,他们将有机会在南美山
区销售山地自行车。
这种协同作用的风险有多大呢?首先,这是一个全新的产品,而非现有产品线(汽车零部
件)的一个品类。对于买方而言,这完全是新业务,同时,它也是在一个完全不同的市场区域
图示 1. 案例研究——成本降低型协同效应
新产品/市场协同效应
第一年 第二年 第三年 第四年 第五年 永续价值
因投入资本而产生的自由现金
流
$ 0.3 $ 0.6 $ 1.1 $ 1.4 $ 1.7 $ 6.5
折现后的现金流(@30%) $ 0.3 $ 0.4 $ 0.6 $ 0.6 $ 0.5 $ 2.0
企业价值 $ 4.3
由于买方公司要在一个全新的市场推行一个全新的产品会产生较高的风险,导致较高的折现率
不应该以买方、卖方或合并后公司的 WACC作为现金流折现的折旧率
展示 2. 案例研究——新产品/市场协同效应

帮助客户最大化实现并购协同价值
©IACVA(CHINA) - BVR 5
(买方的市场主要在美国)。以上两个因素加在一起表明,这是一个高风险项目。因此,它适
用一个相对高的 30%的折现率或者更高,这一折现率相当于风险投资的回报率。这样处理是合
适的,因为一个新产品进入一个新市场所面临的风险是非常大的。
表 2 显示了如何从一个新的风险投资项目中评估预测的协同效应的现金流。投资资本的自
由现金流和预测的现金流的增长用 30%的折现率进行折现。。因为这个项目是高风险的,它与
买、卖双方或合并后的公司现有的业务均不同。你无法判断加权平均资本成本或权益资本成本,
或者任何与独立实体和合并后公司有关的资本成本。因此,你必须使用一个更高风险水平的折
现率,因为它与已有的业务线如此不同。
当完成了对潜在的收购的不同类型协同效应的分析与评估后,买家就可以在谈判桌上使用
这些信息了。
谈判的力量
拥有协同价值的知识,买家就能够更好的在谈判中掌握主动权。这一信息影响买家能否采
取强硬手段并实现预期协同效应的全部价值,或能否在谈判最后作出少许让步以促使交易顺利
进行。
有些涉及到买方希望作出变革的情况,会让卖方处于更有利的谈判地位。这种情况通常与
两种不同的控制相关的变革有关,一是与卖方的供应商重新谈判合同,二是增强和改变市场营
销努力。理论上讲,任何买家都可以参与进来收购公司,实施这些变革并创造价值。因此,这
就使得买方更难提取控制变革所产生的全部价值。
你还需要考虑,协同效应是否仅与特定的买方有关,还是任意其他买方都可以获得的。如
果很多买家都有可能实现同样的协同效应,那么就会让卖方拥有更多谈判能力。卖方会试图为
其自身或股东拿走这些协同价值的一部分,因为他可以吸引更多的买家相互竞争,从而抬高价
格。
例如,这种情况下你可以假设许多潜在的买家都可以实现税收利益,因此卖方就拥有了许
多谈判能力,这些谈判能力与维持或者攫取税收利益有关。
相对应的,其他一些潜在的变革可能让买家具有更强的议价能力。如果买方拥有某种特别
优势使卖方的运营融入其现有的基础设施中以实现成本节约,那么买家将掌握议价主动权。在
这种情况下,买家就更有可能从收购中提取更大价值。同样,如果特定的买方是唯一有机会能
够在新市场推出新产品而产生协同价值的企业,那么买方将能够获得并保留最大价值。
如你所见,评估一项潜在收购的不同协同效应有利于并购谈判,可以帮助买方获得最大利
益。

Time-Tested Ways to Build a Defensible Divorce Valuation
©BVR 6
Help Clients Squeeze the Most Value Out of M&A Synergy
As the economy improves, M&A activity increases. Companies buy other companies because
they expect an increase in value triggered by the combination of two firms into a new entity. One
way valuation analysts can help ensure that buyers get the value they expect is to analyze the
various synergies a deal is expected to generate.
You may be asking: What’s the point of splitting out and valuing all of the potential synergies?
After all, the buyer is not interested in paying the seller for anything that the buyer is bringing to
the table. Why not simply value the target company on a fair market value stand‐alone basis?
The best way to answer this question is to go through an example. Jeff Litvak and Brent Miller,
both with FTI Consulting, a global business advisory firm, provide us with a hypothetical case
study that demonstrates the key concepts and benefits of this approach. Litvak is a senior managing
director and Miller is a senior director, both with FTI’s practice in Chicago. They presented this case
study as part of a recent BVR webinar they conducted.
First of all, there are three different types of synergies: cost, growth, and financial. Each needs
to be examined and valued separately because they have different risk characteristics. Also, some of
the changes that will come about with a merger are not really synergies at all but instead relate to
control, which is examined separately. The case study example focuses on the identification and
valuation of actual synergies.
Proposed acquisition. Buyer Co. and Seller Co. are both U.S.‐based auto parts manufacturers.
But one of the attractions for Buyer Co. is that Seller Co. happens to have a distribution network in
South America. Buyer Co. has determined that Seller Co. is worth $40 million on a stand‐alone basis,
that is, without regard to any changes the buyer may make or synergies that may be triggered. If it
makes the acquisition, Buyer Co. envisions a few different things it could do to create value:
Write up the seller’s assets to achieve some benefit from increased depreciation expense;
Eliminate a portion of the seller’s G&A by absorbing some of the back‐office tasks;
Renegotiate some of the seller’s supplier contracts to get more favorable terms;
Expand the seller’s marketing efforts; and
Use the seller’s distribution network in South America to launch a new product in that market.

帮助客户最大化实现并购协同价值
©BVR 7
Break out ‘control’ changes. The first step is to break out what changes Buyer Co. is looking to
make that would represent a synergistic value versus a control value. A synergistic value is one
created by the integration of the two firms, that is, the value can only be realized by an actual
combination of the two entities. A control value is one that can be achieved without having to
actually combine the two entities.
In this case, the first change—writing up the seller’s assets—is a synergy based on the fact that
you have to actually integrate the firms to really get the benefit of the increased depreciation
expense. The second change (eliminating some G&A) is also a synergy based on the fact that it
requires integration.
Renegotiating the seller’s supply contracts is more of a control change because there is no
indication that you would need to integrate the firms to accomplish this. Likewise, expanding the
seller’s marketing efforts is a control change because it does not require integration. On the other
hand, using the seller’s distribution network in South America to launch a new product is a
synergy—you need to integrate that network into your existing operation to carry out this strategy.
As you may be able to tell, the issue of synergy versus control is not always so clearly defined.
It depends on the facts and circumstances of the particular situation. Some changes that appear to
be a synergy may really be related to control. For example, a buyer does not always have to
integrate the seller firm to reduce G&A costs. There simply could be a lot of waste and inefficiency
such that a streamlining of the seller’s existing back‐office operations could do the trick without
having to combine the seller’s departments with the buyer’s. This would be an example of
something that could potentially be a control change instead of being a synergy.
Similarly, if you think you will be able to renegotiate the supplier contracts because the
integration of the two companies will give you additional buying power and leverage in
negotiations, it could be more of a synergy change than a control change.
You need to look closely at the specifics of what you are trying to change about the company
that is going to generate value. The question to ask is whether the target company can generate the
change on its own or whether it is a change in which the buying company plays an essential role.
That is really what is going to make the determination of whether it is a control change or a synergy
change.
So what do you do with the changes that you determine are related to control value? Those
changes and the capital associated with them are discounted based on the seller’s weighted average
Time-Tested Ways to Build a Defensible Divorce Valuation
©BVR 8
cost of capital. This, however, assumes that the risk associated with it is not particularly higher or
lower than the seller’s overall risk. The reason you do this is that those changes relate to improving
the target company as it stands rather than integrating it together. Because of the fact that it is the
target as it stands, that is where you would look to figure out what the risk of achieving that control
improvement would be.
Different risk levels. Once you have identified the different types of changes and benefits that
you identify as synergies, the next step is to figure out the level of risk associated with each synergy.
In this case, we identified the three different types of synergies: cost, growth, and financial. As a
general rule, financial synergies (such as the tax benefit in this case) are going to be something that
is a lower risk proposition. Cost‐saving synergies are going to have a little bit higher risk. On the
other hand, growth synergies can represent a very high risk. For instance, in this case, putting out a
completely new product in a completely new market is something that can be very risky for the
buying company.
Because there are different levels of risk, you can’t simply go to the basic synergy valuation
method. You need to go through and separately do a valuation of each synergy. For the purposes of
this case study, assume that the WACC for the buyer and seller is 10% and 16%, respectively. When
the companies are integrated together, the combined WACC of the integrated firm will be 12%.
Financial synergy. The first benefit to examine in this case is the tax synergy. The asset
write‐up will increase depreciation expense by $6 million a year for the next three years. You need
to examine the likelihood of being able to actually utilize that increase in that depreciation to
determine the level of risk associated with the synergy.
In this case, the buyer has had pretax income that has consistently been more than $15 million,
which is greater than the $6 million per year that you are expecting to have as increased
depreciation. This indicates that the risk of achieving the tax savings is relatively low. However, it is
not a virtual certainty. It would be different if the buyer consistently had, say, $100 million in pretax
income and there was no expectation that acquiring the selling company was going to lower that
income. In that case, the pretax income is so much greater than the $6 million in extra depreciation
that you would be safe to say it’s an absolute certainty that the tax benefit would be realized.
But, in this case, there is some level of risk because the pretax income is not dramatically higher.
Based on that, the determination made in this situation is that the risk you are dealing with is
relatively comparable to the risk associated with the buyer’s ability to make its debt payments.
Based on that fact, the discount rate you should apply to the cash flows from the tax synergy should
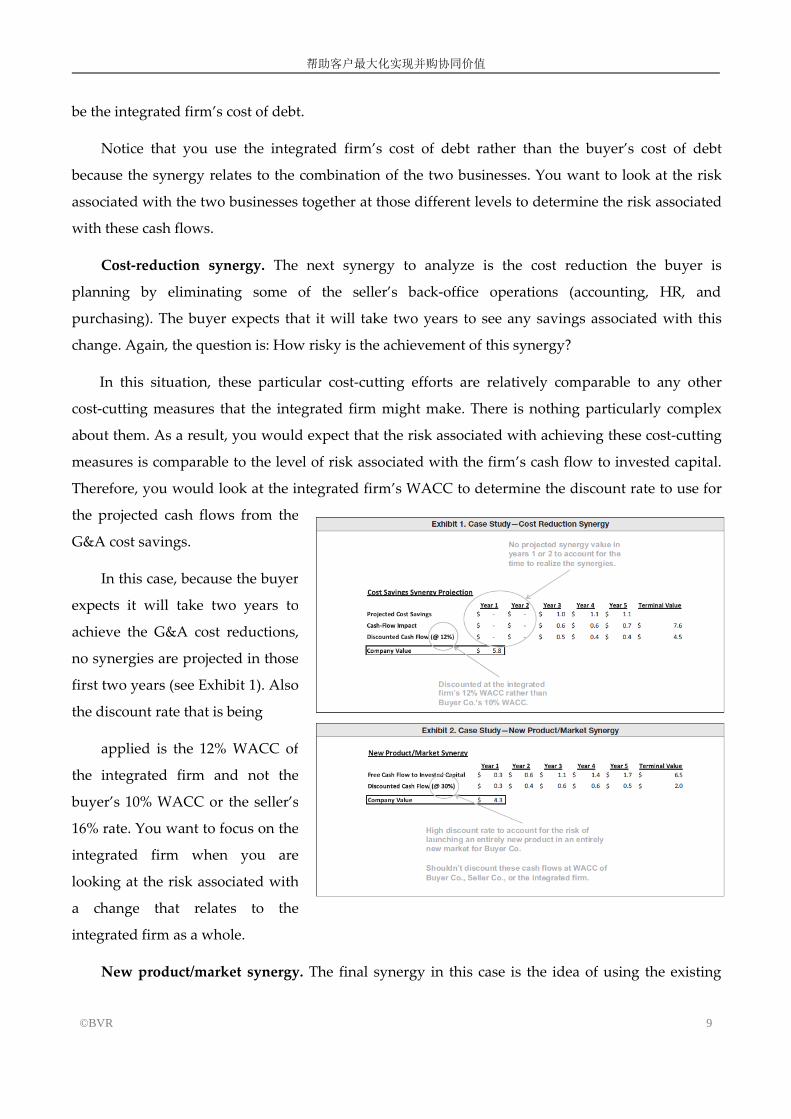
帮助客户最大化实现并购协同价值
©BVR 9
be the integrated firm’s cost of debt.
Notice that you use the integrated firm’s cost of debt rather than the buyer’s cost of debt
because the synergy relates to the combination of the two businesses. You want to look at the risk
associated with the two businesses together at those different levels to determine the risk associated
with these cash flows.
Cost‐reduction synergy. The next synergy to analyze is the cost reduction the buyer is
planning by eliminating some of the seller’s back‐office operations (accounting, HR, and
purchasing). The buyer expects that it will take two years to see any savings associated with this
change. Again, the question is: How risky is the achievement of this synergy?
In this situation, these particular cost‐cutting efforts are relatively comparable to any other
cost‐cutting measures that the integrated firm might make. There is nothing particularly complex
about them. As a result, you would expect that the risk associated with achieving these cost‐cutting
measures is comparable to the level of risk associated with the firm’s cash flow to invested capital.
Therefore, you would look at the integrated firm’s WACC to determine the discount rate to use for
the projected cash flows from the
G&A cost savings.
In this case, because the buyer
expects it will take two years to
achieve the G&A cost reductions,
no synergies are projected in those
first two years (see Exhibit 1). Also
the discount rate that is being
applied is the 12% WACC of
the integrated firm and not the
buyer’s 10% WACC or the seller’s
16% rate. You want to focus on the
integrated firm when you are
looking at the risk associated with
a change that relates to the
integrated firm as a whole.
New product/market synergy. The final synergy in this case is the idea of using the existing
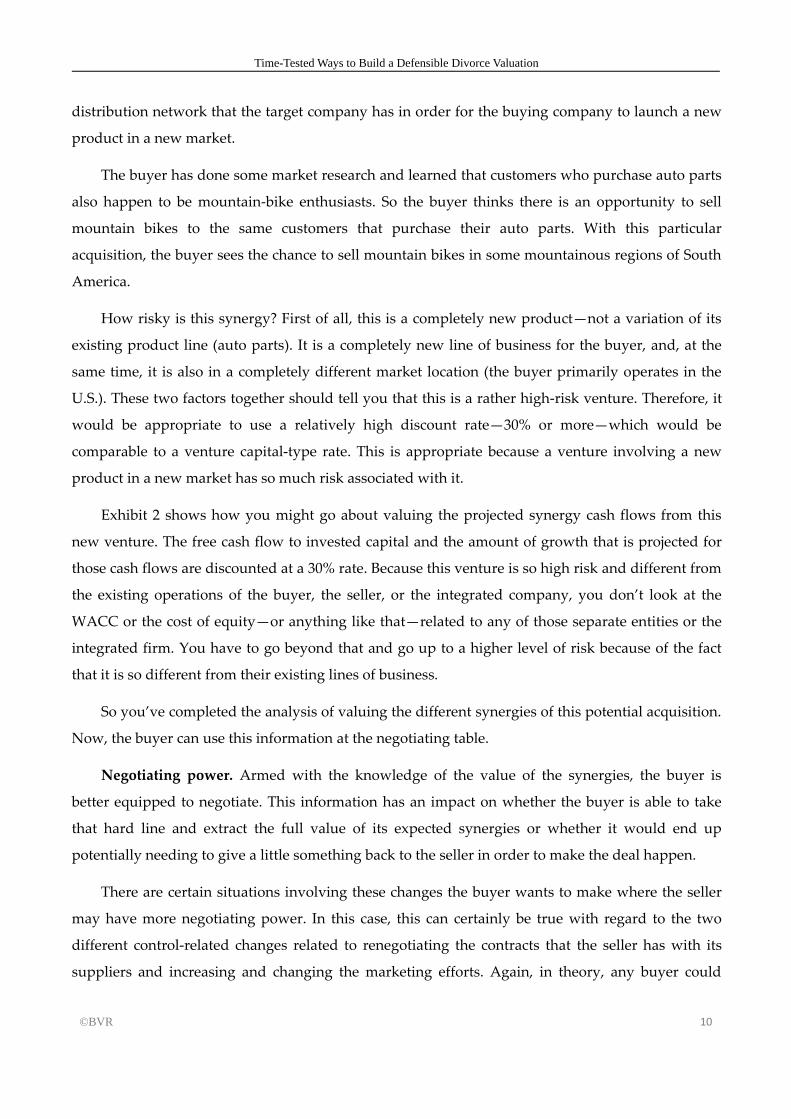
Time-Tested Ways to Build a Defensible Divorce Valuation
©BVR 10
distribution network that the target company has in order for the buying company to launch a new
product in a new market.
The buyer has done some market research and learned that customers who purchase auto parts
also happen to be mountain‐bike enthusiasts. So the buyer thinks there is an opportunity to sell
mountain bikes to the same customers that purchase their auto parts. With this particular
acquisition, the buyer sees the chance to sell mountain bikes in some mountainous regions of South
America.
How risky is this synergy? First of all, this is a completely new product—not a variation of its
existing product line (auto parts). It is a completely new line of business for the buyer, and, at the
same time, it is also in a completely different market location (the buyer primarily operates in the
U.S.). These two factors together should tell you that this is a rather high‐risk venture. Therefore, it
would be appropriate to use a relatively high discount rate—30% or more—which would be
comparable to a venture capital‐type rate. This is appropriate because a venture involving a new
product in a new market has so much risk associated with it.
Exhibit 2 shows how you might go about valuing the projected synergy cash flows from this
new venture. The free cash flow to invested capital and the amount of growth that is projected for
those cash flows are discounted at a 30% rate. Because this venture is so high risk and different from
the existing operations of the buyer, the seller, or the integrated company, you don’t look at the
WACC or the cost of equity—or anything like that—related to any of those separate entities or the
integrated firm. You have to go beyond that and go up to a higher level of risk because of the fact
that it is so different from their existing lines of business.
So you’ve completed the analysis of valuing the different synergies of this potential acquisition.
Now, the buyer can use this information at the negotiating table.
Negotiating power. Armed with the knowledge of the value of the synergies, the buyer is
better equipped to negotiate. This information has an impact on whether the buyer is able to take
that hard line and extract the full value of its expected synergies or whether it would end up
potentially needing to give a little something back to the seller in order to make the deal happen.
There are certain situations involving these changes the buyer wants to make where the seller
may have more negotiating power. In this case, this can certainly be true with regard to the two
different control‐related changes related to renegotiating the contracts that the seller has with its
suppliers and increasing and changing the marketing efforts. Again, in theory, any buyer could

帮助客户最大化实现并购协同价值
©BVR 11
come in, acquire the company, make those changes, and generate that value. Because of this, it
makes it a little bit harder for the buyer to really extract the full value of the control changes
You also need to think about whether any particular synergy is specific to the buyer itself or
whether it is really a synergy that any number of buyers could achieve. If many buyers have the
potential to achieve those same synergies, it gives a little more negotiating power to the seller. The
seller will try to take some of that value for itself and for its shareholders because it can essentially
pit more of the buyers against each other to try to drive up the price.
For example, in this case, you can assume that the tax benefits could potentially be achieved by
a large number of buyers. If that is the case, then the seller may have a lot of negotiating power
related to maintaining the value or grabbing onto the value associated with those tax benefits.
By contrast, some of these other potential changes are potentially something where the buyer
might have more negotiating power. This is especially true if the cost savings related to
incorporating the seller’s operations into its existing infrastructure is something that the buyer is
particularly well suited to do. In this case, it will probably be more likely that the buyer will be able
to extract that value from this acquisition. By the same token, if the particular buyer is the only one
who has the chance to generate some synergistic value from launching a new product in a new
market, then the buyer is going to be able to retain that value.
As you can see, valuing the different synergies associated with a potential acquisition plays
into the negotiations and helps the buyer get the most bang for the buck.
隐含的私营企业定价曲线
©IACVA(CHINA) - BVR 1
The Implied Private Company Pricing Line 2.01
K0 = (FCFF1/P) + g
隐含的私营企业定价曲线
作者: Bob Dohmeyer, ASA; Pete Butler, CFA, ASA; and Rod Burkert, CPA/ABV, CVA
翻译:程永海(银信资产评估有限公司浙江分公司)
小编提示:企业评估领域中存在着一个严重的问题,就是用公开上市股票证券的数据估计一家
小型私营企业的资本成本。运用这一传统方法,不同评估师即使使用同一数据源对同一家公司
进行分析,依然会得出截然不同的估计值。如今,一种能够消除公共和私营数据之间内在问题
的方法出现了,并且该方法能够更可靠地估计私营企业的资本成本。
Editor’s Note: A serious problem area in business valuation is estimating the cost of capital
of a small privately held business by using data from publicly traded equity securities.
Using this traditional approach, different appraisers analyzing the same firm using the
same data sources can come up with vastly different estimates. A new approach has come
along that is designed to eliminate the inherent problems in comparing public and private
data and to be more reliable in estimating the cost of capital for a privately held business.
引言
大多数企业评估项目是针对收入少于 1000万美元的私营公司。如今的资本成本(K0)估

The Implied Private Company Pricing Line 2.01 K0 = (FCFF1/P) + g
©IACVA(CHINA) - BVR 2
计方法几乎完全依赖于上市股票的收益率。小型私营控股公司在许多基本方式上不同于上市公
司。因此,有一些问题使得这些方法在运用到小型私营企业时变得不可靠。基于中小型私营企
业的市场交易,我们建立了一条隐含的私营企业定价曲线(IPCPL)来消除前者公、私之间比
较所产生的问题,同时该曲线更有利于对收入低于 1亿 5000万美元的私人持有公司资本成本
的估算。
Most business appraisal assignments are for private companies with revenue less than $10
million. Current costs of capital (K0) estimation methods rely almost entirely on public
security returns. Small privately held companies are different from public equity securities
in many fundamental ways. Consequently, there are issues that make these methods
unreliable when extrapolated to small privately held businesses. We developed an implied
private company pricing line (IPCPL) based on market transactions in small privately held
businesses to eliminate highly problematic comparisons and use as a more accurate and
defensible starting point to develop a cost of capital for any privately held company with
revenue less than $150 million.
将上市股票的收益率运用到私人持有公司时出现的弊端
两位评估师运用相同的数据为同一家小型私营公司计算资本成本却产生截然不同的结果,
之所以会这样有以下五个原因。
Pitfalls when extrapolating public equity securities returns to small privately held
businesses
Two appraisers developing a cost of capital for the same small, privately held company can
come up with widely divergent results using the same data sources. Here are five reasons
why.
非系统风险又名可分散风险或公司特定风险。非系统风险也称为可分散风险。这类风险可
以通过单一交易型开放式指数基金或股票投资组合轻易且低代价地分散掉,这是运用到私营企
业的上市股票收益率无法弥补的。相对于市场投资组合的总风险系数 total Beta 1.0,小型私营
企业的总风险 total Beta系数约 3.0。这 3 倍的总风险差异,绝大部分意味着公司特定风险,但
我们并不知道这部分差异对于小型私营企业来说是如何在市场定价的。Aswath Damodaran 告
诉我们:“如果你有一个投资者有着完全不可分散的风险,那么[total Beta]理论上是适用的,但
在现实世界你永远不会有这样的买家。另一方面,“Beta”适用于完全可分散风险的投资者。
而私营公司的投资者介于这两者之间。”
Unsystematic risk is also known as diversi‐fiable risk.2 Since this type of risk can be

隐含的私营企业定价曲线
©IACVA(CHINA) - BVR 3
easily and inexpensively diversified away via a single exchange traded fund or stock
portfolio, it is not compensated for in the public stock returns that are extrapolated to
private companies. Small private businesses have a total beta (total risk) of about 3.0
compared to the market portfolio total beta of 1.0.3 The vast majority of this 3x total risk
difference represents company‐specific risk, and it is not known how this differential is
priced in the market for small private businesses.4 Aswath Damodaran tells us: “[Total beta]
theoretically applies if you have an investor who is completely undiversified, but you never
have that kind of buyer in the real world. At the other end of the spectrum, ‘beta’ applies for
totally diversified in‐vestors. Investors in private companies are somewhere in between.”5
流动性差异。收益率与流动性之间的关系是一个非常活跃的研究领域。Damodaran博士
基于流动性问题和私营企业的估值方面作出如下阐述:
Liquidity differences. The relationship between return and liquidity is a very active area of
research. Dr. Damodaran states this with respect to liquidity issues and private company
valuation:
当你购买股票、债券、实物资产甚至一个企业时,有时你会面临懊悔。你想改变你当初的
决定,卖掉你刚买的东西。流动性不足的成本就是这种悔恨的成本。对于被频繁交易的上市公
司股票,这种成本很小。但是对于小的、柜台股票,乃至一个私人企业,由于其拥有较少买家,
这种成本相对较大。
When you buy a stock, bond, real asset or a business, you sometimes face buyer’s
remorse. You want to reverse your decision and sell what you just bought. The cost of
illiquidity is the cost of this remorse. In the case of publicly traded stock in a heavily
traded company, this cost should be small. It will be larger for stock in a small, over‐thecounter stock and will escalate for a private business, where there are relatively few
potential buyers.
弥补流动性不足成本的一种方法是通过成本交易,流动性差的资产应该比流动性强的资产
承担更高的交易成本(如占资产价值的百分之一)。买、卖一个私营企业需要大量的甚至过高
的交易成本,这主要取决于企业的规模、资产和盈利能力。如果潜在的买家相对较少,那么搜
索成本(即寻找这些买家所付出的相关成本)会很高。事实上,如果投资者从你那里购买的交
易成本类似于她将在出售时面临的交易成本估计值,今天的资产价值应该反映将来所有资产持
有者的未来交易成本期望值。
One way to capture the cost of illiquidity is through transactions costs, with less liquid

The Implied Private Company Pricing Line 2.01 K0 = (FCFF1/P) + g
©IACVA(CHINA) - BVR 4
assets bearing higher transactions costs (as a percent of asset value) than more liquid
assets. Trading costs associated with buying and selling a private business can range
from substantial to prohibitive, depending upon the size of the business, the
composition of its assets and its profitability. There are relatively few potential buyers
and the search costs (associated with finding these buyers) will be high. In fact, if the
investor buying it from you builds in a similar estimate of transactions cost she will face
when she sells it, the value of the asset today should reflect the expected value of all
future transactions cost to all future holders of the asset.
传统估值较小程度地反映了流动性的影响。现金流是预期的现金流,折现率通常反映了现
金流中的风险,我们获得的现值是流动性业务的价值。对于公开上市的公司,我们使用这个数
值隐含的假设是:流动性问题不足并不是一个大的问题构成影响评估的因素。而对于私营企业
的评估,分析师并不太愿意(有充分的理由)作出这种假设。评估私营企业价值的标准做法是
将流动性不足的折现率也运用到这一价值。但是这个折现率应该是多少,我们如何才能最好地
估算它?这是一个较难解答的问题,因为在私营企业的估值中,折现率本身是不容易被观察到
的。
In conventional valuation, there is little scope to show the effect of illiquidity. Cash
flows are expected cash flows, the discount rate is usually reflective of the risk in the
cash flows and the present value we obtain is the value for a liquid business. With
publicly traded firms, we then use this value, making the implicit assumption that
illiquidity is not a large enough problem to factor into valuation. In private company
valuations, analysts have been less willing (with good reason) to make this assumption.
The standard practice in many private company valuations is to apply an illiquidity
discount to this value. But how large should this discount be and how can we best
estimate it? This is a very difficult question to answer empirically because the discount
in private company valuations itself cannot be observed.6
小股票溢价。小股票溢价是有争议且高度复杂的。一旦采用就是一个流动性驱动现象(即
小公司股票的流动性越低,带动的回报就越高),或资本资产定价模型跨期的缺陷表现,如
Fama‐French 数据证明的一样,当运用企业规模大小推算私营企业时需要特别注意。例如:
Small stock premium. The small stock premium is both controversial and highly
complex. If one adopts either a liquidity‐driven phenomenon, where the lower liquidity
of small company stocks drives the higher returns, or the intertemporal flaw of the
capital asset pricing model, as demonstrated empirically by the Fama‐French data, one

隐含的私营企业定价曲线
©IACVA(CHINA) - BVR 5
needs to take extraordinary care when extrapolating size percentiles to small privately
held companies.7 For example:
尽管将所有有据可查的小市值、低股价股票的超额收益都归因于非流动性是非常荒谬的,
但是事实上越小的越困苦的公司(那些往往以较低市净率交易的公司)是要比市场上其他的公
司流动性更差。关键是要避免对流动性不足成本的重复计算,因为一些小股票溢价可能会补偿
低市值公司的流动性不足。
While it would be foolhardy to attribute all of the well documented excess returns that
have been associated with owning small market capitalization and low price to book
stocks to illiquidity, smaller and more distressed companies (which tend to trade at low
price to book ratios) are more illiquid than the rest of the market.… The key is to avoid
double counting the cost of illiquidity since some of the small stock premium may be
compensation for the illiquidity of small cap companies.8
另外:“Rolf Banz 提出规模效应可能归因于他没有识别的其他东西; 流动性不足只是与企
业规模高度相关。”
Also: “[T]he size effect that [Rolf Banz] is picking up may be attributable to something else
he’s not identifying; it’s just highly correlated to size.”9
通行实体(PTE)税。如今,小型私营企业的“边际购买者”或“定价投资者”很像一个
PTE。但是,评估师仍然应该使用企业所得税税率计算表来保持与推测的税后股票市场收益数
据一致? 还是应该使用由 Grabowski,Treharne 或 Van Vleet 等人开发的 PTE 模型或者其他的
税来影响收入? 不幸的是,这个模型未能在公平市场价值框架中考虑固有的边际购买者或定
价投资者。 此外,这个模型也未能考虑研究人员称之为的“客户效应”。例如,Keith Sellers
和 Nancy Fannon指出:
Pass‐through entity (PTE) taxes. Today, the “marginal buyer” or “price‐setting investor”
for small private businesses is likely a PTE.10 But should appraisers still use a
C‐corporation income tax rate scheme to remain consistent with the extrapolated, after‐taxstock market return data? Or should appraisers use PTE models developed by Grabowski,
Treharne, or Van Vleet, or others to tax affect income? Unfortunately, these models fail to
incorporate the marginal buyer or price‐setting investor inherent in the fair market value
framework. Also, these models fail to incorporate what researchers call “clientele effects.”
For example, Keith Sellers and Nancy Fannon point out:
如今私人市场估值将股东税视为与价值直接相关的税率,这种处理与实证研究表明的结果

The Implied Private Company Pricing Line 2.01 K0 = (FCFF1/P) + g
©IACVA(CHINA) - BVR 6
相距甚远。至少,这应该向私人市场分析师表明,当存在与公开市场收益不同的税收计划时,
需要仔细考虑抵消和其他相关风险。如同影响价值的所有风险一样,这可能将会通过资本成本
最有效地表现出来。
Where private market valuation today treats shareholder taxes as directly correlated to
value, such treatment is a very far leap from that which is demonstrated by empirical
research. At the very least, this should indicate to private market analysts the need to
carefully consider offsets and other associated risks when different tax schemes than
that which exists in the public market returns are assumed. Like all risks that affect
value, this can be demonstrated perhaps most effectively through the cost of capital.11
现金加回/杠杆。传统的加权平均资本成本方法要求对债务比例、市场借款利率和杠杆 Beta
进行估计——这些数值都很难估计,并且有估计误差。此外,很多评估师也常犯这样的错误:
(1)不把标的公司的现金余额加入到折现现金流现值的分析中;或(2)没有因为负杠杆而使
用杠杆 Beta,这意味着没能把标的公司的现金余额列入现值的计算。Damodaran 指出:
Cash add back/leverage. Traditional weighted average cost of capital methods require
estimates of the percentage of debt to total capital, market borrowing rates, and relevered
betas—all difficult to estimate and all subject to estimation errors. Further, many appraisers
often make the mistake of either: (1) not adding the subject company’s cash balance to the
present value of the discounted cash flow analysis; or (2) not relevering beta for the
negative leverage implied by not adding the subject company’s cash balance to the present
value calculation. Damodaran points out:
在我们看来,争论企业经营需要多少现金和多少超额现金在评估时并未抓住重点。 请注
意,企业经营所需的现金也可以投资于国库券或商业票据等类现金投资。 虽然这些投资的收
益报酬率偏低,但确实能够实现公允的收益。 换句话说,对国库券的投资是零净现值投资,
赚取的恰好是所需要赚到的,所以对价值没有影响。在计算现金流量时,我们不应该将现金视
为营运资本的一部分。 影响价值的分类因此是将现金余额分为浪费现金和非浪费现金。考虑
到投资风险,只有以低于市场利率投资的现金,才会被视为浪费现金。 因此, 支票存款帐户
余留的不产生利息的现金,就是浪费现金。
In our view, the debate over how much cash is needed for operations and how much is
excess cash misses the point when it comes to valuation. Note that even cash needed for
operations can be invested in near‐cash investments such as treasury bills or commercial
paper. These investments may make a low rate of return but they do make a fair rate of
return. Put another way, an investment in treasury bills is a zero net present value

隐含的私营企业定价曲线
©IACVA(CHINA) - BVR 7
investment, earning exactly what it needs to earn, and thus has no effect on value. We
should not consider that cash to be part of working capital when computing cash flows.
The categorization that affects value is therefore the one that breaks the cash balance
down into wasting and non‐wasting cash. Only cash that is invested at below market
rates, given the risk of the investment, should be considered wasting cash. Thus, cash
left in a checking account, earning no interest, is wasting cash.12
陷阱总结。我们都知道使用公开股票收益率的弊端; 我们只是不愿承认他们的存在,或者
是仍然相信没有什么比从公开股票收益率着手更好的方法。 因此,上述的弊端可能会导致两
位评估师对资本成本的估计大大不同。 为了说明这些陷阱或弊端的累积程度,我们假设两位
独立的评估师被要求评估同一私营公司,并且两者都同意:
Summary of pitfalls. We all know the pitfalls of using public equity returns; we just don’t
like to admit they exist or believe that nothing better than starting with public equity
returns is available. As a result, the pitfalls noted above can lead two appraisers to wildly
different cost of capital estimates. To illustrate the cumulative magnitude of these pitfalls,
we hypothecate two independent appraisers assigned to value the same private business
where both agree:
► 运用管理层预测的 2%的现金流稳定增长率;
► 并且该标的公司具有“典型”的特定公司风险。
► To utilize management’s forecast of cash flow with a stable growth rate of 2%; and
► The subject company has “typical” company‐specific risk.
然后,两位评估师建立了股权折
现率,如图 1所示。
Then, both appraisers build up their
equity discount rate as shown in
Exhibit 1.
在每个具体指标的合理范围内,
这两位独立客观的评估师对同一私营
公司权益成本的估值可以很容易达到
24.0%或 11.2%。这种差异的结果是,
即使双方同意标的公司现金流量的预
测和“典型”风险,但当 2%的增长
图 1. “Pitfalls”实例
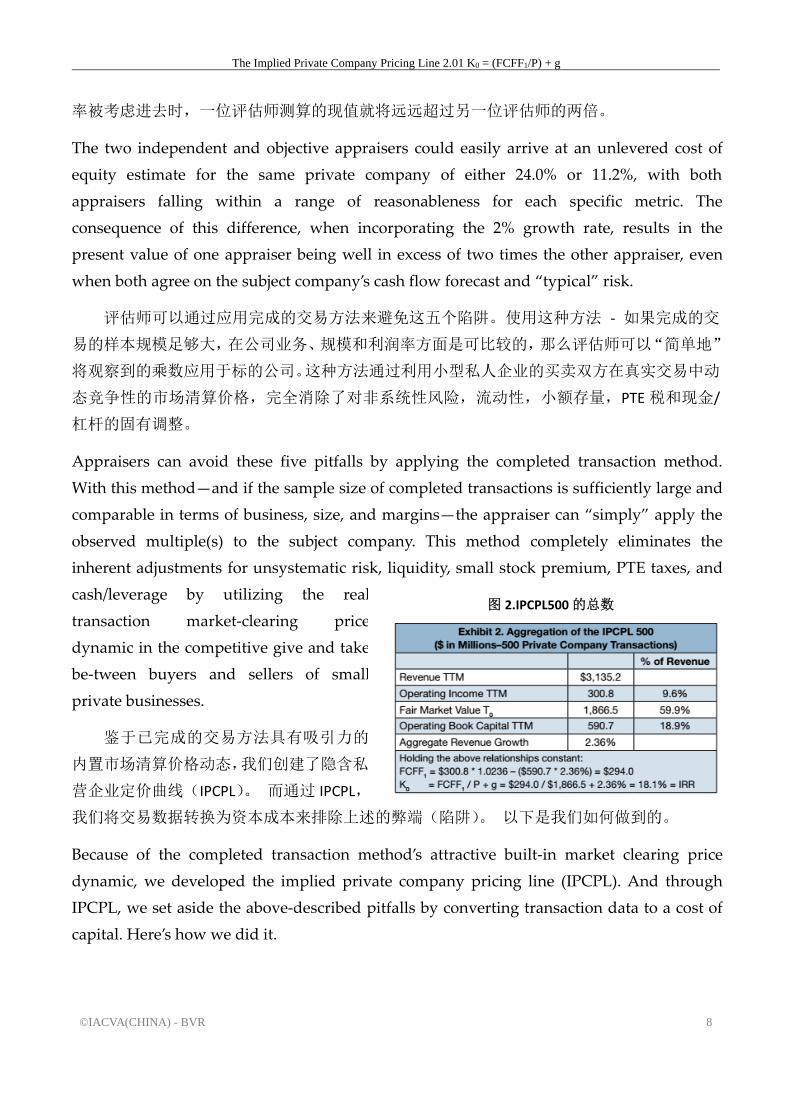
The Implied Private Company Pricing Line 2.01 K0 = (FCFF1/P) + g
©IACVA(CHINA) - BVR 8
率被考虑进去时,一位评估师测算的现值就将远远超过另一位评估师的两倍。
The two independent and objective appraisers could easily arrive at an unlevered cost of
equity estimate for the same private company of either 24.0% or 11.2%, with both
appraisers falling within a range of reasonableness for each specific metric. The
consequence of this difference, when incorporating the 2% growth rate, results in the
present value of one appraiser being well in excess of two times the other appraiser, even
when both agree on the subject company’s cash flow forecast and “typical” risk.
评估师可以通过应用完成的交易方法来避免这五个陷阱。使用这种方法 ‐ 如果完成的交
易的样本规模足够大,在公司业务、规模和利润率方面是可比较的,那么评估师可以“简单地”
将观察到的乘数应用于标的公司。这种方法通过利用小型私人企业的买卖双方在真实交易中动
态竞争性的市场清算价格,完全消除了对非系统性风险,流动性,小额存量,PTE 税和现金/
杠杆的固有调整。
Appraisers can avoid these five pitfalls by applying the completed transaction method.
With this method—and if the sample size of completed transactions is sufficiently large and
comparable in terms of business, size, and margins—the appraiser can “simply” apply the
observed multiple(s) to the subject company. This method completely eliminates the
inherent adjustments for unsystematic risk, liquidity, small stock premium, PTE taxes, and
cash/leverage by utilizing the real
transaction market‐clearing price
dynamic in the competitive give and take
be‐tween buyers and sellers of small
private businesses.
鉴于已完成的交易方法具有吸引力的
内置市场清算价格动态,我们创建了隐含私
营企业定价曲线(IPCPL)。 而通过 IPCPL,
我们将交易数据转换为资本成本来排除上述的弊端(陷阱)。 以下是我们如何做到的。
Because of the completed transaction method’s attractive built‐in market clearing price
dynamic, we developed the implied private company pricing line (IPCPL). And through
IPCPL, we set aside the above‐described pitfalls by converting transaction data to a cost of
capital. Here’s how we did it.
图 2.IPCPL500的总数
隐含的私营企业定价曲线
©IACVA(CHINA) - BVR 9
对 IPCPL 2.0 的概述
IPCPL是通过连接两个估计数据点创建的私营公司的资本成本(曲线):
Overview of IPCPL 2.0
IPCPL is the private company cost of capital line (curve) created by connecting two
estimated data points:
► 数据点 1是基于由《企业评估资源》(“IPCPL 500”)发布的 Pratt's Stats交易数据库中的 500家小型私营
企业的交易价格;和
Data Point 1 is based on transaction prices of 500 small private businesses from the Pratt’s Stats transaction
database, published by Business Valuation Resources (the “IPCPL 500”); and
► 数据点 2是基于收入在 1.5亿美元范围内的微型上市公司的资本成本,根据正在公开的和已经公开的资本成
本进行调整,
Data Point 2 is based on the cost of capital, adjusted for the cost of going and staying public,
of micro‐cap publicly traded companies in the range of $150 million revenues.13
如预期的那样,我们的资本成本计算结果表明数据点 1较小型企业的收益率较高,数据点
2较大规模公司的收益率较低。进而,通过这两点连接成一条曲线(如果有必要请看图 7),
这是根据“无套利”规则建立的,以减轻任何套利或有利地将小公司“卷起”成较大公司的可
能性。
As expected, our cost of capital calculations indicate a higher return for the smaller‐sizedcompanies of Data Point 1 and a lower return for the larger‐sized companies of Data Point 2.
Further, the two points are connected by a curve (skip to Exhibit 7 if you must!) that is
shaped by a “no‐arbitrage” rule to mitigate any possibility to arbitrage or profitably “roll
up” the smaller companies into larger ones.
IPCPL 数据点 1
IPCPL资本成本的引入是基于著名的估值公理 K0=(FCFF1 / P)+ g。由于 K0是不需要
证明的,一旦输入的 FCFF1、P和 g是有效的,自然就会得到数据点 1。总体数据点 1的 IPCPL
500数据来自 500家私营企业的市场清算价格,如下所述。 图表 2总结了数据点 1。
IPCPL Data Point 1
The IPCPL cost of capital derivation, while novel, is based on the well‐known valuation
axiom K0=(FCFF1/P) + g.14 Since K0 is axiomatic, Point 1 is the natural result if the inputs
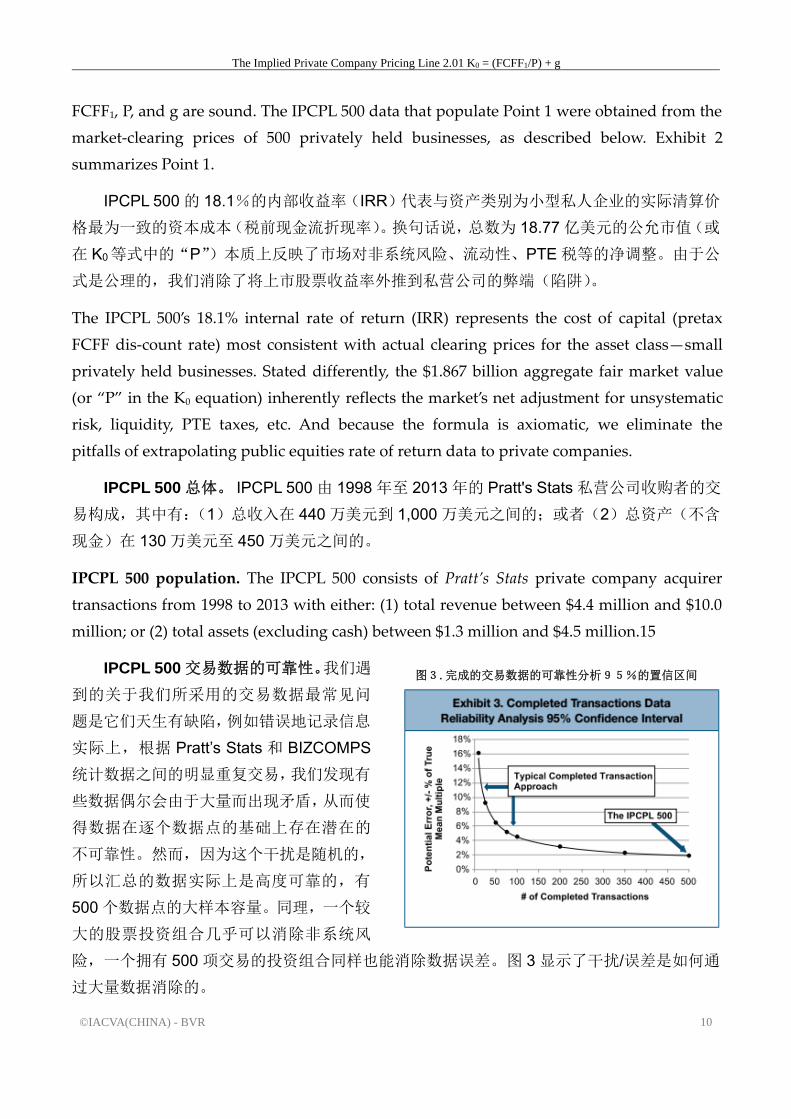
The Implied Private Company Pricing Line 2.01 K0 = (FCFF1/P) + g
©IACVA(CHINA) - BVR 10
FCFF1, P, and g are sound. The IPCPL 500 data that populate Point 1 were obtained from the
market‐clearing prices of 500 privately held businesses, as described below. Exhibit 2
summarizes Point 1.
IPCPL 500的 18.1%的内部收益率(IRR)代表与资产类别为小型私人企业的实际清算价
格最为一致的资本成本(税前现金流折现率)。换句话说,总数为 18.77亿美元的公允市值(或
在 K0等式中的“P”)本质上反映了市场对非系统风险、流动性、PTE税等的净调整。由于公
式是公理的,我们消除了将上市股票收益率外推到私营公司的弊端(陷阱)。
The IPCPL 500’s 18.1% internal rate of return (IRR) represents the cost of capital (pretax
FCFF dis‐count rate) most consistent with actual clearing prices for the asset class—small
privately held businesses. Stated differently, the $1.867 billion aggregate fair market value
(or “P” in the K0 equation) inherently reflects the market’s net adjustment for unsystematic
risk, liquidity, PTE taxes, etc. And because the formula is axiomatic, we eliminate the
pitfalls of extrapolating public equities rate of return data to private companies.
IPCPL 500 总体。 IPCPL 500由 1998年至 2013年的 Pratt's Stats私营公司收购者的交
易构成,其中有:(1)总收入在 440万美元到 1,000万美元之间的;或者(2)总资产(不含
现金)在 130万美元至 450万美元之间的。
IPCPL 500 population. The IPCPL 500 consists of Pratt’s Stats private company acquirer
transactions from 1998 to 2013 with either: (1) total revenue between $4.4 million and $10.0
million; or (2) total assets (excluding cash) between $1.3 million and $4.5 million.15
IPCPL 500 交易数据的可靠性。我们遇
到的关于我们所采用的交易数据最常见问
题是它们天生有缺陷,例如错误地记录信息
实际上,根据 Pratt’s Stats和 BIZCOMPS
统计数据之间的明显重复交易,我们发现有
些数据偶尔会由于大量而出现矛盾,从而使
得数据在逐个数据点的基础上存在潜在的
不可靠性。然而,因为这个干扰是随机的,
所以汇总的数据实际上是高度可靠的,有
500个数据点的大样本容量。同理,一个较
大的股票投资组合几乎可以消除非系统风
险,一个拥有 500项交易的投资组合同样也能消除数据误差。图 3显示了干扰/误差是如何通
过大量数据消除的。
图3.完成的交易数据的可靠性分析95%的置信区间

隐含的私营企业定价曲线
©IACVA(CHINA) - BVR 11
IPCPL 500 transaction data reliability. The most common concern we encounter with the
transaction data we employ is that they are inherently flawed by imperfections, such as
incorrectly reported information. Indeed, based on obvious transaction duplicates between
Pratt’s Stats and BIZCOMPS, we see that some data were occasionally contradictory by
significant amounts—making the data potentially unreliable on a data point‐by‐data point
basis. However, because this noise is random, the aggregated data are, in fact, highly
reliable with a large sample size of 500 data points. In the same way, a large portfolio of
stocks nearly eliminates unsystematic risk; a portfolio of 500 transactions does the same to
data errors. Exhibit 3 shows how the noise/errors are eliminated by the “law of large
numbers.”
为了证明我们的样本容量足够大以致能够解决数据误差的问题,下面是我们的数据分析过
程。
To demonstrate the ability of our large sample size to cure any bad data problem, we
performed the statistical analysis described below.
假设:(a)买方没有支付“疯狂”的价格或卖方也没有出售“疯狂”的价格;和(b)与
决定价格-营业收入乘数相关的交易数据是一个完全准确的 6.00。接下来,假设容量为 100个
交易数据点、平均值为 6.00、标准差为 1.35的样本有大量的实际数据问题,如图4显示。
Assume that: (a) there were no “crazy” prices paid by buyers or sold by sellers; and (b) the
re‐ported transaction data relevant to determining a price‐to‐operating income multiple
were a perfectly accurate 6.00. Next, assume a significantly large actual data problem using
a sample of 100 transaction data points, with a true mean of 6.00 and a standard deviation
of 1.35, as shown in Exhibit 4.16
从图 3(使用图 4所示的数据误差)
的统计分析可以看出,IPCPL 500交易的
汇总数据集几乎完全可靠。
As we see from the statistical analysis
in Exhibit 3 (which uses the data
problems illustrated in Exhibit 4), our
aggregated data set for the IPCPL 500
transactions is nearly perfectly
reliable.17
图 4.数据误差的模拟

The Implied Private Company Pricing Line 2.01 K0 = (FCFF1/P) + g
©IACVA(CHINA) - BVR 12
具体来说,样本容量为 500,我们可以有 95%确信,如果真实均值为 6.00,那么记录的
数据平均营业收入乘数在 5.88和 6.12之间。
Specifically, with a sample size of 500, we are 95% confident that the reported data mean
operating income multiple is between 5.88 and 6.12 if the true mean is 6.00.
IPCPL 500 总数增长假设。我们运用估值公理 K0 =(FCFF1 / P)+ g来计算 IPCPL 500 K0
/ IRR。一个用来计算 K0 / IRR、我们必须输入的估计值是我们 500家公司的总体增长率(g)。
但重要的是,我们注意到,在合理范围内的增长率假设并不重要。 由于增长的固定资产投资
和营运资本抑制了 FCFF1的增长,所以我们计算出的 K0 / IRR只是假设增长变化的一半。
IPCPL 500 aggregate growth assumption. Recall we employ the valuation axiom K0 =
(FCFF1/P) + g to solve for the IPCPL 500 K0/IRR. One input we must estimate is the
aggregate growth rate (g) for our 500 companies to solve for the aggregate K0/IRR. But
importantly, we note that the growth rate assumption, within reason, is not critical. Since
higher growth dampens FCFF1 due to increased investments in fixed assets and working
capital, we calculate that K0/IRR changes only by about one‐half of the assumed change in
growth.
为了估计总体增长,我们使用了 Pratt's Stats的实际收入增长率和企业经营年龄数据以及
劳动统计局(BLS)的小型企业失败率数据。这是我们的研究过程:
To estimate aggregate growth, we used real revenue growth and business age data
from Pratt’s Stats as well as small business failure rate data from the Bureau of Labor
Statistics (BLS). This was our process:
► 首先,我们运用一条年限 10年的移动平均线对 Pratt's Stats中 1到 30年经营期的 10,000家公司进行排列。
这对经营年龄在五年至二十五年的公司收入进行了公正的估计。
► First, we sorted 10,000 companies in Pratt’s Stats by business age—from one to 30 years—using a 10‐year
moving average. This yielded an unbiased estimate of revenue for companies aged five to 25.
► 第二,我们通过查看收入变化将筛选的数据看作是按年龄线的函数。虽然平均实际增长率为 4.8%,但这些
筛选的数据仅考虑幸存公司 - 统计偏差。
► Second, we examined this sorted data by looking at the change in revenue as a function of age. While the
average real growth rate was 4.8%, this sorted data only consider surviving companies—a statistical bias.
► 第三,我们采用了 Pratt's Stats的企业年龄排列数据,并调整了公司的幸存数量,以反映公司的总数是随着
时间的推移而增长的。具体来说,根据 BLS的“净出生率”0.44%我们汇总了经营期较长的公司数量。例
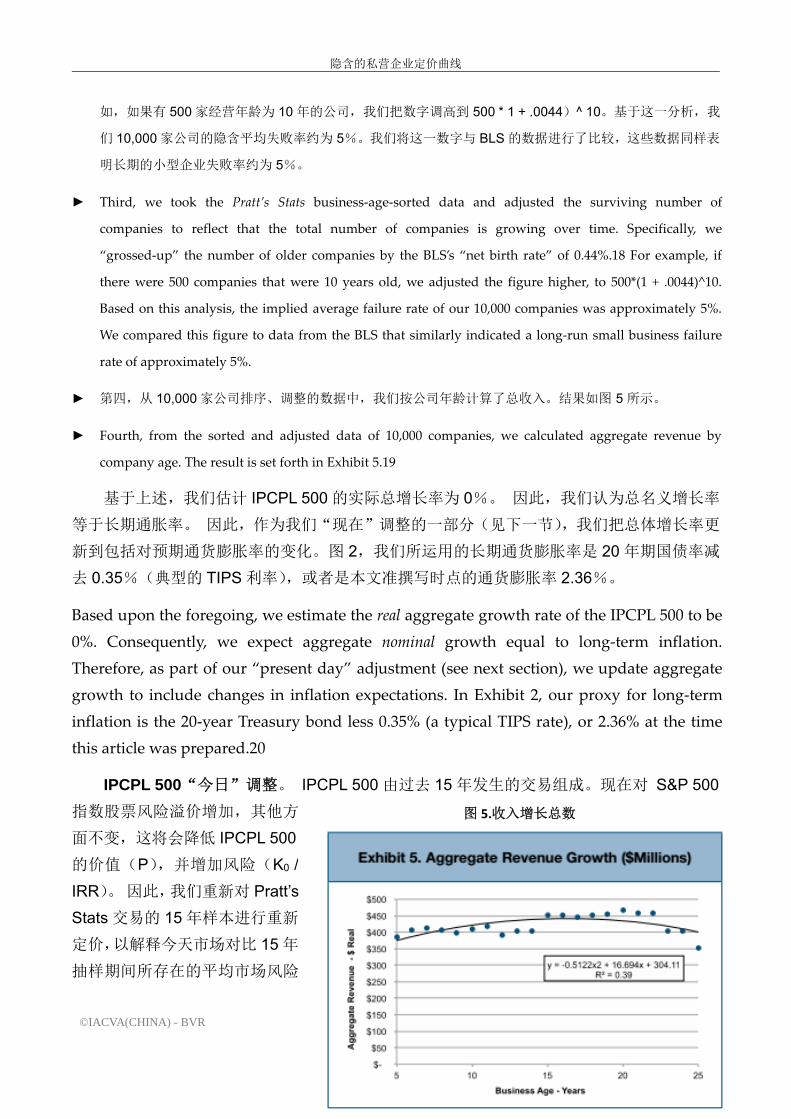
隐含的私营企业定价曲线
©IACVA(CHINA) - BVR 13
如,如果有 500家经营年龄为 10年的公司,我们把数字调高到 500 * 1 + .0044)^ 10。基于这一分析,我
们 10,000家公司的隐含平均失败率约为 5%。我们将这一数字与 BLS的数据进行了比较,这些数据同样表
明长期的小型企业失败率约为 5%。
► Third, we took the Pratt’s Stats business‐age‐sorted data and adjusted the surviving number of
companies to reflect that the total number of companies is growing over time. Specifically, we
“grossed‐up” the number of older companies by the BLS’s “net birth rate” of 0.44%.18 For example, if
there were 500 companies that were 10 years old, we adjusted the figure higher, to 500*(1 + .0044)^10.
Based on this analysis, the implied average failure rate of our 10,000 companies was approximately 5%.
We compared this figure to data from the BLS that similarly indicated a long‐run small business failure
rate of approximately 5%.
► 第四,从 10,000家公司排序、调整的数据中,我们按公司年龄计算了总收入。结果如图 5所示。
► Fourth, from the sorted and adjusted data of 10,000 companies, we calculated aggregate revenue by
company age. The result is set forth in Exhibit 5.19
基于上述,我们估计 IPCPL 500的实际总增长率为 0%。 因此,我们认为总名义增长率
等于长期通胀率。 因此,作为我们“现在”调整的一部分(见下一节),我们把总体增长率更
新到包括对预期通货膨胀率的变化。图 2,我们所运用的长期通货膨胀率是 20年期国债率减
去 0.35%(典型的 TIPS利率),或者是本文准撰写时点的通货膨胀率 2.36%。
Based upon the foregoing, we estimate the real aggregate growth rate of the IPCPL 500 to be
0%. Consequently, we expect aggregate nominal growth equal to long‐term inflation.
Therefore, as part of our “present day” adjustment (see next section), we update aggregate
growth to include changes in inflation expectations. In Exhibit 2, our proxy for long‐terminflation is the 20‐year Treasury bond less 0.35% (a typical TIPS rate), or 2.36% at the time
this article was prepared.20
IPCPL 500“今日”调整。 IPCPL 500由过去 15年发生的交易组成。现在对 S&P 500
指数股票风险溢价增加,其他方
面不变,这将会降低 IPCPL 500
的价值(P),并增加风险(K0 /
IRR)。因此,我们重新对 Pratt’s
Stats交易的 15年样本进行重新
定价,以解释今天市场对比 15年
抽样期间所存在的平均市场风险
图 5.收入增长总数
The Implied Private Company Pricing Line 2.01 K0 = (FCFF1/P) + g
©IACVA(CHINA) - BVR 14
状况。 为此,我们应用这个公式:(ERP0 – ERP15yravg)/ 2。 我们除以二,创造一个样本平
均值,是因为:(1)实际利率与股本风险溢价负相关;(2)资本成本相对于权益成本,对股
权风险溢价的变动反映并不强烈;(3)一般情况下,需作一个较适度的调整。
IPCPL 500 ‘ present day ’ adjustment. The IPCPL 500 is composed of transactions that
occurred over the last 15 years. All else being equal, a current increase in the S&P 500 equity
risk premium would decrease the value (P) of the IPCPL 500 and increase risk (K0/IRR).
Therefore, we modestly reprice our 15‐year sample of Pratt’s Stats transactions to account
for the risks of today’s market versus the average market conditions that existed over the
15‐year sampling period. To do so, we applied this formula: (ERP0 – ERP15yravg)/2. We
divided by two, creating a simple average, because: (1) real interest rates correlate
negatively with equity risk premiums; (2) the cost of capital is slightly less responsive to
changing equity risk premiums than the cost of equity; and (3) to make a more modest
adjustment, generally.
目前的今日调整对 IPCPL 500 K0 / IRR估计数的增加幅度只有 0.6%,这 0.6%将增加到
图 2中所计算的“原始”的 K0 / IRR(18.1%)上。不进行调整的话将类似于使用历史的 ERP
平均值。 而进行调整的话将类似于使用应用 S&P 500 指数估计的内部收益率所计算的
Damodaran目前隐含 ERP。
The current present day adjustment is only a 0.6% increase to our IPCPL 500 K0/IRR
estimate, which would be added to the “raw” 18.1% K0/IRR calculated in Exhibit 2. Making
no adjustment would be analogous to using a historical average ERP. Making the
adjustment is analogous to using Damodaran’s current implied ERP using the estimated
IRR on the S&P 500.21
IPCPL 500 所有者/操作者补偿调整。对于 IPCPL 500,我们加总所有记录的所有者/经营
者补偿,将其加回到营业收入。然后,减去通过分析 IPCPL500地理位置性调整的领先市场补
偿数据库而确定的市场补偿。也就是说,我们所选择了相对较大的最低收入/资产规模标准,
以使得补偿调整的可靠区间相对于更大的 IPCPL 500的总营业收入来说并不那么重要。
IPCPL 500 owner/operator compensation adjustment. For the IPCPL 500, we sum all
reported owner operator compensation and add this figure back to operating income. We
then subtract market compensation determined from analyzing a leading market
compensation database geographically adjusted for the IPCPL 500. That said, our relatively
large minimum revenue/asset size criteria were selected to make the confidence interval of
the compensation adjustment not material relative to the much larger aggregate operating

隐含的私营企业定价曲线
©IACVA(CHINA) - BVR 15
income of the IPCPL 500.
IPCPL 500 现金加回/现金杠杆。我们所使用的 IPCPL 500收益数据是非杠杆的、投资资
本成本。与 Damodaran对现金持有量的上述分析一致,我们调整了 IPCPL 500的购买价格,
使其只包括经营/浪费/非生息现金持有量。我们估计这种非生息金额是收入的 1%。因此,
IPCPL的用户需要加上非杠杆的企业价值现值,也就是所有能够赚取利息的持有现金的现值,
如果只是对权益估值则需要减去所有利息债务。
IPCPL 500 cash add back/leverage. Our IPCPL 500 return data are an unlevered, cost of
invested capital. Consistent with Damodaran’s above analysis on cash holdings, we adjust
the purchase price of the IPCPL 500 to include only operating/wasting/non‐interest‐bearingcash holdings. We estimate this non‐interest‐bearing amount to be 1% of revenue.22
Therefore, users of the IPCPL need to add to the unlevered PV enterprise value all cash
holdings that are capable of earning interest and, if valuing equity, subtract all
interest‐bearing debt.
IPCPL 数据点 2 IWC 微型公司
数据点2是用于其他
拥有 1.5亿美元收入的可
比公司。鉴于这种规模的
私营公司可以上市,我们
将用 Fama-French 三因
素模型计算的标准 K0运
用到最广泛交易的交易
所 指 数 基 金 上 , 即
iShares Micro-Cap ETF
(Ticker IWC)。然后我们
将结果转化为相当于私
营 公 司 资 本 成 本 的
11.6%,如图 6所示。
IPCPL Data Point 2:
IWCMicro‐Cap
Point 2 on the IPCPL
图 6. IPCPL 资本成本(1.5 亿美元收入)
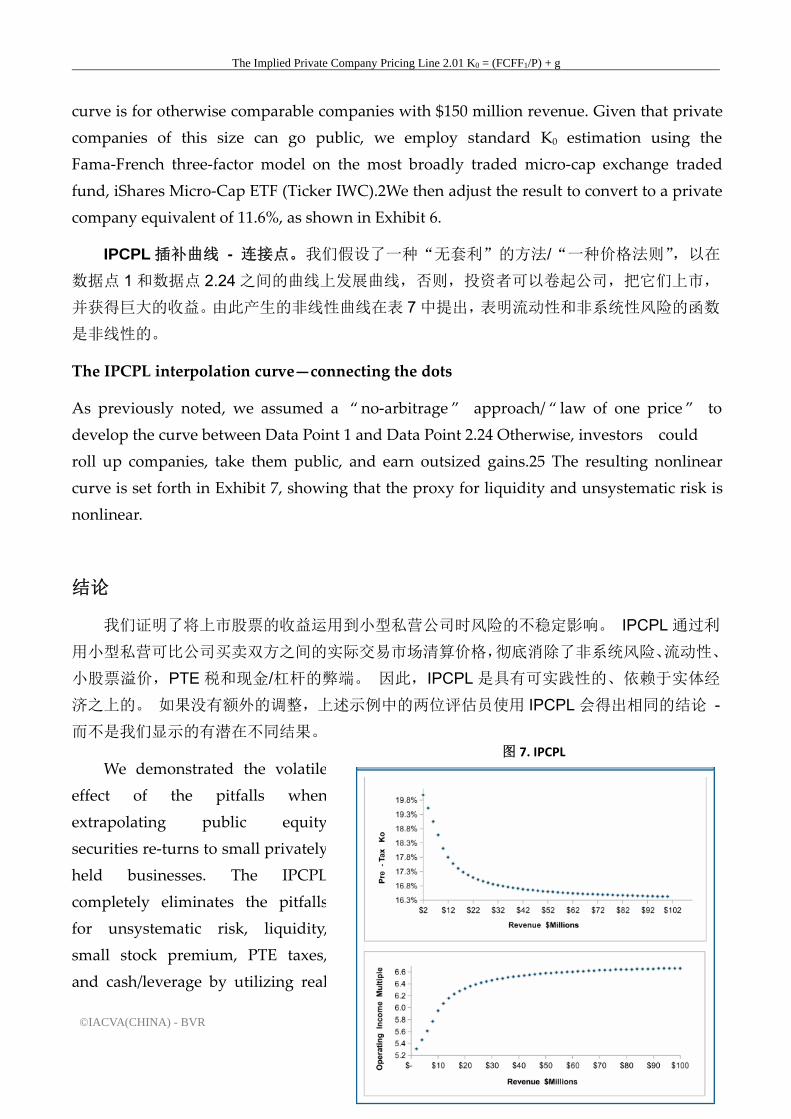
The Implied Private Company Pricing Line 2.01 K0 = (FCFF1/P) + g
©IACVA(CHINA) - BVR 16
curve is for otherwise comparable companies with $150 million revenue. Given that private
companies of this size can go public, we employ standard K0 estimation using the
Fama‐French three‐factor model on the most broadly traded micro‐cap exchange traded
fund, iShares Micro‐Cap ETF (Ticker IWC).2We then adjust the result to convert to a private
company equivalent of 11.6%, as shown in Exhibit 6.
IPCPL 插补曲线 - 连接点。我们假设了一种“无套利”的方法/“一种价格法则”,以在
数据点 1和数据点 2.24之间的曲线上发展曲线,否则,投资者可以卷起公司,把它们上市,
并获得巨大的收益。由此产生的非线性曲线在表 7中提出,表明流动性和非系统性风险的函数
是非线性的。
The IPCPL interpolation curve—connecting the dots
As previously noted, we assumed a “ no‐arbitrage ” approach/ “ law of one price ” to
develop the curve between Data Point 1 and Data Point 2.24 Otherwise, investors could
roll up companies, take them public, and earn outsized gains.25 The resulting nonlinear
curve is set forth in Exhibit 7, showing that the proxy for liquidity and unsystematic risk is
nonlinear.
结论
我们证明了将上市股票的收益运用到小型私营公司时风险的不稳定影响。 IPCPL通过利
用小型私营可比公司买卖双方之间的实际交易市场清算价格,彻底消除了非系统风险、流动性、
小股票溢价,PTE税和现金/杠杆的弊端。 因此,IPCPL是具有可实践性的、依赖于实体经
济之上的。 如果没有额外的调整,上述示例中的两位评估员使用 IPCPL会得出相同的结论 -
而不是我们显示的有潜在不同结果。
We demonstrated the volatile
effect of the pitfalls when
extrapolating public equity
securities re‐turns to small privately
held businesses. The IPCPL
completely eliminates the pitfalls
for unsystematic risk, liquidity,
small stock premium, PTE taxes,
and cash/leverage by utilizing real
图 7. IPCPL
隐含的私营企业定价曲线
©IACVA(CHINA) - BVR 17
trans‐action market‐clearing prices between buyers and sellers of comparable small private
businesses. Thus, the IPCPL is empirically tethered to economic reality. Without additional
adjustment, the two appraisers in the example above would using the IPCPL arrive at the
same conclusion—not something on the order of the potential magnitude we show.26
IPCPL并不完美,毕竟它是一个模型,但这不是问题。 真正的问题是,IPCPL是否比将
传统的股票市场收益运用到计算私营公司资本成本更可靠。我们认为,这个模型是有价值的,
我们已经发现这个模型在我们自己的实践操作中非常有用 - 无论是作为一种独立的工具,还
是在适当的情况下与其他方法一起使用。
IPCPL is not perfect—after all, it’s a model. But that is not the issue. The real question is
whether IPCPL is significantly more reliable than extrapolating traditional stock market
returns to private company cost of capital. We believe it is. For what it is worth, we are
already finding this model very useful in our own practices—either as a stand‐alone tool,
where appropriate, or in conjunction with other methods.
分享你的想法
如果企业价值评估行业要推进,就需要采取新的方式和方法。 当然,传统方法将永远占
有一席之地,但新工具可以而且应该被鼓励,并被认可为是评估工具的补充。 这意味着开放
对话,讨论新的概念,理论和方法。
Share your thoughts
If the business valuation profession is to advance, it needs to be open to new methods and
approaches. Of course, traditional methods will always have their place, but new tools can
—and should—be encouraged and considered as additionsto the valuation toolbox. That
means opening a dialogue and discussing new concepts, theories, and approaches.
注释
Annotation
1. We say “2.0” as this article updates Dohmeyer and Butler’s first exploration of this topic,
which was published in Business Valuation Review, Spring 2012, Vol. 31, No. 1, pp. 35‐47.
2. A business with only one highly specific product or one major customer is an example of
high unsystematic/diversifiable risk. Jim Hitchner says, “ The estimation of unsystematic
The Implied Private Company Pricing Line 2.01 K0 = (FCFF1/P) + g
©IACVA(CHINA) - BVR 18
risk is one of the more difficult aspects of calculating rates of return.” (Financial Valuation:
Applications and Models, 3rd Edition, p. 192.)
3. Based on our calculations of the total beta of nearly all U.S. publicly traded stocks sorted
by size.
4. Many appraisers believe that the small stock premium accounts for some of the 3x total
risk issue. Although the cause and amount of the small stock premium are controversial,
diversifiable risk, by definition, is not the cause.
5. Dr. Aswath Damodaran, 26th Annual Valuation Roundtable of San Francisco, April 20,
2012, Berkeley, Calif.
6. Dr. Aswath Damodaran, Marketability and Value: Measuring the Illiquidity Discount,
Stern School of Business, July 2005.
7. One way to minimize duress collinearity is to use the margin analysis provided in the
Duff & Phelps Risk Premium Report. For an excellent analysis of the intertemporal flaw of
CAPM, see John Y. Campbell and Tuomo Vuolteenaho, “Bad Beta, Good Beta,” Harvard
University, August 2003, ssrn.com/abstract=343780.
8. Dr. Aswath Damodaran, Marketability and Value: Measuring the Illiquidity Discount,
Stern School of Business, July 2005. This possibility is still being explored by researchers
today.
9. James Harrington, Conversations With the Masters series, NACVA Annual Consultant’s
Conference, Dallas, June 2012).
10. Based on IRS Statistics of Income (SOI) data showing significant increases in new
S‐corporation formations versus nearly no new C‐corporation formations.
11. Keith F. Sellers and Nancy J. Fannon, “Valuation of Pass‐Through Entities: Looking at
the Bigger Picture,”2012 AmericanTaxation Association Midyear Meeting: JLTR Conference,
December 2011. Available at ssrn.com/abstract=2003901 or dx.doi. org/10.2139/ssrn.2003901.
12. Dr. Aswath Damodaran, “ Dealing With Cash, Cross Holdings and Other
Non‐Operating Assets: Approaches and Implications,” Stern School of Business, September
2005.
13. For the cost of going and staying public, see Stuart, Alix, “Little Change in Audit Fees,”

隐含的私营企业定价曲线
©IACVA(CHINA) - BVR 19
June 16, 2011, CFO.com (www.cfo. com/article.cfm/14582443/c_14582548).
14. This ex‐ante approach is essentially the same approach used by Damodaran when he
publishes his monthly equity risk premium estimates. And note that IPCPL, like
Damodaran ’s monthly ERP model, requires appraiser judgment. That is, the K0 model is
axiomatic, but the inputs must be estimated.
15. Both size criteria span the 95th and 99th percentiles of Pratt ’s Stats transactions in the
past two years, and both resulted
in approximately the same number of transactions. We adjusted these figures slightly to
create a rounded number of 500 companies. Further, we only included transactions of U.S.
companies that were acquired by a private company and which reported owner ’ s
compensation. And we did not double count deals that fell into both the sales‐ and
asset‐size criteria.
16. Exhibit 4 is an Excel model simulating individual, unreliable data points with a
specified mean of 6.00 and a standard deviation (standard error here) of 1.35. For
illustration purposes only, this error would imply that the data are inherently unreliable for
its typical use, yet still highly reliable for a sample size of 500 transactions.
17. Although we are not aware of any research that claims that these data providers ’
transaction data are systematically biased (net net), we believe that we must qualify our
confidence interval claims accordingly.
18. Net birth data from the BLS indicate new business formations exceed old business
deaths by 0.44% annually over the relevant time frame.
19. Had real growth been as low as 1%, for example, the aggregate revenue in Year 25
would have exceeded $500 million.
20. We would normally estimate inflation by subtracting the 20‐year Treasury Inflation
Protected Securities (TIPS) rate from the 20‐year Treasury bond. However, the TIPS rate is
presently not a reliable indicator because of the current low interest rate environment and
the fact that a TIPS inflation contract is bound at zero. Practitioners could also obtain an
estimate of the long‐term inflation rate from The Livingston Survey.
21. See pages.stern.nyu.edu/~adamodar/.
22. This percentage is based on our experience. We believe differentiating on the basis of

The Implied Private Company Pricing Line 2.01 K0 = (FCFF1/P) + g
©IACVA(CHINA) - BVR 20
interest‐bearing versus non‐interestbearing cash is more objective than other methods of
estimating “excess cash” and failing to relever beta for that excess.
23. The iShares Micro‐Cap ETF seeks investment results that correspond generally to the
price and yield performance of the Russell Microcap® Index. See
us.ishares.com/content/stream.jsp?url=/content/en_us/repository/resource/fact_sheet/iwc.p
df for more information.
24. The economic law of one price, stated in any microeconomics textbook, is stated as: “In
an efficient market, all identical goods must have only one price.” The intuition for this law
is that all sellers will flock to the highest prevailing price, and all buyers to the lowest
current market price. In an efficient market, the convergence on one price is instant.
25. In applying this approach, we used the Double Lehman formula; see
en.wikipedia.org/wiki/Lehman_Formula.
26. As referenced in our webinar to the Experienced Business Appraiser Group on LinkedIn
on Feb. 19, 2013, if appraisers determine that their subject company is more or less risky
(systematic and/or total risk) relative to small private companies of similar size, we
recommend a risk analysis, which is also available at www.Biz‐App‐Solutions.com. In this
risk adjustment, where we move off the IPCPL (typically, only slightly), we account for
differences in systematic as well as total risk of the subject company using a normalized
risk assessment of various publicly traded guideline companies as a benchmark. We plan to
write a follow‐up article to address this generally nominal adjustment to the cost of capital.
跳出模型——跨国企业评估
©IACVA(CHINA) - BVR 1
Getting Your Head Out of the Model:
Valuing a Multinational Company
跳出模型——跨国企业评估
作者:James T. Budyak CPA/ABV, CFA, ASA
翻译:北京北方亚事资产评估事务所蒋东勇、王本楠
中联国际评估咨询有限公司胡东全、程海伦
编者续:跨国企业价值评估的指引相对很少。虽然有相应的模型可以借鉴,但不得盲目使
用。由于没有一成不变的估值理论,我们要仔细斟酌模型的输入参数。作者打破模型的架构并
且研究了基于实际动态中更为现实的价值评估及资本成本。该文章是作者最初于 2006年 5月
发表在《企业价值评估更新》杂志中《跳出模型——尽职调查及国际资本成本研究》一文的续
篇。
评估师在进行跨国企业评估中应当扩展尽职调查的程序,从公司管理层获取区域经营的具
体影响信息。此外,企业价值评估师应评估国别风险报酬及国家信用评级。
在此建议对尽职调查工作进行细化,分解成对以下关键领域的调查:公司‐国家‐货币‐区域
(CCCS)。在本文中会分别讨论以上四点内容并给出应用 CCCS结构的实际案例。而且,文
章还会涉及加权平均资金成本(WACC)的研究及推荐考虑国家投资组合的技巧。

Getting Your Head Out of the Model: Valuing a Multinational Company
©IACVA(CHINA) - BVR 2
公司。对一家企业尽职调查,要考虑其历史和前景,以及何处采购原料、在哪且如何制造
产品或提供服务,探究企业的竞争格局、技术壁垒以及如何运用市场手段去拓展销售。针对公
司的内在研究是对其坐落位置、终端市场和与之相关风险因素的鉴别过程。特别关注区域及正
常经营中涉及的流通货币。
评估师用可比数据和比较基准同标的公司的可比数据进行比较,重点关注收入、风险和盈
利能力(GRP)属性,以确保可比案例的市场价格与标的公司价格有效连接。GRP可以从定性
及定量的视角描述为何选取 EBITDA或市消率作为定价倍数。
国家。最终对跨国企业的评估应当考虑 GRP 和 CCCS。跨国企业的风险分析包括了解标
的公司的销售市场在哪些国家,主要的生产设施分布在哪里。Aswath Damodaran 博士(纽
约大学斯特恩商学院)及传奇投资家 Gary Brinson的在相关讨论中有非常精明的见解。实际
上,这些专家认为公司总部所在地及在证券交易所上市的位置与公司销售地及经营所在地相比
并非十分重要。
对国家的分析需要截取特定国家的近期信息。相关参考来源多种多样,有付费的,也有免
费的,可参考以下免费信息:
www.coface.com/Economic‐Studies‐and‐Country‐Risks/;
www.cia.gov/library/publications/the‐world‐factbook/;
www3.ambest.com/ratings/cr/crisk.aspx; and
www.tradingeconomics.com/.
这些网站并不给出权益资本成本,但多数会描述出目前的经济状况和(或)提供相对于全
球的可比较的国别评级。
另一方面,Damodaran博士的网站免费提供一种估算权益成本及债务成本的方法。这种
方法考虑了多种数据,包括源自穆迪评级(等同于标普)的区域货币主权评级和信用违约互换
( CDS ) 差 价 评 级 。 详 细 内 容 及 数 据 可 以 在
www.stern.nyu.edu/~adamodar/pc/datasets/ctryprem.xls下载 Excel电子表格。
货币。当我们谈及到风险,我们指的是“总风险”,且等同于有意愿的购买者(美国税务总
局 IRS对价值的定义)或普通的市场参与者(财会标准委员会 FASB对价值的定义)估计的总
回报,并认为是适宜的。总回报包括收益及资本利得因素。普遍理解为,总回报涉及了货币流
通因素。

跳出模型——跨国企业评估
©IACVA(CHINA) - BVR 3
当对非国内企业投资时,跨国公司开始接触非本国的币种。货币风险是总风险的重要组成
部分。有证据显示货币风险或许占到总增量国家风险的 50%以上。根据 Francesca Carrieri,
Vihang R. Errunza 和 Basma Majerbi (2004)的文章《新兴市场汇兑风险是否影响全球股票价
值》中,新兴市场中很多资产的价格受货币风险影响很大,且在发达市场和新兴市场中随着时
间变化。总货币溢价在经济上也很重要,因为平均货币溢价占有全球资产绝对价值整体溢价的
40%。由此货币风险在新兴市场及发达市场的资产定价中是一项重要的风险因素。
Campbell Harvey教授(杜克大学)曾就货币风险的重要性在信件中写到:“我开始在我
的课案中讲述在高风险的市场中,很可能一半的风险与货币有关。”
在近期,2014年 5月 8日由 Axel G. Merk, (Merk投资)发文的《国际股票:货币问题》
中也强调了货币风险在总风险中的影响。当进行国际股票投资时,现金流回报的产生可被分解
为股权回报及货币回报。在表 1 中显示了在月度股票指数收益,以美元进行测算,有 30%至
50%源于货币的波动1。
数据来源:默克投资、彭博
注:总回报指数源自每一地方股
票市场。(股利再投资)
期间:2004年 4月 30日至 2014
年 4月 30日,基于月度回报的计算。
货币风险的影响既有好处
也有坏处。在当地股市上涨的
月份中,可能会有很大一部分
收益归因于货币升值。同样在
股市下跌的月份中,亏损的很
大一部分可能归因于货币贬值。
同理,货币的波动会影响总回报。跨国企业离岸业务组合会用到不同功能的货币,可能会
导致外币汇兑损益。对于一家跨国企业,位于发展市场的分支机构采购或销售很可能会受到当
地国家货币的变动影响。或者涉及主要国际产业的海外运营和产品销售产生美元或欧元等硬通
货。
1 在分析中引用的股票指数有:澳大利亚:S&P /ASX 200 净总回报指数;加拿大:S&P / TSX 复合总回报指数;瑞士:瑞士市场总
回报指数;欧元区:Euro Stoxx 50 总回报指数;英国:富时 100 指数总回报指数;日本:日经 225 总回报指数;挪威:奥斯陆证券交易所
OBX 指数(自 2006 年 4 月以来一直是一个总回报指数);新西兰:nzx50 总回报指数;瑞典:OMX 斯德哥尔摩 30 总回报指数;新加坡:富时 STI 总回报指数。所有的股票市场指数都以当地货币为标准,包括再投资的股息。
表 1. 美元投资的货币回报贡献度‐基于国际股票投资组合的投资者

Getting Your Head Out of the Model: Valuing a Multinational Company
©IACVA(CHINA) - BVR 4
问题在于货币是风险的主要贡献因素,但也取决于跨国公司业务的性质。如果该跨国公司
完全处于源自新兴市场的个体地方国家货币,风险程度可能会高。但是如果从多个离岸下属公
司获得硬通货的话,风险的比例就会有几分减轻。
还要考虑所涉及的硬通货的形式。现如今,美元或欧元被视为安全货币,但未来将会如何?
这些货币是否会让位于人民币?或是会有国际货币篮子或商品?
对于美元在国际贸易结算中可能被取代的观点并非牵强。最近,2014年 3月 26日发表的
一篇文章《欢迎来到货币战争:俄罗斯、中国、印度绕过石油美元》里,作者 John Rubino
是www.Dollarcollapse.com 网站的经营者也是 CFA杂志的作者, 说道:
俄罗斯在巩固下一个、最大的(在人口和自然资源方面),且最重要的地缘政治欧亚轴线新
常态:中国‐俄罗斯‐印度…。如果俄罗斯、中国和印度决定开始以其本国货币交易石油,或者
作为零对冲投资,用黄金,届时石油美元会只是几种主要货币之一。中央银行和贸易公司现在
持有 60%的以美元计价债券的储备,将不得不通过将美元兑换成其他货币来进行再平衡。数
万亿美元会在很短的时间被投放在全球市场,这将会以破坏性的而不是有利的方式拉低美元的
外汇价值,提高美国国内利率,使美国更难在经济上或在军事上挤兑世界其他地区。
文章还介绍到:
俄罗斯、中国、印度看起来像是获得了双赢。他们的货币赢得威望,为他们的政府在政治
及军事上提供了强大的动力。他们的死对头美国,在这项伟大游戏中被削弱了。这些年他们所
清空的黄金及白银升值幅度足够弥补海外债券的贬值。
类似的理论在斯普劳特资产管理公司首席投资策略师 John Embry发表的文章《使美国屈
服对西方来讲是可怕的》及王者世界新闻中写到:
由主要国家以其他货币对石油定价的变化是巨大的,这些国家已经厌倦了美国所享有的优
势。由此,国际交易定价中,正在形成由美元定价转变为以其他货币。这会使得美元地位大幅
降低,我认为石油美元运动会激发出诸如此类的事情。
类似的货币趋势理论在 2014 年 4 月 25日的 http://bit.ly/16wH3wu 中一文《标准普尔股
票市场达到和黄金同一高度了么?》同样有所论述:
另一方面,我们认为更重要的是,美元作为储备货币的破裂。人们普遍认为,美国享有拥
有世界储备货币的特权。美国已经能够将其债务提升到人类历史上从未见过的水平,因为它是
一种普遍接受的货币,在大多数交易资产类别中使用,特别是石油(石油美元)。但是美元作
为储备货币的终结即将来临。以历史标准为基准,世界储备货币的平均寿命为 27年,美元的
霸权地位已经经历了 43年。先前对石油美元的威胁已经被使用武力一笑置之。然而,乌克兰

跳出模型——跨国企业评估
©IACVA(CHINA) - BVR 5
的例子具有能成为一个轴心点的潜质。西方国家对俄罗斯采取的笨拙的制裁,得以对货币核心
体系:石油美元的报复。俄罗斯即将与主要贸易伙伴签署能源合作,以非美元货币计价。我们
相信,这将成为一个先例,一些亚洲和新兴国家也将效仿。这将导致人们对美元资产的信任丧
失,这无疑会影响美国股市。不用说,这也应该是贵金属价格的主要刺激因素。
如果一家公司的外汇敞口没有对冲,而危机发生时,该公司可能被迫报导重大的外汇损失。
新兴市场公司以具有蔓延性而闻名。如此就是一家打喷嚏,全盘感冒。新兴市场股票和债券市
场对发达(国内)市场所享有的极端波动不具有免疫力。这种免疫是由于美国的储备货币地位,
导致全球投资者认为美国在危机时期是一个安全的避风港。然而,美国的货币储备地位很可能
在未来受到挑战,这将给资本市场(和评估师)带来一个问题,如何在折现率定量模型中寻找
无风险利率的基准。美元地位的下降可能与美国国债的抛售相一致。美国国债在过去几十年里
一直是投资界的无风险标准。
区域。尽职调查的范围是研究行业或公司运营的区域,或许还会牵扯到诸如北美自由贸易
协定或是欧元区这样的区域贸易集团。有些产业具有地域性的本质,比如杂货店,那里的主要
经济是地方经济。另一方面,对一家石油化工产业或技术产业的公司来说,焦点将集中在区域
或全球经济体上。
自然资源企业是个例外,资源的位置是评估国家和政治风险的关键因素。据凯西研究首席
能源投资策略师Marin Katusa称:“然而,我们在资源投资领域所面临的风险是最不可预测的。
资源公司应对从大宗商品价格波动到税收变化的风险,从区位不确定性到新技术的挑战,从洪
水 和 龙 卷 风 到 劳 工 动 乱 。 ” ( 参 见
www.caseyresearch.com/cdd/never‐underestimate‐country‐risk.)
回顾。如果通过该种框架来实施尽职调查,可能会发现跨国公司并没有想象的那么危险。
完整的风险损失与公司总部所在地(所在国家的政治风险)有关联,需要通过对 CCCS 架构
的四个方面进行分析并调整。当然也会有另一种表现形式,即:分析中会发现即便公司总部设
在美国本土,而产品出口至国外新兴市场并在发展中国家建有工厂,也会在公司中存在较大的
风险。
考虑到企业的“风险回报”,一种极端是低 BETA 值,稳定的企业设立在发达市场中;另
一种极端是企业处在完全依赖于高风险的地方经济,比如阿富汗、叙利亚、苏丹或是津巴布韦。
大多数公司在这两种极端之间应该有部分,而不是全部,由国家/政治带来的风险溢价。
CCCS方法可以帮助评估师选择适当的权益资本成本模型,这样,考虑到企业的特性,包
括在公司全球业务中的行业领域、货币的流动性,WACC研究中债务成本的潜在风险调整将

Getting Your Head Out of the Model: Valuing a Multinational Company
©IACVA(CHINA) - BVR 6
在后文讨论。
CCCS案例分析。为了演示 CCCS 架构,我们设想一家总部设立在美国的跨国企业,其
在墨西哥运营着由美国实体控制的装配工厂(名为maquiladora),任务是为在墨西哥运营的
工厂设计一项权益资本成本。
墨西哥传统运营大都取决于当地的经济,被认为经营风险比在美国高。例如,最近一期晨
星数据(2013)设定墨西哥权益资本成本(CRRM线性模型)为 16.79%,对比美国的权益资
本成本数据为 10.92%,之间有 5.87个百分点总增量需求回报。在墨西哥运营完全取决于当地
经济,会涵盖墨西哥的全部国家风险,如同 CRRM的现行模型所展示的那样。
再来看一下标的公司的运营,因为工厂的母公司设立在美国,可能依靠美国的经济或是全
球的市场。如果那样的话,可以认为所估算的权益资本成本比完全基于在墨西哥的运营要低。
进一步的尽职调查证明了这一点,工厂销售全部产品给母公司,母公司是一家跨国公司,有着
全球品牌、优良技术、良好的客户关系。工厂从销售过程中获得美金。由此这样的运营并不被
看做是严格意义上的本土运营。
标的公司比独立在墨西哥运营企业(仅依靠当地经济)风险小这个理念,也是学术界和金
融专家在国家风险评估中谈到的“整体与局部”理论部分。在近年间,随着美国与墨西哥的经贸
合作,双方经济稳步增长,而这种争论逐步协调统一,特别是在北美自由贸易协定执行之后。
在标的公司的运营中,因为工厂只是全球运营的一部分,并不依靠地方经济,所以国家风
险减轻了。由于销售过程中使用了更有吸引力的硬通货而非墨西哥比索,从而带来了货币风险
的降低。如何量化风险的降低?可以想一下 Harvey 教授关于货币风险可占到总风险溢价的
50%之多的观点。你也许会争论还存在与恐袭、动荡、贪腐相关的如同墨西哥这样新兴市场的
其他国别风险。权益资本成本被归类到国别分布风险模型(10.38%权益资本成本)的下限,是
典型的货币风险的最低程度,并且可以被考虑使用国际 CAPM模型(11.82%),因为这样在
评估中不会因为使用了较高的风险调整而低估了其价值。
有充足的证据表明,标的公司以适当的资金成本运营,证明其权益资本成本比用包含了墨
西哥国家主权风险模型要低,诸如CRRM模型(参见 1996年 2月 7日Claude B. Erb, Campbell
R. Harvey, and Tadas E. Viskanta编纂的《预期收益及 135个国家的波动性》。
工厂低货币风险的实质意味着对风险总量下调了大概一半,5.87个百分点(美国相对墨西
哥的 CRRM)。如此的调整降低了墨西哥 CRRM,为 13.86%(墨西哥 16.79%及美国 10.92%
的平均数)。因为标的公司的业务源自于对美国客户的销售,有这样一种争论:其国别风险甚
至会更低,在美国 CRRM线性模型上方些许且接近最低点的位置。这是因为其运营地点在墨

跳出模型——跨国企业评估
©IACVA(CHINA) - BVR 7
西哥,且可能受到某些国家因素的负面影响。
风险溢价会减少三分之二,在 CRRM模型中,墨西哥企业运营风险减少 5.87个百分点,
即其权益资本成本约为 12.86%。
WACC的研究。在本文所述的评估国别风险,进一步细化需要在整体WACC 模型中考
虑适用的债务成本。
简言之,是否需要使用债务成本以调整国家风险溢价,这个问题取决于特定的因素及情况。
例如,假定标的公司是一家跨国企业,一系列海外运营位于成熟市场及新兴市场国家,我们同
样也假定这家跨国公司在发达国家持有重要的可证券化资产。在这个案例中,或许会有这样的
争论,可以在这些发达国家发生实质性的借贷融资,其利率不会有任何的国别风险。
另一方面,评估师可能会得出结论,标的公司被分割而应获得全部的国别/政治风险。如
果评估师想要为风险溢价而调整权益资本成本和债务成本,可以参照达摩达兰的著作。
例如,访问达摩达兰的网页 pages.stern.nyu.edu/~adamodar/pc/datasets/,特别是
uValuedataJan2014.xls文件(参见表 2)。可以看到设定的美国(成熟的)股权风险溢价(ERP)
是 5%。考虑国家投资组合,许多实质上是新兴及发展中市场,其全球权益风险溢价为 6.35%。
美国与全球的ERP之间存在 1.35%的
偏差,从理论上来说,这并不是为了
调整全球投资组合中国家风险的债
务成本而增加的数额。在其早期的著
作及讲演中,达摩达兰指出整体上讲
新兴市场的债务较之新兴市场的权
益更加稳定,可以根据相关股票市场
波动率乘以违约价差来估计调整后
的国家风险溢价(在国别股票市场中
的标准差/国别债券的标准差)。达摩达兰同时指出:“我曾使用过新兴市场平均水平 1.5”。(股
票市场比 http://bit.ly/1jDAjgP大概多 1.5倍)
采用他的全球违约债务成本(对债务成本增加)为 0.9%,意味着当股权较全球市场风险
向上调整了 1.35个百分点,债权向上调整 0.9个百分点。其比率是 135/90为 1.5倍,这与达摩
达兰早先的观点是一致的。
其他数据也支持这一理论。达摩达兰曾分析各种新兴市场国家的股权市场相对债权市场
的波动性,并得到“在新兴市场,股权风险较债权风险大约高出 1.5至 2.0倍”。成熟市场中这
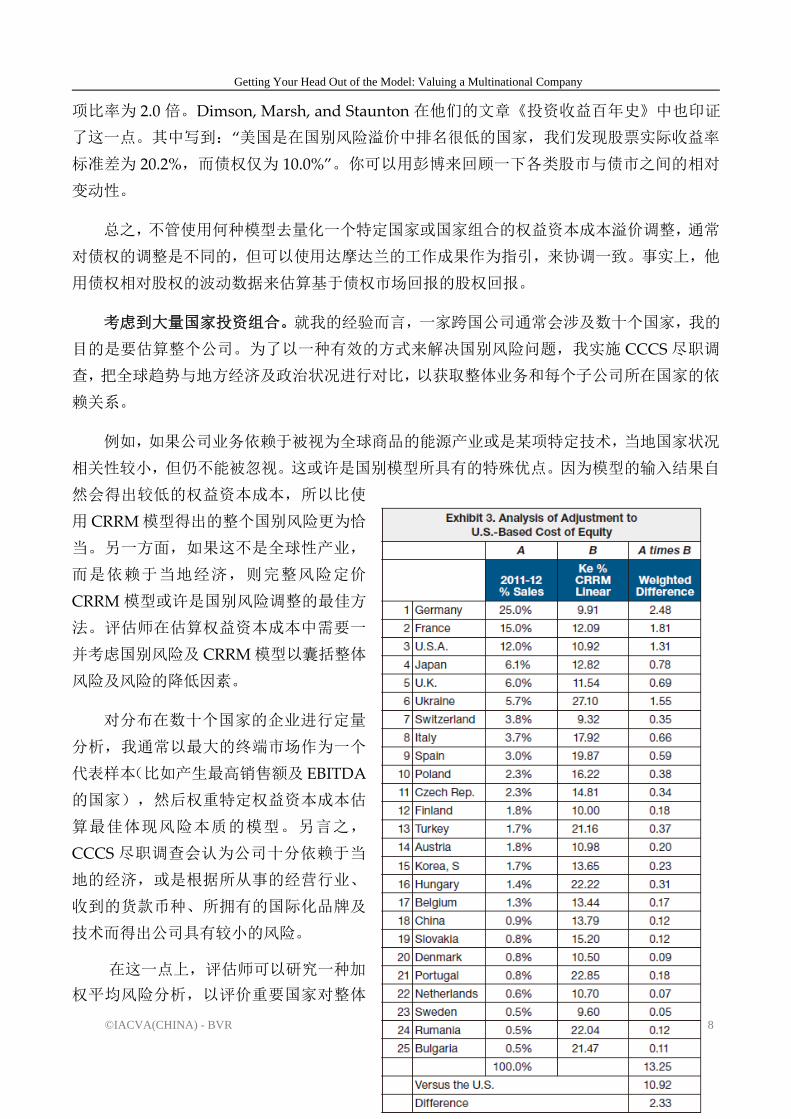
Getting Your Head Out of the Model: Valuing a Multinational Company
©IACVA(CHINA) - BVR 8
项比率为 2.0 倍。Dimson, Marsh, and Staunton 在他们的文章《投资收益百年史》中也印证
了这一点。其中写到:“美国是在国别风险溢价中排名很低的国家,我们发现股票实际收益率
标准差为 20.2%,而债权仅为 10.0%”。你可以用彭博来回顾一下各类股市与债市之间的相对
变动性。
总之,不管使用何种模型去量化一个特定国家或国家组合的权益资本成本溢价调整,通常
对债权的调整是不同的,但可以使用达摩达兰的工作成果作为指引,来协调一致。事实上,他
用债权相对股权的波动数据来估算基于债权市场回报的股权回报。
考虑到大量国家投资组合。就我的经验而言,一家跨国公司通常会涉及数十个国家,我的
目的是要估算整个公司。为了以一种有效的方式来解决国别风险问题,我实施 CCCS尽职调
查,把全球趋势与地方经济及政治状况进行对比,以获取整体业务和每个子公司所在国家的依
赖关系。
例如,如果公司业务依赖于被视为全球商品的能源产业或是某项特定技术,当地国家状况
相关性较小,但仍不能被忽视。这或许是国别模型所具有的特殊优点。因为模型的输入结果自
然会得出较低的权益资本成本,所以比使
用 CRRM模型得出的整个国别风险更为恰
当。另一方面,如果这不是全球性产业,
而是依赖于当地经济,则完整风险定价
CRRM模型或许是国别风险调整的最佳方
法。评估师在估算权益资本成本中需要一
并考虑国别风险及 CRRM模型以囊括整体
风险及风险的降低因素。
对分布在数十个国家的企业进行定量
分析,我通常以最大的终端市场作为一个
代表样本(比如产生最高销售额及 EBITDA
的国家),然后权重特定权益资本成本估
算最佳体现风险本质的模型。另言之,
CCCS 尽职调查会认为公司十分依赖于当
地的经济,或是根据所从事的经营行业、
收到的货款币种、所拥有的国际化品牌及
技术而得出公司具有较小的风险。
在这一点上,评估师可以研究一种加
权平均风险分析,以评价重要国家对整体

跳出模型——跨国企业评估
©IACVA(CHINA) - BVR 9
国家风险的贡献。如此,就与达摩达兰的观点一致,“评估新兴市场公司时,评估师过多关注
公司组建在哪里,过少关注公司的业务在哪里。”。在实践中,我一直考虑跨国公司的终端市
场风险,并纳入折现率中。如果在其他国家只有重要的生产设施而无销售,也应当作为考虑因
素。
通过 Excel表 3中所示,在该例子中,我们看到每个国家的业务都依附于当地经济,我们
采用 CRRM模型来衡量每个参与的国家相对于美国的风险。(注意,销售数据仅作为说明,
CRRM源自最近的晨星国际资本成本报告。)这种分析表明,在美国的权益资本成本基础上
可能向上调整约 2.3%。
结语。如今国际评估项目中,对折现率的研究不仅仅是以用电脑计算模型建立加权平均资
本成本模型为基础。全球经济的动态特性要求评估分析人员不仅要谨慎,更要打破模型的束缚
以探究真正影响标的公司的因素。所设计的 CCCS 架构可以在公司、国家、货币及区域等至
关重要的方面指引尽职调查。
James T. Budyak, CPA/ABV, CFA, ASA,是估值研究公司的高级副总裁。他活跃于对企
业的评估及尽职调查、股权及债权的投资、无形资产以及偿付能力及公允价值意见等。他曾研
究数十过国家,拜访过 40多个国家。他的联系方式是 [email protected]及(414)
221‐6238。

Getting Your Head Out of the Model: Valuing a Multinational Company
©IACVA(CHINA) - BVR 10
Getting Your Head Out of the Model:
Valuing a Multinational Company
By James T. Budyak CPA/ABV, CFA, ASA
Editor’s note: There is relatively little guidance on the valuation of multinational companies.
There are models that can be used, but they should not be used blindly. The inputs to the models
must be carefully considered because there is no one‐size‐fits‐all methodology. The author has
developed a framework designed to breakout of models and develop a more realistic valuation and
cost of capital based on real‐world dynamics. This article is a follow‐up to the author’s “Getting
Your Head Out of the Model: Due Diligence and Developing International Cost of Capital,”
originally featured in the May 2006 issue of Business Valuation Update.
Appraisers valuing a multinational company (MNC) should expand their due
diligence process to solicit information from company management about the specific
effects of operating in their particular location. Additionally, business valuators should
review country‐risk‐and‐return and country‐risk ratings.
I recommend that you break down your due diligence into these key areas of
investigation: company country‐currency‐sector (CCCS). In this article, I will discuss each
of these and give an example of using the CCCS framework in practice. Also, I will cover
developing a weighted average cost of capital (WACC) and recommend a technique for
considering a large portfolio of countries.
Company. Due diligence on a company considers its history and outlook as well as
where it sources its inputs, and how and where it produces its products or provides its
services. It looks at the company’s competitive landscape, barriers to entry, and how it uses
marketing to generate sales. Inherent in studying a company is an appreciation for its
location and its end markets and the risks associated with these elements. Special focus on
the industry (sector) and currencies that are involved in its normal operations is
recommended.
Appraisers use comparable data (comps) and benchmark a subject entity with its
comps, focusing on the attributes of growth, risk, and profitability (GRP) to ensure the
market prices of comps to the pricing of a company has been effectively bridged. GRP
跳出模型——跨国企业评估
©IACVA(CHINA) - BVR 11
contributes to the story from a qualitative and quantitative perspective in terms of why an
EBITDA or price/revenue multiple is selected for the subject entity being valued.
Country. Ultimately, the valuation of an MNC should consider GRP and CCCS. The
risk analysis for an MNC includes knowing what countries the subject company sells to
and where the major production assets are located. The astute views of Dr. Aswath
Damodaran (Stern School of Business, New York University) and legendary investment
manager Gary Brinson are relevant to this discussion. In effect, these experts suggest that
the location of the company’s headquarters or where the company’s publicly traded stock is
exchanged is not nearly as important (if at all) as where the company generates its sales or
does business.
The country analysis requires obtaining recent information on a specific country. There
are numerous sources for reference, some free and some for a fee. Examples of free
information:
• www.coface.com/Economic‐Studies‐and‐Country‐Risks/;
• www.cia.gov/library/publications/the‐world‐factbook/;
• www3.ambest.com/ratings/cr/crisk.aspx; and
• www.tradingeconomics.com/.
These websites won’t give you a cost of equity, but most will describe the current
economic conditions and/or provide some comparative ratings of a country versus the
world.
Dr. Damodaran’s website, on the other hand, is free and provides a means of
estimating a cost of equity and a cost of debt, considering a variety of data including local
currency sovereign ratings from Moody’s (or S&P equivalent) and credit default swap
(CDS) spreads by rating. For more details, download the Excel spreadsheet that contains
these data from www.stern.nyu.edu/~adamodar/pc/datasets/ctryprem.xls.
Currency. When we speak about risk, we refer to “total risk” and, equivalently, what
would be an estimated total return that a willing buyer (IRS definition of value) or average
market participant (FASB definition of value) judges to be applicable. Total return includes
the elements of yield plus capital gain. Inherent in the total return is an understanding of

Getting Your Head Out of the Model: Valuing a Multinational Company
©IACVA(CHINA) - BVR 12
what currencies are involved.
When investing in nondomestic businesses, the MNC is exposed to nondomestic
currencies. Currency risk is a significant component of total risk. Evidence exists that
currency risk may be 50% of total incremental country risk or more. According to an article
titled “Does Emerging Market Exchange Risk Affect Global Equity Prices” by Francesca
Carrieri, Vihang R. Errunza, and Basma Majerbi (2004), “The price of EM currency risk is
significant and time‐varying for a large number of assets from developed and emerging
markets. Total currency premia are also economically significant as, on average, they
represent about 40 percent of the total premium in absolute value across all global assets.
Therefore currency risk is an important risk factor in pricing both emerging market and
developed market assets.”
Professor Campbell
Harvey (Duke University) has
written to me on the
significance of currency risk:
“I stated in presentations and
in my course material that, for
a high risk market, it is likely
that about half of the risk is
related to currency.”
The impact that currency
risk has on total risk is also
highlighted in a recent article
titled “International Equities:
Currencies Matter,” by Axel G
Merk, Merk Investments, May
8, 2014. “When investing in
international equities, the return stream generated can be broken into equity returns and
currency returns. As the chart in Exhibit 1 shows, between 30% and 50% of monthly equity
index returns, when measured in U.S. dollars, were attributable to currency fluctuation.1
The impact of currency risk works both ways—on the upside as well as on the
downside. In a month where the local country’s stock market moved up, it is possible that a

跳出模型——跨国企业评估
©IACVA(CHINA) - BVR 13
good portion of the gain may be attributed to currency appreciation. Similarly, in a down
month, a good portion of the loss may be attributed to currency depreciation.
Similarly, currency volatility can impact total return. The MNC may be subject to
foreign exchange gains or losses as a result of its portfolio of offshore businesses, which
have different functional currencies. For an MNC, the purchase or sale of a division that is
located in a developing market will likely involve exposure to local country currency
volatility. Or it could be that offshore operations are involved in a major global industry
and product sales generate hard forms of currency such as dollars or euros.
The point is that currency is a major contributor to risk, but it depends on the nature of
the MNC’s business. If the subject MNC is completely exposed to individual local country
currencies from emerging markets, it may have a high degree of risk. But if it is gathering
hard currency from various offshore affiliates, the perception of risk is somewhat mitigated.
Also consider the form of the hard currency involved. Today, dollars or euros are
considered to be safe havens. But what about the future? Will these currencies give way to
Chinese yuan/renminbi? Or will there be a global basket of currencies or goods?
The idea that the U.S. dollar may be replaced in global trade settlements is not that
far‐fetched. Consider a recent article, “Welcome to the Currency War: Russia, China, India
Bypass the Petrodollar,” by John Rubino, who manages www.Dollarcollapse.com and
writes for CFA Magazine, on March 26, 2014. Rufino says:
Russia is aggressively cementing the next, biggest (certainly in terms of population and natural
resources), and most important New Normal geopolitical Eurasian axis: China – Russia – India… . If
Russia, China and India decide to start trading oil in their own currencies—or, as Zero Hedge speculates, in
gold—then the petrodollar becomes just one of several major currencies. Central banks and trading firms that
now hold 60% of their reserves in dollar‐denominated bonds would have to rebalance by converting dollars
to those other currencies. Trillions of dollars would be dumped on the global market in a very short time,
which would lower the dollar’s foreign exchange value in a disruptive rather than advantageous way, raise
domestic U.S. interest rates and make it vastly harder for the U.S. to bully the rest of the world economically
or militarily.
The article continues:
For Russia, China, and India, this looks like a win/win. Their own currencies gain prestige, giving their

Getting Your Head Out of the Model: Valuing a Multinational Company
©IACVA(CHINA) - BVR 14
governments more political and military muscle. The U.S., their nemesis in the Great Game, is diminished.
And the gold and silver they’ve vacuumed up in recent years rise in value more than enough to offset their
depreciating Treasury bonds.
A similar theme was written about in the article “This Is Horrifying for the West &
Will Bring the U.S. to Its Knees” by John Embry, chief investment strategist at Sprott Asset
Management LP, and King World News:
The move by major nations to price oil in other currencies is huge. These other nations are sick and tired
of the advantage the United States has enjoyed. This is why there is a move to start pricing international
transactions in a currency other than U.S. dollars. This could be the thing that brings the U.S. dollar to its
knees…. I think the petrodollar movement could certainly trigger something like that.
A similar theme on currency trends was voiced in an article titled “Has the Stock
Market S&P Topped at Exactly the Same Price as Gold?” http://bit.ly/16wH3wu, dated
April 25, 2014:
On the other hand, of higher importance in our view, is the cracking dollar reserve currency. It is widely
accepted that the U.S. has enjoyed an exceptional privilege having a world reserve currency. The U.S. has
been able to grow its debt mountain to a level never seen before in the history of mankind because it had a
universally accepted currency which was used in the most traded asset classes, in particular oil (the
petrodollar). However, the end of the dollar reserve currency seems to be imminent. Based on historical
standards, world reserve currencies have lived on average 27 years. Note that the current dollar hegemony is
ongoing for 43 years. Prior threats to the petrodollar have been laughed away by the use of military force. The
Ukrainian case, however, has the potential to become a pivot point. Clumsy sanctions against Russia by the
West point to retaliation right to the core of the monetary system: the petrodollar. Russia is about to sign
energy contracts with its major trading partners in non‐dollar currencies. We believe this will act as a
precedent, and several Asian and emerging countries will follow. It will result in a loss of trust in dollar
denominated assets, undoubtedly affecting U.S. equities. Needless to say, this should also be a major catalyst
for precious metals.
If a company has currency exposure that is unhedged, and a crisis event occurs, the
company may be forced to report a significant foreign exchange loss. Emerging market
companies are known for being contagious. That is, when one sneezes, they all catch a cold.
Emerging market equity and debt markets do not have the immunity to extreme volatility
that developed (domestic) markets enjoy. This immunity is due in part to the U.S. reserve

跳出模型——跨国企业评估
©IACVA(CHINA) - BVR 15
currency status that causes global investors to perceive the U.S. as a safe haven in times of
crisis. However, the U.S. reserve currency status is likely to be challenged in the future,
which will pose a problem to the capital markets (and appraisers) who look for risk‐freebenchmarks in their discount rate‐setting quantitative models. Degradation in the U.S.
dollar status will likely coincide with a sell‐off of U.S. Treasury securities that have been a
risk‐free standard for the investing community for decades.
Sector. This area of due diligence examines the industry or sector in which the
company operates. It may also involve a regional trade group, such as NAFTA or Eurozone.
Some industries are inherently local, such as grocery stores, where the primary economy is
the local economy. On the other hand, for a company in the petrochemical industry or
technology industry, the focus would be on regional, or possibly global, economic forces.
An exception to this rule is natural resource companies, where the location of the
resources is a critical element in assessing country and political risk. According to Marin
Katusa, chief energy investment strategist, Casey Research, “the risks we face in the world
of resource investing, though, are some of the most unpredictable out there. Resource
companies navigate risks running from commodity price swings to taxation changes, from
geologic uncertainties to the challenges of new technologies, from floods and tornadoes to
labor unrest.” (See www.caseyresearch.com/cdd/never‐underestimate‐country‐risk.)
Recap. If you go through this framework to conduct your due diligence, you may find
that the MNC is not as risky as you thought. A full risk penalty associated with where the
company is headquartered (the sovereign risk of that country) may have to be adjusted
given the results of your analysis of the four areas of the CCCS framework. Of course, it
could go the other way. The analysis can uncover more risk in a company that, even though
headquartered in the U.S., exports products offshore to emerging markets and has plants
offshore in developing nations.
Think of a company on a “risk‐return spectrum.” At one extreme are those low‐beta,stable companies domiciled in developed markets. At the other extreme are companies
located in and totally dependent on a very risky local economy, such as Afghanistan, Syria,
Sudan, or Zimbabwe. Between these two extremes are many companies that deserve some,
but not all, elements of incremental risk premium attributed to country/political risk.
The CCCS methodology can help the valuation analyst select an appropriate cost of
Getting Your Head Out of the Model: Valuing a Multinational Company
©IACVA(CHINA) - BVR 16
equity model so that the risk rate ultimately makes sense in view of the company’s
characteristics, including industry sector and flow of currencies throughout its worldwide
operation. The potential risk adjustment to the cost of debt in the WACC development is
discussed later in this article.
CCCS case study. To illustrate the CCCS framework, let’s consider an example of an
MNC with U.S. headquarters that uses an assembly plant (called a maquiladora) run by the
U.S. entity in Mexico. The assignment is to develop a cost of equity for the plant operation
in Mexico.
A traditional Mexico operation that is mostly dependent on the local economy is
regarded as more risky than a U.S. operation. For example, the latest Morningstar data
(2013) put a cost of equity (CRRM linear model) for Mexico of 16.79% versus a cost of
equity for the U.S. of 10.92%, or a difference of about 587 basis points of total increment
required return. A Mexican operation that is completely dependent on the local economy
may warrant the full Mexican country risk penalty, such as the difference observed in the
CRRM linear model.
Looking at our subject operation, because the plant’s parent company is in the U.S., it
may be dependent on the U.S. economy or global marketplace. If that’s the case, you can
expect that the cost of equity is lower than what you would estimate for a strictly
Mexico‐based operation. Further due diligence bears this out. The plant sells 100% of its
product to its parent, which is an MNC with strong global brand, technology, and customer
base. The plant receives U.S. dollars for its sales. Therefore, this operation cannot be
compared to a strictly local operation.
The notion that our subject operation is less risky than a stand‐alone business in
Mexico (solely dependent on the local economy) is part of the “integrated versus
segmented” theme talked about by academia and finance professionals in the context of
country risk assessment. There are arguments to be made that in recent years the Mexican
and the U.S. economies have become more integrated due to the growing trade openness
among them, particularly after the implementation of the NAFTA.
In our subject operation, the country risk is mitigated because the plant is part of a
global operation and not dependent on the local economy. The currency risk is mitigated,
as well, because its sales are transacted with a more attractive, harder currency than

跳出模型——跨国企业评估
©IACVA(CHINA) - BVR 17
Mexican pesos. How do you quantify this mitigation of risk? You may want to consider
Professor Harvey’s view that currency risk can be 50% of total incremental risk. You could
argue there is still the residual country risk that is associated with terror, violence, and
corruption that is characteristic of an emerging market such as Mexico. A cost of equity that
is bracketed in at the lower end of the spectrum by the country spread model (10.38% cost
of equity), which typically bakes in minimal currency risk, and international CAPM model
(11.82%) would be worth considering so as not to underestimate value by using too high a
risk adjustment.
There appears to be ample evidence that the appropriate cost of capital for our subject
operation would justify a lower cost of equity than a model that uses the full amount of
Mexican country sovereign risk, such as the CRRM model (see Claude B. Erb, Campbell R.
Harvey, and Tadas E. Viskanta, “Expected Returns and Volatility in 135 Countries,” Feb.
7, 1996).
The substantially lower currency risk of the plant implies an adjustment of possibly
one‐half of the total incremental risk of 587 basis points (U.S. versus Mexican CRRM). Such
an adjustment would lower the CRRM required rate of Mexico 13.86% (halfway between
Mexico at 16.79% versus U.S. at 10.92%). Because the subject business derives its sales from
U.S.‐based customers, there is an argument that the country risk adjustment could be even
lower, with the apparent floor being above the CRRM linear rate for the U.S. This is because
the operation is located in Mexico and could be negatively affected from certain country
factors.
A two‐thirds reduction of the incremental risk shown by the CRRM model of 587 basis
points to reflect the reduced risks of this Mexican operation as explained above would put
the cost of equity at about 12.86%.
Developing the WACC. In the context of assessing country risk, a rather subtle
refinement needs to be made to the applicable cost of debt that is included in the overall
WACC model.
In a nutshell, the question of whether to adjust the cost of debt for incremental country
risk depends on the specific facts and circumstances. For example, let’ s say our subject
entity is an MNC with a mix of offshore operations in locations ranging from developed
countries to emerging countries. Let ’ s also assume that the MNC has significant

Getting Your Head Out of the Model: Valuing a Multinational Company
©IACVA(CHINA) - BVR 18
securitizable assets held in developed countries. In this case, there may be an argument that
any material debt funding could be done in such developed countries at rates that do not
have any material country risk.
On the other hand, the appraiser may conclude that the subject entity is segmented and
deserves the full country risk/sovereign risk penalty. If the appraiser wants to adjust both
the cost of equity and the cost of debt for such incremental risk, he or she should review the
works of Damodaran.
For example, go to Damodaran ’ s website,
pages.stern.nyu.edu/~adamodar/pc/datasets/, and, in particular, this file:
uValuedataJan2014.xls (see
Exhibit 2). You see that the
assumed equity risk premium
(ERP) for the U.S. (mature) is 5%.
The global equity risk premium,
which takes into account a
portfolio of countries, many of
which are emerging or
developing in nature, is 6.35%.
The difference between the U.S. and global ERP is 1.35%. This is not the amount in theory
you would add to adjust the cost of debt for country risk for such a global portfolio. In his
past writings and speeches, Damodaran has indicated that, in general, emerging market
debt is less volatile than emerging market equity. “You can estimate an adjusted country
risk premium by multiplying the default spread by the relative equity market volatility for
that market (Standard deviation in country equity market/Standard deviation in country
bond),” says Damodaran. “ I have used the emerging market average of 1.5 (equity
markets are about 1.5 times more http://bit.ly/1jDAjgP)
Using his global default spread (to add to the cost of debt) of 0.90%, the suggestion is
that, while equities are adjusted upward for perceived global market risk by 135 basis
points, debt is adjusted upward by 90 basis points. The ratio of 135/90 is 1.5 and is
consistent with Damodaran’s earlier comments.
Other data suggest this theme. Damodaran has analyzed relative volatilities of equity
versus debt markets in a variety of emerging market countries and found that “ for
跳出模型——跨国企业评估
©IACVA(CHINA) - BVR 19
emerging markets, equity is between 1.5 and 2.0 times more risky than bonds.” This
suggests that for developed markets the ratio is 2.0. Dimson, Marsh, and Staunton
corroborate this in their text Triumph of the Optimists, which states:“For the United States,
which ranked toward the lower end of the country risk premium spectrum, we find that the
standard deviation of real returns on stocks was 20.2% compared with 10.0% for bonds.”
You can review relative volatilities of various stock and debt markets using Bloomberg, for
instance.
In summary, whatever models you run or use to quantify the incremental cost of
equity adjustment for a particular country or portfolio of countries, typically the adjustment
to debt is different but can be reconciled using the base work of Damodaran as a guide. In
fact, he uses debt‐versus‐equity volatility data to estimate equity returns from debt market
returns.
Considering a large portfolio of countries. My experience has been that an MNC is
often involved in dozens of countries and the goal is to value the aggregate firm. To
address country risk analysis in an efficient manner, I conduct CCCS‐related due diligence
to learn how dependent the overall business and each affiliated country is to global trends
versus local economic and political conditions.
For instance, if the business is tied to the energy industry or to certain technology that
is viewed as a global commodity, then the local country conditions are less relevant but still
worthy of consideration. This may be the case where the country spread model has special
merit, as the inputs to this model naturally result in a lower cost of equity that may be more
appropriate than a full country risk penalty that results from the CRRM model. On the
other hand, if this is not a global industry, but rather more dependent on the local
economies, then the fully risk‐priced CRRM model may be best as a proxy for the country
risk adjustment. The analyst may consider both country spread and CRRM models to
bracket in full risk and a reduction in risk in terms of cost of equity estimates.
To manage the quantitative analysis of dozens of countries, I often obtain a
representative sample of the largest‐end markets (e.g., those countries that generate the
highest sales and EBITDA) and then weight the specific cost of equity estimates for the
models I think are best proxies for the nature of the risk. In other words, CCCS due
diligence may suggest the firm is quite dependent on the local economy, or it could suggest

Getting Your Head Out of the Model: Valuing a Multinational Company
©IACVA(CHINA) - BVR 20
the firm has less risk due to the industry in which it operates, the currencies it receives, and
the existence of global branding and technology.
At that point, the analyst can develop a weighted average risk analysis that appreciates
the significant countries that contribute to
overall country risk. By doing so, one is
consistent with the view of Damodaran:
“When valuing emerging market companies,
analysts pay too much attention to where a
company is incorporated and too little to
where it does business.” It has been my
practice to review the risk of an MNC’s end
markets and incorporate this into the
discount rate. If there were significant
production facilities in any country but no
sales, this also would be considered.
An example extracted from Excel is
shown as Exhibit 3. In this example, we view
each country’s business to be mostly
dependent on the local economy. We applied
a CRRM model to benchmark risk of each
contributing country to the U.S. (Note that
sales are for illustration only and CRRM is
per a recent Morningstar International Cost
of Capital report.) This type of analysis
suggests a U.S.‐based cost of equity could be
adjusted upward by about 2.3%.
Final thoughts. Developing discount rates for an international valuation project in
today’s world entails more than using computer/calculation models to build a
base‐weighted average cost of capital. The dynamic nature of the global economy is such
that the valuation analyst must not only be vigilant but willing to break out of the models
to uncover what really is impacting the subject company. The CCCS framework is designed
to guide your due diligence in the vital areas of company, country, currency, and sector.

跳出模型——跨国企业评估
©IACVA(CHINA) - BVR 21
James T. Budyak, CPA/ABV, CFA, ASA, is a senior vice president of Valuation Research Corp.He is active in valuation and due diligence for businesses, equity and debt investments, intangibleassets, and solvency and fairness opinions. He has studied dozens of countries and visited over 40.He can be reached at [email protected] and (414) 221-6238.
Annotation
1. Stock indexes used in this analysis (Exhibit 1): Australia: S&P/ASX 200 Net Total Return Index; Canada:
S&P/TSX Composite Total Return Index; Switzerland: Swiss Market Gross Total Return Index; Eurozone:
Euro Stoxx 50 Total Return Index; U.K.: FTSE 100 Total Return Index; Japan: Nikkei 225 Total Return Index;
Norway: Oslo Stock Exchange OBX Index (It has been a total return index since April 2006); New Zealand:
NZX 50 Total Return Index; Sweden: OMX Stockholm 30 Total Return Index; Singapore: FTSE STI Total
Return Index. All stock market indexes are in local currency terms, and all include reinvested dividends.
一个被遗忘的统计概念解释了倍数可能错误的原因
©IACVA(CHINA) - BVR 1
A Forgotten Statistical Concept Tells
Why Your Multiple May Be Wrong
一个被遗忘的统计概念解释了倍数可能错误的原因
翻译: 梁瑞莹 (广东中联羊城资产评估有限公司)
1885年,弗朗西斯∙加尔顿先生发表了一篇突破性的论文,题目为“从遗传性身高回归到平
均水平”。
在论文中,他指出那些非常高或非常矮的人生出来的孩子的身高会随着长大逐步趋向平均
水平。加尔顿据此认为异于平均值的差异是来自父母遗传的运气和孩子自身对环境的复制技能
共同造成的。
加尔顿认为这种运气和复制技能结合后趋于平均的理论是应用于小型私营企业定价的
重要的理论和实践概念之一:经济租金(又称超额利润)往往随着时间的推移趋向于零。不幸
的是,许多评估人员错过了运气和技能固有的统计和因果微妙之处,坚持传统的理念,即“具
有超额的收益就应该是溢价倍数”。相反,低于平均水平的利润必须具有较差的倍数。
我们展示的这些数据和逻辑,尽管看起来有些违反直觉,但事实却正是如此。单纯为高利
润率的公司给予高估值其实并不恰当。此外,我们要进一步讨论数据对估值的其他启示。
数据显示。对于超额租金的 好测量标准是一项新投资的加权平均资本成本率的隐含现金
回报率。我们对于前面提到的这个数据的代替数据是相对于行业平均利润率的主要业务利率。
我们的数据显示,规模小的私人投资者一般对于那些有超高的边际利率的公司给予较低的倍数,
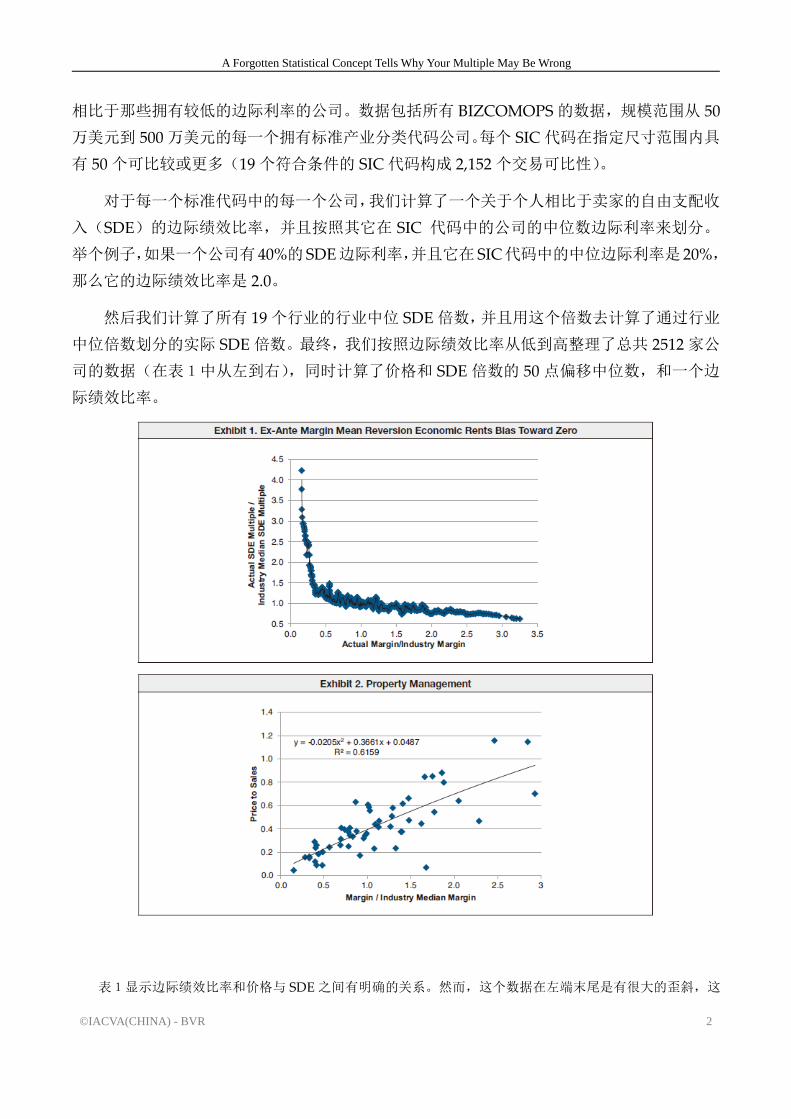
A Forgotten Statistical Concept Tells Why Your Multiple May Be Wrong
©IACVA(CHINA) - BVR 2
相比于那些拥有较低的边际利率的公司。数据包括所有 BIZCOMOPS的数据,规模范围从 50
万美元到 500万美元的每一个拥有标准产业分类代码公司。每个 SIC 代码在指定尺寸范围内具
有 50个可比较或更多(19个符合条件的 SIC代码构成 2,152个交易可比性)。
对于每一个标准代码中的每一个公司,我们计算了一个关于个人相比于卖家的自由支配收
入(SDE)的边际绩效比率,并且按照其它在 SIC 代码中的公司的中位数边际利率来划分。
举个例子,如果一个公司有 40%的SDE边际利率,并且它在 SIC代码中的中位边际利率是 20%,
那么它的边际绩效比率是 2.0。
然后我们计算了所有 19个行业的行业中位 SDE倍数,并且用这个倍数去计算了通过行业
中位倍数划分的实际 SDE倍数。 终,我们按照边际绩效比率从低到高整理了总共 2512家公
司的数据(在表1中从左到右),同时计算了价格和 SDE倍数的 50 点偏移中位数,和一个边
际绩效比率。
表1显示边际绩效比率和价格与 SDE之间有明确的关系。然而,这个数据在左端末尾是有很大的歪斜,这

一个被遗忘的统计概念解释了倍数可能错误的原因
©IACVA(CHINA) - BVR 3
个地方需要我们去解释。在表2中,我们展示了 19个行业中的一个行业关于价格对于 SDE的偏差。
如果我们的主体有正常的盈余(X 轴上单位为1处),中间的趋势线将是销售的 0.4 倍。
用三倍的盈余在 X轴的单位为3处,中间的趋势线将约为销售的 0.95 倍。从一倍到三倍的盈
余变化(1.0到 3.0)来看,估计价格增长了大约 2.37 倍。换句话说,价格和自由支配收入的
倍数大约是 21%,相比于正常的盈余,比高盈余较低。(和前面讨论的平均盈余一致)
数据背后潜在着一个逻辑。表1和表2显示了边际绩效和价格对于 SDE之间有一个明确
的关系,还显示了结果是向下回归的。然而,数据在 X轴 1点处严重歪斜。为什么 SDE倍数
在实际盈余的增长和下降会严重低于平均值呢?原因可能是低盈余的公司相比于高盈余的公
司有更大的风险,同时回报价值也低。
一些评估专家很难理解为什么一些实际价值较低的公司能够有高利润,并且可以相应的下
调倍数。答案是反直觉的,但是这里有一些合理的现象能解释为什么倍数变化是这样的。
概率现象。假如你投掷一枚硬币,头像朝上的概率为 50%。假如你投掷两次,两次头像朝
上的概率将减少到 25%。你投掷的越多,这个头像连续朝上的概率将会越来越低,即使下一次
头像朝上的概率仍然是 50%.这种现象在投资者身上也同样存在。一个公司可以非常成功的获
得一个高利润,但是投资者担心大数定律将随着时间减少它们的利润。一个公司可以通过在正
确的时间正确的地点做正确的事情来得到高额的利润。某种程度上来说这个公司是幸运的,但
投资者必须考虑这种幸运可否延续,并且投资者需要避开那些价值完全依靠在过去成功上公司
股票。
或者,相比于行业利润来说不幸运的公司利润较低,但是大数定理告诉我们,运气在某个
时刻一定会改变的。如果运气是商业的唯一决定因素,一个精明的风险分散投资者将购买一个
平衡的股票组合资产,该资产包括历史上有过好运气的股票,也包括有过坏运气的股票,它们
的平均值和行业平均值相等。
上文陈述中存在两个缺陷,有时被指认为“赌徒破产问题”和“不确定性问题”。“赌徒破产
问题”发生是因为一个人如果用有限预算与一个有大量资金的机构对赌,其结果 终必将失败。
这里也有一种可能,尽管很微小,是一系列坏运气发生之后,这个赌徒的钱全部用完了然后他
或者她回家了,很悲伤但是获得了教训变得更加理智了。这个问题不可能发生在那些实际拥有
无限的预算的机构身上。第二个缺陷是存在使用不公平的硬币的可能性(被机构欺骗)。这个
缺陷将会引发不确定性风险,并且使得定价发生偏移,不能合理定价。不是风险本身而是不确
定性,是当代市场的特征。
谨慎的投资者通过预估然后下调或者提升资产的成本来说明市场上的赌徒破产问题和不
确定性问题。贴现率或者 佳预估折扣是投资者使用的一种价格手段用来反映市场的不确定性。

A Forgotten Statistical Concept Tells Why Your Multiple May Be Wrong
©IACVA(CHINA) - BVR 4
然而,不确定性的调整显然不足以克服低回报企业的吸引力。它确实表明,低利润可能不会像
一些人认为的那样危险,并且为什么高利润的公司可能更危险。答案可能是一个能够修改自由
现金流量、折现率的公司在长期更具潜力,并且能够得到投资者更好的市场预期。
市场环境。对于小公司来说,业务本身的环境可以用来解释数据。为了理解为什么,我们
有必要认为一个估值应该能够反映一个潜质的现在价值或者预期未来收入。大多数估价专家使
用戈登模型表示长期前景。考虑以下因素:
第一,在一个高利润公司,不能保证现有的优秀管理团队将会继续保持恰当的位置。企业
招聘者以 好的团队作为目标。另外,当这些优秀的团队为他人做事时,不幸将会发生。这是
公司的非系统性风险的一部分。并且不能保证,一个优秀的管理团队或者一个成功的机构在退
休后会被另一个同样资历的团队或者机构取代。事实上,管理团队越优秀,那么以同样优秀的
管理团队来取代它就会越困难,因为优秀团队的供应是有限的。也可能是因为替代者表现很糟
糕。
第二,无法保证,一个优秀的团队会一直优秀下去。举个例子,行为经济学的研究表明,
成功过的管理者因为盲目自信倾向于冒更大的风险。他们的盲目自行将对公司带来危害。
第三,当公司利润超过行业平均值的时候,克服当前困难并以同样的比率增加利润将变得
更加困难。仅基于过去利润增长的预测是可疑的。因此,管理层似乎变得不那么优秀了。评估
人员将利用相对利润增长率来调整倍数。
第四,随着收入的增加,想要得到百分比规模的增长率难以重现。相对的,对于一个规模
为 5万美元的公司来说,在短时间内将公司价值翻一倍是较为简单的。但是对于一个公司价值
为 5千万美元的公司来说,在同样的时间内将公司价值翻一倍是非常困难的。销售和利润上的
相对增长率是评估人员用来调整倍数的另一个因素。
第五,和第三、第四相关,Damodaran教授指出:
公司的资本回报率超过资本成本(股本)则获得正超额收益。虽然这种超额收益可能是通过历史数据或
行业平均数来证明的,但这些回报的存在无疑会吸引新的竞争对手,随着时间的推移,这些回报将面临下行
压力。
低利润的公司高倍数的偏差。刚刚讨论过的大多数观点,如果反过来,都支持业绩不佳的
公司高倍数的想法。由于其他原因,管理不善的人退休或离开时更有可能被更好的管理者取代。
新的管理层可以重振公司,并对未来抱有希望,从而提升公司当期的价值。低利润相比与高利
润更容易提高。同样的,与高倍数和高销售的公司相比,提升低倍数和低销售的公司更加容易。
许多当前表现不佳的公司在将来可能做得更好,而且这种潜力在市场上已经是被定价并且认同
的。

一个被遗忘的统计概念解释了倍数可能错误的原因
©IACVA(CHINA) - BVR 5
还需要考虑其他因素。业绩不佳的公司更容易被收购。如果这些公司的协同作用更高,那
这个收购价格就会更高,收购者是不会在意当前的利润的。而且,在非常低的比率下,有形资
产和无形资产各自价值可能大于所有资产的总和。如果单独出售,这些资产的总价值超过行业
平均数的可能性是非常大的。利润率很低且没有吸引力的公司往往不会出现在数据中,因为它
们已经被剔除了。
后,企业的成本估值方法解释了很多。它涉及到有形资产和无形资产的替换成本估计,
这是一个企业的价值指标。这个方法也包括替代无形资产的时间和风险。由于成本法的理论部
分是基于“为什么我要为一次交易支付更多的费用,而不是花同样钱开始找一个模仿品或者竞
争者”,所以假想新的复制品或者竞争的盈利能力的影响也应该被考虑在购买和制造或竞争中。
换句话说,如果潜在买家购买后,那么收盘后将只有卖家在市场上。然而,如果买方决定复制
/制造,那么将有两个企业可能同时争夺一些或全部相同的业务。
这种成本方法与上面所述的数据相一致,所构建的成本大多与小型私营企业的利润水平无
关,一般来说,这些企业都没有特殊的无形资产/进入门槛。这样做是为了降低高利润公司的
倍数,推高低利润公司的倍数。
实证数据对估值分配的影响。如果你的测试主体的利润超过或者低于行业中值很多,前面
的这些证据和推理就有力的报名,需要提出正确的问题:
为什么利润会超过行业中值呢?
∙ 是产能利用率在不可持续的高位水平吗?
∙ 是否有一个行业准入门槛,如专利,来提高价格?
∙ 是否缺少竞争?如果是,有多大可能会持续下去?
为什么利润会低于行业中值?
∙ 是否产能利用率在一个不常规的低位水平?
∙ 是否有一个产品或者领域,利润产生水平特别低或者为负呢?如果是,能不能发生逆转?
∙ 是否高的销售增长率(以及相关的团队开发的费用)会带来销售疲软?如果是,那应该如何减少增长
对利润的影响?
∙ 是否有一些可预见的人口负面统计,造成管理团队的努力都付之东流?如果有,这种情况会持续下去
吗?
因此,我们可以使用这个建立在预估相对 SDE倍数之上的推论利润数据,并利用上述问
题的答案来做出明智的判断调整。

A Forgotten Statistical Concept Tells Why Your Multiple May Be Wrong
©IACVA(CHINA) - BVR 6
摘要和结论。在这篇文章中,我们已经表明,无论是数据还是逻辑都不支持适用于小企业
的可持续经济租金理论。当公司的 SDE除以行业平均 SDE比率回归到实际利润除以行业利润
比率时。数据显示,与利润率不同的是,数据显示行业规范的趋势正在温和下降,超过了前者
的一半。
这种变化仍然表明,当利润增加时,价格会下降。低利润情况下倍数的快速增长可以被多
个因素解释,包括管理的改变带来的新的显著的管理能力提升,导致收购的协同效应,感观上
相对舒适度的提升,以及资产本身的价值高于整个公司的价值,以及估值的成本方法。
评估领域的数据具有很多含义。 好的表述就是在做评估任务时将他作为要回答的问题。

一个被遗忘的统计概念解释了倍数可能错误的原因
©IACVA(CHINA) - BVR 7
A Forgotten Statistical Concept Tells Why Your Multiple May BeWrong
By Bob Dohmeyer, ASA, and Dr. Herbert Kierulff
In 1885, Sir Francis Galton published a breakthrough treatise entitled Regression Toward
Mediocrity in Hereditary Stature. In it, he demonstrated that the children of very tall or very
short people tended toward average over time. Galton interpreted this finding to mean that
variations from average were due to the luck of the draw with respect to parents tempered
by the skill of individuals in coping with their environment.
Galton’s regression to the mean as explained by a combination of luck and skill apply
to one of the most important theoretical and practical concepts in pricing small private
businesses: economic rents (aka excess profits) tend to revert to a mean of zero over time.
Unfortunately, many appraisers have missed the statistical and causal subtleties inherent in
both luck and skill, adhering to conventional wisdom that says “companies with superior
margins deserve a premium multiple.” Conversely, inferior margins must deserve inferior
multiples.
We show with data and logic that, counterintuitive as it may seem, the reverse is true.
Placing high values on companies with superior margins acts to the detriment of valuations.
In addition, we discuss other implications of the data on the valuation assignment.
What the data show. The best measure of excess rents is the implied CFROI of new
investments to the WACC ratio. Our proxy for this statistic is the subject business margin
relative to the median industry margin. Our data demonstrate that investors in small
privately held businesses generally place lower multiples on companies with superior
margins than companies with less‐than‐satisfactory margins. The data consist of all
BIZCOMPS data in the size range of $500,000 to $5 million for every SIC code that had 50
comparables or more in the specified size range (19 qualifying SIC codes making up 2,152
transaction comparables).
For each comp within each SIC code, we calculated a margin performance ratio of the
individual comparable’s seller’s discretionary earnings (SDE) margin and divided by the
median margin of the other comps in that SIC code.1 For example, if the comp had a 40%
SDE margin and the median margin in its SIC code was 20%, then its margin performance
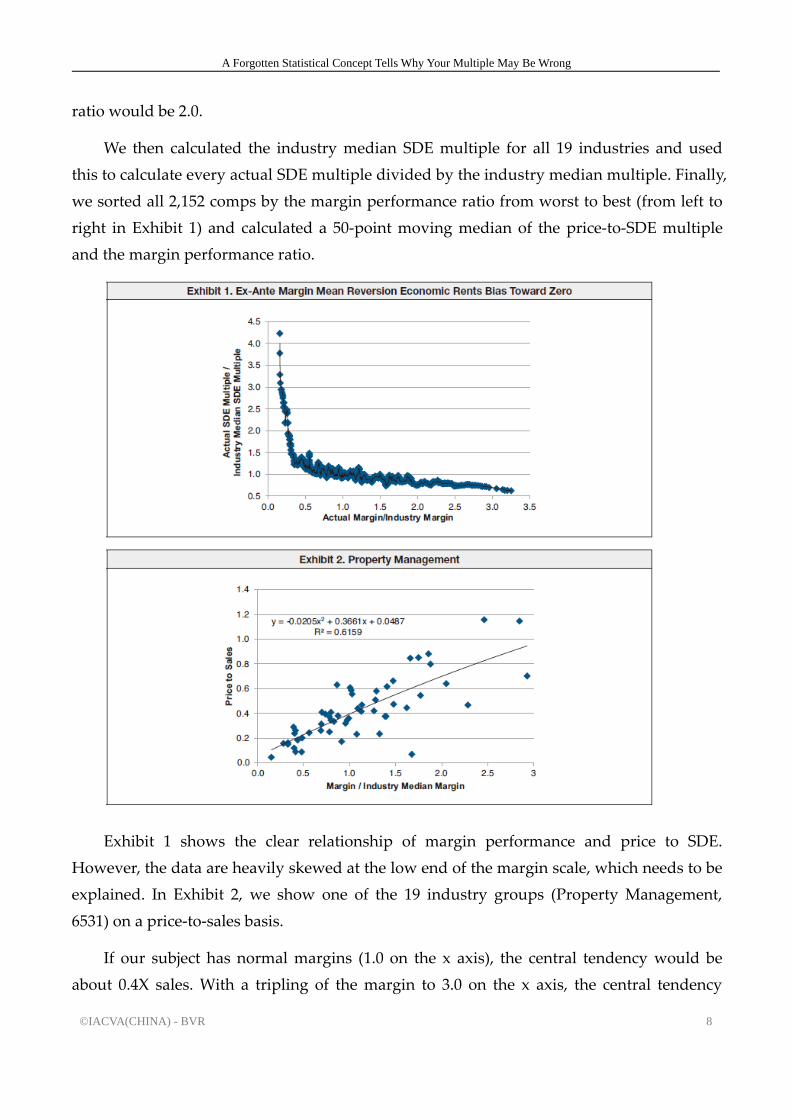
A Forgotten Statistical Concept Tells Why Your Multiple May Be Wrong
©IACVA(CHINA) - BVR 8
ratio would be 2.0.
We then calculated the industry median SDE multiple for all 19 industries and used
this to calculate every actual SDE multiple divided by the industry median multiple. Finally,
we sorted all 2,152 comps by the margin performance ratio from worst to best (from left to
right in Exhibit 1) and calculated a 50‐point moving median of the price‐to‐SDE multiple
and the margin performance ratio.
Exhibit 1 shows the clear relationship of margin performance and price to SDE.
However, the data are heavily skewed at the low end of the margin scale, which needs to be
explained. In Exhibit 2, we show one of the 19 industry groups (Property Management,
6531) on a price‐to‐sales basis.
If our subject has normal margins (1.0 on the x axis), the central tendency would be
about 0.4X sales. With a tripling of the margin to 3.0 on the x axis, the central tendency
一个被遗忘的统计概念解释了倍数可能错误的原因
©IACVA(CHINA) - BVR 9
would be approximately 0.95X sales. Notice with a tripling of profit margin (1.0 to 3.0) the
estimated price only increases by about 2.37X. In other words, the price‐to‐SDE multiple is
about 21% less at the highest margins compared to the normal margin (consistent with the
mean reverting margin discussion above).
The logic behind the data. Exhibits 1 and 2 show the clear relationship of margin
performance and price to SDE and the resultant downward regression. However, the data
are heavily skewed at one point. Why the steep increase in SDE multiples at actual margins
significantly below average? Firms with low margins should be riskier than those with high
margins and receive lower values.
Some valuation specialists have trouble understanding why “undeserving” companies
enjoy high margins and may adjust the multiples downward accordingly. The answer is
counterintuitive, but there are several logical explanations for why the multiples behave as
they do.
The phenomenon of luck. If you flip a fair coin, the chance of heads is 50%; if you flip it
twice, the chance that it will land heads both times is reduced to 50% × 50%, or 25%. The
more you flip, the lower the probability is that you will have successive rounds of heads
even though the probability of heads on the next flip is 50%. These points are not lost on
investors. A firm can be extremely successful with a high margin, but investors fear that the
law of large numbers will reduce those margins over time. A firm can enjoy high margins
just by being in the right place at the right time doing the right thing badly. To the extent
that firms are lucky, investors must consider that the streak will not last and they will tend
to avoid stocks that are priced purely on the basis of past success.
Alternatively, unlucky firms will have low margins relative to their industries, but the
law of large numbers suggests that the luck must change at some point. If luck were the
only thing involved in business, a prudent diversified investor would have a balanced
portfolio of stocks with a history of good luck and bad luck with a mean equal to the
industry average.
Two flaws in the above statement are sometimes referred to as “gamblers’ ruin” and
“uncertainty.” Gamblers’ ruin occurs because a player with a limited budget betting against
a house with an unlimited budget must lose in the long run. There is a probability, however
small, that a run of bad luck will occur such that the player’s resources are all used up and
he or she goes home sadder but wiser. This cannot happen to the house with an (practically)
A Forgotten Statistical Concept Tells Why Your Multiple May Be Wrong
©IACVA(CHINA) - BVR 10
unlimited budget. The second flaw is the possibility of an unfair coin (cheating by the
house). This causes risk to be replaced by uncertainty and makes probability calculations
impossible. Uncertainty, not risk, characterizes the modern marketplace.
Prudent investors account for gamblers’ ruin and uncertainty in the marketplace by
adjusting the best estimate forecast downward or increasing the cost of capital. The
discount rate or best estimate haircut is the price the investor demands to play in an
uncertain world. Nonetheless, adjustment for uncertainty apparently is insufficient to
overcome the attractiveness of low‐return businesses. It does suggest that low margins may
not appear as risky as some believe and why high margin firms may be riskier. The answer
may be the long‐term potential of firms that modifies FCFF forecasts and discount rates and
appears in the investors’ evaluation of the environment.
The environment. For small companies, the environment of business itself goes the rest
of the way to explain the data. To understand why, it is necessary to take the view that a
valuation should measure the present value of a potential or expected future stream of
earnings into what amounts to practical infinity. The use of the Gordon model by most
valuation experts signifies that long‐term outlook. Consider the following.
First, in a high‐margin company, there is no guarantee that the existing excellent
management team will remain in place. Corporate recruiters target the best. In addition,
misfortune happens to excellent managers just as they do to other people. This is part of
company‐specific risk. And there is no guarantee that an excellent management team (or
other agency responsible for success) will be replaced by another as qualified when the
excellent team retires. In fact, the more excellent the existing management team, the harder
it will be to replace with an equally excellent management since the supply is limited. It is
also possible that the replacements will be very poor performers.
Second, there is no guarantee that the excellent management team will remain
excellent. For example, studies in behavioral economics and finance show that successful
managers tend to take greater risks based upon the confidence borne of past success. They
become overconfident to the detriment of their companies.
Third, as margins increase over industry averages, it becomes harder to beat the
existing competition and continue to increase margins at the same rate. Projections based
solely upon past margin growth are suspect. Therefore, managements appear to become
less excellent. Relative growth in margins is one factor appraisers use to adjust multiples.

一个被遗忘的统计概念解释了倍数可能错误的原因
©IACVA(CHINA) - BVR 11
Fourth, as revenues grow, percentage changes become harder to replicate. It is
relatively easy to double a firm’s sales in a short time when they are $50,000. It is
significantly more difficult to double a firm’s sales in the same amount of time when they
are $50 million. Relative growth in sales and profits is another factor appraisers use to
adjust multiples.
Fifth, and related to three and four above, Professor Damodaran points out:
A firm that generates a return on capital (equity) that exceeds its cost of capital (equity) is earning a
positive excess return. While this excess return may be justified using historical data or industry averages,
the presence of these returns will undoubtedly draw in new competitors over time, putting downward
pressure on these returns over time.2
High multiple bias in low‐margin companies.Most of the points just discussed, if reversed,
support the idea of high multiples for poor performing companies. Poor managements are
more likely to be replaced by better ones when they retire or leave for other reasons. New
managements can reinvigorate the companies and hold out hope for the future, thereby
driving up the perceived value of companies in the current period. Low margins are easier
to improve compared with high margins. It is significantly easier to increase low multiples
and sales than high ones. Many companies that are under performing now have the
potential to do much better, and it is this potential that is priced in the market.
There are other factors to consider. Poorly performing companies become candidates
for acquisition. The more the perceived synergy in these companies, the higher the price,
regardless of current margins. Also, at very low ratios, the tangible and intangible assets
individually may be worth more than the sum of the parts. Sold off individually, the total
value of these assets may result in ratios that exceed industry averages by a considerable
amount. Companies with very low margins and unattractive futures tend not to show up in
the data because they have already been liquidated.
Finally, the cost approach to business valuation explains a great deal. It involves
estimating the cost to replace the firm’s assets—both tangible and intangible—as an
indicator of the FMV of the business. This approach should also include the time and risk to
replace the intangible assets. Since the cost approach’s theory is partly based on “why
would I pay more for a business than it would cost me to start a copy/competitor,” the
impact on profitability of the hypothetical new copy/competitor needs also to be considered
in the trade‐off between buy and make/compete. In other words, if the potential buyer
A Forgotten Statistical Concept Tells Why Your Multiple May Be Wrong
©IACVA(CHINA) - BVR 12
“buys,” then there will be only the seller immediately after the close. However, if the buyer
decides to copy/make, there will be two businesses potentially competing for some or all of
the same business.
This cost approach is consistent with the data above—the cost to build is mostly
independent of the small private businesses’ level of margins given, generally, no special
intangibles/barriers to entry. This acts to pull down the multiple of the high‐margin
company and push up the multiple of the low‐margin company
Implications of the empirical data on the valuation assignment. If your subject’s
margin is substantially above or below the industry median, the evidence and reasoning
above strongly suggest that the right questions need to be asked:3
Why is the margin superior?
• Is capacity utilization at unsustainably high levels?
• Is there a barrier to entry such as a patent that allows premium pricing?
• Is there a lack of competition? If yes, how likely is that to continue?
Why is the margin inferior?
• Is capacity utilization at an irregularly low level?
• Is there a product or region that has an abnormally low or negative contribution
margin? If yes, then can that be reversed?
• Is high sales growth (and related expensing of developing the assembled workforce,
etc.) causing margins to be weak? If yes, then how would reducing growth impact the
margin?
• Are there predictable negative demographic issues that despite management’s best
efforts suggest poor performance is likely to continue?
Therefore, we can use the generalized margin data above on the predicted relative SDE
multiple and use the answers to the above questions to make informed judgmental
adjustments.4
Summary and conclusion. In this article, we have shown that neither the data nor logic
support the theory of sustainable economic rents as applied to small business. When the
company SDE/industry average SDE ratios are regressed against actual margins/industry

一个被遗忘的统计概念解释了倍数可能错误的原因
©IACVA(CHINA) - BVR 13
margins, i.e., multiples regressed against margins, the data show a gently declining trend
toward the industry norm beyond the point at which the former approach half of the latter.
What variation remains suggests that, as margins increase, prices decline. The rapid
increase in multiples at low levels of margin are explained by a number of factors including
perceived new management competence brought about by management change, synergy
leading to acquisition, a perceived relative ease of improvement, assets by themselves being
worth more than the company as a whole, and the cost approach to valuation.
There are numerous implications of the data for the valuation community. These are
best expressed as questions to be answered during the progress of the valuation
assignment.
Bob Dohmeyer, ASA, a shareholder at Dohmeyer Valuation Corp., located just outside
of Dallas, can be reached at [email protected] and 214.494.2677. Dr. Herbert
Kierulff, Snellman Professor of Entrepreneurship and Finance at Seattle Pacific University,
can be reached at [email protected] and 206‐281‐3523.
Annotation
1. We excluded negative and below 1% SDE margins.
2. people.stern.nyu.edu/adamodar/pdfiles/papers/returnmeasures.pdf.
3. We assume in all cases owner compensation is properly restated to the market value
of his or her contribution.
4. The same analysis and questions apply to the DCF. The analyst should forecast
future margins to be consistent with the mean reverting tendencies evidenced by the data.

以离婚为目的的评估:久经检验的十项原则
©IACVA(CHINA) - BVR 1
10 Time-Tested Ways to Build a
Defensible Divorce Valuation
以离婚为目的的评估:久经检验的十项原则
翻译:梁瑞莹(广东中联羊城资产评估有限公司)
校对:文豪(中南财经政法大学)
以离婚为目的的企业价值评估可能比其他目的的评估更具有挑战性,因为不同司法管辖
地区的规则不同。大多数州没有明确的以离婚为目的的评估指南,例如,关于离婚的州法律中
没有明确的价值定义。此外,即使有很多先前的判例(它们可能是令人因惑的或相互矛盾的),
法庭对离婚判决的自由裁量权依然很大。
尽管情况复杂,但仍然有一些普适的建议供离婚评估师参考,这些建议无论在何种司法管
辖下都能够适用。
1. 谨记这是一场诉讼。离婚评估的首要任务是谨记这是一场诉讼。毕竟,你听说过多少
离婚是友好的?实际上,几乎所有的离婚是有争议的,只是程度不同罢了。这就是为什么离婚
评估虽然只占典型的评估项目很小一部分,但是离婚评估中评估师作为专家证人被传唤的比例
很高。因此,评估专家必须做好自己的本职工作,谨记自己的一言一行很容易受到挑战。
2. 明确评估基准日。在评估的早期,就要弄清楚评估基准日,这极为重要。评估基准日
可以是开庭日、指控日、离婚日或分居日。通常,评估师需要和一个律师(代理人)打交道(如
果双方都同意或法庭指派,可能需要面对两个律师),请他们根据评估基准日设定不同的阶段
——当然也可能出现多个评估基准日。

10 Time-Tested Ways to Build a Defensible Divorce Valuation
©IACVA(CHINA) - BVR 2
3. 了解相关的评估标准。由于离婚评估标准因司法管辖地区而异,你需要对适用的标准
有一个完整的认识。州与州之间标准不同,有时在一个州内(甚至在州内的县与县之间)的标
准都不一样。然而,尽管了解什么标准适用是你的责任,但选择正确标准的责任并不在你。标
准的选择必须经过你和客户一致同意。记得把选择的标准在提醒函中进行说明,因为有时关于
一些术语的含义存在混淆。评估师要保证每个人能够理解“公允市场价值”、“投资价值”、“内
在价值”的意思。
评估师不是去制定法律,而是要遵守它。如果价值标准在法律中明确出现,评估专家应该
采用它们,否则,你将触犯法律。如果标准含糊不清,你应该告诉律师并征求它们的意见。
4. 仔细阅读先前的判例法。离婚评估规则不只是州与州之间不同,有些州内部县与县之
间也不同。因此,你必须仔细阅读先前的判例。这是一个判例法不发达的领域。许多州没有明
确的判例法,当法院想要表示其他意思时也使用“公允的市场价值”,因为法官只是发现“公允
的市场价值”是一个方便的惯用词。同样地,与法院处理常规的评估案例相比,家庭法院处理
折价和溢价是不同的。因此你需要在这方面研究相关判例。
不要只读有关案例的文章,也不要听别人对案例的评论,去阅读真实的案例。当你这样做,
你就能看到法官、诉讼人和律师们对一些问题的激烈争论,而这些问题你将来很可能会遇到。
每个案例都有其各自的特点,每种情形都基于不同的事实和环境。当然,评估师还需要关注正
在经历离婚的当事人所处的背景。
5. 询问离婚夫妻双方。除了早期询问律师,评估师还需询问正式配偶和/或婚外配偶(这
取决于哪个是你的客户,你有什么途径得知是谁)。如果双方同意或法庭指派,你可以同时和
双方沟通。有时这种沟通是非正式的,有时也可以通过证词或律师的质询进行正式的沟通。
针对正式配偶,设计的问题应该能够收集有关业务信息、实体类型、各种需要的企业信息,
例如,财务信息,或其他定量和定性的信息。
针对非正式配偶,评估师应该通过询问了解他(她)的个人观点,了解其顾虑或之前面临
的问题,以便在未来的诉讼中能够充分应对。
6. 准备涉及的实体清单。要求提供所有涉及的实体和实体所有权类型的列表、离婚当事
人的所有权、关于离婚事件的简要描述,以及涉及的公司数量等。例如,租给标的公司的房地
产是否由另一个实体拥有?虽然你可能不直接参与评估该房地产的价值,但你要确保你将评估
的企业与该房地产的所有者关于租赁费用和一些其他公司间的关系能够保持一致。并且,要尽
可能弄清楚为了实现评估目的是否有遗漏的资产。如果情况复杂,考虑雇佣一个专门的审计师。
7. 记录关键数据。务必做好记录,这是离婚评估和其他目的评估的差异之一。例如,如
果你用电话交谈,当你获得一些重要信息时,就需要进一步进行书面确认。当你向律师、诉讼

以离婚为目的的评估:久经检验的十项原则
©IACVA(CHINA) - BVR 3
当事人和企业负责人问询时,请他们书面答复(即使他们说你想要的不存在)。为什么要这么
麻烦?这是一个诉讼,你要保护自已以防在法庭上受到质疑。
8. 做好对外解释的准备。由于相关的判例较少,离婚法庭不像其他法庭那样熟悉企业价
值评估理论和方法。离婚法庭听到大量各种各样的问题,会限制他们在处理企业价值评估时考
虑的深度。
9. 管理好你的时间和诉讼。参与离婚评估,你通常会控制不住自己的时间安排。通常你
会在最后一刻接到各种截止日期或者出庭电话。这可能是个大问题,除非你合理的安排好你的
时间和手上的诉讼。
10.关注你的报酬。在处理离婚工作中,你是由个人支付报酬而不是公司客户或者律师事
务所。这些人正在离婚上花费很多钱,所以他经常会设置一个支付的上限。有时你是为婚外配
偶工作,钱就是个问题。许多评估师不会接这种没有预付金或者没有按月支付安排的离婚案件。
收费一般很少超过预付款,因为客户并不欢迎但又不得不聘请评估师。一旦评估报告送达或者
你已经在法庭上作证,你对客户来说就没有用处了,所以付款就可能成为一个严重的问题。
最后的忠告:在参与离婚诉讼中还会遇到其他问题,包括买卖协议、竞业禁止条款、商誉
和双底衰退等。因此,你应该完全熟知这些问题。并且,在家庭法方面,缺乏客观性的情况似
乎比其他类型的案例更加普遍。所以,评估师必须格外小心以避免任何可能偏向客户的压力。
10 Time-Tested Ways to Build a Defensible Divorce Valuation
©BVR 4
10 Time‐Tested Ways to Build a Defensible Divorce Valuation
Business valuations prepared for divorce purposes can be much more challenging than
valuations can be for other purposes. That’s because the rules differ among jurisdictions.
There are no clear valuation guidelines for divorce in most states. For example, there’s no
specific definition of value in state statutes governing divorce. Also, divorce courts exercise
a great deal of discretion—even if there is an abundance of judicial precedent (which can be
confusing and contradictory).
Regardless of this complex landscape, there are some universal tips for valuation
experts who do divorce work—pieces of advice that apply no matter the jurisdiction.
1. Realize that it is a litigation. The very first thing to realize in doing a valuation for
divorce is that it is a litigation. How many times have you heard of an amicable divorce?
Virtually all are contentious, some more than others. This is why, even though divorce
cases may be a small percentage of the typical valuation practice, they account for a high
percentage of the occasions valuation experts are called to testify as an expert witness. The
valuation expert has to conduct himself or herself accordingly, understanding that what
you say and what you do are subject to challenge.
2. Nail down the valuation date. Very early in the process, get a clear answer to the
issue of the valuation date. This is a fundamental aspect to understand upfront. It could be
the trial date, the complaint date, or the date of the divorce or separation. Most often you’re
dealing with an attorney (two attorneys if mutually agreed to or appointed by the court).
Ask them to set the stage in terms of the valuation date—there could be multiple valuation
dates as well.
3. Know the relevant valuation standard. Because the standard of value for divorce
differs by jurisdiction, you need a complete understanding of the appropriate standard to
use. It changes by state and sometimes within a state (and even within counties in states).
However, while it is your responsibility to understand what the appropriate standards of
value are, it’s not your responsibility to choose the right one. That’s something that should
be agreed to between you and the client. Include it in your retainer letter. Because there is
sometimes confusion as to the precise meaning of terms, make sure that everyone
understands what the labels “fair market value,” “investment value,” and “intrinsic value”
以离婚为目的的评估:久经检验的十项原则
©BVR 5
mean.
It is not up to the valuation analyst to make the law but to follow it. If the standard of
value is clearly entrenched in the jurisdiction, the valuation expert should follow that
standard. Otherwise, you will run afoul of the law. If the standards are vague, you should
advise the attorneys on the vagueness of the standard and ask their advice on what to do
about it.
4. Read prior case law very carefully. Rules for divorce valuations vary not only from
state to state, but also by counties within some states. Therefore, you have to read the prior
case law very carefully. It’s an area in which the case law is not well developed. There’s no
definitive case law in many states, and in many states the courts use “fair market value”
when they really mean something else because the judges just find “fair market value” to
be a convenient phrase. Also, family law courts treat discounts and premiums differently
than courts in conventional valuation cases, so you need to study relevant case law in this
regard.
Don’t just read articles about cases, and don’t listen to other people’s comments about
cases. Go back and read the actual cases in the area where your specific valuation is going
to be heard. When you do this, you will see the courts and the litigants and the attorneys
struggling with the same kinds of issues that you will have to deal with. Each case has a lot
of moving parts, and each individual situation is very specific in its facts and circumstances.
It also needs to be looked at in the context of the rest of the situation that the parties are
going through in their divorce, such as support.
5. Develop questions for both spouses. In addition to questioning the attorneys early
on, you need to ask questions of the titled spouse and/or the outside spouse (depending on
which one is your client and what kind of access you have). If you are mutually agreed to
or court‐appointed, you can expect to speak with both parties. Sometimes it’s informal and
sometimes more formal, through depositions or interrogatories through the attorneys.
From the titled spouse, your questions should be designed to collect information about
the business, the type of entity, and the kind of business information that you’ll need, such
as financial information and qualitative and quantitative information. From the nontitled
spouse, you should ask questions that explore that person’s perspective and to raise any
concerns or issues early on in the process so that you can address them as the case moves
forward.
10 Time-Tested Ways to Build a Defensible Divorce Valuation
©BVR 6
6. Get a list of entities involved. Ask for a list of the entities and the types of
ownership of the entities, the ownership by the parties to the divorce, a brief description of
the overall situation, and the number of companies involved. For instance, is the real estate
owned by another entity that is leased to the subject company? While you may not be
directly involved in valuing that real estate entity, you would want to make sure that you
are consistent in terms of the lease payments and other aspects of the intercompany
relationships between the real estate owner and the subject company that you may be
valuing. Also, try to get a feel for whether other assets are out there that you need to know
about for valuation purposes. If things get complicated, consider engaging a forensic
accountant.
7. Memorialize key data. Put it in writing! This is one of the differences between
valuations for divorce and valuations for other purposes. For example, if you have a
telephone conversation, and when you get critical pieces of information, follow it up with a
letter to confirm. When you send information requests to the attorneys, the litigants, and
the business owners, ask for written responses (even if they say that what you want does
not exist). Why bother with this? This is a litigation, so you need to cover yourself in case
you are challenged in court.
8. Be prepared to teach. Because of the small amount of case law developed, divorce
courts tend to be not as cognizant of business valuation theory and methodology as other
courts. Divorce courts hear so many different issues that it limits the depth they consider
when they have to deal with business valuations.
9. Carefully manage your time and cases. With a divorce valuation engagement,
you’re generally not in control of your own schedule. It’s not unusual to get a call at the last
minute about various deadlines or court appearances. This can be a big problem unless you
manage your time and your cases appropriately.
10. Watch your fees. In divorce work, you’re being paid by individuals, not company
clients or law firms. And these individuals are shelling out a lot of money in connection
with the divorce, so it often places an absolute ceiling on what can be charged. Sometimes
you are working for the out spouse, and money is a problem. Many valuation experts will
not take a divorce case without a retainer and an arrangement to be paid monthly. It’s
uncommon to charge above and beyond the retainer because the client views the valuation
expert as a necessary evil and once the report is delivered or you have testified in court, the

以离婚为目的的评估:久经检验的十项原则
©BVR 7
client has no use for you, so payment could become a very serious problem.
Final thought: There are other issues you’ll encounter in a divorce engagement,
including buy‐sell agreements, noncompete covenants, goodwill, and the double dip.
Therefore, you should be fully versed on these issues. Also, the lack of objectivity appears
to be more prevalent in family law matters than in other types of cases. Therefore, the
valuation expert must take extra care to avoid any pressure toward bias in favor of the
client.

美国税务法庭对专家见证税务事项的影响
©IACVA(CHINA) - BVR 1
U.S. Tax Court Judge Laro Discusses
Valuation and Expert Testimony
Issues
美国税务法庭对专家见证税务事项的影响
翻译:邓艳芳(中联资产评估集团有限公司)
你不是每一天都有机会听到美国税务法庭法官对于估值专家感兴趣议题的见解。BVU 在
近一次的商业价值协会组织的午餐会上非常幸运地听到了税务法官 David Laro 的讲解。
Laro法官是论文《曼德尔鲍姆决定》的作者。估值专家 Robert Reilly和 Daniel Van Vleet主
持了午餐会,并出色的让法官 Laro谈论很多有趣的话题。
税务法庭的事实。Reilly 和 Van Vleet要求 Laro法官指出税务法庭在美国法律体系中的
位置。法官接受并指出在华盛顿特区有一个由 19个联合法官组成的税务法庭,并且他们有各
自的管辖权限。大部分与税务有关案件都是和解而不是进入美国税务法庭。当各方不能达成一
致意见的情况下,他们可以在联邦地区法院、美国联邦索赔法院或者美国税务法庭起诉。因此,
金融专家都不能认为每一个税收决定都是税务法庭的决定。诉讼当事人可以向美国联邦上诉法
院的区域巡回法院上诉美国税务法庭裁决。但是上诉法院的裁定只是本区域的判例,不能约束
其他巡回的税务法官。而且,上诉法院维持了 94%的原判,Laro法官的概率高达 97%。

U.S. Tax Court Judge Laro Discusses Valuation and Expert Testimony Issues
©IACVA(CHINA) - BVR 2
税务法庭备忘录是事实性的,不能作为判例,但是可以用在一些权威机构上。Reilly指出
有些观点可以具有里程碑式的地位。Laro法官的《曼德尔鲍姆决定》就是一个例子。直到现
在,它已经成为美国国税局和评估分析师在缺乏流动性时构思和计算的重要工具。
关于Mandelbaum更多信息。Reilly 希望了解弄明白为什么不是所有的法官都像 Laro
在Mandelbaum里做的一样?提供一个完整的描述,说明他们是如何得出估值结论的。Laro
解释说,不同的法官喜欢用有不同的方法。这是一个透明度的问题,不是每一个法官都想要阐
明他或她的思考过程。法官对 Mandelbaum的态度是研究缺乏流动性的法律环境,给评估师
和潜在的当事人形成价值结论的方法论。当他发现许多早期的备忘录中关于法院如何决定的问
题缺乏解释时,他做出了慎重的努力,以制定一个可以指导评估行业的决定。
裁审法官?Reilly 和 Vleet 希望了解:裁审法官的观点会影响评估师的实践吗?Laro 回
答没有影响。他允许评估专家在他面前不讨论的Mandelbaum中的因素去质疑整个报告。
他还认为专家阅读一名首席法官讨论估值问题的案例,以了解法官的来历,这是很好的做
法。但对法官进行评估是错误的。重要的是专家的独立、公正的意见。他或她是怎么做到的?
他/她能支持吗?
Laro说这有很多的变量,涉及法官的决策:包括案件的事实细节、专家观点、目击证人、
证据和法官自己的观点及偏好。认为专家通过研究法官的初期观点就可以影响案件的结果是很
大的错误。
税收影响。Laro踌躇回答这个技术问题。当 Reilly和 Vleet试图把他钉在某些问题上时,
他提醒他们,法官们会向专家们寻求这些问题的正确答案
但是他确实允许税务问题在他的法庭不是一个封闭问题。他指出,特拉华法院允许这样做。
他说“门是开着的”,他正等着正确的事实走进法庭。
“热水澡”。专家见证的未来如何?“热水澡”,Laro回答赢得观众发笑。热水澡是处理专
家证人答辩的可替代方式。他解释到,在我们体系里双方方聘请专家向检察官和法院解释评估
和其他专业知识。但是,法官指出,经过对立律师的质证之后,想想专家的证词对于法官来说
是什么样子的?正如我们的对抗性模型所要求的那样。由于对专家可信度的持续攻击,证词变
得支离破碎。
他说,实现更公平的方法是,这种技术在其他一些以“热汤”闻名的国家实行,或者更正式
的说法是“共同见证证词”。Laro法官曾在一些案子使用,他通常和两名专家坐在一张桌子旁,
而律师则被转移到外围。法官开始谈话,问专家问题,并邀请他们进行他们自己的对话。在不
担心信誉受到攻击的情况下,专家能够对他们在案件上的工作进行学术性的讨论。

美国税务法庭对专家见证税务事项的影响
©IACVA(CHINA) - BVR 3
Reilly在澳大利亚、爱尔兰和英格兰等英国法系下有过参与案件审核的经历,他说与美国
相比是完全不同的。在很多方面来说,寻求事实认定是更好。当你坐在你认识人旁边或者他的
工作你很熟悉时。他说,你不会因为你觉得自己处于守势而攻击这个人。你们谈论这个案子,
并提出坦诚的意见分歧。
三个演讲者都赞成主审法官应该是老练的,因为法官需要发起对话。Reilly想知道这种方
法在法律界是如何看待的。Laro 说,在他提议使用的时候,各方起初都是很谨慎的,但是
后 IRS和那些申请的纳税人都是赞成的,并且看起来很满意。在第二种情况下,纳税人要求如
此。拉罗法官认为这种方法是前进的方向:它为法官提供了一致的专家证词,并以此帮助决策。

U.S. Tax Court Judge Laro Discusses Valuation and Expert Testimony Issues
©BVR 4
U.S. Tax Court Judge Laro Discusses Valuation and ExpertTestimony Issues
It’s not every day that you get the chance to hear the insights of a U.S. Tax Court judge
on issues of interest to valuation analysts. BVU was fortunate to hear Tax Court Judge
David Laro speak at a recent luncheon sponsored by the Business Valuation Association.
Judge Laro is the author of the seminal Mandelbaum decision (available at BVLaw).
Valuation experts Robert Reilly (Willamette Management Associates) and Dan Van Vleet
(Stout Risius Ross) moderated the luncheon and did an excellent job in having Judge Laro
talk about a number of interesting topics.
Tax Court facts. Reilly and Van Vleet asked Judge Laro to situate the Tax Court in the
U.S. legal system. The judge obliged and pointed out that there is one Tax Court, in
Washington, D.C., that is composed of 19 federal judges, all of whom have their own
jurisdiction. Most tax‐related cases settle rather than proceed to the U.S. Tax Court. In cases
where the parties don’t come to a resolution, they can litigate in federal district court, the
U.S. Court of Federal Claims, or the U.S. Tax Court. Consequently, financial experts cannot
assume that every tax decision is a Tax Court decision. Litigants may appeal a U.S. Tax
Court decision at the U.S. Court of Appeals of the appropriate regional circuit. But the
appeals court decision only serves as precedent in that circuit—it doesn’t bind Tax Court
judges in other circuits. Also, the appeals court affirms 94% of the time. Judge Laro’s
affirmation rate is even higher—97%.
Tax Court memos are fact‐intensive and don’t serve as precedent, but they can serve as
persuasive authority. Reilly pointed out that some opinions can assume landmark status.
Judge Laro’s Mandelbaum decision is a case in point. By now, it has become the
quintessential job aid for the IRS and valuation analysts when it comes to conceptualizing
and computing a discount for lack of marketability (DLOM).
More on Mandelbaum. Reilly wants to know: Why don’t all judges do what Judge
Laro did in Mandelbaum? That is, provide a thorough description of how they arrived at
their valuation conclusions. Different judges prefer different approaches, Judge Laro
explained. It’s a matter of transparency, and not every judge wants to set out his or her
thought process. The judge’s approach to Mandelbaum was to research the DLOM legal

美国税务法庭对专家见证税务事项的影响
©BVR 5
landscape and provide a methodology that valuators and future litigants could use to
create their valuations. When he discovered that many of the earlier memo cases broaching
the subject lacked explanations as to how the court arrived at its decision, he made a
deliberate effort to develop a decision that could guide the appraisal industry.
Tailor approach to presiding judge? Should knowledge about the presiding judge
influence the way an expert performs a valuation, Reilly and Van Vleet wanted to know.
No, said Judge Laro. He allowed that he would question the thoroughness of a report in
which an expert appearing in front of him failed to discuss theMandelbaum factors.
He also thought it was good practice for an expert to read the cases in which a
presiding judge discussed valuation issues to get a picture of where the judge is coming
from. But it would be a mistake to tailor a valuation to the judge. What matters is the
expert’s independent, unbiased opinion. How did he or she arrive at it? Can he or she back
it up?
There are so many variables, Judge Laro said, that go into a judge’s decision‐making:
the facts specific to a case, the experts, the witnesses, evidence, and the judge’s own views
and preferences. For an expert to assume he or she can influence the outcome of a case by
studying the judge’s prior decisions would be a big mistake.
Tax affecting. Judge Laro was hesitant to answer technical questions. When Van Vleet
and Reilly tried to pin him down on certain issues, he reminded them that the judges look
to the experts for the right answer to those questions.
But he did allow that the issue of tax affecting was not a closed matter in his court. The
Delaware Court of Chancery allows it, he noted. “The door is wide open,” he says. He was
waiting for the right set of facts to walk through it.
‘Hot tubbing.’What’s the future of expert testimony? “Hot tubbing,” responded Judge
Laro to chuckles in the audience. Hot tubbing is an alternate way to handle
cross‐examination of expert witnesses. In our system, he explained, the parties retain
experts to teach the fact‐finder and the court (sometimes the same) about valuation and
other issues that require specialized knowledge. But, the judge points out, think of what the
expert’s testimony looks like to a judge after the opposing counsel has put the expert
through cross‐examination, as our adversarial model requires. The testimony is fragmented
because of the sustained attack on the expert’s credibility.

U.S. Tax Court Judge Laro Discusses Valuation and Expert Testimony Issues
©BVR 6
The solution to a more equitable outcome, he says, is a technique practiced in a number
of other countries known as hot tubbing or, more formally, “concurrent witness testimony.”
Judge Laro, who has used it in a few cases, says he usually sits at a table with the two
experts flanking him and the attorneys relegated to the periphery. The judge opens a
conversation, asks questions of the experts, and invites them to pursue their own dialogue.
Without having to worry about attacks on their credibility, the experts are able to have a
collegial discussion about their work on the case.
Reilly, who had experience with this approach involving cases in Australia, Ireland,
and England (countries that trace their legal system to England), says it’s “radically
different” from the U.S. approach. In many ways, it’s better for fact‐finding. When you sit
next to someone you know or whose work you know, he says, you don’t attack the person
just because you feel on the defensive. You talk about the case and air honest
disagreements.
All three speakers agreed it requires a certain sophistication by the presiding judge
because the judge has to get the conversation started. Reilly wanted to know what the
reception of this approach has been in the legal community. When he proposed adopting it
in a case, Judge Laro said, the parties at first were reticent. But ultimately the IRS and the
petitioning taxpayer agreed and seemed satisfied. In a second case, the taxpayer asked for it.
Judge Laro thinks this approach is the way forward: It provides the judge with coherent
expert testimony and as such aids the decision‐making.

行业协会可以成为很好的补偿费用数据来源
©IACVA(CHINA) - BVR 1
Trade Associations Can Be Excellent
Sources of Compensation Data
行业协会可以成为很好的补偿费用数据来源
翻译:邵唯实(北京路浩资产评估有限公司)
在离婚案件中确定合理的补偿费用的最大问题是找出可用并相关的数据来支持你的观点。
因为合理的补偿费用通常是案件中最具争议的问题,也通常是评估离婚案件中最大的调整项,
所以这很重要。
The biggest problem in developing reasonable compensation for business owners
involved in a divorce is finding usable and relevant data to back up your opinion. This is
important because reasonable compensation is often the most contentious issue in the case,
typically involving the largest adjustment when valuing the spouse’s business.
当前的目录。有许多渠道和工具帮助评估师决定可对比的补偿费用。Paul Saltzman
(CPA, CVA, CFF,Dixon Hughes GoodmanLLP会计师事务所)说“我喜欢找出我们客户从
属的行业协会,就算它不是一个大众的协会,它可能也有一些可以用于小型企业比较的数
据。”附件中展示了一些提供补偿费用数据的行业协会渠道列表。
Current listing. There are many sources and tools to help appraisers determine
comparable com‐ pensation. “I like finding out what trade associations our clients belong

Trade Associations Can Be Excellent Sources of Compensation Data
©IACVA(CHINA) - BVR 2
to,” says Paul Saltzman, CPA, CVA, CFF (Dixon Hughes Goodman LLP). “Even if it’s not a
broad reaching association, it may have data for the smaller businesses that might be
comparable.” The accompanying exhibit presents a listing of trade association sources for
compensation data.
Saltzman在一次 BVR的研讨会“婚姻争端中合理的补偿费用”中提出他的看法。他的合
作者,JamesEwart(CPA,CVA,CFF,Dixon Hughes GoodmanLLP会计师事务所)观察到:
“显然,从评估层面来说,补偿费对影响很大。从家庭的支持层面来说,我们也想了解家庭单
元是如何被支持的。补偿费用通常是支持家庭层面的巨大组成部分,不管是对赡养费还是儿童
抚养费方面。”
Saltzman made his remarks during a BVR webinar, Reasonable Compensation in Marital
Dissolution. His co‐presenter, James Ewart, CPA, CVA, CFF (Dixon Hughes Goodman LLP)
observes: “Obviously, compensation has an impact on the valuation side. On the support side,
we also want to know how the family unit is being supported. Compensation typically is a
very large component of that support side, whether it be for alimony or child support.”
Saltzman又说:“当我们处理离婚问题时,我们在资产的价值外通常会面临一个支持问题。
所以我们需要在计算价值和计算价值对应的补偿费用并使用该价值决定能做到何种支持间进行
综合考虑。”
“When we are dealing with divorce, we usually have an issue of support in addition to
the value of an asset,” adds Saltzman. “So here we have an interplay between computing a
value and using compensation in computing that value, and then using a value to determine
what support would be available.”
Ewart 说:“补偿费用可能包括工资、奖金也可能来源于资产如 ‘汽车火车飞机 ’。”
Saltzman说:“在家庭法律案例中,我们花费了大量时间去获取和整理这些东西。”
Compensation can include salaries and bonuses and assets such as “trains, planes, and
automo‐ biles,” says Ewart. “In family law matters, we spend a considerable amount of time
documenting and obtaining an understanding of what those are,” says Saltzman.
12点检查事项。所有的补偿费用渠道,包括行业协会调查,其中的数据都会有些偏差。
Donald Schiller (Schiller Du Canto and Fleck)提出的作为决定合理补偿费用数据的很好的考
量的下面 12点检查事项在近年经常被提及。
12‐point checklist. All compensation sources, including trade association surveys, have

行业协会可以成为很好的补偿费用数据来源
©IACVA(CHINA) - BVR 3
plusses and minuses. The 12‐point checklist below by Donald Schiller (Schiller Du Canto
and Fleck) has been cited frequently over the years, but it serves as a good reminder when
determining reason‐ able compensation data.1
1、数据采集是基于国家还是地区?
1. Are the data collected on a national or regional basis?
2、是否包含补偿费用可能会直接跟企业利润挂钩的雇主/雇员(如咨询机构合伙人)的数
据?
2. Do the data include owner/employees where the amount of compensation reported
may also include business profits as compensation (i.e., partners in professions and businesses)?
3、我们从行业和专业协会取得的数据中与评估对象相关的数据的采样规模如何?
3. Concerning data from business and professional associations, what are the sampling
sizes that relate to the subjectvaluations?
4、当使用标准行业分类代码识别对比者时,如何将目标企业的特性与行业代码所覆盖的
大量公司进行对比?
4. When using SIC codes in identifying comparables, howdo the particular characteristics
of the subject company compare with the broader range of companies covered by SIC code?
5、如何确定目标雇主/雇员的工作/工时与职位和对比公司的对比。
5. How do the data use and define the job titles, and are the actual duties comparable to
the duties/hours of the subject owner/employee?
6、调查的数据是反应平均数,中位数还是四分位数。
6. Does the data survey reflect averages? Medians? Quartiles?
7、数据如何能反应细分的行业和专业如婚姻律师,司法会计师,说客等。
7. Do the data reflect compensation for people with particular niches and subspecialties,
i.e., matrimonial attorneys, forensic accountants, lobbyists, etc.?
8、评估师是否需要在调查数据中调查多个职位以覆盖雇主/雇员的工作。
8. Does the valuator need to include multiple job titles from the survey data to cover the
owner/employee’s duties?

Trade Associations Can Be Excellent Sources of Compensation Data
©IACVA(CHINA) - BVR 4
9、调查使用的渠道和统计有多可靠?
9. How reliable are the statistics and sources that the survey uses?
10、在运用时,各种股票期权、限售股、影子股补偿和其他隐含要素是否反映在调查的数
据里,且是否与目标雇主/雇员可比?
10. Where applicable, are stock options, restricted stock, shadow stock compensation and
other perks reflected in the data survey, and are they comparable to the owner/employee in
question?
11、数据库中的所有公司是否包含工资以外的养老金计划?
11.Were all companies in the database consistent in having/not having retirement plans
separate from salary?
12、目标客户是否是企业中的关键人物?
12. Is the owner a “key person” in the business or a top performer/sales generator?
如要获得 Ewart和Saltzman“婚姻争端中合理的补偿费用”研讨会的详细资料,请访问
www.bvresources.com/pastevents.asp
Foran archivedversionof the Ewart and Saltzmanwebinar, “ReasonableCompensation in
Marital Dissolution,”gotowww.bvresources.com/pastevents.asp.

行业协会可以成为很好的补偿费用数据来源
©IACVA(CHINA) - BVR 5
1Donald Schiller, “Hot Topics in Valuation,”www.sdflaw.com/files/Hot_Topics_in_Valuation.pdf.
Trade Association Compensation Surveys, Continue
行业协会补偿费用
SIC NAICS INDUSTRY
行业
SOURCE
渠道
TITLE
报告名称
0180 111421 Garden, Landscape, and Plant Nurseries
园艺,景观和植物护理
American Nurseryman; www.amerinursery.com
美国园艺人; www.amerinursery.com
Grower: Wage & Benefits Report
0740 541940 Veterinarians and Services
兽医和兽医服务
American Veterinary Medical Association; www.avma.org
美国兽医协会; www.avma.org
AVMA Report on VeterinaryCompensation
0781 541320 Landscape Designers and Architects
景观设计和建筑
American Society of Landscape Architects; www.asla.org
美国景观设计建筑社团; www.asla.org
ASLA’s 2014 Salary Survey Report
1241 213113 Coal Mining
煤炭采矿业
National Mining Association; www.nma.org
国家矿业协会; www.nma.org
Annual Coal Mining Wages vs. AllIndustries
1400 212310 Crushed Stone, Sand, and Gravel Miningand Quarrying
碎石,沙,砂砾和采石业
National Stone, Sand & Gravel Association;www.nssga.org
国家石,沙,砂砾协会; www.nssga.org
Aggregates Industry CompensationSurvey
1731 238210 Electrical Contractors
电力集成商
National Electrical Contractors Association;www.necanet.org
国家电力集成商协会; www.necanet.org
Officer and Overhead PersonnelCompensation Survey
1731 238210 Electronics, Sound & CommunicationsSystem Contractors
电子、音像交流系统集成商
National Systems Contractors Association;www.nsca.org
国家系统集成商协会; www.nsca.org
Compensation & Benefits Report
2050 311800 Wholesale and Commercial Bakeries
批发和经营烘焙仪器
American Bakers Association; americanbakers.org
美国烘焙协会; americanbakers.org
Salary and Benefits Survey
2431 321911 Wood Millwork, Window, and DoorManufacturers
木制品、门窗制造
Architectural Woodwork Institute; awinet.org
木工建筑学院; awinet.org
Cost of Doing Business andCompensation Study
2500 337000 Furniture Manufacturers
家居制造
American Home Furnishings Alliance; www.ahfa.us
美国家庭家具制造联盟; www.ahfa.us
Sales Reps Compensation Survey
2542 337215 Store Fixture Manufacturers
商店设施制造
Association for Retail Environments;www.retailenvironments.org
零售环境协会; www.retailenvironments.org
Employee Compensation & BenefitsReport
Manufacturers Association for Plastics Processors;www.mappinc.com
塑料处理制造协会; www.mappinc.com
Wage and Salary Report
2711 511110 Commercial Printing and NewspaperPublishing
商业印刷与报纸出版
Inland Press Association; www.inlandpress.org/research
内陆印刷协会; www.inlandpress.org/research
Newspaper Industry CompensationSurvey
National Association for Printing Leadership; napl.org
国家印刷领袖协会; napl.org
NAQP Financial Benchmarking Study
Graphic Arts Information Network; www.printing.org
图片艺术信息网; www.printing.org
Wage & Benefit Survey
2836 325414 Biotechnology Companies
生物技术公司
BioWorld; www.bioworld.com
生物世界; www.bioworld.com
BioWorld’s Executive CompensationReport 2014
3320 331500 Foundries and Metal CastingsManufacturers
铸造和金属制造
American Foundry Society; www.afsinc.org
美国铸造业社团; www.afsinc.org
Executive Salary Survey
Precision Metal Forming Association; www.pma.org
精准金属造型协会; www.pma.org
Executive Compensation Report -Manufacturing Edition
3460 332110 Metal Forgings and StampingsManufacturers
金属锻造和冲压制造
Forging Industry Association; www.forging.org
锻造业协会; www.forging.org
Hourly and Management Compensationand Benefits
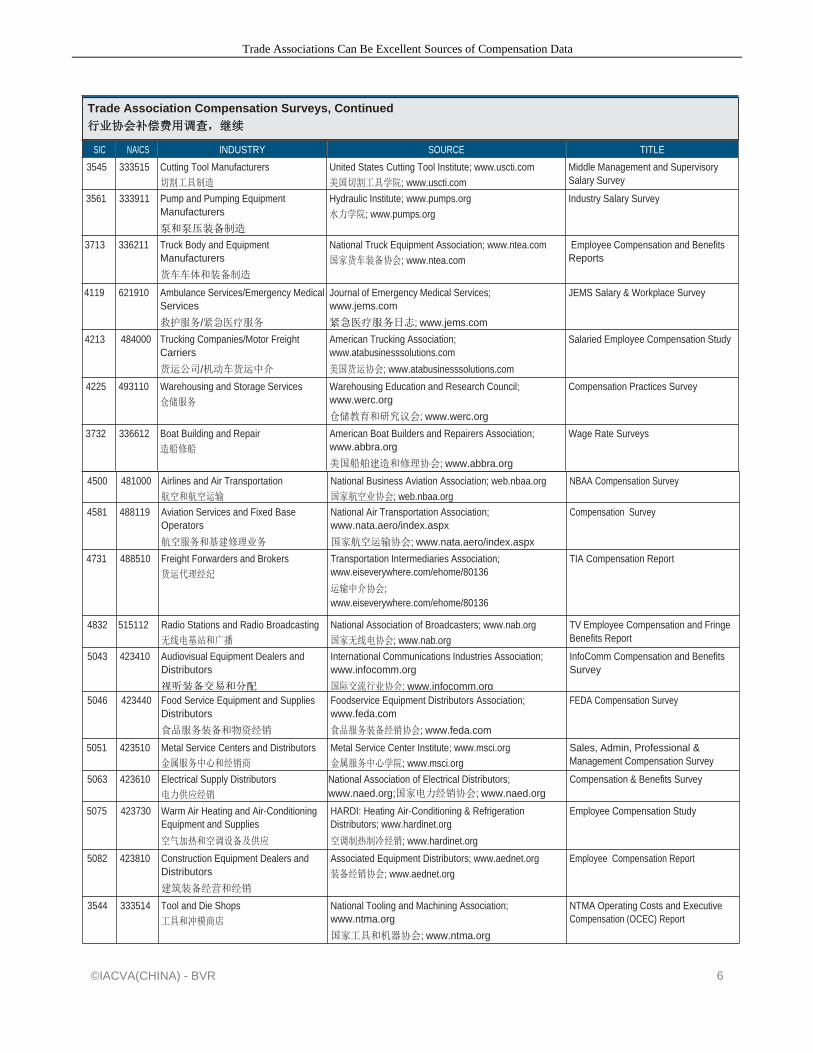
Trade Associations Can Be Excellent Sources of Compensation Data
©IACVA(CHINA) - BVR 6
Trade Association Compensation Surveys, Continued
行业协会补偿费用调查,继续
SIC NAICS INDUSTRY SOURCE TITLE
3545 333515 Cutting Tool Manufacturers
切割工具制造
United States Cutting Tool Institute; www.uscti.com
美国切割工具学院; www.uscti.com
Middle Management and SupervisorySalary Survey
3561 333911 Pump and Pumping EquipmentManufacturers
泵和泵压装备制造
Hydraulic Institute; www.pumps.org
水力学院; www.pumps.org
Industry Salary Survey
3713 336211 Truck Body and EquipmentManufacturers
货车车体和装备制造
National Truck Equipment Association; www.ntea.com
国家货车装备协会; www.ntea.com
Employee Compensation and BenefitsReports
4119 621910 Ambulance Services/Emergency MedicalServices
救护服务/紧急医疗服务
Journal of Emergency Medical Services;www.jems.com
紧急医疗服务日志; www.jems.com
JEMS Salary & Workplace Survey
4213 484000 Trucking Companies/Motor FreightCarriers
货运公司/机动车货运中介
American Trucking Association;www.atabusinesssolutions.com
美国货运协会; www.atabusinesssolutions.com
Salaried Employee Compensation Study
4225 493110 Warehousing and Storage Services
仓储服务
Warehousing Education and Research Council;www.werc.org
仓储教育和研究议会; www.werc.org
Compensation Practices Survey
3732 336612 Boat Building and Repair
造船修船
American Boat Builders and Repairers Association;www.abbra.org
美国船舶建造和修理协会; www.abbra.org
Wage Rate Surveys
4500 481000 Airlines and Air Transportation
航空和航空运输
National Business Aviation Association; web.nbaa.org
国家航空业协会; web.nbaa.org
NBAA Compensation Survey
4581 488119 Aviation Services and Fixed BaseOperators
航空服务和基建修理业务
National Air Transportation Association;www.nata.aero/index.aspx
国家航空运输协会; www.nata.aero/index.aspx
Compensation Survey
4731 488510 Freight Forwarders and Brokers
货运代理经纪
Transportation Intermediaries Association;www.eiseverywhere.com/ehome/80136
运输中介协会;www.eiseverywhere.com/ehome/80136
TIA Compensation Report
4832 515112 Radio Stations and Radio Broadcasting
无线电基站和广播
National Association of Broadcasters; www.nab.org
国家无线电协会; www.nab.org
TV Employee Compensation and FringeBenefits Report
5043 423410 Audiovisual Equipment Dealers andDistributors
视听装备交易和分配
International Communications Industries Association;www.infocomm.org
国际交流行业协会; www.infocomm.org
InfoComm Compensation and BenefitsSurvey
5046 423440 Food Service Equipment and SuppliesDistributors
食品服务装备和物资经销
Foodservice Equipment Distributors Association;www.feda.com
食品服务装备经销协会; www.feda.com
FEDA Compensation Survey
5051 423510 Metal Service Centers and Distributors
金属服务中心和经销商
Metal Service Center Institute; www.msci.org
金属服务中心学院; www.msci.org
Sales, Admin, Professional &Management Compensation Survey
5063 423610 Electrical Supply Distributors
电力供应经销
National Association of Electrical Distributors;www.naed.org;国家电力经销协会; www.naed.org
Compensation & Benefits Survey
5075 423730 Warm Air Heating and Air-ConditioningEquipment and Supplies
空气加热和空调设备及供应
HARDI: Heating Air-Conditioning & RefrigerationDistributors; www.hardinet.org
空调制热制冷经销; www.hardinet.org
Employee Compensation Study
5082 423810 Construction Equipment Dealers andDistributors
建筑装备经营和经销
Associated Equipment Distributors; www.aednet.org
装备经销协会; www.aednet.org
Employee Compensation Report
3544 333514 Tool and Die Shops
工具和冲模商店
National Tooling and Machining Association;www.ntma.org
国家工具和机器协会; www.ntma.org
NTMA Operating Costs and ExecutiveCompensation (OCEC) Report

行业协会可以成为很好的补偿费用数据来源
©IACVA(CHINA) - BVR 7
Trade Association Compensation Surveys, Continued
行业协会补偿费用调查,继续
SIC NAICS INDUSTRY SOURCE TITLE
5084 423830 Machine Tool Dealers and Distributors
机械工具经营和经销
American Machine Tool Distributors Association;www.amtda.org
美国机械工具经销协会; www.amtda.org
AMTDA Service Technician & ApplicationEngineer Practices Survey
Material Handling Equipment Dealers andDistributors
物料运输装备经营和经销
Material Handling Equipment Distributors Association;www.mheda.org
物理运输装备经销协会; www.mheda.org
Employee Compensation Report
5085 423840 Industrial Supplies Distributors
工业物资经销
Industrial Distribution; www.inddist.com Annual Salary Survey
Industrial Supply Association; www.isapartners.org Employee Compensation Report
5113 424130 Paper and Packaging Distributors National Paper Trade Association; www.gonpta.com Compensation Report
5141 424410 Food Distributors, Wholesalers, and Brokers
食品经销,批发,经纪
Food Marketing Institute; www.fmi.org Asset Protection Department Structure
International Foodservice Distributors Association;www.ifdaonline.org
国际食品服务经销协会; www.ifdaonline.org
Employee Compensation Report
5149 424490 Pet Food Suppliers and Distributors
宠物食物供应和经销
Pet Industry Distributors Association; www.pida.org
宠物行业经销协会; www.pida.org
Employee Compensation Study
5169 424690 Chemical Distributors
化工经销
National Association of Chemical Distributors;www.nacd.com/benefit/benefits.aspx
国家化工经销协会;
Compensation and Benefits Survey
5193 424930 Flower and Florist Supplies Distributors
花及花卉服务物资经销
Wholesale Florist & Florist Supplier Association;www.wffsa.org
花及花卉服务批发物资协会; www.wffsa.org
Employee Compensation Survey
5211 444110 Building Supplies Stores and Home Centers
建筑物资商店和家庭中心
North American Retail Hardware Association;www.nrha.org
北美零售硬件协会; www.nrha.org
Employee Compensation Study
Northeastern Retail Lumber Association; www.nrla.org
东北部杂货零售协会; www.nrla.org
Biennial Compensation and BenefitsSurvey
5251 444130 Hardware Stores
硬件业
North American Retail Hardware Association;www.hrta.org 北美硬件零售协会;www.hrta. org
Employee Compensation Survey
5261 444220 Lawn and Garden Equipment andSupplies Stores
剪草和园艺设备物资业
American Nurseryman; www.amerinursery.com
美国园艺人; www.amerinursery.com
Wage & Benefits Survey
5300 440000 Retail Stores
零售业
National Retail Federation; www.nrf.com
国家零售联盟; www.nrf.com
Retail Compensation & Benefits Survey
5411 447110 Convenience Stores
便利店业
National Association of Convenience Stores;www.nacsonline.com
国家便利店协会; www.nacsonline.com
State of the Industry CompensationReport
5734 443120 Computer, Software, and PeripheralEquipment Stores 电脑,软件和外设业
Business Technology Association; www.bta.org
商业技术协会; www.bta.org
BTA Compensation Report
5084 423830 Fluid Power Equipment Dealers andDistributors
液压装备经营和经销
Fluid Power Distributors Association; www.fpda.org
液压装备协会; www.fpda.org
Employee Compensation Reports

Trade Associations Can Be Excellent Sources of Compensation Data
©IACVA(CHINA) - BVR 8
Trade Association Compensation Surveys, Continued
行业协会补偿费用调查,继续
SIC NAICS INDUSTRY SOURCE TITLE
5812 722310 Food Service Contractors
食品服务商
National Association of College & University FoodServices; www.nacufs.org
国家学院大学食品服务协会; www.nacufs.org
Salary Benchmarking Survey
5942 451211 College and University Stores andBookstores
学院大学商店和书店
National Association of College Stores; www.nacs.org
国家学院书店协会; www.nacs.org
College Stores Salary & Benefits Survey
5947 453220 Museum Shops and Stores
博物馆商店
Museum Store Association; www.museumdistrict.com
博物馆商店协会; www.museumdistrict.com
Museum Store Association RetailIndustry Report
6020 522110 Commercial Banks and FinancialInstitutions
商业银行和财经学院
American Bankers Association; www.aba.com
美国银行业协会; www.aba.com
Compensation & Benefits Survey
Independent Commmunity Bankers of America;www.icba.org
美国独立商业银行; www.icba.org
Compensation Survey
6060 522130 Credit Unions
信用社
Credit Union National Association; advice.cuna.org
国家信用社协会; advice.cuna.org
Staff Salary Report
Credit Union Executives Society; www.cues.org
信用社高管社团; www.cues.org
CUES Executive Compensation Survey
6162 522292 Mortgage Banking and Bankers
抵押银行业
Mortgage Bankers Association of America;www.mbaa.org
美国抵押银行家协会; www.mbaa.org
The Residential Compensation Survey
Commercial Real Estate CompensationSurvey Program
6211 523110 Investment Banks and Banking Services
投行服务
Securities Industry and Financial Markets Association;www.sifma.org
证券行业和财经市场协会; www.sifma.org
Compensation of Top Management inSmall and Regional Firms
Financial Services Institute; www.financialservices.org
财经服务学院; www.financialservices.org
FSI Broker-Dealer Financial Performanceand Compensation Study
6512 531120 Industrial Building Managers andOperators
工业建筑管理经营
National Association of Industrial and Office Properties;www.naiop.org
国家工业和办公建筑协会; www.naiop.org
National Real Estate Compensation andBenefits Survey
The Institute of Real Estate Management;www.irem.org
不动产管理学院; www.irem.org
Profile and Compensation Study -Accredited Management Organization
Profile and Compensation Study -Certified Property Manager
FacilitiesNet; www.facilitiesnet.com
设施网www.facilitiesnet.com
Salary Database
6512 531120 Office Building Managers and Operators
办公建筑管理和经营
National Association of Industrial and Office Properties;www.naiop.org
国家工业和办公建筑协会; www.naiop.org
Commercial Real Estate CompensationSurvey
6512 711310 Sports, Convention, and EntertainmentFacility Operators
运动、会议和娱乐设施经营
International Association of Venue Managers;www.iavm.org
国际聚会管理协会; www.iavm.org
Arena Management Salary Report
Convention Center Management SalaryReport
6513 531311 Apartment Managers and Operators
公寓管理和经营
National Multi Housing Council; www.nmhc.org
国家复合房屋议会; www.nmhc.org
National Multifamily IndustryCompensation Survey
The Institute of Real Estate Management;www.irem.org
不动产管理学院; www.irem.org
Profile and Compensation Study -Accredited Residential Manager

行业协会可以成为很好的补偿费用数据来源
©IACVA(CHINA) - BVR 9
Trade Association Compensation Surveys, Continued
行业协会补偿费用调查,继续
SIC NAICS INDUSTRY SOURCE TITLE
6514 531110 Condominium and CooperativeManagers and Operators
共有与合作管理和经营
Community Associations Institute; www.caisecure.net
交流协会学院; www.caisecure.net
Community Association ManagerCompensation & Salary Survey
National Association of Industrial and Office Properties;www.naiop.org
国家工业和办公建筑协会; www.naiop.org
Compensation Report
FacilitiesNet; www.facilitiesnet.com
设施网; www.facilitiesnet.com
Salary Survey
6282 523930 Financial Planners and InvestmentAdvisors
财经计划与投资顾问
Securities Industry and Financial Markets Association;www.sifma.org
证券行业和财经市场协会; www.sifma.org
Operations and Compensation Surveys
6300 524100 Insurance Companies, Carriers, andInsurers
保险公司、经纪和保险家
National Association of Mutual Insurance Companies;www.namic.org
国家共同保险公司协会; www.namic.org
Property & Casualty InsuranceCompensation Survey
6798 525930 Real Estate Investment Trusts
房地产投资信托
National Association of Real Estate Investment Tools;www.reit.com
国家房地产投资工具协会; www.reit.com
NAREIT Compensation Survey
7213 812331 Uniform and Linen Rental Services
制服和亚麻租赁服务
Textile Rental Services Association; www.trsa.org
纺织租赁服务协会; www.trsa.org
Compensation & Benefits Report
7217 561740 Carpet and Upholstery Cleaning Services
地毯和家用垫衬清洁服务
Cleaning Management Institute; cminstitute.net
清洁管理学院; cminstitute.net
Carpet Cleaning Benchmarking SurveyReport
7261 812200 Funeral Homes, Mortuaries, Cemeteries,and Crematories
丧葬室、太平间、墓地、火葬场
National Funeral Directors Association;www.nfda.org
国家丧葬管理协会; www.nfda.org
NFDA Compensation Survey
7299 812191 Weight Loss Centers and Diet Clinics
减肥中心和节食诊所
American Dietetic Association; www.eatright.org
美国节食协会; www.eatright.org
Salary Surveys
7311 541810 Advertising Agencies
广告代理
American Association of Advertising Agencies;www.aaaa.org
美国广告代理协会; www.aaaa.org
Employee Compensation
7322 561440 Collection Agencies and Services
收藏代理和服务
Credit Research Foundation; www.crfonline.org
信用研究基金会; www.crfonline.org
Credit and A/R Compensation Study
7331 541860 Direct Mail Marketing and AdvertisingServices
直邮市场和广告服务
Mailing & Fulfillment Service Association;www.mfsanet.org
邮政实施服务协会; www.mfsanet.org
Wage and Benefits Study
7336 541430 Graphic Design Services
图像设计服务
American Institute of Graphic Arts; www.aiga.org
美国图像艺术学院; www.aiga.org
Survey of Design Salaries
8011 621111 OfficesandClinicsofDoctorsofMedicine
医药诊所
American Medical Group Association;www.amga.org/store/
美国医疗群体协会; www.amga.org/store/
Medical Group Compensation andFinancial Survey
Physician Compensation and ProductionSurvey
8711 541330 Engineering Services
工程服务
American Council of Engineering Companies;www.acec.org
美国工程公司议会; www.acec.org
Engineering Income and Salary Survey

Trade Associations Can Be Excellent Sources of Compensation Data
©IACVA(CHINA) - BVR 10
Trade Association Compensation Surveys, Continued
行业协会补偿费用调查,继续
SIC NAICS INDUSTRY SOURCE TITLE
8712 541310 Architectural Services
建筑服务
American Institute of Architects; store.aia.org
美国建筑学院; store.aia.org
AIA Compensation Survey
(Source: This is an update of a table that appears in Reasonable Compensation: Application and Analysis for Appraisal, Tax and Management Purposes, KevinYeanoplosand RonaldSeigneur.Business Valuation Resources, 2010. )
(渠道:这是根据“Reasonable Compensation: Application and Analysis for Appraisal, Tax and Management Purposes, Kevin Yeanoplosand Ronald Seigneur.
BusinessValuation Resources, 2010”作出的更新表格)

预览行业资本成本新基准资源
©IACVA(CHINA) - BVR 1
A Preview of the New Benchmark
Resource for Industry Cost of Capital
预览行业资本成本新基准资源
翻译: 胡东全 程海伦(中联国际评估咨询有限公司)
道衡(Duff & Phelps)在三月份发布了《2014年度评估手册—资本成本指南》,提供了
以前在《晨星/Ibbotson SBBI评估年鉴》提供的关键年终数据和道衡风险溢价报告。资本成本
指南对于个体企业,企业所有者权益,证券或无形资产的权益资本成本估算很有价值。
现在,道衡引入了一个重要的新资源—《2014年评估手册—行业资本成本》。
像之前的《晨星(Morningstar)/Ibbotson资本成本年鉴》一样,《2014年评估手册—行
业资本成本》在 2014年 3月发布,其中包括三个年内季度更新内容(6月,9月和 12月)。与
上一本书一样,这本书是按照国民经济行业分类(SIC)来定义出版的。
BVU得到了一个和道衡的吉姆∙哈林顿坐下来交流的机会,他会告诉我们,新书将会看到
什么。
BVU:这本书是怎么产生的?
吉姆∙哈灵顿:晨星停用了 2013年评估分析师广泛使用的一些出版物,包括《SBBI评估年
鉴》和《Ibbotson资本成本年鉴》。 去年春天,当我们发布《评估手册 ‐ 资本成本指南》时,
道衡开始填补空白。这是第一本书,它提供了以前在《晨星/Ibbotson SBBI评估年鉴》提供的

A Preview of the New Benchmark Resource for Industry Cost of Capital
©IACVA(CHINA) - BVR 2
关键年终数据和道衡风险溢价报告,可用于制定个人公司的权益资本成本。
第二本书是《评估手册 ‐ 行业资本成本》,它提供了与以前在《晨星/Ibbotson 资本成本
年鉴》中发表的同样类型的严格的行业级别分析。
BVU:新书何时可以出版?
吉姆∙哈灵顿:现在已经有了,而且提前预购的买家应该随时收到。精装书将于 2014年 3
月出版;6 月、9 月和 12 月可选择季度更新。这与《晨星/Ibbotson》过去发布数据的方式是
一样的,这是一本书,数据是 3月份的数据,然后是通过电子邮件发送 PDF格式的 3个季度
更新。
我们这样做的原因与《晨星/Ibbotson》过去遵循这个时间表的原因是一样的:大多数美
国公司都是在一个标准的 1‐12月财政年度,所以到 3月底,大多数公司都报告了他们最近的
财政年度的结果。我们谨慎遵循着同样的发布时间表,就像现在已经停止的《晨星/Ibbotson
资本年鉴》,以便能够以不间断的方式提供关键数据,将能够使之前购买资本成本年鉴的人将数
据库保持最新状态。
这本书的出版时间安排在今年晚些时候,因为这本书涉及大量的工作,并添加了我们得到
的所有额外材料。最初的 2014 版出版工作必须从头开始。明年春天,精装书的 2015 版将在
2015年 3月发布,精装书将在 5月开始定期发货,并在 6月、9月和 12月发布 PDF格式的季
度更新。
BVU:如果我购买“评估手册—资本成本指南”来制定公司权益资本成本,为什么还需要
获得关于行业资本成本的第二本书?
吉姆∙哈灵顿:有以下几个原因:首先,评估是一种固有的比较过程——任何分析都可以归
结为试图将一件事与另一件事进行比较。例如,如果你为标的公司制定了权益资本成本,你可
能会遇到的第一个自然问题是:“我对标的公司的分析与标的公司的同行或行业相比如何?”在
任何分析中,一个正常和谨慎的步骤是执行一些基准测试作为一个“合理性”测试。评估分析师
很可能会发现在新书中提供的统计数据是一个非常有用的指标,对他/她自己的行业定制分析
进行基准测试提供额外支持,这些分析包括标的业务、企业所有者权益、证券或无形资产。
而且,最初的指南没有 CAPM的贝塔值。行业手册有行业级别的贝塔值,可以在 CAPM
分析中使用,这些贝塔值也可以用于在线风险溢价计算。
BVU:新书通过国民经济行业分类(SIC)而不是北美产业分类标准(NAICS)或全球行
业分类标准(GICS)定义每个行业。这是为什么?
吉姆∙哈灵顿:旧书使用 SIC 20年了,所以我们至少在一开始就要符合这个标准。将来,

预览行业资本成本新基准资源
©IACVA(CHINA) - BVR 3
我们可能将 SIC转换为 NAICS 或 GICS。
BVU:它涵盖了几个行业?
吉姆∙哈灵顿:本书包含了超过 200个 SIC 美国行业的数据,还包括对于美国大盘股,中
盘股,小盘股和微型股四个规模组合中每一个按照相同统计口径的统计数据。
BVU:停产的《晨星/Ibbotson资本成本年鉴》包括 300多个行业。为什么这本新书少了?
吉姆∙哈灵顿:以前的晨星书中列出的行业有相当多是重复的。例如,在晨星出版的
Ibbotson资本成本年鉴的最终 2013 版中,如果你看 SIC 21,SIC 211 和 SIC 2111,他们是完
全重复,他们拥有相同的公司集和每个数据点相同的统计数据。我们在《2014年度评估手册 ‐行业资本成本》中消除了这一重复分析,并简化了数据。
我们也加紧了公司的筛选过程。“筛选过程”是我们用来识别有“资格”被纳入分析的公司。
在新的行业书籍中,它模仿了《2014年评估手册—资本成本指南》中使用的流程,以便从《风
险溢价报告》的研究报告中找出这些公司。 更严格的筛选有助于确保新书中行业分析中使用
的公司是经过数年交易的经验丰富的公司,至少销售最低数量的产品或服务,并能够达到一定
程度活跃的经营现金流量。
公司筛选的最后一步是公司至少有 75%的收入来自单一业务部门(即:,单一经营公司)。这
是在前《晨星/Ibbotson年鉴》中应用的“75%规则”。
BVU:这本新书包含哪些信息?
吉姆∙哈灵顿:本书包括用八种不同方式从行业层面计算 200 多个美国行业的权益资本成
本估算值,包括 CAPM、风险叠加方法、一阶段和三阶段 DCF 模型,以及 Fama‐French 三
因素模型。它还包括行业负债成本估计和行业加权平均资本成本(WACC)估计。
此外,详细的行业统计数据,包括销售,市值,资本结构,杠杆和无杠杆的 beta评估,
评估(交易)倍数,财务和盈利率,股本回报率,预测每股收益(EPS)增长率也包括在内。
其中一些统计信息以前从未提供过。
BVU:你说这本新书有一些额外的统计数据,在晨星/Ibbotson的书中没有。你为读者提供
了什么额外的信息?
吉姆∙哈灵顿:我们感到非常兴奋的是,可以使用新的统计数据来衡量债务类表外资产对
资本结构和标的行业无杠杆贝塔值的影响。通过“类似债务的表外项目”,我的具体意思是资本
化的经营租赁和未置存养老金负债。
为什么这个很重要?好吧,在给公司设定债务评级时,信用评级机构会考虑这些债务的等

A Preview of the New Benchmark Resource for Industry Cost of Capital
©IACVA(CHINA) - BVR 4
价负债,而且在确定公司的真实财务(和股权)风险时也应该考虑这些负债。我们复制了信用评
级机构在这方面的分析。
这些表外负债有时是相当重要的,因此我们用包括以及不包括表外负债的两种方式计算了
每个行业的资本结构和未杠杆的 betas,然后我们并排显示结果。
最后,对每个行业的资本结构,包括每种类型表外负债的影响进行量化。例如,零售行业
使用大量的经营租赁,这是行业内资本结构发生变化的主要驱动因素,所以表外债务也包括在
内。另外,在表外债务中,汽车行业资本结构变化的主要驱动力是未置存养老金负债。
BVU:当然,每个行业的资本成本估算也在新书里?
吉姆∙哈灵顿: 哦,是的! 对于资本成本,有 8 种不同的计算方法。过去的晨星/Ibbotson书
有五种方法。在新书中,权益资本成本有八种方法计算,包括 CAPM,CAPM 加上使用 CRSP
等分量研究的规模溢价,使用CRSP等分量研究的累计行业风险溢价,CAPM加使用风险溢价报
告研究的规模溢价,累计行业风险溢价超过无风险利率的等分量研究,一阶段贴现现金流 DCF
模型,三阶段 DCF模型,和法玛—弗伦奇三因子模型。
BVU:beta值怎么样? beta值是如何计算的?
吉姆∙哈灵顿:是的,beta值有六种方法计算。晨星/Ibbotson的书有两个。在新书中,六种
方式是最小二乘法(原始)beta、blume 调整 beta、行业 beta、或“对等组”beta、vasicek 调整
beta、beta求和法和下行 betas。这些 beta值是用超过 200多个美国行业中的中值公司,通过
每个行业的 SIC组合、每个行业的大复合、每个行业的小组合,以及“高金融风险”公司组合来
计算的。当然,提交的任何统计数据都取决于是否可以计算这些数据,因此某些行业不包括所
有的统计数据。
新书中的 beta值可以作为 CAPM估计的 beta输入在线风险溢价计算器中来使用。
需要说明的是,在执行WACC分析时,“无杠杆”和“有杠杆”是常见的做法。例如,当主
体公司的资本结构预计在未来发生变化时,这就不同了。一个无杠杆的 beta,也被称为“资
产”beta,即指一个公司仅仅通过股权资本融资所对应的 beta值。在新书中,对每个行业都计
算了无杠杆的 beta值。
BVU:你提到对等组。你可以解释它们是如何创建的?
吉姆∙哈灵顿:在书中创建的对等组对分析师来说是一个很大的帮助。一个常见的难点是为
标的公司确定同行公司或比较对象。在新书中,任何行业的分析中,每家公司必须至少有 75%
的收入来自于该行业,正如 SIC所定义的那样。这些现成的对等组资源对寻找合适的公司方面
是一个很大的帮助。

预览行业资本成本新基准资源
©IACVA(CHINA) - BVR 5
对于一个行业所需的最低数量的公司来说,门槛和旧书是一样的。必须有至少五家公司组
成一个行业。
BVU:如何进行更新工作?
吉姆∙哈灵顿:一切都将重新计算,6月、9月和 12月将通过电子方式进行更新。同样,由
于启动延迟,6月和 9月的更新可能会在本月末之前一起发布。
BVU:数据变化那么大吗?为什么需要更新呢?
吉姆∙哈灵顿:是的,数据改变了。在某些情况下,这些变化将会是显著的四分之一到四分
之一,而在另一些情况下可能并不那么重要。但随着时间的推移,这些变化变得越来越重要。
无论如何,通常最好是使用现有的最新数据。
BVU:谢谢 Jim,我们期待着看到这本书,并祝贺 D&P在这个宝贵的新资源中所付出的
一切努力。
吉姆∙哈灵顿:不用谢。
A Preview of the New Benchmark Resource for Industry Cost of Capital
©IACVA(CHINA) - BVR 6
A Preview of the New Benchmark Resource for Industry Cost ofCapital
Duff & Phelps published the 2014 Valuation Handbook ‐ Guide to Cost of Capital in March,
providing key year‐end data previously available in the Morningstar/Ibbotson SBBI Valuation
Yearbook and the Duff & Phelps Risk Premium Report. The Guide to Cost of Capital is valuable for
developing cost of equity capital estimates for an individual business, business ownership interest,
security, or intangible asset.
Now Duff & Phelps has introduced an important new resource, the 2014 Valuation
Handbook ‐ Industry Cost of Capital.
Like the previous Morningstar/Ibbotson Cost of Capital Yearbook, the 2014 Valuation
Handbook ‐ Industry Cost of Capital is published with data through March 2014 and will
include three intra‐year quarterly updates (June, September, and December). Like the
previous book, this one is published with industries identified by Standard Industrial
Classification (SIC) code.
BVU had the opportunity to sit down with Jim Harrington of Duff & Phelps, who told
us what we’ll see in the new book.
BVU: How did this book come about?
Jim Harrington: Morningstar discontinued a number of publications used extensively
by valuation analysts in 2013, including the SBBI Valuation Yearbook and the Ibbotson Cost
of Capital Yearbook. Duff & Phelps began to fill the void this past spring when we
published the Valuation Handbook ‐ Guide to Cost of Capital. This first book provides the
key year‐end data previously available in both the Morningstar/Ibbotson SBBI Valuation
Yearbook and the Duff & Phelps Risk Premium Report and can be used to develop cost of
equity capital for an individual company.
The second book is the Valuation Handbook ‐ Industry Cost of Capital, and it provides
the same type of rigorous industry‐level analysis previously published in the green‐coverMorningstar/Ibbotson Cost of Capital Yearbook.
BVU: When will the new book be available?
JH: It has just become available, and prepublication buyers should be receiving it any

预览行业资本成本新基准资源
©IACVA(CHINA) - BVR 7
day. The hardcover book will have data through March 2014; optional quarterly updates
will be available in June, September, and December. This is the same way that
Morningstar/Ibbotson used to publish the data—a hardcover book with data through
March, followed by three quarterly updates delivered in PDF format via email.
We did this for the same reason that Morningstar/Ibbotson used to follow that
schedule: Most U.S. firms are on a standard January‐to‐December fiscal year, so by the end
of March the majority of them have reported their most recent fiscal year’s results. We were
careful to follow the same release schedule as the now‐discontinued Morningstar/Ibbotson
Cost of Capital Yearbook so as to be able to supply the critical data in an uninterrupted
fashion. Prior purchasers of the Cost of Capital Yearbook will be able to keep their libraries
up to date.
The timing of the book this year is a little later in the year because of the extensive
work involved in producing the book and adding all the additional material that we
included. The initial 2014 version had to be done from scratch. Next spring, the 2015
version of the hardcover book will be issued with data through March 2015, and the
hardcover book will start its regular delivery schedule and ship in May, followed by the
June, September, and December quarterly updates in PDF format, of course.
BVU: If I buy the Valuation Handbook ‐ Guide to Cost of Capital to develop
company‐level cost of equity estimates, why would I also need to get a second book on
industry cost of capital?
JH: Several reasons. First of all, valuation is an inherently comparative process—just
about any analysis boils down to trying to compare one thing to another. For example, if
you’ve developed a cost of equity estimate for the subject company, a natural first question
you might get is: “How does my own analysis of the subject company compare to the
subject company’s peers, or industry?” A normal and prudent step in any analysis is to
perform some benchmarking as a “reasonableness” test. The valuation analyst will likely
find the statistics presented in the new book to be a very useful indicator for benchmarking,
augmenting, and providing additional support for his or her own custom analyses of the
industry in which a subject business, business ownership interest, security, or intangible
asset resides.
Also, the original guide does not have betas for CAPM. The industry handbook has
industry‐level betas that can be used in a CAPM analysis. Those betas can also be used in

A Preview of the New Benchmark Resource for Industry Cost of Capital
©IACVA(CHINA) - BVR 8
the online Risk Premium Calculator.
BVU: The new book defines each industry by SIC code instead of NAICS or GICS
codes. Why is that?
JH: The old book used SIC codes for 20 years, so we wanted to be consistent with that
standard, at least in the beginning. In the future, we may translate the SIC codes into
NAICS codes or GICS codes.
BVU: How many industries does it cover?
JH: The book includes data on over 200 U.S. industries by SIC code. Also included: The
same statistics are calculated for each of four size groupings: U.S. large‐cap, midcap,
low‐cap, and microcap stocks.
BVU: The discontinued Morningstar/Ibbotson Cost of Capital Yearbook included
over 300 industries. Why does this new book have fewer?
JH: A significant number of the industries listed in the previous Morningstar book
were duplicates. For example, the final edition of the Ibbotson Cost of Capital Yearbook
that Morningstar published was the 2013 version, and, in that book, if you look at SIC 21,
SIC 211, and SIC 2111, they are exact duplicates: They have the same company sets and the
same statistics for every data point. We eliminated this duplicative analysis in the 2014
Valuation Handbook ‐ Industry Cost of Capital and streamlined the data.
We also tightened up the company screening process. The “screening process” is what
we use to identify the companies that “qualify” to be included in the analysis. In the new
industry book, it mimics the process used in the 2014 Valuation Handbook – Guide to Cost
of Capital to identify the companies in the exhibits from the Risk Premium Report Study
that are published in that book. The stricter screening helps to ensure that the companies
used in the industry analysis in the new book are seasoned companies that have traded for
several years, are selling at least a minimal quantity of product or services, and have been
able to achieve a degree of positive cash flow from operations.
The final step in the company screening process is identifying companies that have at
least 75% of their revenue derived from a single business segment (i.e., pure play
companies). This is the same “75% rule” that was applied in the former
Morningstar/Ibbotson yearbook.

预览行业资本成本新基准资源
©IACVA(CHINA) - BVR 9
BVU: What information does this new book contain?
JH: The book includes industry‐level cost of equity estimates for over 200 U.S.
industries calculated eight different ways, including CAPM, various build‐up methods,
one‐stage and three‐stage DCF models, and the Fama‐French three‐factor model. It also
includes industry cost of debt estimates and industry weighted average cost of capital
(WACC) estimates.
In addition, detailed industry‐level statistics for sales, market capitalization, capital
structure, levered and unlevered beta estimates, valuation (trading) multiples, financial and
profitability ratios, equity returns, aggregate forward‐looking earnings‐per‐share (EPS)
growth rates are included. Some of these statistics have not been previously available.
BVU: You say this new book has additional statistics that were not available in the
Morningstar/Ibbotson book. What extra information does that provide for your readers?
JH: Something that we added that we are very excited about is new statistics that can
be used to gauge the impact of debt‐like off‐balance‐sheet items on the capital structure and
unlevered betas of the subject industry. By “debt‐like off‐balance‐sheet items,” I mean
specifically capitalized operating leases and unfunded pension liabilities.
Why is this important? Well, these debt‐equivalent liabilities are taken into account by
credit rating agencies when assigning a debt rating for a company, and they should also
likely be considered when ascertaining the true financial (and equity) risk of the subject
company. We replicated the analysis the credit rating agencies use in this regard.
These off‐balance‐sheet liabilities are sometimes quite significant, and so we calculate
the capital structures and unlevered betas for each industry two ways—with and without
the off‐balance‐sheet liabilities included—and then we show the results side by side.
Finally, the impact on capital structure from including each of these types of
off‐balance‐sheet liabilities is quantified for each industry. For example, the retail industry
uses a lot of operating leases, so that’s the main driver of the change in capital structure in
that industry when off‐balance‐sheet debt is included. Alternatively, the main driver of the
change in capital structure in the auto industry when off‐balance‐sheet debt is included is
unfunded pension liabilities.
BVU: And, of course, cost of capital estimates for each industry are in the new book,
too?
A Preview of the New Benchmark Resource for Industry Cost of Capital
©IACVA(CHINA) - BVR 10
JH: Oh yes! For cost of capital, there are eight different ways it’s calculated. The old
Morningstar/Ibbotson book had five ways. In the new book, the eight ways cost of equity
capital is calculated are CAPM, CAPM plus a size premium using the CRSP Decile Size
Study, the build‐up plus industry risk premium using the CRSP Decile Size Study, CAPM
plus a size premium using the Risk Premium Report Study, the build‐up plus risk premium
over the risk‐free rate using the industry risk premium adjustments, a one‐stage discountedcash flow (DCF) model, a three‐stage DCF model, and the Fama‐French three‐factor model.
BVU: How about betas? Are betas calculated?
JH: Yes, betas are calculated six ways. The Morningstar/Ibbotson book had two. In the
new book, the six ways are OLS (raw) beta, blume adjusted beta, industry beta, or “peer
group” beta, Vasicek‐adjusted beta, SUM beta, and downside betas. These betas are
calculated for over 200 U.S. industries for the median company in each industry, the SIC
composite for each industry, the large composite for each industry, the small composite in
each industry, and also for “high‐financial‐risk” companies. Of course, any of the statistics
presented depends on whether the data to calculate them are actually available, so some
industries will not include all statistics.
The betas in the new book can be used in the online Risk Premium Calculator as the
beta input for CAPM estimates.
On a related note, it is common practice to “unlever” and then “relever” betas when
performing WACC analyses. This is done, for instance, when the capital structure of the
subject company is expected to change in the future. An unlevered beta, which is also
known as an “asset” beta, is the beta that would be expected if a company were financed
solely with equity capital. Unlevered betas are calculated for each industry in the new
industry book.
BVU: You mentioned peer groups. Can you explain how they are created?
JH: The peer groups created in the book are a big help to the analyst. A common
challenge is identifying peer group companies, or comparables, for the subject company. In
the new industry book, each company in any given industry’s analysis must have at least
75% of revenue coming from that industry, as defined by SIC code. These ready‐made,
off‐the‐shelf peer groups are a big help in finding appropriate comps.
As for the minimum number of companies required for an industry, the thresholds are

预览行业资本成本新基准资源
©IACVA(CHINA) - BVR 11
the same as the old book. There must be at least five companies to make up an industry.
BVU: How will the updates work?
JH: Everything will be recalculated, and updates will be delivered electronically for
June, September, and December. Again, because of startup delays, the June and September
updates for 2014 will possibly come out together, likely before the end of this month.
BVU: Do the data change that much? Why would somebody need to have the
updates?
JH: Yes, the data change. In some cases, the changes will be significant quarter to
quarter and in others possibly not so significant. But over time, the changes tend to become
important. Regardless, it’s generally best to use the most current data available.
BVU: Thanks, Jim, we look forward to seeing the book and congratulate you on all
of the effort D&P has put into this valuable new resource.
JH:My pleasure.
Editor’s note: Further information about The Valuation Handbook ‐ Industry Cost of Capital
and related products is available at www.bvresources.com/costofcapital. A complete review of the
book begins on page 311.

评估酒店的机会和特别思考
©IACVA(CHINA) - BVR 1
Opportunities and SpecialConsiderations in the Valuation ofHotels
评估酒店的机会和特别思考
翻译:鲁国平(上海东洲资产评估有限公司湖北分公司)
校对: 包秋鸣(上海财瑞资产评估有限公司)
酒店不再是房地产评估师的独家领域,为商业评估专家提供了独特的挑战和机会。行业专
家Mark Dayman(Franintel Inc.)在 2014年的 BVR 网络研讨会上利用了房地产评估和商业
评估准则讲述了他的观点。
Dayman说:“酒店和度假村的评估对 BV行业的许多人来说似乎是一个奇怪的话题。 多
年前,大多数酒店被认为是房地产,所以房地产估价师把他们作为他们的案例列表的一部分。
但事情发生了变化。 他说:“酒店已经完全不同,不仅在美国,而且在全世界也是如此。” 酒
店不再被视为人们的“储物柜”。 他们提供临时住房和更广泛的便利设施来支持个人服务(所
谓的“接触服务”)。 并且认为“当你进入全方位服务的酒店或度假村时,向客人提供接触服务
的人数是巨大的。” “我认为它已经超越了房地产。”

Opportunities and Special Considerations in the Valuation of Hotels
©IACVA(CHINA) - BVR 2
Dayman解释说,很多酒店评估工作涉及酒店和度假村系统。 “它忽略了我不是房地产估
价师的事实。 当我需要一个,我肯定可以找到他们与我一起工作,但这真的是这个特定业务
的经济学问题。这就是生意, 为临时住房提供各种需求支援服务。”
BV机遇。 Dayman指出,商业评估专家可以通过多种方式介入酒店和度假市场。 共同
参与是为了做出买/卖决定的定价。 他说:“这不一定是一个关于一块房地产是值得的问题,
但经济学家告诉我有些人愿意出多少价去交易买卖。
可行性研究是评估专家的另一个机会。 他说:“几乎每个在美国建立的酒店和世界各地的
大部分酒店都需要有人来参与并告诉这个项目涉及的人,这样做在经济上是否可行。 从经济
角度看,如果按现金流量计量的财产价值超过了建设成本,则该项目是可行的。 如果没有,
这是不可行的。 “所以我们在可行性方面做了大量的工作,这实际上是任何一个人用 BV知识
能够做的。”
投资组合分析超出任何独特的买卖决策,是评估专家的另一个领域。 投资组合可能不包
括所有酒店,但酒店将是整个投资组合的一部分。 他说:“投资者想知道一些物业是否提供所
要求的投资回报,如果不是,他们可以做些什么。”
世界各地会计学的主要领域是公允价值会计的问题,也就是说,不是什么成本,而是在今
天有什么价值。 “通常,我们将参与帮助酒店和度假村的业主分配所有不同类型的被购买资产
的购买价格,”Dayman说。 减值测试是业主需要定期跟进的另一个领域。 “当然,现在经常
在公司层面进行减值测试,但是当事情开始出现问题时,他们会带来专家帮助他们实现真正的
减值成本。”
知名域名是可以触发估价工作的另一个领域。 大多数州有制定一个程序来补偿房地产业
主的业务损失。 这里的一个有趣的角度是当酒店经营一般租期为 20年的租赁时。 让我们说,
五年之后,这个财产将被知名领域占有。 房地产业主得到赔偿,但国家经常忽略承租人。 “我
们经常参与帮助承租人确定真正的商业价值,“他说。
房地产税问题也可能涉及评估专家。 的确,许多司法管辖区对个人财产征税,但不对知
识产权征税。“将房地产价值与酒店使用的所有资产形式分开以减少物业税评估往往变得重
要。”
他说:“ 后,肯定也不少,评估专家进入成本隔离研究的概念,实际上将采购价格分配
问题实际上是极端的。 建筑物的不同部分可能构成不同类型的个人财产,并可能被隔离,以
加速尽可能多的折旧注销。
业务评估专家不会参与某些酒店估值,例如涉及银行贷款抵押品的任何事项,包括 SBA
贷款。 该地区需要合格的房地产估价师。

评估酒店的机会和特别思考
©IACVA(CHINA) - BVR 3
酒店价值的组成部分。Dayman解释说,
一家酒店是一家企业,因此其业务价值的组成
部分包括有形和无形资产(图 1)。 看看酒店
的资产负债表,由于酒店业务的性质,流动负
债经常超过流动资产。 酒店通常还将拥有非
现金的有形资产,这些资产可以是一大堆东西
而不仅仅是简单的项目,如保证金和各种贷款
此外,当然,你还会发现土地,建筑物,家具,
灯具和设备。
酒店的无形资产是很富裕的。 很多物业
都有“标示”,就是他们是专营权。 标示是知识产权,具有价值,可以被视为将支付的所有特
许权使用费的现值。 可能一些独立的酒店和度假村将有一个标示,所以这是需要考虑的。
预订系统可以是一个非常重要的无形资产 ‐ 通常是酒店经营者登上某个品牌的原因。 预
订系统是你购买国旗时所购买的一部分。 随着预订系统的出现,当标志被购买时,标准,支
持和一整套资产被提供给买方。
劳动力和管理是其他关键的无形资产。 在独立酒店中,管理层可能更有价值,因为在标
志性的酒店,你正在依赖特许人的能力来帮助你管理物业。 当你作为独立酒店经营时,工作
人员必须具备在任何情况下经营的技能。 重要的是问题停在酒店首席执行官的桌子上。
技术也是一个也发挥作用的问题。 任何一家酒店都可以拥有独特的技术,当然,如果它
是一个独立的,它将会有一个需要重视的技术平台。非竞争协议可能已经到位,它们可能有价
值,所以需要检查 。 独立酒店将存在客户名单,但标记的酒店可能没有单独的客户名单。 它
可能是具有标示的预留系统的组成部分。
与任何被重视的业务一样,每种情况都会有所不同,可能还有其他无形资产。 “但是到
后,如果我们没有别的话,我们会有诚意的。”Dayman说。
酒店价值的独特方面。 酒店的基本价值基础理论与其他业务的基本理论没有什么不同。
该价值是以合理的资本成本由未来经济利益的现值推动的。 如何确定未来的经济效益和资本
成本需要一些不寻常的考虑,但基本概念没有什么不同。 “我们也考虑比较销售来确定一个特
定的合理性,如果没有其他的话财产”,他说。
酒店和大多数酒店业务的独特特征是纯粹的供需特征。 你可以实际了解酒店缘何如此运
行,以及与竞争性的市场上如何竞争。
识别一家酒店如此运行的原因会让人难以置信现金流方面将会发生的事。当然,你必须考
图表 1:酒店业务价值的组成部分
有形
流动资产,流动负债
有形非经常性资产和负债
•土地,建筑物和 FF&E
无形
标示(特许经营权,也可能是独立人士)
•人力/管理
•技术
•非竞争性协议
•客户名单
•商誉

Opportunities and Special Considerations in the Valuation of Hotels
©IACVA(CHINA) - BVR 4
虑可能已经出售的具有竞争力的物业(通常是以每房为单位),但是在一天的 后,这是一笔
现金交易,参与交易的个人都想知道现金回报。
挖掘细节。评估师花时间研究一系
列标准,特别是三个基本概念:入住率,
平均每日费率和每个可用房间的收入(图表 2)。
入住率(房间除以可用房间除外)回答了房间
出售频率的问题。 平均每日房价(ADR)包括
房间收入除以出售的房间。 每个可用房间的收入标准是房间数量除以可用房间数量。
当酒店做好了评估准备时,酒店行业习惯了一个非常具体的介绍。 美国酒店住宿协会已
经制定了统一的演示标准,以便读者知道他们在看什么,以及在演讲中期待什么。 酒店评估
报告应符合这些标准。
“虽然没有必要,我们提供与我们历史演示相同的时间表的常见尺寸数据,”他说。 “我们
不把它们作为一个单独的时间表。我正在看资产负债表上的某些项目之间的非常关键的关系,
特别是在操作中。 他们立即强调,房地产是否运作良好,是否可能有独特的事情需要考虑,
以及异常成本的影响。“这导致了规范化调整的问题。
酒店的规范化调整类似于其他行业的估值业务。有例外,但大多数情况下,在评估酒店时,
你被要求将酒店视为具有 100%股权或无债务表现的单一业务单位 。 他说:“我们不进行少
数产权评估。 “我们评估 100%的产权,所以我们需要考虑到比其他原则更多的正常化调整。”
业主如何得到补偿? 你正在考查一份相关实体租赁的财产吗?
你可能会不时遇到一些不寻常的挑战,不仅仅是以前的介绍过的错误或某些项目被以会计
目的来处理。 Dayman回忆说:“我们遇到的一个有趣的情况就是一个财产被重建的情况。”
“几乎所有的重建成本都打破了利润表。这里需要说的是,你需要保持一个不一样的视角。”
基准来源。基准是竞争优势和弱点的发挥。 “你必须能够在竞争激烈的市场中定位这个主
题,”他说。 在物业的历史分析中
你正在研究,你不仅希望显示基本的历史财务信息,而且还要显示市场正在发生的情况。
一个好的来源不仅是市场数据和酒店和度假村的财务数据,也是史密斯旅游研究(STR)。
STR已经有 20到 30年了,可能是酒店市场和运营数据 广泛依赖的来源。 大多数酒店收到
STR 的每月报告,告诉他们他们在市场上的表现如何。 “请不要犹豫,对你的客户进行询
问,”Dayman建议。 基准信息的其他来源包括计量经济学,PKF 咨询和专门从事有限服务
酒店的 Highland Group(图 3)。 这些数据将真正揭示主题酒店的直接竞争帮助衡量其实力
和多年来的管理情况,以及实际上比你做的更好或更差的人。
图表 2:酒店竞争市场
入住率(%)=出售房间/可用房间
平均每日房价(ADR($))=房间收入/房间销
售
每间客房的收入(RevPAR($))=
房间收入/房间可用

评估酒店的机会和特别思考
©IACVA(CHINA) - BVR 5
另一个好的资源是你自己的同事网络。
如果你了解其他公司的人可以访问你没有
的数据,请给他们打个电话并获取他们的见解。
他说:“很少有人挂断我。”如果你有相关业务的
朋友,每个人似乎都像一个团队一样工作,所以
我强烈要求开发这些网络的可能性。”房地产估价师也需要成为这个网络的一部分,因为有时
候你需要一个房地产估价师。使用交际网络中的某人可以更好地控制整个业务。
网站访问想法。实地考察你所评估的业务是的标准做法。 但是为什么不去参访竞争企业
呢? 毕竟,你正在尝试评估你的对象相对于其他人在市场上的表现,因此顺便拜访对手可以
产生一些有价值的信息。Dayman说,访问竞争对手是酒店业的必要的。 他说:“突然间,你
们开发出的量化信息开始进入现实。你开始明白为什么你的客户比那个市场上的其他人更好。
你还将有机会了解你的服务主体在市场上缺失哪些。 那些采访真的很重要。”
有时, 初被认为是竞争对手的公司根本不是竞争对手,因为他们的业务性质。 将这些
企业列入名单的一种方法是访问它们。
当你出现并提问时竞争对手会欢迎你吗? “我必须承认不能与业主或总经理谈话是相对
不寻常的,”他说。“你必须以良好的态度进入。 但大多数业主和总经理都可以讨论他们的产
品,以及他们如何看待市场竞争,他们认为竞争对手是谁,以及为什么。”如果管理层不和他
说话,他会寻找一些知识渊博愿意谈的员工。“我会和前台经理谈谈,来处理他们的客人,他
们来自哪里,他们住多久,谁和他们竞争等等。”
市场份额分析。评估酒店的主要方面之一是确定其市场份额。一个特定的酒店与其他被认
为是该特定物业市场的一部分相比有多好? 酒店行业高度细分,可能有十几个不同的有限的
物业,这是有挑战性的因为很难从中区分出其中一个。
这可以通过确定你的财产的市场份额和市场渗透率来实现。换句话说,你到底有多少市场
份额? 这种情况往往为不仅仅有在客户住宿方面,还有某些来源市场方面。 例如,市场至少
要分为旅游市场和商业市场。你可以进一步打破这些类别,并且均有差异。
他说:“几乎所有的可行性研究和评估,我看到的 大的错误之一是别人做你的客户正在
做的事情。” 通常,这是一个试图改善现有财产的问题,今天很普遍。 由于近期经济衰退,
几乎每个酒店都延期维修,所以现在正在起作用。
还有其他酒店进入市场的问题。 这是一个供需业务,所以你必须考虑供应。 你投入市场
的房间越多,市场占有率就越低。 客户的问题是:“你是否能够保持自己的份额或更好,否则
你将会因为不如市场中的其他一些实体而失去份额?”
图表 3:酒店基准分析
• 市场业绩
• 财务绩效
资料来源:STR,普华永道,计量经济学,PKF
咨询,
高地集团,HVS,Korpacz,RealtyRates

Opportunities and Special Considerations in the Valuation of Hotels
©IACVA(CHINA) - BVR 6
如果你忽视更多的供应进入市场的事实,你将高估物业的未来表现并将过高评估它。 当
然这可能会导致潜在的买家或业主作出错误的决定。 有时,这个供应信息很容易揭开。 当你
在另一家酒店时,询问还有哪些人可能进入市场。与政府官员谈论已发出或要求的许可证。他
说:“市政府有关新供应信息的巨大来源。”
你对供应的分析也必须考虑未知数,即供应可能会出现,尽管没有人听说过任何事情。如
果你在一个占有率非常高的市场,几乎可以保证更多的物业将建成。 你看到未知的另一个地
方是在一个拥有非常古老财产的市场。 他说:“新的物业可以进入市场,真正夺取市场。” “人
们想要新的物业。 他们喜欢酒店的新鲜度,以及食品和饮料。”很多时候,策略是将新的物业
带入一个地区老酒店,并尝试振兴市场。
在需求方面,存在两种需求,可能会影响潜在的财产。 第一个是“不适应”的需求,其中
明显的是“转机”。这一切发生在几乎所有的地方,在一年中的所有酒店房间都被填满,人们
被拒之门外。 他们只是去别的地方。 问题是:“这是否足以导致市场不满意,而你的特定主
体财产可能会令人满意?”
另一种形式的需求是“潜在”需求。 他说:“几年前我曾经有一个有趣的案例涉及到一个正
在重建的老内战酒店。 “人们想把它变成一个会议酒店,在一个受欢迎的地区举行会议,但不
在这家酒店所在的城市。 但是,如果酒店建成,我们能够确定这些会议的需求。 我们真的是
根据同样的信息做的。 在合理的市场区域内举行了哪些会议,由于我们所在的位置以及我们
所拥有的设施,我们能收到哪些份额?“这是一个酒店房间仅供出售的例子。
在分析的这一点上,评估专家可以开始把大量的这些数据放在一起。 你应该对对象财产
的未来市场地位有一个相当好的想法,无论是要建成还是现有财产。 你知道它在哪里,当市
场中发生其他事情时会发生什么。
其他收入和成本。 不要忘记考虑可能出现的其他形式的收入,例如食品和饮料业务,电
信和技术(互联网接入),商店,健身中心等。 Dayman指出,如果它是一个度假村,各种各
样的设施可能会刺激收入。
如果你有一家拥有经营历史的酒店,那么你将会有一个相当好的成本结构。 如果有独特
的情况,你需要考虑它们。 如果操作正在发生变化,你需要能够量化这些变更将会对成本结
构做些什么。 如果你正在处理一个新的或拟建的酒店,那么你将拥有前所述来源的大量基准
信息。 “顺便说一句,还有国家餐饮协会的食品和饮料的详细信息,”他说
说。 “你甚至可以进一步下线,获取 QSR,快速休闲,美食或休闲餐饮等各种不同食物部分
的信息。 他们似乎都有自己的协会。”
基准信息的问题是,并不一定意味着,如果成本将是房间收入的 1.5%,那将是你的主题

评估酒店的机会和特别思考
©IACVA(CHINA) - BVR 7
酒店。 “可能是,但是你需要小心,看看每个酒店的情况,看看这个基准在这种情况下是否有
意义,”他说。 一些基准来源分解了诸如特定劳动力和子部门之类的成本。 你可以了解主题
财产所在市场上是否对人们支付的利率或发生的利率是有意义的。
所有关于税息折旧及摊销前利润。 后,这个问题归结于税息折旧及摊销前利润。 也就
是说,这个财产会为财产所有者产生多少现金流?
当你做一个值得研究的时候,你需要考虑到有一个特许经营费,特许权使用费和营销费的
假设,那就是第三方管理公司。戴曼说:“几乎所有的估值或可行性都假定有第三方管理。” 如
果你重视非独立酒店,请注意,即使酒店没有招致版税和营销费用,你也可以看到比特许经营
地点更高的运营成本。
后要记住的是,你将要有一个需要建立在现金流中的替代储备。 这不是折旧扣除,而
是用于替换家具,固定装置,维修等的金额。 他说:“对于大多数全新的酒店来说,这个比率
是每年收入的 1%左右,但是在三,四年之后,每年可以涨到 4%‐5%。” 他还指出,在今天
的许多债务协议中,贷方正在成长非常认真的更换储备。 “我甚至看到过钱被托管,以确保它
在将来使用。”
房地产部分。 酒店评估在评估专家以及酒店评估服务使用者中引起了很多争议。 争议主
要来自事实上,底层房地产与企业价值高度一体化。 酒店的业务估值提供整个实体的价值,
包括房地产,个人财产,无形资产等。 如前所述,将房地产组成部分从其他价值分割变得很
重要。
这样做的技术和方法超出了本文的范围,但是由 Dayman 和 Kari Lazarova(Valuation
Aspects LLC)进行的网络研讨会“Valuing Hotels”中介绍了这个问题。 网络研讨会可在
bvresources.com/pastevents.asp获得。

Opportunities and Special Considerations in the Valuation of Hotels
©BVR 8
Opportunities and Special Considerations in the Valuation of Hotels
No longer the exclusive domain of real estate appraisers, hotels offer a unique challenge
and opportunity for business valuation experts. Industry expert Mark Dayman (Franintel
Inc.) offered his insights during a 2014 BVR webinar into this niche that draws on both the
real estate appraisal field and the business valuation discipline.
“Valuing hotels and resorts seems like such an odd topic to many people in the BV
industry,” says Dayman. Years ago, most hotels were considered to be pieces of real estate,
so the real estate appraisers took them over as part of their case list. But things have
changed. “Hotels have taken on a completely different dimension, not just here in the
United States, but throughout the world,” he says. Hotels are no longer considered a
“storage bunker” for people. They literally provide temporary housing along with a wide
range of other amenities that require personal services (so‐called “touch services”). “When
you get into a full service hotel or a resort, the number of people providing touch services
to guests is enormous,” he says. “It has moved beyond what I would consider to be a piece
of real estate.”
A lot of the hotel appraisal work involves the hotel and resort system, Dayman explains. “It
ignores the fact that I’m not a real estate appraiser. When I need one, I certainly can find
them to work with me on engagements, but really it is a question of the economics of this
particular business. And that’s what it is—a business. It provides temporary housing with
various demanded support services.”
BV opportunities. The business valuation expert can become involved in the hotel and
resort market in a number of ways, Dayman points out. The common engagement is for
pricing to make buy/sell decisions. “This isn’t necessarily a question about what a piece of
real estate is worth, but what the economics are telling me about how much somebody is
willing to transact a deal to buy or sell,” he says.
Feasibility studies are another opportunity for valuation experts. “Almost every hotel built
in America and generally throughout the world requires somebody to come in and tell
people involved in the project whether it is economically feasible to do so,” he says. From
an economic standpoint, the project is feasible if the value of the property measured in
terms of cash flow exceeds the cost of building it. If it doesn’t, it’s not feasible. “So we do a
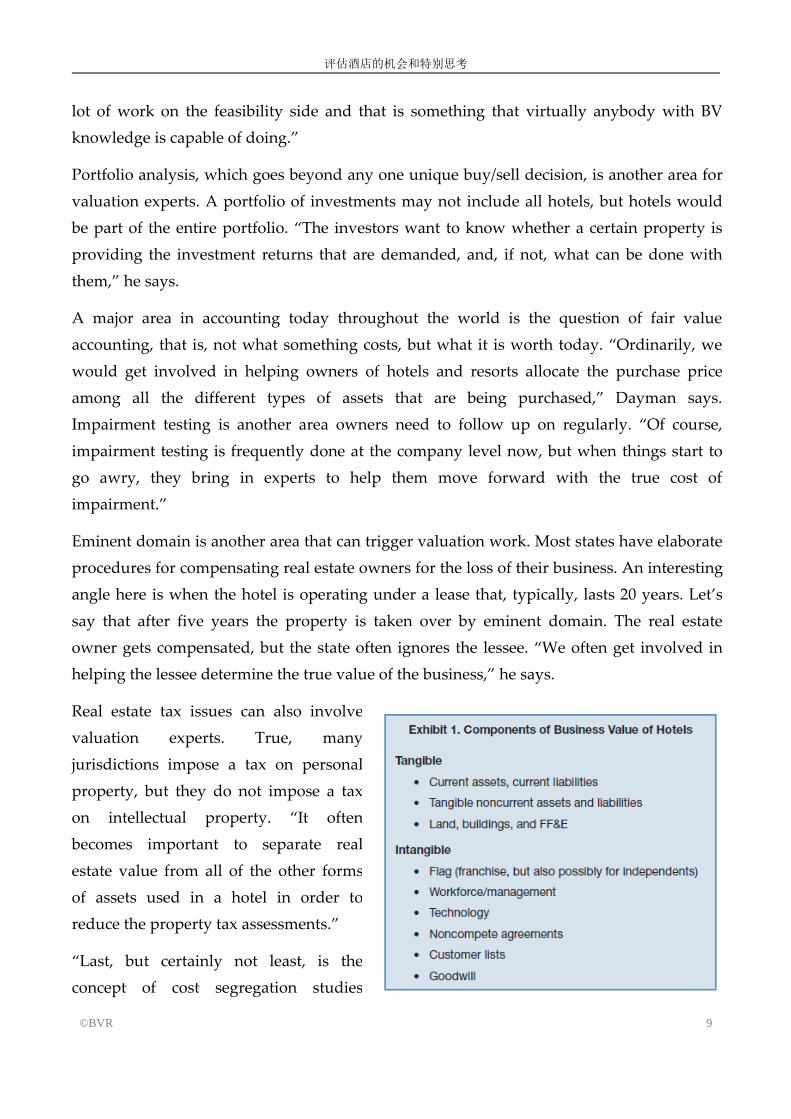
评估酒店的机会和特别思考
©BVR 9
lot of work on the feasibility side and that is something that virtually anybody with BV
knowledge is capable of doing.”
Portfolio analysis, which goes beyond any one unique buy/sell decision, is another area for
valuation experts. A portfolio of investments may not include all hotels, but hotels would
be part of the entire portfolio. “The investors want to know whether a certain property is
providing the investment returns that are demanded, and, if not, what can be done with
them,” he says.
A major area in accounting today throughout the world is the question of fair value
accounting, that is, not what something costs, but what it is worth today. “Ordinarily, we
would get involved in helping owners of hotels and resorts allocate the purchase price
among all the different types of assets that are being purchased,” Dayman says.
Impairment testing is another area owners need to follow up on regularly. “Of course,
impairment testing is frequently done at the company level now, but when things start to
go awry, they bring in experts to help them move forward with the true cost of
impairment.”
Eminent domain is another area that can trigger valuation work. Most states have elaborate
procedures for compensating real estate owners for the loss of their business. An interesting
angle here is when the hotel is operating under a lease that, typically, lasts 20 years. Let’s
say that after five years the property is taken over by eminent domain. The real estate
owner gets compensated, but the state often ignores the lessee. “We often get involved in
helping the lessee determine the true value of the business,” he says.
Real estate tax issues can also involve
valuation experts. True, many
jurisdictions impose a tax on personal
property, but they do not impose a tax
on intellectual property. “It often
becomes important to separate real
estate value from all of the other forms
of assets used in a hotel in order to
reduce the property tax assessments.”
“Last, but certainly not least, is the
concept of cost segregation studies

Opportunities and Special Considerations in the Valuation of Hotels
©BVR 10
where valuation experts come in and actually take the issue of purchase price allocation to
an extreme,” he says. Different parts of the building may constitute different types of
personal property and may be segregated to accelerate as much depreciation write‐off aspossible.
Business valuation experts will not get involved in certain hotel valuations, such as
anything that involves bank loan collateral, including SBA loans. This area requires a
qualified real estate appraiser.
Components of hotel value. Dayman explains that a hotel is a business, so its components
of business value include tangible and intangible assets (Exhibit 1). Taking a look at a
hotel’s balance sheet, current liabilities frequently exceed current assets because of the
nature of the hotel business. A hotel will also typically have noncurrent tangible assets,
which can be a whole host of things, not just simple items such as security deposits and a
variety of loans. Also, of course, you’ll find land, buildings, furniture, fixtures, and
equipment.
The intangible assets of a hotel can be substantial. A lot of properties have a “flag,” that is,
they are franchised. The flag is intellectual property, and it has value, which could be
viewed as the present value of all of the royalty payments that will be paid. Possibly some
independent hotels and resorts will have a flag, so that’s something to consider.
The reservation system can be a very important intangible—it is often the reason a hotel
operator will sign on to a particular brand. The reservation system is part of what you are
buying when you buy the flag. Along with the reservation system come standards, support,
and a whole group of assets that are being provided to the buyer when the flag is
purchased.
The workforce and management are other key intangibles. In the independent hotels,
management is probably more valuable because, in a flagged hotel, you are relying a lot on
the capacity of the franchisor to help you manage your property. When you are operating
as an independent hotel, the staff has to have the skill to operate under all circumstances.
The bottom line is that the questions stop at the hotel CEO’s desk.
Technology is an issue that also comes into play. Any hotel can have unique technology,
and, certainly if it is an independent, it is going to have a technology platform that needs to

评估酒店的机会和特别思考
©BVR 11
get valued. Noncompete agreements may be in place, and they probably have a value, so
they need to be examined. Customer lists will exist for the independent hotel, but a flagged
hotel may not have a separate customer list. It may be an integral part of the reservation
system embodied with the flag.
As with any business being valued, each case will be different, and there may be other
intangible assets. “But at the end of the day, we have goodwill if we don’t have anything
else,” Dayman says.
Unique aspects of hotel value. The basic underlying theory of value for a hotel is no
different from that of any other business. The value is driven by the present value of future
economic benefits using a reasonable cost of capital. How you determine the future
economic benefits and the cost of capital requires some unusual considerations, but the
basic concepts are no different. “We also consider comparative sales to determine the
reasonableness, if nothing else, of a particular property,” he says.
The distinctive feature with hotels and most hospitality businesses is that there is a pure
supply and demand feature. You
can actually study why a hotel is
performing the way it is and how it
is competing against the others in
the competitive market where it
stands.
Being able to identify why a hotel is
performing the way it is provides
you with incredible insight about what is going to happen in the future in terms of cash
flow. Of course, you have to consider competitive properties that may have been sold
(usually on a per‐room basis), but, at the end of the day, this is a cash transaction, and the
individuals involved in the transaction want to know the cash returns.
Digging into the details. Appraisers spend time studying a host of criteria, particularly
three basic concepts: the occupancy rate, average daily rate, and the revenue per available
room (Exhibit 2). The occupancy rate (rooms sold divided by rooms available) answers the
question of how often are the rooms sold. The average daily rate (ADR) consists of room
revenue divided by the rooms sold. The revenue per available rooms metric is rooms sold
divided by the number of rooms available.

Opportunities and Special Considerations in the Valuation of Hotels
©BVR 12
When a hotel valuation is prepared, a very specific presentation is customary for the hotel
industry. The American Hotel Lodging Association has established uniform presentation
standards so that readers know what they are looking at and what to expect in terms of a
presentation. A hotel valuation presentation should conform to these standards.
“Although it is not necessary, we provide common size data on the same schedule as our
historic presentation,” he says. “We don’t do them as a separate schedule. I am looking at
very critical relationships between certain items on a balance sheet and, more particularly,
in the operations. They immediately highlight for me whether a property is operating well
or not, whether there may be unique things that need to be considered, and the impact of
unusual costs.” This leads into the issue of normalization adjustments.
Normalization adjustments in hotels are done similar to valuation engagements in other
industries. There are exceptions, but most of the time, when valuing hotels, you are being
asked to value the hotel as a single business unit with 100% equity or debt‐free presentation.“We are not trying to do minority interests,” he says. “We are looking at 100% interest, so
we need to take into account perhaps more normalized adjustments than otherwise.” How
are owners being compensated? Are you looking at a piece of property that is being leased
through related entities?
You can run into some unusual challenges from time to time, not the least of which may be
errors in previous presentations or the way certain items were treated for accounting
purposes. “One interesting situation we ran into was a case where a property was being
rebuilt,” Dayman recalls. “Almost all of the cost of doing it was hitting the income
statement. The point here is that you need to keep your eyes open for the unusual.”
Sources for benchmarks. Benchmarking is where competitive strengths and weaknesses
come into play. “You have to be
able to position that subject
property within the competitive
marketplace,” he says. In the
historic analysis for the properties
you are examining, you not only
want to show basic historical
financial information, but you also want to show what is happening in the marketplace.
A good source not only for market data but also for financial data on hotels and resorts is

评估酒店的机会和特别思考
©BVR 13
Smith Travel Research (STR). STR has been around 20 or 30 years and is probably the most
widely relied‐upon source of market and operating data for hotels. Most hotels receive
monthly reports from STR that tell them exactly how they are performing within the
marketplace. “Don’t hesitate to make that inquiry of your client,” Dayman advises. Other
sources of benchmarking information include Econometrics, PKF Consulting, and the
Highland Group, which specializes in limited service hotels (Exhibit 3). These data will
actually reveal the subject hotel’s direct competition and help measure its strength and how
well it is managed over the years and who’s actually doing better or worse than your
subject.
Another good resource is your own network of colleagues. If you know individuals in other
firms who have access to data that you don’t have, give them a call and get their insights.
“Rarely do people hang up on me,” he says. “If you have friends in related businesses,
everybody seems to work as a team, so I would strongly urge development of those
networking possibilities.” Real estate appraisers need to be part of that network as well
because there will be times when you need a real estate appraiser. Using someone from
your network will allow you to better control the entire engagement.
Site visit idea. Paying a visit to the business you are valuing is standard practice during an
engagement. But why not also visit competing firms? After all, you’re trying to assess the
performance of your subject versus others in the market, so dropping in on rivals can yield
some valuable information. Visiting competitors is a must in the hotel industry, according
to Dayman. “Suddenly the quantitative information you’ve developed begins to come to
life,” he says. “You start to understand why your client performs better than the others
within that market. You will also start to learn what is missing in the market that may be an
opportunity for your subject entity. Those interviews are really important.”
Sometimes the firms that are initially considered competitors aren’t really competitors at all
because of the nature of their operations. One way to weed these businesses out of the list is
to visit them.
Will competitors welcome you when you show up asking questions? “I must say it is
relatively unusual that I am unable to speak with an owner or general manager,” he says.
“You have to go in with a good attitude. But most owners and general managers are open
to a discussion about their product and how they see competition in the marketplace, who
they think the competition is, and why.” If management will not speak with him, he’ll seek
Opportunities and Special Considerations in the Valuation of Hotels
©BVR 14
out some knowledgeable staffer who’s willing to talk. “I will talk to the front desk manager
just to get a handle on who their guests are, where they’re from, how long they are staying,
who is competing with them, and so on.”
Analysis of market share. One of the major aspects in valuing a hotel is determining its
market share. How well is a particular hotel doing compared to the others that are
considered part of the market of that particular property? The hotel industry is highly
segmented, and there may be a dozen different limited properties out there, which is
challenging because it is very hard to distinguish one from another.
This can be accomplished by identifying the market share of your property and its
penetration into its market. In other words, how much more or less than the market share
are you really getting? That often gets delineated not just in terms of total guest stays at the
subject property but in terms of certain source markets. For example, at a minimum, the
market should be segmented into the tourist market and into the commercial market. You
can break these groups down further, and each one of them makes a difference.
“On almost every feasibility study and appraisal that I see, one of the greatest errors is the
question of others doing what your client is doing,” he says. Often, it’s a matter of trying to
make improvements to existing property, which is very common today. Almost every hotel
has deferred maintenance as a result of the recent recession, so that’s now coming into play.
There is also the issue of other hotels coming into the market. This is a supply and demand
business, so you must take into account the supply. The more rooms you put into the
market, the lower the market occupancy is going to be. The question for the client is: “Are
you going to be able to maintain your share or better it, or are you going to lose because
you are not as good as some of the other properties in the marketplace?”
If you overlook the fact that more supply is coming into the market, you are going to
overestimate the future performance of the property and overvalue it. Of course, this could
lead to potential buyers or owners making the wrong decision. Sometimes, this supply
information is easy to uncover. When you’re at another hotel, ask about who else may be
coming into the market. Talk to government officials about permits that have been issued
or requested. “The city governments are enormous sources for information about the new
supply,” he says.
Your analysis of supply also has to consider the unknowns, that is, supply may come in

评估酒店的机会和特别思考
©BVR 15
spite of the fact that nobody has heard anything about it. If you are in a market that has
extremely high occupancy rates, it’s almost a guarantee that more properties will be built.
The other place that you see the unknown is in a market that has very old properties. “New
properties can come in and really capture the market,” he says. “People want new
properties. They like freshness in hotels, and food and beverage, too.” Many times the
strategy is to bring new properties into an area with old hotels and try to reinvigorate the
market.
In terms of demand, two kinds of demand may exist and may be impacting the potential
property. The first is “unaccommodated” demand, the most obvious of which is the
“turn‐away.” This happens almost everywhere at some point during the year when all
hotel rooms are filled and people are turned away. They simply go somewhere else. The
question is: “Does it happen enough that it results in a market that is just not being satisfied
and your particular subject property could be satisfying it?”
The other form of demand is “latent” demand. “I had an interesting case a few years ago
that involved an old Civil War hotel that was being rebuilt,” he says. “People wanted to
make it into a conference hotel in an area where it was popular to have conferences, but not
in the town where this hotel was located. But we were able to determine what that demand
would be for those conferences if that hotel were built. We really did it based on the same
sort of information. What conferences are taking place within a reasonable market area and
what share of those could we pick up because of where we are located and the facilities that
we have?” This is an example of hotel rooms that could be sold if they were only available
to be sold.
At this point in the analysis, the valuation expert can start to bring a lot of these data
together. You should have a fairly good idea of the future market position of the subject
property, whether it is a to‐be‐built or whether it is an existing property. You know exactly
where it stands and what is going to happen when other things occur within the
marketplace.
Other revenue and costs. Don’t forget to give consideration to other forms of revenue that
may come along, such as from a food and beverage operation, telecommunications and
technology (Internet access), stores, fitness centers, and the like. If it’s a resort, a wide range
of amenities could generate revenue, Dayman points out.
If you have a hotel that has a history of operations, you’ll have a fairly good idea of what
Opportunities and Special Considerations in the Valuation of Hotels
©BVR 16
the cost structure is going to be. If there are unique situations, you need to take them into
account. If the operations are changing, you need to be able to quantify what those changes
are going to do to the cost structure. If you are dealing with a new or proposed hotel, you
have a tremendous amount of benchmark information from the sources previously
mentioned. “By the way, there is also detailed information from the National Restaurant
Association for food and beverage,” he says. “You can even get further down the line and
get information on a variety of different food segments, from QSR, Fast Casual, Fine Dining,
or Casual Dining. They all seem to have their own associations.”
The problem with benchmark information is that it does not necessarily mean that, if a cost
is going to be 1.5% of room revenue, it will be for your subject hotel. “It might be, but you
need to be careful and look at each hotel situation and see whether that benchmark makes
sense under the circumstance,” he says. Some of the benchmark sources break down costs
on such things as specific labor and subdepartments. You can get an idea whether the rates
that are being paid for people or being incurred makes sense in the market the subject
property is located.
All about EBITDA. At the end of the day, the issue comes down to EBITDA. That is, how
much cash flow is this property going to generate for the owner of the property?
When you are doing a study for value, you need to take into account the assumption that
there is a franchise fee, royalties, and marketing fees, and there is going to be a third‐partymanagement company. “Almost every valuation or feasibility assumes that there is third
party management,” says Dayman. If you are valuing a nonfranchise, independent hotel,
keep in mind that you will actually see a higher cost of operations than a franchise location,
even though the hotel is not incurring the royalties and marketing fees.
The final thing to keep in mind is that you are going to have a replacement reserve that
needs to be built into the cash flow. This is not a depreciation deduction but rather an
amount of money that must be set aside for replacement for furniture, fixtures, repairs, and
the like. “For most brand new hotels, the rate is around 1% of revenues per year, but it can
go up to 4%‐5% a year after three or four years,” he says. He also notes that, in many debt
agreements today, the lenders are becoming very serious about the replacement reserve. “I
have even seen money escrowed in order to make sure it is around for future use.”
Real estate component. Hotel valuations create a lot of controversies among valuation
experts as well as among users of hotel valuation services. The controversy arises primarily

评估酒店的机会和特别思考
©BVR 17
from the fact that the underlying real estate is highly integrated with the business
enterprise value. The business valuation of a hotel provides the value of the entire
entity—including real estate, personal property, intangible assets, and so on. As mentioned
previously, it becomes important to split out the real estate component from the other
values.
The techniques and methodologies for doing this are beyond the scope of this article, but
this issue was covered during the webinar “Valuing Hotels,” conducted by Dayman and
Kari Lazarova (Valuation Aspects LLC). The webinar is available at
bvresources.com/pastevents.asp.