Building the European Road Safety Observatory. SafetyNet. Deliverable 2.2. 2 First classification of...
53
Loughborough University Institutional Repository Building the European Road Safety Observatory. SafetyNet. Deliverable 2.2.2 First classification of the EU member states on risk and exposure data This item was submitted to Loughborough University’s Institutional Repository by the/an author. Citation: LEJEUNE, P . ... et al., 2007. Building the European Road Safety Observatory. SafetyNet. Deliverable 2.2.2 First classification of the EU member states on risk and exposure data Additional Information: • This is a report. Metadata Record: https://dspace.lboro.ac.uk/2134/4355 Version: Published Publisher: European Commission, Directorate-General Transport and Energy Please cite the published version.
Transcript of Building the European Road Safety Observatory. SafetyNet. Deliverable 2.2. 2 First classification of...

Loughborough UniversityInstitutional Repository
Building the EuropeanRoad Safety Observatory.SafetyNet. Deliverable
2.2.2 First classification ofthe EU member states onrisk and exposure data
This item was submitted to Loughborough University’s Institutional Repositoryby the/an author.
Citation: LEJEUNE, P. ... et al., 2007. Building the European Road SafetyObservatory. SafetyNet. Deliverable 2.2.2 First classification of the EU memberstates on risk and exposure data
Additional Information:
• This is a report.
Metadata Record: https://dspace.lboro.ac.uk/2134/4355
Version: Published
Publisher: European Commission, Directorate-General Transport and Energy
Please cite the published version.

This item was submitted to Loughborough’s Institutional Repository (https://dspace.lboro.ac.uk/) by the author and is made available under the
following Creative Commons Licence conditions.
For the full text of this licence, please go to: http://creativecommons.org/licenses/by-nc-nd/2.5/

Deliverable 2.2.2 First classification of the EU member states on Risk and Exposure Data
Project co-financed by the European Commission, Directorate-General Transport and Energy
Contract No: Integrated Project No. 506723: SafetyNetAcronym: SafetyNet Title: Building the European Road Safety Observatory
Integrated Project, Thematic Priority 6.2 “Sustainable Surface Transport”
Project Co-ordinator:Professor Pete Thomas Vehicle Safety Research Centre Ergonomics and Safety Research Institute Loughborough University Holywell Building Holywell Way LoughboroughLE11 3UZ
Organisation name of lead contractor for this deliverable: SWOV – Institute for Road Safety Research, Netherlands
Due Date of Deliverable: 31/01/2007
Submission Date: 31/01/2007
Report Author(s):Philippe Lejeune, Vincent Treny, Gilles Duchamp, CETE-SO, Stig Hemdorff,DRD, Mouloud Haddak, INRETS, Peter Hollo, KTI, Joao Cardoso, ElisabeteArsenio, LNEC, George Yannis, Eleonora Papadimitriou, NTUA, Frits Bijleveld, Sjoerd Houwing, SWOV, Torkel Bjørnskau, TØI, Lucy Rackliff, VSRC, Andrea Angermann, KfV
Project Start Date: 1st May 2004 Duration: 4 years
Project co-funded by the European Commission within the Sixth Framework Programme (2002 -2006) Dissemination Level
PU Public X
PP Restricted to other programme participants (inc. Commission Services)
RE Restricted to group specified by consortium (inc. Commission Services)
CO Confidential only for members of the consortium (inc. Commission Services)

SafetyNet Deliverable 2.2.2 1st classification of the EU member states on RED
Project co-financed by the European Commission, Directorate-General Transport and Energy
sn_swov_2.2.2_deliverable2.2_4 20/03/2007 Page 1
Table of Contents TABLE OF CONTENTS................................................................................................................ 1
EXECUTIVE SUMMARY .............................................................................................................. 2
1. INTRODUCTION....................................................................................................................... 3
2. METHODOLOGY AND DEFINITIONS ..................................................................................... 5
2.1 DEFINITIONS.......................................................................................................................... 52.2 INFORMATION COLLECTION PROTOCOL.................................................................................... 8
3. AVAILABILITY........................................................................................................................ 10
3.1 INTRODUCTION .................................................................................................................... 103.2 RESULTS............................................................................................................................. 103.3 SUMMARY ........................................................................................................................... 14
4. COMPATIBILITY .................................................................................................................... 15
4.1 INTRODUCTION .................................................................................................................... 154.2 SELECTION OF INDICATORS .................................................................................................. 18
4.2.1 Population.................................................................................................................. 194.2.2. Vehicle fleet .............................................................................................................. 214.2.3 Road length ............................................................................................................... 234.2.4 Fuel consumption ...................................................................................................... 254.2.5 Driver population........................................................................................................ 264.2.6 Vehicle kilometres...................................................................................................... 28
4.3 CONCLUSION....................................................................................................................... 30
5. USABILITY.............................................................................................................................. 31
5.1 INTRODUCTION .................................................................................................................... 315.2 RESULTS............................................................................................................................. 315.3 SUMMARY ........................................................................................................................... 34
6. SUMMARY AND CONCLUSION............................................................................................ 35
REFERENCES............................................................................................................................ 39
GLOSSARY AND LIST OF ABBREVIATIONS.......................................................................... 40
ANNEX 1 ..................................................................................................................................... 41
3. ROAD LENGTH ....................................................................................................................... 413. ROAD LENGTH ....................................................................................................................... 423.1. INTRODUCTION ROAD LENGTH ............................................................................................. 423.2. NATIONAL DATA ON ROAD LENGTH ....................................................................................... 443.3. EXPERT PART OF ROAD LENGTH .......................................................................................... 47
ANNEX 2 ..................................................................................................................................... 50

SafetyNet Deliverable 2.2.2 1st classification of the EU member states on RED
Project co-financed by the European Commission, Directorate-General Transport and Energy
sn_swov_2.2.2_deliverable2.2_4 20/03/2007 Page 2
Executive Summary This report is based on the replies to the questionnaire on Risk Exposure Data(RED) that was sent to the national experts of all EU member states plus Norway. The present report can be seen as a first classification of the EU member states on RED availability, compatibility and usability. On the basis of these results, a clear distinction can be made between indicators that are at least generally available in Europe and indicators that are not generally available. There is a relation between availability and the level of complexity of the indicators. Basic indicators are more generally available than more complex ones.
The most widely available indicators are population, vehicle fleet, road length, fuel consumption, driver kilometres and vehicle kilometres. The less available indicators are: person kilometres, number of trips and time in traffic.
Based on examination of compatibility with CARE, five of the six generally available indicators are regarded as compatible with CARE. The only indicator that is not regarded as compatible with CARE is "fuel consumption". The main reason is that transport use can not be distinguished in the data collected in many countries. The other five indicators: population, driver population, vehicle fleet, road length and vehicle kilometres are regarded as compatible with CARE, or at least partially compatible.
These five indicators are thus regarded as usable. The other indicators are less than partially available or not compatible with the CARE data. However, this does not mean that these indicators are useless. They can still provide valuable information on national or small-scale international level. For European wide comparison these indicators are not (yet) suitable for usage in the common framework.
The five currently usable indicators are:
� Population road length � Vehicle fleet � Driver population � Vehicle kilometres

SafetyNet Deliverable 2.2.2 1st classification of the EU member states on RED
1. Introduction The present report is based on the replies to the Risk Exposure Data – RED - questionnaire that was sent to the national experts of all EU member states plus Norway. The report presents a first classification of the EU member states on RED availability, compatibility and usability, and thus provides a solid base for a common RED framework, which will be developed in a forthcoming deliverable.
The general purpose of the investigation presented in the following has been to identify those Risk Exposure Data (RED) indicators that are compatible with the accident information in the CARE database for a sufficient number of countries. It will be suggested that this RED information should be included in the CARE system to make better comparisons between countries possible in the future.
In order to determine "the real risk" in traffic amongst the different European countries, it is important to relate the number of accidents, injuries or fatalities to some indicator of traffic volume, i.e. exposure. By using actual accident figures alone it is almost impossible to compare the numbers for one country with the numbers for another country. Consider 5.000 killed per year in France; does that make the traffic more dangerous in France than in Denmark where there is about 300 killed per year? Looking at the number of killed by inhabitants the level is almost the same for the two countries (see figure 1.1).
Project co-financed by the European Commission, Directorate-General Transport and Energy
sn_swov_2.2.2_deliverable2.2_4 20/03/2007 Page 3
size would be a better indicator (the so-called health risk). Therefore several suggestions for indicators have been put up.
Figure 1.1 The use of RED for comparisons
Comparing the actual numbers of killed in one country to the numbers in another country will seldom be a fair comparison. 500 killed could be a high number if it is a small country and a low number if it is a large country.
Risk can be described by how you expose yourself to the danger in traffic. The problem is how to describe this exposure. To get closer to that question it is possible to use different types of RED information describing different aspects of getting involved in an accident. Unfortunately there is no single indicator available that can cover all purposes. Looking at the number of deaths in traffic accidents the most proper risk factor could be described by the amount of traffic. On the other hand if you have to compare with the risk of dying from cancer, traffic amount is no longer a proper factor. In this case the population
Number of killed
5232
369
0
1000
2000
3000
4000
5000
6000
F DK
Number of killed per million inhabitants
86
69
0
20
40
60
80
100
F DK

SafetyNet Deliverable 2.2.2 1st classification of the EU member states on RED
Project co-financed by the European Commission, Directorate-General Transport and Energy
sn_swov_2.2.2_deliverable2.2_4 20/03/2007 Page 4
to take the size of the countries, e amount of kilometres travelled etc. into account and thus make better
have been considered:
� Vehicle fleet
onn
No e directly linked to traffic. An indicator such as fuel nsumption is an indirect indicator of the amount of traffic. It is nevertheless
ility of the RED indicators a questionnaire as administered to the national CARE experts (except Switzerland).
odology to get the information about RED in each country described.
discussed concerning availability roughout the countries and possibility of disaggregating the information.
tion is ade between usable RED indicators and (for the moment) not-usable RED
6 conclusions and recommendations will be given.
By using the information of RED it is possiblethcomparisons possible.
The following indicators
� Population
� Road length � Fuel consumpti� Driver populatio� Vehicle kilometres � Person kilometres � Number of trips � Time in traffic
t all indicators arcoincluded because it is possible to use fuel consumption to estimate the amount of traffic for those countries that do not have genuine traffic volume data. Also population is not directly linked to traffic but is an indicator often used to compare so-called health risk estimates (number of deaths per million inhabitants) between sectors. A further description and explanation of the indicators is presented in chapter 2.
To get information about the availabwUnfortunately not all countries have replied to the questionnaire in due time. An effort has been made to get answers from the remaining countries which resulted in many extra replies. The final non-response was around 5%. The analyses will be based on those countries only that were able to give information on RED.
In chapter 2 the methis
In chapter 3 the availability of each RED is th
In chapter 4 the compatibility with the information in CARE is discussed.
In chapter 5 the usability of RED indicators is discussed and a distincmindicators.
In chapter

SafetyNet Deliverable 2.2.2 1st classification of the EU member states on RED
Project co-financed by the European Commission, Directorate-General Transport and Energy
sn_swov_2.2.2_deliverable2.2_4 20/03/2007 Page 5
inally, additional tables with information on usability and definitions will be
order to assess the availability of data within the countries and to what extent
the questionnaire the common definitions of UNECE/ECMT/EUROSTAT
.1 Definitions
opulation
Fpresented in the annexes
2. Methodology and definitions Ineach country’s data would meet common definitions and compatibility with CARE, a questionnaire was administered to each country’s CARE expert. Together with the questionnaire there was a description of the aim of the questionnaire and how to deal with it concerning information from other parties. Because the CARE expert might not be able to answer all questions, the questionnaire was split into separate parts addressing each RED indicator, making it possible for the CARE expert to administer the questionnaire further to relevant experts for each indicator within the country. An example of the questionnaire is included as appendix 1.
InGlossary was given, and it was asked if the national definitions would apply to that. In some cases it was necessary to combine some definitions from the Glossary, and by that having not an exact mach to the Glossary definitions. Some definitions where based on definitions given in the EUROSTAT statistics alone (such as population).
2The definitions were:
PDefinition Population:‘Population’ of a country is defined as the whole number of inhabitants in the country. This number does not include temporary visitors and tourists from other countries, nor illegal immigrants.
EUROSTAT

SafetyNet Deliverable 2.2.2 1st classification of the EU member states on RED
Vehicle fleetDefinition Vehicle fleet:Basically equal to “Stock of road vehicles” in the Glossary defined as number of road vehicles registered at a given date in a country and licensed to use roads open to public traffic (military vehicles excluded). Here supplied with cycle and for some countries mopeds because they are not registered and also divided into subgroups.
Common types of road vehicles are:Cycle: A road vehicle which has two or more wheels and is propelled solely by the muscular energy of the persons on that vehicle, in particular by means of a pedal system, lever or handle (e.g. bicycles, tricycles, quadricycles and invalid carriages).Moped: Two- or three-wheeled road vehicle which is fitted with an engine having a cylinder capacity of less than 50cc (3.05 cu. in) and a maximum authorized design speed in accordance with national regulations.Motorcycle: Two-wheeled road motor vehicle with or without side-car, including motor scooter, or three-wheeled road motor vehicle not exceeding 400 kg (900 lb) unladen weight. All such vehicles with a cylinder capacity of 50 cc or over are included, as are those under 50 cc which do not meet the definition of moped.Passenger car: Road motor vehicle, other than an motorcycle, intended for the carriage of passengers and designed to seat no more than nine persons (including the driver). The term "passenger car" therefore covers microcars (need no permit to be driven), taxis and hired passenger cars, provided that they have fewer than ten seats. This category may also include pick-ups.Motor-coach or bus: Passenger road motor vehicle designed to seat more than nine persons (including the driver). Statistics also include mini-buses designed to seat more than 9 persons (including the driver). (Here also including Trolleybus).Tram (street-car): Passenger road motor vehicle designed to seat more than nine persons (including the driver), which is connected to electric conductors or powered by diesel engine and which is rail-borne.Lorry: Rigid road motor vehicle designed, exclusively or primarily, to carry goods.
UNECE/ECMT/EUROSTAT (2003)
Road lengthDefinition Road:
"Line of communication, (travelled way) using a stabilized base other than rails or airstrips open to public traffic, primarily for the use of road motor vehicles running on their own wheels. Included are bridges, tunnels, supporting structures, junctions,crossings and interchanges. Toll roads are also included. Excluded are dedicated cycle paths."
UNECE/ECMT/EUROSTAT (2003)
Definition Motorway:
"Road, specially designed and built for motor traffic, which does not serve properties bordering on it, and which: (a) is provided, except at special points or temporarily, with separate carriageways for the two directions of traffic, separated from each other, either by dividing strip not intended for traffic, or exceptionally by other means; (b) does not cross at level with any road, railway or tramway track, or footpath; (c) is specially sign-posted as a motorway and is reserved for specific categories of road motor vehicles“
UNECE/ECMT/EUROSTAT (2003)
Project co-financed by the European Commission, Directorate-General Transport and Energy
sn_swov_2.2.2_deliverable2.2_4 20/03/2007 Page 6

SafetyNet Deliverable 2.2.2 1st classification of the EU member states on RED
Definition Urban road:
"A road within the boundaries of a built-up area, which is an area with entries and exits specially sign-posted as such.“
UNECE/ECMT/EUROSTAT (2003)
Fuel consumptionDefinition Fuel consumption (not part of the Glossary):‘Fuel consumption’ of a country is defined as the total consumption of energy by road motor vehicles in the country in terajoule. Energy can be in the form of gasoline, diesel, LPG, electricity, or some other energy type which is used for the propulsion of road motor vehicles.
Road motor vehicleA road vehicle fitted with an engine whence it derives it sole means of propulsion, which is normally used for carrying persons or goods or for drawing, on the road, vehicles used for the carriage of persons or goods.
UNECE/ECMT/EUROSTAT (2003)
Driver populationDefinition Driver (not part of the Glossary):A person in the possession of a licence (possibly a novice licence) to drive a road motor vehicle, not necessarily in the possession of a vehicle or having the possibility to use a vehicle.
Road motor vehicleA road vehicle fitted with an engine whence it derives it sole means of propulsion, which is normally used for carrying persons or goods or for drawing, on the road, vehicles used for the carriage of persons or goods.
UNECE/ECMT/EUROSTAT (2003)
Vehicle kilometresDefinition vehicle kilometres:‘Vehicle kilometres’ of a country is defined as the total number of kilometres travelled within the borders of the country by road vehicles, where ‘road vehicle’ is a "vehicle running on wheels and intended for use on roads.
Person kilometreDefinition person kilometres:‘Person kilometres’ of a country is defined as the total number of kilometres travelled within the borders of the country by persons, regardless their age
Number of tripsDefinition Number of trips:‘Number of trips’ of a country is defined as the total number of trips made by persons, regardless their age, in the country. A return trip counts as two.
Project co-financed by the European Commission, Directorate-General Transport and Energy
sn_swov_2.2.2_deliverable2.2_4 20/03/2007 Page 7

SafetyNet Deliverable 2.2.2 1st classification of the EU member states on RED
Time in trafficDefinition Time in traffic:‘Time in traffic’ of a country is defined as the total time spent travelling by persons, regardless their age, in the country
Availability: Available data is defined as "relevant data at country level that is ready for use". For analysis purposes the availability of the data is divided into four categories:
� Data is fully available (relevant data is available on country level); � Data is partially available (data is available but not complete for all
subsets);� Data is not available; � Data availability is not known (there was no response on
availability).
Compatibility: Compatibility is defined as a property of data ensuring the possibility of comparisons. In order to be compatible, the indicators must be defined in the same way as in EUROSTAT or CARE, or if not, be specified so that specific variables or values of the variables may be compared.
Usability:Usable data is defined in SafetyNet WP2 as "data that is at least partially available and at least partially compatible".
In a few cases other sources than the questionnaire has been used when analysing the availability and compatibility. For instance information from a joint workshop of UNECE, ECMT and EUROSTAT about methods to establish information about vehicle kilometres has been used.
The analysis of availability in chapter 3 has basically been based on the extent to which national information would be available according to the SafetyNet WP2 definitions listed above, which were derived from the definitions of UNECE, ECMT and EUROSTAT.
2.2 Information collection protocol The foundation of this first classification is the collection of information through the national experts of the EU member states. This has been done in a two-step approach. The first step is collecting information by the means of a questionnaire.After the questionnaire additional information has been searched through sources that were mainly provided by the same national expert. All used sources are approved by the national experts.
The overall response to the questionnaire was quite satisfactory. The questionnaire was sent to twenty-six countries and until the 1st of June 2006 the number of responses varied from seventeen to twenty-two. Table 3.1 presents the responses and the response rates for each separate indicator.
Project co-financed by the European Commission, Directorate-General Transport and Energy
sn_swov_2.2.2_deliverable2.2_4 20/03/2007 Page 8

SafetyNet Deliverable 2.2.2 1st classification of the EU member states on RED
Project co-financed by the European Commission, Directorate-General Transport and Energy
sn_swov_2.2.2_deliverable2.2_4 20/03/2007 Page 9
Table 2.1 Responses questionnaire
# Sent # Responses % Response Population 26 22 85%Vehicle fleet 26 17 65%Road length 26 21 81%Fuel consumption/sales 26 17 65%Driver population 26 18 69%Vehicle kilometres 26 20 77%Person kilometres 26 18 69%Number of trips 26 18 69%Time in traffic 26 19 73%
The countries replied the most to the questionnaire on "population" and on "road length". This was also expected, because these data sources are easy to access. Based on this assumption we would have expected more response on the vehicle fleet questionnaire. This questionnaire however, was one of the questionnaires with the highest non-response (35%) together with the questionnaires on "Number of trips" and "fuel consumption". The overall response rate to the questionnaire was 73%.
After the first response rounds, missing or more detailed information was collected by using additional sources that were mainly suggested by the experts, who filled in the questionnaires.These sources were mostly websites from statistical offices or from international data files. By using these other sources an additional 22% of the cells in table 3.1 were filled in. Together with the responses from the questionnaire we were able to fill in 95% of the grid on availability.

SafetyNet Deliverable 2.2.2 1st classification of the EU member states on RED
Project co-financed by the European Commission, Directorate-General Transport and Energy
sn_swov_2.2.2_deliverable2.2_4 20/03/2007 Page 10
3. Availability 3.1 IntroductionThis chapter presents the availability of Risk and Exposure Data (RED) in the EU member states plus Norway. All twenty-six countries received the SafetyNet WP2 Questionnaire on each of the nine RED indicators. The results on the availability of the data will be described in this chapter. First, a brief overview will be given on the data collection. Second, the results will be given per indicator. Finally, the conclusions will present a list of the indicators going from the most available indicators to the least available.
Available data is defined in SafetyNet WP2 as "relevant data on country level that is ready for use". For analysis purposes the availability of the data is divided into four categories:
� Data is fully available (relevant data is available on country level); � Data is partially available (data is available but not complete for all
subsets);� Data is not available; � Data availability is not known (there was no response on
availability).
Partially available data could be adjusted by using transformation rules. These transformation rules will be prepared in the coming SafetyNet WP2 deliverable "RED common framework".
In this chapter the total availability per indicator will be used to determine whether a RED indicator is available, or not. If an indicator is at least partially available in 60% or more of all the 26 included countries, this indicator will be regarded as available.
3.2 Results The results of the first analysis on availability of RED will be presented in this section using the information that was collected through the RED questionnaire and through the additional sources. Table 3.1 presents the availability per country for all the RED indicators. With assistance of this table all 9 indicators have been analysed on availability.A black cell symbolises that data is available in a certain country for a certain indicator, dark grey cells stand for partially available data, light grey cells for not available data, and white cells indicate that the country did not respond to the SafetyNet WP2 questionnaire and that no additional information has been found.
Table 3.1 Availability of RED in the EU member states

SafetyNet Deliverable 2.2.2 1st classification of the EU member states on RED
The availability has been rated per country and for all countries together. For each country data is regarded available when data is available or partially available with the possibility of correction by transformation rules. All indicators will also be rated on the percentage of availability on a European level. For instance, if there are no countries that have data available on an indicator the availability percentage will be 0%. If 22 of 26 countries have data on the indicator available the availability percentage will be 85%. Only countries where information on the relevant indicator has been obtained are included in the calculations of percentages.
In the following a distinction is made between indicators that are at least available for more than 60% and indicators that are less available Only indicators that are available in more than 60% of the countries will be checked for compatibility in the next chapter.
Table 3.2 Availability population
All twenty-six countries collect population data. There are some small differences in the way immigrants are counted in the total population of some countries. These issues will be mentioned in the chapter on compatibility with the definitions. The French response was not fully completed but based on the completed part the French data is regarded as available.The overall rating for this indicator is that population data is available in every country.
Table 3.3 Availability vehicle fleet
Project co-financed by the European Commission, Directorate-General Transport and Energy
sn_swov_2.2.2_deliverable2.2_4 20/03/2007 Page 11

SafetyNet Deliverable 2.2.2 1st classification of the EU member states on RED
Information was found for all countries using both the questionnaire, and additional data sources. Most of these countries have vehicle fleet data fully available. The other countries have vehicle fleet data partially available, because certain vehicle types like mopeds, bicycles or trams are not included. Some countries keep scrapped vehicles in their databases. This should be considered when analysing for the compatibility of the vehicle fleet data. Based on the information we have received, vehicle fleet data is available in every country.
Table 3.4 Availability road length
As stated in Chapter 2, road length is a frequently used indicator for RED and at least partially available in all countries. The most common reason why data on road length is only partially available is because data on local roads or part of the local roads is missing. In the case of Germany information only exists for roads outside urban areas. Road length data from the United Kingdom is fully available for all road types, but only for Great Britain and not for Northern Ireland. Finland has fully available data since 2004. For the previous years, data is missing for local roads. When using only the most recent data, road length data is also fully available in Finland.Road length data is regarded to be available in every country.
Table 3.5 Availability fuel consumption
Fuel consumption data is mostly used as an indicator when other indicators are not available. All the countries that collect data on fuel consumption have fossil fuels data available. The Czech Republic, Denmark, Finland and Portugal include electricity as well. Greece, Poland and Ireland are the only EU countries who appear not to be collecting fuel consumption data.
Electric cars are not very common in the EU member states. Therefore, only fossil fuels are normally used as RED indicators. Accordingly, countries that collect at least fossil fuel consumption data will be regarded as having available data. 23 countries collect fuel consumption data. This indicator will therefore be regarded as generally available
Table 3.6 Availability driver population
Project co-financed by the European Commission, Directorate-General Transport and Energy
sn_swov_2.2.2_deliverable2.2_4 20/03/2007 Page 12

SafetyNet Deliverable 2.2.2 1st classification of the EU member states on RED
As stated in Chapter 2, a driver is a person who is in possession of a driver licence to drive a road motor vehicle. The possession of a vehicle is not required, nor is having the possibility to drive. Fifteen countries have fully available data on driver population and additionally six countries have partially available data. Belgian law doesn't require driving licenses for mopeds. Denmark, Lithuania and Luxemburg only have data on a yearly basis on new licences.
One of the problems with driver licenses is that deceased people are in some cases not removed from the database. Based on this first classification, this indicator is regarded as available in every country.
Table 3.7 Availability vehicle kilometres
As stated in Chapter 2, vehicle kilometres are the total number of kilometres travelled by road vehicles. Approximately three quarters of all the countries have vehicle kilometres data at least partially available. Most countries that have data partly available do not collect national data on bicycles, mopeds or motorcycles.
Five countries do not collect data on vehicle kilometres. Among these countries are three of the smallest EU member states: Cyprus, Malta and Luxemburg. The other two countries that do not collect these data are Greece and Lithuania.Vehicle kilometres will be regarded as commonly available.
Table 3.8 Availability person kilometres
This indicator is quite similar to "vehicle kilometres" except it gives an indication of the total number of kilometres travelled by individuals, rather than by vehicles. Eleven countries have at least partially available data on person kilometres. There are also eleven countries that do not have such data. This indicator is accordingly regarded as not generally available.
Table 3.9 Availability number of trips
Project co-financed by the European Commission, Directorate-General Transport and Energy
sn_swov_2.2.2_deliverable2.2_4 20/03/2007 Page 13

SafetyNet Deliverable 2.2.2 1st classification of the EU member states on RED
The number of trips are commonly collected by means of national travel surveys. Only one country (United Kingdom) has fully available data on number of trips. Eight countries have the data partially available, because not all age groups are included. The data from Denmark is only available when making extra efforts to collect it from the national survey on "person kilometers". But almost two thirds of the EU member states do not collect data on number of trips at all. Number of trips data is therefore regarded as not generally available.
Table 3.10 Availability time in traffic
Time in traffic data is collected by the same national travel surveys as data on the number of trips. Such data is collected by only one third of the European countries. Accordingly, time in traffic is regarded as not generally available.
3.3 Summary Based on the results of the questionnaire and the collection of additional data, a clear distinction can be made between indicators that are generally available in Europe and indicators that are not generally available. There is a correlation between the level of complexity of the indicators and the availability. Basic indicators are more generally available than more complex ones.Based on the 60% availability level, the following six indicators will be regarded as (generally) available: population, vehicle fleet, road length, fuel consumption, driver population and vehicle kilometres.
The indicators that are not generally available are: person kilometres, number of trips and time in traffic.
Project co-financed by the European Commission, Directorate-General Transport and Energy
sn_swov_2.2.2_deliverable2.2_4 20/03/2007 Page 14

SafetyNet Deliverable 2.2.2 1st classification of the EU member states on RED
Project co-financed by the European Commission, Directorate-General Transport and Energy
sn_swov_2.2.2_deliverable2.2_4 20/03/2007 Page 15
4. Compatibility 4.1 Introduction A precondition for RED indicators to be usable for risk estimation is that they are compatible with CARE. In order to investigate the compatibility with CARE, it is necessary to examine each indicator in more detail for each country. In the examination of the indicators in the following, the specific properties or subsets of the indicators will be termed variables and values, thus corresponding to normal research terminology. For example, the indicator “population” covers several variables, gender, age etc. For all countries using gender, this variable will have two values; “men” and “women”. The values for age can, however, be single years for some countries and age brackets for others. Similarly, both the variables and the values of the other indicators may vary between countries.
Compatibility is defined in chapter 2 as a property of data ensuring the possibility of comparisons. In order to be compatible, the indicators (for instance “Population” or “Vehicle fleet”) must accordingly be defined in the same way as in EUROSTAT or CARE, or if not, be specified so that the specific variables of the indicator or the specific values of the variables may be compared.
For instance, if country A defines vehicle kilometres according to the EUROSTAT definition, i.e. as the total amount of road traffic by road vehicles within the country, whereas country B defines it as the total amount of road traffic carried out by the nationally registered road vehicles within the borders of the country, B’s definition is not compatible with EUROSTAT’s definition. If, however, country B has additional sources of data making it possible to add the proportion of traffic carried out by foreign vehicles, the data on vehicle kilometres is nevertheless compatible with the EUROSTAT definition.
In the same way compatibility with CARE must be considered. If for instance country A defines bicycle kilometres as a part of the total number of vehicle kilometres of that country, then (assuming all other road vehicles to be represented both in the number of vehicle kilometres as well as in the number of accidents) the number of vehicle kilometres is directly comparable to the total number of road accidents, and accordingly compatible with CARE.
If, however, bicycle kilometres are not included in the total number of vehicle kilometres, but bicycle accidents are included in the CARE statistics of the country, then it must be possible to subtract the number of bicycle accidents/injuries from the total in order to have compatibility between accident data and exposure data.
Likewise, compatibility between countries must be considered. That is, however, not the subject of the present report and will be discussed in a forthcoming deliverable. If however, RED indicators are compatible with EUROSTAT definitions or with CARE, they will normally be compatible between countries. There are, however, possible exceptions. If country A and country B only give data on accidents and exposure in age brackets, and these age

SafetyNet Deliverable 2.2.2 1st classification of the EU member states on RED
brackets differ between the countries, they may both be compatible with CARE (having data for each single year of injured or killed road users), but not compatible with each other.
There is reason to believe that these kinds of problems will be encountered, and it is therefore necessary to have a very detailed knowledge of the definitions and the content of the various RED indicators in different countries. If risk figures are to be comparable between countries, it is vital that such detailed information is available. Such detailed information will, however, not be presented here, but will be presented and discussed in a later deliverable.
In order to evaluate the degree of compatibility with CARE in the following, each variable will be considered by use of a decision tree depicted in figure 4.1. This decision tree will in principle be adopted for all available RED indicators for all countries, i.e. for each available indicator/country combination, there will be a unique decision path determining whether or not the indicator of that country is compatible with CARE.
yes Variables and values of X equals variables and values in CARE?
no
Compatible with EUROSTAT def.?
Can transformation rules be adopted?
no
no
yes
Compatible with CARE
yes
yes
Subsets of variables and values of X comparable to CARE?
no
no
Can transformation rules be adopted?
Incompatible with CARE
no
1
yes
yes
2
3
4
5
7
8
9
10
11
12
Indicator X def. as in EUROSTAT?
6
yes
Figure 4.1 Decision tree to determine compatibility with CARE
The decision tree consists of two main branches, one branch determining the compatibility with EUROSTAT and one determining the compatibility with CARE. If an indicator is not compatible with EUROSTAT definitions, and transformation rules can not be adopted, the indicator can not be compatible with CARE.
The following examples may illustrate the paths in the decision tree:
Project co-financed by the European Commission, Directorate-General Transport and Energy
sn_swov_2.2.2_deliverable2.2_4 20/03/2007 Page 16

SafetyNet Deliverable 2.2.2 1st classification of the EU member states on RED
Project co-financed by the European Commission, Directorate-General Transport and Energy
sn_swov_2.2.2_deliverable2.2_4 20/03/2007 Page 17
A) In Germany, vehicle kilometres are defined by use of a sample of German cars that are extrapolated to national data. These data cover German cars irrespective of where they are driven. So the definition of vehicle kilometres is not defined as in EUROSTAT (path 1), nor compatible with EUROSTAT’s definition (path 2). Transformation rules may however be applied, for instances by use of surveys etc. (path 6). Moreover, even if the indicator is not in accordance with EUROSTAT definitions, the variables of this indicator e.g. vehicle types may be identical to the definitions in CARE (path 10).
B) Belgium does not collect vehicle kilometres for mopeds, and accordingly the definition of vehicle kilometres in Belgium is not identical to that of EUROSTAT (path 1). But it is nevertheless compatible in the sense that it is normally no problem involved in omitting vehicle kilometres for specific vehicle types from EUROSTAT data on vehicle kilometres (path 5). The next question to consider is whether the data on vehicle kilometres is based on the same definition of vehicle types as in CARE. By and large it is, making Belgium data on vehicle kilometres compatible with CARE (path 10).
C) France does not collect data on passenger cars older than 15 years. This implies that the vehicle fleet in France is not defined as in EUROSTAT (path 1) where the “Stock of road vehicles” is not restricted according to vehicle age. The French vehicle data are furthermore not compatible with EUROSTAT’s definition (path 2). However, transformation rules may be adopted, for instance based on the proportion of vehicles older than 15 years in comparable countries (path 6). In the comparison with CARE, the age restriction of French vehicles obstruct direct compatibility (path 7). However, in CARE plus 2, vehicle age is a variable with values compatible to the age restrictions of the vehicle fleet registrations in France, and thus the vehicle fleet data are compatible with CARE (path 11).
When adopting this logic in the following, we use a rather tolerant criterion of compatibility. Based on the information available at this stage, we are not able to distinguish between “partially” and “fully” compatible. Thus, we classify indicators to be compatible with CARE if variables and values of the indicator are at least partly compatible. Indicators are considered to be “partially compatible” if the indicator in total is compatible (population over all ages, gender, and nationality) and/or if some specific variables (e.g. gender) are compatible whereas others (e.g. age) are not. So if a country has for instance vehicle registrations with only vehicle type and not vehicle age defined as in CARE, we nevertheless regard vehicle fleet of that country to be compatible with CARE. The more detailed considerations of possible cross tabulations etc. will be dealt with in a subsequent deliverable.

SafetyNet Deliverable 2.2.2 1st classification of the EU member states on RED
Project co-financed by the European Commission, Directorate-General Transport and Energy
sn_swov_2.2.2_deliverable2.2_4 20/03/2007 Page 18
4.2 Selection of indicators The discussion of compatibility will be restricted to the 6 indicators that were considered to be at least partly available for more than 60 per cent of the countries. The following indicators will thus be considered with regard to compatibility with CARE:
� Population � Vehicle fleet � Road length � Fuel consumption/sales � Driver population � Vehicle kilometres
For each indicator a table has been prepared indicating whether the indicator is compatible with CARE for different countries. The first column lists the countries considered; the second column gives the results on availability taken from chapter 3. The third column indicates the way through the decision tree depicted in figure 4.1 for each indicator/country combination. The fourth column gives the result of the decision tree route stating whether or not the indicator for the specific country is compatible with CARE. This is calculated as a percentage of the countries having the indicator available and where compatibility has been possible to assess. Countries that have a specific indicator available, but where compatibility with CARE has not been possible to assess due to lack of answers to the questionnaire, are accordingly not included in the calculation of this percentage.

SafetyNet Deliverable 2.2.2 1st classification of the EU member states on RED
Project co-financed by the European Commission, Directorate-General Transport and Energy
sn_swov_2.2.2_deliverable2.2_4 20/03/2007 Page 19
4.2.1 Population
An overview of the results concerning compatibility for population data is given in table 4.1
Table 4.1 Compatibility with CARE for population data
Population Available Decision path CompatibleBE Belgium 1 4 10 1CZ Czech Rep. 1 4 10 1DK Denmark 1 4 10 1DE Germany 1 4 10 1EE Estonia 1 4 10 1EL Greece 1 4 7 11 1ES Spain 1 4 10 1FR France 1 4 7 11 1IE Ireland 1 1 5 10 1IT Italy 1 4 7 11 1CY Cyprus 1 4 10 1LV Latvia 1 4 10 1LT Lithuania 1 4 7 11 1LU Luxembourg 1 4 10 1HU Hungary 1 4 10 1MT Malta 1 4 7 11 1NL The Netherlands 1 4 10 1AT Austria 1 4 10 1PL Poland 1 4 10 1PT Portugal 1 4 7 11 1SI Slovenia 1 4 10 1SK Slovakia 1 4 10 1FI Finland 1 4 7 11 1SE Sweden 1 4 10 1UK United Kingdom 1 4 10 1NO Norway 1 4 10 1
100 %
EL, FR, IE, IT, LU, PT: Age not rounded down to the whole number of years. SK: data from 31st of December. AT, DE, DK, ES, FR, GR, LU, NL: "Own" or "foreign" nationality of persons involved in accidents is registered. LT, MT, PT, FI: does not have single year data. IE does not state clearly whether definition is the same as in EUROSTAT.
Overall, population figures are generally compatible with CARE. Some countries (EL, FR, IE, IT, LU, PT) have age not rounded down to the whole number of years, but instead to the closest whole year. Also in some countries age 0 to 1 is rounded up 1, and some countries have only age data for age brackets. Such discrepancies are, however small and possible to adjust.

SafetyNet Deliverable 2.2.2 1st classification of the EU member states on RED
Project co-financed by the European Commission, Directorate-General Transport and Energy
sn_swov_2.2.2_deliverable2.2_4 20/03/2007 Page 20
There are, however, three more serious problems involved when considering compatibility of population data with accident data. These are concerned with (1) the proportion of foreigners residing in each country, (2) the number of illegal immigrants, and (3) the magnitude of tourist and transit road traffic.
The proportion of non-nationals residing in different countries varies greatly between countries. The proportion is highest in Luxembourg (LU) with 39 %, and lowest in Slovakia (SK) with only 1 % (Eurostat 2006).
It is clear that if such differences are not taken into consideration when using population as risk exposure data, the estimates will be biased. However, in most countries, foreigners residing more or less permanently are registered as part of the population.
As a rule, foreigners (of every kind) are included in the road accident statistics for the country where the accident happens, and accordingly it is important that the population figures also include foreign residents. For most countries this is not a problem.
Furthermore, in CARE plus 2 the nationality (own/foreign) of persons in accidents is registered, and accordingly one may restrict the risk estimates (rates) to accidents/injuries/fatalities of “own“ nationality per inhabitant of “own” nationality. According to the latest CARE documents, nationality of persons involved in accidents is registered in Austria (AT), Germany (DE), Denmark (DK), Estonia (EE), France (FR), Greece (EL) and The Netherlands (NL).
Illegal immigrants will naturally not be included in the population register, but they will normally be included in road accidents statistics, and as such they may contribute to biases when using population as risk exposure data. This bias will, however, probably be small, and for those countries that register nationality (own/foreign) of persons in accidents, it will be possible anyway to correct for this bias by excluding foreigners and people with unknown nationality from the calculations.
Some countries, especially those in central or southern Europe may have substantial tourist and transit traffic which may give estimation biases when population data is used as exposure data. Accidents occurring by such traffic will be registered in the accident register of that country, whereas the persons involved will not be part of the population. Although this bias may be modest, it may be significant, especially if risk is estimated for sub-groups of the population.
In CARE plus 2, the home country for a vehicle involved in an accident is registered, making it possible to control for such possible biases. Only Germany (DE), Spain (ES), United Kingdom (UK), Greece (EL), Ireland (IE), The Netherlands (NL) and Portugal (PT) do not register whether vehicles in accident belong to own or foreign country.

SafetyNet Deliverable 2.2.2 1st classification of the EU member states on RED
Project co-financed by the European Commission, Directorate-General Transport and Energy
sn_swov_2.2.2_deliverable2.2_4 20/03/2007 Page 21
4.2.2. Vehicle fleet
An overview of the results concerning compatibility for vehicle fleet data is presented in table 4.2.
Table 4.2 Compatibility with CARE for vehicle fleet data
Vehicle fleet Available Decision path Compatible BE Belgium 1 4 7 11 1CZ Czech Rep. 1 1 5 7 8 12 1DK Denmark 1 4 7 11 1DE Germany 1 4 7 11 1EE Estonia 1 4 7 11 1EL Greece 1 4 10 1ES Spain 1 4 7 11 1FR France 1 1 2 6 7 11 1IE Ireland 1 1 2 3 0IT Italy 1 4 7 11 1CY Cyprus 1 4 10 1LV Latvia 1 4 7 11 1LT Lithuania 1 4 7 11 1LU Luxembourg 1 4 10 1HU Hungary 1 4 7 11 1MT Malta 1 4 7 11 1NL The Netherlands 1 4 10 1AT Austria 1 4 10 1PL Poland 1 4 10 1PT Portugal 1 4 7 11 1SI Slovenia 1 4 10 1SK Slovakia 1 4 7 11 1FI Finland 1 4 10 1SE Sweden 1 4 7 11 1UK United Kingdom 1 4 10 1NO Norway 1 4 10 1
96,2 %
BE, DK, DE, ES, LV, LT, HU, PT: Mopeds are not registered; LU, IT, SK no data after 1994, 1998, and 1995 respectively. For DK a registration is established from mid 2006. FR: Only data for vehicles < 15 years. In CARE Plus 2 vehicle age is a variable (with matching values) making data compatible. CZ: Does not have data for trolleybuses. DE, IT: Lorries can not be categorized as more or less than 3.5 tonnes EE: Data on road tractors are missing after 1997. IE: Differs on several vehicle types, doubt that transformation rules can be adopted. DK, HU: Passenger cars include minibuses up to 9 persons. MT: Mopeds are included in motorcycles. PT: Trolleybuses are not included. Data from Azores and Madeira not incl. after 1990. SK: Only data for road tractors for companies with at least 20 employees. SE: Road tractors included in lorries from 1990. UK: Some data for GB only.

SafetyNet Deliverable 2.2.2 1st classification of the EU member states on RED
Project co-financed by the European Commission, Directorate-General Transport and Energy
sn_swov_2.2.2_deliverable2.2_4 20/03/2007 Page 22
All countries have data on vehicle fleet, and some have data fully compatible with CARE for a number of variables. Typically, data on vehicle fleet are based on information from central vehicle registration databases which are updated at least yearly. Some countries also register and publish monthly figures.
There are however some problems for some definitions. CARE defines car+taxi as one category and buses as another. Some countries have taxis with more than 8 seats, i.e. they are buses but also taxis. A number of countries have trolleybuses that are not included in the bus definition (Czech Republic + Portugal). In France there are age limits to the registration of vehicles (passenger cars, buses and road tractors).
Many countries have no central register of mopeds (Belgium, Germany, Spain, Hungary, Latvia, Lithuania, Portugal. Denmark has started to register all new mopeds from mid 2006). As long as it is possible to subtract mopeds from the CARE data for these countries, this does not create problems with compatibility.
Withdrawal of vehicles no longer in use may be a problem in some countries. Registration procedures of immigrant vehicles and de-registration of emigrant vehicles are unclear in many cases.

SafetyNet Deliverable 2.2.2 1st classification of the EU member states on RED
Project co-financed by the European Commission, Directorate-General Transport and Energy
sn_swov_2.2.2_deliverable2.2_4 20/03/2007 Page 23
4.2.3 Road length
Table 4.3 gives an overview of the results concerning the compatibility for road length data.
Table 4.3 Compatibility with CARE for road length data
Road length Available Decision path Compatible BE Belgium 1 4 10 1CZ Czech Rep. 1 4 10 1DK Denmark 1 4 10 1DE Germany 1 4 10 1EE Estonia 1 4 7 11 1EL Greece 1 4 10 1ES Spain 1*FR France 1 4 10 1IE Ireland 1 4 10 1IT Italy 1*CY Cyprus 1 4 10 1LV Latvia 1*LT Lithuania 1 4 7 11 1LU Luxembourg 1 1 5 7 8 9 0HU Hungary 1 1 5 10 1MT Malta 1 4 7 11 1NL The Netherlands 1 4 10 1AT Austria 1 4 10 1PL Poland 1*PT Portugal 1 4 10 1SI Slovenia 1 4 10 1SK Slovakia 1 4 10 1FI Finland 1 4 10 1SE Sweden 1 4 10 1UK United Kingdom 1 4 10 1NO Norway 1 4 10 1
95,5 %
* ES, IT, LV, PL: Data is at least partially available, but compatibility is not possible to assess due to lack of answers to the questionnaire DK: Private roads (with or without public access) are not part of the road network. This is probably the case for most countries. DE: Only lengths for roads outside urban areas, compatible to CARE for motorways. EE, LT: Only aggregated data for the whole road network FR, FI: Compatibility to CARE for motorway assumed, not stated in questionnaire. IE: Has only data for national roads, motorways can be distinguished LU: Separate definition. Only data for the whole network of state roads is available. Motorways can not be distinguished HU: Earth road without stabilised base part of road network. Motorways can be distinguished MT: Data for whole road network, Malta has no motorways AT: No data for municipality roads PT: Only national roads, motorways can be distinguished SI: Data from United Nations Economic and Social Council TRANS/WP.6/AC.5/2005/12 UK: Data restricted to Great Britain

SafetyNet Deliverable 2.2.2 1st classification of the EU member states on RED
Project co-financed by the European Commission, Directorate-General Transport and Energy
sn_swov_2.2.2_deliverable2.2_4 20/03/2007 Page 24
The only road distinction in CARE is between motorways and not motorways, and thus countries where motorway lengths can be distinguished, are considered to be compatible.
In CARE, road accidents refer to accidents on public roads but they normally include accidents on private roads to which the public has right of access (except for BE, NL, PT). Few countries register the length of private roads. In addition, the lengths of small, very local roads are probably not included in many countries.
The possible problem imposed by lack of road lengths for private roads and small, local roads, is accordingly that road lengths for non-motorways may be not compatible with CARE data. These roads carry small volumes of traffic, and it may be argued that these roads may be ignored. Accordingly, we argue that with a few exceptions road lengths will be partly compatible with CARE for non-motorways, and fully compatible for motorways.

SafetyNet Deliverable 2.2.2 1st classification of the EU member states on RED
Project co-financed by the European Commission, Directorate-General Transport and Energy
sn_swov_2.2.2_deliverable2.2_4 20/03/2007 Page 25
4.2.4 Fuel consumption
Table 4.4 gives the results concerning compatibility for fuel consumption data.
Table 4.4 Compatibility with CARE for fuel consumption data
Fuel consumption Available Decision path CompatibleBE Belgium 1 1 2 3 0CZ Czech Rep. 1 4 7 8 9 0DK Denmark 1 4 10 1DE Germany 1 1 5 10 1EE Estonia 1 1 2 3 0EL Greece 0ES Spain 1*FR France 1 1 5 10 1IE Ireland 0IT Italy 1*CY Cyprus 1 1 5 10 1LV Latvia 1*LT Lithuania 1 1 2 3 0LU Luxembourg 1 1 2 3 0HU Hungary 1*MT Malta 1 1 5 10 1NL The Netherlands 1 1 2 3 0AT Austria 1 1 2 3 0PL Poland 0PT Portugal 1 4 10 1SI Slovenia 1*SK Slovakia 1*FI Finland 1 1 0SE Sweden 1 1UK United Kingdom 1 1 5 10 1NO Norway 1 1 5 10 1
55,6 %
* ES, IT, HU, SI, SK, FR, LV: Data is at least partially available, but compatibility is not possible to assess due to lack of answers to questionnaire BE, DE, CY, LU, MT, FI, UK, NO: Consumption/sales measured in tonnes/litres/m3
BE, EE, LU, NL AT, FI : Transport use can not be distinguished DE, LT, PT: Data of transport use can be obtained, but not by transport mode DK; NO: Transport modes can be distinguished CZ: Data restricted to vehicle fleet of enterprises. LT, SE: Data from United Nations Economic and Social Council TRANS/WP.6/AC.5/2005/12 UK: Data restricted to Great Britain
Although many countries collect data on fuel consumption, these data are in many cases not compatible with CARE. The main reason is that transport use seldom can be distinguished in the data collected.
SafetyNet Deliverable 2.2.2 1st classification of the EU member states on RED
Project co-financed by the European Commission, Directorate-General Transport and Energy
sn_swov_2.2.2_deliverable2.2_4 20/03/2007 Page 26
Furthermore, even if transportuse can be distinguished, fuel sales can often not be seperated for different transport modes. Additionally, there is also a substantial problem involved concerning the correspondence between sales and consumption; fuel sold in one country may be consumed in another. In addition, such biases will be systematic; countries where taxes are relatively low and fuel is cheap will attract customers from neighbouring countries. Thus the sales statistics for a country may be quite unreliable as indicator for road traffic within the country. It is also difficult to envisage possible adjustments or transformation of data to solve this problem.
4.2.5 Driver population
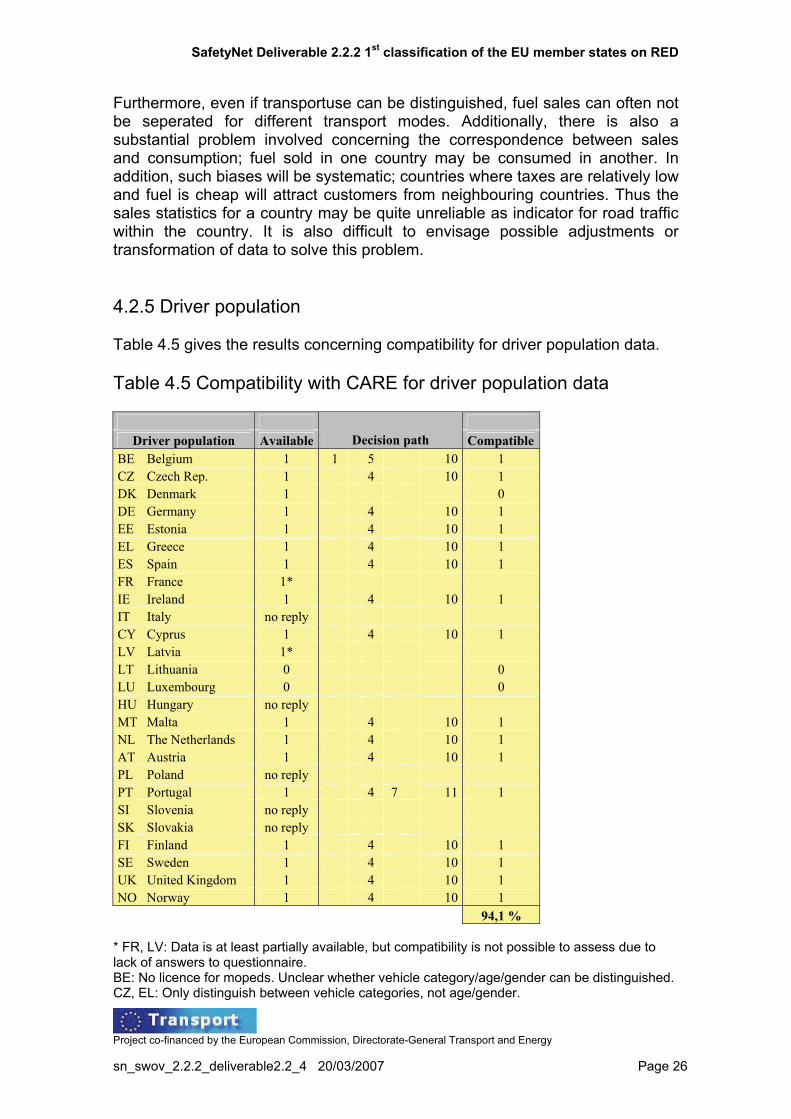
Table 4.5 gives the results concerning compatibility for driver population data.
Table 4.5 Compatibility with CARE for driver population data
Driver population Available Decision path CompatibleBE Belgium 1 1 5 10 1CZ Czech Rep. 1 4 10 1DK Denmark 1 0DE Germany 1 4 10 1EE Estonia 1 4 10 1EL Greece 1 4 10 1ES Spain 1 4 10 1FR France 1*IE Ireland 1 4 10 1IT Italy no reply CY Cyprus 1 4 10 1LV Latvia 1*LT Lithuania 0 0LU Luxembourg 0 0HU Hungary no reply MT Malta 1 4 10 1NL The Netherlands 1 4 10 1AT Austria 1 4 10 1PL Poland no reply PT Portugal 1 4 7 11 1SI Slovenia no reply SK Slovakia no reply FI Finland 1 4 10 1SE Sweden 1 4 10 1UK United Kingdom 1 4 10 1NO Norway 1 4 10 1
94,1 %
* FR, LV: Data is at least partially available, but compatibility is not possible to assess due to lack of answers to questionnaire. BE: No licence for mopeds. Unclear whether vehicle category/age/gender can be distinguished. CZ, EL: Only distinguish between vehicle categories, not age/gender.

SafetyNet Deliverable 2.2.2 1st classification of the EU member states on RED
Project co-financed by the European Commission, Directorate-General Transport and Energy
sn_swov_2.2.2_deliverable2.2_4 20/03/2007 Page 27
DE Only distinguish between car/motorcycle. PT: moped licences only in local registers. UK: data restricted to Great Britain. DK: Information is available in a national register but is not available in an adequate format.
Except for Denmark, all countries having driver licence data have data that are at least partly compatible with CARE. One possible problem involved when utilising licence registers as exposure data is that it varies and is often rather unclear whether persons or licences are the units of the registers. This may create problems in comparisons, and should be examined in detail.
Another and perhaps bigger problem is that the register of drivers often contains drivers who are in fact dead, have emigrated etc. Also, the driver registers do not contain data on the true drivers within the country borders. This is a particular problem in e.g. Luxembourg and Belgium, because a large proportion of the population are EU-citizens from other countries, with their national driving licenses. Also, many EU-citizens from the former east-block work in western countries, creating similar discrepancies between the number of registered drivers and the true number of drivers.
Some countries have procedures for removing deceased drivers from the registers (Spain, Sweden), but others have not. Several countries state that deceased drivers are not necessarily removed from the registers (e.g. Greece and Austria). Especially for risk estimates of older drivers this may create biases.

SafetyNet Deliverable 2.2.2 1st classification of the EU member states on RED
Project co-financed by the European Commission, Directorate-General Transport and Energy
sn_swov_2.2.2_deliverable2.2_4 20/03/2007 Page 28
4.2.6 Vehicle kilometres
The results on compatibility for vehicle kilometres data is given in table 4.6.
Table 4.6 Compatibility with CARE for vehicle kilometres data
Vehicle kilometres Available Decision path CompatibleBE Belgium 1 1 5 10 1CZ Czech Rep. 1 1 5 10 1DK Denmark 1 4 10 1DE Germany 1 1 2 6 10 1EE Estonia 1 1 5 10 1EL Greece 0ES Spain 1*FR France 1 1 2 6 10 1IE Ireland no reply IT Italy no reply CY Cyprus 0LV Latvia 1 1 2 6 10 1LT Lithuania 0LU Luxembourg 0HU Hungary 1 1 2 6 10 1MT Malta 0NL The Netherlands 1 1 2 6 10 1AT Austria 1 1 5 10 1PL Poland no reply PT Portugal 1 1 5 10 1SI Slovenia 1 1 5 10 1SK Slovakia 1 1 5 10 1FI Finland 1 1 5 10 1SE Sweden 1 5 10 1UK United Kingdom 1 4 10 1NO Norway 1 1 5 10 1
100,0 %
* ES: Data is at least partially available, but compatibility is not possible to assess due to lack of answers to questionnaire. BE: Has no data for mopeds. CZ HU: Has no data for local roads, motorways can be distinguished. DK, NL; UK: Have data also for bicycles, but for DK the quality is rather poor. DE: Total data cover vehicle kilometres of German cars, not necessarily on German ground. Vehicle km for motorways can be distinguished. EE, FI: No data for motorcycles or mopeds. FR, LV, SI: Data from United Nations Economic and Social Council TRANS/WP.6/AC.5/2005/12 FR: Estimates based on surveys and vehicle fleet, older vehicles not registered. Poor data for motorcycles. NL, LT: Data cover national vehicles and not necessarily traffic within national borders. PT: Estimates of vehicle kilometres on the national road network based on census and b) estimates of total traffic volumes by fuel sales and vehicle fleet. SI: Estimates based on traffic counts and road length. Urban traffic underestimated. SK: Only data for some vehicle types; motor coaches, buses and lorries. UK: data restricted to Great Britain.

SafetyNet Deliverable 2.2.2 1st classification of the EU member states on RED
Project co-financed by the European Commission, Directorate-General Transport and Energy
sn_swov_2.2.2_deliverable2.2_4 20/03/2007 Page 29
There are somewhat different definitions of vehicle kilometres available from EUROSTAT depending on which publication one uses. One definition includes all road vehicles, independent of whether they are motor vehicles or not. Another definition, which can be found in the Glossary of Transport Statistics (3rd edition), is that vehicle kilometre is a “unit of measurement representing the movement of a road motor vehicle over one kilometre”.
In the present report, vehicle kilometres are defined as including all road vehicles. As quite few European countries have vehicle kilometres for bicycles (Denmark, The Netherlands and Great Britain do have bicycle data), few countries are regarded as having definitions identical to that of EUROSTAT. However, it is normally quite clear whether or not bicycles are included, both in the vehicle kilometres data and in the accident data, so this poses no big problem. It does, however, imply that most countries are regarded as having data not defined as in EUROSAT, but as compatible to EUROSTAT’s definition (path 1,5).
There are in general two possible problems with vehicle kilometres data and compatibility with CARE.
Firstly, in many countries traffic volume data cover national vehicles and not necessarily traffic within national borders (Germany, The Netherlands, Lithuania). Increasingly, countries are starting to use odometer readings from periodic vehicle inspections to estimate vehicle kilometres, (Denmark, Latvia, The Netherlands, Finland, Sweden). Such a method is easy to adopt, and probably quite accurate, but if it is not complemented by other methods, traffic volumes will be biased because an unknown proportion of travel is carried out abroad.
Secondly, in many countries data on vehicle kilometres is restricted to specific types of roads. Some countries only have data on vehicle kilometres for national roads (Hungary, Czech Republic). And when many countries do not have road lengths for small local roads, and private roads, they will accordingly often also lack vehicle kilometres for such roads.
Some countries (e.g. Denmark, Sweden) combine odometer readings with other methods in order to give total estimates and estimates for different types of roads.
Most countries that have vehicle kilometres data can either distinguish traffic on motorways or have estimates for total traffic volumes (or both). In either case they are considered to be compatible with CARE. In order to achieve total traffic volumes, different methods are used; surveys, censuses weighted by road lengths/number of vehicles/ fuel sales etc. There is perhaps a need for scrutinising the different methods in order to ensure that traffic volume data are compatible between countries. Within the framework of UNECE there is currently work going on in order to describe and compare the different methods used by different countries to produce traffic volume data. This work can be of great value in order to get detailed information of the methods used.

SafetyNet Deliverable 2.2.2 1st classification of the EU member states on RED
Project co-financed by the European Commission, Directorate-General Transport and Energy
sn_swov_2.2.2_deliverable2.2_4 20/03/2007 Page 30
4.3 Conclusion Based on the information received, five of the six selected indicators considered are regarded as compatible with CARE. The only indicator that is not regarded as compatible is "fuel consumption". The main reason is that transport use can not be distinguished in the data collected in many countries. However, many countries utilise fuel consumption data in combination with other data sources to estimate vehicle kilometres.
The five indicators considered to be at least partly compatible with CARE are population, driver population, vehicle fleet, road length and vehicle kilometres.
It is, however, important to emphasize that this conclusion is based on a preliminary classification of indicators and countries by use of the information received so far. It is possible that further and more detailed information or future information may lead to other conclusions.

SafetyNet Deliverable 2.2.2 1st classification of the EU member states on RED
Project co-financed by the European Commission, Directorate-General Transport and Energy
sn_swov_2.2.2_deliverable2.2_4 20/03/2007 Page 31
5. Usability 5.1 Introduction Usable data is defined in SafetyNet WP2 as "data that is at least partially available and partially compatible". In the two previous chapters, the level of availability and compatibility of the indicators has been determined for each country. These results are used in this chapter to determine whether an indicator is usable or not. If more than 60 percent of the EU member states have usable data for an indicator, it will be regarded as usable.
5.2 Results In this section each indicator will be analysed on the level of usability. The indicator can be regarded as "usable" or "not usable". The countries that collect usable data are displayed in light grey cells. Countries that do not collect usable data are placed in the dark grey cells and countries that are lacking information are placed in the white cells.
Table 5.1 Usability of population data (suggestion)
Data at least partially available
Not available Notknown
Data at least partiallycompatible
BE, CZ, DK, DE, EL, ES, FR, HU, IE,IT, CY, LT, LV,LU, MT, NL, PL, PT, AT, SI, SK, FI, SE, UK, NO, EE
Not compatible Not known
UsableNot usable Not known or partially not known
All countries have usable data on population.

SafetyNet Deliverable 2.2.2 1st classification of the EU member states on RED
Project co-financed by the European Commission, Directorate-General Transport and Energy
sn_swov_2.2.2_deliverable2.2_4 20/03/2007 Page 32
Table 5.2 Usability of vehicle fleet data
Data at least partially available
Notavailable
Notknown
Data at least partiallycompatible
BE, CZ, EE, EL, ES, FR, IT, CY, LT, LU, MT, NL, AT, SI, SK, FI, SE, UK, NO, DK, DE, LV, HU, PL, PT,
Not compatible IENot known
All countries except Ireland have data that are compatible with CARE. The disaggregation of vehicle types differs in Ireland and it is doubtful whether this can be corrected by transformation rules. "Vehicle fleet" is being considered as a usable indicator.
Table 5.3 Usability of road length data
Data at least partially available
Notavailable
Notknown
Data at least partiallycompatible
BE, EE, FR, CY, HU, MT, NL, SI, SK, SE, NO, CZ, DK, DE, EL, AT, PT, FI, UK, IE, LT
Not compatible LU, LV, Not known ES, IT, PL,
For four countries the compatibility with CARE is not known. Luxemburg uses a separate definition. It is not certain if this is compatible, and it is also not known whether motorways can be distinguished for Luxemburg. Therefore, "road length" data from Luxemburg will currently be regarded as not compatible. By building a common RED framework, a more detailed examination of the Luxemburg "road length" data will be made.
No detailed information on variables and values was found for Spain, Italy, Poland and Latvia. Malta has no motorways. For all other countries data is regarded usable for making comparisons on a European level.

SafetyNet Deliverable 2.2.2 1st classification of the EU member states on RED
Project co-financed by the European Commission, Directorate-General Transport and Energy
sn_swov_2.2.2_deliverable2.2_4 20/03/2007 Page 33
Table 5.4 Usability of fuel consumption data
Data at least partially available
Notavailable
Notknown
Data at least partiallycompatible
DK, DE, FR, CY, MT, PT, SE, UK, NO
Not compatible CZ, EE, LU, FI, LT, BE, NL, AT,
EL, IE, PL
LV
Not known ES, HU, SI, SK, IT,
Fuel consumption is adequately available but not well compatible with CARE. This indicator will thus be regarded as not usable for this moment. It is a potential usable indicator if data could be disaggregated by transport use and transferred into an estimate of vehicle kilometres.
Table 5.5. Usability of driver population data
Data at least partially available
Notavailable
Notknown
Data at least partiallycompatible
CZ, DE, EE, EL, ES, IE, CY, MT, AT, PT, FI, SE, UK, NO, BE, NL,
Not compatible Not known DK, FR, LT, LU, LV, IT, HU,
PL, SI, SK,
We regard this indicator as usable since most countries who replied have compatible data available. Lithuania, Luxemburg and Denmark have only data available for new licenses per year. In the case of Denmark data exists but they are not published in a useful way. Compatibility has not been analysed for these countries but is expected to be partially compatible as well.
Table 5.6 Usability of vehicle kilometres data
Data at least partially available
Notavailable
Not known
Data at least partiallycompatible
CZ, DK, PT, SK, SE, NO BE, DE, EE, FR, HU, NL, AT, SI, FI, UK, LV,
Not compatible EL, CY,LT, LU, MT,
Not known ES, IE, IT, PL,
All countries that have vehicle kilometres available, have compatible data as well. This means that this indicator can be regarded as a usable indicator.

SafetyNet Deliverable 2.2.2 1st classification of the EU member states on RED
Project co-financed by the European Commission, Directorate-General Transport and Energy
sn_swov_2.2.2_deliverable2.2_4 20/03/2007 Page 34
5.3 SummaryOnly five of the nine indicators are regarded as usable. All other indicators are less than partially available or not compatible with the CARE data. This does not mean that these indicators are useless. They still provide usable information on national or small-scale international level. For European wide comparisons these indicators are not (yet) suitable for usage in the common framework. The five usable indicators are: population, road length, vehicle fleet, driver population, and vehicle kilometres.
Therefore, these five indicators should be regarded as areas where we put the most effort to include them into CARE. Some of the others are still of great relevance to the safety work but getting relevant data for all countries is too big an effort for the moment. Based on this first classification, they will be put on stand by for later considerations.

SafetyNet Deliverable 2.2.2 1st classification of the EU member states on RED
Project co-financed by the European Commission, Directorate-General Transport and Energy
sn_swov_2.2.2_deliverable2.2_4 20/03/2007 Page 35
6. Summary and Conclusion In the previous chapters nine different potential RED indicators have been considered with regard to availability, compatibility and usability to be used as exposure data in risk calculations with accident data from CARE.
Availability was defined as relevant data on country level that is ready for use. It was distinguished between fully available and partly available data, where the former refer to data readily available, and the latter refer to data that are available but not complete for all subsets.
Compatibility was defined as a property of data ensuring the possibility of comparisons. In order to be compatible, the variables must be defined in the same way as in EUROSTAT or CARE, or if not, be specified so that subsets of the data (specific variable values) may be compared.
Usability was defined as data that was at least partially available and partially compatible.
Based on this first analysis of the answers to the RED questionnaire, five of the nine common RED indicators can be regarded as usable for comparing RED at a European level. The five indicators that were classified as possibly usable indicators are: "population", "driver population", "vehicle fleet", "road length" and "vehicle kilometres".
Population figures have often been used as to make risk estimates, and such figures are available for all countries, and in general compatible with CARE. There are however, some issues involved when using population figures in risk estimates. These are concerned with the number of foreigners residing within the borders of a country, the number of illegal immigrants and the amount of tourist/transit traffic. The possible problems created by these issues are modest and probably solvable, but they should nevertheless be taken seriously. In small countries like Luxembourg and Belgium, the proportion of foreigners is large, and if not taken into consideration, it may lead to biased estimates.
Also for driver population figures there are some issues that may create biases when utilised for risk estimations. One issue is that the unit in licence registrations sometimes are persons (drivers) and sometimes licenses. This may be trivial and not a problem, but it should nevertheless be considered when making risk estimates. Another possible problem is the fact that deceased drivers may not be removed from the register. A third possible problem is the number of foreigners/immigrants/tourists that may constitute substantial proportions of the population of specific driver groups. For instance, due to large tourist traffic, the number of licensed motorcycle drivers may not be a good indicator for motorcycle traffic in some countries. If such issues are taken into consideration, driver population figures may be a fairly good indicator of traffic exposure and thus applicable for risk estimations and risk comparisons.

SafetyNet Deliverable 2.2.2 1st classification of the EU member states on RED
Project co-financed by the European Commission, Directorate-General Transport and Energy
sn_swov_2.2.2_deliverable2.2_4 20/03/2007 Page 36
All countries have data on vehicle fleet, and a number of countries have data fully compatible with CARE for a number of variables. There are however, also some challenges when utilising vehicle fleet data for risk estimations, related to some vehicle types missing in some countries etc. Such problems should however be possible to solve by using similar subsets of CARE data. Withdrawal of vehicles which are no longer in use may be a problem in some countries. Registration procedures of immigrant vehicles and de-registration of emigrant vehicles are unclear in many cases, and should be examined in more depth if vehicle fleet figures are to be used in risk calculations based on CARE.
Road lengths are available and considered compatible for most countries. There are, however, limitations to the applicability of road length as risk exposure indicator. Some countries can give figures of motorway lengths but not of the total road network. Consequently risk can only be estimated as motorway accidents per motorway length. Other countries may have figures of the total road network, but do not have separate figures for motorways. In such countries only total accidents per total road length can be estimated. So, even if road lengths are available and compatible with CARE for most countries, the compatibility between countries may be somewhat restricted.
Neither of the indicators population, driver population, vehicle fleet or road length is in itself a good indicator of traffic volume. Population data are only valid for comparisons if the level of motorization is the same; the number of cars is only valid if the average driving distances are the same and road lengths are only valid if annual daily traffic per kilometre of road is the same.
Nevertheless, for some countries comparisons based on these indicators could give at least an ordinal ranking of risk levels between countries. Such a ranking would of course be even more reliable if risk estimations based on the different indicators give the same results. Furthermore, it is also possible to envisage some joint measure based on these indicators that perhaps could be used; i.e. a measure weighing together these indicators. One could perhaps argue that some weighed estimate of road lengths and the number of vehicles could be a proxy for traffic volume that could be more valid as exposure than either the road length or the number of vehicle in themselves.
Among the indicators that are regarded as usable here, vehicle kilometres is the indicator that could be regarded as most valid from a methodological point of view. Vehicle kilometres is in fact a measure of traffic volume; the other indicators are mere proxies of traffic.
The methods used for producing vehicle kilometres data varies greatly between countries. Some are based on traffic counts and road lengths (annual daily traffic x kilometre of road), others use vehicle fleet data and fuel sales/consumptions; some use travel surveys and vehicle fleet data etc. Increasingly, countries are starting to use odometer recordings registered at periodic vehicle inspections to estimate vehicle kilometres, (Denmark, Latvia, The Netherlands, Finland, Sweden).

SafetyNet Deliverable 2.2.2 1st classification of the EU member states on RED
Project co-financed by the European Commission, Directorate-General Transport and Energy
sn_swov_2.2.2_deliverable2.2_4 20/03/2007 Page 37
Such a method is easy to adopt, and probably quite accurate, but ought to be complemented by other methods in order to give valid estimates for traffic volumes within the borders of each country. In spite of this limitation of the method, adopting this method will to a large extent ensure that traffic volume data of different countries are comparable, because the data are collected in the same way in different countries. If one could find a uniform way of estimating the amount of traffic carried out abroad, this could perhaps be a method to recommend for the future (and it seems anyway to be increasingly popular today). The work currently going on within the framework of UNECE will possibly lead to recommendations of ways to harmonize traffic volume data based on odometer recordings.
Three indicators were not commonly available in the EU member states and thus not considered with regard to usability and compatibility. These indicators are "person kilometres", "number of trips", and "time-in-traffic". In addition, the indicator "fuel consumption" was not considered to be compatible with CARE.
The main problem with fuel consumption as RED indicator is that road transport use seldom can be distinguished in fuel consumption data. Moreover many countries that do distinguish between consumption for transport and other types of fuel consumption, seldom distinguish between transport modes so that road traffic can be separated out. Still, even if fuel consumption is not regarded as compatible as a RED indicator alone, many countries use fuel consumption data in combination with other data sources to estimate road traffic volumes.
Person kilometres, which can be regarded as a highly adequate RED indicator, was not considered usable because of lack of availability. It is possible that further information from member states can alter the picture, and it is also possible that person kilometres could be included in the common framework because of its adequacy and the fact that it will probably be more available in the future. It is also possible for many countries to give estimates on person kilometres based on data from vehicle kilometres and passenger counts. Furthermore, if more countries will conduct national travel surveys in the future, which is quite likely, data on person kilometres will be more easily available. Also the number of trips and time in traffic will be potentially available from national travel surveys, but few countries that conduct national travel surveys today do in fact give such estimates.
The present analysis provides a first classification of the data. Indicators that seem to be usable have been distinguished from those that seem not to be usable, based on the information available so far. In the near future additional information sources will be examined and the possibility of adopting transformation rules to correct for differences in methodology, variables and values between countries will be considered. Especially for compatibility with CARE, more detailed information is needed to build the common framework.
The indicators that for the moment are unavailable for a substantial number of countries, and thus not considered with regard to compatibility and usability will, however, return in the common framework. We will give recommendations for

SafetyNet Deliverable 2.2.2 1st classification of the EU member states on RED
Project co-financed by the European Commission, Directorate-General Transport and Energy
sn_swov_2.2.2_deliverable2.2_4 20/03/2007 Page 38
usage of all nine common indicators and also on methodologies that could be used to obtain these indicators.

SafetyNet Deliverable 2.2.2 1st classification of the EU member states on RED
Project co-financed by the European Commission, Directorate-General Transport and Energy
sn_swov_2.2.2_deliverable2.2_4 20/03/2007 Page 39
ReferencesEurostat (2006). Population and social conditions. Statistics in focus, 8/2006. ISSN 1024-4352 (http://epp.eurostat.cec.eu.int/cache/ITY_OFFPUB/KS-NK-06-008/EN/KS-NK-06-008-EN.PDF).
SafetyNet (2006). Deliverable 2.1. State of the Art Report on Risk and Exposure Data.

SafetyNet Deliverable 2.2.2 1st classification of the EU member states on RED
Project co-financed by the European Commission, Directorate-General Transport and Energy
sn_swov_2.2.2_deliverable2.2_4 20/03/2007 Page 40
Glossary and List of Abbreviations CARE CARE is a European Community database on road accidents resulting in death or injury. For further details seehttp://ec.europa.eu/transport/roadsafety/road_safety_observatory/care_en.htm
DGTren The Directorate-General for Energy and Transport. Based in Brussels, it reports to Jacques Barrot, Vice-President of the European Commission, Commissioner for Transport and Andris Piebalgs, Commissioner for Energy.For further details see http://ec.europa.eu/dgs/energy_transport/index_en.html
ECMT The European Conference of Ministers of Transport (ECMT) is an intergovernmental organisation established by a Protocol signed in Brussels on 17 October 1953. It comprises the Ministers of Transport of 43 full Member countries, 7 Associate countries and 1 Observer country. For more information see http://www.cemt.org/about.html
Eurostat Eurostat is the statistical information service of the European Union.For more information seehttp://epp.eurostat.ec.europa.eu/portal/page?_pageid=1153,47169267,1153_47181498&_dad=portal&_schema=PORTAL#COM
National Experts National Experts groups are established by the Road Safety High Level Group whenever a subject requires some special attention. Two “National Experts” Groups have been active in providing information and advice to the SafetyNet project. These are the CARE group (which was involved in this case) and the RSPI group.
UNECE United Nations Economic Commission for Europe. For more details see http://www.unece.org/

SafetyNet Deliverable 2.2.2 1st classification of the EU member states on RED
Annex 1
3. Road length
Project co-financed by the European Commission, Directorate-General Transport and Energy
sn_swov_2.2.2_deliverable2.2_4 20/03/2007 Page 41

SafetyNet Deliverable 2.2.2 1st classification of the EU member states on RED
3. Road length
3.1. Introduction road length
One often-used indicator of risk exposure is road length, i.e. the length of ‘road’ in a country. The following definition of ‘road’ is used by UNECE/ECMT/EUROSTAT (2003):
Definition Road:
"Line of communication, (travelled way) using a stabilized base other than rails or airstrips open to public traffic, primarily for the use of road motor vehicles running on their own wheels. Included are bridges, tunnels, supporting structures, junctions,crossings and interchanges. Toll roads are also included. Excluded are dedicated cycle paths."
UNECE/ECMT/EUROSTAT (2003)
This definition contains terms as ‘stabilized base’, ‘open to public traffic’, and ‘primarily for the use of road motor vehicles’ which may be interpreted differently by countries. Furthermore, for road safety studies it is important to distinguish, for instance, between road types, as 'motorway' and 'urban road'. Also these terms may be defined or interpreted differently.
Definition Motorway:
"Road, specially designed and built for motor traffic, which does not serve properties bordering on it, and which: (a) is provided, except at special points or temporarily, with separate carriageways for the two directions of traffic, separated from each other, either by dividing strip not intended for traffic, or exceptionally by other means; (b) does not cross at level with any road, railway or tramway track, or footpath; (c) is specially sign-posted as a motorway and is reserved for specific categories of road motor vehicles“
UNECE/ECMT/EUROSTAT (2003)
Definition Urban road:
"A road within the boundaries of a built-up area, which is an area with entries and exits specially sign-posted as such.“
UNECE/ECMT/EUROSTAT (2003)
For example, it may be so that in some countries certain roads are included in the national road length or in the national road length of motorways, whereas they are excluded in other countries. Furthermore, it may happen that in one country the national road length is composed of the measurements from half of the country's regions, while in another country it is based on measurements from all its regions. These kinds of differences should be accounted for when comparing numbers among countries.
Therefore, we would like to know in which regions in your country, and for what road types, road length is measured and how these road types are defined.
Project co-financed by the European Commission, Directorate-General Transport and Energy
sn_swov_2.2.2_deliverable2.2_4 20/03/2007 Page 42

SafetyNet Deliverable 2.2.2 1st classification of the EU member states on RED
Project co-financed by the European Commission, Directorate-General Transport and Energy
sn_swov_2.2.2_deliverable2.2_4 20/03/2007 Page 43
Furthermore, we would like to know what methods are used to measure road length. Finally, we would like to know how the road length information of the road types from the different regions is aggregated to produce the national road length estimate.

SafetyNet Deliverable 2.2.2 1st classification of the EU member states on RED
3.2. National data on road length
Q0. Contact information
?Please fill in your contact information:
Name: Institute: Country: E-mail: Tel.: Fax:
Q1. Do you have any national data on road length?
? Please fill in X in Yes or No.
Yes No
? If No, you will not have to fill in the rest of the questionnaire. Please indicate below if you have any data at all, or you are planning to gather the information in the future.
Q2. Definition and EUROSTAT data
Q2.a Definition
Definition Road:
"Line of communication, (travelled way) using a stabilized base other than rails or airstrips open to public traffic, primarily for the use of road motor vehicles running on their own wheels. Included are bridges, tunnels, supporting structures, junctions,crossings and interchanges. Toll roads are also included. Excluded are dedicated cycle paths."
UNECE/ECMT/EUROSTAT (2003)
? Is the definition of 'road' given above valid for the national road length data of your country? If not, then please explain what definition is used in your country.
Project co-financed by the European Commission, Directorate-General Transport and Energy
sn_swov_2.2.2_deliverable2.2_4 20/03/2007 Page 44

SafetyNet Deliverable 2.2.2 1st classification of the EU member states on RED
Example:
Yes
No, we include dedicated cycle paths
Q2.b. Data
? Please check this data. Are the data correct? If any data are wrong or based on incorrect definitions, or if you have any data that is more up-to-date, please inform the contact person of EUROSTAT Hans Strelow by e-mail: [email protected]
Some information on the national number of road length is already available at EUROSTAT. You can find this information in Appendix F that is sent to you
t l f thi d t ld l k it t th CIRCA it
Information available at EUROSTAT:
Example:
Yes
2003 figures are available, we will contact EUROSTAT for an update
Some definitions seems to be different from ours. We will contact EUROSTAT in order to find out how data are obtained
Q2.c. Data sources
Information:
It is possible that you obtain these numbers from different sources, for instance local authorities, companies, or organizations that gathers the information. For each of those sources, we would like to know the procedure by which the data is obtained for each of those sources (the Q3 part of this questionnaire). If you have many organizations that provide you with data, or organizations that provide you with data using practically the same (official) procedure, it is only necessary to fill in the information once.
? Please indicate the data source/sources used to obtain the national number. If the total number is different from the sum, please specify how these data sources then add up to the national number.
Example:We obtain numbers from regional authorities. They add up to the national numberWe have just one national number based on a national road databaseFor the main roads (state and county) we obtain the information from our national database. For municipality roads we use a questionnaire
Project co-financed by the European Commission, Directorate-General Transport and Energy
sn_swov_2.2.2_deliverable2.2_4 20/03/2007 Page 45

SafetyNet Deliverable 2.2.2 1st classification of the EU member states on RED
Project co-financed by the European Commission, Directorate-General Transport and Energy
sn_swov_2.2.2_deliverable2.2_4 20/03/2007 Page 46
This first part of the questionnaire was intended for the national CARE expert. The remainder of the questionnaire is intended for specialists on each of the sources (see Q2.c) you use to add up to the national number. If you do not know how to answer these questions correctly, please forward the questionnaire to the organization that provided you with the data.
When distributing the questionnaire you can get help on how to do in the distribution assistance document.
If you have to forward the questionnaire to more than one specialist, then please make a copy of this questionnaire after you have filled in your part for each extra specialist. Remember to fill in your information in the distribution assistance document and sent it along with the questionnaire to the specialist.

SafetyNet Deliverable 2.2.2 1st classification of the EU member states on RED
3.3. Expert part of road length
Q3. Methodologies for obtaining road length data
Please answer the following questions (Q3.a-h) separately for eachmethodology used in your organization to obtain road length information for the part of the road network you are responsible for. Methodology is not obtaining the information from a database. It is preferably a step deeper. How is the data in the database obtained? It could be by measuring on the road or on maps. If different methods are used for different parts of the road networks it is necessary to fill in the questions for each method. When to distinquish different methodologies is described in appendix B. In Appendix C several example methodologies are given.
Q3.a. Contact information
? Please fill in your contact information (if the same as in Q0., then write same in the name box and skip the rest of Q3.a.):
Name: Institute: Country: E-mail: Tel.: Fax:
Q3.b. Name of the methodology
? Please, supply the (unique) name of the methodology if it exists. Preferably, this is the name commonly referred to in literature.
Example:National Road Survey 2003Length of public roads – state and county roadsLength of public roads – municipality roads
Q3.c. Period of availability
? In which years (1991-today) is this methodology for obtaining road length information applied?
Example:1991 – 2003, the method was effective since 1980
Project co-financed by the European Commission, Directorate-General Transport and Energy
sn_swov_2.2.2_deliverable2.2_4 20/03/2007 Page 47

SafetyNet Deliverable 2.2.2 1st classification of the EU member states on RED
Q3.d. Application area
? For which geographical region of your country is this methodology for obtaining road length information applicable?
Example:Province XDepartment Y of province XThe whole country
? For which subsection of the road network (for example motorways, rural roads) is this methodology for obtaining road length information applicable?
Example:MotorwaysRural roadsAll roadsState roads
Q3.e. Transformation to national data
Information:
Sometimes a transformation is applied to the data before it is called final. It can be a better guess on the total length because not the whole road network is measured.
? What transformation, if any, do you apply to your final data from this methodology before it is published or otherwise made available to your national correspondent?
Example:NoneThe length of municipality roads are multiplied by 1.3 to take into account private roads with public access, where the length is not measured
Project co-financed by the European Commission, Directorate-General Transport and Energy
sn_swov_2.2.2_deliverable2.2_4 20/03/2007 Page 48

SafetyNet Deliverable 2.2.2 1st classification of the EU member states on RED
Q3.f. Estimation error (systematic, random)
Information:
All (physical) measurements are subject to some inaccuracy or error. In order to use road length data, it is necessary to make an assessment of this error. If anything is known about the error of this methodology, it can be very important for researchers to know, in particular when relatively close numbers need to be judged different or not.
Example: Generally, error comes in two flavours: systematic and non-systematic error. The latter is usually assumed to be random error. Obviously, both types of error are unknown; otherwise the data could be corrected for it. Errors are often caused by compromises needed in the methodology.
? Please specify any calculation you may have of the magnitude of the systematic or random error of your road length data.
Example:We have a calculation of the survey sampling error in our main documentation, see next questionWe have no knowledge of errors
Q3 g. Documentation
? What formal documentation (for example technical reports) on this source of road length information is available to the SafetyNet consortium and how it is accessible?
Example:Our annual report can be found at this internet location: www.statinfo.xx/anreport. A technical document is also available at that location: www.statinfo.xx/technot. It describes the technical issues about the used methodology
Q3 h. Comments
? If you have comments regarding the questions about the methodology, or if you want to comment your answers, please use the space below.
Project co-financed by the European Commission, Directorate-General Transport and Energy
sn_swov_2.2.2_deliverable2.2_4 20/03/2007 Page 49

SafetyNet Deliverable 2.2.2 1st classification of the EU member states on RED
Annex 2
Project co-financed by the European Commission, Directorate-General Transport and Energy
sn_swov_2.2.2_deliverable2.2_4 20/03/2007 Page 50