Building a hierarchical tree of erythro-myeloid progenitor (EMP)
184
HAL Id: tel-03241576 https://tel.archives-ouvertes.fr/tel-03241576 Submitted on 28 May 2021 HAL is a multi-disciplinary open access archive for the deposit and dissemination of sci- entific research documents, whether they are pub- lished or not. The documents may come from teaching and research institutions in France or abroad, or from public or private research centers. L’archive ouverte pluridisciplinaire HAL, est destinée au dépôt et à la diffusion de documents scientifiques de niveau recherche, publiés ou non, émanant des établissements d’enseignement et de recherche français ou étrangers, des laboratoires publics ou privés. Building a hierarchical tree of erythro-myeloid progenitor (EMP)-derived haematopoiesis Lorea Iturri Torrea To cite this version: Lorea Iturri Torrea. Building a hierarchical tree of erythro-myeloid progenitor (EMP)-derived haematopoiesis. Immunology. Sorbonne Université, 2020. English. NNT : 2020SORUS108. tel- 03241576
-
Upload
khangminh22 -
Category
Documents
-
view
0 -
download
0
Transcript of Building a hierarchical tree of erythro-myeloid progenitor (EMP)

HAL Id: tel-03241576https://tel.archives-ouvertes.fr/tel-03241576
Submitted on 28 May 2021
HAL is a multi-disciplinary open accessarchive for the deposit and dissemination of sci-entific research documents, whether they are pub-lished or not. The documents may come fromteaching and research institutions in France orabroad, or from public or private research centers.
L’archive ouverte pluridisciplinaire HAL, estdestinée au dépôt et à la diffusion de documentsscientifiques de niveau recherche, publiés ou non,émanant des établissements d’enseignement et derecherche français ou étrangers, des laboratoirespublics ou privés.
Building a hierarchical tree of erythro-myeloidprogenitor (EMP)-derived haematopoiesis
Lorea Iturri Torrea
To cite this version:Lorea Iturri Torrea. Building a hierarchical tree of erythro-myeloid progenitor (EMP)-derivedhaematopoiesis. Immunology. Sorbonne Université, 2020. English. �NNT : 2020SORUS108�. �tel-03241576�

Building a hierarchical tree of erythro-myeloid
progenitor (EMP)-derived haematopoiesis
Doctoral thesis on Immunology,
Ecole doctoral Complexité du Vivant, Sorbonne université
Presented by
Lorea Iturri Torrea
Macrophages and Endothelial Cells,
Department of Stem Cell and Development, Department of Immunology,
Institut Pasteur
Directed by Elisa Gómez Perdiguero
Publicly presented and defended on 13th November 2020
In front of a jury composed of :
Dr Thierry Jaffredo President of the Jury
Dr Berthold Göttgens Reviewer
Dr Elaine Dzierzak Reviewer
Dr James Palis Examiner
Dr Ana Cumano Examiner
Dr Elisa Gómez Perdiguero PhD Supervisor


1
To my parents

2

3
ACKNOWLEDGEMENTS
This PhD study was carried out in 2016-2020 in the team Macrophages and Endothelial
Cells, within the department of Stem Cells and Development and the department of
Immunology at Institut Pasteur in Paris.
First of all, I would like to express my appreciation to each member of my thesis jury
for accepting to be part of this event. I am grateful to Dr. Thierry JAFFREDO to be the president
of my jury, as well as to Dr. Berthold GÖTTGENS and Dr. Elaine DZIERZAK for accepting to
review the manuscript. I’m also thankful to Dr. Ana CUMANO and Dr. James PALIS to accept
to be the examiners.
I owe a deep gratitude to my project supervisor, Dr. Elisa GÓMEZ PERDIGUERO for
giving me the opportunity to work in her team. I’m thankful for her trust and guidance during
these years.
I would also like to thank all the members of the lab for their support during these years.
Specially, I would like to first thank Dr. Javier SÁENZ CORONILLA to help me build some
confidence during the first two years and ending up becoming a true friend. I am very grateful
to Dr. Laina FREYER, without whom the single cell project would not have happened. Thank
you for always being so good-natured and helpful, thank you also for the endless discussions
on populations and populations. I would like to thank Kémy ADÉ and Rebeca PONCE
LANDETE for student support, specially Rebeca for the moral support I needed the last year.
Also, I would like to thank Dr. Yvan LALLEMAND and Pascal DARDENNE for technical help
and for showing me all I know about mice. Finally, I am very grateful to Dr. Anne BITON for
the bioinformatic analysis.

4
I’m also grateful to Dr. Ana CUMANO and her team for the technical help and insightful
discussions, specially to Dr. Ramy ELSAID for showing me techniques that I used throughout
this work.
I am thankful to the members of my two Comité de Suivi de Thèse: Dr. Charles
DURAND, Dr. Philippe HERBOMEL and Dr. Christian VOSSHENRICH for their attendance
and pieces of advice during my thesis.
I would like to thank also the different platforms of Institut Pasteur for allowing me
produce this work: the Cytometry & Biomarkers UTechS Platform, the Animal Facility and the
Pasteur Single Cell Initiative, with special thanks to Dr. Yann LOE MIE and Dr. Baptiste
SAUDEMONT for their help with the MARS-Seq pipeline. I’m also thankful to the ANR and the
Labex REVIVE for fully funding my scholarship for these four years.
I would like to thanks my girls in Paris, Dr. Eva CONDE GARCÍA and Dr. Júlia TORNÉ
CORTADA, for enduring with me these past 6 years and with whom I have shared more than
flat (or two). I would like to thank the rest of my Spanish support team for the healing lunches
in the cantine and the beer hours we have shared in The 25: Cristina FERNÁNDEZ MOLINA,
Anna SEGÚ CRISTINA and MARÍA BENAVENTE DÍAZ.
Por último, me gustaría agradecer inmensamente a mis padres, Antxón ITURRI
GAZTELU y Ana TORREA LARRAMENDI, por haberme empujado siempre hacia delante y
por haberme permitido volar hasta donde estoy. I’m greatly appreciative to Haser SÜTÇU for
taking so good care of me, this thesis would have been much more difficult without you by my
side.

5
LIST OF CONTENTS
ACKNOWLEDGEMENTS ........................................................................................................................ 3
LIST OF CONTENTS ............................................................................................................................... 5
ABBREVIATIONS .................................................................................................................................... 9
INTRODUCTION .................................................................................................................................... 11
1.- Development of the hematopoietic system .................................................................................. 11
The generation of hematopoietic waves during embryonic development .......................................... 12
1.1- First wave (primitive) ................................................................................................................... 14
1.2 Second wave (Yolk sac definitive hematopoiesis) ....................................................................... 16
1.2.1 Erythromyeloid progenitors ................................................................................................... 16
1.2.2 Lymphoid-primed precursors found in the early yolk sac ..................................................... 19
1.3- Third wave (hematopoietic stem cells)........................................................................................ 21
2.- Emergence of EMPs ........................................................................................................................ 24
2.1 Anatomy and development of the yolk sac .................................................................................. 25
2.2 Endothelial to hematopoietic transition ........................................................................................ 29
2.2.1 EHT of hematopoietic stem cells........................................................................................... 29
2.2.2 EHT of erythromyeloid progenitors ....................................................................................... 32
3. EMP-derived hematopoietic lineages............................................................................................. 33
3.1- Erythroid lineages ....................................................................................................................... 35
3.1.1- Red blood cells ..................................................................................................................... 35
Definitive RBC in development................................................................................................... 37
3.1.2- Megakaryocytes ................................................................................................................... 38
Mk in development ..................................................................................................................... 40
3.2- Myeloid lineages ......................................................................................................................... 40
3.2.1- Monocytes ............................................................................................................................ 40
Monocyte subsets....................................................................................................................... 41
Monocyte development .............................................................................................................. 41

6
Monocytes: a precursor for macrophages and dendritic cells ................................................... 42
3.2.2- Resident macrophages ........................................................................................................ 43
Functional diversity of ResMf ..................................................................................................... 44
Developmental origins of resident macrophages ....................................................................... 45
First wave of macrophage production in the yolk sac ................................................................ 45
Second wave of macrophage production in the fetal liver ......................................................... 47
Third wave of macrophage production from the fetal liver and bone marrow............................ 47
3.2.3- Dendritic cells ....................................................................................................................... 48
DC heterogeneity........................................................................................................................ 48
DC development ......................................................................................................................... 49
3.2.4- Granulocytes ........................................................................................................................ 50
Granulocyte heterogeneity ......................................................................................................... 51
Granulocyte development .......................................................................................................... 52
3.2.4- Mast cells ............................................................................................................................. 54
Mast cell development ................................................................................................................ 54
AIMS AND OBJECTIVES ...................................................................................................................... 57
MATERIALS AND METHODS............................................................................................................... 59
Published protocol ............................................................................................................................... 61
RESULTS ............................................................................................................................................... 71
Part 1. Yolk sac. Paper manuscript to be submitted ........................................................................ 71
Part 2. Fetal liver ................................................................................................................................. 119
EMP derived cells in the fetal liver ................................................................................................... 119
Single cell expression analysis of EMP-derived progenitors of the yolk sac and fetal liver ............ 122
DISCUSSION ....................................................................................................................................... 133
1.- Phenotype of yolk sac definitive MEPs ...................................................................................... 133
Csf2rb/CD131 as a marker of early MEP commitment in the yolk sac ........................................ 134
2.- EMP-derived megakaryopoiesis .................................................................................................. 136
3.- Production of macrophages by EMPs ........................................................................................ 138

7
Macrophage cluster in the single cell analysis ............................................................................. 139
4. EMP-derived mast cell production ............................................................................................... 140
Differentiation hierarchy of mast cell progenitors ......................................................................... 141
5. Similarities and differences between EMPs emerging at E8.5 and at E9.5 .............................. 142
Phenotype of bona fide EMPs in the yolk sac .............................................................................. 142
Observation of “early” and “late” emerging EMPs ........................................................................ 143
REFERENCES ..................................................................................................................................... 153
LIST OF FIGURES ............................................................................................................................... 178
LIST OF TABLES ................................................................................................................................ 179
ABSTRACT .......................................................................................................................................... 180
English .............................................................................................................................................. 180
Français ............................................................................................................................................ 180

8

9
ABBREVIATIONS
AGM Aorta-Gonads-Mesonephros
BaP Basophil progenitor
BFU-E Burst Forming Unit-Erythroid
BMP Basophil and Mast cell progenitor
cDC conventional DC
CDP Common Dendritic cell Progenitor
CFC/CFU Colony Forming Cells/Units
CFU-E Colony Forming Unit-Erythroid
cMoP common Monocyte Progenitor
CMP Common Myeloid Progenitors
DC Dendritic Cells
DETC Dendritic Epidermal T Cells
E Embryonic day (mouse development)
EHT Endothelial to Hematopoietic Transition
EMP Erythro-Myeloid Progenitor
EoP Eosinophil Progenitor
FL Fetal Liver
GMP Granulocyte-Monocyte Progenitor
GW Gestational weeks (human development)
HSC Hematopoietic Stem Cell
HSPC Hematopoietic Stem and Progenitor Cells
LTR Long Term Reconstitution

10
MC Mast Cells
MCp Mast Cell progenitor
MDP Monocyte and Dendritic Cell Progenitor
MEP Megakaryocyte and Erythrocyte Progenitor
Mf Macrophages
Mk Megakaryocytes
Mo Monocytes
MPP Multipotent progenitors
NeuP Neutrophil Progenitor
OHT 4-Hydroxy-Tamoxifen
pDC plasmacytoid DC
pSp para-aortic Splanchnopleura
RBC Red Blood Cells
resMf resident Macrophages
TAM Tamoxifen
YS Yolk Sac
11
INTRODUCTION
1.- Development of the hematopoietic system
The hematopoietic system is composed of a variety of blood cells that circulate through
the body and the organs that are involved in their production and maturation: the bone marrow,
spleen, thymus and lymph nodes in adulthood. Blood cells provide the necessary oxygen
supply to the body (erythrocytes), prevent blood loss by clotting (platelets) and defend the host
against internal aberrant cells and external pathogens by generating an immune response
(myeloid and lymphoid cells).
Immune responses can be classified as part of the innate and adaptive immunity.
Innate immune responses are fast, initiated within minutes or hours, and are not specific to
pathogens. They embody a group of proteins and phagocytic cells that recognize conserved
features of pathogens and become quickly activated to help destroy the invaders. Adaptive
immune responses, on the other hand, are highly specific to the particular pathogen and
provide long-lasting protection(Alberts et al., 2002).
Hematopoietic stem cells (HSCs) are responsible for the continuous blood cell
production, a process known as hematopoiesis, while maintaining a pool of self-renewing stem
cells, capable of long-term reconstitution activity. In the adult, hematopoiesis is localized in the
bone marrow, spleen and thymus. However, not all the adult immune cells are produced by
adult HSC.
Several studies to date have identified an additional layer of hematopoietic cells that
are not produced by adult HSC, which includes tissue-resident macrophages and some
lymphocyte subsets such as skin Vγ5+ T cells, also named dendritic epidermal-like T cells
(DETC), and peritoneal B1a B cells(Beaudin et al., 2016; Elsaid et al., 2019). These immune

12
cell subsets are only produced during embryonic life and are maintained in their tissue of
residency by self-renewal, independently of adult bone marrow hematopoiesis. Importantly,
tissue-resident macrophages have further been shown to be able to develop from progenitors
that are independent from HSC yet persist throughout adult life through localized self-renewal
(Ginhoux et al., 2010; Gomez Perdiguero et al., 2015; Schulz et al., 2012). In order to better
understand the respective contribution of HSC-derived and HSC-independent hematopoiesis,
we need to further understand the events that happen in the early embryo and establish the
foundation of the hematopoietic system.
The generation of hematopoietic waves during embryonic development
Groundbreaking studies described the existence of different waves of hematopoietic
progenitor emergence that overlap in embryonic development in different model organisms,
from invertebrates (D. melanogaster)(Evans et al., 2003; Holz et al., 2003), to amphibians
(xenopus)(Ciau-Uitz et al., 2000; Turpen and Smith, 1985; Turpen et al., 1997), teleost fish
(Danio rerio, zebrafish)(Bertrand and Traver, 2009; Davidson and Zon, 2004), avians (chicken,
quail)(Dieterlen-Lievre, 1975; Sabin, 1920) and mammals (mouse and human)(Ivanovs et al.,
2017; McGrath et al., 2015a; Müller et al., 1994; Russell and Seldon E. Bernstein, 1966). In
mammalian embryos, blood cell production is observed in several successive niches: the
extra-embryonic yolk sac, chorio-allantoic placenta, para-aortic splanchnopleura (pSp), aorta-
gonad-mesonephros (AGM) region, fetal liver, spleen and the bone marrow (Dzierzak and
Speck, 2008).
Historically, developmental hematopoiesis was subdivided into two main phases or
waves, an embryonic or primitive wave, comprised of transitory hematopoietic cell populations
located in the yolk sac; and a definitive wave, originating later in development and providing
all mature hematopoietic cell lineages for the lifetime of the organism (Godin and Cumano,
2002). Subsequently, yolk sac hematopoiesis was further subdivided into two independent
primitive and definitive waves, after careful examination of its erythropoietic component(Palis

13
et al., 1999; Wong et al., 1986); reviewed in(Palis and Yoder, 2001). Throughout this chapter,
I will explain the characteristics of each of the three overlapping waves of mammalian
embryonic hematopoiesis: primitive, yolk sac-definitive (EMP) and intraembryonic-definitive
(HSC) hematopoiesis.
Figure 1. Illustration of the three hematopoietic waves during mammal development. A first
transient primitive wave of progenitors emerges in the yolk sac at E7-7.5. The second wave of
progenitors is composed of EMPs, that are found in the yolk sac and the fetal liver, and whose timing of
exhaustion is still debated. Finally, HSCs take over fetal liver hematopoiesis and migrate to the bone
marrow, where they will continue during adulthood. Progenitor numbers are represented by height of
the peak. Approximate human hematopoietic timeline compared to mice from (Ivanovs et al., 2017;
Mikkola and Orkin, 2006).

14
1.1- First wave (primitive)
Studies conducted in the beginning of the century observed that early mammalian
embryos have specific blood cells compared to mid-late embryos (fetal liver) or adults (bone
marrow). The concept of primitive hematopoiesis was intimately associated with the
observation of nucleated erythropoiesis in young mammalian embryos that resemble those of
birds, fish, reptiles, and amphibians (Gulliver, 1875; Migliaccio et al., 1986; Sabin, 1920). Also,
macrophages had been observed with electron microscopy in the yolk sac starting from E9,
thus before the appearance of monocytes or promonocytes (Enzan, 1986; Takahashi et al.,
1989).
The first active hematopoietic site is located in the yolk sac, an extra-embryonic organ.
The yolk sac (YS) produces clonogenic myeloid and erythroid progenitors that fail to long-term
repopulate irradiated recipients (Dieterlen-Lievre, 1975; Lassila et al., 1978; Medvinsky and
Dzierzak, 1996; Moore and Metcalf, 1970). Primitive monopotent precursors of erythrocytes,
megakaryocytes and macrophages mature faster than their adult counterparts and are
independent of the transcription factor Runx1, necessary for definitive hematopoietic
emergence (Chen et al., 2009; Palis et al., 1999; Potts et al., 2014). This wave is characterized
to emerge directly from the YS mesoderm and not through an endothelial intermediate like the
following definitive waves. Importantly, targeted disruption of genes involved in primitive
hematopoiesis regulation, such as Scl/Tal1, Gata1 or Lmo2, causes embryonic death as early
as E10.5, which highlight the importance of this wave to sustain early embryo growth (Fujiwara
et al., 1996; Robb et al., 1995; Shivdasanl et al., 1995; Warren et al., 1994).
Primitive erythroid cells emerge in the yolk sac soon after gastrulation, at E7.5-8 in the
mouse(Silver and Palis, 1997) and 18–19 days of gestation in humans(Bloom and Bartelmez,
1940; Luckett, 1978), and mature semi-synchronously in the bloodstream. Primitive erythroid
precursors are also called EryP-CFC (CFC, colony forming cells) since they produce
characteristic compact colonies of large erythroid cells in culture. EryP-CFC expand for 48

15
hours in the yolk sac and are rapidly extinguished by E9 (Palis et al., 1999). Primitive red
blood cells can be distinguished from their definitive counterparts by their larger size and
nuclei, as well as the expression of embryonic globins like the εγ- and βH1-globin genes in
mouse (ε- and γ-globin genes in human)(Kingsley et al., 2006; Stamatoyannopoulos, 2005).
At E12.5, primitive erythroid precursors cease dividing in the bloodstream and are rapidly
substituted by the first definitive red blood cells released from the liver that quickly become the
predominant cell type in circulation. Between E12.5 and E16.5 definitive red blood cells have
been shown to enucleate and can remain in circulation several days (at least 5-7) after their
enucleation (Fraser et al., 2007; Kingsley et al., 2004). Despite their dilution by definitive red
blood cells, primitive erythrocytes can still be detected after birth in mice(Fraser et al., 2007;
Kingsley et al., 2004).
Most platelets found before E10.5 are of maternal origin (Potts et al., 2014) and a few
maternal-derived macrophages are transiently detected at E7.5-8. Both megakaryocyte and
macrophage embryonic precursors emerge in the yolk sac at E7.5 (Palis et al., 1999). The first
megakaryocytes of the yolk sac are observed at E8.5 and they form platelets by E10.5 (Potts
et al., 2014). These primitive Mk are characterized by a faster rate of platelet production and
lower ploidy (2-8N) (Palis et al., 1999; Tober et al., 2007; Xu et al., 2001). They are shown to
be small, Runx1-independent, megakaryocytes that generate platelets very fast and have
limited capacity to endoreplicate (Potts et al., 2014; Tober et al., 2007; Xu et al., 2001).
As for primitive macrophages, they have been observed in the vascular lumen of the
yolk sac from E9.0, before the appearance of monocytes, and characterized by an expression
of F4/80 and an immature phenotype of a round shape, a euchromatic nucleus with large
nucleoli, poorly developed Golgi apparatus, few intracytoplasmic organelles, abundant
polyribosomes, and the absence of peroxidase activity (Naito et al., 1989, 1996; Takahashi et
al., 1989). Few monopotent macrophage precursors (2-9) have been observed in the E7.5 yolk
sac, and their number rises to 100 precursors by E8.5 (Palis et al., 1999).

16
Nevertheless, it is still challenging to separate primitive macrophages and
megakaryocytes from their definitive counterparts that arise in the definitive waves. We
currently lack tools to perform specific genetic labelling to trace primitive megakaryocytes or
macrophages separately from those derived later. Indeed, although primitive cells do not
undergo an endothelial to hematopoietic transition (EHT, discussed later), EHT genes can be
expressed throughout their development or maturation, as evidenced by the labelling of
primitive erythroblasts using fate mapping approaches based on endothelial or EHT genes
such as Tie2/Tek and Runx1(Samokhvalov et al., 2007; Stefanska et al., 2017; Tang et al.,
2010). Indeed, Runx1-deficiency leads to lack of primitive macrophages(Lacaud et al., 2002),
defective maturation of primitive erythrocytes (Yokomizo et al., 2008) and decreased number
of primitive diploid megakaryocytes (Potts et al., 2014). We thus have a very limited
understanding of the spatiotemporal pattern and functional contribution of primitive
macrophages and megakaryocytes to development.
1.2 Second wave (Yolk sac definitive hematopoiesis)
1.2.1 Erythromyeloid progenitors
Colony forming assays demonstrated that a second wave of multipotent progenitors
appeared at E8.25, containing definitive erythroid progenitors (BFU-E and CFU-E colonies)
and multipotent myeloid progenitors (macrophage colonies were associated with mixed
granulocyte, monocyte and mast cell colonies) (Palis et al., 1999). YS definitive progenitors
were characterized as highly proliferative potential colony-forming cells (HPP-CFC) that give
rise to macroscopic colonies when cultured in vitro (Palis et al., 2001). Such progenitors were
named erythromyeloid progenitors (EMPs) as they have the potential to give rise to definitive
hematopoietic cells from both the erythroid and myeloid lineages (Bertrand et al., 2007; Gomez
Perdiguero et al., 2015; McGrath et al., 2015a). While EMPs are a transient population of
progenitors, rescue experiments following the disruption of a Runx1 binding partner, Cfbβ, showed
that they are required for fetal survival (Chen et al., 2011). Indeed, the first definitive erythrocytes
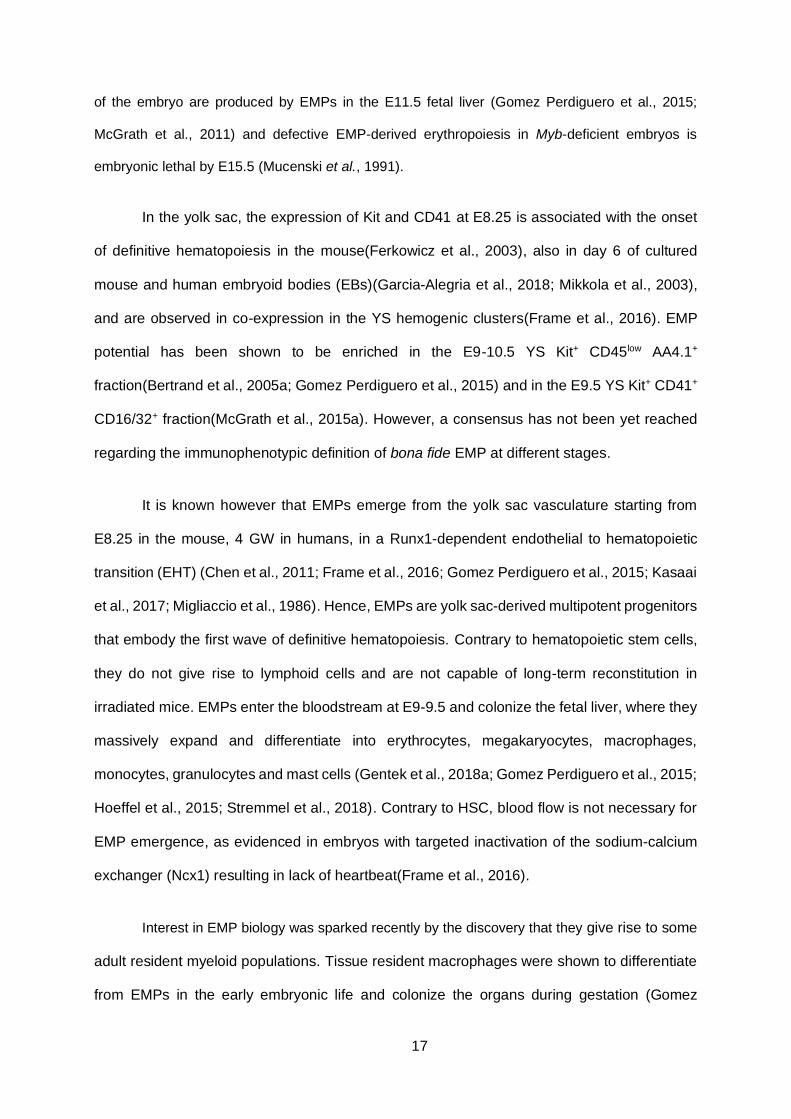
17
of the embryo are produced by EMPs in the E11.5 fetal liver (Gomez Perdiguero et al., 2015;
McGrath et al., 2011) and defective EMP-derived erythropoiesis in Myb-deficient embryos is
embryonic lethal by E15.5 (Mucenski et al., 1991).
In the yolk sac, the expression of Kit and CD41 at E8.25 is associated with the onset
of definitive hematopoiesis in the mouse(Ferkowicz et al., 2003), also in day 6 of cultured
mouse and human embryoid bodies (EBs)(Garcia-Alegria et al., 2018; Mikkola et al., 2003),
and are observed in co-expression in the YS hemogenic clusters(Frame et al., 2016). EMP
potential has been shown to be enriched in the E9-10.5 YS Kit+ CD45low AA4.1+
fraction(Bertrand et al., 2005a; Gomez Perdiguero et al., 2015) and in the E9.5 YS Kit+ CD41+
CD16/32+ fraction(McGrath et al., 2015a). However, a consensus has not been yet reached
regarding the immunophenotypic definition of bona fide EMP at different stages.
It is known however that EMPs emerge from the yolk sac vasculature starting from
E8.25 in the mouse, 4 GW in humans, in a Runx1-dependent endothelial to hematopoietic
transition (EHT) (Chen et al., 2011; Frame et al., 2016; Gomez Perdiguero et al., 2015; Kasaai
et al., 2017; Migliaccio et al., 1986). Hence, EMPs are yolk sac-derived multipotent progenitors
that embody the first wave of definitive hematopoiesis. Contrary to hematopoietic stem cells,
they do not give rise to lymphoid cells and are not capable of long-term reconstitution in
irradiated mice. EMPs enter the bloodstream at E9-9.5 and colonize the fetal liver, where they
massively expand and differentiate into erythrocytes, megakaryocytes, macrophages,
monocytes, granulocytes and mast cells (Gentek et al., 2018a; Gomez Perdiguero et al., 2015;
Hoeffel et al., 2015; Stremmel et al., 2018). Contrary to HSC, blood flow is not necessary for
EMP emergence, as evidenced in embryos with targeted inactivation of the sodium-calcium
exchanger (Ncx1) resulting in lack of heartbeat(Frame et al., 2016).
Interest in EMP biology was sparked recently by the discovery that they give rise to some
adult resident myeloid populations. Tissue resident macrophages were shown to differentiate
from EMPs in the early embryonic life and colonize the organs during gestation (Gomez

18
Perdiguero et al., 2015; Hoeffel et al., 2015). Further, these macrophages are not dependent
on bone marrow HSC in steady state and self-maintain by local proliferation (Ajami et al., 2007;
Bouwens et al., 1986; Chorro et al., 2009; Ghigo et al., 2013; Hashimoto et al., 2013; Jenkins
et al., 2011; Yona et al., 2013). Similarly, EMP have also been proposed to give rise to adult
mast cells in specific niches (Gentek et al., 2018a; Li et al., 2018).
Although it is now established from a variety of complementary studies that EMP
differentiate into tissue resident macrophages, the extent of their contribution remains currently
unclear. The gold standard to investigate ontogeny is through genetic fate mapping, but the
temporal overlap with other hematopoietic waves and shared expression of genes used for
Cre-driven strategies (Runx1, Csf1r, Tie2, Kit and Cdh5) makes it difficult to make definitive
conclusions on the subject. Also, inducible Cre-driven labelling rarely reaches saturation
(100%), which hinders the interpretation of results. It is proposed that the embryonic EMP
contribution to adult pools depends on the niche availability and/or postnatal modifications,
microglia being mostly constituted of embryonic self-renewing cells (Ginhoux et al., 2010;
Gomez Perdiguero et al., 2015; Kierdorf et al., 2013) while lamina propria macrophages shift
to adult HSC-derived origin during weaning (Bain et al., 2014).
It is tempting to hypothesize that EMP-like progenitor cells are present in the bone
marrow in a quiescent state. A rare embryonic-like population of cells (Very Small Embryonic-
Like Stem Cells, VSELs) have been identified in the adult bone marrow with the potential to
regenerate damaged tissues and there seems to be an “EMP-like program” in the BM upon
critical regeneration (Faltusová et al., 2020; Kucia et al., 2006). However, there is so far no
evidence that VSELs are responsible for that program or that they are linked to bona fide
embryonic EMPs. The current most reliable method to identify embryonic population progeny
in the adult remains in utero genetic fate-mapping, which has failed to demonstrate any
contribution of EMPs to adult bone marrow progenitor populations.

19
1.2.2 Lymphoid-primed precursors found in the early yolk sac
The discovery of lymphoid potential in the yolk sac at E9 raised the possibility that
lymphoid precursors emerge in the yolk sac independently of hematopoietic stem cells(Liu and
Auerbach, 1991; Yoder et al., 1997). Some lymphoid cells are tissue residents and self-
maintain locally in the tissues by self-renewal, such as peritoneal B-1a B cells(Haas et al.,
2005), skin γδT cells(Jameson et al., 2004; Payer et al., 1991) and lymphoid tissue inducer
(LTi) cells, a subset of group 3 innate lymphoid cells (ILC3), in both lymphoid and non-lymphoid
organs(Gasteiger et al., 2015). It has been suggested that these cells derive in fact from yolk
sac-derived lymphoid-primed multipotent progenitors that emerge before definitive HSCs can
be detected (Böiers et al., 2013; Yoshimoto et al., 2011). These studies have shown that a
distinct lymphoid-primed progenitor population in the yolk sac, co-expressing classical
lymphoid (Rag1 and Il7r) and myeloid-associated genes, contribute to fetal lymphocytes and
myeloid cells (but not to tissue resident macrophages). A subsequent study proposed that such
progenitors give rise to epidermal γδ T cells (Gentek et al., 2018b) but this interpretation is not
supported by another recent study, that claims their origin is, in fact, in embryonic HSC(Elsaid
et al., 2019).
This population is distinct from EMP since it has been demonstrated that EMPs emerge
prior to E9 and do not give rise to lymphocytes (Gomez Perdiguero et al., 2015; McGrath et
al., 2015a). Additionally, B-lymphocyte potential prior to E9.5 is only found in the CD41
negative population of yolk sac cells, which is a key marker of EMPs at that stage (Yoshimoto
et al., 2011).
It has not yet formally been proven whether these lymphoid-primed multipotent
progenitors are generated in situ in the YS or if they are HSC-independent, as cells can reach
the yolk sac through circulation at these stages. Indeed, lymphoid precursors appear inside
the embryo proper earlier than they do in the yolk sac (Cumano et al., 1996; Godin et al., 1993;
Tavian et al., 2001). Definitive LTR-HSC activity has been found in the AGM region at a time
20
slightly earlier than in the yolk sac and fetal liver (Cumano et al., 2001; Müller et al., 1994). It
is also important to bear in mind that HSCs that emerge in the major arteries by E9.5 lack long
term reconstitution capacity in vivo (thus named pre-HSC), but acquire it after culture (Cumano
et al., 1996; Medvinsky and Dzierzak, 1996), which was not tested in the Yoshimoto and Böiers
studies. It is thus not excluded that such lymphoid progenitors are in fact pre-HSC or
multipotent progenitors generated from the earliest HSC.
The concept that some lymphoid-producing HSCs could be generated from yolk sac
clusters was also claimed by a study that showed up to 10% of labelling of adult HSC when
tamoxifen was administered at E7.5 in Runx1MerCreMer embryos (Samokhvalov et al., 2007).
However, the administration of tamoxifen (TAM) instead of the active form 4-hydroxy-tamoxifen
(OHT) could lead to labelling of Runx1+ cells beyond E8.5. This distinction is key in lineage-
tracing studies analysing such close-by events and is related to the pharmacological kinetics
of tamoxifen in inducible Cre-lox strains. In those, a fusion gene is created between a bacterial
Cre recombinase and the ligand binding domain of modified estrogen receptors (ER or Mer),
which prevents the translocation of the produced protein into the nucleus(Metzger et al., 1995;
Zhang et al., 1996). When TAM is administered, the reagent is metabolized by the liver into
OHT, its active metabolite form with high binding affinity for estrogen receptor. OHT binds to
the estrogen receptors, allowing translocation to the nucleus and initiation of Cre-mediated
recombination. Administration of OHT by intraperitoneal injection ensures therefore a tighter
temporal control of gene recombination events at the time of the injection.
Since the number of lymphoid precursors in the yolk sac at E9.5 and E10.5 is very
small compared to the thousands of EMPs at that moment (Böiers et al., 2013; Gomez
Perdiguero et al., 2015; Palis et al., 1999; Yoder et al., 1997; Yoshimoto et al., 2011) and their
origin is still debated, we will consequently refer exclusively to EMP-derived hematopoiesis
when discussing definitive yolk sac-hematopoiesis.

21
1.3- Third wave (hematopoietic stem cells)
Hematopoietic stem cells (HSC) are characterized by two main properties:
multipotency and self-renewal. They are multipotent stem cells that can give rise to
hematopoietic cells from the erythroid, myeloid and lymphoid lineages. They are also able to
maintain an HSC pool by self-renewal, as assessed by the capacity of a single cell to
reconstitute the hematopoietic system of an irradiated mouse in long term reconstitution (LTR)
experiments.
Pioneering work in the 70s (Françoise Dieterlen-Lievre, 1975) demonstrated that the
embryo proper, not the yolk sac, is the only source of HSC in the avian species, this was later
proven true in mice(Cumano et al., 2001; Medvinsky and Dzierzak, 1996; Müller et al., 1994)
and humans(Ivanovs et al., 2011; Tavian et al., 2001). The aorta has been shown to contain
progenitor cells with erythroid, myeloid and lymphoid activity as early as E8(Cumano et al.,
1996) and intra-aortic clusters can be observed from E9 up until E14 in the pSp, the AGM
region and other major vessels (De Bruijn et al., 2002; Garcia-Porrero et al., 1995; Yokomizo
and Dzierzak, 2010), also in a Runx1-dependent manner(Cai et al., 2000; North et al., 1999,
2002). The peak of cluster formation has been observed at E10.5, at the time in which cells
with HSC capacity are first detected, and the largest clusters are found in the vitelline and
umbilical artery, which connect the embryo with the yolk sac and placenta,
respectively(Yokomizo and Dzierzak, 2010). Of note, human aortic clusters have been
observed at 5-6 GW(Tavian et al., 1996). It is thought that little hematopoietic differentiation
occurs locally (Godin et al., 1999; Kieusseian et al., 2012). HSC start to colonize the fetal liver
from E10.5, where they mature, expand and ultimately give rise to myeloid, erythroid and
lymphoid cells (Godin et al., 1999; Kieusseian et al., 2012).
HSCs dramatically expand in the fetal liver from E11.5 to E15.5, where they begin to
establish an adult-like hierarchy of an expanding pool of multipotent progenitors (Ikuta et al.,
1990; Morrison et al., 1995a). The fetal liver is the principal site of mid- and late-gestation
22
hematopoiesis in mice, and the shift towards bone marrow hematopoiesis is due to changes
in the local hematopoietic microenvironment initiated by embryonic organogenesis (Mikkola
and Orkin, 2006). The migration to the fetal bone marrow is essentially a progressive process
that initiates at E16.5 and is finalized when the fetal liver hematopoiesis ceases at 2-4 days
after birth (Christensen et al., 2004; Coşkun et al., 2014; Sasaki and Sonoda, 2000; Wolber et
al., 2002). In humans, on the contrary, the fetal bone marrow starts to be colonized already at
the end of the first trimester, at 10-11 GW, and becomes a second major location for
hematopoiesis in the fetus during the second trimester, at 20-22 GW. Human fetal liver
hematopoiesis is thought to decline in the third trimester and to cease soon after birth
(Charbord et al., 1996; Golfier et al., 2000; Migliaccio et al., 1986). The difficulty to access mid
and late gestation human tissues and the definition of HSC by their ability to LTR in irradiated
hosts hampers the study of this key stage in humans, so most of our current understanding of
late hematopoietic development comes from studies in the mouse. Although early ontogeny is
largely conserved among mammals, it is thus important to keep in mind that midgestation
hematopoietic events could differ, as does the onset of bone marrow hematopoiesis, between
human and mouse.
HSC in the adult bone marrow perform differently than in the embryo. Indeed, adult
HSC are quiescent cells that rarely enter the G1 stage of the cell cycle (Passegué et al., 2005).
On the contrary, HSCs in the fetal liver are actively cycling and are more efficiently transplanted
into irradiated mice, suggesting cell-intrinsic differences between HSCs in the fetus and adult
bone marrow (Harrison et al., 1997; Morrison et al., 1995b; Rebel et al., 1996). Cell surface
markers are also differently expressed in embryonic HSCs. Adult bone marrow HSC are
defined by the lack of surface expression of lineage-specific markers and expression of Sca-1
and c-Kit (LSK population), they also downregulate CD34 expression by 10 weeks after birth
(Ogawa et al., 2001). Conversely, embryonic HSC express lower levels of Sca-1 in the surface
until E12.5, CD93/AA4.1 (an endothelial or B cell marker), VE-Cadherin (endothelial marker)
and 50% are expressing Mac-1/CD11b (a myeloid marker)(Bertrand et al., 2005a; De Bruijn et

23
al., 2002; Sánchez et al., 1996). It is not known whether these molecules play a role in the
behaviour of HSC during fetal life or if they are involved in their high expansion rate.
Primitive Yolk-sac definitive Embryo definitive
Potential Monopotent
(E or Mk or Mf)
Multipotent
(E/Mk-My)
Multipotent
(E/Mk-My-Ly)
Time of emergence E7.5-8.5 (?) E8.25-E11.5 E9.5-E12.5
Niche of emergence Yolk Sac Yolk Sac Embryo proper
EHT No Yes (vasculature) Yes (arteries)
Globins in mice ζ, βH1, εγ, α1, α2, β1 and β2
βH1(low), α1, α2, β1 and β2
α1, α2, β1 and β2
Fate mapping strategies
Bh1-GFP
(only for erythrocytes)
Csf1rMiCM
OHT E8.5-9.5
Csf1rMiCM
OHT E10.5
Cdh5CreERT2
OHT E7.5
Cdh5CreERT2
OHT E10.5
Runx1MCM
OHT E7.5
Runx1MCM
OHT E8.5-9.5
KitMiCM
OHT E7.5(?)
KitMiCM
OHT E7.5-8.5
KitMiCM
OHT 8.5-9.5
Tie2MCM
OHT E7.5(?)
Tie2MCM
OHT E7.5-E8.5
Tie2MCM
OHT E10.5
VavCre

24
Table 1. Summary of main characteristics of the three hematopoietic waves. MCM, MerCreMer;
MiCM, MeriCreMer; OHT, 4-hydroxytamoxifen; ?, supposition, data available does not allow to define.
The fate-mapping strategies that can label each wave are extensively explained in (Gentek et al.,
2018a; Höfer et al., 2016; McGrath et al., 2015b; Stefanska et al., 2017)
Interestingly, studies on induced pluripotent stem cells (iPSC) and embryonic stem
(ES) cells have further confirmed the emergence of overlapping waves of hematopoiesis. ES
cells generate first unipotent primitive colonies —macrophage, erythroid and megakaryocyte—
and secondly definitive colonies associated to endothelium —GM-CFC, BFU-E, mast cells and
a second wave of megakaryocytes— (Fujimoto et al., 2003; Hadland et al., 2004; Irion et al.,
2010; Kennedy et al., 2007; Zambidis et al., 2005). Additionally, murine ES cells grown as EBs
can generate a population of immunophenotypic EMPs (Kit+ CD41+ CD16/32+) with similar
potential than in vivo (McGrath et al., 2015a) and without long-term reconstitution capacity.
The mechanisms for which yolk sac but not AGM hematopoiesis can be mimicked in ES and
iPS cells remain elusive to this day and need to be further investigated (Batta et al., 2014;
Lacaud and Kouskoff, 2017).
2.- Emergence of EMPs
Central to the field of embryonic hematopoiesis is the generation of definitive
progenitors from endothelial precursors. It is now well established from a variety of studies in
several vertebrate model organisms that EMPs form hematopoietic cell clusters attached to
the vessel walls of the yolk sac, in a manner similar to HSCs(Chen et al., 2011; Frame et al.,
2016; Kasaai et al., 2017; Palis and Yoder, 2001). While the process of HSC emergence has
been extensively studied in the last decades, especially in the dorsal aorta, less is known about
the inherent mechanisms of EMP emergence. The understanding of their production is
fundamental to understand EMP biology and could explain intrinsic differences between the
two lineages.

25
This chapter provides an overview of the current knowledge on EMP emergence,
starting by introducing the anatomy of the yolk sac and following with the key aspects of the
process.
2.1 Anatomy and development of the yolk sac
Although the mammalian ovum contains virtually no yolk, its development is
homologous to avians and reptilians whose yolk is abundant, and the yolk sac constitutes an
important nutritive organ in small rodents, exercising both absorptive and secretory functions
(Snell and Stevens, 1966; Wislocki et al., 1946). It is also the niche of origin of the first
hematopoietic cells of the embryo.
The yolk sac (YS) is a splanchnopleuric organ composed of a double cell layer formed
by extraembryonic mesoderm and endoderm. The endoderm of the yolk sac is an villous
epithelium that absorbs and digests maternal blood-derived macromolecules (Jollie, 1990), a
function later assumed by the definitive endoderm-derived gut and liver, while the adjacent
mesoderm cells produce the first vasculature and blood cells of the embryo. It has long been
accepted that he association of these structures, an absorption machinery coupled to a
capillary network, makes the yolk sac an organ of fetal-mother exchange prior to the formation
of the allantoic placenta (Everett, 1935).
The formation of the yolk sac begins during gastrulation at E6.5-7 of murine
development when the primitive streak generates a layer of extraembryonic mesodermal cells
under the visceral endoderm. At E7.5, the yolk sac is a limited structure forming the central
portion of the egg cylinder, but it rapidly expands and form an extensive band enveloping the
amnion and the exocoelomic cavity of the ovoid egg. The yolk sac vasculature arises from
extraembryonic mesoderm and is initially composed of two sequential and independent
vasculogenesis events that are then inter-twined, the development of blood islands (clusters

26
of primitive erythroblasts surrounded by an endothelial covering) and the formation of the
vascular plexus.
Figure 2. Illustrations of murine yolk sacs after gastrulation. (A) At E7.5, the yolk sac is located
proximal to the embryo, few endothelial precursors are sparse throughout the yolk sac. (B) At E8.5,
endothelial cells fuse into a honeycomb-like vascular plexus, the blood islands surround the proximal
yolk sac. (C) Close up of a E7.5 mesodermal mass. Erythroid precursors expand in the mesoderm
forming cell masses that will turn into blood islands. (D) Close up of E8.5 blood islands. Morphologically
distinguishable erythroblasts are surrounded by a layer of endothelial cells that connects them with the
developing vasculature. EMPs start to emerge both inside the blood islands and in the proximal part of
the yolk sac. Inspired from (Ferkowicz and Yoder, 2005).

27
Blood island precursors are morphologically evident in the yolk sac mesoderm from the
time of its formation, at E7-7.5, as proliferative masses that express Scl/Tal1 and low levels of
Flk1 (also known as Vegfr2) (Drake and Fleming, 2000; Palis, 2006). Angioblasts coexpressing
Tal1 and high levels of Flk1 are visible at E7.5-8 throughout the yolk sac surrounding blood
clusters, but not in the embryo proper. At E8, the process of yolk sac vasculogenesis is initiated
in the proximal part of the yolk sac where angioblasts fuse and begin forming a vascular plexus
that extends towards the blood islands until both entities merge around E8.25, when the
primitive heart begins pumping (Lopez et al., 2015). By E8.5, the mesodermal cell masses
have turned into morphologically distinguishable red blood cells that do not express Flk1 and
are surrounded by an endothelium (Palis, 2006).
Morphogenesis of the vascular plexus vessels follows a sequential pattern of gene
expression in which Tal1/Scl and Flk1 are coexpressed first, then Pecam-1 (CD31), CD34,
Cdh5 (VE-Cad) and later Tie2. Tal1 is later downregulated as part of the endothelial cell
maturation(Drake and Fleming, 2000). When the blood circulation is established, the yolk sac
vasculature starts to remodel into a hierarchical network of branched vessels until E9.5 (Lucitti
et al., 2007; Udan et al., 2013).
The release of erythroblasts increases the viscosity of blood flow, producing a
hemodynamic force that is necessary to induce vasculature remodelling, and arterial
specification in particular. This proved evident in Mlc2a-deficient embryos with impaired heart
contractility (Flamme et al., 1997; Lucitti et al., 2007), in which plasma pumped by the heart
was responsible for the release of erythroblasts and allowed them to promote yolk sac
remodelling. Arterial specification can be observed at this stage by change of morphology and
the expression of nuclear Sox17(Corada et al., 2013). Live hemodynamic analysis with doppler
OCT indicates a robust blood velocity in the yolk sac vessels of 1-3mm/s on the different
phases of the heartbeat cycle, although slower than in the dorsal aorta, where the velocity
reaches 1-8mm/s (Garcia et al., 2015).

28
Figure 3. Illustration of E9.5 murine embryo. The embryo has turned and is contained inside the yolk
sac. Arterial specification has occurred and the vitelline artery receives the circulation from the embryo.
In the close up, numerous hemogenic clusters containing EMPs are emerging from both the arterial and
venous vasculature.
Meanwhile, between E8.5 and E9, the mouse embryo turns and is enveloped by the
yolk sac together with the amnion, remaining connected to the yolk sac the walls of the midgut
enclosing the vitelline artery and vein. From E9.5 onwards, the vessel remodelling is finished
and hematopoietic cell clusters are visible in the vessel walls of both the arterial and venous
side(Frame et al., 2016). The process of mouse embryo turning is very different from other
mammals like the human, in which the embryo is enveloped only by the amnion while the yolk
sac is displaced alongside and then absorbed after 8 GW. If the yolk sac and the vitelline duct
are not properly absorbed (in non-murine species) they cause an intestinal anomaly called
Meckel’s diverticulum(Downard et al., 2004). After E11.5, the murine yolk sac is no longer
hematopoietic (Frame et al., 2016) but it is not discarded until birth, its sole function is thought
to be the physical protection of the fetus.
29
2.2 Endothelial to hematopoietic transition
Extensive research has focused on the generation of hematopoietic stem/progenitor
cells (HSPCs) from endothelial cells lining the major arteries of the vertebrate embryo in a
process termed endothelial to hematopoietic transition (EHT). EHT consists of a switch in cell
morphology and the break of tight junctions with neighbouring cells, generating characteristic
clusters of cells attached to the vessel walls (De Bruijn et al., 2002; Jaffredo et al., 1998; Kissa
and Herbomel, 2010; Oberlin et al., 2002).
2.2.1 EHT of hematopoietic stem cells
The specification of hemogenic endothelium in the embryonic aorta is a process
extensively studied that depends on the transcriptional network of Runx1, both Notch and Wnt
signaling pathways, blood flow and inflammatory signals. Embryos deficient for Runx1 lack
hematopoietic clusters, HSCs and definitive progenitor cells (Cai et al., 2000; North et al.,
1999; Okuda et al., 1996). Runx1 is considered to be the master regulator of the onset of EHT,
as it is in charge of reorganizing transcription factors to regulate the fate decision of endothelial
cells and is therefore key for the process (Lichtinger et al., 2012; Narula et al., 2013; Yzaguirre
et al., 2017).
Both Notch and Wnt/β-catenin signalling pathways are activated during aortic EHT
(Bigas et al., 2013). While several Notch proteins are expressed during HSC emergence,
Notch1 has been shown to be located specifically in the nucleus of endothelial cells of the
dorsal aorta and cells of the clusters, and it was proven key to promote aortic specification and
HSC emergence, together with Gata2 (Kumano et al., 2003; Robert-Moreno et al., 2005,
2008). On the other hand, canonical Wnt/β-catenin signaling pathway has also been proven
to be fundamental to the process. β-catenin can also be observed in the nucleus of the cells
in the aortic endothelium and seems to be involved in arterial specification via Notch (Corada
et al., 2010; Ruiz-Herguido et al., 2012). Other transcription factors involved in the Wnt

30
signaling pathway are regulated in the process, for instance, the downregulation of Sox17
maintains arterial identity and prevents commitment into HSC (Corada et al., 2013). In addition
Wnt signaling is implicated in cell-cell junctions, which are remodelled during EHT as observed
by live imaging (Bertrand et al., 2010; Boisset et al., 2010; Lancino et al., 2018).
Key studies demonstrated that blood flow is also required for hemogenic cluster
formation as a result of hemodynamic forces and nitric oxide signaling, which ultimately
regulates Runx1 expression(Adamo et al., 2009; North et al., 2009). Higher nitric oxide
concentrations increased HSC numbers by increasing blood flow, while lower concentrations
impeded cluster generation. Finally, recent studies have similarly found that pro-inflammatory
signals such as tumor necrosis factor (TNF) and interferons (IFNs) could enhance HSC
emergence in the zebrafish and mouse aorta. It is proposed that those signals are provided
by yolk sac-macrophages (Espín-Palazón et al., 2014; Li et al., 2014b; Mariani et al., 2019;
Sawamiphak et al., 2014).
Whether HSC are generated from putative hemogenic endothelial cells or they acquire
endothelial markers when they are emerging from the underlying tissue has been debated for
the past few decades. Since Runx1 is expressed in mesenchymal cells underlying the
endothelial layer of the aorta, which are not labelled with VE-Cad and that have some HSC
activity, it has been suggested that hematopoietic progenitors emerge from those
mesenchymal cells (North et al., 2002) or from subaortic patches expressing Gata2 and
CD93/AA4.1 (Bertrand et al., 2005a). This could also be explained by an egress into the lumen,
which has been observed In avian and fish embryos. In chick embryos, the ability to uptake
acetylated low-density lipoprotein (AcLDL) by endothelial cells has been used for lineage
tracing, and labelled cells have been found in the underlaying mesenchyme of the aorta,
suggesting that endothelial cells could ingress into the tissue (Jaffredo et al., 2000). In
zebrafish embryos, live imaging showed that EHT does not release the HSC into the vascular
lumen but into the underlying mesenchyme(Bertrand et al., 2010; Kissa and Herbomel, 2010).

31
Maturation steps have been identified inside intra-aortic clusters expressing Runx1,
Pecam-1, Kit and Ly6a/Sca-1(De Bruijn et al., 2002; Yokomizo and Dzierzak, 2010). Flow
cytometry and cell sorting allowed the characterization of the different stages of cell maturation
starting from immature HSCs to fully matured HSC with reconstitution potential: from pro-HSC
(VE-Cad+ CD41lo), to pre-HSC I (VE-Cad+ CD41lo CD43+), to pre-HSC II (VE-cad+ CD41lo
CD43+ CD45+) to HSC (or dHSC) (Rybtsov et al., 2011; Taoudi et al., 2008). Recently, scRNA-
seq analysis studies have further supported the notion of a hemogenic endothelium and have
allowed to further dissect the steps of HSC maturation inside the clusters, providing markers
for arterial cell specification programs (Neurl3(Hou et al., 2020)) and for HSC commitment
(CD201(Zhou et al., 2016), CD44(Oatley et al., 2020), Gata2 and CD27 (Vink et al., 2020)).
Figure 4. Illustration of events taking place in EHT. Key transcription factors involved in the EHT are
shown in red and key signalling pathways in green. Cell surface markers characteristic for each stage
are shown in purple. Up-regulated genes during the process are shown on top of the cells and down-
regulated genes are showed below the cells HP, hematopoietic progenitor. Image adapted from
(Ottersbach, 2019).
It is worth remembering that although HSCs mature into multipotential progenitors with
long term reconstitution capacity in the aorta, they are not able to differentiate into mature cells
within their niche of origin, as shown by the lack of differentiated precursors in the AGM(Godin
et al., 1999; Kieusseian et al., 2012). It is not known whether this is due to the lack of support
for hematopoiesis by the aortic niche or to an intrinsic temporal need for maturation of HSCs.

32
2.2.2 EHT of erythromyeloid progenitors
The initiation of EHT is concomitant with yolk sac vasculature remodelling and
precedes the acquisition of aortic fate. Hemogenic cell clusters can be observed in the yolk
sac vessel walls from E9 to E11 (Frame et al., 2016; Samokhvalov et al., 2007). The number
of individual clusters reaches its maximum at E9.5, but the clusters tend to be overall larger
from E10.5, exemplified by the appearance of clusters composed of 50 cells or more(Frame
et al., 2016). YS hematopoietic clusters express endothelial cell surface markers such as Flk1,
CD34, VE-Cadherin, Pecam-1 and CD105 (Frame et al., 2016; Lee et al., 2016; McGrath et
al., 2015a). Similarly to intra-embryonic EHT, YS EHT is dependent on the transcription factor
Runx1, whose expression is found in the nucleus of hemogenic endothelial cells (Chen et al.,
2011; Frame et al., 2016; North et al., 1999; Samokhvalov et al., 2007). Furthermore, YS
AcLDL+ endothelial cells gave rise to EMPs, which were shown to emerge directly from the
endothelium in a live-imaging set up of fate-mapped cells (Kasaai et al., 2017). Similar to HSC
generation, EMP cluster generation is dependent on the Wnt/β-catenin signaling pathway
(Frame et al., 2016).
However, essential differences have been reported concerning the EHT generation of
EMP versus HSC. EMP emergence begins in the blood islands prior to the remodelling of the
vascular plexus, EMP clusters show no preference for arterial versus venous vasculature and
they appear equally abundant in both large and small vessels(Frame et al., 2016). Additionally,
studies on ES cells proposed the existence of an hemogenic wave independent of Notch1,
endowed with erythromyeloid potential and no LTR capacity (Hadland et al., 2004; McGrath et
al., 2015a).
Furthermore, the lack of blood flow does not disrupt EMP emergence. Normal cluster
morphology and localization were observed in the yolk sacs of Ncx1-/- mutants that lack a
beating heart although nitric oxide enhanced the formation of clusters (Frame et al., 2016;
Kasaai et al., 2017; Lux et al., 2008). Whether inflammatory signals are needed for the

33
emergence of EMPs is currently unknown, but macrophages that are located both inside and
outside the vessels during EHT could potentially contribute to the process, as has been
proposed for intra-embryonic EHT.
Finally, EMPs differ from their HSC counterparts in their capacity to differentiate within
their niche of emergence. EMPs have been shown to produce macrophages in situ that are
Runx1-dependent and that can be labelled with an inducible Cre under control of the Cdh5
(VE-Cadherin) promoter pulsed at E7.5(Gentek et al., 2018a). It is not yet clear whether the
yolk sac constitutes a supportive niche for hematopoietic differentiation or whether this
capacity is an inherent characteristic of EMPs that is distinct from HSCs.
3. EMP-derived hematopoietic lineages
EMPs have been demonstrated to give rise to the first innate immune cells of the
embryo. They are the first multipotent hematopoietic progenitors, with the potential to give rise
to cells from the erythroid lineage (erythrocytes and megakaryocytes) and myeloid lineage
(macrophages, monocytes, granulocytes, dendritic cells and mast cells)(Gomez Perdiguero et
al., 2015; McGrath et al., 2015a). The extent of their contribution to fetal and adult
hematopoietic systems is still unclear but there is a growing body of literature that recognises
their key role in fetal erythropoiesis and the production of certain adult resident myeloid
populations.
While not much is yet known on how lineage choice is regulated in EMPs, we do have
substantial data on the process from HSC-derived progenitors. In the adult bone marrow,
common myeloid progenitors (CMP) hold the potential to from myeloid and erythroid lineages,
and could be thus considered as a functional equivalent to EMP. HSC give rise to CMP through
sequential steps of commitment in which they lose the self-renewal capacity to become
multipotent progenitors (MPP) and further loose lymphoid potential (Akashi et al., 2000; Debili
et al., 1996). CMPs then differentiate into megakaryocyte/erythrocyte progenitors (MEP) and

34
into granulocyte/monocyte progenitors (GMP) to give rise to all erythroid and myeloid lineages
(Figure 5). A similar hierarchical differentiation tree has been proposed to occur during fetal
liver HSC-derived hematopoiesis(Traver et al., 2001).
Figure 5. Schematic illustration of commitment steps of HSC towards erythroid and myeloid
lineages. Expression of Pu.1 and Gata1 transcription factors is indicated in blue for gene and black for
protein levels. HSC, hematopoietic stem cell; MPP, multipotent progenitor; CMP, common myeloid
progenitor; MEP, megakaryocyte/erythrocyte progenitor; GMP, granulocyte/monocyte progenitor.
Erythroid/myeloid lineage decision seems to be governed by the transcription factors
Gata1 and Pu.1, although the process to that leads to lineage choice is still an intense debate.
Gata1 is essential for the differentiation of the erythroid lineage (Zhang et al., 2000), while Pu.1
is necessary for the differentiation of myeloid cells and the maintenance of stem and progenitor
cells during hematopoiesis (Iwasaki and Akashi, 2007; Nerlov and Graf, 1998). Pu.1 and Gata1
both inhibit each other and activate themselves. In the literature, a stoichiometric model for
erythroid versus myeloid commitment in HSCs was proposed where randomly fluctuating
Gata1 and Pu.1 cross-antagonise each other until a threshold of expression is surpassed (Graf
and Enver, 2009; Nerlov et al., 2000; Orkin and Zon, 2008; Zhang et al., 2000). However, a
recent study failed to observe a reproducible Pu.1–Gata1 double-positive stage in live imaging

35
of single cells(Hoppe et al., 2016), which led the authors to propose that Pu.1 and Gata1 were
not lineage-decision driving but rather executing transcription factors.
In order to better understand the lineage decisions and the hierarchy of EMP-derived
hematopoiesis, I will review the different classes of cells that they can give rise to, with special
emphasis on the current knowledge on their differentiation steps, mostly obtained from adult
hematopoiesis.
3.1- Erythroid lineages
3.1.1- Red blood cells
Red blood cells (RBC), also called erythrocytes, are the cells responsible for transport
of oxygen and carbon dioxide between the lungs and the rest of the body. They are the most
abundant cell type in the body, around 70% of the cell count in humans(Bianconi et al., 2013),
and they are constantly produced in the erythroblastic islands of the bone marrow at an
approximate rate of 2 x 10¹¹ RBC per day(Palis, 2014). Once released into circulation, they
have an average lifespan of 45 days in adult mouse, 115 days in human(Franco, 2012; Palis,
2014) and are ultimately cleared in the spleen by resident red pulp macrophages (Bratosin et
al., 1998; Burger et al., 2012; Mebius and Kraal, 2005) and to a minor extent by resident
macrophages (Kupffer cells) in the liver. Splenic red pulp macrophages recycle the iron, which
is returned to new erythroid precursors (Dautry Varsat et al., 1983; Hentze et al., 2010;
Leimberg et al., 2008).
Mammalian RBCs are highly specialised in gas transportation. The lack of nucleus and
organelles makes them small and biconcave, which yields an increased surface-to-volume
ratio for a more efficient gas exchange(Blatter et al., 2017). It also provides deformability to
traverse small capillaries and allows to increase hemoglobin capacity, the oxygen
transportation molecule, and (Ji et al., 2011; Morera and MacKenzie, 2011).

36
Hemoglobin is a metalloprotein composed of 4 protein subunits, globins, each carrying
one iron containing molecule, the haem or heme, that binds to one oxygen molecule. There
are different types of globins, which have different affinity to oxygen. In adult mice, these are
α1-, α2-, β1-, and β2-globins, but primitive erythroid cells also express type ζ‐, βH1‐, and εγ‐
globins(Trimborn et al., 1999). The switch from γ-globin to adult β-globin occurs when fetal
liver erythropoiesis begins. In humans, two globin gene switches occur during development,
the embryonic (ε or ζ) to fetal (γ) switch correlates with yolk sac to fetal liver erythropoiesis,
while a second fetal to adult (β) switch occurs at birth. Human fetal hemoglobin is thus
composed of α2γ2 (called HbF) while adult hemoglobin is composed of α2β2 (called HbA) or,
less frequently, α2δ2 (called HbA2)(Peschle et al., 1985; Stamatoyannopoulos, 2005;
Stamatoyannopoulos and Nienhuis, 1983).
The production of RBCs is effectuated through a series of more differentiated highly
proliferating progenitors. In the adult bone marrow, megakaryocyte/erythrocyte progenitors
(MEP) differentiate sequentially into lineage committed burst-forming unit erythroid (BFU-E)
and colony-forming unit erythroid (CFU-E). These populations were defined by their ability to
form erythroid colonies in vitro. The transcription factor Myb supports erythropoiesis through
the transactivation of Kruppel-Like Factor 1 (Klf1) and LIM Domain Only 2 (Lmo2)
expression(Bianchi et al., 2010). CFU-E requires the cytokine erythropoietin (EPO) for their
survival and expansion (Koury and Bondurant, 1990, 1992) and proper maturation. BFU-E
develop into morphologically identifiable precursors that gradually progress by accumulating
haemoglobin, decreasing cell size, condensing their chromatin (nuclear pyknosis) and finally
decreasing their RNA content (Figure 6). After, the erythroblast enucleates and turns into a
reticulocyte. Finally, the reticulocyte further matures by removing all residual cytoplasmic
organelles, including mitochondria and ribosomes by autophagy and exocytosis, acquiring a
biconcave elastic shape (Palis, 2014).

37
Figure 6. Maturation steps of definitive erythroid precursors deriving from BFU-E progenitors.
Precursors are defined morphologically through the maturation steps. ProE, proerythroblast; BasoE,
basophilic erythroblast; PolyE, polychromatic erythroblast; OrthoE, orthochromatic erythroblast.
Pyrenocytes are cleared by macrophages during the maturation process, and reticulocytes and red
blood cells are released into circulation.
The final maturation step of definitive erythroblasts occurs within erythroblastic islands
of the fetal liver and the bone marrow, where a central macrophage surrounded by
erythroblasts phagocytes the extruded nuclei surrounded by a cell membrane (pyrenocytes)
(Yoshida et al., 2005).
Definitive RBC in development
During murine development, the first definitive red blood cells are produced by E11.5
in the fetal liver, after rapid and local expansion of EMP and EMP-derived progenitors (Gomez
Perdiguero et al., 2015; McGrath et al., 2015a). Release into circulation starts at E12.5,
probably to respond to the increasing demands of the developing embryo, and they rapidly
become the most common cell type in circulation. Defective EMP-derived erythropoiesis in Myb-
deficient embryos is embryonic lethal by E15.5 (Mucenski et al., 1991). A similar rapid burst of
enucleated erythrocytes has been observed in the human embryo from 4 to 6 weeks of
gestation, at the moment in which EMPs have emerged and colonize the fetal liver (Migliaccio
et al., 1986; Oberlin et al., 2002). It should be mentioned that, although terminal differentiation
occurs only in the fetal liver, the observation of both BFU-E and CFU-E forming cells in the

38
yolk sac and circulation by E10.5 suggests a maturation of erythroid progenitors already in
their niche of emergence(Palis et al., 1999).
The erythrocytes that EMP and HSC produce are morphologically identical: they are
enucleated and ovoid and they express large quantities of β- and α-globins. Although EMP-
derived erythrocytes do not express primitive εγ-globin, low levels of embryonic βH1-globin
transcripts can be detected during early fetal erythropoiesis(McGrath et al., 2011). Importantly,
EMP-derived erythropoiesis, although transient, can support murine embryo during gestation,
as evidenced in experiments in which HSCs were selectively depleted(Chen et al., 2011).
Further interesting differences have been noticed among erythroblasts of the EMP-
lineage with respect to both primitive and bone marrow-derived erythroblasts. While the latter
fail to self-maintain in culture, it was demonstrated that yolk sac-derived erythroblasts can
proliferate in culture and be maintained for several months(England et al., 2011). Another
difference between EMP- and HSC-derived erythropoiesis is the expression of the pan-
hematopoietic marker CD45. While loss of CD45 expression at the surface of erythrocytes is
secondary and occurs during the BFU-E stage in bone marrow erythropoiesis(Boulais et al.,
2018; Li et al., 2014a), a recent preliminary report demonstrated that EMP-derived MEP are
CD45 negative (Soares-da-Silva et al., 2020). Additionally, this manuscript also showed that
EMP-derived erythrocytes require lower concentration of EPO than HSC-derived erythrocytes,
which might provide a competitive advantage during fetal erythropoiesis(Soares-da-Silva et
al., 2020).
3.1.2- Megakaryocytes
Megakaryocytes (Mk) are large cells that produce platelets, small cell fragments whose
function is to prevent blood loss by aggregating to induce blood coagulation. Platelets are the
second most abundant cell type in the blood and they are constantly replenished since they
have a lifespan of a few days. In humans, it was quantified that 1011 platelets are produced per

39
day in humans to maintain homeostasis(Branehög et al., 1975). Adult Mks are situated close
to bone marrow sinusoids, to ensure a fast release of platelets into circulation when
needed(Stegner et al., 2017).
Megakaryopoiesis in the adult bone marrow occurs through hierarchical steps of
differentiation, from HSC, multipotent progenitor (MPP), common myeloid progenitor (CMP)
and megakaryocyte-erythroid progenitor (MEP)(Akashi et al., 2000; Debili et al., 1996).
However, there is evidence that Mks are also produced from an alternative route prior to the
CMP stage, from VWF+ long term-HSC (quiescent, expressing CD150)(Grover et al., 2016;
Sanjuan-Pla et al., 2013) and MPP2(Cabezas-Wallscheid et al., 2014; Pietras et al., 2015;
Rodriguez-Fraticelli et al., 2018). Extensive research over the last decade has shown that
these populations contain Mk-primed cells and can differentiate directly into Mks, thus
bypassing the intermediate shared progenitors CMP and MEP. This direct differentiation was
demonstrated in different conditions, such as thrombopoietin (TPO) induction, inflammation
and after expression of a tyrosyl-tRNA synthetase variant (YRSACT), as well as in steady
state(Carrelha et al., 2018; Haas et al., 2015; Kanaji et al., 2018; Rodriguez-Fraticelli et al.,
2018). VWF+ HSCs are spatially located alongside Mks, which induce their proliferation and
repopulation capacity via CXCL4(Pinho et al., 2018).
Mks undergo endomitosis as they mature, acquiring a polyploid nucleus of 16N on
average. They then follow a series of elaborate remodelling events to produce platelets. They
extend long cytoplasmic protrusions along the sinusoidal blood vessels of the bone marrow
(proplatelets) that release 1 to 2 μm platelets into the blood vasculature(Avecilla et al., 2004;
Bender et al., 2015; Stegner et al., 2017). Restructuring of the Mk cytoskeleton is conducted
by a massive microtubule reorganization(Bender et al., 2015; Italiano et al., 1999; Patel et al.,
2005). The cytokine thrombopoietin (TPO) is the primary regulator of platelet production, since
it supports the survival, proliferation and differentiation of the precursors(Hitchcock and
Kaushansky, 2014). Additionally, CXCL12 and its receptor CXCR4 increase the mobility of

40
terminally differentiated Mks and facilitate the interaction with sinusoidal endothelial cells
(Grozovsky et al., 2015).
Mk in development
Embryonic platelets play a critical role in the closure of blood and lymphatic
vasculatures as Mk-devoid embryos display blood-filled lymphatic vessels at E10.5, in Meis1-
deficient embryos and after targeted ablation of platelets carrying diphtheria toxin receptor
(DTR) (Bertozzi et al., 2010; Carramolino et al., 2010). EMPs can differentiate into
megakaryocytes but the extent of their contribution is currently unknown (Gomez Perdiguero
et al., 2015; McGrath et al., 2015a). During development, Mk production shifts from the yolk
sac to the FL at E11.5 and Mk production in the YS has been defined as belonging to the
primitive wave. However, it is difficult to rule out Mk production from definitive EMPs in the YS,
as there are currently no distinctive features between primitive and definitive megakaryocytes,
such as globin genes in the erythroid lineage.
3.2- Myeloid lineages
3.2.1- Monocytes
Monocytes are myeloid circulating cells found in the bone marrow, spleen and blood
that mediate initiation and resolution of inflammation, and they have diverse roles in tissue
homeostasis. Their recruitment to sites of tissue injury and inflammation requires trafficking
across the blood vessel wall, which is mediated by their chemokine receptors and adhesion
molecules(Auffray et al., 2009; Swirski et al., 2009). They are also the precursors of infiltrating
macrophages and, in some instances, dendritic cells. However, monocytes, and patrolling
monocytes in particular, can also have intravascular effector functions (Carlin et al., 2013) and
as such may not be considered as only precursor cells.

41
Monocyte subsets
Murine monocytes are generally divided into two subsets: classical or inflammatory and
patrolling monocytes, regarding their phenotype and functions.
Classical monocytes are defined as CD115 (Csf1r)+ Gr1/Ly6C+ (CD14hi CD16+/- in
humans). They express Ccr2, which is required for their egress form the BM into circulation,
and low levels of Cx3cr1 (a fractalkine receptor) and are rapidly recruited in various situations
of tissue injury or infection, where they differentiate into macrophages (Dunay et al., 2010;
Peters et al., 2004; Samstein et al., 2013; Serbina et al., 2003; Traynor et al., 2000; Wojtasiak
et al., 2010). Of note, the granulocyte receptor-1 (Gr1) antigen is comprised of the two
structurally related GPI-anchored proteins: Ly-6C (expressed by the monocyte lineage) and
Ly-6G (expressed by granulocyte lineage).
Patrolling monocytes are CD115+ Gr1/Ly6Cneg (CD14dim CD16+ in humans), do not
express Ccr2 but high levels of Cx3cr1. They patrol blood vessels to mediate early responses
and promote wound healing and angiogenesis(Auffray et al., 2007; Carlin et al., 2013;
Nahrendorf et al., 2007).
Monocyte development
As for most immune cells, classical monocytes are produced through progressively
more restricted progenitors (Figure 7), starting from the common myeloid progenitor (CMP), to
the granulocyte/monocyte progenitor (GMP) to the monocyte/dendritic cell progenitor (MDP)
to the common monocyte progenitor (cMoP) that differentiates into Ly6C+ monocytes, which
later can differentiate into Ly6Cneg monocytes (Geissmann et al., 2010; Guilliams et al., 2018;
Hettinger et al., 2013). However, recent studies have challenged this differentiation pathway
and have proposed that monocytes are produced through different developmental programs
in steady state, which may explain their functional diversity. Some MDPs can be found within
the phenotypic characterization of CMP, and recent reports based on adoptive transfer and

42
fate-mapping experiments have proposed that Ly6Chi monocytes can differentiate directly from
GMPs under inflammatory conditions(Ikeda et al., 2018; Liu et al., 2019; Yáñez et al., 2017).
Figure 7. Schematic illustration of progenitor steps leading to the production of monocytes.
Surface marker phenotype is indicated in blue. GMP, granulocyte/monocyte progenitor; MDP,
monocyte/dendritic cell progenitor; cMoP, common monocyteprogenitor; Mo, monocyte.
In the embryo, the first monocytes are produced in the fetal liver starting from E12.5
and they are products of EMP hematopoiesis (Gomez Perdiguero et al., 2015). This first wave
of monocytes is proposed to be responsible for a second wave of resident macrophage
production (Hoeffel et al., 2012, 2015) (discussed below). Monocytes are then produced from
HSC later in the fetal liver and the bone marrow, and HSC are responsible for all monocyte
production during adult life(Boyer et al., 2011).
Monocytes: a precursor for macrophages and dendritic cells
Monocytes have been historically considered as the obligatory circulating precursors
of all macrophages(van Furth et al., 1972). Ly-6C+ monocytes are indeed a major source for
macrophage differentiation in response to tissue injury and monocyte-derived macrophages
are required for infection defense and tissue repair. Ly-6C+ monocyte-derived macrophages
can adopt a very wide range of phenotypes in response to the stimuli present but they are

43
usually classified into two main categories: inflammatory macrophages (or M1) and
alternatively activated macrophages (M2)(Murray et al., 2014).
Finally, monocytes can also differentiate into dendritic cells (DCs) under inflammatory
conditions and infection. Although monocyte-derived dendritic cells (MoDCs or infDCs) display
DC-like properties in vivo, they do not depend on FLT3 but on Csf1/M-CSF (Karsunky et al.,
2003; Louis et al., 2015). Monocytes have been shown to give rise to antigen presenting cells
resembling dendritic cells in vitro, when they are cultured with IL-4 and Csf2 (also known as
GM-CSF) (Briseño et al., 2016). MoDCs share a similar surface phenotype with conventional
dendritic cells (cDCs) and macrophages but they can be identified by coexpression of CD64
and FcεRI (Plantinga et al., 2013; Segura and Amigorena, 2013).
3.2.2- Resident macrophages
The term resident macrophage (resMf) refers to a heterogeneous family of innate
immune cells that play a central role in tissue inflammation and homeostasis. They are found
in all organs and body cavities, where they display tissue-specific phenotypes, functions and
gene expression profiles(Gautier et al., 2012; Lavin et al., 2014), as exemplified by liver Kupffer
cells, brain microglia, splenic red pulp macrophages and epidermal Langerhans cells. They
are professional phagocytic cells that are essential players in the homeostasis of their tissue
of residency by releasing growth factors, cytokines and extracellular matrix (ECM)-modifying
enzymes(Okabe and Medzhitov, 2016). ResMf populations, at steady-state, are characterized
by a low input rate from bone marrow-derived monocytes, in stark contrast to other myeloid
populations. Instead, they are long-lived and self-maintain by proliferation (Chorro et al., 2009;
Epelman et al., 2014; Hashimoto et al., 2013; Kierdorf et al., 2013; Schulz et al., 2012; Yona
et al., 2013; Zigmond et al., 2014).

44
Functional diversity of ResMf
ResMf are regularly spaced in many tissues such as the brain, the peritoneal serosa,
the muscles, the epidermis, and the liver and this arrangement has been hypothesized to be
regulated by mutual repulsion and growth factor availability(Hume et al., 2019). They exhibit
long elongated processes or dendrites that build up a 3D network-like structure throughout
each organ(Chopin and Nutt, 2015; Nimmerjahn et al., 2005) and which allows them to behave
as tissue sentinels. Among their multiple functions, they regulate tissue homeostasis by
scavenging of macromolecules, tissue debris, senescent and apoptotic cells and production of
bioactive molecules, fight infections by uptaking invading pathogens and finally, they have key
functions in tissue repair and regeneration(Kierdorf et al., 2015; Wynn and Vannella, 2016).
Specifically during development, they are involved in organogenesis of the brain
(Paolicelli et al., 2011; Nguyen et al., 2020), limbs, lung (Blackwell et al., 2011; Muñoz-Espín
et al., 2013), mammary glands (Ingman et al., 2006), testis (DeFalco et al., 2014) and pancreas
(Banaei-Bouchareb et al., 2004). They also contribute to HSPC emergence (Mariani et al.,
2019) and blood and lymphatic vessel branching (Fantin et al., 2010; Gordon et al., 2010;
Kubota et al., 2009). In line with such highly diverse and tissue-specific functions, resMf have
tissue-specific transcriptomic, epigenetic and metabolic profiles (Lavin et al., 2014), for which
the transcription factors responsible have been identified in some tissues. This is the case for
Gata6 for peritoneal macrophages(Okabe and Medzhitov, 2014; Rosas et al., 2014) and SpiC
for red pulp macrophages(Kohyama et al., 2009). Acquisition of these tissue-specific
macrophage phenotypes occurs after tissue colonization during organogenesis and their
maturation continues during development (Mass et al., 2016; Matcovitch-Natan et al., 2016;
Summers and Hume, 2017). Interestingly, it has been reported that the transcription factor
Zeb2 is necessary to maintain those tissue-specific identities as well as maintaining the
macrophage pool (Scott et al., 2018).

45
Developmental origins of resident macrophages
The past decade has seen an increasingly growing body of literature in the field of
resident macrophages. A series of seminal studies evidenced the embryonic origin of some
adult resident macrophages (Ginhoux et al., 2010; Gomez Perdiguero et al., 2015; Hoeffel et
al., 2015; Schulz et al., 2012) and renewed interest in these resident homeostatic cells and in
the potential role of different lineage contributions in a phenotypically homogenous population.
However, the precise ontogeny of these cells has been the subject of intense debate because
of the limitations of the different fate-mapping systems, including temporal overlap of
hematopoietic waves, low labelling efficiencies and lack of specificity of the promoters used.
The current framework proposes the existence of three waves of macrophages that
sequentially colonize tissues. After a first wave of yolk sac-derived Myb-independent
macrophages, a second wave of fetal liver-derived embryonic monocytes can give rise to
tissue macrophages. Finally, HSC-derived monocytes can infiltrate specific tissues during
postnatal development, in steady state or after tissue inflammation. In terms of ontogeny, the
first macrophage wave could derive from primitive and/or EMPs while the second could
originate from EMP and/or HSC. The contribution of each wave to the resMf pool in each tissue
is suggested to be dependent on both niche availability and accessibility(Guilliams and Scott,
2017). It should be noted at this point that some confusion currently exists in the macrophage
field, as the term “primitive” was often (and in some cases still is) used to qualify immature or
ancestral cells or to express that they are the earliest or first of its kind, with no regards to their
ontogeny. As such, yolk sac macrophages are often called “primitive” for these reasons, and
not because they are deriving from primitive progenitors.
First wave of macrophage production in the yolk sac
The potential to produce macrophages in the yolk sac resides in EMPs and monopotent
progenitors/precursors (Bertrand et al., 2005b). Yolk sac macrophages have no monocyte
intermediates and their generation is independent of the transcription factor c-Myb (Bertrand
46
et al., 2005b; Naito et al., 1989; Schulz et al., 2012; Takahashi et al., 1989). Currently, we lack
lineage-specific markers or tools to discriminate between primitive and EMP-derived
macrophages in the early yolk sac. In particular, it is not possible yet to determine the
quantitative contribution of primitive progenitors vs EMP into microglia, the central nervous
system resident macrophages. While such distinction has been studied in the developing
zebrafish (Ferrero et al., 2018), it has yet to be clarified whether mouse microglia are of
primitive, EMP or mixed origin. Unfortunately, studies to date have been unable to isolate a
yolk sac macrophage primitive precursor, and the use of Cx3cr1-GFP reporter in combination
with Kit marker in the E8 yolk sac showed that the macrophage forming cells at this stage are
associated with erythromyeloid colonies, pointing towards an EMP origin for mouse microglia
(Kierdorf et al., 2013). Further, ResMf and their progenitors can be fate mapped when targeting
cells expressing VE-Cad/Cdh5(Gentek et al., 2018a), Runx1(Ginhoux et al., 2010),
Tie2/Tek(Gomez Perdiguero et al., 2015) and Csf1r(Gomez Perdiguero et al., 2015; Kasaai et
al., 2017) early in development, thus strongly arguing for an origin of resMf progenitors from
hemogenic endothelium. This does not exclude that primitive macrophage precursors could
contribute in part to the monocyte-independent macrophage wave, as they could express
these genes in the course of their generation.
As EMP commit towards their myeloid progeny, they lose Kit expression while they
concomitantly upregulate the expression of macrophage genes like Cx3cr1, Csf1r and Irf8
(Bertrand et al., 2005b; Kierdorf et al., 2013; Mass et al., 2016). EMP-derived macrophages
enter in circulation as soon as it is established and colonize all the tissues from E8.5 to E12.5
(Gomez Perdiguero et al., 2015; Stremmel et al., 2018). The primary target for YS-produced
EMP macrophages is the yolk sac and the developing brain (neuroectoderm) by E9.5, probably
due to the early establishment of the vascular network in this niche (Ginhoux et al., 2010;
Gomez Perdiguero et al., 2015; Kierdorf et al., 2013; Stremmel et al., 2018).

47
Second wave of macrophage production in the fetal liver
Later on, EMPs produce monocytes in the fetal liver and release them into circulation,
which leads to colonization of all tissues but the brain(Gomez Perdiguero et al., 2015; Hoeffel
et al., 2012, 2015). The inducible recombination of progenitor cells under the control of
Tie2/Tek promoter proved essential to address the ontogeny of this wave. Indeed, while E7.5
and E8.5 tamoxifen (TAM) pulses highly labelled tissue resMf populations, tissue resMf were
barely labelled when pulsed at E9.5 but other myeloid and lymphoid cells (together with HSC)
were highly labelled. This demonstrated that resMf progenitors originated from hemogenic
progenitors present before E9.5 and not from HSCs(Gomez Perdiguero et al., 2015).
Third wave of macrophage production from the fetal liver and bone marrow
The majority of tissue macrophage populations are established prenatally during
mouse development and can be maintained by proliferation independently of bone marrow
monocyte input in steady state(Hashimoto et al., 2013; Yona et al., 2013).
However, EMP-derived resMf can be replaced by a wave of HSC-derived infiltrating
monocytes in a manner dependent on the tissue and that is impacted by tissue challenge and
aging. Gradual replacement by HSC-derived monocytes can occur in steady state in specific
organs and has been proposed to progressively increase with age. During steady state, resMf
of the gut lamina propia are entirely dependent from bone marrow Ly6C+ monocytes after
weaning(Bain et al., 2014). Other resMf are partly dependent on bone marrow monocytes for
their maintenance, such as macrophages from the lung (Gomez Perdiguero et al., 2015;
Hashimoto et al., 2013), liver (Scott et al., 2016), heart(Epelman et al., 2014; Molawi et al.,
2014), pancreas(Calderon et al., 2015), dermis(Tamoutounour et al., 2013), adipose
tissue(Kanda et al., 2006; Weisberg et al., 2006), and peritoneum(Parwaresch and Wacker,
1984; Yona et al., 2013).

48
Tissue resMf can also be replaced after specific tissue challenges. It has been long
reported that γ-radiation provokes replacement of epidermal Langerhans cells(Katz et al.,
1979) and spleen red pulp macrophages(Fogg et al., 2006) with bone marrow derived
monocytes. Also, liver Kupffer cells can be replaced with HSC-derived cells, after cell ablation
(DT mediated or clodronate)(Scott et al., 2016), bacterial and viral infection(Blériot et al., 2015;
Borst et al., 2018) and following lipid overload during non-alcoholic steatohepatitis(Tran et al.,
2020). Much less is known about the impact that this replacement over age or after specific
challenges has on the ability of resMf to perform their functions, which could have major
implications in physiological tissue homeostasis, as infections and wounds are frequent during
lifetime.
3.2.3- Dendritic cells
Dendritic cells (DC) are specialized antigen-presenting myeloid cells. They are highly
phagocytic and migratory cells that process antigens in peripheral and lymphoid tissues
(spleen and lymph nodes). After activation in peripheral tissues, they migrate to the T and B
cell zones of lymphoid tissues (spleen and lymph nodes) to expose the antigen via afferent
lymphatics and high endothelial venules and thus have major functions in the initiation and
regulation of adaptive immunity. Adult DC production is located in the bone marrow and
depends on the ligand of the receptor tyrosine kinase fms-like tyrosine kinase 3 (FLT3)(Liu et
al., 2009; McKenna et al., 2000; Waskow et al., 2008). It is a heterogeneous group classified
by transcription factor and cell surface marker expression, but their surface markers also
represent activation stages(Boltjes and van Wijk, 2014; Geissmann et al., 2010).
DC heterogeneity
Conventional DCs (cDCs) are generally short-lived, 3-6 days, and can be subdivided
into cDC1 and cDC2, regarding distinct sets of transcription factors required for their
development (equivalent to human CD141/BDCA3+ and CD1c/BDCA1+ cDCs(Collin and
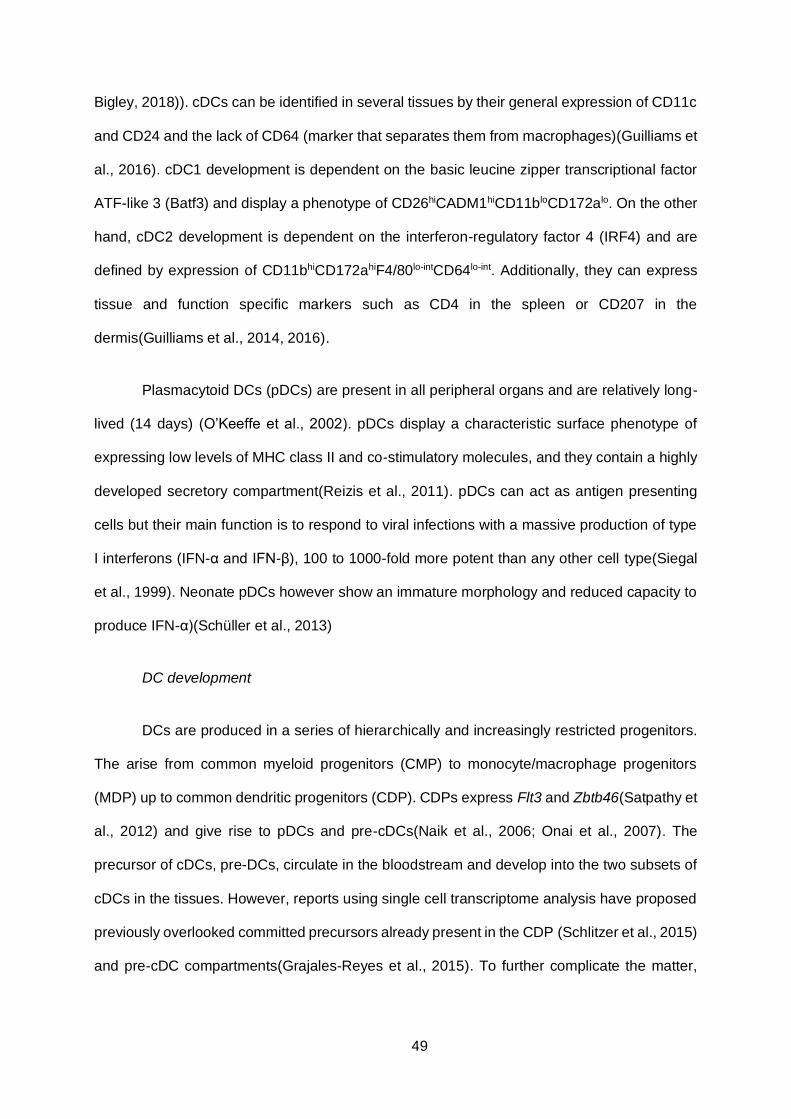
49
Bigley, 2018)). cDCs can be identified in several tissues by their general expression of CD11c
and CD24 and the lack of CD64 (marker that separates them from macrophages)(Guilliams et
al., 2016). cDC1 development is dependent on the basic leucine zipper transcriptional factor
ATF-like 3 (Batf3) and display a phenotype of CD26hiCADM1hiCD11bloCD172alo. On the other
hand, cDC2 development is dependent on the interferon-regulatory factor 4 (IRF4) and are
defined by expression of CD11bhiCD172ahiF4/80lo-intCD64lo-int. Additionally, they can express
tissue and function specific markers such as CD4 in the spleen or CD207 in the
dermis(Guilliams et al., 2014, 2016).
Plasmacytoid DCs (pDCs) are present in all peripheral organs and are relatively long-
lived (14 days) (O’Keeffe et al., 2002). pDCs display a characteristic surface phenotype of
expressing low levels of MHC class II and co-stimulatory molecules, and they contain a highly
developed secretory compartment(Reizis et al., 2011). pDCs can act as antigen presenting
cells but their main function is to respond to viral infections with a massive production of type
I interferons (IFN-α and IFN-β), 100 to 1000-fold more potent than any other cell type(Siegal
et al., 1999). Neonate pDCs however show an immature morphology and reduced capacity to
produce IFN-α)(Schüller et al., 2013)
DC development
DCs are produced in a series of hierarchically and increasingly restricted progenitors.
The arise from common myeloid progenitors (CMP) to monocyte/macrophage progenitors
(MDP) up to common dendritic progenitors (CDP). CDPs express Flt3 and Zbtb46(Satpathy et
al., 2012) and give rise to pDCs and pre-cDCs(Naik et al., 2006; Onai et al., 2007). The
precursor of cDCs, pre-DCs, circulate in the bloodstream and develop into the two subsets of
cDCs in the tissues. However, reports using single cell transcriptome analysis have proposed
previously overlooked committed precursors already present in the CDP (Schlitzer et al., 2015)
and pre-cDC compartments(Grajales-Reyes et al., 2015). To further complicate the matter,

50
lymphoid progenitors have been reported to produce pDCs in steady state(Rodrigues et al.,
2018), and cDCs under ablation conditions(Salvermoser et al., 2018).
Very little is currently known about DC development during fetal life. Small numbers of
DCs (CD11c+ cells) have been observed in the thymus at E17.5 and the spleen at postnatal
day (P)1(Dakic et al., 2004) but the absence of detection could come from a lack of activation
from T cells before that stage, as most DC-markers are only expressed later in development.
At birth, DCs are still only 0.2% of the spleen but reach 30% after 3 weeks of age and stabilise
at 10% in the adult (Sun et al., 2003). It is currently unknown when the first DCs are produced
during fetal life. In humans, DCs have been observed within fetal spleen, skin, thymus, and
lung by 13WG with the capacity to induce T cell stimulationc(McGovern et al., 2017), and
recent scRNAseq has identified putative DCs clusters in human fetal liver relatively as early
as 7 GW(Popescu et al., 2019). However, such identification is solely based on expression of
general myeloid markers and lack of other myeloid lineage genes, and as such it would need
further investigation for this cell annotation to be confirmed. EMP contribution to this population
during development remains to be investigated.
3.2.4- Granulocytes
The term granulocyte embodies a heterogeneous group of innate immune cells that
are distinguished by a polylobed nucleus, multiple granules in the cytoplasm and specific cell
surface markers. There are three types of granulocytes; basophils, eosinophils and neutrophils
that are distinguished based on their nucleus structure and granule content. Neutrophils
contain a multilobed nucleus with acidic granules; eosinophils contain a bi-lobed nucleus and
crystalloid acidic granules; finally, basophils have a large bi- or tri-lobed nucleus with big basic
granules. They are relatively short-lived cells, produced in the bone marrow, where they form
and mature the granules before they are released into the peripheral blood.

51
Granulocyte heterogeneity
Neutrophils are the most abundant type of granulocytes and also of immune cells.
Nearly 60% of bone marrow leukocytes are neutrophil precursors(Kennedy and Deleo, 2009).
They are the first cells that are mobilized to the sites of infection where they degrade
pathogenic bacteria and fungi by releasing proteolytic and antimicrobial granules, reactive
oxygen species as well as their nuclear content forming nuclear extra-cellular traps (NET)
(Brinkmann et al., 2004; Mantovani et al., 2011). Furthermore, neutrophils produce cytokines
to recruit immune cells and regulate the inflammatory responses(Soehnlein et al., 2017). They
remain 6-12h in the blood and stay in tissues an average of 1-2 days before undergoing
apoptosis (Athens et al., 1961; Bainton et al., 1971; Cronkite and Fliedner, 1964; Summers et
al., 2010) and being cleared by tissue macrophages(Savill et al., 1989b, 1989a). 1-2x10¹¹
neutrophils are released daily into circulation in humans to maintain their numbers (Athens et
al., 1961; Summers et al., 2010). Their production is controlled by granulocyte colony-
stimulating factor (G-CSF or Csf3), granulocyte/macrophage colony-stimulating factor (GM-
CSF or Csf2), and interleukin 3 (IL3).
Eosinophils can be found in mucosal tissues, the lung, the gastrointestinal tract and
the bone marrow; and only a minor part is found in the peripheral blood. They are considered
very short-lived, as they only stay in the blood for 18h of average before seeding
tissues(Williams and Hellewell, 1995). Their main function is to respond to parasites and
allergic responses(Costa, 1997). They are recruited to sites of inflammation in Th2-type
responses where they produce an array of cytokines and lipid mediators and release toxic
granule proteins and superoxide radicals(Kita, 2011). They express the high affinity receptor
for IgE (FcεRI), CD80/CD86 and MHC II.
Basophils are a rare cell type in circulation (0.5% of leukocytes) and have a short
lifespan of 1-2 days. Under inflammatory conditions, however, they rapidly proliferate in the
bone marrow and migrate to sites of inflammation(Karasuyama and Yamanishi, 2014; Min et

52
al., 2012), where they play a role in parasite infections (Lantz et al., 1998) and allergic reactions
(Gibbs, 2005; Prussin and Metcalfe, 2006). They express FcεRI and are the main producers
of IL-4 during primary helminth infection (van Panhuys et al., 2011). They also secrete IL-4 in
allergic reactions in response to IL-3 or FcεRI cross-linking (Denzel et al., 2008).
Granulocyte development
All granulocytes derive from a granulocyte/monocyte progenitor (GMP) in a highly
controlled process that involves the C/EBP (CCAAT/enhancer binding proteins) transcription
factor family: C/EBP-α(Johansen et al., 2001; Ma et al., 2014), -β(Hirai et al., 2006, 2015), and
-ε(Bartels et al., 2015; Paul et al., 2015). Further differentiation produces lineage-committed
progenitors like eosinophil progenitor (EoP) and basophil/mast cell progenitor (BMCP) (Figure
8). The upregulation of Gata1 is key to produce EoP, while the acetylation of C/EBP-ε at
specific lysines causes neutrophil differentiation (Bartels et al., 2015; Fiedler and Brunner,
2012). An early neutrophil-restricted progenitor (proNeu1) has only recently been proposed in
mice, using single-cell transcriptional analysis, that is contained within the GMP population,
expresses CD68 and low levels of Mac-1/CD11b and requires CEBP-ε to further differentiate
into neutrophil precursors (Kwok et al., 2020).
Under resting conditions, granulopoiesis is regulated by a number of physiological
processes, such as diurnal oscillation, metabolic activity and aging. In response to stress
conditions, like an infection, granulopoiesis is rapidly activated and enter in emergency
granulopoiesis mode. Emergency granulopoiesis enhances the production of granulocytes to
meet the demand for neutrophils during severe infection when these cells are consumed in
large quantities during the innate immune response and is regulated by granulocyte colony-
stimulating factor (G-CSF), C/EBP-α and specially by C/EBP- β(Manz and Boettcher, 2014;
Yvan-Charvet and Ng, 2019).

53
Figure 8. Schematic illustration of the development of the three types of granulocytes and mast
cells in steady state. Expressed genes are in blue. GMP, granulocyte/monocyte progenitor; NeuP,
neutrophil progenitor; EoP, eosinophil progenitor; BMP, basophil and mast cell progenitor; BaP, basophil
progenitor; MCp, mast cell progenitor
During mouse embryonic development, rare neutrophils have been observed as early
as E11.5 in circulation. These cells show normal maturation and are produced by EMPs in the
fetal liver at least until E16.5 (Gomez Perdiguero et al., 2015; McGrath et al., 2015a). The fetal
liver from E12.5 to E14.5 has mostly immature granulocyte precursors and no eosinophil
peroxidase (Epx) or basophil FcεRI expression (McGrath et al., 2015a). In human fetal
development, mature neutrophils clusters were observed in the bone marrow at 12-15 weeks
of gestation, but lower number were found in the fetal liver at this stage(Ohls et al., 1995;
Slayton et al., 1998). These observations are consistent with a recent human fetal liver single
cell transcriptomic analysis, which failed to detect mature neutrophils, basophils and
eosinophils at 17 GW (Popescu et al., 2019). It is not known whether this apparent discrepancy
is due to the scarcity of neutrophils in the fetal liver in comparison with the fetal erythroid and

54
monocyte/macrophage cell abundance, observed also in the mouse, or whether human
embryonic granulopoiesis is distinctly located in the bone marrow.
3.2.4- Mast cells
Mast cells (MCs) are innate resident mononuclear granular myeloid cells that play a
key role in allergies but also have tissue specific homeostatic functions such as promoting (i)
uterine spiral artery remodeling during pregnancy (Meyer et al., 2017; Woidacki et al., 2013),
(ii) cardiomyocyte contractility following myocardial infarction (Ngkelo et al., 2016), (iii) corneal
vasculature and (iv) neuronal network development (Liu et al., 2015). Their cytoplasm contains
hundreds of large granules that store histamine, heparin, a variety of cytokines, chondroitin
sulfate and proteases. They are widely distributed throughout vascularized tissues, particularly
near surfaces exposed to the external environment, including the skin, airways, and
gastrointestinal tract, but not in circulation (Galli et al., 2005). Consistent with their role in
allergic reactions, they share expression of FcεRI with eosinophils and basophils, however
they additionally express Kit/CD117, ST2 and IL-33Rα (Allakhverdi et al., 2007).
MCs are long lived cells that self-maintain in the tissues by local precursors (Dahlin
and Hallgren, 2015; Matsuda et al., 1981) and have minimal contribution from the bone marrow
in steady state (Gentek et al., 2018a; Hatanaka et al., 1979; Kitamura et al., 1977).
Interestingly, it was shown that bone marrow progenitors contribute to skin MC only when the
host is MC-deficient (Hatanaka et al., 1979). More recently, it was shown that bone marrow
progenitors did not contribute significantly to MC replenishment in RMB mice (which express
the human diphtheria toxin receptor under the control of the 3′ UTR of the FcεRI gene) after
DT treatment, despite niche availability and vasculature proximity (Gentek et al., 2018a).
Mast cell development
In the adult bone marrow, MCs come from granulocyte/macrophage progenitor (GMP)
that differentiate into a bipotent basophil/mast cell progenitor (BMP) that further commits to

55
MC progenitors (MCp) (Arinobu et al., 2005; Iwasaki et al., 2006; Qi et al., 2013). The bone
marrow releases immature MCp that differentiate into MCs in peripheral tissues. The migration
of MCp to tissues is a regulated process that is stimulated by inflammation (Dahlin and
Hallgren, 2015). Gata1 and Gata2 are also involved in the maturation from MCp into mature
MCs (Harigae et al., 1998; Migliaccio et al., 2003).
Much less is known about the development of MC during development. MC potential
have been observed in the E8.5 mouse yolk sac and reach maximum at E11.5 (Palis et al.,
1999; Sonoda et al., 1983). This is followed by an increase in MC potential in the fetal liver
from E11 to E15, and in the skin until E17 (Gentek et al., 2018a; Hayashi et al., 1985). Similarly
to resMf, adult MC have been recently shown to be partially derived from EMPs that are not
completely replaced from bone marrow MCp in young animals (Gentek et al., 2018a; Li et al.,
2018). Importantly, embryonic MCs have a different phenotype compared with their adult
counterparts; they lack FcεR1 and MHCII surface expression but acquire them in the
adulthood, which makes the observation of MC during development challenging (McGrath et
al., 2015a). A recent study reported that adult-like MC could be generated by mouse or human
ESC populations enriched in Gata2 expression when cultured for two weeks(Kauts et al.,
2018). This suggests that, rather than depending on the lineage, the acquisition of adult
phenotype depends on a steady maturation in time.

56

57
AIMS AND OBJECTIVES
Extensive research over the last two decades has established the importance of EMP
hematopoiesis for embryo development and for the generation of adult tissue resident
macrophages. However, one of the main obstacles in developmental hematopoiesis, and
specifically when studying EMPs, is the inability to distinguish EMP-derived from HSC-derived
hematopoietic cells, since they coexist in different tissues while sharing surface markers and
gene expression patterns. As a result, very little is known about EMP differentiation process
and the contribution of EMP-derived erythroid and myeloid lineages to the embryo.
A better understanding of EMP-derived lineage decisions is critical to comprehend
embryonic hematopoiesis and could have important translational significance, since defects in
EMP development could affect infancy related hematopoietic disorders and/or result in long-
term defects of tissue resident macrophages.
The main questions that I addressed during my PhD are the following:
Aim 1. Identify the in vivo differentiation patterns of EMPs
Aim 2. Characterize a unique phenotype and gene expression pattern of EMPs and
EMP-derived progenitors in the yolk sac and the fetal liver
Aim 3. Assess the contribution of EMPs to the fetal hematopoietic system to ultimately
build an EMP lineage tree.
In pursuit of these aims, I based my experiments on the precise genetic Csf1rMeriCreMer
fate mapping system, that has been demonstrated to label exclusively EMP and EMP progeny
but not HSC when pulsed at E8.5(Gomez Perdiguero et al., 2015). I combined flow cytometry,
cell sorting and single cell gene expression analysis in order to determine surface markers and
molecular pathways of EMPs throughout embryonic development.

58

59
MATERIALS AND METHODS
The materials and methods used during this work are contained in the form of a
manuscript in the results section.
The differences in the single-cell RNA-Sequencing data analysis for the figures 10-14
are explained here
Experimental design for scRNA-Seq. YFP+ single cells from E9.5 yolk sac Csf1riCre RosaYFP
(n=3 litters, 27-29sp), E10.5 yolk sac Csf1rMeriCreMer RosaYFP (n=6 litters, 34-38sp), E10.5 fetal
liver Csf1rMeriCreMer RosaYFP (n=6 litters, 34-38sp) and E12.5 fetal liver Csf1rMeriCreMer RosaYFP
(n=2 litters) embryos pulsed at E8.5 were index-sorted into 384-well plates with a lysis mix
containing UPW, 10% Triton X-100 and RNasin plus 40U/μl (Promega N2611) with MARS-seq
barcodes (made by etc) and immediately placed in dry ice after sorting. Plates were stored
until processing at -80°C.
The plates were processed following the MARS-Seq pipeline (Jaitin et al., 2014) and
sequenced in a Illumina NextSeq 500 sequencer using NextSeq® 500/550 High Output Kit v2
(75 cycles) (Illumina). 22 plates were sequenced in three independent sequencing runs,
megakaryocytes and macrophages were sorted in the first run (Figure 10)
Cell and gene filtering for scRNA-Seq analysis. Cells for which mitochondrial genes took
up more than 5% of the total UMI counts, and that had less than 3,000 detected genes were
filtered out. We excluded 241 cells that were detected as doublet by the scDblFinder R
package (Germain, 2020) using default parameters and running the analysis for each plate
separately. In total, we analysed 5002 cells from 8360 sorted. The genes detected in less than
5% of the cells of each condition (E9.5 YS, E10.5 YS, E10.5 FL and E12.5 FL), the ERCC-
spike-ins, and all mitochondrial genes were excluded. In total, 9,467 genes were kept. 797

60
and 1,257 cells were selected in the E9.5 and E10.5 YS conditions, respectively, and 1,686
and 1,456 cells were selected in the E10.5 and E12.5 FL conditions, respectively.
Batch effect correction. Batch effects were removed by hierarchically merging the samples
using the ‘reduceMNN’ function of the batchelor R package(Haghverdi et al., 2018) on 50
principal components calculated with the multiBatchPCA function from the HVGs only. Plates
were first merged within each sequencing run (using auto.merge=TRUE), and then across
sequencing runs by descending number of plates.
The corrected low-dimensional coordinates of each cell returned by fastMNN were used as
input for computation of clustering and UMAP (Uniform Manifold Approximation and Projection
for Dimension Reduction) for visualization. UMAPs were calculated using the ‘runUMAP’
function of the Seurat package(Stuart et al., 2019) with the default parameters
Cell Clustering. A shared nearest-neighbor graph (SNN) was built using the ‘buildSNNGraph’
function of the scran R package. Communities were searched for in the SNN graph using the
method of random walks implemented in the `cluster_walktrap` function of the igraph v1.2.5
package. The number k of nearest neighbors used in the SNN graph containing both tissues
was k = 11.
Gene differential expression between clusters. Differential expression analyses were
performed by computing pairwise t-tests using the ‘findMarkers’ function in the scran R
package. The option ‘pval.type="some"’ was used to only consider markers differential in at
least half of the pairwise comparisons between clusters.
Cell cycle quantification. Cells were classified into their cell cycle phases based on their
gene expression data using the ‘cyclone’ function(Scialdone et al., 2015) of the scran package
with default parameters.

61
Published protocol
Additionally, the fate-mapping and flow cytometry method that is used in this work are
more extensively explained in the form of a published protocol in The Journal of Visualized
Experiments (JoVE) attached to this section (Iturri et al., 2017). Of note, the day of the
experiment the digestion buffer or mix, PBS containing 1mg/ml Collagenase D, 100 U/ml
Deoxyribonuclease I (DNAseI) and 3% fetal bovine serum (FBS), is prepared before starting
dissection and stored at 4 °C, as the yolk sac is transferred before the blood collection.

62

Journal of Visualized Experiments www.jove.com
Copyright © 2017 Journal of Visualized Experiments July 2017 | 125 | e55305 | Page 1 of 10
Video Article
Identification Of Erythromyeloid Progenitors And Their Progeny In The MouseEmbryo By Flow CytometryLorea Iturri1,2, Javier Saenz Coronilla1, Yvan Lallemand1, Elisa Gomez Perdiguero1
1Department of Developmental and Stem Cell Biology, CNRS UMR3738, Department of Immunology, Institut Pasteur2Cellule Pasteur UPMC, University Pierre et Marie Curie
Correspondence to: Elisa Gomez Perdiguero at [email protected]
URL: https://www.jove.com/video/55305DOI: doi:10.3791/55305
Keywords: Developmental Biology, Issue 125, Macrophages, yolk sac, definitive hematopoiesis, hematopoietic stem and progenitor cells, mouseembryos, FACS, fate mapping
Date Published: 7/17/2017
Citation: Iturri, L., Saenz Coronilla, J., Lallemand, Y., Gomez Perdiguero, E. Identification Of Erythromyeloid Progenitors And Their Progeny In TheMouse Embryo By Flow Cytometry. J. Vis. Exp. (125), e55305, doi:10.3791/55305 (2017).
Abstract
Macrophages are professional phagocytes from the innate arm of the immune system. In steady-state, sessile macrophages are found inadult tissues where they act as front line sentinels of infection and tissue damage. While other immune cells are continuously renewed fromhematopoietic stem and progenitor cells (HSPC) located in the bone marrow, a lineage of macrophages, known as resident macrophages,have been shown to be self-maintained in tissues without input from bone marrow HSPCs. This lineage is exemplified by microglia in thebrain, Kupffer cells in the liver and Langerhans cells in the epidermis among others. The intestinal and colon lamina propria are the only adulttissues devoid of HSPC-independent resident macrophages. Recent investigations have identified that resident macrophages originate fromthe extra-embryonic yolk sac hematopoiesis from progenitor(s) distinct from fetal hematopoietic stem cells (HSC). Among yolk sac definitivehematopoiesis, erythromyeloid progenitors (EMP) give rise both to erythroid and myeloid cells, in particular resident macrophages. EMP areonly generated within the yolk sac between E8.5 and E10.5 days of development and they migrate to the fetal liver as early as circulation isconnected, where they expand and differentiate until at least E16.5. Their progeny includes erythrocytes, macrophages, neutrophils and mastcells but only EMP-derived macrophages persist until adulthood in tissues. The transient nature of EMP emergence and the temporal overlapwith HSC generation renders the analysis of these progenitors difficult. We have established a tamoxifen-inducible fate mapping protocol basedon expression of the macrophage cytokine receptor Csf1r promoter to characterize EMP and EMP-derived cells in vivo by flow cytometry.
Video Link
The video component of this article can be found at https://www.jove.com/video/55305/
Introduction
There are several successive but overlapping waves of hematopoietic progenitors during development whose myeloid progeny remain intoadulthood. First, unipotent "primitive" progenitors emerge in the mouse yolk sac 1,2 between E7.5-E8.25 and give rise to embryonic macrophageswithout any monocytic intermediate. Whether macrophages derived from primitive progenitors persist in the adult brain as microglia remains asubject of active investigation. Second, Erythro-Myeloid Precursors (EMPs) arise in the yolk sac at E8.5, enter the bloodstream and colonizethe embryo. EMPs emerge from the yolk sac hemogenic endothelium in a Runx1-dependant endothelial-to-hematopoietic transition 3,4. WhileEMP can differentiate into macrophages within the yolk sac, they also colonize the fetal liver from embryonic day (E)95 and differentiate intoerythrocytes, megakaryocytes, macrophages, monocytes granulocytes and mast cells 6. The macrophages that derive from EMPs exhibitproliferative capacity in developmental and adult tissues. Whether EMP-derived macrophages bypass the monocyte stage of differentiation isstill controversial as very little is known about their differentiation pathway 7,8. Finally, Hematopoietic Stem Cells (HSCs) emerge at E10.5 withinthe embryo proper from the aorta-gonad-mesonephros region and migrate to the fetal liver. HSCs with long-term repopulation capacity are onlydetected after E11 (at the 42 somite pair stage)9. There, they expand and differentiate from E12.5 until definitive hematopoiesis begins to shift tothe bone marrow, which becomes the predominant site of blood cell production for the duration of postnatal life 10.
The spatial and temporal overlap in emergence, as well as shared immuno-phenotypic markers has thus far hampered our ability to distinguishthe specific contributions of these waves of embryonic hematopoietic progenitors. While both EMP and HSC are generated in a Runx1-dependent manner and express the transcription factor Myb and the growth factor receptor Csf1r (Colony-Stimulating Factor 1 Receptor, alsoknown as Macrophage Colony Stimulating Factor Receptor) among others, EMPs can be distinguished from HSCs by their lack of lymphoidpotential, both in vitro and in vivo, their lack of long-term repopulating potential and lack of surface expression of the lineage marker Sca-1 11.Genetic fate mapping models are required to characterize macrophage ontogeny since they allow targeting embryonic progenitors in a cell-specific and time-specific manner. Here we present the fate-mapping protocol used in our laboratory to discriminate between the two lineages ofmacrophages found in most adult tissues: HSC-derived infiltrating macrophages and HSC-independent resident macrophages.
Tissue resident macrophages have been traced back to Myb-independent precursor cells expressing the cytokine receptor Csf1r12 and arepresent in the embryo at E8.5-E10.5 using three complementary fate-mapping strategies 6. In order to study yolk sac hematopoiesis without

Journal of Visualized Experiments www.jove.com
Copyright © 2017 Journal of Visualized Experiments July 2017 | 125 | e55305 | Page 2 of 10
labeling fetal HSCs, we use a transgenic strain, Csf1rMeriCreMer, expressing a tamoxifen-inducible fusion protein of 'improved' Cre recombinaseand two mouse estrogen receptors (Mer-iCre-Mer) under the control of the Csf1r promoter. Hence, the Cre recombinase will be active in Csf1r-expressing cells during a limited time-window. When used with a reporter strain containing a fluorescent protein downstream of a lox-STOP-lox cassette (Rosa26LSL-eYFP), it will lead to the permanent genetic labeling of the cells present at the time of induction but also of their progeny.Administration at E8.5 of the active form of tamoxifen, 4-hydroxytamoxifen (OH-TAM), labels EMPs and macrophages, without labeling yolksac unipotent "primitive" progenitors or fetal HSCs. Thereby, we have characterized the immunophenotype of EMPs and their progeny duringembryonic development, as well as assessed the contribution of yolk sac-derived macrophages to the adult macrophage pools. Further work isrequired to characterize whether primitive progenitor-derived macrophages are also labeled using this approach and whether they can contributeto adult macrophage pools.
Protocol
Animal procedures were performed in accordance with the approved institutional animal care and use committee of the Institut Pasteur (CETEA).
1. In Utero Pulse Labeling in Csf1r MeriCreMer Rosa LSL-YFP Embryos
1. Prepare the stock solution of 4-hydroxytamoxifen (OH-TAM, 50 mg/mL).1. Under the fumehood, open the 25 mg vial of OH-TAM and add 250 µL ethanol (100%).2. Transfer the OH-TAM solution to a 2 mL microcentrifuge tube with a truncated tip and vortex at maximum speed for 10 min.3. Sonicate 30 min in a sonicator bath.4. Add 250 µL of PEG-35 castor oil under the fumehood to obtain a 50 mg/mL stock solution.
NOTE: PEG-35 castor oil is a solvent with amphiphilic properties that binds hydrophobic molecules and solubilizes them in aqueoussolvents.
5. Vortex for approximately 5 min at maximum speed and sonicate 30 min in a sonicator bath.6. Aliquot 90 µL (4.5 mg) per microcentrifuge tube (1 aliquot per injection).7. Store at 4 °C for 1 week or at -20 °C for long term as previously described 13.
2. Prepare the stock solution of Progesterone (10 mg/mL)1. Add 250 µL of 100% Ethanol to 25 mg of progesterone to prepare a 10 mg/100 µL suspension under the fumehood. Vortex gently.2. Add 2250 µL autoclaved sunflower oil to make 10 mg/ml progesterone solution under the hood.3. Vortex for approximately 5 min at maximum speed, aliquot and store at 4 °C. Note that the solution is clear when stored.
3. Tamoxifen administration
NOTE: Embryonic development was estimated considering the day of vaginal plug formation as Embryonic day (E) 0.5. Recombination isinduced by single injection at E8.5 into pregnant Csf1rMeriCreMerfemales 12. Supplement OH-TAM with 37.5 µg per g of Progesterone to reduceabortion rates after tamoxifen administration. Inject at 1 pm (for vaginal plug observed in the morning).
1. On the morning of injection, sonicate an aliquot of the OH-TAM solution for 10 min (or until completely resuspended).2. Add 360 µL NaCl 0.9% under the fumehood to obtain a 10 mg/mL OH-TAM solution and vortex thoroughly. Sonicate until the solution is
clear and completely resuspended (at least 30 min).3. Pre-warm progesterone to room temperature.4. Mix 450 µL of OH-TAM and 225 µL of progesterone in a microcentrifuge tube. Vortex.5. Sonicate at least 10 min and load on to a 1 mL syringe with a 25G needle.6. In the animal facility, weigh the pregnant female (Csf1rMeriCreMer females are in an inbred FVB genetic background and typical weigh
between 25 and 33 g).7. Perform an intra-peritoneal injection by slowly injecting the calculated volume into the mouse. After withdrawing the needle, gently
press on the puncture wound and massage the abdomen to distribute the OH-TAM.
NOTE: The OH-TAM injection dose is 75 mg/kg and the Progesterone dose is 37.5 mg/kg. Table 1 provides the volume to inject intopregnant females.

Journal of Visualized Experiments www.jove.com
Copyright © 2017 Journal of Visualized Experiments July 2017 | 125 | e55305 | Page 3 of 10
Mouse weight (g) Total volume to inject from the mix (µL)
25 281
26 292
27 303
28 315
29 326
30 338
31 348
32 360
33 371
34 382
35 394
Table 1: Injection volume of 4-OH-tamoxifen (OH-TAM). Volume required for a single injection at E8.5 of 75 µg per g (body weight) of OH-TAMsupplemented with 37.5 µg per g of progesterone.
2. Dissection of the Yolk Sac (YS) and Fetal Liver (FL)
NOTE: Rigorous sterile techniques are not necessary when manipulating embryos unless if they are going to be used for long-term culture.Nevertheless, the working area must be clean and covered in foil under absorbent paper.
1. Prepare ice-cold phosphate buffered saline (PBS) and digestion mix (PBS containing 1 mg/mL collagenase D, 100 U/mL Deoxyribonuclease I(DNase I) and 3% fetal bovine serum).
2. Sacrifice pregnant females by cervical dislocation at the required gestation day (e.g. embryonic stage E10.5).3. Pinch the skin just over the genitals and make a small incision at the midline with scissors. Pull the skin toward the head to expose
completely the body wall without fur. Cut the abdominal muscles to expose the internal organs and push the gut to expose the two uterinehorns.
4. With middle-sized blunt forceps, grab the fat-pad attached to the ovary and gently pull the uterus. Cut at the cervical level of the uterine hornsand lift the horns from the peritoneal cavity. Remove the fat-pad to completely free the uterine horns and cut the horns from the ovary on eachside.
5. Put the horns into ice-cold PBS in a 10 mm Petri dish. Rapidly grip the uterus muscle layers at one extremity (cervical end) and slide finescissors between the muscle layer and the decidual tissue to release the embryos with the surrounding decidual tissue.
NOTE: Muscle tend to rapidly contract after the extraction, so this step must be as quick as possible.6. Use one pair of fine forceps to cut off the Reichert's membrane and the placenta.7. Gently remove the yolk sac and place it in a 24-well tissue culture plate with 0.5 mL of digestion mix.
NOTE: At this step, embryonic blood can be collected.1. Immediately after severing the umbilical and vitelline vessels, transfer the embryo into a 12-well tissue culture plate containing 10 mM
ice-cold ethylenediaminetetraacetic acid (EDTA). Decapitate the embryo using sharp fine scissors, trying to limit as much as possibletissue dilaceration. Incubate on ice for 10-15 min and collect the EDTA containing the blood.
8. Remove the amnion surrounding the embryo.9. For stages <E11.5, count the number of somite pairs for better staging of embryos and a better time resolution (each somite pair develops in
~1 h 30 min).10. Cut the head of the embryo using forceps or fine scissors. Transfer the head to a 24-well plate with 0.5 mL digestion mix.
NOTE: The neuroectoderm and brain at later stages are further dissected for flow cytometry analysis; carefully remove the surroundingvascular plexus.
11. Cut the embryo above the hindlimb and remove the forelimbs.12. To isolate the liver, open the thorax using a pair of fine forceps. Pinch anteriorly to the heart and gently pull while using the second
forceps to free the organs from the body.1. Carefully separate the fetal liver from the heart and gut. Transfer the fetal liver to a 24-well plate with 0.5 mL digestion mix. Carefully
monitor the transfer under the dissecting microscope.
13. Collect the tail region (or any other embryo part) for genotyping by polymerase chain reaction assay (PCR).
NOTE: Other tissues and organs can be harvested from E10.5 embryos for a similar analysis using flow cytometry. Blood, head skin, aorta-gonad-mesonephros region (AGM), heart and neuroectoderm can be collected at E10.5. At later stages, lung, kidney, spleen and pancreascan also be collected. A detailed description of the dissection of the AGM at different developmental stages has been previously described 14.
3. Processing of Embryonic Tissues for Flow Cytometry
1. Incubate the organs (placed in the digestion mix) for 30 min at 37 °C.2. Transfer the tissue and enzymatic solution onto a 100 μm strainer placed in a 6-well tissue culture plate filled with 6 ml of FACS buffer (0.5%
Bovine Serum Albumin (BSA) and 2 mM EDTA in 1x PBS). Mechanically dissociate by gently mashing with the black rubber piston of a 2 mLsyringe to obtain a single-cell suspension.

Journal of Visualized Experiments www.jove.com
Copyright © 2017 Journal of Visualized Experiments July 2017 | 125 | e55305 | Page 4 of 10
NOTE: From now on, all steps should be performed at 4 °C.3. Collect the cell suspension with a Pasteur pipette and transfer into a 15 mL tube.4. Spin for 7 min at 320 x g at 4 °C. Discard the supernatant by aspiration.5. Resuspend the pellet in 60 µL Fc-blocking buffer (CD16/CD32 blocking antibody diluted 1/50 in FACS buffer).
1. Transfer 50 µL of the single-cell suspension per well in a round bottom 96 multi-well plate. Incubate for at least 15 min on ice.
NOTE: The staining can also be performed in 5 mL polystyrene FACS tubes when handling a small number of samples.2. Transfer the remaining 10 µL into a 5 mL polystyrene FACS tube to obtain a pool of the samples from each tissue. This pool will serve
as the controls (i.e. unstained samples and fluorescent minus one (FMO) controls for each fluorochrome). Transfer 50 µL of the pool foreach fluorescent minus one (FMO) control (one per fluorochrome) to the 96 multi-well plate.
NOTE: Each FMO control contains all the fluorochrome-coupled antibodies from the antibody panel, except for the one that is beingmeasured. FMOs are used to identify gate boundaries and to control for the spectral overlap in multicolor panels. To correctly addressthe variations in background and autofluorescence between different tissues, it is important to prepare these controls from the poolof samples of each tissue. The appropriate control for YFP expression will be the samples from Cre-negative embryos, which areconfirmed by PCR genotyping.
4. Surface Antigen Staining
1. Prepare the antibody mix in FACS buffer (Table 2). Prepare 50 µL of antibody mix per sample.1. Use the following fluorochrome-coupled antibodies: anti-CD45.2 (clone 104); anti-CD11b (clone M1/70); anti-F4/80 (clone BM8); anti-
AA4.1 (clone AA4.1); anti-Kit (clone 2B8); and anti-Ter119 (clone Ter119).2. Prepare six antibody mixes for the FMO controls in FACS buffer. Prepare 50 µL of antibody mix per control sample.
NOTE: The antibody dilution in the antibody mix is two times more concentrated than the final concentration indicated in the materialstable. For a panel with six fluorochrome-coupled antibodies, 6 FMO controls are prepared. Table 2 provides the composition of theantibody mix and FMO controls for one tube.
Volume (µL) of antibody (Final Volume 50 µL)
Antibody Clone Antibody Mix FMO CD45.2 FMO CD11b FMO F4/80 FMO AA4.1 FMO Kit FMO Ter119
anti-CD45.2 104 1 0 1 1 1 1 1
anti-CD11b M1/70 0.5 0.5 0 0.5 0.5 0.5 0.5
anti-F4/80 BM8 1 1 1 0 1 1 1
anti-AA4.1 AA4.1 1 1 1 1 0 1 1
anti-Kit 2B8 0.5 0.5 0.5 0.5 0.5 0 0.5
anti-Ter119 Ter119 0.5 0.5 0.5 0.5 0.5 0.5 0
FACS buffer 45.5 46.5 46 46.5 46.5 46 46
Table 2: Volume of antibodies using for staining and Fluorescent minus one (FMO) controls. Volume (µL) of antibody required for a finalvolume of 50 µL.
2. Add 50 µL of the antibody mix to the samples in the 96-multiwell plate (final volume during staining is 100 µL). Gently pipette up and downtwice and incubate on ice for 30 min.
3. Spin the 96-multiwell plate for 7 min at 320 x g at 4 °C and discard the supernatant. Resuspend in 200 µL of FACS buffer.4. Repeat wash procedure (step 4.3) twice with 150 µL FACS buffer.5. Filter the samples and the controls (FMOs and unstained pool samples) into 5 ml polystyrene tubes through a 70 μm strainer. Store on ice
until acquisition.
5. Identification of EMPs and YS-derived Macrophages by Flow Cytometry
NOTE: This protocol was optimized using a 4 laser flow cytometer equipped with a 405 nm Violet laser, a 488 nm Blue laser, a 562 nm Yellowlaser and a 638 nm Red laser.
1. Prepare compensation beads for each coupled antibody following the manufacturer's instructions. Use unstained samples and compensationbeads to optimize laser intensities.
2. To identify gate boundaries, use FMO (Fluorescence minus one) controls for each antibody.3. In order to exclude dead cells, add 1 µL of DAPI (1 mg/ml) to the tube (containing 200 µL of stained cell suspension) 1 min before acquisition.
Use the strong DAPI signal and the forward-scattered parameter (FSC) to perform exclusion of dead cells and debris.
NOTE: Use software from the flow cytometer to draw gates during acquisition. Compensation matrix and analysis can be performed aftersample acquisition using other commercially available software.
4. Use forward and side scatter (FSC vs SSC) to perform live cell and doublet discrimination from total events.5. Create fluorescence dot plots in log-scale axis and draw daughter gates to, first, exclude erythrocytes (Ter119+) and, then, to identify
progenitor cells (Kit+) and hematopoietic cells (CD45+ Kitneg) (See Figure 1).6. Create fluorescence histograms to quantify the labeling efficiency of YFP among the different identified populations in the YS (Figure 2), fetal
liver (Figure 3) and brain (Figure 4).

Journal of Visualized Experiments www.jove.com
Copyright © 2017 Journal of Visualized Experiments July 2017 | 125 | e55305 | Page 5 of 10
Representative Results
Genetic fate mapping was achieved by administration at E8.5 of OH-TAM into Csf1r-Mer-iCre-Mer females mated with males carrying aRosa26-LSL-eYFP reporter. In the presence of OH-TAM, excision of the stop cassette leads to the permanent expression of YFP in the cellsexpressing Csf1r. We collected two hematopoietic tissues: the yolk sac and the fetal liver and a non-hematopoietic tissue, the neuroectoderm,from the embryos at E10.5. Single-cell suspensions were obtained by enzymatical and mechanical dissociation and samples were analyzedby flow cytometry after staining with fluorescent-coupled antibodies. After exclusion of dead cells and doublets, single cell suspensions wereanalyzed (Figure 1). All gates were defined using Fluorescence Minus One (FMO) controls. It is recommended to also perform an erythrocyteexclusion (Ter119+ cells) to improve clarity of the analysis (Figure 1B). Using the cell surface markers Kit (progenitor marker) and CD45(hematopoietic cells marker), we were able to distinguish three populations of cells of interest: Kit+ CD45neg; Kit+ CD45low and Kitneg CD45+
(Figure 1). Progenitors were further analyzed based on their expression of AA4.1 (Figures 2-4). Indeed, AA4.1 is a surface marker that allowsthe enrichment of the progenitor population within erythromyeloid progenitors in the yolk sac, as demonstrated in colony forming assays 15.Once the populations of interest were identified, we quantified the YFP labeling efficiency in each population using histograms. Among theyolk sac Kit+ progenitors, both CD45neg (Figure 2A) and CD45low (Figure 2B) cell populations contain AA4.1+ YFP+ cells. However, AA4.1+
YFP+ cells in the liver and brain are only found in the Kit+ CD45low progenitor population (Figure 3B and 4B). Since, the brain is not an activesite of hematopoiesis, progenitors found in this tissue could correspond to circulating progenitors. This also suggests a process of progenitormaturation as they migrate from the yolk sac to the fetal liver and the peripheral tissues. Kit+ progenitors first express AA4.1, irrespectively ofCD45 expression, but by the time they reach circulation and the fetal liver, all AA4.1+ YFP+ progenitors express detectable levels of cell surfaceCD45. Macrophages, defined as F4/80bright CD11b+, were found in the Kitneg CD45+ gate (Figure 2-4). Macrophages in the E10.5 yolk sac, liverand brain were efficiently labeled (60 to 80% of F4/80bright CD11b+ cells are YFP+) by a single OH-TAM administration at E8.5 (Figure 2C, 3C and4C).
To compare labeling efficiency between litters, we recommend that an internal control for recombination efficiency is used. Variability in the levelof expression of the reporter can be observed between experiments, due to variations in developmental timing between litters and mouse strainswhen OH-TAM is injected in utero. Hence, we recommend that embryo staging from E8.5 to E11.5 embryos is performed by somite pair counting.In this protocol, we propose to use the labeling efficiency in the brain resident macrophages (microglia) as a reference to compare the efficiencyof Cre recombination between different experiments and strains (Figure 4C). Other resident macrophages could be used, however microgliawere the first cells to be described as yolk sac-derived macrophages 16 and they represent the most abundant population of tissue residentmacrophages at E10.5. Thus, YFP labeling in microglia can be used to assess the fate-mapping efficiency in each experiment and compare datafrom different litters.
Figure 1: Gating strategy to identify progenitor cells (Kit+ CD45neg and Kit+ CD45low) and differentiated hematopoietic cells (Kitneg
CD45+). (A) Discrimination of live cells and singlets is performed using DAPI staining and Forward and Side scatter (FSC/SSC) parameters.(B) Following red blood cell exclusion (Ter119neg), three populations of cells of interest are identified based on cell surface expression of Kit andCD45: Kit+ CD45neg; Kit+ CD45low and Kitneg CD45+ cells. (C) Csf1r-expressing cells present when OH-TAM is injected and their progeny areidentified in Cre-recombinase positive embryos as expressing YFP compared to the Cre-recombinase negative embryos (confirmed later bypolymerase chain reaction assay, PCR). Please click here to view a larger version of this figure.

Journal of Visualized Experiments www.jove.com
Copyright © 2017 Journal of Visualized Experiments July 2017 | 125 | e55305 | Page 6 of 10
Figure 2: Labeling efficiency in the yolk sac from E10.5 Csf1rMeriCreMer Rosa26LSL-eYFP embryospulsed with OH-TAM at E8.5. (A) Kit+
CD45neg cells are gated based on Kit and CD45 expression on live yolk sac cells (blue gate, left panel). AA4.1 and Kit expression on Kit+
CD45neg cells. Blue gate encloses AA4.1+ Kit+ CD45neg cells (middle panel). Comparison of YFP labeling in AA4.1+ Kit+ CD45neg cells (rightpanel) in Cre negative controls (black) and Cre positive samples (green). Histograms represent the percentage of cells (y-axis) positive forYFP signal (x-axis). (B) Kit+ CD45low cells are gated based on Kit and CD45 expression (blue gate, left panel). AA4.1 and Kit expression onKit+ CD45low cells. Blue gate encloses EMP, as defined as AA4.1+ Kit+ CD45low cells (middle panel). Comparison of YFP labeling in AA4.1+
Kit+ CD45low cells (right panel) in Cre negative controls (black) and Cre positive samples (green). Histograms represent the percentage of cells(y-axis) positive for YFP signal (x-axis). (C) Hematopoietic cells are defined as Kitneg CD45+ and gated in blue (left panel). F4/80 and CD11bexpression on Kitneg CD45+ cells. Macrophages are defined as F4/80bright CD11b+ cells (middle panel). Comparison of YFP labeling in F4/80bright
CD11b+ macrophages (right panel) in Cre negative controls (black) and Cre positive samples (green). Histograms represent the percentage ofcells (y-axis) positive for YFP signal (x-axis). Please click here to view a larger version of this figure.

Journal of Visualized Experiments www.jove.com
Copyright © 2017 Journal of Visualized Experiments July 2017 | 125 | e55305 | Page 7 of 10
Figure 3: Labeling efficiency in the liver from E10.5 Csf1rMeriCreMer Rosa26LSL-eYFP embryospulsed with OH-TAM at E8.5. (A) Kit+ CD45neg
cells are gated based on Kit and CD45 expression on live liver cells (blue gate, left panel). AA4.1 and Kit expression on Kit+ CD45neg cells. Bluegate encloses AA4.1+ Kit+ CD45neg cells (middle panel). Comparison of YFP labeling in AA4.1+ Kit+ CD45neg cells (right panel) in Cre negativecontrols (black) and Cre positive samples (green). Histograms represent the percentage of cells (y-axis) positive for YFP signal (x-axis). (B) Kit+
CD45low cells are gated based on Kit and CD45 expression (blue gate, left panel). AA4.1 and Kit expression on Kit+ CD45low cells. Blue gateencloses EMP, as defined as AA4.1+ Kit+ CD45low cells (middle panel). Comparison of YFP labeling in AA4.1+ Kit+ CD45low cells (right panel) inCre negative controls (black) and Cre positive samples (green). Histograms represent the percentage of cells (y-axis) positive for YFP signal(x-axis). (C) Hematopoietic cells are defined as Kitneg CD45+ and gated in blue (left panel). F4/80 and CD11b expression on Kitneg CD45+ cells.Macrophages are defined as F4/80bright CD11b+ cells (middle panel). Comparison of YFP labeling in F4/80bright CD11b+ macrophages (right panel)in Cre negative controls (black) and Cre positive samples (green). Histograms represent the percentage of cells (y-axis) positive for YFP signal(x-axis). Please click here to view a larger version of this figure.

Journal of Visualized Experiments www.jove.com
Copyright © 2017 Journal of Visualized Experiments July 2017 | 125 | e55305 | Page 8 of 10
Figure 4: Labeling efficiency in the brain from E10.5 Csf1rMeriCreMer Rosa26LSL-eYFP embryospulsed with OH-TAM at E8.5. (A) Kit+ CD45neg
cells are gated based on Kit and CD45 expression on live brain cells (blue gate, left panel). AA4.1 and Kit expression on Kit+ CD45neg cells. Bluegate encloses AA4.1+ Kit+ CD45neg cells (middle panel). Comparison of YFP labeling in AA4.1+ Kit+ CD45neg cells (right panel) in Cre negativecontrols (black) and Cre positive samples (green). Histograms represent the percentage of cells (y-axis) positive for YFP signal (x-axis). (B) Kit+
CD45low cells are gated based on Kit and CD45 expression (blue gate, left panel). AA4.1 and Kit expression on Kit+ CD45low cells. Blue gateencloses EMP, as defined as AA4.1+ Kit+ CD45low cells (middle panel). Comparison of YFP labeling in AA4.1+ Kit+ CD45low cells (right panel) inCre negative controls (black) and Cre positive samples (green). Histograms represent the percentage of cells (y-axis) positive for YFP signal(x-axis). (C) Hematopoietic cells are defined as Kitneg CD45+ and gated in blue (left panel). F4/80 and CD11b expression on Kitneg CD45+ cells.Macrophages are defined as F4/80bright CD11b+ cells (middle panel). Comparison of YFP labeling in F4/80bright CD11b+ macrophages (right panel)in Cre negative controls (black) and Cre positive samples (green). Histograms represent the percentage of cells (y-axis) positive for YFP signal(x-axis). Please click here to view a larger version of this figure.
Discussion
The different waves of hematopoietic precursor cells partially overlap within a short time frame, which makes the analysis of the contribution ofeach wave of developmental hematopoiesis to immune cells technically very challenging.
Tamoxifen-inducible Cre systems offer the opportunity to tag specific cells in a temporally inducible manner and to perform lineage analysis inembryos or adults, without the need for ex vivo or in vitro culture or transplantation. In tamoxifen-inducible Cre strains, a fusion gene is createdbetween a bacterial Cre recombinase and a mutant form of the ligand binding domain of the human estrogen receptor (CRE-ER) or betweenan improved single-point mutant Cre and two mouse estrogen receptors (Mer-iCre-Mer). Fusion of Cre with estrogen receptors leads to thecytoplasmic sequestration of Cre by Hsp90, thereby preventing nuclear Cre-mediated recombination. Tamoxifen (TAM) is metabolized by theliver into 4-hydroxytamoxifen (OH-TAM), its active metabolite with high binding affinity for estrogen receptor. OH-TAM binding to the fusion Creleads to the disruption of the interaction with Hsp90, permitting its translocation to the nucleus and initiation of Cre-mediated recombination.Injection of TAM or OH-TAM in utero into pregnant females has been shown to activate recombination in the developing embryo. Tamoxifenadministration during pregnancy can lead to abortion and thus reduces litter size but it also prevents birth if delivered after mid-gestation, in

Journal of Visualized Experiments www.jove.com
Copyright © 2017 Journal of Visualized Experiments July 2017 | 125 | e55305 | Page 9 of 10
which case pup delivery through a caesarean operation is required. To counterbalance tamoxifen effects during pregnancy, we supplement OH-TAM administration with a half-dose of progesterone, in order to improve survival of embryos and reduce the risk of abortions 17.
Several routes can be employed to deliver TAM or OH-TAM into pregnant females. Currently oral gavage or intra peritoneal (ip) injection is usedfor tamoxifen. OH-TAM has the advantage to be immediately available, as it does not require to be metabolized by the liver of the pregnantdam. However, while tamoxifen is very easy to dissolve in corn oil, OH-TAM is very difficult to prepare using the same technique and results inan emulsion. This has been a limiting step in employing OH-TAM for in utero pulse labeling. We have adapted the protocol for preparation ofOH-TAM developed by the group of J.F. Nicolas 13, where they use PEG-35 castor oil, a solvent with amphiphilic properties to solubilize OH-TAM, as tamoxifen dissolution is one of the most critical steps in the procedure. This allows for reproducible and optimal preparation of OH-TAM and considerably shortens the time of tamoxifen preparation. Further, it is necessary to adapt the concentration of OH-TAM to inject whenusing different inducible Cre strains. The combination of a viability dye (DAPI) and size (FSC) is critical to remove dead cells and cellular debris,respectively. Dead cells and debris are highly autofluorescent in most of the violet, blue and red laser detectors, and can hamper flow cytometricanalysis. Further, we do not recommend fixing the cells after staining prior to analysis with the flow cytometer. Fixation can lead to changes incell morphology and thus renders difficult size discrimination based on Forward and Side Scatter (FSC vs. SSC). Further, fixation of samples withPFA leads to a significant loss of YFP fluorescent intensity.
The main limitation within this protocol is that the populations are not tested on their functionality and differentiation potential. In order toovercome this, cells can be sorted following a similar protocol using a Fluorescently-activated cell sorter (FACS) to perform colony-forming assay.In this case, the procedure must be performed under sterile conditions and use of fetal bovine serum (FBS) in the FACS buffer, instead of BSA,is highly recommended. The low labeling efficiency achieved with this technique and the consequently low number of YFP+ cells of interest perembryonic tissue is a major challenge in the study of EMP phenotype. This protocol uses a 4-laser flow cytometer. A flow cytometer with 3 laserscan also be used but it is important to adapt the antibody panel to take into account the increased spectral overlap between dyes. Additionally,titration of antibodies is required to find the appropriate concentration when changing the antibody panel and we recommend performing titrationof antibodies and validation of the new antibody panel in a pilot experiment where all embryos per tissue are pooled, in order to increase thenumber of cells analyzed per tissue.
The field of developmental biology has been revolutionized by the Cre/Lox method, which allows permanent labeling of cells in situ. Thisapproach achieves tissue- or cell type -specificity through expression of the Cre recombinase under the control of a specific promoter. Inour case, we chose to study the expression of the Cre recombinase under the control of the promoter of Csf1r (Colony Stimulating Factor 1Receptor), an important mitogenic and growth factor receptor for macrophages and their progenitors, using a strain developed by the groupof J. Pollard 18. The advantage of a fate mapping strategy based on Csf1r expression compared to other published strategies is that it allowsthe labeling of yolk sac-derived cells (EMP and macrophages) without labeling any fetal HSCs 12. The Cx3cr1CreERT2 strain can also label yolksac cells without labeling HSCs 19, however it can only label macrophages and macrophage precursors but it does not label EMP progenitors1. The Cx3cr1CreERT2 strain has the same caveat as the Csf1rMerCreMer line, since it cannot distinguish between macrophages derived fromunipotent primitive macrophage progenitors or from EMP. When tamoxifen is administered as early as E7.5 in both Runx1MerCreMer16 andKitMerCreMer20, peripheral blood cells are always labeled in adults, albeit at a very low efficiency, thus demonstrating labeling of HSCs duringdevelopment. Further, KitMerCreMer fate mapping labels yolk sac Kit+ Sca1+ progenitors while EMP are Kit+ Sca1 negative 11. The Csf1rMeriCreMer
strain is not a knock-in but it was generated by classical additive transgenesis, thus expression of the Cre may not fully recapitulate endogenousexpression of Csf1r. However, this has the advantage to avoid any potential developmental defects due heterozygous expression of Csf1r.This is an important factor to take to account when analyzing other fate mapping strategies used for developmental hematopoiesis studies,such as Runx1MerCreMer, KitMerCreMer and Cx3cr1CreERT2, where the inducible Cre is inserted-in the endogenous locus. For both Runx1MerCreMer
and Kit MerCreMer, developmental hematopoietic defects have been described in heterozygous embryos. Collectively, the method presentedhere allows to investigate yolk sac EMP biology during development and also yolk sac-derived macrophages found in adult tissues anddistinct from HSC-derived macrophages. This will improve our current understanding of this lineage of resident macrophages and their specificfunctions in adulthood. The immunophenotypic characterization of EMPs has been improved recently using cell sorting and colony formingassays, demonstrating that yolk sac EMP specifically express CD41 and CD16/32 in early stages of development 11. However, the specificityof expression of CD41 and CD16/32 needs further characterization from E10.5 onwards, especially in the fetal liver niche, using fate-mappingmodels. Indeed, whether CD41 and CD16/32 expression is still specific to EMP when compared to fetal HSCs and HSC-derived progenitors inthe E10.5 to E14.5 fetal liver need to be elucidated. The presented method allows to label EMP generated in the yolk sac and to follow themduring embryonic development and it will contribute to a more detailed characterization of EMP phenotype when they seed the fetal liver.
This method could be important in the near future to study EMP differentiation pathways. While EMPs emerge from the yolk sac endotheliumfrom E8.5 to E10.5 4, this method only allows to label a fraction of the progenitors emerging between E8.5-E9.5. Therefore, a limitation ofthis method is that only a small fraction of EMP is labeled, thus rendering difficult the analysis in classical loss-of-function studies with floxedalleles for candidate genes. Alternatively, sparse labeling could become an advantage in clonal studies of EMP differentiation in vivo, usingclonal reporter. Nevertheless, the labeling efficiency needs to be characterized for each floxed reporter or floxed allele used, as recombinationefficiency of floxed constructs depends on genomic locus (floxed alleles) or the Rosa26 reporter construct. Indeed, different Rosa26 reporterlines are available with different promoters and it is reported that Rosa26tdTomato and Rosa26mTmG strain have higher recombination efficiencythan the Rosa26LSL-eYFP line. The reporter mouse strain used in this protocol is Rosa26LSL-eYFP line, which cannot provide information regardingthe dynamic process of progenitor maturation mentioned in the results section. The question of maturation process can be partially addressedusing different reporter strains like the Rosa26mTmG. In such strain, cells can be distinguished based on the time elapsed since the recombinationevent. All cells in the Rosa26mTmG strain express membrane-bound tdTomato fluorescent protein and Cre recombination excises the tdTomatocassette and allows for expression of membrane-bound GFP. Since tdTomato has a long half-life, cells that still contain tdTomato but havestarted to express the GFP (shortly after recombination) are tdTomato+ GFPlow/int and can be distinguished from tdTomatoneg GFP+ cells that donot express tdTomato anymore and express higher levels of GFP (later after recombination).
As discussed above, OH-TAM preparation is a critical step to consistently deliver similar doses of OH-TAM between experiments and toreduce tamoxifen side effects. Progesterone co-administration is also useful to limit deleterious effect of tamoxifen on pregnancy. Anothercritical element of the protocol is the viability of the single-cell suspension obtained from different embryonic tissues. We usually obtain >90%viable cells for flow cytometric analysis. To achieve this, it is critical to follow all the steps rapidly and to maintain all samples on ice after tissue

Journal of Visualized Experiments www.jove.com
Copyright © 2017 Journal of Visualized Experiments July 2017 | 125 | e55305 | Page 10 of 10
collection. Appropriate controls such as unstained samples, single stains and fluorescent minus one (FMO) controls are required to identify gateboundaries and to control for the spectral overlap in multicolor panels. Changes in the antibody need to be validated in terms of antibody titrationand spectral overlap. Finally, the choice of the Rosa26 reporter strain needs to be adapted to the scientific question that is investigated.
Disclosures
The authors have nothing to disclose.
Acknowledgements
The authors thank Prof Frederic Geissmann and Prof Christian Schulz for insightful discussions; Dr Hannah Garner for critical reading of themanuscript, Dr Xavier Montagutelli and Dr Jean Jaubert and the staff of the Institut Pasteur animal facility for support with mouse husbandry;and Pascal Dardenne and Vytaute Boreikaite, an Amgen Scholar, for their technical assistance. Research in the E.G.P. laboratory is fundedby the Institut Pasteur, the CNRS, the Cercle FSER (FRM and a starting package from the Institut Pasteur and the REVIVE consortium. L.I. issupported by a PhD fellowship from the REVIVE consortium.
References
1. Bertrand, J. Y. et al. Three pathways to mature macrophages in the early mouse yolk sac. Blood. 106 (9), 3004-3011 (2005).2. Palis, J., Robertson, S., Kennedy, M., Wall, C., & Keller, G. Development of erythroid and myeloid progenitors in the yolk sac and embryo
proper of the mouse. Development. 126 (22), 5073-5084 (1999).3. Chen, M. J. et al. Erythroid/myeloid progenitors and hematopoietic stem cells originate from distinct populations of endothelial cells. Cell Stem
Cell. 9 (6), 541-552 (2011).4. Frame, J. M., Fegan, K. H., Conway, S. J., McGrath, K. E., & Palis, J. Definitive Hematopoiesis in the Yolk Sac Emerges from Wnt-
Responsive Hemogenic Endothelium Independently of Circulation and Arterial Identity. Stem Cells. (2015).5. Kieusseian, A., Brunet de la Grange, P., Burlen-Defranoux, O., Godin, I., & Cumano, A. Immature hematopoietic stem cells undergo
maturation in the fetal liver. Development. 139 (19), 3521-3530 (2012).6. Gomez Perdiguero, E. et al. Tissue-resident macrophages originate from yolk-sac-derived erythro-myeloid progenitors. Nature. 518 (7540),
547-551 (2015).7. Hoeffel, G. et al. C-Myb(+) erythro-myeloid progenitor-derived fetal monocytes give rise to adult tissue-resident macrophages. Immunity. 42
(4), 665-678 (2015).8. Kierdorf, K., Prinz, M., Geissmann, F., & Gomez Perdiguero, E. Development and function of tissue resident macrophages in mice. Semin
Immunol. 27 (6), 369-378 (2015).9. Houssaint, E. Differentiation of the mouse hepatic primordium. II. Extrinsic origin of the haemopoietic cell line. Cell Differ. 10 (5), 243-252
(1981).10. Cumano, A., & Godin, I. Ontogeny of the hematopoietic system. Annu Rev Immunol. 25 745-785 (2007).11. McGrath, K. E. et al. Distinct Sources of Hematopoietic Progenitors Emerge before HSCs and Provide Functional Blood Cells in the
Mammalian Embryo. Cell Rep. 11 (12), 1892-1904 (2015).12. Schulz, C. et al. A lineage of myeloid cells independent of Myb and hematopoietic stem cells. Science. 336 (6077), 86-90 (2012).13. Chevalier, C., Nicolas, J. F., & Petit, A. C. Preparation and delivery of 4-hydroxy-tamoxifen for clonal and polyclonal labeling of cells of the
surface ectoderm, skin, and hair follicle. Methods Mol Biol. 1195 239-245 (2014).14. Bertrand, J. Y., Giroux, S., Cumano, A., & Godin, I. Hematopoietic stem cell development during mouse embryogenesis. Methods Mol Med.
105 273-288 (2005).15. Bertrand, J. Y. et al. Characterization of purified intraembryonic hematopoietic stem cells as a tool to define their site of origin. Proc Natl Acad
Sci U S A. 102 (1), 134-139 (2005).16. Ginhoux, F. et al. Fate mapping analysis reveals that adult microglia derive from primitive macrophages. Science. 330 (6005), 841-845
(2010).17. Nakamura, E., Nguyen, M. T., & Mackem, S. Kinetics of tamoxifen-regulated Cre activity in mice using a cartilage-specific CreER(T) to assay
temporal activity windows along the proximodistal limb skeleton. Dev Dyn. 235 (9), 2603-2612 (2006).18. Qian, B. Z. et al. CCL2 recruits inflammatory monocytes to facilitate breast-tumour metastasis. Nature. 475 (7355), 222-225 (2011).19. Yona, S. et al. Fate mapping reveals origins and dynamics of monocytes and tissue macrophages under homeostasis. Immunity. 38 (1),
79-91 (2013).20. Sheng, J., Ruedl, C., & Karjalainen, K. Most Tissue-Resident Macrophages Except Microglia Are Derived from Fetal Hematopoietic Stem
Cells. Immunity. 43 (2), 382-393 (2015).

71
RESULTS
Part 1. Yolk sac. Paper manuscript to be submitted

- 1 -
Two sequential and independent pathways of erythromyeloid
progenitor commitment in their niche of emergence
Authors
Lorea Iturri1-2, Laina Freyer1, Anne Biton3, Pascal Dardenne1, Yvan Lallemand1 and Elisa
Gomez Perdiguero1.
1Institut Pasteur, Macrophages and endothelial cells, Department of Developmental and Stem
Cell Biology, UMR3738 CNRS, F-75015 Paris, France; 2Sorbonne Université, Collège
Doctoral, F-75005 Paris, France ; 3Institut Pasteur, Bioinformatics and Biostatistics Hub (C3BI),
Paris, France.
Correspondence: [email protected]
Key points
• EMP commitment towards myeloid and erythroid lineages revealed at the single cell
level in the yolk sac niche.
• Mk develop directly from EMPs in a Myb-independent manner and then from EMP-
derived CD131+ Myb-dependent MEP progenitors.

- 2 -
Abstract:
The extra-embryonic yolk sac contains the first definitive multipotent cells of the
embryo that are denominated as erythromyeloid progenitors (EMP). EMPs emerge in the yolk
sac vasculature prior to the intraembryonic generation of Hematopoietic Stem Cells (HSCs)
and they give rise to erythroid, monocyte/granulocytes, mast cells and macrophages, the latter
in a Myb-independent manner. Different groups have isolated yolk sac EMPs in their niche of
origin according to a phenotype that is based on membrane markers. Whereas these classical
immunophenotyping approaches only capture late megakaryocyte and erythroid commitment
at these early developmental stages, bona fide EMPs can be distinguished from their
committed derived progenitors at the single cell gene expression level. Here, we uncover the
heterogeneity and progressive commitment of yolk sac HSC-independent EMP progenitors
into myeloid, megakaryocyte and erythroid fates in their niche of emergence, prior to
colonization and expansion in the fetal liver. We further demonstrate that EMPs commit and
differentiate within the yolk sac not only into macrophages but also into megakaryocytes
(Mks). EMPs first commit towards Mk in a Myb-independent manner that does not require a
shared Mk-E common progenitor. Such shared Mk-E progenitor (or MEP) is produced later by
EMPs in the yolk sac and is absent in Myb-deficient embryos. We identified CD131 (Csf2rb)
as a novel marker of these EMP-derived Myb-dependent MEPs in the yolk sac that colonize
the fetal liver and differentiate there into Mk but mostly erythrocytes.
Introduction
Erythromyeloid progenitors (EMPs) are developmentally restricted hematopoietic
progenitors that emerge from the hemogenic endothelium of the yolk sac and have the
potential to give rise to definitive hematopoietic cells from both the erythroid and myeloid
lineages (Frame et al., 2016; Gomez Perdiguero et al., 2015; Kasaai et al., 2017; McGrath et
al., 2015). While the extent of their contribution to fetal and adult hematopoietic systems is still
under investigation, EMP-derived hematopoiesis is required for embryo survival through

- 3 -
erythrocyte production (Chen et al., 2011) and for the generation of certain adult resident
macrophage populations, such as brain microglia, liver Kupffer cells and epidermal
Langerhans cells (Ginhoux et al., 2010; Schulz et al., 2012) and adult resident mast cells
(Gentek et al., 2018; Li et al., 2018).
EMPs emerge from the yolk sac vasculature from E8.25 to E11.5, where they are
observed as intravascular cell clusters (Frame et al., 2016). In contrast to Hematopoietic Stem
Cells (HSCs), EMP emergence is regulated by canonical Wnt signalling but does not require
Notch signalling (Hadland et al., 2004) or blood flow (Frame et al., 2016; Kasaai et al., 2017).
Importantly, while HSCs need to colonize the fetal liver in order to differentiate (Godin et al.,
1999; Kieusseian et al., 2012), EMPs can also differentiate in situ in the yolk sac at least into
macrophages, but other lineages have not been formally investigated. EMPs then enter the
bloodstream at the beginning of circulation and colonize the fetal liver, where they expand and
differentiate into erythrocytes, megakaryocytes, macrophages, monocytes, granulocytes and
mast cells (Gentek et al., 2018; Gomez Perdiguero et al., 2015; Hoeffel et al., 2015; McGrath
et al., 2015; Stremmel et al., 2018).
Another key difference between EMPs and HSCs is their dependence on the
transcription factor Myb. While both progenitors express Myb (Hoeffel et al., 2015;
Mukouyama et al., 1999), only HSCs require Myb for their survival and self-renewal
(Mukouyama et al., 1999; Sumner et al., 2000). Consequently, Myb-deficient embryos lack
HSC and HSC-derived cells (Mucenski et al., 1991) but still possess normal EMP-derived
resident macrophages (Schulz et al., 2012).
EMPs have been characterized by different groups by the expression of Kit, CD41 and
CD16/32(McGrath et al., 2015) or Kit, AA4.1 and low levels of CD45 (Bertrand et al., 2005;
Gomez Perdiguero et al., 2015), which can all be expressed by HSC themselves or HSC-
derived progenitors. Indeed, from E9.5-10.5 onwards, HSCs emerge from the dorsal aorta
hemogenic endothelium and contribute to circulating and fetal liver progenitor pools. As such,

- 4 -
the study of EMP-derived hematopoiesis requires control of progenitor labelling in a short
temporal window. Unfortunately, most tamoxifen-inducible Cre/lox fate mapping strategies
based on targeting of hemogenic endothelium (Runx1MeriCreMer; Cdh5CreERT2; Tie2MerCreMer) lead
to labelling of both EMPs and HSCs, even when tamoxifen or 4-hydroxytamoxifen (OHT) is
delivered very early in development (E6.5-E7.5)(Gentek et al., 2018; Gomez Perdiguero et
al., 2015; Samokhvalov et al., 2007). We thus decided to employ the Csf1rMeriCreMer fate
mapping strategy, as it has been demonstrated that it labels EMPs without any HSC labeling
when OHT is administered at E8.5 (Gomez Perdiguero et al., 2015).
HSC erythro-myeloid commitment and differentiation is a process relatively well
understood. In the adult bone marrow, HSC give rise to common myeloid progenitors (CMP)
after sequentially losing self-renewal (multipotent progenitor, MPP) and lymphoid potential
(Debili et al., 1996; Akashi et al., 2000). CMP hold the potential to form myeloid and erythroid
lineages, and could be thus considered as a functional equivalent to EMP. CMPs then
differentiate into megakaryocyte/erythrocyte progenitors (MEP) and granulocyte/monocyte
progenitors (GMP). Lineage-determining transcription factors orchestrate the activation of
specific gene expression programs that lead to commitment and differentiation (Orkin and
Zon, 2008), such as Pu.1 for myeloid fate (Scott et al., 1994) and Gata1 for erythroid lineages
(Pevny et al., 1991), and their interplay is essential for myeloid versus erythroid lineage choice
(Hoppe et al., 2016; Nerlov et al., 2000; Zhang et al., 2000).
Nevertheless, the dynamics and differentiation steps by which EMP give rise to diverse
blood and immune cell types in development are currently unclear. The paucity of progenitor
cells, the coexistence with HSC and the limited expression of specific cell surface markers at
these stages have to date hampered the faithful characterization of definitive yolk sac
progenitors. We thus embarked in an unbiased characterization of yolk sac progenitor
heterogeneity by combining high-parameter flow cytometry, single cell RNA-sequencing

- 5 -
(scRNA-seq) and functional potency assays together with fate mapping analysis of wild type
and Myb mutant embryos.
Methods
Animals. Csf1rMeriCreMer (Qian et al., 2011), PU.1eYFPGATA1mCherry(Hoppe et al., 2016), c-myb
mutant(Mucenski et al., 1991) and RosaYFP(Srinivas et al., 2001) reporter mice have been
previously described. Csf1rMeriCreMer mice were on FVB background, other mice were on
C57BL/6 background. Csf1rMeriCreMer mice were generated by J. W. Pollard. Myb-/- mice were
generated by M. L. Mucenski and were a kind gift from F. Geissmann, Centre for Molecular
and Cellular Biology of Inflammation (CMCBI), King’s College London, London SE1 1UL, UK.
RosaYFP (B6.129X1-Gt(ROSA)26Sortm1(EYFP)Cos/J) reporter mice were purchased from
The Jackson Laboratory. Embryonic development was estimated considering the day of
vaginal plug formation as 0.5 day embryonic day (E0.5), and staged by developmental criteria.
Animals procedures were performed in accordance with the Care and Use Committee of the
Institut Pasteur (CETEA) guidelines and with their approval.
PCR genotyping of Csf1rMeriCreMer (Qian et al., 2011), PU.1eYFPGATA1mCherry(Hoppe et al., 2016)
and c-myb mutant(Mucenski et al., 1991) embryos was performed according to protocols
described previously. No randomization method was used and the investigators were blinded
to the genotype of the animals during the experimental procedure. Results are displayed as
mean ± s.e.m. All experiments included littermate controls.
In utero pulse labelling of Csf1r+ haematopoietic progenitors. Heterozygous
Csf1rMeriCreMer females were crossed to homozygous RosaYFP reporter males in the case of
figures 2-5. Heterozygous Myb+/- females were crossed with males homozygous for
Csf1rMeriCreMer;RosaYFP and heterozygous for Myb+/- in the case of figure 6. Recombination was
induced by single injection at E8.5 or E9.5 of 75 µg/g (body weight) of 4-hydroxytamoxifen
- 6 -
(Sigma) into pregnant females. The 4-hydroxytamoxifen was supplemented with 37.5 µg per
g (body weight) progesterone (Sigma).
Processing of tissues for flow cytometry. Pregnant females were euthanized by cervical
dislocation and embryos ranging from embryonic day (E) 8 to E14.5 were dissected out from
the uterus and washed in 4°C phosphate buffered saline (PBS, Invitrogen). Harvest of
embryonic blood was performed by severing the umbilical and vitelline vessels and
immediately transferring the embryo into a 12-well tissue culture plate filled with 2 mM 4°C
EDTA, embryos smaller than E11.5 were decapitated in the well. Organs were dissected in
PBS at 4°C and digested for 30 minutes at 37°C in with 0.5 ml digestion solution (PBS
containing 1mg/ml Collagenase D (Roche), 100 U/ml DNAse I (Sigma) and 3% fetal calf serum
(Invitrogen)). Tissues were then mechanically disrupted with a 2ml-syringe piston on top of
100 µm filters to obtain a single cell suspension in FACS buffer containing PBS with 0.5%
bovine serum albumin (BSA) and 2mM ethylene-diamine-tetra-acetic acid (EDTA).
Flow cytometric analysis of embryonic tissues and cell sorting. Cells were centrifuged at
320g for 7 min, resuspended in 4°C FACS buffer, plated in multi-well round-bottom plates and
immunolabelled for FACS analysis. After 15 min incubation with purified anti-CD16/32
(FcRIII/II) diluted 1/50 or ChromPure Mouse IgG diluted 1/20, antibody mixes were added
and incubated for 30 min. Where appropriate, cells were further incubated with streptavidin
conjugates for 20 min.
Samples were acquired using a Beckman Coulter CytoFLEX LX or a BD Symphony A5 cell
analyser. Cells were sorted using a BD FACSAria III cell sorter. All data was analysed using
FlowJo 10.7. t-Distributed Stochastic Neighbour Embedding (t-SNE) representation was
obtained using FlowJo 10.7 default parameters. Cell density was calculated using the
following formula: Cells/tissue = Count x Vsample/Vacq x Vblock/Vplated; with Count, quantification
by FlowJo; Vsample, volume of the analysed sample; Vacq, volume acquired by cytometer; Vblock,

- 7 -
volume in antibody blocking buffer after first centrifugation; Vplated, volume of Vblock plated with
antibody mix.
Table1: Antibodies used for flow cytometry and cell sorting
Antigen Conjugate Clone Company
AA4.1 PE-CF594 AA4.1 eBioscience
CD131 BV421 JORO50 BD Pharmingen
CD131 PE JORO50 BD Pharmingen
CD16/32 BV605 2.4G2 BD Biosciences
CD16/32 FITC 2.4G2 BD Biosciences
CD16/CD32 (Fc Block™) 2.4G2 BD Biosciences
CD19 Biotin 1D3 BD Biosciences
CD3 Biotin 145-2C11 BD Biosciences
CD34 Biotin RAM34 ThermoFisher
CD34 BV421 RAM34 BD Biosciences
CD4 Biotin H129 BD Biosciences
CD41 BV510 MWReg30 Biolegend
CD41 PE MWReg30 SONY
CD45 BUV395 30-F11 BD Biosciences
CD45.2 APC-Cy7 104 Sony
CD61 PE-Cy7 2C9.G2 BD Biosciences
CD71 AF647 C2 BD Biosciences
CD8 Biotin 53-6.7 Biolegend
ChromPure Mouse IgG Jackson ImmunoResearch
F4/80 Biotin BM8 Biolegend
F4/80 BV421 BM8 SONY
Gr1 Biotin RB6-8C5 BD Pharmingen
Gr1 APC RB6-8C5 BD Pharmingen
Kit APC-Cy7 2B8 SONY
Kit PE 2B8 BD Pharmingen
Streptavidin BUV737
BD Pharmingen
Streptavidin BV785 BD Pharmingen
Streptavidin PE-Cy7 Biolegend
Ter119 Biotin TER-119 Biolegend
Ter119 PerCP-Cy5.5 TER-119 Biolegend
Colony forming assays. Colony-forming-unit-culture (CFU-C) assays were performed
sorting single cells into 96-well Nunc™ UpCell™ Microplates (ThermoFisher) in complete
medium OPTI-MEM with 10% FCS, penicillin (50 units/ml), streptomycin (50 μg/ml) and β-
mercaptoethanol (50 μM) 493 supplemented with a saturating amount of the following

- 8 -
cytokines: M-CSF (5 ng/ml), GM-CSF (2.5 ng/ml), SCF in saturation, EPO (2ng/ml) and TPO
(5ng/ml) for myeloid and erythroid differentiation. SCF was obtained from the supernatant of
myeloma cell lines (provided by F. Melchers) transfected with cDNA encoding those cytokines.
Cultures were grown at 37°C with 5% CO2 and colonies scored after 12 days. Plates were
incubated at 4°C for 20 minutes and colonies were transferred into multi-well round-bottom
plates and washed once with FACS buffer. Wells were stained following same protocol with
antibodies against Ter119, CD41, CD11b, F4/80 and Gr-1 and analysed by flow cytometry
using a Beckman Coulter CytoFLEX LX.
Experimental design for scRNA-Seq. Yolk sac YFP+ single cells from E9.5 Csf1riCre
RosaYFP (n=3 litters, 27-29sp) and E10.5 Csf1rMeriCreMer RosaYFP (n=6 litters, 34-38sp)
embryos pulsed at E8.5 were stained with fluorescent antibodies for the populations A, B, C
D, Mf and Mk. Cells were index-sorted into 384-well plates with a lysis mix containing UPW,
10% Triton X-100 and RNasin plus 40U/μl (Promega N2611) with MARS-seq barcodes
(prepared by Baptiste Saudemont (Keren-Shaul et al., 2019)) and immediately placed in dry
ice after sorting. Plates were stored until processing at -80°C.
The plates were processed following the MARS-Seq pipeline (Jaitin et al., 2014) and
sequenced in a Illumina NextSeq 500 sequencer using NextSeq® 500/550 High Output Kit v2
(75 cycles) (Illumina). Nine plates were sequenced in three independent sequencing runs,
megakaryocytes and macrophages were sorted in the first run (Figure S3A-E)
Cell and gene filtering for scRNA-Seq analysis. Cells for which mitochondrial genes took
up more than 5% of the total UMI counts, and that had less than 2,750 detected genes were
filtered out. We excluded 38 cells out of 1990 that were detected as doublet by the scDblFinder
R package (Germain, 2020) using default parameters and running the analysis for each plate
separately. In total, we analysed 1952 cells from 3420 sorted. The genes detected in less than
5% of the cells of each condition (E9.5 and E10.5), the ERCC-spike-ins, and all mitochondrial

- 9 -
genes were excluded. In total, 10,188 genes were kept and 781 and 1,234 cells were selected
in the E9.5 and E10.5 conditions, respectively.
Data normalization. Cells were pre-clustered within each plate with the ‘quickCluster’ function
of the scran R package(Lun et al., 2016) using a minimum cluster size of 50 cells. Size factors
were calculated using the ‘computeSumFactors’ function from the scran R package. Size
factors were then rescaled to adjust for differences in sequencing depth between plates and
used to normalize the UMI counts of each cell using the multiBatchNorm function of the R
batchelor package(Haghverdi et al., 2018). The resulting normalized and log-transformed
counts were used for further processing.
Selection of highly variable genes. A mean-variance trend was fitted for each gene using
the ‘modelGeneVar’ and ‘combineVar’ functions from the scran R package using plate as a
blocking factor. The top 3,000 genes with larger variance than the fitted trend were retained
as the highly variable genes (HVGs).
Batch effect correction. Batch effects were removed by hierarchically merging the samples
using the ‘reduceMNN’ function of the batchelor R package(Haghverdi et al., 2018) on 50
principal components calculated with the multiBatchPCA function from the HVGs only. The
samples were first merged across plates within each sequencing run for each condition (E9.5
and E10.5) separately, then across sequencing runs for each condition, and finally across
conditions from the oldest (E10.5) to youngest (E9.5) time point. The E9.5 condition contained
three batches: two plates with >300 cells from the same sequencing run and one plate with
~80 cells from a different sequencing run. We thus first merged the two plates with the largest
number of cells that were coming from the same sequencing run and then merged them with
the third plate that had a smaller number of cells in order to make sure we were maximising
the number of similar cells during the merging.
- 10 -
The corrected low-dimensional coordinates of each cell returned by fastMNN were used as
input for computation of clustering and UMAP (Uniform Manifold Approximation and Projection
for Dimension Reduction) for visualization. UMAPs were calculated using the ‘runUMAP’
function of the Seurat package(Stuart et al., 2019) with 16 neighbouring points (neighbours =
16) and 0.32 as the minimal distance to be considered (min.dist = 0.32).
Cell Clustering. A shared nearest-neighbor graph (SNN) was built using the ‘buildSNNGraph’
function of the scran R package. Communities were searched for in the SNN graph using the
method of random walks implemented in the `cluster_walktrap` function of the igraph v1.2.5
package. The number k of nearest neighbors used in the SNN graph differed depending on
the dataset under consideration: k = 13 was used for the full yolk sac dataset and k = 9 for the
E9.5 yolk sac dataset.
Gene differential expression between clusters. Differential expression analyses were
performed by computing pairwise t-tests using the ‘findMarkers’ function in the scran R
package. The option ‘pval.type="some"’ was used to only consider markers different ial in at
least half of the pairwise comparisons between clusters.
Gene set enrichment analysis. Using the genes detected as differentially expressed
between each cluster and at least half of the other clusters (FDR < 1%), we performed an
over-representation analysis using the MSigDB
(http://software.broadinstitute.org/gsea/msigdb) and the GeneSetDB databases
(https://www.genesetdb.auckland.ac.nz/haeremai.html).
Pseudotime analysis. Cell lineage trajectories were inferred using the R package slingshot
v1.4.0 (Street et al., 2018). The UMAP coordinates and the cell clustering assignments were
used as inputs. The EMP1 cluster was used as the root node and the ‘My’ ,’Mk2’, and ‘pEry2’
clusters as ending points of the trajectories. We used ‘shrink.method="density"’ and the
parameter “extend='n'” was used in the ‘getCurves’ function in order to ask for the trajectories

- 11 -
to not extend beyond the center of the endpoint clusters. In order to find genes associated
with each trajectory, a general additive model (GAM) was fitted to each gene as recommended
in the slingshot vignette, p-values were corrected using the Bonferroni method.
Results
Spatio-temporal dynamics of yolk sac progenitor subpopulations endowed with
progressive commitment to erythroid lineages
We sought to further characterize the heterogeneity among yolk sac (YS) definitive
progenitors using high parameter flow cytometry with fluorescently-conjugated antibodies
against well-known hematopoietic and progenitor markers. We probed expression of CD45
(pan-hematopoietic marker), AA4.1/CD93 (C-type lectin like type I transmembrane protein;
endothelial/progenitor marker), CD16/32 (Fc receptor, myeloid/progenitor marker), CD34
(transmembrane phosphoglycoprotein, hematopoietic progenitor marker excluding MEPs),
CD61 (Integrin b3, binding partner to the Mk marker CD41), and CD71 (transferrin receptor,
erythroid precursor marker) at the surface of Kit+ CD41+ progenitor cells in the yolk sac (gating
strategy in Figure S1).
We selected AA4.1, CD34 and CD45 as they were the most discriminating markers
and used them to further subdivide YS progenitor cells into four major subsets (A, B, C and
D). The four subsets of cells can be visualized in two dimensions with respect to their
expression of the three markers using a t-Distributed Stochastic Neighbour Embedding (t-
SNE) plot (Figure 1A-B and S1B). We next performed a timecourse analysis of the emergence
and dynamics of these populations in the three main developmental locations of EMPs, the
yolk sac, blood and fetal liver (FL) (Figure 1C).
Population A, defined as AA4.1+ CD34+ CD45+, was detected in the yolk sac from E8
(6-8sp stage), albeit at very low numbers (21.21± 5.35 cells per yolk sac) and increased by

- 12 -
54-fold by E9.5 (1146.6± 133.94 cells per yolk sac) (Figure 1B and quantification in 1C).
Population A can be detected from E9.5 onwards in blood while it was only detected in the FL
from E10.5, suggesting that A was generated in the YS and reached and seeded the FL
through circulation. Although A was CD45neg at E8, it gained expression of CD45 at its cell
surface from E8.75 (Figure S1C). B, defined as AA4.1neg CD34+ CD45+, followed a similar
trend to A in dynamics and cell numbers, but delayed, as no B cells could be detected yet at
E8.
Population C, defined as AA4.1neg CD34neg CD45+, and D, AA4.1neg CD34negCD45neg,
only appeared in the YS at E9.5 and expressed higher levels of the erythroid lineage marker
CD71 (Figure 1B and S1B). In blood and FL, it were only detected after E10.5 and
represented the most abundant subset in the FL.
These population dynamics combined with the enrichment of CD71 in C-D suggested
that A gave rise to B and then to erythroid committed progenitors (C and D). Indeed, CFU
assays confirmed that, while all populations had a similar cloning efficiency, multipotent
progenitors were enriched in A and B while C and D contained almost strictly
erythroid/megakaryocyte potential. Thus bona fide multipotential EMPs are found in A and B
while C and D correspond to already committed progenitors toward E/Mk lineages.
Lineage relationship between yolk sac progenitor subsets
To further characterize these temporal dynamics between the different
subpopulations, we investigated whether E/Mk-committed progenitors (C and D) developed
from EMPs (A and B). We performed pulse-and-chase experiments in the transgenic fate-
mapping mouse line Csf1rMeriCreMer RosaYFP by administering OHT in utero at E8.5 or E9.5
(Figure 2A) and analysing the labelling efficiency of the different subsets of yolk sac
progenitors 24, 48 and 72h after pulse (Figure 2A-C). A and B were equally labelled 24 hours
after pulse, albeit at different extents depending on the timing of the pulse (40% in OHT E8.5

- 13 -
and 10% in OHT E9.5). Importantly, A was barely labelled 48h after pulse, whereas B labelling
efficiency was maintained. These results clearly showed that YFP-labelled A cells
differentiated into B progenitors within 24 hours, regardless of the timing of their labelling
(“early” at E8.5 vs “late” at E9.5). Erythroid-committed progenitors (C and D) were only labelled
48h after pulse and labelling efficiency of C equilibrated with B, indicating that C and D
correspond to EMP-derived E/Mk-committed progenitors and that transiting from A/B into C
also took 24 hours or less.
Interestingly, we also observed differences in erythroid progenitor labelling between
E8.5 and E9.5 OHT pulse and this was reflected in the YFP labelling of mature Mk and
erythrocytes (Figure 2C and D). Early E8.5 pulse labelling led to equal labelling of C and D at
E10.5 (48h post pulse) and significant labelling (peaking at 30%) of mature Mks in YS and
blood until E11.5 and E14.5, respectively (Figure 2C). However, the E9.5 pulse barely labelled
mature cells in the yolk sac and blood, and YFP+ Mks in the FL preceded circulating YFP+
Mks, suggesting that the YFP+ Mks found in FL were locally produced (Figure 2D). In
conclusion, early-pulsed EMPs make mature circulating Mks within 24-48h in the yolk sac
while late E9.5 pulsed EMPs require the fetal liver to produce Mks. Thus, it appeared there
were two megakaryopoiesis pathways from EMPs: a YS pathway, in which Mk differentiation
occurred rapidly from early-pulsed EMPs in situ in the yolk sac with Mks released immediately
into circulation, and a second FL pathway where late-pulsed EMPs differentiated more slowly
into Mk and later release them into circulation.
As previously published (Gomez Perdiguero et al., 2015), no erythrocytes were
labelled in the yolk sac (Figure 2E) and the first EMP-derived (YFP+) erythrocytes were found
in the FL four days after pulse. EMP-derived erythrocytes were consistently found in the blood
5 days after pulse at the earliest in both pulses, suggesting it takes 5 days for yolk sac EMPs
to commit and fully differentiate into circulating blood erythrocytes, regardless of time of pulse.
Altogether, these results suggested that the in vivo erythroid output of EMPs changed over

- 14 -
time while their cell intrinsic potential was unchanged: first EMPs differentiate rapidly into
mature Mks in the yolk sac, while red blood cell production is gradual and becomes
predominant in the fetal liver.
Single cell expression analysis reveals lineage commitment and differentiation
among fate-mapped progenitors
In order to further unravel the relationships between the different progenitor
populations, we performed gene expression analysis of single EMP-derived progenitor cells
in the yolk sac. We index-sorted yolk sac YFP+ single cells from E9.5 Csf1riCre RosaYFP and
E10.5 Csf1rMeriCreMer RosaYFP embryos pulsed at E8.5 in order to analyse the different
populations at key stages. The cells were stained with fluorescent antibodies for the previously
described populations and processed following the MARS-Seq pipeline (Jaitin et al., 2014).
After quality control and doublet exclusion, we analysed a total of 781 E9.5 cells and 1234
E10.5 cells (Figure S3A and S3B). Among those, 1952 cells were Kit+ CD41+ progenitors, 13
macrophages and 64 megakaryocytes (Figure 3C). After normalization and data merging to
minimize batch effects generated during plate processing and sequencing runs,
dimensionality reduction was conducted using Uniform Manifold Approximation and Projection
(UMAP) (see figure S3C-E). Random walk clustering (Pons and Latapy, 2006) allowed us to
identify 13 well-defined cell states or clusters among sorted cells which were annotated as
followed: Macrophages (Mf), Myeloid progenitors (My), undifferentiated erythro-myeloid
clusters EMP1, EMP2 and EMP3, megakaryocyte/ erythrocyte progenitors (MEP), mast
cell/mast cell progenitor (MCp-MC), Mk progenitors (pMk1 and pMk2), megakaryocytes (Mk1,
Mk2) and erythroid progenitors (pEry1, pEry2) (Figure 3A). Clusters were annotated on the
basis of literature-established lineage genes (Figure 3B), top differentially expressed genes of
each pairwise comparison (Figure S3F) and index sorting information (Figure 3C).
The expression of two key hematopoietic master regulators, the transcription factors
Sfpi1(Pu.1) and Gata1 for myeloid and erythroid lineages, respectively, were key for

- 15 -
determining the identity of the clusters (Figure 3B). At the gene expression level, EMP1
expressed Pu.1 but Gata1 expression was not detected. In accordance with progressive
erythroid commitment, Pu.1 expression was down regulated from EMP1 to MEP while Gata1
expression was upregulated from EMP3 to fully committed progenitors (pEry2 and pMk2).
Concurrently, Pu.1 expression was upregulated along myeloid/macrophage differentiation
(Figure 3B).
Surface marker annotations allowed us to show that population A was mainly restricted
to EMP1 and part of EMP2 and EMP3 clusters, while population B was a very heterogeneous
population that corresponded to EMP2 and EMP3, myeloid progenitors (My), MEP and
megakaryocyte progenitors (pMk1 and pMk2) (Figure 3C). As expected, C and D were
restricted to the E/Mk clusters (MEP, pEry1 and pMk1) although D corresponded principally
to the most committed erythroid clusters (pEry1 and pEry2). Thus, in accordance with the
pulse-and-chase experiments (Figure2), A is mostly composed of multipotent EMPs, B is a
mixed population of committed or lineage-primed progenitors, C contains E/Mk-committed
progenitors and D is mostly composed of fully committed erythroid progenitors.
To confirm at the protein level, we analysed the expression of Pu.1 and Gata1 proteins
tagged with fluorescent proteins in Pu.1-YFP Gata1-mCherry embryos(Hoppe et al., 2016)
(Figure 3D). As expected, population A (EMP1) expressed only Pu.1-YFP both at E9.5 and
E10.5 and population B contained cells expressing Pu.1, Gata1 or coexpressing both markers,
consistent with the transcriptional heterogeneity observed in the scRNASeq dataset. Pu.1-
YFP cells were not detected in populations C and D. Finally, gene set enrichment analysis
(GSEA) uncovered in specific clusters innate immunity (clusters My and Mf), platelet
activation/degranulation and coagulation (clusters pMk1 to Mk2) and heme synthesis (clusters
pEry1 and pEry2) pathways, thus further confirming the cluster annotations (Figure 3E).
Importantly, there was a striking difference in the contribution of the two analysed
timepoints to the committed clusters (Figure S3E). Myeloid (My) and Mk (pMk1 and pMk2)

- 16 -
progenitor clusters were composed of cells from both E9.5 and E10.5. However, erythroid
clusters (pEry1 and pEry2) were almost exclusively composed of E10.5 cells. Altogether, the
results confirmed at the single cell level that the in vivo output of EMPs changed over time in
regards to the Mk/E balance, with erythroid differentiation only starting after E9.5.
Trajectory analysis of yolk sac progenitors reveals an E9.5-specific Mk lineage
pathway
We then performed trajectory analysis of the lineages that were annotated in the
dataset with the Slingshot package(Street et al., 2018). Starting from cluster EMP1, three
trajectories were generated: (i) a megakaryocyte lineage trajectory (Mk trajectory, black); (ii)
an erythroid trajectory (E trajectory, red) and (iii) a shorter myeloid trajectory (My trajectory,
blue) (Figure 4A). 1468, 2246 and 431 genes were associated with the megakaryocyte,
erythrocyte and myeloid trajectories, respectively (p-value < 0.01). The trajectory analysis
suggested that among EMP clusters, EMP2 corresponded to myeloid-primed EMPs while
EMP3 to erythroid-primed EMPs. This was supported by higher expression of myeloid genes
in EMP2 (Pu.1, Csf1r, Irf8) and lower expression of E/Mk genes (Gata1, Klf1) (Figure 3B and
S3F). Conversely, EMP3 had higher expression levels of E/Mk genes (Gata1, Klf1 and Gata2).
In the E and Mk shared trajectory, leading from EMP1 to MEP, Cebpb, Lcp1, Coro2a
and Cd34 were downregulated while Gata1, Zfpm1, Cited4 and Mfsd2b were upregulated at
the MEP level (Figure 4B-C). In the Mk trajectory, the first genes specific for megakaryopoiesis
to be upregulated in MEP were Fermt3, Itga2b(CD41), F2r and Rap1b. A large number of
genes was upregulated in more differentiated progenitors (pMk1 and pMk2) and in mature
Mks, such as Thbs1, Pf4, Treml1, F2rl2 and components of the platelet von Willebrand factor
(vWF) receptor (Gp1bb, Gp5 and Gp9). Interestingly, few C and D cells were part of the
trajectory, but B cells, especially from E9.5, were found in the committed pMk1 and pMk2
clusters (Figure 4B). The F trajectory had two sets of genes that clustered depending on the
timing of upregulation. The first set of genes that was upregulated early corresponded to MEP

- 17 -
differentiation genes (Gata1, Zfpm1, Cited4 and Mfsd2b). The second set of genes was
upregulated in more mature progenitors (pEryp1 and pEry2) at E10.5 and included genes
linked to erythrocyte function such as Alad, Epor, Cpox and Ermap (Figure 4C).
The Myeloid trajectory was characterized by a first large gene set upregulated in EMP2
that included innate immune and myeloid genes (Emb, Tspo and Mpo) and then a second set
of upregulated genes in the My cluster, containing a macrophage specific transcription factor
(Irf8), genes involved in peroxisomal or lysosomal activity (Abcd2) and cathepsin-encoding
genes (Ctsz and Ctsc).
Since E9.5 progenitors seemed particularly enriched in megakaryocyte but not
erythroid clusters (Figure 3SE and 4C) and as the erythroid trajectory was mostly composed
of E10.5 progenitors, we analysed separately the E9.5 progenitors and annotated three cell
states or clusters on the basis of gene expression (Figure 4E). A distinct megakaryocyte
progenitor cluster was observed at E9.5 (Figure 4B S4A and S4B). We performed trajectory
analysis starting from the EMP cluster at E9.5 and observed a Mk-differentiation trajectory
that involved the significant regulation of 586 genes (p-value<0.01). These included the
downregulation of multiple myeloid genes such as Sfpi1, Cebpb, Emb and Cd34, the
upregulation of Tal1 starting in the EMP cluster and a later upregulation of Mk lineage genes
such as Gata1, Podxl, Gp1bb, F2r and Itga2b(CD41) in the pMk cluster. This gene set
upregulation was also closely correlated with the loss of AA4.1 at the surface (phenotype A to
B, Figure S4E) and suggested the existence of a rapid yolk sac megakaryopoiesis that does
not involve a MEP intermediate (Figure 4E).
CD131 is a novel marker of MEP commitment in the yolk sac
In order to resolve the erythroid/megakaryocyte commitment steps in the yolk sac, we
performed pairwise comparison of the genes that were differentially expressed by E9.5 and
E10.5 cells from the MEP cluster. We observed that E10.5 MEPs distinctly expressed Csf2rb
- 18 -
(the common chain of GM-CSF, IL-3 and IL-5 receptors) (Fig5A). Importantly, while cells in
EMP and myeloid clusters also expressed Csf2rb at a lower level, the highest Cs2rb-
expressing cells were those of the MEP cluster. Further, Cs2rb-expressing were effectively
located in the UMAP region where E10.5 cells were most abundant (Figure 5B and S3E).
We proceeded to verify the expression of CD131 at the surface of YS progenitor
populations and we observed few CD131+ cells at E9.5 (27.51± 6.69 sem) but considerably
more at E10.5 (188.8± 28.6 sem) (Figure 5C-D). CD131+ cells were CD45+ AA4.1neg and
expressed CD34 at a lower level than B, and as such could correspond to phenotypic
intermediates between B and C populations (Figure S5). Since most CD131+ cells were found
in B (49.36%) and C (41.87%) (Figure 5E) and expressed Gata1-mCherry (46%) (Figure 5F),
we hypothesized they corresponded to an erythroid-committed progenitor. We therefore
sorted E10.5 CD131+ yolk sac cells for colony forming assays to investigate their differentiation
potential. The enrichment in highly proliferative erythroid colonies and mixed erythroid and
megakaryocyte colonies suggested an early Mk/E committed progenitor (Figure 5G).
Altogether, the results identified CD131 as a novel marker of early yolk sac MEP produced at
E10.5.
Deletion of the transcription factor Myb blocks production of yolk sac MEP but
allows direct megakaryocyte differentiation
We next analysed Csf1rMeriCreMer RosaYFP Myb-/- embryos pulsed at E8.5 in order to
follow the fate of EMP and EMP-derived cells in the absence of the hematopoietic transcription
factor Myb. Erythroid-committed progenitors C and D were completely absent in Myb-deficient
embryos at all stages analysed (Figure 6A). While there were no significant differences in A
and B numbers at E9.5, A and B were reduced from E10.5 onwards in Myb-deficient yolk sacs
and no gene dosage effects were observed (Figure 6B). Pulse-labelled YFP+ Myb-deficient
progenitors followed the same trend as all cells, therefore showing no difference of YFP+ and
YFPneg progenitors with regard to Myb-dependence (Figure S6A) and by E11.5, only a few

- 19 -
YFP+ cells were still present in the yolk sac, and had a B phenotype. Further, CD131+ cells
were also absent both at E10.5 and E11.5 in Myb-deficient yolk sacs, suggesting an early
blockage at the MEP level during YS hematopoiesis (Figure 6C). Altogether, this complete
lack of E/Mk-committed progenitors in Myb-deficient embryos should result in the lack of
definitive YFP+ E and Mk mature cells. It is indeed the case for erythrocytes (Figure 6D), as
no YFP+ red blood cells were observed in the fetal liver and blood of Myb-deficient embryos.
However, yolk sac EMP-derived megakaryopoiesis remained unaffected until E12.5 (Figure
6D and S6B). Moreover, Mk labelling was normal in Myb-deficient embryos in the blood until
E11.5 and in the fetal liver at E10.5, but strongly decreased thereafter (Figure 6D). These
results suggested that EMP-derived Mks found in blood and fetal liver at these early stages
bypassed the MEP intermediate and were produced in the yolk sac until E12.5. No EMP-
derived Mk production was observed in the FL after E11.5, coinciding with the lack of
production of mature red blood cells and the absence of MEPs in Myb-deficient embryos
(Figure 6B-D).
Altogether these results demonstrated the existence of two successive and
independent waves of Mk production from EMPs. In the yolk sac, EMPs were able to provide
the first burst of definitive megakaryocytes in circulation in a Myb-independent manner from
E9.5 until at least E12.5, which were later replaced by a wave of MEP-produced Mk. EMP-
derived MEPs were produced in the yolk sac after E9.5 in a Myb-dependent manner and they
terminally differentiated in the fetal liver before Mk were released into circulation.
Discussion
Kit and CD41 coexpression in the yolk sac is considered a marker of definitive
hematopoiesis and both are expressed in the hemogenic clusters in this niche (Frame et al.,
2016). While it is known that EMPs in the yolk sac locally differentiate into macrophages and
that the other erythromyeloid lineages are found in the fetal liver (Gomez Perdiguero et al.,
2015; McGrath et al., 2015), less is known about the spatio-temporal dynamic of EMP
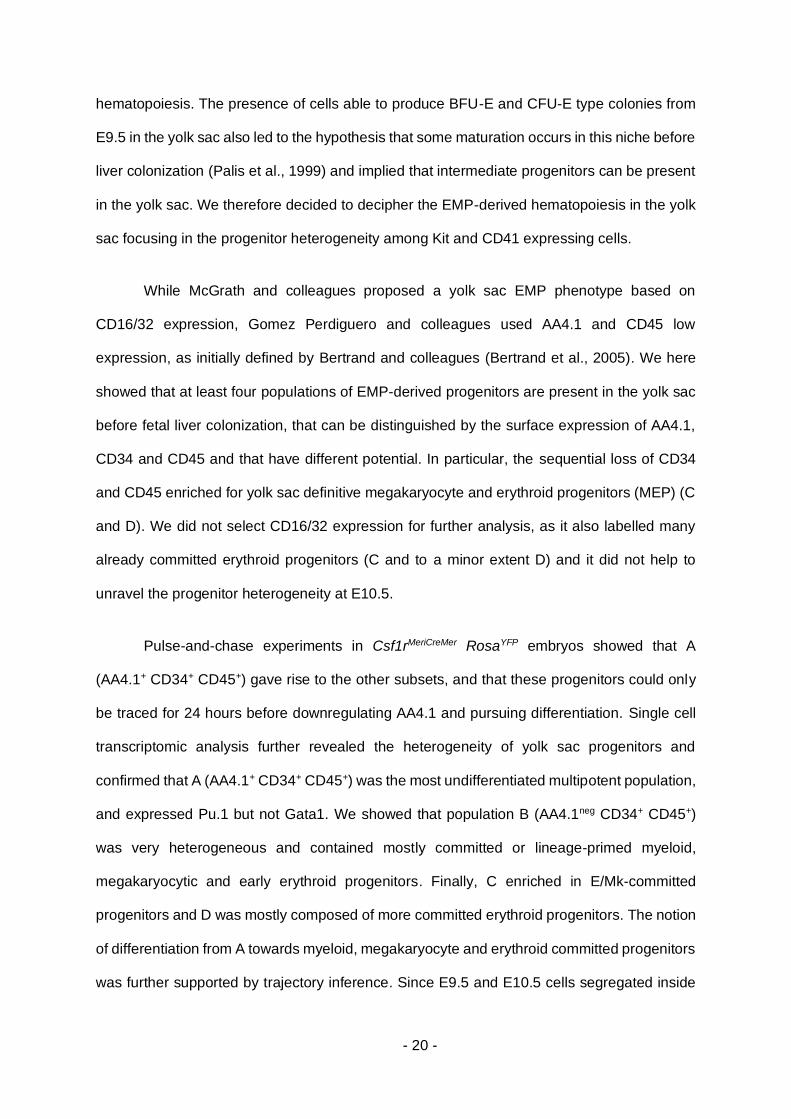
- 20 -
hematopoiesis. The presence of cells able to produce BFU-E and CFU-E type colonies from
E9.5 in the yolk sac also led to the hypothesis that some maturation occurs in this niche before
liver colonization (Palis et al., 1999) and implied that intermediate progenitors can be present
in the yolk sac. We therefore decided to decipher the EMP-derived hematopoiesis in the yolk
sac focusing in the progenitor heterogeneity among Kit and CD41 expressing cells.
While McGrath and colleagues proposed a yolk sac EMP phenotype based on
CD16/32 expression, Gomez Perdiguero and colleagues used AA4.1 and CD45 low
expression, as initially defined by Bertrand and colleagues (Bertrand et al., 2005). We here
showed that at least four populations of EMP-derived progenitors are present in the yolk sac
before fetal liver colonization, that can be distinguished by the surface expression of AA4.1,
CD34 and CD45 and that have different potential. In particular, the sequential loss of CD34
and CD45 enriched for yolk sac definitive megakaryocyte and erythroid progenitors (MEP) (C
and D). We did not select CD16/32 expression for further analysis, as it also labelled many
already committed erythroid progenitors (C and to a minor extent D) and it did not help to
unravel the progenitor heterogeneity at E10.5.
Pulse-and-chase experiments in Csf1rMeriCreMer RosaYFP embryos showed that A
(AA4.1+ CD34+ CD45+) gave rise to the other subsets, and that these progenitors could only
be traced for 24 hours before downregulating AA4.1 and pursuing differentiation. Single cell
transcriptomic analysis further revealed the heterogeneity of yolk sac progenitors and
confirmed that A (AA4.1+ CD34+ CD45+) was the most undifferentiated multipotent population,
and expressed Pu.1 but not Gata1. We showed that population B (AA4.1neg CD34+ CD45+)
was very heterogeneous and contained mostly committed or lineage-primed myeloid,
megakaryocytic and early erythroid progenitors. Finally, C enriched in E/Mk-committed
progenitors and D was mostly composed of more committed erythroid progenitors. The notion
of differentiation from A towards myeloid, megakaryocyte and erythroid committed progenitors
was further supported by trajectory inference. Since E9.5 and E10.5 cells segregated inside

- 21 -
the MEP (megakaryocyte and erythroid progenitors) cluster and contributed differently to the
trajectories of megakaryocyte and erythrocytes, we proceeded to resolve E/Mk pathways of
differentiation in the yolk sac.
We were able to further refine the identification of the intermediate steps in the E/Mk
pathway thanks to a cell surface marker identified with the scRNA-seq analysis by pairwise
statistical comparison of E9.5 and E10.5 cells from the MEP cluster. Csf2rb was found to be
expressed 2.4-fold more in E10.5 cells and it was also expressed higher in E10.5 MEP when
compared to other clusters. This gene encodes for the high affinity receptor subunit CD131/
βc, the common β chain shared among granulocyte-macrophage colony-stimulating factor
(GM-CSF/CSF2), interleukin-3 (IL-3) and interleukin 5 (IL-5) receptors, and is involved in the
differentiation and survival of progenitor cells and the growth and differentiation of myeloid
cells and megakaryocytes (Scott and Begley, 1999). The expression of CD131 was recently
described in the literature to enrich in E/Mk biased progenitors of the bone marrow (Drissen
et al., 2019) and the cytokine GM-CSF is used in culture to promote the initial proliferation of
progenitors of the erythroid and megakaryocyte lineage, although it is not required for the
terminal cell divisions in these pathways (Metcalf et al., 1980). In this study, we showed that
EMPs differentiate at E10.5 in the yolk sac into functional and transcriptomic MEPs,
characterized first by the expression of CD131 and defined by in vitro clonal differentiation
potential. CD131 is thus a marker of MEP commitment in the yolk sac that is situated upstream
of CD34 loss at the cell surface.
We also showed that this differentiation pathway was dependent on the expression of
Myb. Embryos lacking the hematopoietic transcription factor Myb have normal number of
tissue resident macrophages (Schulz et al., 2012) but fetal liver erythropoiesis is blocked
(Mucenski et al., 1991). While AA4.1+ EMPs emerge normally in Myb-/- embryos, their
AA4.1neg CD34+ CD45+ (B) progeny is rapidly reduced from E10.5 onwards and all the E/Mk
intermediates (CD131+ MEP, C and D) are completely absent at all stages. No EMP-derived

- 22 -
erythrocyte production was consequently found in Myb-/- embryos, however EMP-derived
megakaryopoiesis was unaffected in the yolk sac at all stages. After E10.5, EMP-derived Mk
were severely reduced in the fetal liver, suggesting that Mk production through a Myb-
dependent MEP intermediate occurred primarily in the fetal liver niche.
It was proposed that normal Mk numbers in the Myb-deficient embryos derived from
primitive hematopoiesis (Tober et al., 2008). However, by combining Myb deficiency with EMP
pulse labelling, we can clearly demonstrate that EMPs emerge normally in Myb-/- embryos
and differentiate directly into megakaryocytes bypassing yolk sac CD131+ MEP progenitors.
Importantly, this novel direct MEP-independent megakaryopoiesis uncovered in Myb-deficient
embryos is also found in Myb-competent embryos, as evidenced during EMP fate mapping
and scRNAseq studies. Yolk sac MEP-independent megakaryopoiesis started rapidly after
EMP emergence in a limited time window, as evidence by the fact that yolk sac Mks are only
labeled when EMP are pulsed at E8.5 and not at E9.5. This yolk sac-specific direct
megakaryopoiesis is faster than the MEP-derived counterpart, as mature Mks were found in
the yolk sac and blood 24-48h after EMP pulse labeling, and Mks were released into circulation
as soon as they were produced. Further scRNAseq analysis of yolk sac progenitors confirmed
the existence of a megakaryocyte differentiation pathway at E9.5 that differed from the adult-
like MEP-dependent differentiation, which is predominant at E10.5. Collectively, our results
demonstrate that Myb-deficient Mk progenitors are not just a restricted form of definitive
megakaryopoiesis (Tober et al., 2008), in which Myb-/- EMP retain the capability to give rise to
Mks as they fail to differentiate into MEP in the absence of Myb. Rather, megakaryopoiesis in
Myb-deficient embryos corresponds to the first wave of rapid and local Mk production from
EMPs before the production of CD131 MEPs, that later mature into a second EMP-derived
wave of Mk in the fetal liver. This is reminiscent of local macrophage differentiation in the yolk
sac that is proposed to bypass monocytic intermediates (Naito et al., 1996; Takahashi et al.,
1989).

- 23 -
In regards to the differences in EMP output depending on the timing of pulse-labelling,
the production of red blood cells also displayed different dynamics. While the labelling
efficiency of red blood cells produced from E9.5-pulsed EMPs peaked 5 days after pulse,
those pulsed at E8.5 peaked 4 days after pulse. Interestingly, regardless of the time of pulse
labelling, EMP-derived red blood cells were only found in circulation at E13.5, even if labeled
EMP-derived red blood cells were present and accumulating in the fetal liver since E11.5. This
suggests that erythrocyte release into circulation is not passive event but rather a highly
regulated process in the fetal liver. The differences in EMP output between pulses could be
explained by a temporal specialization of progenitors in the yolk sac in response to changes
in the different signals provided by the hematopoietic niches over time (cell extrinsic
hypothesis) or by the emergence of two waves of EMP progenitors (cell intrinsic hypothesis).
In regards to the latter, comparison of E9.5 and E10.5 yolk sac progenitors did not reveal any
major differences at the scRNA-seq level in the EMP clusters.
Altogether, these results demonstrate that EMPs can differentiate into
megakaryocytes in the yolk sac very rapidly (in 24-48h) and that they do not depend on a MEP
intermediate to do so. These results uncover two pathways to produce definitive
megakaryocytes: a direct yolk sac-specific pathway that starts at E9.5 directly from EMP
progenitors in a Myb-independent manner, and a second adult-like pathway, where EMP
produce first MEP in the yolk sac in a Myb-dependent manner and that terminally differentiate
into both erythrocytes and megakaryocytes in the fetal liver. These MEP progenitors seed the
fetal liver starting from E10.5 and are responsible for the rapid production of millions of
definitive red blood cells that are released into circulation from E12.5. Commitment of erythroid
progenitors occurs at E10.5 and it is characterized by the acquisition of CD131 at the surface
and a sequential loss of CD34 and CD45.

- 24 -
Acknowledgements
We are thankful for insightful discussions, technical support, and critical reading of the
manuscript by Ana Cumano. We gratefully acknowledge the Plateforme de Cytometrie
(Sophie Novault) at the Center for Innovation and Technological Research of the Institut
Pasteur for support in conducting this study. We thank Yann Loe Mie and Baptiste Saudemont
for their help with the MARS-Seq pipeline. This work was supported by recurrent funding from
the Institut Pasteur, the CNRS and Revive (Investissement d'Avenir; ANR-10-LABX-73) and
by an ERC investigator award (2016-StG-715320) from the European Research Council to
E.G.P. E.G.P. also acknowledges financial support from the Fondation Schlumberger (FRM
FSER 2017) and the Emergence(s) program from Ville de Paris (2016 DAE 190). L.I. was
supported by a fellowship from the Revive Labex and L.F. by a Florence Gould-Pasteur
Foundation fellowship.
Authorship Contributions
Conceptualization: LI and EGP; Methodology and data collection: LI, LF, PD, YL and
EGP; scRNA-seq data analysis: LI, LF and AB; Writing - Original Draft: LI and EGP; Writing -
Review & Editing: LI, LF, AB, YL and EGP; Funding Acquisition: EGP; Supervision: EGP.
The authors declare no competing financial interests and no conflicts of interest.
References
Bertrand, J.Y., Giroux, S., Golub, R., Klaine, M., Jalil, A., Boucontet, L., Godin, I., and Cumano,
A. (2005). Characterization of purified intraembryonic hematopoietic stem cells as a
tool to define their site of origin. Proc. Natl. Acad. Sci. U. S. A. 102, 134–139.
Chen, M.J., Li, Y., De Obaldia, M.E., Yang, Q., Yzaguirre, A.D., Yamada-Inagawa, T., Vink,
C.S., Bhandoola, A., Dzierzak, E., and Speck, N.A. (2011). Erythroid/myeloid
progenitors and hematopoietic stem cells originate from distinct populations of
endothelial cells. Cell Stem Cell 9, 541–552.
Drissen, R., Thongjuea, S., Theilgaard-Mönch, K., and Nerlov, C. (2019). Identification of two
distinct pathways of human myelopoiesis. Sci. Immunol. 4, 7148.

- 25 -
Frame, J.M., Fegan, K.H., Conway, S.J., McGrath, K.E., and Palis, J. (2016). Definitive
Hematopoiesis in the Yolk Sac Emerges from Wnt-Responsive Hemogenic
Endothelium Independently of Circulation and Arterial Identity. Stem Cells 34, 431–
444.
Gentek, R., Ghigo, C., Hoeffel, G., Bulle, M.J., Msallam, R., Gautier, G., Launay, P., Chen, J.,
Ginhoux, F., and Bajénoff, M. (2018). Hemogenic Endothelial Fate Mapping Reveals
Dual Developmental Origin of Mast Cells. Immunity 48, 1160-1171.e5.
Germain, P.-L. (2020). scDblFinder: scDblFinder. R package version 1.1.8.
Ginhoux, F., Greter, M., Leboeuf, M., Nandi, S., See, P., Gokhan, S., Mehler, M.F., Conway,
S.J., Ng, L.G., Stanley, E.R., et al. (2010). Fate mapping analysis reveals that adult
microglia derive from primitive macrophages. Science (80-. ). 330, 841–845.
Godin, I., Garcia-Porrero, J.A., Dieterlen-Lièvre, F., and Cumano, A. (1999). Stem cell
emergence and hemopoietic activity are incompatible in mouse intraembryonic sites.
J. Exp. Med. 190, 43–52.
Gomez Perdiguero, E., Klapproth, K., Schulz, C., Busch, K., Azzoni, E., Crozet, L., Garner,
H., Trouillet, C., De Bruijn, M.F., Geissmann, F., et al. (2015). Tissue-resident
macrophages originate from yolk-sac-derived erythro-myeloid progenitors. Nature 518,
547–551.
Hadland, B.K., Huppert, S.S., Kanungo, J., Xue, Y., Jiang, R., Gridley, T., Conlon, R.A.,
Cheng, A.M., Kopan, R., and Longmore, G.D. (2004). A requirement for Notch1
distinguishes 2 phases of definitive hematopoiesis during development. Blood 104,
3097–3105.
Haghverdi, L., Lun, A.T.L., Morgan, M.D., and Marioni, J.C. (2018). Batch effects in single-cell
RNA-sequencing data are corrected by matching mutual nearest neighbors. Nat.
Biotechnol. 36, 421–427.
Hoeffel, G., Chen, J., Lavin, Y., Low, D., Almeida, F.F., See, P., Beaudin, A.E., Lum, J., Low,
I., Forsberg, E.C., et al. (2015). C-Myb+ Erythro-Myeloid Progenitor-Derived Fetal
Monocytes Give Rise to Adult Tissue-Resident Macrophages. Immunity 42, 665–678.
Hoppe, P.S., Schwarzfischer, M., Loeffler, D., Kokkaliaris, K.D., Hilsenbeck, O., Moritz, N.,
Endele, M., Filipczyk, A., Gambardella, A., Ahmed, N., et al. (2016). Early myeloid
lineage choice is not initiated by random PU.1 to GATA1 protein ratios. Nature 535,
299–302.
Jaitin, D.A., Kenigsberg, E., Keren-Shaul, H., Elefant, N., Paul, F., Zaretsky, I., Mildner, A.,
Cohen, N., Jung, S., Tanay, A., et al. (2014). Massively Parallel Single-Cell RNA-Seq
for Marker-Free Decomposition of Tissues into Cell Types. Science (80-. ). 343, 776
LP – 779.
Kasaai, B., Caolo, V., Peacock, H.M., Lehoux, S., Gomez-Perdiguero, E., Luttun, A., and
Jones, E.A.V. (2017). Erythro-myeloid progenitors can differentiate from endothelial
cells and modulate embryonic vascular remodeling. Sci. Rep. 7, 1–12.
Keren-Shaul, H., Kenigsberg, E., Jaitin, D.A., David, E., Paul, F., Tanay, A., and Amit, I.
(2019). MARS-seq2.0: an experimental and analytical pipeline for indexed sorting
combined with single-cell RNA sequencing. Nat. Protoc. 14, 1841–1862.
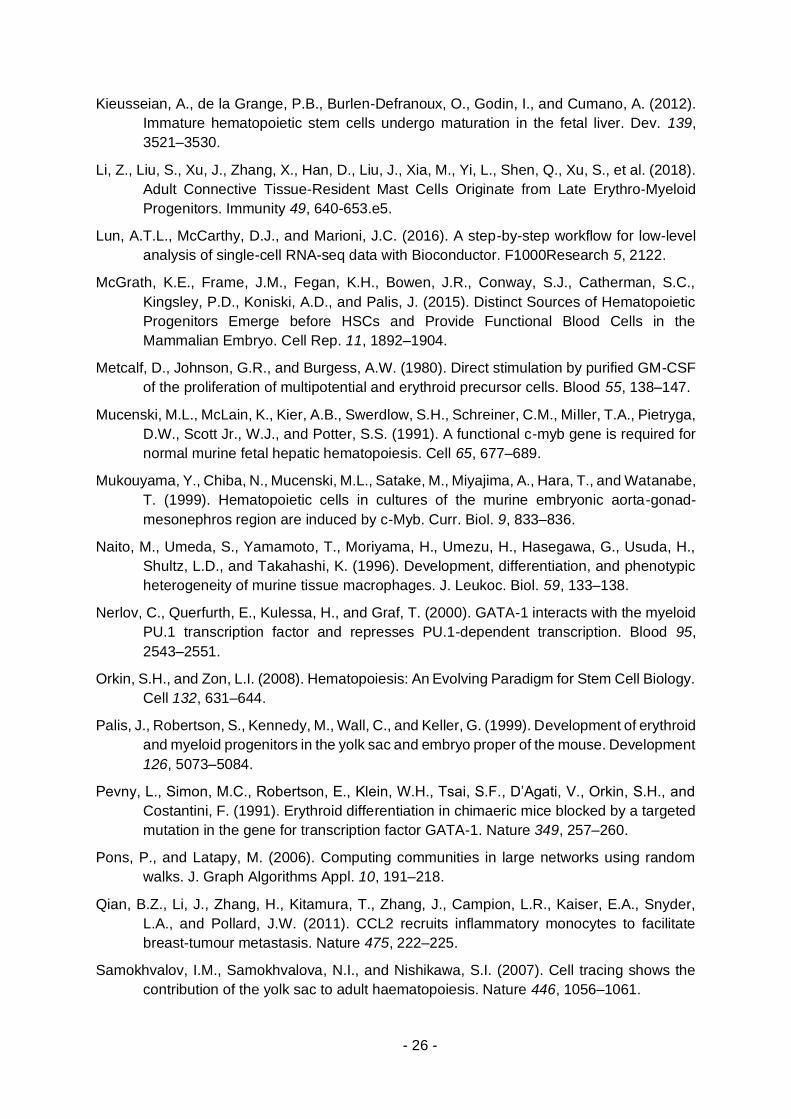
- 26 -
Kieusseian, A., de la Grange, P.B., Burlen-Defranoux, O., Godin, I., and Cumano, A. (2012).
Immature hematopoietic stem cells undergo maturation in the fetal liver. Dev. 139,
3521–3530.
Li, Z., Liu, S., Xu, J., Zhang, X., Han, D., Liu, J., Xia, M., Yi, L., Shen, Q., Xu, S., et al. (2018).
Adult Connective Tissue-Resident Mast Cells Originate from Late Erythro-Myeloid
Progenitors. Immunity 49, 640-653.e5.
Lun, A.T.L., McCarthy, D.J., and Marioni, J.C. (2016). A step-by-step workflow for low-level
analysis of single-cell RNA-seq data with Bioconductor. F1000Research 5, 2122.
McGrath, K.E., Frame, J.M., Fegan, K.H., Bowen, J.R., Conway, S.J., Catherman, S.C.,
Kingsley, P.D., Koniski, A.D., and Palis, J. (2015). Distinct Sources of Hematopoietic
Progenitors Emerge before HSCs and Provide Functional Blood Cells in the
Mammalian Embryo. Cell Rep. 11, 1892–1904.
Metcalf, D., Johnson, G.R., and Burgess, A.W. (1980). Direct stimulation by purified GM-CSF
of the proliferation of multipotential and erythroid precursor cells. Blood 55, 138–147.
Mucenski, M.L., McLain, K., Kier, A.B., Swerdlow, S.H., Schreiner, C.M., Miller, T.A., Pietryga,
D.W., Scott Jr., W.J., and Potter, S.S. (1991). A functional c-myb gene is required for
normal murine fetal hepatic hematopoiesis. Cell 65, 677–689.
Mukouyama, Y., Chiba, N., Mucenski, M.L., Satake, M., Miyajima, A., Hara, T., and Watanabe,
T. (1999). Hematopoietic cells in cultures of the murine embryonic aorta-gonad-
mesonephros region are induced by c-Myb. Curr. Biol. 9, 833–836.
Naito, M., Umeda, S., Yamamoto, T., Moriyama, H., Umezu, H., Hasegawa, G., Usuda, H.,
Shultz, L.D., and Takahashi, K. (1996). Development, differentiation, and phenotypic
heterogeneity of murine tissue macrophages. J. Leukoc. Biol. 59, 133–138.
Nerlov, C., Querfurth, E., Kulessa, H., and Graf, T. (2000). GATA-1 interacts with the myeloid
PU.1 transcription factor and represses PU.1-dependent transcription. Blood 95,
2543–2551.
Orkin, S.H., and Zon, L.I. (2008). Hematopoiesis: An Evolving Paradigm for Stem Cell Biology.
Cell 132, 631–644.
Palis, J., Robertson, S., Kennedy, M., Wall, C., and Keller, G. (1999). Development of erythroid
and myeloid progenitors in the yolk sac and embryo proper of the mouse. Development
126, 5073–5084.
Pevny, L., Simon, M.C., Robertson, E., Klein, W.H., Tsai, S.F., D’Agati, V., Orkin, S.H., and
Costantini, F. (1991). Erythroid differentiation in chimaeric mice blocked by a targeted
mutation in the gene for transcription factor GATA-1. Nature 349, 257–260.
Pons, P., and Latapy, M. (2006). Computing communities in large networks using random
walks. J. Graph Algorithms Appl. 10, 191–218.
Qian, B.Z., Li, J., Zhang, H., Kitamura, T., Zhang, J., Campion, L.R., Kaiser, E.A., Snyder,
L.A., and Pollard, J.W. (2011). CCL2 recruits inflammatory monocytes to facilitate
breast-tumour metastasis. Nature 475, 222–225.
Samokhvalov, I.M., Samokhvalova, N.I., and Nishikawa, S.I. (2007). Cell tracing shows the
contribution of the yolk sac to adult haematopoiesis. Nature 446, 1056–1061.

- 27 -
Schulz, C., Perdiguero, E.G., Chorro, L., Szabo-Rogers, H., Cagnard, N., Kierdorf, K., Prinz,
M., Wu, B., Jacobsen, S.E.W., Pollard, J.W., et al. (2012). A Lineage of Myeloid Cells
Independent of Myb and Hematopoietic Stem Cells. Science (80-. ). 336, 86 LP – 90.
Scott, C.L., and Begley, C.G. (1999). The beta common chain (βc) of the granulocyte
macrophage-colony stimulating factor, interleukin-3 and interleukin-5 receptors. Int. J.
Biochem. Cell Biol. 31, 1011–1015.
Scott, E.W., Simon, M.C., Anastasi, J., and Singh, H. (1994). Requirement of transcription
factor PU.1 in the development of multiple hematopoietic lineages. Science (80-. ).
265, 1573–1577.
Srinivas, S., Watanabe, T., Lin, C.S., William, C.M., Tanabe, Y., Jessell, T.M., and Costantini,
F. (2001). Cre reporter strains produced by targeted insertion of EYFP and ECFP into
the ROSA26 locus. BMC Dev. Biol. 1, 1–8.
Street, K., Risso, D., Fletcher, R.B., Das, D., Ngai, J., Yosef, N., Purdom, E., and Dudoit, S.
(2018). Slingshot: Cell lineage and pseudotime inference for single-cell
transcriptomics. BMC Genomics 19, 477.
Stremmel, C., Schuchert, R., Wagner, F., Thaler, R., Weinberger, T., Pick, R., Mass, E.,
Ishikawa-Ankerhold, H.C., Margraf, A., Hutter, S., et al. (2018). Yolk sac macrophage
progenitors traffic to the embryo during defined stages of development. Nat. Commun.
9, 75.
Stuart, T., Butler, A., Hoffman, P., Hafemeister, C., Papalexi, E., Mauck, W.M., Hao, Y.,
Stoeckius, M., Smibert, P., and Satija, R. (2019). Comprehensive Integration of Single-
Cell Data. Cell 177, 1888-1902.e21.
Sumner, R., Crawford, A., Mucenski, M., and Frampton, J. (2000). Initiation of adult
myelopoiesis can occur in the absence of c-Myb whereas subsequent development is
strictly dependent on the transcription factor. Oncogene 19, 3335–3342.
Takahashi, K., Yamamura, F., and Naito, M. (1989). Differentiation, maturation, and
proliferation of macrophages in the mouse yolk sac: A light-microscopic, enzyme-
cytochemical, immunohistochemical, and ultrastructural study. J. Leukoc. Biol. 45, 87–
96.
Tober, J., McGrath, K.E., and Palis, J. (2008). Primitive erythropoiesis and megakaryopoiesis
in the yolk sac are independent of c-myb. Blood 111, 2636–2639.
Zhang, P., Zhang, X., Iwama, A., Yu, C., Smith, K.A., Mueller, B.U., Narravula, S., Torbett,
B.E., Orkin, S.H., and Tenen, D.G. (2000). PU.1 inhibits GATA-1 function and erythroid
differentiation by blocking GATA-1 DNA binding. Blood 96, 2641–2648.
Figures

- 28 -

- 29 -
Figure 1. Spatio-Temporal dynamics of yolk sac progenitor subsets endowed
with progressive commitment to erythroid lineages.
(A) Yolk sac E10.5 CD41+ Kit+ cells can be subdivided in a tSNE representation (upper panel)
into 4 populations A, B, C and D (dashed lines). (lower panel) Overlay of previous phenotypic
definitions of EMPs (pink) on the t-SNE space (grey). (B) t-SNE representation of the
fluorophore intensity of AA4.1, CD45, CD71, Kit, CD34, CD16/32, CD61 and CD41 in the four
subsets. (C) Representative contour plots of Kit and CD41 expression among lineage negative
cells, of AA4.1 and CD34 among Kit+ CD41+ progenitor cells and of CD16/32 and CD45
among AA4.1neg CD34neg cells from E8 to E11.5 in the yolk sac (upper panel), blood (middle
panel) and fetal liver (bottom panel). (D) Quantification of the number of cells per yolk sac in
each population from E8.5 to E11.5. n=3 at E8(6-8 somite pairs - sp), 11 at E8.75 (16-28
somite pairs - sp); 3 at E9 (20-21sp); 7 at E9.5 (27-29 sp); 17 at E10.5 (34-38sp) and 5 at
E11.75 (51-53sp). Bars represent mean± sem. (E) Colony forming units (CFU-C) assays of
sorted A, B, C and D populations and analyzed 12 days after. Cloning efficiency (left) and
frequency of colony types (E/Mk, erythroid and/or Mk; Myeloid and Mix colonies) (right);
mean± sem. Data from 6 embryos.
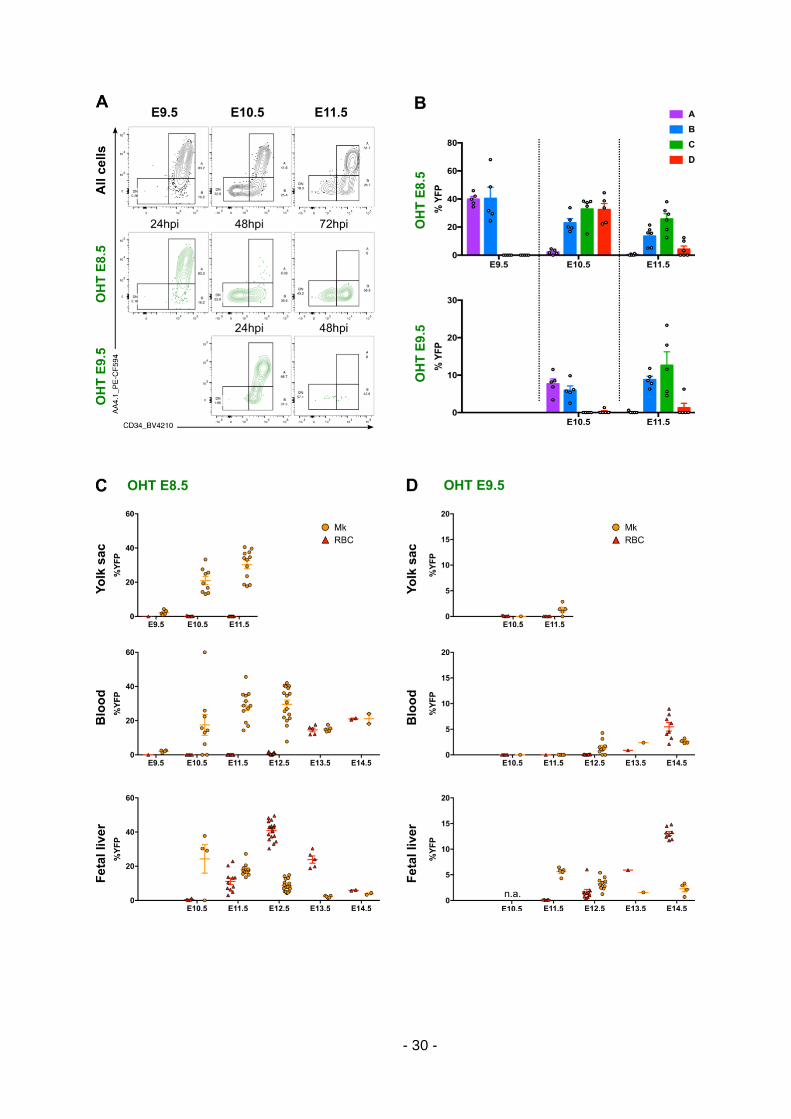
- 30 -

- 31 -
Figure 2. Lineage relationship between yolk sac progenitor subpopulations.
(A) Flow cytometric analysis of Kit+ CD41+ cells from Csf1rMeriCreMer RosaYFP embryos
pulsed at E8.5 (middle panel) and E9.5 (bottom panel) and analyzed 24, 48 and 72h after. (B)
Labelling efficiency (% of YFP+ cells) of A, B, C and D progenitor subsets after E8.5 (upper)
or E9.5 pulse (bottom). 4-OHT at E8.5: n=5 at E9.5; 9 at E10.5 and 12 at E11.5. 4-OHT at
E9.5: n=6 at E10.5 and 5 at E11.5. Bars represent mean± sem. (C) Labelling efficiency (% of
YFP+ cells) of megakaryocytes (Mk) and red blood cells (RBC) in the yolk sac, blood and fetal
liver after an E8.5 pulse. n=5 at E9.5; 9 at E10.5; 12 at E11.5; 17 at E12.5; 5 at E13.5 and 2
at E14.5 (D) Labelling efficiency of Mk and RBC in the yolk sac, blood and fetal liver after a
E9.5 pulse. n=6 at E10.5; 5 at E11.5; 10 at E12.5; 5 at E13.5 and 4-8 at E14.5

- 32 -

- 33 -
Figure 3. Single cell expression profiling of fate mapped progenitors supports
heterogeneity based on membrane markers and reveal different transcriptional
states.
(A) UMAP representation of 1965 yolk sac YFP+ cells from E9.5 Csf1riCreRosaYFP and
E10.5 Csf1rMeriCreMer RosaYFP pulsed at E8.5, index-sorted and processed with the MARS-Seq
pipeline. Clustering was performed using shared nearest-neighbor graph (SNN) and random
walks method (FAST-MNN). Clustering was performed using random walks clustering on a
shared nearest-neighbor graph (SNN) built using 13 nearest neighbors. Mf, macrophage; My,
myeloid progenitor; MEP, megakaryocyte-erythroid progenitor; pMC-MC, mast cell
progenitor/mast cell; pMK, Mk progenitor; pEry, erythroid progenitor. (B) Violin plot
representation of key lineage-associated gene expression by the hematopoietic clusters. (C)
UMAP representation of the cells colored by index sorting. A (purple), B (blue), C (green), D
(red), macrophages (Kitneg CD16/32high, pink) and megakaryocytes (Kitneg CD41high, orange).
(D) Representative contour plots showing expression of Gata1-mCherry and Pu.1-EYFP
among E9.5 (upper) and E10.5 (bottom) yolk sac progenitor subsets. n=9 and 3 at E9.5 and
E10.5, respectively. (E) Gene set enrichment analysis (GSEA) of the hematopoietic clusters.
Dot color indicates adjusted p-value and dot size indicates the percentage of genes that are
expressed from the pathway. Only the top 10 Gene Ontology (GO) pathways with Benjamini
and Hochberg adjusted p-value < 0.1 in at least one cluster are represented. The three GO
categories were used simultaneously (BP (Biological process), CC (Cellular component), MF
(Molecular Function)).

- 34 -

- 35 -
Figure 4. Lineage trajectories of EMP in the yolk sac.
(A) Slingshot infers three lineage trajectories starting from EMP1 towards pEry2 (red),
Mk2 (black) and My clusters (blue). (B) Trajectory from EMP1 to Mk2. Heatmap representing
the differentially expressed genes along the trajectory. Top 30 genes (30 smallest p-values)
for the trajectory are represented. (C) Trajectory from EMP1 towards Erythroid progenitors
(pEry2). Top 30 genes (30 smallest p-values) for the trajectory are represented. (D) Trajectory
from EMP1 to Myeloid progenitor cluster (My). Top 30 genes (30 smallest p-values) for the
trajectory are represented. (E) Upper panel, UMAP representation of YS E9.5 Csf1riCre
RosaYFP YFP+ Kit+ cells allows the identification of an EMP (green), Myeloid (red) and Mk
progenitor (blue) cluster. Lower panel, Slingshot infers two trajectories starting from EMP
towards pMk or My. (F) Trajectory of E9.5 EMP to Megakaryocyte progenitors (pMk). Top 30
genes (30 smallest p-values) for the trajectory are represented.

- 36 -

- 37 -
Figure 5. CD131 is a marker of EMP to erythroid commitment in the yolk sac.
(A) MA-plot of the MEP cluster comparing E9.5 to E10.5 cells. The genes that are
differentially expressed with FDR < 1% are shown as black dots, and the names of the genes
with FDR < 1% and logFC > 0.9 are shown. (B) Upper panel, expression of Csf2rb in the
UMAP. Lower panel, violin plot representation with boxplots of Csf2rb expression in all
hematopoietic clusters. (C) Representative contour plots showing cytometric analysis of
CD131+ cells among YS Kit+ CD41+ cells at E9.5 and E10.5. (D) Quantification of the number
of CD131+ cells per YS at E9.5 and E10.5. n=15 and 11 at E9.5 and E10.5, respectively. Bars
represent mean± sem. (E) Pie chart indicating the proportion of CD131+ cells among A-D
progenitor subsets. (F) Expression of Gata1-mCherry and Pu.1-EYFP among E9.5 and E10.5
YS CD131+ progenitors. n=9 and 3 at E9.5 and E10.5, respectively. (G) Colony forming units
(CFU-C) assays of sorted CD131+ progenitors compared to population A and analyzed 12
days after. Cloning efficiency (left) and frequency of colony types (Mk, Megakaryocyte; E,
erythroid; E/Mk, E and Mk; Gr1, granulocytes; MF, macrophages; MF/Gr1, MF and Gr; EMP,
mixed colonies) (right); mean± sem. Data from 6 embryos.

- 38 -

- 39 -
Figure 6. Deletion of the transcription factor Myb specifically results in a
blockage of yolk sac erythroid progenitors but does not affect megakaryocyte
differentiation.
(A) Flow cytometric analysis of Kit+ CD41+ cells from Myb-deficient embryos and wt
littermates from E9.5 to E11.5. (B) Number of cells per yolk sac in each population in Myb+/+,
Myb +/- and Myb-/- at E9.5, E10.5 and E11.5. Results from 3 independent litters per stage.
Bars represent mean± sem. ns, not significant; *, p<0.1; **, p<0.01. (C) Number of CD131+
cells per yolk in Myb+/+, Myb +/- and Myb-/- at E9.5, E10.5 and E11.5. Results from 3
independent litters per stage. Bars represent mean± sem. ns, not significant; *, p<0.1; **,
p<0.01. (D) Labelling efficiency (% of YFP+ cells) of red blood cells (RBC) and
megakaryocytes (Mk) in the yolk sac, blood and fetal liver of Csf1rMeriCreMer RosaYFP Myb-/-
embryos pulsed at E8.5. Results from 3 independent litters per stage. Bars represent mean±
sem. Statistical analysis compared wt and Myb-deficient groups: *, p<0.1.

- 40 -
Supplemental Figures (6)

- 41 -
Figure S1. (A) Gating strategy for EMP subsets in the E10.5 yolk sac. Cells were gated based
on size (FSC-A) and scatter (SSC-A). After doublet exclusion, lineage negative cells were
selected and EMPs were gated using expression of Kit and CD41. Among Kit+ CD41+ cells,
A was defined as AA4.1+ CD34+ and B as AA4.1neg CD34+. In the AA4.1neg CD34neg gate
(DN), C and D were identified based on CD45 expression. (B) Immunophenotype of E10.5
yolk sac Kit+ CD41+ cells with the markers used for the t-SNE analysis. Histogram of individual
markers and dot plots with overlay of A (purple), B (blue), C (green) and D (red) populations.
(C) Expression of CD45 on A (Kit+ CD41+ AA4.1+ CD34+) cells in the yolk sac over time,
from E8 to E10.5.
Figure S2. Gating strategy for Megakaryocytes (Mks) and red blood cells (RBC) in the E12.5
fetal liver of Csf1rMeriCreMer RosaYFP embryos pulsed at E8.5. Cells were gated based on size
(FSC-A) and scatter (SSC-A). After exclusion of doublets and autofluorescent debris, CD61hi
cells were selected and Mks were gated using expression of CD45 and CD41. For RBC,
CD71hi CD41neg cells were gated among Lineage+ CD45neg cells. YFP labelling was then
analyzed in Mks (CD61hi CD41+ CD45neg) and RBC (Lineage+ CD71hi CD45neg CD41neg).
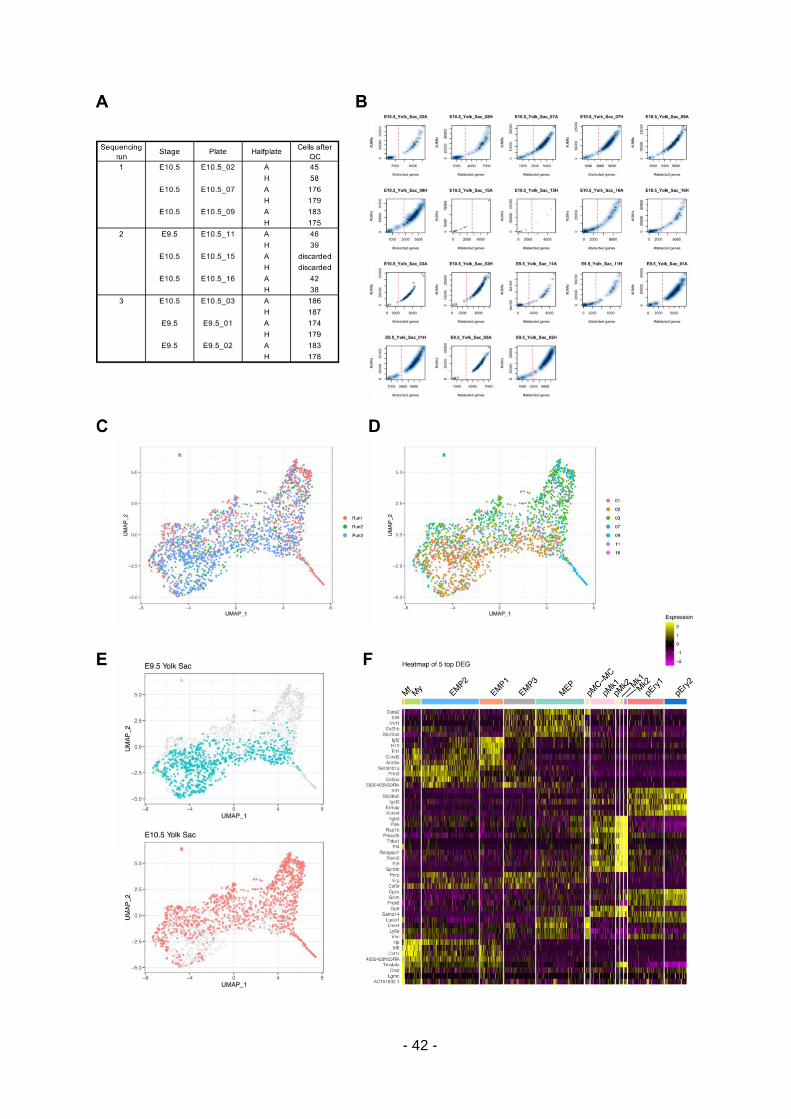
- 42 -

- 43 -
Figure S3. (A) Table summarizing the sequencing runs, sorted 384-well plates, separately
processed half-plates and the number of cells that passed the quality control in each half plate.
(B) Graphical representation of the number of UMI per number of detected genes in each cell
from each processed half-plate and with the threshold at 2750 detected genes for the QC (red
dotted line). (C) Representation of the three sequencing runs in the UMAP. (D) Representation
of the seven independently sorted plates in the UMAP. (E) Representation of the two
developmental time points (E9.5, turquoise, and E10.5, red) in the UMAP. (F) Heatmap
representing the top 5 differentially expressed genes (DEG) out of each pairwise cluster
comparison among the 13 clusters identified in the scRNA-seq analysis.

- 44 -

- 45 -
Figure S4. (A) Violin plot representing expression of Kit, key transcription factors (Myb,
Gata1, Spf1(Pu.1), Irf8) and Mk-associated genes (Itg2b, Mpl, Thbs1) by the 3 hematopoietic
clusters at E9.5. (B) Heatmap representing the 10 top differentially expressed genes (DEG)
among the 3 clusters identified at E9.5. pMk, Mk progenitor; My, Myeloid progenitor. (C)
Representation of the progenitor phenotype (A, purple; B, blue; C, green; D, red) of the cells
belonging to each of the three trajectories along the pseudotime value. (D) UMAP
representation of YS E9.5 Csf1riCre RosaYFP YFP+ Kit+ cells and the three clusters used for
trajectory analysis with Slingshot. (E) Representation of the progenitor phenotype (A, purple;
B, blue; C, green; D, red) of the cells belonging to the megakaryocyte trajectory in E9.5 dataset
alone along the pseudotime value.
Figure S5. Phenotype of CD131+ cells in the E10.5 yolk sac in regards to progenitor subsets
A-D. CD131+ cells (red) are overlaid on top of all CD41+ Kit+ progenitors.

- 46 -
Figure S6. (A) Number of YFP+ cells per yolk sac in each EMP subset (A-B-C-D) in Myb+/+,
Myb +/- and Myb-/- at E9.5, E10.5 and E11.5. Results 3 independent litters. Bars represent
mean± sem; ns, not significant; *, p<0.1. (B) Number of Mk cells per yolk sac in Myb+/+, Myb
+/- and Myb-/- at E9.5, E10.5 and E11.5. Results from 3 independent litters. Bars represent
mean± sem.

119
Part 2. Fetal liver
In order to further investigate the differentiation dynamics of EMPs, we followed pulsed-
labelled EMP and EMP-derived progenitors in the fetal liver at different stages.
EMP derived cells in the fetal liver
First, we performed high parameter flow cytometry from E12.5 FL and identified
myeloid progenitors as annotated in the bone marrow, since they have similar potential in the
E14.5 fetal liver(Traver et al., 2001). Lineageneg KIT+ Sca-1neg cells can be subdivided into
three progenitor populations, based on CD34 and CD16/32 expression: CMP (Common
Myeloid Progenitor, CD34+ CD16/32neg), GMP (Granulocyte and Macrophage progenitor,
CD34+ CD16/32+) and MEP (Megakaryocyte and erythrocyte progenitor, CD34neg C16/32neg).
The E12.5 FL contains a CD16/32+ CD34neg population that is not readily apparent in the bone
marrow and we named it P1 (Figure 9A). We performed dimensionality reduction (t-SNE) and
observed that the differences in surface marker expression did separate these four
populations. We observed that MEPs were characterized by an increase in CD71 and a
decrease in CD45 and ultimately CD41 at the surface. Also, we saw that GMPs have higher
CD61 (figure 9B).
We then used Csf1rMeriCreMer RosaYFP embryos pulsed in utero at E8.5 or E9.5 to observe
EMPs and EMP-derived progenitor phenotype in the fetal liver from E10.5 to E14.5 (Figure
9C). In total cells, we observed an acquisition of BM phenotype, since P1 was very abundant
at E10.5 but less apparent by E14.5 and GMP and CMP clearly separated from E11.5 onwards.
Pulsed EMPs gave rise to a majority of MEPs in both pulses (from 80% at E10.5 to 98% of
labelled progenitors at E14.5) and to GMPs and P1 cells. Pulse at E8.5 showed non-MEP
labelled progenitors until E13.5 and MEPs until E14.5 (Figure 9C) but there was a rapid
decrease of labelling efficiency in all progenitors from E11.5 (Figure 9D). Pulse labelling at
E8.5 suggested that CMP was not produced from EMP. Further, labeling efficiency equilibrated

120
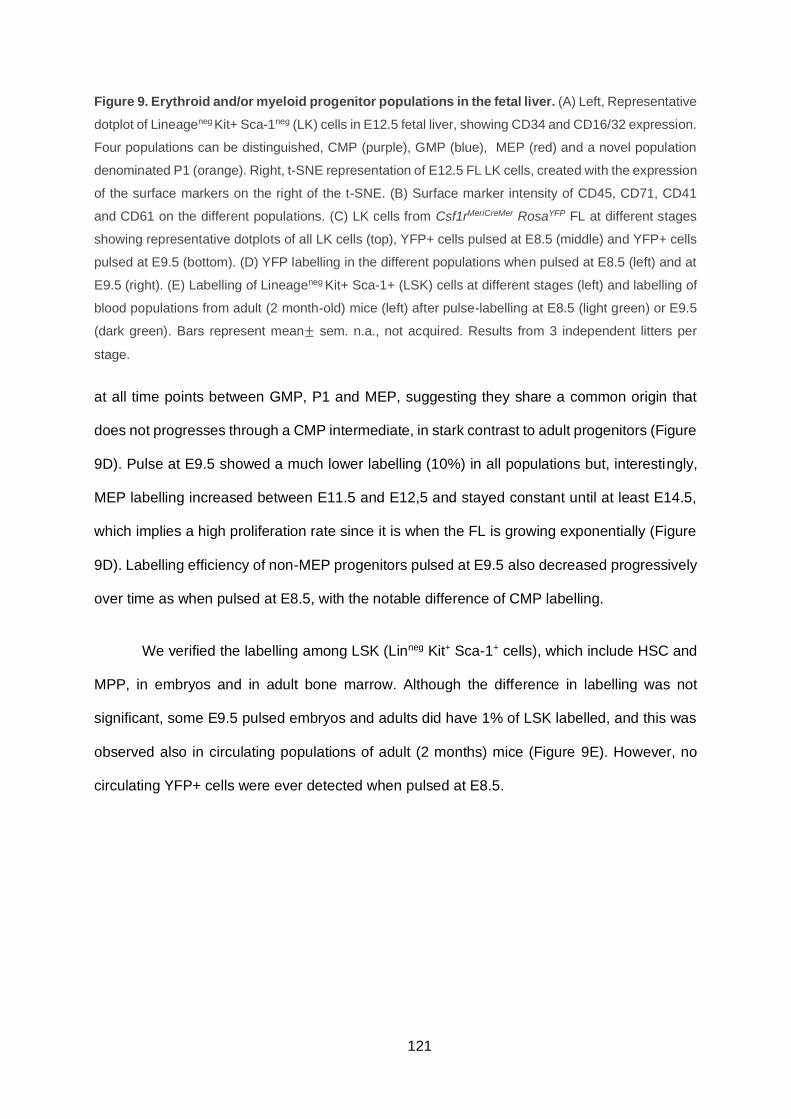
121
Figure 9. Erythroid and/or myeloid progenitor populations in the fetal liver. (A) Left, Representative
dotplot of Lineageneg Kit+ Sca-1neg (LK) cells in E12.5 fetal liver, showing CD34 and CD16/32 expression.
Four populations can be distinguished, CMP (purple), GMP (blue), MEP (red) and a novel population
denominated P1 (orange). Right, t-SNE representation of E12.5 FL LK cells, created with the expression
of the surface markers on the right of the t-SNE. (B) Surface marker intensity of CD45, CD71, CD41
and CD61 on the different populations. (C) LK cells from Csf1rMeriCreMer RosaYFP FL at different stages
showing representative dotplots of all LK cells (top), YFP+ cells pulsed at E8.5 (middle) and YFP+ cells
pulsed at E9.5 (bottom). (D) YFP labelling in the different populations when pulsed at E8.5 (left) and at
E9.5 (right). (E) Labelling of Lineageneg Kit+ Sca-1+ (LSK) cells at different stages (left) and labelling of
blood populations from adult (2 month-old) mice (left) after pulse-labelling at E8.5 (light green) or E9.5
(dark green). Bars represent mean± sem. n.a., not acquired. Results from 3 independent litters per
stage.
at all time points between GMP, P1 and MEP, suggesting they share a common origin that
does not progresses through a CMP intermediate, in stark contrast to adult progenitors (Figure
9D). Pulse at E9.5 showed a much lower labelling (10%) in all populations but, interestingly,
MEP labelling increased between E11.5 and E12,5 and stayed constant until at least E14.5,
which implies a high proliferation rate since it is when the FL is growing exponentially (Figure
9D). Labelling efficiency of non-MEP progenitors pulsed at E9.5 also decreased progressively
over time as when pulsed at E8.5, with the notable difference of CMP labelling.
We verified the labelling among LSK (Linneg Kit+ Sca-1+ cells), which include HSC and
MPP, in embryos and in adult bone marrow. Although the difference in labelling was not
significant, some E9.5 pulsed embryos and adults did have 1% of LSK labelled, and this was
observed also in circulating populations of adult (2 months) mice (Figure 9E). However, no
circulating YFP+ cells were ever detected when pulsed at E8.5.

122
Single cell expression analysis of EMP-derived progenitors of the yolk sac and
fetal liver
In order to further characterize EMP and EMP-derived progenitors, we also index-sorted
Csf1rMeriCreMer RosaYFP fetal liver YFP+ cells that were pulsed at E8.5 to perform single cell
expression analysis using the MARS-Seq pipeline. Kit+ YFP+ cells from E10.5 and E12.5 fetal
liver were analysed and merged to the yolk sac cells that were previously analysed (Figure
10A-B). When sorting E12.5 fetal liver progenitors, in order to enrich the dataset in myeloid
cells (98% of YFP cells are MEP, Figure 9), we sorted half of the plate of “non-MEP”
progenitors, defined as double negative cells for CD34 and CD16/32. This allowed us to
decrease the frequency of MEPs to 77% of average (Figure 10A). 5002 YFP+ cells were sorted
in total, including 64 yolk sac megakaryocytes and 29 macrophages from yolk sac and fetal
liver (Figure 10B). The objective of this analysis was to observe differences in the
differentiation dynamics of EMPs across different niches, the yolk sac and the fetal liver, and
stages, from E9.5 to E12.5.
Normalization and data merging were performed to minimize batch effects generated
during plate processing and sequencing runs (collaboration with Anne Biton, bioinformatician
at the C3BI, Institut Pasteur), and data was represented in UMAP (Figure 10C). The
enrichment for certain stages among certain cell types is biologically relevant feature that is
observed in the plate distribution in the UMAP (will be explained later, Figure 14) due to the
uneven distribution of stages among the sequencing runs (FL E12.5 were only analysed from
first run, E10.5 fetal liver were mostly from third run, and E9.5 yolk sac was mostly in the third
run). Importantly, cells from each sequencing run did locate in all parts of the UMAP although
up to different proportions.

123
Figure 10. Single cell RNA-Sequencing of yolk sac and fetal liver EMP-derived progenitors. (A)
Representative dotplots of the four sorted conditions. YS E9.5, E10.5 and FL E10.5 dotplots correspond
to the sorted cells from plates 02, 03 and 04 of Run1, respectively, and FL E12.5 dotplot corresponds
to plate04 of Run1. (B) Summary of processed plates following MARS-Seq pipeline and number of cells
that were used for analysis per half-plate after quality control (QC) and doublet exclusion. (C) Projection
of the dataset after merging and dimensionality reduction with Uniform Manifold Approximation and
Projection (UMAP). Upper panel shows the different sequencing runs and lower panel shows the
different processed plates.

124
Next, we clustered the cells using nearest-neighbour graph (SNN) and random walks
method (Pons and Latapy, 2006) and identified 13 well-defined cell states or clusters among
the cells which were annotated as followed: erythroid progenitors 1, 2 and 3 (pEry1, pEry2,
pEry3); megakaryocytes 1 and 2 (Mk1 and Mk2); megakaryocyte progenitor (pMk);
erythromyeloid progenitors 1 and 2 (EMP1, EMP2); mast cell (MC); mast cell progenitor (pMC),
erythromyeloid progenitor (EMP); granulocyte/monocyte progenitor (GMP); macrophage
progenitor (pMf); and macrophage (Mf) (Figure 9) Clusters were annotated on the basis of the
expression of lineage specific genes (Figure 9B) and of differentially expressed genes of each
pairwise comparison (Figure 10).
EMP1 and EMP2 did not express specific lineage genes although they were distinct
from each other. EMP1 expressed high Pu.1 (Sfpi1) and C/EBP- (Cebpb) and no Gata1.
EMP2 expressed higher levels of Gata2 and low levels of Gata1, together with lower
expression of Cd34 and Sfpi1, suggesting an erythroid-biased erythromyeloid progenitor. They
both expressed Notch1 and Gpr56 (not shown).
Erythroid progenitors (pEry1, 2 and 3) progressively acquired erythroid-specific genes.
pEry1 significantly expressed Gata1 and Gata2 and lower levels of CD34. pEry2 had lost the
expression of Gata2, but acquired more Klf1 and erythropoietin receptor (Epor). By pEry3, the
expression of haemoglobin genes such as Hba-a1 was evident (Figure 9B).
Megakaryocyte progenitor (pMk) expressed key megakaryocyte genes such as Rap1b,
integrin subunit Beta 3/CD61 (Itgb3), Integrin subunit alpha 2b/CD41 (Itgba2b) and
thrombospondin (Thbs1). pMk differed from fully mature megakaryocytes (Mk1 and 2) in that
it expressed megakaryocytic genes at a lower level and retained expression of progenitor
genes such as Kit and Gata2 (Figure 9B).

125
Figure 11. Distribution of clusters in the UMAP and expression of manually picked genes. (A)
Clustering is shown in UMAP representation. (B) Expression of manually picked lineage genes in UMAP.

126
Genes are divided in five columns, depending on the gene type. RBC, red blood cell; Mk,
megakaryocyte; GMP, Granulocyte/Monocyte progenitors.
The cell cluster annotated as GMP, for Granulocyte/Monocyte progenitors, expressed
Cd34 and PU.1 (Sfpi1), as the other myeloid progenitor cells. These cells expressed low levels
of the CCAAT/enhancer binding protein (C/EBP)- (Cebpb), but high levels of
myeloperoxidase (Mpo). Further, they are the sole cells expressing C/EBP- (Cepbe), which
could be indicative of neutrophil differentiation. They also expressed neutrophil granule
proteases such as proteinase 3 (Prtn3), elastase (Elane) and cathepsin G (Ctsg) (Prtn3 shown
in Figure 12B as example) and the proteinase inhibitor Serpinb1a was also significantly more
expressed in this cluster. Additionally, we detected in this cluster membrane spanning 4-
domains A3 (Ms4a3), which has been recently proposed to be a distinct marker for early
myeloid progenitors in the adult bone marrow (Liu et al., 2019). Granule proteoglycan serglycin
(Srgn), marker of granulocyte and mast cell, was significantly expressed in both GMP and MC
clusters. While we termed this cluster GMP in accordance to current consensus from adult
myeloid progenitors, it did mostly express granulocyte genes and no “monocyte” genes (or at
very low level), such as Csf1r or Cx3cr1.
Macrophage progenitors (pMf) were annotated on the basis of their high expression of
Colony Stimulating Factor 1 Receptor (Csf1r), Interferon Regulatory Factor 8 (Irf8) and C-X3-
C Motif Chemokine Receptor 1 (Cx3cr1). Together with EMP1, they expressed higher levels
of C/EBP- (Cebpb) and Myocyte Enhancer Factor 2C (Mef2c)(Schüler et al., 2008) than the
GMP cluster, which is indicator of monocyte and macrophage differentiation. pMf progenitors,
together with pMk, expressed lower levels of Myb compared to GMP, pMC and pEry.

127

128
Figure 12. Heatmap displaying the top three differentially expressed genes in each pairwise
comparison (ordered by p-value, always less than 0.01) used for clustering with shared nearest-
neighbor graph (SNN) and random walks method (FAST-MNN). Modularity was set to k=11. pEry1-3,
erythroid progenitor 1-3; pMk; megakaryocyte progenitor; EMP2, erythromyeloid progenitor 2; MC, mast
cell; pMC, mast cell progenitor; EMP, erythromyeloid progenitor; GMP, granulocyte/monocyte
progenitor; pMf, macrophage progenitor; Mf, macrophage. Red arrows point towards genes mentioned
in the text.
Mast cell clusters (pMC and MC) were annotated based on the higher expression of
Kit, Gata1 and Gata2, as well as expression of mast cell- specific genes: organic cation
transporter 3 (Slc22a3, histamine and organic cation transporter), interferon induced
transmembrane protein 1 (Ifitm1) and integrin alpha-4/beta-7 (Itgb7) (Figure 13A). High
expression of Lmo4 was also found to be a marker of pMC and MC in the dataset. MC cluster
also showed lower number of expressed genes, which is generally a marker of differentiated
cells when compared to progenitors(Banerji et al., 2013; Gaspar-Maia et al., 2011) (Figure
13B). Further, MC cells were mostly in the G1 cell cycle phase, together with mature Mk2 and
a part of mature Mf (Figure 13C). Collectively, these characteristics of the MC cluster pointed
to a set of differentiated mast cells or mast cell precursors produced early by EMP
hematopoiesis.
Finally, we analysed the contribution of the different sorted conditions, defined by stage
and tissue, to the clusters (Figure 14). As previously observed, E9.5 YS solely contained
undifferentiated EMPs (EMP1 and EMP2), macrophage progenitors (pMf) and megakaryocyte
progenitors (pMk). E10.5 YS contained in addition more myeloid progenitors, some in the GMP
cluster, mast cell progenitors and early erythroid progenitors.
E10.5 FL was the main source for pEry1 and pEry2 (Figure 14B), while it barely
contributed to EMP and myeloid progenitor compartments (GMP and pMf). They also
contributed to pMC and pMk and low number of cells were found in EMP2. Interestingly, E10.5
FL did contribute significantly to mature Mf, and co-clustered with E10.5 YS counterparts. This

129
Figure 13. MC cluster has differentiated mast cell characteristics. (A) Expression of mast cell
differentiation associated genes in UMAP representation. (B) Number of genes detected per cell in each
cluster. Mk1, Mk2, Mf and MC express less genes than progenitor cells. (C) Cell cycle phase score
given by cyclone across clusters (Right) shows that MC is uniquely in G1, together with terminally
differentiated Mk, while pMC is mostly in mitotic state. (Right) Cell cycle phase was annotated and
represented in the UMAP. Although G1 and S cells were found in all clusters, MC is composed only of
cells in G1.
could be consequent to a technical limitation of the MARS-Seq pipeline (lack of gene
detection), or it could indicate that FL E10.5 macrophages might be circulating macrophages
coming from the yolk sac that just seeded and did not significantly change gene expression
profile in response to their new niche. The low number of cells available (11 from the YS and
23 from the FL) unfortunately did not allow us to conclude further. E12.5 FL contribution offered

130
a complementary inverted picture to E10.5: undifferentiated cells were barely present when
compared to the large amount of committed cells, as late erythroid progenitors pEry3, mast
cells (MC) and GMPs.
This dataset clearly suggested that EMP commitment and differentiation was not only
time-specific but also niche-specific. The YS niche favoured exclusively Mk and Mf
differentiation at early stages, while early erythroid and broad myeloid fate (pMC, GMP and
pMF) were only evidenced a day later there. In the FL, Mk differentiation was mainly observed
at E10.5. However, macrophage differentiation (pMf) is almost virtually absent from the FL,
regardless of the stage, and it thus appeared as if macrophage differentiation from early pulsed
EMP was YS-specific.

131
Figure 14. Contribution of embryonic stage and niche to the cell clusters. (A) Distribution of the
cells per each condition in the UMAP: E9.5 YS, E10.5 YS, E10.5 FL and E12.5 FL. (B) Quantification of
the contribution of each condition to the clusters, showing percentage of cells in each cluster.

132

133
DISCUSSION
The contribution of different embryonic hematopoietic waves to the hematopoietic
system of the embryo and adult is a fascinating field of research. Several studies over the past
decade have demonstrated that EMPs, although a transient population of progenitors, are
essential to ensure fetal survival (Chen et al., 2011), as they give rise to the first burst of
definitive erythrocytes and to the first set of definitive myeloid populations of the embryo
(Gomez Perdiguero et al., 2015; McGrath et al., 2015a). Importantly, EMPs are also the origin
of some adult resident myeloid populations, as they have been shown to give rise to tissue
resident macrophages (Gomez Perdiguero et al., 2015; Hoeffel et al., 2015), and to some
tissue mast cells (Gentek et al., 2018a; Li et al., 2018). These myeloid subsets are able to self-
renew in their tissue of residency, without contribution from HSC-derived hematopoiesis in
steady-state.
Yet, little is known about the differentiation pathways that EMPs undertake during their
existence, as well as the extent of their contribution to the developing embryo. In the course of
my PhD, I aimed to decipher the spatio-temporal differentiation dynamics of EMPs throughout
embryonic development.
In this section, I will discuss the results we obtained on the phenotype of yolk sac
definitive MEPs, on the novel direct pathway of megakaryopoiesis I identified in the yolk sac
and on the macrophage and mast cell differentiation from EMPs. Finally, I will discuss the
observed differences of EMPs that emerged at E8.5 and at E9.5.
1.- Phenotype of yolk sac definitive MEPs
An initial objective of the project was to identify the phenotype of EMP-derived
progenitors. In this study, we showed a distinct phenotype of MEP progenitors produced in the
yolk sac by EMPs.

134
We showed that these MEP progenitors can be isolated within Kit+ CD41+ CD34neg
cells and further subdivided into populations C and D following downregulation of CD45. They
first appear at E9.5 (C, 79.22 20.23 sem; D, 72.97 21.41 sem) and are more abundant at
E10.5 (C, 262.49 54,36 sem; D, 153.39 22.86 sem). This is in accordance with the previous
observation of BFU-E and CFU-E producing progenitors starting at E9.5 in the yolk sac,
preceding the fetal liver (Palis et al., 1999). The analysis of scRNA-Seq Kit+ CD41+ cells in
Csf1rMeriCreMer RosaYFP embryos, pulsed at E8.5, confirmed that cell populations losing CD34
and CD45 gradually enriched in more terminally differentiated erythroid progenitors. Erythroid
clusters were composed of B, C and D cells, displaying a continuum of differentiation along
the trajectory. It is important to note that both C and D, although mostly erythroid, contained
cells in the clusters of megakaryocyte progenitors, and that the culture of these cells gave rise
to both RBC and Mk. Thus, these populations have not yet committed fully to red blood cells
production. The observation of CD34 downregulation is consistent with the phenotype of MEP
potential in the bone marrow and the fetal liver (Akashi et al., 2000; Traver et al., 2001).
Additionally, the loss of CD45 has been very recently reported to be a signature of EMP-
derived MEPs in the fetal liver (Soares-da-Silva et al., 2020).
Csf2rb/CD131 as a marker of early MEP commitment in the yolk sac
The pairwise statistical comparison of E9.5 and E10.5 MEP-committed progenitors in
the scRNA-Seq dataset was performed to resolve Ery/Mk pathways of differentiation, after the
observation that E9.5 and E10.5 cells segregated inside the MEP cluster and contributed
differently to the trajectories of megakaryocyte and erythrocytes. Csf2rb was found to be
expressed 2.4 fold more in E10.5 cells and it was expressed higher in those cells when
compared to other clusters. Since this gene encodes for the common β chain of the high affinity
receptor subunit CD131, we investigated the phenotype and colony forming potential of the
cells expressing CD131 at their surface. This led us to conclude that CD131 was a marker of
MEP commitment that was situated upstream of CD34 loss.

135
CD131 is the common β chain of the granulocyte-macrophage colony-stimulating factor
(GM-CSF/CSF2), interleukin-3 (IL-3) and interleukin 5 (IL-5) receptors. Each of the three
receptors is a heterodimer comprising a cytokine-binding chain, and a common β chain
(βc/CD131) that converts the low-affinity interaction between ligand and α chain to one of high
affinity (Scott and Begley, 1999). It is involved in the differentiation and survival of progenitor
cells and the growth and differentiation of myeloid cells and megakaryocytes.
A recent publication using scRNASeq proposed that CD131 expression in a subset of
human CMPs marks progenitors that were able to specifically generate megakaryocytes,
erythroid cells and Gata1-expressing myeloid cell types (basophils/mast cells and eosinophils),
but not monocytes or neutrophils. They designated CD131+ CMPs as EMPP
(erythroid/megakaryocyte-primed MPP) and also found CD131 expression in the MEP
compartment (Drissen et al., 2019). However, the mechanism governing this remains
unknown.
A possible explanation for these results may reside in the interaction of CD131 with
erythropoietin receptor (EpoR), since it is expressed early during MEP commitment. It has
been suggested that CD131/EpoR heterodimer regulates cellular stress responses in
mesenchymal cells of different tissues through alternative erythropoietin (EPO) signalling
(Bohr et al., 2015; Brines et al., 2004; Leis et al., 2004). However, the interaction of EpoR and
CD131 is not yet clear and rather controversial. A recent report claimed that the biophysical
interaction of the two proteins does not occur with EPO (Cheung Tung Shing et al., 2018). On
the other hand, a recent screening of artificial transmembrane protein aptamers, extremely
short proteins designed to bind to transmembrane proteins, demonstrated that the combination
of the transmembrane domain and JAK2-binding sites of the EpoR with the transmembrane
and cytoplasmic domains of CD131 induced cell proliferation when activated by EPO (He et
al., 2019).

136
Another possible explanation would be in the GM-CSFR/CSF2R complex itself, since
it is known that GM-CSF stimulates the maintenance of multipotential progenitor cells, the
initial proliferation of progenitors of the erythroid, eosinophil, and megakaryocyte lineage, as
well as mature cells of the granulocyte/monocyte lineage (Burgess and Metcalf, 1980). Indeed,
single cell cloning studies showed that GM-CSF could stimulate at least five divisions of cells
that subsequently formed mixed or pure erythroid, eosinophil, or megakaryocyte colonies but
that it was not required for the terminal cell divisions in these pathways (Metcalf et al., 1980).
Interestingly, human GM-CSF does supports terminal maturation of erythrocyte colonies in the
absence of EPO (Nishijima et al., 1997).
Since CD131 is only expressed early during MEP commitment but is downregulated in
pEry1 and pMk1 cell clusters, is it possible to hypothesize that CD131 is involved in the
proliferation of the progenitors before their maturation via EPO, GM-CSF or another ligand that
could activate the receptor signalling cascade. CD131 upregulation could be part of the
differentiation process of MEP-biased progenitors in order to proliferate, or it could be the result
of a stochastic expression of CD131 in EMPs, which in turn biases their differentiation towards
MEP differentiation.
2.- EMP-derived megakaryopoiesis
The fate-mapping of Csf1rMeriCreMer RosaYFP embryos combined with the deletion of Myb,
a key transcription factor for definitive erythropoiesis, showed that EMPs produce
megakaryocytes in the yolk sac that do not transit through a CD131+ MEP stage. Also, it
demonstrated that MEP-independent differentiation occurs rapidly after EMP emergence,
since yolk sac megakaryocytes were practically only labelled when the OHT pulse was given
at E8.5.
These results share similarities with the observation of (i) Mk-primed HSC (vWF+
CD150+) that are placed at the top of the differentiation tree and that directly differentiate into

137
Mk (Sanjuan-Pla et al., 2013), and (ii) HSC and MPP priming towards megakaryocytes that
has been observed in single cell studies combining clonal studies with gene expression
analysis (Rodriguez-Fraticelli et al., 2018). Additionally, Mk-primed HSC have been shown to
occupy a distinct niche in the bone marrow and to be regulated by megakaryocytes (Pinho et
al., 2018). We currently ignore whether EMP-direct megakaryopoiesis is produced by a
phenotypically different subset of EMP or if it emerges in specific regions of the yolk sac
vasculature.
As it has been mentioned in the introduction, megakaryocyte potential emerges in the
mouse yolk sac at E8 (4-6sp), peaks at E9.5 (Tober et al., 2007) and most embryonic
megakaryocytes and platelets are formed after E10.5 (Potts et al., 2014). The distinct
phenotype of yolk sac-derived megakaryocytes (Cortegano et al., 2019; Potts et al., 2014), the
association of Mk colonies with primitive erythroid colonies at E8-E9 (Tober et al., 2007) and
the independence of yolk sac megakaryopoiesis from Myb (Tober et al., 2008) has led to the
conclusion that this first wave of megakaryopoiesis is of primitive origin.
Our results raise the possibility that yolk sac megakaryopoiesis is, to a great extent, of
EMP origin. Unfortunately, labelling using the Csf1rMeriCreMer inducible construct underestimates
the contribution of the pulsed EMP progenitors, since only 40% of the progenitors are labelled.
Similarly, the inability to label primitive megakaryocytes does not allow us either to resolve
their quantitative contribution in vivo to megakaryopoiesis.
Regarding the independence from the transcription factor Myb, an initial study reported
that no megakaryocyte progenitors were produced in the absence of Myb, since both Myb -/-
CFU assays and ES cell chimeras failed to produce megakaryocytes (Sumner et al., 2000). In
contrast, a later report stated that Myb depletion did not affect yolk sac megakaryopoiesis
specifically (Tober et al., 2008). We could confirm both reports, since the number of
megakaryocytes were normal in Myb-deficient yolk sacs in vivo but we did not observe any
megakaryocyte colony development ex vivo. One hypothesis to reconcile such conflicting

138
findings is that Myb might be important in the colony environment during Mk differentiation. In
mice with single point mutations in the c-Myb gene (Metcalf et al., 2005), Myb-disrupted
progenitors generated CFU-Mk colonies in regular culture conditions that were distinctively
small, containing 2-20 cells per well, when compared to the average colony of 100-200 cells.
If this was also the case in the Myb-/- mutant, Mk colonies would have been missed by our
colony counting method, flow cytometry.
Altogether, these results demonstrate that EMPs can differentiate into megakaryocytes
in the yolk sac very rapidly (in 24-48h) and that they do not depend on a MEP intermediate to
do so. These results uncover two pathways to produce definitive megakaryocytes: a direct yolk
sac-specific pathway that starts at E9.5 directly from EMP progenitors in a Myb-independent
manner, and a second adult-like pathway, where EMP produce first MEP in the yolk sac in a
Myb-dependent manner and that terminally differentiate into both erythrocytes and
megakaryocytes in the fetal liver.
3.- Production of macrophages by EMPs
Contrary to the observation of sophisticated maturation levels of erythrocyte and
megakaryocyte progenitors, the transcriptional analysis of EMP-derived progenitors in the yolk
sac showed a distinctively short macrophage differentiation continuum in both E9.5 and E10.5
yolk sac cells. This was embodied by the similarity of EMP1/EMP2 and myeloid clusters in the
yolk sac, both containing also A cells (AA4.1+). There are several possible explanations for
this result that will be discussed here.
One possible interpretation is that the differentiation of EMPs towards macrophages is
very rapid in the yolk sac. This is contrary to a report that performed scRNA-Seq from E9-
E10.25 CD45+/low cells, which showed a differentiation continuum from a non-primed EMP
through a pMac intermediate towards a differentiated macrophage(Mass et al., 2016). The key
difference with our study is that they also sorted all the CD45+ cells, which could support the

139
idea that Kit downregulation is very rapid during macrophage differentiation and that the
following steps are performed through a Kitneg precursor, the pre-mac, that would probably also
be responsible for expansion of the macrophage population. In this case, more cells would
need to be sorted to observe intermediate progenitor levels, maybe focusing on A and/or
CD131neg B cells to enrich in myeloid-biased cells, and adding more Kitneg CD45+ cells.
Another possible interpretation is that the technique has an insufficient level of gene
detection. A comparative analysis of single-cell RNA sequencing methods found that MARS-
Seq had a high probability of gene dropout (fraction of cells with zero counts) and a lower
sequencing depth than other methods like Smart-seq, Smart-seq2 and CEL-seq2 (Ziegenhain
et al., 2017). A third possible interpretation would be that bona fide EMP gene expression is
very similar to macrophage progenitor gene profile, which, together with a lower detection
capacity, would not allow to properly resolve the two progenitor populations. In order to
address this problem, we could resort to use a complementary scRNA sequencing technique
such a 10X Chromium, which can now be combined with surface protein detection (CITE-Seq),
or perform single cell RT-qPCR in a microfluidic-based platform such as BioMark.
We did, nevertheless, identify a myeloid progenitor cluster (My in the YS analysis, pMf
in the analysis of YS and FL) with a higher expression of Csf1r, Cx3cr1 and Irf8 and a lower
expression of Myb, which was also observed in the study of Mass and colleagues (Mass et al.,
2016).
Macrophage cluster in the single cell analysis
It was interesting to notice a big separation in the UMAP between the My and
macrophage (Mf) clusters. This could be, as mentioned before, because intermediate
precursors were not sorted. But it could also indicate that the sorted macrophages were of
primitive origin. Indeed, the major caveat of Csf1rMeriCreMer strain is that committed macrophage
progenitors/precursors can recombine independently of their origin, as they also express

140
Csf1r. Also, within the Mf cluster, macrophages sorted from the E10.5 fetal liver clustered with
those of the yolk sac, without any tissue-specific “signature”. This could also be due to a
potential primitive origin or another possible explanation is that those cells had just colonized
their tissue or were still in the internal circulation of the yolk sac and fetal liver, respectively, so
they did not acquire yet the tissue-specific characteristics of their niche. Unfortunately, the
plates of E12.5 macrophages, monocytes and granulocytes prepared in order to address this
further failed in the sequencing step, so we were unable to compare the expression of E12.5
fetal liver myeloid cells with the E10.5 YS and FL macrophages or the different myeloid
progenitor subsets identified in the FL.
4. EMP-derived mast cell production
One unanticipated finding of the study was the presence of mast cell-committed
progenitors starting from the E10.5 yolk sac, and the large amount of mast cell progenitor (or
precursor) numbers in the E12.5 fetal liver.
Both the YS and FL cells from the MC clusters (pMC and MC) expressed genes
involved in the differentiation of mast cells, such as Gata1, Gata2, Scl22a3 and Itgb7 (Figure
9-11). However, due to the expression of Kit in differentiated mast cells and the lack of mature
mast cell gene expression in embryonic mast cells, specially FcRI (McGrath et al., 2015a),
we could not formally conclude on the degree of differentiation of this cluster. Instead, we
analysed cell cycle status and the number of genes detected in the cluster to decide between
progenitor/precursor and mature mast cells.
First, the cell cycle score given by the Cyclone package showed that 80% of cells in
the MC cluster were in cell cycle arrest (G1), thus in favour with more mature differentiated
cells. Second, MC progenitors (pMC) cells expressed on average 4500-5000 genes/cell,
indicating a higher signalling promiscuity, or entropy, while Mk2, Mf and MC clusters contained
around 3500 genes/cell. As a general rule, the low basal expression of a wide range of

141
developmental transcription factors is a marker of stem and progenitor cells, related to the
openness of the chromatin in these cells (Efroni et al., 2008; Gaspar-Maia et al., 2011; Lee et
al., 2006), therefore, they can be distinguished from differentiated cells that highly express a
lower number of lineage-specific genes and genes implicated in mRNA splicing(Banerji et al.,
2013). Of note, signalling promiscuity is now used in computational methods in order to infer
the inherent potency of different cells in single cell analysis algorithms like SCENT (Chen and
Teschendorff, 2019; Teschendorff and Enver, 2017). Collectively, these findings, associated
to the higher expression of mast cell related genes, indicated that the cluster annotated as MC
was more terminally differentiated that pMC (MC progenitor) and could therefore contain mast
cells and/or mast cell precursors.
The idea that the YS could harbour mast cell precursors was first introduced by Sonoda
and colleagues in 1983 (Sonoda et al., 1983). They showed that the injection of E9.5 or E11
yolk sac cells directly into the skin of adult mice produced mast cells that could be observed in
the skin 5 months after the graft, at a higher efficiency than the fetal liver cells of the same
stages. In the fetal liver, the number of cells with mast cell potential explode from E11.5 to
E17.5 (Gentek et al., 2018a; Sonoda et al., 1983), which could be explained with the big
contribution of E12.5 EMP-derived cells to the more differentiated MC cluster in our dataset.
Differentiation hierarchy of mast cell progenitors
Mast cell clusters (pMC and MC) are found adjacent to MEP in the UMAP, which could
suggest that they share a differentiation trajectory or just be the consequence of similar
expression of Gata1 and Gata2 gene sets, among others, during differentiation. This adjacent
clustering has already been observed for mast cell progenitors in several single cell expression
studies. A novel megakaryocyte-erythroid-mast cell (MEMP) progenitor has been proposed
from human FL scRNA-seq analysis (Popescu et al., 2019), just based on UMAP proximity
and force-directed graph (FDG) inferred-trajectory analysis, but without any functional
validation. Similarly, mast cell and basophil potential within the CMP population has been

142
observed to be more correlated to MEP-biased CMPs than to granulocyte/monocyte-biased
CMPs (Drissen et al., 2019; Franco et al., 2010), suggesting that mast cells could be
generated in the course of MEP differentiation. Other studies have claimed that the potential
to give rise to pure mast cell colonies in the bone marrow resides only in GMPs, through a
bipotent basophil/mast cell progenitor (Arinobu et al., 2005; Iwasaki et al., 2006; Qi et al.,
2013). Unfortunately, since we could not distinguish basophil progenitor signature in our
dataset and we did not evaluate mast cell potential in the CFU-assays, we are not able yet to
conclude on this matter.
5. Similarities and differences between EMPs emerging at E8.5 and at E9.5
Phenotype of bona fide EMPs in the yolk sac
EMPs had been characterised as Kit+ CD41+ CD16/32+ cells at E9.5 by McGrath and
colleagues (McGrath et al., 2015a) and as Kit+ CD45low AA4.1+ cells from E9 to E10.5 (Bertrand
et al., 2005a; Gomez Perdiguero et al., 2015). As for the latter, AA4.1 expression during
development is found in vascular endothelial cells, aorta-associated hematopoietic clusters
and fetal liver hematopoietic progenitors (Petrenko et al., 1999) but its function in not known.
Indeed, CD45neg/low Kit+ AA4.1+ cells were enriched mostly for multipotent cells with LTR
activity, or HSC, in the E10.5 AGM (Bertrand et al., 2005a) and for erythromyeloid progenitors
in the E9 and E10.5 YS (Bertrand et al., 2005a; Gomez Perdiguero et al., 2015). I thus
performed an unbiased approach of high parameter flow cytometry and scRNA-Seq analysis
of Kit+ CD41+ cells using AA4.1, CD34 and CD45 fluorophore-conjugated antibodies.
While CD16/32-defined EMPs were found all across the EMP differentiation spectrum,
including certain erythroid-committed progenitors, AA4.1-defined EMPs (named population A
in this study) were relatively homogeneous at the gene expression level, and expressed Pu.1
but not Gata1. Among YS progenitor populations, AA4.1-defined EMPs were the first to
appear, between E8 and E8.75, and subsequently gave rise to the other progenitor
143
populations. Therefore, this study confirms that AA4.1 is a marker of early emerging EMPs
that is rapidly downregulated in 24 hours as EMPs advance in the differentiation process.
Careful analysis of differentially expressed genes (DEGs) in the scRNAseq dataset has not
allowed us thus far to identify (and test) novel surface markers for EMPs, which could
dramatically improve our toolset for EMP studies.
Observation of “early” and “late” emerging EMPs
The different output observed between E8.5 and E9.5 OHT-pulsed progenitors in
Csf1rMeriCreMer RosaYFP embryos raises interesting possibilities. The differences and similarities
have been summarised in Table 2.
EMP that were pulsed with Csf1rMeriCreMer at E8.5 had different potential in vivo than the
ones pulsed at E9.5. EMPs pulsed at E8.5 gave rise to a rapidly maturing wave of MEP-
independent megakaryocytes and to erythroid progenitors that generated millions of red blood
cells that were exhausted by E14-15 in the FL. The pulse at E9.5, on the other hand, seemed
to give rise to a more classical pathway of differentiation, in which megakaryocytes are
produced in the FL together with red blood cells. The maintenance of EMP-derived progenitors
in the fetal liver for a longer period of time suggests that more undifferentiated progenitors
colonize the FL in this wave.
The differences between the two pulses could be explained (i) by a temporal specialization of
progenitors in the yolk sac, in response to changes in the hematopoietic niche over time, or
due to different signals provided by the microenvironment through the emergence in different
locations (cell extrinsic hypothesis), or (ii) by the emergence of two waves of EMP progenitors
(cell intrinsic hypothesis). Indeed, as commented in the literature review, the vascular niche is
very different at E8.5 and E9.5, since the vascular plexus is being remodeled into a network of
blood vessels and arteries, and could harbor different local microenvironment along the
remodelling procedure.

144
OHT E8.5 OHT E9.5
Similarities They give rise to cells of the erythromyeloid lineages
They label population A, which differentiates in 24 hours
They produce erythrocytes in the liver three days after pulse and release
them to circulation in five days
AA4.1+ cells of E9.5 and E10.5 YS (pulsed at E8.5) did not cluster
separately in scRNASeq analysis
Differences 40% maximum of progenitor
labelling
10% maximum of progenitor
labelling
Labels YS population D at E10.5 No YS D labelling is observed
Labels YS specific MEP-
independent Mk production
Mk production is mostly localized in
the FL
Labels a wave of large erythrocyte
production that exhausts rapidly
Labels a wave of erythrocyte
production that is maintained longer
YFP+ FL progenitors are rapidly
exhausted
YFP+ FL progenitors are maintained
for a longer time
No labelling of LSK No labelling of LSK, although 1-
1.5% in some litters
Table 2. Comparison of the results obtained in Csf1rMeriCreMer RosaYFP embryos pulsed at E8.5 or
E9.5. Population A was defined as AA4.1+ CD34+ CD45+; population D as AA4.1neg CD34neg CD45neg
CD71+; YS, yolk sac; FL, fetal liver; MEP, megakaryocyte/erythrocyte progenitors; LSK, Linneg Kit+ Sca-
1+.

145
The existence of two waves of EMP potential was claimed by Hoeffel and colleagues
in 2015 (Hoeffel et al., 2015). In their study, they reported that EMP emerging at E7.5 were
expressing Csf1r but not Myb, and gave rise to yolk sac macrophages and microglia. They
denominated this wave “early” or “primitive” EMPs, due to the possibility that it embodied
primitive macrophage precursors. On the other hand, they reported a wave of “late” or
“definitive" EMPs that expressed Myb but not Csf1r. To set the stages for each EMP wave,
they used the OHT induction timing from Runx1MerCreMer (E7.5, E8.5 or E9.5) and they assumed
that the Runx1MerCreMer OHT E7.5 pulse corresponded (i.e. labelled the same cells) to the
Csf1rMeriCreMer E8.5 pulse. To our knowledge, no erythromyeloid potential has been observed
in the literature in progenitors emerging at E7.5 (Gomez Perdiguero et al., 2015; McGrath et
al., 2015a; Palis et al., 1999), therefore there are not “early” EMPs that could emerge that early
(E7.5). Further, the authors did not assess themselves for erythromyeloid potential in the
different stages or pulses (by CFU assays and/or quantifying red blood cell labelling). The
confusion is likely explained by the fact that Runx1 labels endothelial cells with hemogenic
potential at E7.5, but not directly emerging progenitor cells at this stage (Samokhvalov et al.,
2007).
A note of caution is due here also, since the Csf1rMeriCreMer strain was generated by a
classical additive transgenesis, and it is not a knock-in like the Runx1MerCreMer or KitMerCreMer
strains, thus the expression of the Cre may not fully recapitulate endogenous expression of
Csf1r. However, all E8.5 Csf1r+ labeled cells in Csf1riCre embryos expressed the Csf1r protein,
as did most, but not all, of the E9.5 cells, indicating that some EMP-derived cell did lose Csf1r
expression as they differentiated (Kasaai et al., 2017). This observation contradicted the study
by Hoeffel an colleagues, which stated that no Csf1r protein was expressed by Kit+ CD41+
cells at E9.5 (E8.5 cells were not tested), although some mRNA was expressed at E9.5 and
even less mRNA was found at E10.5 using Csf1r-GFP mice as a proxy for gene expression
(Hoeffel et al., 2015). Similarly, they found that more Myb mRNA was found in E10.5 Kit+
CD41+ cells compared to E9.5 cells (again, E8.5 cells were not tested).
146
Our study offers an explanation for the observation of a decrease in Csf1r expression
and an increase in Myb expression in Kit+ CD41+ progenitor cells over time when sorted as
bulk. This is, in fact, due to an increase of progenitor heterogeneity in the yolk sac, and in
particular the large production of yolk sac MEP progenitors, which express high levels of Myb
and no Csf1r. Therefore, if two waves of EMP exist, expression of Csf1r or Myb at the EMP
level is most probably not a distinctive marker of each wave.
The reason why the labelling efficiency is different between the two pulses is not yet
clear. One possibility is indeed that the EMPs emerging from E8.5 to E9.5 are expressing
higher levels of Csf1r transcript than the ones emerging from E9.5 to 10.5. A second possibility
is that more EMPs are emerging from E8.5 to E9.5 than later. A third possibility involves the
pharmacological kinetics of OHT in utero.
As for the first possibility, it is fundamental to assess the levels of Csf1r and other
interacting factors by single cell qPCR, i.e. using the BioMark technology. Regarding the
second possibility, the maximum number of A and B (putative Csf1r+ expressing cells) was
found at E9.5, which is consistent with the maximum number of clusters in the yolk sac found
by Frame and colleagues (Frame et al., 2016). We thus do not observe a decrease in EMP
production that would explain the results. Finally, it is important to notice that the lack of fine
understanding on the precise pharmacological kinetics of OHT in utero makes it very difficult
to conclude, as OHT induced recombination in time may not follow a symmetrical Gaussian
distribution, which could severely impact on the interpretation of such close-by pulses.
In any case, in order to assess the intrinsic hematopoietic potential of the two EMP
waves single cell clonal analysis should be performed. First, colony forming assay (CFU) from
EMPs at E8.5 and E9.5 should be performed to verify the potential of the progenitors ex vivo,
in a controlled environment. Alternatively, we could verify the potential of E8.5 versus E9.5
pulsed AA4.1+ progenitors at E10.5. Second, we could take advantage of novel cell barcoding
technologies such as the PolyloxExpress barcoding recently developed by Pei and colleagues

147
(Pei et al., 2020). This system combines lineage tracing and single progenitor cell barcoding
(single cell fate) with single cell RNA-Sequencing (transcriptomics of the produced cells), and
could be fundamental to observe the dynamics of differentiation in vivo of the two pulses in the
yolk sac and the fetal liver. Ideally, it would resolve the question on whether E8.5 cells tend to
have a uni-lineage potential compared to E9.5 cells, and would particularly resolve the input
of MEP-independent or dependent megakaryopoiesis to the pool of labelled megakaryocytes.
Once the inherent potential of the two pulses is characterised, a greater focus on the
location of the different emerging progenitors in the yolk sac (arterial/venous or distal/proximal
vasculature) could produce interesting findings that could account for the specifications of each
wave.
Altogether, we evidenced that EMPs with different in vivo potential exist in the embryo,
either corresponding to the emergence of two distinct waves of EMP progenitors or as a result
of a temporal specialization of progenitors in the yolk sac, in response to changes in the signals
provided by the niche over time. Several questions remain unanswered at present and further
work is required to establish the identity of the progenitors emerging at E8.5 or E9.5.

148

149
CONCLUSION
The purpose of my thesis was to decipher the spatio-temporal differentiation dynamics
of erythromyeloid progenitors (EMP) and to characterize the phenotype of EMP and EMP-
derived progenitors throughout development. In order to do so, we embarked upon an
extensive characterization of EMP and EMP-derived progenitors using high parameter flow
cytometry, fate mapping approaches and single cell expression analysis. In particular, we
focused on their niche of origin, the yolk sac (YS), where we resolved the heterogeneity of
EMP-derived progenitors and demonstrated the existence of a direct pathway of definitive
megakaryopoiesis.
First, we observed the segregation of four different EMP-derived progenitors in the
E10.5 yolk sac, based on AA4.1, CD34 and CD45 expression, which are distinct at a potency
and gene expression level, and identified among them AA4.1+ CD34+ CD45low/+ as a marker of
bona fide EMPs.
Second, we identified the intermediate steps in the erythroid/megakaryocyte pathway,
thanks to a cell surface marker identified with the scRNA-seq analysis, CD131, which was
upregulated between E9.5 and E10.5. We validated this marker in functional assays and
demonstrated that CD131 is a marker of early megakaryocyte/erythrocyte progenitor (MEP)
commitment, that is expressed before the complete downregulation of CD34 and CD45 in late
MEP.
Additionally, the combination of Myb deficiency with EMP pulse labelling using the
Csf1rMeriCreMer strain showed that EMPs emerge normally in Myb-/- embryos and differentiate
directly into megakaryocytes, bypassing yolk sac CD131+ MEP progenitors. Importantly, we
showed that this novel direct MEP-independent megakaryopoiesis is part of the unperturbed
in vivo differentiation dynamics of EMPs, since it was also present in Myb-competent embryos,
150
as evidenced during EMP fate mapping and scRNAseq studies. Therefore, we demonstrated
that EMPs can differentiate into megakaryocytes in the yolk sac very rapidly (in 24-48h) and
that they do not depend on a MEP intermediate to do so.
Finally, the results in this study indicated that the timing of EMP emergence in the yolk
sac could impact its differentiation potential and contribution to the hematopoietic system of
the embryo. Yolk sac MEP-independent megakaryopoiesis was produced in a limited time
window, as evidenced by the fact that yolk sac Mks were only labeled when EMP were pulsed
at E8.5 and not at E9.5. Further, the different labelling dynamics of fetal liver progenitors, and
red blood cells particularly, suggested that the cells colonizing this niche had different potential
depending on their time of production.
Taken together, the findings of this thesis provide insights into the ontogeny of early
embryonic hematopoiesis and specially contribute to our understanding of the hematopoiesis
of the yolk sac. As a result, we can build a EMP-lineage tree that embodies yolk sac definitive
hematopoiesis (Figure 15).

151
Yolk sac definitive hematopoiesis
Figure 15. Hallmarks of yolk sac definitive hematopoiesis depicted as a lineage tree. Bona fide
EMPs are characterised by the expression of AA4.1, and they sequentially give rise to macrophage
precursors (Mfp), megakaryocyte precursors (Mkp) and definitive megakaryocyte/erythrocyte
progenitors (MEP). EMP give rise both to macrophages and megakaryocytes/platelets in the yolk sac in
a Myb-independent manner, while MEP differentiation requires Myb expression. Cell surface phenotype
is shown in bold green, upregulated or downregulated genes are shown in green italics and the green
vertical arrows indicate the up or downregulation of the genes in the differentiation steps, illustrated by
horizontal black arrows.

152

153
REFERENCES
Adamo, L., Naveiras, O., Wenzel, P.L., McKinney-Freeman, S., Mack, P.J., Gracia-Sancho, J., Suchy-Dicey, A., Yoshimoto, M., Lensch, M.W., Yoder, M.C., et al. (2009). Biomechanical forces promote embryonic haematopoiesis. Nature 459, 1131–1135.
Ajami, B., Bennett, J.L., Krieger, C., Tetzlaff, W., and Rossi, F.M.V. (2007). Local self-renewal can sustain CNS microglia maintenance and function throughout adult life. Nat. Neurosci. 10, 1538–1543.
Akashi, K., Traver, D., Miyamoto, T., and Weissman, I.L. (2000). A clonogenic common myeloid progenitor that gives rise to all myeloid lineages. Nature 404, 193–197.
Alberts, B., Johnson, A., Lewis, J., Raff, M., Roberts, K., and Walter, P. (2002). Molecular Biology of the Cell (New York).
Allakhverdi, Z., Smith, D.E., Comeau, M.R., and Delespesse, G. (2007). Cutting Edge: The ST2 Ligand IL-33 Potently Activates and Drives Maturation of Human Mast Cells. J. Immunol. 179, 2051–2054.
Arinobu, Y., Iwasaki, H., Gurish, M.F., Mizuno, S.I., Shigematsu, H., Ozawa, H., Tenen, D.G., Austen, K.F., and Akashi, K. (2005). Developmental checkpoints of the basophil/mast cell lineages in adult murine hematopoiesis. Proc. Natl. Acad. Sci. U. S. A. 102, 18105–18110.
Athens, J.W., Haab, O.P., Raab, S.O., Mauer, A.M., Ashenbrucker, H., Cartwright, G.E., and Wintrobe, M.M. (1961). Leukokinetic studies. IV. The total blood, circulating and marginal granulocyte pools and the granulocyte turnover rate in normal subjects. J. Clin. Invest. 40, 989–995.
Auffray, C., Fogg, D., Garfa, M., Elain, G., Join-Lambert, O., Kayal, S., Sarnacki, S., Cumano, A., Lauvau, G., and Geissmann, F. (2007). Monitoring of blood vessels and tissues by a population of monocytes with patrolling behavior. Science (80-. ). 317, 666–670.
Auffray, C., Fogg, D.K., Narni-Mancinelli, E., Senechal, B., Trouillet, C., Saederup, N., Leemput, J., Bigot, K., Campisi, L., Abitbol, M., et al. (2009). CX3CR1+ CD115+ CD135+ common macrophage/DC precursors and the role of CX3CR1 in their response to inflammation. J. Exp. Med. 206, 595–606.
Avecilla, S.T., Hattori, K., Heissig, B., Tejada, R., Liao, F., Shido, K., Jin, D.K., Dias, S., Zhang, F., Hartman, T.E., et al. (2004). Chemokine-mediated interaction of hematopoietic progenitors with the bone marrow vascular niche is required for thrombopoiesis. Nat. Med. 10, 64–71.
Bain, C.C., Bravo-Blas, A., Scott, C.L., Gomez Perdiguero, E., Geissmann, F., Henri, S., Malissen, B., Osborne, L.C., Artis, D., and Mowat, A.M.I. (2014). Constant replenishment from circulating monocytes maintains the macrophage pool in the intestine of adult mice. Nat. Immunol. 15, 929–937.
Bainton, D.F., Ullyot, J.L., and Farquhar, M.G. (1971). The development of neutrophilic polymorphonuclear leukocytes in human bone marrow: Origin and content of azurophil and specific granules. J. Exp. Med. 134, 907–934.
Banaei-Bouchareb, L., Gouon-Evans, V., Samara-Boustani, D., Castellotti, M.C., Czernichow, P., Pollard, J.W., and Polak, M. (2004). Insulin cell mass is altered in Csf1 op /Csf1 op macrophage-deficient mice. J. Leukoc. Biol. 76, 359–367.
Banerji, C.R.S., Miranda-Saavedra, D., Severini, S., Widschwendter, M., Enver, T., Zhou, J.X., and Teschendorff, A.E. (2013). Cellular network entropy as the energy potential in

154
Waddington’s differentiation landscape. Sci. Rep. 3, 3039.
Bartels, M., Govers, A.M., Fleskens, V., Lourenço, A.R., Pals, C.E., Vervoort, S.J., Van Gent, R., Brenkman, A.B., Bierings, M.B., Ackerman, S.J., et al. (2015). Acetylation of C/EBPε is a prerequisite for terminal neutrophil differentiation. Blood 125, 1782–1792.
Batta, K., Florkowska, M., Kouskoff, V., and Lacaud, G. (2014). Direct Reprogramming of Murine Fibroblasts to Hematopoietic Progenitor Cells. Cell Rep. 9, 1871–1884.
Beaudin, A.E., Boyer, S.W., Perez-Cunningham, J., Hernandez, G.E., Derderian, S.C., Jujjavarapu, C., Aaserude, E., MacKenzie, T., and Forsberg, E.C. (2016). A Transient Developmental Hematopoietic Stem Cell Gives Rise to Innate-like B and T Cells. Cell Stem Cell 19, 768–783.
Bender, M., Thon, J.N., Ehrlicher, A.J., Wu, S., Mazutis, L., Deschmann, E., Sola-Visner, M., Italiano, J.E., and Hartwig, J.H. (2015). Microtubule sliding drives proplatelet elongation and is dependent on cytoplasmic dynein. Blood 125, 860–868.
Bertozzi, C.C., Schmaier, A.A., Mericko, P., Hess, P.R., Zou, Z., Chen, M., Chen, C.Y., Xu, B., Lu, M.M., Zhou, D., et al. (2010). Platelets regulate lymphatic vascular development through CLEC-2-SLP-76 signaling. Blood 116, 661–670.
Bertrand, J.Y., and Traver, D. (2009). Hematopoietic cell development in the zebrafish embryo. Curr. Opin. Hematol. 16, 243–248.
Bertrand, J.Y., Giroux, S., Golub, R., Klaine, M., Jalil, A., Boucontet, L., Godin, I., and Cumano, A. (2005a). Characterization of purified intraembryonic hematopoietic stem cells as a tool to define their site of origin. Proc. Natl. Acad. Sci. U. S. A. 102, 134–139.
Bertrand, J.Y., Jalil, A., Le Klaine, M., Jung, S., Cumano, A., Godin, I., Klaine, M., Jung, S., Cumano, A., and Godin, I. (2005b). Three pathways to mature macrophages in the early mouse yolk sac. Blood 106, 3004 LP – 3011.
Bertrand, J.Y., Kim, A.D., Violette, E.P., Stachura, D.L., Cisson, J.L., and Traver, D. (2007). Definitive hematopoiesis initiates through a committed erythromyeloid progenitor in the zebrafish embryo. Development 134, 4147–4156.
Bertrand, J.Y., Chi, N.C., Santoso, B., Teng, S., Stainier, D.Y.R., and Traver, D. (2010). Haematopoietic stem cells derive directly from aortic endothelium during development. Nature 464, 108–111.
Bianchi, E., Zini, R., Salati, S., Tenedini, E., Norfo, R., Tagliafico, E., Manfredini, R., and Ferrari, S. (2010). c-myb supports erythropoiesis through the transactivation of KLF1 and LMO2 expression. Blood 116, e99–e110.
Bianconi, E., Piovesan, A., Facchin, F., Beraudi, A., Casadei, R., Frabetti, F., Vitale, L., Pelleri, M.C., Tassani, S., Piva, F., et al. (2013). An estimation of the number of cells in the human body. Ann. Hum. Biol. 40, 463–471.
Bigas, A., Guiu, J., and Gama-Norton, L. (2013). Notch and Wnt signaling in the emergence of hematopoietic stem cells. Blood Cells, Mol. Dis. 51, 264–270.
Blackwell, T.S., Hipps, A.N., Yamamoto, Y., Han, W., Barham, W.J., Ostrowski, M.C., Yull, F.E., and Prince, L.S. (2011). NF-κB Signaling in Fetal Lung Macrophages Disrupts Airway Morphogenesis. J. Immunol. 187, 2740–2747.
Blatter, D., Lui, B., Stone, D., and Wyatt, B. (2017). The Denucleation of the Mammalian Erythrocyte: An Evolutionary Mechanism.
Blériot, C., Dupuis, T., Jouvion, G., Eberl, G., Disson, O., and Lecuit, M. (2015). Liver-Resident Macrophage Necroptosis Orchestrates Type 1 Microbicidal Inflammation and Type-2-Mediated Tissue Repair during Bacterial Infection. Immunity 42, 145–158.

155
Bloom, W., and Bartelmez, G.W. (1940). Hematopoiesis in young human embryos. Am. J. Anat. 67, 21–53.
Bohr, S., Patel, S.J., Vasko, R., Shen, K., Iracheta-Vellve, A., Lee, J., Bale, S.S., Chakraborty, N., Brines, M., Cerami, A., et al. (2015). Modulation of cellular stress response via the erythropoietin/CD131 heteroreceptor complex in mouse mesenchymal-derived cells. J. Mol. Med. 93, 199–210.
Böiers, C., Carrelha, J., Lutteropp, M., Luc, S., Green, J.C.A., Azzoni, E., Woll, P.S., Mead, A.J., Hultquist, A., Swiers, G., et al. (2013). Lymphomyeloid contribution of an immune-restricted progenitor emerging prior to definitive hematopoietic stem cells. Cell Stem Cell 13, 535–548.
Boisset, J.C., Van Cappellen, W., Andrieu-Soler, C., Galjart, N., Dzierzak, E., and Robin, C. (2010). In vivo imaging of haematopoietic cells emerging from the mouse aortic endothelium. Nature 464, 116–120.
Boltjes, A., and van Wijk, F. (2014). Human dendritic cell functional specialization in steady-state and inflammation. Front. Immunol. 5, 131.
Borst, K., Frenz, T., Spanier, J., Tegtmeyer, P.K., Chhatbar, C., Skerra, J., Ghita, L., Namineni, S., Lienenklaus, S., Köster, M., et al. (2018). Type I interferon receptor signaling delays Kupffer cell replenishment during acute fulminant viral hepatitis. J. Hepatol. 68, 682–690.
Boulais, P.E., Mizoguchi, T., Zimmerman, S., Nakahara, F., Vivié, J., Mar, J.C., van Oudenaarden, A., and Frenette, P.S. (2018). The Majority of CD45– Ter119– CD31– Bone Marrow Cell Fraction Is of Hematopoietic Origin and Contains Erythroid and Lymphoid Progenitors. Immunity 49, 627-639.e6.
Bouwens, L., Baekeland, M., de Zanger, R., and Wisse, E. (1986). Quantitation, tissue distribution and proliferation kinetics of kupffer cells in normal rat liver. Hepatology 6, 718–722.
Boyer, S.W., Schroeder, A. V., Smith-Berdan, S., and Forsberg, E.C. (2011). All Hematopoietic Cells Develop from Hematopoietic Stem Cells through Flk2/Flt3-Positive Progenitor Cells. Cell Stem Cell 9, 64–73.
Branehög, I., Ridell, B., Swolin, B., and Weinfeld, A. (1975). Megakaryocyte Quantifications in Relation to Thrombokinetics in Primary Thrombocythaemia and Allied Diseases. Scand. J. Haematol. 15, 321–332.
Bratosin, D., Mazurier, J., Tissier, J.P., Estaquier, J., Huart, J.J., Ameisen, J.C., Aminoff, D., and Montreuil, J. (1998). Cellular and molecular mechanisms of senescent erythrocyte phagocytosis by macrophages. A review. Biochimie 80, 173–195.
Brines, M., Grasso, G., Fiordaliso, F., Sfacteria, A., Ghezzi, P., Fratelli, M., Latini, R., Xie, Q.W., Smart, J., Su-Rick, C.J., et al. (2004). Erythropoietin mediates tissue protection through an erythropoietin and common β-subunit heteroreceptor. Proc. Natl. Acad. Sci. U. S. A. 101, 14907–14912.
Brinkmann, V., Reichard, U., Goosmann, C., Fauler, B., Uhlemann, Y., Weiss, D.S., Weinrauch, Y., and Zychlinsky, A. (2004). Neutrophil Extracellular Traps Kill Bacteria. Science (80-. ). 303, 1532–1535.
Briseño, C.G., Haldar, M., Kretzer, N.M., Wu, X., Theisen, D.J., Wumesh, K.C., Durai, V., Grajales-Reyes, G.E., Iwata, A., Bagadia, P., et al. (2016). Distinct Transcriptional Programs Control Cross-Priming in Classical and Monocyte-Derived Dendritic Cells. Cell Rep. 15, 2462–2474.
De Bruijn, M.F.T.R., Ma, X., Robin, C., Ottersbach, K., Sanchez, M.J., and Dzierzak, E. (2002). Hematopoietic stem cells localize to the endothelial cell layer in the midgestation

156
mouse aorta. Immunity 16, 673–683.
Burger, P., Hilarius-Stokman, P., De Korte, D., Van Den Berg, T.K., and Van Bruggen, R. (2012). CD47 functions as a molecular switch for erythrocyte phagocytosis. Blood 119, 5512–5521.
Burgess, A.W., and Metcalf, D. (1980). The nature and action of granulocyte - macrophage colony stimulating factors. Blood 56, 947–958.
Cabezas-Wallscheid, N., Klimmeck, D., Hansson, J., Lipka, D.B., Reyes, A., Wang, Q., Weichenhan, D., Lier, A., Von Paleske, L., Renders, S., et al. (2014). Identification of regulatory networks in HSCs and their immediate progeny via integrated proteome, transcriptome, and DNA methylome analysis. Cell Stem Cell 15, 507–522.
Cai, Z., de Bruijn, M., Ma, X., Dortland, B., Luteijn, T., Downing, J.R., and Dzierzak, E. (2000). Haploinsufficiency of AML1 Affects the Temporal and Spatial Generation of Hematopoietic Stem Cells in the Mouse Embryo specific genes, including IL-3, GM-CSF, CSF-1R, the subunits of the T cell antigen receptor, myeloperoxi-dase, and neutrophil elastase (.
Calderon, B., Carrero, J.A., Ferris, S.T., Sojka, D.K., Moore, L., Epelman, S., Murphy, K.M., Yokoyama, W.M., Randolph, G.J., and Unanue, E.R. (2015). The pancreas anatomy conditions the origin and properties of resident macrophages. J. Exp. Med. 212, 1497–1512.
Carlin, L.M., Stamatiades, E.G., Auffray, C., Hanna, R.N., Glover, L., Vizcay-Barrena, G., Hedrick, C.C., Cook, H.T., Diebold, S., and Geissmann, F. (2013). Nr4a1-dependent Ly6Clow monocytes monitor endothelial cells and orchestrate their disposal. Cell 153, 362–375.
Carramolino, L., Fuentes, J., García-Andrés, C., Azcoitia, V., Riethmacher, D., and Torres, M. (2010). Platelets play an essential role in separating the blood and lymphatic vasculatures during embryonic angiogenesis. Circ. Res. 106, 1197–1201.
Carrelha, J., Meng, Y., Kettyle, L.M., Luis, T.C., Norfo, R., Alcolea, V., Boukarabila, H., Grasso, F., Gambardella, A., Grover, A., et al. (2018). Hierarchically related lineage-restricted fates of multipotent haematopoietic stem cells. Nature 554, 106–111.
Charbord, P., Tavian, M., Humeau, L., and Péault, B. (1996). Early ontogeny of the human marrow from long bones: An immunohistochemical study of hematopoiesis and its microenvironment. Blood 87, 4109–4119.
Chen, W., and Teschendorff, A.E. (2019). Estimating differentiation potency of single cells using single-cell entropy (SCENT). In Methods in Molecular Biology, (Humana Press Inc.), pp. 125–139.
Chen, M.J., Yokomizo, T., Zeigler, B.M., Dzierzak, E., and Speck, N.A. (2009). Runx1 is required for the endothelial to haematopoietic cell transition but not thereafter. Nature 457, 887–891.
Chen, M.J., Li, Y., De Obaldia, M.E., Yang, Q., Yzaguirre, A.D., Yamada-Inagawa, T., Vink, C.S., Bhandoola, A., Dzierzak, E., and Speck, N.A. (2011). Erythroid/myeloid progenitors and hematopoietic stem cells originate from distinct populations of endothelial cells. Cell Stem Cell 9, 541–552.
Cheung Tung Shing, K.S., Broughton, S.E., Nero, T.L., Gillinder, K., Ilsley, M.D., Ramshaw, H., Lopez, A.F., Griffin, M.D.W., Parker, M.W., Perkins, A.C., et al. (2018). EPO does not promote interaction between the erythropoietin and beta-common receptors. Sci. Rep. 8, 1–16.
Chopin, M., and Nutt, S.L. (2015). Establishing and maintaining the Langerhans cell network.

157
Semin. Cell Dev. Biol. 41, 23–29.
Chorro, L., Sarde, A., Li, M., Woollard, K.J., Chambon, P., Malissen, B., Kissenpfennig, A., Barbaroux, J.B., Groves, R., and Geissmann, F. (2009). Langerhans cell (LC) proliferation mediates neonatal development, homeostasis, and inflammation-associated expansion of the epidermal LC network. J. Exp. Med. 206, 3089–3100.
Christensen, J.L., Wright, D.E., Wagers, A.J., and Weissman, I.L. (2004). Circulation and Chemotaxis of Fetal Hematopoietic Stem Cells. PLoS Biol. 2, e75.
Ciau-Uitz, A., Walmsley, M., and Patient, R. (2000). Distinct origins of adult and embryonic blood in Xenopus. Cell 102, 787–796.
Collin, M., and Bigley, V. (2018). Human dendritic cell subsets: an update. Immunology 154, 3–20.
Corada, M., Nyqvist, D., Orsenigo, F., Caprini, A., Giampietro, C., Taketo, M.M., Iruela-Arispe, M.L., Adams, R.H., and Dejana, E. (2010). The Wnt/β-catenin pathway modulates vascular remodeling and specification by upregulating Dll4/notch signaling. Dev. Cell 18, 938–949.
Corada, M., Orsenigo, F., Morini, M.F., Pitulescu, M.E., Bhat, G., Nyqvist, D., Breviario, F., Conti, V., Briot, A., Iruela-Arispe, M.L., et al. (2013). Sox17 is indispensable for acquisition and maintenance of arterial identity. Nat. Commun. 4, 1–14.
Cortegano, I., Serrano, N., Ruiz, C., Rodríguez, M., Prado, C., Alía, M., Hidalgo, A., Cano, E., De Andrés, B., and Gaspar, M.L. (2019). CD45 expression discriminates waves of embryonic megakaryocytes in the mouse. Haematologica 104, 1853–1865.
Coşkun, S., Chao, H., Vasavada, H., Heydari, K., Gonzales, N., Zhou, X., de Crombrugghe, B., and Hirschi, K.K. (2014). Development of the fetal bone marrow niche and regulation of HSC quiescence and homing ability by emerging osteolineage cells. Cell Rep. 9, 581–590.
Costa, J.J. (1997). The Cells of the Allergic Response. JAMA 278, 1815.
Cronkite, E.P., and Fliedner, T.M. (1964). GRANULOCYTOPOIESIS. N. Engl. J. Med. 270, 1244–1248.
Cumano, A., Dieterlen-Lievre, F., and Godin, I. (1996). Lymphoid potential, probed before circulation in mouse, is restricted to caudal intraembryonic splanchnopleura. Cell 86, 907–916.
Cumano, A., Ferraz, J.C., Klaine, M., Di Santo, J.P., and Godin, I. (2001). Intraembryonic, but not yolk sac hematopoietic precursors, isolated before circulation, provide long-term multilineage reconstitution. Immunity 15, 477–485.
Dahlin, J.S., and Hallgren, J. (2015). Mast cell progenitors: Origin, development and migration to tissues. Mol. Immunol. 63, 9–17.
Dakic, A., Shao, Q., D’Amico, A., O’Keeffe, M., Chen, W., Shortman, K., and Wu, L. (2004). Development of the Dendritic Cell System during Mouse Ontogeny. J. Immunol. 172, 1018–1027.
Dautry Varsat, A., Ciechanover, A., and Lodish, H.F. (1983). pH and the recycling of transferrin during receptor-mediated endocytosis. Proc. Natl. Acad. Sci. U. S. A. 80, 2258–2262.
Davidson, A.J., and Zon, L.I. (2004). The “definitive” (and ’primitive’) guide to zebrafish hematopoiesis. Oncogene 23, 7233–7246.
Debili, N., Coulombel, L., Croisille, L., Katz, A., Guichard, J., Breton-Gorius, J., and Vainchenker, W. (1996). Characterization of a bipotent erythro-megakaryocytic progenitor in human bone marrow. Blood 88, 1284–1296.

158
DeFalco, T., Bhattacharya, I., Williams, A. V., Sams, D.M., and Capel, B. (2014). Yolk-sac-derived macrophages regulate fetal testis vascularization and morphogenesis. Proc. Natl. Acad. Sci. U. S. A. 111, E2384–E2393.
Denzel, A., Maus, U.A., Gomez, M.R., Moll, C., Niedermeier, M., Winter, C., Maus, R., Hollingshead, S., Briles, D.E., Kunz-Schughart, L.A., et al. (2008). Basophils enhance immunological memory responses. Nat. Immunol. 9, 733–742.
Dieterlen-Lievre, F. (1975). On the origin of haemopoietic stem cells in the avian embryo: an experimental approach.
Downard, C.D., Lewicke, S., and Ziegler, M.M. (2004). Meckel’s Diverticulum. In Encyclopedia of Gastroenterology, (Elsevier), pp. 638–640.
Drake, C.J., and Fleming, P.A. (2000). Vasculogenesis in the day 6.5 to 9.5 mouse embryo. Blood 95, 1671–1679.
Drissen, R., Thongjuea, S., Theilgaard-Mönch, K., and Nerlov, C. (2019). Identification of two distinct pathways of human myelopoiesis. Sci. Immunol. 4, 7148.
Dunay, I.R., Fuchs, A., and Sibley, L.D. (2010). Inflammatory Monocytes but Not Neutrophils Are Necessary To Control Infection with Toxoplasma gondii in Mice. Infect. Immun. 78, 1564–1570.
Dzierzak, E., and Speck, N.A. (2008). Of lineage and legacy: The development of mammalian hematopoietic stem cells. Nat. Immunol. 9, 129–136.
Efroni, S., Duttagupta, R., Cheng, J., Dehghani, H., Hoeppner, D.J., Dash, C., Bazett-Jones, D.P., Le Grice, S., McKay, R.D.G., Buetow, K.H., et al. (2008). Global Transcription in Pluripotent Embryonic Stem Cells. Cell Stem Cell 2, 437–447.
Elsaid, R., Meunier, S., Defranoux, O., Soraes-da-Silva, F., Perchet, T., Iturri, L., Freyer, L., Vieira, P., Pereira, P., Golub, R., et al. (2019). A wave of hematopoietic stem cell-derived T/ILC-restricted progenitors initiates thymopoiesis and shapes the embryonic thymus architecture. BioRxiv 791103.
England, S.J., McGrath, K.E., Frame, J.M., and Palis, J. (2011). Immature erythroblasts with extensive ex vivo self-renewal capacity emerge from the early mammalian fetus. Blood 117, 2708–2717.
Enzan, H. (1986). ELECTRON MICROSCOPIC STUDIES OF MACROPHAGES IN EARLY HUMAN YOLK SACS. Pathol. Int. 36, 49–64.
Epelman, S., Lavine, K.J., Beaudin, A.E., Sojka, D.K., Carrero, J.A., Calderon, B., Brija, T., Gautier, E.L., Ivanov, S., Satpathy, A.T., et al. (2014). Embryonic and adult-derived resident cardiac macrophages are maintained through distinct mechanisms at steady state and during inflammation. Immunity 40, 91–104.
Espín-Palazón, R., Stachura, D.L., Campbell, C.A., García-Moreno, D., Del Cid, N., Kim, A.D., Candel, S., Meseguer, J., Mulero, V., and Traver, D. (2014). Proinflammatory signaling regulates hematopoietic stem cell emergence. Cell 159, 1070–1085.
Evans, C.J., Hartenstein, V., and Banerjee, U. (2003). Thicker than blood: Conserved mechanisms in Drosophila and vertebrate hematopoiesis. Dev. Cell 5, 673–690.
Everett, J.W. (1935). Morphological and physiological studies of the placenta in the albino rat. J. Exp. Zool. 70, 243–285.
Faltusová, K., Chen, C.-L., Heizer, T., Báječný, M., Szikszai, K., Páral, P., Savvulidi, F., Renešová, N., and Nečas, E. (2020). Altered Erythro-Myeloid Progenitor Cells Are Highly Expanded in Intensively Regenerating Hematopoiesis. Front. Cell Dev. Biol. 8, 98.
Fantin, A., Vieira, J.M., Gestri, G., Denti, L., Schwarz, Q., Prykhozhij, S., Peri, F., Wilson, S.W.,

159
and Ruhrberg, C. (2010). Tissue macrophages act as cellular chaperones for vascular anastomosis downstream of VEGF-mediated endothelial tip cell induction. Blood 116, 829–840.
Ferkowicz, M.J., and Yoder, M.C. (2005). Blood island formation: Longstanding observations and modern interpretations. Exp. Hematol. 33, 1041–1047.
Ferkowicz, M.J., Starr, M., Xie, X., Li, W., Johnson, S.A., Shelley, W.C., Morrison, P.R., and Yoder, M.C. (2003). CD41 expression defines the onset of primitive and definitive hematopoiesis in the murine embryo. Development 130, 4393–4403.
Ferrero, G., Mahony, C.B., Traver, D., Bertrand, J.Y., and Rie Wittamer, V. (2018). Embryonic Microglia Derive from Primitive Macrophages and Are Replaced by cmyb-Dependent Definitive Microglia in Zebrafish.
Fiedler, K., and Brunner, C. (2012). The role of transcription factors in the guidance of granulopoiesis. Am. J. Blood Res. 2, 57–65.
Flamme, I., Frölich, T., and Risau, W. (1997). Molecular mechanisms of vasculogenesis and embryonic angiogenesis. J. Cell. Physiol. 173, 206–210.
Fogg, D.K., Sibon, C., Miled, C., Jung, S., Aucouturier, P., Littman, D.R., Cumano, A., and Geissmann, F. (2006). A clonogenic bone harrow progenitor specific for macrophages and dendritic cells. Science (80-. ). 311, 83–87.
Frame, J.M., Fegan, K.H., Conway, S.J., McGrath, K.E., and Palis, J. (2016). Definitive Hematopoiesis in the Yolk Sac Emerges from Wnt-Responsive Hemogenic Endothelium Independently of Circulation and Arterial Identity. Stem Cells 34, 431–444.
Franco, R.S. (2012). Measurement of Red Cell Lifespan and Aging. Transfus. Med. Hemotherapy 39, 302–307.
Franco, C.B., Chen, C.-C., Drukker, M., Weissman, I.L., and Galli, S.J. (2010). Distinguishing Mast Cell and Granulocyte Differentiation at the Single-Cell Level. Cell Stem Cell 6, 361–368.
Fraser, S.T., Isern, J., and Baron, M.H. (2007). Maturation and enucleation of primitive erythroblasts during mouse embryogenesis is accompanied by changes in cell-surface antigen expression. Blood 109, 343–352.
Fujimoto, T.T., Kohata, S., Suzuki, H., Miyazaki, H., and Fujimura, K. (2003). Production of functional platelets by differentiated embryonic stem (ES) cells in vitro. Blood 102, 4044–4051.
Fujiwara, Y., Browne, C.P., Cunniff, K., Goff, S.C., and Orkin, S.H. (1996). Arrested development of embryonic red cell precursors in mouse embryos lacking transcription factor GATA-1. Proc. Natl. Acad. Sci. U. S. A. 93, 12355–12358.
van Furth, R., Cohn, Z.A., Hirsch, J.G., Humphrey, J.H., Spector, W.G., and Langevoort, H.L. (1972). The mononuclear phagocyte system: a new classification of macrophages, monocytes, and their precursor cells. Bull. World Health Organ. 46, 845–852.
Galli, S.J., Kalesnikoff, J., Grimbaldeston, M.A., Piliponsky, A.M., Williams, C.M.M., and Tsai, M. (2005). MAST CELLS AS “TUNABLE” EFFECTOR AND IMMUNOREGULATORY CELLS: Recent Advances. Annu. Rev. Immunol. 23, 749–786.
Garcia-Alegria, E., Menegatti, S., Fadlullah, M.Z.H., Menendez, P., Lacaud, G., and Kouskoff, V. (2018). Early Human Hemogenic Endothelium Generates Primitive and Definitive Hematopoiesis In Vitro. Stem Cell Reports 11, 1061–1074.
Garcia-Porrero, J.A., Godin, I.E., and Dieterlen-Libvre, F. (1995). Potential intraembryonic

160
hemogenic sites at pre-liver stages in the mouse (Springer-Verlag).
Garcia, M.D., Lopez, A.L., Larin, K. V., and Larina, I. V. (2015). Imaging of cardiovascular development in mammalian embryos using optical coherence tomography. Methods Mol. Biol. 1214, 151–161.
Gaspar-Maia, A., Alajem, A., Meshorer, E., and Ramalho-Santos, M. (2011). Open chromatin in pluripotency and reprogramming. Nat. Rev. Mol. Cell Biol. 12, 36–47.
Gasteiger, G., Fan, X., Dikiy, S., Lee, S.Y., and Rudensky, A.Y. (2015). Tissue residency of innate lymphoid cells in lymphoid and nonlymphoid organs. Science (80-. ). 350, 981–985.
Gautier, E.L., Shay, T., Miller, J., Greter, M., Jakubzick, C., Ivanov, S., Helft, J., Chow, A., Elpek, K.G., Gordonov, S., et al. (2012). Gene-expression profiles and transcriptional regulatory pathways that underlie the identity and diversity of mouse tissue macrophages. Nat. Immunol. 13, 1118–1128.
Geissmann, F., Manz, M.G., Jung, S., Sieweke, M.H., Merad, M., and Ley, K. (2010). Development of monocytes, macrophages, and dendritic cells. Science (80-. ). 327, 656–661.
Gentek, R., Ghigo, C., Hoeffel, G., Bulle, M.J., Msallam, R., Gautier, G., Launay, P., Chen, J., Ginhoux, F., and Bajénoff, M. (2018a). Hemogenic Endothelial Fate Mapping Reveals Dual Developmental Origin of Mast Cells. Immunity 48, 1160-1171.e5.
Gentek, R., Ghigo, C., Hoeffel, G., Jorquera, A., Msallam, R., Wienert, S., Klauschen, F., Ginhoux, F., and Bajénoff, M. (2018b). Epidermal γδ T cells originate from yolk sac hematopoiesis and clonally self-renew in the adult. J. Exp. Med. 215, 2994–3005.
Germain, P.-L. (2020). scDblFinder: scDblFinder. R package version 1.1.8.
Ghigo, C., Mondor, I., Jorquera, A., Nowak, N.J., Wienert, S., Zahner, S.P., Clausen, B.E., Luche, H., Malissen, B., Klauschen, F., et al. (2013). Multicolor fate mapping of langerhans cell homeostasis. J. Exp. Med. 210, 1657–1664.
Gibbs, B.F. (2005). Human basophils as effectors and immunomodulators of allergic inflammation and innate immunity. Clin. Exp. Med. 5, 43–49.
Ginhoux, F., Greter, M., Leboeuf, M., Nandi, S., See, P., Gokhan, S., Mehler, M.F., Conway, S.J., Ng, L.G., Stanley, E.R., et al. (2010). Fate mapping analysis reveals that adult microglia derive from primitive macrophages. Science (80-. ). 330, 841–845.
Godin, I., and Cumano, A. (2002). The hare and the tortoise: An embryonic haematopoietic race. Nat. Rev. Immunol. 2, 593–604.
Godin, I., Garcia-Porrero, J.A., Dieterlen-Lièvre, F., and Cumano, A. (1999). Stem cell emergence and hemopoietic activity are incompatible in mouse intraembryonic sites. J. Exp. Med. 190, 43–52.
Godin, I.E., Garcia-Porrero, J.A., Coutinho, A., Dieterlen-Lièvre, F., and Marcos, M.A.R. (1993). Para-aortic splanchnopleura from early mouse embryos contains B1a cell progenitors. Nature 364, 67–70.
Golfier, F., Barcena, A., Harrison, M.R., and Muench, M.O. (2000). Fetal bone marrow as a source of stem cells for in utero or postnatal transplantation. Br. J. Haematol. 109, 173–181.
Gomez Perdiguero, E., Klapproth, K., Schulz, C., Busch, K., Azzoni, E., Crozet, L., Garner, H., Trouillet, C., De Bruijn, M.F., Geissmann, F., et al. (2015). Tissue-resident macrophages originate from yolk-sac-derived erythro-myeloid progenitors. Nature 518, 547–551.
Gordon, E.J., Rao, S., Pollard, J.W., Nutt, S.L., Lang, R.A., and Harvey, N.L. (2010).

161
Macrophages define dermal lymphatic vessel calibre during development by regulating lymphatic endothelial cell proliferation. Development 137, 3899–3910.
Graf, T., and Enver, T. (2009). Forcing cells to change lineages. Nature 462, 587–594.
Grajales-Reyes, G.E., Iwata, A., Albring, J., Wu, X., Tussiwand, R., Kc, W., Kretzer, N.M., Briseño, C.G., Durai, V., Bagadia, P., et al. (2015). Batf3 maintains autoactivation of Irf8 for commitment of a CD8α + conventional DC clonogenic progenitor. Nat. Immunol. 16, 708–717.
Grover, A., Sanjuan-Pla, A., Thongjuea, S., Carrelha, J., Giustacchini, A., Gambardella, A., Macaulay, I., Mancini, E., Luis, T.C., Mead, A., et al. (2016). Single-cell RNA sequencing reveals molecular and functional platelet bias of aged haematopoietic stem cells. Nat. Commun. 7, 1–12.
Grozovsky, R., Giannini, S., Falet, H., and Hoffmeister, K.M. (2015). Regulating billions of blood platelets: Glycans and beyond. Blood 126, 1877–1884.
Guilliams, M., and Scott, C.L. (2017). Does niche competition determine the origin of tissue-resident macrophages? Nat. Rev. Immunol. 17, 451–460.
Guilliams, M., Ginhoux, F., Jakubzick, C., Naik, S.H., Onai, N., Schraml, B.U., Segura, E., Tussiwand, R., and Yona, S. (2014). Dendritic cells, monocytes and macrophages: a unified nomenclature based on ontogeny. Nat. Rev. Immunol. 14, 571–578.
Guilliams, M., Dutertre, C.A., Scott, C.L., McGovern, N., Sichien, D., Chakarov, S., Van Gassen, S., Chen, J., Poidinger, M., De Prijck, S., et al. (2016). Unsupervised High-Dimensional Analysis Aligns Dendritic Cells across Tissues and Species. Immunity 45, 669–684.
Guilliams, M., Mildner, A., and Yona, S. (2018). Developmental and Functional Heterogeneity of Monocytes. Immunity 49, 595–613.
Gulliver, G. (1875). Observations on the sizes and shapes of the red corpuscles of the blood of vertebrates, with drawings of them to a uniform scale, and extended and revised tables of measurements. Proc Zool Soc London 474–495.
Haas, K.M., Poe, J.C., Steeber, D.A., and Tedder, T.F. (2005). B-1a and B-1b cells exhibit distinct developmental requirements and have unique functional roles in innate and adaptive immunity to S. pneumoniae. Immunity 23, 7–18.
Haas, S., Hansson, J., Klimmeck, D., Loeffler, D., Velten, L., Uckelmann, H., Wurzer, S., Prendergast, Á.M., Schnell, A., Hexel, K., et al. (2015). Inflammation-Induced Emergency Megakaryopoiesis Driven by Hematopoietic Stem Cell-like Megakaryocyte Progenitors. Cell Stem Cell 17, 422–434.
Hadland, B.K., Huppert, S.S., Kanungo, J., Xue, Y., Jiang, R., Gridley, T., Conlon, R.A., Cheng, A.M., Kopan, R., and Longmore, G.D. (2004). A requirement for Notch1 distinguishes 2 phases of definitive hematopoiesis during development. Blood 104, 3097–3105.
Haghverdi, L., Lun, A.T.L., Morgan, M.D., and Marioni, J.C. (2018). Batch effects in single-cell RNA-sequencing data are corrected by matching mutual nearest neighbors. Nat. Biotechnol. 36, 421–427.
Harigae, H., Takahashi, S., Suwabe, N., Ohtsu, H., Gu, L., Yang, Z., Tsai, F., Kitamura, Y., Douglas Engel, J., and Yamamoto, M. (1998). Differential roles of GATA‐1 and
GATA‐2 in growth and differentiation of mast cells. Genes to Cells 3, 39–50.
Harrison, D.E., Zhong, R.K., Jordan, C.T., Lemischka, I.R., and Astle, C.M. (1997). Relative to adult marrow, fetal liver repopulates nearly five times more effectively long-term than short-term. Exp. Hematol. 25, 293–297.

162
Hashimoto, D., Chow, A., Noizat, C., Teo, P., Beasley, M.B., Leboeuf, M., Becker, C.D., See, P., Price, J., Lucas, D., et al. (2013). Tissue-resident macrophages self-maintain locally throughout adult life with minimal contribution from circulating monocytes. Immunity 38, 792–804.
Hatanaka, K., Kitamura, Y., and Nishimune, Y. (1979). Local development of mast cells from bone marrow-derived precursors in the skin of mice. Blood 53, 142–147.
Hayashi, C., Sonoda, T., Nakano, T., Nakayama, H., and Kitamura, Y. (1985). Mast-cell precursors in the skin of mouse embryos and their deficiency in embryos of Sl Sld genotype. Dev. Biol. 109, 234–241.
He, L., Cohen, E.B., Edwards, A.P.B., Kragelund, B.B., Krause, D.S., and Dimaio, D. (2019). Transmembrane Protein Aptamer Induces Cooperative Signaling by the EPO Receptor and the Cytokine Receptor β-Common Subunit. ISCIENCE 17, 167–181.
Hentze, M.W., Muckenthaler, M.U., Galy, B., and Camaschella, C. (2010). Two to Tango: Regulation of Mammalian Iron Metabolism. Cell 142, 24–38.
Hettinger, J., Richards, D.M., Hansson, J., Barra, M.M., Joschko, A.C., Krijgsveld, J., and Feuerer, M. (2013). Origin of monocytes and macrophages in a committed progenitor. Nat. Immunol. 14, 821–830.
Hirai, H., Zhang, P., Dayaram, T., Hetherington, C.J., Mizuno, S.I., Imanishi, J., Akashi, K., and Tenen, D.G. (2006). C/EBPβ is required for “emergency” granulopoiesis. Nat. Immunol. 7, 732–739.
Hirai, H., Yokota, A., Tamura, A., Sato, A., and Maekawa, T. (2015). Non-steady-state hematopoiesis regulated by the C/EBPβ transcription factor. Cancer Sci. 106, 797–802.
Hitchcock, I.S., and Kaushansky, K. (2014). Thrombopoietin from beginning to end. Br. J. Haematol. 165, 259–268.
Hoeffel, G., Wang, Y., Greter, M., See, P., Teo, P., Malleret, B., Leboeuf, M., Low, D., Oller, G., Almeida, F., et al. (2012). Adult Langerhans cells derive predominantly from embryonic fetal liver monocytes with a minor contribution of yolk sac-derived macrophages. J. Exp. Med. 209, 1167–1181.
Hoeffel, G., Chen, J., Lavin, Y., Low, D., Almeida, F.F., See, P., Beaudin, A.E., Lum, J., Low, I., Forsberg, E.C., et al. (2015). C-Myb+ Erythro-Myeloid Progenitor-Derived Fetal Monocytes Give Rise to Adult Tissue-Resident Macrophages. Immunity 42, 665–678.
Höfer, T., Busch, K., Klapproth, K., and Rodewald, H.R. (2016). Fate Mapping and Quantitation of Hematopoiesis in Vivo. Annu. Rev. Immunol. 34, 449–478.
Holz, A., Bossinger, B., Strasser, T., Janning, W., and Klapper, R. (2003). The two origins of hemocytes in Drosophila. Development 130, 4955–4962.
Hoppe, P.S., Schwarzfischer, M., Loeffler, D., Kokkaliaris, K.D., Hilsenbeck, O., Moritz, N., Endele, M., Filipczyk, A., Gambardella, A., Ahmed, N., et al. (2016). Early myeloid lineage choice is not initiated by random PU.1 to GATA1 protein ratios. Nature 535, 299–302.
Hou, S., Li, Z., Zheng, X., Gao, Y., Dong, J., Ni, Y., Wang, X., Li, Y., Ding, X., Chang, Z., et al. (2020). Embryonic endothelial evolution towards first hematopoietic stem cells revealed by single-cell transcriptomic and functional analyses. Cell Res. 30, 376–392.
Hume, D.A., Irvine, K.M., and Pridans, C. (2019). The Mononuclear Phagocyte System: The Relationship between Monocytes and Macrophages. Trends Immunol. 40, 98–112.

163
Ikeda, N., Asano, K., Kikuchi, K., Uchida, Y., Ikegami, H., Takagi, R., Yotsumoto, S., Shibuya, T., Makino-Okamura, C., Fukuyama, H., et al. (2018). Emergence of immunoregulatory Ym1+Ly6Chi monocytes during recovery phase of tissue injury. Sci. Immunol. 3, 207.
Ikuta, K., Kina, T., MacNeil, I., Uchida, N., Peault, B., Chien, Y. hsiu, and Weissman, I.L. (1990). A developmental switch in thymic lymphocyte maturation potential occurs at the level of hematopoietic stem cells. Cell 62, 863–874.
Ingman, W. V., Wyckoff, J., Gouon-Evans, V., Condeelis, J., and Pollard, J.W. (2006). Macrophages promote collagen fibrillogenesis around terminal end buds of the developing mammary gland. Dev. Dyn. 235, 3222–3229.
Irion, S., Clarke, R.L., Luche, H., Kim, I., Morrison, S.J., Fehling, H.J., and Keller, G.M. (2010). Temporal specification of blood progenitors from mouse embryonic stem cells and induced pluripotent stem cells. Development 137, 2829–2839.
Italiano, J.E., Lecine, P., Shivdasani, R.A., and Hartwig, J.H. (1999). Blood platelets are assembled principally at the ends of proplatelet processes produced by differentiated megakaryocytes. J. Cell Biol. 147, 1299–1312.
Iturri, L., Saenz Coronilla, J., Lallemand, Y., and Gomez Perdiguero, E. (2017). Identification of erythromyeloid progenitors and their progeny in the mouse embryo by flow cytometry. J. Vis. Exp. 2017.
Ivanovs, A., Rybtsov, S., Welch, L., Anderson, R.A., Turner, M.L., and Medvinsky, A. (2011). Highly potent human hematopoietic stem cells first emerge in the intraembryonic aorta-gonad-mesonephros region. J. Exp. Med. 208, 2417–2427.
Ivanovs, A., Rybtsov, S., Ng, E.S., Stanley, E.G., Elefanty, A.G., and Medvinsky, A. (2017). Human haematopoietic stem cell development: From the embryo to the dish. Dev. 144, 2323–2337.
Iwasaki, H., and Akashi, K. (2007). Myeloid Lineage Commitment from the Hematopoietic Stem Cell (Cell Press).
Iwasaki, H., Mizuno, S.I., Arinobu, Y., Ozawa, H., Mori, Y., Shigematsu, H., Takatsu, K., Tenen, D.G., and Akashi, K. (2006). The order of expression of transcription factors directs hierarchical specification of hematopoietic lineages. Genes Dev. 20, 3010–3021.
Jaffredo, T., Gautier, R., Eichmann, A., and Dieterlen-Lievre, F. (1998). Intraaortic hemopoietic cells are derived from endothelial cells during ontogeny. Development 125, 4575 LP – 4583.
Jaffredo, T., Gautier, R., Brajeul, V., and Dieterlen-Lièvre, F. (2000). Tracing the progeny of the aortic hemangioblast in the avian embryo. Dev. Biol. 224, 204–214.
Jameson, J.M., Cauvi, G., Witherden, D.A., and Havran, W.L. (2004). A Keratinocyte-Responsive γδ TCR Is Necessary for Dendritic Epidermal T Cell Activation by Damaged Keratinocytes and Maintenance in the Epidermis. J. Immunol. 172, 3573–3579.
Jenkins, S.J., Ruckerl, D., Cook, P.C., Jones, L.H., Finkelman, F.D., Van Rooijen, N., MacDonald, A.S., and Allen, J.E. (2011). Local macrophage proliferation, rather than recruitment from the blood, is a signature of T H2 inflammation. Science (80-. ). 332, 1284–1288.
Ji, P., Murata-Hori, M., and Lodish, H.F. (2011). Formation of mammalian erythrocytes: Chromatin condensation and enucleation. Trends Cell Biol. 21, 409–415.
Johansen, L.M., Iwama, A., Lodie, T.A., Sasaki, K., Felsher, D.W., Golub, T.R., and Tenen, D.G. (2001). c-Myc Is a Critical Target for C/EBPα in Granulopoiesis. Mol. Cell. Biol. 21, 3789–3806.

164
Jollie, W.P. (1990). Development, morphology, and function of the yolk‐sac placenta of
laboratory rodents. Teratology 41, 361–381.
Kanaji, T., Vo, M.-N., Kanaji, S., Zarpellon, A., Shapiro, R., Morodomi, Y., Yuzuriha, A., Eto, K., Belani, R., Do, M.-H., et al. (2018). Tyrosyl-tRNA synthetase stimulates thrombopoietin-independent hematopoiesis accelerating recovery from thrombocytopenia. Proc. Natl. Acad. Sci. 115, E8228–E8235.
Kanda, H., Tateya, S., Tamori, Y., Kotani, K., Hiasa, K.I., Kitazawa, R., Kitazawa, S., Miyachi, H., Maeda, S., Egashira, K., et al. (2006). MCP-1 contributes to macrophage infiltration into adipose tissue, insulin resistance, and hepatic steatosis in obesity. J. Clin. Invest. 116, 1494–1505.
Karasuyama, H., and Yamanishi, Y. (2014). Basophils have emerged as a key player in immunity. Curr. Opin. Immunol. 31, 1–7.
Karsunky, H., Merad, M., Cozzio, A., Weissman, I.L., and Manz, M.G. (2003). Flt3 ligand regulates dendritic cell development from Flt3+ lymphoid and myeloid-committed progenitors to Flt3+ dendritic cells in vivo. J. Exp. Med. 198, 305–313.
Kasaai, B., Caolo, V., Peacock, H.M., Lehoux, S., Gomez-Perdiguero, E., Luttun, A., and Jones, E.A.V. (2017). Erythro-myeloid progenitors can differentiate from endothelial cells and modulate embryonic vascular remodeling. Sci. Rep. 7, 1–12.
Katz, S.I., Tamaki, K., and Sachs, D.H. (1979). Epidermal Langerhans cells are derived from cells originating in bone marrow [30]. Nature 282, 324–326.
Kauts, M.L., De Leo, B., Rodríguez-Seoane, C., Ronn, R., Glykofrydis, F., Maglitto, A., Kaimakis, P., Basi, M., Taylor, H., Forrester, L., et al. (2018). Rapid Mast Cell Generation from Gata2 Reporter Pluripotent Stem Cells. Stem Cell Reports 11, 1009–1020.
Kennedy, A.D., and Deleo, F.R. (2009). Neutrophil apoptosis and the resolution of infection. Immunol. Res. 43, 25–61.
Kennedy, M., D’Souza, S.L., Lynch-Kattman, M., Schwantz, S., and Keller, G. (2007). Development of the hemangioblast defines the onset of hematopoiesis in human ES cell differentiation cultures. In Blood, (American Society of Hematology), pp. 2679–2687.
Kierdorf, K., Erny, D., Goldmann, T., Sander, V., Schulz, C., Perdiguero, E.G., Wieghofer, P., Heinrich, A., Riemke, P., Hölscher, C., et al. (2013). Microglia emerge from erythromyeloid precursors via Pu.1-and Irf8-dependent pathways. Nat. Neurosci. 16, 273–280.
Kierdorf, K., Prinz, M., Geissmann, F., and Gomez Perdiguero, E. (2015). Development and function of tissue resident macrophages in mice. Semin. Immunol. 27, 369–378.
Kieusseian, A., de la Grange, P.B., Burlen-Defranoux, O., Godin, I., and Cumano, A. (2012). Immature hematopoietic stem cells undergo maturation in the fetal liver. Dev. 139, 3521–3530.
Kingsley, P.D., Malik, J., Fantauzzo, K.A., and Palis, J. (2004). Yolk sac-derived primitive erythroblasts enucleate during mammalian embryogenesis. Blood 104, 19–25.
Kingsley, P.D., Malik, J., Emerson, R.L., Bushnell, T.P., Mcgrath, K.E., Bloedorn, L.A., Bulger, M., and Palis, J. (2006). “Maturational” globin switching in primary primitive erythroid cells.
Kissa, K., and Herbomel, P. (2010). Blood stem cells emerge from aortic endothelium by a novel type of cell transition. Nature 464, 112–115.
Kita, H. (2011). Eosinophils: Multifaceted biological properties and roles in health and disease.

165
Immunol. Rev. 242, 161–177.
Kitamura, Y., Shimada, M., Hatanaka, K., and Miyano, Y. (1977). Development of mast cells from grafted bone marrow cells in irradiated mice. Nature 268, 442–443.
Kohyama, M., Ise, W., Edelson, B.T., Wilker, P.R., Hildner, K., Mejia, C., Frazier, W.A., Murphy, T.L., and Murphy, K.M. (2009). Role for Spi-C in the development of red pulp macrophages and splenic iron homeostasis. Nature 457, 318–321.
Koury, M.J., and Bondurant, M.C. (1990). Erythropoietin retards DNA breakdown and prevents programmed death in erythroid progenitor cells. Science (80-. ). 248, 378–381.
Koury, M.J., and Bondurant, M.C. (1992). The molecular mechanism of erythropoietin action. Eur. J. Biochem. 210, 649–663.
Kubota, Y., Takubo, K., Shimizu, T., Ohno, H., Kishi, K., Shibuya, M., Saya, H., and Suda, T. (2009). M-CSF inhibition selectively targets pathological angiogenesis and lymphangiogenesis. J. Exp. Med. 206, 1089–1102.
Kucia, M., Reca, R., Campbell, F.R., Zuba-Surma, E., Majka, M., Ratajczak, J., and Ratajczak, M.Z. (2006). A population of very small embryonic-like (VSEL) CXCR4+ SSEA-1+Oct-4+ stem cells identified in adult bone marrow. Leukemia 20, 857–869.
Kumano, K., Chiba, S., Kunisato, A., Sata, M., Saito, T., Nakagami-Yamaguchi, E., Yamaguchi, T., Masuda, S., Shimizu, K., Takahashi, T., et al. (2003). Notch1 but not Notch2 is essential for generating hematopoietic stem cells from endothelial cells. Immunity 18, 699–711.
Kwok, I., Becht, E., Xia, Y., Ng, M., Teh, Y.C., Tan, L., Evrard, M., Li, J.L.Y., Tran, H.T.N., Tan, Y., et al. (2020). Combinatorial Single-Cell Analyses of Granulocyte-Monocyte Progenitor Heterogeneity Reveals an Early Uni-potent Neutrophil Progenitor. Immunity.
Lacaud, G., and Kouskoff, V. (2017). Hemangioblast, hemogenic endothelium, and primitive versus definitive hematopoiesis. Exp. Hematol. 49, 19–24.
Lacaud, G., Gore, L., Kennedy, M., Kouskoff, V., Kingsley, P., Hogan, C., Carlsson, L., Speck, N., Palis, J., and Keller, G. (2002). Runx1 is essential for hematopoietic commitment at the hemangioblast stage of development in vitro. Blood 100, 458–466.
Lancino, M., Majello, S., Herbert, S., De Chaumont, F., Tinevez, J.Y., Olivo-Marin, J.C., Herbomel, P., and Schmidt, A. (2018). Anisotropic organization of circumferential actomyosin characterizes hematopoietic stem cells emergence in the zebrafish. Elife 7.
Lantz, C.S., Boeslger, J., Song, C.H., Mach, N., Kobayashi, T., Mulligan, R.C., Nawa, Y., Dranoff, G., and Galli, S.J. (1998). Role for interleukin-3 in mast cell and basophil development and in immunity to parasites. Nature 392, 90–93.
Lassila, O., Eskola, J., Toivanen, P., Martin, C., and Dieterlen-lievre, F. (1978). The origin of lymphoid stem cells studied in chick yolk sac-embryo chimaeras. Nature 272, 353–354.
Lavin, Y., Winter, D., Blecher-Gonen, R., David, E., Keren-Shaul, H., Merad, M., Jung, S., and Amit, I. (2014). Tissue-resident macrophage enhancer landscapes are shaped by the local microenvironment. Cell 159, 1312–1326.
Lee, L.K., Ghorbanian, Y., Wang, W., Wang, Y., Kim, Y.J., Weissman, I.L., Inlay, M.A., and Mikkola, H.K.A. (2016). LYVE1 Marks the Divergence of Yolk Sac Definitive Hemogenic Endothelium from the Primitive Erythroid Lineage. Cell Rep. 17, 2286–2298.
Lee, T.I., Jenner, R.G., Boyer, L.A., Guenther, M.G., Levine, S.S., Kumar, R.M., Chevalier, B.,

166
Johnstone, S.E., Cole, M.F., Isono, K. ichi, et al. (2006). Control of Developmental Regulators by Polycomb in Human Embryonic Stem Cells. Cell 125, 301–313.
Leimberg, M.J., Prus, E., Konijn, A.M., and Fibach, E. (2008). Macrophages function as a ferritin iron source for cultured human erythroid precursors. J. Cell. Biochem. 103, 1211–1218.
Leis, M., Gliezzi, P., Grasso, G., Bianchi, R., Vilia, P., Fratelli, M., Savino, C., Bianchi, M., Nielsen, J., Gerwien, J., et al. (2004). Derivatives of erythropoitein that are tissue protective but not erythropoietic. Science (80-. ). 305, 239–242.
Li, J., Hale, J., Bhagia, P., Xue, F., Chen, L., Jaffray, J., Yan, H., Lane, J., Gallagher, P.G., Mohandas, N., et al. (2014a). Isolation and transcriptome analyses of human erythroid progenitors: BFU-E and CFU-E. Blood 124, 3636–3645.
Li, Y., Esain, V., Teng, L., Xu, J., Kwan, W., Frost, I.M., Yzaguirre, A.D., Cai, X., Cortes, M., Maijenburg, M.W., et al. (2014b). Inflammatory signaling regulates embryonic hematopoietic stem and progenitor cell production. Genes Dev. 28, 2597–2612.
Li, Z., Liu, S., Xu, J., Zhang, X., Han, D., Liu, J., Xia, M., Yi, L., Shen, Q., Xu, S., et al. (2018). Adult Connective Tissue-Resident Mast Cells Originate from Late Erythro-Myeloid Progenitors. Immunity 49, 640-653.e5.
Lichtinger, M., Ingram, R., Hannah, R., Müller, D., Clarke, D., Assi, S.A., Lie-A-Ling, M., Noailles, L., Vijayabaskar, M.S., Wu, M., et al. (2012). RUNX1 reshapes the epigenetic landscape at the onset of haematopoiesis. EMBO J. 31, 4318–4333.
Liu, C.-P., and Auerbach, R. (1991). In vitro development of murine T cells from prethymic and preliver embryonic yolk sac hematopoietic stem cells.
Liu, J., Fu, T., Song, F., Xue, Y., Xia, C., Liu, P., Wang, H., Zhong, J., Li, Q., Chen, J., et al. (2015). Mast Cells Participate in Corneal Development in Mice. Sci. Rep. 5, 17569.
Liu, K., Victora, G.D., Schwickert, T.A., Guermonprez, P., Meredith, M.M., Yao, K., Chu, F.-F., Randolph, G.J., Rudensky, A.Y., and Nussenzweig, M. (2009). In Vivo Analysis of Dendritic Cell Development and Homeostasis. Science (80-. ). 431, 530.
Liu, Z., Gu, Y., Chakarov, S., Bleriot, C., Kwok, I., Chen, X., Shin, A., Huang, W., Dress, R.J., Dutertre, C.A., et al. (2019). Fate Mapping via Ms4a3-Expression History Traces Monocyte-Derived Cells. Cell 178, 1509-1525.e19.
Lopez, A.L., Garcia, M.D., Dickinson, M.E., and Larina, I. V. (2015). Live confocal microscopy of the developing mouse embryonic yolk sac vasculature. Methods Mol. Biol. 1214, 163–172.
Louis, C., Cook, A.D., Lacey, D., Fleetwood, A.J., Vlahos, R., Anderson, G.P., and Hamilton, J.A. (2015). Specific Contributions of CSF-1 and GM-CSF to the Dynamics of the Mononuclear Phagocyte System. J. Immunol. 195, 134–144.
Lucitti, J.L., Jones, E.A.V., Huang, C., Chen, J., Fraser, S.E., and Dickinson, M.E. (2007). Vascular remodeling of the mouse yolk sac requires hemodynamic force. Development 134, 3317–3326.
Luckett, W.P. (1978). Origin and differentiation of the yolk sac and extraembryonic mesoderm in presomite human and rhesus monkey embryos. Am. J. Anat. 152, 59–97.
Lux, C.T., Yoshimoto, M., McGrath, K., Conway, S.J., Palis, J., and Yoder, M.C. (2008). All primitive and definitive hematopoietic progenitor cells emerging before E10 in the mouse embryo are products of the yolk sac. Blood 111, 3435–3438.
Ma, O., Hong, S., Guo, H., Ghiaur, G., and Friedman, A.D. (2014). Granulopoiesis Requires Increased C/EBPα Compared to Monopoiesis, Correlated with Elevated Cebpa in Immature G-CSF Receptor versus M-CSF Receptor Expressing Cells. PLoS One 9,

167
e95784.
Mantovani, A., Cassatella, M.A., Costantini, C., and Jaillon, S. (2011). Neutrophils in the activation and regulation of innate and adaptive immunity. Nat. Rev. Immunol. 11, 519–531.
Manz, M.G., and Boettcher, S. (2014). Emergency granulopoiesis. Nat. Rev. Immunol. 14, 302–314.
Mariani, S.A., Li, Z., Rice, S., Krieg, C., Fragkogianni, S., Robinson, M., Vink, C.S., Pollard, J.W., and Dzierzak, E. (2019). Pro-inflammatory Aorta-Associated Macrophages Are Involved in Embryonic Development of Hematopoietic Stem Cells. Immunity 50, 1439-1452.e5.
Mass, E., Ballesteros, I., Farlik, M., Halbritter, F., Günther, P., Crozet, L., Jacome-Galarza, C.E., Händler, K., Klughammer, J., Kobayashi, Y., et al. (2016). Specification of tissue-resident macrophages during organogenesis. Science (80-. ). 353.
Mass, E., Jacome-Galarza, C.E., Blank, T., Lazarov, T., Durham, B.H., Ozkaya, N., Pastore, A., Schwabenland, M., Chung, Y.R., Rosenblum, M.K., et al. (2017). A somatic mutation in erythro-myeloid progenitors causes neurodegenerative disease. Nature 549, 389–393.
Matcovitch-Natan, O., Winter, D.R., Giladi, A., Aguilar, S.V., Spinrad, A., Sarrazin, S., Ben-Yehuda, H., David, E., González, F.Z., Perrin, P., et al. (2016). Microglia development follows a stepwise program to regulate brain homeostasis. Science (80-. ). 353.
Matsuda, H., Kitamura, Y., Sonoda, T., and Imori, T. (1981). Precursor of mast cells fixed in the skin of mice. J. Cell. Physiol. 108, 409–415.
McGovern, N., Shin, A., Low, G., Low, D., Duan, K., Yao, L.J., Msallam, R., Low, I., Shadan, N.B., Sumatoh, H.R., et al. (2017). Human fetal dendritic cells promote prenatal T-cell immune suppression through arginase-2. Nature 546, 662–666.
McGrath, K.E., Frame, J.M., Fromm, G.J., Koniski, A.D., Kingsley, P.D., Little, J., Bulger, M., and Palis, J. (2011). A transient definitive erythroid lineage with unique regulation of the β-globin locus in the mammalian embryo. Blood 117, 4600–4608.
McGrath, K.E., Frame, J.M., Fegan, K.H., Bowen, J.R., Conway, S.J., Catherman, S.C., Kingsley, P.D., Koniski, A.D., and Palis, J. (2015a). Distinct Sources of Hematopoietic Progenitors Emerge before HSCs and Provide Functional Blood Cells in the Mammalian Embryo. Cell Rep. 11, 1892–1904.
McGrath, K.E., Frame, J.M., and Palis, J. (2015b). Early hematopoiesis and macrophage development. Semin. Immunol. 27, 379–387.
McKenna, H.J., Stocking, K.L., Miller, R.E., Brasel, K., De Smedt, T., Maraskovsky, E., Maliszewski, C.R., Lynch, D.H., Smith, J., Pulendran, B., et al. (2000). Mice lacking flt3 ligand have deficient hematopoiesis affecting hematopoietic progenitor cells, dendritic cells, and natural killer cells. Blood 95, 3489–3497.
Mebius, R.E., and Kraal, G. (2005). Structure and function of the spleen. Nat. Rev. Immunol. 5, 606–616.
Medvinsky, A., and Dzierzak, E. (1996). Definitive hematopoiesis is autonomously initiated by the AGM region. Cell 86, 897–906.
Metcalf, D., Johnson, G.R., and Burgess, A.W. (1980). Direct stimulation by purified GM-CSF of the proliferation of multipotential and erythroid precursor cells. Blood 55, 138–147.
Metcalf, D., Carpinelli, M.R., Hyland, C., Mifsud, S., DiRago, L., Nicola, N.A., Hilton, D.J., and

168
Alexander, W.S. (2005). Anomalous megakaryocytopoiesis in mice with mutations in the c-Myb gene. Blood 105, 3480–3487.
Metzger, D., Clifford, J., Chiba, H., and Chambon, P. (1995). Conditional site-specific recombination in mammalian cells using a ligand- dependent chimeric Cre recombinase. Proc. Natl. Acad. Sci. U. S. A. 92, 6991–6995.
Meyer, N., Woidacki, K., Knöfler, M., Meinhardt, G., Nowak, D., Velicky, P., Pollheimer, J., and Zenclussen, A.C. (2017). Chymase-producing cells of the innate immune system are required for decidual vascular remodeling and fetal growth. Sci. Rep. 7, 1–14.
Migliaccio, A.R., Rana, R.A., Sanchez, M., Lorenzini, R., Centurione, L., Bianchi, L., Vannucchi, A.M., Migliaccio, G., and Orkin, S.H. (2003). GATA-1 as a regulator of mast cell differentiation revealed by the phenotype of the GATA-1low mouse mutant. J. Exp. Med. 197, 281–296.
Migliaccio, G., Migliaccio, A.R., Petti, S., Mavilio, F., Russo, G., Lazzaro, D., Testa, U., Marinucci, M., and Peschle, C. (1986). Human embryonic hemopoiesis. Kinetics of progenitors and precursors underlying the yolk sac-liver transition. J. Clin. Invest. 78, 51–60.
Mikkola, H.K.A., and Orkin, S.H. (2006). The journey of developing hematopoietic stem cells. Development 133, 3733–3744.
Mikkola, H.K.A.A., Fujiwara, Y., Schlaeger, T.M., Traver, D., and Orkin, S.H. (2003). Expression of CD41 marks the initiation of definitive hematopoiesis in the mouse embryo. Blood 101, 508–516.
Min, B., Brown, M.A., and LeGros, G. (2012). Understanding the roles of basophils: breaking dawn. Immunology 135, 192–197.
Molawi, K., Wolf, Y., Kandalla, P.K., Favret, J., Hagemeyer, N., Frenzel, K., Pinto, A.R., Klapproth, K., Henri, S., Malissen, B., et al. (2014). Progressive replacement of embryo-derived cardiac macrophages with age. J. Exp. Med. 211, 2151–2158.
Moore, M.A.S., and Metcalf, D. (1970). Ontogeny of the Haemopoietic System: Yolk Sac Origin of In Vivo and In Vitro Colony Forming Cells in the Developing Mouse Embryo. Br. J. Haematol. 18, 279–296.
Morera, D., and MacKenzie, S.A. (2011). Is there a direct role for erythrocytes in the immune response? Vet. Res. 42, 89.
Morrison, S.J., Uchida, N., and Weissman, I.L. (1995a). The Biology of Hematopoietic Stem Cells. Annu. Rev. Cell Dev. Biol. 11, 35–71.
Morrison, S.J., Hemmati, H.D., Wandycz, A.M., and Weissman, I.L. (1995b). The purification and characterization of fetal liver hematopoietic stem cells. Proc. Natl. Acad. Sci. U. S. A. 92, 10302–10306.
Mucenski, M.L., McLain, K., Kier, A.B., Swerdlow, S.H., Schreiner, C.M., Miller, T.A., Pietryga, D.W., Scott Jr., W.J., and Potter, S.S. (1991). A functional c-myb gene is required for normal murine fetal hepatic hematopoiesis. Cell 65, 677–689.
Müller, A.M., Medvinsky, A., Strouboulis, J., Grosveld, F., and Dzierzakt, E. (1994). Development of hematopoietic stem cell activity in the mouse embryo. Immunity 1, 291–301.
Muñoz-Espín, D., Cañamero, M., Maraver, A., Gómez-López, G., Contreras, J., Murillo-Cuesta, S., Rodríguez-Baeza, A., Varela-Nieto, I., Ruberte, J., Collado, M., et al. (2013). Programmed cell senescence during mammalian embryonic development. Cell 155, 1104.
Murray, P.J., Allen, J.E., Biswas, S.K., Fisher, E.A., Gilroy, D.W., Goerdt, S., Gordon, S.,

169
Hamilton, J.A., Ivashkiv, L.B., Lawrence, T., et al. (2014). Macrophage Activation and Polarization: Nomenclature and Experimental Guidelines. Immunity 41, 14–20.
Nahrendorf, M., Swirski, F.K., Aikawa, E., Stangenberg, L., Wurdinger, T., Figueiredo, J.L., Libby, P., Weissleder, R., and Pittet, M.J. (2007). The healing myocardium sequentially mobilizes two monocyte subsets with divergent and complementary functions. J. Exp. Med. 204, 3037–3047.
Naik, S.H., Metcalf, D., van Nieuwenhuijze, A., Wicks, I., Wu, L., O’Keeffe, M., and Shortman, K. (2006). Intrasplenic steady-state dendritic cell precursors that are distinct from monocytes. Nat. Immunol. 7, 663–671.
Naito, M., Yamamura, F., Nishikawa, S., and Takahashi, K. (1989). Development, Differentiation, and Maturation of Fetal Mouse Yolk Sac Macrophages in Cultures. J. Leukoc. Biol. 46, 1–10.
Naito, M., Umeda, S., Yamamoto, T., Moriyama, H., Umezu, H., Hasegawa, G., Usuda, H., Shultz, L.D., and Takahashi, K. (1996). Development, differentiation, and phenotypic heterogeneity of murine tissue macrophages. J. Leukoc. Biol. 59, 133–138.
Narula, J., Williams, C.J., Tiwari, A., Marks-Bluth, J., Pimanda, J.E., and Igoshin, O.A. (2013). Mathematical model of a gene regulatory network reconciles effects of genetic perturbations on hematopoietic stem cell emergence. Dev. Biol. 379, 258–269.
Nerlov, C., and Graf, T. (1998). PU.1 induces myeloid lineage commitment in multipotent hematopoietic progenitors. 12, 2403–2412.
Nerlov, C., Querfurth, E., Kulessa, H., and Graf, T. (2000). GATA-1 interacts with the myeloid PU.1 transcription factor and represses PU.1-dependent transcription. Blood 95, 2543–2551.
Ngkelo, A., Richart, A., Kirk, J.A., Bonnin, P., Vilar, J., Lemitre, M., Marck, P., Branchereau, M., Le Gall, S., Renault, N., et al. (2016). Mast cells regulate myofilament calcium sensitization and heart function after myocardial infarction. J. Exp. Med. 213, 1353–1374.
Nguyen, P.T., Dorman, L.C., Pan, S., Vainchtein, I.D., Han, R.T., Nakao-Inoue, H., Taloma, S.E., Barron, J.J., Molofsky, A.B., Kheirbek, M.A., et al. (2020). Microglial Remodeling of the Extracellular Matrix Promotes Synapse Plasticity. Cell 182, 388-403.e15.
Nimmerjahn, A., Kirchhoff, F., and Helmchen, F. (2005). Neuroscience: Resting microglial cells are highly dynamic surveillants of brain parenchyma in vivo. Science (80-. ). 308, 1314–1318.
Nishijima, I., Watanabe, S., Nakahata, T., and Arai, K.I. (1997). Human granulocyte-macrophage colony-stimulating factor (hGM-CSF)-dependent in vitro and in vivo proliferation and differentiation of all hematopoietic progenitor cells in hGM-CSF receptor transgenic mice. J. Allergy Clin. Immunol. 100, S79–S86.
North, T., Gu, T.L., Stacy, T., Wang, Q., Howard, L., Binder, M., Marin-Padilla, M., and Speck, N.A. (1999). Cbfa2 is required for the formation of intra-aortic hematopoietic clusters. Development 126, 2563 LP – 2575.
North, T.E., De Bruijn, M.F.T.R., Stacy, T., Talebian, L., Lind, E., Robin, C., Binder, M., Dzierzak, E., and Speck, N.A. (2002). Runx1 expression marks long-term repopulating hematopoietic stem cells in the midgestation mouse embryo. Immunity 16, 661–672.
North, T.E., Goessling, W., Peeters, M., Li, P., Ceol, C., Lord, A.M., Weber, G.J., Harris, J., Cutting, C.C., Huang, P., et al. (2009). Hematopoietic Stem Cell Development Is Dependent on Blood Flow. Cell 137, 736–748.

170
O’Keeffe, M., Hochrein, H., Vremec, D., Caminschi, I., Miller, J.L., Anders, E.M., Wu, L., Lahoud, M.H., Henri, S., Scott, B., et al. (2002). Mouse plasmacytoid cells: Long-lived cells, heterogeneous in surface phenotype and function, that differentiate into CD8- dendritic cells only after microbial stimulus. J. Exp. Med. 196, 1307–1319.
Oatley, M., Bölükbası, Ö.V., Svensson, V., Shvartsman, M., Ganter, K., Zirngibl, K., Pavlovich, P. V., Milchevskaya, V., Foteva, V., Natarajan, K.N., et al. (2020). Single-cell transcriptomics identifies CD44 as a marker and regulator of endothelial to haematopoietic transition. Nat. Commun. 11, 1–18.
Oberlin, E., Tavian, M., Blazsek, I., and Péault, B. (2002). Blood-forming potential of vascular endothelium in the human embryo. Development 129, 4147 LP – 4157.
Ogawa, M., Tajima, F., Ito, T., Sato, T., Laver, J.H., and Deguchi, T. (2001). CD34 Expression by Murine Hematopoietic Stem Cells. Ann. N. Y. Acad. Sci. 938, 139–145.
Ohls, R.K., Li, Y., Abdel-Mageed, A., Buchanan, G., Mandell, L., and Christensen, R.D. (1995). Neutrophil pool sizes and granulocyte colony-stimulating factor production in human mid-trimester fetuses. Pediatr. Res. 37, 806–811.
Okabe, Y., and Medzhitov, R. (2014). Tissue-specific signals control reversible program of localization and functional polarization of macrophages. Cell 157, 832–844.
Okabe, Y., and Medzhitov, R. (2016). Tissue biology perspective on macrophages. Nat. Immunol. 17, 9–17.
Okuda, T., Van Deursen, J., and Hiebert, S.W. (1996). AML1, the Target of Multiple Chromosomal Translocations in Human Leukemia, Is Essential for Normal Fetal Liver Hematopoiesis.
Onai, N., Obata-Onai, A., Schmid, M.A., and Manz, M.G. (2007). Flt3 in Regulation of Type I Interferon-Producing Cell and Dendritic Cell Development. Ann. N. Y. Acad. Sci. 1106, 253–261.
Orkin, S.H., and Zon, L.I. (2008). Hematopoiesis: An Evolving Paradigm for Stem Cell Biology. Cell 132, 631–644.
Ottersbach, K. (2019). Endothelial-to-haematopoietic transition: An update on the process of making blood. Biochem. Soc. Trans. 47, 591–601.
Palis, J. (2006). Yolk Sac Development in Mice. In Hematopoietic Stem Cell Development, (Boston, MA: Springer US), pp. 62–71.
Palis, J. (2014). Primitive and definitive erythropoiesis in mammals. Front. Physiol. 5 JAN, 3.
Palis, J., and Yoder, M.C. (2001). Yolk-sac hematopoiesis: The first blood cells of mouse and man. Exp. Hematol. 29, 927–936.
Palis, J., Robertson, S., Kennedy, M., Wall, C., and Keller, G. (1999). Development of erythroid and myeloid progenitors in the yolk sac and embryo proper of the mouse. Development 126, 5073–5084.
Palis, J., Chan, R.J., Koniski, A., Patel, R., Starr, M., and Yoder, M.C. (2001). Spatial and temporal emergence of high proliferative potential hematopoietic precursors during murine embryogenesis. Proc. Natl. Acad. Sci. U. S. A. 98, 4528–4533.
van Panhuys, N., Prout, M., Forbes, E., Min, B., Paul, W.E., and Le Gros, G. (2011). Basophils Are the Major Producers of IL-4 during Primary Helminth Infection. J. Immunol. 186, 2719–2728.
Paolicelli, R.C., Bolasco, G., Pagani, F., Maggi, L., Scianni, M., Panzanelli, P., Giustetto, M., Ferreira, T.A., Guiducci, E., Dumas, L., et al. (2011). Synaptic pruning by microglia is necessary for normal brain development. Science (80-. ). 333, 1456–1458.

171
Parwaresch, M.R., and Wacker, H.-H. (1984). Origin and Kinetics of Resident Tissue Macrophages. Cell Prolif. 17, 25–39.
Passegué, E., Wagers, A.J., Giuriato, S., Anderson, W.C., and Weissman, I.L. (2005). Global analysis of proliferation and cell cycle gene expression in the regulation of hematopoietic stem and progenitor cell fates. J. Exp. Med. 202, 1599–1611.
Patel, S.R., Hartwig, J.H., and Italiano, J.E. (2005). The biogenesis of platelets from megakaryocyte proplatelets. J. Clin. Invest. 115, 3348–3354.
Paul, F., Arkin, Y., Giladi, A., Jaitin, D.A., Kenigsberg, E., Keren-Shaul, H., Winter, D., Lara-Astiaso, D., Gury, M., Weiner, A., et al. (2015). Transcriptional Heterogeneity and Lineage Commitment in Myeloid Progenitors. Cell 163, 1663–1677.
Payer, E., Elbe, A., and Stingl, G. (1991). Circulating CD3+/T cell receptor V gamma 3+ fetal murine thymocytes home to the skin and give rise to proliferating dendritic epidermal T cells. J. Immunol. 146, 2536–2543.
Pei, W., Shang, F., Wang, X., Fanti, A.-K., Greco, A., Busch, K., Klapproth, K., Zhang, Q., Quedenau, C., Sauer, S., et al. (2020). Resolving Fates and Single-Cell Transcriptomes of Hematopoietic Stem Cell Clones by PolyloxExpress Barcoding. Cell Stem Cell 0.
Peschle, C., Mavilio, F., Carè, A., Migliaccio, G., Migliaccio, A.R., Salvo, G., Samoggia, P., Petti, S., Guerriero, R., Marinucci, M., et al. (1985). Haemoglobin switching in human embryos: Asynchrony of ζ → α and ε → γ-globin switches in primitive and definitive erythropoietic lineage. Nature 313, 235–238.
Peters, W., Cyster, J.G., Mack, M., Schlöndorff, D., Wolf, A.J., Ernst, J.D., and Charo, I.F. (2004). CCR2-Dependent Trafficking of F4/80dim Macrophages and CD11cdim/intermediate Dendritic Cells Is Crucial for T Cell Recruitment to Lungs Infected with Mycobacterium tuberculosis. J. Immunol. 172, 7647 LP – 7653.
Petrenko, O., Beavis, A., Klaine, M., Kittappa, R., Godin, I., and Lemischka, I.R. (1999). The molecular characterization of the fetal stem cell marker AA4. Immunity 10, 691–700.
Pietras, E.M., Reynaud, D., Kang, Y.A., Carlin, D., Calero-Nieto, F.J., Leavitt, A.D., Stuart, J.A., Göttgens, B., and Passegué, E. (2015). Functionally Distinct Subsets of Lineage-Biased Multipotent Progenitors Control Blood Production in Normal and Regenerative Conditions. Cell Stem Cell 17, 35–46.
Pinho, S., Marchand, T., Yang, E., Wei, Q., Nerlov, C., and Frenette, P.S. (2018). Lineage-Biased Hematopoietic Stem Cells Are Regulated by Distinct Niches. Dev. Cell 44, 634-641.e4.
Plantinga, M., Guilliams, M., Vanheerswynghels, M., Deswarte, K., Branco-Madeira, F., Toussaint, W., Vanhoutte, L., Neyt, K., Killeen, N., Malissen, B., et al. (2013). Conventional and Monocyte-Derived CD11b+ Dendritic Cells Initiate and Maintain T Helper 2 Cell-Mediated Immunity to House Dust Mite Allergen. Immunity 38, 322–335.
Pons, P., and Latapy, M. (2006). Computing communities in large networks using random walks. J. Graph Algorithms Appl. 10, 191–218.
Popescu, D.M., Botting, R.A., Stephenson, E., Green, K., Webb, S., Jardine, L., Calderbank, E.F., Polanski, K., Goh, I., Efremova, M., et al. (2019). Decoding human fetal liver haematopoiesis. Nature 574, 365–371.
Potts, K.S., Sargeant, T.J., Markham, J.F., Shi, W., Biben, C., Josefsson, E.C., Whitehead, L.W., Rogers, K.L., Liakhovitskaia, A., Smyth, G.K., et al. (2014). A lineage of diploid platelet-forming cells precedes polyploid megakaryocyte formation in the mouse embryo. Blood 124, 2725–2729.

172
Prussin, C., and Metcalfe, D.D. (2006). 5. IgE, mast cells, basophils, and eosinophils. J. Allergy Clin. Immunol. 117, S450–S456.
Qi, X., Hong, J., Chaves, L., Zhuang, Y., Chen, Y., Wang, D., Chabon, J., Graham, B., Ohmori, K., Li, Y., et al. (2013). Antagonistic Regulation by the Transcription Factors C/EBPα and MITF Specifies Basophil and Mast Cell Fates. Immunity 39, 97–110.
Rebel, V.I., Miller, C.L., Eaves, C.J., and Lansdorp, P.M. (1996). The repopulation potential of fetal liver hematopoietic stem cells in mice exceeds that of their adult bone marrow counterparts. Blood 87, 3500–3507.
Reizis, B., Bunin, A., Ghosh, H.S., Lewis, K.L., and Sisirak, V. (2011). Plasmacytoid dendritic cells: Recent progress and open questions. Annu. Rev. Immunol. 29, 163–183.
Robb, L., Lyons, I., Li, R., Hartley, L., Köntgen, F., Harvey, R.P., Metcalf, D., and Begley, C.G. (1995). Absence of yolk sac hematopoiesis from mice with a targeted disruption of the scl gene. Proc. Natl. Acad. Sci. U. S. A. 92, 7075–7079.
Robert-Moreno, À., Espinosa, L., de la Pompa, J.L., and Bigas, A. (2005). RBPjκ-dependent Notch function regulates Gata2 and is essential for the formation of intra-embryonic hematopoietic cells. Development 132, 1117–1126.
Robert-Moreno, À., Guiu, J., Ruiz-Herguido, C., López, M.E., Inglés-Esteve, J., Riera, L., Tipping, A., Enver, T., Dzierzak, E., Gridley, T., et al. (2008). Impaired embryonic haematopoiesis yet normal arterial development in the absence of the Notch ligand Jagged1. EMBO J. 27, 1886–1895.
Rodrigues, P.F., Alberti-Servera, L., Eremin, A., Grajales-Reyes, G.E., Ivanek, R., and Tussiwand, R. (2018). Distinct progenitor lineages contribute to the heterogeneity of plasmacytoid dendritic cells. Nat. Immunol. 19, 711–722.
Rodriguez-Fraticelli, A.E., Wolock, S.L., Weinreb, C.S., Panero, R., Patel, S.H., Jankovic, M., Sun, J., Calogero, R.A., Klein, A.M., and Camargo, F.D. (2018). Clonal analysis of lineage fate in native haematopoiesis. Nature 553, 212–216.
Rosas, M., Davies, L.C., Giles, P.J., Liao, C. Te, Kharfan, B., Stone, T.C., O’Donnell, V.B., Fraser, D.J., Jones, S.A., and Taylor, P.R. (2014). The transcription factor Gata6 links tissue macrophage phenotype and proliferative renewal. Science (80-. ). 344, 645–648.
Ruiz-Herguido, C., Guiu, J., D’Altri, T., Inglés-Esteve, J., Dzierzak, E., Espinosa, L., and Bigas, A. (2012). Hematopoietic stem cell development requires transient Wnt/β-catenin activity. J. Exp. Med. 209, 1457–1468.
Russell, E.S., and Seldon E. Bernstein (1966). Blood and Blood Formation.
Rybtsov, S., Sobiesiak, M., Taoudi, S., Souilhol, C., Senserrich, J., Liakhovitskaia, A., Ivanovs, A., Frampton, J., Zhao, S., and Medvinsky, A. (2011). Hierarchical organization and early hematopoietic specification of the developing HSC lineage in the AGM region. J. Exp. Med. 208, 1305–1315.
Sabin, F.R. (1920). Studies on the origin of blood-vessels and ofred blood-corpuscles as seen in the living blastoderm of chicks during the second day of incubation.
Salvermoser, J., van Blijswijk, J., Papaioannou, N.E., Rambichler, S., Pasztoi, M., Pakalniškyte, D., Rogers, N.C., Keppler, S.J., Straub, T., Reis e Sousa, C., et al. (2018). Clec9a-mediated ablation of conventional dendritic cells suggests a lymphoid path to generating dendritic cells in vivo. Front. Immunol. 9, 16.
Samokhvalov, I.M., Samokhvalova, N.I., and Nishikawa, S.I. (2007). Cell tracing shows the contribution of the yolk sac to adult haematopoiesis. Nature 446, 1056–1061.
Samstein, M., Schreiber, H.A., Leiner, I.M., Sušac, B., Glickman, M.S., and Pamer, E.G.

173
(2013). Essential yet limited role for CCR2+ inflammatory monocytes during Mycobacterium tuberculosis-specific T cell priming. Elife 2013.
Sánchez, M.J., Holmes, A., Miles, C., and Dzierzak, E. (1996). Characterization of the first definitive hematopoietic stem cells in the AGM and liver of the mouse embryo. Immunity 5, 513–525.
Sanjuan-Pla, A., Macaulay, I.C., Jensen, C.T., Woll, P.S., Luis, T.C., Mead, A., Moore, S., Carella, C., Matsuoka, S., Jones, T.B., et al. (2013). Platelet-biased stem cells reside at the apex of the haematopoietic stem-cell hierarchy. Nature 502, 232–236.
Sasaki, K., and Sonoda, Y. (2000). Histometrical and Three-Dimensional Analyses of Liver Hematopoiesis in the Mouse Embryo. Arch. Histol. Cytol. 63, 137–146.
Satpathy, A.T., KC, W., Albring, J.C., Edelson, B.T., Kretzer, N.M., Bhattacharya, D., Murphy, T.L., and Murphy, K.M. (2012). Zbtb46 expression distinguishes classical dendritic cells and their committed progenitors from other immune lineages. J. Exp. Med. 209, 1135–1152.
Savill, J.S., Henson, P.M., and Haslett, C. (1989a). Phagocytosis of aged human neutrophils by macrophages is mediated by a novel ’charge-sensitive’recognition mechanism. J. Clin. Invest. 84, 1518–1527.
Savill, J.S., Wyllie, A.H., Henson, J.E., Walport, M.J., Henson, P.M., and Haslett, C. (1989b). Macrophage phagocytosis of aging neutrophils in inflammation. Programmed cell death in the neutrophil leads to its recognition by macrophages. J. Clin. Invest. 83, 865–875.
Sawamiphak, S., Kontarakis, Z., and Stainier, D.Y.R. (2014). Interferon Gamma Signaling Positively Regulates Hematopoietic Stem Cell Emergence. Dev. Cell 31, 640–653.
Schlitzer, A., Sivakamasundari, V., Chen, J., Sumatoh, H.R. Bin, Schreuder, J., Lum, J., Malleret, B., Zhang, S., Larbi, A., Zolezzi, F., et al. (2015). Identification of cDC1- and cDC2-committed DC progenitors reveals early lineage priming at the common DC progenitor stage in the bone marrow. Nat. Immunol. 16, 718–728.
Schüler, A., Schwieger, M., Engelmann, A., Weber, K., Horn, S., Müller, U., Arnold, M.A., Olson, E.N., Stocking, C., Schü, A., et al. (2008). The MADS transcription factor Mef2c is a pivotal modulator of myeloid cell fate. Blood 111, 4532–4541.
Schüller, S.S., Sadeghi, K., Wisgrill, L., Dangl, A., Diesner, S.C., Prusa, A.R., Klebermasz-Schrehof, K., Greber-Platzer, S., Neumüller, J., Helmer, H., et al. (2013). Preterm neonates display altered plasmacytoid dendritic cell function and morphology. J. Leukoc. Biol. 93, 781–788.
Schulz, C., Perdiguero, E.G., Chorro, L., Szabo-Rogers, H., Cagnard, N., Kierdorf, K., Prinz, M., Wu, B., Jacobsen, S.E.W., Pollard, J.W., et al. (2012). A Lineage of Myeloid Cells Independent of Myb and Hematopoietic Stem Cells. Science (80-. ). 336, 86 LP – 90.
Scialdone, A., Natarajan, K.N., Saraiva, L.R., Proserpio, V., Teichmann, S.A., Stegle, O., Marioni, J.C., and Buettner, F. (2015). Computational assignment of cell-cycle stage from single-cell transcriptome data. Methods 85, 54–61.
Scott, C.L., and Begley, C.G. (1999). The beta common chain (βc) of the granulocyte macrophage-colony stimulating factor, interleukin-3 and interleukin-5 receptors. Int. J. Biochem. Cell Biol. 31, 1011–1015.
Scott, C.L., Zheng, F., De Baetselier, P., Martens, L., Saeys, Y., De Prijck, S., Lippens, S., Abels, C., Schoonooghe, S., Raes, G., et al. (2016). Bone marrow-derived monocytes give rise to self-renewing and fully differentiated Kupffer cells. Nat. Commun. 7, 1–10.

174
Scott, C.L., T’Jonck, W., Martens, L., Todorov, H., Sichien, D., Soen, B., Bonnardel, J., De Prijck, S., Vandamme, N., Cannoodt, R., et al. (2018). The Transcription Factor ZEB2 Is Required to Maintain the Tissue-Specific Identities of Macrophages. Immunity 49, 312-325.e5.
Segura, E., and Amigorena, S. (2013). Inflammatory dendritic cells in mice and humans. Trends Immunol. 34, 440–445.
Serbina, N. V., Kuziel, W., Flavell, R., Akira, S., Rollins, B., and Pamer, E.G. (2003). Sequential MyD88-Independent and -Dependent Activation of Innate Immune Responses to Intracellular Bacterial Infection. Immunity 19, 891–901.
Shivdasanl, R.A., Mayer, E.L., and Orkin, S.H. (1995). Absence of blood formation in mice lacking the T-cell leukaemia oncoprotein tal-1/SCL. Nature 373, 432–434.
Siegal, F.P., Kadowaki, N., Shodell, M., Fitzgerald-Bocarsly, P.A., Shah, K., Ho, S., Antonenko, S., and Liu, Y.J. (1999). The nature of the principal Type 1 interferon-producing cells in human blood. Science (80-. ). 284, 1835–1837.
Silver, L., and Palis, J. (1997). Initiation of murine embryonic erythropoiesis: A spatial analysis. Blood 89, 1154–1164.
Slayton, W.B., Juul, S.E., Calhoun, D.A., Li, Y., Braylan, R.C., and Christensen, R.D. (1998). Hematopoiesisis the liver and marrow of human fetuses at 5 to 16 weeks postconception: Quantitative assessment of macrophage and neutrophil populations. Pediatr. Res. 43, 774–782.
Snell, G.D., and Stevens, L.C. (1966). Early Embryology.
Soares-da-Silva, F., Burlen-Defranoux, O., Elsaid, R., Iturri, L., Freyer, L., Sismeiro, O., Pinto-do-Ó, P., Gomez-Perdiguero, E., and Cumano, A. (2020). Yolk sac erythromyeloid progenitors sustain erythropoiesis throughout embryonic life. BioRxiv 2020.02.27.968230.
Soehnlein, O., Steffens, S., Hidalgo, A., and Weber, C. (2017). Neutrophils as protagonists and targets in chronic inflammation. Nat. Rev. Immunol. 17, 248–261.
Sonoda, T., Hayashi, C., and Kitamura, Y. (1983). Presence of mast cell precursors in the yolk sac of mice. Dev. Biol. 97, 89–94.
Stamatoyannopoulos, G. (2005). Control of globin gene expression during development and erythroid differentiation. Exp. Hematol. 33, 259–271.
Stamatoyannopoulos, G., and Nienhuis, A.W. (1983). Globin Gene Expression and Hematopoietic Differentiation. Liss, New York.
Stefanska, M., Batta, K., Patel, R., Florkowska, M., Kouskoff, V., and Lacaud, G. (2017). Primitive erythrocytes are generated from hemogenic endothelial cells. Sci. Rep. 7, 1–10.
Stegner, D., Vaneeuwijk, J.M.M., Angay, O., Gorelashvili, M.G., Semeniak, D., Pinnecker, J., Schmithausen, P., Meyer, I., Friedrich, M., Dütting, S., et al. (2017). Thrombopoiesis is spatially regulated by the bone marrow vasculature. Nat. Commun. 8, 1–11.
Stremmel, C., Schuchert, R., Wagner, F., Thaler, R., Weinberger, T., Pick, R., Mass, E., Ishikawa-Ankerhold, H.C., Margraf, A., Hutter, S., et al. (2018). Yolk sac macrophage progenitors traffic to the embryo during defined stages of development. Nat. Commun. 9, 75.
Stuart, T., Butler, A., Hoffman, P., Hafemeister, C., Papalexi, E., Mauck, W.M., Hao, Y., Stoeckius, M., Smibert, P., and Satija, R. (2019). Comprehensive Integration of Single-Cell Data. Cell 177, 1888-1902.e21.
Summers, K.M., and Hume, D.A. (2017). Identification of the macrophage-specific promoter

175
signature in FANTOM5 mouse embryo developmental time course data. J. Leukoc. Biol. 102, 1081–1092.
Summers, C., Rankin, S.M., Condliffe, A.M., Singh, N., Peters, A.M., and Chilvers, E.R. (2010). Neutrophil kinetics in health and disease. Trends Immunol. 31, 318–324.
Sumner, R., Crawford, A., Mucenski, M., and Frampton, J. (2000). Initiation of adult myelopoiesis can occur in the absence of c-Myb whereas subsequent development is strictly dependent on the transcription factor. Oncogene 19, 3335–3342.
Sun, C.M., Fiette, L., Tanguy, M., Leclerc, C., and Lo-Man, R. (2003). Ontogeny and innate properties of neonatal dendritic cells. Blood 102, 585–591.
Swirski, F.K., Nahrendorf, M., Etzrodt, M., Wildgruber, M., Cortez-Retamozo, V., Panizzi, P., Figueiredo, J.L., Kohler, R.H., Chudnovskiy, A., Waterman, P., et al. (2009). Identification of splenic reservoir monocytes and their deployment to inflammatory sites. Science (80-. ). 325, 612–616.
Takahashi, K., Yamamura, F., and Naito, M. (1989). Differentiation, maturation, and proliferation of macrophages in the mouse yolk sac: A light-microscopic, enzyme-cytochemical, immunohistochemical, and ultrastructural study. J. Leukoc. Biol. 45, 87–96.
Tamoutounour, S., Guilliams, M., MontananaSanchis, F., Liu, H., Terhorst, D., Malosse, C., Pollet, E., Ardouin, L., Luche, H., Sanchez, C., et al. (2013). Origins and functional specialization of macrophages and of conventional and monocyte-derived dendritic cells in mouse skin. Immunity 39, 925–938.
Tang, Y., Harrington, A., Yang, X., Friesel, R.E., and Liaw, L. (2010). The contribution of the Tie2+ lineage to primitive and definitive hematopoietic cells. Genesis 48, 563–567.
Taoudi, S., Gonneau, C., Moore, K., Sheridan, J.M., Blackburn, C.C., Taylor, E., and Medvinsky, A. (2008). Extensive hematopoietic stem cell generation in the AGM region via maturation of VE-Cadherin+CD45+ pre-definitive HSCs. Cell Stem Cell 3, 99–108.
Tavian, M., Coulombel, L., Luton, D., Clemente, H., Dieterlen-Lievre, F., and Peault, B. (1996). Aorta-associated CD34+ hematopoietic cells in the early human embryo. Blood 87, 67–72.
Tavian, M., Robin, C., Coulombel, L., and Péault, B. (2001). The human embryo, but not its yolk sac, generates lympho-myeloid stem cells: Mapping multipotent hematopoietic cell fate in intraembryonic mesoderm. Immunity 15, 487–495.
Teschendorff, A.E., and Enver, T. (2017). Single-cell entropy for accurate estimation of differentiation potency from a cell’s transcriptome. Nat. Commun. 8, 1–15.
Tober, J., Koniski, A., McGrath, K.E., Vemishetti, R., Emerson, R., De Mesy-Bentley, K.K.L., Waugh, R., and Palis, J. (2007). The megakaryocyte lineage originates from hemangioblast precursors and is an integral component both of primitive and of definitive hematopoiesis. Blood 109, 1433–1441.
Tober, J., McGrath, K.E., and Palis, J. (2008). Primitive erythropoiesis and megakaryopoiesis in the yolk sac are independent of c-myb. Blood 111, 2636–2639.
Tran, S., Baba, I., Poupel, L., Dussaud, S., Moreau, M., Gélineau, A., Marcelin, G., Magréau-Davy, E., Ouhachi, M., Lesnik, P., et al. (2020). Impaired Kupffer Cell Self-Renewal Alters the Liver Response to Lipid Overload during Non-alcoholic Steatohepatitis. Immunity 0.
Traver, D., Miyamoto, T., Christensen, J., Iwasaki-Arai, J., Akashi, K., and Weissman, I.L. (2001). Fetal liver myelopoiesis occurs through distinct, prospectively isolatable progenitor subsets.

176
Traynor, T.R., Kuziel, W.A., Toews, G.B., and Huffnagle, G.B. (2000). CCR2 Expression Determines T1 Versus T2 Polarization During Pulmonary Cryptococcus neoformans Infection . J. Immunol. 164, 2021–2027.
Trimborn, T., Gribnau, J., Grosveld, F., and Fraser, P. (1999). Mechanisms of developmental control transcription in the murine α and β-globin loci. Genes Dev. 13, 112–124.
Turpen, J.B., and Smith, P.B. (1985). Dorsal lateral plate mesoderm influences proliferation and differentiation of hemopoietic stem cells derived from ventral lateral plate mesoderm during early development of Xenopus laevis embryos. J. Leukoc. Biol. 38, 415–427.
Turpen, J.B., Kelley, C.M., Mead, P.E., and Zon, L.I. (1997). Bipotential primitive-definitive hematopoietic progenitors in the vertebrate embryo. Immunity 7, 325–334.
Udan, R.S., Vadakkan, T.J., and Dickinson, M.E. (2013). Dynamic responses of endothelial cells to changes in blood flow during vascular remodeling of the mouse yolk sac. Dev. 140, 4041–4050.
Vink, C.S., Calero-Nieto, F.J., Wang, X., Maglitto, A., Mariani, S.A., Jawaid, W., Göttgens, B., and Dzierzak, E. (2020). Iterative Single-Cell Analyses Define the Transcriptome of the First Functional Hematopoietic Stem Cells. Cell Rep. 31, 107627.
Warren, A.J., Colledge, W.H., Carlton, M.B.L., Evans, M.J., Smith, A.J.H., and Rabbitts, T.H. (1994). The Oncogenic Cysteine-rich LIM domain protein Rbtn2 is essential for erythroid development. Cell 78, 45–57.
Waskow, C., Liu, K., Darrasse-Jèze, G., Guermonprez, P., Ginhoux, F., Merad, M., Shengelia, T., Yao, K., and Nussenzweig, M. (2008). The receptor tyrosine kinase Flt3 is required for dendritic cell development in peripheral lymphoid tissues. Nat. Immunol. 9, 676–683.
Weisberg, S.P., Hunter, D., Huber, R., Lemieux, J., Slaymaker, S., Vaddi, K., Charo, I., Leibel, R.L., and Ferrante, A.W. (2006). CCR2 modulates inflammatory and metabolic effects of high-fat feeding. J. Clin. Invest. 116, 115–124.
Williams, T.J., and Hellewell, P.G. (1995). Mechanisms and pharmacological manipulation of eosinophil accumulation in vivo. Trends Pharmacol. Sci. 16, 418–423.
Wislocki, G.B., Deane, H.W., and Dempsey, E.W. (1946). The histochemistry of the rodent’s placenta. Am. J. Anat. 78, 281–345.
Woidacki, K., Popovic, M., Metz, M., Schumacher, A., Linzke, N., Teles, A., Poirier, F., Fest, S., Jensen, F., Rabinovich, G.A., et al. (2013). Mast cells rescue implantation defects caused by c-kit Deficiency. Cell Death Dis. 4, 462.
Wojtasiak, M., Pickett, D.L., Tate, M.D., Bedoui, S., Job, E.R., Whitney, P.G., Brooks, A.G., and Reading, P.C. (2010). Gr-1+ cells, but not neutrophils, limit virus replication and lesion development following flank infection of mice with herpes simplex virus type-1. Virology 407, 143–151.
Wolber, F.M., Leonard, E., Michael, S., Orschell-Traycoff, C.M., Yoder, M.C., and Srour, E.F. (2002). Roles of spleen and liver in development of the murine hematopoietic system. Exp. Hematol. 30, 1010–1019.
Wong, P., Chung, S., Reicheld, S., and Chui, D. (1986). Hemoglobin switching during murine embryonic development: evidence for two populations of embryonic erythropoietic progenitor cells. Blood 67, 716–721.
Wynn, T.A., and Vannella, K.M. (2016). Macrophages in Tissue Repair, Regeneration, and Fibrosis. Immunity 44, 450–462.
Xu, M.J., Matsuoka, S., Yang, F.C., Ebihara, Y., Manabe, A., Tanaka, R., Eguchi, M., Asano,

177
S., Nakahata, T., and Tsuji, K. (2001). Evidence for the presence of murine primitive megakarycytopoiesis in the early yolk sac. Blood 97, 2016–2022.
Yáñez, A., Coetzee, S.G., Olsson, A., Muench, D.E., Berman, B.P., Hazelett, D.J., Salomonis, N., Grimes, H.L., and Goodridge, H.S. (2017). Granulocyte-Monocyte Progenitors and Monocyte-Dendritic Cell Progenitors Independently Produce Functionally Distinct Monocytes. Immunity 47, 890-902.e4.
Yoder, M.C., Hiatt, K., Dutt, P., Mukherjee, P., Bodine, D.M., and Orlic, D. (1997). Characterization of definitive lymphohematopoietic stem cells in the day 9 murine yolk sac. Immunity 7, 335–344.
Yokomizo, T., and Dzierzak, E. (2010). Three-dimensional cartography of hematopoietic clusters in the vasculature of whole mouse embryos. Development 137, 3651–3661.
Yokomizo, T., Hasegawa, K., Ishitobi, H., Osato, M., Ema, M., Ito, Y., Yamamoto, M., and Takahashi, S. (2008). Runx1 is involved in primitive erythropoiesis in the mouse. Blood 111, 4075–4080.
Yona, S., Kim, K.W., Wolf, Y., Mildner, A., Varol, D., Breker, M., Strauss-Ayali, D., Viukov, S., Guilliams, M., Misharin, A., et al. (2013). Fate Mapping Reveals Origins and Dynamics of Monocytes and Tissue Macrophages under Homeostasis. Immunity 38, 79–91.
Yoshida, H., Kawane, K., Koike, M., Mori, Y., Uchiyama, Y., and Nagata, S. (2005). Phosphatidylserine-dependent engulfment by macrophages of nuclei from erythroid precursor cells. Nature 437, 754–758.
Yoshimoto, M., Montecino-Rodriguez, E., Ferkowicz, M.J., Porayette, P., Shelley, W.C., Conway, S.J., Dorshkind, K., and Yoder, M.C. (2011). Embryonic day 9 yolk sac and intra-embryonic hemogenic endothelium independently generate a B-1 and marginal zone progenitor lacking B-2 potential. Proc. Natl. Acad. Sci. U. S. A. 108, 1468–1473.
Yvan-Charvet, L., and Ng, L.G. (2019). Granulopoiesis and Neutrophil Homeostasis: A Metabolic, Daily Balancing Act. Trends Immunol. 40, 598–612.
Yzaguirre, A.D., de Bruijn, M.F.T.R., and Speck, N.A. (2017). The Role of Runx1 in Embryonic Blood Cell Formation. In Advances in Experimental Medicine and Biology, (Springer New York LLC), pp. 47–64.
Zambidis, E.T., Peault, B., Park, T.S., Bunz, F., and Civin, C.I. (2005). Hematopoietic differentiation of human embryonic stem cells progresses through sequential hematoendothelial, primitive, and definitive stages resembling human yolk sac development. Blood 106, 860–870.
Zhang, P., Zhang, X., Iwama, A., Yu, C., Smith, K.A., Mueller, B.U., Narravula, S., Torbett, B.E., Orkin, S.H., and Tenen, D.G. (2000). PU.1 inhibits GATA-1 function and erythroid differentiation by blocking GATA-1 DNA binding. Blood 96, 2641–2648.
Zhang, Y., Riesterer, C., Ayrall, A.M., Sablitzky, F., Littlewood, T.D., and Reth, M. (1996). Inducible site-directed recombination in mouse embryonic stem cells. Nucleic Acids Res. 24, 543–548.
Zhou, F., Li, X., Wang, W., Zhu, P., Zhou, J., He, W., Ding, M., Xiong, F., Zheng, X., Li, Z., et al. (2016). Tracing haematopoietic stem cell formation at single-cell resolution. Nature 533, 487–492.
Ziegenhain, C., Vieth, B., Parekh, S., Reinius, B., Guillaumet-Adkins, A., Smets, M., Leonhardt, H., Heyn, H., Hellmann, I., and Enard, W. (2017). Comparative Analysis of Single-Cell RNA Sequencing Methods. Mol. Cell 65, 631-643.e4.
Zigmond, E., Samia-Grinberg, S., Pasmanik-Chor, M., Brazowski, E., Shibolet, O., Halpern,

178
Z., and Varol, C. (2014). Infiltrating Monocyte-Derived Macrophages and Resident Kupffer Cells Display Different Ontogeny and Functions in Acute Liver Injury. J. Immunol. 193, 344–353.
LIST OF FIGURES
Figure 1. Illustration of the three hematopoietic waves during mammal development. .......... 13
Figure 2. Illustrations of murine yolk sacs after gastrulation ................................................... 26
Figure 3. Illustration of E9.5 murine embryo.. .......................................................................... 28
Figure 4. Illustration of events taking place in EHT ................................................................. 31
Figure 5. Schematic illustration of commitment steps of HSC towards erythroid and myeloid
lineages ............................................................................................................................. 34
Figure 6. Maturation steps of definitive erythroid precursors deriving from BFU-E
progenitors.. ...................................................................................................................... 37
Figure 7. Schematic illustration of progenitor steps leading to the production of monocytes..
........................................................................................................................................... 42
Figure 8. Schematic illustration of the development of the three types of granulocytes and
mast cells in steady state. ................................................................................................. 53
Figure 9. Erythroid and/or myeloid progenitor populations in the fetal liver. ......................... 121
Figure 10. Single cell RNA-Sequencing of yolk sac and fetal liver EMP-derived progenitors
......................................................................................................................................... 123
Figure 11. Distribution of clusters in the UMAP and expression of manually picked genes. 125
Figure 12. Heatmap displaying the top three differentially expressed genes. ...................... 128
Figure 13. MC cluster has differentiated mast cell characteristics.. ...................................... 129
Figure 14. Contribution of embryonic stage and niche to the cell clusters. .......................... 131
Figure 15. Hallmarks of yolk sac definitive hematopoiesis depicted as a lineage tree ......... 151

179
LIST OF TABLES
Table 1. Summary of main characteristics of the three hematopoietic waves ........................ 24
Table 2. Comparison of the results obtained in Csf1rMeriCreMer RosaYFP embryos pulsed at E8.5
or E9.5 ............................................................................................................................. 144

180
ABSTRACT
English
Erythro-myeloid progenitors (EMP) are developmentally restricted hematopoietic
progenitors that produce the first definitive hematopoietic cells in the embryo. Importantly, it
has been shown that they give rise to tissue-resident macrophages and mast cells that
colonize organs during gestation and self-maintain during adult life without contribution from
the bone marrow. These cells are specialized immune cells that contribute to the homeostasis
of the tissues throughout steady state and tissue challenge (wounds or infections). This PhD
project aimed to characterise the contribution of EMPs to the hematopoietic system of the
embryo, with special focus to their niche of origin, the yolk sac. With the use of genetic mouse
models, high parameter flow cytometry and single cell expression analysis, this project i)
characterises the major definitive progenitor populations in the yolk sac, ii) identifies a novel
pathway of direct megakaryopoiesis from EMPs and iii) uncovers two waves of EMP potential
emerging at different stages. This work sheds light on the poorly characterised early definitive
embryonic haematopoiesis and could have potential implications on macrophage ontogeny
studies and early childhood myeloproliferative disorders.
Français
Les progéniteurs érythro-myéloïdes (EMP) sont des progéniteurs hématopoïétiques
restreints au développement qui produisent les premières cellules hématopoïétiques
définitives de l'embryon. Surtout, ils donnent naissance aux macrophages résidents et
mastocytes qui colonisent les différents organes pendant la gestation et s’auto-renouvellent
pendant la vie adulte sans apport de la moelle osseuse. Ces cellules sont des cellules
immunitaires spécialisées qui contribuent à l'homéostasie des tissus aussi bien dans les tissus
sains que suite à des blessures ou des infections. Ce projet de doctorat visait à caractériser
la contribution des EMP au système hématopoïétique de l'embryon, avec un accent particulier
sur leur niche d'origine, le sac vitellin. En utilisant des modèles génétiques de souris, la
cytométrie de flux à paramètres élevés et l'analyse de l'expression au niveau unicellulaire, ce
projet i) caractérise les principales populations de progéniteurs définitifs dans le sac vitellin, ii)
identifie une nouvelle voie de mégacaryopoïèse directe à partir des EMP et iii) découvre deux
vagues de potentiel EMP émergeant à des stades différents du développement. Ce projet a
pour but de mieux comprendre la complexité de l'hématopoïèse embryonnaire et pourrait avoir
des implications sur les études d'ontogenèse des macrophages et les troubles
myéloprolifératifs infantiles.