Positively charged biomaterials exert antimicrobial effects on gram-negative bacilli in rats

Myeloid Derived Suppressor Cells (MDSCs) Are Increasedand Exert Immunosuppressive Activity Together withPolymorphonuclear Leukocytes (PMNs) in ChronicMyeloid Leukemia PatientsCesarina Giallongo1, Nunziatina Parrinello1, Daniele Tibullo1*, Piera La Cava1, Alessandra Romano1,
Annalisa Chiarenza1, Ignazio Barbagallo2, Giuseppe A. Palumbo1, Fabio Stagno1, Paolo Vigneri3,
Francesco Di Raimondo1
1 Department of Clinical and Molecular Biomedicine, section of Hematology, Ferrarotto Hospital, University of Catania, Catania, Italy, 2 Department of Drug Sciences,
section of Biochemistry, University of Catania, Catania, Italy, 3 Department of Pediatric and Medical Sciences, University of Catania, Catania, Italy
Abstract
Tumor immune tolerance can derive from the recruitment of suppressor cell population, including myeloid derivedsuppressor cells (MDSCs), able to inhibit T cells activity. We identified a significantly expanded MDSCs population in chronicmyeloid leukemia (CML) patients at diagnosis that decreased to normal levels after imatinib therapy. In addition, expressionof arginase 1 (Arg1) that depletes microenvironment of arginine, an essential aminoacid for T cell function, resulted in anincrease in patients at diagnosis. Purified CML CD11b+CD33+CD14-HLADR- cells markedly suppressed normal donor T cellproliferation in vitro. Comparing CML Gr-MDSCs to autologous polymorphonuclear leukocytes (PMNs) we observed a higherArg1 expression and activity in PMNs, together with an inhibitory effect on T cells in vitro. Our data indicate that CML cellscreate an immuno-tolerant environment associated to MDSCs expansion with immunosuppressive capacity mediated byArg1. In addition, we demonstrated for the first time also an immunosuppressive activity of CML PMNs, suggesting a strongpotential immune escape mechanism created by CML cells, which control the anti-tumor reactive T cells. MDSCs should bemonitored in imatinib discontinuation trials to understand their importance in relapsing patients.
Citation: Giallongo C, Parrinello N, Tibullo D, La Cava P, Romano A, et al. (2014) Myeloid Derived Suppressor Cells (MDSCs) Are Increased and ExertImmunosuppressive Activity Together with Polymorphonuclear Leukocytes (PMNs) in Chronic Myeloid Leukemia Patients. PLoS ONE 9(7): e101848. doi:10.1371/journal.pone.0101848
Editor: Giovanni Li Volti, University of Catania, Italy
Received April 18, 2014; Accepted June 10, 2014; Published July 11, 2014
Copyright: � 2014 Giallongo et al. This is an open-access article distributed under the terms of the Creative Commons Attribution License, which permitsunrestricted use, distribution, and reproduction in any medium, provided the original author and source are credited.
Data Availability: The authors confirm that all data underlying the findings are fully available without restriction. Data are all contained within the paper.
Funding: This study has been supported in part by A.I.L. (Associazione Italiana contro le Leucemie) sezione di Catania and by FON.CA.NE.SA. (FondazioneCatanese per lo Studio delle Malattie Neoplastiche del Sangue). The funders had no role in study design, data collection and analysis, decision to publish, orpreparation of the manuscript.
Competing Interests: The authors have declared that no competing interests exist.
* Email: d.tibullo@unict
Introduction
The tyrosine kinase inhibitors (TKIs), imatinib (IM), nilotinib
and dasatinib have changed the course of the chronic myeloid
leukemia (CML) [1] but these drugs are not able to eradicate CML
clone [2]. However, a study with patients discontinuing IM has
shown that 41 percent of the patients stopping treatment while in
complete molecular response (CMR), remained in CMR at 12
months of follow-up [3]. In these patients, it is possible that the
immune system plays a role in maintaining complete remission.
This observation, together with the finding of BCR/ABL
transcripts in some healthy individuals [4], could support the
hypothesis that in some patients the immune system may exert an
immune surveillance against leukemic cells, while a suppression of
this system may create a permissive environment for development
and progression of disease. Indeed, immunotherapy in combina-
tion with TKIs is currently tested in clinical trials for treatment of
CML [5,6].
CD4+ T cells are central components of effective immune
response against cancer cells. This T cells subset appear to be
anergic to the leukemia cells in CML patients [7,8] and show
decreased expression of the TCR-f chain compared with T cells of
healthy individuals [9]. In addition, CML cells produce large
amounts of IL-10 [7,10], a cytokine which is known to suppress
cytokine expression by T cells [11]. Consequently, it is important
the identification of cell types and mechanisms responsible for the
induction and/or maintenance of T cell anergy in CML patients.
In many solid tumors, a subpopulation of myeloid cells defined
as Myeloid Derived Suppressor Cells (MDSCs) is supposed to play
a central role providing a favorable microenvironment in which
transformed cells can proliferate, acquire new mutations, expand
and evade host immunosurveillance [12,13]. MDSCs represent a
phenotypically heterogeneous population of myeloid cells at
different stages of maturation [12], that are able to suppress
tumor-specific T cell response through the induction of T cell
PLOS ONE | www.plosone.org 1 July 2014 | Volume 9 | Issue 7 | e101848

anergy and the development of T-regulatory cells (T-reg) [14].
Two important subsets of human MDSCs have been reported:
granulocytic MDSCs (Gr-MDSCs) with a CD11b+CD33+CD14-
HLADR- phenotype and monocytic MDSCs (Mo-MDSCs) that
are CD14+HLADR- [15–19].
MDSCs inhibit T cell activation and function by producing
ROS and nitrogen species which down regulate or dissociate the
CD3-associated f chain from the T cell receptor (TCR) thus
inhibiting T cells function. In addition, MDSCs and in particular
Gr-MDSCs produce arginase I (Arg1) and deplete their environ-
ment of L-arginine and L-cysteine, amino acids required for T cell
activation and proliferation [20]. Finally, MDSCs promote
expansion of T-reg cells through production of IL-10, TGF-band INFc [21,22].
Since tumor cells in CML are immature and of myeloid origin
their role as potential MDSCs is of interest to investigate.
Materials and Methods
Patients and sample collectionTo participate in this study, all participants signed a written
informed consent approved with the study (34/2013/VE) by the
local ethical committee (Azienda ospedaliero Universitaria Poli-
clinico-Vittorio Emanuele). After written informed consent,
samples were collected from CML patients and age-matched
healthy donors (HD) at Division of Hematology, AOU Policlinico
– OVE, University of Catania. CML patients at diagnosis and
during TKIs treatment were enrolled in this study. During
treatment, all patients were followed with a monthly CBC count,
molecular evaluation of the BCR/ABL transcript every 3 months
and cytogenetic evaluation every 6 months, according to ELN
guidelines.
Flow cytometry analysis of MDSCs phenotypeThe amount of MDSCs was evaluated in peripheral blood (PB)
of 20 HD, 19 CML patients at diagnosis and 18 during IM
therapy (13 of whom collected at diagnosis too). Analysis of
MDSCs was performed by multicolor FACS analysis using the
following antibody (Beckman Coulter): CD14 PC5 (clone
RMO52), HLADR ECD (clone IMMU-357), CD11b FITC
(clone bear-1), CD33 PE (clone D3HL60, 251) and their respective
isotype controls. Briefly, 16106 cells were stained with 10 ml of
each of the above listed Abs and incubated for 20 minutes in the
dark at room temperature. After lysing red cells with ammonium
chloride, cells were analyzed by flow cytometer (Cytomics FC 500,
Beckman Coulter) and analysis was performed using CXP Analysis
software. Using sequential gating strategy, Gr-MDSCs cells were
identified as cells CD11b+CD33+CD14-HLADR-, while the Mo-
MDSCs as CD14+HLADR-. The results were expressed both as
percentage and absolute number. The amount of MDSCs was also
evaluated in bone marrow (BM) samples of five CML patents at
diagnosis and compared to PB from the same patients.
In 12 CML patients we also evaluated the frequency and
phenotype of T-reg (CD4+CD25high, Foxp3+) at diagnosis and
during therapy with IM. For the evaluation of T-reg, 16106 cells
were incubated with 10 ml of following mAbs (Beckman Coulter):
CD4 Pc5 (clone 13b8.2) and CD25 PE (clone B149.9) for 20
minutes in the dark at room temperature. Subsequently,
intracellular Foxp3 FITC (clone PCH101 eBioscence) and
relevant isotype control staining was performed according to the
manufacturer’s instructions. T-reg was enumerated both as
percentage and absolute number.
Investigation of BCR/ABL transcripts in granulocytic andmonocytic MDSCs subsets
Gr-MDSCs and Mo-MDSCs were isolated from peripheral
blood mononuclear cells (PBMNCs) by the magnetic separation
(CD14-negative and CD66b-positive selection, StemCell Thechnolo-
gies and Anti-HLA-DR MicroBeads and CD14 MicroBeads,
Miltenyibiotec). The purity and viability was more than 90% as
tested by flow cytometry. After RNA extraction and reverse
transcription, we performed quantitative real-time PCR using a
7900HT Fast Real-Time PCR System (Applied Biosystems) with
the BioQuant p210 BCR-ABL kit (Biodiversity). For each sample
the fusion gene, either b2a2 or b3a2, and the housekeeping gene
ABL transcripts were detected. The cycle threshold values for
BCR-ABL and the control gene were determined in duplicate for
each sample.
RNA extraction and qRT-PCRMost samples from patients at diagnosis were collected before
any treatment but 9 had been treated with hydroxyurea (HU) for
2–6 days prior to sample collection. Cells from PB of CML
patients and HD were obtained collecting the buffy coat layer of
cells from the whole blood and lysing the residual red cells. Gr-
MDSCs were obtained from freshly isolated PBMNCs as
described above. Cell purity was determined by flow cytometry
and was .90%.
After RNA extraction and reverse transcription, Arg1 mRNA
expression was assessed by TaqMan Gene Expression, Applied
Biosystem and quantified using a fluorescence-based real-time
detection method by 7900HT Fast Start (Applied Biosystem). For
each patient, the relative expression level of Arg1 mRNA was
normalized using ABL and GAPDH as invariant controls.
ELISA for Arg1By using a specific ELISA test, according to the manufacturer’s
recommendations, we measured Arg1 protein in HD (n = 10) and
CML sera at diagnosis (n = 15) and followed during IM therapy
(n = 10) (BioVendor Laboratory Medicine, Candler, NC, USA).
Absorbance at 450 nm was evaluated by a spectophotometer and
Arg1 concentration was calculated on the basis of standard curve.
Isolation of polymorphonuclear leukocytes (PMNs)To isolate HD and CML PMNs, the pellet obtained after
centrifugation of PB on Ficoll, containing erythrocytes and
polymorphonuclear leukocytes (PMNs), was subjected to hypo-
tonic lysis (155 mM NH4 Cl, 10 mM KHCO3, 0.1 mM EDTA,
pH 7.4) for 15 minutes on ice [23]. After washing, cell purity and
viability were checked by flow cytometry and microscopy. PMNs
showed a purity and viability of more than 90%.
Western blot analysisWestern Blot Analysis was performed according to the
manufacturer’s recommendations [24]. The antibody directed
against the human Arg1 was obtained from Santa Cruz
Biothecnology (CA, USA). An anti-mouse antibody against actin
(Sigma, St. Louis, MO, USA) was used to assess equal loading.
The blots were scanned, and the optical density of the bands was
measured using Scion Image software (New York, NY).
Arginase enzymatic assayArginase activity was measured in cell lysates as follows. Briefly,
Gr-MDSCs and PMNs from fresh blood were lysed with 0.5%
MDSCs and PMNs in Chronic Myeloid Leukemia
PLOS ONE | www.plosone.org 2 July 2014 | Volume 9 | Issue 7 | e101848
MDSCs and PMNs in Chronic Myeloid Leukemia
PLOS ONE | www.plosone.org 3 July 2014 | Volume 9 | Issue 7 | e101848

Triton X-100, 25 mM Tris (tris(hydroxymethyl)aminomethane)–
HCl, pH 7.5; 10 mM MnCl2 was added to this lysate, and the
enzyme was activated by heating for 10 minutes at 56uC. Arginine
hydrolysis was conducted by incubating the lysate with 0.5 M L -
arginine (pH 9.7) at 37uC for 1 h. The reaction was stopped with
900 ml of H2SO4 (96%)/H3PO4 (85%)/H2O (1/3/7, v/v/v). The
urea concentration was measured at 540 nm after the addition of
a-isonitrosopropiophenone followed by heating at 95uC for
30 min. One unit of enzyme activity is defined as the amount of
enzyme that catalyzes the formation of 1 mMol of urea in 1 h at
37uC.
T cell functional assaysT cells were isolated by Ficoll-Hypaque density-gradient
centrifugation and purified using T-cells enrichment columns
(R&D Systems) with a purity and viability of more than 90% as
tested by flow cytometry. Cells were stimulated with 5 mg/mL
phytohemagglutinin (PHA; Sigma) per well and incubated for
72 hours post-stimulation. Cells were cultured in RPMI-1640
medium with 10% FBS and 1% penicillin-streptomycin. Sera from
CML patients at diagnosis and HD at different concentration
(10%, 20%) [25] with or without 10 mM Nor.NOHA (Sigma
Aldrich) were added at the time of plating and PHA addition.
In functional assays, T cell proliferation was measured by
carboxyfluorescein succinimidyl ester (CFSE) staining. Prolifera-
tion rate of lymphocytes was determined by assessing the reduction
of the intensity of the fluorescent cell permeable dye CFSE, which
is retained in the cytosol through cellular esterases and equally
distributed into both daughter cells during mitosis. For cell
labeling, 56105 lymphocytes were incubated at 37uC for 20 min
in 1 ml PBS containing 1 mM CFSE (BD Pharmingen). Cells were
then stimulated with 5 mg/mL PHA and incubated for 72 hours
prior to flow cytometry. T cell proliferation was measured by
CFSE dilution.
The suppressive function of CML Gr-MDSCs and PMNs was
measured by their ability to inhibit the proliferation of HD T cells
in the following Suppression Assay: CFSE-labeled T cells were
seeded in 96-well plates with CML Gr-MDScs or PMNs at 4:1
ratio [26]. T cell proliferation was induced by PHA stimulation
[27]. Controls included a positive T cell proliferation control (T
cells plus PHA) and a negative one (T cells only). Every condition
was analyzed by flow cytometry for T cell proliferation after three
days.
Separation of Gr-MDSCs from frozen samples causes a
significant decrease in MDSCs viability and function [28];
therefore, all above described functional assays were performed
using fresh blood.
Statistical analysisStatistical analyses were made with Prism Software (Graphpad
Software Inc., La Jolla, CA, USA). The data is expressed as mean
6 SEM. Statistical analysis was carried out by paired Student’s t-
test or ANOVA test. A p value ,0.05 was considered to indicate a
statistically significant difference between experimental and
control groups.
Results
Gr- and Mo-MDSCs are increased in CML patients atdiagnosis
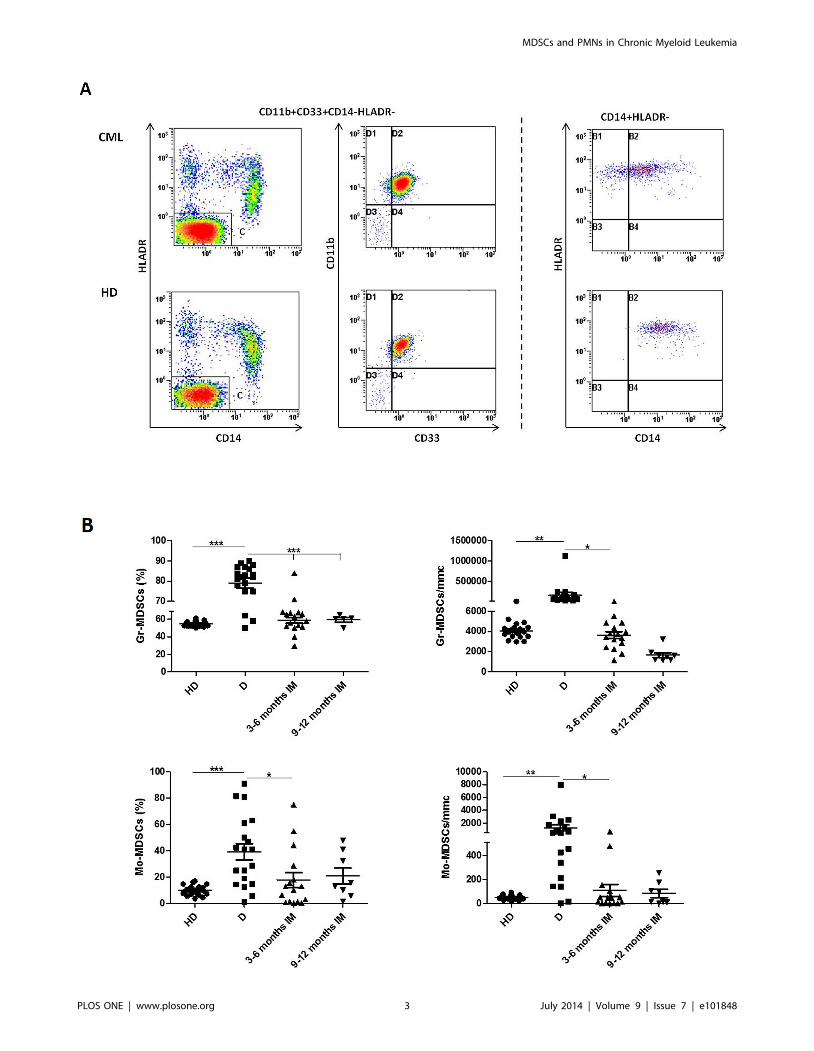
The proportions of CD11b+CD33+CD14-HLADR- (Gr-
MDSCs) and CD14+HLADR- (Mo-MDSCs) cells in the PB of
CML patients at diagnosis and during IM therapy were evaluated
using flow cytometry. Representative flow cytometry results for
one patient and one HD are shown in fig.1A. The percentage of
Gr-MDSCs and Mo-MDSCs cells was significantly elevated in
patients at diagnosis compared to HD (79,1610% vs 54,663% for
Gr-MDSCs, p,0.0001 and 37,3617,2% vs 9,863,8% for Mo-
MDSCs, p,0.001) (fig.1B). The results expressed as absolute
number showed also a significant difference between the two
groups (740716977 vs 40716291 for Gr-MDSCs and 12806872
vs 57618 for Mo-MDSCs; p,0.001). Both Gr-MDSCs and Mo-
MDSCs subpopulations, measured as percentage and as absolute
number, returned to normal levels during treatment with IM
(fig 1B). MDSCs count on BM samples did not show differences
with the corresponding PB (data not shown). Clinical data of
patients enrolled at diagnosis are reported in table 1. The
percentage of MDSCs did not correlate neither with age, nor with
leukocytosis or Sokal risk. In addition, no correlation was observed
between MDSCs and the response to IM. Our set comprises only
3 patients who were considered resistant to IM and they showed
very high levels of MDSCs, although not the highest observed.
In order to evaluate whether MDSCs belong to the tumor clone
or normal residual cells, in 3 patients we analyzed BCR/ABL
expression in both CD11b+CD33+CD14-HLADR- and CD14+HLADR- subpopulation cells and all samples showed the
oncoprotein expression in both the two subsets (data not shown).
Since it has been reported that MDSCs may promote T-reg
expansion, we also evaluate this lymphoid subpopulation and
found that in these CML patients T-reg was significantly increased
at diagnosis in respect to HD both as percentage (9,362% vs
5,960,8%; p,0.0001) and absolute number (111,7651% vs
70,6625,4%; p,0.001) and returned to normal levels during
therapy with IM (fig.2A). In addition, at diagnosis, T-reg cells
correlated with Gr-MDSCs (r = 0,6228; p = 0.01, fig.2B), but not
with Mo-MDSCs (r = 0,3379; p = 0.14).
CML patients have increased Arg1 expression andincreased levels of circulating protein
The expression of the MDSCs associated molecule, Arg1, was
assessed in leukocytes from HD and CML patients at diagnosis
and during IM therapy. The relative expression of Arg1 in CML
samples was 200 fold higher than HD (p,0.0001) (fig.3A). IM
therapy reduced Arg1 expression to normal levels (diagnosis vs
therapy: p,0.0001).
Since high Arg1 expression is characteristic for Gr-MDSCs, we
investigated the mRNA levels in Gr-MDSCs obtained from freshly
isolated PBMNCs by magnetic separation. Analyzing this MDSCs
subpopulation in CML patients at diagnosis (n = 8) and HD
(n = 4), we observed an increase of expression of about 4,3 fold (p,
0.001) in CML Gr-MDSCs compared to HD (fig.3B).
Using an ELISA test, we measured the enzyme concentration in
sera from HD and CML patients. The differences in Arg1
concentration between HD and CML patients at diagnosis was
Figure 1. Flow cytometry analysis of circulating Gr-MDSCs and Mo-MDSCs cells in PB from HD and CML patients at diagnosis (D)and during IM therapy. A: Representative data from one HD and one CML at diagnosis. Flow cytometry analysis was performed with gates set oneither CD11b+CD33+CD14-HLADR- or CD14+HLADR-cells populations. B: Figures show the quantitative data for Gr-MDSCs and Mo-MDSCs. Resultsare expressed either as percentage or absolute number. Statistically significant differences between groups are indicated by P-value in the figures.doi:10.1371/journal.pone.0101848.g001
MDSCs and PMNs in Chronic Myeloid Leukemia
PLOS ONE | www.plosone.org 4 July 2014 | Volume 9 | Issue 7 | e101848

Ta
ble
1.
Clin
ical
char
acte
rist
ics
of
CM
Lp
atie
nts
recr
uit
ed
atd
iag
no
sis.
Pa
tie
nts
Ge
nd
er
1A
ge
BC
R/A
BL
tra
nsc
rip
tle
ve
lsW
BC
(10
3/m
L)
HG
B(g
/dL
)P
LT
(10
3/m
L)
LD
H(m
g/d
L)
Liv
er
(cm
)2S
ple
en
(cm
)2S
ok
al
risk
gro
up
Gr-
MD
SC
s(%
)M
o-M
DS
C(%
)
1M
59
25
,14
75
,61
5,3
20
-0
0lo
w8
71
8,9
2F
48
81
,88
67
,14
8,1
45
81
04
32
14
hig
h8
64
1
3F
71
48
,16
70
,59
,23
38
22
30
--
inte
rme
dia
te8
94
6,8
4M
70
34
9,5
17
1,2
13
,53
70
71
50
0in
term
ed
iate
79
81
,2
5F
66
12
6,7
32
7,6
12
,92
94
88
82
3in
term
ed
iate
82
12
,4
6M
38
65
,61
28
,81
3,6
23
2-
00
low
83
,42
8,5
7M
21
12
6,5
11
44
14
,21
07
12
47
06
low
83
,78
1,6
8M
53
14
2,7
82
4,8
16
,63
11
28
80
3lo
w8
36
3
9M
48
40
,33
25
9,9
9,9
35
01
07
47
14
inte
rme
dia
te9
04
1
10
F6
42
8,2
15
51
0,6
53
11
14
70
2in
term
ed
iate
58
,31
11
F5
71
22
,97
15
,31
1,4
27
31
12
42
1lo
w8
86
1
12
M3
65
6,2
41
36
,61
0,8
20
81
35
27
8lo
w8
74
2,4
13
M5
21
4,8
94
61
0,2
41
81
82
00
2lo
w7
82
5
14
F5
81
50
,04
12
21
0,7
36
11
69
30
3in
t7
55
0
15
F6
51
91
,66
87
15
,32
52
68
80
0lo
w5
09
1,2
16
M7
27
1,9
82
11
,91
31
68
34
52
4in
t7
51
4,4
17
F7
84
8,2
25
8,5
11
,76
51
-0
1h
igh
64
5,4
18
M3
71
53
,59
10
4,3
12
,83
44
16
35
00
low
82
,52
,8
19
M6
96
28
51
2,2
32
02
60
00
low
83
25
Ab
bre
viat
ion
s:F,
Fem
ale
;M
,m
ale
;W
BC
,w
hit
eb
loo
dce
lls;
HG
B,
he
mo
glo
bin
;P
LT,
pla
tele
ts;
LDH
,la
ctat
ed
eh
ydro
ge
nas
e.
PB
:p
eri
ph
era
lb
loo
d.
Live
ran
dsp
lee
n,
cmb
elo
wth
eco
stal
mar
gin
.1A
ge
atd
iag
no
sis.
do
i:10
.13
71
/jo
urn
al.p
on
e.0
10
18
48
.t0
01
MDSCs and PMNs in Chronic Myeloid Leukemia
PLOS ONE | www.plosone.org 5 July 2014 | Volume 9 | Issue 7 | e101848

statistically significant (64637,5 vs 243,9664,3 ng/ml; p,0.0001)
(fig.3C). After treatment, Arg1 level decreased at 3 and 12 months
of IM therapy but it remained higher than HD.
We also found a significant correlation (r = 0,61; p = 0.02)
between the percentage of Gr-MDSCs and Arg1 protein levels in
the serum of patients at diagnosis (n = 11 patients) (fig.3D).
Purified CML Gr-MDSCs and PMNs areimmunosuppressive cells
Arg1 appears to be a major mediator of T cell suppression in
both Gr-MDSCs and PMNs in cancer patients [27,29,30].
Therefore, especially in CML, it is important to compare Gr-
MDSCs with autologous PMNs.
Evaluating Arg1 expression and activity in 8 patients at
diagnosis, the protein levels resulted significantly higher in CML
PMNs in respect to autologous Gr-MDSCs (p,0.001; fig.4A) so as
enzymatic activity (47,2615,3 U/L in CML Gr-MDSCs vs
81,8619,9 U/L in CML PMNs; p,0.001) (fig.4B).
To verify whether both Gr-MDSCs and PMNs in CML patients
could be immunosuppressive cells, we tested their ability to inhibit
T cells proliferation. Cocultures were prepared using purified Gr-
MDSCs and PMNs from HD and patients at diagnosis and CFSE-
labeled T cells from HD. After 72 h from mitogen stimulation, the
proliferation of T cells was inhibited of 13,861,5% and
20,563,5% respectively with CML Gr-MDSCs and CML PMNs
compared with control (HD T cells plus PHA) (p,0.05 and p,
0.001) while no suppressive effect on T cells was observed after
incubation with HD Gr-MDSCs or PMNs (fig.4C).
CML serum has immunosuppressive activitySince CML patients at diagnosis have high levels of Arg1 in
serum, subsequent experiments were designed to further under-
stand whether or not circulating protein exerts immunosuppressive
activity with CML MDSCs and PMNs. First we evaluated the
effect of CML serum at different concentration on HD T cell
proliferation. Since the major inhibitory effect was obtained with
20% serum (data not shown), only this concentration is reported in
fig 5. After 72 h from mitogen stimulation and incubation with
HD or CML serum, the percentage of proliferation of CFSE-
labeled T cells was inhibited of 23,667,4% with CML serum
compared to positive control (HD T cells plus PHA) (p,0.05).
Most importantly, this inhibitory effect was lost by the addition of
Nor.NOHA (an Arg1 inhibitor) (p,0.05).
Figure 2. Frequency of circulating T-reg cells in PB from HD and CML patients at diagnosis and during IM therapy. A: Figures showthe quantitative data expressed either as percentage or absolute number. Cytometric analysis was performed with gates set on CD4+ cells and theresults presented as the percentage of CD25+Foxp3+cells in CD4+ cells. Statistically significant differences between groups are indicated by P-valuein the figures. B: Correlation of the percentages of Gr-MDSCs cells and T-reg in PB from CML patients at diagnosis.doi:10.1371/journal.pone.0101848.g002
MDSCs and PMNs in Chronic Myeloid Leukemia
PLOS ONE | www.plosone.org 6 July 2014 | Volume 9 | Issue 7 | e101848

Discussion
In CML, like in other malignancies, the immune surveillance
against cancer is impaired, resulting in immune escape of the
malignant cells. Immunoinhibitory mechanisms such as Treg has
been reported [31] and tumor cells display ligands for the PD-
1inhibitory receptor [32]. MDSCs have been shown to play a
central role in anti-tumor immune response in a variety of cancers
including hematological malignances [33]. There are very limited
data regarding MDSCs in CML. Christiansson et al. showed an
increase of the Gr-MDSCs subset in CML patients that was
limited to Sokal high risk patients. Since in our center most Sokal
high risk patients are treated with second generation TKIs, they
were not included in this study. Therefore our series comprises
only 2 patients belonging to this high risk group and we cannot
verify if there is a correlation between the amount of Gr-MDSC
and Sokal risk. In addition, differently from our study, in
Christiansson’s paper cryopreserved samples were analyzed and
functional experiments were not provided [32].
In the present study, evaluating the percentage of MDSCs cells
in CML patients defined as CD11b+CD33+CD14-HLADR- (Gr-
MDSCs) and CD14+HLADR- (Mo-MDSCs), we found that both
were significantly higher at diagnosis compared to HD and
decreased to normal levels after IM therapy. Since MDSCs drive
the development of T-reg [21,22,34], in some patients we also
investigated the levels of circulating T-reg cells. As it has been
reported [35,36], in CML patients T-reg resulted significantly
increased in respect to HD and we found that they directly
correlated with Gr-MDSCs. Similar to Gr-MDSCs, the percent-
age of T-reg cells decreased to the HD levels after TKI therapy,
confirming the correlation with the amount of granulocytic
MDSCs. MDSCs expansion in CML patients may explain the
already reported defects of NK from CML patients [37] and
dysfunction in antigen processing and migration of CML dendritic
cells [38] since the cross-talk between MDSCs and these cells
impairs their function [22].
MDSCs are characterized as immature myeloid cells (IMCs)
and since CML cells mostly consist of IMCs, we hypothesized that
the tumor cells themselves might be MDSCs. Analyzing the
oncoprotein expression by real time PCR, both Gr-MDSCs and
Mo-MDSCs expressed BCR/ABL (data not shown). Therefore,
some tumor cells may be accounted for as MDSCs.
Our data also show that CML cells are characterized by high
expression of Arg1 and CML Gr-MDSCs expressed higher levels
Figure 3. Increased Arg1 expression in CML patients at diagnosis. A: Arg1 mRNA expression in HD and CML patients at diagnosis (D) andduring IM therapy assessed by real time PCR. Healthy donors (HD) vs D and D vs therapy: p,0.0001. B: Levels of Arg1 mRNA in Gr-MDSCs from HDand CML patients at diagnosis. The expression resulted higher in CML Gr-MDSCs in respect to HD (calculated value of 2‘-DDCt in HD was 1; p,0.001).C: Arg1 concentration measured by ELISA. Circulating protein was increased in CML patients at diagnosis compared to HD (p,0.0001) and decreasedduring IM therapy (D vs 3–6 and 12 months: p,0.001 and p,0.05 respectively). D: Correlation of the percentage of Gr-MDSCs cells in PB and Arg1levels in serum of CML patients at diagnosis.doi:10.1371/journal.pone.0101848.g003
MDSCs and PMNs in Chronic Myeloid Leukemia
PLOS ONE | www.plosone.org 7 July 2014 | Volume 9 | Issue 7 | e101848

of Arg1 mRNA in respect to HD. In addition, analyzing Arg1 in
sera of CML patients, the levels of circulating protein resulted
significantly increased at diagnosis in respect with HD and
decreased during IM therapy.
Since Arg1 appears to be the major mediator of T cell
suppression by both Gr-MDSCs and PMNs in cancer patients
[29,30,39,40], we analyzed Arg1 expression and activity in these
two myeloid subsets comparing CML Gr-MDSCs to autologous
PMNs. Both Arg1 protein and enzyme activity was higher in CML
PMNs than Gr-MDSCs, demonstrating, for the first time, a critical
role of CML PMNs on the tumor microenvironment with a
potential immunosuppressive activity.
To demonstrate this suppressive capacity of CML PMNs and
verify whether the population of cells with the phenotype of Gr-
MDSCs that accumulates in PB of CML patients could be
functionally defined as MDSCs, we determined their ability to
inhibit T cell response. Both CML Gr-MDSCs and CML PMNs
mediated a significantly suppression of T cell proliferation; on the
contrary, no inhibitory effect was observed by Gr-MDSCs and
PMNs from HD.
Since CML patients showed high levels of circulating Arg1, we
also investigated whether the serum from patients at diagnosis has
immunoinhibitory effects. We found a reduction of HD T cell
proliferation after exposure to CML serum, but not to HD one.
Inhibition of Arg1 by Nor.NOHA reversed this suppressive effect.
This current work also shows for the first time a significant
overlap between Gr-MDSCs and PMNs in CML patients. In fact,
even if Gr-MDSCs and PMNs are considered phenotypically and
functionally different myeloid subsets, they share many common
features that may lead to a critical evaluation of their relationship.
In first, Gr-MDSCs show similar functions to PMNs promoting
immunosuppression, angiogenesis [41,42], invasion and metastasis
[43,44]. As PMNs [27], MDSCs acquire strong immunosuppres-
sive activity after activation [45]. In addition, in contrast to murine
Gr-MDSCs, the human Gr-MDSCs are identified by a set of
antigens (CD11b, CD14, CD15, CD33, CD66b and HLADR)
Figure 4. Gr-MDSCs and PMNs exert immunosuppressive activity in CML patients. Arg1 expression (A) and activity (B) were significantlyincreased in CML PMNs more than autologous Gr-MDSCs isolated from patients at diagnosis. For analysis of western blot the optical density of thebands was measured using Scion Image software. Results represent the means of three independent experiments; error bars denote SEM. (C) Thepercentage of T cell proliferation was significantly reduced when T cells were cultured with CML Gr-MDSCs (p,0.05) and CML PMNs (p,0.001), whileGr-MDSCs and PMNs from HD did not exert any suppressive activity. Mean frequency of CD3+ CFSE dim cells 6 SEM from four independentexperiments in duplicate is shown.doi:10.1371/journal.pone.0101848.g004
MDSCs and PMNs in Chronic Myeloid Leukemia
PLOS ONE | www.plosone.org 8 July 2014 | Volume 9 | Issue 7 | e101848

which are well established markers for PMNs [46,47]. Therefore,
the significant overlap between the two myeloid cell populations
concerns both their function and their immunophenotype. In
contrast to conventional PMNs, Gr-MDSCs are purified from the
mononuclear cell fraction in density gradient of peripheral blood
[48]. Despite the low percentage of CD11b+CD33+ CD14-
HLADR- CD34+ cells (immature myeloid cells, IMCs), CML Gr-
MDSCs are more immature compared to autologous PMNs and
showed lower levels of expression of CD11b, CD15 and CD16
and lower Arg1 expression and activity (data not shown). A large
number of published works are consistent with the hypothesis that
tumor associated PMNs and Gr-MDSCs represent functional
states of cells originating from the same cell type [48].
Nearly half of CML patients treated with imatinib who have
reached durable complete molecular response are able to stop the
treatment without relapse although they have a minimal amount
of residual leukemia cells left [49,50]. This implies that the
immune system is able to restrain the tumor cell expansion.
However, there is a lack of specific prognostic factors which could
determine the restarting of the leukemic growth. There is
increasing evidence suggesting that NK-cells are important in
controlling the leukemic cells: increased NK-cell counts seem to
correlate with the successful imatinib discontinuation [51]. It could
be of interest the monitoring of MDSCs in patients who have
discontinued TKI treatment in order to see if their increase could
correlate with the restarting of the leukemic growth.
In conclusion our results suggest a strong potential immune
escape mechanism in CML patients created by MDSCs and
PMNs which control the anti-tumor reactive T cells. In addition,
MDSCs should be monitored in imatinib discontinuation trials to
understand their importance in relapsing patients.
Author Contributions
Conceived and designed the experiments: CG DT AR FD. Performed the
experiments: CG NP DT PL IB PV FD. Analyzed the data: CG DT FD
GAP AC IB PV. Contributed reagents/materials/analysis tools: IB FS
GAP AC PV. Contributed to the writing of the manuscript: CG DT FD
PV.
References
1. Davies J (2011) First-line therapy for CML: nilotinib comes of age. Lancet Oncol
12: 826–827.
2. Hochhaus A, O9Brien SG, Guilhot F, Druker BJ, Branford S, et al. (2009) Six-
year follow-up of patients receiving imatinib for the first-line treatment of
chronic myeloid leukemia. Leukemia 23: 1054–1061.
3. Mahon FX, Rea D, Guilhot J, Guilhot F, Huguet F, et al. (2010) Discontinuation
of imatinib in patients with chronic myeloid leukaemia who have maintained
complete molecular remission for at least 2 years: the prospective, multicentre
Stop Imatinib (STIM) trial. Lancet Oncol 11: 1029–1035.
4. Bose S, Deininger M, Gora-Tybor J, Goldman JM, Melo JV (1998) The
presence of typical and atypical BCR-ABL fusion genes in leukocytes of normal
individuals: biologic significance and implications for the assessment of minimal
residual disease. Blood 92: 3362–3367.
5. Simonsson B, Hjorth-Hansen H, Bjerrum OW, Porkka K (2011) Interferon
alpha for treatment of chronic myeloid leukemia. Curr Drug Targets 12: 420–
428.
6. Preudhomme C, Guilhot J, Nicolini FE, Guerci-Bresler A, Rigal-Huguet F, et al.
(2010) Imatinib plus peginterferon alfa-2a in chronic myeloid leukemia.
N Engl J Med 363: 2511–2521.
7. Muller L, Pawelec G (2002) Chronic phase CML patients possess T cells capable
of recognising autologous tumour cells. Leuk Lymphoma 43: 943–951.
8. Bertazzoli C, Marchesi E, Passoni L, Barni R, Ravagnani F, et al. (2000)
Differential recognition of a BCR/ABL peptide by lymphocytes from normal
donors and chronic myeloid leukemia patients. Clin Cancer Res 6: 1931–1935.
9. Chen X, Woiciechowsky A, Raffegerst S, Schendel D, Kolb HJ, et al. (2000)
Impaired expression of the CD3-zeta chain in peripheral blood T cells of
patients with chronic myeloid leukaemia results in an increased susceptibility to
apoptosis. Br J Haematol 111: 817–825.
10. Pawelec G, Rehbein A, Schlotz E, da Silva P (1996) Cellular immune responses
to autologous chronic myelogenous leukaemia cells in vitro. Cancer Immunol
Immunother 42: 193–199.
11. Moore KW, de Waal Malefyt R, Coffman RL, O9Garra A (2001) Interleukin-10
and the interleukin-10 receptor. Annu Rev Immunol 19: 683–765.
12. Filipazzi P, Huber V, Rivoltini L (2011) Phenotype, function and clinical
implications of myeloid-derived suppressor cells in cancer patients. Cancer
Immunol Immunother 61: 255–263.
13. Gabrilovich DI, Nagaraj S (2009) Myeloid-derived suppressor cells as regulators
of the immune system. Nat Rev Immunol 9: 162–174.
14. Serafini P, Borrello I, Bronte V (2006) Myeloid suppressor cells in cancer:
recruitment, phenotype, properties, and mechanisms of immune suppression.
Semin Cancer Biol 16: 53–65.
15. Movahedi K, Guilliams M, Van den Bossche J, Van den Bergh R, Gysemans C,
et al. (2008) Identification of discrete tumor-induced myeloid-derived suppressor
cell subpopulations with distinct T cell-suppressive activity. Blood 111: 4233–
4244.
16. Poschke I, Kiessling R (2012) On the armament and appearances of human
myeloid-derived suppressor cells. Clin Immunol 144: 250-268.
17. Chikamatsu K, Sakakura K, Toyoda M, Takahashi K, Yamamoto T, et al.
(2012) Immunosuppressive activity of CD14+ HLA-DR- cells in squamous cell
carcinoma of the head and neck. Cancer Sci 103: 976–983.
18. Thakur A, Schalk D, Sarkar SH, Al-Khadimi Z, Sarkar FH, et al. (2011) A Th1
cytokine-enriched microenvironment enhances tumor killing by activated T cells
armed with bispecific antibodies and inhibits the development of myeloid-
derived suppressor cells. Cancer Immunol Immunother 61: 497–509.
19. Van Rompaey N, Le Moine A (2011) Myeloid-derived suppressor cells:
characterization and expansion in models of endotoxemia and transplantation.
Methods Mol Biol 677: 169–180.
20. Bronte V, Serafini P, Mazzoni A, Segal DM, Zanovello P (2003) L-arginine
metabolism in myeloid cells controls T-lymphocyte functions. Trends Immunol
24: 302–306.
21. Huang B, Pan PY, Li Q, Sato AI, Levy DE, et al. (2006) Gr-1+CD115+immature myeloid suppressor cells mediate the development of tumor-induced T
regulatory cells and T-cell anergy in tumor-bearing host. Cancer Res 66: 1123–
1131.
22. Ostrand-Rosenberg S, Sinha P, Beury DW, Clements VK (2012) Cross-talk
between myeloid-derived suppressor cells (MDSC), macrophages, and dendritic
cells enhances tumor-induced immune suppression. Semin Cancer Biol 22: 275–
281.
23. Munder M, Mollinedo F, Calafat J, Canchado J, Gil-Lamaignere C, et al. (2005)
Arginase I is constitutively expressed in human granulocytes and participates in
fungicidal activity. Blood 105: 2549–2556.
24. Tibullo D, Barbagallo I, Giallongo C, La Cava P, Parrinello N, et al. (2012)
Nuclear translocation of heme oxygenase-1 confers resistance to Imatinib in
chronic myeloid leukemia cells. Curr Pharm Des.
25. Zitta K, Meybohm P, Bein B, Heinrich C, Renner J, et al. (2012) Serum from
patients undergoing remote ischemic preconditioning protects cultured human
Figure 5. CML serum has immunosuppressive activity linked toArg1. 8 CML sera were analyzed on 4 different HD T cells with areduction of T cell proliferation (p,0.05).The effect was lost afteraddition of Nor.NOHA. Mean frequency of CD3+ CFSE dim cells 6 SEM isshown.doi:10.1371/journal.pone.0101848.g005
MDSCs and PMNs in Chronic Myeloid Leukemia
PLOS ONE | www.plosone.org 9 July 2014 | Volume 9 | Issue 7 | e101848

intestinal cells from hypoxia-induced damage: involvement of matrixmetallo-
proteinase-2 and -9. Mol Med 18: 29–37.
26. Lechner MG, Megiel C, Russell SM, Bingham B, Arger N, et al. (2011)
Functional characterization of human Cd33+ and Cd11b+ myeloid-derived
suppressor cell subsets induced from peripheral blood mononuclear cells co-
cultured with a diverse set of human tumor cell lines. J Transl Med 9: 90.
27. Hock BD, Taylor KG, Cross NB, Kettle AJ, Hampton MB, et al. (2012) Effect of
activated human polymorphonuclear leucocytes on T lymphocyte proliferation
and viability. Immunology 137: 249–258.
28. Kotsakis A, Harasymczuk M, Schilling B, Georgoulias V, Argiris A, et al. (2012)
Myeloid-derived suppressor cell measurements in fresh and cryopreserved blood
samples. J Immunol Methods 381: 14–22.
29. Bronte V, Zanovello P (2005) Regulation of immune responses by L-arginine
metabolism. Nat Rev Immunol 5: 641–654.
30. Rotondo R, Bertolotto M, Barisione G, Astigiano S, Mandruzzato S, et al.
(2011) Exocytosis of azurophil and arginase 1-containing granules by activated
polymorphonuclear neutrophils is required to inhibit T lymphocyte prolifera-
tion. J Leukoc Biol 89: 721–727.
31. Bachy E, Bernaud J, Roy P, Rigal D, Nicolini FE (2011) Quantitative and
functional analyses of CD4(+) CD25(+) FoxP3(+) regulatory T cells in chronic
phase chronic myeloid leukaemia patients at diagnosis and on imatinib mesylate.
Br J Haematol 153: 139–143.
32. Christiansson L, Soderlund S, Svensson E, Mustjoki S, Bengtsson M, et al.
(2013) Increased Level of Myeloid-Derived Suppressor Cells, Programmed
Death Receptor Ligand 1/Programmed Death Receptor 1, and Soluble CD25
in Sokal High Risk Chronic Myeloid Leukemia. PLoS One 8: e55818.
33. Chen X, Liu S, Wang L, Zhang W, Ji Y, et al. (2008) Clinical significance of B7-
H1 (PD-L1) expression in human acute leukemia. Cancer Biol Ther 7: 622–627.
34. Pan PY, Ma G, Weber KJ, Ozao-Choy J, Wang G, et al. (2010) Immune
stimulatory receptor CD40 is required for T-cell suppression and T regulatory
cell activation mediated by myeloid-derived suppressor cells in cancer. Cancer
Res 70: 99–108.
35. Rojas JM, Wang L, Owen S, Knight K, Watmough SJ, et al. (2010) Naturally
occurring CD4+ CD25+ FOXP3+ T-regulatory cells are increased in chronic
myeloid leukemia patients not in complete cytogenetic remission and can be
immunosuppressive. Exp Hematol 38: 1209–1218.
36. Hus I, Tabarkiewicz J, Lewandowska M, Wasiak M, Wdowiak P, et al. (2011)
Evaluation of monocyte-derived dendritic cells, T regulatory and Th17 cells in
chronic myeloid leukemia patients treated with tyrosine kinase inhibitors. Folia
Histochem Cytobiol 49: 153–160.
37. Mellqvist UH, Hansson M, Brune M, Dahlgren C, Hermodsson S, et al. (2000)
Natural killer cell dysfunction and apoptosis induced by chronic myelogenous
leukemia cells: role of reactive oxygen species and regulation by histamine. Blood
96: 1961–1968.
38. Dong R, Cwynarski K, Entwistle A, Marelli-Berg F, Dazzi F, et al. (2003)
Dendritic cells from CML patients have altered actin organization, reducedantigen processing, and impaired migration. Blood 101: 3560–3567.
39. Munder M, Schneider H, Luckner C, Giese T, Langhans CD, et al. (2006)
Suppression of T-cell functions by human granulocyte arginase. Blood 108:1627–1634.
40. Rotondo R, Barisione G, Mastracci L, Grossi F, Orengo AM, et al. (2009) IL-8induces exocytosis of arginase 1 by neutrophil polymorphonuclears in nonsmall
cell lung cancer. Int J Cancer 125: 887–893.
41. Boelte KC, Gordy LE, Joyce S, Thompson MA, Yang L, et al. (2011) Rgs2mediates pro-angiogenic function of myeloid derived suppressor cells in the
tumor microenvironment via upregulation of MCP-1. PLoS One 6: e18534.42. Finke J, Ko J, Rini B, Rayman P, Ireland J, et al. (2011) MDSC as a mechanism
of tumor escape from sunitinib mediated anti-angiogenic therapy. IntImmunopharmacol 11: 856–861.
43. Hiratsuka S, Watanabe A, Aburatani H, Maru Y (2006) Tumour-mediated
upregulation of chemoattractants and recruitment of myeloid cells predeter-mines lung metastasis. Nat Cell Biol 8: 1369–1375.
44. Ichikawa M, Williams R, Wang L, Vogl T, Srikrishna G (2011) S100A8/A9activate key genes and pathways in colon tumor progression. Mol Cancer Res 9:
133–148.
45. Condamine T, Gabrilovich DI (2011) Molecular mechanisms regulatingmyeloid-derived suppressor cell differentiation and function. Trends Immunol
32: 19–25.46. Montero AJ, Diaz-Montero CM, Kyriakopoulos CE, Bronte V, Mandruzzato S
(2012) Myeloid-derived suppressor cells in cancer patients: a clinical perspective.J Immunother 35: 107–115.
47. Dumitru CA, Moses K, Trellakis S, Lang S, Brandau S (2012) Neutrophils and
granulocytic myeloid-derived suppressor cells: immunophenotyping, cell biologyand clinical relevance in human oncology. Cancer Immunol Immunother 61:
1155–1167.48. Brandau S, Moses K, Lang S (2013) The kinship of neutrophils and granulocytic
myeloid-derived suppressor cells in cancer: cousins, siblings or twins? Semin
Cancer Biol 23: 171–182.49. Mahon FX, Rea D, Guilhot J, Guilhot F, Huguet F, et al. (2010) Discontinuation
of imatinib in patients with chronic myeloid leukaemia who have maintainedcomplete molecular remission for at least 2 years: the prospective, multicentre
Stop Imatinib (STIM) trial. Lancet Oncol 11: 1029–1035.50. Ross DM, Branford S, Seymour JF, Schwarer AP, Arthur C, et al. (2013) Safety
and efficacy of imatinib cessation for CML patients with stable undetectable
minimal residual disease: results from the TWISTER study. Blood 122: 515–522.
51. Ohyashiki K, Katagiri S, Tauchi T, Ohyashiki JH, Maeda Y, et al. (2012)Increased natural killer cells and decreased CD3(+)CD8(+)CD62L(+) T cells in
CML patients who sustained complete molecular remission after discontinuation
of imatinib. Br J Haematol 157: 254–256.
MDSCs and PMNs in Chronic Myeloid Leukemia
PLOS ONE | www.plosone.org 10 July 2014 | Volume 9 | Issue 7 | e101848
Copyright © 2022 FDOKUMEN