
EIA/EMP REPORT - Environmental Clearance
285
EIA/EMP REPORT River Sand/Bajri Mine (ML Area of 4280.00 ha) Tehsil – Marwar Jn., District - Pali Rajasthan January 2015 Project Proponent: M/s Kuber Associates R/o C-57, Hanumaan Nagar, Khatipura, Jaipur, Rajasthan. EIA Consultant: EQMS INDIA PVT. LTD. INDIA 304-305, 3 rd Floor, Plot No. 16, Rishabh Corporate Tower, Community Centre, Karkardooma, Delhi – 110092 Phone: 011-30003200, 30003219; Fax: 011-22374775 Website: www.eqmsindia.com ; E-mail – [email protected]
-
Upload
khangminh22 -
Category
Documents
-
view
0 -
download
0
Transcript of EIA/EMP REPORT - Environmental Clearance

EIA/EMP REPORT
River Sand/Bajri Mine (ML Area of 4280.00 ha) Tehsil – Marwar Jn., District - Pali Rajasthan
January 2015
Project Proponent:
M/s Kuber Associates
R/o C-57, Hanumaan Nagar,
Khatipura, Jaipur, Rajasthan.
EIA Consultant:
EQMS INDIA PVT. LTD. INDIA
304-305, 3rd Floor, Plot No. 16, Rishabh Corporate Tower,
Community Centre, Karkardooma, Delhi – 110092
Phone: 011-30003200, 30003219; Fax: 011-22374775
Website: www.eqmsindia.com ; E-mail – [email protected]

EIA/EMP report of Sand/Bajri Mine (With ML Area of 4280.0 ha) Tehsil Marwar Jn., District Pali, Rajasthan
EQMS INDIA PVT. LTD. 2
Table of Contents
Executive Summary .......................................................................................................................I - X Chapter 1. Introduction ................................................................................................................. 8
1.1. Preamble ............................................................................................................................ 8 1.2. Purpose of the Report ........................................................................................................ 9 1.3. Identification of Project & Project Proponent ....................................................................... 9 1.4. Brief description of nature, size and location of the project ............................................... 10 1.5. Salient Features of the Project ......................................................................................... 10 1.6. Need for the project and its importance to the country or region ....................................... 15 1.7. Policy, Legal and Administrative Framework .................................................................... 15 1.8. Scoping Of the Project ...................................................................................................... 18 1.9. Environmental Framework of the State ............................................................................. 18 1.10. Rajasthan State Forest Policy .......................................................................................... 20 1.11. Rajasthan State Pollution Control Board (RSPCB) ........................................................... 20 1.12. Public Hearing .................................................................................................................. 20 1.13. Compliance of ToR ........................................................................................................... 21
Chapter 2. : Project Description .................................................................................................. 28 2.1. General ............................................................................................................................ 28 2.2. Type of Project ................................................................................................................. 28 2.3. Need for the Project ......................................................................................................... 29 2.4. Location, Project Boundary and Project Site Layout ......................................................... 29 2.5. Size or magnitude of Operation ........................................................................................ 29 2.6. Proposed Schedule for Implementation ............................................................................ 29 2.7. Technology and Process Description ............................................................................... 30 2.8. Project Description ........................................................................................................... 32 2.9. Site Elevation, Working Depth and Groundwater Table .................................................... 39 2.10. Terms and conditions imposed by Director of Mines and Geology, Rajasthan. ................. 44 2.11. Statutory / Necessary Approvals. ..................................................................................... 45
Chapter 3. : Description of the Environment ............................................................................... 48 3.1. Introduction ...................................................................................................................... 48 3.2. Physiography, Topography and Drainage......................................................................... 52 3.3. Geology and Hydrogeology .............................................................................................. 65 3.4. Meteorology ..................................................................................................................... 74 3.5. Air Quality ......................................................................................................................... 84 3.6. Water Quality ................................................................................................................... 89
3.7. Soil 94 3.8. Noise Environment ......................................................................................................... 100 3.9. Biological Environment ................................................................................................... 102 3.10. Socio-Economic Environment ......................................................................................... 121
Chapter 4. : Anticipated Environmental Impacts and Mitigation Measures................................ 142 4.1. Introduction .................................................................................................................... 142 4.2. Impacts on Topography and Drainage ............................................................................ 142 4.3. Land Environment .......................................................................................................... 143 4.4. Impacts on Climate ......................................................................................................... 143 4.5. Water Environment ......................................................................................................... 144 4.6. Noise and Vibration ........................................................................................................ 148 4.7. Impacts on Air Environment............................................................................................ 153 4.8. Biological Environment ................................................................................................... 161 4.9. Impact on Socio-Economic Environment ........................................................................ 164 4.10. Impact due to Transportation of Mined out material on environment ............................... 165

EIA/EMP report of Sand/Bajri Mine (With ML Area of 4280.0 ha) Tehsil Marwar Jn., District Pali, Rajasthan
EQMS INDIA PVT. LTD. 3
4.11. Impact on the carrying capacity of SH and NH due to proposed transport activities ....... 165 4.12. Impact Due To Vehicular Emission ................................................................................. 170
Chapter 5. : Analysis of Alternatives ......................................................................................... 173 5.1. General .......................................................................................................................... 173 5.2. Alternative Sites ............................................................................................................. 173 5.3. Alternative Technology ................................................................................................... 175
Chapter 6. : Environmental Monitoring Programme .................................................................. 177 6.1. General .......................................................................................................................... 177 6.2. Areas of concern ............................................................................................................ 177 6.3. Environmental Monitoring ............................................................................................... 177 6.4. Environmental Monitoring Programme ........................................................................... 177 6.5. Environment Management Group ................................................................................... 182 6.6. Environment Policy/Violations of Environment Norms/ Hierarchal System ...................... 182 6.7. Cost of Environment Monitoring Plan ............................................................................. 183
Chapter 7. : Additional Studies ................................................................................................. 185 7.1. General .......................................................................................................................... 185 7.2. Replenishment Studies ................................................................................................... 185 7.3. Risk Assessment ............................................................................................................ 202 7.4. Inundation ...................................................................................................................... 203 7.5. Disaster Due to Failure of Pit Slope ................................................................................ 204 7.6. Disaster Due to Failure of Mine Waste Dump ................................................................. 205 7.7. Disaster Due to Surface Fire .......................................................................................... 205 7.8. Disaster Management Plan ............................................................................................ 206 7.9. Occupational Health and Safety ..................................................................................... 208 7.10. R & R Plan ..................................................................................................................... 208 7.11. Social Impact Assessment ............................................................................................. 208
Chapter 8. : Project benefits ..................................................................................................... 209 8.1. General .......................................................................................................................... 209 8.2. Accelerated Development of Infrastructure and Housing Sector ..................................... 209 8.3. Employment Potential..................................................................................................... 209 8.4. State Exchequer ............................................................................................................. 209 8.5. Betterment of Trade and Commerce .............................................................................. 209 8.6. Tangible social benefits .................................................................................................. 210
Chapter 9. : Environmental Management Plan ......................................................................... 211 9.1. General .......................................................................................................................... 211 9.2. Pollution Control Measures ............................................................................................ 211 9.3. Green Belt development plan ......................................................................................... 227 9.4. Solid Waste Management .............................................................................................. 230 9.5. Occupational Health Management Plan ......................................................................... 231 9.6. Soil conservation works .................................................................................................. 235 9.7. Capital Cost of Project .................................................................................................... 236 9.8. Summary of cost of environment management plan ....................................................... 236
Chapter 10. : Environmental Management Plan ......................................................................... 238 10.1. Purpose of the Report .................................................................................................... 238 10.2. Identification of Project & Project Proponent ................................................................... 238 10.3. Project Description ......................................................................................................... 238 10.4. Description of Environment............................................................................................. 241 10.5. Anticipated Environmental Impacts and Mitigation Measures ......................................... 242 10.6. Environmental Monitoring Programme ........................................................................... 245 10.7. Additional Studies ........................................................................................................... 245 10.8. Project benefits............................................................................................................... 247 10.9. Environmental Management Plan ................................................................................... 247

EIA/EMP report of Sand/Bajri Mine (With ML Area of 4280.0 ha) Tehsil Marwar Jn., District Pali, Rajasthan
EQMS INDIA PVT. LTD. 4
10.10. Conclusion ..................................................................................................................... 247 Chapter 11. : Declaration & Disclosure of Consultants ................................................................... 0
List of Tables
Table 1.1 : Salient Features of the Project ....................................................................................... 11 Table 1.2 : Key Environmental Legislations ..................................................................................... 16 Table 1.3 : Environmental Framework of State Government ............................................................ 18 Table 1.4 : Compliance of ToR ........................................................................................................ 21 Table 2.1 : Annual Production Schedule (Million Metric Tonne) ....................................................... 30 Table 2.2 : Daily Water Requirement ............................................................................................... 31 Table 2.3 : Block – wise yearly mining area for five years (ha) ......................................................... 37 Table 2.4 Block – wise yearly production for five years (million metric tonne) .................................. 37 Table 2.5 : Year-wise Production of Solid waste (Cubic Meter) ........................................................ 38 Table 2.6 : Conditions imposed by Director of Mines and Geology .................................................. 44 Table 3.1 : Description of Rivers Flowing through Pali District in Luni Catchment ............................ 55 Table 3.2 : Details of Catchment, Sub-Catchment and Watershed.................................................. 57 Table 3.3 : Computation of River Bed Slope .................................................................................... 59 Table 3.4 : Tehsil wise landuse and land cover of the district ........................................................... 61 Table 3.5 : Details of Landuse Class 2km/10km on either side of rivers of ML area ......................... 65 Table 3.6 : Land Use Details ............................................................................................................ 65 Table 3.7 : Geological Sequence ..................................................................................................... 66 Table 3.8 : Earthquake Events of Magnitude more than 3.3 (Richter Scale) .................................... 72 Table 3.9 : Ground Water Trend ...................................................................................................... 72 Table 3.10 : Distance of Tehsil Headquarters from Nearest IMD Station ......................................... 75 Table 3.11 : Climatological Data Station: IMD, Jodhpur (1960-1990) ............................................... 76 Table 3.12 : Monthly Rain Fall Data Observed at Tehsil (2012) ...................................................... 78 Table 3.13 : Monthly Rainfall (mm) data observed at Marwar Jn. Tehsil (2004-2013) ...................... 79 Table 3.14 : Computation of Standard Deviation .............................................................................. 79 Table 3.15 : Site Specific Meteorological Data ................................................................................. 81 Table 3.16 : Details of Ambient Air Quality Monitoring Locations ..................................................... 85 Table 3.17 : Ambient Air Quality results (µg/m3) .............................................................................. 87 Table 3.18 : Water Sampling Locations ........................................................................................... 91 Table 3.19 : Physico chemical and Biological Characteristics of Surface Water ............................... 92 Table 3.20 : Physico chemical and Biological Characteristics of Ground Water ............................... 93 Table 3.21 : Details of Soil Sampling Locations ............................................................................... 97 Table 3.22 : Physico-chemical Characteristics of Soil ...................................................................... 98 Table 3.23 Details of Noise Monitoring Locations .......................................................................... 101 Table 3.24 : Noise Levels [dB(A)] in the Study Area ...................................................................... 102 Table 3.25 : Forest Types in the Pali Forest Division .................................................................... 103 Table 3.26 : Sampling Location of Floristic Survey ......................................................................... 105 Table 3.27 : Phyto-sociological Characters of Different species recorded in proposed mining area 107 Table 3.28 : Phyto-sociological Characters of Different species recorded around mining areas ..... 108 Table 3.29 : Mammalian Fauna Sighted during the primary survey ................................................ 113 Table 3.30 : Avifauna Sighted during the primary survey ............................................................... 115 R-Resident, WV-Winter Visitor ........................................................................................................... 115 Table 3.31 : Herpetofauna recorded from the project area ............................................................. 117 Table 3.32 : Fish species reported from the project area ............................................................... 117 Table 3.33 : Distict – wise apportionment of the area under WLS .................................................. 118 Table 3.34 : Pali District at a Glance .............................................................................................. 121 Table 3.35 : Village-wise details of population ............................................................................... 124 Table 3.36 : Educational Network in the District ............................................................................. 132

EIA/EMP report of Sand/Bajri Mine (With ML Area of 4280.0 ha) Tehsil Marwar Jn., District Pali, Rajasthan
EQMS INDIA PVT. LTD. 5
Table 3.37 Network of Medical And Public health Centres In The District ...................................... 132 Table 3.38 : Comprehensive List of Infrastructures present in the Study Area ............................... 134 Table 3.39 : Area irrigated and un-irrigated under Kharif and Rabi Crops ...................................... 139 Table 3.40 : Productivity of Principal Crops .................................................................................... 140 Table 3.41 : Groupwise Details of SSI and MSME Registered Units .............................................. 140 Table 4.1 : Reduction in Surface Flow Due to Mining in Tehsil Marwar Jn. upto 6th Year .............. 144 Table 4.2 : Reduction in Surface Flow Due to Mining in Tehsil Marwar Jn upto 4 Years close of
mining ..................................................................................................................................... 145 Table 4.3 : Year-wise Computation of Ground Water Recharge as per GEC-97 ............................ 146 Table 4.4 : Standard Values of Noise Levels ................................................................................. 150 Table 4.5 : Modeling Output ........................................................................................................... 150 : Standard Values of Noise Levels ................................................................................................ 152 Table 4.6........................................................................................................................................ 152 Table 4.7 : Predicted Noise Levels................................................................................................. 152 Table 4.8 : Details of Production Parameters, Transportation, Moisture, Silt Contents ................... 155 Table 4.9 : Predicted Ground Level Concentration due to Open-pit excavation ............................. 155 Table 4.10 : Details of Production Parameters, Transportation, Moisture, Silt Contents ................. 158 Table 4.11 : Receptors Location And Model Results ...................................................................... 159 Table 4.12 : Cumulative levels of existing and predicted levels of PM10 ......................................... 161 Table 4.13 : Traffic volume counts near Jojawar on SH-61 ............................................................ 167 Table 4.14 : Traffic volume counts at Karmal on SH-62 ................................................................. 167 Table 4.15 : Incremental rise in existing average daily traffic at SH-61 due to proposed transport
activity .................................................................................................................................... 168 Table 4.16 : Incremental rise in existing average daily traffic at SH-62 due to proposed transport
activity .................................................................................................................................... 168 Table 4.17 : Determination of Traffic Noise Levels at Jojawar (SH-61) .......................................... 169 Table 4.18 : Determination of Traffic Noise Levels at Karmal (SH-62) ........................................... 169 Table 4.19 : Emission factors by vehicle type (gm/km/vehicle) ....................................................... 170 Table 4.20 Receptor Locations And Model Results (Worst Case Wind Angle) ............................... 171 Table 5.1 : Particulate Emission Factors for Stone-Processing Operations .................................... 174 Table 6.1 : Air Quality Monitoring and Management ...................................................................... 178 Table 6.2 : Noise Level Monitoring and management .................................................................... 179 Table 6.3 : Physico-chemical and bacteriological parameters to be monitored .............................. 181 Table 6.4 : Summary of Environmental Monitoring Programme ..................................................... 183 Table 7.1 : Annual Sediment Yield in Indian Arid Zones ................................................................. 188 Table 7.2 : Sediment Yield as a function of Effective rainfall .......................................................... 188 Table 7.3 : Annual Sediment Rates by Various Methods ............................................................... 193 Table 7.4 : Tanks under the jurisdiction of Water Resources Department ...................................... 197 Table 7.5 : Year wise Maximum gauge Water Received, Water Utilized from Jawai Dam .............. 201 Table 7.6 : Monthly Average and Maximum Rainfall (mm) in a day during non-monsoon season .. 203 Table 9.1 : Cost under Conservation Plan...................................................................................... 225 Table 9.2 : Cost under CSR initiative ............................................................................................. 227 Table 9.3 : Species suggested for plantation under Greenbelt Development Progaramme ............ 228 Table 9.4 : Phase-wise programme of plantation ........................................................................... 229 Table 9.5 : Annual cost for green belt development plan (Rs. in lakhs) .......................................... 230 Table 9.6 : Year-wise Production of Solid waste ............................................................................ 231 Table 9.7 : Schedule of Medical Checkup ...................................................................................... 233 Table 9.8 : Cost Estimate ............................................................................................................... 234 Table 9.9 : Cost estimate of soil conservation works (engineering) ................................................ 235 Table 9.10 : Total cost of environmental management plan ........................................................... 236

EIA/EMP report of Sand/Bajri Mine (With ML Area of 4280.0 ha) Tehsil Marwar Jn., District Pali, Rajasthan
EQMS INDIA PVT. LTD. 6
List of Figures
Figure 2.1 : Water Balance .............................................................................................................. 31 Figure 2.2 : Index Map of Luni River Basin Showing the Litholog from Dug Well and Tube Well
Sections .................................................................................................................................... 34 Figure 2.3 :Schematic Diagram of Mine Working in Bandi River ...................................................... 40 Figure 2.4 :Schematic Diagram of Mine Working in Lilki River ......................................................... 40 Figure 2.5 :Schematic Diagram of Mine Working in Mithri River ....................................................... 41 Figure 2.6 :Schematic Diagram of Mine Working in Kantyali River ................................................... 41 Figure 2.7 :Schematic Diagram of Mine Working in Khardi River ..................................................... 42 Figure 2.8 :Schematic Diagram of Mine Working in Siriari River ...................................................... 42 Figure 2.9 :Schematic Diagram of Mine Working in Sukri River ....................................................... 43 Figure 2.10 :Schematic Diagram of Mine Working in Khari River ..................................................... 43 Figure 3.1 : Project Location Map on Toposheets ............................................................................ 49 Figure 3.2 : Satellite view of the Project Site .................................................................................... 49 Figure 3.3 : Pictorial View of Sukri River at Phulad and Bandi river at Bhagora and Siriari river near
Siriari ........................................................................................................................................ 51 Figure 3.4 : Administrative Map of District Pali ................................................................................. 53 Figure 3.5 : Physiographic Map of Rajasthan ................................................................................... 54 Figure 3.6 : Catchment Area Map of Luni Basin in Rajasthan and Drainage Map of Study Area ...... 58 Figure 3.7 : Graphical Presentation of Landuse of District Pali ......................................................... 61 : Graphical Presentation of Landuse of Tehsil Marwar Jn. .............................................................. 62 Figure 3.8 ........................................................................................................................................ 62 Figure 3.9 : Landuse Map of 10km Study Area and 2km on either side of rivers of ML area in Tehsil
Marwar Jn. ................................................................................................................................ 64 Figure 3.10 : Regional geology map of Rajasthan ............................................................................ 67 Figure 3.11 : Hydrogeological Map of Pali district ............................................................................ 69 Figure 3.12 : Map of Seismic Zones of India .................................................................................... 70 Figure 3.13 : Map of Seismic Zones of Rajasthan ............................................................................ 71 Figure 3.14 : Site Specific Windrose Diagram .................................................................................. 83 Figure 3.15 : Frequency Distribution of Wind Class ......................................................................... 84 Figure 3.16 : Location of Monitoring and Sampling Stations ............................................................ 85 Figure 3.17 : Soil Map of the Study Area ......................................................................................... 96 Figure 3.18 : Number of families and species in different life forms in the study area .................... 106 Figure 3.19 : Shannon diversity, species Richness and Evenness index in proposed mining area 111 Figure 3.20 : Shannon diversity, species Richness and Evenness index in surrounding area ........ 112 Figure 3.21 : Percent bird species belonging to different orders ..................................................... 116 Figure 3.22 : Location of the Todgarh Raoli and Kumbhalgarh Wildlife Sanctuary vis-à-vis mine lease
area ........................................................................................................................................ 120 Figure 3.23 : Sex wise SC, ST and General Population in Study Area ........................................... 128 Figure 3.24 : Percentage wise break up of SC, ST and General Population in Study Area ............ 128 Figure 3.25 : Gender-wise Distribution of Literate and Illiterate in Study Area ............................... 129 Figure 3.26 : Workers Scenario of the Area ................................................................................... 130 Figure 3.27 : Distribution of Main Workers ..................................................................................... 130 Figure 3.28 : Distribution of Marginal Workers ............................................................................... 131 Figure 4.1 : Noise Graphical Results .............................................................................................. 151 Figure 4.2 : Isopleth of Average Hourly Highest 1st Value Predicted Average Ground – Level
Concentrations (Open Pit Source Modelling) .......................................................................... 157 Figure 4.3 : Isopleth of Maximum Predicted 24 hourly averaged Ground – Level Concentrations (Line
Source Modelling) ................................................................................................................... 160 Figure 4.4 Transport Route Map .................................................................................................... 166 Figure 7.1 : Hydrological Zones of Arid Region of India ................................................................. 187 Figure 7.2 : Sediment Yield as a function of effective rainfall ......................................................... 188

EIA/EMP report of Sand/Bajri Mine (With ML Area of 4280.0 ha) Tehsil Marwar Jn., District Pali, Rajasthan
EQMS INDIA PVT. LTD. 7
Figure 7.3 : Iso-Erodent Map of India after Kothyari ...................................................................... 191 Figure 7.4 : Pictorial view of Siriyari dam in tehsil Marwar .............................................................. 196 Figure 7.5 : Pictorial view of pits on river coarse of Rediya ............................................................ 205
List of Annexure
Annexure – I : Letter of Intent............................................................................................................. 3 Annexure II: Approval Letter for mining plan from Department of Mines & Geology Rajasthan .......... 4 Annexure III: Public Hearing Notice, Attendence Sheets, Proceedings and Replies .......................... 5 Annexure IV: NOC issued by the competent authority in respect to Aravali Notification ................... 18 Annexure V: Laboratory Result Sheets of monitoring of Ambient Air Quality .................................... 19 Annexure VI: Laboratory Result Sheets of Physico – Chemical Analysis of Water ........................... 32 Annexure VII: Laboratory Result Sheets of Physico – Chemical Analysis of Soil ............................. 34 Annexure VIII (A): Environmental Policy .......................................................................................... 35 Annexure VIII (B): Non-Compliance Reporting System .................................................................... 36 Annexure VIII (C): Organization Structure ........................................................................................ 37

EIA/EMP report of Sand/Bajri Mine (With ML Area of 4280.0 ha) Tehsil Marwar Jn., District Pali, Rajasthan
EQMS INDIA PVT. LTD. 8
CHAPTER 1. Introduction
1.1. Preamble
The Aravali Range, running in about 692 km diagonally across Rajasthan from Khetri in N-E
to Khed Brahma in S-W, constitutes the pre-dominant hill tract of the State. It thus, acts as a
barrier for S-W monsoon and topographically exhibit a water divide bifurcating the State into
the eastern plains and western sandy plains. The area to the east of Aravalli, is well drained
by several integrated drainage system including the perennial Chambal, which originates from
Madhya Pradesh, while the area to the west of Aravali has only one drainage system that is
Luni system. With the exception of Chambal, all other rivers are ephemeral in nature and
remain dry about 90% time of year except monsoon period, when run-off occurs as direct
response to the rainfall.
The Physiography of the state is the outcome of the erosional and depositional process. The
present landform and the drainage system have been greatly influenced and determined by
the geological formation and structures. Torrential and episodic rainfall coupled with intense
physical weathering, wafer thin and scanty vegetal cover over large tract of landmass and
aeolian surface deposits has enriched the area with abundance of transportable sediments of
different gradation and size. As a direct response to heavily rainfall, the consequent run-off
causes flash flood and enormous quantities of sediment loads are transported down the valley
and into the ephemeral rivers. The bed load sediment transport by the ephemeral river exceeds
several order of magnitude in contrast to a perennial river in the mountains or in the humid
zones. The suspended sediments specially transported during flash flood events is both of high
concentration and larger in quantity as compared to bed load. Besides, in case of Ephemeral
River the sediment available for supplies/transportation is not fully evacuated in arid/semi –
arid land owing to infrequent and short spell of storm events (Reid & Laroone, 1995). This
leads to thick deposition of sediments in the riverbed section and more often than not result in
raising the bed levels and eventually creates the flooding situation in areas of lesser river bank
heights
The composition and structure of the alluvium differ substantially based on the hydraulic regime
of flow, the discharge, the relief, the drainage system and the rock composition of riverbed and
banks. In ephemeral rivers the alluvium predominantly comprises coarse and fine sand along
with silt and clay and is more often than not deposited on the inside bends (convex banks),
where the water flows more slowly and has less power to transport the bed/sedimentary load.

EIA/EMP report of Sand/Bajri Mine (With ML Area of 4280.0 ha) Tehsil Marwar Jn., District Pali, Rajasthan
EQMS INDIA PVT. LTD. 9
Rivers and streams by far have been the most lucrative and attractive source for extracting
large volume of different grades of sand / bajri for a variety of construction activities. Following
are some advantages of using river sediments as compared to the crushing of rock-mass from
rock-in-situ quarries.
Due to attrition, the material is already granulated and rounded, well sorted and generally
clean
Sediments can easily be collected / extracted by digging less deep pits in active channel
or dry river beds of upper terraces
Invariably free from weak materials and interstitial loose / fine material.
Not far from cities or market as the civilization has developed near the bank of rivers
Require comparatively less processing.
Natural replenishment takes place periodically due to transportation of sediments from
upper course/reaches during high stage of river, which is achieved during events of flash
floods during monsoon.
1.2. Purpose of the Report
Mining activities invariably affect the existing environmental equilibrium of the site with both
adverse and beneficial effects. Exploitation of mineral deposits, occurring in specific sites, does
not leave any choice but to adoption of eco-friendly mining methods compatible with project
economics. For sustainable maintenance of environmental commensuration with the mining
and related operation, it is imperative to conduct studies on the baseline status of existing
environmental attributes and assess the impact on these due to proposed activities, which
would assist in formulating well-addressed management plans for sustainable mineral
extraction within life of mine.
The main purpose of the report is to establish the baseline environmental attributes in terms of
scoping clearance issued by the EAC, Ministry of Environment and Forests, vide meeting held
on 26.9.2013, and predict identify the impacts for preparing environment management plan.
1.3. Identification of Project & Project Proponent
The project has been conceived for an annual production of 0.8 MCM (1.12 MMT) of Sand
(Bajri) by open cast semi-mechanized extraction method in riverbed of Bandi, Lilki, Mithri,
Kantaliyi, Khardi, Sukri upper, Khari and Siriari Nala draining within tehsil Marwar Jn. The lease
area is revenue wasteland in river body (Gair mumkin Nadi Nala).
The project proponent (LoI) is firm named as M/s Kuber Associates with registered office at
the following address:
EIA/EMP report of Sand/Bajri Mine (With ML Area of 4280.0 ha) Tehsil Marwar Jn., District Pali, Rajasthan
EQMS INDIA PVT. LTD. 10
R/o C-57, Hanumaan Nagar,
Khatipura, Jaipur, (Rajasthan)
1.4. Brief description of nature, size and location of the project
1.4.1. Brief description nature and size of the project
The letter of intent was granted vide Rajasthan State Government order no P.8 (2) Khan/Gr. –
2/2013, Jaipur dated 13th Feb 2013 in favour of M/s Kuber Associates for river-bed mining of
minor mineral Sand (Bajri) over an area of 4280.00 ha covered under river stretches within
bounds of 127 different revenue villages in Tehsil Marwar Jn., District Pali. The project has
been proposed for an annual production of 0.8 MCM (1.12 MMT) of sand/bajri by open cast
semi mechanized method of extraction in riverbed. The lease area is revenue waste land in
river body (Gair mumkin Nadi Nala).
The estimated net geological reserves have been assessed as 128.4 MCM (179.76 MMT) of
sand/bajri, out of which 105.35 MCM (161.49 MMT) are mineable. The project has no other
interlinked project. The mining plan as warranted under Rule 37-B, Chapter IVA of RMMCR,
1986 amended upto 2012, has been prepared by the qualified person as defined under Rules
37-C and registered under Rule 37-D with the Department of Mines & Geology, Rajasthan has
been approved by the competent Authority, authorised for approval of mining plans under Rule
37-E of RMMCR, 1986 amended upto 2012.
The project activity falls under category ‘A’ (Activity 1 A – Mining of Minerals) because the
lease area is more than 50 ha and General Condition of the Environmental Clearance
notification 2006, as amended from time to time.
1.4.2. Location and Approach to the project
The mine lease area is linearly stretched under 127 revenue villages in tehsil Marwar Jn.,
district Pali, mentioned ibid. The geographical location is covered under SOI Toposheet no. 45
G/6, 45 G/9, 45 G/10, G/13 and 45G/14. Lease area can be approached from NH-14, SH-61,
SH-62 and SH-67. Distance of lease area on Marwar Junction side is approximately 10.0 km.
Various link roads on the river course stretch, merges with the tar road on Marwar Junction.
1.4.3. Status of Litigation against project
There are no litigations/court cases pending against the project as informed by the project
proponent.
1.5. Salient Features of the Project
The salient features of the project are given in Table 1.1.

EIA/EMP report of Sand/Bajri Mine (With ML Area of 4280.0 ha) Tehsil Marwar Jn., District Pali, Rajasthan
EQMS INDIA PVT. LTD. 11
Table 1.1 : Salient Features of the Project
1 Project Name River Sand (Bajri) Mining of M/s. Kuber Associates
2 Mine Lease Area 4280.0 ha.
3 Location of
Mine
Near Villages
Akhawas, Anji Ki Dhani, Aaua, Angdosh, Asan Dhanchiyan, Asan Daniya, Asan Melda, Asan Jodhwan, Isali, Uprli Nimbli, Kantaliya, Karmal, Kushalpura, kadu, Karwada, karoliya, Khera Kalyankhurd, Khakhro Ka Oda, Kharchi, Kharcho Ki Dhani, Gudha Kesarsingh, Gudha Verjaliya, Gudha Ajwa, Gudha Ganga I, Gudha Ganga II, Gudha Giri, Gudha Durjan, Gudha Dhamavta, Gudhanava, Gudha Premsingh, Gudha Bhopat, Gudha Bhopa, Gudha Hemkaran, Gudha Raghunathsingh, Gudha Rmasingh, Gudha Soorsingh, Gudha Himta, Gadana, Godawas, Gopawas, Golki, Chailawas, Chatra Ka Gudha, Chawariya, Chirpatiya, Choukariya, Jation Ki Dhani, Jooni Foolad, Jadan Khalsa, janoda, Jogdawas, Jojawar, Jorkiya, Jhambuda, jhinjhardi, Thakurwas, Dingor, Dhelpura, Dhal, Teja Ka Gudha, telpura, Thal, Dudor, Devli, Dadiya, Dhanla, Dhamli, Dharesvar, Naya Gaon, Nayi Foolad, narsinghpura, nayagudha, Nichali Nimbli, Nimbli, Nivo Ki Khejari, Pabudi, Badi, Badsa, Bajiya Mali, Bata, Basni, Basera, Bithura Khurd, Bhimaliya, Bhojawas, Mudiya, Malsabavri, Mailawas, Manda, Radjhalra, Ranawas, Rambagh, Risaniya, Vadiya, Bopari, Bhithuda Kalan, bornadi, Borimada, Bhagwaanpura, Bhgoda, Mukanpura, Melap, Mevda, Musaliya, Marwar Juction, Radawas, Revdiya, Rajkiyawas Kalan, rajkiyawas Khurd, Rananadi, Rampura, Sadakmaliya, Suryanagar, Savrad, Saran, Sichana, Sichiyawas, Sinla, Siriyari, Simal, Sodo Ka Dhana, Hemliyawas Kalan, Hemliyawas Khurd, Halawat, Hingola Kalan, Hingola Khurd, Bogla,
Tehsil Marwar
District Pali
State Rajasthan
4 Coordinates Latitude 25°31’00.00”N to 25°42’00.00”N
Longitude 73°30’00.00”E to 73°49’00.00” E
5 Khasra details
S.No. Village Name River Area (ha) Nala Area (ha)
1 Akhawas 0 35.98
2 Anji Ki Dhani 27.46 0
3 Aaua 84.73 0
4 Angdosh 12.16 10.13
5 Asan Dhanchiyan 43.36 0
6 Asan Daniya 0 2
7 Asan Melda 7.04 0.51
8 Asan Jodhwan 0 17.6
9 Isali 0 0.52
10 Uprli Nimbli 0 19.28
11 Kantaliya 145.53 30.47
12 Karmal 0 27.81

EIA/EMP report of Sand/Bajri Mine (With ML Area of 4280.0 ha) Tehsil Marwar Jn., District Pali, Rajasthan
EQMS INDIA PVT. LTD. 12
13 Kushalpura 0 9.72
14 kadu 15.46 0.81
15 Karwada 27.08 0
16 karoliya 0 12.27
17 Khera Kalyankhurd 0 3.85
18 Khakhro Ka Oda 0 8.97
19 Kharchi 0 13.06
20 Kharcho Ki Dhani 4.37 0
21 Gudha Kesarsingh 107.63 24.75
22 Gudha Verjaliya 2.38 0
23 Gudha Ajwa 6.6 2.27
24 Gudha Ganga I 1.2 3.4
25 Gudha Ganga II 0 1.62
26 Gudha Giri 40.38 0
27 Gudha Durjan 0 66.37
28 Gudha Dhamavta 0 6.57
29 Gudhanava 0 82.9
30 Gudha Premsingh 0 24.2
31 Gudha Bhopat 0 5.9
32 Gudha Bhopa 0.12 25.66
33 Gudha Hemkaran 21.08 13.61
34 Gudha Raghunathsingh 0 111.3753
35 Gudha Rmasingh 51.73 0
36 Gudha Soorsingh 36.91 20
37 Gudha Himta 0 9.23
38 Gadana 52.37 0
39 Godawas 20.92 0
40 Gopawas 1.28 0
41 Golki 0 78.82
42 Chailawas 36.72 0.99
43 Chatra Ka Gudha 0 30.62
44 Chawariya 0.24 9.72
45 Chirpatiya 0 29.34
46 Choukariya 10.51 82.81
47 Jation Ki Dhani 17.43 0

EIA/EMP report of Sand/Bajri Mine (With ML Area of 4280.0 ha) Tehsil Marwar Jn., District Pali, Rajasthan
EQMS INDIA PVT. LTD. 13
48 Jooni Foolad 17.51 1.37
49 Jadan Khalsa 0 13.84
50 janoda 17.75 0
51 Jogdawas 0 11.71
52 Jojawar 108.94 117.76
53 Jorkiya 3.7 64.49
54 Jhambuda 3.6 0
55 jhinjhardi 0 13.06
56 Thakurwas 2.14 0
57 Dingor 4.8 3.64
58 Dhelpura 0 0.8
59 Dhal 19.78 0
60 Teja Ka Gudha 0 4.99
61 telpura 0 5.18
62 Thal 0 20.14
63 Dudor 0 41.39
64 Devli 108.94 0
65 Dadiya 66.17 0
66 Dhanla 257.97 65.42
67 Dhamli 57.21 0
68 Dharesvar 0 2.04
69 Naya Gaon 10.31 0
70 Nayi Foolad 1.27 14.77
71 narsinghpura 0 25.33
72 nayagudha 0 20.23
73 Nichali Nimbli 0 3.59
74 Nimbli 70.41 0
75 Nivo Ki Khejari 0 70.49
76 Pabudi 0 0.17
77 Badi 0 1.3
78 Badsa 52.51 0
79 Bajiya Mali 3.03 3.1
80 Bata 94.84 2.12
81 Basni 0 22.3
82 Basera 0 40.94
83 Bithura Khurd 17.7 2.63
84 Bhimaliya 0 93.39
85 Bhojawas 0 6.16
86 Mudiya 24.81 3.85
87 Malsabavri 42.19 38.37

EIA/EMP report of Sand/Bajri Mine (With ML Area of 4280.0 ha) Tehsil Marwar Jn., District Pali, Rajasthan
EQMS INDIA PVT. LTD. 14
88 Mailawas 138.44 0
89 Manda 0 3.17
90 Radjhalra 8.92 0
91 Ranawas 0 15.97
92 Rambagh 0 0.98
93 Risaniya 0 1.42
94 Vadiya 25.85 3.49
95 Bopari 13.17 4.89
96 Bhithuda Kalan 118.11 67.63
97 bornadi 0 19.63
98 Borimada 43.72 0
99 Bhagwaanpura 26.46 0
100 Bhgoda 0 44.43
101 Mukanpura 19.44 0
102 Melap 0 3.03
103 Mevda 0 13.42
104 Musaliya 21.58 8.05
105 Marwar Juction 0 0.32
106 Radawas 37.63 24.19
107 Revdiya 0 0.92
108 Rajkiyawas Kalan 32.49 8.02
109 rajkiyawas Khurd 0 9.55
110 Rananadi 0 4.43
111 Rampura 0 61.62
112 Sadakmaliya 0 4.51
113 Suryanagar 1.56 5.99
114 Savrad 28.95 0
115 Saran 5.5 0
116 Sichana 0 17.54
117 Sichiyawas 14.4 15.72
118 Sinla 0 35.63
119 Siriyari 67.72 0
120 Simal 0 7.22
121 Sodo Ka Dhana 0 2.45
122 Hemliyawas Kalan 0 5.36
123 Hemliyawas Khurd 0 2.51
124 Halawat 18.15 0.51

EIA/EMP report of Sand/Bajri Mine (With ML Area of 4280.0 ha) Tehsil Marwar Jn., District Pali, Rajasthan
EQMS INDIA PVT. LTD. 15
125 Hingola Kalan 30.08 0
126 Hingola Khurd 20.37 0
127 Bogla 0 15.07
Total Total Area 2432.11 1847.53
Total Area 4279.64
6 Toposheet 45 G/6, 45 G/9, 45 G/10, 45G/13 and 45G/14
Landuse Revenue waste land in river body (Gair mumkin Nadi Nala)
7 Name of River Bandi, Lilki, Mithri, Kantaliyi, Khardi, Sukri upper, Khari and Siriari Nala
8 Mineral River Sand (Bajri)
9 Geological Reserves 128.4 MCM (179.76 MMT)
Mineable Reserve 105.35 MCM (161.49 MMT)
Targeted Production 4 MCM (5.6 MMT)
10 Proposed Annual Production
0.8 MCM (1.12 MMT)
11 Validity of Lease 5 Year
Life of mine Continuous, being replenished yearly
12 Ultimate Pit Limit 3 meter from river bed level
13 Method of Mining Opencast Semi-Mechanized
14 No. of Working Days 280
15 Water Demand/Source 25 KLD from ground water resource (4 KLD for Drinking/Domestic, 21 KLD for Dust Suppression & Plantation)
16 Manpower requirement 102
17 Nearest Railway Station Marwar Junction Railway Station
18 Nearest State Highway/ National Highway
NH-14, SH-61, SH-62 and SH-67
19 Nearest Airport Jodhpur Airport (88 km)
1.6. Need for the project and its importance to the country or region
For meeting the huge demand of construction material like coarse and fine sand/Bajri required
in building construction and infrastructure works, road material for construction and
maintenance of roads / highway material in Jodhpur Division of Rajasthan. The natural
available materials in riverbed is suitable from techno-economic consideration. The mining
project shall provide direct employment besides creation of additional jobs by way of
transportation. Apart from this, it will fetch huge revenue to state exchequer.
1.7. Policy, Legal and Administrative Framework
The emerging environmental scenario calls for requisite attention on conservation and proper
use of natural resources and development without destruction. The environmental
consideration in any development process has become a necessity for achieving sustainable

EIA/EMP report of Sand/Bajri Mine (With ML Area of 4280.0 ha) Tehsil Marwar Jn., District Pali, Rajasthan
EQMS INDIA PVT. LTD. 16
developmental. To achieve these goals, the Ministry of Environment & Forests, Govt. of India,
has enacted various acts, legislations, guidelines and standards from time to time. The
principal environmental regulatory agency in India is the Ministry of Environment & Forests,
New Delhi. MoEF formulates environmental policies and accords environmental clearances for
different projects. The important environmental legislations in India are given in Table 1.2.
Table 1.2 : Key Environmental Legislations
Name Scope and Objective Key Areas Operational
Agencies/Key
Player
Water (Prevention
and Control of
Pollution) Act, 1974,
1988
To provide for the
prevention and control of
water pollution and
enhancing the quality of
water
Control sewage and
industrial effluent
discharges
Central and State
Pollution Control
Boards
Air (Prevention and
Control of Pollution)
Act, 1981, 1987
To provide for the
prevention and control of
air pollution
Controls emission of air
pollutants
Central and State
Pollution Control
Board
Noise Pollution
(Regulation &
Control) Rule 2000
Noise pollution control Control of noise pollution in
residential, commercial,
industrial and silent zones
Central and State
Pollution Control
Board
Forest
(Conservation) Act,
1980, 1988
To consolidate
acquisition of common
property such as forest,
halt India’s rapid
deforestation and
resulting environmental
degradation
Regulates access to
natural resources, state
has a monopoly right over
land, categories forests,
restriction on de-
reservation and using
forest for non-forest
purpose
State Government
and Central
Government
Wildlife (Protection)
Act, 1972, 1993
To protect wildlife Creates protected areas
(national parks /
sanctuaries) categories of
wildlife which are protected
Wildlife Advisory
Boards, Central Zoo
Authorities
Ancient Monuments
and Archaeological
sites & Remains Act,
1958
To protect ancient
monuments of national
heritage / importance
Conservation of cultural
and historical remains
found in India
Archaeological
Survey of India
Hazardous Wastes
(Management and
Handling) Rules,
1989
Health and safety Assessment of hazardous
materials and
management
Central and State
Pollution Control
Board

EIA/EMP report of Sand/Bajri Mine (With ML Area of 4280.0 ha) Tehsil Marwar Jn., District Pali, Rajasthan
EQMS INDIA PVT. LTD. 17
Name Scope and Objective Key Areas Operational
Agencies/Key
Player
Biological Diversity
Act, 2002
Biodiversity conservation Disclosure of species
survey or collection
activities to the National
Biodiversity Authority
MoEF, New Delhi and
State Forest
Departments
International
Environmental
(regulation in which
India is a signatory)
Control and reduction of
greenhouse gases
International
environmental issues such
as emission of greenhouse
gases
Govt. of India
Environment
(Protection) Act,
1986
To provide for the
protection and
improvement of
environment
An umbrella legislation,
supplements pollution laws
Central government
nodal agency, MoEF
can delegate to state
departments of
environment
Right to Fair
Compensation and
Transparency in
Land Acquisition,
Rehabilitation and
Resettlement Act,
2013
The new legislation will
guide all land
acquisitions of central
and state governments,
bringing in stricter norms
and increasing
landowners’
compensation
significantly.
Fair compensation to the
assets acquired and
proper rehabilitation and
resettlement of PAFs with
improvement in post-
acquisition social and
economic status
Central and State
Government
EIA Notification 14th
Sep 2006 and
amendment 1st Dec
2009
Environment Impact
Assessment
Environmental Protection Project Development,
State and Central
Government
As per MoEF notification, dated 14th September 2006 and its amendment dated 1st December
2009, construction of a new project or activities or the expansion or modernization of existing
projects or activities listed in the schedule to the notification shall be undertaken in any part of
India only after the prior environmental clearance from the Central Government in the Ministry
of Environment and Forests, New Delhi for matters falling under Category ‘A’ in the schedule
and at state level the State Environment Impact Assessment Authority (SEIAA) for matters
falling under Category ‘B’ in the said schedule, the later duly constituted by the Central
Government under sub-section (3) of section 3 of the said act.
In the present case, the riverbed mining of Sand/Bajri in lease area of 4280.00 ha relates to
mining of minerals (non-coal) project falling under project category with threshold limit “A”, and
as such, the scoping clearance was sought from the Ministry of Environment & Forest.

EIA/EMP report of Sand/Bajri Mine (With ML Area of 4280.0 ha) Tehsil Marwar Jn., District Pali, Rajasthan
EQMS INDIA PVT. LTD. 18
1.8. Scoping Of the Project
In consonance with the provision, under section-6 of the MoEF notification, dated 14th
September 2006, the project proponent has moved an application, to the Ministry of
Environment and Forest in the prescribed Form-I duly filled along a copy of the PFR of the
project. The first step, required in the environment clearance process is ‘Scoping’ by which the
SEAC determines detailed and comprehensive Terms of Reference (TOR) addressing all
relevant environment concerns for the preparation of an Environmental Impact Assessment
(EIA) Report in respect of the project for which prior environment clearance is being sought.
After going through the various aspects of the river bed mining at the proposed site and the
related documents like Form – I and the PFR, the EAC, MoEF in its 11th meeting held on 25th
to 27th September 2013 set out the scoping clearance and issued ToR proposed for
environmental impact assessment studies and preparation of environmental management plan
for River bed mining and for submission of report after Public Hearing.
1.9. Environmental Framework of the State
The specific laws and policies that are formulated by the state government for achieving certain
level of sustainability in the human actions are mentioned in Table 1.3.
Table 1.3 : Environmental Framework of State Government
S.
No.
Legislation / Policy Objective
1. Rajasthan Minor Mineral Concession
Rules, 1986 (amended up to 19
June, 2012)
Relating application for mining lease,
its procedures authorities and
application forms
2. Rajasthan State Environment Policy,
2010.
Sustainable development of the state
3. Rajasthan State Water Policy, 2010 To protect and conserve water
resources
4. Rajasthan State Forest Policy, 2010 Protection and prevention of forest and
increasing vegetal cover, reduce soil
erosion.
1.9.1. The Rajasthan minor minerals (concession) revised rules, 1986 (amended upto 19th June 2012)
The rules inter alia provide for procedure for application for quarrying of minor minerals, grant
of mining lease, restriction on grant of mining lease, various mandatory registers of mining
lease, royalties in respect of mining leases, besides conditions applicable on mining lease, the
rights of lessee and the rights and power of the government. The amended rules 2012, under

EIA/EMP report of Sand/Bajri Mine (With ML Area of 4280.0 ha) Tehsil Marwar Jn., District Pali, Rajasthan
EQMS INDIA PVT. LTD. 19
newly introduced chapter IVA contains provision for systematic, scientific and environment
friendly mining plan. The new rules also allow the lessees/licensees/Short term public holder
having an area more than 1 ha and less than 5 ha individually to form an association of cluster
and submit environment management plans (EMPs), prepared by a recognized person under
the rules, to the district level environment committee for approval.
1.9.2. Rajasthan State Environment Policy 2010
The objectives and principles of the State Environment Policy are the same as enshrine in the
National Environment Policy, 2006. It inter alia includes the environment mission and climate
change agenda for this state for 2010-2014 in keeping with the fourth assessment report of the
inter-governmental panel on Climate Change (IPCC). This policy document is based on an
analysis of the state-specific issues, the natural resource constraints from which these emerge,
and their overall implications for the environment. The document identifies the key
environmental challenges and outlines strategies and actions to address them. Above all, it is
intended to be a guide to action, and accordingly provides inputs for a State Environment
Mission, supported by Task Forces with specific agenda and action plan, and institutional
arrangements for implementation of the proposed measures. The set of strategies and actions
to redress the key environmental problems of the State have been covered under three broad
areas:
conserving and enhancing environmental resources;
assuring sustainability of key economic sectors; and
improving environmental governance and building capacity
1.9.3. State Water Policy
The spiral growth of imbalance between demand and supply of water and continued depletion
of ground water resources along with deteriorating water quality has led the state to formulate
a well-addressed water policy of its own by adopting a radical shift from engineering based
solution to local community based water management solution under Integrated Water
Resource Management (IWRM). This new water policy presents the framework for sustainable
development and management of water resources in the state. It focuses towards community-
level empowerment and responsibility for water management. The objective of the state water
policy is to adopt an integrated and multi sectorial approach to the water resources planning,
development and management on a sustainable basis by considering river basin/sub basin as
unit.

EIA/EMP report of Sand/Bajri Mine (With ML Area of 4280.0 ha) Tehsil Marwar Jn., District Pali, Rajasthan
EQMS INDIA PVT. LTD. 20
1.10. Rajasthan State Forest Policy
In 2010, the State Government has enunciated its own Forest Policy within the framework of
National Forest Policy. This was to meet the peculiar forest situation in the State. The policy
guidelines cover almost all aspects of forestry in the State. Since forest and related issues are
one of the few most important issues of the project, implementation Forest policy is directly
relevant. Protection of existing forests from any kind of anthrogenic pressures and
maintenance of forest on sustainable basis. The principal aim of this forest policy is
environmental stability and ecological security through increased vegetal cover and reduction
in soil erosion.
1.11. Rajasthan State Pollution Control Board (RSPCB)
The Rajasthan State Pollution Control Board (RSPCB), established in 1975 under the provision
of water (Prevention & Control of Pollution) Act 1974 is a statutory authority entrusted to
implement and enforce environmental laws and rules with in the territorial jurisdiction of the
state. It ensures enforcement of statues, judicial and legislative pronouncements in context to
environmental protection within the state. The board is totally or partially responsible for
implementation of central acts related to water, air, noise and Environmental Protection Act,
1986. Agency is also acting as a facilitator for Central and State environmental clearance
process. The main functions are to:-
Plan and execute state-level air and water initiatives;
Advise State Government on air, water and industry issues;
Establish emission standards based on National minimum standards;
Issue consent orders (permits) for industrial air and water discharges;
Issue “No Objection Certificates” for "industrial development".
Publish statistics and disseminate information; and
Take legal action against defaulters.
Conducting of public hearing as per Paragraph -7, Stage-3 of MoEF Notification 2006.
1.12. Public Hearing
In consonance with the EIA notification 14th September 2006, vide Para 7 (III) and Annexure
- IV related to public consultation, the Rajasthan State Pollution Control Board conducted the
public hearing on 18.09.2014 at the Office of Sub-divisional Officer, Marwar Jn., District Pali in
the presence of the ADM Pali and representatives of the State Pollution Control Board,
Rajasthan. The minutes of the meeting, both in Hindi and its gist in English version alongwith
the replies and action plan has been enclosed as Annexure – III.

EIA/EMP report of Sand/Bajri Mine (With ML Area of 4280.0 ha) Tehsil Marwar Jn., District Pali, Rajasthan
EQMS INDIA PVT. LTD. 21
1.13. Compliance of ToR
The compliance of the ToR set out as Annexure – I and additional ToR as per scoping
clearance given by the MoEF consequent to the 11th Meeting held on 25th to 27th September
2013 is given Table 1.4.
Table 1.4 : Compliance of ToR
S. No. Terms of Reference (TORs) Cross Ref. in EIA Report 1. Year-wise production details since 1994 should be given,
clearly stating the highest production achieved in any one year prior to 1994. It may also be categorically informed whether there had been any increase in production after the EIA Notification, 1994 came into force w.r.t. the highest production achieved prior to 1994
Neither the project proponent had carried out any mining in ML Area before 1994 nor was he entitled to carry out such operation in the period anterior to the date of issue of letter of intent. In the light of the interim relief by the Hon’ble Apex Court, the LoI has executed the mining operation and during period December 2013 and upto November 2014, has won 227426
metric tonne. (Section 2.8.5)
2. A copy of the document in support of the fact that the Proponent is the rightful lessee of the mine should be given
Letter of Intent (Annexure-I)
3. All documents including approved mine plan, EIA and public hearing should be compatible with one another in terms of the mine lease area, production levels, waste generation and its management and mining technology and should be in the name of the lessee
Yes chapter 1 and 2 provide project details from which it is manifest that data regarding mine lease area , production levels and waste generation and its management etc are in line with approved mine plan in separate Volume.
4. All corner coordinates of the mine lease area, superimposed on a High Resolution Imagery/Toposheets should be provided. Such an Imagery of the proposed area should clearly show the land use and other ecological features of the study area (core and buffer zone)
The mine lease area, with all corner coordinates, has been marked in mosaic of toposheets in Figure 3.1 and satellite view is shown in Figure 3.2
5. Does the company have a well laid down Environment Policy approved by its Board of Directors? If so, it may be spelt out in the EIA report with description of the prescribed operating process/procedures to bring into focus any infringement/deviation/violation of the environmental or forest norms/ conditions? The hierarchical system or administrative order of the Company to deal with the environmental issues and for ensuring compliance with the EC conditions may also be given. The system of reporting of non-compliances / violations of environmental norms to the Board of Directors of the Company and/or shareholders or stakeholders at large may also be detailed in the EIA report.
The project proponent has environment policy of its own (Annexure-VIII). The PP shall comply with the environmental norms and conditions set forth in the main Environmental Clearance of the project and shall submit compliance to the MoEF periodically as warranted under the EC letter. The hierarchical system of the company and the system for reporting non-compliances has been covered under Section 6.6 and its sub-section.
6. Issues relating to Mine Safety, including subsidence study in case of underground mining and slope study in case of
The issues related to safety of opencast riverbed mining and

EIA/EMP report of Sand/Bajri Mine (With ML Area of 4280.0 ha) Tehsil Marwar Jn., District Pali, Rajasthan
EQMS INDIA PVT. LTD. 22
open cast mining, blasting study etc. should be detailed. The proposed safeguard measures in each case should also be provided.
safety of river and nearby structures have been eloquently made out in Section 2.1 and the slope study for failure of pit slope shows that the safety factor is more than 1.5 (Section 7.5)
7. The study area will comprise of 10 km zone around the mine lease from lease periphery and the data contained in the EIA such as waste generation etc., should be for the life of the mine / lease period.
The study area falling within the domain of the tehsil is shown in Figure 3.1 and the waste generation for the entire lease period has been worked out. (Section 2.8.10 and Table 2.5)
8. Land use of the study area delineating forest area, agricultural land, grazing land, wildlife sanctuary, national park, migratory routes of fauna, water bodies, human settlements and other ecological features should be indicated. Land use plan of the mine lease area should be prepared to encompass preoperational, operational and post operational phases and submitted. Impact, if any, of change of land use should be given.
Landuse map of study area comprising 10 km and 2 km zone around Mine Lease and Lease Periphery is shown in Figure 3.9 and Tabulated in Table 3.5 and the Landuse pattern of the ML Area at present and at the end of 3rd and 5th year is shown in Table 3.6.
9. Details of the land for any Over Burden Dumps outside the mine lease, such as extent of land area, distance from mine lease, its land use, R&R issues, if any, should be given
There will be no development of overburden dumps and thus no land shall be required for it. (Section 2.8.8) besides no R&R issues is involved (Section 7.10)
10. A Certificate from the Competent Authority in the State Forest Department should be provided, confirming the involvement of forestland, if any, in the project area. In the event of any contrary claim by the Project Proponent regarding the status of forests, the site may be inspected by the State Forest Department along with the Regional Office of the Ministry to ascertain the status of forests, based on which, the Certificate in this regard as mentioned above be issued. In all such cases, it would be desirable for representative of the State Forest Department to assist the Expert Appraisal Committees
No such certificate is warranted as the mine lease area is revenue waste land and no forest land is involved in mining operation.
11. Status of forestry clearance for the broken up area and virgin forestland involved in the Project including deposition of net present value (NPV) and compensatory afforestation (CA) should be indicated. A copy of the forestry clearance should also be furnished.
Not applicable as no diversion of forest land for non-forestry purpose is envisaged.
12. Implementation status of recognition of forest rights under the Scheduled Tribes and other Traditional Forest Dwellers (Recognition of Forest Rights) Act, 2006 should be indicated
Not applicable in view of serial no. 11
13. The vegetation in the RF / PF areas in the study area, with necessary details, should be given
The taxonomic diversity and the phyto-sociological characteristics of the plant species in core and buffer zone covering forested area has been provided in detailed (Section 3.9.1)
14. A study shall be got done to ascertain the impact of the Mining Project on wildlife of the study area and details furnished. Impact of the project on the wildlife in the surrounding and any other protected area and accordingly detailed mitigative measures required, should be worked out with cost implications and submitted
The impact of mining on fauna in the study area has been dealt with in detailed under Section 4.8.2. and measure for minimizing impact on fauna has been discussed under Sub-Section 4.8.2.1.

EIA/EMP report of Sand/Bajri Mine (With ML Area of 4280.0 ha) Tehsil Marwar Jn., District Pali, Rajasthan
EQMS INDIA PVT. LTD. 23
15. Location of National Parks, Sanctuaries, Biosphere Reserves, Wildlife Corridors, Tiger/Elephant Reserves/(existing as well as proposed), if any, within 10 km of the mine lease should be clearly indicated, supported by a location map duly authenticated by Chief Wildlife Warden. Necessary clearance, as may be applicable to such projects due to proximity of the ecologically sensitive areas as mentioned above, should be obtained from the State Wildlife Department/Chief Wildlife Warden under the Wildlife (Protection) Act, 1972 and copy furnished
Todgarh Raoli WLS and Kumbhalgarh WLS exist within 10km of the mine lease area. The location of these WLS vis-à-vis the revenue villages along river(s) in the mine lease area within 10 km have been marked on Toposheet 45G/10, 45G/13, 45G/14, 45G/15 (Figure 3.21)
16. A detailed biological study of the study area [core zone and buffer zone (10 km radius of the periphery of the mine lease)] shall be carried out. Details of flora and fauna, duly authenticated, separately for core and buffer zone should be furnished based on such primary field survey, clearly indicating the Schedule of the fauna present. In case of any scheduled I fauna found in the study area, the necessary plan for their conservation should be prepared in consultation with State Forest and Wildlife Department and details furnished. Necessary allocation of funds for implementing the same should be made as part of the project cost
Detailed biological study for flora of core and buffer zone has been conducted and shown in Section 3.9.1 and for terrestrial and aquatic fauna under Section 3.9.2. Conservation Plan for specific species covered under Schedule I & II has been provided under Section 9.2.5.
17. Proximity to Areas declared as ‘Critically Polluted’ or the Project areas likely to come under the ‘Aravali Range’, (attracting court restrictions for mining operations), should also be indicated and where so required, clearance certifications from the prescribed Authorities, such as the SPCB or State Mining Dept. Should be secured and furnished to the effect that the proposed mining activities could be considered
The proposed mine lease area falling in tehsil Marwar Jn. of district Pali is not identified as critically polluted area. Therefore, at present there is no moratorium on consideration of projects for EC in respect of Tehsil Marwar Jn. in District Pali, Rajasthan. The mining plans for tehsil Marwar has been approved by the Department of Geology and Mines Rajasthan. Therefore no clearance certificate from the SPCB is warranted. The mine lease area does not fall under Aravalli Range Notification (Certificate of Competent Authority enclosed as Annexure IV). The mine plan has been approved by the State Mining Department.
18. Similarly, for coastal Projects, A CRZ map duly authenticated by one of the authorized agencies demarcating LTL. HTL, CRZ area, location of the mine lease w.r.t CRZ, coastal features such as mangroves, if any, should be furnished. (Note: The Mining Projects falling under CRZ would also need to obtain approval of the concerned Coastal Zone Management Authority)
Mining project is in Western Rajasthan and does not fall under CRZ.
19. R&R Plan/compensation details for the Project Affected People (PAP) should be furnished. While preparing the R&R Plan, the relevant State/National Rehabilitation & Resettlement Policy should be kept in view. In respect of SCs /STs and other weaker sections of the society in the study area, a need based sample survey, family wise, should be undertaken to assess their requirements, and action programmes prepared and submitted accordingly,
In the wake of the fact that no private land or asset acquisition is involved in the mine lease area which totally falls in revenue waste land classified as Gair Mumkin Nadi/Nala in the revenue records, no R&R plan is warranted (Section 7.10 and Section 7.11)

EIA/EMP report of Sand/Bajri Mine (With ML Area of 4280.0 ha) Tehsil Marwar Jn., District Pali, Rajasthan
EQMS INDIA PVT. LTD. 24
integrating the sectoral programmes of line departments of the State Government. It may be clearly brought out whether the village located in the mine lease area will be shifted or not. The issues relating to shifting of Village including their R&R and socio-economic aspects should be discussed in the report.
20. One season (non-monsoon) primary baseline data on ambient air quality (PM10,SO2 and NOx), water quality, noise level, soil and flora and fauna shall be collected and the AAQ and other data so compiled presented date wise in the EIA and EMP Report. Site specific meteorological data should also be collected. The location of the monitoring stations should be such as to represent whole of the study area and justified keeping in view the pre dominant downwind direction and location of sensitive receptors. There should be at least one monitoring station within 500 m of the mine lease in the pre dominant downwind direction. The mineralogical composition of PM10, particularly for free silica, should be given.
The baseline data for winter season (October - December 2013) has been collected in respect of air quality (Section 3.5); Water Quality (Section 3.6); Noise (Section 3.8); Soil (Section 3.7); Flora & Fauna (Section 3.9); Site specific meteorological data (Section 3.4). One or more than one monitoring stations in the pre-dominant wind direction have been fixed within 500 m of the area.
21. Air quality modelling should be carried out for prediction of impact of the project on the air quality of the area. It should also take into account the impact of movement of vehicles for transportation of mineral. The details of the model used and input parameters used for modelling should be provided. The air quality contours may be shown on a location map clearly indicating the location of the site, location of sensitive receptors, if any, and the habitation. The wind roses showing pre-dominant wind direction may also be indicated on the map
In order to predict the particulate emissions, Lakes Environmental Aermod View ver. 6.2 (Air Dispersion Modelling Software) an interface based on ISCST3 - was used to predict changes in air quality i.e., maximum ground level concentration (GLC’s) of Particulate Matter. (Section 4.7)
22. The water requirement for the Project, its availability and source should be furnished. A detailed water balance should also be provided. Fresh water requirement for the Project should be indicated
Water requirement (25 Kld) for human consumption, plantation and dust suppression shall be met from ground water resource from nearby tube wells on payment basis (Section 2.7.4) Water Balance is shown in Figure 2.1.
23. Necessary clearance from the Competent Authority for drawl of requisite quantity of water for the Project should be provided
Marwar Jn. block does not fall under notified area as per latest list of notified blocks for control and regulation of ground water. No NOC from the CGWA shall have to be obtained for abstraction of ground water (25Kld) in terms of CGWA No. 21-4/ Guidelines/ CGWA/ 2009-832 dated 14.10.2009, as the water requirement from ground water source does not exceed 25 Kld the limit prescribed in the notification dated 14.10.2009 in case of over-exploited block like Marwar Jn. (Section 2.11.2)
24. Description of water conservation measures proposed to be adopted in the Project should be given. Details of rainwater harvesting proposed in the Project, if any, should be provided.
The mining pits can be construed as the recharge structure having adequate capacity for impounding surface run-off. These pits cause

EIA/EMP report of Sand/Bajri Mine (With ML Area of 4280.0 ha) Tehsil Marwar Jn., District Pali, Rajasthan
EQMS INDIA PVT. LTD. 25
quick recharging of the ground water through percolation (Section 4.5), besides this water conservation provision has been made under CSR (Section 9.2.6)
25. Impact of the project on the water quality, both surface and groundwater should be assessed and necessary safeguard measures, if any required, should be provided.
Neither there will be any impact on surface water quality in so far as there shall be no synergic realtion between water and soil during the period of mining nor there shall be impact on ground water quality as the mining activity does not intersect the ground water table (Section 4.5.2 and Section 4.5.3)
26. Based on actual monitored data, it may clearly be shown whether working will intersect groundwater. Necessary data and documentation in this regard may be provided. In case the working will intersect groundwater table, a detailed Hydro-Geological Study should be undertaken and Report furnished. Necessary permission from Central Ground Water Authority for working below ground water and for pumping of ground water should also be obtained and copy furnished
The longitudinal profile of the rivers, showing river bed elevation at different RD, the elevation of the mining floor (pit) corresponding to 3m depth of mining and the depth to the ground water table based on nearby wells and past measurement of ground water depth carried out by the ground water department ,separately for each river have been prepared. The groundwater table shall not intersect with the bottom of mining pits (Section 2.9). No pumping of ground water or dewatering is envisaged under the mine plan
27. Details of any stream, seasonal or otherwise, passing through the lease area and modification / diversion proposed, if any, and the impact of the same on the hydrology should be brought out.
No temporary diversion of discharge of main rivers or any of their interlacing is warranted for facilitating mining (Section 4.2.2)
28. Information on site elevation, working depth, groundwater table etc. Should be provided both in AMSL and bgl. A schematic diagram may also be provided for the same
Combined Schematic View showing average natural surface level, pit bottom level and GWT for each of the river involved is shown in Figure 2.2 and 2.3.
29. A time bound Progressive Greenbelt Development Plan shall be prepared in a tabular form (indicating the linear and quantitative coverage, plant species and time frame) and submitted, keeping in mind, the same will have to be executed up front on commencement of the project.
Progressive greenbelt development plan mentioning the plant species and time frame has been submitted in Tabular form under Sub-Section 9.3.4
30. Impact on local transport infrastructure due to the Project should be indicated. Projected increase in truck traffic as a result of the Project in the present road network (including those outside the Project area) should be worked out, indicating whether it is capable of handling the incremental load. Arrangement for improving the infrastructure, if contemplated (including action to be taken by other agencies such as State Government) should be covered.
Detailed transportation study has been carried out under Section 4.10
31. Details of the onsite shelter and facilities to be provided to the mine workers should be included in the EIA report
Proper site services such as First Aid, Rest Shelter, and Drinking Water will be provided to the mine workers (Section 2.8.13)

EIA/EMP report of Sand/Bajri Mine (With ML Area of 4280.0 ha) Tehsil Marwar Jn., District Pali, Rajasthan
EQMS INDIA PVT. LTD. 26
32. Conceptual post mining land use and Reclamation and Restoration of mined out areas (with plans and with adequate number of sections) should be given in the EIA report
Section 2.8.9
33. A time bound Progressive Greenbelt Development Plan shall be prepared in a tabular form (indicating the linear and quantitative coverage, plant species and time frame) and submitted, keeping in mind, the same will have to be executed up front on commencement of the project. Phase wise plan of plantation and compensatory afforestation should be charted clearly indicating the area to be covered under plantation and the species to be planted. The details of plantation already done should be given.
Detailed greenbelt development plan mentioning the plant species and time frame has been has been dealt with under Section 9.3. No plantation has been carried out yet.
34. Occupational Health impacts of the Project should be anticipated and the proposed preventive measures spelt out in detail. Details of pre placement medical examination and periodical medical examination schedules should be incorporated in the EMP.
Impacts have been anticipated and measures spelt out (Section 7.9), and detailed occupation health management plan provided (Section 9.5)
35. Public health implications of the Project and related activities for the population in the impact zone should be systematically evaluated and the proposed remedial measures should be detailed along with budgetary allocations.
Discussed under Section 4.9
36. Measures of socio economic significance and influence to the local community proposed to be provided by the Project Proponent should be indicated. As far as possible, quantitative dimensions may be given with time frames for implementation
The positive and adverse impact on socio-economic impact to the local community has been discussed under Section 4.9
37. Detailed environmental management plan to mitigate the environmental impacts which, should inter alia include the impacts of change of land use, loss of agricultural and grazing land, if any, occupational health impacts besides other impacts specific to the proposed Project
The environmental plan to mitigate environmental impact have been formulated (Section 9.2 through Section 9.6)
38. Public hearing points raised and commitment of the project proponent on the same along with time bound action plan to implement the same should be provided and also incorporated in the final EIA/EMP Report of the Project.
Incorporated after conducting Public and receiving of minutes (Annexure-III)
39. Details of litigation pending against the project, if any, with direction /order passed by any Court of Law against the project should be given.
There are no litigations/court cases pending against the project as informed by the project proponent. (Section 1.4.3)
40. The cost of the project (capital cost and recurring cost) as well as the cost towards implementation of EMP should clearly be spelt out.
Capital Cost and Recurring cost for implementation of EMP have been provided under Section 9.7, Section 9.8 and Table 9.7
Additional ToR
41. Details of Replenishment studies Detailed computation of silt rate on the basis of various methods has been assessed. (Table 7.2 and Section 7.2)
42. Details of transportation of mined out materials as per the Indian road Congress for both the ways (loaded as well as unloaded trucks) load and its impact on Environment
Study has been conducted for the impact due to transportation on carrying capacity of the Highway (Section 4.10.1); due to increase in vehicular emissions due to mineral transportation. (Section 4.10.2)

EIA/EMP report of Sand/Bajri Mine (With ML Area of 4280.0 ha) Tehsil Marwar Jn., District Pali, Rajasthan
EQMS INDIA PVT. LTD. 27
and noise due to increased traffic (Section 4.11)
43. Proper species specific conservation plan for Schedule-I and II species
Conservation Plan for specific species has been formulated (Section 9.2.5)
44. Impact of mining on plankton The impact on plankton is totally ruled out as there shall be no water column during period of mining (Section 4.8.4)
45. Details of mining activity to be provided w.r.t block wise/ calendar wise / Zonal wise, as the mine lease area is having a long stretch
Section 2.8.6
46. Details of Gradient of river bed to be provided Details of gradient of riverbed has been provided (Section 3.2.3.4 and Table 3.3)
47. Details of excavation schedule & sequential mining plan Details covered under Section 2.8.7 and Table 2.3 and 2.4
48. Mining Plan shall be prepared carefully dividing lease area into manageable blocks to ensure scientific and systematic mining of minor minerals
Approved mine plan in separate Volume
49. The baseline data shall be collected so as to represent the whole mine lease area
Section 3.5 through 3.9
50. As the area falls in the critically polluted area, the comments from Rajasthan SPCB shall be obtained.
The mine area does not fall under critically polluted industrial cluster / area area identified by CPCB. Thus no comments from Rajasthan SPCB is warranted.
EIA/EMP report of Sand/Bajri Mine (With ML Area of 4280.0 ha) Tehsil Marwar Jn., District Pali, Rajasthan
EQMS INDIA PVT. LTD. 28
CHAPTER 2. : Project Description
2.1. General
The project envisages open cast Semi-Mechanized extraction of Sand/Bajri to an annual
maximum of 1.12 MMT for five years from riverbed of Bandi, Lilki, Mithri, Kantaliyi, Khardi,
Sukri upper, Khari and Siriari Nala constituting a combined mine lease area 4280.0 ha for five
years. Neither any forest land, nor any private land is involved in the mine lease area which
totally falls in revenue waste land classified as Gair Mumkin Nadi/Nala in the revenue records.
Todgarh Raoli WLS and Kumbhalgarh WLS exist within 10km distance of the mine lease area.
2.2. Type of Project
The project has been proposed for an annual production of 0.8 MCM (1.12 MMT) of Sand
(Bajri) by open cast Semi-Mechanized extraction method in river bed. The project has no other
interlinked project. The proposed planning details are:
Mining method - Open Cast Semi-Mechanized mining method
Project cost - Rs. 75 lac
Production - Sand/Bajri –1.12 MMT per annum (maximum)
No solid waste other than small quantity of silt/silty clay, which invariably gets deposited as
crust material on the bed profile, after the recession of flood/flash floods, shall be scrapped
and carefully stored for depositing in the upper terraces earmarked for plantation purpose. Due
to deployment of excavators, the silt and clay which have deposited in different sediment layers
with time in the inter beds shall be excavated along with the sand and loaded into the transport
vehicles.
During monsoon season and especially during flash flood regime the rivers with significant free
draining catchment reach high stage and transport suspended sediment of high concentration
and larger amount than the bed load material. The bed load material/sediments which get
accredited at such stretch which has wider river width and has concave banks during the
passing of the floods while the suspended particles settle on the receding of floods. The mined
out area in river bed thus gets replenished only in the eventuality of frequent storm events
which cause heavy run-off to pass through the river which may or not have anicut or dam
across it to facilitate the sediment deposition. Thus no backfilling is required in the case of river
bed mining. The rehabilitation/reclamation of such lease area that has been secluded for
mining being close to the bank in the form of upper terraces will be done by way of tree
plantation along lease boundary. Green barriers will be created by plantation as per CPCB
Guidelines.

EIA/EMP report of Sand/Bajri Mine (With ML Area of 4280.0 ha) Tehsil Marwar Jn., District Pali, Rajasthan
EQMS INDIA PVT. LTD. 29
2.3. Need for the Project
A fast developing country like India, with its abnormally high population, has to keep pace with
the development worldwide and thus it requires development of large infrastructure projects in
the sector of surface transport, power, building industries etc. Huge quantities of raw
construction materials like Sand and Bajri mine are required in erecting vast civil engineering
structures of infrastructure works. The riverbed mining for obtaining raw construction material
is an important source besides rock-in-situ quarries. Hence, considering the demand of Sand
and Bajri & sufficient availability in the area, it is very much necessary to have Sand and Bajri
projects to sustain Infrastructure project as well as household requirement in the area and to
provide employment opportunities to the locals. The scientific extraction of sand / bajri from
river sections incidentally helps in lowering the high flood levels and at the same time reduce
the flooding situations of low lying areas near the river banks.
For meeting the huge demand of construction material like coarse and fine aggregate required
in building construction and infrastructure works, road material for construction and
maintenance of roads / highway material in Pali and Ajmer Division of Rajasthan. The natural
available materials in riverbed have found suitable from techno-economic consideration. The
mining project shall provide direct employment besides creation of additional jobs by way of
transportation. Apart from this, it will fetch huge revenue to state exchequer.
2.4. Location, Project Boundary and Project Site Layout
The mine lease area is linearly stretched under 127 revenue villages of tehsil Marwar Jn.,
district Pali, mentioned ibid. The geographical location is covered under SOI Toposheet no. 45
G/6, 45 G/9, 45 G/10, G/13 and 45G/14. Lease area can be approached from NH-14, SH-61,
SH-62 and SH-67. Distance of lease area on Marwar Junction side is approximately 10.0 km.
Various link roads on the river course stretch, merges with the tar road on Marwar Junction.
The site is approachable from through NH-14, SH-61, SH-62, SH-67 and DRS’.
2.5. Size or magnitude of Operation
The project envisages open cast Semi-Mechanized extraction of Sand/Bajri to an annual
maximum of 1.12 MMT, thereby implying that the daily production has been contemplated as
4000 metric tonne. The mining shall be carried out for 5 years, from stretches of wider river
course. The total area of mine lease is 4280.0 ha. The proponent were granted mining lease
for mining of sand and bajri for a period of five years.
2.6. Proposed Schedule for Implementation
The target production of Sand/Bajri mining during 5 year lease period from the mine is 4 MCM
(5.6 MMT). The mine will be worked on during the day shift only. The average number of

EIA/EMP report of Sand/Bajri Mine (With ML Area of 4280.0 ha) Tehsil Marwar Jn., District Pali, Rajasthan
EQMS INDIA PVT. LTD. 30
working days in the year would be 280. The annual production scheduled, as per approved
mining plan, is given in Table 2.1. It is revealed that the maximum proposed production in any
block is 0.3 million metric tonne.
Table 2.1 : Annual Production Schedule (Million Metric Tonne)
S.No. Year Block –A Block –B Block –C Block –D Block –E Total
1 I 0.145 0.19 0.225 0.26 0.3 1.12
2 II 0.2 0.195 0.215 0.225 0.285 1.12
3 III 0.165 0.2 0.22 0.25 0.285 1.12
4 IV 0.17 0.2 0.23 0.225 0.295 1.12
5 V 0.185 0.2 0.225 0.21 0.3 1.12
Total 0.865 0.985 1.115 1.17 1.465 5.60
2.7. Technology and Process Description
2.7.1. Method of Mining
River bed mining is for extracting sand from riverbed of Bandi, Lilki, Mithri, Kantaliyi, Khardi,
Sukri upper, Khari and Siriari Nala. As per RMMC Rules 1986, extraction is limited to 3.0 m
depth only from the surface area. River bed remains dry for most period of the year except for
few days in rainy season during which the mining activity is stalled. The collective stretch of
the lease area for each river has been sub-divided in to five blocks for ease of operation,
supervision, management and safety. Dry riverbed mining will be carried out as per the
approved production schedule. Light weight excavators will be deployed for extraction in 3.0 m
layer only forming one bench. This is as per the digging depth of the equipment. Mineral will
be loaded in tippers/trucks (20 tonne). The mining machinery and equipment and transportation
vehicles will be on hire/rental basis. Every block will be considered as a unit and will be
provided with all facilities like rest shelter, first aid facilities, drinking water arrangement. 3m
high bench will advance parallel to the bank of the river in available varying width after
secluding 10m wide bank offsets. Mine working will be restricted within the lease area.
However, movement of trucks after mineral loading will be towards both sides through
approach roads connecting to metaled link road either to NH-14, SH-61, SH-62 and SH-67
besides NH-8 for destination. Every block will have its own approach roads from riverbed
connecting to the nearest DR/ SH/NH.
2.7.2. Blasting
No blasting is proposed to be done.
2.7.3. Raw Material Required
No raw material is required for extraction of minerals.

EIA/EMP report of Sand/Bajri Mine (With ML Area of 4280.0 ha) Tehsil Marwar Jn., District Pali, Rajasthan
EQMS INDIA PVT. LTD. 31
2.7.4. Water Requirement and source
Water requirement for human consumption, plantation and dust suppression is 25 KLD, which
shall be met from ground water resource from nearby tube wells on payment basis. Marwar
Jn. block does not fall under notified area as per latest list of notified blocks for control and
regulation of ground water (http://www.cgwb.gov.in/CGWA/Notified_areas.html). The project
thus lies in Non-Notified Area and is neither covered under industrial/infrastructure projects nor
the mining activities shall intersect the ground water table and no dewatering of mining pit is
envisaged.
No NOC from the CGWA shall have to be obtained for abstraction of ground water in terms of
CGWA No. 21-4/Guidelines/CGWA/2009-832 dated 14.10.2009, as the water requirement (25
Kld) from ground water source does not exceed 25 Kld, the limit prescribed in the notification
dated 14.10.2009 in case of overexploited block like Marwar Jn. As the water requirement is
merely 25 Kld the project proponent can take supply from the authorized agencies. The daily
water requirement is shown in Table 2.2 and the water balance is shown in Figure 2.1.
Table 2.2 : Daily Water Requirement
S. No. Activities Demand (kld)
1. Dust suppression 15.0 2. Drinking / Domestic water need at mine site 4.0
3. Green Belt 6.0
Total 25.0
Figure 2.1 : Water Balance
Source:
Privately
Owned wells
25
04
15
06
Domestic
Use
Dust
Suppression
Green Belt
Residual Qty (3.2)
Discharge to Soak
Pit

EIA/EMP report of Sand/Bajri Mine (With ML Area of 4280.0 ha) Tehsil Marwar Jn., District Pali, Rajasthan
EQMS INDIA PVT. LTD. 32
2.7.5. Electric Power / Fuel
As the mining activities shall be carried out in broad day light upto 6pm everyday, there shall
be no need for lightening in the mining area. No electrical power shall be required for operations
of mining machinery which are diesel based prime movers. About 1.0 KLD of HSD oil shall be
needed as primary energy source for running of mining machinery. It will be arranged from the
nearby diesel outlet/depot.
2.7.6. Man Power Requirement
About 102 workforce including one Ist and IInd class mine manager under Rule 37N(1)(i)
RMMCR 1986, foreman, mine mates, supervisors, skilled operators and helpers, semi-skilled
and un-skilled workers shall be engaged for extraction of Sand/Bajri and loading and handling
of mineral in mining area, besides, watch and ward and plantation activity with proper
maintenance.
2.7.7. Extent Of Mechanization
The project is contemplated to win the mineral (Sand / Bajri) by Semi-Mechanized open cast
method of mining without blasting. For an optimum daily production of 4000 metric tonne
following inventory of excavators, loaders, transport and other light vehicles and the water
sprinklers shall be deployed.
S. No. Name of machinery Capacity Nos. Remark
1 Excavators 0.9 to 1.2 m 15 On hire
2 Tippers\ Trucks 20 tones 25 On hire
3 Water tanker 4000 liters 5 On hire
4 Pay loader JCB - 2 On hire
5 Light vehicles - 4 On hire
2.8. Project Description
2.8.1. Geological Reserve
The geological reserve of the lease area are assessed by multiplying the lease area with the
permitted depth of extraction i.e. three meter at each point. In the present case, the volume
shall be 128.4 million cubic meter. The conversion factor for sand as provided in RMMCR,
1986 has been adopted as 1.40 metric tonne/per cubic meter for working out the total tonnage
of material. Thus, geological reserves are 179.76 million metric tonne up to three meters depth
from the natural surface bed / level at any point, without taking into account the replenishment
factor.

EIA/EMP report of Sand/Bajri Mine (With ML Area of 4280.0 ha) Tehsil Marwar Jn., District Pali, Rajasthan
EQMS INDIA PVT. LTD. 33
2.8.2. Mineable Reserves and Targeted Production During Lease Period
The mineable reserves have been worked out by excluding from the geological reserves the
stipulated area to be left out from the mining, for the purpose of the safety and stability of the
structures (bridges) in the river section, controlling the immediate depletion of ground water
around the wells in the river sections and also from the ecological point of view, under the
following mandatory provisions of the RMMCR 1986 and standing orders of the Director of
Geology and Mines:
Under Rule 18 of Rules, 2012 of RMMCR, 1986 clause 32, the lessee shall abstain
from mining in riverbed beyond depth of 3.0 m from the surface and below the water in
such a manner that natural path of river/nallah is not altered”.
As per notification no F-14(1) Mins/Gr11/2012 dated 21 June 2012 from Dy. Secretary
to Government of Rajasthan clause 3, no person shall excavate Sand / Bajri beyond
the depth of 3.0 m from the surface below the water level of river / nallah and within 45
m of any rail/ road bridge.
10 m offset will also be left against the banks to protect side collapse/scouring and
riparian vegetation
A safety zone of 45.0 m radius shall be earmarked for the wells located in the river bed
section.
On the consideration of above, the block reserves have been assessed as:
a. Safety zone for bridge = 2.42 MCM (4.68 MMT)
b. Roads = 1.18 MCM (3.18 MMT)
c. Wells = 0.27 MCM (0.76 MMT)
d. Offset from bank of river = 18.05 MCM (9.66 MMT)
Total blocked reserves = 13.05 MCM (18.27 MMT)
Thus the mineable reserves are = 128.4 MCM – 13.05 MCM = 115.35 MCM or 161.49 MMT.
Targeted Production @ 1.12 MMT/year for 5 years = 4 MCM (5.6 MMT)
Daily Production= Annual Production/no. of mining days= 1, 120,000/280 = 4000 metric tonne
Balance Reserve = 115.35 MCM – 4 MCM = 111.35 MCM (155.89 MMT)
Thus, it is evident that out of the mineable reserve of 161.49 MMT only 5.6 MMT, which is
3.47% of the former, shall be extracted with in the 5 year lease period. This implies that more
than 96% of mineable reserve shall remain as repository which may be replenished in future
during flash floods resulting into high run-off in the catchment area and overflow from the
intercepted catchment of medium and minor dams/tanks.

EIA/EMP report of Sand/Bajri Mine (With ML Area of 4280.0 ha) Tehsil Marwar Jn., District Pali, Rajasthan
EQMS INDIA PVT. LTD. 34
2.8.3. Composition of River Bed material (Matrix)
Field survey and investigation of geological material excavated out of several dug wells and tube wells
from east to west of Pali district in Luni basin has revealed that mixed material of all size and grades,
rounded to angular, alternating with fluvial clay, concurrence sand and aeolin fine sand predominate
(Gupta et al, 1980, Pareek 1981, 1984:G.S.I. 1982; Wadhawan et al (1999) and Sareen 2002). The
index map of Luni river basin showing the litholog from dug well and tube well sections is shown in
Figure 2.2. The alluvium thickness increases from east to west and varies between 60m to 120m deep
in Pali district whereas in some area of Jalore district Alluvium thick of 300 m has been reported. The
deposition over the basement rock has started with clay and ended with multi-grained sand and gravel
sequences fining upwards. The percentage of these constituents is likely to vary from year to year
depending upon intensity, duration and frequency of rainfall and the volume of consequent run-off.
JODHPUR
MERTA CITY
AJMER
SINDARI
BALOTRALuni R.
BARMER
JALORSukri R.
DESURI
PALI
SANCHOR
SOJAT
Luni R.
BHAWATRA Luni
RANN OFKUCHCH
24.43.55.56.57.511.5
61 25
22
9
18
25
x+ +
++ +
35
18
220
xx
++
x x
5
1
Clay
Fine Sand
Calcrete
Medium Sand
Coarse Sand
Gravel
Conglomerate
125
8
2.53.7
335
7.6
1.54.62
19
181.53.0
1.5
3.0 m
NOT TO SCALE
DEPTH (m)
Pebbly Cobbly
Sand Stone
Rhyolite
Granite
Quartzite
Pegmatite
Phyllite
Schist
Gneiss
LEGEND
61
1
5+
240 2
8
3
5
1216
96.5
6 2
5
10.512.5
3161821 150
80
16
5
Scale
0 40km
26°
25°
72° 73° 74°
72° 73° 74°
26°
25°
6175
85
Sogi R.
225
315
80
35
267
B
N
Figure 2.2 : Index Map of Luni River Basin Showing the Litholog from Dug Well and Tube Well Sections

EIA/EMP report of Sand/Bajri Mine (With ML Area of 4280.0 ha) Tehsil Marwar Jn., District Pali, Rajasthan
EQMS INDIA PVT. LTD. 35
2.8.4. Anticipated life of Mine
Since the deposition of bed material and its transportation by the tractive force created during
high floods resulting from severe storms is a natural and frequent phenomenon, the mined out
area periodically gets deposited when the high discharge passes over it. In the present case 3
m deep excavated pit due to mining shall act as a depressed basin in the river bed and function
as settling tank for the sediments during the passage of flood and also for settling of silt and
clay which remain in suspension. In view of the fact that the linear river bed mining is not carried
out in the whole river length but at some selected places where the good quality material has
aggraded, the abrupt change in the riverbed slope at the place of mining induces sediment
towards the mining pits through its sloping sides. The life of mine can be considered as
continuous/ perpetual as long as the rate of sediment aggradations within the mined out area
is either equal to or in excess of the rate of extraction of the river bed material. In the present
case the area mined out in any year in any block shall not be considered for mining during the
lease period of five years.
2.8.5. Year-wise production since 1994
Consequent upon the e-auction conducted by the state government under the provisions of
RMMC 1986 revised upto 2012, the letter of intent was granted vide Rajasthan State
Government order no P.8 (2) Khan/Gr. – 2/2013, Jaipur dated 13th Feb 2013 in favour of M/s
Kuber Associates for river-bed mining of minor mineral Sand (Bajri) over an area of 4280.00
ha covered under river stretches within bounds of 127 different revenue villages in Tehsil
Marwar Jn., District Pali. The project proponent was not entitled to carry out mining operation
in the period anterior to the date of issue of letter of intent. However, the Hon’ble Apex Court
of India in its order dated 25.11.2013, in SLP 34134, has granted interim relief for carrying out
mining operation till the end of February 2014 to such holder of letter of intent who have
submitted their application to the MoEF for clearance. The Hon’ble Supreme Court in its order
dated 27-03-2014 has directed that the interim relief for carrying mining operation is extended
till further hearing and passing of order. In the light of the interim relief by the Hon’ble Apex
Court, the LoI has executed the mining operation and during period December 2013 and upto
November 2014, has won 227426 metric tonne, the monthly production details are given below:
S.NO MONTH QUANTITY
1 Dec-13 456
2 Jan-14 19348
3 Feb-14 34366
4 Mar-14 20633
5 Apr-14 21824
6 May-14 21508
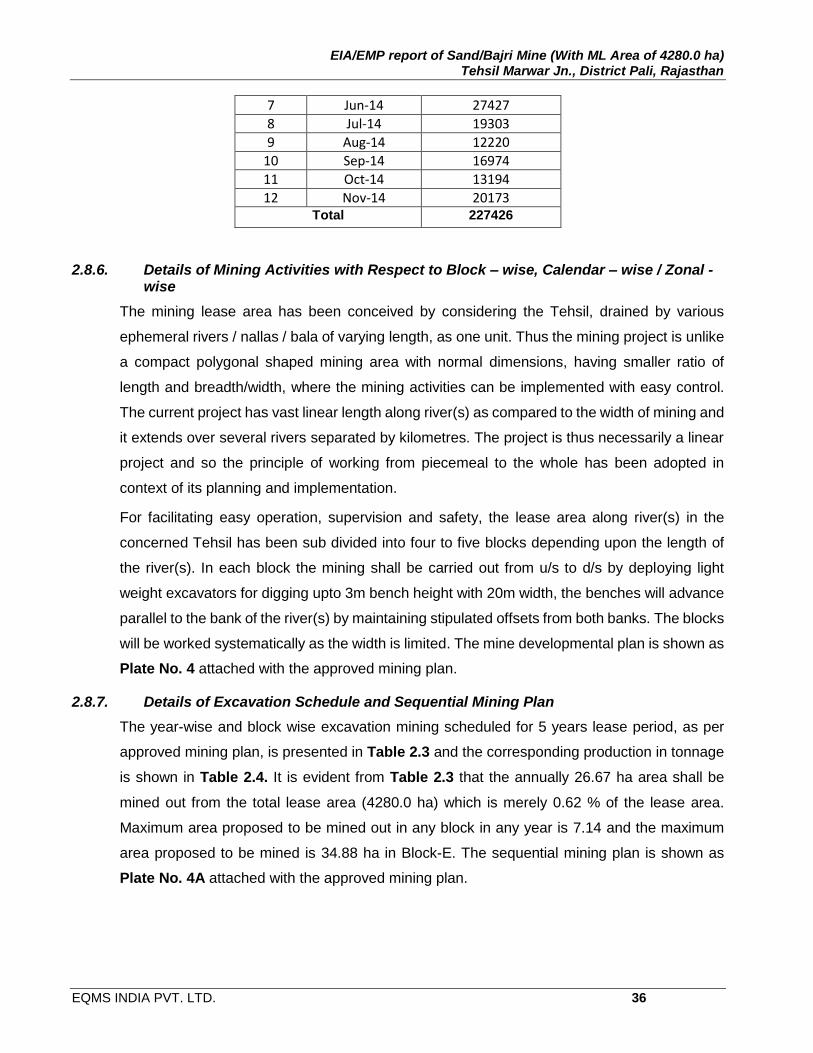
EIA/EMP report of Sand/Bajri Mine (With ML Area of 4280.0 ha) Tehsil Marwar Jn., District Pali, Rajasthan
EQMS INDIA PVT. LTD. 36
7 Jun-14 27427
8 Jul-14 19303
9 Aug-14 12220
10 Sep-14 16974
11 Oct-14 13194
12 Nov-14 20173
Total 227426
2.8.6. Details of Mining Activities with Respect to Block – wise, Calendar – wise / Zonal - wise
The mining lease area has been conceived by considering the Tehsil, drained by various
ephemeral rivers / nallas / bala of varying length, as one unit. Thus the mining project is unlike
a compact polygonal shaped mining area with normal dimensions, having smaller ratio of
length and breadth/width, where the mining activities can be implemented with easy control.
The current project has vast linear length along river(s) as compared to the width of mining and
it extends over several rivers separated by kilometres. The project is thus necessarily a linear
project and so the principle of working from piecemeal to the whole has been adopted in
context of its planning and implementation.
For facilitating easy operation, supervision and safety, the lease area along river(s) in the
concerned Tehsil has been sub divided into four to five blocks depending upon the length of
the river(s). In each block the mining shall be carried out from u/s to d/s by deploying light
weight excavators for digging upto 3m bench height with 20m width, the benches will advance
parallel to the bank of the river(s) by maintaining stipulated offsets from both banks. The blocks
will be worked systematically as the width is limited. The mine developmental plan is shown as
Plate No. 4 attached with the approved mining plan.
2.8.7. Details of Excavation Schedule and Sequential Mining Plan
The year-wise and block wise excavation mining scheduled for 5 years lease period, as per
approved mining plan, is presented in Table 2.3 and the corresponding production in tonnage
is shown in Table 2.4. It is evident from Table 2.3 that the annually 26.67 ha area shall be
mined out from the total lease area (4280.0 ha) which is merely 0.62 % of the lease area.
Maximum area proposed to be mined out in any block in any year is 7.14 and the maximum
area proposed to be mined is 34.88 ha in Block-E. The sequential mining plan is shown as
Plate No. 4A attached with the approved mining plan.
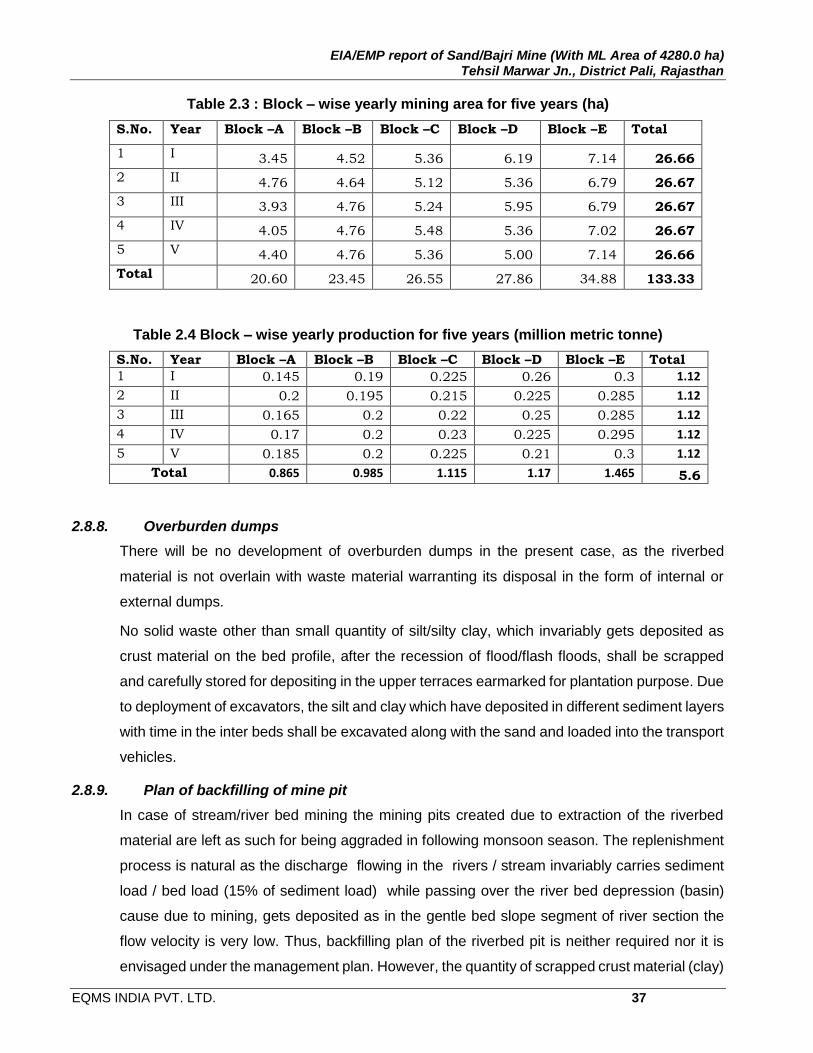
EIA/EMP report of Sand/Bajri Mine (With ML Area of 4280.0 ha) Tehsil Marwar Jn., District Pali, Rajasthan
EQMS INDIA PVT. LTD. 37
Table 2.3 : Block – wise yearly mining area for five years (ha)
S.No. Year Block –A Block –B Block –C Block –D Block –E Total
1 I 3.45 4.52 5.36 6.19 7.14 26.66
2 II 4.76 4.64 5.12 5.36 6.79 26.67
3 III 3.93 4.76 5.24 5.95 6.79 26.67
4 IV 4.05 4.76 5.48 5.36 7.02 26.67
5 V 4.40 4.76 5.36 5.00 7.14 26.66
Total 20.60 23.45 26.55 27.86 34.88 133.33
Table 2.4 Block – wise yearly production for five years (million metric tonne)
S.No. Year Block –A Block –B Block –C Block –D Block –E Total
1 I 0.145 0.19 0.225 0.26 0.3 1.12
2 II 0.2 0.195 0.215 0.225 0.285 1.12
3 III 0.165 0.2 0.22 0.25 0.285 1.12
4 IV 0.17 0.2 0.23 0.225 0.295 1.12
5 V 0.185 0.2 0.225 0.21 0.3 1.12
Total 0.865 0.985 1.115 1.17 1.465 5.6
2.8.8. Overburden dumps
There will be no development of overburden dumps in the present case, as the riverbed
material is not overlain with waste material warranting its disposal in the form of internal or
external dumps.
No solid waste other than small quantity of silt/silty clay, which invariably gets deposited as
crust material on the bed profile, after the recession of flood/flash floods, shall be scrapped
and carefully stored for depositing in the upper terraces earmarked for plantation purpose. Due
to deployment of excavators, the silt and clay which have deposited in different sediment layers
with time in the inter beds shall be excavated along with the sand and loaded into the transport
vehicles.
2.8.9. Plan of backfilling of mine pit
In case of stream/river bed mining the mining pits created due to extraction of the riverbed
material are left as such for being aggraded in following monsoon season. The replenishment
process is natural as the discharge flowing in the rivers / stream invariably carries sediment
load / bed load (15% of sediment load) while passing over the river bed depression (basin)
cause due to mining, gets deposited as in the gentle bed slope segment of river section the
flow velocity is very low. Thus, backfilling plan of the riverbed pit is neither required nor it is
envisaged under the management plan. However, the quantity of scrapped crust material (clay)

EIA/EMP report of Sand/Bajri Mine (With ML Area of 4280.0 ha) Tehsil Marwar Jn., District Pali, Rajasthan
EQMS INDIA PVT. LTD. 38
which is in excess of the quantity required for plantation purpose in upper terraces shall be
deposited in the riverbed pit.
2.8.10. Solid Waste Generation & its Disposal
No solid waste other than silt/clay, which deposits as crust material on the bed profile, shall be
scrapped and deposited into the mine pits or in the upper terraces earmarked for plantation.
Considering 1cm thickness of silt/mud on the existing river bed surface for annual mining area
of 26.67 ha approximately 2667 cum (3734 metric tonne) of silt and clay shall be scrapped.
The year-wise estimation of quantity of solid waste is shown in Table 2.5. Thus in the entire
lease period 13333 cubic meter of silt and clay (18670 metric tonne) shall be produced.
Table 2.5 : Year-wise Production of Solid waste (Cubic Meter)
Year Block –A Block –B Block –C Block –D Block –E Total
I 345 452 536 619 714 2666
II 476 464 512 536 679 2667
III 393 476 524 595 679 2667
IV 405 476 548 536 702 2667
V 440 476 536 500 714 2666
Total 2059 2344 2656 2786 3488 13333
2.8.11. Liquid Effluent
There will be no wastewater generation from mining activities per se. However, the liquid
effluent to the tune of 3.2 KLD shall be generated, due to domestic water use, which shall be
processed in septic tanks/soak pits built integrally with the flush compost toilet.
2.8.12. Mineral Transportation
Mined out material will be directly loaded into the trucks/tippers (20 MT) by deploying JCB/Pay
loaders which will be used on hired. The loaded material shall be hauled by covered/hooded
trucks which shall ply approximately 1.5 km within the Katcha path in the riverbed before
reaching the metal link roads/district roads. The movement of trucks after mineral loading will
be towards both sides through approach roads connecting to metaled link road and then to
NH-14 for destination. Every block, which is well connected to main highway, will have its own
approach roads. For transporting mineral to the nearby villages tractor / trolleys (6MT) shall
also be deployed. Loaded truck will be directly dispatched to the sale points / markets and no
trucks will be allowed to park idly with in the riverbed section especially after 6 pm. For
transportation of maximum daily production of 4000 MT, about 100 trucks shall be deployed
considering that each tipper/ truck shall make two trips per day. Considering the existing road
network, the surface transport by road is the cheapest and economically viable proposition.
The maximum production shall be from Bandi river near village Dhanla which is well connected

EIA/EMP report of Sand/Bajri Mine (With ML Area of 4280.0 ha) Tehsil Marwar Jn., District Pali, Rajasthan
EQMS INDIA PVT. LTD. 39
to SH-61 and is about 4 km from it.
2.8.13. Site Services
Proper site services such as First Aid, Rest Shelter, and Drinking Water will be provided to the
mine workers. Rest shelter along with first-aid station complying with all the provisions of Mines
Rules shall be provided by the project proponent. Water will be supplied for human
consumption, dust suppression and for plantation. The mine will work in day time only, so no
lighting arrangement will be required. Employee will report to the duty on their own means.
Mobile phones shall be used for communication. Appropriate security arrangement shall be
made.
2.8.14. Proposed Infrastructure
As the project will be enlisting local workers for the mining as well as for transportation of
minerals no infrastructure for their residential purposes is needed. The drinking water supply
to the worker will be provided by arranging from nearby tube wells. The latrine / urinal with the
mine rest shelter will have its own septic tank. No mining/industrial/solid waste requiring special
management would be generated.
2.9. Site Elevation, Working Depth and Groundwater Table
The semi-mechanized river bed mining in 3m depth (maximum) shall be carried out in the
riverbed section of numerous river draining the Tehsil. The lease area is a linear area along
different river(s) like Bandi, Lilki, Mithri, Kantaliyi, Khardi, Sukri upper, Khari and Siriari Nala
which cover a longitudinal profile of 62 km, 36 km, 12 km, 22.5 km, 23 km, 33 km, 13.5 km and
30 km respectively in the Tehsil. All these rivers are ephemeral rivers and influenced by nature
due to good alluvium material constituting their river bed matrix. The trend of the ground water
table follows the trend of the natural drainage. The longitudinal profile of the rivers, showing
river bed elevation at different RD, the elevation of the mining floor (pit) corresponding to 3m
depth of mining and the depth to the ground water table based on nearby wells and past
measurement of ground water depth carried out by the ground water department , separately
for each river have been prepared. The groundwater table shall not intersect with the bottom
of mining pits. The schematic view showing average natural surface level, bottom pit level and
GWT for each river is shown in Figure 2.3 through 2.10.

EIA/EMP report of Sand/Bajri Mine (With ML Area of 4280.0 ha) Tehsil Marwar Jn., District Pali, Rajasthan
EQMS INDIA PVT. LTD. 40
Figure 2.3 :Schematic Diagram of Mine Working in Bandi River
Figure 2.4 :Schematic Diagram of Mine Working in Lilki River
220
270
320
370
420
470
520
570
0 10 20 30 40 50 60 70
El m
mas
l
R.D. (m)
River Bed Elevation (masl) EL of Mining Pit EL of GWT (Post Monsoon-13)
250
270
290
310
330
350
370
0 5 10 15 20 25 30 35 40
El m
mas
l
R.D. (m)
River Bed Elevation (masl) EL of Mining Pit EL of GWT (Post Monsoon-13)

EIA/EMP report of Sand/Bajri Mine (With ML Area of 4280.0 ha) Tehsil Marwar Jn., District Pali, Rajasthan
EQMS INDIA PVT. LTD. 41
Figure 2.5 :Schematic Diagram of Mine Working in Mithri River
Figure 2.6 :Schematic Diagram of Mine Working in Kantyali River
220
225
230
235
240
245
250
255
260
265
270
0 2 4 6 8 10 12 14
El m
mas
l
R.D. (m)
River Bed Elevation (masl) EL of Mining Pit EL of GWT (Post Monsoon-13)
260
280
300
320
340
360
380
400
420
0 5 10 15 20 25
El m
mas
l
R.D. (km)
River Bed Elevation (masl) EL of Mining Pit EL of GWT (Post Monsoon-13)

EIA/EMP report of Sand/Bajri Mine (With ML Area of 4280.0 ha) Tehsil Marwar Jn., District Pali, Rajasthan
EQMS INDIA PVT. LTD. 42
Figure 2.7 :Schematic Diagram of Mine Working in Khardi River
Figure 2.8 :Schematic Diagram of Mine Working in Siriari River
235
240
245
250
255
260
265
270
275
280
285
0 5 10 15 20 25
El m
mas
l
R.D. (km)
River Bed Elevation (masl) EL of Mining Pit EL of GWT (Post Monsoon-13)
250
300
350
400
450
500
550
0 5 10 15 20 25 30 35
El m
mas
l
R.D. (m)
River Bed Elevation (masl) EL of Mining Pit EL of GWT (Post Monsoon-13)

EIA/EMP report of Sand/Bajri Mine (With ML Area of 4280.0 ha) Tehsil Marwar Jn., District Pali, Rajasthan
EQMS INDIA PVT. LTD. 43
Figure 2.9 :Schematic Diagram of Mine Working in Sukri River
Figure 2.10 :Schematic Diagram of Mine Working in Khari River
250
270
290
310
330
350
370
390
0 5 10 15 20 25 30 35
El m
mas
l
R.D. (m)
River Bed Elevation (masl) EL of Mining Pit EL of GWT (Post Monsoon-13)
230
240
250
260
270
280
290
0 2 4 6 8 10 12 14 16
El m
mas
l
R.D. (m)
River Bed Elevation (masl) EL of Mining Pit EL of GWT (Post Monsoon-13)
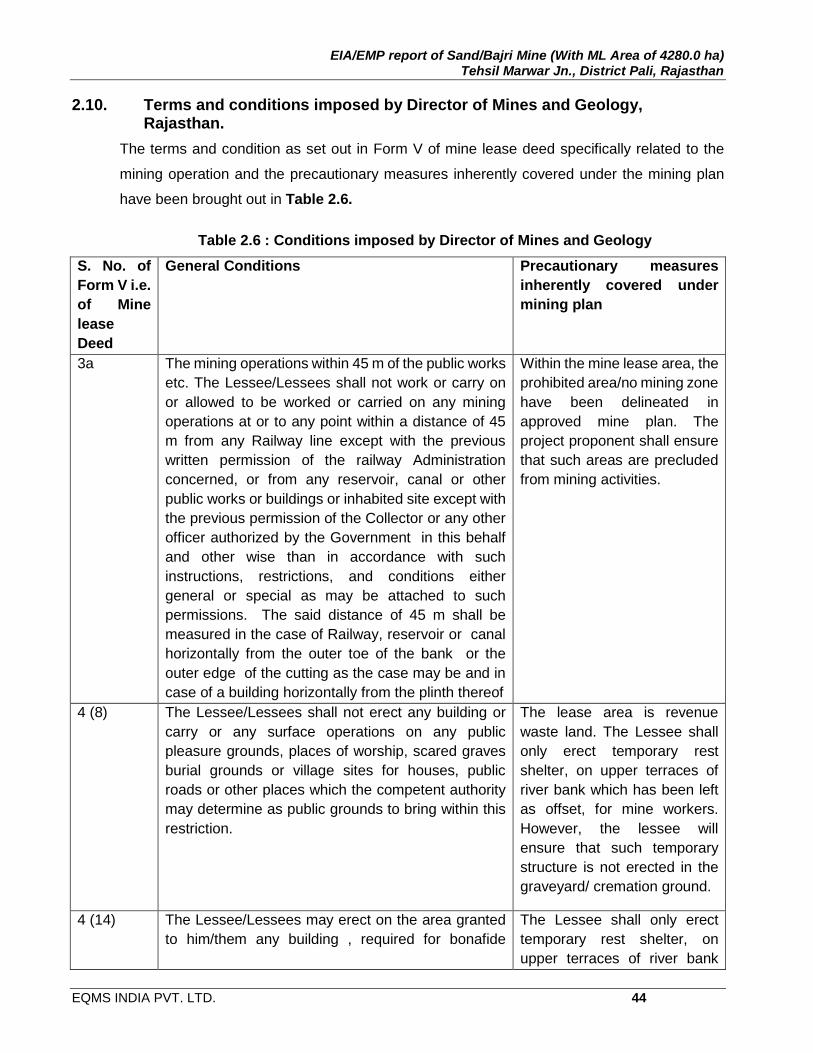
EIA/EMP report of Sand/Bajri Mine (With ML Area of 4280.0 ha) Tehsil Marwar Jn., District Pali, Rajasthan
EQMS INDIA PVT. LTD. 44
2.10. Terms and conditions imposed by Director of Mines and Geology, Rajasthan.
The terms and condition as set out in Form V of mine lease deed specifically related to the
mining operation and the precautionary measures inherently covered under the mining plan
have been brought out in Table 2.6.
Table 2.6 : Conditions imposed by Director of Mines and Geology
S. No. of
Form V i.e.
of Mine
lease
Deed
General Conditions Precautionary measures
inherently covered under
mining plan
3a The mining operations within 45 m of the public works
etc. The Lessee/Lessees shall not work or carry on
or allowed to be worked or carried on any mining
operations at or to any point within a distance of 45
m from any Railway line except with the previous
written permission of the railway Administration
concerned, or from any reservoir, canal or other
public works or buildings or inhabited site except with
the previous permission of the Collector or any other
officer authorized by the Government in this behalf
and other wise than in accordance with such
instructions, restrictions, and conditions either
general or special as may be attached to such
permissions. The said distance of 45 m shall be
measured in the case of Railway, reservoir or canal
horizontally from the outer toe of the bank or the
outer edge of the cutting as the case may be and in
case of a building horizontally from the plinth thereof
Within the mine lease area, the
prohibited area/no mining zone
have been delineated in
approved mine plan. The
project proponent shall ensure
that such areas are precluded
from mining activities.
4 (8) The Lessee/Lessees shall not erect any building or
carry or any surface operations on any public
pleasure grounds, places of worship, scared graves
burial grounds or village sites for houses, public
roads or other places which the competent authority
may determine as public grounds to bring within this
restriction.
The lease area is revenue
waste land. The Lessee shall
only erect temporary rest
shelter, on upper terraces of
river bank which has been left
as offset, for mine workers.
However, the lessee will
ensure that such temporary
structure is not erected in the
graveyard/ cremation ground.
4 (14) The Lessee/Lessees may erect on the area granted
to him/them any building , required for bonafide
The Lessee shall only erect
temporary rest shelter, on
upper terraces of river bank

EIA/EMP report of Sand/Bajri Mine (With ML Area of 4280.0 ha) Tehsil Marwar Jn., District Pali, Rajasthan
EQMS INDIA PVT. LTD. 45
mining purposes and such building shall be the
property of the government after expiry of the lease
which has been left as offset,
for mine workers. However,
these structures shall be
dismantled at the expiry of the
lease
6 (2) The Lessee/Lessees shall keep throughout the terms
of his /their lease all mines, building, engines,
machinery and other mining plants in good repair and
working order.
The lessee shall ensure proper
maintenance of rest shelters /
toilets. The mining and
transport equipment’s shall be
procured on hire / rental basis
and the onus of their regular
maintenance lies with the
owners. However the lessee
will ensure that only useful and
well maintained equipments
are used in mining activities.
6 (8) The lessee / lessees shall keep open and in no way
obstruct any road path or way by any means
whatsoever.
The approved mine plan has
been prepared considering
that no mining operations is
carried out within the distance
of 45m from any public road.
6 (11) The lessee / lessees shall not cultivate or use the land
save for the purposes of the lease.
The lease area lies in gair
mumkin nadi/nala and its
designated use as per mine
plan is only for the purpose of
mining.
6 (13) The lessee / lessees shall not injure or cause to
deteriorate any sources of water power or water
supply and shall not in any other way render any
spring of streams of water supply and shall not in any
other way render any spring of stream of water unfit
to be used or do anything to injure adjoining lands,
villages or houses.
The approved mine plan has
been prepared considering
that no mining operations is
carried out within the distance
of 45m from any source of
water supply or stream/spring,
canal, reservoir or well.
2.11. Statutory / Necessary Approvals.
2.11.1. Consent to Operate under Water Act and Air Act
Under Rule 37T of RMMC 1986 revised upto 2012, the consent to establish has to be obtained
from the RSPCB prior to the start of mining operation. The lessee has to seek permission from
the RSPCB, if not already obtained.

EIA/EMP report of Sand/Bajri Mine (With ML Area of 4280.0 ha) Tehsil Marwar Jn., District Pali, Rajasthan
EQMS INDIA PVT. LTD. 46
2.11.2. NOC/Approval From CGWA For Abstraction Of Water
Marwar Jn. block does not fall under notified area as per latest list of notified blocks for control
and regulation of ground water. No NOC from the CGWA shall have to be obtained for
abstraction of ground water (25Kld) in terms of CGWA No. 21-4/ Guidelines/ CGWA/ 2009-832
dated 14.10.2009, as the water requirement from ground water source does not exceed 25 Kld
the limit prescribed in the notification dated 14.10.2009 in case of over-exploited block like
Marwar Jn.
2.11.3. Restriction – Aravali Range Under Notification S.O. 319 (E) Dated 7-05-1992
In so far as for the state of Rajasthan is concerned, the provision under the said notification
were originally attracted in case of district Alwar only. As the proposed mining is contemplated
in Tehsil Marwar Jn. in non-forested area, which is other than the area notified under
notification, the restrictions do not apply. A certificate issued by the competent authority in the
state government, to the effect that the project area (ML Area) does not fall in the Aravali range
and is not covered by the order dated 8.04.2005 of the Hon’ble Apex Court in the contempt
petition (C) 412/2004 in writ petition 202/1995 in the matter of Godavarman v/s UoI, is enclosed
as Annexure - IV.
2.11.4. Critically Polluted Industrial Cluster / Area Identified by CPCB
The MoEF vide O.M. No. J-11013/5/2010-IA.II (I) dated 13.1.2010 had imposed upto August
2010, a temporary moratorium in respect of 43 Critically Polluted Areas / Industrial Clusters
identified by CPCB on the basis of Critically Environmental Pollution Index (CEPI). The
identified critically polluted area inter-alia included existing industrial area Mandia Road,
Puniyata Road, Sumperpur and Pali town in district Pali (S.No. 31, CEPI 73.73). The MoEF
lifted the moratorium on consideration of projects for EC in respect of 26 industrial clusters /
area vide O.M.s of even no. dated 26th October , 2010, 15th February, 2011, 31st March
2011, 23rd May 2011 and 5tyh July 2011. In the remaining 17 identified industrial clusters, the
moratorium was extended upto 31st March, 2012 and thereafter it was extended till further
orders vide OM of even no. dated 30.03.2012. The CPCB during February – April 2013 re-
assessed the CEPI scores in respect of all 43 CPAs and inferred that the CEPI values were
either still above 80 or above 70 along with increasing trend. The MoEF vide O.M. No. J-
11013/5/2010-IA.II (I) dated 17.9.2013 had re-imposed moratorium in respect of 8 areas viz.,
Ghaziabad (U.P.), Indore (M.P.), Jharsuguda (Orissa), Ludhiana (Punjab), Panipat (Haryana),
Patancheru-Bollaram (A.P.), Singraulli (U.P. and M.P.) and Vapi (Gujarat). Therefore,
technically at present there is no moratorium on consideration of projects for EC in respect of

EIA/EMP report of Sand/Bajri Mine (With ML Area of 4280.0 ha) Tehsil Marwar Jn., District Pali, Rajasthan
EQMS INDIA PVT. LTD. 47
industrial cluster/area identified in 2010 in district Pali, Rajasthan. The mining plans for tehsil
Marwar Jn. has been approved by the Department of Geology and Mines Rajasthan. Therefore
no clearance certificate from the SPCB is warranted.
EIA/EMP report of Sand/Bajri Mine (With ML Area of 4280.0 ha) Tehsil Marwar Jn., District Pali, Rajasthan
EQMS India Pvt. Ltd. 48
CHAPTER 3. : Description of the Environment
3.1. Introduction
For the description of baseline environmental scenario, the proposed mine lease area has
been considered as the core zone. The project has vast linear length along river(s) as
compared to the width of mining and it extends over several rivers separated by
kilometers. The project is thus necessarily a linear project extending over different rivers
in concerned Tehsil. Thus to arrive at a more reasonable study, the buffer area that falls
within 2 km radius from the extremities of the proposed mine lease area in each river has
been adopted for determination of baseline status.
The existing environmental setting is considered to assess and define the present baseline
environment, which are described with respect to climate, hydro-geological aspects,
atmospheric conditions, water quality, soil quality and ecology. It would help in assessing
the cumulative environmental impacts due to the proposed project.
As per prescribed ToR, collection of one season (Non-Monsoon) primary baseline data on
environmental parameters i.e. Ambient Air Quality (PM10, SO2 and NOx), water quality,
Noise level, Soil, flora and fauna and site specific meteorological data has to be done.
This report incorporates the baseline data generated through primary surveys during
October 2013 to December 2013 covering one season i.e. post monsoon to which the
committee agreed and allowed in the prescribed ToR. The study area, covered under SoI
Toposheets 45 G/6, 45 G/9, 45 G/10, G/13 and 45G/14 on 1:50000 scale, is shown in
Figure 3.1, the satellite image of the study area is shown in Figure 3.2 and the pictorial
view of one of the mining site on river is shown in Figure 3.3.

EIA/EMP report of Sand/Bajri Mine (With ML Area of 4280.0 ha) Tehsil Marwar Jn., District Pali, Rajasthan
EQMS India Pvt. Ltd. 49
Figure 3.1 : Project Location Map on Toposheets
Figure 3.2 : Satellite view of the Project Site

EIA/EMP report of Sand/Bajri Mine (With ML Area of 4280.0 ha) Tehsil Marwar Jn., District Pali, Rajasthan
EQMS India Pvt. Ltd. 50
Sukri River at Phulad
Bandi river at Bhagora

EIA/EMP report of Sand/Bajri Mine (With ML Area of 4280.0 ha) Tehsil Marwar Jn., District Pali, Rajasthan
EQMS India Pvt. Ltd. 51
Siriari River near Siriari
Figure 3.3 : Pictorial View of Sukri River at Phulad and Bandi river at Bhagora and Siriari river near Siriari
3.1.2. Methodology
Standard methodologies have been followed in developing the base line report. The
methodology adopted for the study is outlined below:
Conducting reconnaissance surveys for understanding the study area; and
Selecting sampling locations for conducting various environment baseline studies.
The sampling locations have been selected on the basis of the following:
Predominant wind directions recorded by the Indian Meteorological Department
(IMD) observatory nearest to the site;
Existing topography;
Drainage pattern and location of existing surface water bodies like lakes/ponds,
rivers and streams;
Locations of villages / towns / sensitive areas; and
Areas, which represent baseline conditions.
The field observations have been used to:
Assess the positive and negative impacts due to the proposed project;

EIA/EMP report of Sand/Bajri Mine (With ML Area of 4280.0 ha) Tehsil Marwar Jn., District Pali, Rajasthan
EQMS India Pvt. Ltd. 52
Suggest appropriate mitigation measures for remediating the adverse environmental
impacts, if any; and
Suggesting post-project monitoring requirements and suitable mechanism for it.
3.2. Physiography, Topography and Drainage
3.2.1. Physiography
The proposed mine lease area falls under Tehsil Marwar Jn., District Pali of Rajasthan.
Physio-graphically the area is one of the four major divisions of Great Plain of Northern
India and constitutes its western extremity covering east and west Rajasthan. The area
lies to the west of Aravallies and is known as western sandy plain characterized by arid
landscape, barren hills, level rocky structural plains, rock cut pediments, gravel
pavements, shallow colluvium plains and other sandy plains with thick Alluvium
underneath. The district having arid climate is drained by ephemeral rivers like Lilri, Bandi,
Sukri, Jawai, Khari and Rediya which flow from east to west and south to west from the
western aspect of Aravalli range. All these rivers are left bank tributaries of the Luni River
which is the only biggest system in this region.
The district with spatial extent of 12387 sq.km which is 3.62% of the area of the state, has
geographic location as Latitude 24.750 to 26.4830 North and Longitude 72.7830 to 74.300
East. It shares its border with Nagaur and Jodhpur districts in the North, Udaipur and
Rajsamand in south – east, Ajmer in North – East, Sirohi and Jalore district in south-west
and west respectively. The administrative map of the district is shown in Figure 3.4.
The boundary of mine lease area in Tehsil Marwar Jn., has Pali on its West and Sojat
Tehsil on its North, Desuri Tehsil on its south and south-west and Ajmer and Rajsamand
district on its West respectively. The physiographic map of Rajasthan is shown in Figure
3.5.
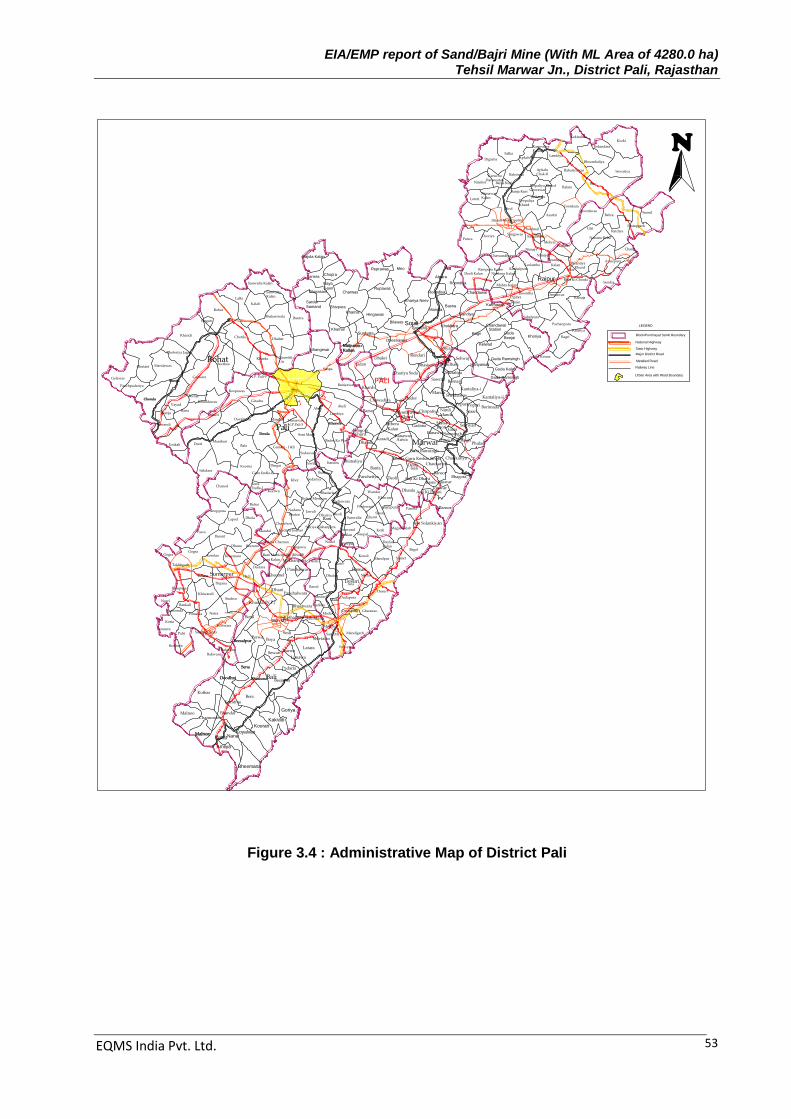
EIA/EMP report of Sand/Bajri Mine (With ML Area of 4280.0 ha) Tehsil Marwar Jn., District Pali, Rajasthan
EQMS India Pvt. Ltd. 53
Bheemana
NanaMalnoo
Amliya
Bohat
Koyalvao
Kooran
Kakradi
Goriya
MarwarRanawasAuwaKaradi
BithoraKalan
Gadana
Phulad
MalsaBaori
RanawasGura
Soorsingh
Guru Soot Singh
ChaukariyaJanuda Guru Keshar Singh
Chaukariya
BansorBhagora
Basni Jojawar
JojawarAnji Ki DhaniDhanla
Bansor
Anji Ki Dhani
DeoliIsali
Deoli
Khurd
Banta
Panchetiya
Bhimaliya
Dhamli
Hingola
Chawadiya
BarsaManda
Dudor
HemliyawasKhurd
Chirpatiya
Manda
NimliBorimada
Saran
Seeriyari
VopariVopari
Kantaliya-ii
Kantaliya-i
Bornari
Shekhawas
Sawrad
Musaliya
Dhakri
Dhundhala
Sehwaj
Siyat
Rendari
Sinla
Khardi
Gura Ramsingh
Jadan Bhasisana
Malnoo
Doodhni
Bera
Malnoo
Kothar
Kumtiya
BhandarChamunderi
Bhatoono
Sena
BaliDoodhni Bhatoono
Sena
Beejapur
BeesalpurPerwa
Boya
Sewari Barwa
Lunawa
Padarla
Latara
Shivtalao
Sesli
Beesalpur
Bali (M)MundaraKothaliyan
Bheetwara
PanchalwaraDhani
Khudala(N.P.)
Beral
Kheemel
Panchalwara
Makhanpura
Mandigarh
Dudapura
Sari (M)
Ranakpur
Markha
MadaGhanerao
DudapuraMada
Markha
Sindarli
Ana
Narlai
Dadai
Dhalop
Barod
Kotri
KesuliMandpur Sumer
Bagol
DaylanKalan
Magar Talab
Desuri
Nadol
BakwanaBakwana
Balupura
BankaliNowi
PomawaBharoonda
Netra
Sindroo
Parothija
Koliwara
Sumarpur(M)
Bamnera
Palri
Khiwandi
Bamnera
Korta
SumarpurBalana
Dujana
I & Ji
Deotara
KoselaoGogra
Kheemara
Dhana Beerami
BasantPawa
Lapod Dhola
Anoppura
Gogra
Takhbgarh
Chanod
Sewariya
Bhoombaliya
Kekindara
Kurki
Ras
Lambiya
Rabariyawas
Kekindara
Balara
ApkaluChak-II
PeepaliyaKhurd
Jaitaran
Banja Kuri
Peepaliya KhurdGhorawar
Jitarah Municipality
Birol
Asarfai
Toonkara
PatwaDeoriya
Chawandiya
Nimaj-i
Nimaj-ii
SangawasSangawas
Mohrai
Phoolmal
Baloonda
Banja Kuri
KanechaRanawatan
Ramawas'KalanLototi
Digarna
Falka
Nimbol
KanwaliyaKallan
Apkalu-I
ChandawalStation
GudaBeejai
Bagri
Kelwad
Guda Ramsingh
Khoriya
Guda Ramsingh
Guda KalanHariyamali
Khariya Soda
Shivpura
SardarSamand
Dhurasani Charwas
Naya
Gaon
ChopraLanera
Rajola Kalan
Surdyata
Bhangesar
Khamal
MalpuriyaKallan
Bilawas Sojat
Khariya Neev
Hingawas
Reprawas Meo
Rupawas
Sojat(M)
Chandawal
Basna
Sandiya
Karmawas
Atpara
Roondiya
Roondiya
Mandla
Dheenawas
Khokhara
Malpuriya
Karlan
Khamal
N.P. Pali 9
Giradra
DavalpuraBhawri
Denda
PaliHemawasN.P.Pali 5
MandaliKherwa
Akeli
Lambiya
Akeli
Sanpa
Baniyawas
Roopawas
DeeriManihari
Bala
Denda
KoornaSakdara
Soni Manji
Bader Ka Was
Kherwa
Gura Endla-II
GuraEndla-I
Dingai
Gundoj - I &li
Sodawas
GarwaraBeenja
BeenjaChenda
Khundawas
RanaBeenja
Diwandi
Vayad
Umkali
Khandi
Dholeriya Jagri
Khutani Mandawas
Rohat
Beenja
Chenda
Gelawas
Panchpadariya
Chotila
Singari
Rohat
SanwaltaKalan
Lalki
Kalali
Bhakariwala Jheetra
Dhabar
Kharda NeembliUri
Beethoo
Sanwalta KalanRaipur
Leelamba
Birantiya
Kalan BirantiyaKhurd
Bar
Nanana Relra
Hajiwas
RatdiyaGiri
Boontiwas
Pratapgarh
Sumel
Sendra
Babra
Chang
Amarpura
Sabalpura
Kala Ki Chouki
KanujaDeepawasJhoontha
Pipliya
Kalan
Pachanpura
Bagri
Kalaliya
Kot Kirana
Kushalpura
Mohra Kalan
Nimbera KalanRampura Kalan
Deoli Kalan
Desuri
Desuri
Jawali
Chanchori
Nadana
RaniBhatan
Itdara MertiyanIndarwara
DeoliSanwalta
Dhariva
Salriya KishanpuraJeewand
kalan
Ghenri
Neepal
PeelowaniPanota
Kerli
Neepal
Siwas
Gajnipura
Wandar
Khiwara
Bhadarlau
Busl
Khor Sedariya
Keerwa
ItandraTewali
Balrai
Mandal Nadana Jodhan
Itdara Charnan
Rani Municipality (Khurd)
Beejowa
Rani Kalan
Kot Solankiyan
Block/Punchayat Samti Boundary
National Highway
State Highway
Major District Road
Metalled Road
Railway Line
Urban Area with Ward Boundary
LEGEND
N
Figure 3.4 : Administrative Map of District Pali
PALI

EIA/EMP report of Sand/Bajri Mine (With ML Area of 4280.0 ha) Tehsil Marwar Jn., District Pali, Rajasthan
EQMS India Pvt. Ltd. 54
Figure 3.5 : Physiographic Map of Rajasthan
3.2.2. Topography
The district has different landforms. Mountainous topography is presented in the form of
Aravalli Range, having altitude varying from 600 mamsl to 1000 mamsl, towering on the
east and south – east direction of the district and dividing the state into east and west. The
undulating and rolling topography is witnessed in the landmass below the hill extending
upto plain topography where the ground elevation varies from 170 to 350 mamsl. The
general ground slope follows the direction of the drainage and is from east to west as well
as from south to west. Isolated hillocks of elevation between 300 to 460 mamsl at many
places suddenly break the more or less plain topography.
The study area covered within Marwar Jn.Tehsil has mountainous (Aravalli Range), rolling
and more or less plain topography with ground elevation varying from 931 mamsl

EIA/EMP report of Sand/Bajri Mine (With ML Area of 4280.0 ha) Tehsil Marwar Jn., District Pali, Rajasthan
EQMS India Pvt. Ltd. 55
(Mandawar in Pipli RF) to 244 mamsl near Baniyawas sluice. Aravalli range forms the
eastern and south eastern boundary of the district with Ajmer and Rajsamand districts.
The various emphemeral rivers flowing in the tehsil have their genesis in western aspect
of Aravalli range. The study area has numerous shallow depressions which have been
converted as tanks and reservoirs by creating suitable civil engineering structures like
embankment and sluices. The general ground slope of the area is 1 m/km in south – north
direction and 2.1 m / km in east – west direction
3.2.3. Drainage
From the western aspect of the Aravalli range in this semi-arid zone numerous rivers
emanate. The prominent rivers are Guhiya, Radiya, Sukri, Bandi (Hemawas), Somesar,
Mithari, Khari (Hemawas) and Jawai. All these rivers are ephemeral rivers and flow during
monsoon and are part of Luni basin. Nearly half of the Luni basin is occupied by rugged
mountains where soils are shallow. Annual rainfall over the Luni basin varies between 300
mm to 600 mm and the mean annual rainfall is 320 mm of which about 97% falls during
four monsoon months. The average rainy days in a year around fourteen. The average
annual pan evaporation of the district is 2640 mm which is eight folds of the mean rainfall
making it an arid region. The general drainage pattern in the district is dendritic. Most of
the rivers are influent. The description of rivers flowing through Pali district in Luni
Catchment is presented in Table 3.1.
Table 3.1 : Description of Rivers Flowing through Pali District in Luni Catchment
S.
No.
Name
of
River
Origin Lengt
h (km)
Catchment
Area
(sq.km)
Geographic
Location of Basin
Tributaries
1 Luni Western Slope of
Aravalli Range
near Ajmer (EL.
550 mamsl)
495 (in
Rajast
han)
37363 230 41’ to 270 05’ N
710 04’ to 740 42’ E
Left Bank tributaries :
Sukri, Mitri, Bandi, Khari,
Jawai, and Guhiya
2 Guhiya Hillocks near
villages
Khariyaniv and
Tharasani in Pali
district
3835 240 45’ to 260 14’ N
720 58’ to 740 14’ E
Radia, Guria Lilri, Sukri and
Phunpharia Bala
3 Bandi
(Hema
was)
Confluence of
Khari and Mithari
near Bombadra
Pickup weir
45 1685 250 15’ to 250 55’ N
720 56’ to 730 57’ E
Khari and Mithari

EIA/EMP report of Sand/Bajri Mine (With ML Area of 4280.0 ha) Tehsil Marwar Jn., District Pali, Rajasthan
EQMS India Pvt. Ltd. 56
4 Mithari South Western
Slopes of Aravalli
range in District
Pali
80 1644 250 00’ to 250 30’ N
720 52’ to 730 29’ E
Many local Nalas
5 Khari
(Hema
was)
Formed by the
confluence of
Somesar and
Khari Kherwa
55 1232 250 18’ to 250 46’ N
730 20’ to 730 50’ E
Somesar and Khari
Kherwa
6 Sukri Confluence of
several nalas.
Orignating from
Aravalli in Pali and
Udaipur
110 3036 250 00’ to 250 53’ N
720 36’ to 730 42’ E
Ghanerav, Muthana, Ka
Bala, Magai Nadi
7 Jawai Western Slopes of
Aravallis
96 2976 240 43’ to 250 34’ N
720 31’ to 730 24’ E
Sukari
The study area (Tehsil Marwar Jn.) is mainly drained by Bandi, Lilki, Mithri, Kantaliyi, Khardi,
Sukri upper, Khari and Siriari Nala. All these rivers flow during monsoon only and their water
is conserved through existing sluices, bunds and tanks. Many minor irrigation/drinking
water ponds/tanks/reservoir also exists on many small streams / nalla / bala.
3.2.3.2 Rivers in study area
The tehsil is drained by different river(s) like Bandi, Lilki, Mithri, Kantaliyi, Khardi, Sukri upper, Khari
and Siriari Nala which cover a longitudinal profile of 62 km, 36 km, 12 km, 22.5 km, 23 km, 33 km,
13.5 km and 30 km respectively in the Tehsil. Siriari, Kantaliya, Phulad, Jograwas I & II, Chirpatia
and Saran dam are the main water resource project in Tehsil with gross storage capacity 4.48,
5.34, 3.72, 3.36, 2.13 MCM respectively, which have been constructed to provide irrigation and
drinking water facilities in the area. The drainage map of the study area which forms part of main
drainage basin of Luni Rivers is shown in Figure 3.6 alongwith the Basin map.
3.2.3.3 Drainage Basin
The rivers in Pali district are left bank tributaries of Luni river in Rajasthan. For delineation of the
drainage basin, the Watershed Atlas of India has been used as it provides uniform base for
watershed characterization in five stages viz., Water Resource Region, Basin, Catchment, Sub-
Catchment and Watershed. The study area falls in Water Resource Region 6 i.e. Western
Rajasthan mostly ephemeral drainage. The distribution of Catchment, Sub-Catchment and
Watershed within Basin of the Water Resource Region in context of the rivers flowing through the
district has been presented in Table 3.2 and highlighted in Figure 3.6 which is the delineated map
of Western Rajasthan ephemeral drainage covering mainly Luni system.

EIA/EMP report of Sand/Bajri Mine (With ML Area of 4280.0 ha) Tehsil Marwar Jn., District Pali, Rajasthan
EQMS India Pvt. Ltd. 57
Table 3.2 : Details of Catchment, Sub-Catchment and Watershed
Region Basin Catchment Sub-Catchment
Watershed Stream Names
Area (sq.km)
District Covered
6 (Western Rajasthan)
6A (Luni & Others drainage)
6A2 (Mainly
Luni)
6A2C (Middle Luni around
Pali)
6A2C1
Bandi – Chhaili
1600 Pali, Barmer
and Jalore
6A2C2 Sukri – Ungti
1700 Pali, Jalore and
Udaipur
6A2C3 Bandi – Somesar
1500 Pali and Udaipur
6A2C4 Kharwa 1340 Pali and Udaipur
6A2C5 Rediya 1100 Pali and Jodhpur
6A2C6 Guhiya –Sukri
1200 Pali and Jodhpur
6A2C7 Bagri 1150 Pali and Udaipur
6A2B (Lower Luni upto
confluence with smaller
Sukri)
6A2B7 Mithri 680 Pali and Udaipur

EIA/EMP report of Sand/Bajri Mine (With ML Area of 4280.0 ha) Tehsil Marwar Jn., District Pali, Rajasthan
EQMS India Pvt. Ltd. 58
Figure 3.6 : Catchment Area Map of Luni Basin in Rajasthan and Drainage Map of Study Area
3.2.3.4 Gradient of Riverbed
The rivers draining through the district mostly originate from the western aspect of Aravali range in
the district itself and also from neighboring district Udaipur and flow through different tehsils. Since
the mining lease area has been fixed along the rivers and small streams (Bala) in particular tehsil
of the district, the information / data regarding the length of the river in the district and the fall (head
loss) negotiated by it within the tehsil has been provided in Table 3.3 to arrive at the net riverbed
slope of the rivers. The longitudinal sections of the rivers for the length traverse by them in tehsil
has been depicted in Figure 2.3 through 2.10.

EIA/EMP report of Sand/Bajri Mine (With ML Area of 4280.0 ha) Tehsil Marwar Jn., District Pali, Rajasthan
EQMS India Pvt. Ltd. 59
Table 3.3 : Computation of River Bed Slope
S.
No.
Name of River Length
traversed
by the river
in Tehsil
(km)
River bed elevation (mamsl) Total fall
(head loss) in
river bed with
in tehsil (m)
Average
bed
slope (m
/ km)
At the start
point in tehsil
At the exit
point in
tehsil
1 Bandi 0-4 590 400 190 47.5
4-7.5 400 320 80 22.9
7.5-28 320 280 40 1.95
28-62 280 230 50 1.47
2 Lilki upto confluence
with Sukri
0-3 360 340 20 6.66
3-12 340 320 20 2.22
12-15 320 297 23 7.66
15-36 297 265 32 1.52
3 Mithri after confluence
of Lilki and Sukri
0-12 265 240 25 2.08
4 Kantyali Nala 0-4 400 340 60 15
4-7 340 320 20 6.66
7-14 320 300 20 2.85
14-22.5 300 280 20 2.35
5 Khardi 0-15 280 248 32 2.13
15-23 248 244 4 0.5
6 Siriari Nala 0-2 500 400 100 50
2-5 400 380 20 6.66
5-8 380 360 20 6.66
8-30 360 280 80 3.63
7 Sukri upto confluence
with Lilki
0-1 377 360 17 17
1-3.5 360 340 20 8
3.5-9.5 340 320 20 3.33
9.5-14.5 320 300 20 4
14.5-33 300 265 35 1.9
8 Khari 0-13.5 280 250 30 2.22
It is evident from the Table 3.3 that in the head and initial reaches the average bed slope
of all the rivers with exception of Mithri and Khari is very steep and ranges between 47.5
m/km (Bandi) to 6.6 m / km (Siriari nala) where as between middle end reaches of the
rivers It varies between 0.5 m / km (Khardi) to 2.85 m/km (Kantayali). The river bed slope

EIA/EMP report of Sand/Bajri Mine (With ML Area of 4280.0 ha) Tehsil Marwar Jn., District Pali, Rajasthan
EQMS India Pvt. Ltd. 60
near 1m/km in the alluvial stratum of the riverbed is moderate to generate velocities of
about 2m /sec to 3m/sec during the high stage of the river caused by flash flood.
Coarser particles of riverine bed material such as bajri and coarse sand are eroded at
such velocities (3m/sec), which is called the line of critical velocity. When the velocity fall
below the critical velocity particles will be deposited or transported instead of being eroded
depending upon the rivers energy. As the velocity of flow of river further decrease, again
particles are not deposited but are transported d/s. Coarser particles are deposited quickly
with the decrease in velocity and after that as the size or the particles decreases the
longer, it is transported. Particles of size 1mm are deposited even at 0.1m / sec velocity.
Sand is relatively easily eroded and moves at velocities 0.2 m / sec, as these do not
coagulate. Clays and final silt stay afloat even when the velocity is near to zero.
3.2.4. Competency of river:
Competency of a river is a measure of the maximum size of the river borne material a river is
capable of transporting and it is directly dependent upon the velocity of flow of the river. The
competence of a river increases as square of its velocity. The maximum load of solid particles a
river can transport is termed as its capacity. The greater the discharge in the river, the greater shall
be the capacity for hauling the sediments. The higher velocities are developed when the rivers are
in high stage. Even the slope of the order of 1m/km are capable of generating such velocities which
are capable of eroding the bed material and its transportation. In the present case on an average
the competency of rivers/stream in the mine lease area varies between 12 mm to less than 0.002
mm (clay)
3.2.5. Land Use/ Land Cover
The Tehsil wise landuse and land cover of the district as per revenue record is shown in
Table 3.4. The pre-dominant landuse in the district is agriculture land 607511 ha (49.27%),
followed by fallow land 204610 ha (16.59%), barren and unculturable land 143918
(11.67%), Permanent Pasture 90862 ha (7.37%), Forest land 82010 ha (6.65%), Land
under non-agricultural use 58281 ha (4.73%) and culturable waste land 45804 ha (3.71%).
The pre-dominant landuse in the Tehsil is agriculture land 65098ha (47%), followed by
fallow land 28213 ha (20%), Permanent Pasture 11439ha (8%), barren and unculturable
land 8729 ha (6%), culturable waste land 7464 ha (5%), Land under non-agricultural use
5050 ha (4%) and Forest Land 14281 ha (10%) . The pie diagram of landuse of the Pali
District and Tehsil Marwar Junction is given in Figure 3.7 and 3.8 respectively.

EIA/EMP report of Sand/Bajri Mine (With ML Area of 4280.0 ha) Tehsil Marwar Jn., District Pali, Rajasthan
EQMS India Pvt. Ltd. 61
Table 3.4 : Tehsil wise landuse and land cover of the district
Tehsil Forest
Land under Non-Agriculture
Use
Barren & unculturable
land Permanent
Pasture
Land under Miscellaneous
trees and grooves
Culturable waste land
Total fallow land
Actual sown area
Total Geographical
area
1 2 3 4 5 6 7 8 9 10
Pali 3369 8657 11461 12484 6 9329 35847 86868 168021
Rohat 198 5957 7946 9828 6894 16872 93080 140775
Bali 27814 5821 28802 11873 29 4091 21405 44145 143980
Sumerpur 556 5050 10422 5914 3862 19175 50994 95973
Desuri 18895 7745 12214 10100 1 3014 19976 58481 130426
Marwar junction 14281 5050 8729 11439 53 7464 28213 65098 140307
Sojat 4932 8386 16991 11692 5554 28533 91667 167775
Jetaran 2282 6720 14759 10769 8 4557 22248 76277 137620
Raipur 9683 4895 32594 6763 6 1039 12341 40901 108222
Total 82010 58281 143918 90862 103 45804 204610 607511 1233099
Figure 3.7 : Graphical Presentation of Landuse of District Pali
82010, 6.65%
58281, 4.73%
143918, 11.67%
90862, 7.37%
45804, 3.71%
204610, 16.59%
607511, 49.27%
Forest
Land under Non-AgricultureUse
Barren & unculturable land
Permanent Paustre
Land under Miscellaneoustrees and grooves
Culturable waste land
Total fallow land
Actual sown area
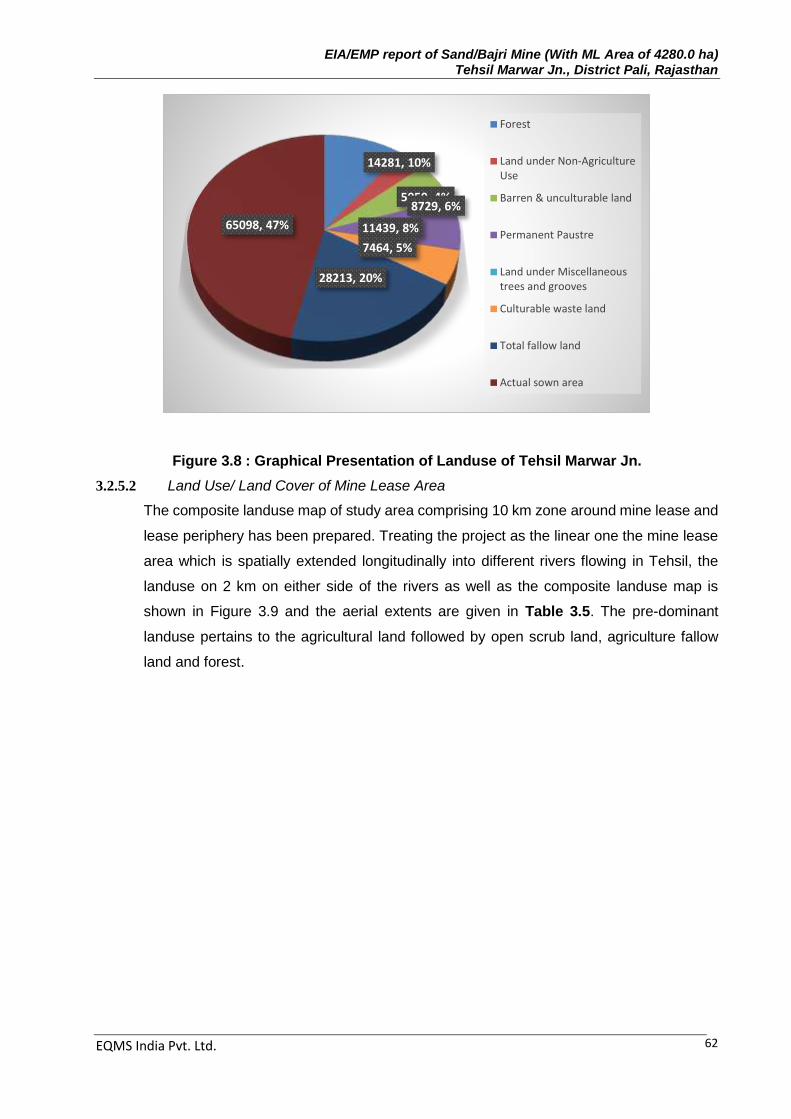
EIA/EMP report of Sand/Bajri Mine (With ML Area of 4280.0 ha) Tehsil Marwar Jn., District Pali, Rajasthan
EQMS India Pvt. Ltd. 62
Figure 3.8 : Graphical Presentation of Landuse of Tehsil Marwar Jn.
3.2.5.2 Land Use/ Land Cover of Mine Lease Area
The composite landuse map of study area comprising 10 km zone around mine lease and
lease periphery has been prepared. Treating the project as the linear one the mine lease
area which is spatially extended longitudinally into different rivers flowing in Tehsil, the
landuse on 2 km on either side of the rivers as well as the composite landuse map is
shown in Figure 3.9 and the aerial extents are given in Table 3.5. The pre-dominant
landuse pertains to the agricultural land followed by open scrub land, agriculture fallow
land and forest.
14281, 10%
5050, 4%8729, 6%
11439, 8%
7464, 5%
28213, 20%
65098, 47%
Forest
Land under Non-AgricultureUse
Barren & unculturable land
Permanent Paustre
Land under Miscellaneoustrees and grooves
Culturable waste land
Total fallow land
Actual sown area

EIA/EMP report of Sand/Bajri Mine (With ML Area of 4280.0 ha) Tehsil Marwar Jn., District Pali, Rajasthan
EQMS India Pvt. Ltd. 63

EIA/EMP report of Sand/Bajri Mine (With ML Area of 4280.0 ha) Tehsil Marwar Jn., District Pali, Rajasthan
EQMS India Pvt. Ltd. 64
Figure 3.9 : Landuse Map of 10km Study Area and 2km on either side of rivers of ML area in Tehsil Marwar Jn.

EIA/EMP report of Sand/Bajri Mine (With ML Area of 4280.0 ha) Tehsil Marwar Jn., District Pali, Rajasthan
EQMS India Pvt. Ltd. 65
Table 3.5 : Details of Landuse Class 2km/10km on either side of rivers of ML area
Landuse Class
2 km Zone around the mine lease area
10 km Zone around the mine lease area
Bandi Area(sq
km)
Kantaliya nala and Khardi
Area(sq km)
Mithri - Sukri-Lilki Area(sq
km)
Total
Area (sq km)
%
Total Area
(sq km) %
Agricultural land 85.9 28.51 120.38 234.79 42.00 1479.47 55.61
Agri fallow land 104.66 30.53 83.65 218.84 39.15 326.28 12.26
Open scrub land 10.98 24.96 28.02 63.96 11.44 549.8 20.67
Settlement 1.86 1.03 3.26 6.15 1.10 64.67 2.43
Water body 0 0.33 0.03 0.36 0.06 7.66 0.29
Vegetation(Forest) 6.6 0.23 8.85 15.68 2.80 185.77 6.98
Dry river bed 7.66 1.78 9.79 19.23 3.44 46.74 1.76
Total 217.66 87.37 253.98 559.01 100 2660.39 100.00
3.2.5.3 Land Use/ Land Cover
The mine lease area is in river bed and forms section of the river. The mine lease area is river
body classified as Gair mumkin nadi/nalla as per revenue record. The designated mine area is
revenue land so the ownership vests with the state of Rajasthan. The existing land use of mine
lease area belongs to landuse category “River body” and shall continue to be so even after the
current mining project is over. The landuse pattern existing as on date and after 3rd and 5th year
of mining have been shown in Table 3.6.
Table 3.6 : Land Use Details
S.N. Particulars Present land use (ha)
At the end of 3rd year (ha)
At the end of 5th year (ha)
1 Pit area 0.0 80 133.33
2 Dump area 0.0 - -
3 Safety zone
Bridge 111.375 111.375 111.375
Permanent Roads 75.60 75.60 75.60
Wells 18.14 18.14 18.14
4 Infrastructure (office, temp, shelter etc)
- 0.80 -
5 Mineral Storage - - -
6 Plantation - - -
7 Un worked 4074.885 3994.085 3941.555
Total 4280.00 4280.00 4280.00
3.3. Geology and Hydrogeology
3.3.1. Geology
Geological configuration of Pali district is quite complex. It is comprised of heterogeneous
assemblage of different litho units of igneous, sedimentary and metamorphic origin. The oldest &
prominent rock exposed along district belongs to Delhi supergroup comprising southern, eastern

EIA/EMP report of Sand/Bajri Mine (With ML Area of 4280.0 ha) Tehsil Marwar Jn., District Pali, Rajasthan
EQMS India Pvt. Ltd. 66
and north eastern margine of the metamorphosed ferruginous and massive clastics. With
subordinate chemogenic sediments and associated intrusive and extrusive phases. Rocks of this
Super group have been further classified in Kumbhalgarh, Sirohi & Punagarh Groups. The Delhi's
are succeeded by a sequence of un-metamorphosed sedimentary rocks comprised of sandstone,
limestone, siltstone, gypsum beds, This Super group is further divided into Jodhpur Group, Bilara
Group & Nagaur Group. The Delhi's are intruded by granites and rhyolite. The predominant is the
Erinpura Granite. The geological Sequence Worked out by G.S.I. is given in Table 3.7. The regional
geological map of Rajasthan is shown in Figure 3.10
Table 3.7 : Geological Sequence
Super group/Age Group Lithology
Quarternary Alluvium & windblown sand Nagaur Group Sandstone, gypsum & siltstone Marwar Supergroup Bilara Group Limestone, chert & dolomite
Jodhpur Group Sandstone, shale, boulders, chert.
Middle to U. Proterozoic Malani Igneous Suite Granite (Jolor type) Rhyolite & pyroclastics with dykes of granophyre
Erinpura Granite Granite and gneiss
Punagarh Group Basic volcanic with pillow
Lava, meta tuff, quartzite, shale, slate phyllite, bedded chert
Delhi Supergroup Sirohi Group Phyllite, mica schist, biotite
Lower to Middle Proterozoic schist, dolomitic marble,
migmatite & gneisses epidiorite, Hornablende
Sendra-Ambaji Granite Granite and gneiss
Phulad Ophiolite Suite Hornblends schist, amphibolite, pyroxene granulite, gabbro & ultramafics.
Kumbhalgarh Group Calc schist, marble, granite
Schist/amphibolite, biotite schist, quartzite, mica schist and migmatite

EIA/EMP report of Sand/Bajri Mine (With ML Area of 4280.0 ha) Tehsil Marwar Jn., District Pali, Rajasthan
EQMS India Pvt. Ltd. 67
The geological formations in the study area covering Tehsil Rohat mainly consist of
Alluvium & Blown Sand, Phylites and Eranpura Granite / Ultra Basic.
Figure 3.10 : Regional geology map of Rajasthan
3.3.2. Hydrogeology
The main hydrogeological formation encountered in the district are Quaternary Alluvium
(Younger and Older), Bilara limestone (Marwar Supergroup), Jodhpur Sandstone (Marwar
Supergroup), Malani Suite of Ignious rocks (Post Delhi and Delhi Super group),
Calcareous Schist, Slate, Phylite, and Granite Gneiss (Aravali Super group). The
hydrogeology map of the area is given in Figure 3.11.
Younger Alluvium: It mainly comprises of stream laid deposits of sand, gravel,
silt, clay, pebbles and cobbles with varying thickness upto 50m but in the north
east part the thickness increases to about 100 m. These occur along drainage
and flood plains of Luni, Sukri, Lilri, Bandi and Jawai. Groundwater follows the

EIA/EMP report of Sand/Bajri Mine (With ML Area of 4280.0 ha) Tehsil Marwar Jn., District Pali, Rajasthan
EQMS India Pvt. Ltd. 68
surface drainage pattern. Hydraulic gradient is gentle in north eastern and central
area (1.3 m / km) and more steep towards south indicating low permeability
aquifer in the southern area
Older Alluvium: It mainly comprises of semi-consolidated to consolidated
sediment of sand (medium to course graind), silt, clay and kankar/gravel (sub-
angular to sub-rounded). Alluvium thickness varies considerably due to
undulating bed rock topography. It covers Jaitaran, Pali, Rohat block and part of
Sojat and Sumerpur Blocks. In Jataran and Sumerpur block alluvial aquifer
covers extensive area.
Bilara Limestone: It is of dark grey colour, hard and compact dolomitic limestone.
It encompasses Sojat and Jaitaran block and covers nearly 2% area in the
potential zone.
Malani Suite of Ignious rocks (Post Delhi and Delhi Super group)
Calcareous Schist, Slate, Phylite, and Granite Gneiss (Aravali Super group) :
Aravalli Super Group comprises dark brown, grey and purple slates with thin
bands of quartzite, phyllite and schist. Pre Aravallies include gneisses and
schists. It covers extensive area in central part though in north and south western
occupy smaller area.
The district has geo-hydrological formations, viz., unconsolidated, semi consolidated fully
consolidated, with varying groundwater potential. The unconsolidated formations include,
recent alluvium, brown sand, clay, silt and gravel, pebble, calcareous concretion, which
are fairly thick and regionally extensive, confined to semi-confined aquifers ; and older
alluvium, laterite, silt, sand , ferruginous concretion and cobbles, confined to semi confined
aquifers to a depth of 39-300 metre below the ground. They are porous formations. The
aquifer potential varies widely between (40-100 litres per second) for the very good ones,
to 10-40 litres per second for moderately good ones to less than 10 lps for low potential
ones. The semi-consolidated formations include: clay-stone, sandstone, grit, silt stone,
conglomerate, and limestone. They also form porous aquifers, and have groundwater
potential varying from less than 10 lps to 100 lps.

EIA/EMP report of Sand/Bajri Mine (With ML Area of 4280.0 ha) Tehsil Marwar Jn., District Pali, Rajasthan
EQMS India Pvt. Ltd. 69
Figure 3.11 : Hydrogeological Map of Pali district

EIA/EMP report of Sand/Bajri Mine (With ML Area of 4280.0 ha) Tehsil Marwar Jn., District Pali, Rajasthan
EQMS India Pvt. Ltd. 70
3.3.3. Seismicity
As per seismic zoning map of India IS 1893 (Part-I):2002, Figure 3.12, the major part of
Rajasthan lies in Zone – II and Western parts of the districts of Barmer and Sirohi as well
as northern sections of Alwar district lie in Zone IV, where the maximum intensity could
reach VIII (MSK). The remaining areas of Barmer and Sirohi districts, as well as the
districts of Bikaner, Jaiselmer and Sirohi lie in Zone III. The north-eastern districts of
Jhunjhunu, Sikar, Bharatpur and the rest of Alwar also lie in Zone III. The rest of the state,
including the capital, Jaipur, lie in Zone II, where the maximum intensity expected would
be around MSK VI, as is evident from the Seismic Zone Map of Rajasthan (Figure 3.13)
that some portion of district Barmer, Jalore, Alwar and Bharatpur lie under Zone – IV. The
project area falling in Tonk District lies within Zone - II.
Figure 3.12 : Map of Seismic Zones of India

EIA/EMP report of Sand/Bajri Mine (With ML Area of 4280.0 ha) Tehsil Marwar Jn., District Pali, Rajasthan
EQMS India Pvt. Ltd. 71
Figure 3.13 : Map of Seismic Zones of Rajasthan
Small to moderate earthquake have visited the state of Rajasthan which has not felt any
major earthquake in past as well as recent years. The Cambay Graben (3) terminates in
the south-western part of the state. The Konoi Fault near Jaiselmer trends in a north-south
direction and was associated with the 1991 Jaiselmer earthquake. Several active faults
criss-cross the Aravalli range and lie parallel to each other. The most prominent of them
is the north-south trending Sardar Shahr Fault and the Great Boundary Fault which runs
along the Chambal River and then continues in the same direction into Uttar Pradesh.
Largest Instrumented Earthquake event in Rajasthan was felt at 22:11 on 15 August 1906
– (Thar Desert, Rajasthan) with movement magnitude i.e. Mw 6.2. This event was located
along the India-Pakistan border, in the vicinity of Janpalia, Rajasthan which is located
north-northwest of Bakhasar. It was felt widely along the Indo-Pakistan border, Sindh, and
Gujarat. It was also felt for several seconds in Rajputana, Jodhpur, Ahmedabad and
around the Gulf of Khambat and at Mirpur in Pakistan.
Important recent earthquake events of magnitude more than 3.3 on Richter scale are
enumerated in Table 3.8.
Project Site
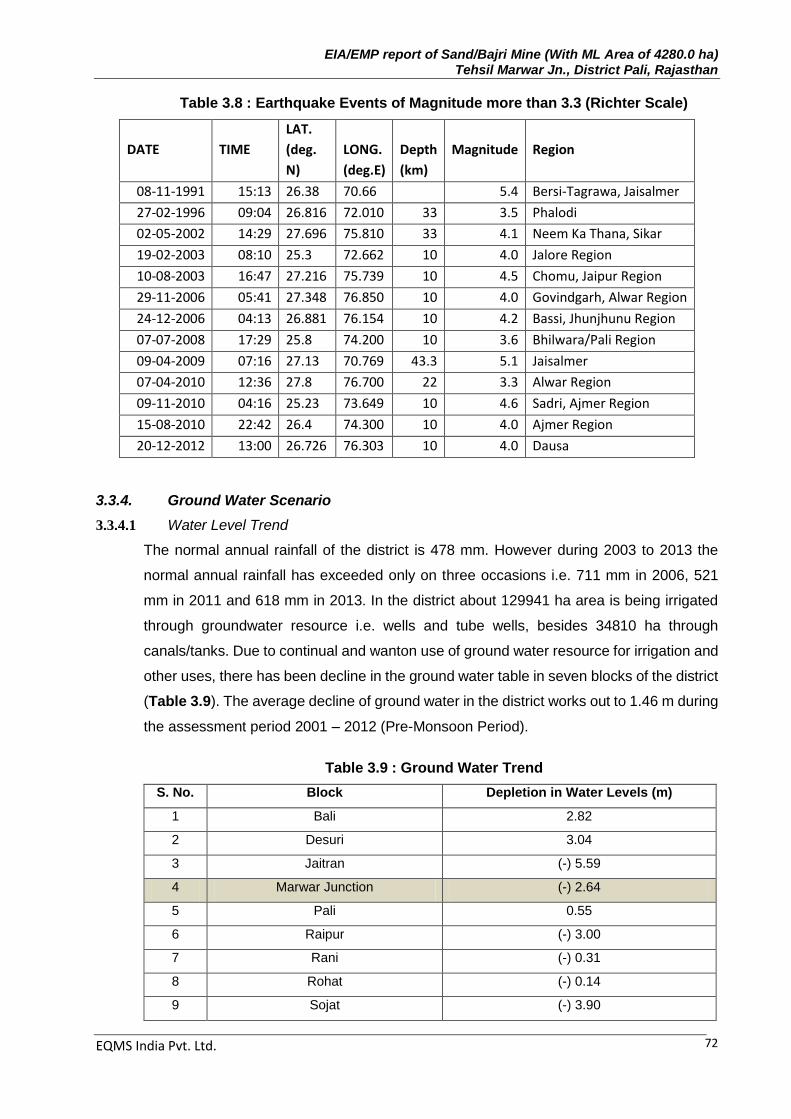
EIA/EMP report of Sand/Bajri Mine (With ML Area of 4280.0 ha) Tehsil Marwar Jn., District Pali, Rajasthan
EQMS India Pvt. Ltd. 72
Table 3.8 : Earthquake Events of Magnitude more than 3.3 (Richter Scale)
DATE
TIME
LAT.
(deg.
N)
LONG.
(deg.E)
Depth
(km)
Magnitude
Region
08-11-1991 15:13 26.38 70.66 5.4 Bersi-Tagrawa, Jaisalmer
27-02-1996 09:04 26.816 72.010 33 3.5 Phalodi
02-05-2002 14:29 27.696 75.810 33 4.1 Neem Ka Thana, Sikar
19-02-2003 08:10 25.3 72.662 10 4.0 Jalore Region
10-08-2003 16:47 27.216 75.739 10 4.5 Chomu, Jaipur Region
29-11-2006 05:41 27.348 76.850 10 4.0 Govindgarh, Alwar Region
24-12-2006 04:13 26.881 76.154 10 4.2 Bassi, Jhunjhunu Region
07-07-2008 17:29 25.8 74.200 10 3.6 Bhilwara/Pali Region
09-04-2009 07:16 27.13 70.769 43.3 5.1 Jaisalmer
07-04-2010 12:36 27.8 76.700 22 3.3 Alwar Region
09-11-2010 04:16 25.23 73.649 10 4.6 Sadri, Ajmer Region
15-08-2010 22:42 26.4 74.300 10 4.0 Ajmer Region
20-12-2012 13:00 26.726 76.303 10 4.0 Dausa
3.3.4. Ground Water Scenario
3.3.4.1 Water Level Trend
The normal annual rainfall of the district is 478 mm. However during 2003 to 2013 the
normal annual rainfall has exceeded only on three occasions i.e. 711 mm in 2006, 521
mm in 2011 and 618 mm in 2013. In the district about 129941 ha area is being irrigated
through groundwater resource i.e. wells and tube wells, besides 34810 ha through
canals/tanks. Due to continual and wanton use of ground water resource for irrigation and
other uses, there has been decline in the ground water table in seven blocks of the district
(Table 3.9). The average decline of ground water in the district works out to 1.46 m during
the assessment period 2001 – 2012 (Pre-Monsoon Period).
Table 3.9 : Ground Water Trend
S. No. Block Depletion in Water Levels (m)
1 Bali 2.82
2 Desuri 3.04
3 Jaitran (-) 5.59
4 Marwar Junction (-) 2.64
5 Pali 0.55
6 Raipur (-) 3.00
7 Rani (-) 0.31
8 Rohat (-) 0.14
9 Sojat (-) 3.90

EIA/EMP report of Sand/Bajri Mine (With ML Area of 4280.0 ha) Tehsil Marwar Jn., District Pali, Rajasthan
EQMS India Pvt. Ltd. 73
10 Sumerpur (-)1.26
District Average (-) 1.46
3.3.4.2 Ground Water Development
The ground water budget for the study area has been worked out by computing the annual
ground water recharge due to all sources and the annual ground water draft for all uses.
3.3.4.3 Annual Ground Water Recharge
To evaluate the monsoon ground water replenishing resource, the monsoon rainfall for
the area was adopted from Table 3.11. The area having slope between 0-50 has been
considered and all area above 50 slope has not been considered as in such area the
possibility run-off recharge is low. The infiltration area coefficient of 10% was considered
appropriate to evaluate recharge by infiltration method as below.
Total Study Area = 140307 ha
Area Suitable for recharge = 120977 ha
Monsoon Rainfall = 543 mm
Infiltration Factor = 10%
Monsoon rainfall recharge = 6569 ha. m or 65.69 MCM
The ground water recharge due to water table fluctuation has been computed as under
Total Study area = 140307 ha
Area Suitable for recharge = 120977 ha
Seasonal Fluctuation = 0.70 m
Specific yield = 0.08 %
Monsoon G.W. Recharge = 6775 ha. m or 67.75 MCM
Rainfall is the only source for ground water recharge. Only medium to minor surface
irrigation network exist in the area where irrigation is being practiced through small minors
which off takes from medium dam/surface ponds/sluices, during Rabi when the
dams/ponds get filled during monsoon months. The minors are lined and due to
application of small water depth for Rabi crops the recharge from field application is not
applicable. During the non-monsoon season the potential evaporation rate is much higher
than the rainfall, therefore, non-monsoon recharge is not expected. As per norms of GEC-
1997, the monsoon season recharge by Water Table Fluctuation (WTF) methodology
should be preferred to the estimation by rainfall infiltration method, provided it does not
exceed by 20% of the later. Thus, the annual ground water recharge for the study area
has been adopted as 6775 ha. m (67.75 MCM).

EIA/EMP report of Sand/Bajri Mine (With ML Area of 4280.0 ha) Tehsil Marwar Jn., District Pali, Rajasthan
EQMS India Pvt. Ltd. 74
3.3.4.4 Annual Ground Water Draft
In the study area, on the basis of statistical data the annual draft is being worked out as
below:
A. Drinking / Domestic Demand
(i) Total population of study area as on 1.1.2011 198978
(ii) Total population of study area as on 1.1.2014
(after incorporating 1.19% annual growth @ 11.9%
decadal growth)
206080
(iii) Population utilizing ground water source as drinking
water
201000
(iv) Per Capita Consumption 70 LPD
(v) Annual Drinking /Domestic Demand 499 ha.m.(4.99 MCM)
B. Irrigation Demand from Ground Water Resource
(i) Area Irrigated 17330 ha
(ii) Gross Irrigation need/ha 0.3 m/ha
(iii) Total demand 5199 ha m(51.99 MCM)
C. Industrial Demand 400 ha. m. (4 MCM)
D. Total Ground Water Draft 7496 ha. m.
3.3.4.5 Ground Water Development
Total Ground Water recharge 6775 ha. m.
Net Ground Water Availability 6098 ha. m.
Annual Ground Water Utilization 7496 ha. m.
Stage of Ground Water Development 122.9 % (Over Exploited)
3.4. Meteorology
The meteorological data recorded during the study period is very useful proper
interpretation of the baseline information, surrounding area for air dispersion. Historical
data on meteorological parameters will also play an important role in identifying the
general meteorological regime of the region.
The climate of the district is semi-arid. During peak of summer season in month of May
and June, the temperature shoots upto 460C - 470C. The onset of Monsoon starts from
the last week of June or early July and continues until the middle of September. The winter
starts from December and continues until the end of March. The winters are moderately

EIA/EMP report of Sand/Bajri Mine (With ML Area of 4280.0 ha) Tehsil Marwar Jn., District Pali, Rajasthan
EQMS India Pvt. Ltd. 75
cool during December and January when the temperature falls to 40C to 50C. The average
rainfall during monsoon is 300 mm.
3.4.1. Methodology
The methodology adopted for monitoring surface observation is as per the standard norms
laid down by Bureau of Indian Standards (IS: 8829) and India Meteorological Department
(IMD). On-site monitoring was undertaken for various meteorological variables in order to
generate the site-specific data. Data was collected every hour continuously from 1st
October 2013 to 31st December 2013 covering one season as per approved ToR.
3.4.1.1 Methodology of Data Generation
The Monitoring Station equipped with continuous monitoring equipment was installed at a
height of 10 m above ground level to record wind speed, direction and temperature. The
meteorological monitoring station was located in such a way that it is free from any
obstructions and as per the guidelines specified under IS:8829. Cloud cover was recorded
by visual observation.
3.4.1.2 Sources of Information
Secondary information on meteorological conditions has been collected from the nearest
IMD station. In the present case the locations of some of the tehsil headquarters of Pali
district vis-à-vis the nearest IMD Jodhpur and Jalore are shown in Table 3.10.
Table 3.10 : Distance of Tehsil Headquarters from Nearest IMD Station
S. No.
Project Location
Latitude Longitude Elevation
Aerial Distance from Nearest IMD
(in Km.)
Nearest IMD
Tehsil masl
Station Name
Latitude Longitude
1 Rohat 25⁰57'26'' 73⁰08'34'' 195 41
IMD Jodhpur
26⁰18' 73⁰01' 2 Sojat 25⁰55'32'' 73⁰40'00'' 265 77
3 Pali 25⁰46'37'' 73⁰20'00'' 224 63
4 Marwar 25⁰43'32'' 73⁰36'47'' 265 89
5 Sumerpur 25⁰09'03'' 73⁰05'00'' 267 52
IMD Jalore 25⁰21' 72⁰37'
3.4.2. Presentation of Data
3.4.2.1 Meteorological Data Recorded at nearest IMD
The meteorological data was collected from the IMD Jodhpur located at EL 217 MSL which
has more pronounced effect on the project site. The data collected from IMD includes wind
speed, temperature, relative humidity and rainfall. The monthly maximum, minimum and
average values were collected for all the parameters except wind speed. All these

EIA/EMP report of Sand/Bajri Mine (With ML Area of 4280.0 ha) Tehsil Marwar Jn., District Pali, Rajasthan
EQMS India Pvt. Ltd. 76
parameters were recorded twice a day viz. at 08:30 and 17:30 hours. The collected data
is tabulated in Table 3.11.
Table 3.11 : Climatological Data Station: IMD, Jodhpur (1960-1990)
Month
Temperature (OC) Relative Humidity
(%) Rainfall (mm)
Mean
Wind
Speed
(kmph)
Cloud Cover
(Oktas of sky)
Mean
Max
Mean
Min 8:30 17:30
Monthly
(mm)
Rainy
Days 8:30 17:30
January 28.8 5.2 52 28 1.7 0.2 7.1 1.8 2.0
February 32.9 5.2 49 26 3.8 0.5 7.5 2.2 2.6
March 38.9 10.4 41 21 6.0 0.5 8.3 2.3 2.8
April 42.6 17.6 37 19 8.8 0.4 9.9 1.8 2.5
May 44.5 21.6 47 20 16.6 1.1 13.0 1.1 1.7
June 44.0 22.8 60 33 34.1 2.0 15.4 3.2 3.1
July 39.9 22.9 73 51 126.7 5.9 13.2 5.8 5.6
August 37.8 22.6 78 57 121.1 6.2 11.3 5.8 5.6
September 38.6 21.2 69 44 54.2 2.8 8.6 3.1 3.5
October 38.7 15.1 50 28 6.0 0.6 6.0 1.0 1.8
November 34.6 10.0 46 30 3.1 0.2 5.5 1.1 1.3
December 30.1 6.7 51 30 1.5 0.1 6.2 1.7 2.0
Mean 43.9 5.7 54 32 - - 9.3 2.6 2.9
Total rainfall / Rainy days 383.6 20.5
3.4.2.2 Meteorological Data Generated at Site
The meteorological parameters have been recorded on hourly basis during the study
period from October, 2013 to December, 2013 and the parameters recorded at site include
wind speed, wind direction, temperature, relative humidity and rainfall. In view of the fact
that the arial distance of tehsil headquarter Marwar Jn., from district headquarter Pali is
merely 29 km; and the lease area in tehsil boundary of Marwar Jn., is about 18 km from
the district headquarter; the meteorological data recorded at Pali has been adopted. This
is logical in the wake of the fact that the temperature, humidity and wind speed do not
differ much if the topography remains unaltered which is so in the present case as the
topography of the tehsils under question is same.
3.4.3. Synthesis of Data on Climatic Conditions
3.4.3.1 Analysis of the Data Recorded at IMD-Jodhpur
Temperature
The winter season starts from Middle of November and continues till end of March.
December, January and February are the coolest months. Both the night and day

EIA/EMP report of Sand/Bajri Mine (With ML Area of 4280.0 ha) Tehsil Marwar Jn., District Pali, Rajasthan
EQMS India Pvt. Ltd. 77
temperatures increase rapidly during the onset of pre-monsoon season from April to May.
The mean maximum and minimum temperature have been recorded as 44.50C in May &
5.20C in the month of January & February respectively. The extreme minimum and
maximum temperature was recorded as -0.70C (07/02/1974) and 46.30C (27/05/1973)
respectively.
Humidity The air is generally humid during the monsoon season and the weather during other
seasons was observed to be dry. The relative humidity during August at 08:30 hr was
observed to be around 78% and at 17:30 hr the same was observed as 57%. The minimum
relative humidity was observed as 37% at 08:30 hr and 19% at 17:30 hr in the month of
April respectively.
Cloudiness During the winter and the pre-monsoon seasons, it was observed that the skies were
generally very clear. In the post-monsoon season, generally light clouds were observed in
the evenings, with clear mornings. During the monsoon season, both in the morning and
evenings, the skies were found to be generally clouded.
Winds Generally, light to moderate winds prevail throughout the year with speed ranging from
1.3 to 5.6 kmph. Winds were light to moderate particularly in the morning hours, while in
the afternoon hours the winds were observed stronger. The annaul wind pattern is as
follows;
At 08:30 -hr
A review of the past IMD record showed predominant winds occurring mostly from SW
and NE direction.
At 17:30-hr
A review of the past IMD record showed predominant winds occurring mostly from SW
and W direction.
3.4.3.2 Observations on Primary Data
The site-specific data for the study period in respect of temperature, humidity and rainfall
is presented in Table 3.15.

EIA/EMP report of Sand/Bajri Mine (With ML Area of 4280.0 ha) Tehsil Marwar Jn., District Pali, Rajasthan
EQMS India Pvt. Ltd. 78
1. Temperature
Maximum temperature of 36.6OC (October 2013) and minimum temperature of 6.2OC
(December 2013) was recorded during the study period.
2. Relative Humidity
Maximum and minimum relative humidity observed during December 2013 and October
2013, was 70.2% and 24.4% respectively.
3. Rainfall
The main rainy season is the southwest monsoon season, from about the last week of
June to September-mid. Some rainfall though less in amount occurs in the cold season
from December to February. The average monthly rainfall observed at various tehsil Pali,
Sojat, Marwar of district Pali from observations made during 1973 to 2008 are reproduced
under Table 3.12. During the study period total 46 mm rainfall occurred only in three rainy
day in October 2013 whereas there were no rainfall during November and December
2013.
Table 3.12 : Monthly Rain Fall Data Observed at Tehsil (2012)
Month JAN FEB MAR APR MAY JUN JUL AUG SEP OCT NOV DEC Tot
al
Ma
x.
In a
day
D
at
e
PALI- PALI
Average
monthl
y
rainfall
(mm)
3.19 5.73 0.53 2.93 9.34 39.41 180.03 148.17 56.70 17.86 8.33 0.00 472.
21
220
.60
2
Jul
y,
19
94
Average
Rainy
days
0.47 0.53 0.07 0.20 0.80 2.67 6.53 7.93 2.93 1.13 0.60 0.00 24
SOJAT-PALI
Average
monthl
y
rainfall
(mm)
5.60 5.71 0.27 3.31 8.23 31.86 208.55 150.73 68.11 17.11 6.15 0.00 505.
60
301
.80
2
Jul
y,
19
94
Average
Rainyda
ys
0.60 0.60 0.07 0.27 1.00 2.67 7.07 8.27 3.47 0.80 0.40 0.00 25
MARWAR- PALI

EIA/EMP report of Sand/Bajri Mine (With ML Area of 4280.0 ha) Tehsil Marwar Jn., District Pali, Rajasthan
EQMS India Pvt. Ltd. 79
Averag
e
monthl
y
rainfall
(mm)
2.89 3.83 1.00 3.15 8.79 47.75 244.19 177.30 73.37 20.99 8.78 1.07 593.
09
227
.00
11
A
ug
.,
19
92
Averag
e Rainy
days
0.33 0.47 0.13 0.13 0.80 2.40 7.67 8.07 3.60 1.00 0.53 0.07 25
Monthly Rainfall data observed at tehsil Marwar Jn., from 2004 to 2013 is presented in
Table 3.13 which shows that during this period the maximum and the minimum annual
rainfall recorded are 701 mm in 2010 and 180 mm in 2009. The maximum monthly rainfall
of 320 mm has been recorded during August 2011. Average annual rainfall is 450.63 mm
which is less than the average of 593.09 mm for the period 1973 to 2008 and also less
than the normal rainfall of 498.7 mm (1978) for the Tehsil Marwar Jn. The standard
deviation (168.04) and the co-efficient of skew (-0.15) have been worked out in Table
3.14.
Table 3.13 : Monthly Rainfall (mm) data observed at Marwar Jn. Tehsil (2004-2013)
Month /Year 2004 2005 2006 2007 2008 2009 2010 2011 2012 2013
Monthly Average
January 0 0 0 0 0 0 0 0 0 8 0.8
February 0 0 0 9 0 0 0 12 0 13 3.4
March 0 0 0 15 0 0 0 0 0 0 1.5
April 0 21 0 0 15 0 0 0 9 8 5.3
May 0 11 2 0 49 16 0 1 20 0 9.9
June 43 31 26 14 77 6 5 16 4 69 29.1
July 39 173 76 305 19 130 177 159 89 194 136.1
August 114 64.5 184.2 57 253 24 247 320 241 187 169.2
September 1.5 68.5 97.1 35 73 4 114 85 115 112 70.5
October 0 0 0 0 8 0 0 0 5 46 5.9
November 31.5 0 0 0 0 0 155 0 0 0 18.7
December 0 0 0 0 0 0 3 0 0 0 0.3
Total 229.00 369.00 385.30 435.00 494.00 180.00 701.00 593.00 483.00 637.00 450.63
Table 3.14 : Computation of Standard Deviation
Year Annual rainfall
(X)
Deviation from mean
(ΔX= X-X1)
ΔX2 ΔX3
2004 229.00 -221.63 49119.86 -10886433.88
2005 369.00 -81.63 6663.46 -543937.99
2006 385.30 -65.33 4268.01 -278829.02

EIA/EMP report of Sand/Bajri Mine (With ML Area of 4280.0 ha) Tehsil Marwar Jn., District Pali, Rajasthan
EQMS India Pvt. Ltd. 80
2007 435.00 -15.63 244.30 -3818.36
2008 494.00 43.37 1880.96 81577.10
2009 180.00 -270.63 73240.60 -19821102.74
2010 701.00 250.37 62685.14 15694477.73
2011 593.00 142.37 20269.22 2885728.41
2012 483.00 32.37 1047.82 33917.83
2013 637.00 186.37 34733.78 6473334.00
Total 4506.30 0.0 254153.12 -6365086.92
Mean (X1) =∑X/n = 450.63
Standard Deviation(σ) = √ ∑X 2/n-1 = 168.04
Co-efficient of Skew = ∑X3/(n-1) σ3 = -0.15
4. Cloud Cover
During the study period, it was observed that the skies were generally very clear and had
a few cloudy days but with less than 2.0 oktas of sky.
5. Wind Speed / Direction
The wind rose diagram developed during each month of Post-monsoon season (October
2013 to December 2013) and the combined seasonal are shown in Figure 3.14. It reveals
that pre-dominant wind direction occurs mostly from East to West, North East to South
West, North – West, South to North, South West to East North respectively. The average
mean wind speed is 1.67 m/s (6.0 kmph) and the maximum speed observed was 20.4
kmph. For less than 1% duration of total time count Calm prevailed. The resultant vector
of wind direction has a frequency of 25% with an average wind direction of 690. The
frequency distribution of wind class for complete post-monsoon season depicted in Figure
3.15 shows that wind with velocity 0.5-1.5 m/s (1.8 kmph – 5.4 kmph) prevailed for 48%
of the total time count, wind velocity ranging between 1.5 – 2.5 m/s (5.4 kmph – 9.0 kmph)
has prevailed for 34.9%. The wind velocity between 3.5 to 4.5m/s (12.6 kmph to 16.2
kmph) had a frequency of 2.4% only.

EIA/EMP report of Sand/Bajri Mine (With ML Area of 4280.0 ha) Tehsil Marwar Jn., District Pali, Rajasthan
EQMS India Pvt. Ltd. 81
Table 3.15 : Site Specific Meteorological Data
Day
Oct-13 Nov-13 Dec-13
Temperature (⁰C)
Humidity (%)
Wind Speed
(Km./hr.) Rain Fall
(mm)
Temperature (⁰C)
Humidity (%)
Wind Speed
(Km./hr.) Rain Fall
(mm)
Temperature (⁰C)
Humidity (%)
Wind Speed
(Km./hr.) Rain Fall
(mm) Max Min Max Min Max Min Max Min Max Min Max Min Max Min Max Min Max Min
1 32.2 21.2 65.5 33.4 12.0 2.0 11 33.5 15.0 57.0 28.3 13.0 1.0 - 25.2 9.5 58.4 28.1 11.1 3.0 -
2 32.0 20.1 59.1 31.7 10.0 3.0 - 32.2 18.0 60.3 28.3 13.0 2.0 - 27.2 9.5 57.0 29.4 13.0 1.0 -
3 32.1 20.2 54.1 28.6 9.0 3.0 - 33.6 17.4 57.7 26.3 11.1 2.0 - 28.7 10.6 62.0 32.0 10.0 2.0 -
4 34.4 20.4 54.8 28.3 13.0 4.0 - 34.4 18.3 57.7 26.5 11.1 2.0 - 28.7 13.4 60.5 33.1 9.0 1.0 -
5 34.8 19.8 54.6 29.4 14.8 4.0 - 33.2 17.6 61.3 27.2 14.8 3.0 - 29.3 13.6 61.9 33.3 8.0 2.0 -
6 34.8 21.0 53.6 34.9 11.0 3.0 - 33.6 16.1 59.5 35.9 11.1 1.0 - 29.5 13.9 64.8 31.3 8.0 4.0 -
7 35.6 22.1 57.5 32.5 14.8 4.0 - 33.1 15.9 59.4 30.3 14.8 2.0 - 29.6 11.8 61.4 28.9 7.0 3.0 -
8 36.3 22.1 65.8 39.7 11.1 3.0 - 33.6 15.9 57.1 27.2 7.4 3.0 - 29.3 11.0 62.0 30.4 9.0 2.0 -
9 36.6 19.6 63.0 30.9 11.1 3.0 29 33.9 17.1 48.3 26.3 11.1 1.0 - 29.2 11.0 65.0 30.7 13.0 3.0 -
10 35.6 22.1 54.6 28.3 11.1 4.0 - 33.9 16.7 53.9 29.3 9.3 3.0 - 29.3 11.0 62.9 30.9 13.0 3.0 -
11 36.4 20.1 61.0 30.3 13.0 4.0 - 33.8 17.1 52.4 29.3 11.1 2.0 - 27.8 13.7 59.9 27.2 13.0 2.0 -
12 36.0 19.5 53.5 27.3 13.0 3.0 6 33.7 17.1 58.7 27.3 7.4 2.0 - 27.7 10.9 61.1 27.2 11.1 2.0 -
13 34.9 19.5 51.0 26.3 12.0 4.0 - 33.0 16.9 47.9 25.3 11.1 3.0 - 27.2 10.2 55.5 29.3 14.8 3.0 -
14 34.9 17.7 54.0 26.4 13.0 3.0 - 30.5 13.7 52.3 26.1 7.4 1.0 - 27.2 13.6 66.7 34.5 11.1 3.0 -
15 34.9 19.3 54.2 27.3 13.0 3.0 - 31.8 15.0 49.3 27.5 9.3 2.0 - 28.4 13.6 67.3 39.6 11.1 4.0 -
16 35.5 19.3 50.6 29.5 10.0 2.0 - 32.0 15.0 53.4 27.2 9.3 1.0 - 27.0 13.6 68.3 41.7 13.0 3.0 -
17 35.5 18.0 51.3 28.9 13.0 3.0 - 32.0 16.4 55.2 27.3 7.4 2.0 - 26.5 13.4 66.3 37.2 13.0 3.0 -
18 35.5 17.0 55.8 30.9 11.1 3.0 - 32.1 16.0 57.2 27.5 7.4 2.0 - 27.2 13.4 65.3 34.3 18.5 2.0 -
19 35.3 18.1 65.3 31.8 14.0 2.0 - 32.7 15.1 55.4 24.8 9.3 2.0 - 27.1 13.4 64.0 39.3 13.0 3.0 -
20 34.8 20.7 61.3 30.3 13.0 2.0 - 33.3 14.3 54.1 26.2 11.1 2.0 - 26.2 13.4 66.3 36.4 11.1 3.0 -
21 34.5 16.5 54.1 26.3 12.0 3.0 - 31.5 12.6 54.3 28.4 11.1 2.0 - 26.2 10.3 65.0 31.3 9.0 3.0 -
22 34.5 17.2 61.0 32.1 9.0 4.0 - 31.5 13.7 63.3 27.8 9.3 1.0 - 27.9 10.3 60.9 27.4 11.1 3.0 -

EIA/EMP report of Sand/Bajri Mine (With ML Area of 4280.0 ha) Tehsil Marwar Jn., District Pali, Rajasthan
EQMS India Pvt. Ltd. 82
23 34.5 17.8 61.4 26.3 13.0 4.0 - 30.8 15.1 56.5 27.0 13.0 3.0 - 26.1 10.6 62.3 34.2 9.0 2.0 -
24 33.2 17.1 53.8 24.4 11.1 4.0 - 31.2 14.1 54.8 28.2 7.4 3.7 - 27.9 10.6 60.1 28.9 11.1 2.0 -
25 33.1 16.0 54.3 25.3 12.0 3.0 - 30.8 15.1 62.7 27.7 14.8 2.0 - 27.0 8.9 59.3 27.6 9.0 2.0 -
26 33.6 16.0 51.2 25.2 12.0 4.0 - 30.8 15.1 56.2 25.7 7.4 2.0 - 26.4 8.9 59.3 26.7 11.0 2.0 -
27 33.6 14.0 54.1 26.6 12.0 3.0 - 31.7 15.1 55.5 23.5 11.1 2.0 - 27.0 9.5 55.1 28.2 11.1 2.0 -
28 33.6 14.8 57.1 28.2 11.1 4.0 - 31.4 15.1 59.0 27.9 18.5 2.0 - 23.7 12.2 62.1 31.7 20.4 3.0 -
29 33.3 14.8 50.4 25.2 11.0 3.0 - 30.9 15.1 50.0 25.8 11.1 1.0 - 21.9 7.3 70.2 38.9 11.1 3.0 -
30 32.7 14.9 55.3 27.1 12.0 3.0 - 29.6 11.3 59.0 25.4 14.8 2.0 - 20.7 6.2 63.3 29.8 18.5 2.0 -
31 33.3 14.9 52.9 27.3 12.0 5.0 - - 22.0 6.8 63.7 30.3 13.0 3.0 -
Max 36.6 65.8 14.8 - 34.4 63.3 18.5 - 29.6 70.2 20.4 -
Min 14.0 24.4 2.0 - 11.3 28.3 1.0 - 6.2 26.7 1.0 -
Total Rainfall 46
-
-

EIA/EMP report of Sand/Bajri Mine (With ML Area of 4280.0 ha) Tehsil Marwar Jn., District Pali, Rajasthan
EQMS India Pvt. Ltd. 83
October 2013 November 2013
December 2013 October TO December 2013
Figure 3.14 : Site Specific Windrose Diagram

EIA/EMP report of Sand/Bajri Mine (With ML Area of 4280.0 ha) Tehsil Marwar Jn., District Pali, Rajasthan
EQMS India Pvt. Ltd. 84
Figure 3.15 : Frequency Distribution of Wind Class
3.5. Air Quality
The study area represents mostly rural environment in arid-zone of Western Rajasthan.
The ambient air quality with respect to the study area covered in Tehsil including the linear
mine lease area forms the baseline information. The various sources of air pollution in the
region are traffic, urban and rural activities. This will also be useful for assessing the
conformity to standards of the ambient air quality during the mine operation.
This section describes the selection of sampling locations, methodology adopted for
sampling, analytical techniques and frequency of sampling.
3.5.1. Methodology Adopted for Air Quality Survey
3.5.1.1 Selection of Sampling Locations
The baseline status of the ambient air quality has been assessed through a scientifically
designed ambient air quality-monitoring network. The design of monitoring network in the
air quality surveillance programme has been based on the following considerations:
Meteorological conditions on synoptic basis;
Topography of the study area and linear nature of project;
Representatives of regional background air quality for obtaining baseline
status; and
Representatives of likely impact areas particularly covering the zone for
maximum annual mining, material handling and transportation interface areas.
Representative residential, rural and commercial area consideration
Ambient air quality monitoring stations were set up at seven locations with due
consideration to the above mentioned points. The location of the selected stations with
reference to the project site and details of environmental setting around each monitoring
station are given in Table 3.16 and Figure 3.13.

EIA/EMP report of Sand/Bajri Mine (With ML Area of 4280.0 ha) Tehsil Marwar Jn., District Pali, Rajasthan
EQMS India Pvt. Ltd. 85
Table 3.16 : Details of Ambient Air Quality Monitoring Locations
Station Code
Name of the Station Distance (km) from the river boundary (
mining area)
Direction w.r.t. river (mining
area)
Environmental Setting
A-1 Marwar Junction Lithri river- 5 SW Commercial
A-2 Dhanla Village Bandi river – 0.4 S Rural/Residential
A-3 Dhanla River bed Bandi river – 0.0 S River bed
A-4 Awa village Lilri nadi – 0.5 N Rural/Residential
A-5 Siriyari village Sukri river – 4.25 NE Rural/Residential
A-6 Bhagora village Bandi river – 0.35 N Rural/Residential
A-7 Musalia village Kantaliya river – 0.30 N Rural/Commercial
Figure 3.16 : Location of Monitoring and Sampling Stations

EIA/EMP report of Sand/Bajri Mine (With ML Area of 4280.0 ha) Tehsil Marwar Jn., District Pali, Rajasthan
EQMS India Pvt. Ltd. 86
3.5.1.2 Monitoring plan
Monitoring is carried out for Particulate Matter (PM10), Sulphur dioxide (SO2), and
Oxides of Nitrogen (NOx) as per TOR. Sampling was carried out on 24hourly twice a
week, for 12 week basis starting from 1st October 2013 to 30 December 2013 (Post
monsoon season).
Ambient air quality levels were assessed with respect to National ambient air quality
standards prescribed by Central pollution Control board (CPCB) 2009
3.5.2. Presentation of Primary Data
The survey results for the three months study period (October 2013 to December 2013)
are presented in detail in Table 3.17. Various statistical parameters like 98th percentile,
mean, maximum and minimum values have been computed from the observed data
for all the AAQ monitoring stations. The mineral composition of the PM10 for silica
content was carried out and it was found to range between 2.1 to 3.3 µg/m3.

EIA/EMP report of Sand/Bajri Mine (With ML Area of 4280.0 ha) Tehsil Marwar Jn., District Pali, Rajasthan
EQMS India Pvt. Ltd. 87
Table 3.17 : Ambient Air Quality results (µg/m3)
Date
Marwar junction (A-1)
Dhanla Village (A-2) Dhanla River bed (A-
3) Date
Auwa village (A-4) Siriyari village (A-5)
PM10 SO2 NOx PM1
0
SO
2 NOx
PM10 SO2 NOx PM1
0
SO
2 NOx
PM1
0
SO
2 NOx
10-01-2013 76 5.6 22.8 63 5.2 20.8 66 6.2 20.8 10-02-2013 69 5.6 20.8 60 5.4 23.6
10-03-2013 81 6.4 21.6 65 5.8 22.4 61 6.8 22.4 10-04-2013 66 6.8 23.2 72 6.0 20.8
10-09-2013 85 7.2 23.2 60 5.0 21.0 60 6.0 20.0 10-10-2013 62 7.0 22.6 62 6.5 24.0
10-11-2013 75 4.8 19.2 69 5.6 20.8 55 7.0 24.3 10-12-2013 71 5.8 20.2 69 7.0 22.2
18/10/2013 78 5.5 23.5 66 5.4 24.8 66 6.4 22.8 19/10/2013 64 6.5 23.4 66 5.8 20.5
20/10/2013 80 5.2 20.8 55 5.9 22.5 58 6.3 25.5 21/10/2013 68 5.6 25.1 69 5.2 21.7
25/10/2013 75 6.0 24.5 58 6.4 22.0 67 5.8 21.4 26/10/2013 59 5.2 21.6 60 5.4 20.0
27/10/2013 95 7.8 25.2 62 6.8 24.0 62 6.5 22.0 28/10/2013 63 5.0 22.4 56 5.0 21.8
11-02-2013 108 8.8 28.6 77 8.0 26.3 79 7.8 24.7 11-03-2013 78 6.6 22.6 64 5.2 22.4
11-04-2013 106 7.9 25.8 69 5.0 20.5 61 6.0 22.8 11-05-2013 72 5.6 23.0 67 5.7 23.0
11-09-2013 85 5.6 24.0 65 4.7 20.8 65 5.5 21.5 11-10-2013 69 5.2 21.7 68 6.7 21.6
11-11-2013 81 6.4 21.8 56 7.0 21.3 72 6.2 20.8 11-12-2013 70 6.8 22.8 71 5.6 24.8
16/11/2013 83 6.0 22.0 68 5.2 22.4 66 6.6 22.4 17/11/2013 72 5.2 21.2 65 4.8 22.2
18/11/2013 77 7.2 23.2 64 5.3 19.4 64 6.0 20.5 19/11/2013 64 5.4 19.2 58 5.6 24.0
24/11/2013 75 6.9 21.4 66 5.6 18.0 58 5.6 22.4 25/11/2013 75 6.0 24.0 55 6.4 24.8
26/11/2013 72 6.5 22.7 70 5.6 22.4 61 5.3 20.2 27/11/2013 68 5.2 20.8 52 5.4 19.2
12-02-2013 70 5.2 23.0 65 5.1 21.7 66 6.4 20.6 12-03-2013 62 6.8 25.0 56 6.0 24.2
12-04-2013 76 6.0 21.6 61 6.4 22.6 70 5.4 19.0 12-05-2013 56 7.2 22.0 62 4.8 20.8
12-09-2013 73 7.2 19.1 58 5.2 21.3 73 6.3 21.6 12-10-2013 55 5.6 20.8 67 6.2 22.4
12-11-2013 68 6.6 20.8 63 6.0 23.0 65 6.0 23.0 12-12-2013 53 6.8 21.2 61 5.6 21.2
17/12/2013 70 6.8 22.3 57 5.5 22.8 62 6.6 23.7 18/12/2013 53 5.6 22.3 64 4.8 20.0
19/12/2013 72 5.0 19.7 62 6.4 21.7 60 5.8 22.2 20/12/2013 58 5.0 18.0 68 6.4 21.2
24/12/2013 69 6.5 18.5 60 5.6 20.0 57 5.6 23.2 25/12/2013 59 5.6 20.8 69 5.6 20.5
26/12/2013 76 6.4 21.6 63 5.2 21.2 66 5.2 22.5 27/12/2013 63 6.3 23.2 66 5.2 22.4
Max 108 8.8 28.6 77 8.0 26.3 79 7.8 25.5 Max 78 7.2 25.1 72 7.0 24.8
Min 68 4.8 18.5 55 4.7 18.0 55 5.2 19.0 Min 53 5.0 18.0 52 4.8 19.2
Mean 79 6.4 22.4 63 5.7 21.8 64 6.1 22.1 Mean 65 5.9 22.0 64 5.7 22.1
98 percentile 107 8.4 27.3 74 7.5 25.6 76 7.4 25.1 98 percentile 77 7.1 25.1 72 6.9 24.8
Standard (24 hr.)
100 80 80 100 80 80 100 80 80 Standard (24
hr.) 100 80 80 100 80 80

EIA/EMP report of Sand/Bajri Mine (With ML Area of 4280.0 ha) Tehsil Marwar Jn., District Pali, Rajasthan
EQMS India Pvt. Ltd. 88
Date Bhagora (A-6) Musalia (A-7)
PM10 SO2 NOx PM10 SO2 NOx
10-05-2013 78 6.2 22.0 60 6.5 23.0
10-07-2013 61 6.5 19.2 66 6.0 21.5
10-12-2013 70 6.0 20.6 72 6.8 22.3
14/10/2013 66 5.2 21.5 70 5.0 21.6
20/10/2013 61 6.4 25.2 75 5.3 21.3
22/10/2013 67 6.0 23.0 68 6.2 22.5
28/10/2013 59 5.6 22.5 71 6.0 21.6
30/10/2013 74 7.1 25.0 62 5.2 20.8
11-06-2013 68 5.2 23.8 61 6.4 25.6
11-08-2013 65 5.6 21.7 65 5.1 22.0
13/11/2013 59 6.7 23.3 68 6.4 24.8
15/11/2013 56 6.0 24.0 64 5.8 21.6
21/11/2013 51 5.8 20.8 65 5.6 20.8
23/11/2013 55 5.2 21.0 69 6.2 22.2
28/11/2013 62 5.3 22.5 62 6.0 22.6
30/11/2013 67 6.8 21.4 67 5.6 20.9
12-06-2013 66 5.5 19.2 63 5.3 21.0
12-08-2013 70 5.6 20.8 66 5.3 22.0
13/12/2013 62 5.0 21.0 64 5.6 19.7
15/12/2013 58 7.2 22.5 70 6.7 22.3
21/12/2013 61 5.6 21.2 62 6.8 21.4
23/12/2013 65 6.8 20.8 66 5.2 20.5
28/12/2013 66 5.2 21.5 61 5.4 21.8
30/12/2013 64 5.5 22.1 65 6.0 22.6
Max 78 7.2 25.2 75 6.8 25.6
Min 51 5.0 19.2 60 5.0 19.7
Mean 64 5.9 21.9 66 5.9 21.9
98 percentile 76 7.2 25.1 74 6.8 25.2
Standard (24 hr.)
100 80 80 100 80.0 80.0

EIA/EMP report of Sand/Bajri Mine (With ML Area of 4280.0 ha) Tehsil Marwar Jn., District Pali, Rajasthan
EQMS INDIA PVT. LTD. 89
Interpretation of theresults
Thes results are compared with the National Ambient Air Quality Standards (NAAQS)
prescribed by MoEF, GoI Notification dated 16.11.2009.
Core Zone–Mine Area (A-3)
Particulate Matter (size less than 10 micron) or PM10, monitored in the Mine area showed
98th percentile value of 76 µg/m3
98th percentile values of Sulphur di oxide and Oxides of Nitrogen in the mine area from the
monitored data were 7.4 µg/m3 and 25.1 µg/m3 respectively.
Buffer Zone (Stations A1, A-2, A-4, A-5, A-6 and A-7)
PM10 values monitored at 6 locations showed 98th percentile values in the range of 7 2 –
1 0 7 µg/m3. Highest value was recorded at Marwar junction and exceeds the limits of
NAAQS. Concentrations of PM10 is mainly contributed due to vehicular traffic and local
activities
98th percentile value of Sulphur di oxide in the study area from the monitored data was in
the range of 6.9 - 8.4 µg/m3. Maximum value was recorded near the sampling station
located at Marwar Junction. The values of SO2 monitored in the study area are well with in
the limits of NAAQS.
Ambient air quality status monitored for nitrogen oxides in the study area were in the range
with 98th percentile values between 24.8– 27.3 µg/m3. A maximum value of was prevailing
at the time of sampling at Marwar junction. The values of NOx monitored in the study area
are well within the limits of NAAQS.
3.6. Water Quality
Selected water quality parameters of ground water resources within 10-km radius of the
study area have been studied to assess the water environment and evaluate anticipated
impact of the project. Understanding the water quality is essential in preparation of
Environmental Impact Assessment and to identify critical issues with a view to suggest
appropriate mitigation measures for implementation.

EIA/EMP report of Sand/Bajri Mine (With ML Area of 4280.0 ha) Tehsil Marwar Jn., District Pali, Rajasthan
EQMS INDIA PVT. LTD. 90
The purpose of this study is to:
Assess the water quality characteristics for critical parameters;
Evaluate the impacts on agricultural productivity, habitat conditions, recreational
resources and aesthetics in the vicinity; and
Predict impact on water quality by this project and related activities.
The information required has been collected through primary surveys and secondary
sources.
3.6.1. Methodology
Reconnaissance survey was undertaken and monitoring locations were finalized based on:
Drainage pattern;
Location of residential areas representing different activities /likely impact areas; and
Likely areas, which can represent baseline conditions.
Five ground water sources in the study area were examined for physico-chemical, heavy
metals and bacteriological parameters in order to assess the effect of industrial and other
activities on ground water. The samples were analyzed as per the procedures specified in
“Standard Methods for the Examination of Water and Wastewater” published by American
Public Health Association (APHA).
Samples for chemical analysis were collected in polyethylene carboys. Samples collected
for metal content were acidified with 1 ml HNO3. Samples for bacteriological analysis were
collected in sterilized glass bottles. Selected physico-chemical and bacteriological
parameters have been analyzed for projecting the existing water quality status in the study
area. Parameters like temperature, dissolved oxygen (DO) and pH were analyzed on spot
at the time of sample collection.
3.6.2. Water Sampling Locations
Surface water sample grabbed from one location and ground water from four locations
which were analyzed for various parameters to compare with the standards for drinking
water as per IS: 10500 for drinking water as well as IS: 2296 (Class A) for surface water
sources. The water sampling locations are identified in Table 3.18 and depicted in Figure
3.16.

EIA/EMP report of Sand/Bajri Mine (With ML Area of 4280.0 ha) Tehsil Marwar Jn., District Pali, Rajasthan
EQMS INDIA PVT. LTD. 91
Table 3.18 : Water Sampling Locations
Code Location
Surface Water
SW1 Siriyari Dam
Ground Water
GW1 Badsa Village
GW2 Kharchi
GW3 Jogdawas
GW4 Marwar City
GW5 Marwar Jn.
3.6.3. Presentation of Results
The results of the water quality monitored during the study period representing Post
Monsoon season for surface water and ground water samples are given in Table 3.19 to
Table 3.20 respectively.
3.6.3.1 Interpretation of Surface Water Quality
The analysis results indicate that pH (7.69) is well within the range of 6.5 - 8.5 i.e. specified
standard limits. The TDS is above the tolerance limit (500 mg/l). Dissolved Oxygen was
observed to be 7 mg/l which indicate the surface water quality is conducive for aquatic life.
The Chlorides and Sulphates were well within the tolerance limits (Chlorides 250 mg/l and
sulphates 400 mg/l). Bacteriological studies reveal the presence of E.coli. The Heavy metal
content is found below detectable limits. The surface water quality is good for fish culture,
irrigation purpose and outdoor bathing except drinking water source with conventional
treatment
3.6.3.2 Ground Water Quality
Most of the village in the project area has tap water supply mostly off taking from springs
as well as local springs nearby the village and residents of these villages make use of this
water for drinking and other domestic uses.
The analysis results indicate that the pH ranged between 7.2 to 7.9 which are well within
the specified standard of 6.5 to 8.5 limits. Total hardness recorded ranged from 111 to 2480
mg/l and was below desirable and permissible limit for two location each respectively and
exceeded the permissible limit in Marwar Junction (2480 mg/l). The Total Dissolved Solids
(TDS) concentration recorded ranged between 311 to 4050 mg/l; it was below the desirable

EIA/EMP report of Sand/Bajri Mine (With ML Area of 4280.0 ha) Tehsil Marwar Jn., District Pali, Rajasthan
EQMS INDIA PVT. LTD. 92
limit in case of one station and for three stations it was below the permissible limit while
exceeded in case of one station i.e. Marwar Junction.
Chloride at all the locations with the exception of Marwar Junction (1750 mg/l). was within
the permissible limit. Fluorides recorded exceeded the desirable limit at all locations and
exceeded the permissible limit at one location. Nitrates were found to be within the
desirable limit. Bacteriological studies reveal that no coliform bacterial are present in the
samples. The heavy metal contents were observed to be in below detectable limits.
Table 3.19 : Physico chemical and Biological Characteristics of Surface Water
Parameters Tolerance limits for inland surface water class A (drinking water without conventional treatment but after
disinfection) as per IS:2296 - 1982
Siriyari Dam
(SW-1)
Colour (Hazen) - < 5
Conductivity (μmhos/cm) - 1138 Turbidity (NTU) - 2.1 pH 6.5 - 8.5 7.69 Total Dissolved Solids (mg/l) 500 662 Total Suspended Solids (mg/l) - 10 Total Hardness (as CaCO3) mg/liter 300 344 Chlorides (as Cl ) mg/l 250 232 Sulphate (as SO4) mg/l 400 19 Nitrate ( as NO3 ) mg/l 20 32 Phosphate (as PO4) mg/l - BDL Fluoride (as F) mg/l 1.5 0.8 Iron (as Fe) mg/l 0.3 0.44 Lead (as Pb) mg/l 0.1 BDL Copper (as Cu) mg/l 1.5 BDL Nickel (as Ni) mg/l - BDL Zinc (as Zn) mg/l 15 BDL Total Chromium (as Cr) mg/l 0.05 BDL Manganese ( as Mn ) mg/l 0.5 BDL Oil & Grease (mg/l) 0.01 3 Calcium (as Ca) mg/l 200 62 Magnesium (as Mg) (mg/l) 100 46 Total Alkalinity (mg/l) 200 42 Chemical Oxygen demand mg/l - 144 BOD (for 3 days at 270C) (mg/l) 3
30
Dissolved Oxygen (mg/l) 6 7

EIA/EMP report of Sand/Bajri Mine (With ML Area of 4280.0 ha) Tehsil Marwar Jn., District Pali, Rajasthan
EQMS INDIA PVT. LTD. 93
Table 3.20 : Physico chemical and Biological Characteristics of Ground Water
Parameters Desirable limits (IS:1050
0)
Permissible limits (IS:10500
)
Badsa
Village
(GW-1)
Kharchi
(GW-2)
Jogdawas (GW-3)
Marwar City (GW-
4)
Marwar Junction (GW-5)
Colour (Hazen Units)
< 5 < 5 < 5 < 5 < 5
Conductivity (μmhos / cm)
- - 623 2262 2278 3459 6751
Turbidity (NTU) 5 10 0.1 5.1 1.3 3.2 0.8
pH 6.5 to 8.5 No relaxatio
n
7.29 7.48 7.448 7.17 6.51
Total Dissolved Solids (mg/l)
500 2000 311 1387 1084 1733 4050
Total Hardness (as CaCO3) mg/l
300 600 111 400 134 408 2480
Chlorides (as Cl ) mg/l
250 1000 120 735 535 935 1750
Sulphate (as SO4) mg/l
200 400 8 30 16 32 22
Nitrate (as NO3 ) mg/l
45 100 30 35 32 28 42
Phosphate (as PO4) mg/l
- - BDL 3 3 2 2
Fluoride (as F) mg/l
1 1.5 1.1 0.8 1.2 1.3 1.8
Iron (as Fe) mg/l 0.3 1 0.14 0.21 0.16 0.24 0.2
Lead (as Pb) mg/l 0.05 No relaxatio
n
BDL BDL BDL BDL BDL
Copper (as Cu) mg/l
0.05 1.5 BDL BDL BDL BDL BDL
Nickel (as Ni) mg/l - - BDL BDL BDL BDL BDL
Zinc (as Zn) mg/l 5 15 BDL BDL BDL BDL BDL
Total Chromium (as Cr) mg/l
0.05 No relaxatio
n
BDL BDL BDL BDL BDL
Manganese (as Mn) mg/l
0.1 0.3 BDL BDL BDL BDL BDL
Calcium (as Ca) mg/l
75 200 14 74 14 61 984
Magnesium (as Mg) (mg/l)
30 100 18 52 24 62 5
Total Alkalinity (mg/l)
200 600 72 104 46 96 36
Total Coliform (MPN/100 ml)
10 10 NIL NIL NIL NIL NIL
EIA/EMP report of Sand/Bajri Mine (With ML Area of 4280.0 ha) Tehsil Marwar Jn., District Pali, Rajasthan
EQMS INDIA PVT. LTD. 94
3.7. Soil
3.7.1. Soil Classification
The soil resource map of Rajasthan (NBSS Publication No-51) has been used in the
present study. The soil is predominantly fine to coarse loamy soil. The soil of the district
belongs to those of Soils of Semi-Arid Transitional Plain with Landscape Map unit numbers
as 107,114,122,125,126,132 & 141 representing the Soils of Aeofluvial Luni Basin and
Soils of Central Highlands-Aravalli with Landscape Map unit number as 174 representing
the Soils of Hilly Terrain with Ridges and Furrows, Landscape Map unit number as 190
also representing the Soils of Pediments and Soils of Pediments with thin Veneer of Sand
having Landscape Map Unit number as 212.The characteristics of these soils are described
hereunder and the soil map of the district is presented in Figure 3.14
Soils of Semi-Arid Transitional Plain
Soil Map Unit 107
These soils are deep, well drained, sandy soils on nearly level plains with sandy surface,
slightly eroded; associated with: Moderately shallow, well drained, coarse loamy soil,
moderately eroded. Taxonomically the soils are classified as Typic Torripsamments and
Typic Camborthids.
Soil Map Unit 114
These soils are very deep, well drained, sandy soils on gently sloping plains with sandy
surface, severely eroded; associated with: Very deep, well drained, coarse loamy soils,
severely eroded, slightly saline. Taxonomically the soils are classified as Typic
Torripsamments and Ustochreptic Camborthids.
Soil Map Unit 122
These soils are very deep, well drained, coarse loamy soils on very gently sloping plains
with sandy surface, moderately eroded; associated with: Shallow, well drained, fine loamy
soils, slightly eroded, slightly saline. Taxonomically the soils are classified as Typic
Camborthids.
Soil Map Unit 125
These soils are very deep, moderately well drained, coarse loamy soils on very gently
sloping aeofluvial plains with sandy surface, moderate erosion; associated with: Very deep,
well drained, coarse loamy soils on very gently sloping aeofluvial plains of luni basin with

EIA/EMP report of Sand/Bajri Mine (With ML Area of 4280.0 ha) Tehsil Marwar Jn., District Pali, Rajasthan
EQMS INDIA PVT. LTD. 95
slight erosion, slightly saline and sodic. Taxonomically the soils are classified as Typic
Camborthids.
Soil Map Unit 126
These soils are shallow, moderately well drained, calcareous, sandy soil on very gently
sloping plains with sandy surface, moderately eroded, associated with moderately shallow,
well drained, calcareous, sandy skeletal soils, severely eroded. Taxonomically the soils are
classified as Typic Paleorthids and Typic Torriorthents.
Soil Map Unit 132
These soils are very deep, well drained, fine loamy soils on very gently sloping plains with
sandy surface, moderately eroded; associated with; very deep, well drained, sandy soils,
severely eroded. Taxonomically the soils are classified as Typic Camborthids and Typic
Torripsamments.
Soil Map Unit 141
These soils are deep, well drained, coarse loamy soils on very gently sloping plains with
sandy surface, moderately eroded; associated with moderately shallow, moderately well
drained, calcareous, fine loamy soils, slightly eroded. Taxonomically the soils are classified
as Typic Camborthids.
Soils of Central Highlands-Aravalli Landscape
Soil Map Unit 174
These soils are Rock-outcrops; associated with moderately shallow, well drained, loamy
skeletal soils on moderately steeply sloping side slops, severely eroded and strongly stony.
Taxonomically the soils are classified as Rock-outcrops and Aridic Ustochrepts.
Soils of Pediments
Soil Map Unit 190
These soils are moderately shallow, well drained, coarse loamy soils on gently sloping
pediments with loamy surface, severely eroded ; associated with very shallow, well drained,
sandy skeletal soil, very severely eroded, moderately stony. Taxonomically the soils are
classified as Typic Ustochrepts and Lithic Ustochrepts.
Soils of Pediments with thin Veneer of Sand
Soil Map Unit 212

EIA/EMP report of Sand/Bajri Mine (With ML Area of 4280.0 ha) Tehsil Marwar Jn., District Pali, Rajasthan
EQMS INDIA PVT. LTD. 96
These soils are Moderately shallow, well drained, coarse loamy soils on very gentle sloping
pediments with loamy surface, moderately eroded, ; associated with very shallow , well
drained, loamy soils on gently sloping pediments, severely eroded. Taxonomically the soils
are classified as Aridic Ustochrepts and Lithic Torriorthents.
Figure 3.17 : Soil Map of the Study Area

EIA/EMP report of Sand/Bajri Mine (With ML Area of 4280.0 ha) Tehsil Marwar Jn., District Pali, Rajasthan
EQMS INDIA PVT. LTD. 97
3.7.2. Soil Characteristics
Soil fertility is an important aspect of the soil-plant relationship. Fertility status of the soils
is primarily and importantly dependent upon both the macro and micronutrient reserve of
the soil. Continued removal of nutrients by crops, with little or no replacement will increase
the nutrient stress in plants and ultimately lowers the productivity. The fertility status of soil
mainly depends upon the nature of vegetation, climate & topography, texture &
decomposition rate of organic matter in the soil. Optimum productivity of any cropping
systems depends upon adequate supply of plant nutrients.
The fertility of soil depends on the concentration of N, P, K, organic and inorganic materials
and water. Nitrogen is required for growth of plant and is a constituent of chlorophyll, plant
protein, and nucleic acids. Phosphorus is most often limiting nutrients remains present in
plant cell nuclei and act as energy storage. It helps in transfer of energy. Potassium is
found in its mineral form and affect plant cell division, carbohydrate formation, translocation
of sugar, various enzyme actions and resistance to certain plant disease, over 60 enzymes
are known to require potassium for activation.
It is essential to determine the potential of soil in the area to identify the current impacts of
urbanization and industrialization on soil quality and predict impacts, which may arise due
to the project operations. Accordingly, a study of assessment of the baseline soil quality
has been carried out.
3.7.3. Data Generation
For studying soil quality of the region, four sampling locations were selected to assess the
existing soil conditions in and around the Mining area representing various land use
conditions. The samples have been collected from the depth of 5 to 15cm and
representative samples prepared by thoroughly mixing. The homogenized samples were
analysed for physico chemical characteristics.
The detail of sampling locations is given in Table 3.21 and shown in Figure 3.13. The soil
quality at all the locations during the study period is tabulated in Table 3.22.
Table 3.21 : Details of Soil Sampling Locations
Location code Location Present Land Use
S1 Basada Agriculture
S2 Kharchi Agriculture
S3 Jogdawas Agriculture
S4 Marwar Agriculture

EIA/EMP report of Sand/Bajri Mine (With ML Area of 4280.0 ha) Tehsil Marwar Jn., District Pali, Rajasthan
EQMS INDIA PVT. LTD. 98
S5 Dhalna Riverbed Sand
Table 3.22 : Physico-chemical Characteristics of Soil
S.No.
Parameter
Sampling Locations
Basada
S-1
Kharchi
S-2
Jogdawas
S-3
Marwar
S-4
Dhalna
S-5
1 Color Dark
Brownish
Dark
Brownish
Brownish Brownish Brownish
2 Texture Sandy clay
Loam
Sandy clay
Loam
Sandy clay
Loam
Sandy clay
Loam
Sandy
3 pH (20%Slurry) 7.7 7.9 7.4 7.5 7.3
4 EC (µmhos/cm) 172 162 183 186 156
5 Bulk Density
(gm/cc) 1.47 1.52 1.56 1.56 1.68
6 Moisture (%) 0.4 0.6 0.8 0.5 0.2
7 Chloride ( mg/kg) 414 579 965 676 406
8 Organic Matter (%) 1.8 2.0 1.6 1.6 0.6
9 Water Holding
Capacity (%)
28.0 24.7 25.8 25.0 16.4
10 Potassium (mg/kg) 21 22 15 21 12
11 Phosphorus (mg/kg) 26 30 24 32 18
12 Nitrogen (mg/kg) 28 27 22 20 16
13 Carbonate(mg/kg) BDL BDL DBL BDL BDL
14 Bi-
Carbonate(mg/kg)
115 756 390 390 366
15 SAR 1.0 0.9 1.0 1.1 0.8
Source: Kamal Enviro & Food Lab. Pvt , Ltd. Gurgaon-Haryana
3.7.4. Soil reaction classes and critical limits for Macro and Micro nutrients in soil
According to Soil Survey Manual (IARI, 1970), the soils are grouped under different soil
reaction classes viz extremely acidic (pH<4.5), very strongly acidic (pH 4.5 – 5.0 ), strongly
acidic (pH 5.1 – 5.5), moderately acidic (pH 5.6-6.0), slightly acidic (pH 6.1-6.5), neutral

EIA/EMP report of Sand/Bajri Mine (With ML Area of 4280.0 ha) Tehsil Marwar Jn., District Pali, Rajasthan
EQMS INDIA PVT. LTD. 99
(pH 6.6- 7.3), slightly alkaline (pH 7.4-7.8), moderately alkaline (pH 7.9-8.4), strongly
alkaline (pH 8.5-9.0).The soils are rated as low (below 0.50 %), medium (0.50-0.75 %) and
high (above 0.75 %) in case of organic carbon, low (<280 kg ha-1), medium (280 to 560 kg
ha-1) and high (>560 kg ha-1) in case of available nitrogen, low (< 10 kg ha-1), medium
(10 to 25 kg ha-1) and high (> 25 kg ha-1) for available phosphorus, low (< 108 kg ha-1),
medium (108 to 280 kg ha-1) and high (> 280 kg ha-1) for available potassium.
3.7.5. Interpretation of Soil Characteristics
Interpretation of Soil Characteristic has been dwelled in following sub-sections
3.7.5.1 Soil Texture
The soils of study area are Semi-Arid Transitional Plain and the most commonly observed
soil texture is Sandy and Sandy Clay Loam.
3.7.5.2 Soil Reaction
Soil pH is an important soil property, which affects the availability of several plant nutrients.
It is a measure of acidity and alkalinity and reflects the status of base saturation. The soil
pH ranges from 7.3 to 7.9, thereby indicating the soil is slightly to moderately alkaline in
nature.
3.7.5.3 Organic Matter
The effect of soil organic matter on soil properties is well recognized. Soil organic matter
plays a vital role in supplying plant nutrients, cation exchange capacity, improving soil
aggregation and hence water retention and soil biological activity. The organic matter
content of soil varied from 0.6 to 2.0 %,( 0.35 to 1.17% as organic carbon) thereby implying
that soils are low to medium in organic content.
3.7.5.4 Macronutrients
Nutrients like nitrogen (N), phosphorus (P) and potassium (K) are considered as primary
nutrients and sulphur (S) as secondary nutrient. These nutrients help in proper growth,
development and yield differentiation of plants and are generally required by plants in large
quantity.
Available Nitrogen
Nitrogen is an integral component of many compounds including chlorophyll and enzyme
essential for plant growth. It is an essential constituent for amino acids which is building
blocks for plant tissue, cell nuclei and protoplasm. It encourages the aboveground
vegetative growth and deep green color to leaves. Deficiency of Nitrogen decreasing rate

EIA/EMP report of Sand/Bajri Mine (With ML Area of 4280.0 ha) Tehsil Marwar Jn., District Pali, Rajasthan
EQMS INDIA PVT. LTD. 100
and extent of protein-synthesis and result into stunted growth and develop chlorosis.
Available nitrogen content in the surface soils ranges between 16 and 28 mg/kg (40 and
62 kg/ha) thereby indicating that soils are low in available nitrogen content.
Available Phosphorus
Phosphorus is important component of adenosine di-phosphate (ADP) and adenosine tri-
phosphate (ATP), which involves in energy transformation in plant. It is essential
component of deoxyribonucleic acid (DNA), the seat of genetic inheritance in plant and
animal. Phosphorous take part in important functions like photosynthesis, nitrogen fixation,
crop maturation, root development, strengthening straw in cereal crops etc. The availability
of phosphorous is restricted under acidic and alkaline soil reaction mainly due to P-fixation.
In acidic condition it gets fixed with aluminum and iron and in alkaline condition with
calcium. Available phosphorus content ranges between 18 and 32-mg/kg (45.0 and 75.0
kg/ha) thereby indicating that soils are high in available phosphorus.
Available Potassium
Potassium is an activator of various enzymes responsible for plant processes like energy
metabolism, starch synthesis, nitrate reduction and sugar degradation. It is extremely
mobile in plant and help to regulate opening and closing of stomata in the leaves and
uptake of water by root cells. It is important in grain formation and tuber development and
encourages crop resistance for certain fungal and bacterial diseases. Available potassium
content in these soils ranges between 12.0 and 22.0-mg/kg (30.0 and 50.0 kg/ha), thereby
indicating low soils in potassium content in the area.
3.8. Noise Environment
The environmental assessment of noise from the industrial activity, construction activity
and vehicular traffic can be undertaken by taking into consideration various factors like
potential damage to hearing, physiological responses, and annoyance and general
community responses.
The impact of noise sources on surrounding community depends on:
Characteristics of noise sources (instantaneous, intermittent or continuous in nature).
It can be observed that steady noise is not as annoying as one which is continuously
varying in loudness.

EIA/EMP report of Sand/Bajri Mine (With ML Area of 4280.0 ha) Tehsil Marwar Jn., District Pali, Rajasthan
EQMS INDIA PVT. LTD. 101
The time of day at which noise occurs, for example high noise levels at night in
residential areas are not acceptable because of sleep disturbance and
The location of the noise sources, with respect to noise sensitive landuse, which
determines the loudness and period of exposure.
The environmental impact of noise can have several effects varying from Noise Induced
Hearing Loss (NIHL) to annoyance depending on loudness of noise. The environmental
impact assessment of noise from the project operation, vehicular traffic can be undertaken
by taking into consideration various factors like potential damage to hearing, physiological
responses, and annoyance and general community responses.
3.8.1. Identification of Sampling Locations
A preliminary reconnaissance survey has been undertaken to identify the major noise
generating sources in the area. Noise at different generating sources has been identified
based on the activities in the village area and traffic.
The noise monitoring has been conducted for determination of ambient noise levels in the
study area. The noise level at each location were recorded for 24 hrs. The environment
setting of noise monitoring locations is given in Table 3.23 and shown in Figure 3.13.
Table 3.23 Details of Noise Monitoring Locations
Station
Code
Noise sampling
location
Distance from
the river
boundary
(mining area)
Direction
w.r.t. river
(mining
area)
Environmental Setting
N-1 Marwar Junction Lithri river- 5 SW Commercial
N-2 Dhanla Village Bandi river – 0.4 S Rural/Residential
N-3 Dhanla River bed Bandi river – 0.0 S River bed
N-4 Awa village Lilri nadi – 0.5 N Rural/Residential
N-5 Siriyari village Sukri river – 4.25 NE Rural/Residential
N-6 Bhagora village Bandi river – 0.35 N Rural/Residential
N-7 Musalia village
Kantaliya river –
0.30 N Rural/Commercial
3.8.2. Method of Monitoring
Sound Pressure Level (SPL) measurements were measured at all locations. The day noise
levels have been monitored during 6 am to 10 pm and night levels during 10 pm to 6 am at

EIA/EMP report of Sand/Bajri Mine (With ML Area of 4280.0 ha) Tehsil Marwar Jn., District Pali, Rajasthan
EQMS INDIA PVT. LTD. 102
all the locations within study area. The Leq day time and night time noise levels and Leq
day and night time noise levels at each of the sampling location are presented in Table
3.24.
Table 3.24 : Noise Levels [dB(A)] in the Study Area
Station Code Location Leq Day Leq Night Leq Day & Night
N-1 Marwar Junction 64.2 52.4 62.6
N-2 Dhanla Village 57.3 50.6 56.0
N-3 Dhanla River bed 53.7 43.9 52.2
N-4 Awa village 54.0 46.6 52.6
N-5 Siriyari village 57.1 47.8 55.6
N-6 Bhagora village 53.2 42.4 51.6
N-7 Musalia village 54.4 44.3 52.8
3.8.3. Interpretation of Results
The noise monitoring shows the day and night time noise level at mine site (Dhanla) the
noise recorded at mine site 53.7 dB (A) Leq during day time and 43.9 dB (A) Leq during
night time. The highest level of noise marked at Marwar Junction i.e. 64.2 dB (A) Leq during
daytime and 52.4 dB (A) Leq during nighttime, due to vehicle movement at nearest road
and exceed the prescribed limit. During daytime, the noise levels marginally exceed the
prescribed limit for all other sites. The major source of the noise in the study area is the
vehicular movement. The ambient air quality standards in respect of noise are 75, 65, 55
and 50 dB (A) Leq in daytime and 70, 55, 45 and 40 dB (A) Leq during nighttime for
industrial, commercial, residential and silence zone respectively. The daytime noise level
measured during 6:00 a.m. to 10:00 p.m. and nighttime measured from 10:00 p.m. to 6:00
am.
3.9. Biological Environment
3.9.1. Flora
3.9.1.1 Forest and Forest Types
The extent of natural forests in Rajasthan is not only one of the lowest in the country but
also the lowest in terms of productivity of forest. On the contrary the state is endowed with
the largest chunk of wasteland which is about 20% of the total wastelands of the country.
Total forests area of Rajasthan is 32639 km2 forest, which is 9.54 % of the total state’s
geographical area. Reserve Forests constitute 38.16%, Protected Forests 53.36% and Un-
classed Forests 8.48% of the forest area. The present mine lease project Marwar Junction

EIA/EMP report of Sand/Bajri Mine (With ML Area of 4280.0 ha) Tehsil Marwar Jn., District Pali, Rajasthan
EQMS INDIA PVT. LTD. 103
falls in district Pali, Rajasthan, which accounts for a geographical area of 12,387 km2 having
662 km2 forest cover which is 5.34% of the district’s geographical area. A 268 km2 scrub
land is also reported from Pali district which supports a variety of flora and fauna together
with forest land. According to Champion and Seth (1968), the state has 20 forest types
which belong to two forest type groups viz. Tropical Dry Deciduous and Tropical Thorn
Forests. Different forest types existing in Pali district are listed in Table 3.25.
Table 3.25 : Forest Types in the Pali Forest Division
Group Sub-type Dominant Species
1. Tropical Dry Deciduous Forest
a. Anogeissus Pendula Forest (5B/E1)
Anogeissus pendula, Boswellia Serreta, Buteo monosperma, Cassia fistula
b. Boswellia Forest (5B/E2) Boswellia Serreta, Anogeissus pendula, Acacia sp., Albezia lebbek
c. Saline Alkaline Scrub Savana (5B/E8)
Acacia nilotica, Prosopis cineraria, Ziziphus xylopyrus,
Prosopis juliflora
d. Butea Forest (5B/E5) Butea monosperma, Holoptelea integrifolia,
Salvadora persica
e. Dry Bamboo Breaks (5B/E9)
Dendrocalamus sp.
Tropical Dry Deciduous Scrub
a. Dry Decideous Scrub (E1/DS1)
Anogeissus pendula, Adhatoda Vasica, Calotropis gigantean, Datura metel
b. Dry Savannah Forests (E1/DS2)
Acacia nilotica, Prosopis cineraria, Ziziphus xylopyrus,Calotropis sp.
c. Euphorbia Scrub (DS3) Euphorbia sp., Ziziphus sp., Acacia sp.
d. Dry Grassland Forest (DS4)
Prosopis cineraria, Acacia sp.
2. Tropical Thorn Forest
a. Desert Thorn Forest (6B/C1)
Acacia sp., Acacia nilotica, Prosopis cineraria, Ziziphus sp., Apluda mutica
Tropical Thorn Scrub
a. Zizyphus Scrub (6B/DS1)
Ziziphua sp. Euphorbia hirta
b. Tropical Euphorbia Scrub (6B/DS2)
Euphorbia neriifolia, Rhus mysurensis
c. Acacia senegal Forest (6B/E2
Acacia senegal, Calotropis sp. Datura sp.
3.9.1.2 Floristic Objectives

EIA/EMP report of Sand/Bajri Mine (With ML Area of 4280.0 ha) Tehsil Marwar Jn., District Pali, Rajasthan
EQMS INDIA PVT. LTD. 104
Objectives of the present baseline floristic study are as follows:
To inventorize taxonomic diversity of plants in the study area
To assess the plant community structure in the study area
To Determine Importance Value Index and Shannon Wiener Diversity Index for tree,
shrub and herbs present in the study area.
Present study areas comprises of mine lease area along the rivers in Tehsil and area within
10 km radius of mining zones as per the ToR. Five sampling locations; two in mining areas
(core zone) and three in outer area within the 10 km of core zone (Buffer zone) were
selected for carrying out phyto-sociological surveys of the vegetation and in addition an
inventory of various floristic elements was also prepared by walking different transects
around these sampling sites. In order to understand the composition of the vegetation,
most of the plant species were identified in the field itself whereas the species that could
not be identified a herbarium specimen was collected along with their photographs for
identification later with the help of available published literature and floras of the region.
Methodology
To understand the community composition of vegetation of the study area, a stratified
random sampling method was used to obtain baseline data. The size and number of
quadrats needed were determined using the species-area curve method (Mishra, 1968).
The sampling consisted with randomly placed quadrats of 10 x 10 m2 for trees, 5 x 5 m2 for
shrubs and 1 x 1 m2 for herbs. Quadrats were spatially distributed so as to minimize the
autocorrelation among the vegetation and trap maximum composition. The data on
vegetation were quantitatively analyzed for density, frequency and abundance as per
Curtis & McIntosh (1950). The Importance Value Index (IVI) for trees was determined as
the sum of relative density, relative frequency and relative dominance (Curtis, 1959). Tree
individuals with > 31.5 cm CBH (circumference at breast height i.e., 1.37 m from the
ground) were individually measured for CBH. Data was collected during winter season
(January 2014).
The index of diversity was computed by using Shannon Wiener Diversity Index (Shannon
Wiener, 1963) as: H = - Σ (ni/n) x ln (ni/n) Where, ni is individual density of a species and
n is total density of all the species.

EIA/EMP report of Sand/Bajri Mine (With ML Area of 4280.0 ha) Tehsil Marwar Jn., District Pali, Rajasthan
EQMS INDIA PVT. LTD. 105
The Evenness Index (E) was calculated by using Shannon's Evenness formula (Magurran,
2004). Evenness Index (E) = H / ln (S) Where, H is Shannon Wiener Diversity index; S is
number of species.
Species richness (SR) was calculated by using Margalef index. Margalef Species
Richness (SR) = S-1/ln(N) Where, S is total number of species and N is total number of
individuals.
Sampling Location
The vegetation sampling was carried out at five different sampling sites the locations which
area are given in Table 3.26.
Table 3.26 : Sampling Location of Floristic Survey
Site Sampling Location Zone
S-1 Bandi River course near Bhagora Mining area (core zone)
S-2 Sukari River near Phulod Mining area (core zone)
S-3 Near Seeryari Dam Surrounding area (buffer zone)
S-4 Near Phulod Dam RF Surrounding area (buffer zone)
S-5 Mandawa-pipli RF Surrounding area (buffer zone)
3.9.1.3 Taxonomic Diversity
Although the Working Plan , 2012-13 to 2021-22, Pali Forest Division reported 104 trees,
74 shrubs/herbs, 28 climbers and 40 grasses species under its territorial jurisdiction
(http://rajforest.nic.in/writereaddata/Pali_final.pdf), but during this primary study, a total of
18 trees, 19 shrubs and 20 herbs species were found in the study area zone. All the above
plant species belong to 14 families each of tree and shrub and 10 families of herb.
Fabaceae, Apocynaceae and Poaceae were the dominated families in tree, shrub and herb
flora respectively. (Figure 3.15)

EIA/EMP report of Sand/Bajri Mine (With ML Area of 4280.0 ha) Tehsil Marwar Jn., District Pali, Rajasthan
EQMS INDIA PVT. LTD. 106
Figure 3.18 : Number of families and species in different life forms in the study area
3.9.1.4 Community Structure
The forests of the study area represent scattered patches of vegetation which comprise of
very low density of vegetation. In mining zones, few individuals of trees (Acacia nilotica
Acacia leucophloea, and Acacia Senegal) were recorded. Opuntia dilenii and Lantana
camera in the shrub flora were found distributed in the mining areas whereas Saccharum
munja, Argemone mexicana and Cannabis sativa were the dominant herbs species
recorded in the mining area.
3.9.1.5 Phyto-sociological Characters of Plant Species
Mining areas (Core zone)
Tree density was recorded as 13.33 trees ha-1 in sampling location I and 20.00 trees ha-1
in sampling location-II. Acacia nilotica was found in both the sampling locations in core

EIA/EMP report of Sand/Bajri Mine (With ML Area of 4280.0 ha) Tehsil Marwar Jn., District Pali, Rajasthan
EQMS INDIA PVT. LTD. 107
zone with highest IVI values (147.22 and 202.89). Shrub density was recorded as 380
shrubs ha-1 at Site-I and 260 shrubs ha-1 at Site-II while Herb’s density was recorded as
4400 and 5200 herbs ha-1 at Site-I and Site-II respectively (Table 3.27).
Table 3.27 : Phyto-sociological Characters of Different species recorded in proposed mining area
S. N.
Species Site-I Site-II
Tree Den (per ha)
F (%) Ab IVI Den (per ha)
F (%) Ab IVI
1 Acacia nilotica 6.67 6.67 1.00
147.22
13.33 13.33
1.00
202.89
2 Acacia leucophloea 6.67 6.67 1.00
152.78
3 Acacia senegal 6.67 6.67 1.00
97.11
Total 13.33 300.00
20.00 300.00
Shrub
1 Acacia jacquemontii 60.00 10.00
1.50
40.48
2 Calotropis gigantea 100.00 20.00
1.25
86.14
3 Cassia tora 80.00 15.00
1.33
51.54 80.00 10.00
2.00
81.93
4 Ipomoea sp 100.00 15.00
1.67
58.15
5 Jatropha curcas 40.00 10.00
1.00
63.69 60.00 10.00
1.50
63.56
6 Lantana camara 40.00 10.00
1.00
80.01
7 Opuntia dilenii 80.00 10.00
2.00
74.50
Total 380.00 300.00
260.00 300.00
Herb
1 Cannabis sativa 1600.00 12.00
1.33
123.67
2 Argemone mexicana 1200.00 8.00 1.50
75.60 1600.00 8.00 2.00
105.55
3 Euphorbia hirta 800.00 4.00 2.00
37.41 800.00 4.00 2.00
34.18
4 Saccharum munja 800.00 4.00 2.00
63.33
5 Cannabis sativa 1200.00 4.00 3.00
67.87
6 Dodonaea viscosa 1200.00 8.00 1.50
69.70
7 Vernonia cinerea 400.00 4.00 1.00
22.70

EIA/EMP report of Sand/Bajri Mine (With ML Area of 4280.0 ha) Tehsil Marwar Jn., District Pali, Rajasthan
EQMS INDIA PVT. LTD. 108
4400.00 300.00
5200.00 300.00
Surrounding areas (Buffer zone)
In the indirect influence area of project, tree density ranged from 87 to 107 trees ha-1, shrub
species density was recorded between 380 to 500 shrubs ha-1 whereas the herb density
values were found between 6000 to 13200 herbs ha-1. Acacia leucophloea was the only
tree species recorded in all the sampling sites. Acacia jacquemontii and Calotropis procera
were distributed in two sampling sites among shrub flora while Argemone maxicana was
found highly distributed among herb flora respectively. (Table 3.28)
Table 3.28 : Phyto-sociological Characters of Different species recorded around mining areas
S. N.
Species Site-I Site-II Site-III
Trees Den (per ha)
F (%) Ab IVI Den (per ha)
F (%) Ab IVI Den (per ha)
F (%)
Ab IVI
1 Acacia leucophloea 20 27 1 94 40 27 2 127 13 7 2 36
2 Acacia nilotica 27 7 4 88 20 13 2 79
3 Azadirachta indica 7 7 1 22
4 Bahunia variagata 7 7 1 19
5 Bombex Ceiba 7 7 1 20
6 Erythrina iIndica 13 13 1 35 7 7 1 18
7 Ficus bengalensis 7 7 1 16 7 7 1 22
8 Moringa oleifera 7 7 1 20 13 13 1 38 7 7 1 17
9 Phoenix sylvestris 7 7 1 18 7 7 1 18 13 7 2 23
10 Prosopis cineraria 7 7 1 18
11 Prosopis juliflora 7 7 1 17
12 Sapindus mukorossi 7 7 1 15
13 Syzygium cumini 7 7 1 18
14 Ziziphus xylopyrus 7 7 1 15
15 Acacia senegal 13 7 2 33
16 Butea monosperma 13 13 1 39
17 Emblica officinais 7 7 1 18
18 Ricinus communis 7 7 1 16
87 300 107 300 107 300
Shrub
1 Acacia jacquemontii
80 5 4 43 80 15 1 63 40 10 1 32

EIA/EMP report of Sand/Bajri Mine (With ML Area of 4280.0 ha) Tehsil Marwar Jn., District Pali, Rajasthan
EQMS INDIA PVT. LTD. 109
2 Adhatoda Vasica 60 10 2 40
3 Caesalpinia bonduc 60 5 3 29
4 Calotropis gigantea 80 15 1 60
5 Calotropis procera 60 10 2 42 40 10 1 41 40 10 1 29
6 Capparis decidua 40 5 2 26
7 Cassia auriculata 60 10 2 51
8 Cassia tora 40 5 2 32
9 Datura stramonium 40 5 2 32
10 Euphorbia nivulia 60 10 2 37
11 Ipomoea sp 40 10 1 33
12 Martynia annua 40 10 1 33
13 Xanthium strumarium
40 5 2 38 60 10 2 36
14 Carissa carandas 60 10 2 34
15 Crotalaria burhia 60 5 3 25
16 Jatropha curcas 60 10 2 32
17 Lantana camara 60 10 2 38
18 Nyctanthes arbor-tristis
80 10 2 48
19 Opuntia dilenii 40 5 2 26
Total 440 300 380 300 500 300
Herbs
1 Abrus precatorius 2000 8 3 52 1200 8 2 54
2 Achyranthes aspera 800 8 1 53
3 Aerva javanica 400 4 1 17
4 Apluda mutica 1600 8 2 91
5 Argemone mexicana
1600 4 4 27 800 4 2 37 1200 8 2 28
6 Barleria cristata 2000 8 3 57
7 Cannabis sativa 2800 8 4 63
8 Cenchrus ciliaris 800 8 1 22
9 Cynodon dactylon 1200 8 2 26
10 Dodonaea viscosa 1200 8 2 49
11 Echinops echinatus 1200 4 3 24
12 Euphorbia granulata
800 4 2 14
13 Saccharum munja 800 4 2 14
14 Acacia pennata 1600 8 2 40
15 Euphorbia hirta 2000 8 3 46
16 Heteropogon contortus
1200 8 2 28
17 Parthenium hysterophorus
2800 12 2 75
18 Solanum xanthocarpum
400 4 1 14
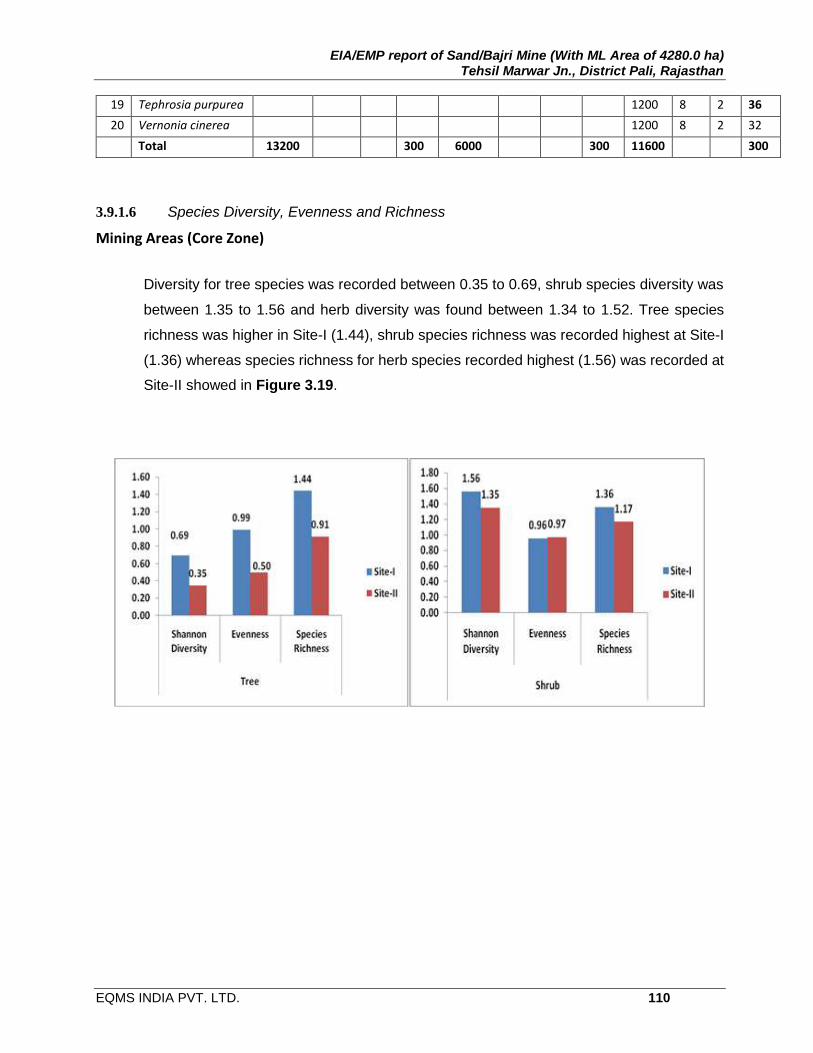
EIA/EMP report of Sand/Bajri Mine (With ML Area of 4280.0 ha) Tehsil Marwar Jn., District Pali, Rajasthan
EQMS INDIA PVT. LTD. 110
19 Tephrosia purpurea 1200 8 2 36
20 Vernonia cinerea 1200 8 2 32
Total 13200 300 6000 300 11600 300
3.9.1.6 Species Diversity, Evenness and Richness
Mining Areas (Core Zone)
Diversity for tree species was recorded between 0.35 to 0.69, shrub species diversity was
between 1.35 to 1.56 and herb diversity was found between 1.34 to 1.52. Tree species
richness was higher in Site-I (1.44), shrub species richness was recorded highest at Site-I
(1.36) whereas species richness for herb species recorded highest (1.56) was recorded at
Site-II showed in Figure 3.19.

EIA/EMP report of Sand/Bajri Mine (With ML Area of 4280.0 ha) Tehsil Marwar Jn., District Pali, Rajasthan
EQMS INDIA PVT. LTD. 111
Figure 3.19 : Shannon diversity, species Richness and Evenness index in proposed mining area
Surrounding areas (Buffer zone)
In the buffer zone of study area, Shannon diversity index values for tree species ranged
from 1.88 to 2.22. Shrub diversity was found highest (2.17) at Site-III whereas highest herb
diversity (2.10) was recorded at sampling Site I. Tree species richness was ranged
between 2.73 to 3.25, shrub species richness was found between 1.94 to 2.49 whereas
herb species richness was recorded between 1.85 to 2.29. (Figure 3.20)

EIA/EMP report of Sand/Bajri Mine (With ML Area of 4280.0 ha) Tehsil Marwar Jn., District Pali, Rajasthan
EQMS INDIA PVT. LTD. 112
Figure 3.20 : Shannon diversity, species Richness and Evenness index in surrounding area
3.9.1.7 Micro Flora
Beside higher plants, the study area also inventorised for micro floral species. Although
these plants area under-utilized but ecologically equal important. During present primary
study no micro floral species has been recorded in the main rivers as there was no flowing
discharge in them. But some Blue-green algae were sighted floating on stagnant water in
mining and influenced area, mainly on d/s of anicuts/reservoir.
3.9.1.8 Economically Important Flora
The dependency level of the nearby habitation on forest was found very low but for some
species like, Prosopis cineraria, Azadirachta indica, Dalbergia sissoo Emblica officinais,
Moringa oleifera, Sapindus mukorossi, Adhatoda Vasica, Cassia tora etc. These plants are
utilized in day to day life of local inhabitants. During the study knowledgeable and elderly
persons of study area villages were interviewed and information on plants parts (seed,
bark, leaf & root) used and indigenous knowledge was gathered. Secondary information
was also consulted to know the ethno-botanical importance of the region. People of the
study area are using these plant species for timber, fuel, fodder, food, and making
agricultural implements.
3.9.1.9 Rare and Endangered Flora
Harsh climatic conditions and low rainfall have led to decline of many valuable plant species
and degradation of their habitats in the study area. Recorded floral species from the present
study area was assessed for their conservation status by cross-checking with Red Data book

EIA/EMP report of Sand/Bajri Mine (With ML Area of 4280.0 ha) Tehsil Marwar Jn., District Pali, Rajasthan
EQMS INDIA PVT. LTD. 113
of Indian plants (by Nayar and Sastry, 1987-90) and none of the plant taxa found under RET
category.
3.9.2. Faunal Diversity
To study the wild mammals, avifauna, herpetofauna and insects of the project area 2-5 km
transect trails were carried out in the different locations. The study area was divided into
different strata based on vegetation and topography. Sampling for habitat and animals was
done in different strata. As the normal systematic transects for mammals and birds were
not possible in this study area due to difficult terrain, therefore mostly trails were used for
faunal sampling. In addition to the field sampling secondary data and information was also
collected as follows:
Direct sighting and indirect evidences such as calls, signs and trophies of
mammals were recorded along the survey routes taking aid from Prater
(1980).
Interviews of local villagers for the presence and relative abundance of
various animal species within each locality.
The Forest Working Plan of the Forest Division falling in the project area was
referred to for secondary informations on the wildlife of the area.
3.9.2.1 Mammals
Around 2-5 km long transects and trails of different habitation were walked to study the wild
mammalian fauna of the study area. Direct sighting of animals as well as indirect signs like scat,
pellets, pugmarks, scraps, vocalizations, horns etc. were also recorded during the survey walk.
Secondary data as well as information elicited from the locals were also noted for the presence or
absence of the wild animals in the area. Forest Working Plan of Pali Forest Division has reported
30 species of mammals in the total forest area under its jurisdiction and out of these 9 species
were directly and indirectly sighted during this survey of the area.(Table 3.29)
Table 3.29 : Mammalian Fauna Sighted during the primary survey
SN Name Scientific Name Order Family CS Schedule
1 Rhesus Monkey Macaca mulatta Primates Cercopithecidae LC II
2 Blue Bull Boselaphus tragocamelus Artiodactyla Bovidae LC III
3 Common House Rat Rattus rattus Rodentia Muridae LC V

EIA/EMP report of Sand/Bajri Mine (With ML Area of 4280.0 ha) Tehsil Marwar Jn., District Pali, Rajasthan
EQMS INDIA PVT. LTD. 114
4 Indian Fox Vulpes bengalensis Carnivora Canidae LC II
5 Indian Hare Lepus nigricollis Lagomorpha Leporidae LC IV
6 Indian Palm Squirrel Funambulus palmarum Rodentia Sciuridae LC IV
7 Jungle Cat Felis chaus Carnivora Felidae LC II
8 Wild Boar Sus scrofa Artiodactyla Suidae LC III
9 Indian Grey Mongoose Herpestes edwardsii Carnivora Herpestidae LC II
CS- Conservation Status (IUCN), LC-Least Concern, Schedule (As per WPA, 1972)
Threatened and Endangered Mammals
The animals such as Common langur, Rhesus macaque, Jungle cat, Jackal, Indian fox,
Wild boar, all rats and shrews are reported as least concern category of IUCN Red Data
Book (ver. 3.1). The Indian Wildlife Protection Act (1972) has also scheduled the animals
in various categories for given them varying degree of protection. Among these mammals,
three species reported as Schedule II, two as Schedule III, two as Schedule IV and one as
Schedule V category.
3.9.2.2 Avifauna
As During any primary study, time constraint and accessibility factors play an important
role. Under present survey, birds were also sampled on the same transect and trails
marked for mammals. Sampling was carried out on fixed width trails of 2 km to 3 km
wherever the terrain permiteds. A prismatic field binocular (10x50) was used for the bird
watching during transect walk as well as during the morning and evening hours nearby the
habitation of study area. Birds were identified with the help of field guide, Birds of Indian
Subcontinent by Grimmett, Inskipp and Inskipp.
By considering the migration large number of birds should have been present in the area
but due to limited surface water sources chances of sighting became rare. As per the Forest
Working Plan, 160 bird species have been reported in the territorial jurisdiction of the forest
division, of which Peafolw is the only Schedule –I Bird species while the rest belong to
Schedule-IV. The avifauna of study area is comprised of Bulbuls, Pigeon and Doves, Robin
and Flycatchers, Drongos, etc., and a large portion of avifaunal species is comprised of
resident birds in the project study area which belong to Schedule-IV of WPA, 1972. Some
of them are local residents, while some exhibit widespread migration pattern. Many bird
species of these classes perform altitudinal and local migrations. During the study, 26 bird
species has been recorded. Order Passeriformes and Charadriiformes were the largest

EIA/EMP report of Sand/Bajri Mine (With ML Area of 4280.0 ha) Tehsil Marwar Jn., District Pali, Rajasthan
EQMS INDIA PVT. LTD. 115
groups of the birds (Figure 3.21). The birds recorded from the study area are given in Table
3.30.
Table 3.30 : Avifauna Sighted during the primary survey
S. No.
Name Scientific Name Order Habit
1 House Sparrow Passer domesticus Passeriformes R
2 Bank Myna Acridotheres ginginianus Passeriformes R
3 Black Drongo Dicrurus macrocercus Passeriformes R
4 Black-winged Stilt Himantopus himantopus Charadriiformes WV
5 Common Myna Acridotheres tristis Passeriformes R
6 Common Peafowl Pavo cristatus Galliformes R
7 Common Pigeon Columba livia Columbiformes R
8 Eurasian Curlew Numenius arquata Charadriiformes WV
9 Goose Greylag Anser anser Anseriformes WV
10 Grey Heron Ardea cinerea Pelecaniformes R
11 House Crow Corvus splendens Passeriformes R
12 Indian Courser Cursorius coromandelicus Charadriiformes R
13 Indian Pond Heron Ardeola grayii Pelecaniformes R
14 Indian Robin Saxicoloides fulicatus Passeriformes R
15 Indian Roller Coracias benghalensis Coraciiformes R
16 Indian Silverbill Euodice malabarica Passeriformes R
17 Little Egretta Egretta garzetta Ciconiiformes R
18 Little Green Bee-eater Merops orientalis Coraciiformes R
19 Little Ringed Plover Charadrius dubiius Charadriiformes R
20 Pintail Duck Anas acuta Anseriformes WV
21 Red-vented Bulbul Pycnonotus cafer Passeriformes R
22 River Tern Sterna arantia Charadriiformes R
23 Spotted Dove Stigmatopelia chinensis Columbiformes R
24 Cuckoo Eudynamys scolopaceus Cuculiformes R
25 Indian Tree pie Dendrocitta vagabunda Passeriformes R
26 Weaver Bird Ploceus philippinus Passeriformes R
R-Resident, WV-Winter Visitor

EIA/EMP report of Sand/Bajri Mine (With ML Area of 4280.0 ha) Tehsil Marwar Jn., District Pali, Rajasthan
EQMS INDIA PVT. LTD. 116
Figure 3.21 : Percent bird species belonging to different orders
Migratory Pattern
Migration is the best studied of animal behaviors, yet few empirical studies have tested
hypotheses explaining the ultimate causes of these cyclical annual movements. Fretwell's
(1980) hypothesis predicts that if nest predation explains why many tropical birds migrate
uphill to breed, then predation risk must be negatively associated with elevation. The
proportion of nests depredated by different types of predators differed among elevations.
In present study, 22 bird species were local resident species while other 4 were recorded
as winter visitors.
3.9.2.3 Herpetofauna
The herpetofauna were also sampled on the same transect marked for mammals. The
sampling was also carried along river banks and the sampling was repeated during night
following the time constraint Visual Encounter Rates (VES) method was adopted. Four
species of lizard i.e. Common House Gecko (Hemidactylus brookii), Leopard gecko
(Eublepharis macularius), and Common garden lizard (Calotes versicolor) Indian
chameleon (Chamaeleo zeylanicus) were sighted from the study area during the survey.
However rat snake was reported by the villagers during consultation. As per Forest Working
Plan of Pali forest division 8 species of reptiles and 4 species of amphibian have been
reported. However during study period the following species of Herpetofauna were noticed.
(Table 3.31)

EIA/EMP report of Sand/Bajri Mine (With ML Area of 4280.0 ha) Tehsil Marwar Jn., District Pali, Rajasthan
EQMS INDIA PVT. LTD. 117
Table 3.31 : Herpetofauna recorded from the project area
S. No. Name Scientific Name Order Family
Reptiles
1 Common House Gecko Hemidactylus frenatus Squamata Gekkonidae
2 Leopard gecko Eublepharis macularius Squamata Gekkonidae
3 Common garden lizard Calotes versicolor Squamata Agamidae
4 Indian chameleon Chamaeleo zeylanicus Squamata Chamaeleonidae
5 Oriental rat snake Ptyas mucosus Squamata Colubridae
Amphibians
1. Comman Indian Toad Bufo melanostictus Anura Bufonidae
2. Marbled Toad Bufo stomaticus Anura Bufonidae
3. Indian Bull Frog Rana tigerina Anura Dicrdglossidae
3.9.2.4 Fish and Fisheries
Fishes are the integral component of stream and rivers which are not only the best sources
of food and animal protein for the human population but provides a source of income for
the local inhabitants. The people use captured fishes for their consumption and in some
cases to sell in local markets as an alternative means for procurement of foods and other
requirement of daily needs. . Although primary fisheries survey was not conducted as the
study was conducted in post monsoon when the river run dry as there was no discharge in
the river(s) which only flow during monsoon. Some secondary informations has been
gathered about fisheries are available in the existing ponds / reservoirs. Forest Working
Plan reported six species listed below. (Table 3.32).
Table 3.32 : Fish species reported from the project area
S. No. Name Scientific Name Order Family CS
1 Catla Catla catla Cypriniformes Cyprinidae LC
2 Rohu Labeo rohita Cypriniformes Cyprinidae LC
3 Bata L. Bata Cypriniformes Cyprinidae NE
4 Lanchi Wallago attu Siluriformes Siluridae NT
5 Singhi Heteropneustes
fossilis
Siluriformes Heteropneustidae LC
6 Singhara M. Seenghala Siluriformes Bagridae NE

EIA/EMP report of Sand/Bajri Mine (With ML Area of 4280.0 ha) Tehsil Marwar Jn., District Pali, Rajasthan
EQMS INDIA PVT. LTD. 118
3.9.3. Protected Areas
The lease area is a linear area along different ephemeral river(s) like Bandi an its tributaries
like Lilki, Mithri, Kantaliyi, Khardi, Sukri upper, Khari and Siriari Nala which cover a
longitudinal profile of 62 km, 36 km, 12 km, 22.5 km, 23 km, 33 km, 13.5 km and 30 km
respectively in the Tehsil.
Bandi river and its tributaries originate from the Aravali ranges and flow from East to West
in Tehsil Marwar. The upper most extremity of the lease area along these rivers begins
after these have debouched from the Aravali range to the plain land of the Tehsil and is
close to the Todgarh Raoli Wildlife Sanctuary, located in the Aravali range constituting the
eastern boundaries of tehsil Raipur, Sojat, Kharchi (Marwar Jn.) and Desuri and shares
boundary with district Ajmer, Rajsamand (Erstwhile Udaipur). The nearest revenue village
Dhal, Siriyari and Halawat which lie in the lease area along Sukri river, Siriyari Nala and
Bandi river are respectively 1 km, 2 km and 0.8 km away from the western boundary of
Todgarh Raowli Wildlife Sanctuary. It is thus evident that some stretches of the mine lease
area along the rivers fall within 10 km from the periphery of the western boundary of
Todgarh Raoli Wildlife Sanctuary.
Todgarh Raoli WLS has been established vide Rajasthan Government Gazette Notification
No. 11/56/Raj/Group-8/82 dated 28-9-1983. The sanctuary has a total aerial extent of
495.27 ha and spatially covers the reserve forest of Aravali range stretch sharing boundary
with district Ajmer, Pali and Rajsamand (Erstwhile Udaipur). The distict – wise
apportionment of the area under WLS is given in Table 3.33:
Table 3.33 : Distict – wise apportionment of the area under WLS
S. No.
District Tehsil Area (sq.km.)
SoI Toposheet No.
1 Ajmer Beawar 91.52 45K/1, 45G/13 and 45 G/14
2 Pali Raipur 230.25
45G/13, 45G/14, 45G/15 and
45K/1 Sojat
Kharchi (Marwar Jn.)
3 Rajsamand Devgarh 173.50 45G/13, 45G/14 and 45G/15 Bhim
Total 495.27
The Southern boundary of the Todgarh Raoli Wildlife Sanctuary is contiguous with the
Northern boundary of Kumbhalgarh Wildlife Sanctuary which was established vide
Rajasthan Government Gazette Notification No. F/C(2)/Raj/F/7 dated 13-7-1971. The

EIA/EMP report of Sand/Bajri Mine (With ML Area of 4280.0 ha) Tehsil Marwar Jn., District Pali, Rajasthan
EQMS INDIA PVT. LTD. 119
sanctuary has a total aerial extent of 610.53 ha and spatially covers the reserve forest of
Aravali range stretch sharing boundary with district Pali (341.74 sq.km), Rajsamand
(141.72 sq.km) and Udaipur (127.07 sq.km). The nearest mine lease location with respect
to Kumbhalgarh WLS in Tehsil Marwar Jn. is Halawat which is about 7.5 km away from the
northern boundary of the sanctuary.
As of now no ESZ has been notified in respect of these sanctuaries. Besides Todgarh Raoli
and Kumbhalgarh WL Sanctuary there are no Biosphere Reserves, Wildlife Corridors,
Tiger/Elephant Reserves/(existing as well as proposed), within 10 km of the mine lease.
Location of the two sanctuaries vis-à-vis the revenue villages covered within 10 km
distance from the boundary of WLSs is marked in the Mosiac Map covering SoI Toposheet
No. 45G/9, 45 G/10, 45 G/11, 45 G/13, 45 G/14 and 45 G/15. (Figure 3.22). As per the
approved mining plan for sand bajri mining no mining activity is envisaged either within
both sanctuaries or in Forest land.

EIA/EMP report of Sand/Bajri Mine (With ML Area of 4280.0 ha) Tehsil Marwar Jn., District Pali, Rajasthan
EQMS INDIA PVT. LTD. 120
Figure 3.22 : Location of the Todgarh Raoli and Kumbhalgarh Wildlife Sanctuary vis-à-vis mine lease area

EIA/EMP report of Sand/Bajri Mine (With ML Area of 4280.0 ha) Tehsil Marwar Jn., District Pali, Rajasthan
EQMS INDIA PVT. LTD. 121
3.10. Socio-Economic Environment
3.10.1. District Profile
Pali district, situated in north eastern part of Rajasthan under Jodhpur division, has
geographical area of 12330 km2. It ranks 9th in comparison to the other districts of the
Rajasthan in terms of the area. The district is divided in ten subdivisions namely Pali, Rohat,
Bali, Sojat, Marwar Junction, Jaitaran, Rani, Raipur, Sumerpur and Desuri. There are 10
tehsils, 10 Panchayat samities & 357 patwar circles 1052 revenue villages and 320 gram
Panchayats for better decentralization of the power. In the district there are 06 assembly
seats and 01 parliament seat. The demographic, administrative and other statistical data
of the district is given in Table 3.34.
Table 3.34 : Pali District at a Glance
S.No Particular Year Unit Statistics
1. Geographical features
(A) Geographical Data
i) Latitude
24.750 to 26.4830(N)
ii) Longitude
72.7830 to 74.300(E)
iii) Geographical Area Sq. KM. 12387
(B) Administrative Units 2011 Nos.
i) Sub divisions 10
ii) Tehsils 10
iii) Sub-Tehsil 8
iv) Patwar Circle 357
v) Panchayat Simitis 10
vi) Nagar nigam 1
vii) Nagar Palika 7
viii) Gram Panchayats 320
xi) Revenue villages 1052
x) Assembly Area 6 MLAs & 1MP
2. Population
(A) Sex-wise 2011 Nos.
i) Male 1025895
ii) Female 1012638
(B) Rural Population 1578682
3. Agriculture
Land utilization 2010-11 ha ha
i) Total Area 1233079
ii) Forest cover 86536
iii) Non Agriculture Land 58485

EIA/EMP report of Sand/Bajri Mine (With ML Area of 4280.0 ha) Tehsil Marwar Jn., District Pali, Rajasthan
EQMS INDIA PVT. LTD. 122
iv) cultivable Barren land 43760
4. Forest
Forest 2010-11 ha 86536
5. Livestock & Poultry
A. Cattle 2007 Nos.
i) Cows 354698
ii) Buffaloes 315125
B. Other livestock
i) Goats 700183
ii) Pigs 6505
iii) Dogs & Bitches 41372
6. Transport
A. Railways
Length of rail line 2010-11 Km 1232
B. Roads
(a) National Highway 2010-11 Km 258.70
(b) State Highway 2010-11 Km 608.00
(c) Main District Highway 2010-11 Km 300.00
(d) Other district & Rural Roads
2010-11 Km 3102.02
(e) Rural road/ Agriculture Marketing Board Roads
2010-11 Km 408.55
(f) Kacha Road 2010-11 Km --
7. Communication
(a) Telephone connection 2010-11 Nos. 89495
(b) Post offices 2010-11 Nos. 374
(c) Telephone center 2010-11 Nos. 146
(d )Density of Telephone 2010-11 Nos./1000 person 43.90
(e) Density of Telephone 2010-11 No. per KM. 7.22
(f) PCO Rural 2010-11 No. 1167
(g) PCO STD 2010-11 No. 1374
(h) Mobile 2010-11 No. --
8. Public Health

EIA/EMP report of Sand/Bajri Mine (With ML Area of 4280.0 ha) Tehsil Marwar Jn., District Pali, Rajasthan
EQMS INDIA PVT. LTD. 123
3.10.2. Socio-economic assessment in the Study area
The development projects are invariably planned based on the availability of exploitable
natural resources. These projects attract flow of finances, investments, jobs and other
livelihood opportunities, which brings in people from different cultural and social
background. Such planned activities not only provide impetus to the local economy but also
bring about a multi-dimensional economic, social and cultural change. Most often it has
been observed that such development projects are commissioned in economically and
socially backward areas, which are inhabited by some of the indigenous populations.
Review of secondary data, such as District Census Statistical Handbooks-2011 and the
records of National Informatics Center data, for the parameters of demography,
occupational structure of people within the study area which mainly comprises of the
villages, where the mine lease area is located along the river(s) of Tehsil as per revenue
(a) Allopathic Hospital
(b) Beds in Allopathic hospitals
(c) Ayurvedic Hospital
(d) Beds in Ayurvedic hospitals
(e) Unani hospitals
(f) Community health centers
(g) Primary health centers
(h) Dispensaries
(i) Sub Health Centers
(j) Private hospitals
2010-11 No. No. No. No.
No. No. No. No. No. No.
5 600
6 127
7
13 71 6 8 3
9. Banking Commercial 2010-11
(a) Commercial Bank Nos. 63
(b) Rural Bank Nos. 77
(c) Co-Operative bank Nos. 41
(d) PLDB Branches Nos. 04
10. Education 2010-11
(a) Primary school Nos. 1164
(b) Middle schools Nos. 1408
(c) Secondary & senior secondary schools
Nos. 507
(d) Colleges Nos. 17
(e) Technical University Nos. --
(f) Professional Educational Institute
Nos. 11
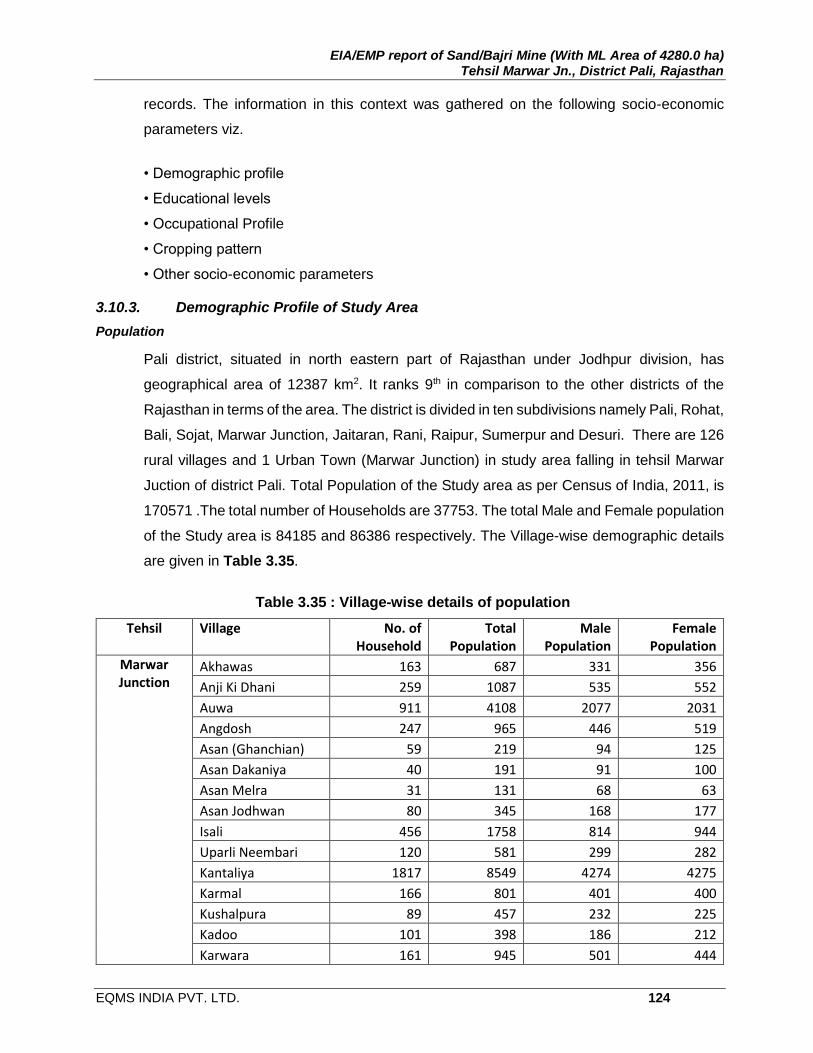
EIA/EMP report of Sand/Bajri Mine (With ML Area of 4280.0 ha) Tehsil Marwar Jn., District Pali, Rajasthan
EQMS INDIA PVT. LTD. 124
records. The information in this context was gathered on the following socio-economic
parameters viz.
• Demographic profile
• Educational levels
• Occupational Profile
• Cropping pattern
• Other socio-economic parameters
3.10.3. Demographic Profile of Study Area
Population
Pali district, situated in north eastern part of Rajasthan under Jodhpur division, has
geographical area of 12387 km2. It ranks 9th in comparison to the other districts of the
Rajasthan in terms of the area. The district is divided in ten subdivisions namely Pali, Rohat,
Bali, Sojat, Marwar Junction, Jaitaran, Rani, Raipur, Sumerpur and Desuri. There are 126
rural villages and 1 Urban Town (Marwar Junction) in study area falling in tehsil Marwar
Juction of district Pali. Total Population of the Study area as per Census of India, 2011, is
170571 .The total number of Households are 37753. The total Male and Female population
of the Study area is 84185 and 86386 respectively. The Village-wise demographic details
are given in Table 3.35.
Table 3.35 : Village-wise details of population
Tehsil Village No. of Household
Total Population
Male Population
Female Population
Marwar Junction
Akhawas 163 687 331 356
Anji Ki Dhani 259 1087 535 552
Auwa 911 4108 2077 2031
Angdosh 247 965 446 519
Asan (Ghanchian) 59 219 94 125
Asan Dakaniya 40 191 91 100
Asan Melra 31 131 68 63
Asan Jodhwan 80 345 168 177
Isali 456 1758 814 944
Uparli Neembari 120 581 299 282
Kantaliya 1817 8549 4274 4275
Karmal 166 801 401 400
Kushalpura 89 457 232 225
Kadoo 101 398 186 212
Karwara 161 945 501 444

EIA/EMP report of Sand/Bajri Mine (With ML Area of 4280.0 ha) Tehsil Marwar Jn., District Pali, Rajasthan
EQMS INDIA PVT. LTD. 125
Karoliya 94 388 188 200
Khera Kalyanpura 31 150 78 72
Khakhron Ka Aauda 65 313 170 143
Kharchi 443 2217 1138 1079
Kharcho Ki Dhani 80 352 176 176
Gura Keshar Singh 423 1777 866 911
Gudabarjaliya 63 323 161 162
Gurha Ajba 113 473 218 255
Guraganga-I 106 482 240 242
Guraganga-II 91 313 161 152
Gudangiri 188 781 358 423
Gura Durjan 92 393 189 204
Gura Dhamawata 84 455 238 217
Guranawa 62 259 133 126
Gura Premsingh 146 597 285 312
Gura Bhopat 80 413 215 198
Gura Bhopa 152 671 335 336
Gura Mehkaran 84 371 175 196
Gawar 230 1001 501 500
Gura Ramsingh 261 1169 572 597
Gura Soorsingh 274 1119 520 599
Gura Himta 17 94 42 52
Gadana 406 1570 733 837
Godawas 110 432 201 231
Gopawas 65 264 113 151
Golki 140 756 381 375
Chelawas 385 1592 753 839
Chatra Ka Gura 189 921 468 453
Chawadiya 177 732 361 371
Chirpatiya 582 2529 1257 1272
Chaukariya 274 1255 630 625
Jatiyon Ki Dhani 118 541 272 269
Jooni Phulad 214 919 473 446
Jadan Khalsa 644 2989 1548 1441
Janunda 292 1121 508 613
Jograwas 207 1024 498 526
Jojawar 1557 7427 3697 3730
Jorkiya 170 813 430 383
Jhambuda 61 283 149 134
Jeejardi 128 629 286 343
Thakurwas 327 1421 701 720
Dingor 163 848 424 424
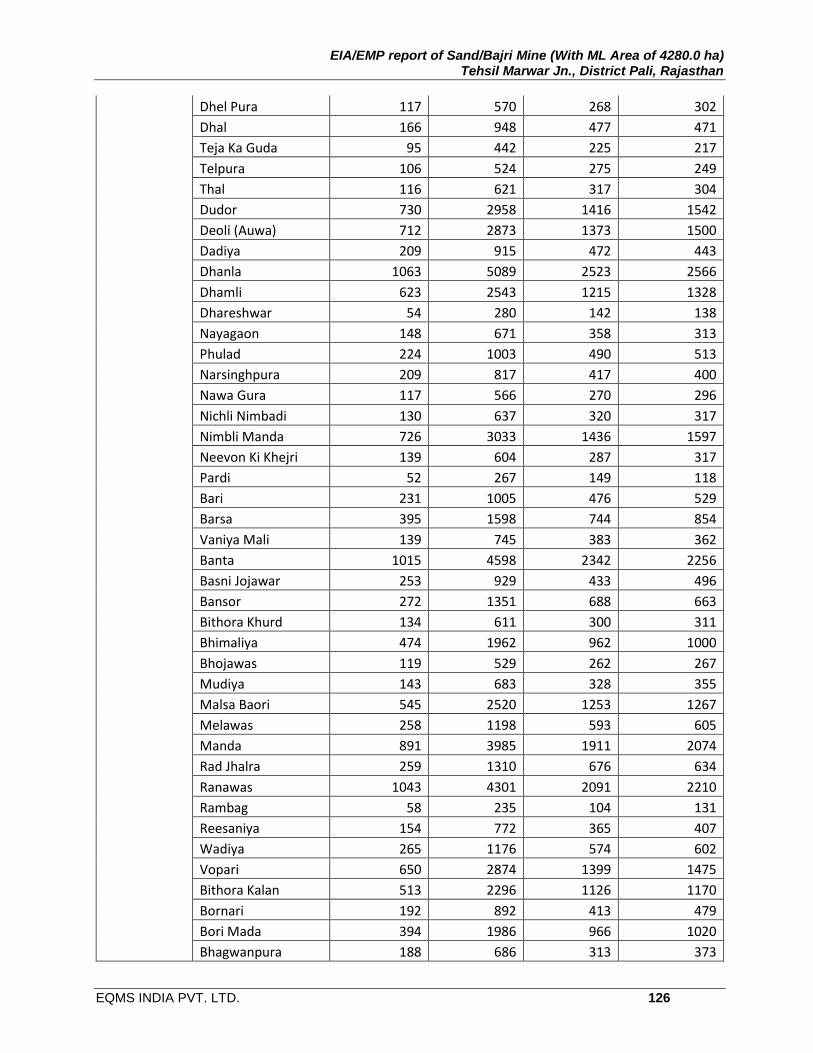
EIA/EMP report of Sand/Bajri Mine (With ML Area of 4280.0 ha) Tehsil Marwar Jn., District Pali, Rajasthan
EQMS INDIA PVT. LTD. 126
Dhel Pura 117 570 268 302
Dhal 166 948 477 471
Teja Ka Guda 95 442 225 217
Telpura 106 524 275 249
Thal 116 621 317 304
Dudor 730 2958 1416 1542
Deoli (Auwa) 712 2873 1373 1500
Dadiya 209 915 472 443
Dhanla 1063 5089 2523 2566
Dhamli 623 2543 1215 1328
Dhareshwar 54 280 142 138
Nayagaon 148 671 358 313
Phulad 224 1003 490 513
Narsinghpura 209 817 417 400
Nawa Gura 117 566 270 296
Nichli Nimbadi 130 637 320 317
Nimbli Manda 726 3033 1436 1597
Neevon Ki Khejri 139 604 287 317
Pardi 52 267 149 118
Bari 231 1005 476 529
Barsa 395 1598 744 854
Vaniya Mali 139 745 383 362
Banta 1015 4598 2342 2256
Basni Jojawar 253 929 433 496
Bansor 272 1351 688 663
Bithora Khurd 134 611 300 311
Bhimaliya 474 1962 962 1000
Bhojawas 119 529 262 267
Mudiya 143 683 328 355
Malsa Baori 545 2520 1253 1267
Melawas 258 1198 593 605
Manda 891 3985 1911 2074
Rad Jhalra 259 1310 676 634
Ranawas 1043 4301 2091 2210
Rambag 58 235 104 131
Reesaniya 154 772 365 407
Wadiya 265 1176 574 602
Vopari 650 2874 1399 1475
Bithora Kalan 513 2296 1126 1170
Bornari 192 892 413 479
Bori Mada 394 1986 966 1020
Bhagwanpura 188 686 313 373

EIA/EMP report of Sand/Bajri Mine (With ML Area of 4280.0 ha) Tehsil Marwar Jn., District Pali, Rajasthan
EQMS INDIA PVT. LTD. 127
Bhagora 249 1214 638 576
Mukanpura 84 347 174 173
Melap 171 805 392 413
Mewara Ki Dhani 90 371 178 193
Musaliya 602 2504 1168 1336
Radawas 395 1746 837 909
Rewariya 83 397 197 200
Rajkiyawas Kalan 165 660 330 330
Rajkiyawas Khurd 63 315 154 161
Rana Nadi 132 619 318 301
Rampura 92 397 181 216
Sarakmaliya 91 422 216 206
Surya Nagar 139 625 321 304
Sawrad 932 4400 2093 2307
Saran 806 3918 1985 1933
Sinchana 240 1018 460 558
Seenchiyawas 87 450 237 213
Sinla 610 3365 1746 1619
Seeriyari 898 3987 1921 2066
Seemal 84 407 213 194
Sodon Ka Dhana 9 58 32 26
Hemliyawas Kalan (Rural) 123 541 243 298
Hemliyawas Khurd (Rural) 92 493 238 255
Halawat 59 287 158 129
Hingola Kalan 155 619 287 332
Hingola Khurd 166 659 307 352
Bogla 208 941 498 443
Marwar Junction (CT) 2519 12004 6172 5832
Total 37753 170571 84185 86386
Sex Ratio
The Sex Ratio of the Study area is 1026 Female / 1000 Male which is more than 987, the
consolidated figure for the district.
SC / ST Population
As far as the social fabric is concerned, the cast-wise distribution in the study area is
constituted by SC/ST and General Category of which the scheduled caste population

EIA/EMP report of Sand/Bajri Mine (With ML Area of 4280.0 ha) Tehsil Marwar Jn., District Pali, Rajasthan
EQMS INDIA PVT. LTD. 128
constitutes 21 % and the scheduled tribe 4% of the total population of the study area. A
graphical presentation of SC/ST Population in study area with sex wise break-up is given
in Figure 3.23 and Figure 3.24 respectively.
Figure 3.23 : Sex wise SC, ST and General Population in Study Area
Figure 3.24 : Percentage wise break up of SC, ST and General Population in Study Area
Literacy Rate
Literacy level is quantifiable indicator to assess the development status of any area or
region. The Literacy Rate of the study area is 51.1% of which male and female literate are
64.1% and 39.3% respectively male female population. The illiterates are 49.9% of the total
0
10000
20000
30000
40000
50000
60000
70000
127926 36469 6176
General SC ST
Male Female
SC Polpulation21%
ST Polpulation4%
General Population75%
SC/SC/General Population

EIA/EMP report of Sand/Bajri Mine (With ML Area of 4280.0 ha) Tehsil Marwar Jn., District Pali, Rajasthan
EQMS INDIA PVT. LTD. 129
population of which female illiterates are 60.7%. The graphical presentation of both sexes
of literates and illiterates in study area is given in Figure 3.25.
Figure 3.25 : Gender-wise Distribution of Literate and Illiterate in Study Area
3.10.4. Economic Profile
The majority of people in rural sector are cultivators & agricultural labours which indicates
dominant agricultural economy. A small section of people are engaged as workers in
household industries. But in urban sector the existing scenario is completely reversed as
most of the people there are engaged in non-agricultural activity especially in industrial
sector, local hotels/restaurants and as drivers some people also operates their
vans/jeeps/cars as tourist vehicle.
3.10.5. Occupation Pattern
Occupational pattern of the concerned study area are recorded to assess skills of people.
Occupational pattern also helps in identifying dominating economic activity in the area. In
the study area the main and marginal workers are 30% and 13% respectively of the total
population while the remaining 57% constitutes non-workers. (Figure 3.26)
0
10000
20000
30000
40000
50000
60000
70000
80000
90000
Total Population Literates Population Illiterates Population
Male Female

EIA/EMP report of Sand/Bajri Mine (With ML Area of 4280.0 ha) Tehsil Marwar Jn., District Pali, Rajasthan
EQMS INDIA PVT. LTD. 130
Figure 3.26 : Workers Scenario of the Area
Main Workers:
The main workers composition is made up of Casual Labours (42%), Agricultural Workers
(23%), Household workers (4%) and other workers 31% respectively (Figure 3.27).
Figure 3.27 : Distribution of Main Workers
Marginal Workers:
The marginal workers which constitute 13% of the total population, comprise of Casual
Labour (18%), Agricultural Labour (58%), Households (3%) and other workers (21%) of the
total Marginal Worker respectively. (Figure 3.28)
Main Workers30%
Marginal Workers
13%
Non Workers57%
Workers Scenario
Casual Workers42%
Agricultural Workers
23%
Household Workers
4%
Other Workers31%
Main Workers

EIA/EMP report of Sand/Bajri Mine (With ML Area of 4280.0 ha) Tehsil Marwar Jn., District Pali, Rajasthan
EQMS INDIA PVT. LTD. 131
Figure 3.28 : Distribution of Marginal Workers
3.10.6. Infrastructure
Education facilities
Education acts as the building block for a society. It determines the social behavior of the
person or the society as a whole. Proper education leads to the upliftment of society by
creating awareness towards the changes and their impacts on their lives. It also determines
the living standard and the thought of a society. Educational standard and the occupation
/ occupational efficiency are positively correlated. This also corresponds to the economic
status of the person or the community as a whole.
The education levels among the villages varied from being illiterate to being postgraduates.
As all villages have at least a primary school, the literacy levels are high among the younger
generation. Most of the elderly people were either illiterate or had not studied beyond Class
X. Most of the younger people had however, studied till Class X at least. There were a few
graduates.
Infrastructure is an important indicator of level of development and the potential for future
growth in particular area. The quality of school largely depends upon the type of
infrastructure available. The education network in the district as on 2012-13 is shown in
Table 3.36.
Casual Workers18%
Agricultural Workers
58%
Household Workers
3%
Other Workers21%
Marginal Workers

EIA/EMP report of Sand/Bajri Mine (With ML Area of 4280.0 ha) Tehsil Marwar Jn., District Pali, Rajasthan
EQMS INDIA PVT. LTD. 132
Table 3.36 : Educational Network in the District
S. No. PARTICULARS GOVT. PRIVATE TOTAL
1. Primary Schools 994 149 1143
2. Middle Schools 868 582 1450
3. Secondary Schools 298 136 434
4. Sr. Sec. Schools 153 63 216
5. CBSC - 10 10
6. Colleges (prof. edu. Inst., Polytech. Coll. & degree colleges.)
7 40 47
There are 113 Primary School, 52 Middle School, 15 Secondary School, 6 Senior
Secondary Schools and 1 college in 112 villages in study area. Higher education facilities
are available in district headquarters Pali.
Health facilities
The network of medical facilities in the district as on March 2013 is given in Table 3.37.
Table 3.37 Network of Medical And Public health Centres In The District
S. No. Particulars Nos.
1 District Hospital (Pali) 1
2 Sub District Hospital (Sojat) 1
3 Community Health Centers 17
4 Aid Post -
5 Upgraded Sub Centers -
6 Sub Centers 488
7 Primary Health Centers 73
8 Urban Family Planning Centers -
Besides district hospital at pali, there are 1 ayurvedic Hospital, 1 allopathic, 9 ayurvedic
and 1 homeopathic dispensary, 15 Primary Health Centre and 30 Primary Health Sub-
centres in the study Area. However, several private medical practitioner and community
health workers are also available.
Drinking Water facilities
Villagers mostly depend on groundwater resource for drinking/domestic water by various
means such as hand pumps (96 villages), well water (87 villages) and tank Water (22
villages). Tap water facilities by the state department has been provided in 44 villages.

EIA/EMP report of Sand/Bajri Mine (With ML Area of 4280.0 ha) Tehsil Marwar Jn., District Pali, Rajasthan
EQMS INDIA PVT. LTD. 133
Communication Facilities
As on 31st March 2013, the network of communication facilities in the district comprises of
2 Head Post Office, 54 Sub- Post Office and 318 branch offices. There are 105 telephone
exchanges besides 39527 basic telephone connections and 988 PCOs in the district. In
the study area there are 39-post offices. As regards basic telecommunication 1515
Telephone connections exist.
Banking Facilities
Commercial banking facilities are available in the district. As on 31st March 2013 there were
206 branches of different banks. The State Bank of Bikaner and Jaipur is the Lead Bank of
the district. 18 Banks and 31 Credit Societies operate in the study area.
Electricity
The district does not have any power generating station. It gets power from Bhilwara, Bilara
and Beawar through 132 KV transmission lines. There two of 220 KV GSS and 9 Nos.
Numbers of Grid Sub-Station of 132 KV and 123 Nos. of 33 KV sub-station and 20896 Nos.
of 11 KV sub- station in the district. The total length of transmission lines of 33 KV single
and double circuit is about 1444 km while 11 KV single circuit line is 9456 km. All villages
in the study area are electrified.. Comprehensive List of Infrastructures present in the Study
Area as per Census records 2001 is given in Table 3.38.

EIA/EMP report of Sand/Bajri Mine (With ML Area of 4280.0 ha) Tehsil Marwar Jn., District Pali, Rajasthan
EQMS INDIA PVT. LTD. 134
Table 3.38 : Comprehensive List of Infrastructures present in the Study Area
Village: Primary
School
Middle
School
Secondary
School
Senior Secon
dary School
College
Hospital
Dispensary
PHC
PHSC
Drinking
water
facilities
Post
Office
Telephone
Connection
Communication
facilities
Bus servi
ces
Bank
Credit
Society
Approach
Paved Road
Power
supply
facilities
Abkai Ki Dhani 1 0 0 0 0 0 0 0 0 A 0 1 N N I 0 0 A A
Ajeetpura 1 0 0 0 0 0 0 0 0 A 0 1 N N I 0 0 NA A
Atpara 2 1 1 1 0 0 0 1 1 A 1 45 Y Y 2 1 A A
Bagri 6 3 1 1 0 1 AL 1 AY 1 1 A 1 450 Y Y 2 1 A A
Bagawas 1 1 0 0 0 0 0 0 1 A 1 1 Y Y 0 0 A A
Bariyala 1 0 0 0 0 0 0 0 0 A 0 1 Y Y 0 1 A A
Basna 1 1 0 0 0 0 0 1 1 A 1 18 Y Y 0 1 A A
Basni Surayta 1 0 0 0 0 0 0 0 0 A 0 0 Y Y 0 0 NA A
Bhaniya 2 0 0 0 0 0 0 0 0 A 0 1 N N I 0 0 NA A
Bhaisana 1 1 0 0 0 0 0 0 0 A 0 22 Y Y 0 1 A A
Bijliyawas 1 0 0 0 0 0 0 0 0 A 0 0 Y Y 0 0 NA A
Bilawas 2 1 1 0 0 0 1 AY 1 1 A 1 69 Y Y 1 0 A A
Butelao 1 1 0 0 0 0 0 0 0 A 0 1 Y Y 0 0 A A
Chundlai 1 1 0 0 0 0 0 0 0 A 0 1 Y Y 0 0 NA A
Chandasani 1 1 0 0 0 0 0 0 0 A 0 1 Y Y 0 0 NA A
Charwas 1 1 1 0 0 0 0 2 1 A 1 7 Y Y 2 2 A A
Chandawal 3 2 1 1 0 0 0 2 1 A 1 413 Y Y 2 2 A A
Chamdiyak 1 0 0 0 0 0 0 0 0 A 0 1 Y Y 0 0 A A
Chopra 1 1 0 0 0 0 0 1 0 A 1 1 Y Y 1 1 A A
Dadi 1 0 0 0 0 0 0 0 0 A 0 1 Y Y 0 0 NA A
Deoli Hulla 1 1 0 0 0 0 0 1 0 A 1 13 Y Y 0 1 A A
Deo Nagar 1 0 0 0 0 0 0 0 0 A 0 0 N N I 0 0 NA A
Dhangarwas 1 1 0 0 0 0 0 0 1 A 0 2 N N I 0 0 A A

EIA/EMP report of Sand/Bajri Mine (With ML Area of 4280.0 ha) Tehsil Marwar Jn., District Pali, Rajasthan
EQMS INDIA PVT. LTD. 135
Dhakri 2 1 1 0 0 1 AY
1 AL, 1 AY 2 1 A 1 20 Y Y 0 2 A A
Dhandheri 1 0 0 0 0 0 0 0 0 A 0 12 N N I 0 0 NA A
Dheenawas 2 1 0 0 0 0 0 0 1 A 1 25 Y Y 0 1 A A
Dhurasani 1 1 0 0 0 0 0 1 0 A 0 8 Y Y 0 0 A A
Dornari 1 0 0 0 0 0 0 0 1 A 0 26 Y Y 0 0 A A
Dhoondha Lambodi 1 0 0 0 0 0 0 0 0 A 0 1 Y Y 0 0 NA A
Gagura 1 1 0 0 0 0 0 1 1 A 0 1 Y Y 0 7 A A
Gajnai 1 0 0 0 0 0 0 0 0 A 1 1 N N I 0 0 NA A
Godelao 1 0 0 0 0 0 0 0 0 A 0 1 Y Y 0 0 A A
Gurha Bachhraj 1 0 0 0 0 0 0 0 0 A 0 5 N N I 0 0 NA A
Guda Bhadawatan 1 0 0 0 0 0 0 0 0 A 0 2 Y Y 0 0 NA A
Guda Beeja 1 1 1 0 0 0 1 AY 0 1 A 1 1 Y Y 0 0 A A
Guda Chatura 1 0 0 0 0 0 0 0 1 A 0 1 Y Y 0 0 A A
Guda Kalan 1 1 1 0 0 0 0 0 1 A 1 1 Y Y 1 1 A A
Guda Ramsingh 1 1 0 0 0 0 0 0 1 A 0 1 Y Y 0 1 A A
Guda Shyama 1 0 0 0 0 0 0 0 0 A 1 1 Y Y 0 0 A A
Hapat 1 0 0 0 0 0 0 0 0 A 0 1 N N I 0 0 NA A
Hariya Mali 2 0 0 0 0 0 0 1 1 A 1 1 Y Y 1 1 A A
Heerawas 1 0 0 0 0 0 0 0 0 A 0 1 N N I 0 0 NA A
Hingawas 1 1 0 0 0 0 0 1 0 A 1 14 Y Y 0 0 A A
Jhupelao 1 1 0 0 0 0 0 1 0 A 0 1 Y Y 0 0 A A
Kanawas 1 0 0 0 0 0 0 0 0 A 0 1 Y Y 0 0 NA A
Karmawas 1 1 0 0 0 0 0 0 1 A 1 28 Y Y 1 1 A A
Kharnikhera 1 0 0 0 0 0 0 0 0 A 0 1 Y Y 0 0 NA A
Kelwad 1 1 1 0 0 0 0 1 1 A 1 1 Y Y 0 1 A A
Ker Khera 1 0 0 0 0 0 0 0 0 A 0 1 Y Y 0 0 NA A

EIA/EMP report of Sand/Bajri Mine (With ML Area of 4280.0 ha) Tehsil Marwar Jn., District Pali, Rajasthan
EQMS INDIA PVT. LTD. 136
Khakhra 2 1 0 0 0 0 0 0 1 A 1 23 Y Y 0 2 A A
Khamal 1 0 0 0 0 0 0 0 0 A 0 1 Y Y 0 0 NA A
Khariya Neev 1 1 1 0 0 0 1 AY 0 1 A 1 1 Y Y 1 1 A A
Khariya Soda 1 1 0 0 0 0 0 1 1 A 1 3 Y Y 0 0 A A
Khariya Swami 1 0 0 0 0 0 0 0 0 A 0 0 Y Y 0 0 NA A
Khera Nabra 1 0 0 0 0 0 0 0 0 A 0 0 N N I 0 0 NA A
Khejari Ka Bala 1 0 0 0 0 0 0 0 0 A 0 0 N N I 0 0 NA NA
Khokhara 2 1 0 0 0 0 0 0 1 A 1 23 Y Y 0 2 A A
Lanera 1 0 0 0 0 0 0 1 1 A 0 1 Y Y 0 0 NA A
Ladpura 1 0 0 0 0 0 0 0 0 A 0 0 Y Y 0 0 A A
Lakhan Ka Khet 1 0 0 0 0 0 0 0 0 A 0 0 N N I 0 0 NA NA
Lundawas 1 0 0 0 0 0 0 0 0 A 0 14 Y Y 0 0 A A
Malpuriya Kalan 1 0 0 0 0 0 0 0 1 A 0 1 Y Y 0 0 NA A
Malpuriya Khurd 1 0 0 0 0 0 0 0 1 A 0 1 Y Y 0 0 NA A
Mamawas 1 0 0 0 0 0 0 0 1 A 0 1 Y Y 0 7 A A
Mandla 1 1 0 0 0 0 0 1 1 A 1 15 Y Y 0 1 A A
Meo 1 1 0 0 0 0 0 1 1 A 1 1 Y Y 0 1 A A
Morawas 1 0 0 0 0 0 0 0 0 A 0 2 Y Y 0 0 A A
Murdawa 1 1 0 0 0 0 0 1 0 A 1 0 Y Y 0 0 A A
Nai Dhani 1 0 0 0 0 0 0 1 0 A 0 1 Y Y 0 0 NA A
Napawas 1 0 0 0 0 0 0 0 0 A 0 1 N N I 0 0 NA A
Nathal Kundi 1 0 0 0 0 0 0 0 0 A 0 3 N N I 0 0 NA A
Naya Gaon 1 1 0 0 0 0 0 1 1 A 0 10 Y Y 0 0 A A
Pachchwa Khurd 1 0 0 0 0 0 0 0 0 A 0 1 Y Y 0 0 NA A
Pachunda Kalan 1 1 0 0 0 0 0 0 0 A 1 16 N N I 0 0 A A
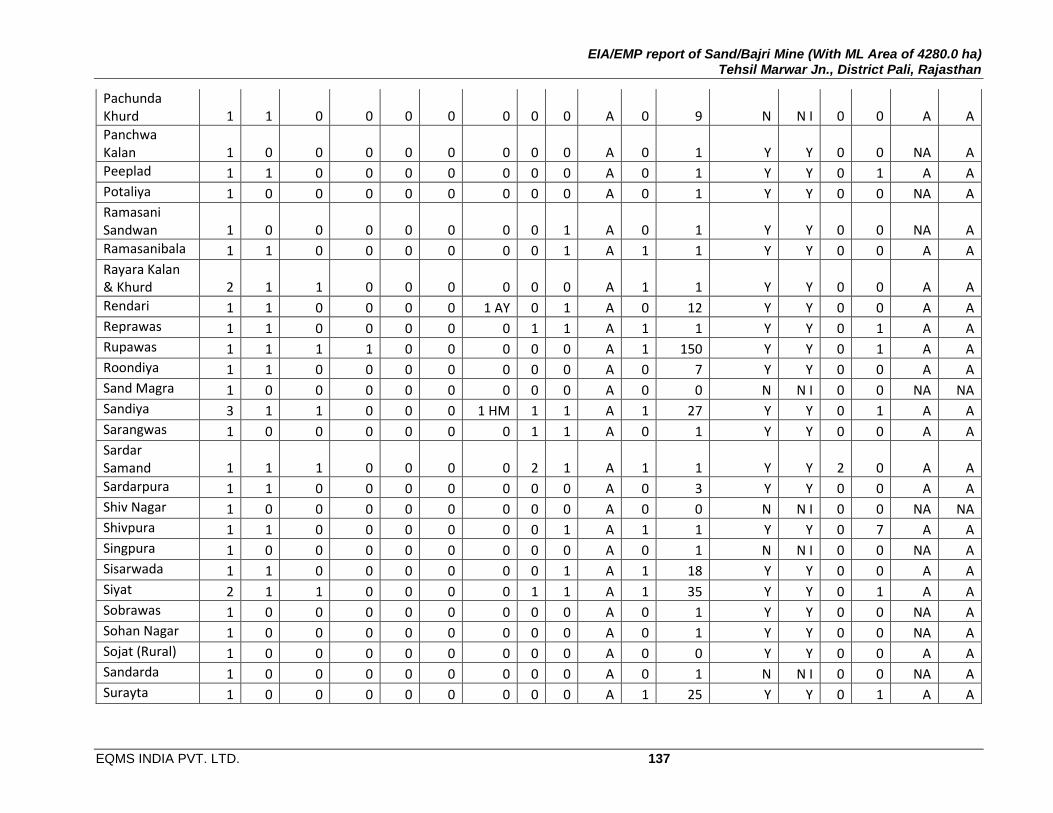
EIA/EMP report of Sand/Bajri Mine (With ML Area of 4280.0 ha) Tehsil Marwar Jn., District Pali, Rajasthan
EQMS INDIA PVT. LTD. 137
Pachunda Khurd 1 1 0 0 0 0 0 0 0 A 0 9 N N I 0 0 A A
Panchwa Kalan 1 0 0 0 0 0 0 0 0 A 0 1 Y Y 0 0 NA A
Peeplad 1 1 0 0 0 0 0 0 0 A 0 1 Y Y 0 1 A A
Potaliya 1 0 0 0 0 0 0 0 0 A 0 1 Y Y 0 0 NA A
Ramasani Sandwan 1 0 0 0 0 0 0 0 1 A 0 1 Y Y 0 0 NA A
Ramasanibala 1 1 0 0 0 0 0 0 1 A 1 1 Y Y 0 0 A A
Rayara Kalan & Khurd 2 1 1 0 0 0 0 0 0 A 1 1 Y Y 0 0 A A
Rendari 1 1 0 0 0 0 1 AY 0 1 A 0 12 Y Y 0 0 A A
Reprawas 1 1 0 0 0 0 0 1 1 A 1 1 Y Y 0 1 A A
Rupawas 1 1 1 1 0 0 0 0 0 A 1 150 Y Y 0 1 A A
Roondiya 1 1 0 0 0 0 0 0 0 A 0 7 Y Y 0 0 A A
Sand Magra 1 0 0 0 0 0 0 0 0 A 0 0 N N I 0 0 NA NA
Sandiya 3 1 1 0 0 0 1 HM 1 1 A 1 27 Y Y 0 1 A A
Sarangwas 1 0 0 0 0 0 0 1 1 A 0 1 Y Y 0 0 A A
Sardar Samand 1 1 1 0 0 0 0 2 1 A 1 1 Y Y 2 0 A A
Sardarpura 1 1 0 0 0 0 0 0 0 A 0 3 Y Y 0 0 A A
Shiv Nagar 1 0 0 0 0 0 0 0 0 A 0 0 N N I 0 0 NA NA
Shivpura 1 1 0 0 0 0 0 0 1 A 1 1 Y Y 0 7 A A
Singpura 1 0 0 0 0 0 0 0 0 A 0 1 N N I 0 0 NA A
Sisarwada 1 1 0 0 0 0 0 0 1 A 1 18 Y Y 0 0 A A
Siyat 2 1 1 0 0 0 0 1 1 A 1 35 Y Y 0 1 A A
Sobrawas 1 0 0 0 0 0 0 0 0 A 0 1 Y Y 0 0 NA A
Sohan Nagar 1 0 0 0 0 0 0 0 0 A 0 1 Y Y 0 0 NA A
Sojat (Rural) 1 0 0 0 0 0 0 0 0 A 0 0 Y Y 0 0 A A
Sandarda 1 0 0 0 0 0 0 0 0 A 0 1 N N I 0 0 NA A
Surayta 1 0 0 0 0 0 0 0 0 A 1 25 Y Y 0 1 A A

EIA/EMP report of Sand/Bajri Mine (With ML Area of 4280.0 ha) Tehsil Marwar Jn., District Pali, Rajasthan
EQMS INDIA PVT. LTD. 138
Tharasani 1 1 0 0 0 0 0 1 0 A 0 1 Y Y 2 0 NA A
Udeshi Kua 1 0 0 0 0 0 0 0 0 A 0 8 Y Y 0 0 A A
Birawas 1 0 0 0 0 0 0 0 0 A 0 1 N N I 0 0 NA NA
Total 122 52 15 4 0
1 AL,
1 AY
1 AL, 6 AY, 1
HM
32
40 - 37 1636 - - 18 53 - -

EIA/EMP report of Sand/Bajri Mine (With ML Area of 4280.0 ha) Tehsil Marwar Jn., District Pali, Rajasthan
EQMS INDIA PVT. LTD. 139
3.10.7. Crop Rotation
As per Agro-Climate Zone (NARP), the district has been categorized as transitional plain
of Luni Basin Zone (RJ-4) and is covered under western dry region IV as per agro-climate
zone (Planning Commission). The district has arid to semi-arid climate. It is drained by
integrated drainage system of Luni basin. The rivers draining through the district are
ephemeral in nature and flows during monsoon. The run-off of the river(s) is intercepted
at many places through storage dam, medium earthen dams, small tanks for the drinking
as well as irrigation purposes. Small anicuts across the rivers have been erected for
impounding water for multipurpose use besides ground water harvesting. Sandy soil
with severe erosion, salinity and shallow skeletal soils are major limiting factors affecting
crop choice in the region. The major Kharif crops grown are maize, millets while during
Rabi wheat, barley and oil seeds are grown. The area both irrigated and un-irrigated during
Kharif and Rabi Crops (2010-11) in the district is shown in Table 3.39 and the productivity
of principal crops is shown in Table 3.40.
Table 3.39 : Area irrigated and un-irrigated under Kharif and Rabi Crops
S. No.
Major Field Crops cultivated (2010-11)
Kharif Area (ha)
Rabi Area (ha)
Total Irrigated Rainfed Total Irrigated Rainfed Total
1 Pearl millet 13295 93131 106426 - - - 106426
2 Cluster bean 5290 10190 15480 - - - 15480
3 Moth bean 220 6700 6920 - - - 6920
4 Green gram 1600 10300 11900 - - - 11900
5 Sorghum 2000 4515 6515 - - - 6515
6 Sesame 150 8900 9050 - - - 9050
7 Cow pea 120 7200 7320 - - - 7320
8 Groundnut 50 250 300 - - - 300
9 Castor 1200 920 2120 - - - 2120
10 Cotton 1395 1015 2410 - - - 2410
11 Mustard - - - 9175 275 9450 9450
12 Wheat - - - 10972 120 11092 11092
13 Cumin - - - 7300 90 7390 7390
14 Barley - - - 8500 1500 10000 10000
15 Gram - - - 6095 1710 7805 7805
16 Taramira - - - 595 1276 1871 1871
17 Fenu greek (Methi) - - - 3200 150 3350 3350
18 Fennel - - - 1720 350 2070 2070
Total area (ha) 25320 143121 168441 47557 5471 53028 221469

EIA/EMP report of Sand/Bajri Mine (With ML Area of 4280.0 ha) Tehsil Marwar Jn., District Pali, Rajasthan
EQMS INDIA PVT. LTD. 140
Table 3.40 : Productivity of Principal Crops
S.No.
Name of crop
Kharif-2011 Rabi -2011 - 12
Production (Qtl)
Productivity
(kg/ha)
Production (Qtl)
Productivity
(kg/ha)
1 Pearl millet 467610 540
2 Green gram 303530 310
3 Moth bean 14170 201
4 Cluster bean 358740 166
5 Groundnut 252011 1740
6 Castor 30312 635
7 Sesame 458820 280
8 Cotton 26410 2100
9 Sorghum 546660 510
10 Chillies 271115 620
11 Cowpea 282110 199
12 Mustard 915990 1390
13 Wheat 1382710 1789
14 Isabgol 2011 421
15 Cumin 25630 642
16 Taramira 275920 1120
17 Gram 293690 862
18 Barley 73110 1799
19 Onion 104520 1520
20 Garlic 92150 1621
21 Funnel 17900 1820
22 Fenugreek 16110 1615
3.10.8. Industries
The break-up of exiting SSI and MSME registered with the district industries given in Table
3.41.
Table 3.41 : Groupwise Details of SSI and MSME Registered Units
Sr. Industrial Category Number of Units
Employment in No.
1. Agro based Industries 1369 4157
2. Beverages & Tobacco based Industry 01 12
3. Textile Industries 1453 11178
4. Handloom 236 473
5. Leather Based 3481 7881
6. Wooden based 970 2733
7. Paper based 07 46

EIA/EMP report of Sand/Bajri Mine (With ML Area of 4280.0 ha) Tehsil Marwar Jn., District Pali, Rajasthan
EQMS INDIA PVT. LTD. 141
8. Rubber Plastic Petroleum & Chemical
Based
238 928
9. Mineral Based 1550 7333
10. Basic Metal and Non-ferrous Metal based & Fabricated Metal Products
945 3901
11. Machinery and Machine Tools Based 13 84
12. Electrical Industry/Machinery Appliances 09 49
13. Transport & Equipment and Part - -
14. Misc. Mfg. Industries 2513 8157
15 Service & Repairing & Alls. Type 1952 5663
Total 14737 52595
Source: - DIC – Pali
.

EIA/EMP report of Sand/Bajri Mine (With ML Area of 4280.0 ha) Tehsil Marwar Jn., District Pali, Rajasthan
EQMS INDIA PVT. LTD. 142
CHAPTER 4. : Anticipated Environmental Impacts and Mitigation Measures
4.1. Introduction
With the commissioning of the mining activities of the proposed project, it is expected that
there shall be certain changes in the overall environmental matrix of the area. The base line
data of the existing environment, in the absence of proposed project activities, provides the
status of natural environment and when this is evaluated in conjunction with the proposed
activities it further provides a mechanism for prediction of changes likely to happen. In
present study likely impact and its extent on various environmental parameters viz.
topography and drainage, land, water, hydrology, noise, air, ecological and socio-economics
were undertaken by assessing the baseline environmental status of the area and estimation
were made as how this will change with commencement of project activity. The mitigation
measures have been developed with a view to bring down the levels of impacts within limits.
In each of the areas of impact, measures have to be taken to mitigate adverse impacts and
where these are beneficial in nature such impacts are to be enhanced/augmented so that the
overall adverse impacts are reduced to substantial extent.
4.2. Impacts on Topography and Drainage
4.2.1. Topography
The core zone i.e. the proposed mine lease area is confined within the flow section of various
stream/river/bala. The riverbed is consolidated matrix of sand/silt/clay/bajri lying in main
stream sections and low terraces of flood plain of the river. The mining activity in the riverbed
by creating pits per se shall not lead to any change in the local topography of the area as the
pits dug in pervious year shall be fully or partially replenished during flood in following years.
There will be no formation of overburden dumps. Thus there will be no change in topography
of either core or buffer zone.
4.2.2. Drainage
Ephemeral stream/river network flow in their defined flow section during monsoon through
mine lease area within tehsil. Besides main streams there are other very small streams,
locally known as Bala, flow in the mine lease area. The mining activities in Main River shall
not cut any lower order stream as these are non-existents and there shall be no impact in the
flow course of main streams, because these flow within their channel storage. Since the
mining activity shall not be carried out during monsoon and in the wake of the fact that 90%
of the time of the year the rivers are dry. No temporary diversion of discharge of main rivers
or any of their interlacing is warranted for facilitating mining. Otherwise also the mining of dry
riverbed has been contemplated. The drainage pattern of the rivers flowing in tehsil shall not
alter due to dry bed mining.

EIA/EMP report of Sand/Bajri Mine (With ML Area of 4280.0 ha) Tehsil Marwar Jn., District Pali, Rajasthan
EQMS INDIA PVT. LTD. 143
4.3. Land Environment
4.3.1. Change in land use
The landuse of the core zone is river body flowing and as per revenue record it has been
categorized as Gair Mumkin Nadi Nala. The mining activity in the river bed per se shall not
lead to any change in the landuse in the core zone as well as buffer zone where no mining
activities is proposed.
4.3.2. Change in river course
There will be no change in the river course due to mining as the river course is mainly guided
by the hydraulic gradient of surface water and the geological conditions of the bank and bed
of the river. In the mine lease area the river section is well defined and is confined between
both the flanks.
4.3.3. Impact on soil
The mining plan envisages open cast manual method of mining in excavating the riverbed
deposits and proposed to remove top soil crust (silt/clay) and stacking for future back filling
programme/spreading on upper terraces.
The mine waste in the form of silt/clay in mine lease area are very fine but due to semi-
mechanized mining, very little dust would be generated. These dust particles are usually
blown away along the wind direction and get deposited on the canopy of surrounding
vegetation on the river bank and agricultural crops thereby interfering with photosynthesis
and other physiological activities of the green cover. Finally, this may result in reduced
ecological functions of the forest ecosystems as well as economic productivity of the agro-
ecosystems.
4.3.3.1 Mitigation measures
In accordance with the Rule 37U in Chapter IVA of RMMCR, 1986 amended upto 2012, the
top soil shall be removed and stacked systematically and separately for spreading on upper
terraces for being used under plantation.
Immediately after back filling, the refilled top soil shall be planted with fast growing
leguminous cover of crops and other indigenous herbs, shrubs of pioneer species, apart from
planting of tree species.
Sprinkling of water, at regular intervals, on exposed surface of silt/clay in upper terraces or
stacks for back filling will further reduce the dust emission due to air. Also, creation of green
belt well before the mining operation starts would also reduce the dust emission.
4.4. Impacts on Climate
Wind Speed The wind speed in any area is dependent upon local topography and is intimately connected
with the development as high and low pressure zones. The controlling factors for the pressure
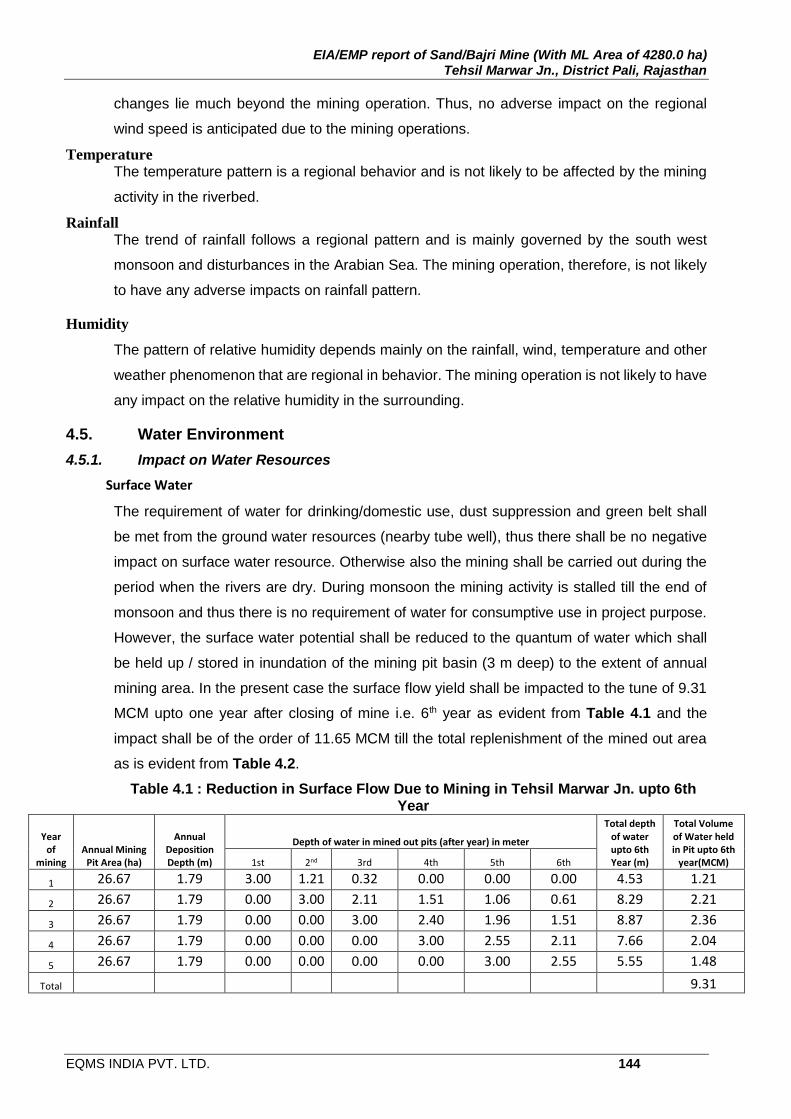
EIA/EMP report of Sand/Bajri Mine (With ML Area of 4280.0 ha) Tehsil Marwar Jn., District Pali, Rajasthan
EQMS INDIA PVT. LTD. 144
changes lie much beyond the mining operation. Thus, no adverse impact on the regional
wind speed is anticipated due to the mining operations.
Temperature The temperature pattern is a regional behavior and is not likely to be affected by the mining
activity in the riverbed.
Rainfall The trend of rainfall follows a regional pattern and is mainly governed by the south west
monsoon and disturbances in the Arabian Sea. The mining operation, therefore, is not likely
to have any adverse impacts on rainfall pattern.
Humidity
The pattern of relative humidity depends mainly on the rainfall, wind, temperature and other
weather phenomenon that are regional in behavior. The mining operation is not likely to have
any impact on the relative humidity in the surrounding.
4.5. Water Environment
4.5.1. Impact on Water Resources
Surface Water
The requirement of water for drinking/domestic use, dust suppression and green belt shall
be met from the ground water resources (nearby tube well), thus there shall be no negative
impact on surface water resource. Otherwise also the mining shall be carried out during the
period when the rivers are dry. During monsoon the mining activity is stalled till the end of
monsoon and thus there is no requirement of water for consumptive use in project purpose.
However, the surface water potential shall be reduced to the quantum of water which shall
be held up / stored in inundation of the mining pit basin (3 m deep) to the extent of annual
mining area. In the present case the surface flow yield shall be impacted to the tune of 9.31
MCM upto one year after closing of mine i.e. 6th year as evident from Table 4.1 and the
impact shall be of the order of 11.65 MCM till the total replenishment of the mined out area
as is evident from Table 4.2.
Table 4.1 : Reduction in Surface Flow Due to Mining in Tehsil Marwar Jn. upto 6th Year
Year of
mining Annual Mining
Pit Area (ha)
Annual Deposition Depth (m)
Depth of water in mined out pits (after year) in meter
Total depth of water upto 6th Year (m)
Total Volume of Water held in Pit upto 6th
year(MCM) 1st 2nd 3rd 4th 5th 6th
1 26.67 1.79 3.00 1.21 0.32 0.00 0.00 0.00 4.53 1.21
2 26.67 1.79 0.00 3.00 2.11 1.51 1.06 0.61 8.29 2.21
3 26.67 1.79 0.00 0.00 3.00 2.40 1.96 1.51 8.87 2.36
4 26.67 1.79 0.00 0.00 0.00 3.00 2.55 2.11 7.66 2.04
5 26.67 1.79 0.00 0.00 0.00 0.00 3.00 2.55 5.55 1.48
Total 9.31

EIA/EMP report of Sand/Bajri Mine (With ML Area of 4280.0 ha) Tehsil Marwar Jn., District Pali, Rajasthan
EQMS INDIA PVT. LTD. 145
Table 4.2 : Reduction in Surface Flow Due to Mining in Tehsil Marwar Jn upto 4 Years close of mining
Year of
mining
Annual Mining
Pit Area (ha)
Annual Deposition Depth (m)
Depth of water in mined out pits (after year) in meter
Total depth
of water
(m)
Total Volume
of Water held in
Pit (MCM) 1st 2nd 3rd 4th 5th 6th 7th 8th
9th
1
26.67 1.79 3.00 1.21 0.32 0.00 0.00 0.00 0.00 0.00 0.00
4.5 1.21
2
26.67 1.79 0.00 3.00 2.11 1.51 1.06 0.61 0.17 0.00 0.00
8.5 2.25
3
26.67 1.79 0.00 0.00 3.00 2.40 1.96 1.51 1.06 0.46 0.00
10.4 2.77
4
26.67 1.79 0.00 0.00 0.00 3.00 2.55 2.11 1.66 1.06 0.17
10.5 2.81
5
26.67 1.79 0.00 0.00 0.00 0.00 3.00 2.55 2.11 1.51 0.61
9.8 2.61
Total
11.65
Ground Water
As the requirement of water for drinking/domestic use, dust suppression and green belt shall
be met from the ground water resources (nearby tube well), thus there shall be impact on
ground water resource to the extent the water is abstracted from the ground i.e. 0.011 MCM
annually.
The district has geo-hydrological formations, viz., unconsolidated, semi consolidated fully
consolidated, with varying groundwater potential. The unconsolidated formations include,
recent alluvium, brown sand, clay, silt and gravel, pebble, which are fairly thick and regionally
extensive, confined to semi-confined aquifers. They are porous formations. The aquifer
potential varies widely between (40-100 litres per second) for the very good ones, to 10-40
litres per second for moderately good ones. The removal of river sand in 3 m depth shall
result into the loss of aquifer material to the extent of the volume of mined out mineral which
will reduce the infiltration into the ground in conditions when the river bed is not saturated
completely. The sand in the river section, acts like a sponge and consequently help in
recharging the water table and thus its continuous removal shall lead to progressive depletion
in infiltration and recharging capacity, but the impact shall be temporary and insignificant.
The response of river flow during monsoon on the replenishment of the wells located along
the bank of the river and also in riverbed is immediate and more pronounced. However, the
megre recharge during run-off period of the ephemeral rivers is not sustained for a
significantly long period.
The lowering of bed of influent rivers result in decline of ground water table in nearby area
as the water gradient towards the bank increases owing to pit caused due to the mining. On
the contrary during flood and after flood the subsurface basin in the form of 3m deep mine

EIA/EMP report of Sand/Bajri Mine (With ML Area of 4280.0 ha) Tehsil Marwar Jn., District Pali, Rajasthan
EQMS INDIA PVT. LTD. 146
pits shall act as reservoir to trigger a good recharge of the ground water due to the increase
head for percolation.
Recharge to Ground Water
The mining pits can be construed as the recharge structure having adequate capacity
for impounding surface run-off. These pits cause quick recharging of the ground water
through percolation. These pits conserve water to a greater extent since these get
filled during monsoon when the evaporation rate is about half of the potential rate
(PET) in summer, as a result of which pond may contain water for long duration.
As per GEC Methodology 1997, 50% of gross storage, considering the number of
fillings, with half of this recharge occurring in the monsoon season, and the balance
in the non-monsoon season. On a conservative consideration that the riverbed mined
out pit gets filled only once during the monsoon, the ground water recharge has been
worked out year wise (Table 4.3). It is evident from the table that the total quantity at
the end of 6th year i.e. 4.65 MCM against which 0.035 MCM water shall be abstracted
from ground water resource to meet the water requirement of the project. It is thus
eloquent that the mining may result in recharge of ground water.
Table 4.3 : Year-wise Computation of Ground Water Recharge as per GEC-97
After Year 1st 2nd 3rd 4th 5th 6th Total
Total Depth of Water in Mined out pit (m)
3.00 4.21 5.42 6.91 8.57 6.78 34.89
Volume of water in Pit (MCM)
0.80 1.12 1.45 1.84 2.29 1.81 9.31
Recharge @ 50% of the volume in Pond
as per GEC-97 (MCM)
0.40 0.56 0.72 0.92 1.14 0.90 4.65
4.5.2. Impact on Surface Water Quality
Though the mining activities shall be carried out during the period when the rivers run dry
and thus there will be no synergic relation between water and soil during the period of mining.
However, during heavy rains the loose soil spread on upper terraces can find way into the
river section due to run-off from upper banks and also due to formation of rills. This will
increase the silt rate to smaller extent as the river flow during flash floods carry
considerably high sediment and suspended load as compared to the former. Besides
this the other probable water pollutants like Biodegradable organic matters, Pathogens and
vectors, Dissolved inorganic solids which may cause pollution during monsoon.

EIA/EMP report of Sand/Bajri Mine (With ML Area of 4280.0 ha) Tehsil Marwar Jn., District Pali, Rajasthan
EQMS INDIA PVT. LTD. 147
Mitigation Measures
The mining in the flooded pits shall be allowed only after the water level has receded.
Sufficient time should be allowed for settling of sediment in the pits
4.5.3. Impact on Ground Water Quality
In view of the facts that the mining activities does not intersect the ground water table. No
impact on the quality of ground water is anticipated. Beside this the sand and bajri are non-
toxic in nature and therefore percolated water from the pits shall not impair the ground water
quality.
4.5.4. Impact on River Morphological features
The extraction of sand and bajri from flood plains of low terrace of rivers / streams shall lead
to change in its cross-sectional profile and cause incision of u/s channel bed thereby
increasing the bed slope / gradient. The extraction of riverine material from such segment of
river which are eroding may cause decrease in bed load and consequent d/s incision. During
flooding the stream creates a new channel path through the pit where it will deposit all bed
sediments. In effluent rivers the alluvial ground water table is lower due to mining as the
ground water from upper gradient flow towards the pit. In the present case the mining pits
shall not be created continuously all along the river but will be punctuated by such reaches
where the mineral deposits are not of good quality. Such reaches act as hump during the
flow of the river through the mining pits and thus lower the flow velocity and specific energy
of flow.
4.5.5. Impact on Stream – Ground water exchange Zone
In between the porous sand / gravel river bed and the ground water table the hyporheic is
sandwiched this zone allows both way movement of infiltrated as well as capillary water
through it and is responsible for hyporheic processes due to interstitial bacterial and
invertebrates biota. The intervention in river by way of hydraulic structures regulating the river
flow and more often than not leaving no flow d/s, mining activities in which the bed material,
filter material through which the water percolate to ground water, effluent from industrial
activities, insecticides used in agriculture are all potent to impair the biota in hyporheic. In the
present case due to dry riverbed for most period of the year except monsoon, this impact will
not be there. However, after the withdrawal of monsoon if the river bed mining, in dry riverbed
near u/s and d/s of water retaining structures such as anicut, the loss of hyporheic zone will
be there as the riverbed stretches both u/s and d/s of the structure are hydraulically
connected with the stored water and the stratum below the river bed has moisture content in
it to support the interstitial bacteria. Therefore during post monsoon the mining in river bed
shall not be carried out in about 500 m u/s and d/s of water retaining structures. These
reaches in river bed can be taken up for mining in March and April.

EIA/EMP report of Sand/Bajri Mine (With ML Area of 4280.0 ha) Tehsil Marwar Jn., District Pali, Rajasthan
EQMS INDIA PVT. LTD. 148
4.5.6. Impact on Irrigation/Water supply schemes
The monsoon flow in the rivers has been harnessed by creating minor /medium dams and
sluices at few places in the river. The stored water is used for drinking and irrigation purposes
during winter. Besides these hydraulic structures small height weir known as anicut have
been constructed across rivers at many places for the purpose of storing water and recharge
of the ground water. There will be no impact on the surface water resource as no river water
is to be consumed for meeting water requirement, however, the surface water potential shall
be reduced to the quantum of water which shall be held up / stored in inundation of the mining
pit basin (3 m deep) to the extent of annual mining area due to and thus there will be impact
on irrigation / water supply schemes on this count. However, during heavy rains the loose
soil spread on upper terraces can find way into the river section due to run-off from upper
banks and also due to formation of rills, which will increase the silt rate to some extent. The
increased silt/sediment will finally get deposited into the ponds/reservoir and impact its
capacity for designated use.
4.6. Noise and Vibration
The main noise generating source during semi-mechanized riverbed mining operation and
related activities are the mining is from operation of machinery like excavators, loaders, and
back-hoe and FE loaders besides transport vehicles movement to and fro from riverbed site
to outside lease boundary or to the sale point. The mine lease area is generally away from
the settlements except in case of rivers which flow adjacent to the town. The noise monitoring
shows that day and night time noise levels are highest at such places where the commercial
activity takes place and the noise levels are within the limits in rural setup which are more
than a couple of km away from mine site. The riverbed locations in the rural areas have noise
levels within the prescribed limits as no anthropogenic activities were witnessed during the
study period except at such places where the bridges were under construction over the river.
4.6.1. Impact on Noise Level
In order to predict ambient noise levels due to the mining the noise modeling has been done.
For computing the noise levels at various distances with respect to the place in the mine
lease area where maximum daily production is envisaged. Noise levels are predicted by a
user friendly model the details of which are elaborated below.
4.6.2. Model for sound wave propagation during mining
For an approximate estimation of dispersion of noise in the ambient air from the point source,
a standard mathematical model for sound wave propagation is used. The noise generated
by equipment decreases with increased distance from the source due to wave divergence.
An additional decrease in sound pressure level with distance from the source is expected
due to atmospheric effect or its interaction with objects in the transmission path.
EIA/EMP report of Sand/Bajri Mine (With ML Area of 4280.0 ha) Tehsil Marwar Jn., District Pali, Rajasthan
EQMS INDIA PVT. LTD. 149
For hemispherical sound wave propagation through homogenous loss free medium, one can
estimate noise levels at various locations, due to different source using model based on first
principles, as per the following equation:
LP2=LP1 – 20Log (r2 / r1) - AE ……………………………. (1)
Where,
LP2 And L P1 are the Sound Pressure Levels (SPL) at points located at a distances of r2 and r1 from
the source. AE is attenuations due to Environmental conditions (E). The combined effect of the entire
source can be determined at various locations by the following equation.
LP (total) = 10Log (10 (Lpa)/10 + 10 Lpb)/10 + 10 Lpc)/10 + ………) (2)
Where Lpa, LPb, LPc are noise pressure levels at a point due to different sources.
Environment Correction (AE)
The equivalent sound pressure level can be calculated from the measured sound pressure level (Leq
measured) averaged over the measurement surface area ‘S’ and from corrections K1 and K2 and is given
by;
(Leq measured) = (Leq measured) – K1 – K2 (3)
Where,
K1 = Factor for the background noise correction. The correction was not applied in this modeling
exercise, as it was not possible to measure the background noise levels by putting off machines hence
it was considered as zero.
K2 = Environmental correction
In the present study dhwani PRO Version 3.6, a noise propagation modelling software developed to
undertake construction, industrial and traffic noise propagation studies. A variety of scenarios can be
created quickly in dhwani PRO, allowing the user to determine the impact of changing the source,
layout and adding /removing the effects of shielding due to noise mitigation devices such as barriers.
4.6.3. Input for the model
4.6.3.1 Base Map, Point Source and Receptors
Base maps identifying the location of the site, noise sources, receptors and other important
characteristics of the surrounding area is the foremost requirement. In this study jpeg raster
maps created in Google map showing the locations of the mining site where the maximum
daily production is to be achieved has been captured and imported for registering the map
and setting up of the scale. The point source is the location where the mining equipment i.e.
the point source of noise is to be operated. The receptors are the nearby settlements where
the impact of propagation of noise is to be evaluated.
4.6.3.2 Hourly noise level

EIA/EMP report of Sand/Bajri Mine (With ML Area of 4280.0 ha) Tehsil Marwar Jn., District Pali, Rajasthan
EQMS INDIA PVT. LTD. 150
Hourly nose levels observed for 24 hours at the point source have been observed and
adopted in studies. The noise levels to be generated intermittently due to running of mining
equipments for different hours have also been incorporated. Besides this, the background
level at the receptors have been entered into the corresponding windows.
4.6.3.3 Standard Values of Noise Levels of Mining Equipments
At the point source noise shall be generated intermittently due to operation and movement
of truck/tripper, service vans, crushing, truck movement. Intermittent noise would generated
due to operation of mining machinery and transport vehicles in respect of which the standard
value of noise levels are given in Table 4.4.
Table 4.4 : Standard Values of Noise Levels
S.No. Machinery/ Activity Noise Produced in dB(A) at 50 ft from source*
1. Excavator 85
2. Front end loader 85
3. Dump Truck/ Tippers 84 *50 feet from source = 15.24 meters
SOURCE: U.S. Department of Transportation (Federal Highway Administration) – Construction Noise Handbook.
4.6.4. Model outputs
After running the model the graphical results in the form of noise level contours (Figure 4.1)
0has been produced which has been captured and exported. Besides this the output in the
tabular form showing the estimated noise levels at different receptors owing to the impact of
running of mining machinery has been generated. (Table 4.5)
Table 4.5 : Modeling Output
4.6.5. Inference
It is evident from the graphical results that the noise level of 85 dB(A) gets highly attenuated
to 37 dB(A), 32 dB(A) and 27 dB(A) about 200m, 400m and 800 m respectively from the point
source. The estimated noise levels at the one receptor in the market due to running of mining
machinery shall be 35 dB(A) which are less than the existing background noise levels of 57.3
dB(A). Thus there will be no impact of running of mining machinery at the receptors location.

EIA/EMP report of Sand/Bajri Mine (With ML Area of 4280.0 ha) Tehsil Marwar Jn., District Pali, Rajasthan
EQMS INDIA PVT. LTD. 151
Figure 4.1 : Noise Graphical Results

EIA/EMP report of Sand/Bajri Mine (With ML Area of 4280.0 ha) Tehsil Marwar Jn., District Pali, Rajasthan
EQMS INDIA PVT. LTD. 152
4.6.5.2 Mitigation Measures to Reduce Ambient Noise Levels
The following control measures will be adopted to keep the ambient noise levels below
permissible limits 75 dB (A).
(i) Provision and maintenance of thick tree belts to screen noise.
(ii) Avenue plantation within the project area to dampen the noise.
(iii) Proper maintenance of noise generating transport vehicles.
(iv) Regular noise level monitoring shall be carried out periodically for taking corrective
action
To protect the workers from exposures to higher noise levels the following measures will
be adopted.
(i) Provision of protective devices like ear muffs/ear plugs to those workers who cannot
be isolated from the source of noise
Reducing the exposure time of workers to the higher noise levels by rotation.
4.6.6. Input for the model
An input noise model has been generated with the source of noise to be generated
intermittently due to operation and movement of truck/tripper, conveyers movement,
service vans, crushing, truck movement. Intermittent noise would generated due to
operation of mining machinery and transport vehicles in respect of which the standard
value of noise levels are given in Table 4.6.
Table 4.6 : Standard Values of Noise Levels
S.No. Machinery/ Activity Noise Produced in dB(A) at 50 ft from source*
1. Excavator 85
2. Front end loader 85
3. Dump Truck/ Tippers 84 *50 feet from source = 15.24 meters
SOURCE: U.S. Department of Transportation (Federal Highway Administration) – Construction Noise Handbook
Model outputs
The ambient noise levels have been predicted for proposed mining. The predicted noise
levels at the boundary of the mine in different directions are given in Table 4.7. There will
be slight impact on the village during blasting for a short period and due to masking effect,
it will not have any significant impact for rest of the time.
Table 4.7 : Predicted Noise Levels
Distance from mine site (m)
Ambient noise levels dB(A) at the riverbed site
Noise level due to deployment of construction machinery dB(A)
Resultant noise level due to construction activities dB(A)
EIA/EMP report of Sand/Bajri Mine (With ML Area of 4280.0 ha) Tehsil Marwar Jn., District Pali, Rajasthan
EQMS INDIA PVT. LTD. 153
1 52.2 85 85.00
10 52.2 65 65.22
100 52.2 45 52.96
500 52.2 31 52.23
It is evident from the table the noise levels due to noise source from river and truck
movement are attenuated after 100 m distance from the mine site. The resultant noise
levels are very high at mine site (85 dB(A)).
4.6.6.2 Mitigation Measures to Reduce Ambient Noise Levels
The following control measures will be adopted to keep the ambient noise levels below
permissible limits 75 dB (A).
(v) Provision and maintenance of thick tree belts to screen noise.
(vi) Avenue plantation within the project area to dampen the noise.
(vii) Proper maintenance of noise generating transport vehicles.
(viii) Regular noise level monitoring shall be carried out periodically for taking corrective
action
To protect the workers from exposures to higher noise levels the following measures will
be adopted.
(ii) Provision of protective devices like ear muffs/ear plugs to those workers who cannot
be isolated from the source of noise
(iii) Reducing the exposure time of workers to the higher noise levels by rotation.
4.6.7. Impacts due to ground vibration (due to blasting)
No ground vibration due to mining activity shall be imparted as no blasting is proposed for
the mining.
4.7. Impacts on Air Environment
Basically dust sources in mines can be categorized as primary sources that generate the
dust and secondary sources, which disperse the dust and carry it from place to place
called as fugitive dust.
Impacts of mining on air quality are cause for concern mainly due to fugitive emissions of
particulate matter. The major operations producing dust in river bed mining are pit
excavation, segregation and screening of material, loading and transporting. Exhaust
emissions from vehicles deployed are also likely to result in inconsequential increase in the
levels of SO2, NOx, and CO.

EIA/EMP report of Sand/Bajri Mine (With ML Area of 4280.0 ha) Tehsil Marwar Jn., District Pali, Rajasthan
EQMS INDIA PVT. LTD. 154
The collection/extraction of river borne material and its handling, loading & unloading will
cause momentary rise in the PM10. The dust liberated in mining and other related
operations is injurious to health if inhaled in sufficient quantity regularly as it may lead to
lung disease.
4.7.1. Dust Dispersion Modelling for Excavation Operation
In this present study, United States Environmental Protection Agency (USEPA–42 series)
approved mathematical equations have been used to predict concentrations for different
operations in mining including the mineral transportation. In order to predict the particulate
emissions, Lakes Environmental Aermod View ver. 6.2 (Air Dispersion Modelling
Software) an interface based on ISCST3 - was used to predict changes in air quality i.e.,
maximum ground level concentration (GLC’s) of Particulate Matter. The AERMOD open
pit source algorithm which uses an effective area for modelling pit emissions, based on
meteorological conditions and then utilizes the numerical integration area source
algorithm to model the impact of emissions from the effective area sources, was used to
predict the ground level concentration (Average hourly highest 1st value) resulting due to
open pit excavation. Short term model options was opted for uniform emissions rates. Line
source inputs were adopted for modelling of dust dispersion resulting from movement of
vehicles on haul road starting from pit to the nearest metaled road. The concentration of
other gaseous pollutants i.e. SO2 and NOx was found to be much lower than the threshold
limit (80 µg/m3), the air modelling was restricted to determination of particulate matter i.e.
PM10 in the present case. Since the mining project is a linear project where the mining will
be done at different locations in different rivers the modelling has been carried out for the
place where the maximum mining activities for obtaining the maximum production per day
is envisaged.
Open Pit Emission Rate
Open pit emission rate depends upon soil properties, climatic conditions and area of pit.
Empirical equation for calculation of open pit emission rate is given as follows:
The details of production parameters, transportation, moisture, silt content and the velocity
adopted for working out the emission rate at the mine pit pertaining to the location of
maximum production per day is provided in Table 4.8.

EIA/EMP report of Sand/Bajri Mine (With ML Area of 4280.0 ha) Tehsil Marwar Jn., District Pali, Rajasthan
EQMS INDIA PVT. LTD. 155
Table 4.8 : Details of Production Parameters, Transportation, Moisture, Silt Contents
S. No.
Particular Value
1 Production in T/day 300
2 Transported material in t/day 300
3 Quantity of ore in each trip 20
4 No. of trips/day 15
5 No. of trips/hr (8 working hours /day) 2
6 Road width in m 6
7 Area of pit in sq km (a) 0.0009
8 Moisture content of road dust in % (m) 5
9 Silt content of road dust in % (s) 10
10 Wind speed in m/sec (u) 1.39
The dust emission rate calculated as above for Riverbed at Dhanla at the place of
maximum daily production has been worked out as 0.00000014 gm/sec/sqm. The results
of dust dispersion modelling showing the first highest value of concentration at Uniform
Cartesian Receptors and also one Non-Uniform Receptors i.e. NCART1 (A-2 air
monitoring site) are shown in Table 4.9. The maximum predicted ground level
concentration as obtained for open pit source inputs with meteorological data of the study
period at the mine pit center 0.45 µg/m3 whereas at the air monitoring station A-2 located
within 500m from the mine pit, it has drastically reduced to 0.04 µg/m3. Isopleth developed
is shown on part of SOI toposheet no. 45G/10 (Figure 4.2).
Table 4.9 : Predicted Ground Level Concentration due to Open-pit excavation
Cartesian Coordinates
Average hourly
highest 1st Concentration
(µg/m3)
Z-Elevation
NET ID DATE
(CONC)
X Y
366257 2825687 0.02020 0 UCART1 131204
365857 2824987 0.02021 0 UCART1 131224
366357 2825187 0.02050 0 UCART1 131111
365904.7 2825442 0.02054 0 NCART2 131221
366257 2825387 0.02059 0 UCART1 131103
365857 2825387 0.02077 0 UCART1 131016
366357 2824987 0.02103 0 UCART1 131101
366357 2825287 0.02117 0 UCART1 131109
365957 2825487 0.02126 0 UCART1 131106
366057 2825687 0.02148 0 UCART1 131106
366057 2825587 0.02159 0 UCART1 131122

EIA/EMP report of Sand/Bajri Mine (With ML Area of 4280.0 ha) Tehsil Marwar Jn., District Pali, Rajasthan
EQMS INDIA PVT. LTD. 156
365957 2824987 0.02475 0 UCART1 131104
366157 2825587 0.02485 0 UCART1 131128
366257 2825587 0.02506 0 UCART1 131202
366157 2825687 0.02526 0 UCART1 131122
365857 2825087 0.02557 0 UCART1 131203
366257 2825087 0.03007 0 UCART1 131101
365857 2825287 0.03213 0 UCART1 131118
366257 2825287 0.03318 0 UCART1 131109
366157 2825087 0.03405 0 UCART1 131208
366157 2825187 0.03489 0 UCART1 131101
366057 2825087 0.03624 0 UCART1 131211
366157 2825387 0.03774 0 UCART1 131121
365957 2825087 0.03953 0 UCART1 131104
365757 2825187 0.03988 0 UCART1 131130
365926 2825127 0.04290 0 NCART1 131120
366157 2825487 0.05250 0 UCART1 131202
365957 2825387 0.05561 0 UCART1 131106
366157 2825287 0.06149 0 UCART1 131109
365957 2825187 0.06947 0 UCART1 131104
366057 2825487 0.07447 0 UCART1 131122
366057 2825187 0.07814 0 UCART1 131117
366057 2825287 0.16125 0 UCART1 131114
366057 2825387 0.17521 0 UCART1 131202
365957 2825287 0.45159 0 UCART1 131130
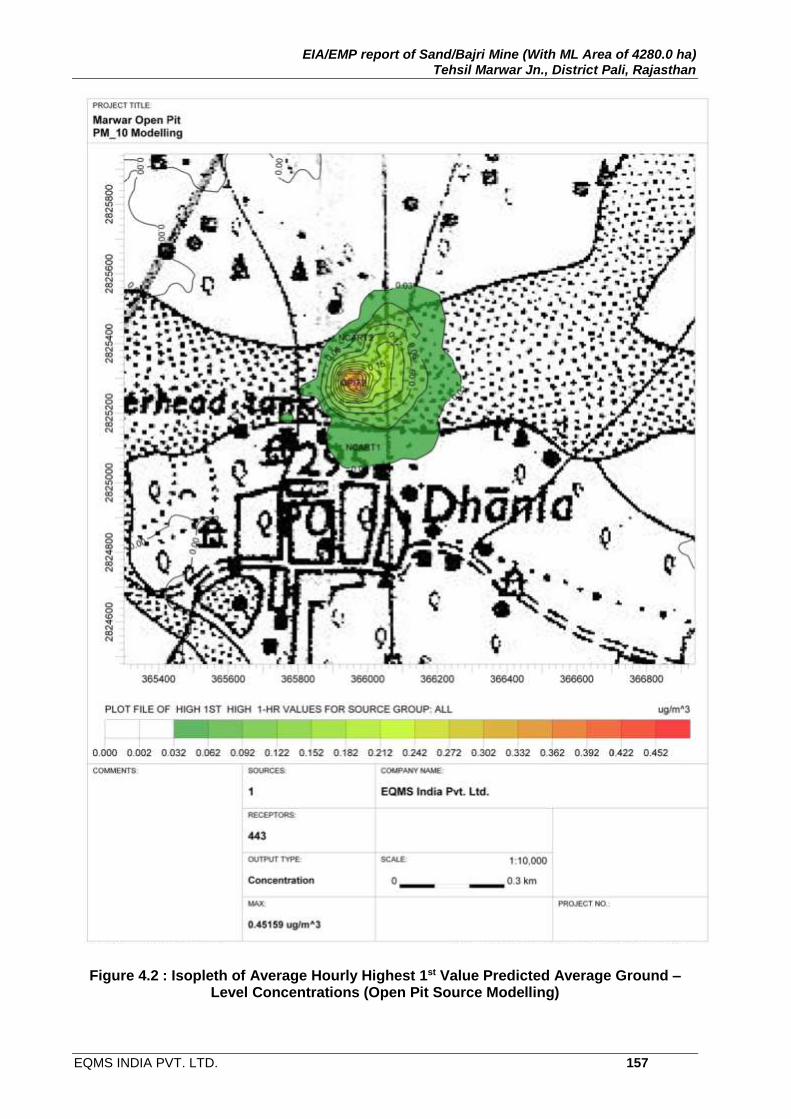
EIA/EMP report of Sand/Bajri Mine (With ML Area of 4280.0 ha) Tehsil Marwar Jn., District Pali, Rajasthan
EQMS INDIA PVT. LTD. 157
Figure 4.2 : Isopleth of Average Hourly Highest 1st Value Predicted Average Ground – Level Concentrations (Open Pit Source Modelling)

EIA/EMP report of Sand/Bajri Mine (With ML Area of 4280.0 ha) Tehsil Marwar Jn., District Pali, Rajasthan
EQMS INDIA PVT. LTD. 158
4.7.2. Impact Due To Vehicular Movement on Haul Roads In Riverbed
The transport vehicle after being loaded with the mineral shall have to ply in the initial
reach in the riverbed through the haul road made for the purpose. The movement of loaded
vehicle is directly responsible for air born dust emission which trails behind the vehicle.
The tractive force of the wheels exhibited from movement on un-paved road causes
pulverization of the surface material which mainly constitutes of river born material i.e.
sand and silt in the present case. The finer soil particles are lifted from the ground as these
are entrapped in the small groves of the tyres and are finally tangentially thrown from the
rolling wheels. The road surface also experiences strong air currents in turbulent shear
with the surface. After a vehicle has passed, the turbulence continues to act on the road
surface. The quantity of dust emission for a particular segment of the un-paved road
linearly varies with the character of the traffic and its volume. Thus it is evidently clear that
the movement of transport vehicle on haul road may result in increase in ground level
concentration of particulate matter.
Haul Road Emission Rate
The emission rate is dependent on several factors which includes soil properties, climatic
conditions, vehicular traffic, wind forces and machinery operation. The Empirical equation
for calculation of emission rate is as under.
E= [{(100-m) / m}0.7 {us/(100-s)}0.1 {(41.6+0.03 f c +108v)}10-5]
The details of production parameters, transportation, moisture, silt content and the velocity
of wind, average speed of vehicle and its capacity adopted for working out the emission
rate at the haul roads pertaining to the location of maximum production per day is provided
in Table 4.10.
Table 4.10 : Details of Production Parameters, Transportation, Moisture, Silt Contents
S. No. Particular Value
1 Production in T/day 300
2 Transported material in t/day 300
3 Quantity of ore in each trip 20
4 No. of trips/day 15
5 No. of trips/hr (8 working hours /day 2
6 Road width in m 6
7 Moisture content of road dust in % (m) 10
8 Silt content of road dust in % (s) 10
9 Wind speed in m/sec (u) 1.39
10 Average Vehicle Speed in m/s (v) 2.7

EIA/EMP report of Sand/Bajri Mine (With ML Area of 4280.0 ha) Tehsil Marwar Jn., District Pali, Rajasthan
EQMS INDIA PVT. LTD. 159
11 Frequency of vehicle movement / hour (f) 2
12 Capacity of dumpers in tonne (c ) 20
The dust emission rate calculated as above for Riverbed haul road at Dhanla, at the place
of maximum daily production, has been worked out as 0.01291 gram/sec/m. The results
of dust dispersion modelling showing the first highest value of concentration at Uniform
Cartesian Receptors and also two Non-Uniform Receptors i.e. NCART1 (A-2 air
monitoring site) and at NCART2 are shown in Table 4.11. The maximum monthly average
predicted ground level concentration as obtained for line source inputs with meteorological
data of the study period at the mine pit center is 8.36 µg/m3 whereas at the air monitoring
station A-2, located within 500m from the mine pit, it has drastically reduced to 1.47 µg/m3.
Isopleth developed is shown on part of SOI toposheet no. 45G/10 (Figure 4.3).
Table 4.11 : Receptors Location And Model Results
Cartesian Coordinates
Average hourly
highest 1st Concentration
(µg/m3)
Z-Elevation
NET ID DATE
(CONC)
X Y
366457 2825537 0.30398 0 UCART1 131121
365957 2826037 0.30704 0 UCART1 131106
366707 2825287 0.38573 0 UCART1 131126
366457 2826037 0.40522 0 UCART1 131202
366207 2825537 0.43232 0 UCART1 131128
365707 2825537 0.44628 0 UCART1 131208
365957 2824787 0.44997 0 UCART1 131116
365957 2825787 0.47164 0 UCART1 131106
366457 2825287 0.58974 0 UCART1 131126
366207 2825787 0.63014 0 UCART1 131202
366207 2825037 0.72633 0 UCART1 131101
365707 2825287 0.72945 0 UCART1 131118
365957 2825037 0.91820 0 UCART1 131116
366207 2825287 1.23969 0 UCART1 131125
365957 2825537 1.35662 0 UCART1 131202
365926 2825127 1.47462 0 NCART1 131116
365904.7 2825442 2.52605 0 NCART2 131202
365957 2825287 8.36326 0 UCART1 131101

EIA/EMP report of Sand/Bajri Mine (With ML Area of 4280.0 ha) Tehsil Marwar Jn., District Pali, Rajasthan
EQMS INDIA PVT. LTD. 160
Figure 4.3 : Isopleth of Maximum Predicted 24 hourly averaged Ground – Level Concentrations (Line Source Modelling)
EIA/EMP report of Sand/Bajri Mine (With ML Area of 4280.0 ha) Tehsil Marwar Jn., District Pali, Rajasthan
EQMS INDIA PVT. LTD. 161
4.7.3. Cumulative Impact
The cumulative impact due to proposed mining operation on the Ambient air quality
for PM10 at the mine site and nearest air monitoring stations A-2 located about
500m, is presented in Table 4.12 which shows that, the resultant concentration
level at each of the location shall be 87.81 µg/m3 and 78.51 µg/m3 which are within
the NAAQS.
Table 4.12 : Cumulative levels of existing and predicted levels of PM10
Location Fugitive Dust (µg/m3) NAAQS
(µg/m3) Net ID Sampling
Station
Maximum
Background
Concentration
Incremental concentration contribution due to
proposed mining and haul road transportation
Resultant
concentration
Open pit
source
modelling
Line
source
modelling
Total
Incremental
concentration
UCART1 A-3 79 0.45 8.36 8.81 87.81 100
NCART1 A-2 77 0.04 1.47 1.51 78.51 100
4.7.4. Mitigation Measures
Following mitigation measures shall be adopted during mining activities to control air
pollution load below the prescribed limits:
Water spraying on haul roads by mobile and fixed sprinklers at regular interval.
Designing and laying haul roads in gentle grade and in hard stratum as far as
possible. The road surface along the riverbank shall be properly laid with grid and
small pebbles to eliminate air borne dust. Proper maintenance of un-tarred and
Katcha road shall be periodically carried out as and when required.
Avenue plantation on roadsides besides plantation around the mine lease area will
help in reducing the emission.
It shall be ensured that the laborers working at or near high dust prone area use
dust filters / mask.
Covered or hooded trucks shall be used for transportation. Care shall be taken to
prevent spillage of material.
4.8. Biological Environment
4.8.1. Impact on Flora
The proposed mine lease area is ‘Gair Mumkun Nadi Nala’, which bears negligible density
and species composition of forest vegetation. There are some economically important
plants species has been found in the buffer zone of the project which have very remote
EIA/EMP report of Sand/Bajri Mine (With ML Area of 4280.0 ha) Tehsil Marwar Jn., District Pali, Rajasthan
EQMS INDIA PVT. LTD. 162
chance of getting disturbed due to mining activities. Since there will be no felling of trees
or deforestation, there will be no impact on flora of the core zone. The mining activity per
se shall not lead to any impact on the terrestrial flora of the buffer zone either. There are
no national parks, sanctuaries, notified biospheres, Tiger/Elephant Corridors, Birds
migratory routes, etc. within 10 km radius.
The dust is the only major pollutant, which will be generated from different activities of
mining. The effect of particulate matter on vegetation is in the form of incrustation, plugging
of stomata, and loss of chlorophyll and reduction of photosynthesis process. Disturbance
in plant metabolism due to deposition of dust particles on foliar surfaces leads to reduction
in plant growth. The atmospheric concentrations normally do not reach a level sufficient
to induce acute injury.
The annual plantation, within the mine lease area, proposed for five years of mining period
shall greatly help in developing a good vegetal cover on the upper terrace near the bank
of the river and eventually attract micro fauna, birds etc in the area. Thus, there will be
positive impact on terrestrial environment around the mine lease area.
4.8.1.1 Measures for Minimizing Impact on Flora
It shall be ensured that no mining shall be carried out inside the land prohibited
from mining activities.
Green Belt shall be properly designed in consultation with the forest department.
Plantation shall be carried out as per periodical plantation programme.
Fast growing native plant species, medicinal value plant species, dust tolerant and
sound receptor plant species and fruit species to enhance the food availability for
wildlife and those which would maintain the regional ecological balance, soil and
hydrological conditions shall be favoured.
4.8.2. Impact on Fauna
Intervention in the riverbed will impact butterflies and birds which are quite sensitive to
noise and human presence. No endangered species of fauna is found in and around lease
area. As such, there will be temporary and insignificant effect on fauna around the mining
lease area. Based on the field observations and interaction with local people and forest
officials it was noted that the project area does not constitute part of any wildlife migratory
routes and mining activities won’t affect animal movement at all. Terrestrial biodiversity
will be affected only by the operation of mining machinery and vehicular movements in the
mining areas and from increased human population (laborers etc.) during mining activities.
No Schedule-I & II species, under WPA 1972, have been sighted in the project area i.e.
core zone. However, a few mammals and avi-fauna included in Schedule I & II of WPA
Act, 1972 are stated to be present in the buffer zone and these wild animals sometimes

EIA/EMP report of Sand/Bajri Mine (With ML Area of 4280.0 ha) Tehsil Marwar Jn., District Pali, Rajasthan
EQMS INDIA PVT. LTD. 163
also frequent the area nearby the river banks. Thus, for conservation of these a
management plan has been formulated.
4.8.2.1 Measures for Minimizing Impact on Fauna
Following measures will be adopted to minimize the impact of mining on faunal
environment of the area
Progressive afforestation will create favorable conditions and good habitat for
fauna in the area.
Measures shall be adopted to curb pollution due to air, water, land and noise
environment.
Creating and developing awareness for nature and wildlife in the adjoining
villages.
4.8.3. Impact on Aquatic Ecology
The dry riverbed mining in ephemeral river system which flow only in 90% of the year
during monsoon alone, in which period the mining activities are not envisaged, apparently
there will be no impact on aquatic life as there will be no surface water available for aquatic
life to survive due to dry river bed condition. Occasionally some aquatic life can be
witnessed at such places where the monsoon run-off has filled the stilling basin provided
d/s of some of the anicuts and road bridges to diffuse the d/s flow energy of streams. But
water in such basins may remain stored only during November and December before its
infiltration into the ground as well as loss in evaporation. However, such stilling basin
cannot be considered as habitat for aquatic life. During heavy rains the loose soil spread
on upper terraces can find way into the river section due to run-off from upper banks and
also due to formation of rills. This will increase the silt rate to smaller extent as compared
to the considerably high sediment and suspended load in run-off resulting from direct
response to heavy rains.
4.8.4. Impact on Plankton
Sand mining from the riverbed which has a flowing water column i.e. in-stream mining may
cause release of fine silt and sediment which result in a temporary increase in the silt
consultation of the flowing water. This leads to reduction in the transparency of the water
and decreases the light intensity of the water column. Phytoplankton forms the basis of
aquatic food chain and needs a certain degree of light intensity for net primary production.
The phytoplankton concentration is a function of net primary production which itself is
dependent on the sunlight intensity. Due to reduction of the light intensity in the water
column with the increase of silt concentration the algal bloom is delayed or stopped
depending upon the sediment concentration in water.

EIA/EMP report of Sand/Bajri Mine (With ML Area of 4280.0 ha) Tehsil Marwar Jn., District Pali, Rajasthan
EQMS INDIA PVT. LTD. 164
In the present case where the mining is proposed from the dry riverbed any silt or finer
particles which may drop during the excavation and loading process shall continue to
remain on the dry riverbed surface. In such a scenario when there is no flow in the river,
there is no case for any increase in siltation rate. Thus the impact on plankton is totally
ruled out at such stretches where there is no water column. However, in case the mining
is done in the stretch of the river which is covered under the receded pond level of the
water structure like anicut across the river section, there is always a probability of the fine
silt particles from the riverbed being swept away during the monsoon period. But during
the monsoon period the silt concentration of the flowing water is always high and the little
amount of silt thus swept away will not appreciable increase the already high sediment
rate during the flow period in monsoon. In that case also there shall be no impact on the
phytoplankton present in the bed of the river with in the stretch of the pond / reservoir
formed due to anicut.
4.9. Impact on Socio-Economic Environment
The entire mine lease area lies within the revenue waste land in river bed, the project does
not involve any loss of agriculture land. Some of the impacts would be directly beneficial
to the socio-economic environment due to proposed employment potential. The beneficial
impacts due to the activities in the region would be:
Employment Potential for 109 persons in the various categories as skilled/semi-
skilled/un-skilled for carrying out mining activities.
Indirect employment in transport sector.
Amelioration of the general living standards of local persons employed in mining
activities.
The higher earnings will result in more purchase power.
Improvement in the economic growth in the region by way of additional mineral
availability.
Various activities, such as livelihood and entrepreneurship through providing
training in self-employment and empowering women through education and
training and promoting their SHG (Self Helping Group), taken under corporate
social responsibility initiative will have a positive impact on socio economic fabric
of the area.
Benefit to the State and the Central governments through financial revenues by
way of royalty, tax, duties, etc from this project directly and indirectly.

EIA/EMP report of Sand/Bajri Mine (With ML Area of 4280.0 ha) Tehsil Marwar Jn., District Pali, Rajasthan
EQMS INDIA PVT. LTD. 165
Adverse Impacts
The adverse impacts on socio-economic environment due to mining activities in the region
will be:
Dust will affect to the local air environment and this dust will settle down on nearby
agricultural fields and will affect the productivity of the land and increase in
respiratory problems.
Soil erosion and loss of fertility etc.
There may be some conflict of utilization of local resources between project
proponent and local communities. For avoidance of which the project proponent
should maintain a good liaison and ensure cordial relation between staff and locals
Contamination of water, soil and air due to mining.
4.10. Impact due to Transportation of Mined out material on environment
The The mining in a tehsil shall be carried out along different rivers which for the have
been divided into different blocks The collective stretch of the lease area for each river
has been sub-divided in to five blocks for ease of operation, supervision, management
and safety. The daily production has been envisaged as 4000 metric tonne. The quantity
of daily production of mine shall significantly vary reach-wise and block-wise. The
maximum production in Tehsil Marwar Jn.i has been envisaged in Bandi river at Dhanla.
At this place about 300 MT daily production is stipulated for the transportation of which 15
tripper/trucks (20 T) shall be required. The increased traffic load due to transportation of
mineral shall not be concentrated in a particular segment of the road as the material shall
be dispatched to different destination and in different directions. The impact due to
transportation shall be on carrying capacity of the State Highway/ National Highway and
also due to increase in vehicular emissions due to mineral transportation.
4.11. Impact on the carrying capacity of SH and NH due to proposed transport activities
The bulk of mineral mined out from river Bandi, Sukri, Lilki and Mithri Nadi, Khari and
Siryari Nala shall be transported through SH-61 (Pali – Bhilwara Road) and also through
SH-62 (Bilara in Jodhpur – Pindwara in Sirohi district). About 1.0 million tonne material /
annum (90%) shall be transported through SH-61 and 0.12 million tonne / annum (10%)
shall be transported through SH-62. The transport plan for movement of trucks is shown
in Figure 4.4. The study for carrying capacity has been carried out for these roads by
undertaking traffic volume counts at the prominent inter-junction of these roads as per
guideline of IRC:9-1972 and IRC:SP 19-2001 and the PCU factors adopted for analysis
has been taken as per IRC:64-1990.

EIA/EMP report of Sand/Bajri Mine (With ML Area of 4280.0 ha) Tehsil Marwar Jn., District Pali, Rajasthan
EQMS INDIA PVT. LTD. 166
Figure 4.4 Transport Route Map
Classified Volume Count Traffic Survey
The traffic survey is essential to realistically and accurately assess the prevailing traffic
volumes and travel characteristics by undertaking classified volume count. The objective
of traffic volume count survey is to assess the traffic intensity on the most vulnerable
section of the road under question. Two – days, 24 hrs., continuous volume counts were
manually undertaken during November 2013 at Jojawar on SH-61 and at Karmal on SH-
62 for capturing the realistic picture of the current volume and composition of traffic
motorized i.e. passenger vehicles (two-wheeler, three-wheeler, bicycle, passenger car);
utility vehicles (Jeep, Van, Mini Bus, Standard Bus); Goods vehicles – LCV (Freight), MCV
(2 axle rigid chasis), MCV (3 axle rigid chasis), MAV and tractor trailer and non-motorized
like animal driven cart. The survey work was conducted by engaging educated people
familiar with traffic characteristics. Before the start of survey the enumerated engaged
were briefed and trained by an expert supervisor about the task.
The analysis of traffic counts provides an estimate of average daily traffic (ADT). In order
to convert recorded vehicles into a common scale, the passenger car units (PCU)
equivalent factor as per IRC:64 -1990 has been adopted. The Table 4.13 reveals that the
total ADT near Jojawar on SH-61 were 3106 in terms of number which translates into 5327
in terms of PCU. The Table 4.14 reveals that the total ADT at Karmal on SH-62 were
2788 in terms of number which translates into 4126 in terms of PCU. It is thus evident that
the number of PCU / hour at these places of count were 222 and 172 on SH –61 and SH-
62 respectively.

EIA/EMP report of Sand/Bajri Mine (With ML Area of 4280.0 ha) Tehsil Marwar Jn., District Pali, Rajasthan
EQMS INDIA PVT. LTD. 167
Table 4.13 : Traffic volume counts near Jojawar on SH-61
S. No. Nomen Clature of Vehicle PCU factor No. of Vehicles / day No. of PCU / day
1 Car / Jeep / Van 1.0 1048 1048
2 Two-Wheelers 0.5 353 176
3 Three – Wheelers 1.0 28 28
4 Mini- Bus 1.5 19 28
5 Bus 3.0 111 333
6 Tempo / LCV 1.5 108 163
7 Two Axle Truck 3.0 648 1943
8 Three Axle Truck 3.0 418 1255
9 More than three Axle Truck 4.5 28 125
10 Tractor 1.5 55 83
11 Cycle 0.5 290 145
Total
3106 5327
Table 4.14 : Traffic volume counts at Karmal on SH-62
S. No. Nomenclature of Vehicle PCU factor No. of Vehicles / day No. of PCU / day
1 Car / Jeep / Van 1.0 841 841
2 Two-Wheelers 0.5 805 402
3 Three - Wheelers 1.0 83 83
4 Mini- Bus 1.5 50 75
5 Bus 3.0 129 388
6 Tempo / LCV 1.5 81 122
7 Two Axle Truck 3.0 451 1352
8 Three Axle Truck 3.0 157 470
9 More than three Axle
Truck 4.5 52 233
10 Tractor 1.5 91 137
11 Cycle 0.5 49 24
Total
2788 4126
Impact on Carrying capacity of SH-61 and SH-62
About 1.0 million metric tonne of material / annum shall be transported through SH-61,
this tantamount to 3600 metric tonne / day for transportation of which 180 trucks (20 tonne
capacity) shall be deployed. The trucks shall make one loaded and unloaded journey
every day. It is thus apparent that the additional traffic load due to mining shall be 1080
PCU/day or 45 PCU/hour. As per IRC: 64-1990, the design service volume for a two lane
rural road in plain terrain for low curvature is 15000 PCU / day. The incremental rise in
daily traffic at SH-61 due to transportation of minerals is evaluated and shown in Table
4.15 which manifests that there shall be an incremental rise of 7.2 % of PCU due to

EIA/EMP report of Sand/Bajri Mine (With ML Area of 4280.0 ha) Tehsil Marwar Jn., District Pali, Rajasthan
EQMS INDIA PVT. LTD. 168
envisaged traffic movement owing to mining activities and that 42.7 % of design service
volume shall be tentatively utilized in post project scenario. Thus the marginal incremental
rise in the total PCU shall not be appreciable and adequate apportionment of total design
service volume capacity shall be still available in post project scenario.
Table 4.15 : Incremental rise in existing average daily traffic at SH-61 due to proposed transport activity
Design Service Volume for SH-61 PCU / Day
Existing Daily Traffic Data at SH-61
Envisaged Traffic Movement Due to Mining Activities
Cumulative Traffic Movement at SH-61 - Post Project Scenario
Design Service Volume tentatively to be utilized in Post Project Scenario
Incremental rise in PCU due to envisaged traffic movement owing to mining activities
PCU / Day
PCU / Hour
PCU / Day
PCU / Hour
PCU / Day
PCU / Hour
15000 5327 222 1080 45 6407 267 42.7 % 7.2 %
About 0.12 million metric tonne of material / annum shall be transported through SH-62,
this tantamount to 428.6 metric tonne / day for transportation of which 22 trucks (20 tonne
capacity) shall be deployed. The trucks shall make one loaded and unloaded journey
every day. It is thus apparent that the additional traffic load due to mining shall be 132
PCU/day or 6 PCU/hour. As per IRC: 64-1990, the design service volume for a two lane
rural road in plain terrain for low curvature is 15000 PCU / day or 625 PCU / hour. The
incremental rise in daily traffic at NH-65, a two lane rural area, due to transportation of
minerals is evaluated and shown in Table 4.16 which manifests that there shall be an
incremental rise of 0.9% of PCU due to envisaged traffic movement owing to mining
activities and that 28.4% of design service volume shall be tentatively utilized in post
project scenario. Thus the marginal incremental rise in the total PCU shall not be
appreciable and adequate apportionment of total design service volume capacity shall be
still available in post project scenario.
Table 4.16 : Incremental rise in existing average daily traffic at SH-62 due to proposed transport activity
Design Service Volume for SH-62 PCU / Day
Existing Daily Traffic Data at SH-62
Envisaged Traffic Movement Due to Mining Activities
Cumulative Traffic Movement at SH-62 - Post Project Scenario
Design Service Volume tentatively to be utilized in Post Project Scenario
Incremental rise in PCU due to envisaged traffic movement owing to mining activities
PCU / Day
PCU / Hour
PCU / Day
PCU / Hour
PCU / Day
PCU / Hour

EIA/EMP report of Sand/Bajri Mine (With ML Area of 4280.0 ha) Tehsil Marwar Jn., District Pali, Rajasthan
EQMS INDIA PVT. LTD. 169
15000 4126 172 132 6 4258 178 28.4 % 0.9 %
4.11.2. Impact Due to Traffic Noise
On the basis of the prevailing traffic, increased traffic due to mineral transportation and
the cumulative traffic in post project scenario the noise values has been worked out and
has been found as 76.9 dB(A) , 71.7 dB(A) and 77.9 dB(A) respectively at Jojawar (SH-
61). dhwani PRO Version 3.6, a noise propagation modelling software developed to undertake
construction, industrial and traffic noise propagation studies has been adopted for calculation of
noise due to traffic. The input data and the other information adopted for calculating the
noise as per in all three cases is shown in Table 4.17. It is thus evident that the existing
noise levels shall slightly increase by 0.8 dB (A) due to increased traffic
Table 4.17 : Determination of Traffic Noise Levels at Jojawar (SH-61)
S. No. Input
Prevailing Traffic
Increased Traffic due to Mining
Cumulative Traffic Post Project Scenario
1 Total Vehicle Flow/10hr. 1294 180 1474
2 Speed km/hr 50 50 50
3 Percentage of Heavy
Vehicle 40.7 100 46.7
4 Gradient Percentage 1 1 1
5 Road Surface Impervious Impervious Impervious
6 Noise level in dB(A) 76.9 71.7 77.9
On the basis of the prevailing traffic, increased traffic due to mineral transportation and the
cumulative traffic in post- project scenario the noise levels have been worked out and found as
75.2 dB(A) , 61.2 dB(A) and 75.5 dB(A) respectively at Karmal on SH-62. dhwani PRO Version 3.6,
a noise propagation modelling software developed to undertake construction, industrial and traffic
noise propagation studies has been adopted for calculation of noise due to traffic. The input data
and the other information adopted for calculating the noise as per all three cases is shown in Table
4.18. It is thus evident that the existing noise levels shall slightly increase by 0.3 dB (A) due to
increased traffic
Table 4.18 : Determination of Traffic Noise Levels at Karmal (SH-62)
S. No. Input
Prevailing Traffic
Increased Traffic due to Mining
Cumulative Traffic Post Project Scenario
1 Total Vehicle Flow/10hr. 1162 44 1206
2 Speed km/hr 50 50 50
3 Percentage of Heavy
Vehicle 28.4 100 29.4
4 Gradient Percentage 1 1 1
5 Road Surface Impervious Impervious Impervious
6 Noise level in dB(A) 75.2 61.2 75.5

EIA/EMP report of Sand/Bajri Mine (With ML Area of 4280.0 ha) Tehsil Marwar Jn., District Pali, Rajasthan
EQMS INDIA PVT. LTD. 170
The state highways have been upgraded into 2 lane with carriageway width of 7-8m and
1.5m wide hard earthen material shoulder on either side while the NH are four lane and
are complete in most of the reaches, except for a few places where the fly over/ bridges
are under construction. The work of four laning /two laning and widening of the highways
has been going on for the last 4 to 5 years and the completed segment of the roads are
in fine fettle. Based on elastic values (empirical relationship between transport demand
and economic growth) socio – economic parameters and recent trends of growth of
different vehicles (PCUs), yearly traffic projections have been analyzed upto year 2035
and the roads have been designed accordingly keeping in view the futuristic requirement.
4.12. Impact Due To Vehicular Emission
The increased traffic load in any particular segment of the road will result into direct
increase in pollutants released from the vehicles. The rate of emissions of various types
of vehicles is presented in Table 4.19. However, the extent of these impacts, at any given
time will depend upon the rate of vehicular emission within a given stretch of the road; and
the prevailing meteorological conditions. The impacts will have strong temporal
dependence as both of these factors vary with time. The temporal dependence would
have diurnal, seasonal as well as long-term components.
Table 4.19 : Emission factors by vehicle type (gm/km/vehicle)
Type of
vehicle
CPCB/ ARAI (Automotive Research Association of India) - Emission Factor
development for Indian Vehicles – 2008
Make
considered
Emission
norms
Emission Factors
g/km
CO NO2 PM10 SO2*
Trucks
(HCV
Diesel
driven)
Post 2000 BS-II 6.00 9.30 1.24 0.03
Passenger
Cars (Diesel
driven)
Post 2005 BS-II 0.06 0.28 0.015 0.004
Buses
(HCV
Diesel
driven)
Post 2005 BS-II 3.92 6.53 0.30 0.026
* Note: Emission Factor of SO2 is calculated based on Sulphur content calculations
considering Bharat Stage IV fuel norms

EIA/EMP report of Sand/Bajri Mine (With ML Area of 4280.0 ha) Tehsil Marwar Jn., District Pali, Rajasthan
EQMS INDIA PVT. LTD. 171
California Line Source dispersion Model (Caline 4) was used for particulate matter
dispersion due to increased transportation on SH-61. The model was run for one hour
considering worst case angle. The receptors location and model results for worst case
wind angle are shown in Table 4.20. The results show that at 25 m predicted
concentration is only 0.3 µg/m3 which reduces to 0.2 µg/m3 at 750m. Thus the impact
on the pollutant level (PM10) due to increased traffic due to transportation of mineral
shall be inconsequential.
Table 4.20 Receptor Locations And Model Results (Worst Case Wind Angle)
RECEPTOR
Coordinates BRG
(DEG)
Predicted Concentration
(PPM) X Y Z
Recpt 1 25 0 1.8 269 0.3
Recpt 2 50 0 1.8 269 0.3
Recpt 3 100 0 1.8 269 0.3
Recpt 4 150 0 1.8 270 0.3
Recpt 5 200 0 1.8 270 0.3
Recpt 6 300 0 1.8 270 0.3
Recpt 7 400 0 1.8 271 0.3
Recpt 8 500 0 1.8 271 0.3
Recpt 9 750 0 1.8 271 0.2
Recpt 10 1000 0 1.8 270 0.1
Recpt 11 1250 0 1.8 270 0
Recpt 12 1500 0 1.8 270 0
Recpt 13 1750 0 1.8 270 0
Recpt 14 2000 0 1.8 270 0
4.12.2. Control Measures for Impact Due to Traffic
Following control measures have been suggested to prevent air pollution due to the
transportation activities:
Transport trucks/tippers shall be properly maintained.
Avoiding of overloading of trucks beyond stipulated capacity by installing weighbridges at the check posts or near to it.
Strict compliance of traffic rules and regulations
The Hon’ble High Court of Judicature for Rajasthan at Jaipur Bench, vide its interim
order dated 14-08-2014, in S.B.Civil Miscellaneous Stay Application 8034/2014 in
S.B.CWP No. 2372/2014 in the matter of overloading and illegal mining, had

EIA/EMP report of Sand/Bajri Mine (With ML Area of 4280.0 ha) Tehsil Marwar Jn., District Pali, Rajasthan
EQMS INDIA PVT. LTD. 172
passed certain directions as interim measures, fixing responsibilities on LOI
holders directed them to install weighing machines at the check post or close to
the check post now existing. However, machine would remain under the
supervision of Mining Department as well as Transport Department who will be
responsible for proper upkeep of records and data for regulating the loading
capacity of trucks. It has also directed Transport department to keep the records
of trucks carrying bajri to avoid overloading and if found otherwise to take action
as per Motor Vehicle Act and Rules made thereunder. It should not only take
pecuniary action but take stringent action like seizure of the truck. Taking strong
note in the matter of illegal mining the Hon’ble High Court had directed the Police
Department specifically the concerned SHO where illegal mining is reported to
register the case and cause seizure of the mining machine
EIA/EMP report of Sand/Bajri Mine (With ML Area of 4280.0 ha) Tehsil Marwar Jn., District Pali, Rajasthan
EQMS INDIA PVT. LTD. 173
CHAPTER 5. : Analysis of Alternatives
5.1. General
Sand of various gradation (Fine Modulus) is required as one of the ingredients for
preparation of plain as well as re-enforced concrete works besides in preparation of
cement-sand, mortar for masonry as well as plastering works in various civil structures.
Fine sand is also required for cement grouting purposes. Another use of fine sand is in
surface preparation by sand blast. The huge demand of these materials could be either
met through extraction from the natural available materials in shoal deposits of riverbed
quarry site or from crushing of stone aggregate obtained from quarrying operations
involving blasting at Rock in-situ quarries. The latter option involves considerable land
degradation as compared to the former. In case the river bed sand conforms to various
specification requirements of IS 383:1970 for use as fine aggregate in concrete, its
designated use in coarse aggregate for non-wearing and wearing surface in concrete
works, and the riverbed mining presents good options. The study for alternative analysis
involves in-depth examination of site and technology.
5.2. Alternative Sites
5.2.1. Natural River bed
In arid to semi-arid zones of Rajasthan, the rivers flowing in the alluvium (young and old)
predominantly comprises of sand and bajri and are well drained soil consisting of mud, silt
and sand invariably are deposited on the inside bends (convex banks), where the water
flows more slowly and has less power to transport the bed/sedimentary load. Thus, a river
can present numerous sites where the aggradation of sediments takes place and large
shoal deposits are formed. These sites can be used from techno-economic considerations
depending upon the distance (lead) from mine site to the sale point or end point of use.
The mining is thus site specific. In the present case the river/streams/bala which originate
from the Aravali ranges, characterized by arid landscape, barren hills, level rocky
structural plains, rock cut pediments, gravel pavements, shallow colluvium plains and
other sandy plains with thick Alluvium underneath, flow with high sediment and suspended
loads during run-off in response to flash floods. The sinuous path of these rivers is
characterized by presence of shoal deposits at inner curves where the river energy is
reduced. At such river stretches the deposition of river born material takes place. During
high stage the rivers flowing in high gradient upper reaches generally developed, velocities
exceeding 2m / second. In such reaches of the river the competency of the river is very
high and increase with the square of its velocity. The ephemeral rivers which flow through
soils of Semi-Arid Transitional Plain, transport enormous quantities of sediments and act
as a good repository of sand. The riverbed mining is thus a site specific project incumbent
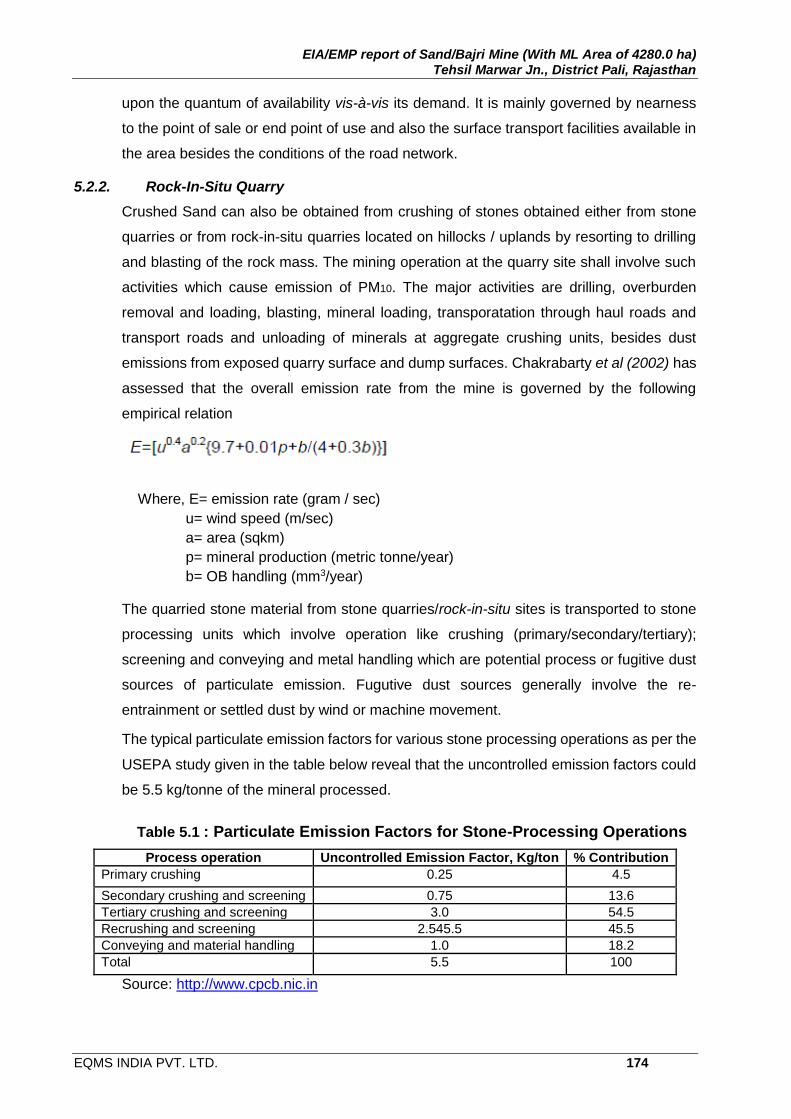
EIA/EMP report of Sand/Bajri Mine (With ML Area of 4280.0 ha) Tehsil Marwar Jn., District Pali, Rajasthan
EQMS INDIA PVT. LTD. 174
upon the quantum of availability vis-à-vis its demand. It is mainly governed by nearness
to the point of sale or end point of use and also the surface transport facilities available in
the area besides the conditions of the road network.
5.2.2. Rock-In-Situ Quarry
Crushed Sand can also be obtained from crushing of stones obtained either from stone
quarries or from rock-in-situ quarries located on hillocks / uplands by resorting to drilling
and blasting of the rock mass. The mining operation at the quarry site shall involve such
activities which cause emission of PM10. The major activities are drilling, overburden
removal and loading, blasting, mineral loading, transporatation through haul roads and
transport roads and unloading of minerals at aggregate crushing units, besides dust
emissions from exposed quarry surface and dump surfaces. Chakrabarty et al (2002) has
assessed that the overall emission rate from the mine is governed by the following
empirical relation
Where, E= emission rate (gram / sec)
u= wind speed (m/sec)
a= area (sqkm)
p= mineral production (metric tonne/year)
b= OB handling (mm3/year)
The quarried stone material from stone quarries/rock-in-situ sites is transported to stone
processing units which involve operation like crushing (primary/secondary/tertiary);
screening and conveying and metal handling which are potential process or fugitive dust
sources of particulate emission. Fugutive dust sources generally involve the re-
entrainment or settled dust by wind or machine movement.
The typical particulate emission factors for various stone processing operations as per the
USEPA study given in the table below reveal that the uncontrolled emission factors could
be 5.5 kg/tonne of the mineral processed.
Table 5.1 : Particulate Emission Factors for Stone-Processing Operations
Process operation Uncontrolled Emission Factor, Kg/ton % Contribution
Primary crushing 0.25 4.5
Secondary crushing and screening 0.75 13.6
Tertiary crushing and screening 3.0 54.5
Recrushing and screening 2.545.5 45.5
Conveying and material handling 1.0 18.2
Total 5.5 100
Source: http://www.cpcb.nic.in

EIA/EMP report of Sand/Bajri Mine (With ML Area of 4280.0 ha) Tehsil Marwar Jn., District Pali, Rajasthan
EQMS INDIA PVT. LTD. 175
The cumulative impact of dust emission at the stone quarry site / rock – In-situ locations
and the stone crushing unit is logically considerably higher as compared to rivebed sand
mining sites. For this reason the latter alternative is the best choice being environmental
friendly. .
5.3. Alternative Technology
The open cast mining in riverbed could be manual/semi-mechanized/mechanized
depending upon the geological and topographical setup of the mineral (ROM) to be won
and the daily/annual targeted production. The project involves open cast mining, in a
maximum depth of 3m from natural surface level of riverbed or ground water table
whichever is met earlier that is less, without blasting.
5.3.1. Manual Method of Mining
The opencast mining process for extraction of sand and bajri primarily involves scooping
the mineral through use of implements like spade, pickaxe, shovel and crowbar etc. The
sand shall be separated from bajri by sieve screening at mine site. The loading of mineral
is also done manually at the river bed site and transported by truck/ tipper (9.0 to 10.2
metric tonnes), tractor trolley small (3 metric tonnes), tractor trolley big (6 metric tonnes)
to the point of sale or end use. The method is mainly labour oriented and is suitable where
the mining depth is stipulated within 1 to 1.5m depth from the natural surface from pit slope
stability point of view. The method can be resorted to where the targeted production is not
substantial and can be adopted where the daily production is of the order of a few hundred
cubic meter say 200 cum to 300 cum/day. Due to high manual component for excavation
as well as loading / unloading, the method can be advantageously adopted where the
labour is readily available. Due to intervention of large number of work force in the
riverbed, there shall be foreseeable impact on environment like pollution of surface water
quality, development of unhygienic conditions, biotic pressure on nearby protected forest,
besides conflict with the local community. This method of mining is most suited in states
where the provision under Minor Mineral (Concession) Rules put an embargo on
mechanical mining through excavator and other earth moving machineries in river or
stream bed by the lease holder or permit holder or contractor as the case may be. The
method is tailor-made for small leases held by lessees / licensees / permit holders and
cluster of small leases after formation of association. In such case the implementation of
common issues of environmental management plans in cluster shall be manageable as
the responsibility for the implementation of the EMP vests with the Association.
5.3.2. Semi-Mechanized Method of Mining
In contrast to the conventional manual method, the mining by deploying mechanical
excavator including any other earth moving machines like J.C.B, Bulldozer, Pocklain,

EIA/EMP report of Sand/Bajri Mine (With ML Area of 4280.0 ha) Tehsil Marwar Jn., District Pali, Rajasthan
EQMS INDIA PVT. LTD. 176
Loaders etc. in river or stream bed by the lease holder or permit holder or contractor as
the case may be, is highly efficient and continuous process to win exorbitantly high daily /
annual targeted production in a scientific and safe manner in accordance with the
approved mining plan. The approved mining plan also permits the use of earthmovers and
loaders in riverbeds. The Rules 37L (3) of Chapter IV A of RMMCR, 1986 amended upto
2012 also states that in order to ensure optimum production with minimum waste
generation, every lease / license / short–term permit holder shall endeavour to deploy
machinery and equipment as per mining plan. Thus use of mining machinery is not
prohibited under the RMMCR. Besides this the approved mine plan also entails semi –
mechanized method of mining and speaks about the extent of mechanization to be
followed for mining.
The targeted annual production as per approved mining plan is 1.12 million metric tonne
which corresponds to 4000 metric tonne / day by mining in 3m deep and 20m wide
benches. If this daily production is to be achieved by manually then 950 labours shall be
needed for excavation @ 3 cum/day/labour which is equivalent to 4.2 tonne/day/labour.
Besides this approximately 800 labours will be required at mine site for loading the mineral
into the trucks.

EIA/EMP report of Sand/Bajri Mine (With ML Area of 4280.0 ha) Tehsil Marwar Jn., District Pali, Rajasthan
EQMS INDIA PVT. LTD. 177
CHAPTER 6. : Environmental Monitoring Programme
6.1. General
The monitoring and evaluation of environmental parameters indicates potential changes
occurring in the environment, which paves way for implementation of rectifying measures
wherever required to maintain the status of the natural environment. Evaluation is also a
very effective tool to judge the effectiveness or deficiency of the measures adopted and
provides insight for future corrections.
The main objective of environmental monitoring is to ensure that the obtaining results in
respect of environmental attributes and prevailing conditions during construction and
operation stage are in conformity with the prediction during the planning stage. In case of
substantial deviation from the earlier prediction of results to identify the cause and suggest
remedial measures. Environmental monitoring is also mandatory to meet compliance of
statutory provisions under the Environment (Protection) Rules, 1986, relevant conditions
regarding monitoring covered under EC orders issued by the MoEF as well as the
conditions set forth under the order issued by Rajasthan State Pollution Control Board
while granting CTE/CTO.
6.2. Areas of concern
In case of river bed mining projects, the changes relating to water, aquatic biota, air, noise,
biodiversity of the area, stability of river bank slopes, river hydraulics and plantation
programme need special attention, from monitoring point of view, during the conceptual
mine plan period to judge the efficiency of measures implemented for conservation of
environment.
6.3. Environmental Monitoring
The overall impact assessment of the proposed project was carried out and monitoring
plans have been framed based on the severity of impacts in different areas. During the
EIA study, it has been observed that the Ambient Air Quality and Noise, Water Quality are
going to be affected marginally though temporary. The preventive/ curative measures to
reduce the ill effects of construction activities on these parameters have been suggested
under various plans. A holistic approach has been adapted for monitoring of air, noise and
water related factors under different heads with suitable financial provisions for their
implementation.
6.4. Environmental Monitoring Programme
All the environmental parameters viz. air, water, noise, soil will be monitored regularly in
order to detect any changes from the baseline status. Environmental Monitoring program
will be followed till the mining operations ceases.

EIA/EMP report of Sand/Bajri Mine (With ML Area of 4280.0 ha) Tehsil Marwar Jn., District Pali, Rajasthan
EQMS INDIA PVT. LTD. 178
6.4.1. Air Quality Monitoring and Management:
Three locations one each in core zone (where the maximum mining is envisaged) and two
each in buffer zone preferably at such intersection of the roads through which the
increased vehicular traffic due to transportation of mined out material is stipulated to pass
en-route in the tehsil will be monitored for four weeks in every season except monsoon.
The 24 hr. monitoring shall be done in respect of PM10, SO2 and NOx. It will be mandatory
on the part of the project proponent (lessee) that they use the required equipment for
monitoring gaseous pollutants in and around the project and periodically put into their
website, accessible for public domain the results of Ambient Air Quality monitored besides
providing the static information regarding mine lease area , production, lease duration.
The information will also be made available on display board affixed at a conspicuous
place in their site office. In addition the lessee will submit a detailed report every fortnight
to the statutory bodies / authorities for evaluation and monitoring purposes. Any abnormal
rise will be investigated to identify the causes and appropriate action will be initiated. The
air quality in and around the project area can be improved by adopting following practices/
methods. (Table 6.1)
Table 6.1 : Air Quality Monitoring and Management
Potential Impact
Action Parameters for
Monitoring Timing
Air Emissions
All mining and transportation equipment are operated as per specified design parameters of the manufacturers. To keep gas emissions from the vehicles within the prescribed limit, proper tuning of engine should be ensured and periodically checked.
Random checks of log book of equipment and follow-up action as per manufactures manual.
At the commissioning of mining operations.
Vehicle trips to be controlled as per mining plan. Either hooded trucks or covered with tarpaulin or polyethylene sheet
Vehicle logs are to be maintained regularly. The overloading of vehicles to be prevented by properly adjusting the weighing machine to display the true weight (tare and loaded).
During site clearing, transportation of minerals
The top soil mainly consisting silt / clay as crust material in the riverbed must be removed 2 to 3 days before the pit mining in the area earmarked is taken up. The top soil shall be scrapped, collected and stacked systematically on the upper terraces where plantation is to be carried out as per approved mine plan.
Absence of heaps / stockpiles of top soil
During site clearing as per progressive mine plan

EIA/EMP report of Sand/Bajri Mine (With ML Area of 4280.0 ha) Tehsil Marwar Jn., District Pali, Rajasthan
EQMS INDIA PVT. LTD. 179
Potential Impact
Action Parameters for
Monitoring Timing
Periodical grading and maintenance of haul roads so as to facilitate smooth movement of vehicles and minimizing the incidence of spillage of sand bajri.
Depressions and furrows created on the surface profile of the road due to continuous movement of the vehicles.
During entire operation period of mine
Regular water spraying shall be done on haul roads through moving sprinklers, besides water spray on top surface of the area to be mined on daily basis subject to site requirements.
Quantity of water requirement shall be monitored from daily water utilization register as well as from water consumption statement.
During entire operation period of mine
Ambient air quality within mine lease area and other locations of the proposed unit to be monitored.
The ambient air quality will conform to the standards for PM10, SO2 and NOx
As per RSPCB requirement.
6.4.2. Ambient Noise Levels Monitoring and Management:
Noise levels in the working area will be monitored once in every season till the continuation
of mining operations. Ambient noise levels will also be monitored once in a season at one
site in the core area zone (where the maximum mining is envisaged) and two each in
buffer zone preferably at such intersection of the roads through which the increased
vehicular traffic due to transportation of mined out material is stipulated to pass en-route
in the tehsil will be monitored for four weeks in every season except monsoon to evaluate
the noise status and its effects on the surrounding community. Due to use of excavators
and loaders the level of noise will definitely rise above threshold level at the place in the
riverbed where the machines are in operation. But this increase in noise level will not be
continuous and shall be governed by the breakup of cycle of operation of the machine
which includes idle time also. Therefore, it would be most appropriate if following
measures are rigorously applied during construction phase of the project. (Table 6.2)
Table 6.2 : Noise Level Monitoring and management
Potential
Impact
Action Parameters for Monitoring
Timing
Noise Inventory of all noise generating mining machinery onsite along with the information of the running hours corresponding to useful life of machinery to be prepared. All equipment under deployment must be maintained in good condition.
Equipment logs, noise reading
During entire mining operation.
Generation of noise due to transport vehicles
Maintenance records of vehicles
During trans-portation.

EIA/EMP report of Sand/Bajri Mine (With ML Area of 4280.0 ha) Tehsil Marwar Jn., District Pali, Rajasthan
EQMS INDIA PVT. LTD. 180
Potential
Impact
Action Parameters for Monitoring
Timing
Implement good working practices (equipment selection and siting) to minimize noise and also reduce its impacts on human health (ear muffs, safe distances and enclosures).
Site working practices records,
During entire mining operation.
The Noise level should not exceed the permissible limit both during day and night times.
Noise level monitoring As per RSPCB re-quirement or quarterly whichever is lesser.
All mining and transportation equipment are operated as per specified design parameters of the manufacturers. Proper maintenance of vehicles and their silencers to minimize noise levels
Random checks of log book of equipment and follow-up action as per manufactures manual.
At the commissioning of mining operations.
Vehicle trips to be controlled as per mining plan. Either hooded trucks or covered with tarpaulin or polyethylene sheet. Minimum use of horns in the village area. Phasing out of old trucks who have outlived their useful life.
Vehicle logs are to be maintained regularly. The overloading of vehicles to be prevented by properly adjusting the weighing machine to display the true weight (tare and loaded).
During site clearing, transportation of minerals
Plantation of trees on the upper terrace of the delineated reach of the river where the mining activity have to be carried out including the avenue plantation along haul roads to attenuate the noise level.
Green development programme in the approved mining plan
During entire period of the mining operation.
6.4.3. Water Quality Monitoring and Management:
Water is one of most precious natural resources. Human beings are highly dependent on
water for various purposes such as domestic needs, sanitation irrigation, industry, and
disposal of wastes etc. The terrestrial and aquatic fauna also depend upon the water. The
mining activity in riverbed will lead to increase in siltation though to a lesser degree.
Further, due to congregation of labourers during the operation phase, open air defecating
in the river bed section cannot be ruled out completely, if proper sanitation facilities are
not provided to them. The rivers flowing in the area are ephemeral and flow during
monsoon only, thus the probable water pollutants which may cause pollution during are:-
Suspended solids
Biodegradable organic matters
Pathogens and vectors
Dissolved inorganic solids

EIA/EMP report of Sand/Bajri Mine (With ML Area of 4280.0 ha) Tehsil Marwar Jn., District Pali, Rajasthan
EQMS INDIA PVT. LTD. 181
The riverbed mining in 3m depth will have an impact on ground water level for monitoring
of which the quality of the ground water shall have to be monitored in each quarter of the
year besides observation of ground water levels during pre-monsoon (May) and post
monsoon (November) every year at selected wells site. Besides this the surface water
quality shall be monitored by taking samples from core area (where the maximum mining
is envisaged) u/s of the lease area and also from two places at buffer zone preferably from
medium dam on main rivers to ascertain the surface water quality. The Bureau of Indian
Standards has prescribed clear cut guidelines for the maintenance of surface water quality
standards (IS:2296-1982). The physico-chemical characteristics of the ground water
should be compared with the drinking water specification as per IS:10500. The water
quality parameters to be monitored quarterly are shown in Table 6.3.
Table 6.3 : Physico-chemical and bacteriological parameters to be monitored
S. No. Parameter S. No. Parameter
1 pH 12 Fluorides
2 Electrical Conductivity 13 Iron
3 Turbidity 14 DO
4 Water Temperature 15 Phosphates
5 TSS 16 BOD
6 TDS 17 COD
7 Total hardness 18 Alkalinity
8 Magnesium 19 Chlorides
9 Calcium 20 Oil and Grease
10 Nitrates 21 Total Coliform
11 Sulphates 22 E-Coli
6.4.4. Soil Quality Assessment:
Soil samples will be collected from one site each at core and buffer zone and quality will
be checked once every except monsoon in order to see any positive or negative impacts
of the operations. Soil samples will be collected from the plantation areas within the ML
area in order to observe the improvement or deficiencies in the soil fertility and to take
corrective actions. The soil analysis shall be carried out for the physico chemical
characteristics like pH, electrical conductivity, organic carbon and status of macro –
nutrients like Nitrogen, Phosphate, Potassium and micro – nutrients like zinc, iron, boron,
etc.
6.4.5. Plantation
Plantation before the onset of monsoon season will be done progressively until the final
closure of the mine. An environment management group will carry out the monitoring as
per schedule durations and parameters mentioned in Table 6.4.

EIA/EMP report of Sand/Bajri Mine (With ML Area of 4280.0 ha) Tehsil Marwar Jn., District Pali, Rajasthan
EQMS INDIA PVT. LTD. 182
6.4.6. Monitoring of erosion and stability of river bank
The project proponent shall closely monitor the condition of the bank of the river/khad with
in the mine lease area, one time each before monsoon and post monsoon. Based on the
observation, the corrective measures in the form of retaining wall / gabion structure shall
be provided at the affected banks at the toe, to control the land slips/bank erosion.
6.5. Environment Management Group
For implementation of Environment Management Plan, a small unit called Environment
Management Group will be formed under the control of the Environment Engineer. The
job of this cell will be:
Implementation of pollution control measure.
Monitoring programme implementation.
Post-plantation care.
To estimate the efficiency of pollution control measures taken.
To bring out any other unforeseen effect on environment not covered under report.
Seeking expert’s advice when needed.
The task of monitoring of various environmental parameters could be assigned to State
Pollution Control Board or any other agency approved by MoEF / SPCB. However, the
project proponent shall procure a few field instruments like RDS, Noise level meter, Water
testing kit.
6.6. Environment Policy/Violations of Environment Norms/ Hierarchal System
6.6.1. Environment Policy
The project proponent (LOI Holder) is a firm which has a laid down environmental policy
of its own and in furtherance of their business philosophy are committed to maintaining a
clean and sustainable environment with concerted efforts towards improvement of
environment performance in routine business. The firm shall strictly adhere to the central
and the state rules and acts in context to the environment protection. The project
proponent (would be lessee) shall comply with the environmental norms and conditions
set forth in the main Environmental Clearance of the project and shall submit compliance
to the MoEF periodically as warranted under the EC letter. The environment policy is
enclosed as Annexure-V (A).
6.6.2. Infringement / deviation of the environment or forest norms/conditions
The project proponent shall comply with the environmental norms set out by the Centre /
State Government, which are being closely monitored by the MoEF, New Delhi and the
State Pollution Control Board, Rajasthan, Forest Department. IPHD and Department of

EIA/EMP report of Sand/Bajri Mine (With ML Area of 4280.0 ha) Tehsil Marwar Jn., District Pali, Rajasthan
EQMS INDIA PVT. LTD. 183
Mines and Geology, Rajasthan. Any infringement / deviation / violation of the rules
contained in various environment and other rules and acts such as Rajasthan State
Environmental Policy, 2010, Rajasthan State Water Policy, 2010, Rajasthan State Forest
Policy, 2010, Wildlife Protection Act, 1972, Air (Prevention and Control of Pollution) Act,
1981, 1987, Noise Pollution (Regulation & Control) Rule 2000 and the Rajasthan Minor
Mineral Concession Rules, 1986 (amended up to 19 June, 2012), if and whenever brought
to the notice of the lessee, the same shall be addressed by him in the light of the expressed
non-compliance reporting system, Annexure V (B). As a safeguard a well-documented
Environment monitoring plan has been formulated.
6.6.3. Hierarchical System of the Company
The organizational structure of the firm belonging to the project proponent is annexed as
Annexure- V (C). The firm is headed by the Project Proponent (would be lessee) duly
assisted by the Manager Mines & Environment shall act as project head. The mines
manager is responsible for execution of works and enforcement of environmental
laws/norms in respect of the project and is supported a Foreman who are responsible for
direct execution of work and planning through Supervisors and Assistant Supervisors
working at different locations. The environmental issues and compliance of the EC
conditions shall be looked into by the Manager (Mines & Environment).
6.7. Cost of Environment Monitoring Plan
The cost in respect of monitoring of environmental attributes, parameter to be monitored,
sampling/monitoring locations with frequency and cost provision against each is shown in
Table 6.4. The total cost of environmental plan works out to Rs. 15.0 lac.
Table 6.4 : Summary of Environmental Monitoring Programme
S.
No.
Aspect Parameters to
be monitored
Frequency Location Cost
Estimates
(Rs. lac)
Implementing and
Pursuing Agency
1 Air Quality
monitoring
SO2, NO
X, CO,
PM10
Four weeks in
one season
except monsoon
3 locations as
already specified 10.0
Rajasthan State Pollution
Control Board or any
approved agency of MOEF
2 Noise Quality
Monitoring
Noise level Once quarterly
except monsoon
3 locations as
already specified 1.5
Rajasthan State Pollution
Control Board or any
approved agency of MOEF
3 Water quality
Monitoring
All parameters
given in water
quality
Once quarterly
except monsoon
3 locations as
already specified 2.5
Rajasthan State Pollution
Control Board or any
approved agency of MOEF

EIA/EMP report of Sand/Bajri Mine (With ML Area of 4280.0 ha) Tehsil Marwar Jn., District Pali, Rajasthan
EQMS INDIA PVT. LTD. 184
4 Soil Parameters
given under soil
monitoring
Once yearly
except monsoon
3 locations as
already specified 0.5
Rajasthan State Pollution
Control Board or any
approved agency of MOEF
5. Plantation Plants and
shrubs in the
green belt area
and there
mortality status
At the time of
plantation before
monsoon and
quarterly
thereafter
Green belt area
within the mine
lease area, haul
roads
- Project Proponent as
routine inspection
6. Erosion and
Bank Stability
Conditions of
vulnerable banks
and of check
dam /spurs
Before monsoon
and post
monsoon every
year
Lease area - Project Proponent as
routine inspection
7. Celebration
of
Environment
Day
Yearly At Tehsil 0.5 Project Proponent
15.00
EIA/EMP report of Sand/Bajri Mine (With ML Area of 4280.0 ha) Tehsil Marwar Jn., District Pali, Rajasthan
EQMS INDIA PVT. LTD. 185
CHAPTER 7. : Additional Studies
7.1. General
After having gone through the various aspects of the river bed mining at the proposed
site and the related documents like Form–I and PFR, the MoEF in its 22nd meeting,
held on 26.9.2013, set out the scoping clearance and issued ToR with additional ToR
proposed for environmental impact assessment studies and preparation of
environmental management plan for river bed mining and for submission of report after
Public Hearing. The Terms of Reference issued by the MoEF is very comprehensive
and subjective covering every aspects of mining activities and the related
environmental issues to be addressed.
7.2. Replenishment Studies
7.2.1. Sediment Yield From Watershed
The rate of gross or absolute silt production (erosion) in the watershed and the ability
of the stream system to transport the eroded material in a river and then to a reservoir
has the direct relation with the quantity of sediment delivered into a reservoir. The rate
of gross erosion is dependent upon many physical factors live climatic conditions,
nature of soil, slope of the area, topography and the land use. Hydro-physical
conditions of the watershed govern the capability of transporting the eroded material.
It has been observed that the average rate of sediment production decreases as the
size of drainage area increase and the larger watershed the lesser is the variation
between the rates. The larger watershed presents more opportunity for deposition of
silt during its traverse from the point of production. The watershed with maximum land
use class of forest generate very low rate of production unless the forest are degraded
or open forest. The cultivated watersheds with unscientific farming produce very high
rate of silt production. The total amount of eroded material, which reaches a particular
hydraulic control point, is termed as sediment yield. The sediment control of inflow is
governed by Character of run-off; Susceptibility of soils; The extent and density of
vegetative cover in the area; and The hydraulic efficiency of the drainage system.
The sediment load comprises of bed load as well as suspended load, the former being
the eroded material kept in motion in the bottom layers of the flow due to rolling, sliding
and hopping, while the latter being the smaller size particles in saltation being thrown
in suspension by the upward component of the turbulent velocity of flow. When the
tractive force exceeds the frictional resistance between sand particles the latter are set
in motion. The resistance to sediment to motion is directly proportional to the diameter
of sediments ‘d’ and the specific weight of sediments in water (G-1), where ‘G’ is the
specific gravity of sediments. The equation of critical tractive forces is:-
EIA/EMP report of Sand/Bajri Mine (With ML Area of 4280.0 ha) Tehsil Marwar Jn., District Pali, Rajasthan
EQMS INDIA PVT. LTD. 186
c = 0.078d
where, ‘d’ is in mm and c is in kg/sqm
7.2.2. Estimation of Sedimentation Rate
The scientific survey for determination of soil erosion rate from catchment and
deposition rate in reservoirs have been frequently and widely conducted in past in India
and in other countries. Sedimentation rate on the basis of actual measurement have
been arrived for different perennial rivers by stream sampling of sediment load
including bed load. Surveys of some of the existing reservoirs was carried out to assess
the actual silting experienced by them over long period after impoundment. Thus the
fundamental method for estimation of sediment is on the basis of actual measurements
carried out in the basin.
7.2.2.1 Sedimentation rate on the basis of actual measurement
Sediment sampling over a substantially long period is a suitable and logical method of
obtaining information of sediment load being carried out by a stream. No sediment load
observation have been made in the case of any of the rivers flowing the district/Tehsil
as the rivers are seasonal and flow during monsoon alone and that the study period
was post monsoon and thus there was no flow in the river. The study of soil erosion
and sediment yield in the Indian Arid Zone was conducted by Central Arid Zone
Research Institute, Jodhpur (CARZI).
The arid zone of India has been subdivided into three zones. The Zone – I (42900
sq.km) is a humid region and has more dependable irrigation system through perennial
rivers. It comprises of part of Punjab and Haryana and is irrigated by Abohar and
Bhatinda branch system. Zone-II (148600 sq.km) comprises of sandy plain, interdune
plains, sand dunes and isolated hillocks. It covers Ganganagar, Bikaner, Jodhpur,
Jaisalmer, Barmer, Churu, Jhunjunu, Sikar and Nagor district in Rajasthan. Zone – III
represents the sloping region with intergrated drainage network of ephemeral river
channel. In Rajasthan it extends over Pali, Jalore and Sirohi districts. The hydrological
zones of arid region of India is shown in Figure 7.1.

EIA/EMP report of Sand/Bajri Mine (With ML Area of 4280.0 ha) Tehsil Marwar Jn., District Pali, Rajasthan
EQMS INDIA PVT. LTD. 187
Churu
JhunjhunuSikar
Bikaner
RAJASTHANJaisalmer
NagaurZONE II
IndiraG
andhi
Can
al
GanganagarSirsa
Jind
Hisar
Bhiwani
HARYANA
PUNJABAbohar
Bhatinda.
Sangrur
Kot
la B
r.
Bhatinda.
Z
O
N
EI
Br.
Br.
Jodhpur
Barmer
Jalore
Luni R
iver ZONE III
ZONE II
GUJARAT
ZONE III LittleRann of Kuchh
Surenaranagar
ZONE III
Bhuj
ARABIANSEA
50 0 100 200 kms
22°
24°
26°
28°
30°
68° 70° 72° 74° 76°
68° 70° 72° 74° 76°
ZONE -I Region with Major Inputs from more Humid Regions
ZONE -II Plainlands with primitive/ nostream network
ZONE -III Sloping Region with integratedstream network
26°
28°
30°
22°
24°
Scale
N
Bikaner
Great Rann of Kuchh
Figure 7.1 : Hydrological Zones of Arid Region of India
The approach of the study was to collect information on the spatial variation of stream
discharges and the sediment yield for 34 Gauge and Discharge site (G& D) in the zone
on various tributaries of the Luni River. The discharge rate for run-off and the sediment
concentration for 16 years was analyzed for computation of sediment yield. Wide
variation in the magnitude of annual sediment yield was observed for different
physiographic reasons. The results plotted in figure shows skewed frequency
distribution. The annual sediment yield results thus obtained are shown in Table 7.1
and the relationship developed between sediment yield and effective rainfall is depicted
in Figure 7.2. The relationship developed is Es=3.68ER0.99, where ER is effective
rainfall (mm) and Es is sediment yield. The annual sediment yields from the other
physiographic reasons are in agreement with mean rates reported from the arid regions
of Australia, Tanzania and USA (Jones, 1981) under similar rainfall conditions.

EIA/EMP report of Sand/Bajri Mine (With ML Area of 4280.0 ha) Tehsil Marwar Jn., District Pali, Rajasthan
EQMS INDIA PVT. LTD. 188
Table 7.1 : Annual Sediment Yield in Indian Arid Zones
Physiographic Region Average sediment yield No. of
Observations m3/ha/year Ham/sq.km/year
Sandy Plain 3.4 0.034 36
Dune Complex 4.8 0.048 18
Younger Alluvial Plain 2.7 0.027 30
Older Alluvial Plain 18.4 0.184 5
Rocky/Gravelly
Piedmont
14.3 0.143 11
Source: IAHS Publication No. 236, 1996
01
10
100
1000
10000
1 10 100 1000
SE
DIM
EN
T Y
IEL
D,E
s (T
/Sq
km
)
Abohar
EFFECTIVE RAINFALL, ER (mm)
Figure 7.2 : Sediment Yield as a function of effective rainfall
The effective rainfall has been worked out on the basis of monthly evapotranspiration
coefficient and average recent rainfall data for 10 years (2004-13). The computation of
sediment yield of Marwar Jn. tehsil based on the relationship derived for sediment yield
as function of the effective rainfall is shown in Table 7.2.
Table 7.2 : Sediment Yield as a function of Effective rainfall
Month Monthly Average
Rainfall (mm) Period 2004-13
Coefficient of evapotranspiration
as per Penman method
Effective Rainfall ER
(mm)
Sediment Yield in tonne / sq.km
Sediment Yield in cubic
meter / ha
January 0.8 0.6 0.48 1.78 0.007
February 3.4 0.6 2.04 7.45 0.030
March 1.5 0.7 1.05 3.86 0.015
ES =3.68 ER 0.99 (R2 = 0.84,P: 0.01)

EIA/EMP report of Sand/Bajri Mine (With ML Area of 4280.0 ha) Tehsil Marwar Jn., District Pali, Rajasthan
EQMS INDIA PVT. LTD. 189
April 5.3 0.7 3.71 13.47 0.054
May 9.9 0.8 7.92 28.55 0.114
June 29.1 0.8 23.28 83.02 0.332
July 136.1 0.8 108.88 382.32 1.529
August 169.2 0.8 135.336 474.18 1.897
September 70.5 0.7 49.357 174.69 0.699
October 5.9 0.7 4.13 14.98 0.060
November 18.7 0.6 11.19 40.20 0.161
December 0.3 0.6 0.18 0.67 0.003
Total 450.6 8.4 347.553 1225.18 4.90
7.2.2.2 Empirical Relation
Sediment load remains ungauged for majority of streams for want of setup of GDS
sites (Gauge, Discharge and Sediment) in non-classified river basins. Many empirical
relations have been evolved for determination of offsite deposition of eroded soil and
sediment yield on the basis of analysis of data from different catchments of varying
catchment area. The sediment yield has been worked out on the basis of some of such
equations as applicable for Indian conditions and
a) Dr. A.N. Khosla’s Findings :
y = 0.036 million cubic meter / 100 sq.km of catchment
= 3.60 cubic meter/ha
Recent studies carried out in some of the Indian reservoirs suggest that actual silting
observed in them is higher than what was postulated in Dr. Khosla’s Findings. The
enveloping curve developed by Dr. Khosla had only five points pertaining to data of
Indian reservoir while the remaining 33 points related to the reservoirs of other
countries. The sediment rate of 3.60 cubic meter / ha is 26.5% less than 4.90 cubic
meter / ha as actually assessed on the basis of relationship developed between
sediment yield effective rainfall by CARZI Jodhpur on the basis of actual observation
of stream discharges and sediment yield in the zone of various tributaries of Luni river.
b) Dr. D.V. Joglekar Enveloping Curve
y=0.597/A0.24 where
y= annual silting rate in million cubic meter per 100 sq. km.
A= Catchment area in sq. km.
For 1sq km catchment area the value of y
y = 0.597/10.24 = 0.597 million cubic meter / 100 sq km
= 5.97 cubic meter/ ha

EIA/EMP report of Sand/Bajri Mine (With ML Area of 4280.0 ha) Tehsil Marwar Jn., District Pali, Rajasthan
EQMS INDIA PVT. LTD. 190
The sediment rate of 5.97 cubic meter / ha is 21.8 % more than 4.90 cubic meter /
ha as actually assessed by CARZI Jodhpur on the basis of actual observation of
stream discharges and sediment yield in the zone of various tributaries of Luni river.
c) Dr. R.S. Varshney’s Regional Enveloping Curves for Northern Indian River
For plain rivers with catchment upto 1000 sq.km.
y=0.392/A0.202
where,
y= annual silting rate in million cubic meter per 100 sq. km.
A= Catchment area in sq. km.
For 1sq km catchment area the value of y
y = 0.392/10.202 = 0.392 million cubic meter / 100 sq. km
= 3.92 cubic meter/ ha
The sediment rate of 3.92 cubic meter / ha is 20% less than 4.90 cubic meter / ha
as actually assessed by CARZI Jodhpur on the basis of actual observation of
stream discharges and sediment yield in the zone of various tributaries of Luni river.
d) Garde and Kothyari
The author have analysed data from 50 catchment with an area ranging from 43
sq. km to 81880 sq. km and evolved the following equation for meet annual
sediment yield.
Sam = CP0.6 Fe1.7 S0.25 Dd0.1 (P max/P)0.19
Where,
Sam = mean annual sediment yield in cum
C = A co-efficient depending on the geographical location of the catchment
P = Average annual rainfall in cm
S = Land slope
Dd = Drainage density in km/ sq.km.
P max = Average maximum monthly rainfall
A = Catchment Area in sq.km.
Fe = Erosion Factor defined as under
Fe = (0.8 FA + 0.6 FG +0.3 FF + 0.1 Fw) /A
Where,
FA = area of available land in catchment
FG = area occupied by grass and scrub
FF = area of forest land
FW = area of waste land

EIA/EMP report of Sand/Bajri Mine (With ML Area of 4280.0 ha) Tehsil Marwar Jn., District Pali, Rajasthan
EQMS INDIA PVT. LTD. 191
On the basis of analysis of 154 catchment in India Garde and Kothyari produced
an ISO-Erosion Rate Map of India (Figure 7.1). In the absence of any other
information the erosion rates in tonne / sq. km / yr, for planning purposes, can be
obtained by using the map. As per the map the study area lies between contours
of 350 tonne / sq.km / yr and 1000 tonne / sq. km. / yr erosion rate but it is close to
the latter. In any case the average value of 675 tonne / sq.km. or 4.82 cubic meter
/ ha can be conservatively adopted.
Figure 7.3 : Iso-Erodent Map of India after Kothyari
e) Dandy Bolten Study
Dandy and Bolton studied sedimentation data from about 1500 reservoirs, ponds,
and sediment detention basins with drainage areas between 1 to 30,000 sq.mile
and found that the annual sediment yield per unit area was inversely related to the
0.16 power of the drainage area:

EIA/EMP report of Sand/Bajri Mine (With ML Area of 4280.0 ha) Tehsil Marwar Jn., District Pali, Rajasthan
EQMS INDIA PVT. LTD. 192
Where, S = Sediment yield in tons per square mile per year; SR = Reference sediment yield of 1645 tonne/year corresponding to a 1 sq. mile
drainage area, A = Drainage area in square miles AR = Reference drainage area in square mile Dandy and Bolton also analysed sedimentation and mean annual runoff data from
505 reservoirs and inferred that annual sediment yield per unit area was increases
sharply as mean annual runoff Q increases from 0 to 2 inches and thereafter, it
decreased exponentially. This led to the following equations.
For Q<2 inches For Q >2 inches Where, QR = reference mean annual runoff QR = 2 inches Dandy and Bolton combined Eqs. 1 and 2 into a set of equations to express
sediment yield in terms of drainage area and mean annual runoff.
Putting values of SR = 1645 tons/mi2/y, QR = 2 inches, and AR = 1 sq.mile, Eq. 3 and
4 reduces to the followings set of equations:
For Q <2 in.: S = 1280 Q0.46(1.43 – 0.26 log A) For Q >2 in.: S = 1965e
-0.055Q(1.43 – 0.26 log A) In several cases, local factors such as soils, geology, topography, land use, and
vegetation may have greater bearing on sediment yield than either mean annual
runoff or drainage area. Nevertheless, these equations provide a first
approximation to be regional assessment of sediment yield for watershed planning
purposes. Equations 5 and 6 are based on average values of grouped data;
therefore, they should be used with caution. Besides Dandy & Bolton themselves
has category stated that use of the equation to predict sediment yield for a specific
For Q <2 in.:
For Q > 2 in.:
- - - - - Eq. 1
- - - - - Eq. 2
- - - - - Eq. 3
- - - - - Eq. 4
- - - - - Eq. 5
- - - - - Eq. 6

EIA/EMP report of Sand/Bajri Mine (With ML Area of 4280.0 ha) Tehsil Marwar Jn., District Pali, Rajasthan
EQMS INDIA PVT. LTD. 193
location would be unwise because of the wide variability caused by local factors
not considered in the equation development. Actual sediment yield form individual
drainage basins may vary 10-fold or even 100-fold from computed yields.
In the present case for effective catchment of 550 sq.km and the mean annual
runoff corresponding to monthly average of 450.6 mm for the observed data from
1973 to 2012 has been computed as under.
Estimation of mean annual runoff on the basis of empirical relation as applicable to
the study area falling in Rajasthan.
R = (P-175)/2500 X P = 37.3 mm Since the mean annual runoff is less than 2 inches, Eq. 5 shall be adopted for
working the sediment yield.
S = 1280 Q0.46(1.43 – 0.26 log A) = 441.54 metric tonne/km2/yr or 4.42 metric tonne / ha or 3.16 cubic meter / ha. The annual sediment rate on the basis of Dandy Bolten equation are lower than the
rates arrived on the basis of actually assessed by CARZI Jodhpur on the basis of
actual observation of stream discharges and sediment yield in the zone of various
tributaries of Luni river
7.2.2.3 Conclusion - Annual Sediment Rates to be Adopted
The summary of silt rate on the basis of various methods described is presented in
Table 7.3.
Table 7.3 : Annual Sediment Rates by Various Methods
S. No.
Method Annual Sediment Rate
Cubic meter / ha Tonne / ha
1 Actual Observation of tributaries by CARZI Jodhpur
4.90 6.86
2 Dr. A.N. Khsola’s Findings 3.60 5.04
3 Dr . D.V. Joglekar Enveloping Curve 5.97 8.36
4 Dr. R.S. Varshney’s Enveloping Curve 3.92 5.49
5 Garde and Kothyari 4.82 6.75
6 Dandy Bolten 3.16 4.42
The siltation rate of 4.90 cum/ha is also comparable with the siltation rate of 4.82
cum/ha as deduced from the ISO – Erodent Map of India (Garde and Kothyari)
EIA/EMP report of Sand/Bajri Mine (With ML Area of 4280.0 ha) Tehsil Marwar Jn., District Pali, Rajasthan
EQMS INDIA PVT. LTD. 194
7.2.3. Computation of annual Sedimentation load:
The major drainage flowing through Tehsil Marwar Jn., are Gogi, Lilki and Sukri. These
drainages form part of sub-watershed 6A2C3 and 6A2C4 as per Watershed Atlas of
India and marked in catchment area map (Figure 7.3). Sediment production occurs in
the drainage basin and sediment delivery is limited to major flood flows. When run-off
occurs from severe storms or torrential rainfall flash floods of high magnitude flow in
the drainage system along with large quantities of sediments which are transported
through the rivers and get deposited at depositional or convex banks due to slower
velocity of flow. Thus it is apparent that any sediment particle detached from its original
configuration shall take time to reach the streams for onwards journey. The lower order
streams (1st and 2nd order) generate more sediments due to their higher bed gradient
but it is the higher order streams flowing with large discharge responsible for creating
high tractive force needed for transportation of bed load and suspended sediments.
With rivers flowing through different tehsils / district it is not feasible to confine the
watershed into one tehsil. Depending upon the topography, the area in anyone tehsil
could be the catchment for nearby drain/stream flowing in contiguous tehsil/district.
Besides this the drainage basin in tehsil/district has been harnessed in the form of
reservoir and tanks created across the main rivers and their tributaries the details of
which are provided in Table 7.4. During flood the silt ladden discharge is intercepted
by the structures and is entrapped in thse reservoirs except for the period of outflow
from the dam which is possible only when the inflow into the dam exceeds the reservoir
capacity. In case of smaller weirs/sluice/dams the condition of outflow is invariably
achieved during good monsoon season. But by contrast this situation is none-to-happy
in context of larger dams as in the case of Jawai Dam which has been filled to its FRL
only in 9 years out of 56 years as is evident from Table 7.5. For transportation of the
sediment it is necessary that the rivers flow during monsoon which is possible only in
case of smaller tanks and reservoirs. The pictorial view of prominent dam in tehsil is
shown in Figure 7.3.
Considering the geographical area of the tehsil as the catchment for the river system
draining through and accounting for the intercepted catchment by different reservoirs,
tanks, weir, anicuts, dams, and the effective catchment area is 550 sq.km. The
sediment yield from this portion of catchment @ 1225.18 tonne/sq.km works out to
0.67 million tonne/year. The project envisages annual production of 1.12 million tonne
or 5.6 million tonne in 5 years lease period. Thus the annual extraction exceeds the

EIA/EMP report of Sand/Bajri Mine (With ML Area of 4280.0 ha) Tehsil Marwar Jn., District Pali, Rajasthan
EQMS INDIA PVT. LTD. 195
annual deposition by 0.45 million tonne which implies that the deposition rate is about
40% lower than the annual extraction rate. The mine pits will get replenished provided
there are two to three events of floods in every monsoon. The replenishment takes
place faster during the first flood and thereafter the rate of replenishment decreases.
For safe replenishment of river bed mine pits it is necessary that the mining activities
are carried out in such reaches which are susceptible to deposition like the convex
banks. Since the mineable reserves are 161.49 MMT against which 5.6 MMT can be
safely extracted during the lease period without taking into account the annual
replenishment. The area mined out every year will get replenished after every
consecutive good monsoon season, reckoned from the end of pre-monsoon season of
the year of extraction, provided the free reach of the river receive run-off from three to
four events of flood every monsoon. It is therefore assessed that the mined out area
within 5 years shall be completely replenished after 5 years reckoned from the
cessation of the mining provided every year average annual rainfall during rainy season
(450.6 mm) occurs in the catchment.
Particular / Year 1st 2nd 3rd 4th 5th 6th 7th 8th 9th 10th Total
Annual Production (MMT) 1.12 1.12 1.12 1.12 1.12 0.00 0.00 0.00 0.00 0.00 5.6
Annual Deposition (MMT) 0.00 0.67 0.67 0.67 0.67 0.67 0.67 0.67 0.67 0.67 6.03

EIA/EMP report of Sand/Bajri Mine (With ML Area of 4280.0 ha) Tehsil Marwar Jn., District Pali, Rajasthan
EQMS INDIA PVT. LTD. 196
Figure 7.4 : Pictorial view of Siriyari dam in tehsil Marwar
.

EIA/EMP report of Sand/Bajri Mine (With ML Area of 4280.0 ha) Tehsil Marwar Jn., District Pali, Rajasthan
EQMS INDIA PVT. LTD. 197
Table 7.4 : Tanks under the jurisdiction of Water Resources Department
S.
No
Name of
Dam
River/
Nallah
Nearest
City
Ht.above
lowest
foundation
(M)
Length
of Dam
(M)
Catchment
Area in
Sqkm
Yield
in
Mcft
Gross
storage
capacity
(Mcum)
Live
storage
Capacity
Mcum
Length
of Canal
system in
k.m.
Command Area in
hectares
Type
of Dam
Design
purpose (
Irrigation ,
Water
supply ,
power
generation
etc.)
GCA CCA ICA
1 Sardar
Samand Sukri pali 35.00 9000 2064 2848 88.17 88.17 64.7 13245 10325 8562 Earthen
Irrigation +
Water supply
2 Hemawas sumer pali 12.00 7924.88 1120 1900 62.55 62.55 33.59 9115 8704 6093 Earthen Irrigation +
Water supply
3 Kharda
Kharda
feeder &
local
catchment
pali 7.00 3000 180 240.95 18.8 18.8 17.82 3006 2451 2220 Earthen Irrigation +
Water supply
4 Baniawas Khari pali 6.20 6082 600 1273 8.49 7.84 8.4 1535 1462 899 Earthen Irrigation +
Water supply
5 Giroliya Bandi
Nalla pali 3.65 3960 691 545 4.95 4.2 15.69 2540 2429 1215 Earthen
Irrigation + Water supply
6 Endla Local
Nalla pali 4.70 5400 46 98.71 6.37 6.03 3.60 810 688 607 Earthen
Irrigation +
Water supply
7 Vayad Local
Nalla pali 4.80 3350 800 96.18 1.44 1.44 3.36 368 350 263 Earthen
Irrigation + Water supply
8 Sali ki
Dhani
Local
Nalla pali 4.70 3075 98.7 58.57 1.55 1.33 5.13 384 369 259 Earthen
Irrigation +
Water supply
9 Lordiya
Lordiya
feeder &
local
catchment
pali - 3350 25.8 - 1.23 1.23 0.15 159 138 121 Earthen Irrigation +
Water supply

EIA/EMP report of Sand/Bajri Mine (With ML Area of 4280.0 ha) Tehsil Marwar Jn., District Pali, Rajasthan
EQMS INDIA PVT. LTD. 198
10 Bandi
Nehra
Bandi
Nadi pali 8.75 7200 2693 7.36 6.52 17.65 1456 1452 1162 Earthen Irrigation
11
Bomadara
pick up
weir
Khari &
Sukri pali 1.92 5029 1254 1500 1.27 1.27 Diversion scheme Earthen
Diversion
scheme
12 Juna
malari Local Sadri 10. 50 1915.00 18 61.89 1.750 1.680 3750 450.00 319.00 240.00
Eathen
dam Irrigation
13 Sadri Magai
River Sadri 28.44 349.50 54 22.5 5. 80 5. 23 19529 1382.38 1274.12 930.00
Masonary
dam
Irrigation &
Water supply
14 Kana dam Ghanerao
River Desuri 12.63 1143.00 53 113.5 3. 05 3.040 10710 812.49 667.34 507.00
Eathen
dam Irrigation
15 Muthana Local Desuri 12. 00 1079.00 35 99.55 2.718 2.464 8700 608.38 455.89 367.00 Eathen
dam Irrigation
16 Rajpura Local Desuri 12. 50 558.00 23 81.6 2. 54 2.220 4290 720.00 648.00 350.00 Eathen
dam Irrigation
17 Seli ki nal Local Desuri 13. 80 1708.00 94 414 2.265 1.926 5540 511.11 414.32 343.01 Eathen
dam
Irrigation &
Water supply
18 47.28 Local Desuri 16.11 1630.00 14 47.28 1.338 1.333 4730 315.88 315.88 260.00 Eathen
dam Irrigation
19 Godadhara Local Desuri 10.62 1348.20 31 107 2.378 2.209 2946 492.60 492.60 379.00 Eathen
dam
Irrigation &
Water supply
20 Kesuli Local Bali 10. 70 137.10 77 129 2.420 2.170 2580 587.00 440.00 308.00 Eathen
dam Irrigation
21 Dantiwara Local Bali 10. 00 542.50 31 98 2.770 2.630 6270 797.00 784.00 494.00 Eathen
dam Irrigation
22 Latara Local Bali 21.00 76. 00 20 70.8 1.410 1.301 2490 422.208 419.948 294.00 Masonary
dam Irrigation
23 Kot Dam Local Bali 8.10 3930.00 72 116.87 2.860 2.730 9090 283.00 521.00 469.00 Eathen
dam With
Face wall
Irrigation
24 Dhani Local Falna 8.00 2610.00 14 0.940 0.930 3340 299.00 220.00 135.00 Eathen
dam Irrigation
25 Mithri Mithri
River Bali 15.70 1545.00 77 292.6 8.710 8.310 4570 1996.00 1930.00
1129.0
0 Eathen
dam Irrigation
26 Sewari Local Bali 8.60 111.00 2 6.01 0.203 0.186 450 44.00 44.00 26.00 Eathen
dam Supplimentally Tank of Mithri

EIA/EMP report of Sand/Bajri Mine (With ML Area of 4280.0 ha) Tehsil Marwar Jn., District Pali, Rajasthan
EQMS INDIA PVT. LTD. 199
27 Pipla Local Bali 7.10 159.00 3 10.35 0.364 0.326 240m 130.00 79.00 48.00 Eathen
dam
28 Shivnath
Sagar Local Bali 20.10 82.30 4 50 1.410 1.410 900 522.00 421.00 240.00
Eathen
dam With Face wall
Irrigation
29 Phutia Local Bali 5. 50 4903.
00 2 55.23 1.540 1.370 3480 380.00 348.00 233.00
Eathen dam
Irrigation
30 Raipur
Luni Dam
Raipur
Luni
River
Raipur 18.90 341.50 373 50.97 9.22 7.63 22.81 4168.24 2605.15 1563.0
9 Eathen
dam Irrigation
31
Giri
Nanda
Dam
Lilari
River Raipur 10.67 350.50 102 304 5.66 5.59 11.74 1839.31 1432.60 860.00
Eathen
dam &
Masonary Face wall
Irrigation
32 Babra
Dam
Lilari
River Raipur 11.00 350.00 372 247.17 3.77 3.56 8.49 598.48 537.02 482.87
Eathen
dam Irrigation
33 Rajsagar
Chopra
Tributory
Luni
River
Sojat 4.60 7680.00 113 176.61 8.16 8.04 9.90 2397.00 1670.00 1320.0
0 Eathen
dam Irrigation
34 Malpuria
Kanawas
Local
Nallah Sojat 2.15 1048.00 129 146.35 5.53 5.08 2.72 892.00 877.00 621.00
Eathen
dam Irrigation
35 Gajnai Sukri
River Raipur 10.00 210.00 86 178.14 6.37 6.27 15.62 1418 1255.00 897.00
Eathen
dam
Irrigation/Water
Supply
36 Borinada Local
Nallah Sojat 2.25 4026 70 79 1.72 1.72 2.1
842
336 242 Eathen
dam Irrigation
37 Siriyari Local
Nallah
Marwar
Jn. 7.93 250 39 132.63 4.48 4.13 7.44 805 763 591
Eathen
dam
Irrigation/Water
Supply
38 Kantaliya Local
Nallah
Marwar
Jn. 7 572 81 166.2 5.34 5.18 8.19 838 759 611
Eathen
dam
Irrigation/Water
Supply
39 Phulad Local
Nallah
Marwar
Jn. 8.23 735 49 131.04 3.72 3.49 5.19 879 810 498
Eathen dam
Irrigation/Water Supply

EIA/EMP report of Sand/Bajri Mine (With ML Area of 4280.0 ha) Tehsil Marwar Jn., District Pali, Rajasthan
EQMS INDIA PVT. LTD. 200
40 Jograwas I
& II
Local
Nallah
Marwar
Jn. 2.28 1213 77 120 3.36 3.32 3.66 931 842 486
Eathen dam
Irrigation
41 Chirpatia Local
Nallah
Marwar
Jn. 2.7 4710 47 91.8 2.13 2.05 0 1828 1502 405
Eathen
dam Irrigation
42 Saran Local
Nallah
Marwar
Jn. 3.5 330 18 66.8 1.87 1.7 3.6 524 509 263
Eathen dam
Irrigation
43 Dhani Local
Nallah Bali 5.5 27.3 0.94 0.93 3.3 481 347 274
Eathen
dam Irrigation

EIA/EMP report of Sand/Bajri Mine (With ML Area of 4280.0 ha) Tehsil Marwar Jn., District Pali, Rajasthan
EQMS INDIA PVT. LTD. 201
Table 7.5 : Year wise Maximum gauge Water Received, Water Utilized from Jawai Dam
Year Max. gauge in ft.
Gross Capacity in mcft.
Water reserved in mcft
Water utilized in mcft.
Area of Irrigation in acres
No. of Watering
Irrigation PHED Irrigation PHED Proposed Actual
1956-57 48.45 4496 - 3454
1957-58 34.4 2431 - 1746.82 18815
1958-59 40.05 3141.5 2249.12 23294
1959-60 51.42 5057.7 2361.7 24818
1960-61 45.7 4066 1000 2368.63 638.85 22669
1961-62 48.9 4577 660 2904.17 614.24 24868
1962-63 37.5 2827.5 600 1660.87 595.95 16629
1963-64 31.86 2176.96 830 740.89 863.5 8895
1964-65 36 2638 461 1765.3 457.28 16502
1965-66 32 2180 390 1213.56 338.4 12560
1966-67 29.3 1949.2 520 898.28 264.67 11816
1967-68 57.57 6364.6 3849.21 327.54 32082
1968-69 48.35 4478 1000 2545.13 638.87 22700 27432
1969-70 16.95 1107.25 1107.25 604 1488
1970-71 48.32 4496.6 1000 3464.2 1000 22407 32421
1971-72 32.02 2189.25 900 805.66 766.67 11000 9982
1972-73 19.4 1232 1200 1321 Nil
1973-74 61.05 7273.5 780 3770.66 388.18 43400 46618 4
1974-75 39 3008 2200 156.48 1800 6402 1
1975-76 55.87 6019.36 100 2892.06 418 43400 36112 3
1976-77 53.4 5627 1000 4087.7 1308.8 40000 39552 4
1977-78 41 3265 800 1992.5 800 23124 3
1978-79 54.45 5679 2300 2500.15 1691 29590 24562 4
1979-80 53.8 5519 1250 3625.8 804 43400 46999 4
1980-81 40.8 3239 660 2000 660 1959 19756 20062 2
1981-82 18.6 1190 Full water reserved 1463 6106
1982-83 21.4 1337 Full water reserved 1546 962
1983-84 61 7260 4650 2000 4610 943.5 43500 57032 5
1984-85 41.5 3229.05 470 2200 670 2495.52 28800 19235 1
1985-86 38.75 2977.25 2829 2390.7 325
1986-87 44 3706 1900 1605 1772 1792.34 21400 28018 3
1987-88 9.9 793.5 Full water reserved 978 Nil
1988-89 46.7 4182.5 2000 2174 1997 1515 21990.41 41287 3
1989-90 29.7 1999.6 1989.06 2072 265
1990-91 61.25 7327.5 4350 3021 4312.4 1958 43500 63679 4
1991-92 49 4595 1710 2367 1608 3260 18801.64 35445 3
1992-93 61.25 7327.5 3550 4200 3476 1745 35550 58700 4
1993-94 60.9 7221.5 3500 3700 3462 3232 60160 4
1994-95 61.25 7327.5 4500 3150 3490 2552 59935 4
1995-96 52.75 5288 2800 2500 2800 2583 42000 24009 3

EIA/EMP report of Sand/Bajri Mine (With ML Area of 4280.0 ha) Tehsil Marwar Jn., District Pali, Rajasthan
EQMS INDIA PVT. LTD. 202
1996-97 42.2 3418.2 650 2652 635 2250 30000 58246 1
1997-98 57 6278 4200 2142 3500 2255 50500 4
1998-99 26.6 1726 Nil Full water reserved 1761
1999-00 5.8 657.26 Nil Full water reserved 664.04
00-2001 42.3 3230.3 800 2727.95 709.5 2728 32000 18252.27 1
2001-02 45.3 3880 2050 1830 2125 1755 24600 55714 3
2002-03 11.65 838
838
800 Full reserved for
PHED
2003-04 40.1 2765.07 900 1976 825 14447 15410 2
2004-05 27.5 1800 Full reserved for PHED
2005-06 43.4 3591.4 1800 2263 1800 2263 21600 34471 3
2006-07 61.25 7327.5 5200 2363 4621 932.35 43500 66076 4
2007-08 60.75 7195 5112.5 2050 4783 2182.54 42420 66493 4
2008-09 24 1505 Full reserved for PHED
2009-10 25 Full reserved for PHED
2010-11 50.15 5907.63 3425 2482.63 3255.03 2352.6 41100 59431 4
2011-12 6082 3500 2250 42000 4
7.3. Risk Assessment
The mining activities involve certain types of hazards, during operation and close, which
can disrupt normal activities abruptly and lead to disaster like fires, inundation, failure of
machinery, explosion, to name a few. The impending dangers or risks, which need be
investigated addressed, disaster management plan formulated with an aim to taking
precautionary steps to avert disaster and to take such action after the disaster, which limits
the damage to the minimum.
Nevertheless, the following natural/industrial problem may be encountered during the
open cast manual riverbed mining operation at the mine site.
Inundation in mine pits.
Failure of Slope of riverbanks.
Surface fire (Oil).
In order to take care of above hazards/disasters, the following will be strictly followed:
Working of mines as per approved plans.
All safety precautions and preventions of CMR 1957 shall be strictly followed
during all mining operations.
Regular maintenance of transport vehicles.
Entry of unauthorized persons will be prohibited.
Periodic checking of worthiness of firefighting and first aid provision in the mining
area.

EIA/EMP report of Sand/Bajri Mine (With ML Area of 4280.0 ha) Tehsil Marwar Jn., District Pali, Rajasthan
EQMS INDIA PVT. LTD. 203
Training and refresher courses for all the employees.
As a part of disaster management plan, a rescue team will be formed by imparting
specialized training to select mining staff.
7.4. Inundation
The area experiences worst storms causing rainfall during monsoon season Though no
mining activities is envisaged during monsoon season (June to September), yet in the
context of the present mine the inundation cannot be ruled out due to flash flood in the
catchment during non-monsoon season as is evident from Table 7.6. It is inferred from
the Table that during non-monsoon season the monthly rainfall during November month
is maximum and infact out of 10 years it was only in November 2010 that good precipitation
ranging from 27-55 mm in a day occurred to generate run-off corresponding to maximum
one day rainfall in different tehsils of Pali. (2.68 mm – 6.65 mm)
Table 7.6 : Monthly Average and Maximum Rainfall (mm) in a day during non-monsoon season
Tehsil
Monthly Average Rainfall (mm) during non-monsoon season (2004-2013)
Maximum Rainfall (mm)
in any day
Run-off from Maximum Rainfall
Jan Feb Mar Apr May Oct Nov Dec mm MCM
Rohat 2.8 3.7 2.4 7.9 17 1.4 11.4 0.6 55 (14-11-2010) 5.86 8.25
Pali 0.7 2.6 3.2 6.6 10.8 1.7 8.7 0.6 27 (23-11-2010) 2.68 4.50
Marwar Jn. 0.8 3.4 1.5 5.3 9.9 5.9 18.7 0.3 54 (17-11-2010) 5.95 8.35
Sumerpur 0 1.6 13.3 1.5 10.8 8.6 12.1 0 50 (23-11-2010) 6.65 6.38
Sojat 1.4 3.2 0.4 4.5 8.1 2.4 10.1 0.6 35 (14-11-2010) 3.66 6.14
Following precautionary measures shall be undertaken in respect of mining operation
during non- monsoon season and before the onset of monsoon
The local nalas will not be obstracted/dirverted along the boundary of lease area.
A careful assessment of the danger of inundation from surface water shall be made
before onset of monsoon season every year and adequate precautions against such
dangers shall be implemented.
Effectiveness of precautions, obstruction in normal drainage system etc. shall be
checked regularly.
During May no mining pit excavation shall be carried out adjacent to the bank offset
line
Standing orders for withdrawal of persons and mining equipment from mine in case of
apprehended danger shall be framed and enforced.

EIA/EMP report of Sand/Bajri Mine (With ML Area of 4280.0 ha) Tehsil Marwar Jn., District Pali, Rajasthan
EQMS INDIA PVT. LTD. 204
7.5. Disaster Due to Failure of Pit Slope
The excavation of a pit in a river bed can be construed as disturbing the continuity of the
earth mass at the surface of excavation. The failure in an earth mass may be looked upon
as loss of continuity caused by shearing stresses brought into play by the act of removing
earth mass. The riverbed material in question comprises of gravel, bajri, sand, silt and clay
and can be treated as cohesive – frictional (c - ᴓ) type of soil.
The mining involves mechanized excavation in pits of 3 m depth from the natural surface
level in the riverbed by deploying excavators. The riverbed material is a consolidated
matrix comprising of gravel / bajri / sand and sand/silt/clay and thus has an angle of repose
of 400 - 450. Since the depth of the pit is 3m and the slope material has a good angle of
internal friction, probability of any planer failure, or wedge failure of pit are not there. If the
depth of cut is too high, there is possibility of slope collapse, which releases a sediment
cloud. This will further move outside the suction radius of dredged head. In order to avoid
this typical situation, the depth of cut may be restricted to:
H/C < 5.5, where,
- Unit weight of the soil
H - Depth of soil
C - Cohesive strength of soil
In the present case = 1850 kg/m3
H = 3 m C = 750 kg/m2
Therefore H/C = 7.4 which is more than 5.5. Hence the pit mining in 3 m depth is safe
from stability consideration of slope. Otherwise also the safety factor against slope failure
has been worked out as under by adopting Taylor’stability curve for stability number
N=0.035 for angle of slope of 400.
F=C/NH = 750/0.035 x 1850 x 3 = 3.8 which is more than 1.5 (SF)
The riverbed in most of the rivers has become a consolidated matrix comprising of gravel,
bajri, sand, silt ansd clay and thus the soil is classified as c - ᴓ i.e. it has both cohesion as
well as internal friction. This is manifest from the almost vertical side slopes of the pit
excavated for the footing of column of a bridge under construction on Rediya River (Figure
7.5).

EIA/EMP report of Sand/Bajri Mine (With ML Area of 4280.0 ha) Tehsil Marwar Jn., District Pali, Rajasthan
EQMS INDIA PVT. LTD. 205
Figure 7.5 : Pictorial view of pits on river coarse of Rediya
7.6. Disaster Due to Failure of Mine Waste Dump
Sliding of surface waste dump is an equally severe risk compared to quarry slope failure.
Hence, it is imperative that the degree of hazard against potential failure of waste dump
slopes should be identified and that precautionary measures are adopted, if required. The
overall waste dump slope, considering the angle of repose, should not be more than 35º-
37º.
In the present case of riverbed mining, the mine waste material is silt and clay which have
been proposed to be disposed in the area designated for plantation and shall be properly
dressed and levelled for creation of the green belt / plantation. Thus, no surface dumps
have been proposed under the plan. The natural heap surface of about 0.5m - 1m high
have an angle of repose of about 250 are quite safe.
7.7. Disaster Due to Surface Fire
The chances of surface fire resulting per se from the riverbed mining activities are well-
nigh impossible except for the mining machinery and transport vehicles catching and
engulfed in fire due to electrical fault like short circuiting and other reasons. In winters the
labour some time use fuel wood to warm themselves. The fire can result from the
negligence of the labour, but it will be localized and shall not spread as the core zone area
of the mine has no appreciable woody material, which can easily catch fire. As a safety,
measure against fire hazard a couple of fire extinguishers will be installed at rest shelter
and refilled periodically.

EIA/EMP report of Sand/Bajri Mine (With ML Area of 4280.0 ha) Tehsil Marwar Jn., District Pali, Rajasthan
EQMS INDIA PVT. LTD. 206
7.8. Disaster Management Plan
In order to handle disaster/emergency situations, an organizational chart entrusting
responsibility to various project personnel will be prepared with their specific roles during
emergency.
7.8.1. Planning
7.8.1.1 Identification and Prevention of Possible Emergency Situations
Possible emergency situations can broadly be classified into vehicle collision, and
inundation. Some of the ways of preventing emergencies are as follows:
Preparation of a Preventive Maintenance Schedule Programme and also covering
maintenance schedules for all mining machinery/equipment and instruments as well
as transport vehicles as per recommendations of the manufacturers user manuals,
Ensuring the compliance of traffic rules strictly along Katcha roads (haul roads) within
the mine lease area as well as outside the mine lease area.
Emergent situation arise due to happening of some incident culminating into an
abnormal situation. It implies that sufficient time space running from a few seconds to
few minutes are always invariably available to arrest an incident of abnormal situation
from turning in to an emergency.
7.8.2. Implementation
Following key personnel, identified for carrying out specific and assigned duties in case of
any kind of emergency, shall be available on call on holidays and off duty also.
Mine Manager
Personnel Officer
Foreman
Senior Mining Mate
Essential workers
7.8.2.1 Responsibilities of Mine Manager
To take overall charge at the place of incident and activate the Emergency
Preparedness Plan according to severity of situation.
Inform Doctor to be ready for treatment of affected employees and intimate their
relatives.
To depute staff carry out following functions -

EIA/EMP report of Sand/Bajri Mine (With ML Area of 4280.0 ha) Tehsil Marwar Jn., District Pali, Rajasthan
EQMS INDIA PVT. LTD. 207
To liaison with District Administration and other Departments and guide their
personnel
To supervise Assembly and Evacuation at all points
To look after Patients who are bed ridden and any Casualties and give
psychological support
Inform and liaise with project proponent, Police department and District Emergency
Authority.
Arrange for chronological records of emergency to be maintained.
Issue authorized statements to News Media.
7.8.2.2 Responsibilities of Mines Foreman
To take immediate charge at the site of incident and ensure that immediate steps as
per Emergency Preparedness Plan are taken and immediately inform Mines manager.
Shall disseminate the information regarding emergency by blowing of Siren / Hooter.
Supervise assembly and evacuation as per plan, if required and ensure that casualties
are receiving proper medical care.
Ensure accounting for personnel and rescue of missing persons.
Control traffic movement in Quarry premises.
7.8.2.3 Responsibilities of Trained Workers
A task force comprising of specially trained staff to act and deliver in the emergency
situation shall carry out the following work.
Fire fighting and spill control till fire brigade takes the charge and thereafter assist the
fire brigade
Ensuring safety and Isolating equipment, materials, urgent repairing or replacement,
electrical work etc.
Controlling movement of equipment, transport vehicles, special vehicle at the mine
site.
Extending First - Aid and medical help.
Assistance at casualty’s reception areas to record details of casualties.

EIA/EMP report of Sand/Bajri Mine (With ML Area of 4280.0 ha) Tehsil Marwar Jn., District Pali, Rajasthan
EQMS INDIA PVT. LTD. 208
7.9. Occupational Health and Safety
The effects of air pollution on human health are well documented. There are controversies
in many respects, but there is sample evidence to show that air pollution is definitely a
contributing factor to chronic bronchitis, asthma and emphysema.
Health and Safety Measures to control dust inhalation; precautions would be adopted to
prevent dust generation at site and dispersing in the environment. For the safety of
workers at site, engaged at strategic dust generation points like loading and unloading
points, screening plant etc., dust masks would be provided. Dust masks would prevent
inhalation of RSPM (PM10) thereby reducing the risk of lung diseases and other respiratory
disorders. Regular health monitoring of workers will be carried out at the time of
appointment as per Mine Rules 1955 and also yearly. Lung function test and audiometry
test will be the essential part of health checkups as mine workers are prone to these. First
aid facility should be available at the rest shelter. Training will be imparted to all the
workers for health safety measures so that they can use the protective equipments
essentially and effectively. Qualified Vocational Training Officer will be employed to impart
the training to all the employees on regular basis. The personal protection equipments
(PPE) such as Industrial Safety Helmet, goggles, Ear muffs / earplug, Dust mask, hand
gloves and Industrial safety shoes with steel toe will be provided to the workers. The
details of pre-placement medical examination and periodical check-up schedule with cost
have been provided in Chapter 9.
7.10. R & R Plan
In the wake of the fact that no private land or asset acquisition is involved in the mine
lease area which totally falls in revenue waste land classified as Gair Mumkin Nadi/Nala
in the revenue records, no R&R plan is warranted.
7.11. Social Impact Assessment
The project does not involve acquisition of any private land or asset and thus there shall
be no project affected persons. No social impact assessment is thus warranted under
Right to Fair Compensation and Transparency in Land Acquisition, Rehabilitation and
Resettlement Act, 2013.

EIA/EMP report of Sand/Bajri Mine (With ML Area of 4280.0 ha) Tehsil Marwar Jn., District Pali, Rajasthan
EQMS INDIA PVT. LTD. 209
CHAPTER 8. : PROJECT BENEFITS
8.1. General
The forthcoming project shall open new vista for employment in the area in many spheres.
With the commencement of proposed mining activities, a new horizon shall emerge to the
local populace for their social upliftment. The mine lease area neither entails any
acquisition of any private land or property nor any displacement of persons. Therefore, it
will it will not have any adverse impact on these counts but it will herald all positive benefits
to the society and improve socio economic fabric of the region.
8.2. Accelerated Development of Infrastructure and Housing Sector
The implementation of the project shall help in meeting the huge demand of construction
material like coarse and fine sand/Bajri required for building construction and infrastructure
works in Jodhpur Division of Rajasthan.
8.3. Employment Potential
8.3.1. Mining Activities
About 102 labors shall be engaged for extraction of Sand/Bajri and loading and handling
of mineral in mining area, besides, watch and ward and plantation activity with proper
maintenance. The majority of manpower belonging to skilled/semi-skilled/unskilled shall
be indigenously available. Therefore, it is estimated that approximately102 persons shall
be benefited by direct employment.
8.3.2. Implementation of Management Plans
Various management plans, suggested as mitigation measures, viz. Green Belt
Development and maintenance of haul road are highly labour oriented forestry/civil work
with lesser material component. The forestry works involved under these plans do not
involve any state-of-the-art for which especial labour is warranted. In fact, these routine
works can be executed to perfection by the skilled/semi-skilled/unskilled labour locally
available.
8.4. State Exchequer
Commencement of mining activities shall result in direct revenue to the State Exchequer
in the form of royalty, trade/sales tax, cess etc. besides creating environmental
management fund for carrying out environment protection works.
8.5. Betterment of Trade and Commerce
With the commencement of mining operations, the need for housing of the mine
workers/personnel shall arise which will be mostly provided by the local persons of nearby
villages/ markets by giving the accommodation on rental basis. This will fetch income to
the house owners. Besides this there shall be an increase in demand of all commodities

EIA/EMP report of Sand/Bajri Mine (With ML Area of 4280.0 ha) Tehsil Marwar Jn., District Pali, Rajasthan
EQMS INDIA PVT. LTD. 210
to meet out the needs of mined workers/personnel and the transport personnel. Thus,
there shall be a general boost to business and commerce in the area.
8.6. Tangible social benefits
There will be a positive impact in socio-economic area due to increased economic
activities, creation of new employment opportunities, infrastructural development and
better educational and health facilities.
The project proponent (Lessee) will undertake awareness program and community
activities like health, camps, medical aids, family welfare camps, AIDS awareness
programme etc.
Periodic medical check-ups as per Mines Act/ Rules and other social development
and promotional activities will be undertaken. All this will assist to lift the general
health status of the residents of the area around mines.
A massive plantation has been done in the mine area so far and lot many are
proposed to mitigate the ill-effects of mining and to improve the vicinity and
environment of mine and it surrounding area. The project proponent will give
emphasis on plantation and will also motivate local persons for plantation during
rainy season. This will also increase the consciousness in workers and near-by
villagers for greenery. Fruit trees can contribute towards their financial gains.

EIA/EMP report of Sand/Bajri Mine (With ML Area of 4280.0 ha) Tehsil Marwar Jn., District Pali, Rajasthan
EQMS INDIA PVT. LTD. 211
CHAPTER 9. : Environmental Management Plan
9.1. General
Based on the evaluation of baseline data and predicted impacts, suitable and plausible
management plans are to be formulated for implementation, to minimize the negative
impacts in the environmental attributes of land, water, air, noise, ecological and socio-
economics. The implementation of all the management plans should commence pari
passu with the commencement of mining activities so that the environmental ambiguities
going to crop up may be resolved before the completion of conceptual plan of the mine
i.e. towards the end of life of mine. Various environmental management plans, designed
within the framework of statutory and regulatory requirements on environmental and socio-
economic aspects to attain sustainable development are described in the proceeding
sections.
9.2. Pollution Control Measures
9.2.1. Air Pollution Control
In riverbed manual mining, dust emissions are generated during various mining activities,
material handling and due to plying of transportation trucks in the mine lease area and
also on haul roads. However, the EIA study has shown that ground level concentration of
pollutants like PM10, SO2 and NOX are within the NAAQS are well and when become
airborne lead to increase in particulates level in the ambient air. The detailed mitigation
measures as contained in Section 4.7. The project proponent shall ensure that these are
strictly followed. Besides this the ambient air quality monitoring shall be periodically carried
out at locations and frequencies mentioned under Section Chapter 6.4.1. Apart from these
mitigation measures, the idle running of transport vehicles at the mine site shall be totally
avoided. The sprinkling of water on surface of haul roads and over the silt/clay disposed
in the plantation area shall involve major cost component of the works towards air pollution
control. For meeting out the cost of purchase of ground water (25 kld for dust suppression)
from tube wells and its transportation cost to the site @ Rs. 625/day for 280 days annually,
a sum of Rs. 1.75 lac has to be earmarked as recurring expenditure under air pollution
control measures.
9.2.2. Noise Pollution Control
The noise monitoring shows that day and night time baseline noise levels at mine site in
river bed are within the prescribed limit. The other source of noise at the site is due to
operation of transport vehicle. Due to use of excavators and loaders the level of noise will
definitely rise above threshold level at the place in the riverbed where the machines are
in operation. But this increase in noise level will not be continuous and shall be governed
by the breakup of cycle of operation of the machine which includes idle time also. The

EIA/EMP report of Sand/Bajri Mine (With ML Area of 4280.0 ha) Tehsil Marwar Jn., District Pali, Rajasthan
EQMS INDIA PVT. LTD. 212
impact study shows that the noise levels due to noise source from mining machinery and
truck movement are attenuated after 100 m distance from the mine site. The resultant
noise levels are very high at mine site. The detailed mitigation measures are contained in
Section 4.6. The project proponent shall ensure that these are strictly followed. Besides
this the ambient air noise level monitoring shall be periodically carried out at locations and
frequencies mentioned under Section Chapter 6.4.2. The environmental surroundings
near the mine site like vegetal cover greatly attenuate the noise level. On this account the
green belt shall be developed along the haul road as well as in the area earmarked for
plantation within the lease, the cost of development of greenbelt has been separately
assessed. The cost of other equipments like ear plug/muff and noise level monitoring
during the course of mining have been included under occupational health and safety plan
and environmental monitoring plan.
9.2.3. Water Pollution Control
9.2.3.1 Surface Water
The major impact due to riverbed surface mining is the increase siltation owing to sediment
particles coming under the influence of the current and also due to toe erosion of bank in
the mine lease area. In the impact studies, it has been held that the mining activities shall
be carried out during the period when the rivers run dry and thus there will be no synergic
relation between water and soil during the period of mining. However, during heavy rains
the loose soil spread on upper terraces can find way into the river section due to run-off
from upper banks and also due to formation of rills. This will increase the silt rate to smaller
extent as the river flow during flash floods carry considerably high sediment and
suspended load as compared to the former. Apart from the mitigation measures suggested
in Section 4.5.2, spillage of sand and bajri into the river bed should be avoided during
transportation. The plantation under the green belt programme shall also help in checking
the erosion of the bank. Besides this the water quality monitoring shall be periodically
carried out at locations and frequencies mentioned under Section Chapter 6.4.3. Thus,
there is no cost implication of this plan as all work activities are covered under other plans.
9.2.3.2 Ground Water
The base level study have revealed that there will be neither any impact on groundwater
as the ground water table is not intersected nor the mineral formation has any toxic
elements. However as the requirement of water for drinking/domestic use, dust
suppression and green belt shall be met from the ground water resources (nearby tube
well), thus there shall be an impact on ground water resource to the extent the water is
abstracted from the ground. This impact shall not be substantial as merely 0.011 MCM
shall be abstracted from ground water resource annually. This meagre use of ground
EIA/EMP report of Sand/Bajri Mine (With ML Area of 4280.0 ha) Tehsil Marwar Jn., District Pali, Rajasthan
EQMS INDIA PVT. LTD. 213
water resource shall be compensated many fold during flood and after flood when the
subsurface basin in the form of 3m deep mine pits shall act as reservoir to trigger a good
recharge of the ground water due to the increase head for percolation. Besides this the
project proponent shall construct a few conventional water harvesting structure under the
CSR initiatives. Thus no further mitigation measures are warranted.
9.2.4. Land Environment
Any mining activity may alter the land use pattern in the lease area. In order to minimise
the adverse effects, the following suggestions have been made. Degradation of land is
not a very significant adverse impact of river terrace mining due to creation of access
roads, mining operations and transportation of mined material. In order to prevent the
environmental degradation of lease area and its surroundings, the following measures
shall be taken;
Minimal damage to the flora standing around the lease area.
Foreign material should neither be allowed to remain/spill in lease area, nor the
pits/pockets will be allowed to be filled with such material,
No stockpiling of extracted sand and bajri shall be done outside the lease area.
9.2.5. Biological Environment
The dust is the only major pollutant, which will be generated from different activities of
mining. The effect of particulate matter on vegetation is in the form of incrustation, plugging
of stomata, and loss of chlorophyll and reduction of photosynthesis process. The annual
plantation proposed for five years of mining period shall greatly help in developing a good
vegetal cover on the upper terrace near the bank of the river and eventually attract micro
fauna, birds etc. in the area. Thus, there will be positive impact on terrestrial environment
around the mine lease area. The increase in siltation due to mining shall be controlled by
creating greenbelt and soil conservation works.
Though no Schedule-I & II species, under WPA 1972, have been sighted in the project
area i.e. core zone. However, in the buffer zone of the study area a good wildlife which
inter-alia include a few mammals (Jungle Cat, Indian Fox, Rhesus Monkey and Mongoose
- Schedule - II) and avi-fauna (Common Peafowl – Schedule - I) included in Schedule I &
II of WPA Act, 1972 are stated to be present as per Forest Working Plan of Pali Forest
Division. These wild animals sometimes also frequent the area nearby the river banks and
villages. Thus, for conservation of these wildlife in non-forest area a management plan
has been formulated in the light of measures enunciated in the working plan of Pali Forest
Division.

EIA/EMP report of Sand/Bajri Mine (With ML Area of 4280.0 ha) Tehsil Marwar Jn., District Pali, Rajasthan
EQMS INDIA PVT. LTD. 214
9.2.5.1 Conservation Plan for Peafowl
Kingdom: Animalia Phylum: Chordata Class: Aves Order: Galliformes Family: Phasianidae Genus: Pavo Species: Pavo cristatus
Introduction
The Indian Peafowl (Pavo cristatus), is also known as the Common Peafowl or the Blue
Peafowl, The peacock is the national bird of India. It is a resident breeder in the Indian
subcontinent and has been introduced into many parts of the world and feral populations
exist in many introduced regions. It is the largest of the pheasants.
It has a crest atop the head. Most attractive part of its body is its magnificent `tail`(train)
with its colourful feathers with a black eye at the end. The peafowls loose these feathers
at the end of summer and new ones grow during summer.
Geographical Distribution:
The Indian sub-continent is the natural range of the Indian Peafowl. It is found in good
numbers in Indian Territory ranging from Outer Himalayas through vast stretch of the
country including the Peninsula. It is also found in Pakistan, Nepal and Sri Lanka. The arid
deserts of Rajasthan, the riverbanks of Gujarat and Madhya Pradesh, the foothills of the
Himalayas in Uttar Pradesh and the forests of Haryana – these are considered to be the
major and commonly-known habitats of peacocks in India.
Habitat and Behaviour:
The scrub jungles and forest edges are the natural habitat of this bird which has affinity
towards a moist and dry deciduous and semiarid biomes. It is also found along streams
with good vegetation and in agricultural fields and in close proximity with the human
settlements. Habitat mosaic of scrub and open areas with ample sites for “dust bathing”
and “lekking”. Dust bathing is critical as this bird has to condition its feathers and remove
feather-degrading bacteria and other external parasites. The peafowl are forest birds that
nest on the ground. The peafowl are terrestrial feeders but roost in trees. It has got a loud
scream that can scary many enemies. The life expectancy is about 10-15 years.

EIA/EMP report of Sand/Bajri Mine (With ML Area of 4280.0 ha) Tehsil Marwar Jn., District Pali, Rajasthan
EQMS INDIA PVT. LTD. 215
Food:
Peafowls are omnivores, eating plant parts, flower petals, seed heads, insects and other
arthropods, reptiles and amphibians. In the study area, dense tree canopy cover supports
good insect diversity which is very common food for peafowls.
Conservation Status:
The Indian Peafowl is listed as least concern species in the Red List of International Union
for Conservation of Nature. However, in India it has been attributed the utmost protection
by inclusion in Schedule-I of Indian Wildlife Act, 1972.
Threat:
These birds are under continuous threat from human beings for variety of reasons like
demand for feather and wild meat, direct encounter with the farmers during harvesting
seasons, adverse impact due to increase use of pesticides and habitat reduction due to
conversion of their habitat to agricultural land, industrial growth etc. The incidence of killing
of peafowls by the local populace for host of reasons have been reported and recorded at
many places in Rajasthan.
Conservation Plan:
The people living in the surrounding area and employee of the company would be
motivated towards the protection of the animal. Motivation will lead to timely information
to the concerned authorities about any threat to wild life or any cases of pouching/hunting.
Though peafowl is well adapted to the existing rural setting of the study area yet the
following strategies may be adopted:
Habitat improvement programme will include plantation of various plant species
mentioned in green belt development plan (Table 9.2) and other species reported
from the study area should be taken in to priority. In order to improve vegetation
cover, it is suggested to carry out extensive afforestation program in different
phases. Peafowl is seen at times in this area. It is well known that this bird requires
insects, snakes and grass seeds etc. as its food and sufficient water to drink. By
planting tree and sowing grass seeds, vegetational status of the area will improve.
This will provide more food and by strengthening water bodies more water will be
available which shall help improve the population status of Peafowl in this area.
Under habitat improvement programme the seeds of grasses and saplings will be
distributed in the various villages of the study area. Compost packets will be also

EIA/EMP report of Sand/Bajri Mine (With ML Area of 4280.0 ha) Tehsil Marwar Jn., District Pali, Rajasthan
EQMS INDIA PVT. LTD. 216
provided at the intervals of the every six months by the proponent (in consultation
of forest department).
Water will be filled in the existing (selected by forest department) water bodies
near the river banks and in the scrub area by water tankers.
School level awareness programmes will be conducted for conservation of
peacocks by organizing competitions during “Wildlife Week” and “Van Mahotsav”
celebrations
The prolific use of insecticides / pesticides should be checked as these harmful
chemicals are detrimental and instrumental for killing of insects / butterflies which
are natural prey for the birds.
Conservation of “lekking sites” and dust bathing sites for Peafowl.
9.2.5.2 Conservation Plan for Jungle Cat
Kingdom: Animalia
Phylum: Chordata Subphylum: Vertebrata Class: Mammalia Order: Carnivora Suborder: Feliformia Family: Felidae Subfamily: Felinae Genus: Felis Species: Felis chaus
Introduction
The jungle cat (Felis chaus), also called the swamp lynx (although not closely related to
the lynxes), is a medium-small cat, but is now considered the largest remaining species
of the wild cat genus Felis. Due to the pointed ears and the long legs this cat resembles a
small lynx (hence the name "swamp lynx").
Geographical Distribution:
Felis chaus inhabits Asia and North Africa, including Indochina, Thailand, Burma, India,
Sri Lanka, Mesopotamia, and North Egypt. Afghanistan and Transcapia define the
northern border of its range It inhabits various habitats, for instance savannas, tropical dry
forests and the reedbeds along rivers and lakes, but it is not found in rainforests. In some
areas the jungle cat comes close to villages and may even live in deserted houses. The
jungle cat lives in heights up to 2500 m, but is more common in the lowlands.
Habitat:

EIA/EMP report of Sand/Bajri Mine (With ML Area of 4280.0 ha) Tehsil Marwar Jn., District Pali, Rajasthan
EQMS INDIA PVT. LTD. 217
Felis chaus is found in a wide variety of habitats, most often in wet grasslands and reed
thickets near stagnant or slowly flowing water. Although some populations reside in dry
areas, F. chaus is never far from a pool of water. Jungle cats live at elevations between
sea level and 2400 meters above MSL.
Food:
The cat feeds on rodents, frogs, hares and other small mammals snakes, lizards and birds.
Those cats living close to bodies of water are able to swim and dive in order to catch fish.
Felis chaus preys on, ground birds, and frogs.
Behaviour:
Like most felids, Felis chaus are solitary animals. They are active both day and night and
den in thick vegetation or in the abandoned burrows of badgers, foxes, or porcupines.
When resting they twist the forefeet at the wrist joint and tuck them under the body.
Conservation Status:
The Jungle Cat is listed as least concern species in the Red List of International Union for
Conservation of Nature. However, in India it has been attributed the utmost protection by
inclusion in Schedule-II of Indian Wildlife Act, 1972
Threat:
Competitors are the main threat to the wild cat. Competitors of the wild cat include
leopards, wolves, red dogs, and hyenas’
Conservation Plan:
The people living in the surrounding area and employee of the company would be
motivated towards the protection of the animal. Motivation will lead to timely information
to the concerned authorities about any threat to wild life or any cases of poaching/hunting.
Proper incentive shall be given to such locals who pass on information about the illegal
poaching. Water holes should be made away from such places where the local people
bring their animals for grazing. Parapets of adequate height should be constructed above
the top of the open wells so that incidence of wildlife / animals drowning in the well are
checked. The area around the well should be cleared of the shrubs so that the animals
don’t dare to come near to it. The ban on use of plastic bags should be strictly followed.
The dangerous chemicals should not be indiscriminately disposed near to the water holes
otherwise the water quality shall be impaired to dangerous proportion. The database of
natural habitat of wild animals should be prepared and the information disseminated to
the gram Panchayat. A great deal of wildlife also inhabit the area outside of the forests

EIA/EMP report of Sand/Bajri Mine (With ML Area of 4280.0 ha) Tehsil Marwar Jn., District Pali, Rajasthan
EQMS INDIA PVT. LTD. 218
which do not fall under jurisdiction of the Forest Department. In context of such areas the
revenue department and the NGOs may take joint and concerted efforts for protection of
animals. The following conservation measures are proposed.
Conservation of Soil and Improvement of Water Regime
Habitat Improvement
Creation of Conservation awareness
Provision of Salt Lakes
Incentives to Informers of Illegal hunting /poaching of animals
Fencing of natural habitat to check the encroachment of shrinking habitat
Strengthening of translocation centres of the district by one time financial aid.
9.2.5.3 Conservation Plan for Indian Fox
Kingdom: Animalia Phylum: Chordata Class: Mammalia Order: Carnivora Family: Canidae Genus: Vulpes Taxon: Vulpes bengalensis
Introduction
The foxes are the smallest amongst the canids characterized by their solitary nature (the
only social unit being a pair during the breeding season) and versatility in strategies for
effective survival.
Geographical Distribution:
The Indian fox (Vulpes bengalensis) is endemic to the Indian subcontinent. The species
has a relatively wide distribution varying from the foothills of the Himalayas in Nepal to the
southern tip of the Indian subcontinent.
However nowhere in its range is the Indian fox abundant.
Habitat:
The species largely occupies semi arid, flat to undulating terrain, scrub and grassland
habitats, which are suitable for foraging and denning activities. The Biogeographic Zones
3 (Desert), 4 (Semiarid) and 6 (Deccan Peninsula) are believed to hold relatively high
numbers. It avoids dense forests, steep terrain, tall grasslands and true deserts. In the
Indian peninsula, the species is restricted to the plains and open scrub forest.

EIA/EMP report of Sand/Bajri Mine (With ML Area of 4280.0 ha) Tehsil Marwar Jn., District Pali, Rajasthan
EQMS INDIA PVT. LTD. 219
Food:
The order Carnivora is well known for its wide dietetic characteristics. Indian fox has been
reported as an omnivorous opportunistic canid. Their diet has been known to comprise of
insects (grasshoppers, termites, beetles, scorpions, ants, and spiders), crustaceans,
rodents including gerbils, field rats and mice, hares (Lepus nigricollis), birds and their
eggs, fishes, ground lizards and rat snakes (Ptyas mucosus). Fruits consumed by the
foxes included ber (Zizyphus spp.), neem (Azadirachta indica), mango (Mangifera indica),
jamun (Syzigium cumini), banyan (Ficus bengalensis) and pods of Cicer arietum and
Cassia fistula. etc., they have also been reported to feed on carcasses, and urban waste.
Behaviour:
They are mostly crepuscular and nocturnal in habits, foraging usually in the dark hours.
Denning in the Indian fox is restricted to the pup rearing period. The Indian fox breeds
from December to January (in Kutch), average litter size being two.
Life Span:
6-8 years in captivity, 10-12 years also reported.
Conservation Status:
The Indian Fox is listed as least concern species in the Red List of International Union for
Conservation of Nature. However, in India it has been attributed the utmost protection by
inclusion in Schedule-II of Indian Wildlife Act, 1972.
Threat:
Wolves and feral dogs are major predators. Bengal foxes are susceptible to habitat loss
and degradation, persecution, roadkills, and changes in native species dynamics due to
pathogens or parasites. Bengal fox is hunted for sport and for its fur. Its body parts are
used in traditional medicines. Although the Indian Fox is widespread, it occurs at low
densities throughout its range, and populations can undergo major fluctuations due to prey
availability. It is also quite sensitive to human modifications of its habitat. There are no
known commercial uses for the Indian Fox, although there is limited localized trade for
skin, tail, teeth and claws (for medicinal and charm purposes). There is no trade or
potential for trade of the Indian Fox.
Conservation Plan:

EIA/EMP report of Sand/Bajri Mine (With ML Area of 4280.0 ha) Tehsil Marwar Jn., District Pali, Rajasthan
EQMS INDIA PVT. LTD. 220
The people living in the surrounding area and employee of the company would be
motivated towards the protection of the animal. Motivation will lead to timely information
to the concerned authorities about any threat to wild life or any cases of poaching/hunting.
Proper incentive shall be given to such locals who pass on information about the illegal
poaching. Water holes should be made away from such places where the local people
bring their animals for grazing. Parapets of adequate height should be constructed above
the top of the open wells so that incidence of wildlife / animals drowning in the well are
checked. The area around the well should be cleared of the shrubs so that the animals
don’t dare to come near to it. The ban on use of plastic bags should be strictly followed.
The dangerous chemicals should not be indiscriminately disposed near to the water holes
otherwise the water quality shall be impaired to dangerous proportion. The database of
natural habitat of wild animals should be prepared and the information disseminated to
the gram Panchayat. A great deal of wildlife also inhabit the area outside of the forests
which do not fall under jurisdiction of the Forest Department. In context of such areas the
revenue department and the NGOs may take joint and concerted efforts for protection of
animals. The following conservation measures are proposed.
Conservation of Soil and Improvement of Water Regime
Habitat Improvement
Creation of Conservation awareness
Provision of Salt Lakes
Incentives to Informers of Illegal hunting /poaching of animals
Fencing of natural habitat to check the encroachment of shrinking habitat
Strengthening of translocation centres of the district by one time financial aid.
9.2.5.4 Conservation Plan for Rhesus Monkey
Kingdom: Animalia Phylum: Chordata Class: Mammalia Order: Primates Family: Cercopithecidae Genus: Macaca
Introduction
The Rhesus Macaque is also known as the Rhesus Monkey. It belongs to the Old World
category and is among the best known. These are small Monkeys with pink faces that

EIA/EMP report of Sand/Bajri Mine (With ML Area of 4280.0 ha) Tehsil Marwar Jn., District Pali, Rajasthan
EQMS INDIA PVT. LTD. 221
don’t have any fur on them. They may be brown or gray in color. They have a long tail that
helps them to stay balanced and for leaping.
Geographical Distribution:
The Northern portions of India are where you will find the Rhesus Macaque. Thailand,
Vietnam, and South China are just a few of the places where they are found. They have
the largest geographical location of any primate in the world other than humans. They
enjoy open areas that are arid. However, they also live in the mountains at high elevations.
They can also live in wooded regions as they have a diverse ability to live in many habitats.
Habitat:
This species is diurnal and omnivorous, and alternatively arboreal and terrestrial. It resides
in a range of habitats, including temperate coniferous, moist and dry deciduous, bamboo,
and mixed forests, mangroves, scrub, rainforest, and around human habitations and
developments, including cultivated areas, temples, and roadsides (Choudhury 2001;
Srivastava and Mohnot 2001).
Food:
Pine needles are part of their food supply. Roots, small insects, and leaves also make up
their daily dietary intake. They are able to store food in the pouches of their cheeks. In
many areas they have been known to go to humans for food that has been left out for
them. They remember where to go for it though so now it has become a huge problem.
Now villagers are trapping them and killing them to get them to stop coming around.
Behaviour:
Swimming is a common event for the Rhesus Macaque. They do it to help them cross
between the islands. The young can swim when they are just a few days old. They are
often found to have drown though in areas where the waters was moving just too fast for
them to swim. They are active both during the day and at night. They will live mainly in the
trees but also on the land.
The groups can have as many as 40 members, with there being about 4 times as many
females. There is a complex hierarch that is through the females. Her young will have their
lineage in the group based on hers
Reproduction:
There isn’t a specific time of year for mating to occur with the Rhesus Macaque. As long
as they have enough food and shelter it will be taking place. The females are mature

EIA/EMP report of Sand/Bajri Mine (With ML Area of 4280.0 ha) Tehsil Marwar Jn., District Pali, Rajasthan
EQMS INDIA PVT. LTD. 222
around 3 years of age. It is about a year later for the males. After mating it takes about
164 days for the young to arrive.
They are well cared for by their mothers. They are taught how to be important members
of the group. They are encouraged when they find food and when they call out to warn
other members of dangers. The life span of a rhesus monkey in captivity is approximately
15 - 20 years for males and 20 - 25 years for females. These monkeys rarely live beyond
15 years of age in the wild.
Conservation Status:
The Rhesus Monkey is listed as least concern species in the Red List of International
Union for Conservation of Nature. However, in India it has been attributed the utmost
protection by inclusion in Schedule-II of Indian Wildlife Act, 1972.
Threat:
This species is generally unthreatened, though its original habitat is increasingly being lost
to development. While M. mulatta exists easily around humans, the increasing level of
cohabitation has been associated with waning levels of human tolerance for the animals
(Molur et al. 2003). Confiscation for laboratory testing is a mostly localized threat, but it is
considerable in certain areas. Capture and release of laboratory and “problem monkeys”
from rural and urban areas into natural forests is a major threat to wild macaques.
Conservation Plan:
The people living in the surrounding area and employee of the company would be
motivated towards the protection of the animal. Motivation will lead to timely information
to the concerned authorities about any threat to wild life or any cases of pouching/hunting.
The root cause of this conflict between humans and rhesus macaques is the eradication
of natural habitat, forcing monkeys into proximity with humans. Though they excel in
human-disturbed environments, rhesus macaques living in forested areas are usually
healthier, eating a better diet, and in overall better condition than urban macaques
(Lindburg 1971).
Restoration of their natural habitat in densely populated areas may decrease conflict, but
given that they will likely move into areas where humans make food readily available, this
may not be a permanent solution. In the long term, management will be necessary to
conserve healthy populations of rhesus macaques and prevent persecution by humans
from being a threat to their survival (Muroyama & Eudey 2004).
Translocation of large numbers of monkeys may be one management option to remove
rhesus macaques dependent on human sources of food. In one area of significant human-

EIA/EMP report of Sand/Bajri Mine (With ML Area of 4280.0 ha) Tehsil Marwar Jn., District Pali, Rajasthan
EQMS INDIA PVT. LTD. 223
rhesus macaque conflict, about 600 macaques were captured and successfully relocated
to forested areas nearby (Imam et al. 2002).
9.2.5.5 Conservation Plan for Mongoose
Kingdom: Animalia Phylum: Chordata Class: Mammalia Order: Carnivora Family: Herpestidae Genus: Herpestes Taxon: Herpestes edwardii Introduction
Mongoose is a member of the family of small cat-like, bold, agile carnivores having a
tapered head, long body, short legs.and are typically gray or brown with long, coarse hair
that bristles when disturbed. They use their claws for digging burrows.
Geographical Distribution and Habitat:
They are widely found in the Caribbeans, Southern Europe and in the Asian and African
continents. Their general habitats are forests, open land, semi-desert/desert and takes
shelter in ground borrows, open fissures in the rocks besides hollows of trees.
Food:
The predators thrive on small mammals, rodants, lizards, snails, crabs, birds and insects.
They often attacks and kill snakes including Cobras.
Behaviour and Life Span:
They can live in isolation and in large groups and are invariably active during the day time
while some species are nocturnal. Their general life span is about 7 to 12 years in the wild
and more than 20 years in captivity.
Conservation Status:
They are listed as lower risk, least concern species in the Red List of International Union
for Conservation of Nature. However, in India it has been attributed the utmost protection
by inclusion in Schedule-II of Indian Wildlife Act, 1972.
Threat:
Their small size renders them an easy prey for big carnivores. The threat also comes from
human intervention in the form of use of toxic agro chemicals in agriculture fields.

EIA/EMP report of Sand/Bajri Mine (With ML Area of 4280.0 ha) Tehsil Marwar Jn., District Pali, Rajasthan
EQMS INDIA PVT. LTD. 224
Conservation Plan:
The people living in the surrounding area and employee of the company would be
motivated towards the protection of the animal. Motivation will lead to timely information
to the concerned authorities about any threat to wild life or any cases of poaching/hunting.
Proper incentive shall be given to such locals who pass on information about the illegal
poaching. Water holes should be made away from such places where the local people
bring their animals for grazing. Parapets of adequate height should be constructed above
the top of the open wells so that incidence of wildlife / animals drowning in the well are
checked. The area around the well should be cleared of the shrubs so that the animals
don’t dare to come near to it. The ban on use of plastic bags should be strictly followed.
The dangerous chemicals should not be indiscriminately disposed near to the water holes
otherwise the water quality shall be impaired to dangerous proportion. The database of
natural habitat of wild animals should be prepared and the information disseminated to
the gram Panchayat. A great deal of wildlife also inhabit the area outside of the forests
which do not fall under jurisdiction of the Forest Department. In context of such areas the
revenue department and the NGOs may take joint and concerted efforts for protection of
animals. The following conservation measures are proposed.
Conservation of Soil and Improvement of Water Regime
Habitat Improvement
Creation of Conservation awareness
Provision of Salt Lakes
Incentives to Informers of Illegal hunting /poaching of animals
Fencing of natural habitat to check the encroachment of shrinking habitat
Strengthening of translocation centres of the district by one time financial aid.
9.2.5.6 Financial Projection of Conservation Plan
To implement the conservation plan following works are proposed within the core zone,
buffer zone and adjoining forest and revenue area. More emphasis will be given to soil
and water conservation structures and creation of water holes along with the habitat
development works. To improve the habitat and conserve the flora and fauna following
items of works are proposed and tentative financial allocation for the same is given in front
of them (Table 9.1).

EIA/EMP report of Sand/Bajri Mine (With ML Area of 4280.0 ha) Tehsil Marwar Jn., District Pali, Rajasthan
EQMS INDIA PVT. LTD. 225
Table 9.1 : Cost under Conservation Plan
S. No. ITEM Amount (Rs. Lac)
1. Conservation of Soil and Water
1.1 Improvement of existing water sources (Small Ponds) 1.00
1.2 Development of new water sources (Water Holes) 1.00
1.3 Construction of Anicut / Check Dams on small Nalas / Balas 2.00
2. Habitat Improvement
2.1 Plantation / Pasture Development 2.00
2.2 Burning regime, seeding and grass cutting 0.50
2.3 Improvement of Escape cover 0.50
2.4 Improvement of Reproductive cover 0.50
3. Creation of Conservation Awareness 0.25
4. Provision of Salt Licks 0.25
5. Incentives to informers of illegal game / poaching 0.50
6. Fencing of Natural Habitat to check the encroachment 0.75
7. Strengthing of trans location centers in the district by one time financial aid
0.75
Total for five years 10.00
9.2.6. Social Environment
With the commencement of the project, there shall be direct employment opportunity for
109 workers, besides this the project will open vista for employment in transportation
sector, besides generation opportunity for deployment in activities related to stone
crushing plant. Since no private land is to be acquired for mining, thus the ticklish issues
touching and arising due to R&R issues are not involved. Therefore, impact of riverbed
mining of sand and bajri on the social economics of the area shall be a very positive one.
It will also provide stimulus to the business and commerce of local market. The small-time
shopkeepers running hotel/Dhaba shall also be benefitted.
9.2.6.1 Corporate Social Responsibility
The project proponent is a non – corporate entity and is well aware of his duty and
responsibility towards the socio-economic development of the local community where the
project activities will be carried. The proponent is also bound by the national policies and
is vigorously passionate to carry out some initiative towards the society by improving their
quality of life and fostering sustainable and integrated development in the communities in
the vicinity of the lease area.
This objective of social responsibility is equally well-entrenched in the minds of the project
proponent which is manifest from some of the CSR activities included in the mine plan.
The project proponent wish to play an active part in providing financial support and
empowering rural communities to chart their own development.

EIA/EMP report of Sand/Bajri Mine (With ML Area of 4280.0 ha) Tehsil Marwar Jn., District Pali, Rajasthan
EQMS INDIA PVT. LTD. 226
The activities to be carried out under Corporate Social Responsibility initiatives will have
a positive impact on socio economic fabric of the region. The Project Proponent may
promote local NGO, ask the communities to prepare their micro level plans based on
genuine needs. It is, therefore, proposed to have CSR plan focusing on following broad
areas of activities that addresses the problems and needs of the community in the project
area in a holistic manner:
Livelihood and Entrepreneurship:
Helping rural communities in the project vicinity to become self-sufficient and sustainable
by providing training in self-employment and supporting entrepreneurship
Women Empowerment:
A driving social change in rural areas by empowering women through education and
training and promoting their Self Help Groups (SHG) and micro finance for group,
individual and community income generation activities such as tailoring/embroidery
classes for women; and Orientation programs for self-employment in collaboration with
District Industries Centre and District Rural Development Agencies.
Education:
Empowering children and adults by bringing quality education to remote rural areas
Infrastructure:
Invest in rural infrastructure to make basic amenities available to the villages such as
traditional water harvesting structures.
Environment:
Promoting environmental awareness and responsibility amongst rural, socially backward
and poor communities.
Health:
Provide affordable, quality healthcare to villages by giving community level health care
training through village workers especially women.
Agricultural Improvement:
With the help of Agricultural Department, organize training programs such as animal
husbandry, dairy development, modern cultivation, scientific storage of grain, water
conservation etc; Assist district livestock officer (DLO) to organize veterinary camps; Help
in arranging in association with nearby agricultural department for soil testing and
technical inputs for increasing yield.
Employment:

EIA/EMP report of Sand/Bajri Mine (With ML Area of 4280.0 ha) Tehsil Marwar Jn., District Pali, Rajasthan
EQMS INDIA PVT. LTD. 227
Preference in employment should be given to local population for skilled, semi-skilled and
unskilled categories. Necessary training may be imparted to locals to improve their skill.
The broad activities proposed under CSR initiative along with financial implications is
shown in Table 9.2.
Table 9.2 : Cost under CSR initiative
S.No. Description Amount (Rs. lac)
1. Health checkup camps 3.5
2. Assistance to local schools, scholarship to students 5.0
3. Sanitations and drinking water facilities 2.5
4. Vocational training to persons for income generation 1.0
5. Assistance to self-help groups 1.0
6. Creation of traditional water harvesting structures 2.0
7. Gender support / women empowerment 2.0
8. Organizing veterinary camps 1.0
9. Plantation in the village panchayat 2.0
Total 20.0
9.3. Green Belt development plan
In order to mitigate and minimize the environmental impacts, arising due to riverbed mining
project especially from air pollution, noise pollution, soil erosion etc. the Greenbelt
development in the area delineated can provide the best mitigation option. The green
canopy not only absorbs some of these pollutants as carbon sink but also improves the
aesthetic environment, besides attenuating the noise levels. Therefore, a “Green Belt
Development Plan” has been proposed around the mine lease area and along the haul
roads. Though the mine lease area 4280 ha has vast linear length along river(s) as
compared to the width of mining and it extends over several rivers separated by
kilometres, yet the annual mining shall be limited to 26.67 ha for each year of lease period
of 5 years beyond which the lease is not extendable. Thus keeping in view the guideline
for plantation in respect of mining lease area more than 50 ha, the plantation within the
lease area has to be carried out during lease period (5 years) in such manner that the total
area under plantation is equivalent to 33% of the factual mining area. In the present case
the annual area for plantation works out to 8.9 ha.
9.3.1. Development of Greenbelt
The green belt is proposed to be developed in the area of upper terraces and areas
prohibited for mining and along the network of haul roads. The strategy worked out for
development of green belt consists of following:
The species selected should be capable of growing fast,
The species should be wind firm and long lived.

EIA/EMP report of Sand/Bajri Mine (With ML Area of 4280.0 ha) Tehsil Marwar Jn., District Pali, Rajasthan
EQMS INDIA PVT. LTD. 228
Broad leaf trees growing above 10 m in height should be planted along the roads,
offices and infrastructure facilities.
The species should form a dense crown cover.
The species should form a litter in abundance on the plantation flow.
Generally local/indigenous fast growing trees shrubs should be planted.
The trees should be protected by plantation of non-palatable shrub species to
avoid browsing by animals.
Placement of tree guards (metal tree guard, pre-feb RCC tree guard, Fiber tree
guard etc.), should be provided to save avenue plantation.
For protection against biotic interference thorn fencing around the plantation,
circular trench around the planting pit and sown with fast growing thorny shrubs on
the ridge should be followed.
To mitigating the impact of dust and noise, which likely to rise during mining, plantation
would be done around the mining areas. The species selected under this plantation will
be moderately high, good foliage bearing and are able to trap dust and noise. The following
species have been proposed for plantation under green belt. (Table 9.3).
Table 9.3 : Species suggested for plantation under Greenbelt Development Progaramme
Sl. No. Name Scientific Name
1 Bordi Zizyphus nummularia
2 Churel Holoptelia integrifolia
3 Farash Tamarix articulata
4 Israeli Babool Acacia tortilis
5 Kala Siris Cassia Siamea
6 Khejdi Prosopis cineraria
7 Kumat Acacia senegal
8 Kunali Dichrostachys glomerata
9 Neem Azadirachta indica
10 Shishum Dalbergia sissoo
11 Siris Albizzia lebbek
12 Vilayathi Babool Prosopis juliflora
9.3.2. Guidelines and Techniques for Green Belt Development
Based on environmental conditions suitable indigenous plants species shall be planted
under green belt development plan. The requirement of plants sapling for development of
green belt shall be made from the nearby forest nursery. The soil characteristics shall also
be kept in mind. As advance work the area to be planted shall be demarcated and pit
locations marked. For site having sandy and sandy loam soil planting pits of 45cm x 45cm
EIA/EMP report of Sand/Bajri Mine (With ML Area of 4280.0 ha) Tehsil Marwar Jn., District Pali, Rajasthan
EQMS INDIA PVT. LTD. 229
or 60cm x 60cm x 60cm shall be dug out and semi-filled with good and loose weathered
soil before planting with the commencement of good monsoon rains sometime in month
of July. For avenue plantation on haul roads as well as village roads circular pit of 60 cm
diameter and 90 cm depth with a circular ditch of 2m diameter and 60 cm depth shall be
dug for planting the soil from the circular dig shall be pitted on the berm. The digging
operation of the pit should be completed before the end of June so as to allow thoroughly
weathering of the dugout soil. Prior to the commencement of the rains, pits shall be refilled
with the dugout soil and FYM added. Planting shall be done when heavy showers causing
run-off occurs sometime between July and August. The saplings should be 9 to 12 months
old. Immediately after planting the pits shall be watered with 20 litres / pit and in case of
failure of rainfall it should be watered @ 20 litres / pit at the interval of the fortnight. The
mortality of plants has been considered as @ 10% and re-digging of pit should be carried
out before replacement of the individual plant.
9.3.3. Precautions During Plantation
Some important precautions should be taken during the plantation, which are as under:
Open grazing is practiced in general in the area; therefore, protection should be
provided in advance.
Polyculture should be practiced. Mixture by group should be preferred over
intimate mixture.
Indigenous species recommended should be planted in sufficient numbers to
increase their population size in the area.
Multipurpose species should be planted in large numbers.
9.3.4. Phase-wise Programme for Plantation under green belt
In the present case the annual area proposed for plantation works out to 8.9 ha. The
plantation shall be carried out @ 500 plants/ha. The plants shall be protected by thorny
brushwood protection and shall be maintained one year after the closure of mine.
Considering the mortality @ 10% the no. of plants / year have been worked out as per
Table 9.4.
Table 9.4 : Phase-wise programme of plantation
S. No. Activity
1st Year 2nd Year 3rd Year 4th Year 5th Year Total
Area (ha) Number
Area (ha) Number
Area (ha) Number
Area (ha) Number
Area (ha) Number
Area (ha) Number
1
Demarcation of Area for plantation 8.9 - 8.9 - 8.9 - 8.9 - 8.9 - 44.5 -
2
Excavation of Pits including re-digging - 4450 - 4895 - 5384.5 - 5922.95 - 6515 - 27168

EIA/EMP report of Sand/Bajri Mine (With ML Area of 4280.0 ha) Tehsil Marwar Jn., District Pali, Rajasthan
EQMS INDIA PVT. LTD. 230
3
Plantation including mortality - 4450 - 4895 - 5384.5 - 5922.95 - 6515 - 27168
4
Thorny brushwood protection - 4450 - 4895 - 5384.5 - 5922.95 - 6515 - 27168
9.3.5. Annual Programme for Plantation under green belt
The greenbelt shall be developed annually in approximately 8.9 ha area. The area
designated for each year shall be planted with trees and shrubs @ 500 plants/ha. The
annual cost for development of greenbelt has been assessed in Table 9.5.
Table 9.5 : Annual cost for green belt development plan (Rs. in lakhs)
S. No. Component Cost (Rs. Lac)
1 Cost of plantation including maintenance for 5 years and
establishment charges @ Rs 0.5 lac/ ha for 8.9 ha
4.45
2 Thorny brushwood protection guard for 4450 sapling @ Rs
10/No.
0.45
3 Cost of FYM and Bio-fertilizer 0.30
4 Cost of watering / irrigation in green belt 0.70
5 Contingency 0.10
Total 6.00
9.4. Solid Waste Management
9.4.1. General
The following types of solid wastes are likely to generate from the mining activities during
the mining period.
Waste from mining in the form of silt/clay
Solid waste from Septic tank/Soak pit
The above-mentioned solid wastes can play havoc and have severe impacts on the
ecosystem if not properly addressed through well designed management plans in their
respect.
9.4.2. Management of Waste from Mine
No solid waste other than silt/clay, which deposits as crust material on the bed profile,
shall be scrapped and deposited in the upper terraces earmarked for plantation.
Approximately 13333 cum (about 18666 MT) of silt/clay shall be produced during 5 years.
The year-wise estimation of quantity of solid waste is shown in Table 9.6, the quantity of

EIA/EMP report of Sand/Bajri Mine (With ML Area of 4280.0 ha) Tehsil Marwar Jn., District Pali, Rajasthan
EQMS INDIA PVT. LTD. 231
scrapped crust material (clay) which is in excess of the quantity required for plantation
purpose in upper terraces shall be deposited in the riverbed pits.
Table 9.6 : Year-wise Production of Solid waste
Year Block –A Block –B Block –C Block –D Block –E Total
I 345 452 536 619 714 2666
II 476 464 512 536 679 2667
III 393 476 524 595 679 2667
IV 405 476 548 536 702 2667
V 440 476 536 500 714 2666
2060 2345 2655 2786 3488 13333
It is evident from the soil characteristics of the core zone that it has low contents of
macronutrients Nitrogen and in Organic carbons. The soil shall be mixed with urea and
farmyard manure (FYM) so as to increase its fertility. Apart from this, the bio-fertilizers
shall be added to the soil.
9.4.3. Cost for management of mine waste
The cost of management of mine waste (Silt/Clay) by manual carriage and disposal /
spreading into the areas earmarked for plantation @ Rs. 50/cum for 2667 cum has been
assessed as Rs. 1.33 lac.
9.5. Occupational Health Management Plan
9.5.1. Potential Risk of Sand Mining Activities
The open-cast semi-mechanized riverbed sand mining project by the nature of the
activities involved is accompanied with risk of lowest degree as compared to underground
mining or the open-cast mining involving blasting. The risks associated with the project
are not hazardous, but if any, they are only accidents and incidents, associated with
mining machinery or transportation activity, if adequate controls or safety systems are not
adopted. The sand excavation by deploying excavators / JCB and loading on to the trucks
by Backhoe can have risks of accidents if human failure or errors are not taken care of.
The Accidents, if any, may not be fatal, but are potential to cause temporary or permanent
disabilities. Thus, the need for adequate safety at work places is needed. On the other
hand, the manual activity of sand mining and sand loading is not associated with
accidents, however, some minor incidents like exhaustion, sun-strokes, or other health
related incidents may take place, which can be avoided with adequate safety regulations
and measures. Transportation of mined sand to the stowing sites is the activity associated
with accidents on road and at the project site. However, with effective safety measures
the accidents can be avoided and prevented.

EIA/EMP report of Sand/Bajri Mine (With ML Area of 4280.0 ha) Tehsil Marwar Jn., District Pali, Rajasthan
EQMS INDIA PVT. LTD. 232
9.5.2. Safety of Machine Use at Mining Site
The major mining machinery to be deployed at site shall be excavators/JCB, Backhoe and
loaders which can excavate sand and load on to vehicles. The area where mining
machinery shall be operated will be under supervision of trained operators and helpers
besides technically qualified foreman to ensure that the machinery are operated as per
specified design parameters of the manufacturer. Before the work is initiated every day,
the routine check-up especially with regard to its hydraulic systems, mechanical
conditions, and other operating systems shall be performed. The movement of
trucks/trippers/tractors for loading /transportation of sand within the mine area and haul
road area shall be regulated by a trained supervisor who shall be responsible for the safety
of vehicle movement and prevention of accidents or incidents associated with the
vehicular movement. All staff working with the mining machinery shall be trained in first-
aid and other safety measures, accident or incident prevention and reporting and
communication mechanisms.
9.5.3. Occupational Health & Safety (OHS)
Sand/Bajri mining does not contain any toxic element. Therefore, the likelihood of any
health hazard does not arise due to the mined product per se. However, the process of
excavation / quarrying leads to some health hazards. The dust generated due to
excavation loading and movement on Katcha/riverbed haul road creates air borne dust
which has silica contents. The dust is the main pollutant of concern for the workers
engaged in the mining activities. The most significant occupational health impacts are
Noise Induced Hearing Loss (NIHL) and Occupational Lung Disease (OLD) like allergic
rhinitis and asthma due to inhalation of dust. Working in open during summer can expose
workers to the direct sun rays causing heat strokes, cramps and burns besides leading to
exhaustion. In extreme windy conditions the dust particles forcing way into the eyes can
create itching as well as allergic conjunctivitis of eye. As per Mines Rules, 1955, Chapter
– IV-A, Section 29B, medical examination of employees at the initial stage and
periodically, shall be done by a team of qualified medical officers provided by the project
proponent.
The initial medical examination of every person employed in the mine within a period of
five years of the date so notified and the said examination shall be so arranged over a
period of five years that one fifth of the persons employed at the mine undergo the
examination every year. The periodical medical examination thereafter of every person
employed in the mine shall be conducted at intervals of not more than five years. In the
present case since the lease is only for five year. It is suggested that the initial medical

EIA/EMP report of Sand/Bajri Mine (With ML Area of 4280.0 ha) Tehsil Marwar Jn., District Pali, Rajasthan
EQMS INDIA PVT. LTD. 233
examination for all workers must be arranged during the first year of appointment and the
periodical check-up during fourth and fifth year subsequent to the appointment.
Regular medical check-up camps shall also be arranged for detection of occupational
diseases and minor disease in the nearby rural population. Free check-up and medicine
for treatment for their acute and chronic illness shall be provided. The medical examination
schedule is provided in Table 9.7.
Table 9.7 : Schedule of Medical Checkup
S.No. Particular 1st
Year 2nd Year
3rd Year
4th Year
5th Year
6th Year Total
1
Initial medical checkup of employees for lung function, audiometric test, tuberclausis and pulmonary disease at the time of appointment 80 22 - - - - 102
2 Periodical Medical Checkup of the employees - 40 40 22 102
9.5.4. Occupational Health & Safety Measures to Control Dust Inhalation
Providing a working environment that is conducive to safety and health.
The management of occupational safety and health is the prime responsibility of mine
management.
Employee involvement and commitment in the implementation of health and safety
guidelines.
Periodical health checkups
Implementing safety and health management system and assessing the effectiveness
through periodic audits.
Monitoring the effects of mining activities on safety and health and conducting regular
performance reviews.
Provision of necessary personal protective equipments.
Establishing and maintaining a system of medical surveillance for employees
Ensuring employees at all levels receive appropriate training and are competent to
carry out their duties and responsibilities.
All the above precautions would be adopted to prevent dust generation at site and to be
dispersed in the outside environment. However, for the safety of workers at site, engaged
at strategic locations / dust generation points like loading and unloading points, screening
sieve, dust masks would be provided. Dust masks would prevent inhalation of RPM

EIA/EMP report of Sand/Bajri Mine (With ML Area of 4280.0 ha) Tehsil Marwar Jn., District Pali, Rajasthan
EQMS INDIA PVT. LTD. 234
thereby reducing the risk of lung diseases and other respiratory disorders. Regular health
monitoring of workers will be carried out.
9.5.5. Noise Induced Hearing Loss (NIHL)
Hearing conservation programmes exists at all operations. Baseline audiogram forms the
basis for future assessment of employees in terms of hearing loss.
Using engineering initiatives to reduce noise at source is the priority management tool.
The hearing conservation programme includes the provision of Hearing Protection
Devises (HPDs) and annual audiometry examination of all employees. Apart from
provision of HPDs emphasis is also laid on training the employees’ responsibility to protect
his / her hearing.
9.5.6. Occupational Lung Diseases (OLD)
There will be regular health camps for all the workers and nearby rural people. Lung
function tests, chest X-rays etc. shall be carried out and any health disorders will be
evaluated. The budget shall be earmarked for the necessary protective devices and
training needs by the project proponent.
9.5.7. Incidence of Silicosis
Continuous exposure to sand dust can lead to Silicosis, silica tuberculosis and pulmonary
disease. Prolong contact with wet sand can cause fungal infection of hands and legs.
9.5.8. Cost Estimate
For initial and periodical medical check-up of employee of the mines, who are engaged at
the active mine site, budgetary provision of Rs. 600/employee/year shall be made. The
provision at this stage is being made for 102 skilled/semi-skilled / unskilled workers. The
cost estimate is provided in Table 9.8.
Table 9.8 : Cost Estimate
S.
No.
Particular Quantity Unit Rate Amount
(Rs. lacs)
1. Initial medical check-up for all workers
for 1/5th of the workers i.e. 21
workers/year
21 Man 600 0.13
2. Periodical check-up for all workers for
1/5th of the workers i.e. 21
workers/year
21 Man 600 0.13
3. Provision for free medicines for all
workers @ Rs. 200/year
102 Man 200 0.21

EIA/EMP report of Sand/Bajri Mine (With ML Area of 4280.0 ha) Tehsil Marwar Jn., District Pali, Rajasthan
EQMS INDIA PVT. LTD. 235
4. Provision for personal protection
equipment like ear plug, dust mask,
shoes, goggles and etc., for 102
workers
102 No. 2000 2.04
5. Provision for First Aid facilities 1 Job L.S. 0.20
6. Provision for fire extinguisher and its
regular refilling
1 Job L.S. 0.10
Total 2.81
The overall estimated cost is made up of the components of capital cost of PPE i.e. Rs.
2.04 lac and Rs. 0.77 lac as annual recurring cost.
9.6. Soil conservation works
Hard measures (Engineering structures) shall be constructed to control the toe erosion
and land slips from falling into the river course. This can be accomplished by erecting
stone masonry retaining structure / Gabion structures at stretch of bank showing sign of
slope failure or imminent soil mass movement. Besides this, sometimes the river current
is directed towards the bank, which are susceptible to toe erosion. In that scenario, it
becomes necessary to repel the current from the bank, for which purpose-repelling spurs
are to be implemented. The advantage with the repelling spurs is that while diverting the
current they create a quiet pocket d/s of these and are filled with river borne material. The
provision for such structures have been incorporated in the management plan. The cost
of which is assessed as Rs. 3.0 lac which amounts to Rs. 0.6 lac / year (Table 9.9).
Table 9.9 : Cost estimate of soil conservation works (engineering)
Sl.
No.
Item Quantity Unit Rate Amount
1. RR Dry stone masonry (10 no.)
Average dimension = 10 m long, 2m high
and side slope 1:4
a. Excavation in foundation
10 x 10 x 1.10 x 0.3 = 1.65
33 Cum 150.00 4950.00
b. RR stone masonry dry
10 x 10 x (1.10 + 0.60 / 2) x 2.0 = 8.5 cum
170 Cum 300.00 51000.00
2. Wire crate boulder Spurs for stream bank
Protection (5no.)
(a) Excavation in foundation
5 x 3.5mx 2.5 x 0.5
21.88 Cum 150 3282.00
(b) Filling of boulder and hand packing in Wire crates 2.25mx 1.25mx1.25 in three tiers i.e. 3 in first tier2 each in second and third tier. 5 x 7 (2.25 x1.25x 1.25)
123.05 Cum 130.00 15966.00
(c ) Collection of boulder 123.05 Cum 160.00 19688.00
(d) Carriage of boulder average lead 1 km 123.05 Cum 400.00 49220.00

EIA/EMP report of Sand/Bajri Mine (With ML Area of 4280.0 ha) Tehsil Marwar Jn., District Pali, Rajasthan
EQMS INDIA PVT. LTD. 236
Manually
(e) CostofG.1 wire crates
5 x 7 x 15.10 sq mx 2.23 = 1178.55 kg or say
11.8Qtl
11.8 Qtl 7000 82600.00
(f) Carriage ofG.1.wire crate to an average lead of1 km
11.8 Qtl 150.00 1770.00
(g) Weaving of GI wire crate 528.5 20.00 10570.00
Total 239046.00
Add 3% Contingencies 7171.00
Grand Total 246217.00
Or say 2.5 lac
3 Annual care of river 0.5 lac
Say 3.0 lac
9.7. Capital Cost of Project
The capital cost of the project Rs. 75 lac involves construction of temporary non-residential
building like main mine office at one place where the maximum mining is envisaged and
small units at other blocks of the mine lease area. It also includes the construction cost of
rest shelters, first-aid posts, establishing of workshops, stores, water supply and sanitary
arrangements, establishing of barriers and Weigh Bridge. The mining and transport
equipment’s shall be procured on hire / rental basis.
9.8. Summary of cost of environment management plan
Table 9.10 : Total cost of environmental management plan
S. No. Name of Plan Capital Cost
(Rs Lac)
Recurring annual
Cost
(Rs Lac)
1. Environment Monitoring Plan for Air,
Noise, Water, Soil, etc.
- 3.00
2. Air Pollution Control-
Management o f H a u l a g e
R o a d s including Sprinkling.
- 1.75
3. Plantation / Green belt development plan
6.00
4. Disposal and spreading of
Silt/clay as per Mining Plan
- 1.33
5. Occupational Health Measures
Provision of PPE and other
Miscellaneous expenditure
2.04 0.77

EIA/EMP report of Sand/Bajri Mine (With ML Area of 4280.0 ha) Tehsil Marwar Jn., District Pali, Rajasthan
EQMS INDIA PVT. LTD. 237
6. Soil Conservation works (Engineering) - 0.60
7. Cost under Corporate Social
Responsibility Initiatives for five years
is Rs. 20 lac. Thus cost per year is Rs.
4.0 lac
- 4.00
8. Conservation Plan for Wildlife
(Schedule I & II, WPA, 1972)
- 2.00
Total 2.04 19.45

EIA/EMP report of Sand/Bajri Mine (With ML Area of 4280.0 ha) Tehsil Marwar Jn., District Pali, Rajasthan
EQMS INDIA PVT. LTD. 238
CHAPTER 10. : Environmental Management Plan
10.1. Purpose of the Report
For sustainable maintenance of environmental commensuration with the mining and related
operation, it is imperative to conduct studies on the baseline status of existing environmental
attributes and assess the impact on these due to proposed activities, which would assist in
formulating well-addressed management plans for sustainable mineral extraction within mine.
The main purpose of the report is to establish the baseline environmental attributes in terms
of scoping clearance issued by the EAC, Ministry of Environment and Forests, vide meeting
held on 26.9.2013 and predict/identify the impacts for preparing environment management
plan.
10.2. Identification of Project & Project Proponent
The project envisages open cast semi-mechanized extraction of Sand/Bajri to an annual
maximum of 1.12 MMT for five years from riverbed of Bandi, Lilki, Mithri, Kantaliyi, Khardi,
Sukri upper, Khari and Siriari Nala constituting a combined mine lease area 4280.0 ha for five
years. The project proponent (LoI Holder) is firm named as M/s Kuber Associates, Jaipur,
Rajasthan.
10.3. Project Description
10.3.1. Type and category of project
The riverbed mining project in 4280.0 ha, classified under category ‘A’ of EIA notification 1996,
has been proposed for an annual production of 0.8 MCM (1.12 MMT) of Sand (Bajri) by open
cast Semi-Mechanized extraction method. The project, with capital cost Rs. 75 lac has no
other interlinked project.
10.3.2. Location
The mine lease area, covered under SOI Toposheet no. 45 G/6, 45 G/9, 45 G/10, G/13 and
45G/14 is linearly stretched under 127 revenue villages of tehsil Marwar Jn., district Pali. The
site is approached from NH-14, SH-61, SH-62, SH-67 and ODRs’ and also by Western
Railway B/G line at Marwar Jn.
10.3.3. Need for the project
For meeting the huge demand of construction material like coarse and fine sand/Bajri required
in building construction and infrastructure works, road material for construction and
maintenance of roads / highway material in Jodhpur Division of Rajasthan. Apart from this, it
will fetch huge revenue to state exchequer.

EIA/EMP report of Sand/Bajri Mine (With ML Area of 4280.0 ha) Tehsil Marwar Jn., District Pali, Rajasthan
EQMS INDIA PVT. LTD. 239
10.3.4. Annual Production Schedule (Million Metric Tonne)
S. No. Year Block –A Block –B Block –C Block –D Block –E Total
1 I 0.145 0.19 0.225 0.26 0.3 1.12
2 II 0.2 0.195 0.215 0.225 0.285 1.12
3 III 0.165 0.2 0.22 0.25 0.285 1.12
4 IV 0.17 0.2 0.23 0.225 0.295 1.12
5 V 0.185 0.2 0.225 0.21 0.3 1.12
Total 0.865 0.985 1.115 1.17 1.465 5.60
10.3.5. Technology and Process Description
The collective stretch of the lease area for each river has been sub-divided in to five blocks for
ease of operation, supervision, management and safety. Dry riverbed mining will be carried
out as per the approved production schedule. Light weight excavators will be deployed for
extraction in 3.0 m layer only forming one bench. This is as per the digging depth of the
equipment. Mineral will be loaded in tippers/trucks (20 tonne). The mining machinery and
equipment and transportation vehicles will be on hire/rental basis.
10.3.6. Water Requirement and source
Water requirement for human consumption (drinking / domestic), plantation and dust
suppression is 4 KLD, 6 KLD, 15 KLD respectively which shall be met from ground water
resource from nearby tube wells on payment basis.
10.3.7. Man Power Requirement
About 102 workforce including Ist and IInd class mine manager under Rule 37N (1)(i) RMMCR
1986, foreman, mine mates, supervisors, skilled operators and helpers, semi-skilled and un-
skilled workers shall be engaged.
10.3.8. Extent Of Mechanization
For an optimum daily production of 4000 metric tonne excavators, loaders, transport and other
light vehicles and the water sprinklers shall be deployed.
10.3.9. Geological Reserve, Mineable Reserves and Targeted Production
1 Total Proved Geological reserves with 3 m depth of mining. 128.4 MCM (179.76 MMT)
2 Reserve blocked due to bank offsets, wells, road and
bridges as per Rule 18(26) of RMMC Rules,1986 13.05 MCM (18.27 MMT)
3 Mineable Reserve (A-B) 115.35 MCM (161.49MMT)
4 Targeted Production @ 1.12 MMT/year for 5 years 4 MCM (5.6 MMT)
Balance Reserve (C-D) 111.35 MCM (155.89MMT)
10.3.10. Anticipated life of Mine

EIA/EMP report of Sand/Bajri Mine (With ML Area of 4280.0 ha) Tehsil Marwar Jn., District Pali, Rajasthan
EQMS INDIA PVT. LTD. 240
The life of mine can be considered as continuous/ perpetual as long as the rate of sediment
aggradations within the mined out area is either equal to or in excess of the rate of extraction
of the river bed material. In the present case the area mined out in any year in any block shall
not be considered for mining during the lease period of five years.
10.3.11. Year-wise production since 1994
There was no production by the project proponent who was not entitled to carry out mining
operation in the period anterior to the date of issue of letter of intent.
10.3.12. Details of Mining Activities with Respect to Block wise, Calendar wise, Zonal wise
The current project has vast linear length along river(s) as compared to the width of mining
and it extends over several rivers separated by kilometres. For facilitating easy operation,
supervision and safety, the lease area along river(s) in the concerned Tehsil has been sub
divided into four to five blocks depending upon the length of the river(s).
10.3.13. Overburden dumps
There will be no development of overburden dumps in the present case, as the riverbed
material is not overlain with waste material warranting its disposal in the form of internal or
external dumps.
10.3.14. Plan of backfilling of mine pit
The backfilling plan of the riverbed pit is neither required nor it is envisaged under the
management plan.
10.3.15. Details of Excavation Schedule and Sequential Mining Plan
Year Block –A Block –B Block –C Block –D Block –E Total
I 3.45 4.52 5.36 6.19 7.14 26.66
II 4.76 4.64 5.12 5.36 6.79 26.67
III 3.93 4.76 5.24 5.95 6.79 26.67
IV 4.05 4.76 5.48 5.36 7.02 26.67
V 4.40 4.76 5.36 5.00 7.14 26.66
20.60 23.45 26.55 27.86 34.88 133.33
10.3.16. Solid Waste Generation & its Disposal
In the entire lease period 13333 cubic meter of silt and clay (18670 metric tonne) shall be
produced, which shall be scrapped and deposited into the mine pits or in the upper terraces
earmarked for plantation.
10.3.17. Mineral Transportation
Mined out material will be directly loaded into the trucks/tippers (20 MT) by deploying JCB/Pay
loaders which will be used on hired.
10.3.18. Site Services

EIA/EMP report of Sand/Bajri Mine (With ML Area of 4280.0 ha) Tehsil Marwar Jn., District Pali, Rajasthan
EQMS INDIA PVT. LTD. 241
Proper site services such as mine office, site office, First Aid post, Rest Shelter, and Drinking
Water and sanitary facilities will be provided to the mine workers.
10.3.19. Site Elevation, Working Depth and Groundwater Table
The longitudinal profile of the rivers, showing river bed elevation at different RD, the elevation
of the mining floor (pit) corresponding to 3m depth of mining and the depth to the ground water
reveals that the ground water shall not intersect the bottom of the mining pit.
10.4. Description of Environment
The description of baseline status of various environmental attributes as assessed during EIA
study is enumerated in Table.
Baseline status
Landuse The pre-dominant landuse in the Tehsil is agriculture land 65098ha (47%), followed by fallow land 28213 ha (20%), Permanent Pasture 11439ha (8%), barren and unculturable land 8729 ha (6%), culturable waste land 7464 ha (5%), Land under non-agricultural use 5050 ha (4%) and Forest Land 14281 ha (10%).
Geology and sub-surface geology of the Area
Geological configuration of Pali district is comprised of litho units of igneous, sedimentary and metamorphic origin. The oldest & prominent rock exposed along district belongs to Delhi supergroup. The geological formations in the study area covering Tehsil Rohat mainly consist of Alluvium & Blown Sand, Phylites and Eranpura Granite / Ultra Basic
Ambient Air Quality and Noise
The pollutant concentration in the air is well below the NAAQS, as set out by CPCB. The noise monitoring shows that Leq day and night time noise levels in mine lease area are within the standards.
Surface Water Quality
The results of surface water indicate that pH ranged is within specified standard limits of 6.5 - 8.5. The TDS exceeded the tolerance limit of 500 mg/l. Dissolved Oxygen was observed to be above 5 mg/l is conducive for aquatic life. The Chlorides and Sulphates are within the tolerance limits (Chlorides 250 mg/l and sulphates 400 mg/l). The surface water quality is good for fish culture, irrigation purpose and outdoor bathing except drinking water source with conventional treatment
Ground Water Quality
The analysis results indicates that the pH ranged between 7.2 to 7.9, which is well with in the specified standard of 6.5 - 8.5 limit. Total hardness recorded was within the desirable and permissible limits for two locations each and exceeded the permissible limit (600 mg/l) for one station. The Total Dissolved Solids (TDS) concentration was below desirable limit for one location and exceeded the desirable limit (500 mg/l) for three locations and exceeded the permissible limit (2000 mg/l) in case of one station.
Soil Quality The results of the soil analysis show that the soil is slightly to moderately alkaline and its texture varies from sandy to sandy clay loam sand. The macronutrients (N, P, K) have been found in all the soil samples though it is low in available Nitrogen and Potassium. The soils are low in organic content.
Biological
Environment During this study a total of 18 trees, 19 shrubs and 20 herbs species were found in the study area zone. All the above plant species belong to 14 families each of tree and shrub and 10 families of herb. Fabaceae, Apocynaceae and Poaceae were the dominated families in tree, shrub and herb flora respectively. During study 9 mammalian species, 26 bird species (22 resident and 4 winter visitors) and 4 species of herpetofauna were reported. Todgarh Raoli WLS and Kumbhalgarh WLS exists within 1km and 8.5 km of the mine lease area respectively. Though no mining is proposed within core-zone of these sanctuaries.
EIA/EMP report of Sand/Bajri Mine (With ML Area of 4280.0 ha) Tehsil Marwar Jn., District Pali, Rajasthan
EQMS INDIA PVT. LTD. 242
Socio-economy There are 126 rural villages and 1 urban Town (Marwar Jn.) in study area with a population of 170571 (Census 2011) comprising of 37753 households. The sex ratio is 1026 Female / 1000 Male. SC and ST constitutes 21 % and 4% of the total population respectively. The Literacy Rate of the study area is 54.5% of which male and female literate are 68.3% and 41.6% of respective male female population. The main and marginal workers are 32% and 12% respectively of the total population while the remaining 56% constitutes non-workers. The majority of people in rural sector are cultivators & agricultural labours which indicates dominant agricultural economy.
10.5. Anticipated Environmental Impacts and Mitigation Measures
10.5.1. IMPACTS ON TOPOGRAPHY AND DRAINAGE
10.5.1.1 Topography
The mining activity in the riverbed by creating pits per se shall not lead to any change in the
local topography of the area. There will be no formation of overburden dumps. Thus there will
be no change in topography of either core or buffer zone.
10.5.1.2 Drainage
No temporary diversion of discharge of main rivers or any of their interlacing is proposed for
facilitating mining. The drainage pattern of the rivers flowing in tehsil shall not alter due to dry
bed mining.
10.5.2. LAND ENVIRONMENT
10.5.2.1 Change in land use
The mining activity in the river bed per se shall not lead to any change in the landuse in the
core zone as well as buffer zone where no mining activities is proposed.
10.5.2.2 Change in river course
There will be no change in the river course due to mining as the river course is mainly guided
by the hydraulic gradient of surface water and the geological conditions of the bank and bed
of the river. In the mine lease area the river section is well defined and is confined between
both the flanks.
10.5.2.3 Impact on soil
The mine waste in the form of silt/clay in mine lease area are very fine but due to semi-
mechanized mining, very little dust would be generated. These dust particles are usually blown
away along the wind direction and get deposited on the canopy of surrounding vegetation on
the river bank and agricultural crops thereby interfering with photosynthesis and other
physiological activities of the green cover. Following mitigation measures will be adopted:
The top soil shall be removed and stacked systematically.
Top soil shall be planted with fast growing indigenous herbs, shrubs of pioneer species,
apart from planting of tree species.
Sprinkling of water, at regular intervals, on exposed surface of silt/clay in upper terraces.
EIA/EMP report of Sand/Bajri Mine (With ML Area of 4280.0 ha) Tehsil Marwar Jn., District Pali, Rajasthan
EQMS INDIA PVT. LTD. 243
10.5.3. IMPACTS ON CLIMATE
10.5.3.1 Wind Speed
The wind speed in any area is dependent upon local topography and is intimately connected
with the development as high and low pressure zones. The controlling factors for the pressure
changes lie much beyond the mining operation. Thus, no adverse impact on the regional wind
speed is anticipated due to the mining operations.
10.5.3.2 Temperature Humidity & Rainfall
The temperature pattern is a regional behaviour and is not likely to be affected by the mining
activity in the riverbed. The trend of rainfall follows a regional pattern and is mainly governed
by the south west monsoon and disturbances in the Arabian Sea. The mining operation,
therefore, is not likely to have any adverse impacts on rainfall pattern. The pattern of relative
humidity depends mainly on the rainfall, wind, temperature and other weather phenomenon
that are regional in behaviour. The mining operation is not likely to have any impact on the
relative humidity in the surrounding.
10.5.4. WATER ENVIRONMENT
10.5.4.1 Impact on Surface Water Resources
The requirement of water for drinking/domestic use, dust suppression and green belt shall be
met from the ground water resources (nearby tube well), thus there shall be no negative impact
on surface water resource. However, the surface water resource shall be affected to quantum
of water which shall be stored in the mining pits (3 m deep) to the extent of annual mining
area.
10.5.4.2 Impact on Ground Water Resource
There shall be impact on ground water resource to the extent the water is abstracted from the
ground for use in drinking/domestic use, dust suppression and green belt.
10.5.4.3 Impact on Surface and Ground Water Quality
During heavy rains the loose soil spread on upper terraces can find way into the river section
due to run-off from upper banks and also due to formation of rills. This will increase the silt
rate to smaller extent as the river flow during flash floods carry considerably high sediment
and suspended load as compared to the former.
In view of the facts that the mining activities does not intersect the ground water table. No
impact on the quality of ground water is anticipated. Beside this the sand and bajri are non-
toxic in nature and therefore percolated water from the pits shall not impair the ground water
quality.
10.5.5. NOISE AND VIBRATION

EIA/EMP report of Sand/Bajri Mine (With ML Area of 4280.0 ha) Tehsil Marwar Jn., District Pali, Rajasthan
EQMS INDIA PVT. LTD. 244
The mine lease area is generally away from the settlements except in case of rivers which flow
adjacent to the town. The noise monitoring shows that day and night time noise levels are
highest at such places where the commercial activity takes place and the noise levels are
within the limits in rural setup which are more than a couple of km away from mine site.
Following mitigation measures shall be adopted:
(ix) Provision and maintenance of thick tree belts to screen noise.
(x) Avenue plantation within the project area to dampen the noise.
(xi) Proper maintenance of noise generating transport vehicles.
(xii) Provision of protective devices like ear muffs/ear plugs to those workers who cannot be
isolated from the source of noise.
10.5.6. IMPACTS ON AIR ENVIRONMENT
The baseline results of the ambient air quality at all monitoring locations in respect of
pollutants, PM10, SO2 and NOx were found to be well within the limits of National Ambient Air
Quality Standards (NAAQS) except for pollutants PM10 in respect of monitoring site at Marwar
Jn. The resultant value of PM10 at the mine site after superimposing the maximum incremental
ground level concentrations of PM10 from the different mining activities at river bed mine pit
area are still within the prescribed limits under NAAQS. Nevertheless, the following mitigation
measures will be adopted:
Copious and regular water sprinkling on haul roads by obile sprinklers.
Laying haul roads in gentle grade and in hard stratum.
Avenue plantation on roadsides for creating carbon sink.
Ensuring that laborers working near to high dust prone area use mask.
Covered trucks shall be used for transportation.
10.5.7. Biological Environment
10.5.7.1 Impact on Flora
Since there will be no felling of trees or deforestation, there will be no impact on flora of the
core zone. The mining activity per se shall not lead to any impact on the terrestrial flora of the
buffer zone either. There are no national parks, sanctuaries, notified biospheres,
Tiger/Elephant Corridors, Birds migratory routes, etc. within 10 km radius. The effect of
particulate matter on vegetation is in the form of incrustation, plugging of stomata, and loss of
chlorophyll and reduction of photosynthesis process.
10.5.7.2 Impact on Fauna
Intervention in the riverbed will impact butterflies and birds which are quite sensitive to noise
and human presence. No endangered species of fauna is found in and around lease area. As

EIA/EMP report of Sand/Bajri Mine (With ML Area of 4280.0 ha) Tehsil Marwar Jn., District Pali, Rajasthan
EQMS INDIA PVT. LTD. 245
such, there will be temporary and insignificant effect on fauna around the mining lease area.
Following mitigation measures shall be adopted:
Progressive afforestation through green belt development will improve the vegetal
cover and create good habitat for fauna in the area.
Measures shall be adopted to curb pollution due to air, water and land.
Developing awareness for nature and wildlife in the adjoining villages.
10.5.7.3 Impact on Aquatic Ecology
The dry riverbed mining in ephemeral river system which flow only in 90% of the year during
monsoon alone, in which period the mining activities are not envisaged, apparently there will
be no impact on aquatic life as there will be no surface water available for aquatic life to survive
due to dry river bed condition.
10.5.8. IMPACT ON SOCIO-ECONOMIC ENVIRONMENT
The beneficial and adverse impacts due to the activities in the region would be:
Direct Employment Potential in various categories as skilled/semi-skilled/un-skilled work force for carrying out mining activities besides Indirect employment in transport sector.
Amelioration of the general living standards of local persons employed in mining activities and improving their purchase power.
Improvement in the economic growth in the region by way of additional mineral availability.
Corporate social responsibility initiative will have a positive impact on socio economic fabric of the area.
Benefit to the State and the Central governments through financial revenues by way of royalty, tax, duties, etc from this project directly and indirectly.
Dust will affect the land productivity and increase in respiratory problems.
Conflict of utilization of local resources between lessee and locals.
Contamination of water, soil and air due to mining.
Increased use of existing roads may cause congestion on roads.
10.6. Environmental Monitoring Programme
All the environmental parameters viz. air, water, noise, soil will be monitored regularly in order
to detect any changes from the baseline status. Environmental Monitoring program will be
followed till the mining operations ceases. The sites for monitoring, parameters to be
monitored and the frequency of monitoring have been elucidated in the concerned monitoring
programme with frequency of monitoring and the locations of the monitoring stations. A
recurring annual cost of Rs. 3 lac has been earmarked.
10.7. Additional Studies
10.7.1. Replenishment Studies

EIA/EMP report of Sand/Bajri Mine (With ML Area of 4280.0 ha) Tehsil Marwar Jn., District Pali, Rajasthan
EQMS INDIA PVT. LTD. 246
The computation of sediment yield of 1.20 MMT/year is based on the relationship derived for
sediment yield as function of the effective rainfall. The annual extraction exceeds the annual
deposition by 0.45 million tonne which implies that the deposition rate is about 40% lower than
the annual extraction rate. The area mined out every year will get replenished after every
consecutive good monsoon season, reckoned from the end of pre-monsoon season of the
year of extraction, provided the free reach of the river receive run-off from three to four events
of flood every monsoon. It is therefore assessed that the mined out area within 5 years shall
be completely replenished after 5 years reckoned from the cessation of the mining provided
every year average annual rainfall during rainy season (450.6 mm) occurs in the catchment.
10.7.2. Risk Assessment
The mining activities involve certain types of hazards, during operation and close, which can
disrupt normal activities abruptly and lead to disaster like fires, inundation, failure of machinery,
explosion, to name a few. The impending dangers or risks, which need be investigated
addressed, disaster management plan formulated with an aim to taking precautionary steps
to avert disaster and to take such action after the disaster, which limits the damage to the
minimum.
10.7.3. Inundation Studies
The area experiences worst storms causing rainfall during monsoon season Though no mining
activities is envisaged during monsoon season (June to September), yet in the context of the
present mine the inundation cannot be ruled out due to flash flood in the catchment during
non-monsoon season.
10.7.4. Pit Slope Stability
On the basis of empirical formula considering the depth of cut, unit weight and cohesive
strength, the pit mining in 3 m depth is safe from stability consideration of slope. Otherwise
also the safety factor against slope failure has been worked out more than 1.5 by adopting
Taylor stability curve for stability number N=0.035 for angle of slope of 400
10.7.5. Occupational Health and Safety
The most significant occupational health impacts are Noise Induced Hearing Loss (NIHL) and
Occupational Lung Disease (OLD) due to inhalation of dust. As per Mines Rules, 1955,
medical examination of employees at the initial stage and periodically, shall be done by a team
of qualified medical officers provided by the project proponent.
10.7.6. R & R Plan
As no private land or asset acquisition is involved, no R&R plan is warranted.
10.7.7. Social Impact Assessment

EIA/EMP report of Sand/Bajri Mine (With ML Area of 4280.0 ha) Tehsil Marwar Jn., District Pali, Rajasthan
EQMS INDIA PVT. LTD. 247
No social impact assessment is warranted under Right to Fair Compensation and
Transparency in Land Acquisition, Rehabilitation and Resettlement Act, 2013
10.8. Project benefits
As no R&R issue is involved, the project will not have any adverse impact but it will herald all
positive benefits to the society and improve socio economic fabric of the region. The local
population shall be definitely benefited due to implementation of CSR initiatives. The following
are the positive benefits:
Direct employment to local population.
Indirect employment for execution of various management plans, viz. Green Belt Development, erection of retaining wall/check dam and maintenance of haul road.
Direct revenue to the state Exchequer in the form of royalty, trade/sales tax, cess etc.
10.9. Environmental Management Plan
S. No. Name of Plan Capital Cost
Rs in Lac
Recurring annual
Cost Rs in Lac
1. Environment Monitoring Plan for Air, Noise, Water, Soil,
etc.
- 3.00
2. Air Pollution Control-
Management o f H a u l a g e R o a d s including
Sprinkling.
- 1.75
3. Plantation / Green belt development plan 6.00
4. Disposal and spreading of
Silt/clay as per Mining Plan
- 1.33
5. Occupational Health Measures
Provision of PPE and other
Miscellaneous expenditure
2.04 0.77
6. Soil Conservation works (Engineering) - 0.60
7. Cost under Corporate Social Responsibility Initiatives for
five years is Rs. 20 lac. Thus cost per year is Rs. 4.0 lac
- 4.00
8. Conservation Plan for Wildlife (Schedule I & II, WPA, 1972) - 1.00
Total 2.04 18.45
10.10. Conclusion
Within the ambit of the Tor issued by the EAC, MoEF, the EIA studies have been conducted
and impacts predicted. It has been ensured that all possible environmental aspects are
touched and assessed both quality wise and quantity wise. Necessary control and mitigative
measures in context to adverse impacts have been proposed to meet the statutory
environmental requirements. The environmental management plan have been formulated and
the financial implications worked out. The implementation of the project shall not lead to any
significant negative impact on the environment.

EIA/EMP report of Sand/Bajri Mine (With ML Area of 4280.0 ha) Tehsil Marwar Jn., District Pali, Rajasthan
EQMS INDIA PVT. LTD. 0
CHAPTER 11. : Declaration & Disclosure of Consultants
Declaration by Experts Contributing to the EIA: Sand/Bajri Mining (ML Area of 4280.0 ha) in
Tehsil Marwar Jn., District Pali, Rajasthan [Category – ‘A’]
I, hereby, certify that I was a part of the EIA team in the following capacity that developed the above EIA.
EIA Coordinator:
Name: Yamesh Sharma
Signature & Date:
Period of Involvement: September 2013 to December 2014
Contact Information: EQMS India Pvt. Ltd.
Functional Area Experts:
Functional Areas Name of the
Expert (s)
Involvement
(Period and
Task**)
Signature
Air Pollution Monitoring
& Control (AP) S K Jain
Oct.13 – Jan.14
Water Pollution (WP) S K Jain Oct.13 – Jan.14
Solid and Hazardous
Waste Management
(SHW)
S K Jain
Oct.13 – Jan.14
Socio-Economics (SE) T.G. Ekande Oct.13 – Jan.14
Ecology and Bio-diversity
Conservation (EB)
Dr. Sunil
Prasad
Oct.13 – Jan.14
Hydrogeology and Water
Conservation (HG)
Yamesh
Sharma
Oct.13 – Feb.14
Soil Conservation (SC) Manoj Kumar
Sharma
Oct.13 – Jan.14
Air Quality Modeling and
Prediction (AQ)
Dr. Sudhanshu
Kumar
Jan.14 - Feb.14
Noise and Vibration (NV) Sanjeev
Sharma
Oct.13 – Jan.14
Land use (LU)
Yamesh
Sharma / Anil
Kumar
Oct.13 – Jan.14
Risk and Hazard
management (RH) S K Jain
Oct.13 – Jan.14
**Please attach additional sheet if required

EIA/EMP report of Sand/Bajri Mine (With ML Area of 4280.0 ha) Tehsil Marwar Jn., District Pali, Rajasthan
EQMS INDIA PVT. LTD. 1
Declaration by the Head of the Accredited Consultant Organization/authorized person
I, S.K.Jain hereby, confirm that the above mentioned experts prepared the EIA: Sand/Bajri Mining (ML
Area of 4280.0 ha) in Tehsil Marwar Jn., District Pali, Rajasthan I also confirm that the consultant
organization shall be fully accountable for any mis-leading information mentioned in this statement.
Signature:
Name: S.K.Jain
Designation: Director, Technical
Name of the EIA Consultant organization EQMS India Pvt. Ltd.
NABET Certificate No. NABET/EIA/RA11/007
Issue Date: 19th May, 2014
UNDERTAKING BY THE CONSULTANT ORGANIZATION
I, S. K. Jain, hereby solemnly do undertake that the prescribed ToR by the MoEF, in respect of the EIA/EMP
report of Sand/Bajri Mining (ML Area of 4280.0 ha) in Tehsil Marwar Jn., District Pali, Rajasthan, have been
complied with and that the data submitted is factually correct to the best of my knowledge and belief. I
further undertake that the organization owns the contents (Information & Data) of the EIA report.
S.K. Jain
Director, Technical
EQMS India Pvt. Ltd.
NABET/EIA/RA11/007
19th May, 2014

EIA/EMP report of Sand/Bajri Mine (With ML Area of 4280.0 ha) Tehsil Marwar Jn., District Pali, Rajasthan
EQMS INDIA PVT. LTD. 2
Annexures

EIA/EMP report of Sand/Bajri Mine (With ML Area of 4280.0 ha) Tehsil Marwar Jn., District Pali, Rajasthan
EQMS INDIA PVT. LTD. 3
Annexure – I : Letter of Intent
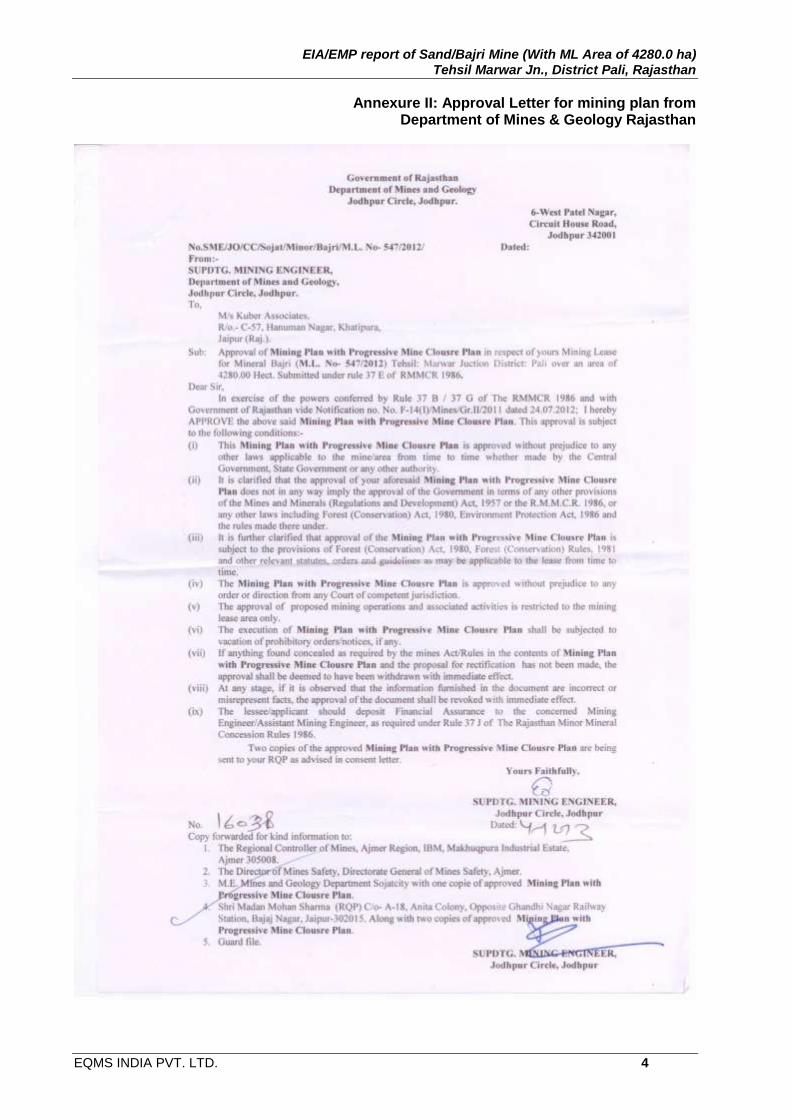
EIA/EMP report of Sand/Bajri Mine (With ML Area of 4280.0 ha) Tehsil Marwar Jn., District Pali, Rajasthan
EQMS INDIA PVT. LTD. 4
Annexure II: Approval Letter for mining plan from Department of Mines & Geology Rajasthan

EIA/EMP report of Sand/Bajri Mine (With ML Area of 4280.0 ha) Tehsil Marwar Jn., District Pali, Rajasthan
EQMS INDIA PVT. LTD. 5
Annexure III: Public Hearing Notice, Attendence Sheets, Proceedings and Replies

EIA/EMP report of Sand/Bajri Mine (With ML Area of 4280.0 ha) Tehsil Marwar Jn., District Pali, Rajasthan
EQMS INDIA PVT. LTD. 6
Rajasthan Patrika Dated 14-08-2014

EIA/EMP report of Sand/Bajri Mine (With ML Area of 4280.0 ha) Tehsil Marwar Jn., District Pali, Rajasthan
EQMS INDIA PVT. LTD. 7
Hindustan Times Dated 14-8-2014

EIA/EMP report of Sand/Bajri Mine (With ML Area of 4280.0 ha) Tehsil Marwar Jn., District Pali, Rajasthan
EQMS INDIA PVT. LTD. 8

EIA/EMP report of Sand/Bajri Mine (With ML Area of 4280.0 ha) Tehsil Marwar Jn., District Pali, Rajasthan
EQMS INDIA PVT. LTD. 9

EIA/EMP report of Sand/Bajri Mine (With ML Area of 4280.0 ha) Tehsil Marwar Jn., District Pali, Rajasthan
EQMS INDIA PVT. LTD. 10

EIA/EMP report of Sand/Bajri Mine (With ML Area of 4280.0 ha) Tehsil Marwar Jn., District Pali, Rajasthan
EQMS INDIA PVT. LTD. 11

EIA/EMP report of Sand/Bajri Mine (With ML Area of 4280.0 ha) Tehsil Marwar Jn., District Pali, Rajasthan
EQMS INDIA PVT. LTD. 12

EIA/EMP report of Sand/Bajri Mine (With ML Area of 4280.0 ha) Tehsil Marwar Jn., District Pali, Rajasthan
EQMS INDIA PVT. LTD. 13

EIA/EMP report of Sand/Bajri Mine (With ML Area of 4280.0 ha) Tehsil Marwar Jn., District Pali, Rajasthan
EQMS INDIA PVT. LTD. 14

EIA/EMP report of Sand/Bajri Mine (With ML Area of 4280.0 ha) Tehsil Marwar Jn., District Pali, Rajasthan
EQMS INDIA PVT. LTD. 15
Summary/details of public hearing in tabular form :
Issues raised by
the Public
Response/Commitment
of Project Proponents
Suggestions made
by the Public Hearing
Panel
Action Plan
Reference in EIA
Doc
Shri Tula Ram
Devasi R/o
Mukamsingh
Suggested that the
plantation should be
carried out along
the riverbank.
Recommended
NOC to the sand
mining project
The plantation shall be
carried out on the upper
terraces and along haul
roads as per green belt
development plan
contained in the EMP.
The PP shall be
responsible for the
maintenance of the
plantation during the
project period.
Section 9.3
(Green Belt
Development Plan –
Rs. 6 lac per annum)
Shri Omkar Nath,
R/o Sehwas
Stated that by
carrying out mining,
the riverbed level
will be lowered and
shall be helpful in
flood control
There shall be general
lowering of the FSL at the
mined out sections
- Section 1.1
Shri Nathasingh R/o
Dutawas
Suggested that the
vehicle deployed for
transporation of
minerals should be
covered
As per approved mine
plan, the transportation of
minerals shall be carried
through covered trucks
and overloading avoided
beyond the stipulated
capacity.
Section 4.10
Shri Raju, R/o
Dhanla
Wanted to know
about the
maintenance of
plantation and
suggested that the
unemployed should
be employed for this
The EIA document
vouches for deployment of
manpower indigenously
available during the lease
period.
The PP shall be
responsible for the
maintenance of the
plantation carried out
during the project
period. The local
people shall get the
employment for
executing mining
activities as well as
labour oriented works
under the management
plans.
Section 4.9 and 8.3.1
Shri Baburam - - -

EIA/EMP report of Sand/Bajri Mine (With ML Area of 4280.0 ha) Tehsil Marwar Jn., District Pali, Rajasthan
EQMS INDIA PVT. LTD. 16
The proposed
mining project is a
good scheme and
recommended NOC
to it.
Shri Ghanshyam,
R/o Revadiya
Expressed no
objection for mining
project
- - -
Shri Ajit Singh
Rathore,
Suggested that the
trees should be
planted along banks
of river and
expressed no
objection from the
project
The plantation shall be
carried out on the upper
terraces and along haul
roads as per green belt
development plan
contained in the EMP
- Section 9.3
(Green Belt
Development Plan –
Rs. 6 lac per annum)
Shri Hukumaram,
Dy. Sarpanch
Sehwas
Suggested that the
incidence of
overloading should
be controlled and
recommended NOC
to the project
As per approved mine
plan, the transportation of
minerals shall be carried
through covered trucks
and overloading avoided
beyond the stipulated
capacity. It is the
responsibility of the state
mine department and the
transport department to
ensure no overloading of
trucks. For effective
control on overloading of
trucks, the Hon’ble High
Court of Judicature for
Rajasthan at Jaipur Bench
vide Judgment dated
14.08.2014 has made the
P.P. solely responsible
and passed instructions to
other departments like
mining , transport and
police to ensure strict
compliance of the order.
Approved mining plan
shall be strictly
complied with.
Periodical checking of
loaded trucks at proper
“Naka” shall be carried
out by mining as well
as transport
department.
Section 4.10.2
Shri Ramesh
Kumar, R/o
Panchayat Isali
The plantation shall be
carried out as per green
belt development plan.
- Section 9.3

EIA/EMP report of Sand/Bajri Mine (With ML Area of 4280.0 ha) Tehsil Marwar Jn., District Pali, Rajasthan
EQMS INDIA PVT. LTD. 17
Suggested
extensive plantation
(Green Belt
Development Plan –
Rs. 6 lac per annum)
Shri Bhawan lal R/o
Khadio
He has no objection
in respect of the
mining project
- - -
Shri Dawood
Qureashi
Suggested
plantation to
improve aesthetic of
the area
The plantation shall be
carried out as per green
belt development plan.
- Section 9.3
(Green Belt
Development Plan –
Rs. 6 lac per annum)
Shri Sharvan Singh,
R/o Kharchi
No objection in
respect of the
mining project
- - -
Shri Arjun Singh,
R/o Sehwas
Suggested that the
overloading of the
tractors should be
avoided
As per approved mine
plan, the transportation of
minerals shall be carried
through covered trucks
and overloading avoided
beyond the stipulated
capacity
Periodical checking of
loaded trucks at proper
“Naka” shall be carried
out by mining as well
as transport
department
Section 4.10.2
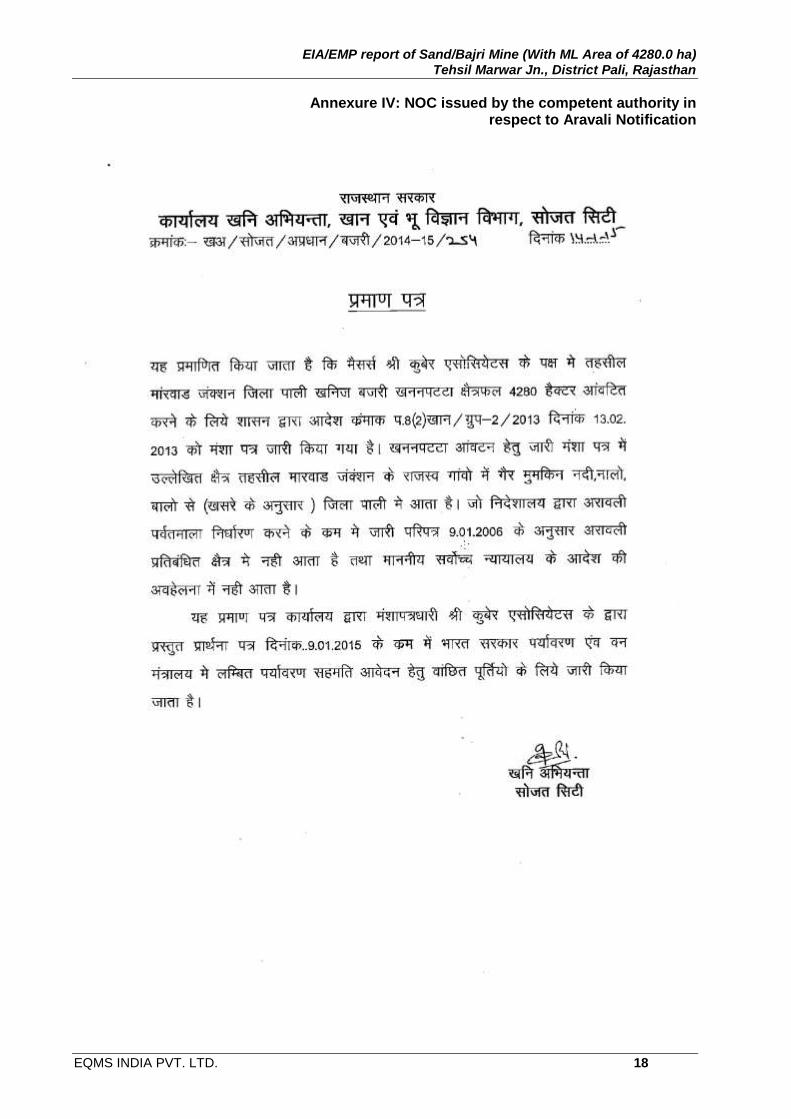
EIA/EMP report of Sand/Bajri Mine (With ML Area of 4280.0 ha) Tehsil Marwar Jn., District Pali, Rajasthan
EQMS INDIA PVT. LTD. 18
Annexure IV: NOC issued by the competent authority in respect to Aravali Notification

EIA/EMP report of Sand/Bajri Mine (With ML Area of 4280.0 ha) Tehsil Marwar Jn., District Pali, Rajasthan
EQMS INDIA PVT. LTD. 19
Annexure V: Laboratory Result Sheets of monitoring of Ambient Air Quality

EIA/EMP report of Sand/Bajri Mine (With ML Area of 4280.0 ha) Tehsil Marwar Jn., District Pali, Rajasthan
EQMS INDIA PVT. LTD. 20

EIA/EMP report of Sand/Bajri Mine (With ML Area of 4280.0 ha) Tehsil Marwar Jn., District Pali, Rajasthan
EQMS INDIA PVT. LTD. 21

EIA/EMP report of Sand/Bajri Mine (With ML Area of 4280.0 ha) Tehsil Marwar Jn., District Pali, Rajasthan
EQMS INDIA PVT. LTD. 22

EIA/EMP report of Sand/Bajri Mine (With ML Area of 4280.0 ha) Tehsil Marwar Jn., District Pali, Rajasthan
EQMS INDIA PVT. LTD. 23

EIA/EMP report of Sand/Bajri Mine (With ML Area of 4280.0 ha) Tehsil Marwar Jn., District Pali, Rajasthan
EQMS INDIA PVT. LTD. 24

EIA/EMP report of Sand/Bajri Mine (With ML Area of 4280.0 ha) Tehsil Marwar Jn., District Pali, Rajasthan
EQMS INDIA PVT. LTD. 25

EIA/EMP report of Sand/Bajri Mine (With ML Area of 4280.0 ha) Tehsil Marwar Jn., District Pali, Rajasthan
EQMS INDIA PVT. LTD. 26

EIA/EMP report of Sand/Bajri Mine (With ML Area of 4280.0 ha) Tehsil Marwar Jn., District Pali, Rajasthan
EQMS INDIA PVT. LTD. 27

EIA/EMP report of Sand/Bajri Mine (With ML Area of 4280.0 ha) Tehsil Marwar Jn., District Pali, Rajasthan
EQMS INDIA PVT. LTD. 28
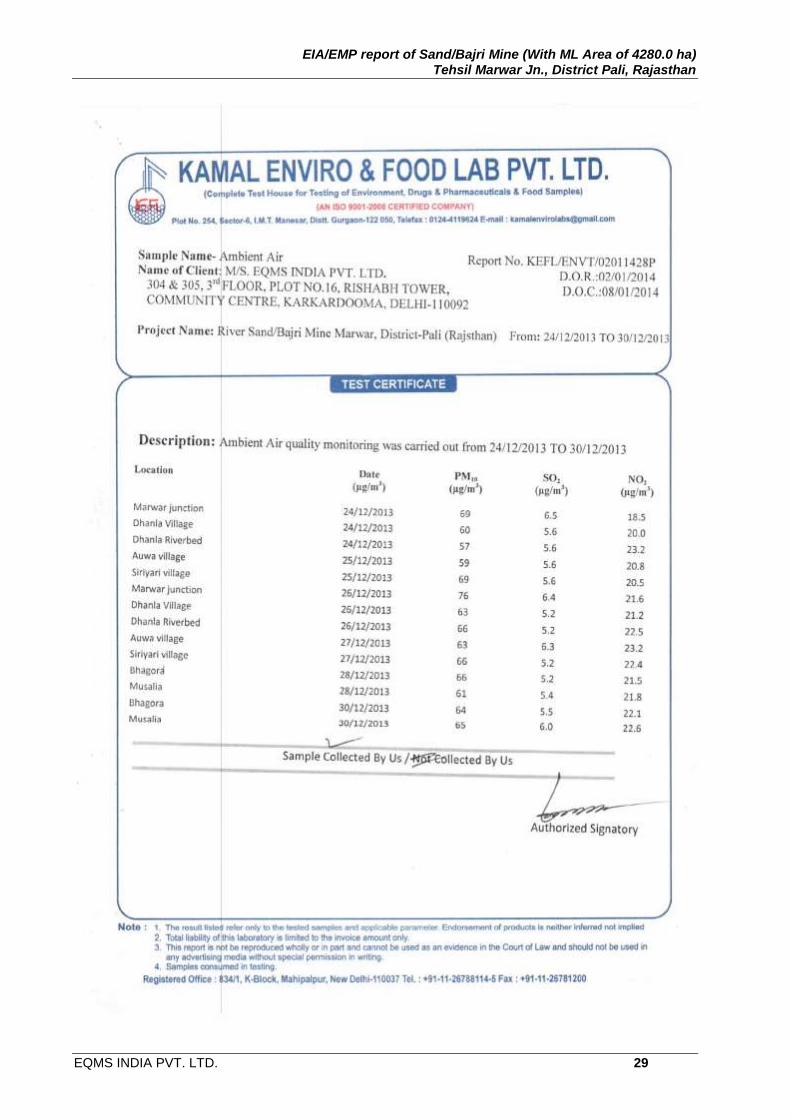
EIA/EMP report of Sand/Bajri Mine (With ML Area of 4280.0 ha) Tehsil Marwar Jn., District Pali, Rajasthan
EQMS INDIA PVT. LTD. 29

EIA/EMP report of Sand/Bajri Mine (With ML Area of 4280.0 ha) Tehsil Marwar Jn., District Pali, Rajasthan
EQMS INDIA PVT. LTD. 30

EIA/EMP report of Sand/Bajri Mine (With ML Area of 4280.0 ha) Tehsil Marwar Jn., District Pali, Rajasthan
EQMS INDIA PVT. LTD. 31

EIA/EMP report of Sand/Bajri Mine (With ML Area of 4280.0 ha) Tehsil Marwar Jn., District Pali, Rajasthan
EQMS INDIA PVT. LTD. 32
Annexure VI: Laboratory Result Sheets of Physico – Chemical Analysis of Water

EIA/EMP report of Sand/Bajri Mine (With ML Area of 4280.0 ha) Tehsil Marwar Jn., District Pali, Rajasthan
EQMS INDIA PVT. LTD. 33

EIA/EMP report of Sand/Bajri Mine (With ML Area of 4280.0 ha) Tehsil Marwar Jn., District Pali, Rajasthan
EQMS INDIA PVT. LTD. 34
Annexure VII: Laboratory Result Sheets of Physico – Chemical Analysis of Soil

EIA/EMP report of Sand/Bajri Mine (With ML Area of 4280.0 ha) Tehsil Marwar Jn., District Pali, Rajasthan
EQMS INDIA PVT. LTD. 35
Annexure VIII (A): Environmental Policy

EIA/EMP report of Sand/Bajri Mine (With ML Area of 4280.0 ha) Tehsil Marwar Jn., District Pali, Rajasthan
EQMS INDIA PVT. LTD. 36
Annexure VIII (B): Non-Compliance Reporting System

EIA/EMP report of Sand/Bajri Mine (With ML Area of 4280.0 ha) Tehsil Marwar Jn., District Pali, Rajasthan
EQMS INDIA PVT. LTD. 37
Annexure VIII (C): Organization Structure