botswana 2003 second generation hiv/aids surveillance
100
Ministry of State President THE NATIONAL AIDS COORDINATING AGENCY (NACA) BOTSWANA 2003 SECOND GENERATION HIV/AIDS SURVEILLANCE BOTSWANA 2003 SECOND GENERATION HIV/AIDS SURVEILLANCE A Technical Report December 2003
-
Upload
khangminh22 -
Category
Documents
-
view
4 -
download
0
Transcript of botswana 2003 second generation hiv/aids surveillance

Ministry of State PresidentTHE NATIONAL AIDS COORDINATING AGENCY (NACA)
��BOTSWANA 2003 SECOND GENERATION
HIV/AIDS SURVEILLANCEBOTSWANA 2003 SECOND GENERATION
HIV/AIDS SURVEILLANCE
A Technical ReportDecember 2003

For further details contact
National AIDS Coordinating Agency (NACA)Private Bag 00463
GaboroneBotswana
Tel: (+267) 390 31 88Fax: (+267) 390 32 73
www.naca.gov.bw
Photos front cover: O. Mangole - NHARSOC 2003
Design and lay-out: Op design (PTY) LTD

Botswana 2003 Second Generation HIV Surveillance Report
National AIDS Coordinating Agency (NACA) in collaboration with AIDS/STD Unit, the BOTUSA Project (CDC), District Health Teams, the Botswana Harvard Partnership and WHO
�
THE NATIONAL AIDS COORDINATING AGENCY (NACA)
BOTSWANA 2003 SECOND GENERATION HIV/AIDS
SURVEILLANCEA Technical Report
November 2003
www.naca.gov.bw
Edited by:
Dr. Kereng Masupu (NACA)
Dr. Khumo Seipone (AIDS/STD unit)
Dr. Thierry Roels (BOTUSA/CDC)
Dr. Soyeon Kim (BHP)
Mrs. Mpho Mmelesi (NACA)
Prof. Ekanem Ekanem (UNDP Consultant)
Mrs. Sarah Gaolekwe (NBTS)

Botswana 2003 Second Generation HIV Surveillance Report
National AIDS Coordinating Agency (NACA) in collaboration with AIDS/STD Unit, the BOTUSA Project (CDC), District Health Teams, the Botswana Harvard Partnership and WHO

Botswana 2003 Second Generation HIV Surveillance Report
National AIDS Coordinating Agency (NACA) in collaboration with AIDS/STD Unit, the BOTUSA Project (CDC), District Health Teams, the Botswana Harvard Partnership and WHO

Botswana 2003 Second Generation HIV Surveillance Report
National AIDS Coordinating Agency (NACA) in collaboration with AIDS/STD Unit, the BOTUSA Project (CDC), District Health Teams, the Botswana Harvard Partnership and WHO

Botswana is often cited as a success economic andgood governance story in Africa. Pivotal to thissuccess has been health, in which Botswana hadnotably reduced its infant and under-five mortal-ity and increased its life expectancy in the 90’s.
However there has been a threat to these achievementsdue to the scourge of HIV/AIDS that has reversed notableachievements made in the nation’s quality of life.
We are facing a situation where every Motswana is eitherinfected or affected; having lost a relative, friend, workmateor an acquaintance to the pandemic. For Botswana, factorsthat drive the epidemic are multiple, intertwined and com-plex and these have social-cultural and economicantecedents. In realizing the complexity and magnitude ofthe disease, Government has shown an unprecedented highlevel of political and economic commitment to its control bydeclaring war against it, and adopting a multi-sectoralapproach. Coupled with this was a call to the internationalcommunity to assist and this has resulted in tremendousresponse in the form of funding and technical support.
Locally, the private sector, civil societies including people liv-ing with HIV/AIDS (PLWA) organizations, have risen to theoccasion to form a partnership with government in fightingthe epidemic. The national response has resulted in settingup prevention programs such as behavior change and com-munication, Voluntary Counseling and Testing, STI Controland prevention of mother to child transmission (PMTCT).Care and support programs have been scaled up to includepublic provision of Highly Active Antiretroviral Therapy(HAART) and Community Home Based Care Programs.Impact mitigation and reduction in stigma have beenaddressed at all levels by providing funding for incomegenerating activities, support for orphans and vulnerablechildren, and greater involvement of PLWA in the nationalresponse.
Sentinel surveillance has been quite useful over years inproviding information on the magnitude of the problem inthe country. There is also a need to closely evaluate theextent of the scourge and the impact of the nationalresponse through special population-based survey.
The nation’s vision 2016 is halting the epidemic; reversingtrend in incidence of HIV infection and improving the qual-ity of life of the people.
“Batswana, letsema le thata ka mong wa lona!”
Ntwa e bolotse!
Festus G. MogaePresident of the Republic of Botswana(Chairman, National AIDS Council)November, 2003
i
Botswana 2003 Second Generation HIV Surveillance Report
National AIDS Coordinating Agency (NACA) in collaboration with AIDS/STD Unit, the BOTUSA Project (CDC), District Health Teams, the Botswana Harvard Partnership and WHO
FOREWORD

i i
Botswana 2003 Second Generation HIV Surveillance Report
National AIDS Coordinating Agency (NACA) in collaboration with AIDS/STD Unit, the BOTUSA Project (CDC), District Health Teams, the Botswana Harvard Partnership and WHO

i i i
Botswana 2003 Second Generation HIV Surveillance Report
National AIDS Coordinating Agency (NACA) in collaboration with AIDS/STD Unit, the BOTUSA Project (CDC), District Health Teams, the Botswana Harvard Partnership and WHO
PREFACE
HIV/AIDS is spreading relentlessly worldwide
with 40 million people infected and over 70
percent of those in sub-Saharan Africa. The
death toll continues to rise. In many devel-
oping countries HIV/AIDS has become one
of the leading causes of mortality.
Botswana is not spared, with its prevalence among preg-
nant women aged 15-49 in 2003 reaching 37.4%. The
prevalence in 2002 was 35.4% and 36.2% in 2001 sug-
gesting that the epidemic curve may have reached its
plateau state. For Botswana, there is a glimpse of hope that
the number of new infections may not be increasing dra-
matically as in the early phases of the epidemic. This asser-
tion is based on the observation that HIV prevalence in the
15-19 years old pregnant women has remained fairly stable
over the last four years. A disturbing trend however is
emerging where rural prevalence is on the increase while
urban prevalence is stabilizing. This might be a reflection of
the disparity of intervention programmes nationwide and
therefore efforts need to be re-enforced to bridge the gap
and therefore reverse the trend.
The high prevalence is coupled with an increased number
of AIDS, TB and Genital Herpes cases and other AIDS-relat-
ed illnesses. The result has been a huge burden in a limited
resource health care system, with increased bed occupancy
rates to over 100% in most medical wards and increased
average length of stay to over 14 days for medical patients
over the years. However, this trend is expected to reverse
with the introduction of anti retroviral treatment provision
in 2002, which currently has enrolled 9228 patients out of
the estimated 110 000 living with AIDS. The success of the
ARV and PMTCT programs are further expected to result in
increased life expectancy currently estimated at 56 years
and infant mortality rate at 57 per 1000 years.
Since there is no cure for AIDS at the moment and no vac-
cines against the virus are currently available, the impact of
HIV/AIDS will only be reduced through behavior change
combined with the provision of ART to those already affect-
ed as well as VCT for those with uncertain sero-status. For
Botswana, this is a bigger challenge because PMTCT data
and VCT data reveal low testing rate due to reluctance of
the population to access these services. The adoption of
positive attitude to testing is the key to prevention and
treatment, hence the reduction of the impact of the epi-
demic.
Hon MP, L Motsumi
Minister of Health
Vice Chairperson, National AIDS Council

i v
Botswana 2003 Second Generation HIV Surveillance Report
National AIDS Coordinating Agency (NACA) in collaboration with AIDS/STD Unit, the BOTUSA Project (CDC), District Health Teams, the Botswana Harvard Partnership and WHO

v
Botswana 2003 Second Generation HIV Surveillance Report
National AIDS Coordinating Agency (NACA) in collaboration with AIDS/STD Unit, the BOTUSA Project (CDC), District Health Teams, the Botswana Harvard Partnership and WHO
ACKNOWLEDGMENTS
The National AIDS Coordinating Agency in col-
laboration with the Ministry of Health,
AIDS/STD Unit, Ministry of Local Government,
Central Statistics Office and all the district
teams would like to pass their sincere gratitude
to all those who contributed in making the 2003 Second
Generation HIV surveillance a success.
Our sincere gratitude goes to all district health teams, made
up of the public health specialists, nurses and laboratory
scientists. All these personnel have shown their undivided
commitment in making this survey a success despite their
day-to-day workload.
We would like to thank all those who participated in the
data management consensus meetings, which were held in
Kasane, Maun and Gaborone for contributions they made
towards the compilation of this report. Mention must be
made to the notable contributions made by NASTAD and
CDC Regional Office in Harare. We are indebted to valuable
contributions made by Mr. Peter Carr and Dr Dennis Nash
(NASTAD) and Dr A. D. McNaghten (CDC) especially in pro-
viding technical support in the area of data management.
This report would not have been successful without the
technical contribution of institutions such as WHO,
BOTUSA/CDC, Botswana Harvard AIDS Institute, NASTAD
and other stakeholders.
Finally I would like to extend my sincere gratitude to all the
staff of National AIDS Coordinating Agency, the Ministry of
Health, Ministry of Local government, CSO staff and the
Data Management Team for the commitment and dedica-
tion they have placed in making this document a success.
A. B. Khan, MD, MPH
National Coordinator
National AIDS Coordinating Agency (NACA)

v i
Botswana 2003 Second Generation HIV Surveillance Report
National AIDS Coordinating Agency (NACA) in collaboration with AIDS/STD Unit, the BOTUSA Project (CDC), District Health Teams, the Botswana Harvard Partnership and WHO
Foreword i
Preface iii
Acknowledgements v
List of Figures viiiList of Tables ixList of Abbreviations x
Executive Summary 1
1. Introduction 3
2. Survey Objectives 4
3. Methodology 5
3.1. HIV sentinel survey 53.1.1 Sentinel population 53.1.2 Sentinel sites 53.1.3 Sample size 53.1.4 Sampling scheme 53.1.5 Duration of survey 63.1.6 Training 63.1.7 Support visits 63.1.8 Specimen handling 73.1.9 Laboratory 73.1.10. Data management 7
3.1.10.1 Data compilation, data entry and data cleaning: 73.1.10.2 Data analysis: 8
3.1.11 Assumptions in estimations 93.1.12 Limitations 10
3.2. Drug-Resistance among HIV-1c Infected, Treatment-Naive Adults in Botswana 113.3 CD4 Cellcounts among HIV-Negative Batswana 113.4 Tebelopele HIV Voluntary Counseling and Testing (VTC) Program 123.5 HIV/AIDS Case Reporting and Mortality Data 123.6 Prevention of Mother to Child Transmission (PMTCT) 123.7 Behavioural Surveys 13
CONTENTS

v i i
Botswana 2003 Second Generation HIV Surveillance Report
National AIDS Coordinating Agency (NACA) in collaboration with AIDS/STD Unit, the BOTUSA Project (CDC), District Health Teams, the Botswana Harvard Partnership and WHO
3.8 Data on Sexually Transmitted Infections 133.9 Data on Tuberculosis 13
4. Results 14
4.1. HIV sentinel surveillance 144.2. Drug-Resistance Among HIV-1c Infected, Treatment -Naive Adults in Botswana 344.3. CD4 Cell Counts Among HIV-Negative Batswana 354.4. Tebelopele VCT Programme Data. 364.5. HIV/AIDS Case Reporting and Mortality 394.6 PMTCT 444.7 Behavioural Surveys 454.8. Sexually Transmitted Infection Programme Data 484.9. Tuberculosis Programme Data 49
5. Discusssion 51
6. Conclusions 54
7. Recommendations 55
8. Appendices 57
8.1. Calculated sample sizes per district 578.2. Sentinel Survey Data Collection Form 588.3. Aggregate syphilis test result reporting form, 2003 HIV sentinel survey 598.4. First time ANC attendees during the survey period and their syphilis test results by age 608.5. Laboratory results form 618.6. a: Worksheet for calculating district and national adjusted prevalence (females). 62
b: Worksheet for Adjusted HIV Prevalence by District (Males) 638.7. Tebelopele VCT Form (Page 1) 648.7. Tebelopele VCT Form (Page 2) 658.8. HIV request form 668.9. BANGUI & ABIDJAN DEFINITIONS OF CLINICAL AIDS (IN ADULTS) 678.10. TB Register form 688.11. Comparison of 2002 and 2003 HIV Results by Individual Age Groups 698.12. Enrollment of first time Tebelopele VCT Program Attendees by Sex and Age Group 728.13. HIV Prevalence by Education Among First Time VTC Attendees 738.14. Demographic Characteristics of Makgabaneng Radio Listenership Respondents 748.15. Names of Participating Staff and Health Facilities 758.16. HIV Prevalence by site, 1992 to 2003 82

v i i i
Botswana 2003 Second Generation HIV Surveillance Report
National AIDS Coordinating Agency (NACA) in collaboration with AIDS/STD Unit, the BOTUSA Project (CDC), District Health Teams, the Botswana Harvard Partnership and WHO
Fig 1. Age-specific seroprevalence of HIV among Batswana pregnant women, 2003 HIV SentinelSurveillance
Fig 2. Adjusted HIV prevalence by residence and age, pregnant women, 2003 Sentinel Surveillance, Botswana
Fig 3. Adjusted HIV prevalence in pregnant women by district, 2003 Sentinel Surveillance, Botswana
Fig 4. HIV prevalence distribution by district, 2003 Sentinel Surveillance, pregnant women, Botswana
Fig 5. Adjusted HIV prevalence trends, 2001-2003, Sentinel Surveillance, Botswana
Fig 6. Age specific HIV prevalence trends, 2001-2003, Sentinel Surveillance, Botswana
Fig 7. Trend in HIV prevalence among pregnant women by age group, Sentinel Surveillance 1992-2003,2003 Sentinel Surveillance, Botswana
Fig 8. Syphilis test results by age group, pregnant women, 2003 Sentinel Surveillance, Botswana
Fig 9. HIV prevalence among men and women aged 15-49. Tebelopele VCT centers, 2003 Botswana
Fig 10. HIV prevalence by residence, Tebelopele VCT centers, 2000-2003, Botswana
Fig 11. HIV prevalence according to reported condom use over the past three months by gender, TebelopeleVCT centers, 2000-2003, Botswana
Fig 12. Percentage of respondents reporting consistent condom use in the previous 3 months by gender,Tebelopele VCT centers, 2000-2003, Botswana
Fig 13. Age and sex specific prevalence of HIV among those requested to undergo testing, 2000-2003,Botswana
Fig 14. HIV Positivity rates by residence, AIDS case reporting 2000 –2003, Botswana
Fig 15. Cumulative AIDS Cases in Botswana, 2000 - 2003
Fig 16. Distribution of reported AIDS cases by age, 2000-2003
Fig 17. Number of reported AIDS cases in Botswana by district, 2000-2003
Fig 18. Crude mortality rate, Botswana, 1995-2000
Fig 19. AIDS Proportional mortality ratio, Botswana, 1995-2000
Fig 20. Knowledge of HIV/AIDS among men and women: percent with correct responses to five AIDS knowl-edge questions, Makgabaneng Radio Listenership Survey 2003
Fig 21. Percentage of Respondents who ever had an HIV test by age group and gender, Makgabaneng RadioListenership Survey, 2003
Fig 22. Number of sexual partners in the last year among those who had sex (percent distribution),Makgabaneng Radio Listenership Survey, 2003
Fig 23. Condom use by gender at last act with a non-marital or non-cohabiting partner by age,Makgabaneng Radio Listenership Survey, 2003
Fig 24. Annual number of STI cases in Botswana, 1995-2001
Fig 25. Annual trends of new cases of TB per 100,000, 1991-2002
LIST OF FIGURES
17
23
24
25
27
28
29
33
36
37
37
38
38
39
40
41
42
43
43
45
46
46
47
48
50
ix
Botswana 2003 Second Generation HIV Surveillance Report
National AIDS Coordinating Agency (NACA) in collaboration with AIDS/STD Unit, the BOTUSA Project (CDC), District Health Teams, the Botswana Harvard Partnership and WHO
1. Enrollment and completeness of information, 2003 Sentinel Surveillance, pregnant women, Botswana
2. Socio-demographic characteristics of women enrolled in the 2003 Sentinel Surveillance, Botswana
3. Results of laboratory quality assurance, Pregnant Women, Botswana 2003 HIV Sentinel Surveillance
4. HIV prevalence according to reported marital status, pregnant women, 2003 HIV Sentinel Surveillance,Botswana
5. HIV prevalence according to education, pregnant women, 2003 HIV Sentinel Surveillance, Botswana
6. HIV prevalence by employment status, pregnant women, 2003 HIV Sentinel Surveillance, Botswana
7. HIV prevalence according to occupation, pregnant women, 2003 HIV Sentinel Surveillance, Botswana
8. HIV prevalence according to number of pregnancies, 2003 HIV Sentinel Surveillance, Botswana
9. Comparison of 2001, 2002 and 2003 HIV prevalence by district, pregnant women, 2003 HIV SentinelSurveillance, Botswana
10. Estimated number of HIV infected adult females per health district and age group in Botswana, basedon prevalences in pregnant women 2003 Sentinel Surveillance, Botswana
11. Estimated number of HIV infected adult males (15-49 years) per health district and age group, derivedfrom 2003 prevalence data for pregnant women, combined male and female infection rate ratiosfrom Tebelopele VCT centers and health facilities, and 2001 census population figures, 2003 SentinelSurveillance, Botswana
12. Syphilis test results per district, pregnant women, 2003 HIV Sentinel Surveillance, Botswana
13. Prevalence of genotypic resistance to ARV drugs among HIV-1C infected adult Batswana from the2001 Sentinel survey (n=71)
14. CD4 Lymphocyte Counts (Cells/mm3) of HIV-negative adults in Botswana
15. Number of HIV Requests and positivity rates by year, 2000 - 2003
16. AIDS cases by age group and year, 2000-2003
17. 2002 PMTCT participation, HIV Testing and AZT Therapy
18. 2002 TB Case notification by district, by age group, National TB Programme, Epidemiology andDisease control unit, MoH, Botswana
LIST OF TABLES
14
15
16
18
19
20
21
22
26
30
31
32
34
35
39
41
44
49
x
Botswana 2003 Second Generation HIV Surveillance Report
National AIDS Coordinating Agency (NACA) in collaboration with AIDS/STD Unit, the BOTUSA Project (CDC), District Health Teams, the Botswana Harvard Partnership and WHO
LIST OF ABBREVIATIONS
AIDSANCARVASUBAISBHPBHRIMSBOTUSACDCCICSODHTDNAEDTAELISAEPTBESRFBCHAARTHIVMOHNACANASTADNGONHRLNNRTIPCRPIPMRPMTCTPPTPTBRTSTDSTITBUNAIDSUNDPUNICEFVCTWHO/AFRO
Acquired Immuno-deficiency SyndromeAntenatal ClinicsAnti-retroviralAIDS/STD UnitBotswana AIDS Impact SurveyBotswana Harvard PartnershipBotswana HIV Response Information Management SystemPartnership between Botswana and the United States of America GovernmentsCenters for Disease Control and Prevention, Atlanta, GeorgiaConfidence IntervalCentral Statistics OfficeDistrict Health TeamDe-oxyribonucleic acidEthyl-diamino Tetra AcetateEnzyme Linked Immunosorbent AssayExtra Pulmonary TuberculosisErythrocyte Sedimentation RateFull Blood CountHighly Active Anti-Retroviral TherapyHuman Immunodeficiency VirusMinistry of HealthNational AIDS Coordinating AgencyNational Alliance of State/Territorial AIDS DirectorsNon-Governmental OrganizationNational HIV Reference LaboratoryNon-nucleotide reverse transcriptase inhibitorPolymerase Chain ReactionProtease InhibitorProportional Mortality RatioPrevention of mother-to-child transmissionPlasma Preparation TubePulmonary TuberculosisReverse TransciptaseSexually Transmitted DiseasesSexually Transmitted InfectionsTuberculosisJoint United Nations Programme on AIDSUnited Nations Development ProgrammeUnited Nations Children’s FundVoluntary Counseling and TestingWorld Health Organization Regional Office for Africa

1
Botswana 2003 Second Generation HIV Surveillance Report
National AIDS Coordinating Agency (NACA) in collaboration with AIDS/STD Unit, the BOTUSA Project (CDC), District Health Teams, the Botswana Harvard Partnership and WHO
EXECUTIVE SUMMARY
Since 1992, Botswana has been monitoring theHIV epidemic through annual sentinel surveil-lance of pregnant women attending antenatalclinics. This approach, tagged “first generationHIV surveillance” has been found useful in pro-
viding data for creating awareness of the problemamong the public and decision makers. The data havebeen used for making estimates and projections for thecountry and for mobilizing support for national HIVintervention programmes. The first generation surveil-lance did not however provide an opportunity for track-ing risky behaviours that may be fueling the epidemic. Italso did not provide a link between behavioural and bio-logical data; hence there was always the difficulty inexplaining the epidemiological patterns of the infectionand changes in prevalence observed over time. The sec-ond generation HIV/AIDS surveillance strategy embarkedupon, and presented in this report, is an attempt toexamine data from various sources in order to increasethe explanatory power of sentinel survey data andenhance use of data from other sources.
The specific objectives of this expanded surveillanceapproach were to:
• Determine the prevalence of HIV and syphilis infec-tion among pregnant women in different geograph-ic locations of Botswana
• Estimate the current number of infected personsaged 15-49 years in the general population
• Investigate the existence of HIV strains resistant toARV drugs in the Botswana population
• Describe the socio-cultural behaviours and other fac-tors that may be fueling the epidemic
• Determine the level of CD4 counts among HIV-nega-tive Batswana
The sentinel survey in 2003 was conducted in all the 22districts and a total of 7251 pregnant women attendingantenatal clinics participated. Blood samples were col-lected from June 30 to September 19, 2003 and testedfor HIV antibodies in an unlinked anonymous approachusing the Murex HIV 1.2.0 test kit and for syphilis byRapid Plasma Reagin (RPR) test.
Data from other sources were analyzed. These includedprogramme data from Tebelopele VCT centers; data onAIDS cases as well as Tuberculosis, PMTCT and sexuallytransmitted infections reported from health facilities.Behavioural data were based on the MakgabanengRadio Listenership Programme Evaluation Survey, whichcovered seven districts.
The FASCount system was used to determine absoluteCD4 and CD8 values while ViroSeq HIV-1 GenotypingSystem was used for evaluating viral resistance to ART.
Overall HIV prevalence in the country was 37.4% andranged from 25.7% in Southern to 52.2% in SelebiPhikwe district. In more than two-thirds of the countrythe prevalence was over 30% and in over one-third ofthe country the prevalence exceeded 40%. There wasno marked difference in HIV prevalence between urbanand rural areas.
The highest age-specific prevalence was observedamong those aged 25-29 years. VCT data showed sig-nificantly higher HIV prevalence among young womenthan in men of similar ages.
While the prevalence in older age groups appears to beincreasing, the prevalence in the age group 15-19 yearshas remained fairly stable ranging from 21 to 23%between 2002 and 2003. Currently, about 283,764adult Batswana aged 15-49 years are living withHIV/AIDS.

2
Botswana 2003 Second Generation HIV Surveillance Report
National AIDS Coordinating Agency (NACA) in collaboration with AIDS/STD Unit, the BOTUSA Project (CDC), District Health Teams, the Botswana Harvard Partnership and WHO
A median CD4+ count among HIV-negative Batswanawas 599 cells/mm3. Prior to the introduction of country-wide HAART, Batswana did not harbour HIV strainsresistant to ARV drugs.
The number of TB cases in the country is on the increase.Similarly, the crude mortality rate over the last decadehas been increasing while the proportional mortalityratio of AIDS has remained stable in the last few years.
From the seven districts sampled for the RadioListenership Program Evaluation Survey, about one infive young persons have correct knowledge on HIVtransmission. Condom use in the last sexual act with anon-marital and non-cohabiting partner was over 60%.However, the proportion of people with multiple part-ners in the surveyed 7 districts was still high at 32% formen and 17% for women.
From the available data, it can be observed thatHIV/AIDS in Botswana remains a great challenge. Itwould be misleading to assume that the epidemic isover. It would be tragic if there were complacency inresponse. Currently about one in three persons aged 15-49 years are living with HIV. This is a threat to the veryexistence of the nation of Botswana.
Fortunately, there is good leadership as demonstrated byhigh level of political and economic commitment on thepart of the government of Botswana. The private sector,civil societies including PLWA organizations have risen tothe occasion to form a partnership with government infighting the epidemic. The national response has result-ed in setting up prevention programs such as behaviorchange communication, Voluntary Counseling andTesting, STI Control and Prevention of mother to childtransmission (PMTCT). Care and support programs havebeen scaled up to include provision of Highly ActiveAntiretroviral Therapy and Community Home Based
Care Programs. Impact mitigation and reduction in stig-ma have been addressed at all levels by providing fund-ing for income generating activities, support for orphansand vulnerable children, and greater involvement ofPLWA. The Government, people of Botswana and col-laborating partners must maintain this momentum so asto bring the epidemic under control.
Based on the results above, the following recommenda-tions are made:
• There is a need to intensify HIV/AIDS interventionprogrammes especially among the young persons soas to reduce the rate of new infections
• In addition to sentinel surveillance, there is a need toclosely evaluate the extent of the scourge and theimpact of the national response through special pop-ulation-based surveys
• Survey design strategies that would eliminate or min-imize ecological fallacies need to be adopted in theconduct of future behavioural studies so as to enableproper linkage with biological data
• There is a need for extensive community mobilizationfor increased patronage of voluntary counseling andtesting services
• Tuberculosis control programme efforts need to beintensified and national treatment algorithms forTuberculosis as well as for STIs need to be reviewed
• There should be a scaling up of anti-retroviral pro-gramme to meet the needs of the increasing numberof infected persons
• In subsequent sentinel surveys, the minimum numberof specimens tested during quality control per labo-ratory should be increased. Criteria for acceptance ofresults should be specified in the survey protocol

3
Botswana 2003 Second Generation HIV Surveillance Report
National AIDS Coordinating Agency (NACA) in collaboration with AIDS/STD Unit, the BOTUSA Project (CDC), District Health Teams, the Botswana Harvard Partnership and WHO
1. INTRODUCTION
According to The Joint United NationsProgramme on AIDS (UNAIDS) estimates,globally, about 40 million people are cur-rently living with HIV/AIDS. An estimated5 million people became infected with
HIV/AIDS in 2003. Over the next decade, withouteffective treatment and care, they will join the ranksof the more than 20 million people who have died ofAIDS since the first case in 1981. However, the vastmajority of people have not yet acquired the HIV,enabling them to protect themselves against it.Providing adequate and affordable treatment andcare to people living with HIV, represents two of thebiggest challenges facing mankind today.
HIV/AIDS marks a severe development crisis in sub-Saharan Africa, which remains by far the worstaffected region of the world. The total number ofpeople living with HIV/AIDS in sub-Saharan Africa by2003 is between 25-28.2 million. As the impact ofAIDS continues to threaten the African society,African leaders are mounting a large-scale response tofight HIV/AIDS, targeting all sectors. Botswana isamong the 19 African nations that have establishedNational AIDS councils or commissions personallychaired by the Head of State to take charge of amulti-sectoral response to AIDS. The epidemic insome countries is still in its early stages and effectiveresponses are possible. In other countries, the epi-demic has reached an advanced stage affecting alarge percentage of the population. The epidemic issteeped in stigma and discrimination. Fear and denialalso hinder the collection of adequate data to ade-quately assess the exact magnitude of the problem.
The interplay of multiple factors obscures causal link-ages and prevents categorical conclusions. Secondgeneration surveillance compares information on HIVprevalence and the behaviours that spread it. InBotswana where the epidemic is generalized, second
generation provides information to help better under-stand the behaviours driving the epidemic and indi-cates the success of the response and provides essen-tial information for planning care and support.
The epidemic in the country is fueled by several fac-tors such as the extreme mobility of the population,high prevalence of some sexually transmitted dis-eases, sexual behavior pattern which include multiplepartners and frequent change in partners, rapidurbanization leading to breakdown of the traditionalmechanisms for controlling social and sexual behavior.Poverty and relative gender inequality among womenare all contributing factors.
Since 1992, Botswana has been monitoring the HIVepidemic through annual sentinel surveillance ofpregnant women attending antenatal clinics. Thisapproach, tagged “first generation HIV surveillance”has been found useful in providing data for creatingawareness of the problem among the public and deci-sion makers. The data have been used for makingestimates and projections for the country and formobilizing support for national HIV intervention pro-grammes. The first generation surveillance did nothowever provide an opportunity for tracking riskybehaviours that may be fueling the epidemic neitherdid it provide a link between behavioural and biolog-ical data; hence there was always the difficulty inexplaining the epidemiological patterns of the infec-tion as well as changes in prevalence observed overtime. The second generation HIV/AIDS surveillancestrategy embarked upon, and presented in this reportis an attempt to pool data from various sources (HIVsentinel seroprevalence survey, VCT programme data,PMTCT, STI and TB surveillance results, behavioral sur-veillance findings and AIDS case reporting) in order toincrease the explanatory power of sentinel surveydata and to better understand the dynamics of theepidemic.

4
Botswana 2003 Second Generation HIV Surveillance Report
National AIDS Coordinating Agency (NACA) in collaboration with AIDS/STD Unit, the BOTUSA Project (CDC), District Health Teams, the Botswana Harvard Partnership and WHO
2. SURVEY OBJECTIVES
The overall objectives of the expanded HIV surveillance survey were to obtain relevant, appropriate,sufficient and accurate data on the status of the epidemic in order to guide programming, interven-tions and policies in the country.
The specific objectives of this expanded surveillance approach were to:
• Determine the prevalence of HIV and syphilis infection among pregnant women in different geographic loca-tions of Botswana
• Estimate the current number of infected persons in the general population
• Investigate antiretroviral drug resistance (ART), resistant HIV strains
• Describe the socio-cultural behaviours and other factors that may be fueling the epidemic
• Determine the level of CD4 counts among HIV-negative Batswana

5
Botswana 2003 Second Generation HIV Surveillance Report
National AIDS Coordinating Agency (NACA) in collaboration with AIDS/STD Unit, the BOTUSA Project (CDC), District Health Teams, the Botswana Harvard Partnership and WHO
3. METHODOLOGY
3.1.1 Sentinel population
In 2003, only pregnant women were included in thesentinel survey. Inclusion and exclusion criteria (eligi-bility criteria) were developed to delineate the targetpopulation and to minimize the risk of multiple sam-pling of individuals.
Inclusion criteria:
• Pregnant women 15-49 years old with a first ANCvisit of their current pregnancy.
• Attending a public health facility that has beenselected to participate in the 2003 survey duringthe survey period that lasted from 30th Junethrough 19th September 2003.
3.1.2 Sentinel sites
The 2003 HIV sentinel surveillance survey included all22 Health Districts. Of these, seven districts wereinvolved in a resistance testing study. A major districtclinic was selected as the primary sentinel site.However, due to the inability of many major districtclinics to yield the required sample size, satellite clinicsites were also included to achieve the targeted sam-ple size. The satellite health facilities selected werethose with the highest number of ANC attendees inthe previous year.
The major criteria for selecting participating sentineland satellite sites:
• The candidate facility provides services for theselected sentinel population
• Blood is routinely drawn from patients/clients aspart of routine care or service provided at the facil-ity
• A reliable laboratory is available to perform theroutine laboratory tests as well as the serologictests for HIV antibody
• The facility is readily accessible• The facility provides services to relatively large
number of people so that an adequate sample sizecan be obtained
• The facilities are located in different geographicareas, urban and rural, or areas of special concernfor the prevention programme
• Facility staff is capable of conducting surveillance
3.1.3 Sample size
Sample sizes were calculated for each sentinel sitetaking into consideration the 2002 HIV prevalence inthe particular health district, the level of confidencedesired for the prevalence estimate, the accuracy andthe logistical feasibility.
Appendix 8.1 shows the targeted sample sizes calcu-lated for the 22 health districts. The calculated samplesize ranged from 116 to 400.
3.1.4 Sampling scheme
A consecutive sampling scheme was used. Clinic per-sonnel knowledgeable about the inclusion criteriaascertained patient eligibility and enrolled womeninto the survey at the time of the prenatal consulta-tion. During this routine antenatal consultation, thesurvey form (Appendix 8.2) was completed in additionto the collection of routine service information in theANC. Demographic Information on age, sex, maritalstatus, parity, employment status, occupation, andeducation was collected on the survey form.Aggregate syphilis data for the 12-week survey periodwas compiled from service records at the end of thesurvey using the syphilis survey form (Appendix 8.3and 8.4).
Each survey form was completed in triplicate usingserially numbered self-carbonating forms; the thirdcopy of the form remained at the originating healthfacility, the second copy of the form was sent to the
3.1. HIV SENTINEL SURVEY

6
Botswana 2003 Second Generation HIV Surveillance Report
National AIDS Coordinating Agency (NACA) in collaboration with AIDS/STD Unit, the BOTUSA Project (CDC), District Health Teams, the Botswana Harvard Partnership and WHO
District Health Office, whilst the original copy of theform was sent to NACA in batches at the end of eachweek.
Once the form was completed, the routine ANCblood was drawn consisting of one red top (5ml) tubewithout anticoagulant and one purple top (5ml) withEDTA anticoagulant. For the seven districts participat-ing in the resistance testing study, different tubeswere used. One white top tube with PPT anticoagu-lant and one purple top (5ml) with EDTA anticoagu-lant were used. No additional blood was collected.Personal identifiers were removed from the specimen(see specimen handling section) before being sent tothe laboratory.
Efforts were made to over sample women in the agegroup 15 to 19 years in three districts Gaborone,Kweneng East, and Francistown.
3.1.5 Duration of survey
The enrollment period was 12 weeks from June 30thto September 19th, 2003. All sites commenced sam-ple collection at the same time and stopped at theend of the survey period. Samples collected beyondthe survey period were not included in the analysis.
3.1.6 Training
The Surveillance Technical Working Group conducteda series of training sessions at the district level inMarch/April 2003. Health officials trained includedpublic health officers, community health nurses,matrons, and laboratory personnel. Four training ses-sions were held for the 22 DHTs (two in the south andtwo in the north). Topics that were covered included:Second generation HIV surveillance, standard operat-ing procedures, data collection tools, laboratory tech-niques, national training requirements for BHRIMS,universal safety precautions, antiretroviral therapy, andpresentation of the 2001 resistance study results. The
importance of high levels of cooperation and supportwas highlighted for the surveillance programme to besuccessful.
A consensus was reached regarding the guidelines ata fifth consensus meeting with all 22 districts repre-sented. The final guidelines were then used for train-ing health personnel at the facility level. Training washeld in June 2003 for all participating facilities. Thetraining was conducted by DHT health personnel andwas supported by the surveillance technical workinggroup in 20 districts.
The main objective was to train staff (midwives) onthe sentinel surveillance protocol and procedures,using the finalized version of the guidelines and todistribute survey material. Non-midwives and stafffrom facilities that were not on the participation listwere also trained by some DHTs in order to limit theconstraints of staff shortage.
3.1.7 Support visits
The NACA surveillance team conducted support visitsthat covered 22 districts and five follow up visits dur-ing the survey period. The objectives of these visitswere to:
• Discuss general issues regarding compliance to theguidelines
• Provide support materials• Reconcile data received at NACA with data
received from the DHT • Reconcile laboratory sentinel survey book numbers
with those received at NACA and verify fax copiesfor legibility from original copies
• Verify the sentinel survey booklet distribution listgenerated at NACA against the actual surveybooklet distribution list at DHT
• Confirm availability of survey materials using astandardized checklist
• Assess storage conditions of specimens

7
Botswana 2003 Second Generation HIV Surveillance Report
National AIDS Coordinating Agency (NACA) in collaboration with AIDS/STD Unit, the BOTUSA Project (CDC), District Health Teams, the Botswana Harvard Partnership and WHO
3.1.8 Specimen handling
After the blood was drawn, the two blood tubes werekept in a rack upright at room temperature. The pur-ple top tube was labeled with the woman’s name andwas sent to the laboratory for routinely performedtests of hemoglobin level, rhesus factor, and ABOgrouping.
After allowing the natural clotting process to occur,the serum in the red top tube was then separated intotwo 1.8 ml cryovials by the facility staff. One vial waslabeled with the patient’s name and served for theroutine syphilis test. The other vial served for theanonymous HIV test and was labeled with an adhesiveunique code number that was found on the corre-sponding form.
The blood specimens were sent to the respective dis-trict laboratories on the same day. When this was notpossible, specimens were kept in the facility’s refriger-ator at 4ºC until transportation was available.
For women who consented for an HIV test as part ofthe nation-wide PMTCT program, a separate HIVrequest form was completed and a third tube (redtop) was collected and labeled with the HIV requestcode according to the national PMTCT guidelines. TheHIV surveillance program therefore did not interferewith the PMTCT program at any stage.
3.1.9 Laboratory
Twenty-five laboratories participated in the surveyfrom the 22 districts. Seventeen of the sites did theHIV testing in their districts, while others sent theirsamples to the National Health Laboratory inGaborone. Laboratories were asked to fax the testresults on laboratory summary sheets (Appendix 8.5)to NACA at the end of each week.
Left over specimens were stored in the district labora-tory refrigerators at 4ºC and later transferred in coolboxes containing ice to the National HealthLaboratory for Quality Assurance. These leftover spec-imens were stored in a serum bank at -76ºC for fur-ther studies.
All laboratories used a standardized test kit for thesurvey specimens. The coded unlinked aliquots werescreened for HIV antibodies by Murex HIV 1.2.0 test(Murex Biotech Limited). This test has a specificity of99.91% and a sensitivity of 100%. The Rapid PlasmaReagin, RPR test (Randox Laboratories) was used forsyphilis testing.
An independent central laboratory (Botswana HIVReference Laboratory) participated in the qualityassurance (QA) program by parallel testing randomlyselected samples using diagnostic ELISA algorithm(Murex HIV 1.2.0 (Murex Biotech Limited). For eachstorage box, random numbers between 1 and 100were generated and used to select 17% of the speci-mens from each box based on sample locations with-in the 10x10 or 9x9 grid storage boxes. The sampleswere thawed for a maximum of 2 hours before beingtested and read on the universal plate reader ELx800(Bio-Tek). Some of the selected specimens could notbe tested due to insufficient volumes and clotting.
3.1.10. Data management
3.1.10.1 Data compilation, data entry and data cleaning
A team made up of technical officers from theNational AIDS Coordinating Agency (NACA), theBOTUSA/CDC Project, Botswana-Harvard AIDSInstitute Partnership, the Ministry of Health AIDS/STDUnit (ASU), the National Health Laboratory, wasresponsible for the daily management of the surveyand met weekly to discuss survey progress.

8
Botswana 2003 Second Generation HIV Surveillance Report
National AIDS Coordinating Agency (NACA) in collaboration with AIDS/STD Unit, the BOTUSA Project (CDC), District Health Teams, the Botswana Harvard Partnership and WHO
NACA staff received survey data weekly from twoindependent sources:
1) district health teams mailed batches of question-naires with the socio-demographic data and
2) participating laboratories faxed HIV test results.Before entry, data collection forms were firstchecked for completeness of data, obvious errorsand inconsistencies. Phone calls were made to thedistricts for clarification and correcting errors.
Data entry and laboratory result forms were thenscanned and entered in an Information BankDatabase system. This procedure allows for efficientlong-term electronic storage and retrieval of docu-ment, images of data collection forms. Two inde-pendent pairs of data entry clerks then entered thescanned images into the database.
The databases were exported in a dbase IV (DbF) for-mat and were compared for inconsistencies. EpiInfo2002 statistical software (Centers for Disease Controland Prevention, Atlanta, GA, USA) was used for thisvalidation procedure. A series of validation runs anddata entry error corrections were performed beforethe two datasets were 100% concordant.
Consensus meetings (two in the North, two in theSouth) were organized with representatives fromNACA, NASTAD, National Health Laboratory, the dis-trict health teams, and the laboratory personnel toreconcile missing data, such as forms without corre-sponding results, or results for which there were nocorresponding forms.
3.1.10.2 Data analysis
Analysis was done using EpiInfo 2002, STATA (STATACorporation, College Station, TX, USA), StatXact ver-sion 3.0.2. (Cytel Software Corporation) and SAS.
For each district, crude HIV prevalence per age group,civil status, education, employment, occupation, andnumber pregnancies were calculated.
HIV prevalence by location type (urban vs. rural) wasalso calculated. The Health districts were classified asurban or rural as follows: Urban: Serowe/Palapye, Kweneng East, Southern,Mahalapye, Kgatleng, South East, Gaborone,Francistown, Lobatse, Selebi Phikwe.
Rural: Ngami, North East, Bobirwa, Gantsi, Chobe,Kgalagadi, Tutume, Boteti, Okavango, KwenengWest, Goodhope, Hukuntsi.
HIV prevalence was calculated using direct standardi-zation as follows:
An estimate of female HIV prevalence for each districtand Botswana as a whole was calculated using directstandardization as follows: (Appendix 8.6.a):
A) Estimating female HIV prevalence for eachdistrict and Botswana
• The exact female population for each district in the6 age groups of interest (15-19 years, 20-24 years,25-29 years, 30-34 years, 35-39 years, and 40-49)was obtained from the 2001 national census data(Appendix 8.6.a - yellow columns).
• HIV prevalence was calculated for each of the 22districts by age group, using 2003 BotswanaSentinel Surveillance data. For Gantsi 2001 and2002 data were combined to estimate 2003 preva-lence.
• This age-specific prevalence was then multiplied bythe corresponding age and district-specific popula-tion to determine the number of infected womenin each age category by district.
• The sum of the number of infected women for allage groups and districts yielded the total infected

9
Botswana 2003 Second Generation HIV Surveillance Report
National AIDS Coordinating Agency (NACA) in collaboration with AIDS/STD Unit, the BOTUSA Project (CDC), District Health Teams, the Botswana Harvard Partnership and WHO
women 15-49 years in Botswana• This number of infected women was divided by the
total female population for each age group by dis-trict to provide an adjusted district HIV prevalence
• The adjusted national prevalence was then calcu-lated by dividing the total number of infectedwomen for all districts divided by the total femalepopulation 15-49 years in Botswana. Robust vari-ances obtained from logistic regression modelswere used to calculate the 95% CI for the adjust-ed prevalence
NOTE: Statistical comparisons of HIV prevalenceexclude Gantsi in determining p-values.
B) Estimate of the total number of HIV infectionamong males 15-49 years old
• The exact male population for each district in the 6age groups of interest (15-19 years, 20-24 years,25-29 years, 30-34 years, 35-39 years, and 40-49)was obtained from the 2001 national census data(Appendix 8.6.b).
• The age-specific HIV prevalence from the 2003survey for each of the six age groups in pregnantwomen in each of the 22 districts was used as thestarting point.
• This prevalence was then multiplied by a male tofemale infection ratio correction factor, i.e. thecombined male-to-female HIV infection ratiosobtained from the Tebelopele Stand Alone VCTand integrated VCT from health facilities.
• This “corrected” prevalence was then multiplied bythe 2003 (15-49 years old) male population todetermine the number of infected men per district.
C) Estimate of the total number of infections(both males and females)
A correction factor for females and males, reflectingthe natural increase in population from 2001 to 2003,
was applied to this number. The correction factor forwomen was 2.5% per year and for men was 2.6%per year.
The addition of the number of infected females andinfected males gave the total number of infected per-sons (age 15-49) in Botswana.
D) HIV Prevalence TrendsFor sentinel surveys conducted from 1992 to 1999,crude estimates of prevalence were calculated andincluded women from non-consistant health districtsexcept for Francistown and Gaborone. Raw data fromsurveys from 1992 to 1999 were not available to re-compute the adjusted prevalences. The 2000 surveyincluded 6 health districts and women aged 15 to 49years. From 2001 to 2003, surveys included womenfrom all 22 health districts and of ages 15 to 49. Forcomparisons of HIV prevalence for various age groupsthat are made over time the following was done:
1) The prevalence for women aged 15-19 and aged20-24 for 1992 to 2000 are crude estimates.Prevalence for women aged 15-19 and aged 20-24for 2001 to 2003 are district adjusted estimates.
2) For comparison of the young age groups to olderwomen, prevalence for women 25-49 are present-ed. The prevalence for women aged 25-49 for1992 to 2000 are based on data for ages 25-44.Estimates are adjusted to the age distribution ofBotswana in 2001 and for 2001 to 2003 are ageand district adjusted.
3.1.11 Assumptions in estimations
The assumptions made by the data managementteam were as follows:
Females:The HIV prevalence among pregnant women aged

10
Botswana 2003 Second Generation HIV Surveillance Report
National AIDS Coordinating Agency (NACA) in collaboration with AIDS/STD Unit, the BOTUSA Project (CDC), District Health Teams, the Botswana Harvard Partnership and WHO
15-49 years attending public antenatal clinics in a dis-trict is representative of the HIV prevalence among allpregnant women in the same age group in that dis-trict.
The HIV prevalence among pregnant women 15-49years in a district is representative of the HIV preva-lence among women of the same age group in thatdistrict.
The rate of natural increase in the female populationremained fairly stable over the two- year period 2002-2003.
Males:Male-to-female HIV infection ratios of the first timeattendees at both stand-alone (Tebelopele) and inte-grated Voluntary Counseling and Testing (VCT) cen-ters in Health facilities are representative of the male-to-female infection ratios in the general population.
The following male-to-female prevalence ratios wereused:
Age Group Prevalence Correction Ratio15-19 0.0820-24 0.3025-29 0.5630-34 0.8235-39 1.0540-49 1.24
The rate of natural increase in the male populationremained fairly stable over the two-year period 2002-2003.
3.1.12 Limitations
The 2003 HIV sentinel surveillance had the followinglimitations:
• The WHO guidelines recommend working with ahealth facility as a sentinel site. In the Botswanacontext, however, several satellite sites needed tobe combined to achieve the required sample size.
• The WHO recommended minimum sample size of250 was not feasible for some districts. The samplesizes obtained for each district had a wide range.Hence, the HIV prevalence estimates of the respec-tive districts have varying degrees of accuracy,which might affect the accuracy of the nationalsummary estimate.
• Data from Gantsi collected in 2003 was excludedfrom analysis for two main reasons. Out of the 91samples retested by an independent QA laborato-ry, 28 (31%) yielded discordant results.Furthermore, a comparison of the results for thisyear with that of last year indicate that HIV preva-lence in the district has doubled within this inter-val. From the general pattern observed in all theother districts, and from epidemiological point ofview, this doubling in prevalence in one yearseemed an unlikely occurrence. For these reasons,data from this district was excluded from theanalysis. In making national estimates for the num-ber of infections in the country, the prevalenceused for this District was the weighted mean of the2001 and the 2002 prevalence.
• Projected population figures for 2003 by agegroups were not available. Therefore the correctionfactor reflecting population increase applied uni-formly to all age groups might have differed fromthe actual.

11
Botswana 2003 Second Generation HIV Surveillance Report
National AIDS Coordinating Agency (NACA) in collaboration with AIDS/STD Unit, the BOTUSA Project (CDC), District Health Teams, the Botswana Harvard Partnership and WHO
In order to evaluate the prevalence of drug resistanceon a population level prior to the initiation ofBotswana’s public national ARV treatment program(background baseline resistance), samples from the2001 HIV Sentinel Surveillance were analysed forbaseline drug resistance of HIV-1C by genotyping arepresentative number of samples from the northernand the southern part of the country (71 samples intotal) and key results are summarized in Table 13. Viralgenotyping was performed by using ViroSeq HIV-1Genotyping System (Celera Diagnostics (formerApplied Biosystems, Inc. (ABI)), Alameda, CA), accord-ing to the manufacturer’s instructions. Briefly, HIV-1RNA was extracted from viral particles pelleted fromplasma by isopropanol/ethanol precipitation, convert-
ed to cDNA and then amplified in PCR. The amplicon(~ 1500 bp) represented the HIV-1 pol region span-ning the entire protease and the first 335 codons ofRT. The PCR product was then sequenced (bothstrands) using 6 different primers and Big Dye chem-istry on an ABI 3100 Genetic Analyser. ViroSeq HIVAnalysis software was used for assembling and edit-ing the sequences. The software compares the samplesequence with HXB2 and identifies mutations knownto be associated with resistance to the different drugs.The Stanford HIV resistance database was also used toanalyze for resistance mutations. This databaseincludes more recently identified resistance mutationscompared to the Viroseq Software.(2000).
3.2 DRUG-RESISTANCE AMONG HIV-1C INFECTED, TREATMENT- NAIVE ADULTS IN BOTSWANA
3.3 CD4 CELLCOUNTS AMONG HIV-NEGATIVE BATSWANA
Samples from the Botswana 2001 HIV SentinelSurveillance survey were used to describe CD4+ lym-phocyte reference ranges. In total, 589 SentinelSurveillance samples were collected, and of these 499were suitable for T-lymphocyte subset enumeration ofwhich 251 (50%) were HIV-negative. Unlysed, wholeblood samples were collected in EDTA (BectonDickinson) to prevent clotting. Blood samples werecollected in the morning and were transported to theNational HIV Reference Laboratory at ambient tem-perature. Only samples that arrived at the laboratorywithin 24 hours of collection were analyzed.
HIV-1 screening of all samples was performed by par-
allel ELISA testing using Murex HIV 1.2.0 (AbbottPharmaceuticals, Inc.) and Ortho HIV-1/HIV-2 AB-Capture ELISA Test System (Ortho-Clinical Diagnostics,Inc) assays to detect the presence of HIV-1 and HIV-2antibodies.
FACSCount System (Becton Dickinson) was used toenumerate absolute values for CD4 (helper/ inducer Tlymphocytes) and CD8 (suppressor/ cytotoxic T lym-phocytes) as well as CD4+ to CD8+ ratios for eachsample. The FACSCount instrument used for thisstudy was validated against two independentFACSCount Systems.

12
Botswana 2003 Second Generation HIV Surveillance Report
National AIDS Coordinating Agency (NACA) in collaboration with AIDS/STD Unit, the BOTUSA Project (CDC), District Health Teams, the Botswana Harvard Partnership and WHO
3.4 TEBELOPELE HIV VOLUNTARY COUNSELING AND TESTING (VCT) PROGRAM
3.5 HIV/AIDS CASE REPORTING AND MORTALITY DATA
3.6 PREVENTION OF MOTHER TO CHILD TRANSMISSION (PMTCT)
The main objective of this program is to establish anetwork of 16 free standing Tebelopele VCT centersin Botswana. Secondary objectives include the mobi-lization of the community in support of VCT andbehavior change, establishing a network for referralprocedures for clients, and discouraging stigmatiza-tion of HIV/AIDS. The first centre was opened in April2000 and currently 16 centres are operational.Several centers have established satellite as well asmobile testing sites. At all centers, qualified andtrained personnel provide HIV voluntary counseling(pre and post) and testing with same-day test results.
An algorithm consisting of two rapid immunoassaystests is used to test the whole blood for HIV antibod-ies. In case of discordant results, a third rapid test is
used as a tiebreaker or the specimen is re-tested bydouble ELISA algorithm. The Ministry of Health hasvalidated the rapid test kit algorithm. A standard formis completed for all clients who visit the center regard-less first or second visit (Appendix 8.7).
Anonymous information is collected on socio-demo-graphics, occupation, number of sexual partners, con-dom use, clinical symptoms, and a few other charac-teristics of interest. Clients go through an extensivepost-counseling session with the development of a riskreduction plan. HIV sero-positive persons are referred toappropriate clinics and/or organizations for follow-upand support (Isoniazid preventive therapy, ARV evalua-tion, mother-to- child transmission for pregnantwomen, associations of People living with AIDS).
A standardized HIV request form (Appendix 8.8) isused in the country to report HIV and AIDS cases fromhealth facilities. The form captures information ondemographic characteristics, reasons for testing, pre-senting symptoms, and exposure to specific risk fac-tors. Clinicians complete the form for various servicereasons: voluntary counseling, Prevention of Motherto Child Transmission (PMTCT), rape, injury, and clini-cal suspect cases. Forms are routinely completed atthe health facility and sent to the Ministry of Health
(MOH) on a monthly basis. The AIDS case definitionused in the country as well as for this data analysis isthe Abidjan definition (Appendix 8.9 Bangui defini-tion plus a confirmatory HIV laboratory test).
The crude mortality data are analyzed from the facili-ty inpatient deaths within public health delivery sys-tem. Sources of these data were the annual CentralStatistics Office Vital Statistics reports 1995-2002.
In Botswana, staff at the health facilities maintainslogbooks with aggregate PMTCT programme data.Information collected includes amongst others,numbers of ANC attendance, number of pregnantwomen counseled and tested for HIV, number of HIVpositive women, provision of AZT, Nevirapine, and
infant formula as replacement feeding. Women con-senting for HIV testing complete the standardizedHIV request form mentioned above. This formtogether with the blood sample is forwarded to therespective district laboratories where it will be testedby parallel ELISA.

13
Botswana 2003 Second Generation HIV Surveillance Report
National AIDS Coordinating Agency (NACA) in collaboration with AIDS/STD Unit, the BOTUSA Project (CDC), District Health Teams, the Botswana Harvard Partnership and WHO
3.7 BEHAVIOURAL SURVEYS
The behavioural data used in this report is based onthe Makgabaneng radio drama listenership survey.Makgabaneng is a weekly, nationally broadcastentertainment-education radio serial drama firstaired in 2001 to support HIV prevention efforts inBotswana. It is written and produced by Batswanawith support from the U.S. Centers for DiseaseControl and Prevention, Media Support Solutions,and the Government of Botswana’s Ministry ofInformation and Broadcasting.
To assess listenership, a random sample of 1730households was selected from seven districts:Ngami, Serowe/Palapye, Southern, Francistown,Kgatleng, Selebi Phikwe, and Gaborone. 60 clusters(enumeration areas or EAs) were selected from theseseven districts with the number of EAs per district
proportional to the population size. 30 householdswere randomly selected per EA, and one 15-49 yearold, Setswana-speaking household member wasrandomly selected per household and approachedfor interview. Protocol and questionnaires were sub-mitted and cleared by Institutional ethical reviewboards in Botswana and the United States.Interviewers were trained for 2 weeks and 3 pilottests were conducted before the 4 teams startedfieldwork. Data was collected between February andMay 2003. Interviews were sex-matched. The surveyinstrument included questions about radio-listeningpatterns, response to Makgabaneng, knowledgeand psychosocial measures related to HIV/AIDS, sex-ual behavior, VCT, PMTCT, and stigma towards thoseinfected.
3.8 DATA ON SEXUALLY TRANSMITTED INFECTIONS
In Botswana, the STI program is based on the syn-dromic management approach. The STI data were
derived from the CSO Health statistics reports 1995-2000.
3.9 DATA ON TUBERCULOSIS
The Botswana National TB program reports all diag-nosed cases including pulmonary Tuberculosis (PTB)cases that were not confirmed by positive sputumresults and all cases of extra pulmonary tuberculosis(EPTB). The reporting system follows theInternational Union Against Tuberculosis and LungDisease/WHO guidelines for TB recording andreporting.
Most of the case finding for tuberculosis is done pas-sively. Patients present voluntarily to facilities. Adiagnosis of TB is suspected on the basis of symp-toms and clinical findings. Screening of tuberculosisis done by all health workers in the different facili-ties. Sputum is usually the first investigation to becarried out. Other diagnostic procedures such as
chest x-ray, blood FBC and ESR are also done.Each facility keeps a register of TB cases (Appendix8.10). These forms are submitted to the DHT on amonthly basis. The DHT collates this information in auser-friendly menu driven computer program using aDOS based software (Epi-Info 6).
The desk review was done using the following doc-uments:• The Global Plan to Stop Tuberculosis. • The Tuberculosis Statistics-2002 in Botswana. • Evaluation of the Botswana National Tuberculosis
(TB) Programme 1999. • National Tuberculosis Control Programme Report
of 2002.

14
Botswana 2003 Second Generation HIV Surveillance Report
National AIDS Coordinating Agency (NACA) in collaboration with AIDS/STD Unit, the BOTUSA Project (CDC), District Health Teams, the Botswana Harvard Partnership and WHO
4.1. HIV SENTINEL SURVEILLANCE
NgamiNorth EastSerowe/PalapyeBobirwaKweneng EastSouthernGantsiMahalapyeKgatlengChobeKgalagadi Tutume BotetiOkavangoGaboroneFrancistownSouth EastLobatseSelebi PhikweKweneng WestGoodhopeHukuntsi
Total
403233423266555437195394369121170454318352577647317251321198146104
7251
6060126238532612106101210742
177
561468610472121011385100020
147
16514513101821392593511839939132
403
3762223892555223590
326353115161429260328555593306246302190137100
6524
93%95%92%96%94%82%0%83%96%95%95%94%82%93%96%92%97%98%94%96%94%96%
90%
Sentinel Site Enrolled
No.
Forms no result Result no form
No.
Unusable for
other reasons*
Used for analysis
No. %
Table 1: Enrollment and completeness of information, pregnant women, 2003 Sentinel Surveillance,Botswana.
A total of 7,251 women were enrolled in the 2003 survey out of which 6,524 or 90% (median of 304 per dis-trict, range 0 – 593) were eligible for inclusion in the analysis. The other 727 were excluded from the analysis forvarious reasons such as missing results (24%), missing forms (20%), hemolyzed specimens (6%), failure to meetthe specified age and date inclusion criteria (20%), unusually high discordance rates (23%) or other reasons(6%). All districts enrolled at least 100 women.
*44 women had hemolyzed specimen and could not be tested, 48 had an interview date outside the survey, 96 were younger than 15 or older than 49, 168
for high discordance, and 47 for other reasons.
4.RESULTS

15
Botswana 2003 Second Generation HIV Surveillance Report
National AIDS Coordinating Agency (NACA) in collaboration with AIDS/STD Unit, the BOTUSA Project (CDC), District Health Teams, the Botswana Harvard Partnership and WHO
115022891449867514255
4457705242
48314594290237
13572385464346
14037165693696
227628251423
17.635.122.213.37.93.9
6.911.981.2
7.522.666.33.7
20.93.78.467.0
22.011.28.957.9
34.943.321.8
Characteristic N %
Table 2: Socio-demographic characteristics of women enrolled in the 2003 Sentinel Surveillance,Botswana.
Age group (n=6524)15-1920-2425-2930-3435-3940-49
Marital status (n=6457)Living togetherMarriedSingle
Educational level (n=6469)NonePrimarySecondaryUniversity
Employment status (n=6487)Regular jobSelf-employedTemporary jobsUnemployed
Occupation (n=6384)Domestic workerOffice workerStudentOther
Number of pregnancies (n=6524)12 to 3>3
The mean age of the women was 25.6 years (median 24 years); 18% of the women surveyed were younger than20 years of age and 35% of women were 20-24 years of age. Over 80% of the women were single. Close to8% of the women had received no formal education and approximately two-thirds of them were unemployed.The most frequent single occupation cited by the women was domestic worker. Students comprised 9% of thegroup. For about a third of the women, this was their first pregnancy.

16
Botswana 2003 Second Generation HIV Surveillance Report
National AIDS Coordinating Agency (NACA) in collaboration with AIDS/STD Unit, the BOTUSA Project (CDC), District Health Teams, the Botswana Harvard Partnership and WHO
Table 3: Results of laboratory quality assurance, pregnant women, Botswana 2003 HIV SentinelSurveillance
Laboratoy
95% Cl
Discordance
% No.
% of totallaboratoryspecimens
Number of specimen re-tested
Number of results
used in analysis
Athlone Laboratory Gweta Primary Hospital LaboratoryTutume Primary Hospital LaboratoryGantsi Hospital Laboratory *Mahalapye Hospital LaboratorySefhare LaboratoryHukuntsi Primary Hospital LabDRM Hospital Laboratory Masunga Primary HospitalRakops Primary Hospital Scottish Livingstone Hospital LabThamaga Primary Hospital LabSelebi Phikwe Government HospitalNational Blood Transfusion LabBobonong LabBamalete Lutheran LabLetlhakane Hospital LabGoodHope Hospital LabTotal excluding Gantsi*
24663
36616922572
10034922270
578134302
321218574
190136
6524
19090
91187
716
15800
9517
27145326100
111450
261
na281012
11nana92
443820
na1
147
13.711.1
na30.85.3
14.312.57.0nana
9.511.816.28.47.70.0na
9.110.1
9.1-19.40.3-48.2
na21.5-41.32.6-9.60.4-57.91.6-38.33.5-12.2
nana
4.4-17.21.5-36.412.1-21.26.0-11.30.9-25.10.0-30.8
na0.2-41.38.6-11.8
77.214.30.0
53.883.19.7
16.045.30.00.0
16.412.789.714.114.113.50.08.1
22.2
The independent National HIV Reference Laboratory (B.H.P.) re-tested 1450 (22%) of the 6523 specimens col-lected for the survey for which we had results and demographics. Overall, 175 specimens gave discordant results.One laboratory (Gantsi Hospital laboratory) gave an unusually high discordance rate of 31% and the site wassubsequently excluded from the analysis. The overall discordance rate excluding Gantsi was 10%.
* Not used in the analysis

17
Botswana 2003 Second Generation HIV Surveillance Report
National AIDS Coordinating Agency (NACA) in collaboration with AIDS/STD Unit, the BOTUSA Project (CDC), District Health Teams, the Botswana Harvard Partnership and WHO
Figure 1: Age- specific seroprevalence of HIV among Batswana pregnant women, 2003 HIV Sentinel Survey
The highest HIV prevalence is consistently in the 25-29 year age group in which prevalence has been atapproximately 50% for the past three years. The lowest rates are among women aged 15-19 years.

18
Botswana 2003 Second Generation HIV Surveillance Report
National AIDS Coordinating Agency (NACA) in collaboration with AIDS/STD Unit, the BOTUSA Project (CDC), District Health Teams, the Botswana Harvard Partnership and WHO
HIV prevalence differed by marital status. Overall HIV prevalence was highest among unmarried women liv-ing together with partners (range: 0.0% in Chobe to 73.7% in Selebi-Phikwe) compared to those who weremarried. HIV prevalence was also consistently higher among single women (range: 26.9% in Southern to56.7% in Bobirwa) than those who were married (range: 14.8% in Kweneng West to 43.2% in Boteti) forall districts except for Ngami, Kgatleng, Kgalagadi, and Boteti.
NgamiNorth EastSerowe/PalapyeBobirwaKweneng EastSouthernMahalapyeKgatlengChobeKgalagadiTutumeBotetiOkavangoGaboroneFrancistownSouth EastLobatseSelebi PhikweKweneng WestGoodhopeHukuntsi
Total%
29317731321542829727530810113833320424447546020519624814011676
524281.2
36.244.647.056.733.426.942.531.253.530.443.236.834.445.949.829.334.754.430.037.132.9
40.2
53315424634031321112713739596550203127911
77011.9
39.622.631.541.722.222.516.137.518.233.322.543.233.337.318.520.015.038.714.822.227.3
27.8
26111714271618122101915432062462519201112
4456.9
61.563.664.757.155.643.833.358.30.0
50.047.453.339.565.054.823.936.073.715.063.625.0
47.2
37221938425351835332435211416042325632655458730124129818713699
6457
Sentinel Site SingleNo. % Pos
MarriedNo. % Pos
Living TogetherNo. % Pos
Total No.
11 women were divorced, 10 separated, 28 were widowed and 18 did not answer.
Table 4: HIV prevalence according to reported marital status, pregnant women, 2003 SentinelSurveillance, Botswana.

19
Botswana 2003 Second Generation HIV Surveillance Report
National AIDS Coordinating Agency (NACA) in collaboration with AIDS/STD Unit, the BOTUSA Project (CDC), District Health Teams, the Botswana Harvard Partnership and WHO
Table 5: HIV prevalence according to education, pregnant women, 2003 Sentinel Surveillance, Botswana.
NgamiNorth EastSerowe/PalapyeBobirwaKweneng EastSouthernMahalapyeKgatlengChobeKgalagadiTutumeBotetiOkavangoGaboroneFrancistownSouth EastLobatseSelebi PhikweKweneng WestGoodhopeHukuntsi
Total%
3217271828281712517403571191910101739148
4837.5
53.135.355.661.121.414.347.133.340.029.415.025.723.952.636.840.050.058.838.514.337.5
34.4
905886661177883673350117461207392504349704031
145922.6
38.946.653.553.040.234.639.849.363.632.045.347.844.253.452.240.041.963.332.935.035.5
44.7
2461432551583492382162657692258159135436454212168222797950
429066.3
36.642.744.755.132.726.540.328.743.432.642.239.031.945.646.724.531.552.716.543.030.0
38.8
74161119127912101812421332012136
2373.7
14.325.06.3
63.621.125.028.633.30.00.0
20.033.3
100.016.738.124.225.025.00.0
100.016.7
26.6
37522238425351335632335311516142525832755258630524130018913695
6469
Sentinel Site NoneNo. % Pos
PrimaryNo. % Pos
SecondaryNo. % Pos
UniversityNo. % Pos
Total N0.
For 55 women, educational background could not be determined.
There was no consistent pattern of relationship between level of education and HIV prevalence. It appearshowever that those with primary education generally had higher rates than their counterparts. The samplesizes for respondents with university level of education in all, but one district was very small (less than 30).

20
Botswana 2003 Second Generation HIV Surveillance Report
National AIDS Coordinating Agency (NACA) in collaboration with AIDS/STD Unit, the BOTUSA Project (CDC), District Health Teams, the Botswana Harvard Partnership and WHO
Table 6: HIV prevalence by employment status, pregnant women, 2003 Sentinel Surveillance, Botswana
There was little variation in HIV prevalence between employment categories. In five districts, HIV prevalencewas highest among those with regular employment compared with those in other employment categories.In seven other districts, HIV prevalence was highest among those self-employed.
NgamiNorth EastSerowe/PalapyeBobirwaKweneng EastSouthernMahalapyeKgatlengChobeKgalagadiTutumeBotetiOkavangoGaboroneFrancistownSouth EastLobatseSelebi PhikweKweneng WestGoodhopeHukuntsi
Total%
2761332711953672532262246311431517027129836015215119314910164
434667.0
39.535.348.352.833.025.736.332.655.631.639.034.733.945.044.729.633.848.726.838.628.1
38.2
64427334896246784116655227214160105697661721
135720.9
34.452.441.167.631.533.943.532.143.937.541.530.848.145.850.021.931.959.216.747.128.6
40.8
1940302143322937925352721203634201734134
5468.4
42.155.046.761.932.631.337.935.133.332.045.755.633.330.050.035.340.070.629.446.275.0
41.9
137124201020142514108223214611167
2383.7
30.857.133.350.040.030.065.035.70.0
20.035.790.037.563.653.128.633.363.60.00.0
28.6
45.0
37222238625451935732135311516042925932755458830524629719013796
6487
Sentinel Site UnemployedNo. % Pos
Regular JobNo. % Pos
Temporary JobNo. % Pos
Self EmployedNo. % Pos
TotalNo.
37 women did not reveal their employment status.

21
Botswana 2003 Second Generation HIV Surveillance Report
National AIDS Coordinating Agency (NACA) in collaboration with AIDS/STD Unit, the BOTUSA Project (CDC), District Health Teams, the Botswana Harvard Partnership and WHO
NgamiNorth EastSerowe/PalapyeBobirwaKweneng EastSouthernMahalapyeKgatlengChobeKgalagadiTutumeBotetiOkavangoGaboroneFrancistownSouth EastLobatseSelebi PhikweKweneng WestGoodhopeHukuntsi
Total%
644481421288282753746121814071110564069644822
140322.0
48.443.255.661.933.635.447.646.759.534.847.940.732.536.648.219.632.552.229.733.318.2
41.8
43334327383121276112711403967342130695
5698.9
27.927.348.840.713.212.919.011.166.718.229.60.0
17.523.134.314.719.043.316.733.340.0
26.4
40224016563921441682926151126768373531012
71611.2
32.536.442.562.525.030.847.638.643.837.531.030.846.742.952.223.521.660.00.0
50.033.3
38.0
22411822016729119919619654922491332323123391461361621086557
369657.9
38.447.543.255.137.126.138.830.140.731.538.242.137.951.047.534.939.054.325.941.529.8
40.5
37121738425251335132034211315742625132753458330423429618113296
6384
Sentinel Site Domestic WorkerNo. % Pos
StudentNo. % Pos
Office workerNo. % Pos
OtherNo. % Pos
TotalNo.
Table 7: HIV prevalence according to occupation, pregnant women, 2003 Sentinel Surveillance, Botswana.
140 women did not reveal their occupation.
In seven of the districts, HIV prevalence was highest among domestic workers, ranging from 18.2% inHukuntsi to 61.9% in Bobirwa. Students had the lowest prevalence (range: 0.0% in Boteti to 66.7% inChobe). The association between HIV prevalence and occupation is confounded by age. Students tend to beyounger and younger people have lower prevalence. When adjusted for age group, office workers ratherthan students have the lowest prevalence.

22
Botswana 2003 Second Generation HIV Surveillance Report
National AIDS Coordinating Agency (NACA) in collaboration with AIDS/STD Unit, the BOTUSA Project (CDC), District Health Teams, the Botswana Harvard Partnership and WHO
Table 8: HIV prevalence according to number of pregnancies, 2003 Sentinel Surveillance, Botswana.
The prevalence of HIV was consistently higher in women with two to three pregnancies (range: 34.5% inHukuntsi to 66.0% in Bobirwa) than in women with a first pregnancy (range 12.5% in Kweneng West to47.7% in Selebi Phikwe). Women with two or three pregnancies generally had higher HIV prevalence thanwomen with more than 3 pregnancies (range 24.7% in Southern to 60.0% in Chobe).
NgamiNorth EastSerowe/PalapyeBobirwaKweneng EastSouthernMahalapyeKgatlengChobeKgalagadiTutumeBotetiOkavangoGaboroneFrancistownSouth EastLobatseSelebi PhikweKweneng WestGoodhopeHukuntsi
Total%
12173126692221311061414251127819921422111689109645420
227634.9
28.928.842.146.424.320.630.224.126.217.628.334.628.327.134.416.421.347.712.537.020.0
28.8
173961671062011471441394863193124127272252132107148755358
282543.3
40.557.347.966.044.335.446.541.062.539.746.644.441.758.153.636.443.059.537.341.534.5
47.4
825396809981767325471095510269120585045513022
142321.8
47.635.847.948.830.324.740.834.260.036.241.330.933.353.655.829.336.051.129.436.731.8
40.2
376222389255522359326353115161429260328555593306246302190137
100.0
6524
Sentinel Site First pregnancy
No. % Pos
2-3 pregnancy
No. % Pos
>3 pregnancy
No. % Pos
Total No.
The mean number of pregnancies was 2.5 (range 1 - 13); the median number was 2.

23
Botswana 2003 Second Generation HIV Surveillance Report
National AIDS Coordinating Agency (NACA) in collaboration with AIDS/STD Unit, the BOTUSA Project (CDC), District Health Teams, the Botswana Harvard Partnership and WHO
Figure 2: Adjusted HIV prevalence by residence and age, pregnant women, 2003 Sentinel Surveillance,Botswana.
The prevalence of HIV infection is essentially the same in urban and rural areas. Women with rural residencehad an overall prevalence of 36.5% compared to 37.9% prevalence for women with urban residence. In thethree youngest age groups, women in rural areas had higher HIV prevalence than those in urban areas. Inboth urban and rural areas, HIV prevalence was highest among women in the 25-29 year age group.

24
Botswana 2003 Second Generation HIV Surveillance Report
National AIDS Coordinating Agency (NACA) in collaboration with AIDS/STD Unit, the BOTUSA Project (CDC), District Health Teams, the Botswana Harvard Partnership and WHO
Figure 3: Adjusted HIV prevalence in pregnant women by district, 2003 Sentinel Surveillance, Botswana.
Age-adjusted HIV prevalence by district is shown in Figure 3. The prevalence in the 22 districts ranged from25.7% in Southern to 52.2% in Selebi Phikwe. Five districts had prevalence between 25% and 30%, eightdistricts between 30% and 40%, and for eight districts, the prevalence was greater than 40%.
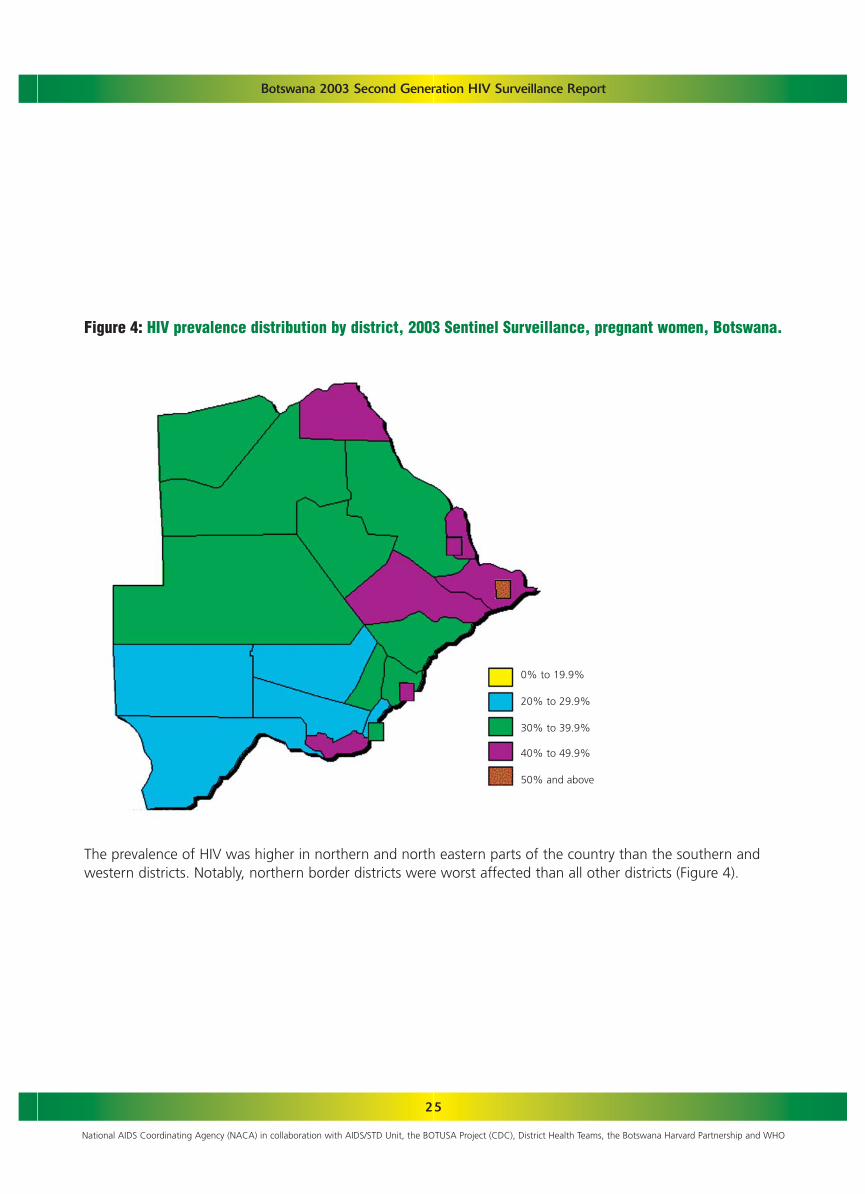
25
Botswana 2003 Second Generation HIV Surveillance Report
National AIDS Coordinating Agency (NACA) in collaboration with AIDS/STD Unit, the BOTUSA Project (CDC), District Health Teams, the Botswana Harvard Partnership and WHO
Figure 4: HIV prevalence distribution by district, 2003 Sentinel Surveillance, pregnant women, Botswana.
0% to 19.9%
20% to 29.9%
30% to 39.9%
40% to 49.9%
50% and above
The prevalence of HIV was higher in northern and north eastern parts of the country than the southern andwestern districts. Notably, northern border districts were worst affected than all other districts (Figure 4).

26
Botswana 2003 Second Generation HIV Surveillance Report
National AIDS Coordinating Agency (NACA) in collaboration with AIDS/STD Unit, the BOTUSA Project (CDC), District Health Teams, the Botswana Harvard Partnership and WHO
Table 9 shows the age-specific and age group adjusted prevalence from the 2001, 2002, and 2003 surveysfor women, all ages combined. Although prevalence increased from 35.4% to 37.4% between 2002 and2003, the trend over the three year period is relatively stable and does not show a significant increase(p=0.22).
NgamiNorth EastSerowe/PalapyeBobirwaKweneng EastSouthernGantsiMahalapyeKgatlengChobeKgalagadiTutumeBoteti OkavangoGaboroneFrancistownSouth EastLobatseSelibe PhikweKweneng WestGoodhopeHukuntsiAdjusted Prevalence
137/37230/75
150/33766/148175/537117/34339/147114/32671/22731/8141/118134/261110/26574/206225/573221/49362/19277/230195/34935/12036/9515/59
2155/5554
35.8 (30.0, 41.6)39.7 (26.8, 52.6)40.3 (33.8, 46.8)43.7 (33.3, 54.0)29.5 (25.3, 33.7)30.3 (24.5, 36.2)21.9 (15.0, 28.8)30.6 (25.0, 36.2)24.2 (17.6, 30.8)38.9 (25.6, 52.2)28.3 (18.5, 38.2)50.0 (42.2, 57.8)36.4 (28.2, 44.6)39.2 (30.3, 48.0)39.3 (33.6, 45.1)45.6 (40.1, 51.0)32.3 (23.5, 41.2)30.9 (24.0, 37.8)51.2 (45.0, 57.5)24.3 (15.8, 32.7)30.0 (19.1, 40.9)23.2 (11.6, 34.9)36.2 (34.5, 37.9)
111/25383/196156/425142/286189/567120/36324/112130/303106/31045/10547/172166/37095/250104/284260/666190/45887/28893/241193/37249/15846/14631/82
2467/6407
40.7 (33.6, 47.7)38.6 (30.9, 46.4)35.2 (27.8, 42.6)45.3 (38.3, 52.2)29.2 (25.0, 33.3)30.5 (24.6, 36.5)18.8 (11.2, 26.5)39.8 (33.7, 46.0)30.9 (22.8, 39.1)38.4 (28.0, 48.7)28.3 (17.9, 38.8)40.7 (34.6, 46.9)35.6 (27.0, 44.2)34.2 (28.3, 40.1)38.2 (33.3, 43.0)40.2 (34.9, 45.5)26.5 (20.4, 32.5)34.6 (27.3, 41.9)48.1 (42.1, 54.1)28.7 (21.2, 36.1)26.3 (18.7, 33.9)40.0 (26.7, 53.3)35.4 (33.9, 36.9)
144/37695/222179/389141/255173/52299/359
na130/326116/35356/11551/161171/429100/260115/328253/555278/59384/30683/246163/30251/19053/13731/100
2629/6783
District2001
HIV+/N % (95CI)
All Ages **
2002
HIV+/N % (95CI)
2003
HIV+/N % (95CI)
Table 9: Comparison of 2001, 2002, and 2003 HIV prevalence by district, pregnant women, 2003 SentinelSurveillance, Botswana.
38.4(32.6,44.2)40.4(32.2,48.5)43.3(37.7,49.0)49.3(41.7,57.0)32.1(26.8,37.5)25.7(20.1,31.3)
na37.4(31.2,43.6)30.6(25.0,36.1)47.0(36.2,57.7)28.9(21.4,36.5)37.7(31.6,43.9)31.9(24.5,39.3)32.7(27.4,38.1)44.8(38.9,50.8)45.8(40.7,50.9)27.9(21.8,34.1)32.4(25.2,39.7)52.2(45.0,59.5)27.0(19.8,34.3)40.9(24.4,57.3)28.4(16.8,39.9)
37.4 (35.8, 39.0)**
* All prevalences are adjusted to the district-specific age distribution and overall prevalence is age and district adjusted.
**For calculating overall adjusted prevalence, Gantsi's prevalence for 2003 was estimated by a weighted average of 2001 and 2002 prevalence.

27
Botswana 2003 Second Generation HIV Surveillance Report
National AIDS Coordinating Agency (NACA) in collaboration with AIDS/STD Unit, the BOTUSA Project (CDC), District Health Teams, the Botswana Harvard Partnership and WHO
Figure 5: Adjusted HIV Prevalence Trends, 2001 – 2003 Sentinel Surveillance, Botswana.
Sentinel surveillance has been conducted in all 22 health districts since 2001. The 2001 census data wereused to adjust prevalence for all three years. Comparisons across the three years indicate no significant dif-ferences (p=0.22). In addition, trend analysis for the three years also indicates that prevalence has remainedfairly stable.

28
Botswana 2003 Second Generation HIV Surveillance Report
National AIDS Coordinating Agency (NACA) in collaboration with AIDS/STD Unit, the BOTUSA Project (CDC), District Health Teams, the Botswana Harvard Partnership and WHO
Figure 6: Age-specific HIV Prevalence Trends, 2001 – 2003 Sentinel Surveillance, Botswana.*
The highest HIV prevalence is consistently in the 25-29 year age group in which prevalence has been atapproximately 50% for the past three years. The lowest rates are among women aged 15-19 years.
* Prior to 2001 not all 22 health districts were included in the sentinel surveillance survey. Standardization methods varied by year and age group (see
methodology).

29
Botswana 2003 Second Generation HIV Surveillance Report
National AIDS Coordinating Agency (NACA) in collaboration with AIDS/STD Unit, the BOTUSA Project (CDC), District Health Teams, the Botswana Harvard Partnership and WHO
Figure 7: Trend in HIV prevalence among pregnant women by age group, Sentinel Surveillance 1992-2003,2003 Sentinel Surveillance, Botswana.*
HIV prevalence in the 15 -19 year age group peaked in 1995, decreased over the next four years and hasremained stable since 1999. For the 20-24 year old age group, HIV prevalence peaked in 1998, decreasedthe following year and has remained stable since 1999. There have been steady increases in the 25-49 yearage group since 1992, although prevalence may be stabilizing over the past three years. The prevalence ofHIV in the country had been increasing between 1992 and 1999. Between 2000 and 2003, the prevalencehas remained relatively stable
*Prior to 2001 not all 22 health districts and age groups were included in the sentinel surveillance survey. Standardization methods varied by year and
age group (see methodology).
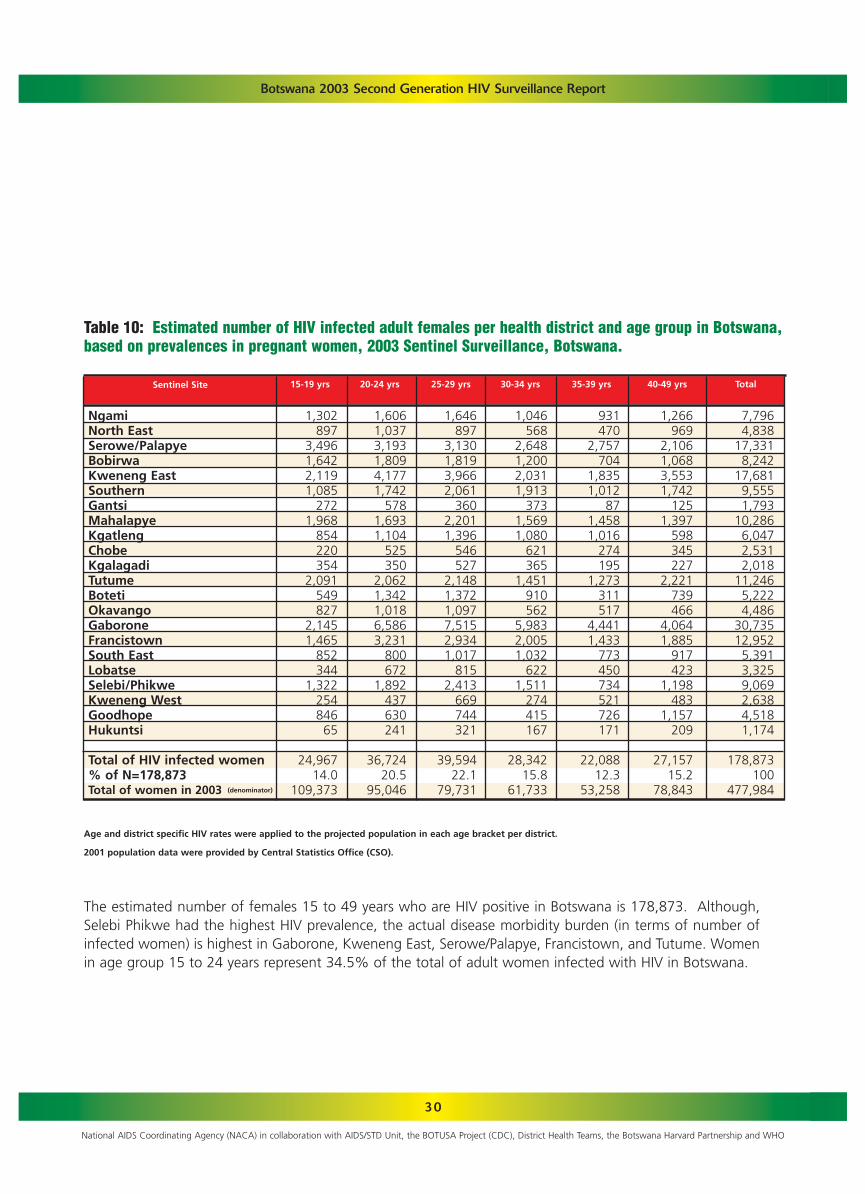
30
Botswana 2003 Second Generation HIV Surveillance Report
National AIDS Coordinating Agency (NACA) in collaboration with AIDS/STD Unit, the BOTUSA Project (CDC), District Health Teams, the Botswana Harvard Partnership and WHO
Table 10: Estimated number of HIV infected adult females per health district and age group in Botswana,based on prevalences in pregnant women, 2003 Sentinel Surveillance, Botswana.
1,302897
3,4961,6422,1191,085
2721,968
854220354
2,091549827
2,1451,465
852344
1,32225484665
24,96714.0
109,373
1,6061,0373,1931,8094,1771,742
5781,6931,104
525350
2,0621,3421,0186,5863,231
800672
1,892437630241
36,72420.5
95,046
1,646897
3,1301,8193,9662,061
3602,2011,396
546527
2,1481,3721,0977,5152,9341,017
8152,413
669744321
39,59422.1
79,731
1,046568
2,6481,2002,0311,913
3731,5691,080
621365
1,451910562
5,9832,0051,032
6221,511
274415167
28,34215.8
61,733
931470
2,757704
1,8351,012
871,4581,016
274195
1,273311517
4,4411,433
773450734521726171
22,08812.3
53,258
1,266969
2,1061,0683,5531,742
1251,397
598345227
2,221739466
4,0641,885
917423
1,198483
1,157209
27,15715.2
78,843
7,7964,838
17,3318,242
17,6819,5551,793
10,2866,0472,5312,018
11,2465,2224,486
30,73512,9525,3913,3259,0692,6384,5181,174
178,873100
477,984
Sentinel Site 15-19 yrs 20-24 yrs 25-29 yrs 30-34 yrs 35-39 yrs 40-49 yrs Total
Age and district specific HIV rates were applied to the projected population in each age bracket per district.
2001 population data were provided by Central Statistics Office (CSO).
The estimated number of females 15 to 49 years who are HIV positive in Botswana is 178,873. Although,Selebi Phikwe had the highest HIV prevalence, the actual disease morbidity burden (in terms of number ofinfected women) is highest in Gaborone, Kweneng East, Serowe/Palapye, Francistown, and Tutume. Womenin age group 15 to 24 years represent 34.5% of the total of adult women infected with HIV in Botswana.
NgamiNorth East Serowe/PalapyeBobirwa Kweneng EastSouthernGantsiMahalapyeKgatlengChobeKgalagadiTutumeBotetiOkavangoGaboroneFrancistownSouth EastLobatseSelebi/PhikweKweneng WestGoodhopeHukuntsi
Total of HIV infected women % of N=178,873Total of women in 2003 (denominator)

Botswana 2003 Second Generation HIV Surveillance Report
National AIDS Coordinating Agency (NACA) in collaboration with AIDS/STD Unit, the BOTUSA Project (CDC), District Health Teams, the Botswana Harvard Partnership and WHO
Table 11: Estimated number of HIV infected adult males (15-49 years) per health district and age group,derived from 2003 prevalence data for pregnant women, combined male to female infection rate ratiosfrom Tebelopele VCT centers and health facilities, and 2001 census population figures, 2003 SentinelSurveillance, Botswana.
9776
2821441588921
164691627
1764362
1389165227723786
1,9231.8%
104,850
448268847472
1,092433176469308194101482367239
1,83482120616844513717980
9,76511.6%84,370
925415
1,573823
2,144979221
1,237718340309967795488
4,2811,550
534431
1,247435386196
20,99327.7%75,663
812373
1,811796
1,5481,369
3531,173
766584317923704338
5,0601,742
781486
1,283244319146
21,92937.9%57,894
894342
2,252531
1,613829102
1,250954297211947320398
4,9741,579
694456781438583169
20,61443.9%47,003
1,456745
1,954878
3,6951,725
1741,364
630494272
1,738992397
5,3442,3701,014
5261,918
5291,188
265
29,66843.5%68,223
4,6322,2198,7193,644
10,2495,4231,0475,6583,4451,9251,2375,2343,2201,922
21,6308,1523,2942,0885,7531,8072,732
862
104,89225.2%
438,003
Sentinel Site 15-19 yrs 20-24 yrs 25-29 yrs 30-34 yrs 35-39 yrs 40-49 yrs Total
The estimated number of males 15 to 49 years who are HIV positive in Botswana is 105,084. Analyses usingdifferent male to female ratios (freestanding Tebelopele centers only and integrated VCT centres in facilitiesonly) yielded estimates ranging from 104,614 to 121,662 infected men. For men, the actual disease mor-bidity burden is highest in Gaborone, Kweneng East, Serowe/Palapye, and Francistown. Men in age group15-24 years represent 11.0% of the total of adult men infected with HIV in Botswana; while those aged 25-34 years represent 41.0%.
NgamiNorth East Serowe/PalapyeBobirwa Kweneng EastSouthernGantsiMahalapyeKgatlengChobeKgalagadiTutumeBotetiOkavangoGaboroneFrancistownSouth EastLobatseSelebi PhikweKweneng WestGoodhopeHukuntsi
Total of HIV infected men% of total N=104892Total men (denominator)
31

32
Botswana 2003 Second Generation HIV Surveillance Report
National AIDS Coordinating Agency (NACA) in collaboration with AIDS/STD Unit, the BOTUSA Project (CDC), District Health Teams, the Botswana Harvard Partnership and WHO
Table 12: Syphilis test results per district, pregnant women, 2003 Sentinel Surveillance, Botswana.
Sentinel Site
95% Cl
Positive Syphilis Results
% No.
Testedfor Syphilis
No.
Sentinel Surveillance Participants
NgamiNorth EastSerowe/PalapyeBobirwaKweneng EastSouthernGantsiMahalapyeKgatlengChobeKgalagadi Tutume BotetiOkavangoGaboroneFrancistownSouth EastLobatseSelebi/PhikweKweneng WestGoodhopeHukuntsi
Total
376222389255522359168326353115161429260328555593306246302190137100
6692
*153424258510366173306349116166329182335*
628308185**49*
4837
*4
2438
12365
1031183
37*
4272**2*
217
2.6%5.7%1.2%1.6%3.3%1.7%2.0%1.4%8.6%
18.7%5.5%1.6%
11.0%*
6.7%2.3%1.1%
**
4.1%*
4.5%
0.1-5.13.5-7.90.0-2.50.5-2.61.5-5.10.0-3.70.4-3.50.2-2.7
3.5-13.712.7-24.63.0-7.90.0-3.5
7.7-14.4*
4.7-8.60.6-2.60.0-2.6
**
0.0-9.6*
3.9-5.1
Of the 4,837 women who were tested for syphilis during the survey, 217 (4.5%, 95% CI: 3.9 – 5.1%) were pos-itive. Kgalagadi (18.7%), followed by Okavango (11.0%) and Chobe (8.6%) were the three districts with thehighest syphilis rates.
* Data were not available for Ngami, Gaborone, Kweneng West, and Hukuntsi. Valid test results were not avail-able for Selebi Phikwe.
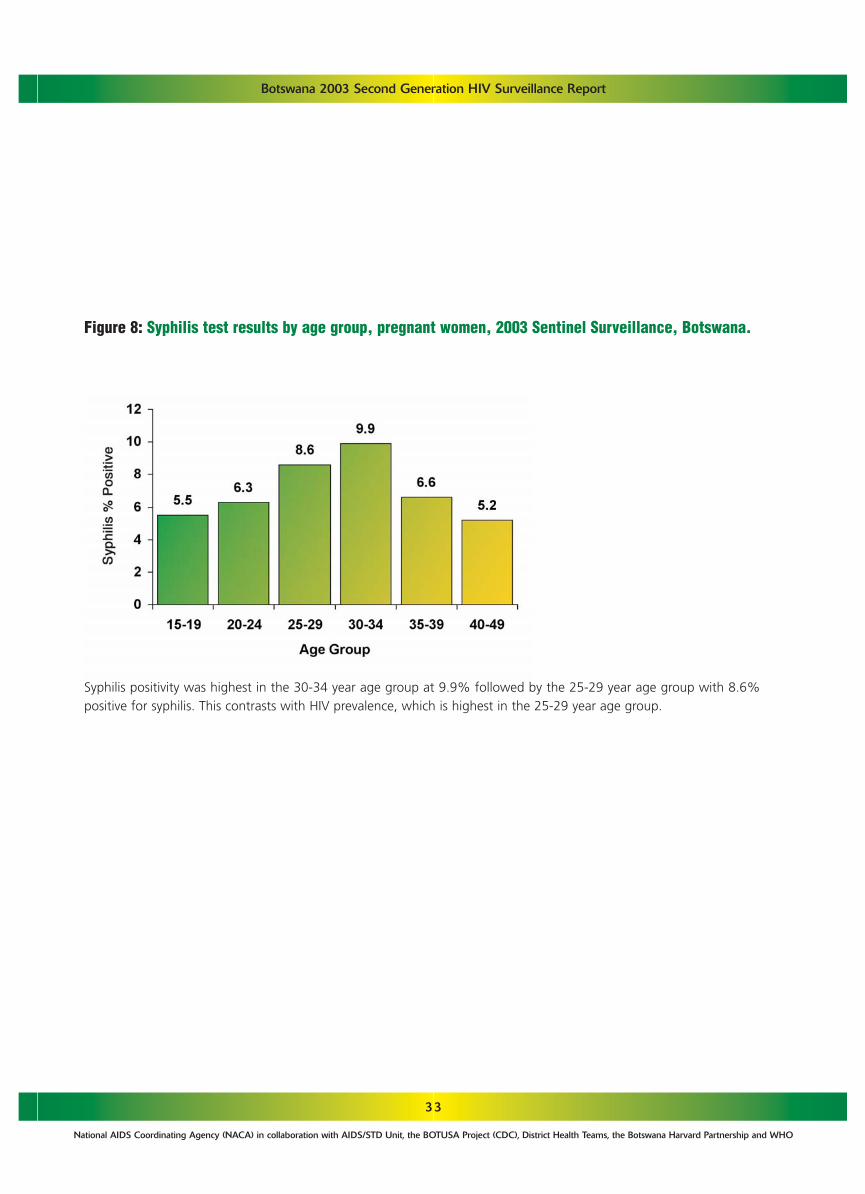
33
Botswana 2003 Second Generation HIV Surveillance Report
National AIDS Coordinating Agency (NACA) in collaboration with AIDS/STD Unit, the BOTUSA Project (CDC), District Health Teams, the Botswana Harvard Partnership and WHO
Figure 8: Syphilis test results by age group, pregnant women, 2003 Sentinel Surveillance, Botswana.
Syphilis positivity was highest in the 30-34 year age group at 9.9% followed by the 25-29 year age group with 8.6%positive for syphilis. This contrasts with HIV prevalence, which is highest in the 25-29 year age group.

34
Botswana 2003 Second Generation HIV Surveillance Report
National AIDS Coordinating Agency (NACA) in collaboration with AIDS/STD Unit, the BOTUSA Project (CDC), District Health Teams, the Botswana Harvard Partnership and WHO
4.2.DRUG-RESISTANCE AMONG HIV-1CINFECTED, TREATMENT-NAIVE ADULTSIN BOTSWANA
The population-based genotyping data show that, prior to the initiation of its’ countrywide public HAART pro-gram, HIV-1C infected Botswana did not harbour primary HIV-1B mutations that confer resistance to any of thethree major ARV drug classes. A considerable number of secondary protease inhibitor (PI) mutations and poly-morphic sites in the RT enzyme predicate the need for continuous population monitoring.
Table 13: Prevalence of genotypic resistance to ARV drugs among HIV-1C infected adult Batswana fromthe 2001 Sentinel Surveillance survey (n=71).
Type of Mutation
NNRTI NNRTINRTI
PrimarySecondary
noneG333E/R* (2.8%)
noneA98S* (1.4%)V179T* (1.4%)
noneL10I (1.4%)K20R (5.6%)M36I (80%)L63 P/Q/S/H/T (38%)V77I (11.3%)I93L (97.2%)
Class of ARV Drug
* not known to be associated with drug resistance
25 (35%) samples analysed had 3 or more secondary mutations at PI coding region (pol region codon 1-99)NOTE: Above genotypic resistance data is evaluated in relation to known HIV-1B resistance data(http://hivdb.stanford.edu/hiv/) (Shafer, R. W. (2002). "Genotypic testing for human immunodeficiency virus type1 drug resistance." Clin Microbiol Rev 15(2): 247-77).

35
Botswana 2003 Second Generation HIV Surveillance Report
National AIDS Coordinating Agency (NACA) in collaboration with AIDS/STD Unit, the BOTUSA Project (CDC), District Health Teams, the Botswana Harvard Partnership and WHO
4.3.CD4 CELL COUNTS AMONG HIV-NEGATIVE BATSWANA
A total of 589 sentinel surveillance samples (from the 2001 survey) were collected, and of these 499 were suit-able for T-lymphocyte subset enumeration of which 251 (50%) were HIV-negative. Of the 2001 sentinel sur-veillance participants, 207 were female (median age 23 years) and 44 were male (median age 26 years). SentinelSurvey samples were representative of both urban (61%) and rural (39%) populations from a large catchmentarea of 11 health districts situated throughout Botswana. Table 14 summarizes the results. The median CD4+LC values were 599 cells/mm3. The median absolute CD8+ LC was 434 cells/mm3 and the CD4+ to CD8+ ratiowas 1.40.
Table 14: CD4+ lymphocyte counts (cells/mm3) of HIV-negative adults in Botswana
20744
251
612591599
152 -1245208 - 1282152 - 1282
626626626
200246208
(599, 653)(551, 701)(600, 652)
Sex N Median Range 2.5th-97.5thpercentile
Mean Standarddeviation
95% CI formean
FemaleMaleBoth
276 - 1062233 - 1276275 - 1114

36
Botswana 2003 Second Generation HIV Surveillance Report
National AIDS Coordinating Agency (NACA) in collaboration with AIDS/STD Unit, the BOTUSA Project (CDC), District Health Teams, the Botswana Harvard Partnership and WHO
4.4. TEBELOPELE VTC PROGRAMME DATA
The number of centres have increased over the years. Whereas in 2000 only three centers were opened, it hadincreased to 16 in 2003. A total of 35,723 persons made one or more visits to these centers between 1 January,2003 and 30 September, 2003. Of those, 34 439 (96.4%) were tested for HIV. Of those tested 26,741 (77.6%)were first time attendees. The two urban centers Gaborone and Francistown had more than 50% of the clients(Appendix 8.12).
Figure 9: HIV prevalence by age group among men and women aged 15-49. Tebelopele VCT Centres, 2003,Botswana.*
Among the women tested at Tebelopele sites, prevalence was highest in the 30-34 year age group (61.5%),whereas among men the highest prevalence was in the 35-39 year age group (59.6%). Prevalance amongwomen is strikingly higher than among men in the three youngest age groups, with female prevalence rang-ing from 13 times higher in 15-19 year olds to twice as high in 25-29 year olds. However, men have high-er prevalence than women in the two highest age groups.
*2003 data through to 30th September only

37
Botswana 2003 Second Generation HIV Surveillance Report
National AIDS Coordinating Agency (NACA) in collaboration with AIDS/STD Unit, the BOTUSA Project (CDC), District Health Teams, the Botswana Harvard Partnership and WHO
Overall and consistently during the four years, for both women and men, persons with rural residence had slight-ly higher HIV prevalence than persons with an urban residence. Degree of education is clearly related with theHIV prevalence. Women and men with higher education levels tend to have lower HIV prevalence than personswith lower education. However, HIV prevalence has risen over time within all educational groups for men andwomen (Appendix 8.13).
Figure 10: HIV prevalence by residence, Tebelopele VCT centers, 2000-2003*, Botswana.
Figure 11: HIV prevalence according to reported condom use over the past three months by gender,Tebelopele VCT centers, 2000-2003, Botswana.
*2003 data through 30 September only
HIV prevalence was observed to be lower among persons who reported regular condom use than among thosereporting irregular or no use.
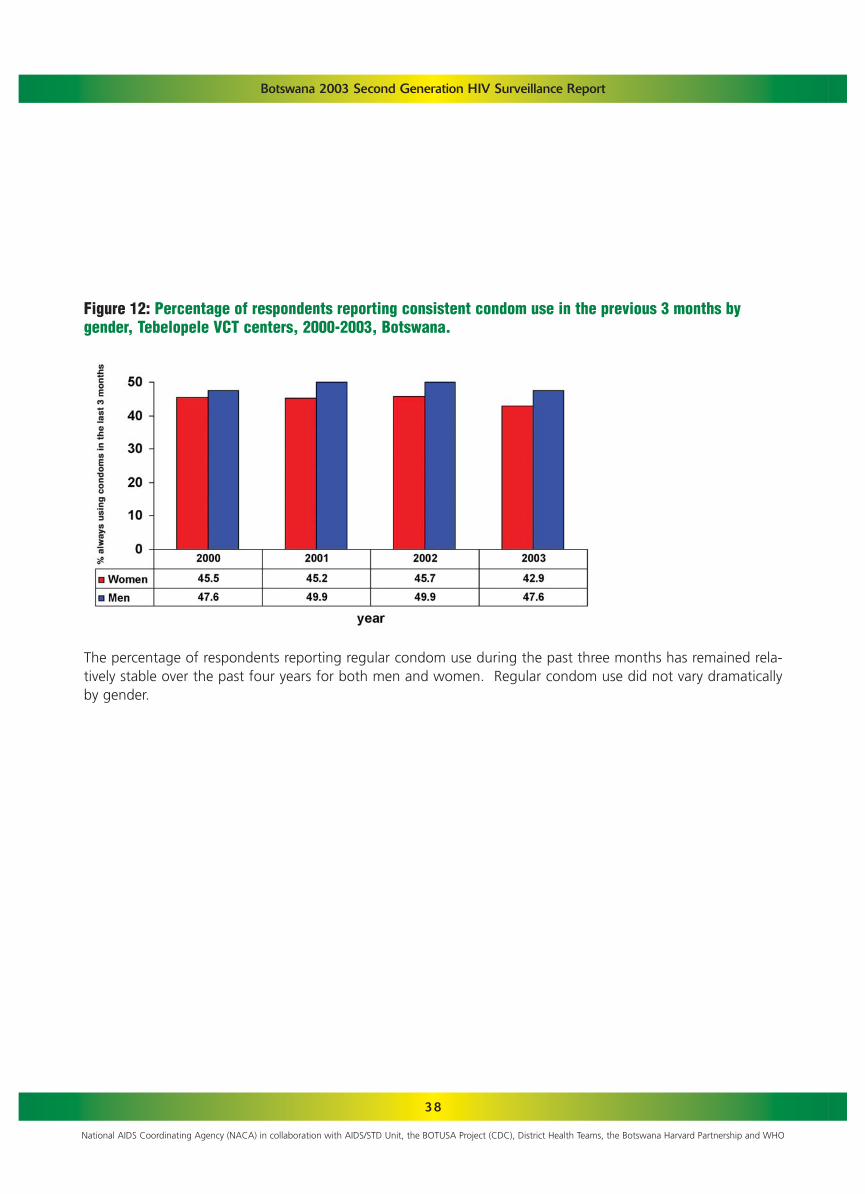
38
Botswana 2003 Second Generation HIV Surveillance Report
National AIDS Coordinating Agency (NACA) in collaboration with AIDS/STD Unit, the BOTUSA Project (CDC), District Health Teams, the Botswana Harvard Partnership and WHO
Figure 12: Percentage of respondents reporting consistent condom use in the previous 3 months by gender, Tebelopele VCT centers, 2000-2003, Botswana.
The percentage of respondents reporting regular condom use during the past three months has remained rela-tively stable over the past four years for both men and women. Regular condom use did not vary dramaticallyby gender.

39
Botswana 2003 Second Generation HIV Surveillance Report
National AIDS Coordinating Agency (NACA) in collaboration with AIDS/STD Unit, the BOTUSA Project (CDC), District Health Teams, the Botswana Harvard Partnership and WHO
Table 15: Number of HIV Requests and positivity rates by year, 2000-2003
4.5. HIV/AIDS CASE REPORTING AND MORTALITY
Between 2000 and 2003, a total of 61,350 HIV request forms were sent from the District Health Teams to theMinistry of Health. Of all the records analyzed, 59,127 had results and about half of the subjects (51%) wereHIV-positive.
Positivity rate was highest in the year 2000 but remained relatively stable over the next three years. Amongyoung people (<30 years) positivity rate was consistently higher among women than men while in the older agegroups, a reverse pattern was observed. Among males, the highest prevalence was observed in those 30-39 yearswhereas among females, persons aged 25-34 years had the highest rate.
10998157511893115670
61350
10914155891813914485
59127
6001780390817457
30342
55.050.150.151.5
51.3
Year Number ofrecords
Number withtest results
Numberpositive
PercentPositive
2000200120022003
Total
Figure 13: Age and sex specific prevalence of HIV among those requested to undergo testing, 2000-2003,Botswana

40
Botswana 2003 Second Generation HIV Surveillance Report
National AIDS Coordinating Agency (NACA) in collaboration with AIDS/STD Unit, the BOTUSA Project (CDC), District Health Teams, the Botswana Harvard Partnership and WHO
Among the 59,127 records with results, 3,239 were classified as AIDS cases. Of the 3,239 cases, gender was indi-cated for 3,197 of which 1644 (51.4%) were females and 1,553 (48.6%) were males. The number of cases washighest in 2000 and declined over the next three years. It should be noted that the data for 2003 was not com-plete at the time of this analysis thus the actual number cases for the year will be higher than what is reportedhere. The cumulative number of cases is shown in Figure 15.
Figure 15: Cumulative AIDS cases in Botswana, 2000-2003.
AIDS CASES
Figure 14: HIV positivity rates by residence, AIDS case reporting 2000-2003, Botswana.
The proportion of patients who were positive was consistently higher in rural than urban areas. The differencewas more pronounced in 2000 and 2003.

41
Botswana 2003 Second Generation HIV Surveillance Report
National AIDS Coordinating Agency (NACA) in collaboration with AIDS/STD Unit, the BOTUSA Project (CDC), District Health Teams, the Botswana Harvard Partnership and WHO
Table 16: AIDS cases by age group and year, 2000-2003
12326
104196217158198119
1141
1262263
17217713816890
956
846
4513614310513265
717
519
227376658346
425
38463
234577613466582320
3239
Age group2000 2001 2002 2003 Total
<1515-1920-2425-2930-3435-3940-4950+
Total
In each of the years, the highest number of cases was observed among those aged 30-34 years. In the youngerage groups (<35 years) there were more female cases than males whereas in the older, the opposite was thecase.
Figure 16: Distribution of reported AIDS cases by age, 2000-2003.

42
Botswana 2003 Second Generation HIV Surveillance Report
National AIDS Coordinating Agency (NACA) in collaboration with AIDS/STD Unit, the BOTUSA Project (CDC), District Health Teams, the Botswana Harvard Partnership and WHO
The districts with highest caseloads were Gaborone, Mahalapye, Palapye and Francistown. Those with the low-est were Hukuntsi, Kweneng East, Okavango and Kgatleng.
Figure 17: Number of reported AIDS cases in Botswana by district, 2000-2003.

43
Botswana 2003 Second Generation HIV Surveillance Report
National AIDS Coordinating Agency (NACA) in collaboration with AIDS/STD Unit, the BOTUSA Project (CDC), District Health Teams, the Botswana Harvard Partnership and WHO
Figure 18: Crude mortality rate, Botswana, 1995-2000.
Figure 19: AIDS proportional mortality ratio, Botswana, 1995-2000.
Since 1995 the crude mortality continues to increase. Between 1995 and 1999, the crude mortality rate hasincreased by 73.2%, an annual increase of about 15%. In the early stages of the epidemic, the proportional mor-tality ratio of AIDS was about 10%. Between 1998 and 1999 nearly one in every five deaths in Botswana can beattributed to AIDS. In 2000, the percentage of deaths attributable to AIDS among men declined to 14.5%.
Sources:
1) CSO population projections, 1991-2001
2) CSO Health Statistics Report, 1995-2000

44
Botswana 2003 Second Generation HIV Surveillance Report
National AIDS Coordinating Agency (NACA) in collaboration with AIDS/STD Unit, the BOTUSA Project (CDC), District Health Teams, the Botswana Harvard Partnership and WHO
Table 17: 2002 PMTCT participation, HIV testing, and AZT therapy.
In 2002, the first year of the Prevention of Mother to Child Transmission (PMTCT) program, 80% of new ANCattendees were offered pre-test counseling. Of those counseled, 47% went on to be tested, and of those 40%were positive. Sixty-four percent of the mothers testing positive went on to receive AZT. Across the 22 healthdistricts, this number ranged from a high of 84% in Gaborone to a low of 31% in Gantsi.
As of November 2003, MASA reported that as part of the ARV eligibility 16,400 persons had been tested forCD4 and viral load. Of those, 10,264 patients have started ARVs.
4.6. PMTCT
NgamiNorth EastSerowe/PalapyeBobirwaKweneng EastSouthernGantsiMahalapyeKgatlengChobeKgalagadi Tutume BotetiOkavangoGaboroneFrancistownSouth EastLobatseSelebi PhikweKweneng WestGoodhopeHukuntsi
Total
1,3561,1272,3561,4811,7632,713808
1,9661,472389628836
1,141660
4,9023,2121,2841,2501,567389740333
32,373
6898607882919683856887437560839993918968
10078
80
558625
1,372484
1,1831,386557963
1,054259341393329143
2,1231,034582811473259266181
15,376
41555833675169497267544729224332456530673654
47
1772425032985663591434373151597812113851
1,0685661332462281599483
6,164
32393762482626453061233142365055233048613546
40
10413237618037523030237142893977654089238981161127893937
3,931
59557560666421544556506447788469616556564145
64
1,9891,1523,9251,8942,1472,990846
2,3641,724572719
1,9401,5311,1005,8733,2321,3871,3701,753572740428
40,248
Sentinel Site Pre-testNo. % Pos
TestedNo. % Pos
PositiveNo. % Pos
Started AZTNo. % Pos
New ANCNo.

45
Botswana 2003 Second Generation HIV Surveillance Report
National AIDS Coordinating Agency (NACA) in collaboration with AIDS/STD Unit, the BOTUSA Project (CDC), District Health Teams, the Botswana Harvard Partnership and WHO
The demographic characteristics of the respondents to the Makgabaneng Radio Listenership survey are shown inAppendix 8.14. Among 15-24 year olds, women (28.1%) were more likely than men (18.1%) to have correctresponses on all five AIDS knowledge questions. Substantive knowledge was low for both genders in the 25-49year old age group. The five HIV knowledge questions included knowing that condom use and having one faith-ful partner can prevent HIV, that a healthy looking person can transmit HIV, that mosquitoes do not transmit HIV,and that AIDS cannot be cured by sex with virgin.
4.7. BEHAVIOURAL SURVEYS
Figure 20: Knowledge of HIV/AIDS among men and women: percent with correct responses to five AIDSknowledge questions, Makgabaneng Radio Listenership Survey, 2003.

46
Botswana 2003 Second Generation HIV Surveillance Report
National AIDS Coordinating Agency (NACA) in collaboration with AIDS/STD Unit, the BOTUSA Project (CDC), District Health Teams, the Botswana Harvard Partnership and WHO
Women in both age groups were more likely to have ever having had an HIV test than men. Among 15-24 yearolds, the percentage of women reporting ever having had an HIV test was over twice as great as that of men.Among those ever tested for HIV, men were more likely than women to report having been tested in the past yearacross both age groups.
Figure 21: Percentage who ever had an HIV test by age group and gender, Makgabaneng Radio ListenershipSurvey, 2003.
Among respondents who were sexually active in the last year, 68.3% of men and 83.1% of females reportedhaving one sexual partner in the past year while 32% of men and 17% of women reported having more thanone sexual partner in the last year.
Figure 22: Number of sexual partners in the last year among those who had sex (percent distribution),Makgabaneng Radio Listenership Survey, 2003.

47
Botswana 2003 Second Generation HIV Surveillance Report
National AIDS Coordinating Agency (NACA) in collaboration with AIDS/STD Unit, the BOTUSA Project (CDC), District Health Teams, the Botswana Harvard Partnership and WHO
Condom use at the last sex act with a non-marital or non-cohabiting partner was higher among men (84.4%)than women (77.2%) among persons 15-24 but the reverse was true in the older age group. Overall condomuse was somewhat higher among young people than among persons aged 25-49.
Figure 23: Condom use by gender at last act with a non-marital or non-cohabitating partner by age,Makgabaneng Radio Listenership Survey, 2003

48
Botswana 2003 Second Generation HIV Surveillance Report
National AIDS Coordinating Agency (NACA) in collaboration with AIDS/STD Unit, the BOTUSA Project (CDC), District Health Teams, the Botswana Harvard Partnership and WHO
Source: CSO Health Statistics Report, 1995-2001
Data on sexually transmitted infections are also routinely collected through the epidemiological reporting systemin the country. Reporting covers aetiological and syndromic information on STIs as a determinant of the epidemic.Over the period 1995 to 2001 STIs have declined.
Figure 24: Annual number of STI cases, Botswana, 1995-2001.
4.8.SEXUALLY TRANSMITTED INFECTION PROGRAMME DATA

49
Botswana 2003 Second Generation HIV Surveillance Report
National AIDS Coordinating Agency (NACA) in collaboration with AIDS/STD Unit, the BOTUSA Project (CDC), District Health Teams, the Botswana Harvard Partnership and WHO
4.9. TUBERCULOSIS PROGRAMME DATA
58249251585848833418297278444386441732322330
1,054545509
59378048
140918085501446646741
21375664269413547
1,490551939
13462
25114032223299
2431064585
16112170
556292116111164507961
3,5001,7791,721
10452
15595
218152120177862460
13411551
34821611697
119374137
2,5541,612
942
30198048
122995286541325515620
13571664354243517
1,200812388
37376832
112915384569
295055316956411815273619
1,025708317
422231726414972723452758386123274532492257
1364796449328453211249211
10,8236,0074,816
Sentinel Site 0-14No.
15-24 No.
25-34No.
35-44 No.
45-54No.
>54No.
TotalNo.
NgamiNorth EastSerowe/PalapyeBobirwaKweneng EastSouthernGantsiMahalapyeKgatlengChobeKgalagadiTutumeBotetiOkavangoGaboroneFrancistownSouth EastLobatseSelebi PhikweKweneng WestGoodhopeHukuntsi
Botswanatotal malestotal females
Table 18: 2002 TB Case notification by district, by age group, National TB Programme, Epidemiology andDisease control unit, MoH, Botswana.
The total number of TB cases registered during 2002 was 10,823 resulting in a TB notification rate of 623 per100,000 of population. Of the 10,823 cases,1,054 were among children aged 0-14.
The two districts with the highest reported TB case load were Gaborone and Kweneng East. Persons aged 25 to34 years had the greatest number of TB cases reported in 2002 (32% of all cases).
The male/female TB case ratio for 2002 was 1.25. The male to female case ratio varied considerably among thedifferent age groups, ranging from 0.6 for 15-24 year olds to 2.2 for persons greater than 54.

50
Botswana 2003 Second Generation HIV Surveillance Report
National AIDS Coordinating Agency (NACA) in collaboration with AIDS/STD Unit, the BOTUSA Project (CDC), District Health Teams, the Botswana Harvard Partnership and WHO
Figure 25: Annual trend of new cases of TB per 100,000, 1991-2002
The rate of reported TB has increased steadily between 1991 and 2002, with an increase of 100% over that time.This corresponds with an annual increase of approximately 10%. In 2002, the BOTUSA project in conjunctionwith the Ministry of Health conducted a nation-wide multi-drug resistance evaluation. Among the 2425 TBpatients, HIV co-infection rate was found to be 60%.

51
Botswana 2003 Second Generation HIV Surveillance Report
National AIDS Coordinating Agency (NACA) in collaboration with AIDS/STD Unit, the BOTUSA Project (CDC), District Health Teams, the Botswana Harvard Partnership and WHO
5. DISCUSSION
The World Health Organization and the Joint UnitedNations Programme on AIDS have advocated formany years, the adoption of second generation HIVsurveillance as a strategy for addressing the limita-tions of the first generation. Second generationHIV/AIDS surveillance is designed to track behaviour,link behaviour to biological surveillance data, and,pool data from various sources together in order toincrease the explanatory power of sentinel surveydata. In Botswana this is the second time that behav-ioural data, VCT, TB, STI and AIDS case reporting havebeen linked with HIV sentinel survey data. In addition,we have examined ARV resistance and documentednormal CD4 levels among HIV-negative Batswana.
From the available data, it can be observed thatHIV/AIDS in Botswana remains a great challenge witha prevalence of 37.4%. The epidemic has affected alldistricts and localities. Rural areas are affected withequal (and in some cases, greater) intensity as theurban areas. It would be misleading to assume thatthe epidemic is over. Currently the epidemic affectsmore than one in every three persons aged 15-49years. This is a threat to developmental process and tothe very existence of the nation of Botswana. Even indistricts with lower prevalence, almost one in everyfour persons aged 15-49 years is affected. Personsaged 25-34 years are those that constitute the mostproductive age of a nation, but they are now over-burdened with HIV/AIDS and are the worst affected.This will likely lead to a depletion of the work force.Indeed, this has already occurred in some sectors suchas mining and agriculture and education.
Many factors continue to exacerbate the epidemic inthe country. Developmental projects such as miningand road construction has attracted a large number ofeconomically buoyant young men of different nation-
alities to various parts of the country thus bringingthem in contact with susceptible and vulnerableyoung women who are less economically empow-ered. In major mining districts like Selebi Phikwe theprevalence of HIV is over 50% among young adultsaged 15-49 years. Mining towns are endemic foci forthe spread of HIV as majority of the miners are usual-ly away from homes for extended period of time andare known to have multiple sex partners. Many citiesand towns in Botswana serve as transit and restingpoints for long distance truckers en-route to neigh-bouring countries. Francistown in particular, wherethe prevalence is now 46% is the hub of these majorroads.
The increasing trend in prevalence among those over35 years of age may be a reflection that AIDS-relatedmortality is slowing down while infected cohorts fromyounger age groups survive to graduate in to olderages. With the introduction of the ARV programme,there is bound to be a lower AIDS proportionate mor-tality ratio and the number of people living withHIV/AIDS will increase even if there is a reduction inincidence. This scenario in itself is a challenge becausethere will to be a large demand for counseling, as wellas for therapy.
The significantly higher HIV prevalence amongwomen (than men) in the young age groups supportsobservation made in many countries that older menprefer and engage in sex with younger women. Fromthe behavioural survey, it was observed that sex withmultiple partners was a common practice amongyoung persons (15-24 years). There is need for intensesexuality education and programmes promoting absti-nence and safer sex to be designed for young peoplegenerally and for young women in particular.

52
Botswana 2003 Second Generation HIV Surveillance Report
National AIDS Coordinating Agency (NACA) in collaboration with AIDS/STD Unit, the BOTUSA Project (CDC), District Health Teams, the Botswana Harvard Partnership and WHO
It has been shown that decreasing HIV prevalencereported in some parts of the world are due in part toa decrease in the prevalence of risky sexual behaviour.The behavioural data used in this report were notbased on a national sample as only seven districtswere purposively selected hence representativeness ofthe findings is not assured. Moreover, it needs to bepointed out that behavioural information collectedfrom a cross-sectional survey may not be a goodmeasure of the risk of current HIV infection. For exam-ple, individuals may use a condom because they arealready HIV-positive and therefore relating condomuse to HIV prevalence in cross-sectional surveybecomes difficult.
Available data indicate a high level of sexual activityamong unmarried Batswana. In fact over 80% of theantenatal attendees in the sentinel survey were singlemothers. From the behavioural survey, about twothirds of young persons are sexually active. This mayexplain in part the persistent high prevalence of HIV inthe country. The high prevalence among single par-ents may likely facilitate an epidemic of orphans in thecountry.
The increasing number of TB cases has been observedin many countries in sub-Saharan Africa. HIV pan-demic has worsened the problem of TB during thepast two decades. HIV infection renders a personinfected with Mycobacterium tuberculosis much morelikely to develop overt TB and the evolution of the dis-ease is much more accelerated. It has been observedthat about 8 – 10% of all TB cases are related to HIVinfection and the association is stronger in Africancountries. There is an urgent need for the provision ofnot only of anti-retroviral drugs, but also drugs forother opportunistic infections, which will reduce thepublic health complications of the HIV epidemic and
also reduce the incidence of tuberculosis.
CD4 levels among Batswana were found to be lowerthan those reported from other countries in the sub-region. It will be important to validate the low CD4+LC level in Botswana especially as predictors of theextent and rate of HIV disease progression.Furthermore, the increasing reliance on CD4+ LC val-ues for the initiation and monitoring of HAARTamong HIV-infected individuals in resource-limitedsettings makes it imperative to adopt and utilize stan-dard methodologies for CD4+ LC counting. The lowCD4 levels among Batswana may mean that corre-spondingly, lower values (than the conventional200/mm3 used in many countries) may be indicativeof the need for therapy. In some countries, decidingon a CD4 cut-off point in determining eligibility forART has been problematic. While this report has pre-sented normal values for HIV-negative individuals, it isalso desirable to compare such values with those ofHIV-positive individuals followed over time. Suchinformation would likely form a stronger scientificbasis for determining HAART eligibility in Botswana.For many years many have questioned the validity ofsentinel survey results. Data from several sources, sen-tinel survey, VCT, PMTCT, HIV Request from Healthfacilities, presented in this report, as well as last yearsreport have shown very high degree of agreement interms of the epidemiological features of HIV infectionin the country. In particular prevalence data fromPMTCT was quite comparable with the results fromsentinel survey data. For this year, from the PMTCTservice data, the prevalence was found to be 40%while it was 37.4% from sentinel survey data. Indeedsentinel surveys need not be undertaken as an annu-al event. Service data from PMTCT could be used tocompliment sentinel data.

Botswana 2003 Second Generation HIV Surveillance Report
National AIDS Coordinating Agency (NACA) in collaboration with AIDS/STD Unit, the BOTUSA Project (CDC), District Health Teams, the Botswana Harvard Partnership and WHO
HIV/AIDS marks a severe development crisis in sub-Saharan Africa, which remains by far the worst affect-ed region in the world. Botswana currently has thehighest prevalence of HIV in the sub region. A largeproportion of the work force in all sectors of the econ-omy is affected. Children are orphaned and familiesare affected and many are disillusioned.
Fortunately, as the impact of AIDS continues to threat-en the African society, many African leaders aremounting a full-scale response to fight HIV/AIDS, tar-geting all sectors. There is a high level of political andeconomic commitment of the part of the governmentof Botswana. Botswana is among the 19 Africannations that have established National AIDS councilsor commissions personally chaired by the Head ofState to take charge of a multisectoral response toAIDS. The private sector, civil societies including PLWAorganizations have risen to the occasion to form apartnership with government in fighting the epidem-ic. The national response has resulted in setting upprevention programs such as behavior change andcommunication, Voluntary Counseling and Testing,STI Control and Prevention of mother to child trans-mission (PMTCT). Care and support programs havebeen scaled up to include public provision of HighlyActive Antiretroviral therapy and Community HomeBased Care Programs. Impact mitigation and reduc-tion in stigma have been addressed at all levels by pro-viding funding for income generating activities, sup-port for orphans and vulnerable children, and greaterinvolvement of PLWA. The government of Botswanamust stoop to conquer this scourge. It must continueto sustain this momentum so as to bring the epidem-ic under control.
53

54
Botswana 2003 Second Generation HIV Surveillance Report
National AIDS Coordinating Agency (NACA) in collaboration with AIDS/STD Unit, the BOTUSA Project (CDC), District Health Teams, the Botswana Harvard Partnership and WHO
6. CONCLUSION
HIV/AIDS remains a major public health problem inBotswana affecting all districts and localities.
HIV prevalence in the country ranges from 25% to52% with a national prevalence of 37.4%. The dis-tricts worst affected are Selebi Phikwe, Bobirwa,Chobe and Francistown with prevalence over 45%.Even in districts least affected, the prevalence is over25%.
The highest age-specific prevalence was observedamong those aged 25-29 years. VCT data show sig-nificantly higher HIV prevalence among youngwomen than in men of similar ages.
The epidemiological features of HIV infection asobserved from various data sources (VCT, PMTCT, HIVTest Requests) in the country are essential the same.
Mean CD4+ counts among Batswana was lower thanvalues reported in other African countries.
Condom use in the last sex with a non-marital, non-cohabitating risk partner was encouraging as morethan two-thirds of sexually active young persons inthe behavioural survey responded in the affirmative.There appeared to be no significant behaviour changehowever (using condom use as an indicator) betweenthe 2001 BAIS survey and the Makgabaneng survey of2003. Specifically, from the BAIS survey, condom usewith a non-marital, non-cohabiting partner was 88%among young men 15-24 years compared to 84% inthe Makgabaneng survey. Only about one in fiveyoung persons had all correct answers to knowledgequestions on HIV/AIDS.
The percentage of sexually young persons who hadmultiple partners was significantly higher in the latest
survey than in the BAIS of 2001.
There is a growing number of AIDS as well as TB caseswhile STI cases are decreasing.
A large proportion of mothers attending ANCs weresingle mothers and the prevalence among this groupwas higher than those who were married. This is apotential pool for a large number of orphans.

55
Botswana 2003 Second Generation HIV Surveillance Report
1. There is a need to scale up HIV/AIDS interven-tion programmes especially among the youngpersons so as to reduce the rate of new infec-tions. Such programmes should include inschool as well as out of school youths.
2. In addition to sentinel surveillance, there is aneed to closely evaluate the extent of thescourge and the impact of the nationalresponse through special population-based sur-veys.
3. There is a need for extensive community mobi-lization for increased patronage of voluntarycounseling and testing services.
4. Tuberculosis control programme efforts need tobe intensified and national treatment algo-rithms for Tuberculosis as well as for STIs needto be reviewed.
5. There should be a scaling up of anti-retroviralprogramme to meet the needs of the increasingnumber of infected persons.
6. In subsequent sentinel surveys, the minimumnumber of specimens tested during qualityassurance per laboratory should be increased.Criteria for acceptance of results and usage inthe report should be specified in the survey pro-tocol.
7. The Ministry of Health needs to implementmeasures that would improve the performanceof the laboratories so as to minimize discordantrates in future surveys
7. RECOMMENDATIONS
National AIDS Coordinating Agency (NACA) in collaboration with AIDS/STD Unit, the BOTUSA Project (CDC), District Health Teams, the Botswana Harvard Partnership and WHO

56
Botswana 2003 Second Generation HIV Surveillance Report
National AIDS Coordinating Agency (NACA) in collaboration with AIDS/STD Unit, the BOTUSA Project (CDC), District Health Teams, the Botswana Harvard Partnership and WHO

57
Botswana 2003 Second Generation HIV Surveillance Report
National AIDS Coordinating Agency (NACA) in collaboration with AIDS/STD Unit, the BOTUSA Project (CDC), District Health Teams, the Botswana Harvard Partnership and WHO
8.1. CALCULATED SAMPLE SIZES PER DISTRICT
The targeted sample sizes calculated for the 22 health districts are shown in the Table below. The calculated sample sizeranged from 116 to 400. The targeted sample size was achieved in six districts
Ngami
North East
Serowe/Palapye
Bobirwa
Kweneng East
Southern
Gantsi
Mahalapye
Kgatleng
Chobe
Kgalagadi
Tutume
Boteti
Okavango
Gaborone
Francistown
South East
Lobatse
Selebi/Phikwe
Kweneng West
Goodhope
Hukuntsi
393
391
372
400
355
354
187
392
360
139
190
396
377
371
381
388
337
379
399
238
176
116
376
222
389
255
522
359
168
326
353
115
161
429
260
328
555
593
306
246
302
190
137
100
District Target Sample Size Actual Sample Size
8.APPENDICES

58
Botswana 2003 Second Generation HIV Surveillance Report
National AIDS Coordinating Agency (NACA) in collaboration with AIDS/STD Unit, the BOTUSA Project (CDC), District Health Teams, the Botswana Harvard Partnership and WHO
8.2. SENTINEL SURVEY DATACOLLECTION FORM

59
Botswana 2003 Second Generation HIV Surveillance Report
National AIDS Coordinating Agency (NACA) in collaboration with AIDS/STD Unit, the BOTUSA Project (CDC), District Health Teams, the Botswana Harvard Partnership and WHO
8.3. AGGREGATE SYPHILIS TEST RESULTREPORTING FORM, 2003 HIV SENTINEL SURVEY
Health facility’s listing of syphilis test results of pregnant women participating in the sentinel surveillance 2002,to be completed by staff of participating health facilities. This form should be completed at the end of the sur-vey when the exact dates of the surveillance are known and be brought to the consensus meetings in October2002.
The Record Book of the facility should be consulted retrospectively and the syphilis test results of all pregnantwomen who came to a specific clinic and who participated in the surveillance should be noted on this form.
Facility’s identification number:........................................................................................................................See Botswana Health Facility Master List
Surname of staff person completing this form: ____________________________________
Given Name of staff person completing this form: _________________________________
ANC sentinel surveillance
Date sentinel survey began at this facility:
Date sentinel survey ended at this facility:
During this exact, same period (consult and tally from facility logbooks):
Number of first time ANC attendees during this period visit seen at this facility:
Number of first time ANC attendees during this period that have a syphilis test result:
Number of women in 2 above that had a syphilis test result:
Please complete table on next page for all women in 3 above
North West North EastSerowe/PalapyeBobirwaKweneng East
SouthernGantsiMahalapyeKgatlengChobe
KgalagadiTutmeBobetiOkavangoGaborone
FrancistownSouth EastLobatseSelibe PhikweKweneng West
GoodhopeHukuntsi
Health District number: (Tick correct box:)

60
Botswana 2003 Second Generation HIV Surveillance Report
National AIDS Coordinating Agency (NACA) in collaboration with AIDS/STD Unit, the BOTUSA Project (CDC), District Health Teams, the Botswana Harvard Partnership and WHO
No. Age Syphilis test Results (Pos or Neg)
8.4. List of individual first time ANC attendees during this period and their syphilis testresults (either RPR or TPHA)

61
Botswana 2003 Second Generation HIV Surveillance Report
National AIDS Coordinating Agency (NACA) in collaboration with AIDS/STD Unit, the BOTUSA Project (CDC), District Health Teams, the Botswana Harvard Partnership and WHO
8.5. LABORATORY RESULTS FORM

62
Botswana 2003 Second Generation HIV Surveillance Report
National AIDS Coordinating Agency (NACA) in collaboration with AIDS/STD Unit, the BOTUSA Project (CDC), District Health Teams, the Botswana Harvard Partnership and WHO
Total
2001 FEMA
LE POPU
LATIO
N PER
DISTR
ICT A
ND
AG
E
GR
OU
P BA
SED O
N 2001 N
ATIO
NA
L CEN
SUS D
ATA
AG
E GR
OU
P (YR
S)
Total
infected
wo
men
Ag
e adju
sted D
istrict
HIV
prevalen
ce, 2003
2003 DISTR
ICT A
GE SPEC
IFIC H
IV PR
EVA
LENC
E
AG
E GR
OU
P (YR
S)
NU
MB
ER O
F INFEC
TED W
OM
EN PER
DISTR
ICT, 2003
AG
E GR
OU
P (YR
S)
15-19
4770
3075
9451
4080
12354
8649
1809
6556
4334
1046
1494
7614
3656
3323
11322
5579
3706
1910
3414
2316
2718
927
104103
District
North W
est (1)
North East (2)
Serowe/Palapye (3)
Bobirwa (4)
Kw
eneng East (5)
Southern (6)
Gantsi (7)
Mahalapye (8)
Kgatleng (9)
Chobe (10)
Kgalagadi (11)
Tutume (12)
Boteti (13)
Okavango (14)
Gaborone (15)
Francistown (16)
South East (17)
Lobatse (18)
Selebi/Phikwe (19)
Kw
eneng West (20)
Goodhope (23)
Hukuntsi (24)
Total
20-24
4109
1943
6947
2815
10718
6575
1539
4632
3590
1070
1300
4891
3126
2546
14944
5947
3919
2131
3658
1576
1733
757
90466
25-29
3217
1565
5682
2413
8572
5210
1491
3653
3076
1040
1218
3903
2506
2118
13206
5174
3308
1809
3243
1401
1417
667
75889
30-34
2464
1277
4653
1838
6590
4350
1115
3216
2398
728
810
3204
2078
1606
9814
3707
2478
1396
2222
1128
1184
502
58758
35-39
2142
1243
4174
1705
5675
3974
1035
3053
2014
587
744
3115
1773
1422
7246
2932
2116
1102
1708
1178
1266
488
50692
40-49
2611
2306
7160
3049
8454
6632
1187
5054
3412
656
1079
5637
2462
2040
8704
3588
2838
1408
2280
1687
2203
597
75044
19313
11409
38067
15900
52363
35390
8176
26164
18824
5127
6645
28364
15601
13055
65236
26927
18365
9756
16525
9286
10521
3938
454952
15-19
26.0
27.8
35.2
38.3
16.3
11.9
14.3
28.6
18.8
20.0
22.6
26.1
14.3
23.7
18.0
25.0
21.9
17.1
36.8
10.4
29.6
6.7
20-24
37.2
50.8
43.8
61.2
37.1
25.2
35.7
34.8
29.3
46.7
25.6
40.1
40.9
38.0
41.9
51.7
19.4
30.0
49.2
26.4
34.6
30.3
25-29
48.7
54.5
52.4
71.7
44.0
37.6
23.0
57.4
43.2
50.0
41.2
52.4
52.1
49.3
54.2
54.0
29.3
42.9
70.8
45.5
50.0
45.8
30-34
40.4
42.3
54.2
62.2
29.3
41.9
31.8
46.4
42.9
81.3
42.9
43.1
41.7
33.3
58.0
51.5
39.6
42.4
64.7
23.1
33.3
31.6
35-39
41.4
36.0
62.9
39.3
30.8
24.2
8.0
45.5
48.0
44.4
25.0
38.9
16.7
34.6
58.3
46.5
34.8
38.9
40.9
42.1
54.5
33.3
40-49
46.2
40.0
28.0
33.3
40.0
25.0
10.0
26.3
16.7
50.0
20.0
37.5
28.6
21.7
44.4
50.0
30.8
28.6
50.0
27.3
50.0
33.3
15-19
1,239
854
3,328
1,563
2,017
1,033
258
1,873
813
209
337
1,990
522
787
2,042
1,395
811
327
1,258
241
80562
23,764
104,103
22.8
20-24
1,529
987
3,039
1,722
3,976
1,658
550
1,611
1,051
499
333
1,963
1,277
969
6,269
3,075
761
639
1,800
416
600
229
34,955
90,466
38.6
25-29
1,566
854
2,980
1,731
3,775
1,961
342
2,095
1,329
520
502
2,044
1,306
1,044
7,153
2,792
968
775
2,297
637
709
306
37,686
75,889
49.7
30-34
995
540
2,520
1,143
1,933
1,821
355
1,493
1,028
592
347
1,381
866
535
5,695
1,908
982
592
1,438
260
395
159
26,977
58,758
45.9
35-39
886
447
2,624
670
1,746
96383
1,388
967
261
186
1,211
296
492
4,227
1,364
736
429
699
496
691
163
21,023
50,692
41.5
40-49
1,205
922
2,005
1,016
3,382
1,658
119
1,330
569
328
216
2,114
703
443
3,868
1,794
873
402
1,140
460
1,102
199
25,849
75,044
34.4
7,421
4,605
16,496
7,844
16,829
9,094
1,707
9,790
5,756
2,409
1,921
10,704
4,970
4,270
29,254
12,328
5,131
3,165
8,632
2,511
4,300
1,117
170,253
454,952
37.4
38.4
40.4
43.3
49.3
32.1
25.7
20.9
37.4
30.6
47.0
28.9
37.7
31.9
32.7
44.8
45.8
27.9
32.4
52.2
27.0
40.9
28.4
37.4
Total p
op
in ag
e gro
up
Overall ad
justed
age-sp
eific prev (%
)
8.6.A WORKSHEET FOR CALCULATING DISTRICT AND NATIONAL ADJUSTED PREVALENCE (FEMALES)
Growth adjustment factor
of 1.05 not applied to the
number infected per site

63
Botswana 2003 Second Generation HIV Surveillance Report
National AIDS Coordinating Agency (NACA) in collaboration with AIDS/STD Unit, the BOTUSA Project (CDC), District Health Teams, the Botswana Harvard Partnership and WHO
8.6.B WORKSHEET FOR ADJUSTED HIV PREVALENCE BY DISTRICT (MALES)
Total
2001 MA
LE POPU
LATIO
N PER
DISTR
ICT A
ND
AG
E
GR
OU
P BA
SED O
N 2001 N
ATIO
NA
L CEN
SUS D
ATA
AG
E GR
OU
P (YR
S)
Total
infected
men
2003 Ag
e adju
sted
District H
IV
prevalen
ce
2003 DISTR
ICT A
GE-SPEC
IFIC H
IV PR
EVA
LENC
E RA
TES
AM
ON
G PR
EGN
AN
T WO
MEN
AG
E GR
OU
P (YR
S)
NU
MB
ER O
F INFEC
TED M
ALES PER
DISTR
ICT, U
SING
MA
LE:FEMA
LE HIV
INFEC
TION
RA
TIO
AG
E GR
OU
P (YR
S)
15-19
4,446
3,266
9,526
4,451
11,518
8,827
1,737
6,822
4,369
942
1,404
8,010
3,551
3,120
9,055
4,300
3,507
1,506
2,493
2,642
3,129
982
99603
District
North W
est (1)
North East (2)
Serowe/Palapye (3)
Bobirwa (4)
Kw
eneng East (5)
Southern (6)
Gantsi (7)
Mahalapye (8)
Kgatleng (9)
Chobe (10)
Kgalagadi (11)
Tutume (12)
Boteti (13)
Okavango (14)
Gaborone (15)
Francistown (16)
South East (17)
Lobatse (18)
Selebi/Phikwe (19)
Kw
eneng West (20)
Goodhope (23)
Hukuntsi (24)
Total
20-24
3,816
1,670
6,129
2,445
9,320
5,431
1,559
4,266
3,328
1,318
1,252
3,804
2,848
1,987
13,843
5,026
3,358
1,776
2,866
1,637
1,633
836
80148
25-29
3,222
1,291
5,089
1,945
8,258
4,412
1,634
3,660
2,818
1,153
1,273
3,133
2,587
1,680
13,407
4,872
3,095
1,706
2,987
1,623
1,308
724
71877
30-34
2,330
1,020
3,874
1,483
6,113
3,790
1,284
2,928
2,071
833
856
2,481
1,956
1,174
10,102
3,921
2,284
1,327
2,297
1,226
1,110
537
54997
35-39
1,955
860
3,241
1,224
4,742
3,093
1,157
2,488
1,799
605
763
2,202
1,736
1,040
7,714
3,071
1,806
1,060
1,728
942
967
458
44651
40-49
2,416
1,426
5,346
2,019
7,076
5,285
1,331
3,972
2,895
757
1,042
3,551
2,660
1,400
9,211
3,631
2,525
1,410
2,939
1,487
1,820
610
64809
18,185
9,533
33,205
13,567
47,027
30,838
8,702
24,136
17,280
5,608
6,590
23,181
15,338
10,401
63,332
24,821
16,575
8,785
15,310
9,557
9,967
4,147
416085
15-19
26.0
27.8
35.2
38.3
16.3
11.9
14.3
28.6
18.8
20.0
22.6
26.1
14.3
23.7
18.0
25.0
21.9
17.1
36.8
10.4
29.6
6.7
20-24
37.2
50.8
43.8
61.2
37.1
25.2
35.7
34.8
29.3
46.7
25.6
40.1
40.9
38.0
41.9
51.7
19.4
30.0
49.2
26.4
34.6
30.3
25-29
48.7
54.5
52.4
71.7
44.0
37.6
23.0
57.4
43.2
50.0
41.2
52.4
52.1
49.3
54.2
54.0
29.3
42.9
70.8
45.5
50.0
45.8
30-34
40.4
42.3
54.2
62.2
29.3
41.9
31.8
46.4
42.9
81.3
42.9
43.1
41.7
33.3
58.0
51.5
39.6
42.4
64.7
23.1
33.3
31.6
35-39
41.4
36.0
62.9
39.3
30.8
24.2
8.0
45.5
48.0
44.4
25.0
38.9
16.7
34.6
58.3
46.5
34.8
38.9
40.9
42.1
54.5
33.3
40-49
46.2
40.0
28.0
33.3
40.0
25.0
10.0
26.3
16.7
50.0
20.0
37.5
28.6
21.7
44.4
50.0
30.8
28.6
50.0
27.3
50.0
33.3
15-199776
282
144
1588921
164691627
1764362
1389165227723786
1,923
104850
1.8%
20-24
448
268
847
472
1,092
433
176
469
308
194
101
482
367
239
1,834
821
206
168
445
137
17980
9,765
84370
11.6%
25-29
925
415
1,573
823
2,144
979
221
1,237
718
340
309
967
795
488
4,281
1,550
534
431
1,247
435
386
196
20,993
75663
27.7%
30-34
812
373
1,811
796
1,548
1,369
353
1,173
766
584
317
923
704
338
5,060
1,742
781
486
1,283
244
319
146
21,929
57894
37.9%
35-39
894
342
2,252
531
1,613
829
102
1,250
954
297
211
947
320
398
4,974
1,579
694
456
781
438
583
169
20,614
47003
43.9%
40-49
1,456
745
1,954
878
3,695
1,725
174
1,364
630
494
272
1,738
992
397
5,344
2,370
1,014
526
1,918
529
1,188
265
29,668
68223
43.5%
4,632
2,219
8,719
3,644
10,249
5,423
1,047
5,658
3,445
1,925
1,237
5,234
3,220
1,922
21,630
8,152
3,294
2,088
5,753
1,807
2,732
862
104,892
438003
25.2%
25.5%
23.3%
26.3%
26.9%
21.8%
17.6%
12.0%
23.4%
19.9%
34.3%
18.8%
22.6%
21.0%
18.5%
34.2%
32.8%
19.9%
23.8%
37.6%
18.9%
27.4%
20.8%
23.9%
Total p
op
in ag
e gro
up
Overall ad
justed
age-sp
eific prev (%
)

64
Botswana 2003 Second Generation HIV Surveillance Report
National AIDS Coordinating Agency (NACA) in collaboration with AIDS/STD Unit, the BOTUSA Project (CDC), District Health Teams, the Botswana Harvard Partnership and WHO
8.7. TEBELOPELE VCT FORM (PAGE 1)

65
Botswana 2003 Second Generation HIV Surveillance Report
National AIDS Coordinating Agency (NACA) in collaboration with AIDS/STD Unit, the BOTUSA Project (CDC), District Health Teams, the Botswana Harvard Partnership and WHO
8.7. TEBELOPELE VCT FORM (PAGE 2)

66
Botswana 2003 Second Generation HIV Surveillance Report
National AIDS Coordinating Agency (NACA) in collaboration with AIDS/STD Unit, the BOTUSA Project (CDC), District Health Teams, the Botswana Harvard Partnership and WHO
8.8. HIV REQUEST FORM

67
Botswana 2003 Second Generation HIV Surveillance Report
National AIDS Coordinating Agency (NACA) in collaboration with AIDS/STD Unit, the BOTUSA Project (CDC), District Health Teams, the Botswana Harvard Partnership and WHO
8.9. BANGUI & ABIDJAN DEFINITIONSOF CLINICAL AIDS (IN ADULTS)
Bangui Definition
In adults, AIDS is defined as the co-existence of at least two major symptoms and at least one minor one, in theabsence of any known cause of immunodepresssion such as malignancy, sever malnutrition or of any otherknown etiology.
- Major symptoms: A - Loss of weight > 10%B - Chronic diarrhea persisting > 1 monthC - Fever of over 1 month’s duration (intermittent or continuous
- Minor symptoms: A - Cough persisting > 1 monthB - Generalized pruritic dermatitisC - Recurrent Herpes ZosterD - Oropharyngeal CandidiasisE - Generalized progressive Herpes InfectionF - Generalized lymphadenopathy
The presence of generalized Kaposi’s sarcoma or cryptococcal meningititis is sufficient to diagnose AIDS
ABIDJAN DEFINITION = BANGUI definition + HIV positive serology
Revised WHO case definition for AIDS in Africa (Abidjan Conference)

68
Botswana 2003 Second Generation HIV Surveillance Report
National AIDS Coordinating Agency (NACA) in collaboration with AIDS/STD Unit, the BOTUSA Project (CDC), District Health Teams, the Botswana Harvard Partnership and WHO
8.10. TB REGISTER FORM

69
Botswana 2003 Second Generation HIV Surveillance Report
National AIDS Coordinating Agency (NACA) in collaboration with AIDS/STD Unit, the BOTUSA Project (CDC), District Health Teams, the Botswana Harvard Partnership and WHO
Ngami (1)North East (2)Serowe/Palapye (3)Bobirwa (4)Kweneng East (5)Southern (6)Gantsi (7)Mahalapye (8)Kgatleng (9)Chobe (10)Kgalagadi (11)Tutume (12)Boteti (13)Okavango (14)Gaborone (15)Francistown (16)South East (17)Lobatse (18)Selebi Phikwe (19)Kweneng West (20)Goodhope (23)Hukuntsi (24)Adjusted Prevalence
16/6114/4314/7913/4014/1049/451/1818/584/463/167/4422/7610/4817/6515/7211/714/329/3422/606/293/275/18
237/1086
20/7715/5425/7118/4716/988/67na
18/6312/643/157/3123/885/3518/7611/6127/1087/326/3514/385/488/271/15
274/1199
26.027.835.238.316.311.9na
28.618.820.022.626.114.323.718.025.021.917.136.810.429.66.722.8
-0.3-4.817.55.82.9-8.1na
-2.510.11.36.7-2.8-6.5-2.5-2.89.59.4-9.30.2
-10.318.5-21.11.8
District2002
HIV+/N %
Age 15 to 19 Years
2003
HIV+/N % Difference %
26.232.617.732.513.520.05.631.08.718.815.928.920.826.120.815.512.526.536.720.711.127.821.0
Ngami (1)North East (2)Serowe/Palapye (3)Bobirwa (4)Kweneng East (5)Southern (6)Gantsi (7)Mahalapye (8)Kgatleng (9)Chobe (10)Kgalagadi (11)Tutume (12)Boteti (13)Okavango (14)Gaborone (15)Francistown (16)South East (17)Lobatse (18)Selebi Phikwe (19)Kweneng West (20)Goodhope (23)Hukuntsi (24)Adjusted Prevalence
40/8428/6261/16840/10171/20334/12010/3543/10844/11611/3313/4355/11736/8133/7392/27266/17627/9533/8160/12418/5217/4510/28
842/2217
48/12932/6356/12852/8569/18629/115
na40/11536/12321/4510/3959/14738/9335/9299/236121/23420/10327/9063/12814/5318/5210/33
922/2359
37.2 50.8 43.8 61.2 37.1 25.2 na
34.829.3 46.725.6 40.1 40.9 38.0 41.9 51.7 19.430.049.2 26.4 34.630.3 38.6
-10.45.67.421.62.1-3.1na
-5.0-8.713.3-4.6-6.9-3.6-7.28.1 14.2 -9.0-10.70.8 -8.2-3.2-5.41.2
District2002
HIV+/N %
Age 20 to 24 Years
2003
HIV+/N % Difference %
47.6 45.2 36.3 39.6 35.0 28.3 28.6 39.8 37.9 33.3 30.2 47.0 44.445.2 33.8 37.5 28.4 40.7 48.4 34.6 37.8 35.7 37.4
8.11. A/B COMPARISON OF 2002 AND 2003HIV RESULTS BY INDIVIDUAL AGE GROUPS

Ngami (1)North East (2)Serowe/Palapye (3)Bobirwa (4)Kweneng East (5)Southern (6)Gantsi (7)Mahalapye (8)Kgatleng (9)Chobe (10)Kgalagadi (11)Tutume (12)Boteti (13)Okavango (14)Gaborone (15)Francistown (16)South East (17)Lobatse (18)Selebi Phikwe (19)Kweneng West (20)Goodhope (23)Hukuntsi (24)Adjusted Prevalence
32/5714/3242/8454/7257/12339/877/2230/5221/6214/2513/4350/8024/4529/6483/17358/10032/7929/6768/10011/2512/287/16
726/1436
37/7624/4443/8233/4648/10932/85
na39/6835/8113/2614/3444/8437/7134/6978/14468/12624/8227/6351/7215/3315/3011/24
736/1510
48.754.5 52.4 71.7 44.037.6na
57.4 43.2 50.041.252.4 52.149.354.2 54.0 29.342.970.8 45.5 50.045.8
49.7
-7.510.8 2.4-3.3-2.3-7.2na
-0.39.3-6.010.9 -10.1-1.24.0 6.2 -4.0-11.2-0.42.8 1.57.1 2.1
-0.3
District2002
HIV+/N %
Age 25 to 29 Years
2003
HIV+/N % Difference %
56.1 43.8 50.075.0 46.344.831.8 57.7 33.956.0 30.262.5 53.345.3 48.0 58.0 40.5 43.2 68.0 44.042.9 43.8
50.0
Ngami (1)North East (2)Serowe/Palapye (3)Bobirwa (4)Kweneng East (5)Southern (6)Gantsi (7)Mahalapye (8)Kgatleng (9)Chobe (10)Kgalagadi (11)Tutume (12)Boteti (13)Okavango (14)Gaborone (15)Francistown (16)South East (17)Lobatse (18)Selebi Phikwe (19)Kweneng West (20)Goodhope (23)Hukuntsi (24)Adjusted Prevalence
15/2518/3122/4518/3433/7326/564/1821/3824/539/188/2518/4920/4813/4347/9236/6315/4616/4029/556/199/215/13
412/905
21/5211/2626/4823/3722/7518/43
na13/2818/4213/1615/3525/5815/3614/4247/8135/6821/5314/3322/346/265/156/19
404/911
40.442.354.262.2 29.3 41.9 na
46.442.981.342.9 43.141.7 33.358.051.5 39.6 42.4 64.723.133.3 31.6
45.9
-19.6-15.85.39.2
-15.9-4.6na
-8.8-2.431.310.96.40.03.16.9-5.77.0 2.4 12.0-8.5-9.5-6.9
-0.8
District2002
HIV+/N %
Age 30 to 34 Years
2003
HIV+/N % Difference %
60.0 58.1 48.9 52.945.246.422.255.345.350.0 32.036.741.7 30.251.157.1 32.640.052.731.642.938.5
46.7
70
Botswana 2003 Second Generation HIV Surveillance Report
National AIDS Coordinating Agency (NACA) in collaboration with AIDS/STD Unit, the BOTUSA Project (CDC), District Health Teams, the Botswana Harvard Partnership and WHO
8.11. C/D COMPARISON OF 2002 AND 2003HIV RESULTS BY INDIVIDUAL AGE GROUPS AGE GROUPS

Ngami (1)North East (2)Serowe/Palapye (3)Bobirwa (4)Kweneng East (5)Southern (6)Gantsi (7)Mahalapye (8)Kgatleng (9)Chobe (10)Kgalagadi (11)Tutume (12)Boteti (13)Okavango (14)Gaborone (15)Francistown (16)South East (17)Lobatse (18)Selebi Phikwe (19)Kweneng West (20)Goodhope (23)Hukuntsi (24)Adjusted Prevalence
6/185/1414/4110/209/356/371/1314/2411/278/105/1415/303/238/2018/4313/337/265/1210/195/182/103/4
178/491
12/299/2522/3511/2812/398/33na
15/3312/254/93/1214/363/189/2614/2420/438/237/189/228/196/112/6
210/539
41.4 36.0 62.9 39.330.824.2 na
45.5 48.0 44.425.038.9 16.7 34.658.3 46.534.838.9 40.942.154.533.3 41.5
8.00.328.7 -10.75.18.0na
-12.97.3
-35.6-10.7-11.13.6 -5.416.57.1 7.9-2.8-11.714.3 34.5 -41.75.2*
District2002
HIV+/N %
Age 35 to 39 Years
2003
HIV+/N % Difference %
33.335.734.150.025.716.2 7.758.340.7 80.035.750.013.040.041.939.4 26.941.752.6 27.8 20.0 75.0 36.2
Ngami (1)North East (2)Serowe/Palapye (3)Bobirwa (4)Kweneng East (5)Southern (6)Gantsi (7)Mahalapye (8)Kgatleng (9)Chobe (10)Kgalagadi (11)Tutume (12)Boteti (13)Okavango (14)Gaborone (15)Francistown (16)South East (17)Lobatse (18)Selebi Phikwe (19)Kweneng West (20)Goodhope (23)Hukuntsi (24)Adjusted Prevalence
2/84/143/87/195/296/181/64/232/60/31/36/182/54/195/146/152/101/74/143/153/151/3
72/272
6/134/107/254/126/154/16na
5/193/182/42/106/162/75/234/97/144/132/74/83/111/21/3
83/265
46.240.028.023.340.0 25.0 na
26.316.750.0 20.0 37.528.6 21.7 44.4 50.0 30.828.650.0 27.350.0 33.3
34.4
21.211.4 -9.5-3.522.8-8.3na8.9
-16.750.0 -13.34.2
-11.40.7 8.7 10.010.814.3 21.47.3 30.0 0.0
5.7*
District2002
HIV+/N %
Age 40 to 49 Years
2003
HIV+/N % Difference %
25.028.637.536.8 17.2 33.316.717.433.3 0.0 33.333.340.021.1 35.7 40.020.014.328.6 20.020.033.3
28.8
8.11. E/F COMPARISON OF 2002 AND 2003HIV RESULTS BY INDIVIDUAL AGE GROUPS AGE GROUPS
71
Botswana 2003 Second Generation HIV Surveillance Report
National AIDS Coordinating Agency (NACA) in collaboration with AIDS/STD Unit, the BOTUSA Project (CDC), District Health Teams, the Botswana Harvard Partnership and WHO

72
Botswana 2003 Second Generation HIV Surveillance Report
National AIDS Coordinating Agency (NACA) in collaboration with AIDS/STD Unit, the BOTUSA Project (CDC), District Health Teams, the Botswana Harvard Partnership and WHO
8.12. ENROLLMENT OF FIRST TIME VCT ATTENDEES BY SEX AND AGE GROUP, TEBELOPELE VCT PROGRAM, 2000-2003*, BOTSWANA
(*INCOMPLETE YEAR, AS OF 30 SEPTEMBER 2003)
326629
018000100000000
974
363112766633542141803125960000000
6695
4777182686747139331380768751075824055523828940
12564
413020651031891404239878533591719347654586906267772
15013
12864579625611734101173219971280110714775871209824934361772
35246
TebelopeleCentre
2000
No
2001
No
2002
No
2003*
No
Total
No
GaboroneFrancistownSelebi PhikweMaunJwanengKasaneSeroweLobatseLetlhakanePalapyeGantsiMochudiKanyeMolepololeTsabongMahalapyeTotal
Men
Women
304609
016000000000000
929
309811085483902082912284270000000
5920
3356159273746334541356461156052625044116022990
10139
29581612710671384297520467590507385473445521271499
11310
971649211995154093710011312112011571033635914605543370499
28298
TebelopeleCentre
2000
No
2001
No
2002
No
2003*
No
Total
No
GaboroneFrancistownSelebi PhikweMaunJwanengKasaneSeroweLobatseLetlhakanePalapyeGantsiMochudiKanyeMolepololeTsabongMahalapyeTotal

73
Botswana 2003 Second Generation HIV Surveillance Report
National AIDS Coordinating Agency (NACA) in collaboration with AIDS/STD Unit, the BOTUSA Project (CDC), District Health Teams, the Botswana Harvard Partnership and WHO
Women
8.13.HIV PREVALENCE BY EDUCATION AMONG FIRST TIME VCT ATTENDEES, TEBELOPELE VCT PROGRAM, 2000-2003*, BOTSWANA
(*INCOMPLETE YEAR, AS OF 30 SEPTEMBER 2003)
None PrimarySecondaryTertiary
9115560284
66.753.035.716.2
5861331882155
53.455.033.617.1
234159854702445
57.761.239.422.1
7923,5638,0802,771
52.958.245.924.4
1,2286,502
19,2658,377
53.658.741.321.3
Education2000
No. % Pos2001
No. % Pos2002
No. % Pos2003*
No. % PosTotal
No. % Pos
Men
None PrimarySecondaryTertiary
21121482300
47.640.519.112.3
151613
2,8352,289
45.050.621.014.5
4991,6834,9542,963
56.958.823.617.5
9632,5575,2072,695
57.959.529.019.4
1,6344,974
13,4788,247
56.357.725.017.1
Education2000
No. % Pos2001
No. % Pos2002
No. % Pos2003*
No. % PosTotal
No. % Pos

74
Botswana 2003 Second Generation HIV Surveillance Report
National AIDS Coordinating Agency (NACA) in collaboration with AIDS/STD Unit, the BOTUSA Project (CDC), District Health Teams, the Botswana Harvard Partnership and WHO
8.14. DEMOGRAPHIC CHARACTERISTICS OF MAKGABANENG RADIO LISTENERSHIP RESPONDENTS
1582470
405
2766651750
405
5499200520
405
162611136702
405
208721214
405
1632381
402
24983561112
402
29103230391
402
131291746800
402
133901754
402
3214851
807
5251491078162
807
83202430911
807
2939028713502
807
3411622968
807
Characteristic Male 25-29 yrs 35-39 yrs
Age Group15-1920-24missingTotal
Marital StatussinglecohabitingmarrieddivorcedwidowedmissingTotal
Educationnoneprimarysecondarypost-secondarymissingTotal
Occupationformal employmentinformal/casual employmentsubsistence/housewife/unemployedstudentothermissingTotal
# Birthsnoneonemore than onemissingTotal
*all values are not weighted
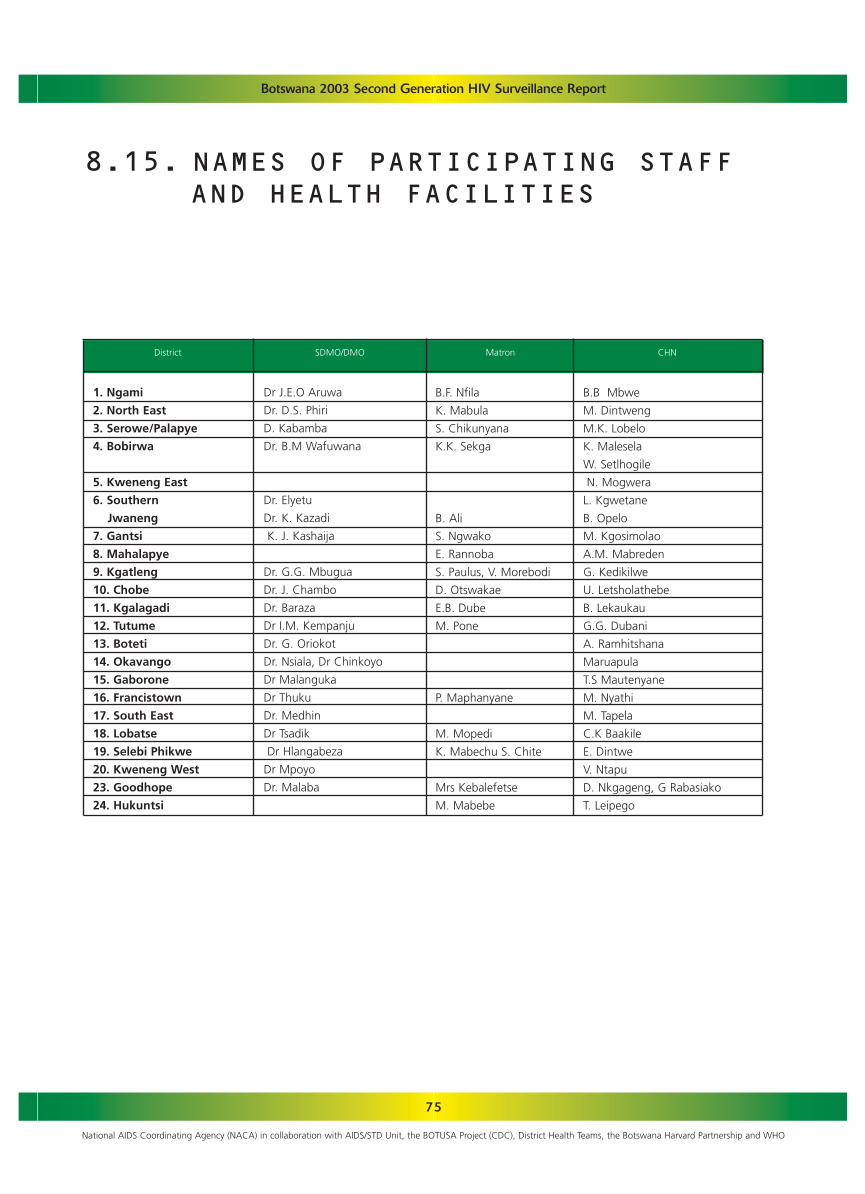
75
Botswana 2003 Second Generation HIV Surveillance Report
National AIDS Coordinating Agency (NACA) in collaboration with AIDS/STD Unit, the BOTUSA Project (CDC), District Health Teams, the Botswana Harvard Partnership and WHO
1. Ngami
2. North East
3. Serowe/Palapye
4. Bobirwa
5. Kweneng East
6. Southern
Jwaneng
7. Gantsi
8. Mahalapye
9. Kgatleng
10. Chobe
11. Kgalagadi
12. Tutume
13. Boteti
14. Okavango
15. Gaborone
16. Francistown
17. South East
18. Lobatse
19. Selebi Phikwe
20. Kweneng West
23. Goodhope
24. Hukuntsi
Dr J.E.O Aruwa
Dr. D.S. Phiri
D. Kabamba
Dr. B.M Wafuwana
Dr. Elyetu
Dr. K. Kazadi
K. J. Kashaija
Dr. G.G. Mbugua
Dr. J. Chambo
Dr. Baraza
Dr I.M. Kempanju
Dr. G. Oriokot
Dr. Nsiala, Dr Chinkoyo
Dr Malanguka
Dr Thuku
Dr. Medhin
Dr Tsadik
Dr Hlangabeza
Dr Mpoyo
Dr. Malaba
B.F. Nfila
K. Mabula
S. Chikunyana
K.K. Sekga
B. Ali
S. Ngwako
E. Rannoba
S. Paulus, V. Morebodi
D. Otswakae
E.B. Dube
M. Pone
P. Maphanyane
M. Mopedi
K. Mabechu S. Chite
Mrs Kebalefetse
M. Mabebe
B.B Mbwe
M. Dintweng
M.K. Lobelo
K. Malesela
W. Setlhogile
N. Mogwera
L. Kgwetane
B. Opelo
M. Kgosimolao
A.M. Mabreden
G. Kedikilwe
U. Letsholathebe
B. Lekaukau
G.G. Dubani
A. Ramhitshana
Maruapula
T.S Mautenyane
M. Nyathi
M. Tapela
C.K Baakile
E. Dintwe
V. Ntapu
D. Nkgageng, G Rabasiako
T. Leipego
District SDMO/DMO Matron CHN
8.15. NAMES OF PARTICIPATING STAFF AND HEALTH FACILITIES
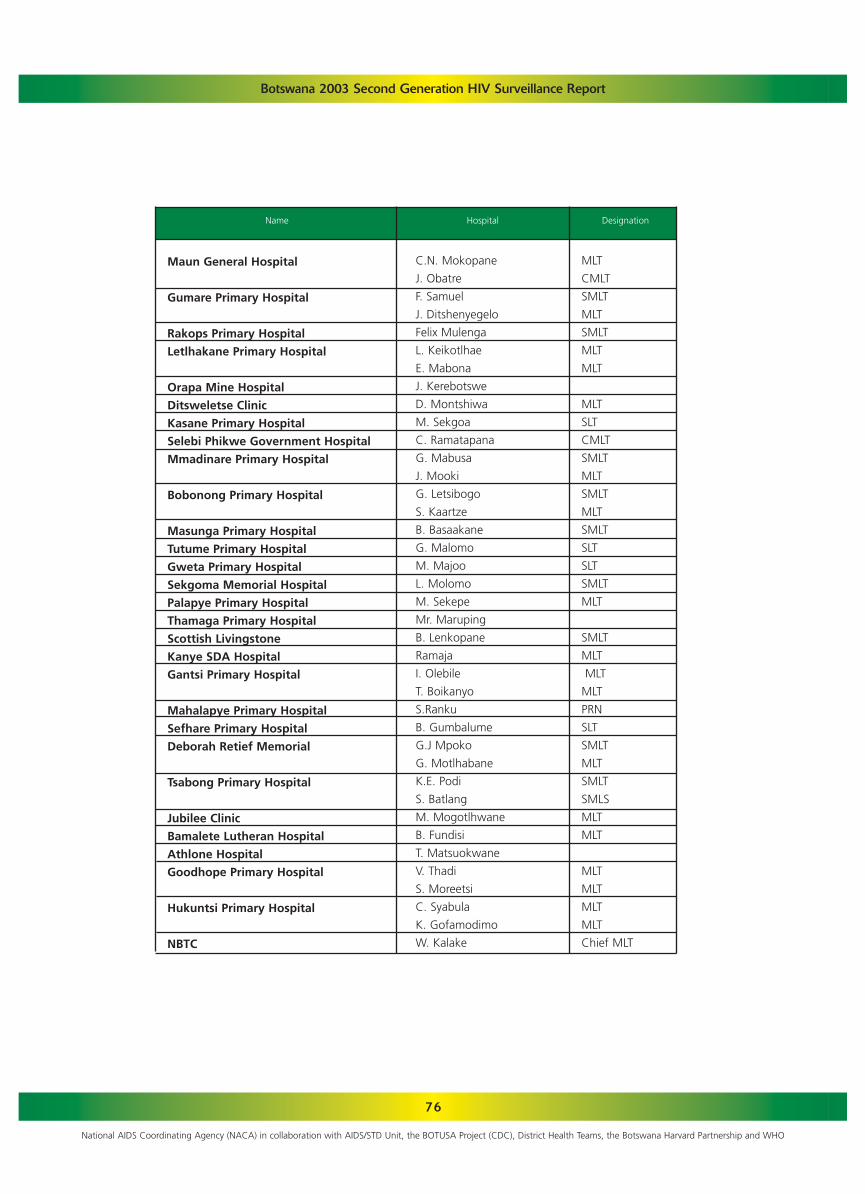
76
Botswana 2003 Second Generation HIV Surveillance Report
National AIDS Coordinating Agency (NACA) in collaboration with AIDS/STD Unit, the BOTUSA Project (CDC), District Health Teams, the Botswana Harvard Partnership and WHO
Maun General Hospital
Gumare Primary Hospital
Rakops Primary Hospital
Letlhakane Primary Hospital
Orapa Mine Hospital
Ditsweletse Clinic
Kasane Primary Hospital
Selebi Phikwe Government Hospital
Mmadinare Primary Hospital
Bobonong Primary Hospital
Masunga Primary Hospital
Tutume Primary Hospital
Gweta Primary Hospital
Sekgoma Memorial Hospital
Palapye Primary Hospital
Thamaga Primary Hospital
Scottish Livingstone
Kanye SDA Hospital
Gantsi Primary Hospital
Mahalapye Primary Hospital
Sefhare Primary Hospital
Deborah Retief Memorial
Tsabong Primary Hospital
Jubilee Clinic
Bamalete Lutheran Hospital
Athlone Hospital
Goodhope Primary Hospital
Hukuntsi Primary Hospital
NBTC
C.N. Mokopane
J. Obatre
F. Samuel
J. Ditshenyegelo
Felix Mulenga
L. Keikotlhae
E. Mabona
J. Kerebotswe
D. Montshiwa
M. Sekgoa
C. Ramatapana
G. Mabusa
J. Mooki
G. Letsibogo
S. Kaartze
B. Basaakane
G. Malomo
M. Majoo
L. Molomo
M. Sekepe
Mr. Maruping
B. Lenkopane
Ramaja
I. Olebile
T. Boikanyo
S.Ranku
B. Gumbalume
G.J Mpoko
G. Motlhabane
K.E. Podi
S. Batlang
M. Mogotlhwane
B. Fundisi
T. Matsuokwane
V. Thadi
S. Moreetsi
C. Syabula
K. Gofamodimo
W. Kalake
MLT
CMLT
SMLT
MLT
SMLT
MLT
MLT
MLT
SLT
CMLT
SMLT
MLT
SMLT
MLT
SMLT
SLT
SLT
SMLT
MLT
SMLT
MLT
MLT
MLT
PRN
SLT
SMLT
MLT
SMLT
SMLS
MLT
MLT
MLT
MLT
MLT
MLT
Chief MLT
Name Hospital Designation

77
Botswana 2003 Second Generation HIV Surveillance Report
National AIDS Coordinating Agency (NACA) in collaboration with AIDS/STD Unit, the BOTUSA Project (CDC), District Health Teams, the Botswana Harvard Partnership and WHO
1. Ngami
2. North East
3.Serowe/Palapye
4. Bobirwa
5. Kweneng East
Maun Gen Hospital
Maun Clinic
Sehitwa Clinic
Boyei Clinic
Tsau Clinic
Sedie Clinic
Makalamabedi Clinic
Boseja Clinic
Shorobe Clinic
Thitoyamokolo Health Post
Masunga Clinic
Makaleng Clinic
Sekgoma Memorial Hosp.
Palapye P. Hospital
Newtown Clinic
Serowe Clinic
Moiyabana Clinic
Mmashoro Clinic
Lotsane Clinic
Kediretswe Clinic
Lerala Clinic
Bobonong P. Hospital
Mmadinare P. Hospital
Sefophe Clinic
Manga Clinic
Tsetsebjwe Clinic
Semolale Clinic
Mathathane Clinic
Borotsi Clinic
Moletemane H. Post
Scottish Livingstone
Kgosing Clinic
S. Mohube, G Obatre,
G. Mokubung
D. Oitsile, G. Mwale
R. Kusane, K. Kgoboge
T.K. Sehube, P. Mokwena,
T. Manyepedza, G. Segosele
L. Phiri, C. Boikanyo,
O. Waloka
V. Letshola, N. Kibakaya
K. Ditshotlo, C Katebe
R.P. Mongale, M. Mogende
P. Handukani, P. Tholo
S. Leshaga, O. Gubago
B. Radikgomo
G. Ranku
K. Buku
B. Monyika
E. Malamu
N. Chimidza, J. Bolebantswe
K. Kgomotsego
N. Motheo
M. Chamme
Balopi
O. Khao
D. Badisang
D. Malawana
J. Malema
N. Moitoi
G. Mwando
T. Nsakwa
R. Botshabelo
M. Ramolathla
G. Tsholo
A. Sankoloba
O. Phuthego
N. Mwanza
B. Gabobegwe
DISTRICT FACILITY PARTICIPATING OFFICIALS

78
Botswana 2003 Second Generation HIV Surveillance Report
National AIDS Coordinating Agency (NACA) in collaboration with AIDS/STD Unit, the BOTUSA Project (CDC), District Health Teams, the Botswana Harvard Partnership and WHO
6. Southern Jwaneng
7. Gantsi
8. Mahalapye
9. Kgatleng
Kanye Clinic
Mahikana Clinic
Kgwatlheng Clinic
Sebego Clinic
Mmamokhasi Clinic
Molapowabojang Clinic
Moshopa Council Clinic
Moshupa H. Post
Dada Clinic
Sese H. Post
Letlhakane East Clinic
Ntlhantlhe Clinic
Ditsweletse Clinic
Shha H. Post
Gantsi Clinic
D’Kar H. Post
Mahalapye P. Hospital
Sefhare P. Hospital
Leetile H. Post
Baitiredi Clinic
Madiba H. Post
Airstrip Clinic
Ramokgonami Clinic
Pilikwe Clinic
Macheng Clinic
Chadibe Clinic
Kalamare Clinic
Shoshong Clinic
Seleka Clinic
Mookane Clinic
DRM
Mochudi Clinic 1
Artesia Clinic
Bokaa Clinic
Mathubudukwane Clinic
Mochudi Clinic 2
Oodi Clinic
Boseja Clinic
D. Mokobane, G. Mudongo
S. Shadikong
Mrs. Moshimba
M. Dibeela
D. Sekgwa
E. Hlomani
C. Maswabi
Mrs. Leshope
S. Methikge
D. Ntsimako
Mrs. Nchoko
D. Searobi
M. Paulus, O. Montsho,
V. Mogonono
C. Viruwa
T. Mabaiwa
T. Taruvinga
M. Mabusa
S. Ntau
B. Nkane
G.M. Mooketsi
M. Kgosietsile
L. Sebego
K. Mophane
J. Mmereki
C. Tibone
M. Monageng
A. Gaetote
S. Siso
C. Molale
B. Nuku, P. Sejamitwa
K. Badumetse, O, Magashula
T. Mosugelo, T. Musonda
J. Soko, S. Monosi
M. Poonyane, F. Moyo
P. Setswamokwena, M. Meleki
L.S. Moyo, B. Bashanako
B. Phutego, S. Makhwaje
DISTRICT FACILITY PARTICIPATING OFFICIALS
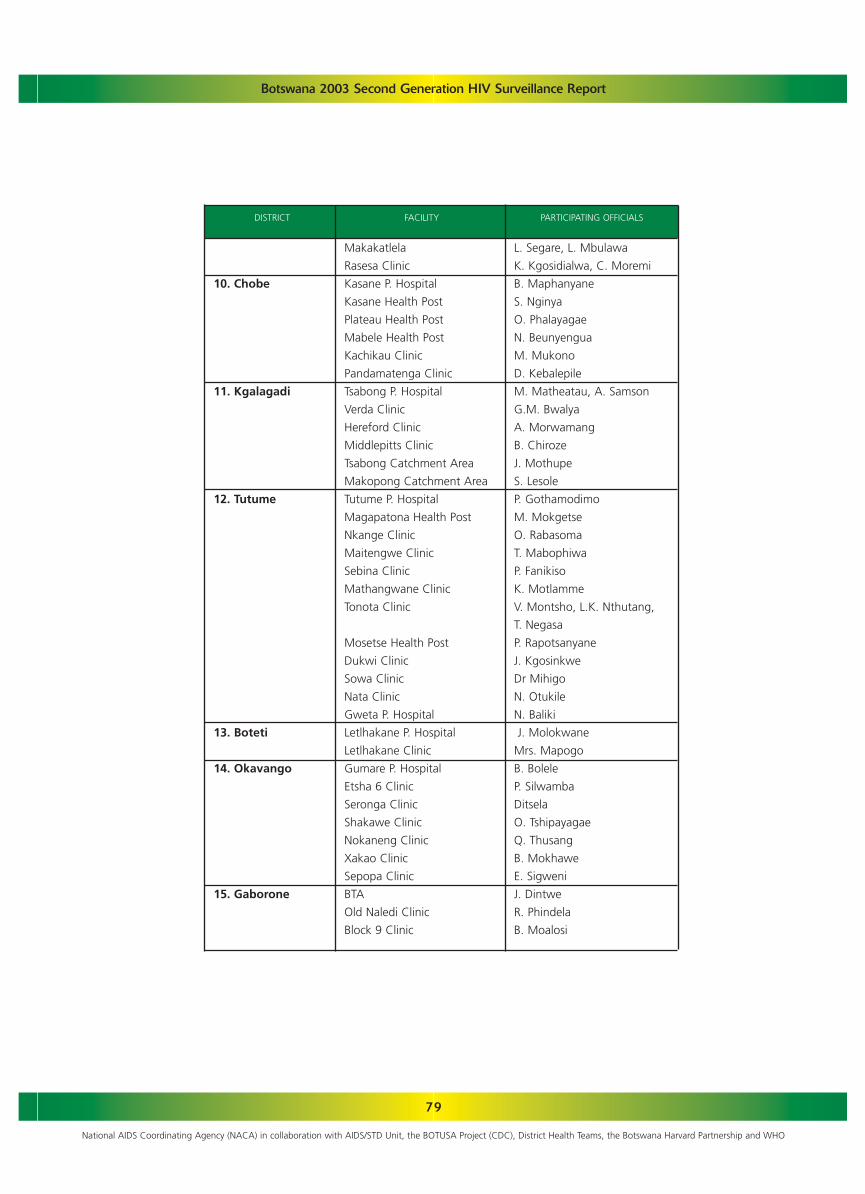
79
Botswana 2003 Second Generation HIV Surveillance Report
National AIDS Coordinating Agency (NACA) in collaboration with AIDS/STD Unit, the BOTUSA Project (CDC), District Health Teams, the Botswana Harvard Partnership and WHO
10. Chobe
11. Kgalagadi
12. Tutume
13. Boteti
14. Okavango
15. Gaborone
Makakatlela
Rasesa Clinic
Kasane P. Hospital
Kasane Health Post
Plateau Health Post
Mabele Health Post
Kachikau Clinic
Pandamatenga Clinic
Tsabong P. Hospital
Verda Clinic
Hereford Clinic
Middlepitts Clinic
Tsabong Catchment Area
Makopong Catchment Area
Tutume P. Hospital
Magapatona Health Post
Nkange Clinic
Maitengwe Clinic
Sebina Clinic
Mathangwane Clinic
Tonota Clinic
Mosetse Health Post
Dukwi Clinic
Sowa Clinic
Nata Clinic
Gweta P. Hospital
Letlhakane P. Hospital
Letlhakane Clinic
Gumare P. Hospital
Etsha 6 Clinic
Seronga Clinic
Shakawe Clinic
Nokaneng Clinic
Xakao Clinic
Sepopa Clinic
BTA
Old Naledi Clinic
Block 9 Clinic
L. Segare, L. Mbulawa
K. Kgosidialwa, C. Moremi
B. Maphanyane
S. Nginya
O. Phalayagae
N. Beunyengua
M. Mukono
D. Kebalepile
M. Matheatau, A. Samson
G.M. Bwalya
A. Morwamang
B. Chiroze
J. Mothupe
S. Lesole
P. Gothamodimo
M. Mokgetse
O. Rabasoma
T. Mabophiwa
P. Fanikiso
K. Motlamme
V. Montsho, L.K. Nthutang,
T. Negasa
P. Rapotsanyane
J. Kgosinkwe
Dr Mihigo
N. Otukile
N. Baliki
J. Molokwane
Mrs. Mapogo
B. Bolele
P. Silwamba
Ditsela
O. Tshipayagae
Q. Thusang
B. Mokhawe
E. Sigweni
J. Dintwe
R. Phindela
B. Moalosi
DISTRICT FACILITY PARTICIPATING OFFICIALS

80
Botswana 2003 Second Generation HIV Surveillance Report
National AIDS Coordinating Agency (NACA) in collaboration with AIDS/STD Unit, the BOTUSA Project (CDC), District Health Teams, the Botswana Harvard Partnership and WHO
16. Francistown
17. South East
18. Lobatse
19. Selebi Phikwe
20. Kweneng West
23. Goodhope
Broadhurst 2 Clinic
Extension 2 Clinic
Area W Clinic
Tswaragano Clinic
Bamalete Lutheran Hospital
Lesetlhana Clinic
Siga Clinic
Nkaikela H. Post
Khayakholo H. Post
Taung Clinic
Otse Clinic
Tsopeng Clinic
Peleng East Clinic
Woodhall Clinic
Peleng Central Clinic
Athlone P. Hospital
Tapologong Clinic
Botshabelo Clinic
Letlhakeng Clinic
Botlhapatlou H. Post
Ngware Clinic
Khudumelapye Clinic
Salajwe Clinic
Motokwe Clinic
Takatokwane Clinic
Ditshegwane Clinic
Sesung H. Post
Moshaneng Clinic
Kotolaname Clinic
Goodhope P. Hosptital
Pitsane Clinic
Rakhuna Clinic
Ramatlabama Clinic
P. Zibochwa
M. Mmolawa, Mosomodi
C. Monyatsiwa
M. Mokgatlaotsile
D. Kitsiso, D. Moagi
J. Butale, E. Ntlhale
J. Mothupi, S. Montsho
R. Kowa, M. Majeka
D. Kazunguza, L.Bolatlhilwe
M. Hisayi, G. Dipholo
R. Mukwevho, S. Tutwane
B. Tshenyego, L. Segokgo
A. Segapo, M. Ramopedi,
Boemo
M. Molefhi, L. Kelebogile
M. Pheto, D. Humbu
S. Leposo, O. Kowa,
M. Motsamai, Dr Kambinda,
K. Motsuokwane
M. Modumedi
Ramosukwane
T. Smith
V. Mokone, G. Ramosenane, C.
Kgotlaname, C. Kwakwadi
G. Magapu, P.S. Otsheleng
L. Matjologwe
K. Radipati, T. Busang
K. Thebenyana, M. Phiri
T. Mafika, O. Hanqiwe
I. Ramotswetla, O. Muzvidziwa
C. Moleele-Segole
L. Moeti, I. Phathswane
C. Kasheeka, F. Bhusumane
M. Pilane
K. MokonyaneG. Pheto
Mrs Ranthadi, Ms Masepela
Mr Khumalo, Ms Seabo
Ms Mohutsiwa,
DISTRICT FACILITY PARTICIPATING OFFICIALS

81
Botswana 2003 Second Generation HIV Surveillance Report
National AIDS Coordinating Agency (NACA) in collaboration with AIDS/STD Unit, the BOTUSA Project (CDC), District Health Teams, the Botswana Harvard Partnership and WHO
24. Hukuntsi
Hebron Clinic
Pitshane Molopo Clinic
Mabule Clinic
Tshidilamolomo Clinic
Mmathete Clinic
Digawana Clinic
Kang Clinic
Hukuntsi Clinic
Hukuntsi P. Hospital
Lehututu H. Post
Inalegolo H. Post
Ukhwi H. Post
Hunhukwi H. Post
Make H. Post
Monong H. Post
Tshane H. Post
Zutshwa H. Post
K. Mantswenabe
Ms Bareki, Mrs Thakanelo
Mrs Phale, Mrs Chavula
Ms Keraanang, Mrs
Rasetshwane
Ms Tautona
M. Seretse, M. Matoko,
Ms Setiko
S. Makhulumo, Mrs Chipausha
O. Seno, M. Maifala,
D. Chilwalo
T. Manewe, A. Mulapati
M. Sichinga, E. Wabo
M. Modisane, Y. Serwe,
G. Bengani, G. Thako,
E. Morwawakgosi
K. Bonang, B. Mogomotsi
L. Mosetlhane
K. Lekgatlhane
M. Segano
E. Mokgethi
A. Lekhutlanye
F. Tsebe
M. Mokgatle
DISTRICT FACILITY PARTICIPATING OFFICIALS

82
Botswana 2003 Second Generation HIV Surveillance Report
National AIDS Coordinating Agency (NACA) in collaboration with AIDS/STD Unit, the BOTUSA Project (CDC), District Health Teams, the Botswana Harvard Partnership and WHO
Bots
wan
aBo
tsw
ana
Bots
wan
aBo
tsw
ana
Bots
wan
aBo
tsw
ana
Bots
wan
aBo
tsw
ana
Bots
wan
aBo
tsw
ana
Bots
wan
aBo
tsw
ana
Bots
wan
aBo
tsw
ana
Bots
wan
aBo
tsw
ana
Bots
wan
aBo
tsw
ana
Bots
wan
aBo
tsw
ana
Bots
wan
aBo
tsw
ana
AN
C1
AN
C1
AN
C1
AN
C1
AN
C1
AN
C1
AN
C1
AN
C1
AN
C1
AN
C1
AN
C1
AN
C1
AN
C1
AN
C1
AN
C1
AN
C1
AN
C1
AN
C1
AN
C1
AN
C1
AN
C1
AN
C1
Out
side
maj
or u
rban
are
asO
utsi
de m
ajor
urb
an a
reas
Out
side
maj
or u
rban
are
asM
ajor
urb
an a
reas
Maj
or u
rban
are
asO
utsi
de m
ajor
urb
an a
reas
Out
side
maj
or u
rban
are
asO
utsi
de m
ajor
urb
an a
reas
Out
side
maj
or u
rban
are
asO
utsi
de m
ajor
urb
an a
reas
Out
side
maj
or u
rban
are
asO
utsi
de m
ajor
urb
an a
reas
Out
side
maj
or u
rban
are
asO
utsi
de m
ajor
urb
an a
reas
Out
side
maj
or u
rban
are
asO
utsi
de m
ajor
urb
an a
reas
Out
side
maj
or u
rban
are
asM
ajor
urb
an a
reas
Out
side
maj
or u
rban
are
asO
utsi
de m
ajor
urb
an a
reas
Out
side
maj
or u
rban
are
asO
utsi
de m
ajor
urb
an a
reas
Bobi
rwa
Bote
tiC
hobe
Fran
cist
own
Gab
oron
eG
ants
iG
oodh
ope
Huk
unts
i K
gala
gadi
K
gatle
ngK
wen
eng
East
Kw
enen
g W
est
Loba
tse
Mah
alap
yeN
gam
i/Nor
th W
est
Nor
th E
ast
Oka
vang
o Se
lebi
-Phi
kwe
Sero
we/
Pala
pye
Sout
h Ea
st
Sout
hern
Tu
tum
e
23.7
14.9
34.2
19.2
9.5
29.7
27.8
27.0
16.0
23.1
39.6
28.7
18.9
43.1
31.4
33.1
21.8
30.0
42.9
34.0
43.0
38.1
22.3
49.9
24.7
37.5
50.8
(n=
120)
42.7
(n=
576)
37.1
(n=
480)
21.8
(n=
257)
29.5
(n=
271)
31.3
(n=
252)
32.0
(n=
362)
41.8
(n=
268)
44.4
(n=
702)
36.2
(n=
734)
30.4
(n=
349)
50.3
(n=
304)
40.7
n=
(513
)35
.4 (
n=33
9)
44.0
(n=
149)
36.7
(n=
281)
39.1
(n=
81)
49.6
(n=
494)
38.6
(n=
576)
21.8
(15
9)33
.1 (
n=96
)23
.3 (
n=62
)28
.5 (
n=12
0)24
.9 (
n=23
1)29
.6 (
n=54
0)25
.3 (
130)
30.6
(n=
232)
31.9
(n=
336)
35.8
(n=
376)
39.9
(n=
75)
40.6
(n=
225)
50.0
(n=
351)
41.0
(n=
341)
32.1
(n=
192)
31.5
(n=
347)
51.1
(n=
267)
45.3
(n=
286)
35.6
(n=
250)
38.4
(n=
105)
40.2
(n=
458)
38.2
(n=
666)
18.8
(n=
112)
26.3
(n=
146)
40.0
(n=
182)
28.3
(n=
172)
30.9
(n=
310)
29.2
(n=
567)
28.7
(n=
158)
34.6
(n=
241)
39.8
(n=
303)
40.7
(n=
253)
38.6
(n=
196)
34.2
(n=
284)
48.1
(n=
372)
35.2
(n=
425)
26.5
(n=
288)
30.5
(n=
363)
40.7
(n=
370)
49.3
(n=
255)
31.9
(n=
260)
47.0
(n=
115)
45.8
(n=
593)
44.8
(n=
555)
40.9
(n=
137)
28.4
(n=
100)
28.9
(n=
161)
30.6
(n=
353)
32.1
(n=
522)
27.0
(n=
190)
32.4
(n=
246)
37.4
(n=
326)
38.4
(n=
376)
40.4
(n=
222)
32.7
(n=
328)
52.2
(n=
302)
43.3
(n=
389)
27.9
(n=
306)
25.7
(n=
359)
37.7
(n=
429)
Co
un
try
Popu
latio
nU
rban
/Ru
ral
Site
1992
1993
1994
1995
1996
1997
1998
1999
2000
2001
2002
2003
1 2 3 4 5 6 7 8 9 10 11 12 13 14 15 16 17 18 19 20 21 22
8.16. HIV PREVALENCE BY SITE,1992 TO 2003


0 to 2999
3000 to 4999
5000 to 9999
10 000 to 14 999
+ 15 000
6,408
12,428
4,456
16,479
2,839
3,255 7,250
26,05011,886
7,057
21,104
14,821
8,685
52,3645,414
8,442
2,035
14,978
4,4449,492
15,944
27,930
Estimated HIV adults 15-49 yearsin Botswana, 2003
Estimated HIV adults 15-49 yearsin Botswana, 2003
HIV Prevalence per health districtamong pregnant women in 2003HIV Prevalence per health districtamong pregnant women in 2003
0% to 19.9%
Data not available
20% to 29.9%
30% to 39%
40% and above
32.7
38.4
47.0
37.7
28.9 40.9
43.349.3
40.4
45.8
52.2
27.9
44.832.4
31.9
28.4
25.7
27.030.6
37.4
32.1
0
10
20
30
40
50
1992 1993 1994 1995 1996 1997 1998 1999 2000 2001 2002 2003
15-19 20-25 25-49
YEAR
HIV
PR
EVA
LEN
CE
Trend in HIV prevalence amongpregnant women, Botswana, 1992-2003
Age specific HIV seroprevalenceamong pregnant women, 2003