Boraginaceae Varronia rupicola (Urb.) Brtton : biogeog - CORE
280
ORBIT - Online Repository of Birkbeck Institutional Theses Enabling Open Access to Birkbecks Research Degree output Boraginaceae Varronia rupicola (Urb.) Brtton : biogeog- raphy, systematic placement and conservation genetics of a threatened species endemic to the Caribbean http://bbktheses.da.ulcc.ac.uk/179/ Version: Full Version Citation: Hamilton, Martin Allen (2016) Boraginaceae Varronia rupicola (Urb.) Brtton : biogeography, systematic placement and conservation genetics of a threat- ened species endemic to the Caribbean. PhD thesis, Birkbeck, University of London. c 2016 The Author(s) All material available through ORBIT is protected by intellectual property law, including copyright law. Any use made of the contents should comply with the relevant law. Deposit guide Contact: email
-
Upload
khangminh22 -
Category
Documents
-
view
2 -
download
0
Transcript of Boraginaceae Varronia rupicola (Urb.) Brtton : biogeog - CORE

ORBIT - Online Repository of Birkbeck Institutional Theses
Enabling Open Access to Birkbecks Research Degree output
Boraginaceae Varronia rupicola (Urb.) Brtton : biogeog-raphy, systematic placement and conservation genetics ofa threatened species endemic to the Caribbean
http://bbktheses.da.ulcc.ac.uk/179/
Version: Full Version
Citation: Hamilton, Martin Allen (2016) Boraginaceae Varronia rupicola (Urb.)Brtton : biogeography, systematic placement and conservation genetics of a threat-ened species endemic to the Caribbean. PhD thesis, Birkbeck, University of London.
c©2016 The Author(s)
All material available through ORBIT is protected by intellectual property law, including copyright law.
Any use made of the contents should comply with the relevant law.
Deposit guideContact: email

Boraginaceae Varronia rupicola (Urb.) Britton Biogeography, systematic placement and conservation genetics of a
threatened species endemic to the Caribbean
Thesis submitted for the degree of
Doctor of Philosophy
by
Martin Allen Hamilton
School of Biological and Chemical Sciences
Birkbeck, University of London
and
Conservation Science Department
Royal Botanic Gardens, Kew
11 December 2015

2
Declaration I hereby confirm that this thesis is my own work and that any materials from other sources
used in this work have been fully and appropriately acknowledged.
Martin Allen Hamilton
11 December 2015

3
Abstract In the Caribbean region, Varronia rupicola (Boraginaceae) is a medium to large, woody shrub
endemic to the Puerto Rican Bank where it is threatened with extinction due to its limited area
of occupancy, small populations and on-going threats. The greatest of these is currently loss of
suitable habitat through development and degradation. These are caused by human activities
that are expected to continue and possibly worsen. The species is also threatened by sea level
rise and drought as well as natural disasters, particularly hurricanes and tsunamis. Combined,
the effects of anthropogenic and climate change induced threats could push the species to
extinction over the coming century.
Through interrogation of the findings of cyto-, phylo- and population genetic as well as
biogeographical research, it is clear that V. rupicola is a distinct species that is endemic to the
islands of Puerto Rico, Vieques and Anegada where five populations were detected. The
species has lost genetic diversity in the wild through a reduction in population size with allelic
diversity proportional to the size of the population. The five populations were found to have
lower than expected levels of heterozygosity as well as significant genetic differentiation and
inbreeding. Varronia rupicola plants were found in an extremely limited area of intact habitat
(<90 km2) overlying substrates that cover <200 km2 across the three islands. Protected areas
contain less than a third (<30 km2) of the remaining intact habitat that supports the species
and established ex-situ collections capture less than half of the private alleles found in the
wild. An integrated approach to the species conservation is needed to maximise genetic
diversity and potentiality allow adaptation of V. rupicola to environmental change and new
threats.

4
Table of Contents Declaration .................................................................................................................................... 2
Abstract ......................................................................................................................................... 3
Table of Contents .......................................................................................................................... 4
Index of Tables .............................................................................................................................. 9
Index of Figures ........................................................................................................................... 12
Acknowledgements ..................................................................................................................... 20
Thesis Committee ................................................................................................................... 20
British Virgin Islands ................................................................................................................ 20
Department of Agriculture .................................................................................................. 20
National Parks Trust of the Virgin Islands ........................................................................... 20
Cuba ........................................................................................................................................ 20
Puerto Rico .............................................................................................................................. 20
Department of Natural and Environmental Resources ...................................................... 20
International Institute for Tropical Forestry ....................................................................... 20
University of Puerto Rico .................................................................................................... 20
US Fish and Wildlife Service ................................................................................................ 20
UK ............................................................................................................................................ 20
Fera Science ........................................................................................................................ 20
Royal Botanic Gardens, Kew ............................................................................................... 21
USA .......................................................................................................................................... 21
Fort Worth Zoo ................................................................................................................... 21
Fairchild Tropical Botanical Garden .................................................................................... 21
Herbaria .................................................................................................................................. 22
Previous workers ..................................................................................................................... 22
Funding organisations ............................................................................................................. 22
Fieldwork companions ............................................................................................................ 22
Chapter 1. Introduction .............................................................................................................. 24
1.1 The Puerto Rican Bank ...................................................................................................... 25

5
1.1.1. Physical environment ................................................................................................ 26
1.1.2. Climate ...................................................................................................................... 27
1.1.3. Population and development ................................................................................... 28
1.1.4. Vegetation and flora ................................................................................................. 29
1.2. Caribbean dry forest ........................................................................................................ 30
1.2.1. Dry forest composition and protection .................................................................... 30
1.2.2. Threats to the dry forest ........................................................................................... 31
1.3. Legislation and protected areas ....................................................................................... 35
1.3.1. Legislation ................................................................................................................. 36
1.3.2. Protected areas in Puerto Rico ................................................................................. 37
1.3.3. Protected areas in the British Virgin Islands ............................................................. 39
1.4. Boraginaceae systematics, biogeography and morphology ............................................ 39
1.4.1. Family divisions ......................................................................................................... 39
1.4.2. Subfamily Cordioideae .............................................................................................. 41
1.4.3. The genus Varronia ................................................................................................... 41
1.4.4. Varronia rupicola ...................................................................................................... 47
1.5. Thesis outline ................................................................................................................... 52
Chapter 2: Biogeography of Varronia rupicola ........................................................................... 53
2.1. Introduction ..................................................................................................................... 53
2.1.1. Geology ..................................................................................................................... 56
2.1.2. Land cover ................................................................................................................. 58
2.1.3. Sea level rise.............................................................................................................. 60
2.2. Materials and Methods .................................................................................................... 64
2.2.1. Survey and sampling of wild populations ................................................................. 64
2.2.2. Mapping geology, land cover and sea level rise ....................................................... 68
2.3. Results .............................................................................................................................. 73
2.3.1. Geology ..................................................................................................................... 75
2.3.2. Land cover ................................................................................................................. 78
2.3.3. Sea level rise.............................................................................................................. 85

6
2.4. Discussion and conclusions .............................................................................................. 90
2.4.1. Geology ..................................................................................................................... 92
2.4.2. Land cover ................................................................................................................. 95
2.4.3 Sea level rise............................................................................................................. 100
2.4.4. Main conclusions .................................................................................................... 104
Chapter 3: Phylogenetic placement of Varronia rupicola......................................................... 108
3.1. Introduction ................................................................................................................... 108
3.1.1 Genomic information ............................................................................................... 109
3.1.2. Phylogenetic analysis techniques ........................................................................... 112
3.2. Materials and Methods .................................................................................................. 115
3.2.1. Sampling .................................................................................................................. 115
3.2.2. Molecular analysis................................................................................................... 117
3.2.3. Statistical analyses .................................................................................................. 119
3.3. Results ............................................................................................................................ 121
3.3.1. Geneious analyses ................................................................................................... 121
3.3.2. ITS and trnL-trnF final analyses ............................................................................... 122
3.4. Discussion and conclusions ............................................................................................ 127
3.4.1. Phylogenetic relationships ...................................................................................... 128
3.4.2. Recommendations for further research ................................................................. 131
3.4.3. Main conclusions .................................................................................................... 132
Chapter 4: Conservation genetics of Varronia rupicola ............................................................ 134
4.1. Introduction ................................................................................................................... 134
4.2. Materials and Methods .................................................................................................. 136
4.2.1. Karyology................................................................................................................. 136
4.2.2. Next-generation sequencing ................................................................................... 138
4.2.3. Sampling for population analyses ........................................................................... 139
4.2.4. Population sample analysis ..................................................................................... 141
4.2.5. Statistical analyses .................................................................................................. 143
4.3. Results ............................................................................................................................ 151

7
4.3.1. Karyology................................................................................................................. 151
4.3.2. Next-generation sequencing ................................................................................... 152
4.3.3. Allelic diversity ........................................................................................................ 157
4.3.4. Genetic structure .................................................................................................... 160
4.4. Discussion and conclusions ............................................................................................ 169
4.4.1. Karyology................................................................................................................. 170
4.4.2. Allelic Diversity ........................................................................................................ 171
4.4.3. Genetic Diversity ..................................................................................................... 172
4.4.4. Main conclusions .................................................................................................... 177
Chapter 5: Discussion, conservation implications and research opportunities ....................... 182
5.1. Conservation implications .............................................................................................. 183
5.1.1. Geology and land use .............................................................................................. 184
5.1.2. Sea level rise............................................................................................................ 189
5.1.3. Natural disasters ..................................................................................................... 192
5.2. Conservation strategies ................................................................................................. 193
5.2.1. In-situ conservation................................................................................................. 196
5.2.2. Ex-situ conservation ................................................................................................ 198
5.2.3. Conservation introductions .................................................................................... 199
5.3. Research opportunities .................................................................................................. 201
5.3.1. Karyology................................................................................................................. 202
5.3.2. Phylogenetics .......................................................................................................... 202
5.3.3. Population genetics ................................................................................................. 203
5.3.4. Palynology ............................................................................................................... 203
5.3.5. Reproduction biology and dispersal ....................................................................... 203
5.3.6. Impacts of climate change ...................................................................................... 206
5.4. Main conclusions ........................................................................................................... 206
References ................................................................................................................................ 209
Appendix 1: Varronia rupicola records ..................................................................................... 242
Voucher specimens, .............................................................................................................. 243

8
Puerto Rico and Vieques ................................................................................................... 243
British Virgin Islands - Anegada......................................................................................... 246
Cultivated material held in ex-situ collections .................................................................. 248
Appendix 2: Survey points by substrate and regional habitat class ......................................... 252
Appendix 3: Varronia rupicola observations made between 2012 and 2015 .......................... 253
Appendix 4: New samples used for phylogenetic analysis ....................................................... 255
Appendix 5: GenBank sequences used in phylogenetic analysis .............................................. 256
Appendix 6: Population genetics samples ................................................................................ 259
Appendix 7: Oligonucleotide testing ......................................................................................... 268
Appendix 8: Microsatellite loci selections ................................................................................ 270
Appendix 9: Private alleles detected for microsatellite loci ..................................................... 272
Appendix 10: Population assignment tests............................................................................... 274

9
Index of Tables
Table 1: Significant events in the formation of the Puerto Rican Bank and deposits of limestone
across geological time based on the International Commission on Stratigraphy international
chronostratigraphic chart (Cohen et al., 2013); *Start date in millions of years ago. ................ 57
Table 2: Global mean sea level rise in metres (m) for the period 2020-2100 per Representative
Concentration Pathway (RCP) with median values followed by likely range in brackets. Table
modified from IPCC (2013a). ....................................................................................................... 63
Table 3: Geological maps arranged by date and title pertaining to the native range of V.
rupicola and used in this research to digitise limestone and other geological deposits on the
islands of Anegada, Puerto Rico and Vieques. ............................................................................ 69
Table 4: The total number of survey points, absence records and presence records as well as all
observations (presence and opportunistic records) recorded per island for Varronia rupicola
between 2012 and 2015. ............................................................................................................ 73
Table 5: Significant events related to sea level rise across the Puerto Rican Bank since the Last
Glacial Maximum (LGM), ~20,000 years before present (k ybp) to the present. Note: the
Pleistocene lasted from 2.588 mya to 11,700 years ago when the Holocene started. .............. 86
Table 6: Nucleotide substitution models frequently cited in the literature. ............................ 114
Table 7: Software packages employed in this research for phylogenetic analyses showing
software version, operating system of personal computer and use for the software. ............ 117
Table 8: DNA substitution models used in this research per model type and analysis. ........... 120
Table 9: Statistical analyses of sequence data by analysis and data source. “Combined” refers
to sequences from GenBank with new sequences generated by this research; “This study”
refers to new sequences generated by this research alone. Calculations of identical sites,
pairwise identity and GC percentage were not performed for Analysis E as this would not be
informative. ............................................................................................................................... 122
Table 10: Support values for monophyletic Cordia s.s. and Varronia by analysis method with
dashes (‒) in analysis C and D denoting Cordia s.s. was not resolved as monophyletic. ......... 128
Table 11: Support values for monophyletic V. rupicola and V. bahamensis by analysis method
with asterisks (*) denoting V. rupicola and V. bahamensis are in a supported (>50% BS) clade.
Analyses A, C and D are not shown as BS/PP% values were <50% and/or V. rupicola and V.
bahamensis were not resolved as monophyletic. .................................................................... 129
Table 12: Summary of samples used for analyses showing the number of samples by origin of
material (Number of samples by origin) per collecting location (Source island) broken-down by
origin of material from extant wild plants (Extant wild), extant ex-situ plants (Extant cultivated)
or herbarium specimens of dead plants (Dried herbarium). All wild and ex-situ plant material

10
originated from silica dried leaf samples. Herbarium specimen material originated from air-
dried herbarium vouchers. ....................................................................................................... 141
Table 13: Samples of 14 Varronia species used for cross-species amplification testing of ten
microsatellite loci showing the species binomial (Species), study identification number (Sample
ID), voucher number (Voucher) and origin of source material (Origin). Source material
abbreviations: Wild = Silica dried leaf material from wild source; Cultivated = Silica dried leaf
material from ex-situ material; HS = leaf material originated from air-dried herbarium vouchers
collected from wild plants that are now dead. ......................................................................... 142
Table 14: Number of samples included in three analysis groups, A-C, by source of material
(extant wild plants, extant ex-situ plants and dead plants from herbarium specimens) where all
wild and ex-situ plant material originated from silica dried leaf samples and herbarium
specimen material originated from air-dried herbarium vouchers. ......................................... 144
Table 15: Parameters used for four separate analyses using genotypic data from eight diploid-
acting loci for analysis group A samples using Geneland and Structure software packages. .. 146
Table 16: Null hypotheses and statistical tests used to accept or reject the null hypotheses for
genetic data .............................................................................................................................. 148
Table 17: Percentage of eight diploid-acting microsatellite loci showing polymorphism at
regional, country and population levels for analysis group A samples of Varronia rupicola.
Population descriptions and designations per sample are provided in Appendix 6: Population
genetics samples. ...................................................................................................................... 156
Table 18: Missing data for nuclear microsatellites per locus; overall by ploidy group and over all
loci for analysis groups A-C with the number of samples missing data per locus and per analysis
group A-C ( A #, B #, C #) and percentage of data missing per locus and per analysis group A-C
(A %, B %, C %). ......................................................................................................................... 156
Table 19: Amplification results for four Varronia species using ten microsatellite loci selected
for V. rupicola population analyses with successful amplification of samples indicated by a plus
(+) or no amplification indicated by a minus (-). ....................................................................... 157
Table 20: Summary of microsatellite genetic parameters divided by loci groups and overall.
Abbreviations and formulae: allelic range (A-range); number of alleles (An); number of private
alleles (Ap); Weir & Cockerham’s (1984) estimations of FIT and FIS as well as Nei’s estimate of
gene diversity (HT); Hedrick's (2005) G’’ST and migrants per generation (Nm). Significant P-
values indicated by: “*” = 5% nominal level, “**” = 1% nominal level, and “***” = 0.1% nominal
level. “^” denotes that values does not include polyploid-acting loci due to software
limitations. ................................................................................................................................ 158
Table 21: Estimations of allelic richness over wild populations performed using FSTAT software
showing summary per population (Rs) and overall (Rt) allelic richness data for diploid-acting

11
loci (Locus) with Rs, the estimate of allelic richness per locus and sample, and Rt, the estimate
of allelic richness over all samples genotyped for each locus, based on the minimum sample
size of six individuals. ................................................................................................................ 159
Table 22: Hierarchical analyses showing observed (Ho), expected (He) and unbiased (uHe)
heterozygosity, within population deficit (FIS) and HWE deviation (HWEDEV) for diploid-acting
loci of extant wild samples........................................................................................................ 161
Table 23: Results for number of populations (K) analyses estimated from Geneland using the
run with the highest posterior probability and Structure using best K default calculation
(Pritchard et al., 2000) and Delta K “^” (Evanno et al., 2005) on the CLUMPAK website. “*”
denotes use of sampling locations as a prior; “~” denotes calculation not possible due to
software limitations. ................................................................................................................. 164
Table 24: Pairwise population heterozygosity analysis (pairwise FST) results and migrants per
generation (Nm) for analysis group A samples calculated in GenAlEx software with FST values
based on Nei’s genotypic number calculations (Nei, 1973, 1977; Nei and Chesser, 1983) shown
below the diagonal and estimations of migrants per generation (Nm = [(1/FST)-1]/4) above the
diagonal. .................................................................................................................................... 166
Table 25: FST values for pairwise population analysis with FST values based on Weir and
Cockerham (1984) method below the diagonal followed by an FST P-value significance indicator
where “***” = 0.1% nominal level. Above the diagonal are P-values obtained using Arlequin
software. ................................................................................................................................... 167
Table 26: Pairwise population matrix developed for isolation by distance hypothesis testing
showing results of Slatkin (1995) linearised FST values below the diagonal and pairwise
population matrix of geographical distances (km) above the diagonal for analysis group A
samples. .................................................................................................................................... 167
Table 27: Summary of population assignment tests (Paetkau et al., 1995, 2004) for extant wild
samples showing outcome per sample reported as remaining in the 'Assigned Population’ or
reassigned to 'Other Population’. ............................................................................................. 168
Table 28: Number of linked loci per population across eight diploid-acting microsatellites with
summary and overall linkage disequilibrium (LD) data divided by source population
(Population) denoted by sequence identifier (Locus) and “^” denoting that values for two loci
were not calculated for Vieques due to these loci, VRBREYV and VRBL3FZ, being monomorphic.
.................................................................................................................................................. 169

12
Index of Figures Figure 1: The Caribbean islands and surrounding countries showing location of Puerto Rico and
the Virgin Islands. ........................................................................................................................ 24
Figure 2: Map showing the countries of Puerto Rico, the US Virgin Islands and the British Virgin
Islands with the current islands shaded yellow and the area of the Puerto Rican Bank during
the Last Glacial Maximum when sea level was ca. -120 m lower than today shaded blue. ....... 25
Figure 3: Protected areas (established and proposed) across the Puerto Rican Bank that include
deposits of limestone of similar age to that known to support extant Varronia rupicola. ........ 38
Figure 4: Varronia rupicola flowers demonstrating distylous type heterostyly of a) long-
styled/short-anthered flower morph “pin” and b) short-styled/long-anthered flower morph
“thrum”. ©M.A. Hamilton. ......................................................................................................... 43
Figure 5: General characters of Varronia species: (a) V. rupicola leaf showing crenate margin
and craspedodromous venation; (b) V. bahamensis showing condensed infructescences and a
fleshy, red mesocarp. ©M.A. Hamilton. ..................................................................................... 44
Figure 6: Embryology characters of Varronia species: (a) V. rupicola stamen showing anther
with two theca releasing pollen; (b) V. rupicola terminal style that is twice bifid with four
stigmatic heads; (c) persistent styles on V. rupicola developing fruits. ©M.A. Hamilton. ......... 46
Figure 7: Characters of Varronia pollen: (1-3) three pores on V. rupicola pollen grain; porate
aperture (a) and reticulum with spinulose muri (b) of V. lima pollen grain. ©M.A. Hamilton. . 46
Figure 8: Varronia lima seed showing (a) bony endocarp, (b) three sterile chambers (red ovals)
and (c) curved embryo (red arrow). ©M.A. Hamilton. ............................................................... 47
Figure 9: Flowers, fruits and foliage of Varronia rupicola on Anegada, British Virgin Islands.
©M.A. Hamilton.......................................................................................................................... 48
Figure 10: Development of solitary Varronia rupicola inflorescence showing (a) triangular lobed
obovoid calyx in bud, (b) white flowers in globose inflorescences with five lobed corolla and (c)
ovoid and obtuse fruit developing from green to red when mature. ©M.A. Hamilton............. 49
Figure 11: Dr Michele Sanchez examining a drought stressed and feral livestock damaged
Varronia rupicola for pests on Middle Cay, Anegada. ©M.A. Hamilton. ................................... 51
Figure 12: Varronia rupicola (highlighted with red oval) growing on exposed limestone within
the Western Salt Ponds Ramsar site, Low Cay, Anegada. ©M.A. Hamilton. .............................. 54
Figure 13: Varronia rupicola growing in dry forest habitat on a) Anegada as a large ca. 3 m
rounded shrub and b) Puerto Rico as a small, emergent tree. ©M.A. Hamilton. ...................... 55
Figure 14: Map of Varronia rupicola collection localtities derived from all available species
records prior to 2012 across the Puerto Rican Bank showing borders of proposed and existing
protected areas in the vicinity of recorded localities. The species has been recorded across

13
Anegada (inset top right), two locations on Vieques (bottom inset) and along the south-
western coast of Puerto Rico (inset top left). ............................................................................. 55
Figure 15: Regional habitat classifications for Puerto Rico and the Virgin Islands based on
Kennaway & Helmer (2007) for the country of Puerto Rico and Kennaway et al. (2008) for the
U.S. and British Virgin Islands. .................................................................................................... 59
Figure 16: 1 arc-second (30 m) digital elevation model (DEM) data for Puerto Rico and the
Virgin Islands available for the country of Puerto Rico (Taylor et al., 2008) and the Virgin Islands
(Love et al., 2015) as well as 1/12 arc-second (2.5 m) DEM for the island of Anegada (inset top
right) classified to exclude all data below 0 m and showing 32 natural breaks using 1 m, 2 m, 3
m, 6 m, 25 m and then 50 m increments up to the maximum 1330 m asl. The native range of
Varronia rupicola is highlighted on south-western Puerto Rico (inset top left), Vieques (inset
bottom middle) and Anegada (inset top right). .......................................................................... 61
Figure 17: Varronia rupicola survey locations on Anegada showing species presence (purple
plus) and absence (grey asterisk) recording locations. ............................................................... 65
Figure 18: Varronia rupicola survey locations on Vieques showing species presence (purple
plus) and absence (grey asterisk) recording locations. ............................................................... 66
Figure 19: Varronia rupicola survey locations on Puerto Rico showing species presence (purple
plus) and absence (grey asterisk) recording locations. ............................................................... 67
Figure 20: Anegada 1/12 arc-second (2.5 m) digital elevation model (DEM) showing 0.5 m
classification as well as current sea level and waterbodies. ....................................................... 72
Figure 21: Map showing unconfirmed localities (red triangle) from records made prior to 2012
as well as confirmed localities (orange circle) where historical (pre-2012) and recent (2012-
2015) records have been made and new localities (purple plus) where records were made
between 2012 and 2015. ............................................................................................................ 74
Figure 22: Map showing Pleistocene limestone (19.80 km2) and Quaternary surface deposits of
sand (7.43 km2) and alluvium (4.38 km2) on the island of Anegada. .......................................... 76
Figure 23: Map showing Pliocene limestone deposits (6.28 km2) on the island of Vieques. ..... 77
Figure 24: Map showing Miocene deposits (165.82 km2) of Juana Diaz (67.83 km2) and Ponce
(97.99 km2) limestone on the island of Puerto Rico. .................................................................. 78
Figure 25: Map showing the two intact, refined habitat types of Kennaway et al. (2008),
‘Coastal shrubland’ (2.96 km2) and ‘Mixed forest’ (17.09 km2), in 2014 that support extant
Varronia rupicola overlying Pleistocene limestone and Quaternary sand deposits on the island
of Anegada along with anthropogenic disturbance digitised from 2011-2013 imagery. Note:
‘Evergreen Coastal Shrubland’ = ‘Coastal shrubland’; ‘Deciduous, Evergreen and Mixed Forest
and Shrubland with or without Succulents’ = ‘Mixed forest’. .................................................... 79

14
Figure 26: Map showing the only habitat type of Gould et al. (2008), ‘Semi-deciduous forest’
(2.86 km2), in 2014 that supports extant Varronia rupicola overlying Pliocene limestone
deposits on the island of Vieques with anthropogenic disturbance digitised from 2014-2015
imagery. Note: ‘Mature secondary lowland dry limestone semi-deciduous forest’ = ‘Semi-
deciduous forest’. ....................................................................................................................... 80
Figure 27: Map showing the intact habitat type of Gould et al. (2008), ‘Semi-deciduous forest’
(65.06 km2), in 2014 that supports extant Varronia rupicola overlying Miocene deposits of
Juana Diaz (forest area = 31.06 km2) and Ponce (forest area = 34.00 km2) limestone on the
island of Puerto Rico with anthropogenic disturbance digitised from 2014-2015 imagery. Note:
‘Mature secondary lowland dry limestone semi-deciduous forest’ = ‘Semi-deciduous forest’. 81
Figure 28: Remaining intact preferred habitat (km2) per island and remaining intact preferred
habitat within protected areas* (km2) for Varronia rupicola per island across the PRB; Note: (*)
denotes that the areas on Anegada are proposed for protection.............................................. 82
Figure 29: Intact V. rupicola habitat area (km2) in 2000 and 2014 as well as habitat loss (%) by
substrate per island between 2000 and 2014 using the regional classifications ‘Semi-Deciduous
and Drought Deciduous Forest on Karst/limestone (includes semi-evergreen forest)’ of
Kennaway & Helmer (2007) for Puerto Rico and Vieques and ‘Deciduous, Evergreen Coastal
and Mixed Forest or Shrubland with Succulents’ of Kennaway et al. (2008) for BVI. ................ 83
Figure 30: Comparison of the findings of this research compared to the global data set of
Hansen et al. (2013) for forest loss between 2000 and 2014. Note: (*) denotes that substrates
are classed as 1) Anegada Pleistocene limestone/Quaternary sand deposits, 2) Vieques
Pliocene limestone, 3) Puerto Rico Miocene Ponce limestone and 4) Puerto Rico Miocene
Juana Diaz limestone. ................................................................................................................. 84
Figure 31: Map showing historical agriculture features on Anegada digitised from a Directorate
of Overseas Surveys (DOS) printed map (DOS, 1966) and the Anegada 1/12 arc-second
topographic DEM. ....................................................................................................................... 85
Figure 32: Altitudinal range of extant Varronia rupicola plants across the species native range
on the islands of Anegada, Vieques and Puerto Rico with elevation shown in meters above sea
level (m asl). ................................................................................................................................ 86
Figure 33: Sea level rise across the Puerto Rican Bank since the end of the Last Glacial
Maximum (LGM) showing significant and dated sea levels: -120 m ca. 20,000 years before
present (20 kYBP); -50 m ca. 10,000 years before present (10 kYBP); -25 m ca. 8,500 years
before present (8.5 kYBP); -3 m ca. 7,000 years before present (7 kYBP); and 0 m ca. 3,000
years before present (3 kYBP). .................................................................................................... 87

15
Figure 34: Map showing future sea level rise scenarios of 1 m, 2 m, 3 m, and 6 m for 2100 to
2300 AD (Bellard et al., 2014) across the Puerto Rican Bank with map insets showing impact to
the native range of V. rupicola. ................................................................................................... 88
Figure 35: Map showing future sea level rise scenarios for 2100 AD on the island of Anegada
using median values of the IPCC (2013a) Representative Concentration Pathways (RCP): 0.44 m
(RCP2.6), 0.53 m (RCP4.5), 0.55 m (RCP6.0) and 0.74 m (RCP8.5). ............................................ 89
Figure 36: Impacts of future sea level rise on extant Varronia rupicola plants growing on the
island of Anegada by scenario, up to 2300 AD. Scenarios based on IPCC (2013a) Representative
Concentration Pathways (RCP) for 2100, 0.44 m (RCP2.6), 0.53 m (RCP4.5), 0.55 m (RCP6.0)
and 0.74 m (RCP8.5), as well as 1 m, 2 m, 3 m and 6 m scenarios of Bellard et al. (2014) for
2100 to 2300 AD. ........................................................................................................................ 90
Figure 37: Map showing all recorded observations (n = 651) of Varronia rupicola between 2012
and 2015 growing on Quaternary sand deposits (157 observations) and Pleistocene limestone
deposits (494 observations) across the island of Anegada. ........................................................ 93
Figure 38: Map showing all recorded observations (n = 6) of Varronia rupicola between 2012
and 2015 growing on Pliocene limestone at a single locality, Puerto Ferro, on the island of
Vieques........................................................................................................................................ 94
Figure 39: Map showing all recorded observations (n = 165) of Varronia rupicola between 2012
and 2015 growing on Miocene deposits of Juana Diaz (110 observations) and Ponce (55
observations) limestone along the south-western coast of the island of Puerto Rico. .............. 95
Figure 40: Map showing proposed protected areas with Quaternary deposits of sand and
Pleistocene limestone covered by intact ‘Deciduous, Evergreen and Mixed Forest and
Shrubland with or without Succulents’ (aka ‘Mixed forest’) and ‘Evergreen Coastal Shrubland’
(aka ‘Coastal shrubland’) of Kennaway et al. (2008) supporting extant Varronia rupicola on
Anegada. ..................................................................................................................................... 96
Figure 41: Map showing protected areas with Pliocene limestone deposits and intact ‘Mature
secondary lowland dry limestone semi-deciduous forest’ (aka ‘Semi-deciduous forest’) of
Gould et al. (2008) supporting extant Varronia rupicola on Vieques. ........................................ 97
Figure 42: Map showing protected areas with Miocene limestone deposits and intact ‘Mature
secondary lowland dry limestone semi-deciduous forest’ (aka ‘Semi-deciduous forest’) of
Gould et al. (2008) supporting extant Varronia rupicola on Puerto Rico. .................................. 98
Figure 43: Map showing future sea level rise scenarios of 1 m, 2 m, 3 m, and 6 m for 2100 to
2300 AD (Bellard et al., 2014) on Anegada. .............................................................................. 102
Figure 44: Map showing future sea level rise scenarios of 1 m, 2 m, 3 m, and 6 m for 2100 to
2300 AD (Bellard et al., 2014) on southern Vieques. ................................................................ 103

16
Figure 45: Map showing future sea level rise scenarios of 1 m, 2 m, 3 m, and 6 m for 2100 to
2300 AD (Bellard et al., 2014) on south-western Puerto Rico. ................................................. 103
Figure 46: Three often confused Caribbean species of Varronia: (a) V. rupicola, (b) V. lima and
(c) V. bahamensis. ©M.A. Hamilton. ........................................................................................ 108
Figure 47: 18-26S repeat unit of nuclear ribosomal DNA (minus the intergenic spacer and much
of the 26S subunit). Adapted from Baldwin (1992) showing the ITS region with approximate
positions of primers (White et al., 1990) used to amplify single-stranded DNA for sequencing
indicated by arrows................................................................................................................... 110
Figure 48: Directions and positions of universal primers for amplification of pDNA non-coding
trnL and trnL-trnF regions. Figure adapted from Taberlet et al. (1991) with 3’ ends of primers
indicated by arrow tips. ............................................................................................................ 111
Figure 49: Nucleotide alignment generated in Geneious following initial Bayesian analysis
showing minimal variation in bases across the trnL region. ..................................................... 119
Figure 50: Bayesian analysis A consensus tree showing the Varronia clade with branch
numbers as posterior probability (PP) percentages and PP values <50% not shown. Cordia s.s.
has been compressed to show detail of the Varronia clade with H. angiospermum as outgroup.
Numbers/letters following specific epithets are either sample numbers for this research or
GenBank numbers and correspond to Appendix 4 or 5, respectively. ..................................... 123
Figure 51: Maximum parsimony analysis B consensus tree showing the Varronia clade with
branch numbers as bootstrap percentages and BS values <50% not shown. Cordia s.s. has been
compressed to show detail of the Varronia clade with H. angiospermum as outgroup.
Numbers/letters following specific epithets are either sample numbers for this research or
GenBank numbers and correspond to Appendix 4 or 5, respectively. ..................................... 124
Figure 52: Bayesian analysis C consensus tree showing all clades with H. angiospermum as
outgroup with branch numbers as posterior probability (PP) percentages and PP values <50%
not shown. Numbers/letters following specific epithets are either sample numbers for this
research or GenBank numbers and correspond to Appendix 4 or 5, respectively. .................. 125
Figure 53: Bayesian analysis D consensus tree showing all clades with H. angiospermum as
outgroup with branch numbers as posterior probability (PP) percentages and PP values <50%
not shown. Numbers/letters following specific epithets are either sample numbers for this
research or GenBank numbers and correspond to Appendix 4 or 5, respectively. .................. 126
Figure 54: Maximum parsimony analysis E consensus tree showing the Varronia clade with
branch numbers as bootstrap percentages and BS values <50% not shown. Cordia s.s. has been
compressed to show detail of the Varronia clade with a GenBank selected outgroup, H.
angiospermum. Numbers/letters following specific epithets are either sample numbers for this
research or GenBank numbers and correspond to Appendix 4 or 5, respectively. .................. 127

17
Figure 55: Maximum parsimony consensus tree for analysis E showing 25 sequences generated
by this research with a GenBank selected outgroup, H. angiospermum, branch numbers as
bootstrap percentages and BS values <50% not shown. Numbers/letters following specific
epithets are either sample numbers for this research or GenBank numbers and correspond to
Appendix 4 or 5, respectively.................................................................................................... 131
Figure 56: Maximum likelihood analysis E consensus tree showing the Varronia clade with
branch numbers as bootstrap percentages and BS values <50% not shown. Cordia s.s. has been
compressed to show detail of the Varronia sequences generated by this research with a
GenBank selected outgroup, H. angiospermum. Numbers/letters following specific epithets are
either sample numbers for this research or GenBank numbers and correspond to Appendix 4
or 5, respectively. ...................................................................................................................... 133
Figure 57: Map showing Varronia rupicola DNA sample collecting locations (purple square) for
samples made across the species native range in the Puerto Rican Bank including within
proposed and existing protected areas in Anegada (inset top right), Vieques (inset bottom) and
south-western Puerto Rico (inset top left). .............................................................................. 140
Figure 58: Varronia rupicola chromosomes (inside red circle) at mitotic metaphase showing
clumping and a possible 2n = 72 giving an octoploid if x = 9 as described by Heubl et al. (1990).
©M.A. Hamilton........................................................................................................................ 151
Figure 59: (a) Histogram of relative fluorescence intensities of G1 nuclei (corresponding to 2C
gDNA content) of V. rupicola (RN1) and Allium sativum (RN2); (b) Histogram of relative
fluorescence intensities of G1 nuclei (corresponding to 2C gDNA content) of V. bahamensis
(RN1) and V. rupicola (RN2). ©M.A. Hamilton. ........................................................................ 152
Figure 60: Testing results of 44 oligonucleotide primers for population level analyses of
Varronia rupicola samples. ....................................................................................................... 153
Figure 61: Map showing sampling of Varronia rupicola on Anegada for wild DNA samples
collected and used during this research (purple squares), historical herbarium vouchers
(orange pentagons) and wild DNA samples excluded from this study (red triangles). ............ 154
Figure 62: Map showing sampling of Varronia rupicola on Vieques for wild DNA samples
collected during this research (purple squares) and historical herbarium vouchers (orange
pentagons). ............................................................................................................................... 155
Figure 63: Map showing sampling of Varronia rupicola on Puerto Rico for wild DNA samples
collected during this research (purple squares) and historical herbarium vouchers (orange
pentagons). ............................................................................................................................... 155
Figure 64: Summary graph of allelic patterns in wild populations (ordered west to east)
showing the number of different alleles (Na) and number of private alleles (Pa) using analysis
group A data and eight diploid-acting loci. ............................................................................... 160

18
Figure 65: Analysis of molecular variance (AMOVA) regional variation (%) for analysis group A
samples within populations, among populations within countries as well as among countries
with analysis results as a weighted average over all loci using sum of squared size difference
(RST) distance method (Slatkin, 1995). ...................................................................................... 161
Figure 66: Principal coordinates analysis results of wild populations for ten polymorphic
microsatellite loci with axis scales based on Eigen values using Jaccard similarity measure.
Outlines are convex hulls: Pink = Vieques island samples with pink squares per sample; Red =
Anegada East population samples with red pluses per sample; Dark green = Anegada West
samples with green crosses per sample; Blue = Ponce population samples with blue squares
per sample; Light green = Guánica population samples with green diamonds per sample. .... 163
Figure 67: Populations and their spatial distribution estimated from wild samples using
Bayesian methods in Geneland software without admixture, with the spatial model and
uncorrelated allele frequencies. Maps of posterior probability to belong to each of the five
populations (clusters) are shown in plates A – E with the highest probabilities indicated by
lighter colours. Sampled individuals included in the analysis are represented by black dots.
Populations were inferred through MCMC and the number of populations along the chain is
depicted in plate F. ................................................................................................................... 165
Figure 68: Populations of Varronia rupicola across the Puerto Rican Bank with coloured
polygons to demarcate populations identified: Anegada west = Dark green polygon; Anegada
east = Red polygon; Guánica (Guánica and Yauco) = Light green polygon; Ponce (Peñuelas and
Ponce) = Blue polygon; Vieques = Pink polygon. ...................................................................... 166
Figure 69: Isolation by distance test results derived from Mantel test calculations using
pairwise population matrices of Slatkin linearized FST and geographical distances (km)
performed in GenAlEx software. R2 indicates variance explained by the model; in this case,
2.8% of the genetic distance between pairs of populations can be attributed to the
geographical distance between these populations for nuclear microsatellites. ...................... 168
Figure 70: Pairwise population assignment graph for Anegada West vs. Ponce using the
frequency method of Paetkau et al. (Paetkau et al., 1995, 2004) showing two samples, 378 and
444, originally assigned to Anegada West reassigned to Ponce; however, these are closely
grouped with the other Anegada West samples as depicted by the dashed line. ................... 174
Figure 71: Map of Varronia rupicola populations on Anegada with observation records (purple
circles) and coloured polygons to demarcate populations: Anegada west = Dark green polygon;
Anegada east = Red polygon. .................................................................................................... 179
Figure 72: Map of Varronia rupicola population on Vieques with observation records (purple
circles) and coloured polygons to demarcate populations: Vieques = Pink polygon. .............. 179

19
Figure 73: Map of Varronia rupicola populations on Puerto Rico with observation records
(purple circles) and coloured polygons to demarcate populations: Guánica (Guánica and Yauco)
= Light green polygon; Ponce (Peñuelas and Ponce) = Blue polygon. ...................................... 180
Figure 74: Map showing historical agriculture features as well as populations detected and
observations of extant Varronia rupicola recorded between 2012 and 2015 on Anegada. .... 184
Figure 75: Map showing proposed protected areas, Quaternary deposits (sand and alluvium)
and Pleistocene limestone deposits on Anegada with extant Varronia rupicola recorded
between 2012 and 2015. .......................................................................................................... 186
Figure 76: Map showing protected areas and Pliocene limestone deposits on Vieques with the
location of the six extant Varronia rupicola recorded on the Puerto Ferro peninsula between
2012 and 2015. ......................................................................................................................... 187
Figure 77: Map showing extant Varronia rupicola recorded between 2012 and 2015 as well as
protected areas and Miocene limestone deposits on Puerto Rico within the species native
range. ........................................................................................................................................ 188
Figure 78: Map showing the impact of future sea level rise scenarios for 2100 to 2300 AD
(Bellard et al., 2014) on extant Varronia rupicola on the island of Anegada ........................... 190
Figure 79: Map showing the impact of future sea level rise scenarios for 2100 to 2300 AD
(Bellard et al., 2014) on extant Varronia rupicola along the southern coast of Vieques Island.
.................................................................................................................................................. 191
Figure 80: Map showing the impact of future sea level rise scenarios for 2100 to 2300 AD
(Bellard et al., 2014) on extant Varronia rupicola along the southern coast of Puerto Rico
Island. ........................................................................................................................................ 191
Figure 81: Examples of reproduction biology and dispersal research: (a-b) V. rupicola controlled
pollination of ex-situ collections; (c) captive rock iguana, Cyclura pinguis, controlled feeding
study using V. rupicola fruits; (d) camera trapping to record V. rupicola pollinators and seed
dispersers. ©M.A. Hamilton. .................................................................................................... 205
Please note: all figures in this text are licensed under a Creative Commons Attribution-NonCommercial-NoDerivatives 4.0 International License.

20
Acknowledgements
Thesis Committee Dr Martin Ingrouille - Principal supervisor
Dr Jane Nicklin - Second supervisor
Dr Adrian Shepherd - Thesis committee
chair
Dr Mike Fay - Kew supervisor
British Virgin Islands
Department of Agriculture
Isha Hodge*
National Parks Trust of the Virgin
Islands
Nancy Pascoe
Joseph Smith Abbott*
Lynda Varlack
Natasha Harrigan
Marcus Maturine*
Keith Grant
Ronnie Thomas
Cuba Julio A. Genaro
Puerto Rico Alcides L. Morales
Department of Natural and
Environmental Resources
Jose Sustache
Miguel Canals*
Dr Miguel A. Garcia
Eileen Ortiz
International Institute for Tropical
Forestry
Christian Torres*
Dr William Gould
Dr Ariel Lugo
University of Puerto Rico
Jeanine Velez
Dr James Ackerman
Dr Franklin Axelrod
Dr Duane Kolterman*
US Fish and Wildlife Service
Omar Monsegur
Mike Barandiaran
Erick Bermudez
Jose Martinez
Oscar Diaz
Marelisa Rivera
UK
Fera Science
Dr Chris Malumphy
* No longer affiliated by the institution listed

21
Royal Botanic Gardens, Kew
UKOTs team
Dr Michele Sanchez
Marcella Corcoran
Sara Barrios
Dr Colin Clubbe
UKOTs Volunteers Programme
Rosemary Foley
Bob McMeekin
Piotr Kaminski
UKOTs Internship Programme
Jean Linsky*
Jodrell Laboratory
Robyn Cowan
Corinne Arnold*
James Walker*
Lindsay Pike*
Dr Ralf Kynast*
Dr Oriane Hidalgo
Dr Hannah Banks
Dr Dion Devey
Dr Ilia Leitch
Dr Jim Clarkson
Dr Tim Fulcher
Dr Felix Forest
Prof Mark Chase
Herbarium
Lauren Phelan
Dr David Goyder
Horticulture
Sara Redstone
John Sitch
Simon Honey
Library, Art & Archives
Craig Brough
Anne Marshall
Millennium Seed Bank
Dr Wolfgang Stuppy
Gemma Toothill*
Thomas Heller
Janet Terry
Dr Tiziana Ulian
USA
Fort Worth Zoo
Kelly Bradley
Fairchild Tropical Botanical Garden
Beth Milne
Marilyn Griffiths
Mary Collins
Dr Brett Jestrow
Christie Jones Leiva

22
Herbaria Thanks to the many staff and volunteers that have made access to herbarium specimens
possible through loans and digitisation, especially curators at FTG, K, MAPR, MO, NY, SIU, SJ,
UPPRP, and US.
Previous workers Many previous workers have provided indispensable reference materials in the form of
physical collections and/or published accounts. Among those that I am most grateful are Dr
Pedro Acevedo-Rodríguez, Dr James Miller and Dr Marc Gottschling as well as the late Dr Ivan
Johnston, Dr George Proctor, William D’Arcy, Paul E.E. Sintenis, Ignatz Urban, Dr Nathaniel L.
Britton and Walter Charles Fishlock. I must especially thank Dr Colin Clubbe for his dedication
to the establishment of the Kew UKOTs Programme and his groundwork in the British Virgin
Islands that led to this research as well as his support, guidance and encouragement
throughout.
Funding organisations Funding to support fieldwork costs were provided by the Bentham-Moxon Trust and the
Mohamed bin Zayed Species Conservation Fund2. Tuition fees were covered by the Emily
Holmes Scholarship (years one and two) and the Office of the Science Directorate at the Royal
Botanic Gardens, Kew (years three and four). This research was only possible with the financial
support of those listed above.
Fieldwork companions Special thanks must be extended to many friends and colleagues that have spent countless
hours in the field with me searching for Varronia rupicola, often in very difficult conditions.
Staff mentioned above from the US Fish and Wildlife Service, Department of Natural and
Environmental Resources, National Parks Trust of the Virgin Islands, University of Puerto Rico
and the International Institute for Tropical Forestry as well as several colleagues from Kew
have provided an enormous amount of assistance during fieldwork. I must make a particular
point to thank Omar Monsegur, Jose Sustache and Dr Michele Sanchez. These three individuals
contributed the most of all and I am deeply indebted to each of them!
2 This work was undertaken with the support of The Mohamed bin Zayed Species Conservation Fund, project no.1225527.

23
“If we range through the whole territory of nature, and endeavour to extract from each
department the rich stores of knowledge and pleasure they respectively contain, we shall not
find a more refined or purer source of amusement, or a more interesting and unfailing subject
for recreation, than that which the observation and examination of the structure, affinities, and
habits of plants and vegetables, afford.” Sir Joseph Paxton (1838).
This work is dedicated to my wife, Michele. Your love gives me purpose and your support
gives me strength. Thank you for always being there to provide assistance and
encouragement.

24
Chapter 1. Introduction Varronia rupicola (Urb.) Britton is a woody shrub in the family Boraginaceae Jussieu endemic
to Puerto Rico and the Virgin Islands (Acevedo-Rodríguez and Strong, 2012) in the Caribbean
(Figure 1). The species is threatened with extinction and was assigned the category of
‘Critically Endangered’ on the IUCN Red List of Threatened Species (Clubbe et al., 2003). Due
to limited distribution and on-going threats to its habitat in Puerto Rico, V. rupicola has been
listed as ‘Threatened’ by the US Fish and Wildlife Service (2014b). There are no known uses of
the species by humans (Wenger et al., 2010) and little is known about the species in the wild.
The few investigations undertaken for V. rupicola prior to this research have only focused on
part of the species distribution and most have relied solely on previously published findings,
few herbarium vouchers and relatively limited survey data as is evidenced by the lack of
detailed information available (Woodbury et al., 1975; Proctor, 1991; Clubbe et al., 2003;
Pollard and Clubbe, 2003; U.S. Fish and Wildlife Service, 2010).
Figure 1: The Caribbean islands and surrounding countries showing location of Puerto Rico and the Virgin Islands.

25
1.1 The Puerto Rican Bank The Puerto Rican Bank (PRB) (Figure 2) comprises the chain of islands that stretches from
Puerto Rico in the west to Anegada in the east encompassing the countries of Puerto Rico
(excluding Monito, Mona and Desecheo), the US Virgin Islands (excluding St Croix) and the
British Virgin Islands (Acevedo-Rodríguez, 1996; McGowan et al., 2006b; Gore, 2013).
Figure 2: Map showing the countries of Puerto Rico, the US Virgin Islands and the British Virgin Islands with the
current islands shaded yellow and the area of the Puerto Rican Bank during the Last Glacial Maximum when sea
level was ca. -120 m lower than today shaded blue.
The PRB forms part of the Greater Antilles (Howard, 1970) along with the Cayman Islands,
Jamaica, Cuba, Haiti and the Dominican Republic (see Figure 1); the last two countries located
on the island of Hispaniola (Acevedo-Rodríguez and Strong, 2012). Except for the island of St
Croix which has always been separated, the Puerto Rico and Virgin Islands archipelago is a
tectonic microplate with an insular shelf that is 50 km broad (north to south) and 300 km wide
(east to west) (Renken et al., 2002) along the seismically active boundary between the
Caribbean and North American plates (Mann, 2005). The islands making up the microplate
were a single land mass (except Desecheo, Monito and Mona) at several times in the past with
the most recent period during the Last Glacial Maximum (Lambeck et al., 2002a) when sea
levels reached a maximum of 120 m below the levels of today (Siddall et al., 2003). Sea level
rise is further discussed in 2.1.3. Sea level rise.

26
In 1493, Christopher Columbus discovered Puerto Rico and the Virgin Islands during his second
voyage to the New World. Puerto Rico and its neighbouring islands were settled by the Spanish
soon after their discovery by Europeans (Britton, 1918; Meyerhoff, 1926; Miller and Lugo,
2009). In 1508, Ponce de Leon was named governor of Puerto Rico, then called San Juan
Bautista, and began exploiting the island of its natural resources. The islands remained under
Spanish control until the Spanish-American War in 1898 which lasted only a few months and
resulted in the transfer of the islands to the United States (Miller and Lugo, 2009). The Virgin
Islands were not successfully colonised by Europeans until, in 1666, the British took control of
the eastern islands which included Tortola, Virgin Gorda and Anegada. St. Thomas and St. John
were settled in 1672 by the Danes. St. Croix changed hands many times between 1643 and
1733 when the French sold the island to Denmark. The United States, in 1917, purchased what
would become known as the US Virgin Islands from Denmark (Britton, 1918; Meyerhoff, 1926).
The complex political boundaries and the distribution of V. rupicola across international and
state borders complicate the species conservation.
1.1.1. Physical environment
The land area of the Commonwealth of Puerto Rico, including Vieques, Mona, Culebra and
several other smaller islands, is ca. (circa) 8,900 km2, with ca. 8740 km2 on the main island and
ca. 125 km2 on Vieques. Puerto Rico’s highest point, Cerro de Punta, in the Cordillera Central
on the main island, reaches 1,388 m asl (Daly et al., 2003) and is the highest point in the
Puerto Rican Bank. The highest point on Vieques is Monte Pirata at ca. 300 m (Renken et al.,
2002). The mountain ranges on Puerto Rico create precipitation gradients on the island from
the northeast where predominantly moist habitats are found to the south-west where
predominantly dry habitats prevail in the rain shadow of the Cordillera Central (Keel, 2005).
The Virgin Islands group with an area of ca. 505 km2, including the US Virgin Islands with ca.
352 km2 and the British Virgin Islands with ca. 153 km2, is made up of ca. 100 rocks, keys and
islands with a nearly even split between the two political entities (Meyerhoff, 1926; Acevedo-
Rodríguez and Strong, 2008). The highest point in the group is found on Tortola where Sage
Mountain reaches ca. 500 m (Kennaway et al., 2008) and several other islands have ca. 300 m
elevations at their highest points (D’Arcy, 1971). Meaning “drowned”, Anegada was so named
by the Spanish due to the low topography and many wetlands on the island. Anegada is 38 km2
and the most northerly and easterly of the Virgin Islands group (Gore, 2013). With a maximum
height of ca. 8 m asl (BVI Department of Town and Country Planning, 1993; Gore, 2013), it has
the lowest elevation and least topography of any island in the archipelago (Howard, 1970). It is
unique in the Virgin Islands as it is the only island completely composed of limestone (Howard,
1970).

27
Soils vary greatly across the archipelago and within individual islands with Puerto Rico having
nine out of the eleven possible soil orders present (Miller and Lugo, 2009). This variation is due
to its complex climate, topography and geology. The last two of these are further discussed in
Chapter 2: Biogeography of Varronia rupicola. The first is covered below.
1.1.2. Climate
The Puerto Rican Bank has a predominantly maritime, tropical climate (Daly et al., 2003). There
is little variation in temperature throughout the year with most locations experiencing
somewhere between 25 °C and 35 °C daily with high humidity. The dry forest habitats
experience the highest temperatures and the mountains the coolest across the archipelago
(Miller and Lugo, 2009). Daly et al. (2003) calculated mean annual temperatures for Puerto
Rico, Culebra and Vieques to be 29.7 °C maximum and 19.4 °C minimum. The islands receive
rainfall throughout the year with November to April being the drier period and January to
February the driest months. Rain produced in this period is the result of cold fronts coming
from eastern North America (Daly et al., 2003; Miller and Lugo, 2009). The wettest months are
on average September and October (Meyerhoff, 1926) during disturbances in the trade winds
that occur from May to November (Daly et al., 2003). During this period and mainly between
the months of June and October, the islands are subjected to hurricanes (Miller and Lugo,
2009).
The rain shadow created by mountain ranges on Puerto Rico cause the south-west of the
island to be considerably drier (Keel, 2005). These dry forest areas include the Guánica State
Forest where V. rupicola is known to occur and that receives less than 1000 mm rainfall
annually (Murphy and Lugo, 1986; Monsegur, 2009). At the eastern end of the archipelago,
Anegada receives between 889 mm and 1016 mm rainfall annually (BVI Department of Town
and Country Planning, 1993).
According to the International Panel on Climate Change (IPCC, 2012), a 2 °C to 5 °C rise in the
daily maximum of global temperature by the end of 2100 will likely result in more intense
droughts, higher frequency of heavy precipitation and higher wind speeds in tropical cyclones.
Elsner and Jagger (2010) found that hurricanes are already increasing in intensity, especially in
the Caribbean Sea and Gulf of Mexico which has the highest ocean heat capacity. The upward
trend in intensity is related to an increase in sea-surface temperature. Hurricanes Gabrielle
and Hugo in 1989 caused major changes to the coastline of Anegada. On its north shore, 15
horizontal meters of beach was lost at Loblolly Bay and 30 meters was gained at Cow Wreck
Bay. Sites on the south shore at the Anegada Reef Hotel and Nutmeg Point lost over 15 m and
32 m of beach, respectively (UNESCO, 1989). Gore (2013) reported that in the period between

28
1861 and 2009 the beaches on the far western side of Anegada within the eroded 285 m while
those in the South accrued up to 135 m, suggesting a counter clockwise beach movement
adjusted to changes in prevailing conditions. Beaches along the north-western coast within the
showed no more than 30 m of erosion or accretion between 1953 and 2002 due to the
stabilising effect of exposed rock along the shoreline.
1.1.3. Population and development
The most heavily developed areas with the majority of human settlements in the Caribbean
are located along the coasts (Burkett et al., 2008) in dry forest habitats that receive between
500 and 1000 mm of rainfall annually (Robbins et al., 2010). According to Lugo et al. (2001),
the limestone regions of coastal Puerto Rico are threatened by human activities such as
groundwater contamination, vegetation removal and development. These threats may be
exacerbated by an increase in human population and unchanged development practices.
Puerto Rico is divided into 78 municipalities which are sub-divided into 875 wards that make
up the political and legal divisions. Within the municipalities, zoning laws are defined and
regulated, often poorly. The majority of the land in Puerto Rico is in private ownership and,
therefore, individuals and developers often make decisions that shape the future of the land’s
use and forest cover within each ward (Yackulic et al., 2011). Martinuzzi et al. (2007) found
that between 1977 and 1994 in Puerto Rico, urban areas grew to nearly 125,000 ha, a 27%
increase. This expansion was mainly in the lower elevations near existing infrastructure with
8,000 ha of side slopes adjacent to the plains being developed. This area of lower elevation
and side slopes contains portions of suitable habitat for V. rupicola in Puerto Rico. According to
Yackulic et al. (2011), reforestation in Puerto Rico following the transition from agrarian to
service industries was mainly in western areas of Puerto Rico formerly used for coffee
production. Human modification of the forests is further discussed in Chapter 2: Biogeography
of Varronia rupicola.
Nicholls et al. (2011) suggested that a 4 °C rise in temperature is possible by 2100 and could
result in sea level rise (SLR) between 0.5 and 2.0 m. This would mean displacement of between
1.2 and 2.2 million people over the next century in the Caribbean, Pacific Ocean and Indian
Ocean. In this scenario, abandonment of areas affected by SLR may be the outcome due to the
costs and challenges associated with implementing SLR protection (Nicholls et al., 2011). This
could have profound consequences for inland areas that would require new developments to
house the displaced. Future sea level rise is further discussed in 2.1.3. Sea level rise.

29
1.1.4. Vegetation and flora
Collectively, the archipelago of islands from Anegada in the east to Mona in the west is known
as the Puerto Rican Bank floristic province and forms part of the Antillean phytogeographical
subregion of the Caribbean vegetation classification system (Lugo et al., 2006). The Caribbean
biodiversity hotspot is of global importance floristically containing 2.3% of the world’s endemic
plants (Myers et al., 2000). The complex history of the region, both environmental and
geological, and its physical location between North and South America have driven the
complex vegetation assemblages and unique flora in limited land area (Fritsch and McDowell,
2003).
The Virgin Islands are covered by dry forest, except for the highest areas that receive more
rainfall, and often have extremely dry eastern areas covered by xerophytic vegetation due to
the salt-laden winds (Ewel and Whitmore, 1973). Kennaway et al. (2008) identified 26
vegetation formations and land cover types for the Virgin Islands group of which 16 were
found on Anegada. The varied geology and topography of Puerto Rico give rise to 28 geo-
climatic zones harbouring diverse taxa and habitats (Keel, 2005). Dinerstein et al. (1995)
identified two broad ecoregions, subtropical moist and dry, for Puerto Rico which Helmer et al.
(2002) divided into ten ecoregions that contain 26 vegetation formations and land cover types.
Puerto Rico has six subtropical life zones according to the Holdridge system (Lugo et al., 1999)
with four occurring at higher elevation and two at lower elevation (Miller and Lugo, 2009).
Further discussion about mapping and observed change of vegetation across the PRB is
provided in 2.1.2. Land cover.
Serious studies of Puerto Rican flora started after the loss of 90% of the forests when only ca.
1% of the mature vegetation was still untouched (Figueroa-Colón, 1996). Several of the islands
have had published accounts in the form of checklists or complete floras. One of the earliest
was an account from Anegada made by Schomburgk (1832) in which he described the
noticeable differences between Anegada and the other Virgin Islands particularly with regard
to the flora, listing several peculiar species for which no specimens seem to exist (Britton,
1916). Of particular note is Schomburgk’s description of the vegetation being cut for transport
and sale in St Thomas, presumably for firewood and fence posts. Nathaniel Lord Britton (1916)
of the New York Botanical Garden was the next worker to undertake botanical survey of
Anegada with W. C. Fishlock, a former staff member of the Royal Botanic Gardens, Kew sent to
Tortola to run the agriculture station. Their work resulted in several new records including the
endemic species Metastelma anegadense Britton (Apocynaceae) and Acacia anegadensis
Britton (Leguminosae). Both species are still extant on Anegada but their ranges have been
extended such that the former has also been recorded on Virgin Gorda and Tortola (Goyder et

30
al., 2014) and the latter found on Fallen Jerusalem (Bárrios, 2015). Britton and many
collaborators also undertook studies for the entire Puerto Rican Bank in a series of publications
that set the stage for all modern works (Britton, 1918; Britton and Wilson, 1924, 1925a, 1925b;
Britton, 1927). D’Arcy provided accounts of the flora of Tortola (D’Arcy, 1967) and Anegada
(D’Arcy, 1971, 1975). In the former, he listed only 60 species for the Virgin Islands that are
absent from Puerto Rico. Little et al. (1976) produced the only thorough account to date for
Virgin Gorda. Acevedo-Rodríguez (1996) listed 642 native vascular plants on St. John, of which
two are endemic. Axelrod (2011) provided the most recent and thorough treatment of the
Puerto Rican flora, listing 2,337 native vascular plants species, of which 243 are endemic. The
most comprehensive work to date for the Caribbean region was undertaken by Acevedo-
Rodríguez and Strong (2012), who listed 183 families, 1,474 genera and 10,401 species of
native seed plants. Of these 182 genera (12.4%) and 7,383 species (71%) are thought to be
endemic (Acevedo-Rodríguez and Strong, 2012).
1.2. Caribbean dry forest The dry forest habitat makes up ca. 47% of the approximately 11,424,544 ha of forested lands
of the Caribbean (Robbins et al., 2010). According to Ewel and Whitmore (1973) the
subtropical dry forest zone found in the Puerto Rican Bank receives between 600 mm and
1100 mm rainfall annually with the soil moisture levels being highest from August to
December. The structure of the vegetation is generally single layered and flattened with a
maximum canopy height of 15 m (Lugo et al., 2006). Many of the woody species are naturally
coppiced and this is due, in part, to hurricane winds and their influence on canopy removal
through uprooting larger and poorly anchored stems as well as inducing sprouts, even on
undamaged stems (Van Bloem et al., 2006). The resulting forests are often dense stands of
small stems, up to 12,000 per ha, growing close together to the point of becoming entangled
(Miller and Lugo, 2009). Many of the dry forest habitats in the Puerto Rican Bank occur over
limestone and species found in these areas exhibit xerophytic adaptations such as small leaves
that are coriaceous or succulent and deciduous during the driest periods (Ewel and Whitmore,
1973).
1.2.1. Dry forest composition and protection
Due to the previously mentioned socio-economic factors, the Caribbean dry forest is a
threatened habitat (Janzen, 1988). This, in turn, means that many species in the dry forest are
also threatened. An assessment by Figueroa-Colón and Woodbury (1996) found that roughly a
third of all rare and threatened Puerto Rican and Virgin Island species are found in the dry
forests and 42% are found on calcareous substrate which is usually associated with dry
habitats at lower elevations. Among the list of rare and threatened taxa produced by Figueroa-

31
Colón and Woodbury (1996) were four species in the Boraginaceae, including V. rupicola which
only grows in the dry forests on calcareous substrate.
Lugo et al. (2001) reported that the southern limestone region of Puerto Rico supports 14,764
ha of dry forest on dry limestone. Keel (2005) showed that ca. 3,545 ha, or 24%, of the total
dry forest area in Puerto Rico falls within the protected area system. Within the southern
limestone region, Figueroa-Colón (1996) listed 13 species-rich sites and found that the Guánica
dry forest ranked third in Puerto Rico for tree species richness, with 657 species, behind
Luquillo Mountains and Maricao which had 830 species and 845 species, respectively. The last
two areas are both strictly moist forest habitats as are all the other sites listed by Figueroa-
Colón (1996) except Guánica and Sierra Bermeja, which are strictly dry forest habitats, and
Susua that has both dry and moist forest habitats. Guánica is the only dry forest site on a
calcareous substrate as the other two dry forest sites are on ultramafic substrates. The
important point to draw from these figures is that Guánica is a unique dry forest site due to
the topography, geology and historic land use. Guánica is different because the area was
mainly used for charcoal production; therefore, the substrate was not heavily disturbed and
trees were allowed to regrow after coppicing. Figueroa-Colón (1996) pointed out that all of the
sites played a major role in keeping species richness across the island by acting as refugia
during the centuries of intensive forest exploitation and habitat conversion that occurred over
most of the island.
1.2.2. Threats to the dry forest
Dry forests face a range threats from natural events through to human-induced impacts.
Miller and Lugo (2009) suggested that 60% of the savannah and scrub forests of today were
once dry forests that were impacted by humans to the extent that they altered irreversibly.
Today dry forests are impacted by development for human settlements and infrastructure
including roads, wind farms, gas and power lines and ports; tourism and recreation including
off road driving and biking; illegal dumping; human-induced fire; agriculture and mining for
sand and bedrock (Huggins et al., 2007).
Many of the rare dry forest species are only found in isolated localities and in association with
each other (U.S. Fish and Wildlife Service, 2010). Figueroa-Colón (1996) stated that just under
half of the Puerto Rican endemic plants occur in less than three localities. This extremely
restricted area of occupancy makes these species much more susceptible to extinction from
localised, threatening events and stochastic events. The impact of these events can be
magnified on the smaller Virgin Islands leading to species extirpation or even extinction.

32
1.2.2.1. Natural events
Climate change and sea level rise
According to the IPCC (2012), the global climate is likely to change over the next century
leading to more severe droughts and higher wind speeds in tropical cyclones (see 1.1.2.
Climate). Dry forests are already known to suffer a water deficit for ten months of the year
(Miller and Lugo, 2009). The species found in dry forests are adapted to these conditions;
however, more intense droughts brought on by climate change in a relatively short period may
prove to be too much for some species to cope with in already altered landscapes. Angeles et
al. (2006) modelled future climate scenarios and found that three of the four areas on Puerto
Rico that would experience greater surface temperatures occur in south-western Puerto Rico.
The IPCC (2013b) reported that the global sea level is expected to rise between 0.28 and 0.98
m by 2100; however, many feel that sea level may rise as much as 3 m by 2100 and 6 m by
2300 (Bellard et al., 2014; Gregory, 2014; Horton et al., 2014). See also 2.1.3. Sea level rise.
Hurricanes
The worst recorded hurricanes to strike Anegada were Hurricane Donna in 1960 and Hurricane
Hugo in 1989, the latter of which caused flooding in The Settlement (BVI Department of Town
and Country Planning, 1993) and extensive damage across the Virgin Islands and Puerto Rico
(Committee on Natural Disasters, 1994). Human infrastructure can impede storm surge
drainage and thus saltwater can remain on the land in depressions causing damage and
mortality to the surrounding vegetation as it evaporates or penetrates the fresh water lens.
Natural seepage into the freshwater lens following storm surges is possible and studies in the
Florida Keys have shown increased mortality of larger stem diameter trees due to increased
salinity and water stress following hurricane induced storm surge events (Sah et al., 2010).
Increased salinity of the fresh water lens, particularly on small islands, may also be caused by
sea level rise.
Van Bloem et al. (2006) studied the impacts on Guánica State Forest of the Category 3
Hurricane Georges that hit Puerto Rico in 1998. The storm dumped 151 mm of rain and had
sustained winds of ca. 180 km/hr and gusts of ca. 240 km/hr. Above-ground stem damage on
woody plants was low with only 13% showing significant damage that was biased to larger
diameter stems. Mortality was also low with less than 2% showing no regeneration after nine
months. The forests of the Caribbean are adapted to withstand the effects of hurricanes;
however, increasing hurricane intensity coupled with habitat degradation and fragmentation
may have dire consequences for nature and humans alike.

33
Earthquakes and tsunamis
The Puerto Rican Trench is an area of high seismic activity and has been the source of several
earthquakes that can also spawn tsunamis. There are ca. ten documented tsunamis to cause
significant impact to the northern Caribbean since 1498, with many of these affecting the
Greater Antilles, especially Puerto Rico and the Virgin Islands (Parsons and Geist, 2009). Recent
studies by Atwater et al. (2012) have suggested that Anegada was struck in 1755 by a
transatlantic tsunami that formed after the Lisbon earthquake. W. C. Fishlock (1912) and BVI
Department of Town and Country Planning (1993) reported an earthquake-induced tsunami in
1867. This tsunami impacted most of the Caribbean with maximum water heights of 1.5 m in
Road Town in Tortola in the BVI and 6.1 m on Vieques and eastern Puerto Rico (Parsons and
Geist, 2009). The most recent reports of tremors in the BVI were in 1992 (BVI Department of
Town and Country Planning, 1993). Probability modelling by Parsons and Geist (2009) found a
higher hazard for a >0.5 m tsunami run-up for the Virgin Islands and Puerto Rico due to the
proximity of the islands to the Caribbean and North American plates subduction zone.
1.2.2.2. Human-induced threats
Agriculture
Most of the Virgin Islands and the majority of Puerto Rico were cleared for plantations of
crops such as sugarcane (Saccharum officinarum L.), coffee (Coffea arabica L.) and bananas
(Musa x paradisiaca L.) following European colonisation and the introduction of slave labour
(D’Arcy, 1967; Miller and Lugo, 2009). This had devastating impacts on the species and
habitats native to the islands, both directly through changes in land cover and indirectly
through secondary impacts like erosion. Since there were few written accounts of the original
vegetation, only speculation exists for the true extent of loss during the plantation era (Britton,
1918; Miller and Lugo, 2009). Acevedo-Rodríguez (1996) reported that 60% of St John was
used for sugarcane production and the majority of the rest of the island was used for
cultivation of secondary crops between 1765 and 1830. In the mid-19th century the sugar
industry collapsed in the Caribbean and some plantations like those on St. John were allowed
to revert to forest. Crop production today in the dry forest is not common due to the water
resources naturally available; however, some farming of crops takes place, especially where
the soils are better developed.
In areas with poorer soils, forestry and livestock grazing are practised. Forestry plantations in
Guánica State Forest of non-native (e.g. Swietenia mahagoni (L.) Jacq. (Meliaceae)) and native
(e.g. Guaiacum officinale L. (Zygophyllaceae)) species were common in 20th century (Ewel and
Whitmore, 1973; Miller and Lugo, 2009). Livestock, often allowed to roam freely or even go

34
feral, can have detrimental effects on the dry forest through suppression of the native
vegetation, spread of non-native species and breakage of the soil surface which allows erosion.
Acevedo-Rodríguez (1996) reported the most immediate threat to the regeneration of native
forests on St. John to be grazing by feral cows, donkeys and goats and uprooting of plants by
pigs. D’Arcy (1971, 1975) commented on the impact of grazing animals on Anegada,
particularly around The Settlement. Recent vegetation surveys found that Anegada is
dominated by unpalatable and spiny species of plants (Clubbe et al., 2004). D’Arcy (1971,
1975) described the cutting of the vegetation for human use (e.g. charcoal and fence posts)
which was also mentioned by Schomburgk (1832). The Puerto Rican forests were also
exploited for centuries and these extractive practices still occur, although to a lesser extent
(Ewel and Whitmore, 1973; Ventosa-Febles et al., 2005). These practices have no doubt left
altered and depauperate vegetation in many areas.
Invasive species and diseases
The international exchange of goods, both living and processed, has opened many new routes
for invasive plants, insect pests and pathogens to enter the PRB. Of particular concern is the
horticultural trade in living plants produced abroad and imported with soil on the roots (Serra
et al., 2003; Clubbe et al., 2010). Once established, these invaders are difficult to control and
nearly impossible to eradicate.
Kairo et al. (2003) found 179 plant species in the Caribbean that are invasive or encroaching on
native habitats. In the Greater Antilles, invasive species from a range of life forms from trees,
e.g. Azadirachta indica A.Juss. (Meliaceae), to herbaceous perennials, e.g. Catharanthus roseus
(L.) G.Don (Apocynaceae), and vines, e.g. Antigonon leptopus Hook. & Arn. (Polygonaceae),
have been recorded in the dry forests (Serra et al., 2003). There are several exotic and invasive
plant species known to occur in the dry forest habitat on Puerto Rico such as the herbaceous
grass species Cenchrus ciliaris L. (Poaceae) and the woody species of Leguminosae:
Haematoxylum campechianum L., Leucaena leucocephala (Lam.) de Wit (Monsegur, 2009),
Parkinsonia aculeata L. and Prosopis juliflora (Sw.) DC. (Ewel and Whitmore, 1973). Monsegur
(2009) listed 761 taxa for Guánica State Forest and found 63 to be non-native. Vieques has
many heavily disturbed landscapes and invasive plants such as Leucaena leucocephala and the
tree Melicoccus bijugatus Jacq. (Sapindaceae) (Monsegur, 2009). D’Arcy (1971) provided a
short list of exotic species for Anegada which did not include Casuarina equisetifolia L.,
Scaevola taccada (Gaertn.) Roxb. or Cryptostegia madagascariensis Bojer ex Decne. that are all
now serious invasive problems on the island (McGowan et al., 2006a).

35
The dry forests are also suffering attack from insect pests with many examples of exotic pests
causing extensive damage to island ecosystems and individual species within those ecosystems
(Liebhold, 1995; Serra et al., 2003; Malumphy et al., 2012). There are already several serious
pests established in Puerto Rico attacking threatened species. For example, Leptocereus
quadricostatus (Bello) Britton & Rose, a Critically Endangered species in the Cactaceae, is
under attack in the Guánica State Forest and surrounding areas by the Harrisia cactus
mealybug, Hypogeococcus pungens, (Segarra Carmona and Ramírez-Lluch, 2007). The pest
effectively stops reproduction of plants by attacking the apical meristem which haults the
formation of flowers. Many cactus plants are affected by the pest and mortality rates are high
(Segarra-Carmona et al., 2010).
Fire
Robbins et al (2010) found that the majority of forest fires in the Caribbean occur in the dry
forest habitat which is the location of most human settlements. Fire is not a natural process in
the Puerto Rican Bank (Miller and Lugo, 2009) and is increasing in frequency (Robbins et al.,
2010); therefore, many of the species lack the necessary adaptions to survive wildfires. Local
wildfires are mainly caused by humans through escaped fires near settlements, land use
disputes, protest, and land clearance for hunting or agriculture (Robbins, 2006). Non-natural,
human-induced fires are known to occur and cause damage to habitats in Guánica State
Forest, particularly along the roads (Ventosa-Febles et al., 2005; Wolfe, 2009). The author has
also seen damage to large areas of dry forest in the proximity of known habitat for V. rupicola
adjacent to Highway 2 in Canas ward of Ponce municipality and within Guánica State Forest.
Wildfires can also assist the establishment and spread of exotic and invasive plant species
through clearance of the native vegetation and increasing soil fertility (Wolfe, 2009; Robbins et
al., 2010). Continued development in the dry forest habitat expands the interface of urban
areas with natural areas and increases the risk for wildfires. Changes in the Caribbean climate
may also exacerbate the effects of wildfires through warming and drying (Robbins et al., 2010).
1.3. Legislation and protected areas As the Puerto Rican Bank includes three political divisions, the establishment of protected
areas, legal frameworks for species and habitat protection and enforcement of laws and
protected area regulations vary considerably. The following sections are provided to give an
overview of the current situation in the Puerto Rican Bank with a specific focus on V. rupicola;
therefore, only the countries of Puerto Rico and BVI will be addressed here.

36
1.3.1. Legislation
The United States Congress (1973) passed the Endangered Species Act (ESA) to protect plants
and animals threatened with extinction and their habitat. The U.S. Fish and Wildlife Service
(USFWS) is tasked with administration of freshwater and terrestrial organisms listed under the
ESA (U.S. Fish and Wildlife Service, 2013b). A species listed for protection is ‘Endangered’ when
there is the risk of extinction across all or a significant portion of its known range. If in the
foreseeable future a species is likely to become ‘Endangered’, it is listed as ‘Threatened’ (U.S.
Fish and Wildlife Service, 2013b). Prior to formal listing, a species may be held on a candidate
list for review as was the case for V. rupicola when this research began (U.S. Fish and Wildlife
Service, 2010). During the course of this research, the species was listed under the ESA as a
‘Threatened’ species (U.S. Fish and Wildlife Service, 2014b) and critical habitat was designated
for the species in Puerto Rico (U.S. Fish and Wildlife Service, 2014a). These designations have
raised the profile of V. rupicola, both regionally and globally, and require that a species
recovery plan is developed for the species in U.S. Territory; however, plants listed under the
ESA are not explicitly protected from collection outside of Federal lands unless state laws exist
that restrict collection of listed species.
In Puerto Rico, V. rupicola is currently listed as a ‘Critical Element’ (Department of Natural and
Environmental Resources, 2007). Although this designation does not provide legal protection
outside state lands, any proposed actions that might impact the species may result in the local
government requiring measures that would avoid or limit such impacts (U.S. Fish and Wildlife
Service, 2010). The Commonwealth of Puerto Rico enacted Law 241, the New Wildlife Law of
Puerto Rico, that declares all wildlife under Puerto Rican jurisdiction the property of the
Commonwealth and enables regulation through collection and hunting permits (Department
of Natural and Environmental Resources, 1999). The Puerto Rico Forest Law, Law 133,
prohibits the collection or damage of flora within public forests, including Guánica State
Forest. This research was undertaken through the acquisition of a collecting permit (#2012-
EPE-012) valid throughout Puerto Rico which was issued by the Department of Natural and
Environmental Resources (DRNA) with reference to relevant laws and regulations.
Existing legislation in the BVI [i.e. Physical Planning Act, 2004, and National Parks Act, 2006
(Government of the Virgin Islands, 2004, 2005)] provides some level of protection for over 13%
of the country’s terrestrial environment (Gardner et al., 2008). Unfortunately, V. rupicola
occurs outside this area and no formal legal protection is currently afforded to the species or
its habitat even though laws exist that could be used to protect the species, i.e. Protection of
endangered animals, plants and articles (removal and possession), CAP. 95 (Government of the
Virgin Islands, 1981). According to Deputy Premiere, the Honourable Dr Pickering (2015), a

37
new ‘Natural Resources and Climate Change Bill’ is being drafted by the BVI Government that
will address environmental management, conservation of biodiversity and protection of
natural resources. It is unclear if the proposed legislation will include provisions for threatened
species to be formally listed under an article or schedule by name, similar to the legislation
enacted in Puerto Rico.
In both countries, the availability of adequate legal protection is overshadowed by the lack of
enforcement of existing laws and wanting implementation of regulations. This is generally a
result of limited resources, both funding and capacity, that leads to the continued threat of
extinction for V. rupicola and many other species. This can be either direct impacts, e.g. plants
killed due to road works, or indirect impacts like habitat loss and degradation. These issues will
be discussed further in Chapter 2: Biogeography of Varronia rupicola.
1.3.2. Protected areas in Puerto Rico
Federal and privately managed lands combined result in 5.2% of the land area under
protection in the Commonwealth of Puerto Rico (Helmer et al., 2002). There are two existing
protected areas, Guánica State Forest and Vieques National Wildlife Refuge (NWR), within the
known historical range of V. rupicola. The species is also now present in the Cabo Rojo NWR as
discussed below. Protected areas that include limestone deposits of similar age to that known
to support extant V. rupicola are further discussed in 2.4. Discussion and conclusions.
Cabo Rojo NWR
First established in 1974 with 238 ha of degraded land, the Cabo Rojo NWR (Figure 3) has
expanded into a 750 ha protected area managed by the USFWS focused on providing bird
habitat and undertaking restoration/reforestation (U.S. Fish and Wildlife Service, 2013a). The
refuge in the extreme south-west of Puerto Rico is outside the known historical range of V.
rupicola. As part of the general restoration efforts on the refuge and as a specific conservation
action for V. rupicola, a small planting (n = 30) of the species was undertaken in November
2012 using nursery grown plants originating from wild source seed collected in Yauco and
Guánica (Morales and Martinez, 2013).

38
Figure 3: Protected areas (established and proposed) across the Puerto Rican Bank that include deposits of
limestone of similar age to that known to support extant Varronia rupicola.
Guánica State Forest
Designated in 1917 and formally managed from 1930 by the Commonwealth of Puerto Rico,
the ca. 4,400 ha of primarily semi-deciduous tropical dry forest known as Guánica State Forest
(Murphy et al., 1995; Van Bloem et al., 2006; Monsegur, 2009) is located in south-western
Puerto Rico (see Figure 3). The forest is divided into two main tracts of land that are separated
by Guánica Bay and several urban areas. The eastern tract of the forest has the highest point
which reaches 228 m asl (Ventosa-Febles et al., 2005) and is part of three municipalities,
Guánica, Yauco and Guayanilla.
One of the premier examples of dry forest habitat in the Neotropics, the forest was recognised
as an International Biosphere Reserve by the United Nations in 1981 (Miller and Lugo, 2009).
Monsegur (2009) found three endemic species to the forest, seven federally listed species (not
including V. rupicola), 19 Puerto Rican endemics, 16 Puerto Rican Bank endemics (including V.
rupicola) and a further 47 species designated as critical elements by the Commonwealth of
Puerto Rico among 761 taxa of which 460 are confirmed to exist in the forest boundaries.
The eastern tract of the forest is almost certainly the collection location for one of the
syntypes (Sintenis, P.E.E. 3731) coming from the Guánica municipality. The other syntype

39
(Sintenis, P.E.E. 4879) is from Los Indios in nearby Guayanilla municipality. The USFWS (2010)
reported that the preference of the species for growing along trails and power line clearings
has meant difficulties in ensuring the species is not impacted by maintenance activities inside
the forest.
Vieques NWR
The Vieques NWR is divided into two main tracts on the island municipality of Vieques, east of
mainland Puerto Rico (see Figure 3). To establish the refuge, the U.S. Congress transferred ca.
7191 ha between 2001 and 2003 from the U.S. Navy to the USFWS (2007). The two tracts
which together cover over half of the island are separated by urban areas. The eastern tract
where V. rupicola has been recorded is the largest portion of the refuge with ca. 5937 ha. The
majority of the habitats in the refuge are altered due to historic land use in the form of
agriculture and military activities. The latter has left many areas with contaminants and
unexploded ordinance (UXO) that are currently being removed (U.S. Fish and Wildlife Service,
2007). The on-going clean-up process has resulted in the destruction of remnant native
vegetation and habitat degradation in some areas.
1.3.3. Protected areas in the British Virgin Islands
Unfortunately, V. rupicola does not naturally occur within the existing protected area network
of the BVI. Part of the recorded habitat for the species occurs within the Western Salt Ponds of
Anegada Ramsar site (The Ramsar Convention On Wetlands, 2013) but this designation does
not constitute a formally protected area or provide legal protection. According to Fenty (2015),
the Government of the Virgin Islands has undertaken public consultations for a series of new
protected areas (see Figure 3), two of which would encompass terrestrial environments on
Anegada (Gardner et al., 2008) and will be discussed further in Chapter 2: Biogeography of
Varronia rupicola. Outside its known historic range, the species is in cultivation on the island of
Tortola in the J.R. O’Neal Botanic Garden, one of the protected areas managed by the National
Parks Trust of the Virgin Islands (NPTVI) (Gardner et al., 2008).
1.4. Boraginaceae systematics, biogeography and morphology
1.4.1. Family divisions
The α-taxonomy of Boraginaceae has been debated for many years without a satisfactory
resolution in the scientific community (Al-Shehbaz, 1991; Estrada Sánchez, 1995; Gottschling et
al., 2005; Cole, 2015). Around 2700 species of Boraginaceae s.l. are found throughout the
temperate, subtropics and tropics of the world (Gottschling, 2003). Major centres of
distribution are found in South and Central America and in the Mediterranean region (Heubl et
al., 1990). Many life forms are found in Boraginaceae from herbaceous perennials through to

40
woody trees and shrubs. The components of Boraginaceae are unclear as phylogenetic
relationships are still being resolved. The Angiosperm Phylogeny Group (APG, 2009) placed
Boraginaceae in the lamiid clade of the asterids; however, the family is not placed to a specific
order. Although Stevens (2012) recognised Boraginales Juss. ex Bercht. & J.Presl. with eight
subordinate groups (Boraginaceae s.s.; Codonaceae; Cordiaceae; Ehretiaceae; Heliotropiaceae;
Hydrophyllaceae; Nama, etc.; and Wellstediaceae), the high level taxonomy proposed by the
Angiosperm Phylogeny Group (APG, 2009) is followed here.
Many authors have proposed often rather diverse taxonomic treatments for the family based
on a range of morphological features. Gürke (1893) undertook a comprehensive investigation
of Boraginaceae and included four subfamilies, Boraginoideae, Cordioideae Beilschmied,
Ehretioideae Arnott and Heliotropioideae Arnott. The works of Ivan M Johnston on
Boraginaceae began in 1923. His final work went to press following his death in 1960 (Correll,
1961). Most modern researchers use a combination of the works of Johnston as the basis for
their taxonomic treatment of the family. Several reviews of the taxonomic literature are
available and provide an insight into the often confusing taxonomy that has been presented
for Boraginaceae (Sahay, 1979; Al-Shehbaz, 1991; Estrada Sánchez, 1995; Gottschling, 2003).
Many modern authors have suggested using a much divided taxonomy for a broadly defined
Boraginaceae (Luebert and Wen, 2008; Miller and Porter Morgan, 2011). Gottschling et al.
(2005) suggested a classification of six subordinate families within the order Boraginales. This
classification would elevate the subfamilies, Cordiaceae Dumortier, Ehretiaceae Martius and
Heliotropiaceae of the formerly defined Boraginaceae s.l., along with the families
Hydrophyllaceae Schrader and Lennoaceae Solms-Laubach. Due to the on-going α-taxonomy
debate in Boraginaceae and unresolved relationships using molecular techniques and
morphological characters, the taxonomy for Boraginaceae composed of six subfamilies,
Boraginoideae, Cordioideae, Ehretioideae, Heliotropioideae, Hydrophylloideae Burnett and
Lennooideae Craven (APG, 2009), is followed here. Cordioideae, Ehretioideae and
Heliotropioideae constitute the primarily woody Boraginales (Gottschling, 2003). Conflicting
dates are given for the diversification of the primarily woody taxa with Gottschling et al (2004)
stating it occurred in the mid-Cretaceous, 90 mya (million years ago), and Moore and Jansen
(2006) suggesting the end of the Cretaceous, 67-63 mya. Heubl et al (1990) stated that it is
likely that the evolutionary radiation of woody Boraginaceae took rise from a diploid ancester
with a basic chromosome number of x = 8 which is still present in the group, especially in
Ehretia P.Browne and Cordia L.

41
1.4.2. Subfamily Cordioideae
An almost exclusively tropical subfamily (Al-Shehbaz, 1991), Cordioideae is dominated by
woody trees, shrubs or lianas with storied cambium in the secondary meristem, a terminal
style which is divided, drupaceous fruit with one to four seeds that lack endosperm and plicate
cotyledons. Cordiaceae, Hoplestigmataceae Gilg and Sebestenaceae Ventenat are synonyms of
Cordioideae (Stevens, 2012; USDA ARS National Genetic Resources Program, 2015). Generic
limitations in this text follow that of Miller & Gottschling (2007). Species concepts and
distributions follow that of Acevedo-Rodríguez & Strong (2012). Some authors include
Varronia P.Browne in the genus Cordia; therefore, references to Cordia rupicola and closely
related taxa recognised as Cordia s.l. section Varronia (P.Browne) G.Don by other authors
should be recognised as part of the genus Varronia and considered as interchangeable unless
otherwise noted. The subfamily, as recognised here, includes three genera, Cordia including
Patagonula L., Saccellium Humb. & Bonpl. and Auxemma Miers. (Gottschling and Miller, 2006);
Hoplestigma Pierre (APG, 2009) and Varronia.
1.4.3. The genus Varronia
Confusion over the distinction between Varronia and Cordia started at the beginning of the
Linnaean system (Taroda and Gibbs, 1986) and is due to the morphological diversity of Cordia
s.l. Browne (1756) first used the name Varronia when describing two shrubs found in Jamaica.
The generic name is in honour of the ancient Roman scholar and writer Marcus Terentius
Varro who lived from 116 to 27 BC (Britton and Wilson, 1925a). Linnaeus (1753) had already
published Cordia and included three species in the genus, with Lantana bullata L. which would
be considered congeneric by other authors. The second edition of Species Plantarum, further
confused the issue as Linnaeus (1762) published ten species that would be included in Cordia
s.l., five in Varronia and five other species in Cordia s.s. Desvaux (1808) presented a
monograph for Varronia and published ten new species. A detailed treatment of Cordia s.l. was
provided by De Candolle (1845); however, he applied the name Varronia considerably
differently than subsequent authors with the exception of Gürke (1893), according to Miller &
Gottschling (2007).
Most authors since De Candolle (1845) have treated Cordia in a broad sense and included
Varronia. A few notable exceptions must be recognised who segregated Varronia based on
pollen (Nowicke and Ridgway, 1973; Nowicke and Miller, 1990) and wood anatomy (Mez,
1890). Friesen (1933) split Varronia and published three new genera, Montjolya, Varroniopsis
and Ulmarronia (≡ Varronia), based on morphological characters. Johnston (1949) re-
established Varronia as a section of Cordia. After Johnston, the next authors to recognise
Varronia and effect taxonomic change were Borhidi et al. (1988); however, their new

42
combinations, with no consideration of synonymy, assigned to all names in the section
received criticism in subsequent publications (Miller and Gottschling, 2007). A concise
overview of the taxonomic treatments for Cordia s.l. was provided by Taroda & Gibbs (1986).
Based on genetic studies using ITS1 and the previous work of several authors (Johnston, 1949;
Taroda and Gibbs, 1986; Borhidi et al., 1988; Nowicke and Miller, 1990), Miller & Gottschling
(2007) recognised Varronia as a distinct genus from the rest of Cordia and highlighted the
distinct distribution and ecological and morphological differences. The generic limitation of
Miller & Gottschling (2007) is followed in this research with Varronia including Catonia Raf.,
Montjolya, Piloisia Raf. and Varroniopsis. Chapter 3: Phylogenetic placement of Varronia
rupicola explores the relationships of several Caribbean species of Cordia and Varronia.
There are ca. 100 species of Varronia (Gottschling et al., 2005; Miller and Wood, 2008)
occurring from Arizona, part of the Northern Mexico and South-western North America
Ecoregion of the Nearctic Ecozone, throughout the Neotropic Ecozone to Argentina in the
Southern South America Ecoregion (Udvardy, 1975; Dinerstein et al., 1995; Miller and
Gottschling, 2007). This distribution covers a range of vegetation types from dry savannah
through to tropical rain forest. Heubl et al. (1990) suggested that the radiation from wet
conditions of the rain forest to the xerophytic conditions of the savannah may have advanced
the dominance of the shrubby life form seen in the genus. They went on to postulate that
modification of flower and inflorescence structure to attract new pollinators made the
transition into new, often hostile, habitats possible.
According to Acevedo-Rodríguez and Strong (2012) there are 67 Varronia species native to the
Caribbean. Nine species are native to the Puerto Rican Bank, three of which, V. rupicola, V.
bellonis (Urb.) Britton and V. wagnerorum (R.A. Howard) Borhidi, are endemic with the last
two only being found on Puerto Rico.
Karyological data for Cordia s.l. is sparse due to the tendency of the chromosomes to stick
together (Britton, 1951; Heubl et al., 1990). Britton (1951) stated that extant Cordia s.l.,
including the x = 7 series, would have a woody ancestor with x = 8. This view was shared by
Opler et al. (1975) who went on to say that the ancestor was heterostylous and probably
adapted to pollination by Lepidoptera. Several authors have reported evidence of aneuploidy
in their studies of the genus in the broad sense that would support a series of base numbers
(Bhattacharya, 1968; Opler et al., 1975). Most notably, Heubl et al. (1990) found three main
evolutionary lines from the cytological data available for Cordia s.l., x = 7, 8 and 9, and a
derived complex, x = 15. Polyploidy has been recorded several times for Cordia s.l. (Britton,
1951; Bhattacharya, 1968; Opler et al., 1975; Heubl et al., 1990) and these authors stated that

43
with aneuploidy several polyploidisation events occurred for species exhibiting heterostyly.
Heubl et al. (1990) found all Varronia studied to be diploid or tetraploid derived from x = 9
with 2n = 18 or 2n = 36 being the somatic chromosome number. Heubl et al. (1990) suggest
that colonisation of disturbed ecosystems was not always coupled with an increase in ploidy
level, but was dependent on morphological adaptations to the envirnoment. Such changes are
seen through the development of homostyly, dioecy and flower morphology that allows
visitation by small insects (Opler et al., 1975; Bawa, 1980). Although diploid taxa are present in
the group, Heubl et al. (1990) considered Varronia a relatively young and advanced group.
Studies have shown distylous type heterostyly to be present in Cordia s.l. and across
Boraginaceae. Self-incompatibility is generally associated with distyly in the family; however,
exceptions like self-compatibility in Amsinckia Lehm. are known (Al-Shehbaz, 1991). Distyly is
associated with two flower types (Figure 4) commonly called pin, long-styled/short-anthered
morphs, and thrum, short-styled/long-anthered morphs. Pin are often homozygous recessive,
and thrum are often heterozygous, with the latter showing little or no seed set (Bawa, 1980;
Bawa and Beach, 1981, 1983; Stutzman et al., 2012); however, complex multi-allelic systems
are known. Generally, pin and thrum flowers are the same overall size, but some species of
Cordia s.l. are known to have slightly larger thrum flowers (Al-Shehbaz, 1991). Studies by
Stutzman et al.(2012) of four Varronia species from the Galapagos Islands suggest that they
are self-incompatible and thus obligate outcrossers.
Figure 4: Varronia rupicola flowers demonstrating distylous type heterostyly of a) long-styled/short-anthered
flower morph “pin” and b) short-styled/long-anthered flower morph “thrum”. ©M.A. Hamilton.
1.4.3.1. General description
Varronia species are usually multi-stemmed, woody shrubs with crenate to serrate leaf
margins, condensed inflorescences/infructescences (Gaviria, 1987; de Stapf, 2010),
craspedodromous venation (Miller and Gottschling, 2007) and a fleshy, red mesocarp with
ornithochorous dispersal (Heubl et al., 1990). The exceptions to the dominant life-form are a
few lianescent species and several suffrutescent species from Brazil with facultatively annual
above-ground structures. Two Brazilian taxa, V. longifolia (A.DC.) Borhidi and V. poliophylla

44
(Fres.) Borhidi, exhibit brochidodromous venation which is unlike any other Varronia but
universal in Cordia s.s. (Miller and Gottschling, 2007). Cordia s.s. are all trees with paniculate
or cymose inflorescences and entire leaves (Miller and Wood, 2008).
1.4.3.2. Vegetative morphology
Varronia species are typically characterised by their shrubby habit, pubescent or scabrous
leaves with alternate arrangement and white flowers in condensed inflorescences (Britton and
Wilson, 1925a). A well-developed, primary root is persistent and many species develop
efficient horizontal root systems to collect sparse moisture in arid environments (Gottschling,
2003). Most species are evergreen, but some species in dry or temperate regions are
deciduous. Leaf blades, at least the upper half, are dentate, crenate or most commonly serrate
(Miller and Gottschling, 2007) (see Figure 5 (a)). The flat, bifacial, undivided leaves usually
have a single-layer of palisade tissue and anomocytic stomata (Gottschling, 2003).
Figure 5: General characters of Varronia species: (a) V. rupicola leaf showing crenate margin and
craspedodromous venation; (b) V. bahamensis showing condensed infructescences and a fleshy, red mesocarp.
©M.A. Hamilton.
The genus Varronia usually has abundant indumentum, only rarely absent, which can consist
of branched multicellular trichomes often with the base being slightly bulbous, unicellular hairs
sometimes with cystoliths that cause the leaf surface to feel rough and uniseriate hairs (Mez,
1890; Estrada Sánchez, 1995; Gottschling, 2003). Gaviria (1987) found variation in the
composition and density of the indumentum within and among species based on ecological
conditions.
Throughout Cordioideae, calcium oxalate crystals are present in the wood as prismatic crystals
or crystal sand which is informative systematically for the subfamily as certain crystal types are
restricted to different sections of Cordia s.l. Crystal sand has been found in all Varronia species
observed and is common across Cordia s.l. The function of crystal arrangments observed is
unclear (Heubl et al., 1990).

45
1.4.3.3. Inflorescence and flower structure
Varronia inflorescences, in most species, are composed of flowers in condensed spicate or
capitate inflorescences (Miller and Wood, 2008). Many of the species with the later type of
inflorescence have calyx lobes with prolonged filiform tips (visible in Figure 5 (b)) which are
unique to Varronia within Cordia s.l. (Miller and Gottschling, 2007). Varronia bifurcata (Ruiz &
Pav.) Borhidi and relatives are the only species that differ and have small cymose
inflorescences a few centimeters wide and differ from those found in Cordia s.s. that are much
broader (Miller and Gottschling, 2007). Syndesmia in Varronia (Hagemann, 1975; Uhlarz and
Weberling, 1977; Estrada Sánchez, 1995) separate it from the rest of Cordia s.s. and result in
the apex of the inflorescence doubling back (Gottschling et al., 2005). This creates the
situation where open flowers and closed buds are interspersed. Gaviria (1987) proposed
spicate and cephaloid syndesmia could be distinguished in early ontogeny. The former can be
derived from the latter (Uhlarz and Weberling, 1977) and can be seen as apomorphic for
Varronia which is supported by molecular data (Gottschling et al., 2005).
Flowers are distylous, rarely unisexual and subdioecious, with a urceolate to campanulate,
five-lobed, rarely four-lobed, calyx (Miller and Gottschling, 2007). Synsepalous calyx has equal
lobes and is persistent, sometimes enclosing, or nearly so, the mature fruit (see Figure 5 (b)).
The corolla is white, sympetalous and tubular with reflexed or spreading limbs (see Figure 4).
The superior gynoecium is sessile and syncarpous with four ovules and a terminal style with
four stigmatic lobes. Usually the androecium is antesepalous, epipetalous and haplostemonous
with linear filaments and trichomes in a patch at the attachment point. Dorsifixed anthers can
be included or exserted and are tetrasporangiate opening via longitudinal slits (Gottschling,
2003). Stamens are usually pubescent at the point of insertion and number five (Miller and
Gottschling, 2007), rarely four. Gottschling (2003) reports immature anthers to have stalked,
glandular trichomes with a single head cell. A nectary disc is developed at the base of the ovary
(Gottschling, 2003; Milet-Pinheiro and Schlindwein, 2010).
1.4.3.4. Embryology
Little is known about Varronia embryology. Gottschling (2003) reports that the internal
architecture of the bicarpellate ovary is the result of the development of basal, apical and false
septa giving rise to four locules. Four stigmatic heads result from the twice bifid, filiform,
terminal style (Figure 6 (b)) which is persistent (Figure 6 (c)) in some species. The anthers have
fibrous thickenings in the endothecium and one to five middle layers. The microspore is
tetrahedral and microsporogenesis is thought to be simultaneous. The two theca release their
pollen simultaneously (Figure 6 (a)).

46
Figure 6: Embryology characters of Varronia species: (a) V. rupicola stamen showing anther with two theca
releasing pollen; (b) V. rupicola terminal style that is twice bifid with four stigmatic heads; (c) persistent styles on
V. rupicola developing fruits. ©M.A. Hamilton.
1.4.3.5. Palynology
Nowicke & Miller (1990) reported seven pollen types for Cordia s.l. Reticulate (network-like
pattern) and 3-porate (circular) aperture pollen found for Varronia (Figure 7) is distinct from
Cordia s.s. (Nowicke and Ridgway, 1973; Moncada and Herrera-Oliver, 1988; Miller and
Nowicke, 1989; Heubl et al., 1990; Nowicke and Miller, 1990) which all have colporate
(compound) apertures (Miller and Gottschling, 2007).
Figure 7: Characters of Varronia pollen: (1-3) three pores on V. rupicola pollen grain; porate aperture (a) and
reticulum with spinulose muri (b) of V. lima pollen grain. ©M.A. Hamilton.

47
Cordia lutea Lam. (Cordia s.s.) reportedly has porate pollen but it is considerably larger than
Varronia pollen (Gottschling, 2003) and the species has a basic number of x = 7 (Miller, 1985)
not x = 9 as in Varronia (Heubl et al., 1990). Pollen size dimorphism has been found for
distylous species of Cordia s.s. (Al-Shehbaz, 1991; McMullen, 2012) and Varronia (Milet-
Pinheiro and Schlindwein, 2010). According to Miller and Gottschling (2007), pollen grains of
Varronia are oblate-spheroidal to spheroidal with a reticulate tectum (roof-like structure) and
sparse but uniform spinulose muri (surface ornamentation).
1.4.3.6. Spermology
Varronia fruits develop inside the persistent calyx as a one-seeded (other three ovules
aborted) drupe. The bony endocarp (Figure 8) is undivided and encloses the seed and three
sterile chambers (Desvaux, 1808) with a mesocarp that is sometimes inflated (Miller and
Gottschling, 2007). Transfer cells are found in the testa (Diane et al., 2002). Embryos may be
curved to straight with plicate cotyledons, a defining feature of the Cordioideae (Heubl et al.,
1990). Endosperm is completely absent inside the seed (Miller and Gottschling, 2007).
Figure 8: Varronia lima seed showing (a) bony endocarp, (b) three sterile chambers (red ovals) and (c) curved
embryo (red arrow). ©M.A. Hamilton.
1.4.4. Varronia rupicola
Varronia rupicola (Urb.) Britton, Scientific Survey of Porto Rico and the Virgin Islands 6(1): 128.
1925. Syntypes: Sintenis, P.E.E. 3731 (1886); Sintenis, P.E.E. 4879 (1886)3
Synonyms
Cordia rupicola Urb., Symbolae Antillanae (Urban). 1: 392. 1899.
Varronia bahamensis sensu Britton & P. Wilson, Scientific Survey of Porto Rico and the Virgin
Islands 6(1): 127. 1925, non (Urb.) Millsp.
3 A full list of specimens consulted is available in Appendix 1: Varronia rupicola records

48
Distribution
This species is endemic to the Puerto Rican Bank and has been recorded in the countries of
Puerto Rico, on the islands of Puerto Rico (south-western coastal municipalities) and Vieques
(southern coastal areas), and the British Virgin Islands, on the island of Anegada (Urban, 1899;
Britton and Wilson, 1925a; Pollard and Clubbe, 2003; Clubbe et al., 2004; Hamilton, 2005; U.S.
Fish and Wildlife Service, 2010).
Description
Varronia rupicola is a medium to large shrub reaching 5 m in height with one to many
branches from the base. Stems, particularly young branches, are covered in setulose
indumentum. Chartaceous leaves are highly variable, ovate to elliptic or oblong-elliptic, 2-10
cm long by 1-5 cm wide and held on short, strigose petioles, 2-10 mm long. Leaf base is obtuse
or narrowed and apex is acute, obtuse or rounded. Leaf margin varies from denticulate or low-
crenate to sub-entire with few teeth. Adaxial surface is scabrous and rigid while the abaxial
surface is puberulous, especially the veins. Appressed, pilose hairs cover the four or five
triangular lobed, 4-5 mm long, calyx which is obovoid in bud (Figure 9, Figure 10 (a)). White
flowers in globose, solitary inflorescences (Figure 9), up to 2.5 cm across, are held on
peduncles up to 4 cm long. Corolla is 7 mm across with four or five lobes, 4-5 mm long (see
Figure 9, Figure 10 (b)). Red fruit is ovoid, obtuse and 4-5 mm long (see Figure 9, Figure 10 (c))
(Urban, 1899; Britton and Wilson, 1925a; Proctor, 1991).
Figure 9: Flowers, fruits and foliage of Varronia rupicola on Anegada, British Virgin Islands. ©M.A. Hamilton.

49
Figure 10: Development of solitary Varronia rupicola inflorescence showing (a) triangular lobed obovoid calyx in
bud, (b) white flowers in globose inflorescences with five lobed corolla and (c) ovoid and obtuse fruit developing
from green to red when mature. ©M.A. Hamilton.
According to Proctor (1991), V. rupicola can be distinguished from the other native Varronia
species in the Puerto Rican Bank by morphological characters. Cordia globosa (= Varronia
bullata L. subsp. humilis (Jacq.) Feuillet) has coarsely serrate leaves and the corolla tip is
filiform. The leaves of V. lima are bullate, its flowers have shorter peduncles and it forms 3mm
fruit which is smaller than V. rupicola. All other Varronia species lack globose, solitary,
peduncled inflorescences.
1.4.4.1. Taxonomy
Urban (1899) first described Cordia rupicola selecting the specific name epithet meaning
“growing on rocks or cliffs” based on the type location habitat from which Paul Sintenis
collected the original material in south-western Puerto Rico. Britton made the combination
Varronia rupicola as part of the revision of the flora of the Puerto Rican Bank (Britton and
Wilson, 1925a). Unfortunately, Britton considered V. rupicola endemic to Puerto Rico and
plants found on Anegada to represent V. bahamensis. D’Arcy (1971) originally followed Britton,
but based on morphological differences of specimens collected on Anegada referred to
Varronia plants as Cordia rupicola in his second publication about the island (D’Arcy, 1975). In
the latter publication, D’Arcy states that further work is needed on the taxa as there are many
similarities between plants in the Bahamas, Hispaniola and the Puerto Rican Bank referred to
as C. rupicola, C. lima and C. bahamensis. These morphological similarities must have been
obvious to Urban (1899) when he described Cordia rupicola and C. bahamensis because he
refers to C. lima in the text as well as a fourth species from Cuba, C. erythrococca Wr., that he
felt warranted note due to their similar characters.
George Proctor collected specimens of Varronia on Anegada in 1987 and also determined
them to be Cordia rupicola (Proctor, 1991). Most collectors since have recognised plants on
Anegada to represent V. rupicola; however, curation of specimens in the major herbaria of

50
Europe and North America varies considerably. Chapter 4: Conservation genetics of Varronia
rupicola explores the genetic variation and structure of Varronia rupicola.
1.4.4.2. Threats to the species
Varronia rupicola is a rare species with a limited area of occupancy (AOO) that is often found
as solitary individuals or in small numbers in isolated patches, especially in Puerto Rico. Human
activities have impacted V. rupicola for decades as was documented by Woodbury et al. (1975)
and has probably been happening since before the species was discovered by Sintenis in 1886
(Urban, 1899) given the documented levels of deforestation and land-use change across the
Puerto Rican Bank (Schomburgk, 1832; Eggers, 1879; D’Arcy, 1971, 1975; Murphy and Lugo,
1990; Lugo et al., 1996; Molina Colón and Lugo, 2006; Ramjohn et al., 2012). The greatest
current threat to the species is habitat loss through development and on-going degradation
and fragmentation of existing habitat are of major concern. Due to the limited numbers of
individuals and locations, the species is also threatened by human-induced fire, particularly on
Puerto Rico, and natural disasters, particularly hurricanes and tsunamis (Parsons and Geist,
2009; Elsner and Jagger, 2010; U.S. Fish and Wildlife Service, 2010). On the island of Anegada
the species faces threats from climate change, most specifically sea-level rise, as the highest
point on the island is ca. 8 m above sea level (asl) and 40% of the island lies below 5 m asl
(D’Arcy, 1971).
The last census of plants in Puerto Rico undertaken by the U.S. Fish and Wildlife Service (2010)
reported 226 individuals, including seedlings, saplings and mature plants with 68% of the
reproductive individuals found within protected areas. The remaining reproductive individuals
were on private lands within an area subject to development for residential housing. No signs
of natural dispersal were found for plants surveyed in Puerto Rico (U.S. Fish and Wildlife
Service, 2010).
The population size on Anegada is estimated to be between 500 and 1000 mature individuals
(Hamilton et al., 2015b), and the species was located in 69% of 104 sampling points along 27
random transects situated in and around the Western Salt Ponds of Anegada RAMSAR site
(Clubbe et al., 2004). All individuals outside the RAMSAR site face development pressures,
particularly road and housing construction, and invasive species are spreading into native
habitats on the island (Pollard and Clubbe, 2003; Clubbe et al., 2004; McGowan et al., 2006a).
Insect pests are causing extensive declines in populations of dry forest species in the Caribbean
(Serra et al., 2003; Malumphy et al., 2012). The potential introduction of insect pests that
might attack V. rupicola is a particular concern due to the limited AOO of the species as they
could infest all existing plants on any of the islands very quickly. During the course of this

51
research (Figure 11), two new pest insects were found attacking V. rupicola across Anegada
(Malumphy et al., 2015). Increased biosecurity is urgently needed to reduce the potential
spread of pests in the region.
Management practices (i.e. road, trail and powerline maintenance) within Puerto Rico’s
protected areas have also negetively impacted the species in the wild (U.S. Fish and Wildlife
Service, 2010). This is often compounded by the morphological similarities, to the untrained
eye, between V. rupicola and several other widespread dry forest species (e.g. Rubiaceae
Guettarda scabra (L.) Vent.). Close collaboration between conservationists, land managers and
maintenance practitioners is challenging but fundamentally necessary for the species long-
term survival.
Figure 11: Dr Michele Sanchez examining a drought stressed and feral livestock damaged Varronia rupicola for
pests on Middle Cay, Anegada. ©M.A. Hamilton.

52
1.5. Thesis outline In order to effectively conserve Varronia rupicola and enable informed management decisions,
investigations into the species distribution and its relationship with other taxa in the region as
well as the size and genetic variability of the extant populations are required. These topics are
the focus of the research presented in this thesis which is the synthesis of field activities
undertaken and collections made between 2012 and 2015 in the Puerto Rican Bank.
Following the recommendation of Assis (2014) for researchers to clearly define methods
employed, this research has used reciprocal illumination (Hennig, 1966), specifically
anatomical, molecular, biogeographical and ecological evidence, as well as taxa sampling
(Heath et al., 2008) through additional species and sampling locations to test hypotheses.
These are being employed as the most appropriate methods given the previous systematic
work undertaken for the study group (Miller, 1985; Miller and Nowicke, 1989; Gottschling et
al., 2001; Gottschling, 2003; Gottschling et al., 2005; Miller and Gottschling, 2007; de Stapf,
2010; Weeks et al., 2010; Stutzman et al., 2012), the species recorded distribution in the
insular Caribbean and its ecological niche.
The specific aims for each chapter are followed by an introduction to the topics discussed
before detailing the materials and methods employed by this research. Subsequently, the
results are presented before these are discussed. Finally the main conclusions for the chapter
are provided.
In Chapter Two, the biogeography of V. rupicola is explored to determine the species native
range and ecological preferences as well as the impacts of on-going habitat modification and
future sea level rise. The phylogenetic placement of V. rupicola and several other species of
Varronia and Cordia native to the Caribbean are the focus of Chapter Three using ITS and trnL-
trnF regions. Chapter Four explores the genetic variability and structure of V. rupicola
populations. This is undertaken using nuclear microsatellites to determine if there are
differences between and within the islands where the species occurs as well as determining if
genetic diversity has been lost in the wild and captured in ex-situ collections. A general
discussion of the findings presented across chapters two to four along with the conservation
implications of the results obtained and further research opportunities follow in Chapter Five.

53
Chapter 2: Biogeography of Varronia rupicola This chapter explores the biogeography of Varronia rupicola with the aim of answering several
specific questions about the native range and ecological preferences of the species and the
impacts of on-going habitat modification and future sea level rise.
• First, where is the species currently extant and does this differ from its historic native
range?
• Second, do V. rupicola plants occur on any specific substrates across the native range
of the species? If so, where are they located and how much area do they cover?
• Third, are V. rupicola plants associated with any specific land cover types overlying the
substrates supporting the species across its native range? If so, where are they located
and how much area do they cover?
• Fourth, are V. rupicola plants found within protected areas (proposed or established)?
If so, how much area of the land cover types known to support V. rupicola plants do
these protected areas contain?
• Fifth, what are the implications of past sea level rise on the native range of V. rupicola?
• Sixth, will proposed scenarios for future sea level rise have an impact on the native
range of V. rupicola?
2.1. Introduction The science of biogeography has advanced significantly in recent years through the
development of Geographical Information System (GIS) software, remote sensing and free
access to global as well as more refined regional datasets. GIS in particular has enabled large
and varied datasets to be compiled, manipulated and queried to produce a wide range of
outputs including land cover and geology maps as well as digital elevation models (DEMs).
These outputs offer the opportunity to simulate and explore change, spatially and temporally,
across a wide range of parameters (Lomolino et al., 2006).
A species range and the size of its populations are seldom static. The expansion and
contraction of a population are driven by abiotic and biotic factors. Among these are human
induced and natural pressures, mating systems, gene pools, changing climate and available
habitat. Studying biogeography of a species requires knowledge of the species interaction with
its environment coupled with human and natural disturbances that effect the organism to be
studied and comparison of historic and modern distribution data (Lomolino et al., 2006;
Lomolino, 2010).

54
Varronia rupicola grows in dry forest habitat with underlying limestone geology (Pollard and
Clubbe, 2003; U.S. Fish and Wildlife Service, 2010; Wenger et al., 2010; BCPeabody
Construction Services Inc. and Coll Rivera Environmental, 2011) in the subtropical dry forest
life zone (Ewel and Whitmore, 1973; Lugo et al., 1999; Miller and Lugo, 2009). The recorded
habitat ranges from open scrubland at the edge of the dune systems to hillside thickets and
closed canopy forest, all of which occur at lower elevations (Pollard and Clubbe, 2003; U.S. Fish
and Wildlife Service, 2010). In south-western Puerto Rico and Vieques where V. rupicola
occurs, the soil is mostly found in pockets between exposed limestone and is high in organic
matter with an alkaline pH (Murphy and Lugo, 1990; Lugo et al., 1996; Monsegur, 2009). On
Anegada’s eastern side and the limestone areas within the western Ramsar site (Figure 12),
the species grows in similar soils to those described for Puerto Rico. Varronia rupicola plants
growing on the western side of Anegada, outside of the limestone cays, are found in sandy
soils with organic matter (Clubbe et al., 2004; Hamilton et al., 2015b).
Figure 12: Varronia rupicola (highlighted with red oval) growing on exposed limestone within the Western Salt
Ponds Ramsar site, Low Cay, Anegada. ©M.A. Hamilton.
The plant species associated with V. rupicola are mostly deciduous, at least during the driest
months, less than 5m in height and generally form a single layer of vegetation (Ewel and
Whitmore, 1973; U.S. Fish and Wildlife Service, 2010) as seen in Figure 13. Varronia rupicola is
often associated with other rare, e.g. Nashia inaguensis (Verbenaceae) Millsp., and
threatened, e.g. Acacia anegadensis Britton (Leguminosae), species across its range (Clubbe et
al., 2004; U.S. Fish and Wildlife Service, 2010).

55
Figure 13: Varronia rupicola growing in dry forest habitat on a) Anegada as a large ca. 3 m rounded shrub and b)
Puerto Rico as a small, emergent tree. ©M.A. Hamilton.
On the island of Puerto Rico the species is only known to occur in the south-west on coastal
limestone (Axelrod, 2011) from the municipalities of Ponce, in the east, to Guánica, in the
west. Varronia rupicola has been recorded on Vieques at two locations, Punta Jalova and
Puerto Ferro, along the southern coast within the eastern tract of the Vieques NWR (Proctor,
1991; Breckon, 2007). The species has been recorded across most of the island of Anegada
(Britton, 1916; D’Arcy, 1975; Pollard and Clubbe, 2003; Hamilton, 2005). The locations
highlighted here are shown in Figure 14.
Figure 14: Map of Varronia rupicola collection localtities derived from all available species records prior to 2012
across the Puerto Rican Bank showing borders of proposed and existing protected areas in the vicinity of
recorded localities. The species has been recorded across Anegada (inset top right), two locations on Vieques
(bottom inset) and along the south-western coast of Puerto Rico (inset top left).

56
Little is known about the specific habitat requirements and ecological niche of V. rupicola.
There are no known studies comparing the native range of the species to published land cover
or geology maps and there are no studies exploring the possible implications of past sea level
rise or impact of scenarios for future sea level rise. As such, the following sections provide an
overview of the available information about the geology, land cover and sea level rise (past
and future) of the species native range.
2.1.1. Geology
The geology of the Puerto Rican Bank (PRB) and specifically south-western Puerto Rico is
complex due to tectonic and climatic events that led to subsidence, faulting and
submersion/emersion (Masson and Scanlon, 1991; Graham, 2003; Mann et al., 2005; Joyce,
2009). Except for Anegada which is composed exclusively of limestone, the PRB islands are, like
their closest neighbours in the Greater Antilles, composed of ca. 115-60 million year old Lower
Cretaceous to Palaeocene deposits (Graham, 2003; Acevedo-Rodríguez and Strong, 2008)
overlaid on ca. 200 million year old Jurassic oceanic basement deposits (Acevedo-Rodríguez
and Strong, 2008) that formed as an oceanic piece of the Pacific crust pushed between the
North and South American plates (Stanek et al., 2009). Many of the volcanic islands also have
limestone deposits, especially along their coasts. These deposits formed during periods of
submersion mostly caused by the glacial cycles, particularly from the Oligocene to the Pliocene
(Graham, 2003). According to Lugo et al. (2001), 7.5% of the surface of Puerto Rico is covered
by deposits of limestone. Unlike the predominantly volcanic islands of the rest of the PRB,
Anegada formed during the last interglacial period of the Pleistocene as part of a coral reef
system (Meyerhoff, 1926; Gore, 2013). Piecing together the evidence of the complex climatic
and physical history of the region is an on-going area of research that, according to Graham
(2003), may never provide a complete reconstruction that enables migration and speciation of
individual plant taxa to be fully described.
Prior to the Eocene, the PRB islands were probably continuously submerged and of little
relevance for the study of terrestrial biota (Santiago-Valentín et al., 2004). During the
Oligocene, Puerto Rico and Hispaniola separated (Graham, 2003) which undoubtedly played a
role in speciation events through isolation and loss of genetic exchange (Santiago-Valentín et
al., 2004). This epoch was the beginning of a global period of reef building that lasted through
the Miocene (Frost et al., 1983). These reef systems became deposits of limestone as they
were exposed through eustatic changes. Limestone deposits in the native range of V. rupicola
formed during different epochs across the PRB. The oldest of these relevant deposits are on
the island of Puerto Rico where the Juana Diaz limestone formed in the early Miocene prior to
the formation of the Ponce limestone later in the same epoch (Krushensky and Monroe, 1975).

57
Limestone along the south and east of Vieques formed during the Pliocene (Renken et al.,
2002) whereas exposed limestone on Anegada formed the most recently during the
Pleistocene (Howard, 1970). Following the deposition of the Anegada limestone, further
eustatic changes driven by glacial cycles (see 2.1.3. Sea level rise) led to the exposure of the
entire PRB as a single land mass during the latter part of the Pleistocene. The separation of the
current islands was due to sea level rise during the Holocene (Santiago-Valentín et al., 2004).
Significant events relating to the formation of the PRB and deposits of limestone across
geological time are shown in Table 1.
Table 1: Significant events in the formation of the Puerto Rican Bank and deposits of limestone across geological
time based on the International Commission on Stratigraphy international chronostratigraphic chart (Cohen et al.,
2013); *Start date in millions of years ago.
Era Period Epoch Start date* Event Reference
Ceno
zoic
Quaternary Holocene 0.012
Separation of the current Puerto Rican Bank islands
Santiago-Valentin and Olmstead, 2004
Pleistocene 2.588 Formation of Anegada limestone Howard, 1970
Neogene Pliocene 5.332 Formation of Vieques limestone Renken et al. 2002
Miocene 23.030 Formation of Juana Diaz and Ponce limestones
Krushensky and Monroe, 1975
Palaeogene Oligocene 33.900
Separation of Puerto Rico and Hispaniola Graham, 2003
Eocene 55.800 Emergence of modern Puerto Rican Bank islands
Santiago-Valentin and Olmstead, 2004
Palaeocene 66.000 Formation of Puerto Rican Bank islands volcanic base
Acevedo-Rodríguez and Strong, 2008
Mes
ozoi
c
Cretaceous Upper 100.500 Lower ~145.000
Jurassic
Upper ~163.500 ~ ~ Middle ~174.100 ~ ~
Lower ~201.300
Formation of Puerto Rican Bank oceanic basement deposits
Acevedo-Rodríguez and Strong, 2008
The surface geology of the island of Puerto Rico is well known due to the mapping work of the
United States Geological Survey (USGS) during the 20th century (Renken et al., 2002). Detailed
quadrangle geological maps (1:20,000 map scale) have yet to be completed for a few areas,
including the Guánica quadrangle (Addarich-Martínez, 2009); however, island wide geological
maps were produced for the USGS by Briggs and Akers (1965) and updated by Bawiec (1999).
Overlain volcanic materials in southern Puerto Rico are covered mainly by Quaternary and
Miocene deposits, with the latter dominated by the Juana Diaz formation and Ponce

58
limestone. The Juana Diaz formation is divided into an upper calcareous layer of Miocene
origin and basal Oligocene beds of cobbles, pebbles and sand. Ponce limestone rests atop the
Juana Diaz formation or Cretaceous rock along the southern coast of modern Puerto Rico
(Monroe, 1980) and atop Eocene sandstone on the small off-shore island of Isla Caja de
Muertos (Kaye, 1957; Monroe, 1980). Limestones of southern and northern Puerto Rico of
similar age are very different, mainly due to faulting and climatic conditions (Monroe, 1980).
Due to the lower rainfall levels in southern Puerto Rico, a layer of Quaternary derived caliche
created by the evaporation of water from the slight solution of the surface limestone has
developed into a thick cap that makes inspection of the bedrock difficult outside of road cuts
and quarries (Monroe, 1980).
The geology of Vieques is less well understood due a lack of detailed mapping; however, the
USGS produced a simplified 1:30,000 surface geology map for the island as part of a
geochemical study (Learned et al., 1973). Renken et al. (2002) produced the most recent
geological map of the island based on the works of Briggs and Akers (1965) and Learned et al.
(1973) which depict Pliocene limestone deposits. Meyerhoff (1927) stated that these deposits
rest directly on the Cretaceous origin volcanic base of Vieques.
The limestone geology of Anegada is the least studied in the PRB with the most notable studies
on the subject being those of Howard (1970), Atwater et al. (2012, 2014) and Spiske and Halley
(2014). As sea levels lowered following the last interglacial period, the exposed coral reefs died
forming a solid limestone slab that is today the island of Anegada (Howard, 1970). Gore (2013)
used the geology and surface deposits of Anegada to divide it nearly in half calling the eastern
portion the ‘Anegada limestone formation’ and the western portion the ‘Anegada ridge plain
formation’. Previous authors called the former the rocky or limestone plain and the latter the
sandy plain (Britton, 1916; D’Arcy, 1975). The deposits of sand and alluvium (unconsolidated
sediments) on Anegada that overlie the limestone bedrock are all thought to be of Quaternary
origin (Howard, 1970; Spiske and Halley, 2014).
The available geological maps will be used to determine if V. rupicola is associated with any
specific types of substrate across its native range.
2.1.2. Land cover
A series of studies led by the United States Forest Service (USFS) were undertaken to provide
regional maps of the relationship of land cover to surface geology and topography across
Puerto Rico and the Virgin Islands (PRVI). These studies used remote sensing-based maps
derived from cloud-free optical satellite imagery (Landsat) processed into image mosaics first
described by Helmer and Ruefenacht (2005). Mapping land cover and forest types was

59
undertaken with supervised classification of Landsat TM and/or ETM+ imagery using decision
tree analysis software (Kennaway and Helmer, 2007; Kennaway et al., 2008; Gould et al.,
2008). The classifications developed for PRVI are based on Helmer et al.’s (2002) hierarchical
system for Landsat image classification that was adapted from Areces-Mallea et al. (1999) for
the Caribbean based on the National Vegetation Classification Standard (FGDC, 1997).
Predictor variable datasets were produced to assist classification of image pixels that included
topography (derived from digital elevation models or digitised topographic maps), geology and
precipitation where available. Training data, either from field survey or existing classification
maps, were used to develop classified land cover maps. Image classification was checked for
accuracy using expert review and reference IKONOS panchromatic sharpened imagery
(Kennaway and Helmer, 2007; Kennaway et al., 2008; Gould et al., 2008).
Cloud-free optical satellite imagery mosaics were produced for Puerto Rico and Vieques using
images captured in 1991 and 2000 to study land cover change, especially due to anthropogenic
factors. Kennaway & Helmer (2007) produced land cover maps for Puerto Rico using a regional
habitat classification with 29 classes (Figure 15).
Figure 15: Regional habitat classifications for Puerto Rico and the Virgin Islands based on Kennaway & Helmer
(2007) for the country of Puerto Rico and Kennaway et al. (2008) for the U.S. and British Virgin Islands.

60
Gould et al. (2008) produced detailed habitat types for the islands of Puerto Rico and Vieques
using a refined habitat classification with 70 classes. Mapping across the Virgin Islands used
cloud-free optical satellite imagery mosaics from 2000 to produce land cover maps showing
refined habitat and regional habitat (see Figure 15) classifications for U.S. (USVI) and British
Virgin Islands (BVI) that included 29 and 20 classes, respectively (Kennaway et al., 2008).
Helmer and Ruefenacht (2005) found that between 1991 and 2000 built-up/urban areas on
Puerto Rico increased by 7.2%. The proximity to urban areas and a lack of protection for older,
species-rich forests on karst increased their likelihood of development (Kennaway and Helmer,
2007). Along the southern coast of Puerto Rico, Helmer et al. (2008) found that around the city
of Ponce many older forests on unprotected areas of limestone geology were converted to
built-up/urban areas or quarries. This is of particular concern for V. rupicola as it is known to
occur in this area (U.S. Fish and Wildlife Service, 2014b). Between 1991 and 2000, Vieques saw
a 49% increase in built-up/urban areas (Helmer and Ruefenacht, 2005). No published data are
available for the same period on Anegada.
The aforementioned land cover maps will be used in this research to explore habitat
preference for V. rupicola in relation to geology and protected areas across the PRB.
2.1.3. Sea level rise
The USGS produced bathymetric and topographic data for PRVI to assist in disaster
management planning in the past decade. These data available varies from a strictly
topographic 1/12 arc-second (2.5 m) digital elevation model (DEM) for the island of Anegada
(DDM, 2014) to bathymetric and topographic 1/3 arc-second (10 m) DEMs for the USVI (Love
et al., 2015) and Puerto Rican municipalities of Arecibo, Fajardo, Guayama, Mayaguez, Ponce
and San Juan (Taylor et al., 2008) as well as bathymetric and topographic 1 arc-second (30 m)
DEMs (Figure 16) for the country of Puerto Rico (Taylor et al., 2008) and all of the Virgin Islands
(Love et al., 2015). The Anegada 1/12 arc-second DEM is derived from a Light Detection and
Ranging (Lidar) survey via small aircraft undertaken in January 2014 (DDM, 2014). The 1/3 arc-
second DEMs derived for specific islands and municipalities as well as the 1 arc-second DEMs
for PRVI were derived from a range of sources described in detail by Taylor et al. (2008) for
Puerto Rico and Love et al. (2015) for the Virgin Islands. Access to these high quality data
afford the opportunity to explore past sea level rise and the implications for V. rupicola as well
as the possible impact of future sea level rise scenarios on the long-term survival of the species
across the PRB.

61
Figure 16: 1 arc-second (30 m) digital elevation model (DEM) data for Puerto Rico and the Virgin Islands available
for the country of Puerto Rico (Taylor et al., 2008) and the Virgin Islands (Love et al., 2015) as well as 1/12 arc-
second (2.5 m) DEM for the island of Anegada (inset top right) classified to exclude all data below 0 m and
showing 32 natural breaks using 1 m, 2 m, 3 m, 6 m, 25 m and then 50 m increments up to the maximum 1330 m
asl. The native range of Varronia rupicola is highlighted on south-western Puerto Rico (inset top left), Vieques
(inset bottom middle) and Anegada (inset top right).
Sea level changes at the local level can vary from that of the global mean due to background
geological processes, gravitational distribution of ice and water as well as dynamics of the
atmosphere and ocean (Kopp et al., 2015). Hansen et al. (2007) suggested that based on
palaeoclimatic data, the Earth’s climate can be quickly flipped due to global sensitivity to
forcing. Since integrating such variable processes across temporal and spatial scales to
reconstruct past sea level and project future changes is an active area of research, many gaps
still exist and debate is active (Gregory et al., 2014; Horton et al., 2014).
Past sea level rise
Sea level has fluctuated significantly in the past; however, precise information about the
extent varies widely, especially for more distant periods. This is mainly due to the complicated
nature of determining sea levels above and below current sea level on constantly moving and
shifting land masses (Martinson et al., 1987; Bard et al., 2002). Glacial and interglacial climate
oscillations cause the transfer of water between the oceans and ice sheets which can result in
rapid changes in sea level (Lambeck et al., 2002a). The speed of these changes is controlled by

62
complex interactions between the land, oceans, atmosphere and ice sheets that are influenced
by changes in insolation and internal feedback (Lambeck et al., 2002a).
The PRB underwent a general period of uplift during the transition period from the Eocene,
when it is thought that the modern islands first appeared, to the Oligocene. This was followed
by higher sea levels during the latter parts of the Oligocene and during the Miocene (Santiago-
Valentín et al., 2004). During the middle Pliocene, sea level was ca. 25 (±10) m higher than
today (Hansen et al., 2007). Between 160,000 and 140,000 ybp, sea levels were around 120 m
lower than current levels during the penultimate glacial maximum (Bard et al., 2002). The Last
Interglacial Period (LIG) lasted from 130,000 to 115,000 ybp (Dahl-Jensen et al., 2013) and sea
levels reached no more than 10 m higher than present levels (Church et al., 2013) with strong
evidence from corals on tectonically stable coasts that sea level was 4-6 m above current levels
(Overpeck et al., 2006).
The last glacial period, 114,000 to 19,000 ybp, saw sea levels drop overall with five periods of
higher sea levels occurring from 60,000 to 32,000 ybp (Lambeck et al., 2002a). In the lead up to
the Last Glacial Maximum (LGM), a rapid fall in sea level of around 50 m in less than 1000 years
has been suggested by Lambeck et al. (2002b) that implies rapid growth and decay of ice
sheets is possible. During the LGM that lasted from 30,000 to 19,000 ybp (Lambeck et al.,
2002a) sea levels reached at least 120 m below those of today (Fairbanks, 1989; Siddall et al.,
2003). These eustatic changes driven by glacial cycles led to the exposure of the Puerto Rican
Bank as a single land mass during the latter part of the Pleistocene.
Following the LGM and the onset of the melting of the ice sheets, sea level began to rise
globally for around 13,000 years (Masson-Delmotte et al., 2013). During the latter part of the
Pleistocene, sea level rose around 20 m by ca. 17,000 ybp (Fleming et al., 1998) and around
14,000 ybp had risen another ca. 25 m due to the deglaciation of the West Antarctic Ice Sheet
before the start of the Holocene (Clark et al., 2009). Fairbanks (1989) stated that sea level had
risen a further ca. 25 m by around 10,000 ybp; therefore, the PRB would have been a single
land mass for ca. 20,000 years. Over the next ca. 1,500 years (8,500 ybp), sea level rose ca. 25
m (Fairbanks, 1989). Fleming et al. (1998) stated that another ca. 22 m sea level rise was
experienced over the following 1,500 years (ca. 7,000 ybp). Relative sea level stability has been
experienced over the past ca. 3,000 years up to the middle of the 19th century (Williams,
2013). Since the turn of the 20th century, annual mean sea level rise rates increased from a
background of 1.7 mm starting in 1900 to 3.2 mm between 1993 and 2010 (Rhein et al., 2013).
Available sea level rise data and DEMs will be used to explore the potential impacts of past sea
level rise on V. rupicola.

63
Future sea level rise
The greenhouse gas (GHG) emissions produced since the Industrial Revolution have increased
global mean temperature which is responsible for current sea level rise through melting of the
ice sheets and thermal expansion (Williams, 2013). Hansen et al. (2007) listed the three most
important of these GHG emissions, in order of impact, as carbon dioxide (CO2), methane (CH4)
and tropospheric ozone (03). To enable long-term modelling, four Representative
Concentration Pathways (RCPs) were developed by a wide range of emission and modelling
experts to produce a comprehensive dataset using radiative forcing values in Watts per square
metre (W/m2) through 2100 (van Vuuren et al., 2011). The RCPs selected from forcing values in
the literature ranged from 2.6 to 8.5 W/m2 (Table 2) and resulted in one mitigation scenario
(RCP2.6) with a very low level of forcing, two scenarios (RCP 4.5 and RCP 6) with medium
stabilisation and one scenario (RCP8.5) with a very high level of forcing (van Vuuren et al.,
2011). The RCPs are supplemented by Extended Concentration Pathways (ECPs), or RCP
extensions (Meinshausen et al., 2011), that allow modelling through 2300 to be undertaken
using the same radiative forcing values of 2.6, 4.5, 6.0 and 8.5 W/m2 (van Vuuren et al., 2011).
Table 2: Global mean sea level rise in metres (m) for the period 2020-2100 per Representative Concentration
Pathway (RCP) with median values followed by likely range in brackets. Table modified from IPCC (2013a).
Year RCP2.6 RCP4.5 RCP6.0 RCP8.5 2020 0.08 [0.06 to 0.10] 0.08 [0.06 to 0.10] 0.08 [0.06 to 0.10] 0.08 [0.06 to 0.11] 2030 0.13 [0.09 to 0.16] 0.13 [0.09 to 0.16] 0.12 [0.09 to 0.16] 0.13 [0.10 to 0.17] 2040 0.17 [0.13 to 0.22] 0.17 [0.13 to 0.22] 0.17 [0.12 to 0.21] 0.19 [0.14 to 0.24] 2050 0.22 [0.16 to 0.28] 0.23 [0.17 to 0.29] 0.22 [0.16 to 0.28] 0.25 [0.19 to 0.32] 2060 0.26 [0.18 to 0.35] 0.28 [0.21 to 0.37] 0.27 [0.19 to 0.35] 0.33 [0.24 to 0.42] 2070 0.31 [0.21 to 0.41] 0.35 [0.25 to 0.45] 0.33 [0.24 to 0.43] 0.42 [0.31 to 0.54] 2080 0.35 [0.24 to 0.48] 0.41 [0.28 to 0.54] 0.40 [0.28 to 0.53] 0.51 [0.37 to 0.67] 2090 0.40 [0.26 to 0.54] 0.47 [0.32 to 0.62] 0.47 [0.33 to 0.63] 0.62 [0.45 to 0.81] 2100 0.44 [0.28 to 0.61] 0.53 [0.36 to 0.71] 0.55 [0.38 to 0.73] 0.74 [0.53 to 0.98] The fifth and most recent Intergovernmental Panel on Climate Change (IPCC) assessment
report (AR5) of Working Group I by Church et al. (2013) provided RCP scenarios (see Table 2)
that suggest that the 21st century rate of mean sea level rise globally will exceed the observed
1971-2010 rate. The increases in sea level rise projections of the AR5 compared to AR4 are
primarily due to model improvements (Church et al., 2013), but these are still below the
projections of many other studies (Overpeck et al., 2006; Hansen et al., 2007; Rahmstorf,
2007; Pfeffer et al., 2008; Grinsted et al., 2010; Nicholls and Cazenave, 2010; Wetzel et al.,
2012) and have been criticised as too conservative (Horton et al., 2014). However, Church et
al. (2013) stated that there is a lack of sufficient evidence to support projections of higher sea
level rise than those presented in the AR5 for the 21st century. Pfeffer et al. (2008) concluded
that it is physically untenable for sea level rise in excess of 2 m by 2100 and that climate

64
variables would need to climb to extremely high levels at an accelerated speed in order to
achieve a 2 m sea level rise by 2100 under physically possible conditions.
Beyond the 21st century, sea level rise of meters higher than present levels is possible if GHG
emissions are not lowered (Pfeffer et al., 2008; Church et al., 2013). The 2300 sea level rise
projections of AR5 range from 0.41-0.85 m for ECP2.6 to the ECP8.5 levels of 0.92-3.59 m
(Church et al., 2013; Horton et al., 2014). Therefore, without mitigation to reduce GHG
emission levels in the atmosphere, sea level rise is expected to continue and accelerate for
centuries (Williams, 2013) with regional, possibly extreme, variations (Church et al., 2013) and
surpass the 1 m ‘guardrail’ (Horton et al., 2014) that has been suggested to minimise impact
on human society and global biodiversity.
Higher sea levels will contribute to the destruction of terrestrial habitats that are not adapted
to saline conditions through seawater inundation associated with periodic high tides (e.g.
centennial tides) or caused by cyclonic activity (Courchamp et al., 2014) that is expected to
increase in severity (IPCC, 2012). Williams (2013) advised governmental bodies to prepare
adaptation plans for sea level rise between 0.5 and 2.0 m by 2100 and suggested that between
4 and 8 m is possible in the following centuries. Such rises in global sea level will have major
impacts on the coastal zones and human infrastructure. Adaptation and forced movements
will undoubtedly put pressure on inland and upland areas further exacerbating the biodiversity
conservation issues of today. As such, Courchamp et al. (2014) urged the integration of climate
change, especially future sea level rise scenarios, into management plans and research of
island biodiversity across the 180,000 islands worldwide.
Bellard et al. (2014) undertook a study using 1, 2, 3 and 6 m sea level rise scenarios for 2100 to
2300 across 4447 islands in ten insular biodiversity hotspots, including the Caribbean. The
study found that between 6% and 19% of the islands would be completely submerged with the
Caribbean being one of the three most impacted hotspots (Bellard et al., 2014). These values
along with the IPCC (2013a) RCP values for 2100 will be explored in this research to determine
the potential impact of future sea level rise on the native range of V. rupicola.
2.2. Materials and Methods The research undertaken into the biogeography of V. rupicola included field survey and
sampling across the PRB as well as desk based studies as described in the following sections.
2.2.1. Survey and sampling of wild populations
To enable planning of field survey and baseline data acquisition, all available V. rupicola
specimen and observation data were incorporated into a database using BRAHMS software
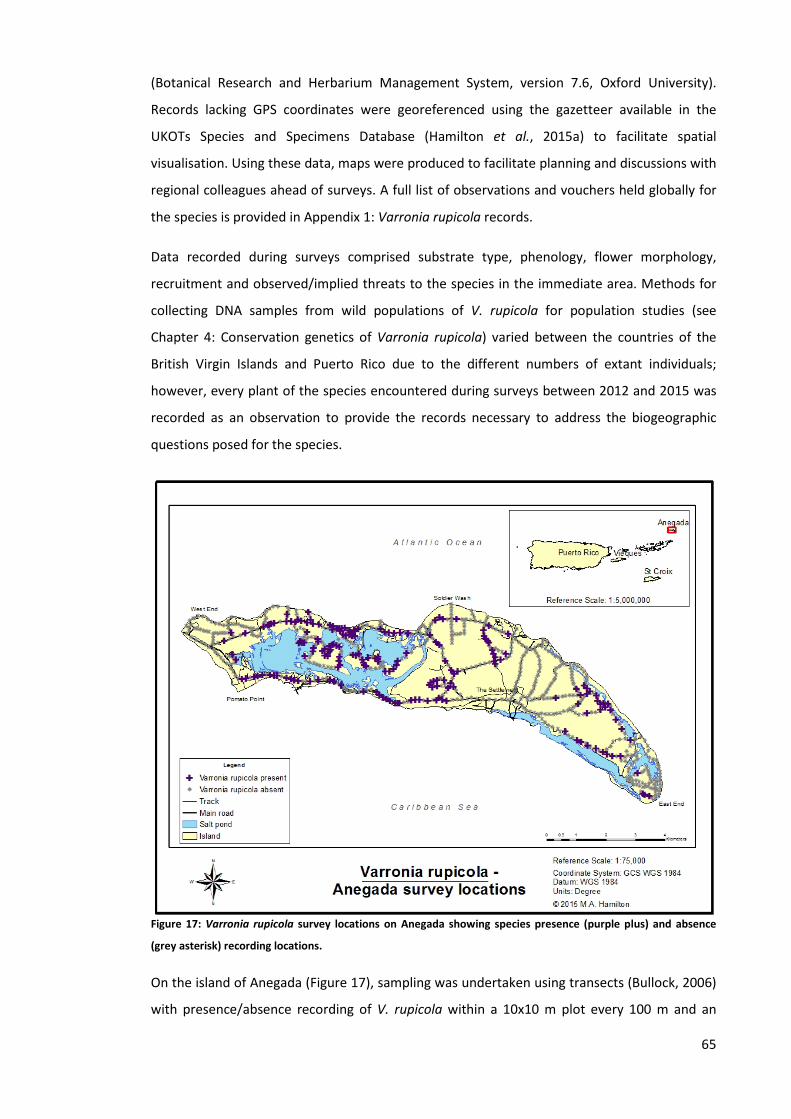
65
(Botanical Research and Herbarium Management System, version 7.6, Oxford University).
Records lacking GPS coordinates were georeferenced using the gazetteer available in the
UKOTs Species and Specimens Database (Hamilton et al., 2015a) to facilitate spatial
visualisation. Using these data, maps were produced to facilitate planning and discussions with
regional colleagues ahead of surveys. A full list of observations and vouchers held globally for
the species is provided in Appendix 1: Varronia rupicola records.
Data recorded during surveys comprised substrate type, phenology, flower morphology,
recruitment and observed/implied threats to the species in the immediate area. Methods for
collecting DNA samples from wild populations of V. rupicola for population studies (see
Chapter 4: Conservation genetics of Varronia rupicola) varied between the countries of the
British Virgin Islands and Puerto Rico due to the different numbers of extant individuals;
however, every plant of the species encountered during surveys between 2012 and 2015 was
recorded as an observation to provide the records necessary to address the biogeographic
questions posed for the species.
Figure 17: Varronia rupicola survey locations on Anegada showing species presence (purple plus) and absence
(grey asterisk) recording locations.
On the island of Anegada (Figure 17), sampling was undertaken using transects (Bullock, 2006)
with presence/absence recording of V. rupicola within a 10x10 m plot every 100 m and an

66
alternating left or right recording location across the island and its habitats. Recording was
undertaken using the existing network of roads, trails and tracks as well as transects through
intact vegetation to minimise sampling bias (Greenwood and Robinson, 2006). If V. rupicola
was present at the 100 m recording location, a DNA sample was taken. Every 500 m, leaf
morphology measurements (petiole length, blade length and blade width) were recorded from
two randomly selected leaves on old growth (i.e. brown/black, not green, stem) and a DNA
sample taken. Every kilometre a herbarium specimen was collected (if the removal of the
specimen would not be detrimental to the survival of the individual) with a DNA sample and
leaf morphology measurements. If a plant was not encountered within 500 m, the next
individual found was sampled regardless of the distance from the nearest presence/absence
sampling point.
Figure 18: Varronia rupicola survey locations on Vieques showing species presence (purple plus) and absence
(grey asterisk) recording locations.
On the islands of Vieques (Figure 18) and Puerto Rico (Figure 19), every known individual
identified through recent survey work of Puerto Rican colleagues and historic records with
precise locality information was sampled. To help ensure sampling consistency,
presence/absence recording was undertaken along transects within a 10x10 m plot every 100
m; however, every new individual encountered was sampled due to the low number of extant
individuals on Puerto Rico and Vieques. Sampling was undertaken in areas of suitable habitat

67
identified through discussions with Puerto Rican colleagues, interpretation of satellite imagery
and ground-truthing of dry forest vegetation overlying limestone on the south-west coast of
Puerto Rico and Vieques islands. Transects were also undertaken in areas and habitats not
known to support the species to help reduce sampling bias. When an individual was
encountered, adaptive sampling (Greenwood and Robinson, 2006) using 10x10 m plots was
undertaken until no new individuals were encountered. All sampling on Puerto Rico and
Vieques included collection of a DNA sample and recording leaf morphology measurements
(petiole length, blade length and blade width) from two randomly selected leaves on old
growth (i.e. brown/black, not green, stem). Herbarium voucher specimens were collected if
the location was a new locality for the species and the removal of the specimen would not be
detrimental to the survival of the individual.
Figure 19: Varronia rupicola survey locations on Puerto Rico showing species presence (purple plus) and absence
(grey asterisk) recording locations.
All survey data was captured using a handheld computer with built-in GPS (Trimble™ Juno® 3,
Trimble Navigation Limited, Sunnyvale, CA, USA) running ArcPad® software (ESRI™, version
10.0, Redlands, CA, USA). Data collection and processing standards followed Hamilton (2008).
Opportunistic species observations were recorded using a digital camera with built-in GPS
(Sony™, model A77V, Tokyo, Japan). Images were processed using LightRoom® software
(Adobe®, version 5.1, Seattle, Washington) and metadata was exported for use in BRAHMS

68
software using the plug-in LR/Transporter (developed by Timothy Armes). All field data were
captured with GPS devices set to record the default geographic coordinate system (GCS) using
World Geodetic System 1984 (WGS 1984) datum, jointly abbreviated as ‘GCS WGS 1984’.
Observation and sample data was incorporated into the BRAHMS software developed
database for further processing and subsequent export for use in other software programs. All
voucher specimens collected from wild plants are deposited in the herbarium (K) of the Royal
Botanic Gardens, Kew with various duplicate vouchers lodged at other herbaria (see Appendix
1: Varronia rupicola records) and all DNA samples are deposited in the Kew DNA Bank (Royal
Botanic Gardens, Kew, DNA Bank, http://www.kew.org/data/dnaBank/).
2.2.2. Mapping geology, land cover and sea level rise
Using ArcGIS® for Desktop software (ESRI™, version 10.1, Redlands, CA, USA), a GIS was
developed with the GCS WGS 1984 map coordinate system using existing data sourced from
the British Virgin Islands National GIS, USGS, USFS and the UKOTs Species and Specimens
Database. Existing data available comprised layers for roads, boundaries (i.e. protected areas,
municipalities and islands), waterbodies and geology as well as DEMs, processed land cover
imagery and digital copies of printed geological and topographical maps. Field data generated
by the author was added to the GIS following processing.
The existing available data varied considerably in scale, accuracy, resolution and content
across the PRB; therefore, the author was required to undertake heads-up, or on-screen,
digitising to create missing or uniform scale layers across the PRB. Much of the data variation
was due to less accurate feature identification performed by recognition algorithms or on-
screen digitising at low resolution that resulted in map scales greater than 1:50,000 which had
limited use for the purposes of this research. Although heads-up digitising can be a very time
consuming process, the results of visual interpretation by a user at high resolution is usually
more accurate (Horning et al., 2010).
Digitising was undertaken directly in the GIS using ArcGIS® software at 1:5000 or 1:100,000
map scale, as discussed in the following sections, or in Google Earth™ (Google Inc., Pro version
7.1, Mountain View, CA, United States). Google Earth™ digitising was undertaken using the
Keyhole Markup Language (.kml file type) and imported into the GIS using ArcToolbox within
ArcGIS® to convert .kml files into shapefiles (.shp), the native file type for vector data in
ArcGIS®. Google Earth™ digitising was performed using a 500 m eye level to increase accuracy.
Satellite imagery viewed in Google Earth™ for digitisation of features was provided by either
Spot Image™ (Airbus Group NV, Leiden, Netherlands) or DigitalGlobe™ (DigitalGlobe
Corporate, Westminster, CO, USA). Spot Image™ imagery provides a 2.5 m resolution and 10–

69
15 m positional accuracy for each pixel (Airbus Defence and Space, 2011) whereas
DigitalGlobe™ imagery provides product resolution of 1m and positional accuracy of 5 m
(DigitalGlobe, 2011, 2015). Recent studies by Mohammed et al. (2013) and Paredes-Hernández
(2013) from India and Mexico, respectively, have shown that Google Earth™ imagery meets
the American Society for Photogrammetry and Remote Sensing (ASPRS) positional accuracy
standards for the production of ASPRS Class 1, 1:20,000 maps (ASPRS, 1990, 2015); however,
archived imagery available from Google Earth™ was shown by Potere (2008) to have much less
accurate positional values, especially for developing countries. Dates of images used in this
research were recent, although they varied from island to island, as follows: Anegada
(11/10/2011 to 26/03/2013); Vieques (25/10/2014 to 18/06/2015); and Puerto Rico
(13/11/2014 to 10/02/2015).
Geology
Existing geological layers and digital copies of printed maps available in the GIS were compared
for resolution and accuracy following any necessary georeferencing or re-projecting. Field
survey data from this research was overlaid on the geological layers to determine which areas
and types of geological deposits were of relevance to V. rupicola. Geological deposits that
required digitisation in south-western Puerto Rico, Vieques and Anegada were all performed
directly in the GIS at a 1:5,000 map scale using the maps listed in Table 3. Varronia rupicola
records generated by this research were overlaid on the bespoke geological layers in the GIS to
associate the underlying geology using the tool ‘Spatial join’. This enabled subsequent
calculations for the number of records per geological type and map production showing the
distribution of geological features. The results of the geological mapping are presented in
2.3.1. Geology.
Table 3: Geological maps arranged by date and title pertaining to the native range of V. rupicola and used in this
research to digitise limestone and other geological deposits on the islands of Anegada, Puerto Rico and Vieques.
Author(s) Date Title Scale Area covered Briggs and Akers (1965) USGS Map HA-197 1:240,000 Puerto Rico (country)
Howard, J. (1970) Reconnaissance geology of Anegada Island 1:75,000 Anegada Island
Glover and Mattson (1973) USGS Map I-735 1:20,000 Rio Descalabrado Quadrangle
Learned et al. (1973) USGS Map 73-155 1:30,000 Vieques Island Krushensky and Monroe (1975) USGS Map I-863 1:20,000 Ponce Quadrangle Monroe, W. (1976) USGS Map 899 1:140,000 Puerto Rico Island
Glover et al. (1977) USGS Map MF-886 1:20,000
Playa de Ponce and Santa Isabel Quadrangles
Krushensky and Monroe (1978) USGS Map I-1042 1:20,000 Peñuelas and Punta Cuchara Quadrangles

70
Author(s) Date Title Scale Area covered
Krushensky and Monroe (1979) USGS Map I-1147 1:20,000 Yauco and Punta Verraco Quadrangles
Monroe, W. (1980) USGS Map 953 1:160,000 Puerto Rico Island
Volckmann, R.P. (1984a) USGS Map I-1557 1:20,000 Cabo Rojo-Parguera Quadrangle
Volckmann, R.P. (1984c) USGS Map I-1558 1:20,000 San German Quadrangle
Volckmann, R.P. (1984b) USGS Map I-559 1:20,000 Puerto Real Quadrangle Bawiec, W.J. (1999) USGS Map 98-038 1:100,000 Puerto Rico (country) Renken et al. (2002) USGS Map 1419 1:100,000 Puerto Rico (country)
Addarich-Martínez, L. (2009)
The geologic mapping and history of the Guánica Quadrangle 1:20,000 Guánica Quadrangle
Atwater et al. (2012)
Geomorphic evidence for an unusual tsunami a few centuries ago at Anegada 1:75,000 Anegada Island
Spiske and Halley (2014)
A coral-rubble ridge as evidence for hurricane overwash, Anegada 1:75,000 Anegada Island
Land cover
Regional habitat types raster data of Kennaway & Helmer (2007) for Puerto Rico and Vieques
and Kennaway et al. (2008) for BVI (see Figure 15) were converted to polygons using the
‘Raster to Polygon’ tool in ArcToolbox and then merged to create a PRVI regional habitat
vector layer. Habitats from the regional habitat layer for the islands of Puerto Rico (including
southern offshore cays), Vieques and Anegada were exported to generate a V. rupicola
habitats layer. All V. rupicola records generated by this research were overlaid on the habitats
layer to assign the appropriate regional land cover classification to each species record using
‘Extract values to points’ in ArcToolbox. All records of V. rupicola generated by this research
were also overlaid on the detailed habitat types raster data of Gould et al. (2008) for the
islands of Puerto Rico and Vieques and Kennaway et al. (2008) for Anegada to assign the
appropriate detailed land cover classification to each record using ‘spatial join’ in ArcToolbox.
For Puerto Rico, any habitat occurrences other than ‘Mature secondary lowland dry limestone
semi-deciduous forest’ of Gould et al. (2008) were examined to determine if the occurrence
was due to the positional accuracy error of the GPS unit (± 10 m) or the pixel size of the habitat
map. If necessary, corrections were made to the habitat classification following interpretation
of the data in ArcGIS™ and/or Google Earth™. This process was repeated for each island where
incorrect habitat types (e.g. ‘golf courses’ on Anegada) were associated with any V. rupicola
records. These steps enabled the calculation of number of records per habitat type on each
island.

71
Historical agriculture features on Anegada were digitised at a 1:5,000 map scale directly in the
GIS from a Directorate of Overseas Surveys (DOS) digitised map (DOS, 1966) following
georeferencing. The Anegada 1/12 arc-second topographic DEM was used to digitise further
historical agriculture features near East End not captured in the DOS map. All V. rupicola
records generated by this research from Anegada were overlaid on the newly created
historical agriculture features layer to explore the impact of historical anthropogenic
disturbance on the species.
Modern anthropogenic disturbance across the native range of V. rupicola and waterbodies,
permanent and seasonal, on Anegada were digitised in Google Earth™ and then imported into
the GIS. The latter features were used strictly for mapping purposes, whereas the former were
used to explore the impact of current anthropogenic disturbance on the species habitat. This
was undertaken by first converting the detailed habitat types raster data of Gould et al. (2008)
for the islands of Puerto Rico and Vieques and Kennaway et al. (2008) for Anegada to polygons
using the ‘Raster to Polygon’ tool in ArcToolbox. The new detailed habitat layers were then
clipped to the relevant geology layer(s) for each island. Finally, the anthropogenic feature
layers were used to erase the overlaid areas between the 2000 detailed habitat types and the
modern anthropogenic features. This resulted in a layer depicting the modern extent (i.e.
2014) of the detailed habitat types that support V. rupicola per geology type.
The global data set of forest change available from Hansen et al. (2013) was subsequently
added to the GIS. These raster data were converted to polygons and then clipped to geological
layers created during this research to enable calculations to be made for forest change across
the native range of V. rupicola as a comparison to the values derived from heads-up
digitisation undertaken in this research.
The modern extent of the detailed habitat types that support V. rupicola were finally clipped to
the existing and proposed protected areas found across the PRB to enable calculations of
remaining habitat within protected areas. The results of the methods above and maps
produced will be presented in 2.3.2. Land cover.
Sea level rise
The Anegada Island coastline available in the GIS did not provide the required accuracy for this
research and was, therefore, recreated using Google Earth™ before importing into the GIS. The
Anegada 1/12 arc-second topographic DEM (Figure 20) was then used to make refinements to
the coastline based on Lidar recorded elevation data. All other coastlines, supplied by USFS,
were found to be of adequate accuracy for sea-level rise mapping. All V. rupicola records made
during this research were overlaid on the available DEMs (raster data) for each island to record
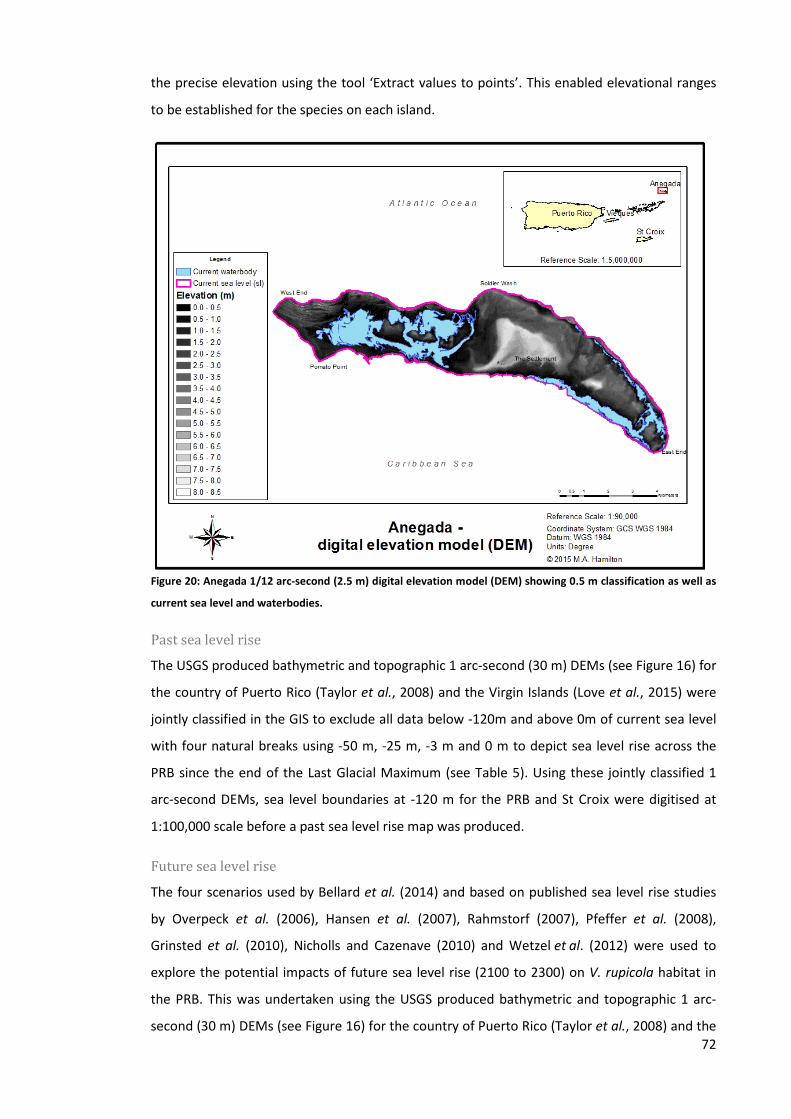
72
the precise elevation using the tool ‘Extract values to points’. This enabled elevational ranges
to be established for the species on each island.
Figure 20: Anegada 1/12 arc-second (2.5 m) digital elevation model (DEM) showing 0.5 m classification as well as
current sea level and waterbodies.
Past sea level rise
The USGS produced bathymetric and topographic 1 arc-second (30 m) DEMs (see Figure 16) for
the country of Puerto Rico (Taylor et al., 2008) and the Virgin Islands (Love et al., 2015) were
jointly classified in the GIS to exclude all data below -120m and above 0m of current sea level
with four natural breaks using -50 m, -25 m, -3 m and 0 m to depict sea level rise across the
PRB since the end of the Last Glacial Maximum (see Table 5). Using these jointly classified 1
arc-second DEMs, sea level boundaries at -120 m for the PRB and St Croix were digitised at
1:100,000 scale before a past sea level rise map was produced.
Future sea level rise
The four scenarios used by Bellard et al. (2014) and based on published sea level rise studies
by Overpeck et al. (2006), Hansen et al. (2007), Rahmstorf (2007), Pfeffer et al. (2008),
Grinsted et al. (2010), Nicholls and Cazenave (2010) and Wetzel et al. (2012) were used to
explore the potential impacts of future sea level rise (2100 to 2300) on V. rupicola habitat in
the PRB. This was undertaken using the USGS produced bathymetric and topographic 1 arc-
second (30 m) DEMs (see Figure 16) for the country of Puerto Rico (Taylor et al., 2008) and the

73
Virgin Islands (Love et al., 2015) as well as the 1/12 arc-second (2.5 m) DEM for the island of
Anegada (DDM, 2014). The three DEMs were jointly classified in the GIS to exclude all data
below 0 m of current sea level with five natural breaks using 1 m, 2 m, 3 m, 6 m and 1330 m asl
(the maximum height in the DEMs) to depict the future sea level rise scenarios across the PRB
between 2100 and 2300.
The Anegada 1/12 arc-second topographic DEM was also used to produce a future sea level
rise map using the four IPCC RCP scenarios for 2100 (IPCC, 2013a). The DEM was classified in
the GIS to exclude all data below 0 m of current sea level with five natural breaks using 0.44 m
(RCP2.6), 0.53 m (RCP4.5), 0.55 m (RCP6.0), 0.74 m (RCP8.5) and 8.6 m (highest point in DEM).
The IPCC scenarios were not explored for the rest of the PRB due to the resolution of the DEMs
available being too course for the RCP sea level rise values.
2.3. Results To determine the species current extant range and how this differs from its historical native
range, all available historical records and the survey data gathered by this research were used.
Based on examination of 41 historical vouchers, V. rupicola has been recorded along the south-
west coast of the island of Puerto Rico in the municipalities of Guánica, Guayanilla, Peñuelas
and Ponce; however, the localities of many of these records are poorly defined. The species
has also been recorded on Vieques Island at two locations, Punta Jalova and Puerto Ferro, and
is only known from the latter location in recent records. On Anegada, the species is found
across the island and predominantly recorded on the western side.
Survey at 1940 points was undertaken between 2012 and 2015 with V. rupicola present at 179
(9%) points. On the island of Vieques, the species was only found present at one recording
point, whereas the islands of Puerto Rico and Anegada had considerably more presence
records with 26 and 152, respectively. In total, 822 observations (presence and opportunistic
records) were made across the native range of the species between 2012 and 2015 with
observations on Vieques (n = 6), the island of Puerto Rico (n = 165) and Anegada (n = 651)
varying considerably (see Table 4 and Appendix 2: Survey points by substrate and regional
habitat class).
Table 4: The total number of survey points, absence records and presence records as well as all observations
(presence and opportunistic records) recorded per island for Varronia rupicola between 2012 and 2015.
Island Survey points Absence records Presence records All observations Anegada 666 514 152 651 Vieques 514 513 1 6 Puerto Rico 760 734 26 165
Total 1940 1761 179 822

74
Review of the locality information for all observations recorded during this research found that
the species is extant across the PRB where it grows on the islands of Puerto Rico (south-
western coastal municipalities of Guánica, Yauco, Peñuelas and Ponce) and Vieques (Puerto
Ferro) in the country of Puerto Rico and across the island of Anegada in the British Virgin
Islands (Figure 21).
Figure 21: Map showing unconfirmed localities (red triangle) from records made prior to 2012 as well as
confirmed localities (orange circle) where historical (pre-2012) and recent (2012-2015) records have been made
and new localities (purple plus) where records were made between 2012 and 2015.
Within the Puerto Rican municipalities, the species is currently known to occur in specific
wards as follows: Guánica municipality in Carenero and Montalva wards; Yauco municipality in
Barina ward; Peñuelas municipality in Tallaboa and Encarnación wards; and Ponce municipality
in Canas ward. No records were made during the course of this research in the Guayanilla
municipality where significant developments (i.e. highway and oil refinery) have occurred in
the past half-century. The species was only found at a single location on the limestone
peninsula of Puerto Ferro on Vieques Island. Across the island of Anegada, the species has
been recorded at 27 localities: Bones Bight, Bones Low Point, Bumber Well Cay, Capt. Auguste
George Airport, Citron Bush, Cow Wreck Bay, East End, Flamingo Pond, Jack Bay, Keel Point,
Low Cay, Middle Cay, North Raibin Slob, Nutmeg Point, Pearl Point, Pomato Point, Sambeal

75
Slob, Setting Point, Soldier East Point, Soldier Point, Saltheap Point, The Settlement, Vagabond
Pond, Warner, West End, Windlass Bight and Windlass Low Point. Of particular note is a >1.75
km gap between observations in the centre of the island. The native range will be explored
further in 2.4. Discussion and conclusions.
2.3.1. Geology
Review of available literature and subsequent digitisation of published maps were used to
identify any specific substrates on which V. rupicola plants occur, where these substrates are
located and how much area the substrates cover across the species native range. The
production of a dated list of significant events relating to the formation of the Puerto Rican
Bank and deposits of limestone across geological time (see Table 1) was followed by
identification of relevant geological deposits. Considerable variation exists in the quality and
quantity of information available for the relevant geological deposits across the native range of
the species. Discrepancies between the USGS 1:20,000 quadrangle maps for the island of
Puerto Rico were observed at several map intersections and required courser scale maps to be
used in order to determine appropriate adjustments for the intersecting areas. A detailed
USGS map for the Guánica Quadrangle is lacking which required the use of Addarich-Martínez
(2009) that has not been adopted by the USGS. Considerable difference was observed
between Addarich-Martínez (2009) and courser scale USGS maps (Briggs and Akers, 1965;
Monroe, 1980; Bawiec, 1999), particularly in the Montalva ward. The limestone deposition of
Monroe (1980) was followed for the Guánica Quadrangle given the focus of that author in the
area over a long period of time.
On Anegada, V. rupicola plants were found to be growing on Pleistocene limestone and
Quaternary deposits of sand. A total of 157 records were made on the later and 494 on the
former. No V. rupicola plants were found on Quaternary deposits outside Anegada.
Pleistocene limestone deposits above current sea level on Anegada total 19.80 km2 (Figure 22).
The remaining land area is covered by 7.43 km2 of Quaternary sand deposits where V. rupicola
plants have been recorded and 4.38 km2 of Quaternary alluvium deposits that are not known
to support the species.

76
Figure 22: Map showing Pleistocene limestone (19.80 km2) and Quaternary surface deposits of sand (7.43 km2)
and alluvium (4.38 km2) on the island of Anegada.
On the island of Vieques, the limestone formation that supports V. rupicola was deposited
during the Pliocene and is limited to the central part of the southern coast and the eastern tip
of the island (Figure 23). The Pliocene limestone deposits on Vieques total 6.28 km2. Various
other deposits, not known to support the species, cover the remainder of the island. Pliocene
limestone is not found in the Punta Jalova area; however, there are Quaternary surface
deposits of sand along the coast in adjacent bays.
77
Figure 23: Map showing Pliocene limestone deposits (6.28 km2) on the island of Vieques.
The southern limestone formations on the island of Puerto Rico (Figure 24) that support V.
rupicola were deposited during the Neogene period with Juana Diaz limestone forming early in
the Miocene followed by the formation of Ponce limestone later in the same epoch
(Krushensky and Monroe, 1975; Addarich-Martínez, 2009). The total area of Miocene
limestone formations that are known to support V. rupicola plants is only 165.82 km2 with
67.83 km2 of Juana Diaz limestone and 97.99 km2 of Ponce limestone. The latter occurs in nine
municipalities along the south-western coast of Puerto Rico from Santa Isabel in the east to
Cabo Rojo in the west. Juana Diaz limestone is restricted to only six of these municipalities,
Juana Diaz to Guánica, from east to west. Neither of these limestone formations nor
Quaternary surface sand deposits is known to occur in the locality described on the Woodbury
(1959) collection from Ensenada ward of Guánica municipality.

78
Figure 24: Map showing Miocene deposits (165.82 km2) of Juana Diaz (67.83 km2) and Ponce (97.99 km2)
limestone on the island of Puerto Rico.
2.3.2. Land cover
To determine if V. rupicola plants are associated with any specific land cover types overlying
the substrates supporting the species across its native range and if the species is found within
protected areas (proposed or established), compilation of existing data, digitisation of new
features and incorporation of field survey data was undertaken. This was followed by data
manipulation and extraction using the GIS developed for this research. These steps enabled
the identification of specific land cover types, where these are located and how much area
they cover as well as how much area of the land cover types known to support V. rupicola
plants occur within protected areas.
The examination of historical records suggests that the species typically occurs in areas of dry
forest that are intact or with only moderate disturbance. Using survey and observational data
derived from this research and the detailed habitats of Kennaway et al. (2008) identified for
Anegada in 2000, the habitat ‘Deciduous, Evergreen and Mixed Forest and Shrubland with or
without Succulents’ totalled 18.34 km2 in 2000, primarily on limestone (16.32 km2), in which
479 V. rupicola observations were made. By 2014, this habitat had decreased to 17.09 km2
with only 3.09 km2 falling within the boundaries of the proposed protected areas on the island.
The second highest number of observations (n = 100) were made in ‘Evergreen Coastal

79
Shrubland’ that totalled 3.60 km2 in 2000 that mostly exists on sand (2.73 km2). This habitat
decreased to 2.96 km2 by 2014 due mainly to a reduction in the area on sand to 2.12 km2. Only
0.83 km2 of this habitat falls within proposed protected areas. The remaining species records
were from ‘Low Density Urban’, ‘Pasture, Hay, Abandoned Agriculture or Other Grassy Areas’
and ‘High-Medium Density Urban’ with 59, nine and four records, respectively. The intact, and
obviously preferred, habitats of the species are ‘Deciduous, Evergreen and Mixed Forest and
Shrubland with or without Succulents’ and ‘Evergreen Coastal Shrubland’ on the island of
Anegada. These habitats classified in 2000, clipped to the underlying substrates of Pleistocene
limestone and Quaternary sand deposits and overlaid with modern anthropogenic
disturbances, are presented in Figure 25.
Figure 25: Map showing the two intact, refined habitat types of Kennaway et al. (2008), ‘Coastal shrubland’ (2.96
km2) and ‘Mixed forest’ (17.09 km2), in 2014 that support extant Varronia rupicola overlying Pleistocene
limestone and Quaternary sand deposits on the island of Anegada along with anthropogenic disturbance digitised
from 2011-2013 imagery. Note: ‘Evergreen Coastal Shrubland’ = ‘Coastal shrubland’; ‘Deciduous, Evergreen and
Mixed Forest and Shrubland with or without Succulents’ = ‘Mixed forest’.
Extant plants (n = 6) on Vieques are only found within the Vieques NWR. All plants were
recorded in the refined ‘Mature secondary lowland dry limestone semi-deciduous forest’
habitat type of Gould et al. (2008) at a single location. In 2000, the area of this habitat was a
mere 3.55 km2 and only 3.04 km2 was found to overlie Pliocene limestone deposits. Between

80
2000 and 2014, the forest area decreased on Vieques to only 2.86 km2. The ‘Mature secondary
lowland dry limestone semi-deciduous forest’ habitat on the island of Vieques remaining in
2000, clipped to the underlying Pliocene limestone substrate and overlaid with modern
anthropogenic disturbances, is presented in Figure 26.
Figure 26: Map showing the only habitat type of Gould et al. (2008), ‘Semi-deciduous forest’ (2.86 km2), in 2014
that supports extant Varronia rupicola overlying Pliocene limestone deposits on the island of Vieques with
anthropogenic disturbance digitised from 2014-2015 imagery. Note: ‘Mature secondary lowland dry limestone
semi-deciduous forest’ = ‘Semi-deciduous forest’.
On the island of Puerto Rico, five sterile individuals, in the same locality, were found within
‘Young secondary lowland dry limestone semi-deciduous forest’ habitat type of Gould et al.
(2008) that totalled 13.66 km2 in 2000 on either Juana Diaz or Ponce limestone formations. All
other V. rupicola plants on Puerto Rico Island, as on Vieques, were found in ‘Mature secondary
lowland dry limestone semi-deciduous forest’ habitat type of Gould et al. (2008). On mainland
Puerto Rico, 95.34 km2 of the latter habitat was remaining in 2000; however, only 72.66 km2 is
found on either Juana Diaz or Ponce limestone formations with 33.64 km2 and 39.02 km2,
respectively.
By 2014, the preferred habitat on either Juana Diaz or Ponce limestone formations had been
further reduced on mainland Puerto Rico to 65.06 km2. Both Juana Diaz and Ponce limestone

81
formations lost habitat during the period such that the remaining forest on each was 31.06
km2 and 34.00 km2, respectively. The ‘Young secondary lowland dry limestone semi-deciduous
forest’ habitat type of Gould et al. (2008) had also decreased between 2000 and 2014 to 8.16
km2 with 5.67 km2 and 2.49 km2 on Juana Diaz and Ponce limestone formations, respectively.
The remaining area of the preferred habitat, ‘Mature secondary lowland dry limestone semi-
deciduous forest’, on the island of Puerto Rico classified in 2000, clipped to the underlying
Miocene limestone substrates and overlaid with modern anthropogenic disturbances, is
presented in Figure 27.
Figure 27: Map showing the intact habitat type of Gould et al. (2008), ‘Semi-deciduous forest’ (65.06 km2), in 2014
that supports extant Varronia rupicola overlying Miocene deposits of Juana Diaz (forest area = 31.06 km2) and
Ponce (forest area = 34.00 km2) limestone on the island of Puerto Rico with anthropogenic disturbance digitised
from 2014-2015 imagery. Note: ‘Mature secondary lowland dry limestone semi-deciduous forest’ = ‘Semi-
deciduous forest’.
The largest amount of observed land development in Puerto Rico occurred in the limestone
areas of the main island to the west of Ponce where 1.71 km2 was developed between 2000
and 2014 across the Juana Diaz (0.69 km2) and Ponce (1.02 km2) limestone formations. This is
3% of the Juana Diaz and 4% of Ponce limestone formations in this area. Based on the area
digitised by the author, 46.19 km2 (47%) of the vegetation covering the Ponce limestone
formation has been impacted by anthropogenic disturbance.

82
The area of preferred habitat found within protected areas across the PRB varies considerably
between the islands. Only 3.09 km2 of the total area (20.04 km2) of the intact, preferred
habitat on Anegada is proposed for protection (Figure 28). Conversely, the entire habitat on
Vieques is within established protected areas; however, the Vieques NWR is undergoing
extensive clearance and modification due to the remedial works to remove unexploded
ordinance (UXO) within the reserve and anthropogenic impacts caused by recreational use in
the reserve and the nearby DRNA protected area. Of the remaining forest overlying Juana Diaz
or Ponce limestone formations on the island of Puerto Rico, 22.08 km2 is found within existing
protected areas. Of this, 8.42 km2 is forest on Juana Diaz limestone and a further 13.66 km2 is
forest on Ponce limestone. The total area under protection includes the small (1.54 km2),
offshore cay of Caja de Muertos where V. rupicola has not been previously recorded. The cay
includes 1.24 km2 of Ponce limestone and 0.91 km2 of ‘Mature secondary lowland dry
limestone semi-deciduous forest’ (Gould et al., 2008) under protection (see Figure 27).
Figure 28: Remaining intact preferred habitat (km2) per island and remaining intact preferred habitat within
protected areas* (km2) for Varronia rupicola per island across the PRB; Note: (*) denotes that the areas on
Anegada are proposed for protection.
The regional habitat classifications of Kennaway & Helmer (2007) for Puerto Rico and Vieques
and Kennaway et al. (2008) for BVI (see Figure 15) were used to undertake comparative
analyses of the species habitat occurrence and preference across the PRB. ‘Mature secondary
lowland dry limestone semi-deciduous forest’ of Gould et.al. (2008) is included in the broader
‘Semi-Deciduous and Drought Deciduous Forest on Karst/limestone (includes semi-evergreen
forest)’ of Kennaway & Helmer (2007). All V. rupicola plants recorded on Puerto Rico (n = 165)
and Vieques (n = 6) occur in the latter broad habitat type and only on limestone. Plants on
Anegada fall into one of four regional habitat types of Kennaway et al. (2008): ‘Deciduous,
Evergreen Coastal and Mixed Forest or Shrubland with Succulents’ (n = 579) across limestone
(82%) and sand (18%); ‘Low-Medium Density Urban’ (n = 59) across limestone (20%) and sand
20.04
2.86
65.06
3.09 2.86
22.08
0
10
20
30
40
50
60
70
Anegada15% protected*
Vieques100% protected
Puerto Rico34% protected
Remaining habitat in 2014
Protected* habitat in 2014

83
(80%); Pasture, Hay or Inactive Agriculture (n = 9) across limestone (78%) and sand (22%); and
‘High-Medium Density Urban’ (n = 4) only on sand.
The ‘Deciduous, Evergreen Coastal and Mixed Forest or Shrubland with Succulents’ habitat
that the species occurs in on the island of Anegada was present on Puerto Rico (3.81 km2) and
Vieques (0.42 km2) on deposits of limestone in 2000; however, the species has not been
recorded in that habitat on the last two islands during this research. The ‘Semi-Deciduous and
Drought Deciduous Forest on Karst/limestone (includes semi-evergreen forest)’ that the
species occurs in on Vieques (2.79 km2 in 2000) and Puerto Rico (105.48 km2 in 2000) is not
found on Anegada. The results of calculations for the number of V. rupicola observations per
habitat and substrate using both the refined and regional classifications are provided in
Appendix 3: Varronia rupicola observations made between 2012 and 2015.
The area (km2) of intact forest habitats across the native range of V. rupicola was calculated for
each island in 2000 and 2014 to determine the loss of habitat per island by substrate (Figure
29). Between 2000 and 2014, the largest percentage loss (12%) was experienced for intact
forest on Anegada’s Quaternary sand deposits while the largest area of loss was experienced
on Puerto Rico’s Ponce limestone where 5.02 km2 (5% loss) was converted to other land cover
types. These findings were subsequently compared to the global data set of forest change
generated by Hansen et al. (2013).
Figure 29: Intact V. rupicola habitat area (km2) in 2000 and 2014 as well as habitat loss (%) by substrate per island
between 2000 and 2014 using the regional classifications ‘Semi-Deciduous and Drought Deciduous Forest on
Karst/limestone (includes semi-evergreen forest)’ of Kennaway & Helmer (2007) for Puerto Rico and Vieques and
‘Deciduous, Evergreen Coastal and Mixed Forest or Shrubland with Succulents’ of Kennaway et al. (2008) for BVI.
4.76
17.20
3.04
39.02
33.64
3.88
16.16
2.86
34.00
31.06
0 20 40 60
Anegada Quaternary sand deposits with intactforest (12% loss 2000-2014)
Anegada Pleistocene limestone with intact forest(5% loss 2000-2014)
Vieques Pliocene limestone with intact forest (2%loss 2000-2014)
Puerto Rico Miocene Ponce limestone with intactforest (5% loss 2000-2014)
Puerto Rico Miocene Juana Diaz limestone withintact forest (4% loss 2000-2014)
Forest area (km2)
Subs
trat
e ty
pes a
nd fo
rest
loss
cal
cula
tions
Remaininghabitat in2014
Remaininghabitat in2000

84
The Hansen et al. (2013) global data set of forest change provided a much less accurate
measure of forest change across the native range of V. rupicola when compared to the values
derived from heads-up digitisation of this research (Figure 30). The differences observed are
easily explained by the course resolution (30 m) of the data used by Hansen et al. (2013).
Figure 30: Comparison of the findings of this research compared to the global data set of Hansen et al. (2013) for
forest loss between 2000 and 2014. Note: (*) denotes that substrates are classed as 1) Anegada Pleistocene
limestone/Quaternary sand deposits, 2) Vieques Pliocene limestone, 3) Puerto Rico Miocene Ponce limestone
and 4) Puerto Rico Miocene Juana Diaz limestone.
Historical agriculture features on the island of Anegada were digitised using a Directorate of
Overseas Surveys (DOS) map (DOS, 1966) and the 1/12 arc-second topographic DEM for
Anegada (DDM, 2014) to explore the impact of historical anthropogenic disturbance on the
vegetation and specifically explore how this may have impacted V. rupicola. The majority of
the agriculture features were in close proximity to The Settlement where the human
population was traditionally centred. The digitised historical agriculture features on Anegada
are shown in Figure 31 and further discussed in 2.4.2. Land cover.
0.00
0.05
2.55
1.05
1.92
0.18
5.02
2.58
0 1 2 3 4 5 6
Pleistocenelimestone/Quaternary sand
deposits
Pliocene limestone
Miocene Ponce limestone
Miocene Juana Diaz limestone
Forest loss (km2)
Subs
trat
e(s)
*
Hamilton forest loss bysubstrate 2000-2014
Hansen et al. forest loss bysubstrate 2000-2014

85
Figure 31: Map showing historical agriculture features on Anegada digitised from a Directorate of Overseas
Surveys (DOS) printed map (DOS, 1966) and the Anegada 1/12 arc-second topographic DEM.
2.3.3. Sea level rise
The current total area of land across the three islands with V. rupicola populations is 8902.63
km2. Puerto Rico is by far the largest island in the PRB with 8737.97 km2. The other two islands,
Vieques and Anegada, are considerably smaller with only 133.06 km2 and 31.60 km2,
respectively. Based on examination of historical records, the species has been recorded below
200 m asl. This research found extant V. rupicola plants between 0.90 m and 7.45 m asl on
Anegada, at a single location 12.00 m asl on the island of Vieques and at much higher
elevations on the island of Puerto Rico where records ranged from 60.00 to 214.00 m asl
(Figure 32). These results have potentially interesting links to the underlying geology as well as
V. rupicola populations across the PRB and are discussed further in 4.4.4. Main conclusions.

86
Figure 32: Altitudinal range of extant Varronia rupicola plants across the species native range on the islands of
Anegada, Vieques and Puerto Rico with elevation shown in meters above sea level (m asl).
Past sea level rise
The fifth question posed for this biogeographic research, “What are the implications of past
sea level rise on the native range of V. rupicola?”, was addressed following extensive literature
review, production of a dated sea level rise chronology of the PRB for the past 20,000 years
(Table 5) and subsequent map production.
Table 5: Significant events related to sea level rise across the Puerto Rican Bank since the Last Glacial Maximum
(LGM), ~20,000 years before present (k ybp) to the present. Note: the Pleistocene lasted from 2.588 mya to
11,700 years ago when the Holocene started.
Epoch Start date Sea level Event Reference
Holo
cene
~3k ybp 0 m Relative sea level stability Rhein et al., 2013 ~7k ybp -3 m Islands isolated across PRB Fleming et al., 1998
~8.5k ybp -25 m Virgin Islands separated from Puerto Rico, Vieques and Culebra Fairbanks, 1989
~10k ybp -50 m Sea level had risen ~25m in 4k years; PRB single land mass for ~20k years Fairbanks, 1989
Plei
stoc
ene
~14k ybp -75 m Sea level had risen ~25m in 3k years Clark et al., 2009; ~17k ybp -100 m Sea level had risen ~20m in 3k years Fleming et al., 1998
~20k ybp -120 m
Onset of ice sheets melting following LGM; PRB single land mass for ~11k years Siddall et al., 2003
0.50 12.00
60.00
7.45 12.00
214.00
0102030405060708090
100110120130140150160170180190200210220
Elev
atio
n (m
asl
)
Anegada Vieques Puerto Rico
Minimum
Maximum

87
During the latter part of the Pleistocene, eustatic changes driven by glacial cycles led to the
exposure of the entire Puerto Rican Bank as a single land mass (Figure 33). Sea level began to
rise following the LGM due to the onset of the melting of the ice sheets. The PRB had been a
single land mass for ca. 11,000 years at this point in time. By around 10,000 ybp, sea level had
risen a further ca. 25 m (Fairbanks, 1989); therefore, the PRB would have been a single land
mass for at least 20,000 years. Sea level rose a further ca. 25 m by ca. 8,000 ybp (Fairbanks,
1989) and separated the Virgin Islands from Puerto Rico, Vieques and Culebra. Over the next
1,500 years (ca. 7,000 ybp), another ca. 22 m sea level rise was experienced (Fleming et al.,
1998) that isolated the individual islands across the PRB with slightly more land area than
today. The current islands of the PRB have had nearly the same land area for ca. 3,000 years.
This is due to relative sea level stability with annual mean sea level rise rates increasing from a
background of 1.7 mm from 1900 to 3.2 mm between 1993 and 2010 (Rhein et al., 2013). The
implications of these findings are discussed in 2.4.3 Sea level rise.
Figure 33: Sea level rise across the Puerto Rican Bank since the end of the Last Glacial Maximum (LGM) showing
significant and dated sea levels: -120 m ca. 20,000 years before present (20 kYBP); -50 m ca. 10,000 years before
present (10 kYBP); -25 m ca. 8,500 years before present (8.5 kYBP); -3 m ca. 7,000 years before present (7 kYBP);
and 0 m ca. 3,000 years before present (3 kYBP).

88
Future sea level rise
Exploring the impact of proposed future sea level rise scenarios on the native range of V.
rupicola required extensive desk study of this controversial and highly debated topic in order
to develop appropriate sea level rise scenarios for 2100 and beyond to 2300 using available
DEMs. Map production was undertaken to depict future sea level rise between 2100 and 2300
for the entire PRB (Figure 34) using the 1 m, 2 m, 3 m and 6 m scenarios of Bellard et al. (2014).
Fortunately, the 1 m, 2 m, 3 m and 6 m scenarios for 2100 to 2300 of Bellard et al. (2014) will
have no direct impact on extant V. rupicola plant locations on Puerto Rico or Vieques;
however, these scenarios will have significant impact on the current locations of the species
across Anegada. Individual maps for Anegada, Vieques and Puerto Rico are provided in 2.4.3
Sea level rise to illustrate the discussion.
Figure 34: Map showing future sea level rise scenarios of 1 m, 2 m, 3 m, and 6 m for 2100 to 2300 AD (Bellard et
al., 2014) across the Puerto Rican Bank with map insets showing impact to the native range of V. rupicola.
The four IPCC RCP scenarios for 2100 (IPCC, 2013a) were only mapped for Anegada (Figure 35)
as the resolution of the DEMs available for the rest of the PRB was too course for the RCP sea
level rise values: 0.44 m (RCP2.6), 0.53 m (RCP4.5), 0.55 m (RCP6.0) and 0.74 m (RCP8.5).

89
Figure 35: Map showing future sea level rise scenarios for 2100 AD on the island of Anegada using median values
of the IPCC (2013a) Representative Concentration Pathways (RCP): 0.44 m (RCP2.6), 0.53 m (RCP4.5), 0.55 m
(RCP6.0) and 0.74 m (RCP8.5).
The highest point on Anegada is a mere 8.56 m asl with 94% of the island (29.62 km2) lying
below 6 m asl and 75% of the island (23.69 km2) lying below 3 m asl. Using the median values
of the four IPCC RCPs, sea level rise by 2100 will have a minimal direct impact on V. rupicola
that ranges from a 4% (29 individuals) to 12% (75 individuals) loss using locations of extant
plants to evaluate the impact. The post-2100 scenarios will have significant impact on the
species current locations across Anegada with losses of extant individual locations varying
from 20% to 99% between the 1 m and 6 m scenarios (Figure 36). The direct impact on
Anegada and the indirect impacts of future sea level rise scenarios across the PRB will be
discussed in 2.4.3 Sea level rise.

90
Figure 36: Impacts of future sea level rise on extant Varronia rupicola plants growing on the island of Anegada by
scenario, up to 2300 AD. Scenarios based on IPCC (2013a) Representative Concentration Pathways (RCP) for 2100,
0.44 m (RCP2.6), 0.53 m (RCP4.5), 0.55 m (RCP6.0) and 0.74 m (RCP8.5), as well as 1 m, 2 m, 3 m and 6 m
scenarios of Bellard et al. (2014) for 2100 to 2300 AD.
2.4. Discussion and conclusions To address the first biogeographic question about the species current range, survey data
gathered across the native range of the species between 2012 and 2015 in this research was
processed and spatially viewed alongside all available historical records. Surveys for this
research (Table 4) showed the species to be extant on each of the islands in the PRB that are
part of its historical range with considerable variation in the area occupied between the
islands. The single location on Vieques is in stark contrast to several south-western coastal
municipalities (Guánica, Yauco, Peñuelas and Ponce) on Puerto Rico and across almost the
entire extent of Anegada with 27 specific localities discernible. The historical recorded range of
the species includes localities where no modern records exist including the Ensenada ward of
Guánica municipality, the Indios ward in the Guayanilla municipality (both on Puerto Rico
Island) and Punta Jalova on Vieques (see Figure 21). All records from the Guayanilla
municipality are poorly defined and at least one collected in 1913, Shafer #1989, could
represent another lost locality. The notes suggest the specimen was collected between
Guayanilla and Tallaboa on a limestone outcrop. The road that once traversed these two areas
crossed through Ponce limestone where an oil refinery was constructed leaving little habitat in
the area for the species. Although the species has not been recorded in these locations in
several decades, its existence cannot be ruled out due to survey limitations in these areas.
Much of the remaining dry forest habitat on limestone in Guayanilla municipality is found on
privately owned land that is difficult, or even impossible, to access. The Ensenada ward locality
is problematic due to a lack of underlying Miocene limestone in the area; however, this is
within the Guánica Quadrangle which lacks a USGS produced/adopted geology map. The Punta
Jalova area on Vieques is part of the former Eastern Maneuver Area of the U.S. Navy that is
29 42 47
75 132
427 597
643
0.44 m (RCP2.6) = 4% plants lost0.53 m (RCP4.5) = 6% plants lost0.55 m (RCP6.0) = 7% plants lost
0.74 m (RCP8.5) = 12% plants lost1 m = 20% plants lost2 m = 66% plants lost3 m = 92% plants lost6 m = 99% plants lost
0 100 200 300 400 500 600 700
Futu
re se
a le
vel r
ise
scen
ario
Number of recorded individuals (n = 651) 2012-2015
# plants lost

91
undergoing extensive clearance and modification due to unexploded ordinance (UXO)
clearance resulting in very limited access and the inability to undertake surveys of many areas.
This area lacks the Pliocene limestone that is known to support the species; however,
Quaternary deposits of sand are found in the area. The lack of detailed information for the two
Woodbury vouchers from Ensenada (1959) and Punta Jalova (1978) make confirmation of
these locations very challenging. The military use of the areas in the species native range on
Vieques could potentially be the cause of the limited numbers (six individuals at a single
location) observed through direct (e.g. habitat fragmentation and degradation) or indirect
impacts (e.g. deterrence of dispersers). Further survey and collaboration with ornithologists
and herpetologists are warranted and will be discussed further in 5.3.5. Reproduction biology
and dispersal.
This research made new formal voucher records in three Puerto Rican municipalities (see
Figure 21). The first was collected in the Montalva ward of the Guánica municipality within the
western tract of the Guánica State Forest. In the Barina ward of Yauco, vouchers were
collected in the eastern tract of the Guánica State Forest and the Catala Farm, a privately
owned area that was accessed with permission of the owner. The final new formal voucher
was collected in Tallaboa ward of the Peñuelas municipality. These locations were surveyed
following discussions with Puerto Rican colleagues that had either seen the species, but not
formally vouchered the location, or agreed survey was warranted when reviewing maps due to
the presence of suitable habitat. The positive result of surveys in areas of suitable habitat
where no historical records existed support the methodology used and highlight the
importance of local, expert input. Further survey based on the detailed geology and habitat
maps presented in this research is warranted as previously unknown plants/populations may
exist, especially on Puerto Rico.
Relatively few historical vouchers (n = 14) from Anegada exist (Appendix 1: Varronia rupicola
records) and most do not provide detailed locality information; therefore, the majority of
vouchers made from that island represent new localities for the species. Seven specific
localities recorded in previous vouchers were confirmed and a further 20 localities were
defined by this research across the island (see Figure 21).
Overall, the native range and detailed localities of the species have been better defined by this
research. There are 506 vouchered records collected between 1886 and 2015 known to exist
for Varronia rupicola that include 177 herbarium sheets, 459 DNA samples, two spirit
collections, and one wood sample. Prior to the start of this research, only 41 vouchers existed;
therefore, this research has generated 424 new vouchers for the species from wild and

92
cultivated material. There are a further 784 georeferenced observation records for the species
collected between 2004 and 2015. Prior to the start of this research, 223 georeferenced
observations existed with all but one, recorded in Puerto Rico, originating from Anegada. This
research has generated 561 new observations for the species from across its native range that
will be used in conjunction with population genetics findings (see 4.4.4. Main conclusions) to
undertake a re-assessment of the species conservation status based on these new data.
2.4.1. Geology
In addressing the second biogeography question about substrates that support V. rupicola, it
was necessary to interpret existing data and digitise printed maps to produce geological
features across the PRB. Discrepancies were found to exist between available data and maps.
This was true for several intersections of the USGS 1:20,000 quadrangle maps for the island of
Puerto Rico. According to Albrecht (2007), these discrepancies are commonly encountered in
GIS and require the user to resolve these using data that provides an appropriate scale for the
product required; therefore, courser scale (i.e. <1:240,000) maps were interrogated to
determine adjustments where discrepancies were found. A major issue encountered was a
lacking USGS map for the Guánica Quadrangle. There are only a few map quadrangles not
completed for Puerto Rico and the Guánica Quadrangle is of particular significance given the
presence of the Guánica State Forest. A map produced as part of an MSc thesis by Addarich-
Martínez (2009) does exist for the quadrangle; however, considerable difference is observed
when compared to earlier, courser scale USGS maps. For this reason, Monroe (1980) was
followed for the quadrangle as he focused on the limestone deposits of the area over a long
period of time and is usually referenced by subsequent USGS workers in their maps of the
southern coast. There are several consequences to this decision and require some caveats to
be attached to the results presented here, beyond the normal issues encountered when
digitising due to error associated with projections and resolution of source data. First, V.
rupicola observations are shown to occur on Ponce limestone in the Montalva ward when
following Monroe (1980); however, the map of Briggs and Akers (1965) suggests that these
plants may be growing on Juana Diaz limestone similar to all other plants found within the
Guánica forest, but elevation data do not support this as all other plants at a similar altitude
are recorded on Ponce limestone. Second, following Monroe (1980) results in a large area of
Juana Diaz limestone in the Monte Las Pardas area between the western and eastern tracts of
the Guánica forest, whereas the map of Addarich-Martínez (2009) shows this area as a large
Ponce limestone deposit. The species has not been found in this area through recent surveys;
however, the area contains a significant area of intact habitat without protection. Determining
the correct substrate classification is necessary to assist further survey and research into V.

93
rupicola. For this reason, an officially adopted/produced USGS map for the Guánica
Quadrangle is desperately needed.
Assessing the geological mapping results of this study in relation to species observations and
underlying substrate has shown the species is limited to deposits of specific substrates that
vary considerably in size and distribution across the PRB. Anegada was found to have two
substrates, Pleistocene limestone and Quaternary sand deposits (overlying Pleistocene
limestone), supporting the species with 494 and 157 observations of the species, respectively
(Figure 37). These findings demonstrate that the species is able to grow on recently deposited
sand even though it has not been formally recorded growing on the substrate elsewhere
across its native range. This provides an opportunity to explore population reinforcement or
assisted colonisation (IUCN/SSC, 2013) of the species into protected areas with suitable
substrates across the species range (see 5.2. Conservation strategies).
Figure 37: Map showing all recorded observations (n = 651) of Varronia rupicola between 2012 and 2015 growing
on Quaternary sand deposits (157 observations) and Pleistocene limestone deposits (494 observations) across
the island of Anegada.
Vieques, with the smallest area of substrate supporting the species, was also found to be
supporting the least number (n = 6) of extant V. rupicola plants (Figure 38). The Puerto Ferro

94
limestone peninsula was the only locality with extant plants even though Pliocene limestone
deposits occur in several areas.
Figure 38: Map showing all recorded observations (n = 6) of Varronia rupicola between 2012 and 2015 growing on
Pliocene limestone at a single locality, Puerto Ferro, on the island of Vieques.
The Miocene limestone formations on Puerto Rico were the largest area of substrate
supporting V. rupicola across its native range but with only 165 observations (Figure 39) split
between Juana Diaz and Ponce limestone, where 110 and 55 observations were made,
respectively. The age of these deposits and the considerable elevation difference observed
between deposits on Puerto Rico compared to Vieques and Anegada suggest that the species
may have originated on Puerto Rico and subsequently colonised progressively younger
limestone formations from west to east. This will be discussed further in relation to the
findings of the phylogenetic placement and population genetics of the species in Chapter 5:
Discussion, conservation implications and research opportunities.

95
Figure 39: Map showing all recorded observations (n = 165) of Varronia rupicola between 2012 and 2015 growing
on Miocene deposits of Juana Diaz (110 observations) and Ponce (55 observations) limestone along the south-
western coast of the island of Puerto Rico.
2.4.2. Land cover
In determining that V. rupicola plants are associated with a relatively few land cover types that
overlie the specific substrates that were found to support the species, a much clearer picture
of the reduction and fragmentation of the species remaining habitat has been drawn. The
variation in habitats between the two countries and across the substrates highlights the
species ability to adapt to its environment; however, the limited number and area of habitats
involved and the complete absence of the species in heavily disturbed habitats other than on
Quaternary sand substrate on Anegada suggests that the species struggles to adapt to
anthropogenic disturbance, particularly on limestone substrates where moisture retention is a
major impedance to establishment (McLaren and McDonald, 2003). Following identification of
habitats and substrates supporting the species, the assessment of protected area coverage
shed light onto the current in-situ conservation measures and the gaps that exist (see 5.2.
Conservation strategies). Maps below include no new data and are provided to assist
visualisation of the discussion.
Two refined habitat types of Kennaway et al. (2008), overlying specific substrates that support
the species were found to be the preferred habitats for V. rupicola on Anegada. Anegada

96
currently lacks designated protected areas, but two new protected areas are proposed for the
island. These are the Eastern Ponds which is to be designated as a National Park and the
Western Ponds that includes the existing Ramsar site which is to be designated as a Protected
Landscape. Once established, these protected areas would only include 15% of the intact,
preferred habitat for the species (Figure 40). On-going anthropogenic disturbance, even within
the boundary of the existing Ramsar site, is of major concern and protected area designation
and regulation is urgently needed. The proposed protected area coverage will be discussed
further in 5.1. Conservation implications following the presentation of the population analyses
results in Chapter 4: Conservation genetics of Varronia rupicola.
Figure 40: Map showing proposed protected areas with Quaternary deposits of sand and Pleistocene limestone
covered by intact ‘Deciduous, Evergreen and Mixed Forest and Shrubland with or without Succulents’ (aka ‘Mixed
forest’) and ‘Evergreen Coastal Shrubland’ (aka ‘Coastal shrubland’) of Kennaway et al. (2008) supporting extant
Varronia rupicola on Anegada.
Although all of the preferred habitat of the species classified by Gould et al. (2008) and
substrates known to support it is found within the DRNA reserve or the Vieques NWR (Figure
41), both of these areas experience on-going disturbance and degradation across much of their
area. The eastern tract of the Vieques NWR that is home to the six extant V. rupicola includes
the former Eastern Maneuver Area of the U.S. Navy that underwent extensive modification
and was used for military exercises that left UXO in the landscape, particularly at Punta Este

97
(CH2M HILL, 2012a) on the eastern tip of the island. The UXO is now being identified and
removed which often requires clear-cutting of the vegetation with some subsequent
restoration planned (CH2M HILL, 2012b). Many areas not subjected to UXO remediation work
within the refuge are open to the public and suffer from disturbance and degradation due to
recreational use and arson as does the entire DRNA reserve. Road improvement works on the
Puerto Ferro peninsula of Vieques were thought to have extirpated V. rupicola from the island
until it was rediscovered during this research. These factors coupled with the species limited
distribution put it in a very precarious situation and suggest urgent and sustained management
is required to bolster wild populations and develop ex-situ collections (see 5.2. Conservation
strategies).
Figure 41: Map showing protected areas with Pliocene limestone deposits and intact ‘Mature secondary lowland
dry limestone semi-deciduous forest’ (aka ‘Semi-deciduous forest’) of Gould et al. (2008) supporting extant
Varronia rupicola on Vieques.
Protection for the preferred habitat of the species classified by Gould et al. (2008) and
substrates known to support it on Puerto Rico (Figure 42) is limited to the Guánica State
Forest. This situation leaves a large proportion of the extant individuals, especially those on
Ponce limestone, unprotected and subject to anthropogenic disturbance. This is of particular
concern near Ponce as this research found 3% of the Juana Diaz and 4% of Ponce limestone
formations in this area were developed between 2000 and 2014. More generally, this research

98
found that 47% of the vegetation covering the Ponce limestone formation in south-western
Puerto Rico has been impacted by anthropogenic disturbance. Research by Martinuzzi et al.
(2007) found urban expansion in Puerto Rico between 1977 and 1994 to be associated with
proximity to existing urbanisation and lower elevations, whereas Kennaway and Helmer (2007)
found that between 1991 and 2000 limestone deposits underwent >20% of the anthropogenic
disturbance on the island with the forests impacted being of an older age. The ‘Mature
secondary lowland dry limestone semi-deciduous forest’ habitat type of Gould et al. (2008)
corresponds to the dry forest age class 4 of Helmer et al. (2008) that is 50-64+ years old;
therefore, V. rupicola is found in some of the oldest and most threatened forest in Puerto
Rico.
Figure 42: Map showing protected areas with Miocene limestone deposits and intact ‘Mature secondary lowland
dry limestone semi-deciduous forest’ (aka ‘Semi-deciduous forest’) of Gould et al. (2008) supporting extant
Varronia rupicola on Puerto Rico.
Outside the species native range, opportunities exist for the assisted colonisation of the
species to establish populations that include currently unprotected genetic diversity. One such
example is on the small, offshore cay of Caja de Muertos where both Ponce limestone and
‘Mature secondary lowland dry limestone semi-deciduous forest’ (Gould et al., 2008) are
under protection. Other examples are along the southern coast of Puerto Rico where Ponce
limestone rests atop Cretaceous rock at the protected area Los Morrillos de Cabo Rojo

99
(Monroe, 1980; Weaver and Schwagerl, 2009) and Cabo Rojo NWR (Monroe, 1980; U.S. Fish
and Wildlife Service, 2013a). These opportunities with reference to population genetics will be
further explored in 5.2.3. Conservation introductions.
There are several localities in south-western Puerto Rico with Miocene limestone geology and
‘Mature secondary lowland dry limestone semi-deciduous forest’ habitat type of Gould et al.
(2008) that have not had intensive survey and appear to have suitable habitat for V. rupicola.
Among these areas are: Cabo Rojo municipality – Boquerón; Guánica municipality – Caño,
Susúa Baja; Yauco municipality - Jácana; Guayanilla municipality – Boca, Cedro, Jaguas,
Macaná, Magas, Playa, Quebradas; Peñuelas municipality – Coto, Cuebas, Santo Domingo,
Tallaboa Alta, Tallaboa Poniente, Tallaboa Saliente; Ponce municipality – Ponce, Magueyes,
Magueyes Urbano, Marueño, Portugués Urbano, Segundo, Sabana Llana; and Caja de Muertos.
These areas represent a relatively small proportion of the 78 municipalities and 875 wards
found on the island of Puerto Rico; however, traversing the often steep limestone hills and
dense vegetation can be an arduous task with access extremely difficult for the predominantly
private land. The issue of privately owned land is the most challenging and often results in the
greatest impact to species and their habitats through modification of the landscape with little
or no regulation (Yackulic et al., 2011).
Within the Guánica forest boundary, Kennaway and Helmer (2007) observed no land
development between 1991 and 2000. During the same period on Vieques within the NWR,
the only change observed occurred on the eastern end of the island (Kennaway and Helmer,
2007) on Pliocene limestone (Learned et al., 1973; CDC, 2007) which was inside the live impact
area of the Atlantic Fleet Weapons Training Facility (CDC, 2007) that had already undergone
significant levels of disturbance. Once opened for access, there are several areas on Vieques
that require thorough survey. Among these are Punta Jalova and Yellow Beach conservation
area as well as the eastern tip of the island, Punta Este.
Historical agriculture features on Anegada (see Figure 31) suggest historical anthropogenic
disturbance has had a significant impact on the species habitat and the localities of extant
individuals. A large area in the centre of the island was under active management for many
decades or centuries (Schomburgk, 1832), creating a nearly complete transect of disturbance
through the middle of the island. The consequences of this historical disturbance in relation to
population genetics are discussed further in Chapter 5: Discussion, conservation implications
and research opportunities.

100
2.4.3 Sea level rise
Eustatic changes have caused significant variations in the amount of submerged and exposed
land across the PRB in the past (see Table 1) and are projected to continue to do so into the
future. How these changes have impacted individual species is poorly known and has never
been assessed for V. rupicola. The following sections summarise the findings of research into
past and future scenarios of sea level rise on the PRB and the potential implications to, and
impacts on, V. rupicola. Maps below include no new data and are provided to assist
visualisation of the discussion.
Past sea level rise
Eustatic changes driven by glacial cycles led to the exposure of the entire Puerto Rican Bank as
a single land mass more than once in the past and submersion of larger parts of the islands
that led to the formation of limestone deposits. Sea levels following the deposition of Miocene
limestone formations on Puerto Rico appear to have been lower, suggesting that at least parts
of the Juana Diaz and possibly Ponce limestones were never submerged again and would have
been exposed substrates for colonisation. Following the deposition of the Pliocene limestone
formation on Vieques, sea levels do not appear to have exceeded the levels experienced
during the formation of that deposit. Thus the limestone subsequently exposed by lower sea
levels would have been available for colonisation from Puerto Rican propagules that might
have been avian dispersed during island isolation (high sea levels) or dispersed by a mixture of
avian/non-avian organisms during PRB exposure (low sea levels). During the Pleistocene,
limestone on Anegada was formed and subsequently exposed. Since its exposure, Anegada
limestone has never been submerged again and was, therefore, available for colonisation from
propagules originating further west in the PRB by methods previously described.
Barker et al. (2012) found that data from amphibians supported an ‘Eastern Dispersal
Hypothesis’ in which the eastern islands of the PRB were colonised from mainland Puerto Rico
subsequent to the penultimate interglacial period. Although the study species of Barker et al.
(2012) is only thought to be able to disperse during periods of low sea level due to salt
intolerance, the findings are nonetheless useful here due to the premise used in the study that
suggests higher extinction rates in small, low lying islands require colonisers from larger,
higher elevation islands. The results from other studies vary widely from low levels of
endemism and high gene flow (Heatwole and MacKenzie, 1967) to low gene flow and high
endemism (Malone et al., 2003), suggesting that sea level fluctuations play a diverse role in
insular, tropical island biogeography. Further discussion in relation to V. rupicola populations
will be provided in 4.4.4. Main conclusions.

101
Future sea level rise
Hurricanes and tsunamis have had major impacts in the PRB (Committee on Natural Disasters,
1994), especially on Anegada as documented by several authors (Atwater et al., 2012, 2014;
Spiske and Halley, 2014). Higher sea levels that are thought to be a certain result of climate
change will exacerbate future events (Nicholls and Cazenave, 2010). To compound the issue,
Parsons and Geist (2009) found a higher hazard for a >0.5 m tsunami run-up for Puerto Rico
and the Virgin Islands due to the proximity of the islands to the subduction zone between the
North American and Caribbean plates. Due to the low-lying nature of Anegada, the island will
probably be the most impacted in the native range of V. rupicola by future events.
The median values of the four IPCC RCP scenarios for 2100 (IPCC, 2013a) showed that V.
rupicola will experience minimal direct sea level rise impacts on Anegada (see Figure 35) with
losses between 4% and 12% of the locations of the current extant individuals (see Figure 36).
However, the indirect impacts on the species may be significantly higher due to anthropogenic
change (e.g. development further inland and up slope) and the effects of natural disasters
previously discussed.
Unfortunately, the species current locations across Anegada, where the largest numbers of
observations were made, will experience significant impact with >1 m sea level rise (see Figure
36). Only 7.91 km2 of Anegada’s limestone lies above 3 m asl and a mere 1.98 km2 are above 6
m asl. A portion of the current dune system along the north and west coasts has peaks above 3
m asl; however, rising seas will undoubtedly wash away these Quaternary deposits overlying
limestone that is below 3 m asl through tidal and storm related events. With a nearly complete
loss of extant localities (99% loss) using the 6 m sea level rise scenario, the majority of extant
localities of the species will surely be lost (Figure 43). Even the 20% loss suggested by the 1 m
scenario will have a significant impact on the species globally calling into question the current
conservation measures for the species and the need for assisted migration and/or other
conservation measures to be put into place.
The indirect impacts of future sea level rise scenarios across the PRB and the direct impact on
Anegada will be discussed further in relation to population genetics (5.1.2. Sea level rise) and
to mitigation options (5.2. Conservation strategies).

102
Figure 43: Map showing future sea level rise scenarios of 1 m, 2 m, 3 m, and 6 m for 2100 to 2300 AD (Bellard et
al., 2014) on Anegada.
The future sea level rise scenarios for 2100 to 2300 of 1 m, 2 m, 3 m and 6 m (Bellard et al.,
2014) will, fortunately, have no direct impact on extant V. rupicola plant locations on Vieques
(Figure 44) or Puerto Rico (Figure 45); however, the indirect impacts could be significant,
especially on Puerto Rico outside of the areas of protected habitat due to anthropogenic
disturbance. By 2100, the Caribbean could see massive population displacement due to the
prohibitive costs associated with coastal mitigation projects (Nicholls et al., 2011). If low-lying,
coastal areas are abandoned, available land (unprotected) at higher elevation but adjacent to
existing infrastructure will be the obvious choice for anthropogenic disturbance. The preferred
habitat of V. rupicola that is outside of existing protected areas meets these criteria and is,
therefore, under severe threat in the face of sea level rise.

103
Figure 44: Map showing future sea level rise scenarios of 1 m, 2 m, 3 m, and 6 m for 2100 to 2300 AD (Bellard et
al., 2014) on southern Vieques.
Figure 45: Map showing future sea level rise scenarios of 1 m, 2 m, 3 m, and 6 m for 2100 to 2300 AD (Bellard et
al., 2014) on south-western Puerto Rico.

104
2.4.4. Main conclusions
This research was undertaken to explore the biogeography of V. rupicola with the aim of
answering several specific questions. These queries involved definition of the native range and
ecological preferences of the species as well as the impacts of on-going habitat modification
and future sea level rise. The original questions and answers provided by this research are as
follows:
• First, where is the species currently extant and does this differ from its historical
native range? The species is extant on the islands of Puerto Rico (south-western
coastal municipalities of Guánica, Yauco, Peñuelas and Ponce); Vieques (Puerto Ferro);
and Anegada (across the island in 27 localities). Within the Puerto Rican municipalities
the species is currently known to occur in specific wards, as follows: Guánica
municipality (Carenero, Montalva); Yauco municipality (Barina); Peñuelas municipality
(Tallaboa, Encarnación); and Ponce municipality (Canas). The historical range of the
species includes the Ensenada ward in Guánica municipality and Guayanilla
municipality (Indios ward and undefined localities) on Puerto Rico and Punta Jalova on
Vieques. The species has not been recorded in these locations in several decades;
however, its existence cannot be ruled out due to survey limitations. The species was
not previously recorded by formal voucher in Puerto Rico at Montalva ward (Guánica
municipality), Barina ward (Yauco municipality) or Tallaboa ward (Peñuelas
municipality); or in Anegada at twenty new localities.
• Second, do V. rupicola plants occur on any specific substrates across the native range
of the species? If so, where are they located and how much area do they cover? Yes.
The species has only been found on specific substrates during this research. Across the
PRB, these substrates are located:
o On Anegada (see Figure 22) - Pleistocene limestone (total area of 19.80 km2)
mainly on the eastern half of the island and Quaternary deposits of sand (total
area of 7.43 km2 ) only on the western half of the island;
o On Vieques (see Figure 23) - Pliocene limestone (total area of 6.28 km2) only
along the central part of the southern coast and the eastern tip;
o On Puerto Rico (see Figure 24) – Miocene limestone formations (total area of
165.82 km2) of Juana Diaz limestone (67.83 km2) and Ponce limestone (97.99
km2) only along the south-western coast with Juana Diaz limestone restricted
to six municipalities from Juana Diaz in the east to Guánica in the west and
Ponce limestone in nine municipalities from Santa Isabel in the east to Cabo
Rojo in the west.

105
• Third, are V. rupicola plants associated with any specific land cover types overlying
the substrates supporting the species across its native range? If so, where are they
located and how much area do they cover? Yes. The species has only been found
within a limited number of habitats that vary based on the use of regional or refined
classifications. Across the PRB, these habitats and their areas are:
o On Anegada, two refined habitat types of Kennaway et al. (2008), ‘Evergreen
Coastal Shrubland’ and ‘Deciduous, Evergreen and Mixed Forest and
Shrubland with or without Succulents’ were found to be overlying specific
substrates that support the species with 2.96 km2 and 17.09 km2 remaining in
2014, respectively (see Figure 25). These two habitats are combined in the
regional habitat classification of Kennaway et al. (2008), ‘Deciduous, Evergreen
Coastal and Mixed Forest or Shrubland with Succulents’, resulting in 20.04 km2
remaining in 2014. The species was also recorded in ‘Low Density Urban’,
‘Pasture, Hay, Abandoned Agriculture or Other Grassy Areas’ and ‘High-
Medium Density Urban’ overlying specific substrates that support the species
with 59, nine and four records, respectively. The species was not found in
these habitats although they do occur on the other islands. The
refined/regional habitats the species was found in on other islands are not
found on Anegada.
o On Vieques, only 2.86 km2 (see Figure 26) of the refined ‘Mature secondary
lowland dry limestone semi-deciduous forest’ habitat type of Gould et al.
(2008) which is included in the regional ‘Semi-Deciduous and Drought
Deciduous Forest on Karst/limestone (includes semi-evergreen forest)’ habitat
of Kennaway & Helmer (2007) was found to be overlying specific substrates
that support the species and remained in 2014.
o On Puerto Rico, 65.06 km2 (see Figure 27) of the refined ‘Mature secondary
lowland dry limestone semi-deciduous forest’ habitat type of Gould et al.
(2008) was found to be overlying specific substrates that support the species
remained in 2014. Five sterile individuals were also recorded in the refined
‘Young secondary lowland dry limestone semi-deciduous forest’ habitat type
of Gould et al. (2008) with 8.16 km2 overlying specific substrates that support
the species remaining in 2014. These habitats are combined in the regional
‘Semi-Deciduous and Drought Deciduous Forest on Karst/limestone (includes
semi-evergreen forest)’ habitat of Kennaway & Helmer (2007) meaning that
73.22 km2 of this broader habitat overlying specific substrates that support the
species remained in 2014.

106
• Fourth, are V. rupicola plants found within protected areas (proposed or existing)? If
so, how much area of the land cover types known to support V. rupicola plants do
these protected areas contain? Yes. The species has been found to occur within
protected areas, both existing and proposed, in both countries and all three islands
(see Figure 28). Across the PRB, these sites and the area of land cover types known to
support V. rupicola plants are:
o On Anegada, ‘Deciduous, Evergreen and Mixed Forest and Shrubland with or
without Succulents’ and ‘Evergreen Coastal Shrubland’ only have 3.09 km2 and
0.83 km2, respectively, falling within the boundaries of the two proposed
protected areas on the island (see Figure 40);
o On Vieques, all 2.86 km2 of the ‘Mature secondary lowland dry limestone
semi-deciduous forest’ refined habitat type of Gould et al. (2008) is protected
in the Vieques NWR (see Figure 41);
o On Puerto Rico, 22.08 km2 of the ‘Mature secondary lowland dry limestone
semi-deciduous forest’ habitat type of Gould et al. (2008) is found within
existing protected areas (see Figure 42). The area under protection is mainly
within the Guánica State Forest; however, 0.91 km2 of the total is included in
the offshore cay of Caja de Muertos where V. rupicola has not been previously
recorded.
• Fifth, what are the implications of past sea level rise on the native range of V.
rupicola? Past sea level rise has caused both isolation of and connectivity between the
current areas where V. rupicola plants are extant. This has potentially allowed
colonisation of habitat on islands where the species had not previously existed,
probably from west to east, through dispersal by the fauna. Periods of lower sea levels
potentially led to connection between previously isolated populations and
opportunities to colonise new areas of habitat. Subsequent periods of higher sea levels
fragmented populations limiting dispersal by non-avian organisms and submerged
suitable habitat in areas below 0 m asl.
• Sixth, will proposed scenarios of future sea level rise impact the native range of V.
rupicola? The median values of the four IPCC RCP scenarios for 2100 (IPCC, 2013a)
could only be mapped for Anegada (see Figure 35) due to the DEMs available having
resolution that was too course for the rest of the PRB. On Anegada, IPCC RCP sea level
rise scenarios by 2100 (see Figure 36) will have a minimal direct impact on V. rupicola
ranging from a loss of 29 (4%) to 75 (12%) individual localities using locations of extant
plants to evaluate the impact. The 1 m, 2 m, 3 m and 6 m scenarios for 2100 to 2300
(see Figure 34) will have no direct impact on extant V. rupicola plant locations on

107
Vieques (see Figure 44) or Puerto Rico (see Figure 45); however, these scenarios will
have significant impact on the species current locations across Anegada (see Figure 43)
with losses of extant individual’s locations varying from 20% to 99% between the 1 m
and 6 m scenarios due to only 6% of the island being above 6m asl. The indirect
impacts of future sea level rise on all three islands could be very high, especially on
Puerto Rico Island outside of existing protected areas.

108
Chapter 3: Phylogenetic placement of Varronia rupicola This chapter focuses on the phylogenetic systematics of Varronia rupicola and specifically
explores its relationship with other species of Varronia and Cordia native to the Puerto Rican
Bank and insular Caribbean. There are no known studies of the phylogenetic placement of V.
rupicola and in those phylogenetic studies undertaken that have included Varronia species i.e.
Gottschling et al. (2001), very few were Caribbean samples.
Determining the placement of V. rupicola and its relationship with morphologically similar and
often confused species is paramount for conservation planning. Also, to undertake a
population genetics study (Chapter 4: Conservation genetics of Varronia rupicola), a phylogeny
is needed to answer fundamental questions about the species placement. Using markers for
ITS and trnL-trnF regions that have been successfully employed in previously published studies,
this research will explore the phylogenetic placement of several Varronia and Cordia species
native to the insular Caribbean for the first time.
• First, do new samples from the Caribbean support previous findings of Varronia as a
monophyletic genus sister to Cordia.
• Second, is V. rupicola is a distinct taxon and, if so, what are its closest relatives?
Recommendations for further research will be made following the discussion of the results for
species placements presented here for the first time.
3.1. Introduction Varronia rupicola is one of nine species in the genus to occur in the PRB (Acevedo-Rodríguez
and Strong, 2012). There has been historical confusion between three species native to the
Caribbean region: V. rupicola, V. lima Desv. and V. bahamensis (Urb.) Millsp. (Figure 46).
Figure 46: Three often confused Caribbean species of Varronia: (a) V. rupicola, (b) V. lima and (c) V. bahamensis.
©M.A. Hamilton.

109
Varronia lima was the first of these species to be described in 1808 from Hispaniola (Desvaux,
1808) and its current known range is Puerto Rico and Hispaniola (Acevedo-Rodríguez and
Strong, 2012). Early collections in the Bahamas were recorded as Cordia lima by Grisebach
(1859). These collections were later re-identified as a separate species with the publication of
Cordia bahamensis Urban (1899). Varronia bahamensis is now known to occur throughout the
Bahamas archipelago, including the Turks and Caicos Islands in the south (Acevedo-Rodríguez
and Strong, 2012). Collections and publications up until the second work of D’Arcy (1975)
recorded V. bahamensis as present on Anegada (Britton, 1916; D’Arcy, 1971). Curation and
identification of Anegada material varies between herbaria; however, the specimens and
historical records from the island are all now thought to be V. rupicola by the majority of
workers in the PRB (Proctor, 1991; Clubbe et al., 2004; U.S. Fish and Wildlife Service, 2010;
Wenger et al., 2010; Acevedo-Rodríguez and Strong, 2012). Resolving the phylogenetic
placement of the aforementioned species is paramount for further population level analyses
to be undertaken for V. rupicola.
3.1.1 Genomic information
Gottschling (2003) demonstrated the usefulness of ITS1 and trnL intron in resolving genus level
relationships for Cordia s.l. and limited success at lower level resolution. Wikström et al. (1999)
found a higher level of variation in the trnF intergenic spacer compared with the trnL intron
and Eriksson et al. (2003) found the ITS region to be more variable than the trnL-trnF region.
Cohen (2013) showed ITS and trnL-trnF to be useful for resolving relationships in subfamily
Boraginoideae. Therefore, exploration of the entire region for ITS and trnL-trnF was chosen for
this research in an attempt to provide a phylogenetic tree for selected Cordia and Varronia
species from the Caribbean and confirm the placement of V. rupicola.
Due to the slow rate of evolution for mitochondrial DNA (mtDNA) in plants (Zhang and Hewitt,
2003), research has focused on identifying specific regions of nuclear or plastid DNA and
producing protocols that enable replicable results across many taxa. Several genomic regions
have been successfully identified and have become standards for sequenced-based molecular
phylogenetic studies (White et al., 1990; Baldwin, 1992; Baldwin et al., 1995; Coleman and
Mai, 1997; Small et al., 1998; Álvarez and Wendel, 2003; Coleman, 2003; Shaw et al., 2005,
2007; Borsch and Quandt, 2009). Increased use of these regions has provided great insight to
the tree of life and offers opportunities for subsequent research to build upon. It has also
highlighted many issues and the need for alternative methods for many groups (Álvarez and
Wendel, 2003; Pirie et al., 2007; Shaw et al., 2007) and caution as discussed below.

110
Nucleotide sequences of nuclear ribosomal DNA (nrDNA) have been successfully used in
comparative studies over a wide range of taxonomic levels (Medlin et al., 1988; White et al.,
1990; Ainouche and Bayer, 1999; Schulenburg et al., 1999; Calonje et al., 2008). Regions of
nrDNA like the bi-parentally inherited internal transcribed spacer (ITS) region (ITS1, 5.8s and
ITS2) of 18-26s nrDNA can be very useful for phylogenetic studies as they are well conserved,
easily examined and have high copy numbers (Baldwin, 1992; Baldwin et al., 1995; Álvarez and
Wendel, 2003; Coleman, 2003; Calonje et al., 2008). Taxonomic relationships for closely
related taxa (inter- or even intraspecific) can be explored using the rapidly evolving ITS region
(White et al., 1990; Calonje et al., 2008). To make use of the ITS region and nearby regions,
White et al. (1990) developed a series of universal primers to enable the sequencing of small
amounts of DNA using polymerase chain reaction (PCR) and cycle sequencing (Figure 47).
Making use of the 18S, 5.8S and 28S rRNA genes, the ITS primers amplify the non-coding
regions, ITS1 and ITS2, between them (White et al., 1990).
Figure 47: 18-26S repeat unit of nuclear ribosomal DNA (minus the intergenic spacer and much of the 26S
subunit). Adapted from Baldwin (1992) showing the ITS region with approximate positions of primers (White et
al., 1990) used to amplify single-stranded DNA for sequencing indicated by arrows.
Interpretation of nrDNA can be complicated by sexual recombination and segregation.
Different character states observed in nrDNA could represent phylogenetically relevant
mutations that occurred after divergence from a common ancestor or be misleading if they
existed in the common ancestor and were differentially transmitted or lost in daughter species
(Baldwin, 1992; Álvarez and Wendel, 2003). The high copy number and rapid concerted
evolution of nrDNA promotes intragenomic uniformity and may also promote uniformity in
populations that interbreed thus minimising the importance of intrapopulational sampling for
phylogenetic studies (Baldwin et al., 1995). However, Álvarez and Wendel (2003) discussed
three possible evolutionary fates of divergent rDNA copies after merging in a single genome -
maintenance of repeat types, generation of new repeat types, and loss of repeat types via

111
concerted evolution – that are not mutually exclusive and have drastic implications on
phylogenetic reconstruction. Feliner and Rosselló (2007) provided an in-depth overview for
phylogenetic reconstruction using ITS and conclude that the region is, and will continue to be,
valuable as long as proper considerations are made.
Maternally inherited plastid genomes (Corriveau and Coleman, 1988) contain non-coding DNA
that has historically been considered “junk” DNA (Kelchner, 2002). Modern work has shown
these non-coding DNA to have vastly varied sizes and important functions for protein coding
(Willingham and Gingeras, 2006; Shaw et al., 2007; Wang et al., 2013). In their review of the
most important non-coding plastid DNA (pDNA) markers, Borsch and Quandt (2009) discussed
the well conserved secondary structure of introns, nucleotide sequences in genes that are
removed by RNA splicing, that gives rise to a mosaic of extremely variable and highly
conserved parts. These introns are classified by their conserved RNA folding patterns into
three (i.e. I, II and III) groups (Michel and Dujon, 1983; Michel et al., 1989; Kelchner, 2002).
Spacer DNA is held between tandem repeat genes (i.e. rRNA) and can be partly, fully or not at
all transcribed. The sequences of spacer DNA and introns are functionally less constrained
(Quandt and Stech, 2004; Borsch and Quandt, 2009).
Plastid DNA, especially non-coding regions like the trnLUAA intron and trnLUAA-trnFGAA intergenic
spacer (Figure 48), has been used extensively for phylogenetic reconstructions as it is highly
conserved across large geographic ranges and shows variation at the interspecific level (Borsch
and Quandt, 2009; Haston et al., 2009); however, polymorphisms in pDNA at the intraspecific
level may result from normal variation or from interspecific pDNA transfer (Taberlet et al.,
1991). The trnL intron is the sole member of the group I intron group in the chloroplast
genome (Kelchner, 2002).
Figure 48: Directions and positions of universal primers for amplification of pDNA non-coding trnL and trnL-trnF
regions. Figure adapted from Taberlet et al. (1991) with 3’ ends of primers indicated by arrow tips.

112
Gielly and Taberlet (1994) reported intron evolution near that of the trnF intergenic spacer,
making it slightly less variable and more suitable to higher level (e.g. intrafamilial) taxonomic
studies (Taberlet et al., 1991; Shaw et al., 2005). Conversely, the trnF intergenic spacer shows a
higher level of variation and may be suitable for lower level (e.g. interspecific) taxonomic
studies (Wikström et al., 1999; Shaw et al., 2005).
There are several other frequently sequenced regions of pDNA (Small et al., 1998; Shaw et al.,
2005, 2007). GenBank (Benson et al., 2013) holds several Varronia and Cordia sequences for
three pDNA regions: rbcL, matK and ndhF. The protein coding region, rbcL, codes for the large
subunit of ribulose-1,5-bisphosphate carboxylase/oxygenase (RUBISCO). The region has been
sequenced from several plant taxa resulting in many phylogenetic studies (Olmstead et al.,
1992; Cuénoud et al., 2002; Kocyan et al., 2011) with several studies showing the region to be
most suitable for studies at the intra- or interfamilial level and above (Chase et al., 1993; Gielly
and Taberlet, 1994; Fay et al., 1997). Another protein coding region, matK, has been employed
in many phylogenetic studies (Sang et al., 1997; Cuénoud et al., 2002) and has shown faster
evolution times than rbcL (Gielly and Taberlet, 1994; Cohen, 2013) potentially making it useful
for low level studies. ndhF is also a protein-encoding region (Cohen, 2013) that has been used
for phylogenetic studies in other Boraginaceae s.l. and closely related families (Ferguson, 1998;
Moore and Jansen, 2006).
3.1.2. Phylogenetic analysis techniques
Detecting evolutionary change requires the comparison of two or more homologous
sequences from gene fragments or entire genes that share a common ancestor. Homologous
sequences are aligned to form columns of homologous sites to identify the location of
insertions and deletions. Indels in different lineages since divergence can result in varied
length of homologous sequences. Alignment is undertaken to maximize sequence similarity
and minimize gaps in complementary bases (Rodríguez–Trelles et al., 2006). If sequences are
from distantly related taxa, alignments can be very difficult to perform manually. In these
situations, specialised software packages are used to implement algorithms to find the best
alignment (Higgins and Lemey, 2009).
Phylogenetic trees constructed from alignments are used to illustrate evolutionary
relationships for organisms, or genes, and depict which are most closely related. The branch
tips of phylogenetic trees represent the extant taxa, often called operational taxonomic units
(OTUs), and their genealogy (Barton et al., 2007; Vandamme, 2009). Internal nodes of the tree
represent hypothetical progenitors of OTUs. Phylogenetic trees can be rooted if an outgroup of

113
one or more OTUs is selected and is thought to be the most distantly related of the OTUs. The
remaining OTUs form the ingroup.
Constructing phylogenetic trees from alignments is commonly undertaken using discrete
character-state methods (Vandamme, 2009) with three regularly employed in the literature,
listed here in order of rigour (Barton et al., 2007): maximum parsimony (Fitch, 1971;
Felsenstein, 1978), maximum likelihood (Felsenstein, 1981) and Bayesian inference (Dempster,
1968). The three are often employed concurrently by researchers to explore the variation in
estimations as parsimony is a non-parametric technique while maximum likelihood and
Bayesian techniques are parametric methods using explicit probabilistic models.
By seeking the tree that explains shared character states due to inheritance from common
ancestors (Thornton, 2006), maximum parsimony (MP) leads to the tree that supposes the
least evolutionary change to explain the data observed (Fitch, 1971). Alternatively, maximum
likelihood (ML) selects values in a model to maximize the agreement between observed and
selected model data (Felsenstein, 1981; Tateno et al., 1994). Bayesian inference (BI) is based
on the generation of posterior probabilities of a phylogenetic tree and a model of evolution
that are based on priors and the data likelihood, generated by a multiple alignment (Dempster,
1968; Li, 1996; Larget and Simon, 1999; Mau et al., 1999; Li et al., 2000; Huelsenbeck et al.,
2014). Advances in computational power have made BI more popular as a method for
assessing nodal confidence (Alfaro et al., 2003), especially using the Markov chain Monte Carlo
(MCMC) algorithms (Metropolis et al., 1953; Hastings, 1970) and the Metropolis coupled
MCMC (MC3) variant (Altekar et al., 2004). The latter requires more computational time but
overcomes the possible entrapment in local optima that standard implementations of MCMC
can suffer (Altekar et al., 2004).
In order to estimate phylogeny using the above mentioned algorithms, a model of evolution is
required to calculate the probabilities of change between nucleotides found along
phylogenetic branches (Fitch and Margoliash, 1967; Posada, 2009). Given that the substitution
model employed may change the phylogenetic analysis, selection of the most appropriate
substitution model is an essential step for phylogeny estimation of DNA sequence alignments
(Sullivan and Joyce, 2005; Posada, 2008; Johnson and Omland, 2014). Acknowledging the
assertion of Box (1976) that all models are wrong and some are useful, identifying the correct
model to suit those data being explored becomes even more important.
Models range in complexity from simple to overly complex. If the model is too simplistic, an
underestimation of the number of substitutions two sequences have experienced since their
last shared common ancestor is possible (Sullivan and Joyce, 2005). Models of evolution that
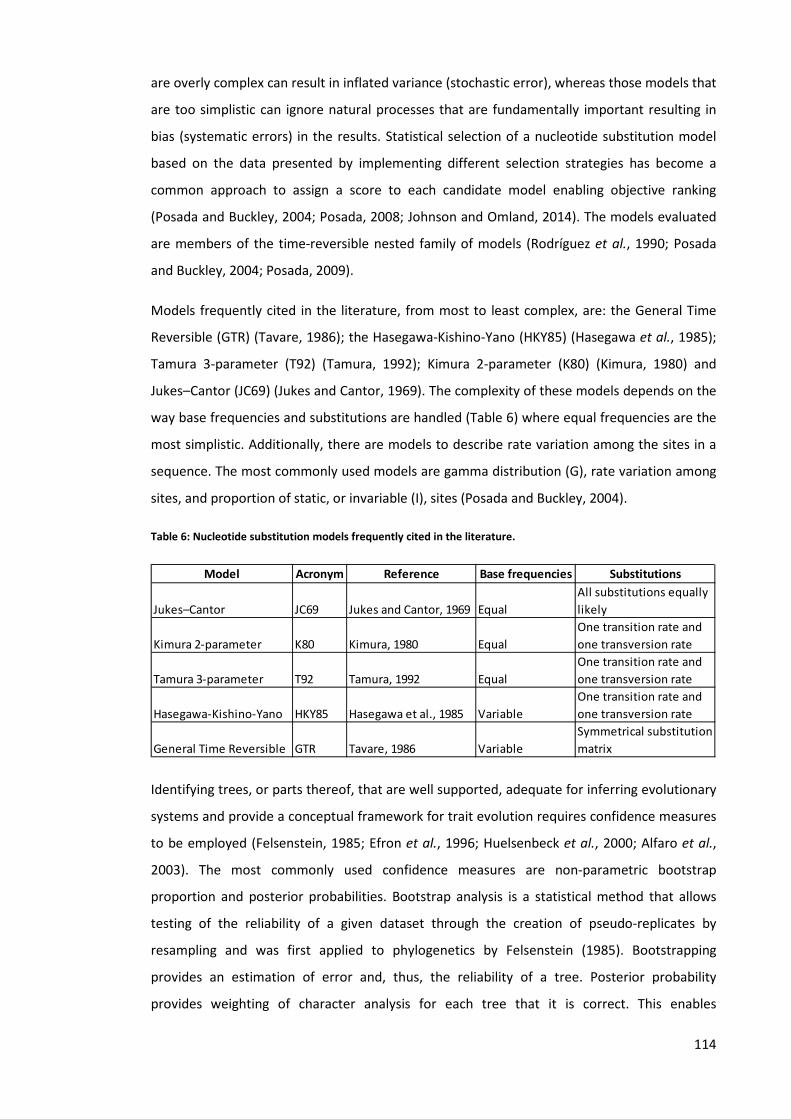
114
are overly complex can result in inflated variance (stochastic error), whereas those models that
are too simplistic can ignore natural processes that are fundamentally important resulting in
bias (systematic errors) in the results. Statistical selection of a nucleotide substitution model
based on the data presented by implementing different selection strategies has become a
common approach to assign a score to each candidate model enabling objective ranking
(Posada and Buckley, 2004; Posada, 2008; Johnson and Omland, 2014). The models evaluated
are members of the time-reversible nested family of models (Rodríguez et al., 1990; Posada
and Buckley, 2004; Posada, 2009).
Models frequently cited in the literature, from most to least complex, are: the General Time
Reversible (GTR) (Tavare, 1986); the Hasegawa-Kishino-Yano (HKY85) (Hasegawa et al., 1985);
Tamura 3-parameter (T92) (Tamura, 1992); Kimura 2-parameter (K80) (Kimura, 1980) and
Jukes–Cantor (JC69) (Jukes and Cantor, 1969). The complexity of these models depends on the
way base frequencies and substitutions are handled (Table 6) where equal frequencies are the
most simplistic. Additionally, there are models to describe rate variation among the sites in a
sequence. The most commonly used models are gamma distribution (G), rate variation among
sites, and proportion of static, or invariable (I), sites (Posada and Buckley, 2004).
Table 6: Nucleotide substitution models frequently cited in the literature.
Identifying trees, or parts thereof, that are well supported, adequate for inferring evolutionary
systems and provide a conceptual framework for trait evolution requires confidence measures
to be employed (Felsenstein, 1985; Efron et al., 1996; Huelsenbeck et al., 2000; Alfaro et al.,
2003). The most commonly used confidence measures are non-parametric bootstrap
proportion and posterior probabilities. Bootstrap analysis is a statistical method that allows
testing of the reliability of a given dataset through the creation of pseudo-replicates by
resampling and was first applied to phylogenetics by Felsenstein (1985). Bootstrapping
provides an estimation of error and, thus, the reliability of a tree. Posterior probability
provides weighting of character analysis for each tree that it is correct. This enables
Model Acronym Reference Base frequencies Substitutions
Jukes–Cantor JC69 Jukes and Cantor, 1969 EqualAll substitutions equally likely
Kimura 2-parameter K80 Kimura, 1980 EqualOne transition rate and one transversion rate
Tamura 3-parameter T92 Tamura, 1992 EqualOne transition rate and one transversion rate
Hasegawa-Kishino-Yano HKY85 Hasegawa et al., 1985 VariableOne transition rate and one transversion rate
General Time Reversible GTR Tavare, 1986 VariableSymmetrical substitution matrix

115
comparative analysis of all trees by sampling based on their posterior probability (Huelsenbeck
et al., 2000).
Modern phylogenetic analyses are an attempt at reconstructing evolutionary history
(Huelsenbeck et al., 2014). There is a plethora of software available to work with and interpret
DNA sequences for constructing phylogenetic trees with statistical methods and computational
demands varying widely. The purpose of employing these software is to identify the
evolutionary tree that explains the observed data requiring the fewest evolutionary events
(Felsenstein, 1978). Many challenges can be encountered when undertaking phylogenetic
analysis and understanding the pitfalls and potential solutions is paramount before beginning
any study. Sanderson and Shaffer (2002) reviewed the most common issues encountered (e.g.
weak tree support, data conflict, model selection, computation time) and provide possible
solutions. This research has tried to address these common issues through the software
programmes chosen and analyses undertaken as presented in the following sections.
3.2. Materials and Methods ITS and trnL-trnF regions were chosen for this study as they previously proved successful in
determining generic limitation and provided insight into species limitations in Boraginaceae
(Gottschling et al., 2001; Gottschling, 2003; Gottschling et al., 2005; Miller and Gottschling,
2007; Cohen, 2013). ITS has been shown to be easily amplified from herbarium specimens
(Baldwin et al., 1995) and with trnL-trnF offers the opportunity to include dead plants in the
current study (Särkinen et al., 2012). All DNA samples were extracted and sequenced in the
Jodrell Laboratory, Kew.
3.2.1. Sampling
Dried plant material of various ages was used for DNA extraction. Samples were sourced from
herbarium specimens held in the herbaria at Kew (K) or Fairchild Tropical Botanical Garden
(FTG) as well as silica dried samples (Chase and Hills, 1991; Särkinen et al., 2012) from
cultivated and wild plants, both living and dead (Appendix 4: New samples used for
phylogenetic analysis). All vouchers collected from cultivated and wild plants are deposited at
K with duplicates lodged at other herbaria.
DNA extraction
Approximately 50 mg of dried plant material was used for genomic DNA extraction and
followed a modified 2×CTAB protocol (Saghai-Maroof et al., 1984; Doyle and Doyle, 1987;
Csiba and Powell, 2006). Sterilised sand, a stainless steel bead and small pieces of leaf material
were combined in a 2 ml Eppendorf® tube for each sample, and then ground into a fine powder
using a Retsch Mixer Mill MM301 (Retsch, Haan, Germany, a Verder Group company).

116
Immediately after grinding, 750 µl of 65 °C pre-heated 2×CTAB buffer [100 mM Tris-HCl pH 8.0,
1.4 M NaCl, 20 mM EDTA, 2% CTAB (hexadecyl trimethyl ammonium bromide)] and β-
mercaptoethanol (1 ml:4 µl) was added to the samples. The samples were incubated for 20
minutes in a 65 °C water bath before adding 750 µl of SEVAG (24:1 chloroform:isoamyl
alcohol). The sample was extracted for one hour at 20 °C by rocking before spinning down at
9000 rpm for ten minutes at 20 °C. The aqueous top layer containing genomic DNA was
pipetted into new 2 ml Eppendorf® tubes with 500 µl of -20 °C isopropanol and gently mixed to
precipitate DNA before storing for 24 hours at -20 °C. To collect the precipitate, the sample
was spun at 4000 rpm for five minutes before pouring off the liquid. The remaining pellet was
washed in 750 µl of 70% ethanol for five minutes on a rocker before spinning down DNA at
4000 rpm for five minutes. All remaining liquid was poured off and the sample left in a fume
cupboard for 24 hours to allow complete evaporation. Genomic DNA was re-suspended in 125
µl of TE 0.1 buffer (10 mM Tris-HCl pH 8, 0.25 mM EDTA) and left to dissolve for 24 hours at 3
°C. Samples were rocked for five minutes to dissolve genomic DNA before it was purified using
Nucleospin DNA purification columns following the protocol supplied by the manufacturer
(QIAquick; Qiagen Ltd, Crawley, UK). To ensure a suitable quantity of genomic DNA was
available for analysis (>10 ng/µl), a Nanodrop (ThermoScientific, Denver, CO) was used to
measure each sample. A polymerase chain reaction (PCR) was performed for each region as
described below.
ITS PCR
Genomic DNA samples were initially run using the primers ITS5 and ITS4 (White et al., 1990) to
amplify the entire ITS region (ITS1, 5.8s and ITS2). Any samples that failed to amplify were
repeated using the primers ITS5 and ITS2 (White et al., 1990) to only amplify the ITS1 region.
ITS amplifications were performed in 25 μL reactions, containing 22.5 μL PCR Abgene
mastermix (1.5 mM mg), 5 μL TBT-PAR [trehalose, bovine serum albumin (BSA), and
polysorbate-20 (Tween-20) (Samarakoon et al., 2013)], 0.5 μL each primer, 1.2 μL
dimethylsulphoxide (DMSO) and 1.0 μL template DNA (~10 ng). DMSO was added to improve
PCR amplification of the GC-rich ITS template (Kang et al., 2005). The PCR profile for both
primer pairs was as follows: initial denaturation of 94 °C for 2 min, followed by 32 cycles of
denaturation at 96 °C for 1 min, annealing at 48 °C for 1 min, extension at 72 °C for 50 sec,
followed by a final extension of 7 min at 72 °C. All PCR experiments included a positive control
(known working sample) and a negative control [DNA replaced with sterile deionised water
(sdH2O)].

117
trnLUAA intron – trnLUAA-trnFGAA spacer PCR
Genomic DNA samples were initially run using the primers c and f of Taberlet et al. (1991) to
amplify the entire trnL-trnF region. Any samples that failed to amplify were repeated using the
primers c and d (Taberlet et al., 1991) to only amplify the trnLUAA intron. Amplifications were
performed in 25 μL reactions, containing 22.5 μL PCR Abgene mastermix (1.5 mM mg), 5 μL
TBT-PAR (Samarakoon et al., 2013), 0.5 μL each primer and 1.0 μL template DNA (~10 ng). The
PCR profile for both primer pairs was as follows: initial denaturation of 96 °C for 2min,
followed by 32 cycles of denaturation at 96 °C for 1 min, annealing at 55 °C for 1 min,
extension at 72 °C for 2min, followed by a final extension of 7 min at 72 °C. All PCR
experiments included a positive and a negative control.
PCR products from the ITS and trnL-trnF regions were purified using Nucleospin DNA
purification columns following the protocol supplied by the manufacturer (QIAquick; Qiagen
Ltd, Crawley, UK). Dideoxy cycle sequencing was performed next with an ABI Prism Big Dye
version 3.1 reaction kit as per the manufacturers' protocol (Applied Biosystems Inc.,
Warrington, UK) using the chain termination method. Dideoxy cycle sequencing products were
run on an ABI 3730 Genetic Analyser, according to the manufacturers' protocol (Applied
Biosystems Inc., Warrington, UK).
3.2.2. Molecular analysis
Molecular analyses were undertaken using a range of software programmes selected for their
ease of use, availability of documentation and easily interpretable outputs (Table 7).
Complementary strands from the ABI 3730 sequencer were imported, aligned, combined into
matrices and used to generate informative phylogenetic trees using Geneious software
(Geneious version 7.1 created by Biomatters. Available from http://www.geneious.com/) on a
PC running Windows 7.
Table 7: Software packages employed in this research for phylogenetic analyses showing software version,
operating system of personal computer and use for the software.
Software package Version Operating system Use
Geneious 7.1.7 Windows 7
Base calling, Sequence alignment, MegaBLAST, Matrix building, Tree building, NEXUS generation
MrBayes plug-in for Geneious 7.1 Windows 7 Bayesian analysisMrBayes 3.2.2 Windows 8.1 Bayesian analysisFigTree 1.4 Windows 8.1 Interpret MrBayes outputs, Tree building
MEGA6 6.0.5 Windows 8.1Nucleotide substitution model selection, ML & MP analysis, Tree building

118
Two versions of MrBayes were used in this study. Initially, the MrBayes 3.2.1 plugin for
Geneious software (developed by Marc Suchard and the Geneious team) was selected as it
worked directly with the software package used to align DNA sequences on a PC running
Windows 7. Initial analyses allowed the exploration of different models and check sequences
applicability for this research. Subsequently, MrBayes 3.2.2 software (Huelsenbeck and
Ronquist, 2001; Ronquist and Huelsenbeck, 2003) was used on a PC running Windows 8.1 to
undertake the final Bayesian analyses that are presented here. FigTree (version 1.4 developed
by Andrew Rambaut; Available from http://tree.bio.ed.ac.uk/) was used to interpret MrBayes
outputs and generate trees on a PC running Windows 8.1.
Molecular Evolutionary Genetics Analysis (MEGA6) software (version 6.0.5; Available from
http://www.megasoftware.net/) (Tamura et al., 2013) was used for multiple analyses
including: identification of the best-fit model of DNA evolution for ML and BI analyses; MP and
ML analyses; and building all trees presented here on a PC running Windows 8.1.
ITS and trnL-trnF regions
DNA sequences were imported into Geneious software for assembly using the default settings.
Following assembly of complementary strands, sequences were manually checked to verify
software base-calling and edit where necessary. Assembly failed for many of the herbarium
specimens sampled.
Assembled sequences for each region (ITS1, ITS, trnL and trnL-trnF) were aligned, respectively,
in Geneious software using the default settings. Following alignment, the consensus sequence
for ITS and trnL-trnF regions were used to perform two separate megaBLAST (Morgulis et al.,
2008) searches of GenBank (Benson et al., 2013) from within Geneious returning a maximum
of 1000 sequences per search. The sequences returned were sorted by species and all Cordia
and Varronia sequences were selected for each region, respectively, and added to Geneious
workspace for further analyses.
Separate visual assessments were undertaken for aligned sequences generated by this study
and combined alignments of sequences from this study and GenBank for each region to
compare base calling and length of sequences. Sequences from either source that were found
to be largely incomplete (missing >75 bp) or had a high proportion of ambiguous bases were
excluded from subsequent analysis. The latter was specifically undertaken for GenBank
sequences as the source sequences are not visible and it is therefore not known if the base
calling/editing was poor or the bases did not agree due to variation in copies of the region.
Heliotropium angiospermum Murray was selected as outgroup for all analyses using GenBank
samples HQ286121 (ITS) and HQ286151 (trnL-trnF).

119
3.2.3. Statistical analyses
Initial analyses of ITS and trnL-trnF regions were undertaken using the MrBayes plugin
developed for Geneious software. Trees for each region were built using the GTR substitution
model and default settings. The initial trees were used to assess sequence quality and taxon
identification, particularly for GenBank sequences. Multiple GenBank sequences representing
the same taxa that passed both visual alignment and initial tree inspection were excluded
leaving a single representative sequence for the analyses. Initial analyses of OTU placements
showed some conflict between nrDNA and pDNA markers; therefore, four separate analyses, A
to D, were undertaken. Analysis A used ITS1 data for 121 sequences with an aligned sequence
length of 287 bp. Analysis B combined all ITS data (ITS1, 5.8s and ITS2) from 92 sequences with
an aligned sequence length of 705 bp. Analysis C used trnL data from 47 sequences with an
aligned sequence length of 486 bp. Analysis D used all trnL-trnF data from 28 sequences with
an aligned sequence length of 920 bp.
Bayesian analysis for the first four analyses, A-D, using MrBayes plugin for Geneious was
performed separately with the GTR model, priors of unconstrained branch lengths of 10 and a
random starting tree. Two simultaneous four chain (three heated, one cold) MC3 analyses were
run with 0.02 chain temperature for 900,000 generations sampling one tree each 200
generations. Burn-in was set at 100,000 and Gamma distributed (+G) rates. The resulting trees
were consulted within Geneious (Figure 49) before further analyses were undertaken.
Figure 49: Nucleotide alignment generated in Geneious following initial Bayesian analysis showing minimal
variation in bases across the trnL region.
Following the initial four analyses, A-D, it was determined that a fifth analysis, E, should also be
undertaken with the combined ITS and trnL-trnF data generated by this research. Twenty-five

120
sequences for both regions were available along with GenBank outgroup, Heliotropium
angiospermum, which resulted in a combined alignment of 26 taxa totalling 1625bp. Base
change calculations were undertaken using MEGA6 for analyses A-E to explore the differences
between sequences per taxa. All positions containing gaps and missing data were eliminated.
Programme specific, formatted files (i.e. .nex, .meg) for the five analyses, A-E, were exported
from Geneious to enable MP, ML and BI analyses in external software packages. Nucleotide
substitution model selection for ML and BI analyses was undertaken to identify best-fit models
for the five separate analyses (Table 8). Using MEGA6, three different best-fit models were
selected K80, HKY85 and T92 for the ML analyses A/B, C/D and E in MEGA6 software,
respectively. The same models were used for BI analyses in MrBayes software except for
analysis E where the partitioned regions of ITS and trnL-trnF were run using separate models,
K80 and HKY85, respectively. Models for all analyses were selected based on low statistical
modelling scores and the ability to implement the model in software packages used for
phylogenetic estimations.
Table 8: DNA substitution models used in this research per model type and analysis.
Analysis ML models BI models
A K80, +G K80, +G
B K80, +G K80, +G
C HKY85, +G HKY85, +G
D HKY85, +G HKY85, +G
E T92, +G K80, +G; HKY85, +G Maximum parsimony (MP) analysis and bootstrapping (n = 1000) was undertaken for the five
separate analyses, A-E, using MEGA6. MP was performed with complete deletion of
gaps/missing data and tree inference was undertaken using ten initial trees made randomly
and default search level settings.
MEGA6 was also used for maximum likelihood (ML) analysis and bootstrapping (n = 1000) for
the five separate analyses, A-E. Analyses A and B used the Kimura 2-parameter (K80) model,
Gamma distributed (+G) with five discrete categories and complete deletion of gaps/missing
data. The initial tree for ML was made automatically using default settings with very strong
branch swap filter. Analyses C/D and E only differed in model selection with HKY85 and T92,
respectively.

121
Bayesian Inference (BI) analysis for the five separate analyses using MrBayes was performed
separately with uniform priors and a random starting tree. Two simultaneous five chain (four
heated, one cold) MC3 analyses were run with 0.04 chain temperature for 20,000,000
generations sampling one tree each 1000 generations. Burn-in was set at 25,000 and Gamma
distributed (+G) rates. To verify convergence on the same likelihood, Bayesian analyses were
repeated twice. Analyses A and B used the K80 model. Analyses C and D used HKY85. Analysis
E contained partitioned data for ITS and trnL-trnF; therefore, the models K80 and HKY85 were
implemented on the partitioned regions, respectively.
Consensus trees from BI analyses were first viewed in FigTree software and then exported in
Newick format for viewing in MEGA6. Consensus trees from MP and ML were consulted
directly in MEGA6. Graphics showing bootstrap (MP and ML) and posterior probability (BI)
percentages shown here were produced in MEGA6.
3.3. Results Assembly failed for many of the herbarium specimens sampled due to poor amplification of
degraded DNA, most likely caused by preservation and storage techniques (Golenberg et al.,
1996). Extracted DNA from type specimens of V. rupicola and V. bahamensis was successfully
re-run to sequence only the trnL and ITS1 regions. Thirty-three new sequences were generated
for both the ITS1 and trnL regions (Appendix 4: New samples used for phylogenetic analysis).
For the entire ITS and trnL-trnF regions, 28 and 27 new sequences were generated,
respectively. In total, 168 sequences were selected for analysis with 102 of those coming from
GenBank (Appendix 5: GenBank sequences used in phylogenetic analysis). Those from
GenBank included 88 ITS1, with 64 of those also covering the entire ITS region, 14 trnL
sequences and only one covering the entire trnL-trnF region.
Following Chase et al. (2000), bootstrap support is provided for MP and ML analyses
undertaken with the following category descriptions: weak (50-74%); moderate (75-84%);
strong (>85%). The category descriptions of posterior probabilities for BI analyses follow
Duangjai et al. (2009): high support (>94%); moderate support (50–94%); weak support
(<50%). Numbers of differences in the following text refers to base change calculations used to
estimate evolutionary divergence between sequences of V. rupicola and all others.
3.3.1. Geneious analyses
Initial analyses of the ITS and trnL-trnF regions using MrBayes plugin for Geneious showed a
well-supported (100%PP), monophyletic Varronia. However, there appeared to be conflict
between nrDNA and pDNA markers for the relative placement and closest relatives of Varronia
rupicola. This was probably due to limited divergence, especially in pDNA, and is probably due

122
to recent hybridisation events. This potential conflict and difference in sequence length and
number of available samples in each of the nrDNA and pDNA regions resulted in five separate
analyses, A-E (Table 9).
Table 9: Statistical analyses of sequence data by analysis and data source. “Combined” refers to sequences from
GenBank with new sequences generated by this research; “This study” refers to new sequences generated by this
research alone. Calculations of identical sites, pairwise identity and GC percentage were not performed for
Analysis E as this would not be informative.
Four Bayesian analyses using the MrBayes plugin for Geneious were attempted. Due to
computational limitations (lack of available memory on ageing hardware) posterior
probabilities files were not generated for analysis B or D even though consensus trees were
generated. ML and MP analysis using Geneious was not possible due to limited
functionality/lacking additional software. For these reasons, final analyses were undertaken
outside of the Geneious platform and are reported in the next section.
3.3.2. ITS and trnL-trnF final analyses
After deleting gaps and missing data, analyses A through E involved 178, 511, 453, 837 and
1415 positions in the final dataset, respectively. Limited divergence in Caribbean Varronia
species, especially in pDNA, and specific variation is discussed below for each analysis. MP, ML
and BI analyses were undertaken for all five datasets and are reported below by analysis.
Analysis A - ITS1
Strongly supported clades using analysis group A (Figure 50) are shown for Varronia, MP (94%),
ML (97%) and BI (100%), as well as Cordia, MP (81%), ML (86%) and BI (100%), across all
analyses. There is minimal variation in the OTUs between MP, ML and BI analyses. Type
specimen sequences for V. rupicola (samples 3B2 and 4B2) and V. bahamensis (sample 74B2)
resolved in the same clade as sequences of living and recently dead plants curated under the
same names. Varronia rupicola and V. bahamensis sequences showed zero differences, and
using all three analyses (MP, ML and BI), were sister to V. bellonis (one difference). The
Analysis Source # sequences Length Identical sites % Identical Pairwise % identity GC% of non-gapsA Combined 121 287 83 28.9 83.1 53.4
This study 33 274 147 53.6 89.5 54.0B Combined 92 705 286 40.6 84.1 55.7
This study 28 683 411 60.2 88.7 55.0C Combined 47 486 406 83.5 96.6 33.6
This study 33 477 429 89.9 97.8 34.1D Combined 28 920 772 83.9 96.9 34.3
This study 27 905 801 88.5 97.4 34.8E Combined 26 1625 ‒ ‒ ‒ ‒
This study 25 1588 ‒ ‒ ‒ ‒

123
positions of V. lima (six differences) and V. nesophila (two differences) changed considerably
between the three analyses.
Figure 50: Bayesian analysis A consensus tree showing the Varronia clade with branch numbers as posterior
probability (PP) percentages and PP values <50% not shown. Cordia s.s. has been compressed to show detail of
the Varronia clade with H. angiospermum as outgroup. Numbers/letters following specific epithets are either
sample numbers for this research or GenBank numbers and correspond to Appendix 4 or 5, respectively.
Analysis B - entire ITS region
Analysis group B also showed strongly supported clades (Figure 51) across the analyses for
Varronia, MP (99%), ML (99%) and BI (100%), as well as for Cordia, MP (81%), ML (61%) and BI
(95%). There is minimal OTU variation between MP, ML and BI analyses. Varronia rupicola and
V. bahamensis sequences showed one difference and were shown in a well-supported clade in
all three analyses. The positions of V. bellonis (one difference), V. lima (17 differences) and V.
nesophila (13 differences) changed considerably between the three analyses.

124
Figure 51: Maximum parsimony analysis B consensus tree showing the Varronia clade with branch numbers as
bootstrap percentages and BS values <50% not shown. Cordia s.s. has been compressed to show detail of the
Varronia clade with H. angiospermum as outgroup. Numbers/letters following specific epithets are either sample
numbers for this research or GenBank numbers and correspond to Appendix 4 or 5, respectively.
Analysis C - trnL
Strongly supported Varronia clades (Figure 52) were shown for analysis C across MP (99%), ML
(98%) and BI (100%); however, Cordia is not resolved. There is minimal variation in the OTUs
between the three analyses with V. rupicola sequences showing two differences with V.
bahamensis and V. lima and not resolved in a clade in any of the analyses. Varronia rupicola
was resolved in a well-supported clade with V. bellonis and V. nesophila (both with zero
differences) in all analyses.

125
Figure 52: Bayesian analysis C consensus tree showing all clades with H. angiospermum as outgroup with branch
numbers as posterior probability (PP) percentages and PP values <50% not shown. Numbers/letters following
specific epithets are either sample numbers for this research or GenBank numbers and correspond to Appendix 4
or 5, respectively.

126
Analysis D – entire trnL-trnF region
Similar to Analysis group C, Cordia was not resolved in any analysis of group D, whereas all
analyses showed a strongly supported (Figure 53) Varronia clade (100% for MP/ML/BI). There
is minimal variation in the OTUs between MP, ML and BI analyses. Varronia rupicola and V.
bahamensis sequences showed two differences and were not resolved in a clade in any of the
three analyses. Varronia rupicola was resolved in a well-supported clade in the three methods,
sister to V. bellonis (zero differences) and V. nesophila (zero differences). Varronia lima (three
differences) was resolved near V. bahamensis in all analyses.
Figure 53: Bayesian analysis D consensus tree showing all clades with H. angiospermum as outgroup with branch
numbers as posterior probability (PP) percentages and PP values <50% not shown. Numbers/letters following
specific epithets are either sample numbers for this research or GenBank numbers and correspond to Appendix 4
or 5, respectively.

127
Analysis E - combined ITS and trnL-trnF
Strongly supported clades (Figure 54) across all three analyses for Varronia (100% for
MP/ML/BI) and Cordia (MP (80%) ML (53%) and BI (57%)) were shown for analysis group E.
There is negligible variation in the OTUs between MP, ML and BI analyses. Varronia rupicola
and V. bahamensis sequences showed four differences and were shown in a well-supported
(MP (96%), ML (95%) and BI (100%)) clade in all analyses. The positions of V. bellonis (14
differences), V. lima (21 differences) and V. nesophila (18 differences) changed minimally
between the three methods.
Figure 54: Maximum parsimony analysis E consensus tree showing the Varronia clade with branch numbers as
bootstrap percentages and BS values <50% not shown. Cordia s.s. has been compressed to show detail of the
Varronia clade with a GenBank selected outgroup, H. angiospermum. Numbers/letters following specific epithets
are either sample numbers for this research or GenBank numbers and correspond to Appendix 4 or 5,
respectively.
3.4. Discussion and conclusions Varronia rupicola has been traditionally placed in Boraginaceae s.l. subfamily Cordioideae
based on morphological characters. Sixty-seven Varronia species were listed by Acevedo-
Rodríguez and Strong (2012) as native to the Caribbean, nine of which are native to the Puerto
Rican Bank. Sequences were not available from three of these species for any analyses: V.
linnaei (Stearn) J.S.Mill., V. portoricensis (Spreng.) Feuillet and V. wagnerorum (R.A.Howard)

128
Borhidi. Sequences of one other species, V. curassavica Jacq., were not available for analyses
C, D and E. Inclusion of sequences from these species in future research is recommended.
The initial conflict observed between nrDNA and pDNA regions for the OTUs led to separate
analysis for ITS and trnL-trnF regions. Weeks et al. (2010) found similar conflict for Galapagean
Varronia species and suggested that this conflict was probably due to hybridisation events and
the differences in inheritance seen between the maternally inherited trnL-trnF pDNA region
and bi-parentally inherited ITS nrDNA region. Subsequent interpretation of phylogenetic trees
and the number of base differences per sequence generated by this research suggested that
combined analyses of nrDNA and pDNA markers should be undertaken as most of the issues
with OTUs were due to excessive branch swapping as a result of very low divergence. Similarly
low levels of infrageneric pairwise sequence variation for both regions have been seen in
Mediterranean Cistaceae (Guzmán and Vargas, 2005) and Resedaceae globally (Martín-Bravo
et al., 2007) as well as specifically for the trnL-trnF region in Korean Citrus (Jung et al., 2005).
3.4.1. Phylogenetic relationships
The outgroup, Heliotropium angiospermum, was chosen as previous studies have shown
Heliotropium sister to Cordia s.l. (Gottschling et al., 2001). All phylogenetic trees presented
here using ITS and trnL-trnF regions confirm that V. rupicola is a part of the monophyletic
genus Varronia with >94%BS or 100%PP, depending on analysis group and method (Table 10).
Given the data generated, V. rupicola and several closely related species appear to be of
relatively recent hybrid origin. Determining if V. rupicola is a distinct taxon and its placement
was complicated by low divergence, especially in the trnL-trnF region of pDNA. Similar results
have been explored in other groups (e.g. Pinus) using multiple low-copy nuclear loci (Syring et
al., 2005) without fully resolving the issue.
Table 10: Support values for monophyletic Cordia s.s. and Varronia by analysis method with dashes (‒) in analysis
C and D denoting Cordia s.s. was not resolved as monophyletic.
Character-
state
method
Analysis A Analysis B Analysis C Analysis D Analysis E
Cord
ia
s.s.
Varr
onia
Cord
ia
s.s.
Varr
onia
Cord
ia
s.s.
Varr
onia
Cord
ia
s.s.
Varr
onia
Cord
ia
s.s.
Varr
onia
MP (BS%) 81 94 81 99 ‒ 99 ‒ 100 80 100
ML (BS%) 86 97 61 99 ‒ 98 ‒ 100 53 100
BI (PP%) 100 100 95 100 ‒ 100 ‒ 100 57 100

129
ITS region (ITS1, 5.8s and ITS2)
Based on ITS, nrDNA shows highly supported clades for Varronia and Cordia. Type specimen
sequences for V. rupicola and V. bahamensis resolved in the same clade as sequences of living
and recently dead plants of the same names in analysis A. Variation in the OTUs between MP,
ML and BI analyses, especially evident for ITS1, appears to be the result of excessive branch
swapping due to low divergence. This suggests the region is useful for intergeneric studies
while it has a limited ability to be used for inter- and intraspecific studies. Additional bases
from 5.8s and ITS2 resulted in better resolution demonstrating good interspecies, but still
limited intraspecific, usefulness. For V. rupicola and V. bahamensis, well-supported clades
were resolved in all three analyses (MP, ML and BI) for the two species with placement
support (BS/PP) ranging widely (Table 11).
Table 11: Support values for monophyletic V. rupicola and V. bahamensis by analysis method with asterisks (*)
denoting V. rupicola and V. bahamensis are in a supported (>50% BS) clade. Analyses A, C and D are not shown as
BS/PP% values were <50% and/or V. rupicola and V. bahamensis were not resolved as monophyletic.
Character-state method
Analysis B Analysis E V. rupicola V. bahamensis V. rupicola V. bahamensis
MP (BS%) 72* 80* 98* 90* ML (BS%) 57* 64* 97* 95* BI (PP%) 96* 58* 99* 75*
Sequences of several other species of Varronia and Cordia are presented here for the first
time. The positions of OTUs often changed considerably between the three analyses methods
(MP, ML and BI); however, sequences curated under the same name resolved in the same
clade in each analysis suggesting that naming of the material is accurate. GenBank sequences
also held under the same name, or synonyms (e.g. V. globosa is a synonym of V. bullata),
resolved in the same clade as sequences generated by this research.
trnLUAA intron – trnFGAA spacer
Cordia is not resolved using pDNA in any of the analyses (MP, ML and BI). This is probably due
to the small sample size but it may point to a bigger systematic query. Either way, further
analyses are recommended using more sequences and other regions as discussed later.
Conversely, a strongly supported Varronia clade is resolved in all three methods. Type
specimen sequences in analysis C for V. rupicola and V. bahamensis resolved in the same clade
as sequences of living and recently dead plants curated under the same names. Zero
differences between V. rupicola, V. bellonis and V. nesophila resulted in a well-supported clade
in the three methods. Unlike nrDNA, V. rupicola and V. bahamensis sequences were not

130
resolved as sisters in a clade in any of the three methods. Varronia lima resolved near V.
bahamensis in all three methods of both analyses C and D.
As with nrDNA analyses, pDNA sequences of several other species of Varronia and Cordia,
presented here for the first time, showed considerable variation in OTU positions; however,
resolution in the same clade for sequences curated under the same name was seen across all
analyses. This also held true for GenBank sequences also held under the same name, or
synonyms.
Combined analysis of ITS and trnL-trnF data
All sequences used in analysis E were generated in this research. With few exceptions and only
for more widespread taxa, sequences of these species were not already available in GenBank.
Those available did not cover all of the ITS and trnL-trnF regions; therefore, sequences
generated in this research are new contributions for these species that will be made available
to the scientific community through GenBank.
Most Varronia sequences used for the analyses in this research form clades with low levels of
sequence variation, a potential indicator of the recent diversification of this group. Many
clades have low bootstrap proportion (BP), especially for analyses A-D, and the OTU positions
vary between the three analysis methods. Rogue taxa with an unstable position in the clade
due to an elevated substitution rate causing homoplasy or extremely low rates inside and
outside the clade can all cause low BP (Sanderson and Shaffer, 2002). There was no obvious
evidence of ribosomal paralogy (Feliner and Rosselló, 2007) observed in this research;
therefore, ITS sequence data have been interpreted as orthologous.
As discussed by Baldwin (1992), comparison of phylogenetic trees generated from pDNA and
nrDNA can help identify problems associated with cytoplasmically inherited DNA through
introgression and hybridisation events. All three analysis methods (MP, ML and BI) show
strongly supported clades (illustrated in Figure 55 for convenience) for Varronia and Cordia
and negligible variation is observed in the resolution of OTUs in analysis E when compared to
other analyses, A to D. Varronia rupicola and V. bahamensis were resolved in a well-supported
clade (see Table 11) using all three methods (MP, ML and BI) with positions of V. bellonis, V.
lima and V. nesophila changing minimally and apparently as a result of swapping due to low
divergence. This suggests that the reconstructed phylogenetic tree is a fair estimate of the
species relationships (Feliner and Rosselló, 2007).

131
Figure 55: Maximum parsimony consensus tree for analysis E showing 25 sequences generated by this research
with a GenBank selected outgroup, H. angiospermum, branch numbers as bootstrap percentages and BS values
<50% not shown. Numbers/letters following specific epithets are either sample numbers for this research or
GenBank numbers and correspond to Appendix 4 or 5, respectively.
3.4.2. Recommendations for further research
Minimal base change differences observed between sequences of V. rupicola, V. bahamensis,
V. bellonis, V. lima and V. nesophila and their placement in the trees resolved in this research
suggest that further analyses incorporating new markers should be undertaken using a
broader group of taxa, particularly insular Caribbean species of Varronia. This would provide
the opportunity to explore the relationships of these species with more resolution and identify
potential parents for hybrid species. Of particular interest is the resolution of V. nesophila,
endemic to the Lesser Antilles and sampled on the island of Montserrat, and the Puerto Rican
endemic, V. bellonis, as sister species. A similarly intriguing situation is observed for the
widespread (Caribbean, Central and South America) species, Cordia collococca, and the Puerto
Rican endemic, C. borinquensis. Sequence variation was observed between samples of the PRB
endemic, C. rickseckeri, collected in the countries of Puerto Rico and the British Virgin Islands.
132
Further analyses are recommended for all of the aforementioned species using samples from
across their range.
Infrageneric groups were distinguishable from the data provided; however, further sampling of
a broader group of taxa would be required to resolve Cordia based solely on pDNA. Further
work is required to fully resolve the interspecific relationships in the focal group of Caribbean
Varronia and a total evidence approach is recommended. Other pDNA regions (e.g. matK, trnS-
trnG spacer and the group II rpl16 intron) should be explored. The rpl16 intron could be
especially useful as group II introns can be excellent phylogenetic tools due to their inability to
move, high rate of evolution and ease of amplification (Small et al., 1998; Kelchner, 2002).
Shaw et al. (2005) found the trnS-trnG spacer to have the highest number of potentially
informative characters (PIC) across 21 non-coding pDNA regions sampled. In Heliotropium,
matK has proven to be more informative than rbcL for interspecific studies (Frohlich, pers.
comm. 2014).
There are also other non-coding, low-copy (e.g. ETS) or single-copy nrDNA genes (e.g. chalcone
synthase (CHS)) that could be explored. However, there are several considerations to take into
account, especially the additional time required for sequencing most nrDNA other than ITS
(Small et al., 1998; Calonje et al., 2008). Non-concerted evolution in ETS has been well
documented and requires additional investigation prior to tree building to determine
orthology or paralogy (Bailey et al., 2003). Nuclear granule-bound starch synthase gene (GBSSI,
or waxy) has been used is several studies and provided phylogenetic resolution in Poaceae and
Rosaceae (Mason-Gamer et al., 1998; Evans et al., 2000) as has the nuclear-encoded alcohol
dehydrogenase loci (Adh); however, additional effort is required to demonstrate orthology and
caution is required due to possible concerted evolution for these regions of nrDNA (Small et
al., 1998; Feliner and Rosselló, 2007; Calonje et al., 2008).
Given the above factors influencing nrDNA analysis and the results of this research, the next
recommended steps are to undertake further pDNA analysis prior to exploring any nrDNA
regions.
3.4.3. Main conclusions
Miller and Gottschling (2007) resurrected Varronia using morphological, geographical and
molecular data from ITS1 only. The findings of this study (illustrated in Figure 56 for
convenience) using new samples support a monophyletic Varronia using sequence data from
ITS, trnL-trnF and combined ITS/trnL-trnF regions. This research also supports a monophyletic
Cordia using sequence data from ITS and combined ITS/trnL-trnF regions only as the trnL-trnF
region was not able to resolve the genus. The inability to resolve Cordia using the trnL-trnF

133
region solely may be due to hybridisation events that give rise to polymorphisms that are not a
result of normal variation (Taberlet et al., 1991). Based on ITS and combined ITS/trnL-trnF
regions data, Varronia rupicola is a distinct species endemic to the Puerto Rican Bank. The
closest relative of V. rupicola sampled is V. bahamensis, an endemic to the Bahaman
Archipelago.
Further species sampling should be incorporated into the existing ITS and trnL-trnF matrices to
produce new phylogenetic trees from across the range of the species. New and existing
samples should be used to undertake further pDNA analyses using new regions (i.e. matK,
trnS-trnG spacer and the group II rpl16 intron) to produce informative phylogenetic trees.
Figure 56: Maximum likelihood analysis E consensus tree showing the Varronia clade with branch numbers as
bootstrap percentages and BS values <50% not shown. Cordia s.s. has been compressed to show detail of the
Varronia sequences generated by this research with a GenBank selected outgroup, H. angiospermum.
Numbers/letters following specific epithets are either sample numbers for this research or GenBank numbers and
correspond to Appendix 4 or 5, respectively.

134
Chapter 4: Conservation genetics of Varronia rupicola This chapter aims to provide answers for a series of important questions for the conservation
and management of V. rupicola genetic diversity.
• First, are populations on the islands of Anegada, Vieques and Puerto Rico genetically
distinct from one another?
• Second, are there genetically distinct populations found within any of the islands?
• Third, has genetic diversity been impacted by a reduction in population size?
• Fourth, do existing ex-situ collections adequately represent the extant genetic diversity
of wild populations?
• Fifth, do existing ex-situ collections or samples from historical specimens reveal a loss
of wild genetic diversity?
4.1. Introduction Research presented here is the first step toward a better understanding of the genetic
diversity and demography of V. rupicola for developing a scientifically underpinned species
conservation and management strategy. Developing comprehensive ex-situ collections,
effective in-situ conservation areas and appropriate management options for the future
requires a fundamental understanding of the genetic diversity for a species of conservation
concern. Recent work by Sanchez et al. (2014) for the Caribbean pine demonstrates the
importance of establishing conservation collections to capture genetic diversity in the face of
current and future threats to the species in the wild. Lacking in-situ conservation areas and
effective management in areas that do exist are known to be adversely impacting V. rupicola
on the islands of Puerto Rico and Vieques (U.S. Fish and Wildlife Service, 2014b).
There are no known studies of the genetic variation or structure of wild populations or ex-situ
collections of V. rupicola. Very few genetic studies have been previously carried out on species
of Varronia or Cordia s.s. in the Neotropics. Those studies particularly focusing on population
genetics methods (Boshier et al., 1995a, 1995b; Chase et al., 1995; Spoon and Kesseli, 2008)
provide very little insight for Caribbean species of Varronia or data for comparative analysis.
This is particularly highlighted by studies focusing on large trees with wide distributions that
are useful for agroforestry (Boshier et al., 1995a, 1995b; Chase et al., 1995) and the lack of
studies reporting the use of microsatellites beyond development and cross-species
amplification (Spoon and Kesseli, 2008).
Using simple sequence repeats (SSRs), or microsatellites, population genetics of wild
populations of V. rupicola were investigated to determine demographic patterns as well as

135
gene flow and diversity. Microsatellites were also used to evaluate genetic diversity of ex-situ
collections and compare with wild populations. This enables an assessment of the
representativeness of existing conservation collections held for the species globally.
Microsatellites are used for the study of populations as they tend to have little or no influence
on phenotypic expression thus making them selectively neutral. This means that SSRs can
generally provide genetic estimates that are not influenced by the process of natural selection
(Silvertown and Charlesworth, 2001). The highly polymorphic nature of SSR regions (Zhang and
Hewitt, 2003) is due to mutations that mainly result from recombination or misalignment
during DNA replication (Schlötterer, 2000; Navascués and Emerson, 2005) and is what enables
the detection of within population genetic drift and gene flow between populations (Fischer et
al., 2000; Ouborg et al., 2010).
Microsatellite regions are amplified with polymerase chain reactions (PCR) using specific
oligonucleotide primers. The primers are developed in pairs to guide microsatellite loci
amplification by binding to the conserved regions flanking the microsatellite. Following
amplification, microsatellites can be analysed using capillary electrophoresis. Important
considerations for evaluating microsatellite variation data are geographical factors such as
barriers between sampling locations, historical factors like sea-level fluctuations and
anthropogenic factors like land-use. These can play important roles in limiting gene flow in a
metapopulation leading to fragmentation and isolation which can, in turn, lead to differences
among populations and increase with time. Population fragments show a decline in
heterozygosity and allelic frequencies. This is exacerbated in species occurring on islands that
are already limited by physical environmental factors and increases the risk of extinction
(Frankham et al., 2002).
Many research fields have successfully employed the use of microsatellites and shown that the
small length, abundance, multiple alleles and co-dominant inheritance are useful for
demonstrating genetic structure and diversity across populations (Powell et al., 1996;
Chistiakov et al., 2006; Fernandez-Silva et al., 2013). Species-specific microsatellites were
chosen for this study as they are much less susceptible to cross-contamination issues that can
occur when using universal primer techniques like AFLP (Selkoe and Toonen, 2006). This
coupled with the advances in next-generation sequencing that have brought the costs
associated with developing bespoke oligonucleotide primers down and reducing the time
investment necessary to select polymorphic primers (Rothberg and Leamon, 2008; Wheeler et
al., 2008; Fernandez-Silva et al., 2013) supported this decision. All DNA samples were
extracted and genotyped by the author in the Jodrell Laboratory, Kew as described below.

136
To explore population differentiation, Wright (1943, 1965) developed the now widely used F-
statistics to calculate the fixation indices FIT, FST and FIS. F-statistics infer population structure
(FST) based on the equation, FST = (FIT-FIS)/(1-FIS), as well as mating system and inbreeding (FIS
and FIT). Another important methodological development was made by Slatkin (1993) to test
the hypothesis of isolation by distance (IBD). This is undertaken using regression analysis of
matrices containing geographical distances (km) between paired populations and pairwise
population genetic differences (FST).
Several software packages are available for exploring genetic diversity through estimation of
allelic frequencies and population structure through clusters. Excoffier and Heckel (2006)
provide a comprehensive review of these packages highlighting each program’s assumptions
and common problems encountered. A major limitation of many packages is the fact that most
can only process haploid or diploid data with a maximum of two alleles per sample. According
to Guillot (2005a) the popular packages that undertake cluster analyses for estimating
population structure assume there is the idealised state of Hardy-Weinberg equilibrium (HWE)
and linkage equilibrium (HWLE). In wild populations, the HWLE principle of genetic variation
remaining constant might not be realised due to drift, inbreeding, migration and selection.
Another important factor to consider when estimating populations is the effect of IBD. For
these reasons, estimations of IBD, inbreeding and overall genetic variation need to be
undertaken to make informed estimations of the population structure of a species.
An idea of the ploidy of the species being studied is needed to interpret results from
population level analysis (i.e. alleles observed); however, this can be complicated by genome
restructuring and gene silencing with the latter resulting in diploidisation of a polyploid (Soltis
and Soltis, 1999). As discussed in 1.4.3. The genus Varronia, the tendency of Cordia s.l.
chromosomes to stick together has resulted in sparse karyological data for the group (Britton,
1951; Heubl et al., 1990). Opler et al. (1975) stated that the ancestor of extant Cordia s.l. was
probably adapted to lepidopteran pollination and heterostylous. Three main evolutionary lines
for Cordia s.l., x = 7, 8 and 9, as well as a derived complex, x = 15, were described by Heubl et
al. (1990) who found all Varronia studied to be diploid or tetraploid. These Varronia were
derived from x = 9 and although diploid taxa are present within the group, Heubl et al. (1990)
considered Varronia a relatively young and advanced group.
4.2. Materials and Methods
4.2.1. Karyology
In order to interpret genetic data from microsatellites, the ploidy of V. rupicola had to be first
explored. To determine if the species was a diploid or polyploid and if more than two alleles

137
could be expected per nuclear microsatellite marker, different methods were employed. First,
traditional karyotyping and then modern flow cytometry methods were undertaken as
described below.
Karyotyping
Fresh root samples from cultivated plants of V. rupicola growing at the Royal Botanic Gardens,
Kew were used to undertake Feulgen staining techniques described in Kynast et al. (2014).
Root tips, 1.5 to 2 mm in length, were collected from nursery grown plants between 08:00 and
10:00, to increase the number of cells at metaphase, into vials containing 2.5 ml sterile
deionised water (sdH2O) for transport to laboratory facilities where they were processed
immediately. Root tips were carefully cleaned with a fine tip brush to remove soil/debris
before being transferred into vials containing 4 ml of pre-treatment solution #12, consisting of
1:1 mix of 4xpre-treatment solution #1 (5 mM colchicine): Pre-treatment solution #5 (para-
dichlorobenzene saturated solution). Vials with root tips were stored at 3 °C for seven hours as
a pre-treatment. Fixation was undertaken using a Modified Farmer's Fixative, consisting of a
3:1 mix of three volume parts of 96%v/v ethanol: one volume part of glacial acetic acid. Fixed
material was stored at 4 °C until processed using the Feulgen staining technique to selectively
stain DNA.
Fixed roots were rinsed in ~15 ml SDH2O at 20 °C for 20 minutes to remove fixative from the
tissues. Next, roots were hydrolyzed in ~10 ml of 1 M HCl at 60 °C for seven minutes to remove
purine bases from DNA and macerate the root tissues. Roots were then stained in ~2 ml of
Schiff’s reagent at 20 °C for 20 minutes. Following staining, the root tip was dissected to
remove the root tip shield cells (not stained) and the stained meristem before squashing the
meristem in 1% lacto-propiono-orcein (LPO) for contrast enhancement. The squashed
meristem was viewed using microscopy to locate chromosomes at mitotic metaphase for
counting.
Flow cytometry
Fresh leaf samples from cultivated plants of V. rupicola and V. bahamensis growing at the
Royal Botanic Gardens, Kew (Kew) were used to undertake flow cytometry techniques as
described in Dolezel et al. (2007). Leaves were collected from nursery grown plants into sealed
plastic bags for transport to laboratory facilities where they were stored at 3 °C until
processed. Following initial trials, Allium sativum L. was selected as the standard using the
General Plant Buffer (GPB) adjusted to pH 7.0, consisting of 0.5 mM spermine 4HCl, 30 mM
sodium citrate, 20 mM 3-(N-morpholino) propanesulfonic acid (MOPS), 80 mM KCl, 20 mM
NaCl, 0.5% (v/v) Triton X-100, on a Partec PA cytometer (Partec, Münster, Germany). Leaf

138
material processing followed a general protocol consisting of ~1cm2 of leaf material cut into a
sterile Petri dish using scissors. Using a pipette, 1000 ul GPB was added to the sterile Petri dish
over the leaf material. A new razor blade was used to finely chop leaf material in the sterile
Petri dish before adding a further 1000 ul GPB. Next, the pipette tip was cut off at 45° angle,
0.5 cm from end to enable the transfer of the buffer and chopped leaf material into a clean
filter where it was allowed to drain into a 3.5 ml tube. Next, 100 ul of propidium iodide was
pipetted into the tube with the GPB and leaf material before vortexing for 30 seconds. The
mixture was allowed to set for 15 minutes before vortexing for a further 30 seconds. The tube
with solution was then visually inspected to ensure no plant debris remained before loading
the tube in the flow cytometer using the protocol supplied by the manufacturer (Partec,
Münster, Germany) to measure the genome size using liberated nuclei.
4.2.2. Next-generation sequencing
Eurofins Genomics (Ebersberg, Germany) performed 454 pyrosequencing for development of
oligonucleotide primers (Margulies et al., 2005) using a V. rupicola sample supplied by the
author from the ex-situ collections of the Royal Botanic Gardens, Kew (accession 2005-1557)
grown from a seed of Anegada, BVI origin. Following commercial sequencing of genomic DNA
extracted by the author, raw data returned was processed using QDD software (Meglécz et al.,
2010). Primer design was undertaken within QDD using Primer3 (Rozen and Skaletsky, 2000;
Koressaar and Remm, 2007; Untergasser et al., 2012) as described below.
DNA Extraction
Fresh leaves were collected and immediately processed using a modified 2×CTAB protocol
(Saghai-Maroof et al., 1984; Doyle and Doyle, 1987; Csiba and Powell, 2006). The amount of 15
ml of 2×CTAB isolation buffer [100mM Tris-HCl pH 8.0, 1.4M NaCl, 20mM EDTA, 2% CTAB
(hexadecyl trimethyl ammonium bromide)] containing 60 µl ß-mercaptoethanol was pipetted
into a Falcon™ (Fisher Scientific UK Ltd, Leicestershire, UK) 50 ml conical centrifuge tube and
heated in a 65 °C water bath. Liquid nitrogen was used to freeze 150 mg of leaf tissue before
grinding in ~2 ml of the pre-heated CTAB buffer using a mortar and pestle. The ground sample
in buffer was added to the tube containing the remaining ~13 ml pre-heated 2×CTAB buffer.
The sample was incubated for 20 minutes in a 65 °C water bath before adding 15 ml of SEVAG
(24:1 chloroform:isoamyl alcohol). It was then rocked for one hour at 20 °C before spinning
down at 8000 rpm for ten minutes at 20 °C. The top clear layer containing genomic DNA was
pipetted into a 50 ml conical centrifuge tube with 5 ml of -20 °C isopropanol, gently mixed and
left to precipitate DNA for three hours at -20 °C. To collect the precipitate, the sample was
spun at 3000 rpm for ten minutes before pouring off the liquid. The remaining DNA pellet was
washed in 3 ml of 70% ethanol for five minutes before spinning down at 3200 rpm for three

139
minutes. All remaining liquid was poured off and the sample left in a fume cupboard for 24
hours to allow complete evaporation.
Genomic DNA was re-suspended in 3 ml of TE buffer (10 mM Tris-HCl pH 8, 0.25 mM EDTA)
and left to dissolve for 24 hours. Nucleospin DNA purification columns were used to purify
extracted genomic DNA following the protocol supplied by the manufacturer (QIAquick,
Qiagen Ltd, Crawley, UK). A Nanodrop (ThermoScientific, Denver, CO) was used to quantify the
amount of genomic DNA in the sample and ensure a suitable quantity (>50 ng/µl) was available
for 454 pyrosequencing.
454 pyrosequencing and primer development
Approximately 64 ng/µl of genomic DNA was sent for sequencing on a Titanium GS-FLX 454
sequencer platform (454 Life Sciences Corporation, a Roche company, Branford, CT, USA). The
raw data, with tags and barcodes already removed, returned from Eurofins Genomics was
quality filtered using the pipeline software package QDD (version 2.1 by Emese Meglecz, Aix-
Marseille University, Marseille, France) on a Linux computer to screen sequences with three or
more di-, tri-, tetra-, penta- or hexabase repeats. Primers were designed using Primer3
(version 1.0) within QDD following removal of redundant sequences. Default settings were
maintained for Primer3 except for product length which was set to 90-300 bp; maximum,
optimum and minimum oligonucleotide sizes set as 27, 20 and 18, respectively; maximum,
optimum and minimum mixture specific melting temperatures (Tm) set at 63.0 °C, 60.6 °C, and
57.0 °C, respectively; maximum difference in Tm for the primers of 10.0 °C; maximum,
optimum, and minimum GC content set at 80%, 50% and 20%, respectively; and no GC clamp.
Following design and removal of all but the highest ranked primers for each region, primers
were ordered from Eurofins Genomics with the M13 tail at the 5’ end of forward primers for
cost savings. Primer testing was undertaken using genomic DNA extracted from silica dried
leaves as described in 3.2.1. Sampling - DNA extraction. Three samples were selected, one
originating from each of the islands of Anegada, Vieques and Puerto Rico, for primer testing
using PCR and genotyping methods described below.
4.2.3. Sampling for population analyses
Dried plant material of various ages was used for population analyses. The vast majority of
samples (374 of 380) came from silica dried leaves (Chase and Hills, 1991; Särkinen et al.,
2012) collected by the author to help ensure high quality DNA was used, minimising
amplification error (Selkoe and Toonen, 2006). Vouchers collected by the author to accompany
silica dried leaves from cultivated and wild plants are deposited at the Kew Herbarium (K) with
duplicates lodged at other herbaria. Vouchers were not collected for every silica sample due to

140
time constraints and the potential negative impact collecting from wild plants may have
caused. All vouchers are listed in Appendix 1: Varronia rupicola records.
Silica dried DNA samples from 260 wild (Figure 57) and 114 cultivated plants were collected. A
summary of samples is provided in Table 12 and a full list of the samples by location is
provided in Appendix 6: Population genetics samples. Samples from six air dried herbarium
specimens held at the Department of Natural and Environmental Resources herbarium (SJ) in
San Juan, Puerto Rico were collected to test for genetic diversity loss. These specimens ranged
in date collected from most recently in 1995 to oldest in 1978.
Figure 57: Map showing Varronia rupicola DNA sample collecting locations (purple square) for samples made
across the species native range in the Puerto Rican Bank including within proposed and existing protected areas
in Anegada (inset top right), Vieques (inset bottom) and south-western Puerto Rico (inset top left).
Ex-situ collections
Through discussion with Puerto Rican Bank colleagues and contacting major botanical
institutions in Europe and the USA, ex-situ collections were identified within the Puerto Rican
Bank, the UK and the USA. Anegada source material has been used to develop collections at
Kew, UK; the Fairchild Tropical Botanical Garden, Miami, Florida, USA; and the J.R. O’Neal
Botanic Garden, Road Town, Tortola, BVI. Source material from the island of Puerto Rico has
been used to develop collections at Kew, UK as well as the Cabo Rojo NWR and the Guánica

141
State Forest, both in Puerto Rico. Every plant held in these ex-situ collections (n = 114) was
sampled (Table 12) unless it was felt that the sampling would be detrimental to the survival of
the plant (e.g. seedlings and unhealthy saplings with few leaves were not sampled in the
Guánica State Forest nursery).
Table 12: Summary of samples used for analyses showing the number of samples by origin of material (Number
of samples by origin) per collecting location (Source island) broken-down by origin of material from extant wild
plants (Extant wild), extant ex-situ plants (Extant cultivated) or herbarium specimens of dead plants (Dried
herbarium). All wild and ex-situ plant material originated from silica dried leaf samples. Herbarium specimen
material originated from air-dried herbarium vouchers.
Source island Number of samples by origin
Extant wild Extant cultivated Dried herbarium Puerto Rico 110 66 3 Vieques 6 0 1 Anegada 144 48 2
Total number of samples 260 114 6
Wild populations
Sampling of the wild populations (Table 12) varied between the British Virgin Islands and
Puerto Rico due to the numbers of extant individuals remaining in each country. The sampling
strategy employed is described in 2.2.1. Survey and sampling of wild populations.
4.2.4. Population sample analysis
DNA sample extraction, amplification and genotyping were undertaken by the author in the
Jodrell Laboratory, Kew. Samples used are reported in Appendix 6: Population genetics
samples. DNA extraction is described in 3.2.1. Sampling - DNA extraction.
Polymerase Chain Reaction (PCR)
To guide amplification of microsatellite loci, 44 primer pairs were selected for testing
(Appendix 7: Oligonucleotide testing). Selections were made after removing all primers
produced by QDD with a target length less than six bases, ranking other than one for “best
primer for target region” and sequences with long strands of repeated bases (e.g. GTTTTT) to
increase the chances of successful amplification. Primers were ordered from Eurofins
Genomics and initially tested against three V. rupicola samples, one from each of the islands
harbouring extant populations, to determine if the loci were polymorphic. Based on melting
temperature, primers were divided into three groups of different annealing temperatures,
Group 1 = 51 °C, Group 2 = 52 °C and Group 3 = 56 °C. As forward primers had the M13 tail at
the 5’ end, primers were also divided for use of either the JOE- (6-carboxy 4', 5'-dichloro-2', 7'-
dimethoxy fluorescein) or FAM- (6-carboxy-fluorescein) labelled M13 primer.
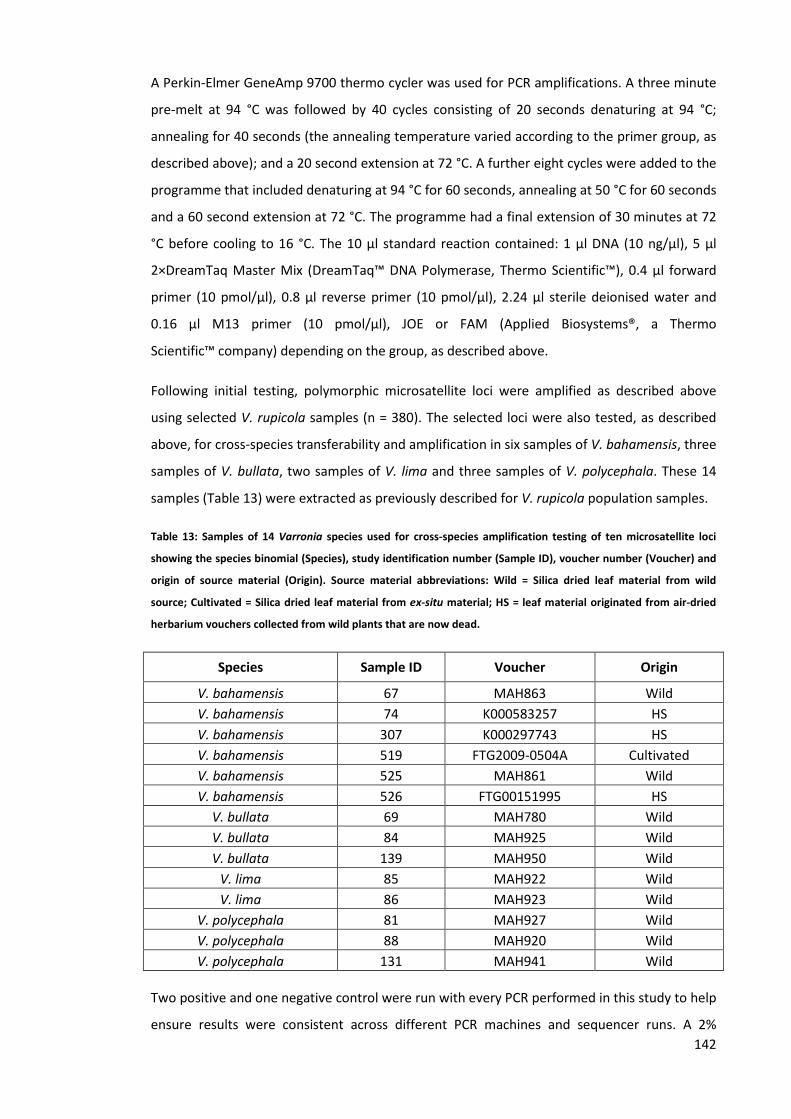
142
A Perkin-Elmer GeneAmp 9700 thermo cycler was used for PCR amplifications. A three minute
pre-melt at 94 °C was followed by 40 cycles consisting of 20 seconds denaturing at 94 °C;
annealing for 40 seconds (the annealing temperature varied according to the primer group, as
described above); and a 20 second extension at 72 °C. A further eight cycles were added to the
programme that included denaturing at 94 °C for 60 seconds, annealing at 50 °C for 60 seconds
and a 60 second extension at 72 °C. The programme had a final extension of 30 minutes at 72
°C before cooling to 16 °C. The 10 µl standard reaction contained: 1 µl DNA (10 ng/µl), 5 µl
2×DreamTaq Master Mix (DreamTaq™ DNA Polymerase, Thermo Scientific™), 0.4 µl forward
primer (10 pmol/µl), 0.8 µl reverse primer (10 pmol/µl), 2.24 µl sterile deionised water and
0.16 µl M13 primer (10 pmol/µl), JOE or FAM (Applied Biosystems®, a Thermo
Scientific™ company) depending on the group, as described above.
Following initial testing, polymorphic microsatellite loci were amplified as described above
using selected V. rupicola samples (n = 380). The selected loci were also tested, as described
above, for cross-species transferability and amplification in six samples of V. bahamensis, three
samples of V. bullata, two samples of V. lima and three samples of V. polycephala. These 14
samples (Table 13) were extracted as previously described for V. rupicola population samples.
Table 13: Samples of 14 Varronia species used for cross-species amplification testing of ten microsatellite loci
showing the species binomial (Species), study identification number (Sample ID), voucher number (Voucher) and
origin of source material (Origin). Source material abbreviations: Wild = Silica dried leaf material from wild
source; Cultivated = Silica dried leaf material from ex-situ material; HS = leaf material originated from air-dried
herbarium vouchers collected from wild plants that are now dead.
Species Sample ID Voucher Origin
V. bahamensis 67 MAH863 Wild V. bahamensis 74 K000583257 HS V. bahamensis 307 K000297743 HS V. bahamensis 519 FTG2009-0504A Cultivated V. bahamensis 525 MAH861 Wild V. bahamensis 526 FTG00151995 HS
V. bullata 69 MAH780 Wild V. bullata 84 MAH925 Wild V. bullata 139 MAH950 Wild
V. lima 85 MAH922 Wild V. lima 86 MAH923 Wild
V. polycephala 81 MAH927 Wild V. polycephala 88 MAH920 Wild V. polycephala 131 MAH941 Wild
Two positive and one negative control were run with every PCR performed in this study to help
ensure results were consistent across different PCR machines and sequencer runs. A 2%

143
agarose gel stained with ethidium bromide was used to visualise PCR products prior to
genotyping.
Genotyping
PCR products (1 µl of each) were added to wells of a 96-well plate each containing 10 µl Hi-Di™
formamide injection solvent and 0.12 µl GeneScan™ 500 ROX™ dye size standard (both from
Applied Biosystems®, a Thermo Scientific™ company). Adhesive plate seals were used to cover
plates prior to six seconds centrifugation. This was followed by heating for four minutes at 95
°C on a dry bath heater. Plates were immediately put on ice for ten minutes before a final six
second centrifugation. Sequencing was performed on an ABI 3730 Genetic Analyser (Applied
Biosystems®, a Thermo Scientific™ company), according to the manufacturers' protocol.
GeneMapper® Software (version 4.1, Applied Biosystems®, a Thermo Scientific™ company)
was used for microsatellite genotyping analyses following the methodology of Papadopulos et
al. (2014). Projects were developed and bins defined by eye for each locus. Sequences of V.
rupicola were added to the projects first to analyse peaks and determine alleles. Automatic
scoring of alleles for each locus performed by GeneMapper was followed by manual
confirmation and any required editing (i.e. due to stuttering). To minimise peak scoring bias,
blind processing was employed using extraction codes. Each sequencer run contained two
positive and one negative control. The control replicates were compared in GeneMapper for
each locus to help ensure results were consistent across different PCR machines and
sequencer runs. Any samples that failed to amplify or had a low signal for a locus were
repeated. Sequences of other Varronia species were added separately to projects for each
locus to assess cross-species amplification without confounding the process of automatic allele
scoring for each locus performed by GeneMapper.
4.2.5. Statistical analyses
To determine if populations between and within the islands were variable and look for
evidence of lost and missing diversity across wild populations and ex-situ collections, statistical
analyses were undertaken within and across the loci. The majority of samples were scored for
all loci. Alleles that only occur in one population, so-called private alleles, are an important
genetic diversity parameter to measure (Kalinowski, 2004). For this reason, those samples
missing data for some of the loci and found to include private alleles for other loci were
retained in the dataset for statistical analyses. The total percentage of missing data for all
samples varied to 6% for locus 'VRgr3_2' and 9% of locus 'VRBREYV'. All other loci had less than
5% missing data and most of these samples were only missing data for one locus.

144
Samples were categorised based on the source of the material and divided into three separate
groups, A-C (Table 14), for undertaking analyses. Origin and source of samples is provided in
Appendix 6: Population genetics samples. Analyses undertaken were subdivided hierarchically
to explore allelic diversity and genetic structure at the regional (i.e. taxon) level as well as the
country and population levels for the analysis groups, A-C. The regional level analyses
encompassed the Puerto Rican Bank including the countries of Puerto Rico and the British
Virgin Islands. Inter-population level analyses initially considered the three islands of Puerto
Rico, Vieques and Anegada due to distance between the islands (>125 km) and current sea
separation (see Chapter 2: Biogeography of Varronia rupicola). Puerto Rico and Anegada were
subsequently further divided to include two populations each (see Appendix 6: Population
genetics samples). These divisions were based on preliminary analyses that inferred population
separation and showed genetic distance (see 4.3. Results).
Table 14: Number of samples included in three analysis groups, A-C, by source of material (extant wild plants,
extant ex-situ plants and dead plants from herbarium specimens) where all wild and ex-situ plant material
originated from silica dried leaf samples and herbarium specimen material originated from air-dried herbarium
vouchers.
Analysis group Description #
samples A Extant wild plants 260 B Extant wild & ex-situ plants 374 C Extant wild, extant ex-situ plants & herbarium specimen samples 380
Genotype data from ten GeneMapper software projects, one per locus, was exported for
analyses and further formatting. Initially, GeneMapper project exports were combined into a
master genotypes table in Microsoft® Excel® 2010 (© 2010 Microsoft Corporation) by sample
number to enable the addition of data fields for sample source (extant wild plants, extant ex-
situ plants or dead plants from herbarium specimens), geographical coordinate data and
locality information. The loci were classified based on the number of alleles per locus. Loci
containing a maximum of two alleles were classed as “diploid-acting” and those with more
than two alleles as “polyploid-acting”. This classification is due to the majority of software
packages only having the ability to analyse data from loci with a maximum of two alleles. The
‘genotypes master table’ of analysis group C enabled data to be further formatted for use with
selected software programmes and software add-ins as described below. All data formatting
and analyses were performed on PCs running Windows® 7 or Windows® 8.1 with 64-bit
operating systems.
The Microsoft Excel 2010 plug-in, Genetic Analysis in Excel ‘GenAlEx’ version 6.5.01 (Peakall
and Smouse, 2006, 2012a), was used to identify allelic diversity. Initially analysis group C

145
samples were used in a regional analysis of the two countries. The region was subsequently
divided by the three islands to explore inter-island diversity. Prior to cluster analyses described
below, GenAlEx enabled the exploration of expected versus observed Hardy-Weinberg
equilibrium (HWE) using analysis group A samples.
CREATE (Coombs et al., 2008) software (version 1.3.7) was used to convert raw data from eight
diploid-acting loci for analysis group A in the genotypes master table into formatted files for
use with FSTAT (Goudet, 1995), Arlequin (Excoffier and Lischer, 2010) and Genetix (Belkhir et
al., 2004) software packages. PGDSpider (Lischer and Excoffier, 2012) software (version
2.0.7.3) was used to further convert files exported from CREATE for use with Geneland (Guillot
et al., 2005a, 2005b, 2008; Guillot, 2008; Guillot and Santos, 2009, 2010; Guedj and Guillot,
2011; Guillot et al., 2012) and Structure (Pritchard et al., 2000; Falush et al., 2003, 2007; Hubisz
et al., 2009) software packages.
PAST (Hammer et al., 2001) software (version 1.0) was used for principal coordinates analyses
(PCoA) based on the algorithm of Davis (1986). PCoA is a multivariate analysis that considers
the entire dataset, regardless of ploidy, and enables the visualisation of among individual
genetic distances (Dufresne et al., 2014). For this research, PCoA enabled the two polyploid-
acting loci to be included in a multivariate analysis along with the eight diploid-acting loci.
Subsequently, the contribution of the two polyploid-acting loci was explored to identify
populations through genetic structure inference. To enable PCoA analyses, genotypic data
from all ten loci for analysis group C was converted into a ‘0,1’ matrix per locus showing
presence/absence for each allele by sample. Geographic coordinate data was added to the
matrix for each sample prior to undertaking PCoA. Sample number and collection locality
information was added to facilitate visualisation of results. Each locus was analysed separately
to check input data formatting before combining data for the ten loci to perform a final
analysis of all extant wild samples (analysis group A). All PCoA analyses were undertaken using
the Jaccard (1901) similarity measure to account for absence data (i.e. multiple occurrences of
zero) within the matrix. The transformation exponent (c = 4) was used for the analysis as initial
trials using higher or lower values (i.e. two or six) showed less resolution.
Clustering analyses were undertaken using Bayesian techniques implementing Markov chain
Monte Carlo (MCMC) methods to detect population boundaries using two software packages,
Geneland and Structure. According to Guillot et al. (2009), these packages share assumptions
about the presence of cluster-specific minimum allele frequencies and cluster members being
at HWLE. Both packages infer the number of populations by identifying genetic discontinuities
and locating the portions of space with the highest likelihood using several different models

146
that are selected by the user. The packages differ in their inference abilities due to the
underlying models. Structure lacks a spatial model and thus the ability to include geographic
coordinates for each sample in the analysis; however, the package does include the
functionality to define collecting locations as a priori (Hubisz et al., 2009). The packages also
differ in their ancestry models. Structure is able to model with or without genetic admixture
(Pritchard et al., 2000), whereas Geneland is only able to model without admixture (Guillot et
al., 2005b). The no admixture model assumes that individuals come purely from a single
population while the admixture model allows for mixed ancestry of individuals. Both packages
are able to model allele frequencies as correlated or uncorrelated (Pritchard et al., 2000;
Guillot et al., 2005b). The uncorrelated model assumes allele frequencies are independent in
populations (Pritchard et al., 2000). Conversely, correlated allele frequencies use the F-model
which assumes that allele frequencies are quite similar due to shared ancestry or migration
(Falush et al., 2003). This can assist in detecting clusters where divergence is low; however, it
can also lead to overestimation of clusters in some datasets (Falush et al., 2003; Guillot, 2008).
Geneland (version 4.0) and Structure (version 2.3.4) software were used to estimate the
number of populations (K) and population membership of samples for analysis group A.
Several preliminary runs were undertaken to determine the most appropriate model
parameters to use before final runs were undertaken. Analysis group A samples were analysed
using the eight diploid-acting loci combined as neither package has the capability to analyse
data with more than two alleles per loci or mixed ploidy. Four separate analyses (Table 15)
were run using different parameters for each software package as described below.
Table 15: Parameters used for four separate analyses using genotypic data from eight diploid-acting loci for
analysis group A samples using Geneland and Structure software packages.
Analysis number
Geneland Parameters Structure Parameters
Spatial model Allele
frequencies Admixture Allele
frequencies Analysis 1 No Correlated Yes Correlated Analysis 2 No Uncorrelated Yes Uncorrelated Analysis 3 Yes Correlated No Correlated Analysis 4 Yes Uncorrelated No Uncorrelated
Geneland software analyses one and two used either correlated or uncorrelated allele
frequencies, respectively, without the spatial model. Analyses three and four used the spatial
model (geographic coordinates for each sample) and either correlated or uncorrelated allele
frequencies, respectively. All analyses included ten independent runs using 105 iterations with
thinning of 100, maximum of 600 nuclei, minimum of one population and maximum of seven
populations. All other settings were left at default values. Post-processing of the model with

147
the highest probability was undertaken using 105 iterations with a burn-in of 50 and pixel
values in the spatial domain of 200 for X and 100 for Y. A final run was performed using the
same settings except the maximum of populations was set to five to explore changes in
posterior probability and convergence.
Structure software analyses one and two used the admixture model and either correlated or
uncorrelated allele frequencies, respectively. Analyses three and four used the no-admixture
model and either correlated or uncorrelated allele frequencies, respectively. All analyses
included a priori information on collecting location (Falush et al., 2003; Hubisz et al., 2009).
Ten replicates were run for each value of K from 1-10 using 106 iterations with thinning of 103.
All other settings were left at default values. Post-processing of the Structure results were
performed using the CLUMPAK (Kopelman et al., 2015) pipeline
(http://clumpak.tau.ac.il/index.html) and included separate analyses for the best K described
by Pritchard et al. (2000) and Evanno et al. (2005).
Following cluster analyses and assignment of populations, GenAlEx was used to test
assignments using the frequency method of Paetkau et al. (Paetkau et al., 1995, 2004). The
method assumes HWLE and starts with the calculation of population-wide allelic frequencies
followed by derivation of a log-likelihood value. Missing alleles are handled through
assignment of non-zero numbers and the individual being assigned is left out of calculations
during assignment to a reference population (Efron, 1983; Paetkau et al., 1995). Default
settings, leave one out option and zero frequencies = 0.01, were used to undertake population
assignment assessments.
The software packages Arlequin (version 3.5), GenAlEx, FSTAT (version 2.9.3.2) and Genetix
(version 4.05.2) were used to perform hierarchical analyses using analysis group A samples.
Due to conflicting views in the research community about the best approach to use for
calculating F-statistics (Meirmans, 2006; Song et al., 2006), a range of approaches were taken
for these estimations to compare results. The fixation indices are presented here, unless
otherwise noted, using Wight’s (1965) original symbols (FST, FIS and FIT) as there are many
analogues, particularly for FST (e.g. Nei’s GST (1986), Slatkin’s RST (1995), Weir and Cockerham’s
θ (1984) and Hedrick's standardized GST (2005)). In general terms, the indices or their
analogues measure different aspects of heterozygote deficiencies: global deficit, FIT; among
population deficit, FST; or within population deficit, FIS (Goudet, 1995). FSTAT and GenAlEx can
make use of both Weir & Cockerham’s (1984) variance estimation based on allelic number as
well as Nei’s (Nei, 1973, 1977; Nei and Chesser, 1983) genotypic number based calculations.
The latter weighs all samples equally, whereas the former weighs frequencies of alleles
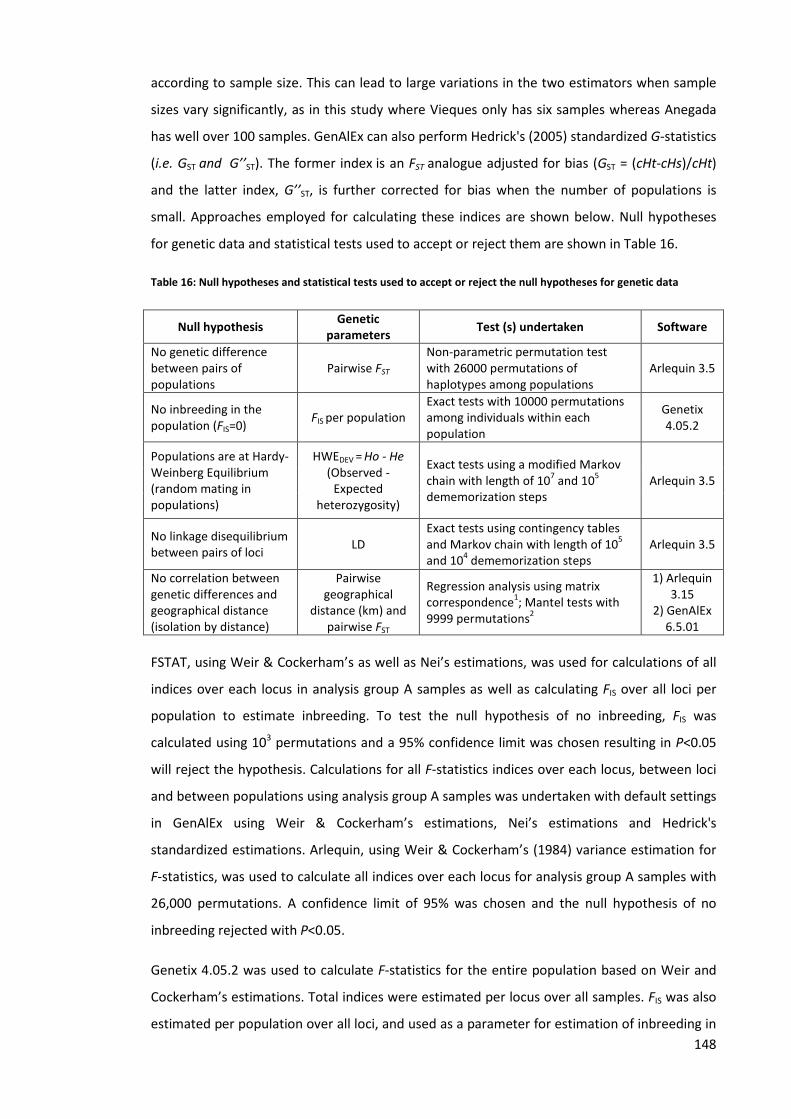
148
according to sample size. This can lead to large variations in the two estimators when sample
sizes vary significantly, as in this study where Vieques only has six samples whereas Anegada
has well over 100 samples. GenAlEx can also perform Hedrick's (2005) standardized G-statistics
(i.e. GST and G’’ST). The former index is an FST analogue adjusted for bias (GST = (cHt-cHs)/cHt)
and the latter index, G’’ST, is further corrected for bias when the number of populations is
small. Approaches employed for calculating these indices are shown below. Null hypotheses
for genetic data and statistical tests used to accept or reject them are shown in Table 16.
Table 16: Null hypotheses and statistical tests used to accept or reject the null hypotheses for genetic data
Null hypothesis Genetic parameters Test (s) undertaken Software
No genetic difference between pairs of populations
Pairwise FST Non-parametric permutation test with 26000 permutations of haplotypes among populations
Arlequin 3.5
No inbreeding in the population (FIS=0) FIS per population
Exact tests with 10000 permutations among individuals within each population
Genetix 4.05.2
Populations are at Hardy-Weinberg Equilibrium (random mating in populations)
HWEDEV = Ho - He (Observed -
Expected heterozygosity)
Exact tests using a modified Markov chain with length of 107 and 105 dememorization steps
Arlequin 3.5
No linkage disequilibrium between pairs of loci LD
Exact tests using contingency tables and Markov chain with length of 105 and 104 dememorization steps
Arlequin 3.5
No correlation between genetic differences and geographical distance (isolation by distance)
Pairwise geographical
distance (km) and
pairwise FST
Regression analysis using matrix correspondence1; Mantel tests with 9999 permutations2
1) Arlequin 3.15
2) GenAlEx 6.5.01
FSTAT, using Weir & Cockerham’s as well as Nei’s estimations, was used for calculations of all
indices over each locus in analysis group A samples as well as calculating FIS over all loci per
population to estimate inbreeding. To test the null hypothesis of no inbreeding, FIS was
calculated using 103 permutations and a 95% confidence limit was chosen resulting in P<0.05
will reject the hypothesis. Calculations for all F-statistics indices over each locus, between loci
and between populations using analysis group A samples was undertaken with default settings
in GenAlEx using Weir & Cockerham’s estimations, Nei’s estimations and Hedrick's
standardized estimations. Arlequin, using Weir & Cockerham’s (1984) variance estimation for
F-statistics, was used to calculate all indices over each locus for analysis group A samples with
26,000 permutations. A confidence limit of 95% was chosen and the null hypothesis of no
inbreeding rejected with P<0.05.
Genetix 4.05.2 was used to calculate F-statistics for the entire population based on Weir and
Cockerham’s estimations. Total indices were estimated per locus over all samples. FIS was also
estimated per population over all loci, and used as a parameter for estimation of inbreeding in

149
each population. The maximum number of permutations allowed by the software (10,000) was
used to check significance level and accept or reject the null hypothesis.
The hypothesis of isolation by distance (IBD) based on the method developed by Slatkin (1993)
through regression analyses using matrix correspondence was tested to determine if there was
significant gene flow between the populations. This is of particular interest as the pollinators
and dispersers of the species are not known and a lack of gene flow will suggest that the pollen
and/or seeds are unable to move between populations requiring further study. Geographical
distances in kilometres (km) were derived from the median of samples geographical
coordinates by population. According to Veness (2010), geographical distance calculations are
based on a spherical Earth and can, therefore, contain errors up to 0.3%. This amount of error
is acceptable for inference of IBD as geographical coordinates derived from GPS units are only
accurate to 10m and the mean value per population is used. Movable Type Scripts (MTS©
2002-2015 Chris Veness) available online (http://www.movable-
type.co.uk/scripts/latlong.html) was used to calculate the shortest distance between the
median values of analysis group A collecting coordinates using the haversine formula for each
pair of populations. These calculations enabled the population of a square-matrix of pairwise
population geographical distances (km) for IBD testing. Arlequin, making use of Slatkin’s (1995)
linearised distances, was used to generate a square-matrix of pairwise population Slatkin
(1993) linearised FST values ((t/M= FST/(1-FST) with M=2N for diploid data). Analysis group A
samples were analysed with Arlequin set to run 26,000 permutations. To check the significance
of correlation between Slatkin’s linearised FST and geographical distances, Mantel tests of 94
permutations were performed in GenAlEx on the two matrices across the five populations to
calculate the squared correlation coefficient between observed and predicted values
parameter (R2). This parameter, according to Norusis (2008), infers the observed variability in
genetic differences attributed to geographical distance.
Arlequin software was also used to undertake AMOVA (analysis of molecular variance)
analyses to calculate genetic variability within populations, among populations within regions
and among regions (Excoffier et al., 1992). The method calculates sums of squared deviations
by partitioning total variance into components of covariance across the hierarchy. The
correlation of uniting gametes is used as a function of variance, and instead of gene
frequencies variation, AMOVA uses the unique allele combinations of the diploid-acting loci
(Weir and Cockerham, 1984; Excoffier et al., 1992; Weir, 1996). AMOVA was used to calculate
pairwise population FST values to estimate the population origin of samples following
Meirmans (2006). To test the null hypothesis of population pairs lacking genetic

150
differentiation, FST was calculated via AMOVA in Arlequin using the default value of 26000
permutations and a 95% confidence limit (P<0.05 rejects the null hypothesis) was chosen.
Calculations of Nei’s unbiased genetic distance (GST’), Nei’s gene diversity (uHs) and Nei’s
estimate of genetic diversity (HT) (Nei, 1973, 1977; Nei and Chesser, 1983) were undertaken
between pairs of populations using default settings in GenAlEx and FSTAT. By adjusting for
sample size, GST’ and uHs overcome some of the issues associated with indices that do not
correct for variations across samples. Nei’s GST’ accounts for levels of heterozygosity and allelic
variation enabling a measure of genetic distance based on frequency of alleles (Nei, 1978).
Nei’s uHs is a representation, within subpopulations, of the expected heterozygosity under
HWE and is therefore useful for diversity comparisons between regions or across populations.
To explore genetic diversity across the entire population and within each locus, HT was also
calculated over all loci and over all populations for each locus.
The indices used to infer heterozygosity range in value for each index. The FST index (including
GST’ and G’’ST) varies between 0 and +1, where zero indicates a lack of genetic distance
between paired populations and one being the highest population subdivision and maximum
between population differentiation (Wright, 1965; Nei, 1978). For F-statistics indices used for
inbreeding and mating system inference, the inbreeding coefficient (FIS) and the total
inbreeding coefficient (FIT), values vary from +1 to -1 with inbreeding and excess homozygosity
indicated by positive values. Negative FIS values indicate outbreeding and if FIT and FST values
are equal, mating is random.
According to Wright’s formula (1965), calculation of genetic flux Nm between populations was
performed in GenAlEx. This method’s appropriateness has been called into question in the
literature (Whitlock and McCauley, 1999; Frankham et al., 2002, p.330); however, it was
undertaken and reported here to explore whether it is a useful measure in relation to V.
rupicola samples for determining restrictions in gene movement between populations.
In order to assess Hardy-Weinberg equilibrium (HWE) as well as linkage equilibrium (HWLE)
and subsequently interpret the results from cluster analyses using programmes assuming HWE
and HWLE, additional population level analyses were undertaken using Arlequin software. To
compare expected versus observed heterozygosity and HWE deviations, allelic frequencies
were calculated per population over all loci to determine observed heterozygosity using the
null hypothesis (no deviations from HWE and mating is not random) based on Levene (1949)
and Guo and Thompson (1992). As the data contained two alleles, expected heterozygosity
was calculated using the equation ∑ipi=1 described in Silvertown and Charlesworth (2001, p.54)
where pi is the frequency of the i-th allele. AMOVA analysis employing a Markov chain

151
consisting of 107 steps was started with 105 dememorisation steps using analysis group A
sample data for the eight diploid-acting loci to test HWE.
To test for linkage disequilibrium (LD), exact tests of sample differentiation were undertaken
among samples based on genotype frequencies following the contingency tables method
described by Slatkin (1994). Detecting population demographic histories and allelic
recombination can be achieved through LD testing. According to Flint-García et al. (2003), LD
relates to inbreeding, population size and bottlenecking and is correlated to recombination or
mutation. The former correlation can decrease allele associations while the later correlation
can increase allele associations. Arlequin was used to test the null hypothesis of loci having no
association through exact tests implementing a Markov chain consisting of 105 steps was
started with 104 dememorisation steps using analysis group A sample data for the eight
diploid-acting loci. A 95% confidence limit was chosen with P<0.05 rejecting the null
hypothesis of no association.
4.3. Results
4.3.1. Karyology
Karyotyping
Chromosomes sticking together during mitotic metaphase only allowed estimations of
chromosome numbers to be made. Based on a relatively few observations (n = 4), V. rupicola is
an octoploid with 2n = 72 (Figure 58) assuming x = 9 (Heubl et al., 1990).
Figure 58: Varronia rupicola chromosomes (inside red circle) at mitotic metaphase showing clumping and a
possible 2n = 72 giving an octoploid if x = 9 as described by Heubl et al. (1990). ©M.A. Hamilton.
Flow cytometry
Fresh leaves collected from V. rupicola and V. bahamensis plants were used to establish a flow
cytometry protocol for these species using Allium sativum (garlic) as a standard. Varronia
rupicola samples (n = 3) showed the same genome size (2C-value of 2.6 pg = 2542.8 Mbp)
when compared to the garlic standard (Figure 59 (a)); however, the single V. bahamensis

152
sample available had a smaller genome size (2C-value of 2.1 pg = 2053.8 Mbp) than V. rupicola
(Figure 59 (b)).
Figure 59: (a) Histogram of relative fluorescence intensities of G1 nuclei (corresponding to 2C gDNA content) of V.
rupicola (RN1) and Allium sativum (RN2); (b) Histogram of relative fluorescence intensities of G1 nuclei
(corresponding to 2C gDNA content) of V. bahamensis (RN1) and V. rupicola (RN2). ©M.A. Hamilton.
4.3.2. Next-generation sequencing
The extracted V. rupicola genomic DNA sample sent for sequencing produced a total of
12,130,785bp with a mean fragment size of 553bp and 39.3% GC content. In total, 21,907
individual sequences were produced with 20,875 of those having at least 80bp. Following QDD
pipeline 1 processing, 2,507 sequences (11.4% of total sequences) contained at least one
microsatellite. QDD pipeline 2 processing found 871 consensus sequences with 713 unique
sequences (28.4% of the 2,507 sequences containing at least one microsatellite). A total of 865
sequences (3.9% of total sequences) contained target microsatellites and sequences with
primers totalled 642 (2.9% of total sequences) following QDD pipeline 3 processing. A
BLAST® search was performed (QDD pipeline 4) that returned very few potential matches,
none of which were plastid regions or strict matches.
Further screening of the data following primer development to select best primers for target
regions, as suggested by Gardner et al. (2011), resulted in 381 sequences (1.7% of total
returned) including target microsatellites with six or more di-, tri-, tetra-, penta- or hexabase
repeats that were used for selecting 44 primer pairs for testing (Appendix 7: Oligonucleotide
testing). Of the primer pairs tested, 27 loci (61.4%) provided interpretable sequence data;
however, only 13 (29.5%) were polymorphic for the trial samples (one from each island with
extant populations).

153
Of the polymorphic loci, eight (18.2% of total tested) were diploid-acting (Figure 60) and five
(11.4% of total tested) were polyploid-acting. The latter were often difficult to interpret;
therefore, only two (4.5% of total tested) polyploid-acting loci were selected for further
analyses. In total, ten polymorphic loci (22.7% of total tested) were analysed; however,
analyses for the two polyploid-acting loci was limited due to most software programmes only
being able to process haploid or diploid data. This is a major obstacle for interpreting polyploid
species data, particularly if all loci are polyploid-acting. This research was able to discover eight
diploid-acting loci for analysis in the most commonly used software packages (i.e. Geneland
and Structure). Subsequently, data from the diploid- and polyploid-acting loci were combined
to compare population clustering results only for diploid-acting loci. This was undertaken using
PCoA to ensure that clustering results did not change significantly when introducing polyploid-
acting loci data.
Figure 60: Testing results of 44 oligonucleotide primers for population level analyses of Varronia rupicola
samples.
Samples that failed to amplify or gave weak peaks were repeated. Those still not scorable were
excluded from final analyses. Of 443 extracted samples, 380 samples were selected for
analyses. Of these, 260 samples were from extant wild plants, 114 were from extant ex-situ
collections and six were from herbarium specimens collected between 1978 and 1995
Not interpretable 38.6%
Monomorphic 31.8%
Polymorphic - Diploid-acting
18.2%
Polymorphic - Polyploid-acting
11.4%
Oligonucleotide primer testing results

154
(Appendix 6: Population genetics samples). The samples excluded (n = 63) were predominantly
from ex-situ collections (n = 54) that were not from wild seed sources. The remaining nine
excluded samples were from Anegada (Figure 61) leaving 144 samples from that island. Six
samples originated from Vieques at a single location (Figure 62) and 110 samples originated
from the island of Puerto Rico (Figure 63).
Following repeats and final sample selections, three analysis groups were defined. Group A (n=
260) contained only samples of extant wild plants. Group B (n = 374) consisted of extant wild
and ex-situ plants. Group C (n = 380) included the same samples as group B as well as a further
six herbarium specimen samples.
Figure 61: Map showing sampling of Varronia rupicola on Anegada for wild DNA samples collected and used
during this research (purple squares), historical herbarium vouchers (orange pentagons) and wild DNA samples
excluded from this study (red triangles).

155
Figure 62: Map showing sampling of Varronia rupicola on Vieques for wild DNA samples collected during this
research (purple squares) and historical herbarium vouchers (orange pentagons).
Figure 63: Map showing sampling of Varronia rupicola on Puerto Rico for wild DNA samples collected during this
research (purple squares) and historical herbarium vouchers (orange pentagons).

156
Of the diploid-acting loci, all were polymorphic for wild samples (analysis group A) at the
regional and country levels; however, two loci, VRBREYV and VRBL3FZ, were monomorphic for
Vieques when undertaking population analysis (Table 17) resulting in a 95% mean value for
polymorphic loci across the populations.
Table 17: Percentage of eight diploid-acting microsatellite loci showing polymorphism at regional, country and
population levels for analysis group A samples of Varronia rupicola. Population descriptions and designations per
sample are provided in Appendix 6: Population genetics samples.
Regional level Population level Region % polymorphic Population % polymorphic Puerto Rican Bank 100% Anegada East 100%
Country level Anegada West 100% Country % polymorphic Guánica 100% British Virgin Islands 100% Ponce 100% Puerto Rico 100% Vieques 75% The only locus that had >5% missing data was the diploid-acting locus 'VRBREYV'. As all
samples missing data for this locus originated from Anegada, this was magnified when
undertaking population level analysis and will be discussed in 4.3.3. Allelic diversity. All other
loci had less than 4% missing data for wild samples (Table 18). A single sample, number 432,
from Anegada was missing data for three loci and was specifically retained due to the presence
of rare private alleles.
Table 18: Missing data for nuclear microsatellites per locus; overall by ploidy group and over all loci for analysis
groups A-C with the number of samples missing data per locus and per analysis group A-C ( A #, B #, C #) and
percentage of data missing per locus and per analysis group A-C (A %, B %, C %).
Diploid-acting
Locus A # A % B # B % C # C % VRgr3_2 9 3.5% 9 2.4% 9 2.4%
VRBS43W 5 1.9% 7 1.9% 8 2.1% VRBREYV 18 6.9% 23 6.1% 24 6.3% VRBL3FZ 0 0.0% 0 0.0% 0 0.0%
VRB5M1O 6 2.3% 8 2.1% 8 2.1% VR_gr271_2 2 0.8% 2 0.5% 2 0.5%
VRA5NLR 5 1.9% 5 1.3% 6 1.6% VRE18LG 0 0.0% 0 0.0% 0 0.0% Overall 45 2.2% 54 1.8% 57 1.9%
Polyploid- acting
Locus A # A % B # B % C # C % VRD2DN4 10 3.8% 10 2.7% 10 2.6% VR_gr27_2 2 0.8% 3 0.8% 4 1.1%
Overall 12 2.3% 13 1.7% 14 1.8%
All loci A # A % B # B % C # C % 57 2.2% 67 1.8% 71 1.9%

157
Testing for cross-species transferability of the ten microsatellites (Table 19) selected for V.
rupicola population analyses was successful for 50% of the loci across V. bahamensis, V.
bullata, V. lima and V. polycephala. Of these five loci, only one, VRD2DN4, was successfully
amplified for all four species. Results of the other four loci varied with VRA5NLR and VRE18LG
only amplifying in one species each. Amplification was better for the loci VRBL3FZ and
VR_gr27_2 with amplification in three species each.
Table 19: Amplification results for four Varronia species using ten microsatellite loci selected for V. rupicola
population analyses with successful amplification of samples indicated by a plus (+) or no amplification indicated
by a minus (-).
Locus V. bahamensis V. bullata V. lima V. polycephala VRgr3_2 - - - -
VRBS43W - - - - VRBREYV - - - - VRBL3FZ + - + +
VRD2DN4 + + + + VRB5M1O - - - -
VR_gr271_2 - - - - VRA5NLR - - - +
VR_gr27_2 + + - + VRE18LG + - - -
Below the results of allelic diversity and genetic structure are reported to compare genetic
variability and explore population structure as well as diversity of extant plants.
4.3.3. Allelic diversity
Using analysis group C (all samples), alleles were summarised per locus, by ploidy group and
overall (Table 20). The eight diploid-acting loci ranged in size from 145-350bp with 92 total
alleles. The two polyploid-acting loci had 15 total alleles and ranged from 179-335bp. Two loci,
VRD2DN4 and VRE18LG, failed to show any private alleles. All other loci had at least one
private allele and the maximum observed was 13 private alleles for locus VRgr3_2.
The fixation indices (FIT, FST and FIS) calculated over all populations was lowest for VRE18LG
which only had two alleles and was the only locus to show outbreeding. This locus showed the
highest value (7.117) for estimation of migrants per generation (Nm) which ranged from 0.309
for locus VRBREYV and had a low, mean overall value of 1.863. Overall gene diversity (HT) was
0.680 with the highest for VRBS43W (0.904) and the lowest value (0.453) observed for
VRA5NLR which showed the only values similar for FIT and FST which mean mating is random.

158
Table 20: Summary of microsatellite genetic parameters divided by loci groups and overall. Abbreviations and
formulae: allelic range (A-range); number of alleles (An); number of private alleles (Ap); Weir & Cockerham’s
(1984) estimations of FIT and FIS as well as Nei’s estimate of gene diversity (HT); Hedrick's (2005) G’’ST and migrants
per generation (Nm). Significant P-values indicated by: “*” = 5% nominal level, “**” = 1% nominal level, and “***”
= 0.1% nominal level. “^” denotes that values does not include polyploid-acting loci due to software limitations.
Diploid-acting
Locus A-range An Ap FIT G’’ST FIS HT Nm
VRgr3_2 270-332 17 13 0.328 ***
0.703 ***
0.325 *** 0.760 0.620
VRBS43W 250-350 15 5 0.338 ***
0.757 ***
0.334 *** 0.904 1.292
VRBREYV 256-319 13 7 0.412 ***
0.920 ***
0.410 *** 0.828 0.309
VRBL3FZ 200-230 6 1 0.380 ***
0.493 ***
0.381 *** 0.578 0.733
VRB5M1O 210-300 25 10 0.297 ***
0.690 ***
0.296 *** 0.899 1.518
VR_gr271_2 230-285 7 4 0.380 ***
0.187 *
0.369 *** 0.531 2.175
VRA5NLR 180-230 7 4 0.308 ***
0.305 ***
0.312 *** 0.453 1.140
VRE18LG 145-200 2 0 -0.693 0.071 **
-0.721 *** 0.490 7.117
Polyploid-acting
VRD2DN4 179-210 5 0 ~ ~ ~ ~ ~ VR_gr27_2 285-335 10 1 ~ ~ ~ ~ ~
Overall* 145-350 107 45 0.290^
*** 0.510^
*** 0.252^
*** 0.680^ 1.863^ Forty-five (48.9%) of the 92 alleles for diploid-acting loci are private to one of the two
countries, British Virgin Islands or Puerto Rico. Of these, one private allele appears to have
been lost from Puerto Rico as it was only detected in historical herbarium specimens from that
country and was found in extant wild material from Anegada (see Appendix 9: Private alleles
detected for microsatellite loci).
Twenty-four (26.1%) of the 92 alleles for diploid acting loci are private to the British Virgin
Islands. Of these, eight are shared between the two populations on Anegada defined as
Anegada East (eastern half of Anegada, BVI including the localities of East End and Warner)
and Anegada West (western half of Anegada, BVI including the localities of Bones Bight, Bones
Low Point, Bumber Well Cay, Capt. Auguste George Airport, Citron Bush, Cow Wreck Bay,
Flamingo Pond, Jack Bay, Keel Point, Low Cay, Middle Cay, North Raibin Slob, Nutmeg Point,
Pearl Point, Pomato Point, Sambeal Slob, Setting Point, Soldier East Point, Soldier Point,
Saltheap Point, The Settlement, Vagabond Pond, West End, Windlass Bight and Windlass Low
Point); one is of unknown provenance (probably Anegada West origin) from ex-situ collections
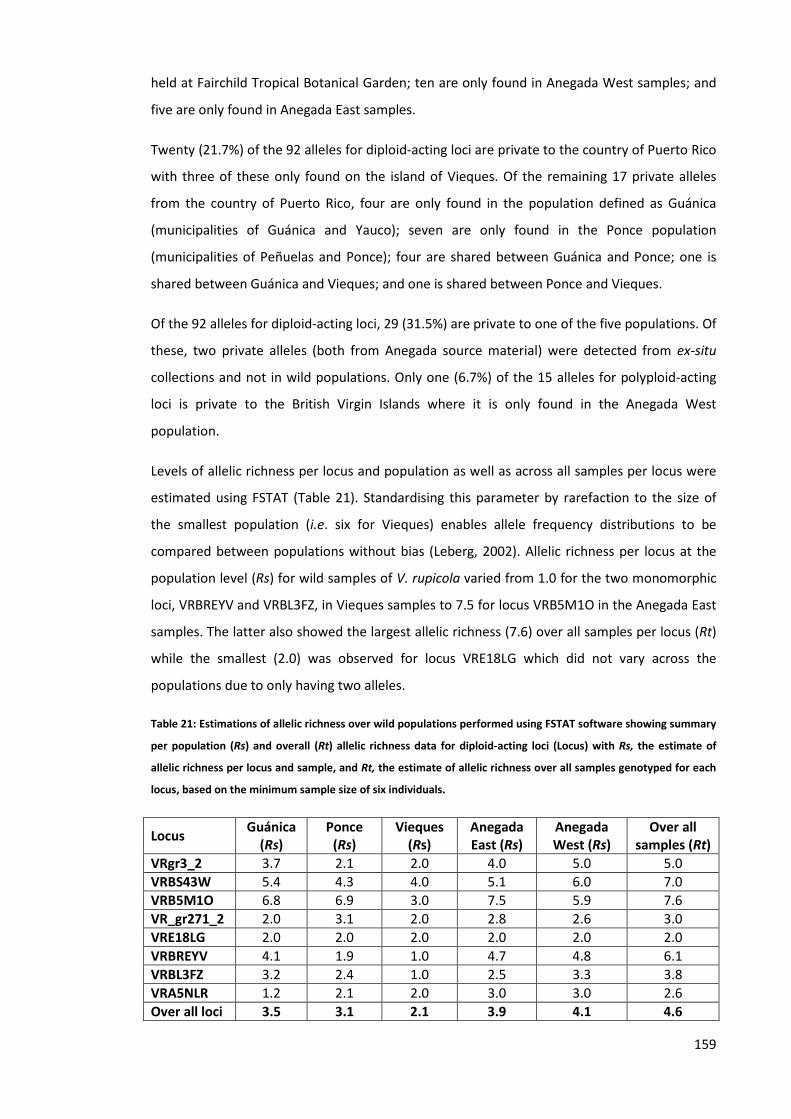
159
held at Fairchild Tropical Botanical Garden; ten are only found in Anegada West samples; and
five are only found in Anegada East samples.
Twenty (21.7%) of the 92 alleles for diploid-acting loci are private to the country of Puerto Rico
with three of these only found on the island of Vieques. Of the remaining 17 private alleles
from the country of Puerto Rico, four are only found in the population defined as Guánica
(municipalities of Guánica and Yauco); seven are only found in the Ponce population
(municipalities of Peñuelas and Ponce); four are shared between Guánica and Ponce; one is
shared between Guánica and Vieques; and one is shared between Ponce and Vieques.
Of the 92 alleles for diploid-acting loci, 29 (31.5%) are private to one of the five populations. Of
these, two private alleles (both from Anegada source material) were detected from ex-situ
collections and not in wild populations. Only one (6.7%) of the 15 alleles for polyploid-acting
loci is private to the British Virgin Islands where it is only found in the Anegada West
population.
Levels of allelic richness per locus and population as well as across all samples per locus were
estimated using FSTAT (Table 21). Standardising this parameter by rarefaction to the size of
the smallest population (i.e. six for Vieques) enables allele frequency distributions to be
compared between populations without bias (Leberg, 2002). Allelic richness per locus at the
population level (Rs) for wild samples of V. rupicola varied from 1.0 for the two monomorphic
loci, VRBREYV and VRBL3FZ, in Vieques samples to 7.5 for locus VRB5M1O in the Anegada East
samples. The latter also showed the largest allelic richness (7.6) over all samples per locus (Rt)
while the smallest (2.0) was observed for locus VRE18LG which did not vary across the
populations due to only having two alleles.
Table 21: Estimations of allelic richness over wild populations performed using FSTAT software showing summary
per population (Rs) and overall (Rt) allelic richness data for diploid-acting loci (Locus) with Rs, the estimate of
allelic richness per locus and sample, and Rt, the estimate of allelic richness over all samples genotyped for each
locus, based on the minimum sample size of six individuals.
Locus Guánica (Rs)
Ponce (Rs)
Vieques (Rs)
Anegada East (Rs)
Anegada West (Rs)
Over all samples (Rt)
VRgr3_2 3.7 2.1 2.0 4.0 5.0 5.0 VRBS43W 5.4 4.3 4.0 5.1 6.0 7.0 VRB5M1O 6.8 6.9 3.0 7.5 5.9 7.6 VR_gr271_2 2.0 3.1 2.0 2.8 2.6 3.0 VRE18LG 2.0 2.0 2.0 2.0 2.0 2.0 VRBREYV 4.1 1.9 1.0 4.7 4.8 6.1 VRBL3FZ 3.2 2.4 1.0 2.5 3.3 3.8 VRA5NLR 1.2 2.1 2.0 3.0 3.0 2.6 Over all loci 3.5 3.1 2.1 3.9 4.1 4.6

160
Allelic richness observed over all loci ranged from 2.1 in Vieques, the smallest population, to
4.1 for the largest population, Anegada West (see Chapter 2: Biogeography of Varronia
rupicola). This suggests that reduction of the Vieques population has had a detrimental effect
on allelic richness. In fact, allelic richness appears to be linked to population size as observed in
Figure 64. The number of private alleles (Pa) also follows this trend with the exception of the
Ponce population that has slightly more Pa than the larger Guánica population.
Figure 64: Summary graph of allelic patterns in wild populations (ordered west to east) showing the number of
different alleles (Na) and number of private alleles (Pa) using analysis group A data and eight diploid-acting loci.
4.3.4. Genetic structure
Results of hierarchical analyses are reported below at regional (i.e. taxon), country and
population levels. These analyses were based on analysis group A (extant wild samples) unless
otherwise noted. Most software packages are unable to analyse microsatellite data with more
than two alleles; therefore, the majority of results presented are for the eight diploid-acting
loci and should be interpreted as such. Additional, however limited, analyses were undertaken
to make use of the polyploid-acting loci. Where this is the case, the additional use of the two
polyploid-acting loci in the analysis is explicitly defined.
Genetic variation within populations was the most significant source of variation (65%) found
through global, locus by locus AMOVA analysis with results as a weighted average over all loci
using RST (Slatkin, 1995) distance method (Figure 65). Variation among populations within
countries (11%) was the smallest source of variation with regional variation between the two
countries (25%) considerably higher.
0.000
5.000
10.000
Guanica Ponce Vieques Anegada West Anegada East
Mea
n
Populations
Allelic patterns across populations
Na
Pa

161
Figure 65: Analysis of molecular variance (AMOVA) regional variation (%) for analysis group A samples within
populations, among populations within countries as well as among countries with analysis results as a weighted
average over all loci using sum of squared size difference (RST) distance method (Slatkin, 1995).
Analyses of group A (extant wild) samples were undertaken at three hierarchical levels:
regional (i.e. taxon), country (i.e. Puerto Rico and BVI) and population (i.e. Anegada west,
Anegada east, Guánica; Ponce, and Vieques) levels (Table 22). Results of these analyses are
presented in the following sections.
Table 22: Hierarchical analyses showing observed (Ho), expected (He) and unbiased (uHe) heterozygosity, within
population deficit (FIS) and HWE deviation (HWEDEV) for diploid-acting loci of extant wild samples.
Abbreviations and formulae: Number of samples (N); number of alleles (An); number of private alleles (Ap); Ho =
number of heterozygotes/N; He = 1-Sum pi^2; HWEDEV = Ho - He; uHe = (2N/(2N-1))*He; FIS = (Mean He-Mean
Ho)/Mean He. Regional HWEDEV P-values calculated in Arlequin. FIS and FIS P-values calculated in Genetix. All other
values were calculated in GenAlEx. Significant P-values indicated by: “*” = 5% nominal level; “***” = 0.1%
nominal level.
Location N An Ap Ho He uHe FIS HWEDEV PRB 260 92 44 0.501 0.631 0.634 0.252 *** -0.169 *** BVI 144 70 24 0.572 0.668 0.671 0.147 *** -0.096 *** Anegada East 25 49 5 0.535 0.633 0.647 0.176 *** -0.098 *** Anegada West 119 61 10 0.580 0.656 0.659 0.120 *** -0.076 *** Puerto Rico 116 67 20 0.430 0.594 0.597 0.280 *** -0.164 *** Guánica 72 51 4 0.470 0.565 0.569 0.175 *** -0.095 *** Ponce 38 41 7 0.379 0.464 0.470 0.196 *** -0.085 *** Vieques 6 17 3 0.292 0.344 0.375 0.239 * -0.052 *
25%
11% 65%
Among countries
Among populations withincountries
Among individuals withinpopulations
Nuclear microsatellite AMOVA global results

162
Regional and country level genetic structure
Heterozygosity and deviation from HWE was calculated at the regional (i.e. species) level
(Table 22) over all loci to explore variation and test significance. Lower than expected mean
observed heterozygosity at the taxon level (0.501) was observed across all loci and overall at
the regional level. The overall positive value for FIS of 0.252 showed a P-value (P<0.001) that
was highly significant and the null hypothesis was rejected. Mating is not fully random as FIT
and FST values are not equal with FIT being slightly larger.
The overall among population heterozygosity value for all loci of 0.214/0.510 (FST /G’’ST) was
highly significant (P<0.001) and corresponds with AMOVA results (see Figure 65) showing low
population subdivision and low between population differentiation. All among population
heterozygosity values, FST, showed significant P-values (P<0.05) rejecting the null hypothesis of
population pairs lacking genetic differentiation.
Country level analyses (see Table 22) were undertaken to compare with regional results and
check for high levels of variation in heterozygosity between the two countries. Values of
observed heterozygosity were slightly higher for BVI (0.572) and slightly lower for Puerto Rico
(0.430) than regional values. Overall deviation from HWE was higher for Puerto Rico (-0.164)
than BVI (-0.096) and significant P-values (P<0.001) were observed for all HWE deviations per
country as at the regional level. The overall inbreeding coefficient (FIS) for BVI was 0.147 and
0.280 for Puerto Rico indicating low levels of homozygosity and weak inbreeding are present.
Both had significant P-values (P<0.001) and the null hypothesis was again rejected at the
country level.
Following PCoA analysis a final graph (Figure 66) was produced showing individuals colour-
coded by population and defined with convex hull outlines for each population. The first two
axes explained most of the variation, 15% and 6% respectively, and suggests a high level of
group distinction according to Peakall and Smouse (2012a). The PCoA analysis clearly
separated the samples from the three islands; however, it was unable to make a distinction
among the populations on the islands of Anegada and Puerto Rico. The broad grouping of
Anegada and Vieques should be noted and will be discussed (see 4.4.3. Genetic Diversity) in
relation to cluster analyses using Bayesian methods presented here.

163
Figure 66: Principal coordinates analysis results of wild populations for ten polymorphic microsatellite loci with
axis scales based on Eigen values using Jaccard similarity measure. Outlines are convex hulls: Pink = Vieques
island samples with pink squares per sample; Red = Anegada East population samples with red pluses per sample;
Dark green = Anegada West samples with green crosses per sample; Blue = Ponce population samples with blue
squares per sample; Light green = Guánica population samples with green diamonds per sample.
Bayesian cluster analysis techniques implementing MCMC methods were undertaken in
Geneland and Structure. Four analyses were undertaken in each programme to estimate
population membership and the number of populations (K) for analysis group A (extant wild)
samples using eight diploid-acting microsatellite loci (Table 23). Both packages gave similar
results using the different models. Without either the spatial model or admixture (admix),
Geneland failed to detect populations using uncorrelated allele frequencies and only detected
two populations using correlated allele frequencies. Implementing the spatial model increased
Geneland’s ability to detect populations with seven detected using correlated allele
frequencies and five using uncorrelated allele frequencies. The latter value of K = 5 had the
highest posterior probability (89%) between the two analyses using the spatial model when
run with maximum K = 5. All runs converged at the same value of K.
-0.25 -0.20 -0.15 -0.10 -0.05 0.00 0.05 0.10 0.15Coordinate 1 = 15% of variation
-0.40
-0.32
-0.24
-0.16
-0.08
0.00
0.08
0.16
0.24
0.32
Coor
dina
te 2
= 6%
of v
ariat
ion

164
Table 23: Results for number of populations (K) analyses estimated from Geneland using the run with the highest
posterior probability and Structure using best K default calculation (Pritchard et al., 2000) and Delta K “^” (Evanno
et al., 2005) on the CLUMPAK website. “*” denotes use of sampling locations as a prior; “~” denotes calculation
not possible due to software limitations.
Software Geneland Structure Spatial model without spatial with spatial without spatial with spatial
Alle
le
freq
uenc
ies
Corr
elat
ed
Unc
orre
late
d
Corr
elat
ed
Unc
orre
late
d
Corr
elat
ed*
Unc
orre
late
d*
Corr
elat
ed
Unc
orre
late
d
Without admix 2 1 7 5 7 (2^) 5 (2^) ~ ~ With admix ~ ~ ~ ~ 7 (2^) 5 (2^) ~ ~ Although Structure lacks a spatial model, the package allowed collecting locations to be
defined as a priori (Hubisz et al., 2009) for the analyses and also has the ability to use two
different ancestry models, with or without genetic admixture (Pritchard et al., 2000). Structure
analyses estimations of K were the same with or without admixture; however, results varied
between correlated and uncorrelated allele frequencies when using the original best K analysis
(Pritchard et al., 2000). All estimations following Evanno et al. (2005) were K = 2, whereas
those following Pritchard et al. (2000) matched Geneland analyses using the spatial model
where K = 7 for correlated allele frequencies and K = 5 for uncorrelated allele frequencies. The
correlated allele frequencies has been shown to overestimate clusters in some datasets
(Falush et al., 2003; Guillot, 2008) and the Evanno et al. (2005) estimations of K have been
shown to underestimate when differentiation is low (Waples and Gaggiotti, 2006); therefore, K
= 5 was selected (Figure 67) for these analyses and will be further discussed in 4.4.3. Genetic
Diversity.

165
Figure 67: Populations and their spatial distribution estimated from wild samples using Bayesian methods in
Geneland software without admixture, with the spatial model and uncorrelated allele frequencies. Maps of
posterior probability to belong to each of the five populations (clusters) are shown in plates A – E with the
highest probabilities indicated by lighter colours. Sampled individuals included in the analysis are represented by
black dots. Populations were inferred through MCMC and the number of populations along the chain is depicted
in plate F.
Based on Bayesian analyses of extant wild samples, five populations of V. rupicola occur across
the Puerto Rican Bank: Anegada west, Anegada east, Guánica, Ponce and Vieques (Figure 68).
The geographical extent and observations of individual V. rupicola plants will be further
discussed and illustrated with more clarity in 4.4.4. Main conclusions.

166
Figure 68: Populations of Varronia rupicola across the Puerto Rican Bank with coloured polygons to demarcate
populations identified: Anegada west = Dark green polygon; Anegada east = Red polygon; Guánica (Guánica and
Yauco) = Light green polygon; Ponce (Peñuelas and Ponce) = Blue polygon; Vieques = Pink polygon.
Inter-population genetic structure
Population pairwise genetic distances were calculated in GenAlEx and Arlequin to enable
comparisons to be made of the different methods available in each. Results of pairwise
population analyses giving FST calculated via Nei’s (Nei, 1973, 1977; Nei and Chesser, 1983)
distance method (Table 24) and those calculated via Weir and Cockerham’s (1984) frequency
method (Table 25) varied for analysis group A (extant, wild) samples; however, the variation
was minor and all values showed low levels of between population differentiation and
subdivision.
Table 24: Pairwise population heterozygosity analysis (pairwise FST) results and migrants per generation (Nm) for
analysis group A samples calculated in GenAlEx software with FST values based on Nei’s genotypic number
calculations (Nei, 1973, 1977; Nei and Chesser, 1983) shown below the diagonal and estimations of migrants per
generation (Nm = [(1/FST)-1]/4) above the diagonal.
Population Anegada East Anegada West Vieques Ponce Guánica Anegada East ~ 6.129 1.190 1.971 2.594 Anegada West 0.039 ~ 0.918 2.117 2.946 Vieques 0.174 0.214 ~ 0.679 0.781 Ponce 0.113 0.106 0.269 ~ 2.338 Guánica 0.088 0.078 0.242 0.097 ~

167
Values for Nei’s method ranged from 0.039 between the Anegada populations to 0.269
between Vieques and Ponce populations. The same populations showed minimum (0.064) and
maximum (0.300) values using Weir and Cockerham’s method. Due to software limitations, P-
values were only calculated via AMOVA analysis in Arlequin. These were significant across the
pairwise population calculations thus rejecting the null hypothesis of no genetic differentiation
between populations.
Table 25: FST values for pairwise population analysis with FST values based on Weir and Cockerham (1984) method
below the diagonal followed by an FST P-value significance indicator where “***” = 0.1% nominal level. Above the
diagonal are P-values obtained using Arlequin software.
Population Anegada East Anegada West Vieques Ponce Guánica Anegada East ~ 0.000 0.000 0.000 0.000 Anegada West 0.064*** ~ 0.000 0.000 0.000 Vieques 0.177*** 0.262*** ~ 0.000 0.000 Ponce 0.137*** 0.118*** 0.300*** ~ 0.000 Guánica 0.119*** 0.120*** 0.277*** 0.165*** ~ Migrants per generation (Nm) values for analysis group A samples were also calculated
between the populations (see Table 24). Vieques showed the lowest amount of migration
when compared to all other populations, whereas the two Anegada populations showed the
highest amount of between population migrations. While this measure has become less
favoured according to Whitlock and McCauley (1999), it is shown here due to the support the
calculations give to other analyses that will be discussed later.
Arlequin software was used to calculate Slatkin’s linearised distances (Slatkin, 1995). Wild
samples (analysis group A) collected across the Puerto Rican Bank were divided into five
populations and geographical distances between the median values of geographical
coordinates across all samples for each population were calculated. The resulting matrices,
combined below into a single matrix (Table 26), were used for isolation by distance (IBD)
hypothesis testing in GenAlEx.
Table 26: Pairwise population matrix developed for isolation by distance hypothesis testing showing results of
Slatkin (1995) linearised FST values below the diagonal and pairwise population matrix of geographical distances
(km) above the diagonal for analysis group A samples.
Population Anegada East Anegada West Vieques Ponce Guánica Anegada East ~ 8.34 138.30 265.40 284.70 Anegada West 0.069 ~ 132.60 258.50 277.70 Vieques 0.215 0.355 ~ 133.50 153.50 Ponce 0.159 0.134 0.429 ~ 19.98 Guánica 0.135 0.136 0.382 0.198 ~

168
To check the significance of correlation between Slatkin’s linearised FST and geographical
distances, Mantel tests were performed on the two matrices to calculate the squared
correlation coefficient between observed and predicted values parameter (R2). The null
hypothesis of no significant relationship was not rejected as the isolation by distance
hypothesis testing shows no significance (P = 0.179) across the five populations. The smallest
population, Vieques, with only six extant individuals shows the highest Slatkin linearized FST
values (Table 26, Figure 69) and lowest allelic richness (see Table 21).
Figure 69: Isolation by distance test results derived from Mantel test calculations using pairwise population
matrices of Slatkin linearized FST and geographical distances (km) performed in GenAlEx software. R2 indicates
variance explained by the model; in this case, 2.8% of the genetic distance between pairs of populations can be
attributed to the geographical distance between these populations for nuclear microsatellites.
Results of GenAlEx population assignment tests (see Appendix 10: Population assignment
tests) are summarised in Table 27. Three samples from the largest population, Anegada West,
were assigned to other populations following testing. These reassignments were for sample
447 to the Anegada East population and samples 378 and 444 to the Ponce population.
Overall, 99% of the samples were maintained in their originally assigned population.
Table 27: Summary of population assignment tests (Paetkau et al., 1995, 2004) for extant wild samples showing
outcome per sample reported as remaining in the 'Assigned Population’ or reassigned to 'Other Population’.
Population Assigned Population Other Population Anegada East 25 ~ Anegada West 116 3 Guánica 72 ~ Ponce 38 ~ Vieques 6 ~ Total assignments 257 3 Percentage assigned 99% 1%
R² = 0.028 P = 0.179
0.0000.0500.1000.1500.2000.2500.3000.3500.4000.4500.500
0 100 200 300
Slat
kin
F ST
Geographical distance (Km)
Isolation by distance testing 8
20
133
134
138
154
259
265
278
285
(Anegada East vs. Anegada West)
(Ponce vs. Guánica)
(Vieques vs. Anegada East)
(Vieques vs. Ponce)
(Vieques vs. Anegada West)
(Vieques vs. Guánica)
(Anegada West vs. Ponce)
(Anegada East vs. Ponce)
(Anegada West vs. Guánica)
(Anegada East vs. Guánica)

169
To explore demography and detect recombination, paired loci associations were calculated to
test the null hypothesis of no association between loci. All populations showed LD (Table 28)
with the largest number of linked loci coming from the largest population, Anegada West. The
smallest population, Vieques, with only six samples and two monomorphic loci that could not
be calculated, showed the smallest number of linked loci.
Table 28: Number of linked loci per population across eight diploid-acting microsatellites with summary and
overall linkage disequilibrium (LD) data divided by source population (Population) denoted by sequence identifier
(Locus) and “^” denoting that values for two loci were not calculated for Vieques due to these loci, VRBREYV and
VRBL3FZ, being monomorphic.
Locus Anegada East Anegada West Guánica Ponce Vieques VRgr3_2 1 3 4 0 0
VRBS43W 0 4 3 2 1 VRB5M1O 1 4 4 3 2
VR_gr271_2 0 4 2 2 0 VRE18LG 0 0 0 1 0 VRBREYV 1 5 5 0 ~ VRBL3FZ 2 3 2 2 ~ VRA5NLR 1 3 2 0 1 Overall 6 26 22 10 4^
4.4. Discussion and conclusions Species conservation strategies can be greatly improved through a better understanding of
genetic diversity and spatial structure, especially when coupled with detailed ecological and
biological information. This research has sought to identify the genetic structure of V. rupicola
and to inform the species management through detection of populations with unique genetic
diversity as this will be key to the species survival in the future through adaption to changing
environmental conditions (Fay et al., 2009; Kramer and Havens, 2009). To that end, ten
polymorphic microsatellite loci were selected and analysed. Of these, two loci, VRD2DN4 and
VR_gr27_2, were polyploid-acting with five and ten alleles, respectively. These results provide
support for V. rupicola being a complex polyploid and the discovery of eight alleles per sample
across multiple samples for VR_gr27_2 further supports the idea that the species is an
octoploid as eight alleles in a single individual should only be possible in an octoploid (or
higher polyploid). The remaining eight loci were diploid-acting as they showed a maximum of
two alleles. The eight loci that amplified from a unique site (one set of homeologues) suggest
that the species is an allopolyploid that arose from crosses between species with disparate
genomes (Collevatti et al., 1999).

170
All diploid-acting loci were polymorphic for analysis group A (extant wild samples) at the
country and regional levels; however, a 95% mean value for polymorphic loci across the
populations was observed as two loci, VRBREYV and VRBL3FZ, were monomorphic for the
smallest population, Vieques. For analysis group A, 3.5% and 6.9% data was missing from the
diploid-acting loci, VRgr3_2 and VRBREYV, respectively. All samples missing data for these loci
originated from Anegada and led to magnification of the missing data percentages when
undertaking population level analyses as discussed below in 4.4.2. Allelic Diversity. Data
missing for extant wild samples from all other loci was less than 4%.
Allelic dropout, when one or more copies fail to amplify by PCR at a locus, is not thought to be
the cause of these missing data as high quality samples were used, other loci for these samples
successfully amplified and the samples were repeated to minimise the potential of genotyping
error (Wang et al., 2012). These missing data, especially for the Anegada material, could
suggest a mutation in the primer region as this can result in the inability of the loci to be
successfully amplified (Paetkau and Strobeck, 1995).
Due to the limitations of commonly used software packages, analysis options for the two
polyploid-acting loci were very limited. As the majority of microsatellite data was diploid-
acting, most of the analyses focused on these eight loci. For these reasons, a range of
techniques were employed to explore the data available and are discussed below.
4.4.1. Karyology
Gene duplication causes genetic variation and genome enlargement through the addition of
gene fragments, genes, chromosomes (aneuploidy) or entire genomes (polyploidy) (Wayne
and Miyamoto, 2006; Vandamme, 2009). Genomes of polyploids are highly dynamic and
according to Soltis et al. (2014) undergo rapid changes in gene content and expression
following polyploidisation. Polyploidy can occur through the union of genomes of two different
species, allopolyploidy, or through the duplication of a single species genome, autopolyploidy
(Leitch and Bennett, 1997; Soltis and Soltis, 1999; Petrov and Wendel, 2006).
Through observations of root tip cells at mitotic metaphase made during this research, it is
clear that V. rupicola is a complex polyploid. Following the assertion of Heubl et al. (1990) that
Varronia species have a base number of x = 9, counts made by the author would suggest that
V. rupicola is an octoploid. Limited observations of V. bahamensis suggest that it is also a
complex polyploid; however, formal counts were not possible and a ploidy level is not known.
Flow cytometry showed identical genome size measurements for V. rupicola samples
originating from the islands Puerto Rico and Anegada. This suggests that plants in the two

171
countries have a shared ploidy. Results of genotyping (i.e. all samples showed similar numbers
of alleles per loci) support this assertion. Comparison of V. rupicola and V. bahamensis samples
showed the latter to have a smaller genome and supports the findings of phylogenetic
research (see 3.4.3. Main conclusions) that places the two species separately.
Further studies are required to formally establish the ploidy level, ploidy type (e.g.
allopolyploidy) and genome size of either species; however, the research presented here has
provided the initial results required to interpret population genetic data.
4.4.2. Allelic Diversity
Missing data per locus was less than 4% overall except for the loci VRgr3_2 and VRBREYV as
previously discussed. As these samples all originated from Anegada, population level analyses
significantly magnified the missing data to the point that for Anegada East VRgr3_2 and
VRBREYV were missing 24% and 8% data, respectively, and Anegada West was missing 10%
data for VRBREYV. At the population level, all other loci had less than 5% missing data for
analysis group A. Those loci with >5% missing data can be problematic for analyses performed
during this research particularly pairwise distance-based methods (i.e. AMOVA, Mantel) and
results provided from these loci must be interpreted with caution (Dufresne et al., 2014).
GenAlEx allows missing data to be interpolated such that average genetic distances are
interpolated for each population level pairwise value; however, this can lead to bias, especially
if large numbers of missing data are not minimized (Peakall and Smouse, 2012b). Loci missing
>5% data were not considered in analyses undertaken with Arlequin (Excoffier and Lischer,
2011). Comparison of results for pairwise distance-based methods do not suggest that the
missing data have introduced excessive bias; however, further analyses and simulation would
be required to test this assumption (Wang et al., 2012).
Alleles were summarised per locus, by ploidy group and overall using analysis group C samples
(see Table 20). One diploid-acting locus, VRD2DN4, and one polyploid-acting locus, VRE18LG,
lacked private alleles. All other loci contained private alleles, ranging from 1-13. The loci with
ranges >60bp showed the highest number of private alleles (Pa) with the overall highest (Pa =
10) observed in the largest population, Anegada West (see Table 22). Vieques, the smallest
population showed the lowest number of private alleles (Pa = 3). Over half (56%) of the private
alleles were restricted to the British Virgin Islands where the majority of extant plants survive
(see Chapter 2: Biogeography of Varronia rupicola). These results suggest that decreasing
population size has a proportional effect on the number of private alleles within and among
the populations (see Figure 64) and also suggests limited gene flow between the countries as

172
seen in the low (1.863) overall value of Nm and highly significant (P-value<0.001) total
inbreeding coefficient (0.290).
Eight shared alleles have been found between the two BVI populations. For Puerto Rico, there
are four alleles shared between Guánica and Ponce, one allele shared between Guánica and
Vieques and one shared between Ponce and Vieques that are not found in the British Virgin
Islands. The Puerto Rican populations of Guánica, Ponce and Vieques, have four, seven and
three private alleles, respectively. There are ten and five private alleles found in the BVI
populations of Anegada West and Anegada East, respectively. The high number of population
specific private alleles further supports that overall gene flow is low.
One allele found in extant wild material from Anegada and detected in historical herbarium
specimens from Puerto Rico was not found in extant wild material from the latter. This
indicates that the allele has been lost from Puerto Rico as the sampling included the vast
majority of extant (known) individuals in the wild and from ex-situ collections. Two alleles
found in ex-situ collections from Anegada were not detected in extant wild material from that
country. One of these alleles originated from a historical herbarium specimen and ex-situ
collections and one only from ex-situ collections. Due to minimal records for the living
collections, it is not clear whether the sampled plants in the ex-situ collection originated from
wild collected seed or are propagules from another ex-situ collection; therefore, the allele only
detected from ex-situ material could represent an undetected (due to sampling) natural allele
that is potentially lost from the wild or represents a new allele originating from the ex-situ
collections where several species of Varronia coexist. The allele detected in both historical
herbarium specimens and ex-situ collections appears to represent either an undetected
natural allele due to the sampling strategy or is one that has potentially been lost from the
wild. This allele, along with all other rare alleles, is of particular importance for conservation
planning and will be discussed further in 5.2. Conservation strategies.
4.4.3. Genetic Diversity
Puerto Rican Bank regional structure
Determining spatial population genetic structure through inference of the number of
populations (K) by statistical models can be very challenging. The complexity of this process is
discussed in a review by Sisson (2005) and highlighted in several studies (Franco̧is et al., 2006;
Chen et al., 2007; Guillot, 2009; Durand et al., 2009; François and Durand, 2010; Cheng et al.,
2013) trying to determine the most robust models and software packages available for the
task. In this research, a range of different approaches and software packages were employed
to infer K and explore the different results obtained for analysis group A (wild extant samples)

173
data using the diploid- and polyploid-acting loci as a combined data set and separately
depending on the limitations of the different software packages used.
Principal coordinates analysis (PCoA) of all ten loci detected three separate groupings of
individuals based on genetic distances, one for each island, with poor resolution within the
islands of Puerto Rico and Anegada (see Figure 66). A broad grouping of Anegada and Vieques
is shown and provides insight for the best K results seen from the estimations following
Evanno et al. (2005) of K = 2.
Bayesian techniques implementing Markov chain Monte Carlo (MCMC) methods to detect
population boundaries were employed using Geneland and Structure software packages.
These packages assume cluster members being at HWE and the presence of cluster-specific
minimum allele frequencies (Guillot et al., 2009). These assumptions are often unrealistic in
wild populations and estimations of K using Bayesian clustering models may have no biological
grounding depending on the data derived from a given sampling strategy (François and
Durand, 2010). All populations detected by this research deviated from HWE; however, the
results of PCoA analyses, which do not rely on the HWE assumption, were not considerably
different from the results of Bayesian methods (see Table 23, Figure 66). Therefore, it seems
that the HWE deviation has not had a significant negative impact on the Bayesian clustering
results. For the analyses performed (see Table 23), the selection of ancestry model (with or
without admixture) showed no effect on the results. Including a spatial model in Geneland or
prior information about collecting location in Structure had a significant impact on the results
as did the choice of allelic frequency model. François and Durand (2010) also found the
inclusion of spatial information to be beneficial for analyses when comparing different
software programmes. Guillot et al. (2005a) reported the overestimation of K using the
correlated model; therefore, results from Geneland and Structure using spatial information
and uncorrelated data, resulting in K = 5, were selected for post-processing (see Figure 67).
The possible effects of populations not at HWLE on Bayesian methods could be further
explored using packages that assume loci are unlinked (Gao et al., 2007) as part of future
research.
Despite 99% of the samples maintaining their originally assigned population, there were three
samples that were reassigned (see Appendix 10: Population assignment tests, Table 27). Two
of these samples, 378 and 444, originally assigned to Anegada West were reassigned to Ponce
due to log likelihood values (illustrated in Figure 70 for convenience). The grouping of these
samples with the other Anegada West samples suggests that these are possibly immigrants

174
and were correctly placed in the originally assigned population (Paetkau et al., 2004). As such,
the original population assignments appear extremely robust.
Figure 70: Pairwise population assignment graph for Anegada West vs. Ponce using the frequency method of
Paetkau et al. (Paetkau et al., 1995, 2004) showing two samples, 378 and 444, originally assigned to Anegada
West reassigned to Ponce; however, these are closely grouped with the other Anegada West samples as depicted
by the dashed line.
Overall, results showing clear separation of the three islands and further separation of extant
individuals on the islands of Anegada and Puerto Rico into two populations each also appear to
be the most biologically meaningful given the geographical separation (see Figure 57),
historical land-use factors (see Figure 31) and on-going habitat fragmentation (see 2.4.2. Land
cover). As such, the estimation of five clusters was chosen and population analyses were based
on these groupings. These will also be the most practical groupings for conservation purposes
at the country level; however, the broad grouping of Anegada and Vieques should be noted for
the potential of in-situ conservation measures and population management. This will be
discussed further in 5.2. Conservation strategies.
Regional variation between the two countries was the second most significant source of
variation (25%) behind genetic variation within populations (65%). The variation among
populations within countries (11%) was the smallest source (see Figure 65). Overall values for
differentiation between populations were positive (FST = 0.214; G’’ST = 0.510) and the values
were highly significant (P<0.001) confirming that population pairs have genetic differentiation.
These results support the decision to select five populations instead of two as suggested by
other methods (e.g. best K estimations following Evanno et al. (2005)). The results also show
the need for a regional approach to conservation for the species to capture the large amount
of variation at the individual level within populations.

175
An overall, low-level and significant (P<0.001) deviation from HWE (HWEDEV = -0.169) was
observed at the regional level across all loci as well as low levels of homozygosity and weak
inbreeding (FIS = 0.252 and FIT = 0.290) overall (see Table 20) with the inbreeding coefficients
highly significant at the regional level. As previously discussed, these results suggest that some
caution should be taken in relation to the Bayesian techniques used to detect population
boundaries as the packages assume cluster members being at HWLE. Although the HWE
deviation results are significant, the values are low overall and the selected Geneland results
all converged at the same value (K = 5) when using the uncorrelated allele frequencies and
spatial models together. The presence of excess homozygosity and inbreeding in addition to
significant genetic differentiation between populations indicate reduced gene flow at the
species level.
Nonetheless, the isolation by distance (IBD) null hypothesis was not rejected as the overall
value across the five populations (see Figure 69) was not significant (P=0.179). The smallest
population, Vieques, with only six extant individuals remaining on the island showed the
highest IBD values and suggests a relict population and possible bottlenecking. IBD could only
explain 2.8% of the genetic distance between populations and therefore distance between
islands is not the main underlying cause of the reduced gene flow observed in this research.
Country level analyses (see Table 22) were undertaken to compare with regional results and
check for high levels of variation in heterozygosity between the countries. The findings of
these analyses are discussed in the following sections.
Puerto Rican structure
Three populations could be detected based on results of the Bayesian analyses and F-statistics
across the islands of Vieques and Puerto Rico with the latter having two populations defined as
Ponce and Guánica. Observed heterozygosity was lower for Puerto Rico (Ho = 0.430) than the
overall species value (Ho = 0.501). Observed heterozygosity was larger for Guánica (Ho =
0.470), the largest population in Puerto Rico, than the country value. Observed heterozygosity
was proportional to population size across Puerto Rico suggesting that reduction in population
size is having a negative impact on heterozygosity as all values were smaller than expected.
Puerto Rico also had significant P-values for all HWE deviations across loci, but overall
deviation from HWE was similar to the regional value. Overall inbreeding values for Puerto
Rico are higher than the regional (taxon) value and all Puerto Rico populations had larger
inbreeding values than those observed for the BVI. This suggests that the smaller and more
spatially separate populations detected in Puerto Rico are exchanging less genetic material
than those in BVI.

176
The Guánica population showed an overall low level of deviation from HWE with six loci having
significant individual values (P<0.05) for HWE deviation. Guánica showed the second highest
values (n = 22) for linkage disequilibrium (LD) with only one locus not showing signs of LD (see
Table 28). Most loci showed low inbreeding values with an overall highly significant (P<0.001)
value of 0.175 indicating that the population is inbreeding; however, it has the smallest value
for the Puerto Rico populations and is a similar value to the smallest BVI population, Anegada
East.
Overall levels of HWE deviation for Ponce were low and five individual loci exhibited HWE
deviation with significant individual values (P<0.05). Five loci showed LD and Ponce had low to
moderate overall levels with ten linked loci (Table 28). All but one locus showed inbreeding
and with an overall value of 0.196 that was highly significant (P<0.001) indicating that the
population is inbreeding.
The Vieques population level data must be analysed with caution as there were only six
samples available for the analyses; two loci are monomorphic resulting in values not being
calculated for many indices of those loci; and overall values are for only six loci compared to
eight for other populations. With these issues in mind, only one locus showed significant
deviation from HWE and overall HWE was the lowest for all populations. Vieques also had the
lowest LD values overall (n = 4) with only three loci exhibiting LD. Vieques had the largest
inbreeding value (FIS = 0.239) over all populations (see Table 22), and the value was significant
(P-value<0.05). This suggests that the small population size and close proximity of the six
individuals is leading to higher levels of inbreeding than any other population.
Further research is needed to determine the flower morphology, pollination and dispersal (see
5.3.5. Reproduction biology and dispersal), particularly on Vieques, as these factors may be
playing a significant role in the results observed here (e.g. lack of flowers with reciprocal floral
forms for outcrossing).
British Virgin Islands structure
Two populations, Anegada East and Anegada West, were defined for the island of Anegada in
the BVI based on results of the Bayesian analyses and F-statistics. Observed heterozygosity (Ho
= 0.572) was higher for BVI and both of the populations in the country than the overall species
value (Ho = 0.501) or Puerto Rico. The overall deviation from HWE was lower for the BVI (see
Table 22) and significant P-values were observed for all HWE deviations across loci. As for
Puerto Rico, observed heterozygosity was proportional to population size in BVI suggesting
that reduction in population size is having a negative impact on heterozygosity as all values

177
were smaller than expected. Overall inbreeding values for BVI are considerably lower than the
regional (taxon) value. This suggests that the larger and less spatially separated populations
detected on Anegada are exchanging more genetic material than those in BVI. This was also
supported by the results of pairwise population heterozygosity analyses and migrants per
generation (see Table 24, Table 25).
Anegada West is the largest extant population of the species (519 observed individuals) and
had the largest number of samples (n = 116) available for analysis. All loci for the Anegada
West population showed HWE deviation with significant P-values (P<0.01) observed across
loci. A highly significant (P-value<0.001) FIS value of 0.120 (see Table 22) was observed for
Anegada West indicating that the population is inbreeding; however, this was the lowest value
observed across the five populations. The largest number of linked loci (see Table 28) was
observed from Anegada West (n = 26) and all but one loci showed LD.
Anegada East (240 observed individuals, 25 sampled) showed significant (P<0.05) HWE
deviation for five loci and the highest overall HWE deviation value (-0.098) of the five
populations. Due to a significant (P-value<0.05) FIS value of 0.176, Anegada East is inbreeding,
but at levels lower than all of the Puerto Rico populations except Guánica. Five loci showed LD
and overall Anegada East had the second lowest levels with six linked loci.
4.4.4. Main conclusions
Wild samples (n = 260) of V. rupicola collected from three islands with extant individuals in the
PRB were combined with samples from five ex-situ collections (n = 114) and historical
herbarium specimens (n = 6) to undertake population analyses and explore the extant genetic
diversity of the species. Ten polymorphic nuclear microsatellites were genotyped for samples
of V. rupicola and resulted in observation of 107 alleles. Private alleles were observed for each
country and population. Eight microsatellites were diploid-acting with a maximum of two
alleles. The remaining two microsatellites were polyploid-acting with five or eight alleles per
sample supporting the theory that V. rupicola is a complex polyploid. Due to the observation of
ca. 72 chromosomes and up to eight alleles per sample for one of the nuclear microsatellite
loci coupled with the stated x = 9 base number of Heubl et al. (1990), the species is thought to
be an octoploid.
Testing of the ten microsatellites selected for V. rupicola population analyses for cross-species
transferability was successful for 50% of the loci (see Table 19) for one or more species across
ten samples of V. bahamensis, three samples of V. bullata, two samples of V. lima and four
samples of V. polycephala. Further testing is required to determine if these microsatellites are
polymorphic for these species and interpretable for population level studies. Of particular

178
importance is the failure of V. bahamensis, the closest relative (see 3.4.3. Main conclusions)
and species most often confused with V. rupicola, to successfully amplify for 60% of the
microsatellites and did not return matching alleles for those amplified. This further supports
the separation of these two species.
Significant (P<0.05) deviation from Hardy-Weinberg equilibrium (HWE) was observed at the
regional level overall and within all populations; however, the overall value for the species was
low (HWEDEV = -0.169). Low levels of homozygosity and weak inbreeding (FIS = 0.252 and FIT =
0.290) were observed overall, and these were significant (P<0.05). Isolation by distance was
not shown to be significant (P=0.179), but Vieques, the smallest population, did show higher
IBD values than all other populations. Deviations from HWE and evidence of LD should be
further explored to see if other factors are causing the departure from random mating [e.g.
apomictic Varronia species have been suggested (Spoon and Kesseli, 2008)].
Cluster analyses based on Bayesian techniques (see Table 23) converged at the same value of K
(n = 5) when using uncorrelated allele frequencies and spatial information together. Although
fine scale resolution for the islands of Anegada and Puerto Rico (see Figure 66) were not
detected with PCoA, clear separation for the three islands was detected. Population
assignment testing following Paetkau et al. (Paetkau et al., 1995, 2004) showed 99%
assignment values providing very strong evidence for assignments. The three reassigned
samples (see Figure 70) are possibly immigrants and were correctly placed in the originally
assigned population (Paetkau et al., 2004). The estimation of five clusters (see Figure 67)
appears to be the most biologically meaningful given on-going habitat fragmentation,
geographical separation and knowledge of the historical land-use factors (see 2.4.4. Main
conclusions).
Population assignments are also supported by the elevation findings from Chapter 2 (see
Figure 32). The two populations on Anegada (illustrated in Figure 71 for convenience) overlap
in altitudinal range such that Anegada East is found from 0.50 to 3.71 m asl and Anegada West
occurs between 0.90 to 7.45 m asl; however, these populations do not correspond to the
range of the Vieques population (illustrated in Figure 72 for convenience) found 12 m asl or
either of the Puerto Rican populations (illustrated in Figure 73 for convenience) found
between 60 and 214 m asl. The altitudinal ranges of populations on the last two islands do not
overlap either. Ponce samples ranged from 60 to 128 m asl whereas Guánica samples used for
population analyses ranged from 133 to 214 m asl. The links to geological findings and the
conservation implications of this research will be further explored in 5.1. Conservation
implications.

179
Figure 71: Map of Varronia rupicola populations on Anegada with observation records (purple circles) and
coloured polygons to demarcate populations: Anegada west = Dark green polygon; Anegada east = Red polygon.
Figure 72: Map of Varronia rupicola population on Vieques with observation records (purple circles) and coloured
polygons to demarcate populations: Vieques = Pink polygon.

180
Figure 73: Map of Varronia rupicola populations on Puerto Rico with observation records (purple circles) and
coloured polygons to demarcate populations: Guánica (Guánica and Yauco) = Light green polygon; Ponce
(Peñuelas and Ponce) = Blue polygon.
This research set out to provide answers for a series of important questions for the
conservation and management of V. rupicola genetic diversity.
• First, are populations on the islands of Anegada, Vieques and Puerto Rico genetically
distinct from one another? Yes. Clear separation is observed through analysis
methods employed [e.g. PCoA (see Figure 66), cluster analyses (see Figure 67)] and
private alleles are observed for each island (see Table 22). Also, all populations show
highly significant genetic differentiation (see Table 25).
• Second, are there genetically distinct populations found within any of the islands?
Yes. Separation is shown in cluster analyses using Bayesian techniques for five
populations (see Figure 68): one on Vieques (see Figure 72) and two on each of the
islands of Anegada (see Figure 71) and Puerto Rico (see Figure 73). Significant values
for genetic differences between populations (pairwise FST) were observed as well as
private alleles for each population (see Table 22).
• Third, has genetic diversity been impacted by a reduction in population size?
Apparently so. Vieques shows the highest inbreeding coefficient value and the lowest
allelic diversity. These values are proportional to the size of the population across the

181
five populations (see Figure 64) which all show lower observed (Ho) than expected
(He) heterozygosity.
• Fourth, do existing ex-situ collections adequately represent the extant genetic
diversity of wild populations? No. Existing ex-situ collections only capture 44% of the
43 private alleles found in the wild. Existing ex-situ collections currently capture 14 of
the 25 British Virgin Islands private alleles and five of 20 Puerto Rican private alleles, all
from the Guánica population resulting in none of the private alleles in the Vieques or
Ponce populations being captured.
• Fifth, do existing ex-situ collections or samples from historical specimens reveal a
loss of wild genetic diversity? Yes. Two alleles detected in existing ex-situ collections
or historical specimens from Anegada were not detected in the wild. One allele
detected in historical specimens from Puerto Rico was not detected in the extant wild
or ex-situ samples. This allele was detected in Anegada from extant wild samples
suggesting it is lost from Puerto Rico.
The implications of these findings will be explored further (see Chapter 5: Discussion,
conservation implications and research opportunities) with a specific focus on how the
remaining genetic diversity observed in extant populations is linked to substrates and land
cover across the native range of the species. This will be explored in the context of existing
conservation measures, including protected areas and ex-situ collections, and
recommendations for the species conservation and future research will be made based on
the research presented here.

182
Chapter 5: Discussion, conservation implications and research
opportunities Based on the findings of this research, it is clear that V. rupicola and V. bahamensis are
different but closely related species which occur in separate geographical areas and that other
Varronia species sampled are more distantly related. This was specifically observed through:
• phylogenetic analyses using the trnLUAA intron resolved the type material and modern
samples of V. rupicola and V. bahamensis together, but in separate clades;
• combined ITS and trnL-trnF data resolved samples of the two species from across their
native ranges as sister species in a well-supported (MP (96%), ML (95%) and BI (100%))
clade;
• flow cytometry showed that samples of V. rupicola from both BVI and Puerto Rico had
the same genome size which was larger than that of a V. bahamensis sample from the
northern Bahamas;
• of the ten microsatellites selected for V. rupicola that amplified for all samples
collected across the PRB, six did not amplify in V. bahamensis samples collected across
the Bahaman Archipelago;
• V. rupicola occurs on a very limited number of substrates on three islands in the PRB;
• micromorphological differences observed by the author during exploratory research
between these species as discussed below in 5.3. Research opportunities.
This research brought to light several historical collections not previously known to workers in
the PRB and provided new observation and voucher records through field survey as well as the
confirmation of site and historical records from other workers across the native range of the
species. The extant native range of V. rupicola (see Figure 21) is now known to be the islands
of Puerto Rico (south-western coastal municipalities of Guánica, Yauco, Peñuelas and Ponce);
Vieques (Puerto Ferro); and Anegada (across the island in 27 localities). This has provided a
snap-shot of the extant metapopulation and enabled detailed assessment of the species
biogeography.
Varronia rupicola plants were only found on specific substrates across its native range. On the
island of Anegada (see Figure 22) the species was recorded on Pleistocene limestone and
Quaternary deposits of sand. Pliocene limestone was found to support the species on the
island of Vieques (see Figure 23), whereas substrates on the island of Puerto Rico, Juana Diaz
and Ponce limestone formations (see Figure 24), were found to be the oldest deposits
(Miocene origin) supporting the species. The limestone substrates found on each island are not
known to occur on other islands in the PRB.

183
Overlying the substrates supporting the species, V. rupicola plants were found to be associated
with specific land cover types across its native range. The regional habitat classifications of
Kennaway et al. (2008) for the Virgin Islands and Kennaway & Helmer (2007) for Puerto Rico
showed the species to prefer ‘Deciduous, Evergreen Coastal and Mixed Forest or Shrubland
with Succulents’ on Anegada and ‘Semi-Deciduous and Drought Deciduous Forest on
Karst/limestone (includes semi-evergreen forest)’ on Vieques and Puerto Rico. The latter
classification is not found on Anegada, whereas the former is found in Puerto Rico although
the species was not recorded in that land cover type in the country.
Varronia rupicola was found, in both countries and all three islands (see Figure 28), to occur
within protected areas (established and proposed) containing 32% of the remaining intact
preferred habitat of the species. The area of preferred land cover types for V. rupicola
contained within these protected areas varies widely with the smallest proportion protected
(15%) per island found on Anegada where the largest number of extant individuals remain. The
potential consequences of this variation and the on-going loss of suitable habitat across the
three islands on the substrates known to support the species are discussed further in the
following sections. Maps below include no new data and are provided to assist the reader with
visualisation of the discussion without referring back to other chapters.
5.1. Conservation implications The implications of the current distribution and composition of protected areas across the PRB
for the conservation of V. rupicola vary significantly between the islands. This is due to many
factors including the numbers of extant individuals, the amount of remaining preferred habitat
and the overall area of substrates that support the species. On each island, these factors may
be significantly impacted by future climate change, especially in relation to elevation.
Chapter Three determined the placement of V. rupicola and its relationship with
morphologically similar and often confused species. This was paramount for conservation
planning as the confusion, particularly with V. bahamensis, has led to on-going issues with
voucher curation and literature references to the two species distributions which negatively
impact conservation recommendations and action. The findings of Chapter Four indicate that
there are five populations found in the PRB with varying levels of allelic and genetic diversity as
well as low levels of inbreeding. These findings are of particular significance for the species
conservation and must be taken into account when developing management plans. In Chapter
Two, the species biogeography was explored and the findings show that the species ecological
preferences and native range put it at risk of extinction as discussed below in relation to the
species population genetics.

184
5.1.1. Geology and land use
The limited area of occupancy (AOO), reliance on intact habitat and isolation to relatively small
areas of specific substrates make V. rupicola particularly susceptible to impacts from human
activities. Historical land use is poorly understood across the native range of V. rupicola due to
a lack of detailed records and maps along with poor oral history; however, long-term habitat
modification has been documented across the PRB (Schomburgk, 1832; Eggers, 1879; D’Arcy,
1971, 1975; Murphy and Lugo, 1990; Lugo et al., 1996; Molina Colón and Lugo, 2006; Ramjohn
et al., 2012) since before the species was described by Urban in 1899. On the island of
Anegada, historical agricultural features were digitised by the author (see 2.3.2. Land cover).
The resulting features with all observations recorded of the species and the populations
defined by this research are shown in Figure 74. Impelling evidence of the impact of historical
land use on Anegada are shown through the nearly continuous corridor of disturbance in the
middle of the island overlaid with the observations that show a distinct (1.75 km minimum)
gap between plants occurring in the two identified populations.
Figure 74: Map showing historical agriculture features as well as populations detected and observations of extant
Varronia rupicola recorded between 2012 and 2015 on Anegada.
The isolation of extant individuals at a single location on the island of Vieques suggests that the
historical habitat disturbance as well the potential impact on pollinators and dispersers during
the 60 year period of use by the U.S. Navy has had a hugely negative impact on the species.

185
This assertion is supported by results of genetic analyses that showed the lowest number of
private alleles and the lowest allelic richness for Vieques as well as the highest values for IBD
and inbreeding.
Historical disturbance on Puerto Rico is well documented with Figueroa-Colón (1996) stating
that 90% of the Puerto Rican forests have been modified and only ca. 1% of the mature
vegetation was untouched. The separation of plants on Puerto Rico into two populations
suggests that historical disturbance has impacted gene flow. The area between these
populations where no modern records exist is centred on the municipality of Guayanilla. Of
particular importance in this area are the developments of an oil refinery and a major highway
that cut between the populations detected.
The historical disturbance that led to habitat loss is also the greatest current threat to the
species. Quarrying and landfills are common developments across the species native range
(Huggins et al., 2007), particularly in areas not already developed for anthropogenic
infrastructure. This research found that the limestone geology that supports the species is very
limited with only 19.80 km2 (10%) of Pleistocene limestone on Anegada, 6.28 km2 (3%) of
Pliocene limestone on Vieques and 165.82 km2 (86%) of Miocene limestone formations (Juana
Diaz limestone (67.83 km2) and Ponce limestone (97.99 km2)) on Puerto Rico. With such a small
area of potential habitat to begin, all development and disturbance on these limestone
formations can have a significant negative impact on the species, particularly as V. rupicola is
only found in a limited number of habitats covering these substrates.
Urban developments on the limestone formations that support V. rupicola lead to
fragmentation of the species already limited, preferred habitat. In 2014, 20.04 km2 of the
species preferred habitat remained on Anegada (see Figure 25) while only 2.86 km2 remained
on Vieques (see Figure 26). Significantly more habitat remained on Puerto Rico with 65.06 km2
(see Figure 27) found to be overlying the specific substrates that support the species. The
limited numbers of individuals and locations mean that V. rupicola is also threatened by
habitat degradation caused by feral animals, recreation and human-induced fire, even within
protected areas.
The currently limited human population on Anegada have a much less significant impact on
the landscape compared to the Puerto Rican islands; however, Anegada has the potential for
island-wide development (BVI Department of Town and Country Planning, 1993) with local
community support and road improvement works underway. The species currently has no
legal protection in BVI and there are no existing protected areas on Anegada. The Government
of the Virgin Islands has produced plans for two new protected areas on Anegada that would

186
encompass part of the substrates and preferred habitat of the species on the island. Although
a welcome addition to the BVI protected areas network, these areas will provide very little
protection of V. rupicola preferred habitat as only 3.17 km2 falls within these proposed areas
(see Figure 40). Nonetheless, the proposed protected areas on Anegada will secure a
significant proportion of the extant individuals with 39% of those observed between 2012 and
2015 (Figure 75). The proposed Western Ponds Protected Landscape will capture over half
(51%) of the Anegada West individuals (total = 519) while the proposed Eastern Ponds
National Park will only capture 13% of the Anegada East individuals (total = 240).
During field surveys, the author observed high levels of habitat disturbance including the
operation of heavy machinery to clear vegetation and anthropogenic development within the
boundary of the proposed Western Ponds Protected Landscape. Varronia rupicola plants were
killed, in significant numbers, without regard to the species globally threatened status. Feral
livestock roam free grazing and degrading the landscape within the boundaries of both
proposed protected areas and across the entire island. These animals, often malnourished and
unable to find adequate amounts of fresh water, have altered the landscape immeasurably.
Their continued, unmanaged presence in the landscape is environmentally unsustainable along
with being an animal welfare issue.
Figure 75: Map showing proposed protected areas, Quaternary deposits (sand and alluvium) and Pleistocene
limestone deposits on Anegada with extant Varronia rupicola recorded between 2012 and 2015.

187
The Vieques NWR is home to the six V. rupicola recorded on the island during this research at a
single location on the Puerto Ferro peninsula. Although all of the extant individuals and all the
substrates known to support the species and its preferred habitat (2.86 km2 remaining in 2014
(see Figure 41)) are found within the Vieques NWR (eastern tract) or the adjacent DRNA
reserve (Figure 76), the species future survival and the conservation of the remaining genetic
diversity on the island is not certain as both of these areas experience significant levels of on-
going disturbance and degradation. The single location and tiny area (ca. 50 m2) occupied by
the species adjacent to an access road make it highly susceptible to extirpation from the
island. Road works undertaken in the years immediately prior to this research without proper
management were thought to have resulted in the extirpation of the species from Vieques.
Fortunately, V. rupicola re-established through propagules (seed and/or root shoots) and was
located during this research. Activities allowed/undertaken in the area in future need to be
fully assessed and overseen to ensure that the species and its habitat are not impacted again
as a single event could result in the loss of all genetic diversity found on the island.
Figure 76: Map showing protected areas and Pliocene limestone deposits on Vieques with the location of the six
extant Varronia rupicola recorded on the Puerto Ferro peninsula between 2012 and 2015.
The largest island, Puerto Rico, also has the most human inhabitants. Significantly more
anthropogenic issues were observed on Puerto Rico during this research which include
increased disturbance through recreational activities, development/maintenance of

188
infrastructure and vandalism (e.g. fire). These issues are documented (U.S. Fish and Wildlife
Service, 2010) and were observed during this research being as prevalent, if not more so,
within protected areas as they are outside of them and are directly impacting V. rupicola and
its habitat. Guánica State Forest in south-western Puerto Rico is divided into two main tracts of
land that are separated by significant anthropogenic disturbance and Guánica Bay. Both tracts
of the forest were found to support extant V. rupicola with the eastern tract containing the
greater number of plants (n = 94) when compared to the three found in the western tract.
Both tracts of forest suffer from arson attacks/escaped fires and significant levels of
unauthorised trail clearance for recreational use as well as disturbance caused by clearance for
accessing electrical distribution infrastructure. However, the plants and their habitat have a
much better chance of survival compared to those found in unprotected areas where
conversion from intact, mature forest to urban development is ongoing and documented
during this research. There is currently only 22.08 km2 of the species preferred habitat within
existing protected areas (see Figure 42), mainly within Guánica State Forest. This results in 59%
of the extant plants under protection and 86% of the Guánica population (total = 113) under
protection (Figure 77). This means that none of the Ponce population (total = 52) or its genetic
diversity is protected in-situ.
Figure 77: Map showing extant Varronia rupicola recorded between 2012 and 2015 as well as protected areas
and Miocene limestone deposits on Puerto Rico within the species native range.

189
5.1.2. Sea level rise
Past sea level rise
Past sea level rise has undoubtedly had a significant impact (positive and negative) on the
species genetic diversity through connectivity between as well as isolation of the islands and
substrates that are home to extant V. rupicola. Substantially larger areas of limestone
substrates and sandy deposits overlying limestone were available for colonisation during
periods of lower seas. This was particularly true during the LIG when limestone known to
support extant plants across the three islands was fully formed. This may have resulted in
considerably larger populations and increased gene flow as the exposed land would have
opened opportunities for the movement of genetic material (i.e. pollen and seed) from non-
avian organisms (e.g. reptiles).
Within the past 8,500 years, the Virgin Islands were separated from Puerto Rican islands and
within a short period (1,500 years) the individual islands of the PRB were isolated with slightly
larger land masses. During the period up to 3,000 ybp the sea level rose to near current levels
and has since been fairly constant. Therefore, the sea separating the islands with V. rupicola
would have probably limited gene flow to avian seed dispersal over the past 7,000 years. The
limited gene flow between islands coupled with the limited area of exposed limestone
substrates and subsequent anthropogenic disturbance of the habitats covering those
substrates led to further limitation of gene flow within islands and the development of the five
populations detected by this research.
Future sea level rise
The implications of future sea level rise for the long-term survival of V. rupicola depend mainly
on the human response and the amount of rise experienced. If there are active, global efforts
to curb GHG emissions and keep the global temperature from rising above the 2 °C threashold
(IPCC, 2012), lower levels of sea rise may be experienced. If these efforts are undertaken in
conjunction with coastal defences and mitigation strategies, the impacts could be minimal
over the coming centuries (Traill et al., 2011). Alternatively, continued or accelerated GHG
emissions and abandonment of coastal areas could have hugely negative impacts on V.
rupicola, its habitat and our planet, generally.
The lowest lying island within the species native range is Anegada which has a maximum
elevation of just over 8 m. The impacts of the four IPCC RCP scenarios for 2100 (IPCC, 2013a)
were explored for Anegada (see Figure 35) and showed a minimal direct impact on extant
individuals of V. rupicola (see Figure 36). If sea levels rise significantly more over the coming
centuries, the survival of V. rupicola on the island is in doubt through direct inundation of the

190
land and increased salinity of the fresh water lens. The scenarios of 1 m, 2 m, 3 m and 6 m for
2100 to 2300 showed significant impacts across Anegada with the species current locations
being all but lost with a 6 m increase (Figure 78). The entire Anegada East population lies
below 3.8 m asl and only ten individuals in the Anegada West population are found above 6 m
asl. Active measures and international collaborations will be required to secure the genetic
diversity currently found on Anegada in light of these data using a suite of techniques.
Figure 78: Map showing the impact of future sea level rise scenarios for 2100 to 2300 AD (Bellard et al., 2014) on
extant Varronia rupicola on the island of Anegada
The situation on Vieques and Puerto Rico is not as dire, at least for the direct impact of rising
seas. The 1 m, 2 m, 3 m and 6 m scenarios for 2100 to 2300 (see Figure 34) showed that V.
rupicola plant locations on Vieques would not be affected due to the population being found
12 m asl (Figure 79). Similarly, the Ponce and Guánica populations on Puerto Rico Island will
not be affected as they occur above 60 m and 133 m asl (Figure 80), respectively.

191
Figure 79: Map showing the impact of future sea level rise scenarios for 2100 to 2300 AD (Bellard et al., 2014) on
extant Varronia rupicola along the southern coast of Vieques Island.
Figure 80: Map showing the impact of future sea level rise scenarios for 2100 to 2300 AD (Bellard et al., 2014) on
extant Varronia rupicola along the southern coast of Puerto Rico Island.

192
Rising sea levels could have significant indirect impacts on V. rupicola populations across the
three islands. Anegada could potentially become an untenable option for human habitation in
the coming century or be developed such that all available land is completely altered for
human use. Depending on the overall sea level rise experienced and the human response, the
island could remain as a refuge for the species or become uninhabitable. The latter due to lost
habitat through combined sea level rise and human development on the remaining exposed
land. Further loss of genetic diversity and higher levels of inbreeding should be expected
unless active conservation measures are implemented to counteract these impacts.
Rising seas around Vieques could isolate the Puerto Ferro peninsula such that it becomes an
isolated cay separate from the main island. This phenomenon could also be repeated around
the adjacent Pliocene limestone formations. This could potentially limit human disturbance in
these areas and result in a positive outcome for the species long-term conservation. The
isolation of the Vieques and Anegada populations on smaller land masses with less elevation
would mean that they would be more susceptible to the issues discussed in 5.1.3. Natural
disasters.
Outside of existing protected areas on Puerto Rico Island the indirect impacts could be the
most detrimental as the human population seeks refuge from rising seas in areas with higher
elevation close to existing infrastructure. Given the significantly higher elevations of the Puerto
Rican populations, isolation and reduction of the extant habitat directly through sea level rise
will not be an issue; therefore, the protection of these populations is paramount for the
species long-term survival as discussed in 5.2. Conservation strategies.
5.1.3. Natural disasters
The native range of V. rupicola is prone to natural disasters, particularly hurricanes and
tsunamis (Parsons and Geist, 2009; Elsner and Jagger, 2010; Atwater et al., 2012). The
International Panel on Climate Change (IPCC, 2012) state that a 2 °C to 5 °C rise in the daily
maximum of global temperature by the end of 2100 will likely result in higher wind speeds in
tropical cyclones. This is of particular concern for V. rupicola as the Caribbean Sea has a very
high ocean heat capacity which drives hurricane intensity (Elsner and Jagger, 2010). Although
V. rupicola and the other native species found in the PRB dry forests are adapted to cyclonic
activity, more intense storms brought on by climate change in a relatively short period may
prove to be too much for these species to cope with, particularly in already altered landscapes
where water retention is lowered by exposure to direct sunlight and drying winds.
The impact of storm surge associated with higher sea levels and more intense hurricanes could
result in greater levels of inundation, especially on low-lying Anegada. These surges have the

193
capacity to change the landscape profoundly through alteration of habitats due to salt
intrusion of the freshwater lens and vegetation mortality (Sah et al., 2010). Intensive storms
can also cause major changes to the coastlines with up to 30 meters of gain or loss recorded in
a single storm event (UNESCO, 1989). Quaternary deposits on Anegada are highly susceptible
to storm surge and could lead to the opening/closing of sea connections to the interior salt
ponds as has been documented by past events (Atwater et al., 2012). If significant alterations
were made to the Quaternary deposits, V. rupicola populations could be directly impacted by
further habitat loss and fragmentation as well as indirectly through salinisation of the
freshwater lens.
The native range of V. rupicola has been struck by several documented tsunamis originating
from earthquakes in the region (Parsons and Geist, 2009) or from as far away as Europe
(Atwater et al., 2012). The low-lying nature of Anegada makes V. rupicola populations
particularly susceptible to extirpation through tsunami induced impacts. These can be either
direct mortality from overwash or indirect mortality caused by salt water intrusion of the
freshwater lens. Increased sea levels will only exacerbate the potential impacts of tsunamis in
the future.
Depending on the amount of sea level rise experienced, the V. rupicola population on Vieques
could be impacted by future tsunamis. Parsons and Geist (2009) state that Vieques
experienced 6.1 m tsunami induced waves in the past. A similar magnitude tsunami following 6
m sea level rise or greater magnitude following less severe sea rise would have the potential to
impact the Vieques population.
Tsunamis are not expected to have any direct impacts on Puerto Rican V. rupicola populations
due to the species altitudinal range (>60 m asl); however, the indirect impacts could be
significant if the human population was forced to develop new infrastructure (i.e. roads, power
transmission) and urban developments at higher elevations. The latter should not impact
populations in existing protected areas, but the former could impact protected populations
due to easements allowed for such infrastructure on public land. Developing a robust
management plan for the species that takes the above issues into account will require
significant resources and support from a wide range of stakeholders as discussed in the next
section.
5.2. Conservation strategies Effective conservation management should aim to preserve the maximum genetic diversity of
a species through capture of allelic richness as well as genetically different populations in order
to enable adaption to environmental change (Frankham et al., 2002). Defining distinct

194
conservation units for V. rupicola should focus on the detected genetic, observed ecological
and existing political boundaries across the species native range. Genetic data presented here
suggest that a single evolutionary significant unit (ESU) is present in the PRB; however, the five
distinct populations detected should be conserved such that the species potential for
adaptation and evolutionary success are maximised (Crandall et al., 2000). As the loss of any
population would result in reduced adaptation potential and lower diversity, each of the five
populations should be defined as separate management units (MUs) in the short-term (Moritz,
1994). Movement of individuals between MUs may be warranted if significant inbreeding is
detected (Moritz, 1999), populations are small or at risk of extirpation due to external factors
(e.g. anthropogenic disturbance, natural disasters). As these data presented here have met
these criteria, management plans should consider movement of genetic material between
MUs; however, careful consideration must also be given to the potential for outbreeding
depression (Frankham et al., 2011) and experimental trails are suggested (see 5.2.3.
Conservation introduction).
Given the limited total area of substrates and habitats that are known to support V. rupicola, a
range of different conservation strategies will need to be employed to ensure the survival of
the species in the face of on-going habitat loss and the potential impacts of climate change
discussed previously. Every effort should be made to designate further protected areas that
will capture more of the species preferred habitat and genetic diversity as V. rupicola is more
likely to survive stochastic events in the long term in a network of areas that facilitate gene
flow (Soulé, 1985). This is particularly important on Puerto Rico where none of the Ponce
population is protected in-situ.
Changes to existing and introduction of new management practices are required to ensure the
species is not adversely affected in protected areas across the PRB. The predominance of the
species to grow along roads, trails and powerline clearings in Puerto Rico has led to several
documented (U.S. Fish and Wildlife Service, 2010) and observed (this research) instances
where individual V. rupicola plants have been damaged or even killed. New measures to
control feral animals on Anegada, fire on Puerto Rico and unsanctioned vegetation clearance
across the species native range are urgently needed. This will require close collaboration
between conservationists, land managers/owners, maintenance practitioners and the local
communities. While not impossible, this will not be easily accomplished; therefore,
complementary and engaging approaches are needed to garner local support.
An awareness raising campaign should be started with the main goals of enabling the
identification of the species by non-botanists and highlighting the global importance of the

195
species to local communities. This campaign should include the production of posters for
display in protected areas and public facilities, species fact sheets for distribution to local
communities and schools, presentations about the species to local community groups and
schools as well as local and national government officials. Communities must be made aware
that V. rupicola is part of the local, national and cultural heritage and the species is in decline.
To assist fundraising and awareness raising efforts, the species should be reassessed for the
IUCN Red List based on the findings of this research. Initial assessment using this new
information indicate that the species should be downlisted from ‘Critically Endangered’, but
will remain in a threatened category. Following re-assessment, targeted communications with
BVI Government officials should be undertaken to promote the species inclusion in national
legislation for protected status such that across its range V. rupicola has legal protection. The
global assessment and threat status should also be highlighted to Puerto Rican as well as
United States Government officials and agencies to facilitate and promote cross border
conservation initiatives.
The IUCN Species Survival Commission (SSC) guidelines (2013) for conservation translocation,
or moving organisms from one place to another deliberately for a positive conservation
outcome, provide a detailed framework for developing conservation plans for V. rupicola.
Restoration of degraded habitat and reinforcement plantings (IUCN/SSC, 2013) to bolster
numbers of individuals should be undertaken within existing protected areas and beyond the
species recorded native range as conservation introductions (i.e. assisted colonisation
(IUCN/SSC, 2013)). In the dry forests that support suitable habitat for V. rupicola in south-
western Puerto Rico, the soil is predominantly high in organic matter and found in pockets
between exposed limestone (Murphy and Lugo, 1990; Lugo et al., 1996; Monsegur, 2009).
Anegada soils on exposed limestone are similar to those described for Puerto Rico; however,
V. rupicola also occurs in the Anegada Ridge Plain Formation where the soils are composed of
sand with organic matter (Gore, 2013). Habitat restoration and reinforcement plantings using
nursery grown plants in thin soils on rocky substrates as well as freely drained sandy soils can
be very challenging and will require supplemental irrigation to ensure establishment and
survival (Gilman et al., 2009).
Compounding the challenges of restoring habitats and establishing new V. rupicola plantings
are the potential impacts of insect pests (Serra et al., 2003; Malumphy et al., 2012) as well as
climate change induced drying and prolonged droughts (IPCC, 2012). With dry forests already
suffering a water deficit for up to ten months of the year (Miller and Lugo, 2009), climate
change causing more intense droughts over the coming century could prove to be too much

196
for V. rupicola to cope with, especially in degraded habitats. Building resilience through habitat
restoration and bolstering populations with supplemental plantings could be key measures for
securing the species survival.
Climate change induced stress could result in plants being more susceptible to existing and
new pests throughout the PRB. Two pest insects were found attacking V. rupicola across
Anegada (Malumphy et al., 2015) during the course of this research. The fact that one of these
pests was a new record for the BVI (Malumphy et al., 2015) suggests that increased biosecurity
is needed to reduce the spread of established pests across the PRB and introduction of new
pests to the region.
The populations detected by this research and the remaining genetic diversity are thought to
be the result of adaptation to specific ecological niches, habitat fragmentation (i.e. sea level
rise and subsequent anthropogenic disturbance) and potentially many more factors not
explored in this research. This has significant implications for management planning,
particularly if separate MUs are to be maintained (Moritz, 1994). In the short-term, the
precautionary approach of maintaining the five populations separately is suggested; however,
the threats to the species survival may become so great that maintaining separate populations
is impossible. To evaluate the variations observed in habitat, substrate and elevation as well as
the possible deleterious effects of mixing populations, further research should be undertaken
and will be discussed further in 5.3. Research opportunities.
In light of the currently limited in-situ protection and the challenges discussed previously,
several different conservation measures should also be employed including in-situ
reinforcement coupled with habitat restoration, ex-situ collections and conservation
introductions (IUCN/SSC, 2013). Suggested approaches are discussed in the following sections.
5.2.1. In-situ conservation
Once established, the two proposed protected areas on Anegada would offer opportunities for
habitat restoration and conservation translocations (i.e. population reinforcement) as both
areas have experienced significant degradation through feral animal grazing/trampling and
anthropogenic disturbance. Excluding the feral animals, or preferably permanently removing
them, would have an immediate positive impact on the habitat and enable planting activities
to be undertaken without grazing pressure on the establishing plant material. Small exclosures
(20 x 20 m) could be trialled to demonstrate proof of concept for population reinforcement
and restoration plantings on sand and limestone within the protected areas if feral animal
exclusion or management across the landscape is not achievable in the short-term. Overall,
reinforcement and restoration plantings should be planned such that areas with the highest

197
elevation are included to build resilience against sea level rise and natural disasters. Within
The Settlement, the grounds of the rock iguana head start facility would make an ideal location
for reinforcement plantings of the Anegada West population. Using this location would
minimise monitoring/maintenance costs and the plantings could serve as an educational and
outreach resource once adequate interpretation and NPTVI staff training is provided. As the
location is already fenced to exclude feral animals, planting activities could be undertaken
immediately using rescued seedlings from road verges/areas slated for development.
Subsequently, further plants grown from seed could be planted at the site to bolster the
collection.
In the country of Puerto Rico and within the known historical range of V. rupicola, there are
two established protected areas, Guánica State Forest and Vieques NWR, with extant
individuals. Both protected areas offer opportunities for habitat restoration of degraded dry
forest overlying the limestone substrates known to support the species. The eastern tract of
the Vieques NWR includes the former U.S. Navy Eastern Maneuver Area where extensive
modification of the landscape resulted from the military’s use that included exercises that left
UXO in the landscape. The removal of identified UXO is underway and often requires the
vegetation to be clear-cut. There are plans for subsequent restoration (CH2M HILL, 2012b) and
this could include specific habitat improvement for V. rupicola as well as population
enhancement through reinforcement plantings using material from the Vieques population.
Both of the Puerto Rican protected areas have public access (though currently limited in the
Vieques NWR) that leads to habitat degradation through recreational uses (e.g. unauthorised
trail cutting, fires and pollution). Habitat restoration, especially in areas of the western tract of
Guánica State Forest that were burnt or cleared for powerline maintenance could potentially
provide a significant amount of new habitat for reinforcement plantings of V. rupicola sourced
from the Guánica population. Areas for potential habitat restoration in the Guánica State
Forest eastern tract are numerous; however, large areas of intact habitat exist that are less
susceptible to anthropogenic disturbance and would be ideal for reinforcement plantings of
the Guánica population with minimal resources required. The species should also be planted in
close proximity to the forest headquarters in the eastern tract for ease of
monitoring/maintenance and to reduce the risk of vandalism. These plantings could also serve
as an educational and outreach resource if adequate interpretation and forest staff training is
provided. Existing plants held in the forest nursery could be used immediately to undertake
these plantings, particularly near the forest headquarters.

198
5.2.2. Ex-situ conservation
The on-going loss and fragmentation of habitat as well as the potential for future threats from
sea level rise and natural disasters puts V. rupicola populations at risk of extinction. Limited
resources and habitat protection compounded by small population sizes mean that in-situ
conservation measures alone leave populations at risk. To overcome these limitations, in-situ
activities should be complemented by ex-situ conservation measures. This would also provide
future opportunities for population reinforcement, assisted colonisation and conservation
translocation to be undertaken using these ex-situ collections.
The success of an ex-situ collection to preserve the genetic diversity of V. rupicola will depend
on the representativeness of the material. Capturing all the extant genetic diversity in living
collections of plants is possible, but most likely impractical due to nursery and planting space
constraints. Alternatively, seed banking is an economical and safe way to preserve the genetic
diversity of an orthodox (desiccation tolerant) species like V. rupicola in a small space with few
long-term resource needs (Li and Pritchard, 2009). The representativeness of the seed
collection and its subsequent ability to supply adequate material for population reinforcement,
assisted colonisation and conservation translocation will be determined by the sampling
strategy. The strategy employed must ensure that genetically distinct populations are collected
throughout the species range and a high proportion of extant individuals are sampled (Hoban
and Strand, 2015).
During this research, conservation collections (plants and seeds) were documented at several
locations (see Appendix 1: Varronia rupicola records - Cultivated material held in ex-situ
collections). Material originating from Anegada was found at three institutions: The J.R. O'Neal
Botanic Garden, Tortola, BVI; Royal Botanic Gardens, Kew, UK; and Fairchild Tropical Botanic
Garden, Dade County, Florida, USA. A single seed collection is held in the Millennium Seed
Bank. These Anegada collections are all thought to have originated from the Anegada West
population; therefore, securing collections (seed/cuttings) from across the Anegada East
population is paramount. Further collections from the Anegada West population should be
secured as well, ensuring that new material is collected from across the population.
Conservation collections from Puerto Rico have also been established at three locations: Royal
Botanic Gardens, Kew, UK; Department of Natural and Environmental Resources (DRNA),
Guánica State Forest, Guánica, Puerto Rico; and USFWS, Cabo Rojo NWR, Cabo Rojo, Puerto
Rico. All of these Puerto Rican collections are thought to have originated from the Guánica
population; therefore, securing material (seed/cuttings) from across the Ponce population and
the six individuals on Vieques is crucial for the species conservation. As no seed collections are

199
known to exist from Puerto Rico, collections should be secured, ensuring that seed are
collected from across the three populations.
Maintaining living plants in botanic gardens is beneficial, especially for research and
educational purposes; however, these collections must be maintained to ensure records are
accurate and also monitored to ensure that the species does not escape (i.e. in tropical
locations like Florida outside the species native range). If the material will be used for
population reinforcement, assisted colonisation and conservation translocation, progeny
should be destroyed unless they are from known crosses or asexual propagation to ensure that
the potential negative effects of hybridisation, inbreeding and outbreeding are minimised.
5.2.3. Conservation introductions
Conservation introductions should be undertaken following the IUCN/SSC guidelines (2013)
and planned such that areas with low elevation (<5 m asl) are generally avoided to ensure
resilience against sea level rise and natural disasters. There may be instances were plantings
below 5 m asl are warranted to test the species ecological adaptation, develop nursery stock
on soils with higher moisture content/retention or make use of intact habitat within
established protected areas. If plantings are undertaken in such areas, the potential loss of the
material must be taken into account and mirrored collections containing the same genetic
diversity should be maintained elsewhere for security.
There are no known areas of suitable limestone substrate within BVI other than Anegada to
consider for conserving V. rupicola. There are deposits of Quaternary sand within protected
areas on several other islands in BVI; however, these are outside the species known range and
will not afford long-term resilience against sea level rise and natural disasters as these are all
less than 5 m asl. As discussed previously, conservation introductions in these areas should
only be considered as experimental or potentially short-term measures.
Given the lack of suitable areas within BVI to conserve the genetic diversity detected in the
two Anegada populations of V. rupicola, conservation introductions to other islands should be
considered, particularly within protected areas with limestone deposits known to support the
species. Multivariate analyses (i.e. PCoA) showed an overall grouping of Anegada and Vieques
population samples. This could justify a conservation introduction of Anegada material to
Vieques. Following the UXO removal at Punte Este and subsequent habitat restoration,
Anegada material could be planted within the Vieques NWR to provide added resilience
against sea level rise.

200
Vieques also has a second protected area adjacent to the Vieques NWR containing Pliocene
limestone and suitable habitat for V. rupicola which is managed by the DRNA. This area would
be ideal for conservation introductions using material from the six extant plants in the Vieques
population. The DRNA protected area also has extensive Quaternary sand deposits that have
been heavily degraded. These areas could be ideal locations for educational and outreach
plantings of the species. Interpretation could be used to raise awareness in the local public
about the negative impact of arson/escaped fires and unauthorised trail development.
Along the southern coast of Puerto Rico Island, Ponce limestone occurs within three protected
areas outside the recorded native range of V. rupicola: Los Morrillos de Cabo Rojo, Cabo Rojo
NWR and the small off-shore island of Isla Caja de Muertos (Monroe, 1980). The three areas
offer the opportunity for conservation introductions of material from all five populations
(mixed or separated) for research and conservation.
The Cabo Rojo NWR includes areas with both Miocene limestone and Quaternary sand
deposits. As part of the general restoration efforts on the refuge and as a specific conservation
action for V. rupicola, a small planting (n = 30) of the species was undertaken in November
2012 by the USFWS using nursery grown plants originating from wild source seed collected in
Yauco and Guánica (Morales and Martinez, 2013). Many potential sites for further
conservation introductions within the refuge exist and should be explored urgently,
particularly for material from the Ponce population. Of particular note is an area on the
extreme south-western edge of the refuge where habitat similar to that on Anegada overlies
Quaternary sand deposits. This area should be considered for experimental conservation
introduction plantings, particularly of Anegada sourced material.
Los Morrillos de Cabo Rojo is adjacent to the Cabo Rojo NWR and has many similarities (e.g.
aspect, elevation) to the Puerto Ferro peninsula within the Vieques NWR where the Vieques
population of V. rupicola exists. Unfortunately, the area has been heavily degraded through
anthropogenic disturbance, mainly recreational activities and arson. This could be an ideal
location to establish a fully representative planting of the Vieques population. The accessibility
and proximity to the USFWS regional office would make monitoring straightforward while
isolating the Vieques material from other areas that could be used for plantings of other
populations. Further plantings of the species in this area should only be undertaken following a
broader habitat restoration programme and an awareness raising campaign to reduce the
potential for escaped fires/arson in the area.
Isla Caja de Muertos should be considered for conservation introductions following a thorough
habitat assessment and survey for V. rupicola. If no V. rupicola plants are found, the island

201
could be used for the preservation of the species using material from one or many source
populations. This could be an ideal location for the protection of Anegada sourced genetic
material as well as the Critically Endangered iguana, Cyclura pinguis, which is also extant on
Anegada. More straightforward and potentially less controversial would be the conservation
introduction of genetic material from the nearest population, Ponce, on mainland Puerto Rico
which has no in-situ protection.
Depending on the resources available for subsequent monitoring and research, these
protected areas could be used to conserve a single population each (low-medium resource
input) or to bring multiple populations together to test the genetic consequences (medium-
high resource input). The opportunities for research into the mixing of individuals from
different populations, common garden experiments and sowing/planting techniques will be
discussed along with other topics in the following section.
5.3. Research opportunities Development of a comprehensive species management and recovery plan that is applicable
across political boundaries and legal frameworks throughout the PRB requires robust and
scientifically sound evidence. On-going collaborations with a network of individuals and
institutions interested in conserving V. rupicola have enabled an active research and
conservation programme to be established for the species. Further investigations will be
undertaken in the field and the lab to study the species phenology, reproductive biology and
seed dispersal to inform the long-term management of the species. The research undertaken
and presented here has also set the stage for further cyto-, phylo- and population genetic
studies to be undertaken of endemic Caribbean Varronia and Cordia species. This could lead to
significant contributions to the scientific literature for an understudied and often threatened
group of species.
The established network of protected areas offer opportunities to undertake quantitative
genetic studies (e.g. reciprocal transplant, common garden experiments) that Kramer and
Havens (2009) state are largely neglected but of major importance due to the risks associated
with the introduction of genetically different material. Frankham et al. (2011) showed that
previous estimates of outbreeding depression are conflated and likely to occur when
individuals from different populations with different karyotypes and from different
environments are brought together after separation for more than 500 years. Undertaking
quantitative genetic studies would provide much needed evidence for the suitability of V.
rupicola population mixing as well as contributing much needed data for this field of study.

202
Another significant opportunity for research in the established protected areas is the
development of sowing/planting techniques for V. rupicola and associated dry forest species
with the aim of restoring degraded lands. These studies could establish protocols that ensure
high survivorship which will maximise resources (i.e. plant material and funding). Ultimately
this research could provide more conservation impact through delivering efficiencies that
provide practitioners with more time to focus on other species/issues of concern.
This research allowed the author to work with a wide range of specialists across many
different fields. This has established several necessary protocols/methodologies to enable
further research as well as opening many areas of investigation. The areas with on-going
research, that require further investigation to generate publishable results or offer new lines
of inquiry are presented in the following sections.
5.3.1. Karyology
This research found traditional methods to observe root tip cells at mitotic metaphase and
pollen grains at meiotic metaphase to be very difficult due to sticky Boraginaceae
chromosomes (Bhattacharya, 1968; Gaviria, 1987). Establishing a new protocol for breaking
the sticky chromosomes apart to enable counting would be a major advance for research of
the Varronia group specifically and the family as a whole. This in turn would open several areas
of investigation, particularly flow cytometry studies for Varronia species.
If a protocol is not available, material of a known diploid and tetraploid species could
potentially be used to develop a flow cytometry library to confirm the ploidy level for V.
rupicola. Securing living material of new Varronia species is the first step required to progress
this research. Regardless of chromosome counts being successfully undertaken, further flow
cytometry studies can be undertaken using the protocol established during this research for V.
rupicola to generate publishable results for the species.
5.3.2. Phylogenetics
The ITS and trnL-trnF matrices generated by this research should be expanded to include new
species of Varronia and Cordia native to the Caribbean and specifically the PRB. Further pDNA
analyses using new regions (i.e. matK, trnS-trnG spacer and the group II rpl16 intron) should
also be undertaken using new and existing samples. These new and expanded matrices should
be combined to produce informative phylogenetic trees of Caribbean Varronia and Cordia
species with the aim of presenting better resolution of the interspecific relationships. This
may, in turn, shed light on possible parentage for species of hybrid origin and open new lines
of inquiry using next-generation sequencing (Soltis et al., 2013). These are exciting possibilities

203
that could lead to the development of new model systems with far reaching research
possibilities.
5.3.3. Population genetics
New V. rupicola plants have been discovered within the two Puerto Rican populations and the
extremes of the Anegada East population since this research was completed. Samples of these
new plants and any further discoveries, particularly on Puerto Rico and Vieques, should be
analysed and the data combined with the results of this research to inform the species
management discussed in 5.2. Conservation strategies.
Morphology data collected from individual plants sampled for genetic material during this
research should be analysed jointly using multivariate and cluster analysis methods (i.e. PCoA
and Bayesian techniques) with population genetics data. These combined data may provide
added support for the populations detected and could possibly provide insight into phenotypic
variation, especially flower morphology.
A subset of the microsatellite loci used in this research was successfully amplified for four
other Varronia species. This offers many new research opportunities that will require limited
time and resources to be invested before results can be acquired. This is particularly significant
for other Caribbean endemic species like V. lima and V. bahamensis and potentially useful for
threatened species such as V. bellonis that have yet to be tested but were found to be closely
related to V. rupicola.
5.3.4. Palynology
Pollen of Varronia has been shown to differ from that of Cordia s.s. (Nowicke and Ridgway,
1973; Moncada and Herrera-Oliver, 1988; Miller and Nowicke, 1989; Heubl et al., 1990;
Nowicke and Miller, 1990). Initial micromorphological studies undertaken by the author using
available pollen samples from V. rupicola, V. lima (see Figure 7) and V. bahamensis suggests
that further research is warranted and could provide strong support for the results of
phylogenetic analyses. Fresh pollen samples should be acquired from Varronia species native
to the Caribbean, especially endemics included in phylogenetic analyses presented here, to
inform development of phylogenetic trees. This area of research could occupy several years
and offer a significant amount of new data.
5.3.5. Reproduction biology and dispersal
Understanding the reproductive biology of V. rupicola is fundamental to the species
conservation. On-going research is exploring this topic in the wild and in controlled
environments. The ex-situ collections held at Kew are being used to undertake a reproductive

204
biology study (Figure 81 (a) and (b)) to determine lengths of time for flowering, fruit
development and dispersal as well as floral morphology variations. The results of this research
will assist conservationists in planning monitoring and collecting programs and may help to
identify reproductive impediments within wild populations due to flower morphology. The
study may also help to determine if the departure from random mating detected in this
research is the result of apomixes which has been suggested for other Varronia species (Spoon
and Kesseli, 2008).
Working with herpetologist, Kelly Bradley, on Anegada, a controlled feeding study (Figure 81
(c)) using V. rupicola fruits presented to captive iguanas, Cyclura pinguis, strongly suggests that
these two threatened species have a relationship in the wild. This led to a camera trapping
programme on Anegada (Figure 81 (d)) to record V. rupicola pollinators and seed dispersers.
This research is on-going and has also been extended to Puerto Rico with the assistance of
USFWS biologist, Omar Monsegur. This research has the potential to unlock the secrets of
gene flow across the PRB for V. rupicola and suggest new approaches to the conservation of
the species. This is an exciting and potentially ground-breaking area of research that will bring
together a range of taxonomic specialists and conservation practitioners.
To understand the potential of dispersed as well as stored seed, a longevity study is needed.
This will provide insight into the species ability to remain in the seed bank for natural
regeneration (Molina Colón and Lugo, 2006; Bossuyt and Honnay, 2008) and also establish the
species storage behaviour enabling the design of a seed testing and recollection protocol (Li
and Pritchard, 2009). These are very important considerations for the species long-term
conservation as the seed longevity will have many implications for the strategies discussed
previously in 5.2. Conservation strategies for V. rupicola.

205
Figure 81: Examples of reproduction biology and dispersal research: (a-b) V. rupicola controlled pollination of ex-
situ collections; (c) captive rock iguana, Cyclura pinguis, controlled feeding study using V. rupicola fruits; (d)
camera trapping to record V. rupicola pollinators and seed dispersers. ©M.A. Hamilton.

206
5.3.6. Impacts of climate change
This research developed a robust GIS comprised of species observations, elevation, land cover
and geologic data that can be used to develop models and project them into the future. Data
loggers have been deployed across the native range of V. rupicola with the assistance of
USFWS biologists in Puerto Rico and Vieques to record micro-climatic conditions for use in
modelling habitat niche and future climate scenarios. Climatic data currently being collected
will enable the inclusion of high resolution temperature and humidity readings in models that
are currently unavailable.
The data loggers will also enable seed germination studies to be designed to explore the
species response to dryer and hotter conditions than it currently experiences. The climatic
data can also be used to determine periods when optimal conditions for seed germination are
experienced which can be used for propagating the species by direct seeding in appropriate
nursery or field situations. The results of this research can have a profound effect on the
management decisions for V. rupicola discussed in 5.2. Conservation strategies.
5.4. Main conclusions This research set out to investigate the distribution, biology and variability of V. rupicola in
order to make informed management decisions for its conservation. The results of karyological
and phylogenetic research presented here clearly show that V. rupicola is a distinct species
endemic to the PRB. Biogeographical and population genetic research support this finding and
provide insight into the structure as well as diversity of extant populations, their ecological
preferences and the impacts of past sea level rise as well as anthropogenic disturbance.
Less than 1,000 individuals were observed during this research across the PRB in five detected
populations. The largest population, Anegada West, was found to have 519 individuals and the
greatest number of private alleles (Pa = 10). Anegada was also found to support the second
largest population, Anegada East, with 240 individuals. Puerto Rico supports the third,
Guánica, and fourth, Ponce, largest populations with 113 and 52 individuals, respectively.
Vieques was found to have the smallest population with only six extant individuals.
Although Anegada holds 79% of extant individuals, it was only found to have just over half
(56%) of the private alleles; therefore, the considerably smaller populations on Puerto Rico
(20% of extant individuals) and Vieques (1% of extant individuals) still have a significant
amount of the overall allelic diversity for the species with the smallest population, Vieques,
found to have three private alleles. The historical range of the species includes locations on
Puerto Rico and Vieques (see Figure 21) that were not found to support extant individuals. This

207
reduction in the species native range and the small populations observed on these islands has
undoubtedly driven the reduction in allelic and genetic diversity detected by this research.
Throughout the PRB, V. rupicola plants were found within an extremely limited area of intact
habitat (<90 km2, see Figure 25, Figure 26, Figure 27) overlying a very limited number of
substrates (see Figure 22, Figure 23, Figure 24) that cover <200 km2 across the three islands
where the species is extant. These islands do have protected areas (established or proposed,
see Figure 28) that include intact habitat and V. rupicola individuals (see Figure 75, Figure 76,
Figure 77); however, these areas contain less than a third (<30 km2) of the remaining intact
habitat (see Figure 40, Figure 41, Figure 42) across the PRB that supports V. rupicola.
Unfortunately, considerable genetic diversity also remains unprotected as these protected
areas do not include any of the Ponce population, meaning only 59% of the two Puerto Rican
populations is protected, and only 39% of the two Anegada populations. Fortunately, all
remaining intact habitat, all substrate known to support the species and the six extant V.
rupicola on Vieques are found within protected areas.
Given the species limited AOO and protected habitat compounded by the fact that the two
largest populations occur on Anegada below 8 m asl, the species is threatened with extinction.
On-going habitat fragmentation and degradation will continue to be significant threats to the
species. Climate change induced drying, increased cyclonic intensity and sea level rise (IPCC,
2012) will surely impact the species directly if global efforts to curb GHG emissions and keep
the global temperature from rising above the 2 °C threashold (IPCC, 2012) are unsuccessful. If
a 6 m sea level rise were to be experienced, 99% of the locations of the extant individuals on
Anegada will be lost under the rising water. The indirect impacts of climate change could have
similarly catastrophic impacts on V. rupicola, especially outside of protected areas as
anthropogenic development is forced inland and up slope into areas with currently intact
habitat. Populations within protected areas may also be impacted through storm surge or
development of new infrastructure given easement in these areas, an already established
practise. Natural disasters are also a potential threat to V. rupicola populations, particularly on
Anegada where hurricane storm surge or tsunami run-up could kill plants directly by overwash
or result in salinisation of the freshwater lens. These natural disasters could also result in
similar indirect impacts as climate change induced sea level rise, particularly if the frequency of
these events were to increase forcing coastal communities to seek refuge at higher elevation.
Combined, the effects of sea level rise and natural disasters could push the species to
extinction over the coming century.

208
This research suggests that genetic diversity has already been impacted by a reduction in
population size as Vieques (six remaining plants) shows the highest inbreeding coefficient
value and the lowest allelic diversity. Across the five populations, values for allelic diversity are
proportional to the size of the population (see Figure 64) suggesting that reduction drives the
loss of genetic diversity. Also, historical specimens and ex-situ collections reveal a loss of wild
genetic diversity from Puerto Rico and Anegada. Therefore, it seems that an integrated
approach to the species conservation is needed to preserve the V. rupicola gene pool and the
species habitat across its native range.
Established ex-situ collections capture less than half (44%) of the private alleles found in the
wild with none of the Vieques or Ponce private alleles captured. A single seed collection is
known from the Anegada West population which means the remainder of the ex-situ
collections are living plants that could easily be lost if resources are cut or natural disasters
strike. Bolstering these collections should be a high priority for the species conservation.
An integrated management plan that is ambitious, yet implementable, should be designed
based on the genetic and ecological results presented here (Heywood and Iriondo, 2003). The
conservation strategy should include in-situ and ex-situ measures to maximise genetic
diversity. These will potentially allow V. rupicola to adaptat to environmental change and new
threats (e.g. sea level rise, drought, anthropogenic disturbance and pest attack).
This research allowed the observation of on-going habitat loss, future threats to the species as
well as genetic structure and variability of V. rupicola through the combination of genetic and
biogeographical data. This work is a valuable reference for developing a conservation strategy
for the species and has also contributed new scientific knowledge of V. rupicola as well as
several other Varronia and Cordia species native to the Caribbean.

209
References Acevedo-Rodríguez, P. (1996). Flora of St. John, U.S. Virgin Islands. Bronx, N.Y., U.S.A.: New York Botanical Garden.
Acevedo-Rodríguez, P. and Strong, M. T. (2008). Floristic richness and affinities in the West Indies. Botanical Review, 74 (1), p.5–36. [Online]. Available at: doi:10.1007/s12229-008-9000-1.
Acevedo-Rodríguez, P. and Strong, M. T. (2012). Catalogue of seed plants of the West Indies. Washington, D.C., USA: Smithsonian Institution Scholarly Press. [Online]. Available at: http://www.sil.si.edu/smithsoniancontributions/Botany/pdf_hi/SCtB-0098.pdf.
Addarich-Martínez, L. (2009). The geologic mapping and history of the Guánica Quadrangle, southwestern Puerto Rico. MSc Thesis. University of Puerto Rico, Mayaguez Campus, Puerto Rico. [Online]. Available at: http://sociedadgeologicapr.org/Documents/addarichmartinez.pdf.
Ainouche, A.-K. and Bayer, R. J. (1999). Phylogenetic relationships in Lupinus (Fabaceae: Papilionoideae) based on internal transcribed spacer sequences (ITS) of nuclear ribosomal DNA. American Journal of Botany, 86 (4), p.590–607. [Online]. Available at: http://www.amjbot.org/content/86/4/590.abstract.
Airbus Defence and Space. (2011). The Earth in mosaic. Space in daily life. [Online]. Available at: http://www.space-airbusds.com/en/news2/the-earth-in-mosaic.html [Accessed: 15 October 2015].
Albrecht, J. (2007). Key concepts and techniques in GIS. London, U.K.: Sage. [Online]. Available at: http://academicworks.cuny.edu/cgi/viewcontent.cgi?article=1008&context=hc_pubs.
Alfaro, M. E., Zoller, S. and Lutzoni, F. (2003). Bayes or bootstrap? A simulation study comparing the performance of Bayesian Markov chain Monte Carlo sampling and bootstrapping in assessing phylogenetic confidence. Molecular Biology and Evolution, 20 (2), p.255–266. [Online]. Available at: doi:10.1093/molbev/msg028.
Al-Shehbaz, I. A. (1991). The genera of Boraginaceae in the southeastern United States. J Arnold Arbor, Suppl Ser, 1, p.1–59.
Altekar, G., Dwarkadas, S., Huelsenbeck, J. P. and Ronquist, F. (2004). Parallel Metropolis coupled Markov chain Monte Carlo for Bayesian phylogenetic inference. Bioinformatics, 20 (3), p.407–415. [Online]. Available at: doi:10.1093/bioinformatics/btg427.
Álvarez, I. and Wendel, J. F. (2003). Ribosomal ITS sequences and plant phylogenetic inference. Molecular Phylogenetics and Evolution, 29 (3), p.417–434. [Online]. Available at: doi:10.1016/S1055-7903(03)00208-2.
Angeles, M. E., Gonzalez, J. E., Erickson, D. J. and Hernández, J. (2006). An assessment of future Caribbean climate changes using the BAU scenario by coupling a global circulation model with a regional model. In: XVIII Conference on Climate Variability and Change, 2006, Atlanta, GA, USA: American Metereological Society, p.1–17.
APG. (2009). An update of the Angiosperm Phylogeny Group classification for the orders and families of flowering plants: APG III. Botanical Journal of the Linnean Society, 161 (2), p.105–121. [Online]. Available at: doi:10.1111/j.1095-8339.2009.00996.x.
Areces-Mallea, A. E., Weakley, A. S., Li, X., Sayre, R. G., D. Parrish, J. D., Tipton, C. V and Boucher, T. (1999). A guide to Caribbean vegetation types: Preliminary classification system and descriptions. Panagopoulos, N. (ed.). Washington, D.C.: The Nature Conservancy. [Online]. Available at: http://web.utk.edu/~rreyno16/plants_1999.pdf.
ASPRS. (1990). ASPRS accuracy standards for large-scale maps. Photogrammetric Engineering
210
& Remote Sensing, 56 (7), p.1068–1070. [Online]. Available at: http://www.asprs.org/a/society/committees/standards/1990_jul_1068-1070.pdf.
ASPRS. (2015). ASPRS positional accuracy standards for digital geospatial data. Photogrammetric Engineering & Remote Sensing, 81 (3), p.1–26. [Online]. Available at: doi:10.14358/PERS.81.3.A1-A26.
Assis, L. C. S. (2014). Testing evolutionary hypotheses: From Willi Hennig to Angiosperm Phylogeny Group. Cladistics, 30 (3), p.240–242. [Online]. Available at: doi:10.1111/cla.12048.
Atwater, B. F., ten Brink, U. S., Buckley, M., Halley, R. S., Jaffe, B. E., López-Venegas, A. M., Reinhardt, E. G., Tuttle, M. P., Watt, S. and Wei, Y. (2012). Geomorphic and stratigraphic evidence for an unusual tsunami or storm a few centuries ago at Anegada, British Virgin Islands. Natural Hazards, 63 (1), Springer Netherlands, p.51–84. [Online]. Available at: doi:10.1007/s11069-010-9622-6.
Atwater, B. F., Fuentes, Z., Halley, R. B., Ten Brink, U. S. and Tuttle, M. P. (2014). Effects of 2010 Hurricane Earl amidst geologic evidence for greater overwash at Anegada, British Virgin Islands. Advances in Geosciences, 38, p.21–30. [Online]. Available at: doi:10.5194/adgeo-38-21-2014.
Axelrod, F. S. (2011). A systematic vademecum to the vascular plants of Puerto Rico. Fort Worth, Texas: BRIT Press. [Online]. Available at: http://herbario.uprr.pr/index.php?page=vademecum-pr&hl=en_US.
Bailey, C. D., Carr, T. G., Harris, S. A. and Hughes, C. E. (2003). Characterization of angiosperm nrDNA polymorphism, paralogy, and pseudogenes. Molecular Phylogenetics and Evolution, 29 (3), p.435–455. [Online]. Available at: doi:10.1016/j.ympev.2003.08.021.
Baldwin, B. G. (1992). Phylogenetic utility of the internal transcribed spacers of nuclear ribosomal DNA in plants: An example from the compositae. Molecular Phylogenetics and Evolution, 1 (1), p.3–16. [Online]. Available at: doi:10.1016/1055-7903(92)90030-K.
Baldwin, B. G., Sanderson, M. J., Porter, J. M., Wojciechowski, M. F., Campbell, C. S. and Donoghue, M. J. (1995). The ITS region of nuclear ribosomal DNA: A valuable source of evidence on angiosperm phylogeny. Annals of the Missouri Botanical Garden, 82 (2), Missouri Botanical Garden Press, p.247–277. [Online]. Available at: doi:10.2307/2399880.
Bard, E., Antonioli, F. and Silenzi, S. (2002). Sea-level during the penultimate interglacial period based on a submerged stalagmite from Argentarola Cave (Italy). Earth and Planetary Science Letters, 196 (3-4), p.135–146. [Online]. Available at: doi:10.1016/S0012-821X(01)00600-8.
Barker, B. S., Rodríguez-Robles, J. A., Aran, V. S., Montoya, A., Waide, R. B. and Cook, J. A. (2012). Sea level, topography and island diversity: Phylogeography of the Puerto Rican red-eyed coquí, Eleutherodactylus antillensis. Molecular Ecology, 21 (24), p.6033–6052. [Online]. Available at: doi:10.1111/mec.12020.
Bárrios, S. (2015). Conservation genetics of Vachellia anegadensis, a British Virgin Islands endemic plant species. MSc Thesis, Reading University, Reading, UK.
Barton, N. H., Briggs, D. E. G., Eisen, J. A., Goldstein, D. B. and Patel, N. H. (2007). Phylogenetic reconstruction. In: Evolution, Cold Spring Harbor, NY, USA: Cold Spring Harbor Laboratory Press, p.1–55. [Online]. Available at: www.evolution-textbook.org.
Bawa, K. S. (1980). Evolution of dioecy in flowering plants. Annual Review of Ecology and Systematics, 11, Annual Reviews, p.15–39. [Online]. Available at: http://www.jstor.org/stable/2096901.
Bawa, K. S. and Beach, J. H. (1981). Evolution of sexual systems in flowering plants. Annals of the Missouri Botanical Garden, 68 (2), Missouri Botanical Garden Press, p.254–274. [Online].

211
Available at: http://www.jstor.org/stable/2398798.
Bawa, K. S. and Beach, J. H. (1983). Self-incompatibility systems in the Rubiaceae of a tropical lowland wet forest. American Journal of Botany, 70 (9), Botanical Society of America, p.1281–1288. [Online]. Available at: http://www.jstor.org/stable/2443418.
Bawiec, W. J. (1999). Geology, geochemistry, geophysics, mineral occurrences and mineral resource assessment for the Commonwealth of Puerto Rico. U.S. Geological Survey Open-File Report, Reston, VA, USA: US Geological Survey. [Online]. Available at: http://pubs.er.usgs.gov/publication/ofr9838.
BCPeabody Construction Services Inc. and Coll Rivera Environmental. (2011). Via Verde natural gas pipeline project: Biological assessment. Unpublished report submitted to U.S. Fish and Wildlife Service, San Juan, Puerto Rico. [Online]. Available at: http://gutierrez.house.gov/sites/gutierrez.house.gov/files/images/stories/20110711-BiologicalAssessment.pdf.
Belkhir, K., Borsa, P., Chikhi, L., Raufaste, N. and Bonhomme, F. (2004). GENETIX 4.05, logiciel sous Windows TM pour la génétique des populations. Montpellier (France): Laboratoire Génome, Populations, Interactions, Université de Montpellier. [Online]. Available at: http://kimura.univ-montp2.fr/genetix/.
Bellard, C., Leclerc, C. and Courchamp, F. (2014). Impact of sea level rise on the 10 insular biodiversity hotspots. Global Ecology and Biogeography, 23 (2), p.203–212. [Online]. Available at: doi:10.1111/geb.12093.
Benson, D. A., Cavanaugh, M., Clark, K., Karsch-Mizrachi, I., Lipman, D. J., Ostell, J. and Sayers, E. W. (2013). GenBank. Nucleic Acids Research, 41 (D1), p.D36–D42. [Online]. Available at: doi:10.1093/nar/gks1195.
Bhattacharya, G. N. (1968). Chromosome studies in Boraginaceae. Bulletin of the Botanical Society of Bengal, 22, p.79–82.
Van Bloem, S. J., Lugo, A. E. and Murphy, P. G. (2006). Structural response of Caribbean dry forests to hurricane winds: a case study from Guánica Forest, Puerto Rico. Journal of Biogeography, 33 (3), p.517–523. [Online]. Available at: doi:10.1111/j.1365-2699.2005.01450.x.
Borhidi, A., Gondár, E. and Orosz-Kovács, Z. (1988). The re-consideration of genus Cordia L. Acta Botanica Hungarica, 34, p.375–423.
Borsch, T. and Quandt, D. (2009). Mutational dynamics and phylogenetic utility of noncoding chloroplast DNA. Plant Systematics and Evolution, 282 (3-4), Springer Vienna, p.169–199. [Online]. Available at: doi:10.1007/s00606-009-0210-8.
Boshier, D. H., Chase, M. R. and Bawa, K. S. (1995a). Population genetics of Cordia alliodora (Boraginaceae), a neotropical tree. 2. Mating system. American Journal of Botany, 82 (4), Botanical Society of America, p.476–483. [Online]. Available at: http://www.jstor.org/stable/2445694.
Boshier, D. H., Chase, M. R. and Bawa, K. S. (1995b). Population genetics of Cordia alliodora (Boraginaceae), a neotropical tree. 3. Gene flow, neighborhood, and population substructure. American Journal of Botany, 82 (4), Botanical Society of America, p.484–490. [Online]. Available at: http://www.jstor.org/stable/2445695.
Bossuyt, B. and Honnay, O. (2008). Can the seed bank be used for ecological restoration? An overview of seed bank characteristics in European communities. Journal of Vegetation Science, 19, p.875–884. [Online]. Available at: doi:10.3170/2008-8-18462.
Box, G. E. P. (1976). Science and statistics. Journal of the American Statistical Association, 71

212
(356), Taylor & Francis, p.791–799. [Online]. Available at: doi:10.1080/01621459.1976.10480949.
Breckon, G. J. (2007). Report on the flora of Vieques Island, Puerto Rico. Unpublished report submitted to U.S. Fish and Wildlife Service, Mayagüez, Puerto Rico: University of Puerto Rico, Mayagüez.
Briggs, R. P. and Akers, J. P. (1965). Hydrogeologic map of Puerto Rico and adjacent islands. Hydrologic Investigations Atlas No. HA-197. [Online]. Available at: http://pubs.er.usgs.gov/publication/ha197.
Britton, D. (1951). Cytogenetic studies on the Boraginaceae. Brittonia, 7 (4), Springer New York, p.233–266. [Online]. Available at: http://dx.doi.org/10.2307/2804694.
Britton, N. L. (1916). The vegetation of Anegada. Memoirs of the New York Botanical Garden, 6, p.565–580.
Britton, N. L. (1918). The flora of the American Virgin Islands. Brooklyn Botanic Garden Memories, 1, p.19–118.
Britton, N. L. (1927). Further botanical studies in Porto Rico. Journal of the New York Botanical Garden, 28, p.125–131.
Britton, N. L. and Wilson, P. (1924). Botany of Porto Rico and Virgin Islands Pandanales to Thymeleales. Scientific Survey of Porto Rico and Virgin Islands, 5 (1-4), New York, NY, USA: New York Academy of Sciences, p.1–641.
Britton, N. L. and Wilson, P. (1925a). Botany of Porto Rico and the Virgin Islands Myrtales to Lycopodiales Part 1: Descriptive flora - Spermatophyta (continued). Scientific survey of Porto Rico and the Virgin Islands, 6 (1), New York, NY, USA: New York Academy of Sciences, p.1–158. [Online]. Available at: http://archive.org/details/scientificsurvey60104newy.
Britton, N. L. and Wilson, P. (1925b). Botany of Porto Rico and the Virgin Islands Myrtales to Lycopodiales Part 2: Descriptive flora - Spermatophyta (continued). Scientific Survey of Porto Rico and the Virgin Islands, 6 (2), New York, NY, USA: New York Academy of Sciences, p.159–316. [Online]. Available at: http://archive.org/details/scientificsurvey60104newy.
Browne, P. (1756). The civil and natural history of Jamaica. London: T. Osborne and J. Shipton. [Online]. Available at: https://play.google.com/store/books/details?id=vcRhFZ9p96UC&rdid=book-vcRhFZ9p96UC&rdot=1.
Bullock, J. M. (2006). Plants. In: Sutherland, W. J. (ed.), Ecological census techniques, Cambridge, UK: Cambridge University Press, p.186–213. [Online]. Available at: doi:10.1017/CBO9780511790508.005.
Burkett, V. R., Fernandez, L., Nicholls, R. J. and Woodroffe, C. D. (2008). Climate change impacts on coastal biodiversity. In: Fenech, A., MacIver, D. and Dallmeier, F. (eds.), Climate Change and Biodiversity in the Americas, Charlottetown, Prince Edward Island, Canada: University of Prince Edward Island, p.167–193. [Online]. Available at: http://ro.uow.edu.au/scipapers/217.
BVI Department of Town and Country Planning. (1993). Anegada development plan. Tortola, British Virgin Islands: Office of the Chief Minister.
Calonje, M., Martín-Bravo, S., Dobeš, C., Gong, W., Jordon-Thaden, I., Kiefer, C., Kiefer, M., Paule, J., Schmickl, R. and Koch, M. A. (2008). Non-coding nuclear DNA markers in phylogenetic reconstruction. Plant Systematics and Evolution, 282 (3-4), p.257–280. [Online]. Available at: doi:10.1007/s00606-008-0031-1 [Accessed: 10 July 2014].
De Candolle, A. P. (1845). Borragineae. In: De Candolle, A. P. (ed.), Prodromous Systematis

213
Naturalis Regni Vegetabilis, 9, Paris: Treuttel & Würtz, p.466–559.
CDC. (2007). Petitioned public health assessment soil pathway evaluation, Isla de Vieques bombing range, Vieques, Puerto Rico. Federal Facilities Assessment Branch Division of Health Assessment and Consultation Agency for Toxic Substances and Disease Registry, Atlanta, GA, USA. [Online]. Available at: http://www.atsdr.cdc.gov/HAC/PHA/reports/isladevieques_02072003pr/printview.html#backd.
CH2M HILL. (2012a). Feasibility study report UXO 1, eastern conservation area, former Vieques Naval Training Range (VNTR), Vieques, Puerto Rico. Unpublished report submitted to Naval Facilities Engineering Command (NAVFAC), Virginia Beach, VA, USA. [Online]. Available at: http://www.navfac.navy.mil/niris/ATLANTIC/VIEQUES_EAST/N69321_000067.pdf.
CH2M HILL. (2012b). Site management plan, fiscal year 2013: Atlantic fleet weapons training area - Vieques, Puerto Rico. Unpublished report submitted to Naval Facilities Engineering Command (NAVFAC), Virginia Beach, VA, USA. [Online]. Available at: http://www.navfac.navy.mil/niris/ATLANTIC/VIEQUES_EAST/N69321_000065.pdf.
Chase, M. R., Boshier, D. H. and Bawa, K. S. (1995). Population genetics of Cordia alliodora (Boraginaceae), a neotropical tree. 1. Genetic variation in natural populations. American Journal of Botany, 82 (4), Botanical Society of America, p.468–475. [Online]. Available at: http://www.jstor.org/stable/2445693.
Chase, M. W., De Bruijn, A. Y., Cox, A. V, Reeves, G., Rudall, P. J., Johnson, M. A. T. and Eguiarte, L. E. (2000). Phylogenetics of Asphodelaceae (Asparagales): An analysis of plastid rbcL and trnL-F DNA sequences. Annals of Botany, 86 (5), p.935–951. [Online]. Available at: doi:10.1006/anbo.2000.1262.
Chase, M. W. and Hills, H. H. (1991). Silica gel: An ideal material for field preservation of leaf samples for DNA studies. Taxon, 40, p.215–220.
Chase, M. W., Soltis, D. E., Olmstead, R. G., Morgan, D., Les, D. H., Mishler, B. D., Duvall, M. R., Price, R. A., Hills, H. G., Qiu, Y.-L., Kron, K. A., Rettig, J. H., Conti, E., Palmer, J. D., Manhart, J. R., Sytsma, K. J., Michaels, H. J., Kress, W. J., Karol, K. G., Clark, W. D., Hedren, M., Gaut, B. S., Jansen, R. K., Kim, K.-J., Wimpee, C. F., Smith, J. F., Furnier, G. R., Strauss, S. H., Xiang, Q.-Y., Plunkett, G. M., Soltis, P. S., Swensen, S. M., Williams, S. E., Gadek, P. A., Quinn, C. J., Eguiarte, L. E., Golenberg, E. M., Learn Jr., G. H., Graham, S. W., Barrett, S. C. H., Dayanandan, S. and Albert, V. A. (1993). Phylogenetics of seed plants: An analysis of nucleotide sequences from the plastid gene rbcL. Annals of the Missouri Botanical Garden, 80 (3), Missouri Botanical Garden Press, p.528–580. [Online]. Available at: doi:10.2307/2399846.
Chen, C., Durand, E., Forbes, F. and François, O. (2007). Bayesian clustering algorithms ascertaining spatial population structure: A new computer program and a comparison study. Molecular Ecology Notes, 7 (5), p.747–756. [Online]. Available at: doi:10.1111/j.1471-8286.2007.01769.x.
Cheng, L., Connor, T. R., Siren, J., Aanensen, D. M. and Corander, J. (2013). Hierarchical and spatially explicit clustering of DNA sequences with BAPS software. Molecular Biology and Evolution, 30 (5), p.1224–1228. [Online]. Available at: doi:10.1093/molbev/mst028.
Chistiakov, D. a., Hellemans, B. and Volckaert, F. a M. (2006). Microsatellites and their genomic distribution, evolution, function and applications: A review with special reference to fish genetics. Aquaculture, 255 (1-4), p.1–29. [Online]. Available at: doi:10.1016/j.aquaculture.2005.11.031.
Church, J. A., Clark, P. U., Cazenave, A., Gregory, J. M., Jevrejeva, S., Levermann, A., Merrifield, M. A., Milne, G. A., Nerem, R. S., Nunn, P. D., Payne, A. J., Pfeffer, W. T., Stammer, D. and Unnikrishnan, A. S. (2013). Sea level change. In: Stocker, T. F., Qin, D., Plattner, G.-K., Tignor,

214
M., Allen, S. K., Boschung, J., Nauels, A., Xia, Y., Bex, V. and Midgley, P. M. (eds.), Climate change 2013: The physical science basis. Contribution of Working Group I to the Fifth Assessment Report of the Intergovernmental Panel on Climate Change, Cambridge, UK and New York, NY, USA: Cambridge University Press, p.1137–1216. [Online]. Available at: http://www.ipcc.ch/report/ar5/wg1/.
Clark, P. U., Dyke, A. S., Shakun, J. D., Carlson, A. E., Clark, J., Wohlfarth, B., Mitrovica, J. X., Hostetler, S. W. and McCabe, a M. (2009). The Last Glacial Maximum. Science, 325 (5941), p.710–714. [Online]. Available at: doi:10.1126/science.1172873.
Clubbe, C. P., Gillman, M., Acevedo-Rodríguez, P. and Walter, R. (2004). Abundance, distribution and conservation significance of regionally endemic plant species on Anegada, British Virgin Islands. Oryx, 38 (3), p.342–346. [Online]. Available at: doi:10.1017/S0030605304000596.
Clubbe, C. P., Hamilton, M. A. and Corcoran, M. R. (2010). The role of native species nurseries in mitigating threats from invasive species: case studies from UK Overseas Territories. In: Proceedings of the 4th Global Botanic Gardens Congress, June 2010, 2010, Dublin, Ireland: Botanic Gardens Conservation International, p.1–13. [Online]. Available at: http://www.bgci.org/files/Dublin2010/papers/Clubbe-Colin.pdf.
Clubbe, C. P., Pollard, B., Smith-Abbott, J., Walker, R. and Woodfield, N. K. (2003). Cordia rupicola. IUCN 2012. IUCN Red List of Threatened Species. Version 2012.2. <www.iucnredlist.org>. [Online]. Available at: doi:10.2305/IUCN.UK.2003.RLTS.T43896A10831148.en [Accessed: 30 August 2015].
Cohen, J. I. (2013). A phylogenetic analysis of morphological and molecular characters of Boraginaceae: Evolutionary relationships, taxonomy, and patterns of character evolution. Cladistics, p.1–31. [Online]. Available at: doi:10.1111/cla.12036.
Cohen, K. M., Finney, S. C., Gibbard, P. L. and Fan, J.-X. (2013). The ICS international chronostratigraphic chart. Episodes, 36 (3), p.199–204. [Online]. Available at: doi:10.18814/epiiugs/2013/v36i3/59399.
Cole, T. (2015). Angiosperm Phylogeny Group (APG) in jeopardy – Where have the flowers gone? PeerJ PrePrints, 3, p.e1517. [Online]. Available at: doi:10.7287/peerj.preprints.1238v1.
Coleman, A. W. (2003). ITS2 is a double-edged tool for eukaryote evolutionary comparisons. Trends in Genetics, 19 (7), p.370–375. [Online]. Available at: doi:10.1016/S0168-9525(03)00118-5.
Coleman, A. W. and Mai, J. C. (1997). Ribosomal DNA and ITS-2 sequence comparisons as a tool for predicting genetic relatedness. Journal of Molecular Evolution, 45 (2), p.168–177. [Online]. Available at: doi:10.1007/PL00006217.
Collevatti, R. G., Brondani, R. V and Grattapaglia, D. (1999). Development and characterization of microsatellite markers for genetic analysis of a Brazilian endangered tree species Caryocar brasiliense. Heredity, 83 (6), p.748–756. [Online]. Available at: doi:10.1038/sj.hdy.6886380.
Committee on Natural Disasters. (1994). Hurricane Hugo: Puerto Rico, the US Virgin Islands, and South Carolina September 17-22, 1989. Natural Disasters Studies, Washington DC, USA: The National Academies Press. [Online]. Available at: http://www.nap.edu/openbook.php?record_id=1993.
Coombs, J. A., Letcher, B. H. and Nislow, K. H. (2008). CREATE: A software to create input files from diploid genotypic data for 52 genetic software programs. Molecular Ecology Resources, 8, p.578–580. [Online]. Available at: doi:10.1111/j.1471-8286.2007.02036.x.
Correll, D. S. (1961). Ivan Murray Johnston (1898-1960). Taxon, 10 (1), International Association for Plant Taxonomy (IAPT), p.1–8. [Online]. Available at:

215
http://www.jstor.org/stable/1216255.
Corriveau, J. L. and Coleman, A. W. (1988). Rapid screening method to detect potential biparental inheritance of plastid DNA and results for over 200 angiosperm species. American Journal of Botany, 75 (10), Botanical Society of America, p.1443–1458. [Online]. Available at: doi:10.2307/2444695.
Courchamp, F., Hoffmann, B. D., Russell, J. C., Leclerc, C. and Bellard, C. (2014). Climate change, sea-level rise, and conservation: Keeping island biodiversity afloat. Trends in Ecology & Evolution, 29 (3), p.127–130. [Online]. Available at: doi:10.1016/j.tree.2014.01.001.
Crandall, K. A., Bininda-Emonds, O. R. P., Mace, G. M. and Wayne, R. K. (2000). Considering evolutionary processes in conservation biology. Trends in Ecology and Evolution, 15 (7), p.290–295. [Online]. Available at: doi:10.1016/S0169-5347(00)01876-0.
Csiba, L. and Powell, M. P. (2006). DNA extraction protocols. In: Savolainen, V., Powell, M. P., Davis, K., Reeves, G. and Corthals, A. (eds.), DNA and tissue banking for biodiversity and conservation- theory, practice and uses, Richmond, Surrey, UK: Kew Publishing, Royal Botanic Gardens Kew, p.48–51.
Cuénoud, P., Savolainen, V., Chatrou, L. W., Powell, M., Grayer, R. J. and Chase, M. W. (2002). Molecular phylogenetics of Caryophyllales based on nuclear 18S rDNA and plastid rbcL, atpB, and matK DNA sequences. American Journal of Botany, 89 (1), p.132–144. [Online]. Available at: doi:10.3732/ajb.89.1.132.
D’Arcy, W. G. (1967). Annotated checklist on the dicotyledons of Tortola, Virgin Islands. Rhodora, 69 (October-December), p.385–450.
D’Arcy, W. G. (1971). The Island of Anegada and its flora. Atoll Research Bulletin, 139, p.1–21.
D’Arcy, W. G. (1975). Anegada Island: Vegetation and flora. Atoll Research Bulletin, 188, p.1–40. [Online]. Available at: http://www.sil.si.edu/DigitalCollections/atollresearchbulletin/issues/00188.pdf.
Dahl-Jensen, D., Albert, M. R., Aldahan, A., Azuma, N., Balslev-Clausen, D., Baumgartner, M., Berggren, A.-M., Bigler, M., Binder, T., Blunier, T., Bourgeois, J. C., Brook, E. J., Buchardt, S. L., Buizert, C., Capron, E., Chappellaz, J., Chung, J., Clausen, H. B., Cvijanovic, I., Davies, S. M., Ditlevsen, P., Eicher, O., Fischer, H., Fisher, D. A., Fleet, L. G., Gfeller, G., Gkinis, V., Gogineni, S., Goto-Azuma, K., Grinsted, A., Gudlaugsdottir, H., Guillevic, M., Hansen, S. B., Hansson, M., Hirabayashi, M., Hong, S., Hur, S. D., Huybrechts, P., Hvidberg, C. S., Iizuka, Y., Jenk, T., Johnsen, S. J., Jones, T. R., Jouzel, J., Karlsson, N. B., Kawamura, K., Keegan, K., Kettner, E., Kipfstuhl, S., Kjær, H. A., Koutnik, M., Kuramoto, T., Köhler, P., Laepple, T., Landais, A., Langen, P. L., Larsen, L. B., Leuenberger, D., Leuenberger, M., Leuschen, C., Li, J., Lipenkov, V., Martinerie, P., Maselli, O. J., Masson-Delmotte, V., McConnell, J. R., Miller, H., Mini, O., Miyamoto, A., Montagnat-Rentier, M., Mulvaney, R., Muscheler, R., Orsi, A. J., Paden, J., Panton, C., Pattyn, F., Petit, J.-R., Pol, K., Popp, T., Possnert, G., Prié, F., Prokopiou, M., Quiquet, A., Rasmussen, S. O., Raynaud, D., Ren, J., Reutenauer, C., Ritz, C., Röckmann, T., Rosen, J. L., Rubino, M., Rybak, O., Samyn, D., Sapart, C. J., Schilt, A., Schmidt, A. M. Z., Schwander, J., Schüpbach, S., Seierstad, I., Severinghaus, J. P., Sheldon, S., Simonsen, S. B., Sjolte, J., Solgaard, A. M., Sowers, T., Sperlich, P., Steen-Larsen, H. C., Steffen, K., Steffensen, J. P., Steinhage, D., Stocker, T. F., Stowasser, C., Sturevik, A. S., Sturges, W. T., Sveinbjörnsdottir, A., Svensson, A., Tison, J.-L., Uetake, J., Vallelonga, P., van de Wal, R. S. W., van der Wel, G., Vaughn, B. H., Vinther, B., Waddington, E., Wegner, A., Weikusat, I., White, J. W. C., Wilhelms, F., Winstrup, M., Witrant, E., Wolff, E. W., Xiao, C. and Zheng, J. (2013). Eemian interglacial reconstructed from a Greenland folded ice core. Nature, 493 (7433), p.489–494. [Online]. Available at: doi:10.1038/nature11789.
Daly, C., Helmer, E. H. and Quiñones, M. (2003). Mapping the climate of Puerto Rico, Vieques

216
and Culebra. International Journal of Climatology, 23 (11), p.1359–1381. [Online]. Available at: doi:10.1002/joc.937.
Davis, J. C. (1986). Statistics and data analysis in geology. 2nd ed. New York City, New York, USA: John Wiley & Sons, Ltd.
DDM. (2014). BVI to acquire additional topographic data for Anegada. Department of Disaster Management, British Virgin Islands Web page. [Online]. Available at: http://www.bviddm.com/index.php?action=article&id=1310 [Accessed: 2 October 2015].
Dempster, A. P. (1968). A generalization of Bayesian inference. Journal of the Royal Statistical Society. Series B (Methodological), 30 (2), Wiley for the Royal Statistical Society, p.205–247. [Online]. Available at: doi:10.2307/2984504.
Department of Natural and Environmental Resources. (1999). New wildlife law of Puerto Rico. Commonwealth Law No. 241, San Juan, Puerto Rico: Estado Libre Asociado de Puerto Rico. [Online]. Available at: http://www.drna.gobierno.pr/biblioteca/leyes/la-nueva-ley-de-vida-silvestre-de-puerto-rico/.
Department of Natural and Environmental Resources. (2007). Elementos críticos de la división de patrimonio natural - plantas. Sustache, J. and Quevedo, V. (eds.). Unpublished report submitted to the Government of Puerto Rico, San Juan, Puerto Rico: Departamento de Recursos Naturales Ambiantales.
Desvaux, N. A. (1808). Memoire sur le genre Varronia. Journal de Botanique, 1 (5), p.257–281. [Online]. Available at: http://books.google.co.uk/books?vid=HARVARD:32044106331234&printsec=titlepage&redir_esc=y#v=onepage&q&f=false.
Diane, N., Hilger, H. H. and Gottschling, M. (2002). Transfer cells in the seeds of Boraginales. Botanical Journal of the Linnean Society, 140 (2), p.155–164. [Online]. Available at: doi:10.1046/j.1095-8339.2002.00085.x.
DigitalGlobe. (2011). Geolocation accuracy of Worldview products. DigitalGlobe Fact Sheets, Westminster, CO, USA. [Online]. Available at: Geolocation Accuracy of WorldView Products.
DigitalGlobe. (2015). Basic imagery datasheet. DigitalGlobe Fact Sheets, Westminster, CO, USA. [Online]. Available at: http://www.digitalglobe.com/products/basic-imagery.
Dinerstein, E., Olson, D. M., Graham, D. J., Webster, A. L., Primm, S. A., Bookbinder, M. P. and Ledec, G. (1995). A conservation assessment of the terrestrial ecoregions of Latin America and the Caribbean. Washington DC: The World Bank.
Dolezel, J., Greilhuber, J. and Suda, J. (2007). Estimation of nuclear DNA content in plants using flow cytometry. Nat. Protocols, 2 (9), Nature Publishing Group, p.2233–2244. [Online]. Available at: http://dx.doi.org/10.1038/nprot.2007.310.
DOS. (1966). Anegada, British Virgin Islands, Sheet 6, D.O.S. 346, 1:100,000. Tolworth, UK: Directorate of Overseas Surveys.
Doyle, J. J. and Doyle, J. L. (1987). A rapid DNA isolation procedure for small quantities of fresh leaf tissue. Phytochemical Bulletin, 19, p.11–15.
Duangjai, S., Samuel, R., Munzinger, J., Forest, F., Wallnöfer, B., Barfuss, M. H. J., Fischer, G. and Chase, M. W. (2009). A multi-locus plastid phylogenetic analysis of the pantropical genus Diospyros (Ebenaceae), with an emphasis on the radiation and biogeographic origins of the New Caledonian endemic species. Molecular Phylogenetics and Evolution, 52 (3), p.602–620. [Online]. Available at: doi:10.1016/j.ympev.2009.04.021.
Dufresne, F., Stift, M., Vergilino, R. and Mable, B. K. (2014). Recent progress and challenges in population genetics of polyploid organisms: An overview of current state-of-the-art molecular

217
and statistical tools. Molecular Ecology, 23 (1), p.40–69. [Online]. Available at: doi:10.1111/mec.12581 [Accessed: 13 July 2014].
Durand, E., Chen, C. and François, O. (2009). Comment on ‘On the inference of spatial structure from population genetics data’. Bioinformatics, 25 (14), p.1802–1804. [Online]. Available at: doi:10.1093/bioinformatics/btp337.
Efron, B. (1983). Estimating the error rate of a prediction rule: Improvement on cross-validation. Journal of the American Statistical Association, 78 (382), p.316–331. [Online]. Available at: doi:10.1080/01621459.1983.10477973.
Efron, B., Halloran, E. and Holmes, S. (1996). Bootstrap confidence levels for phylogenetic trees. Proceedings of the National Academy of Sciences of the United States of America, 93 (23), p.13429–13434. [Online]. Available at: http://www.pnas.org/content/93/23/13429.abstract.
Eggers, B. H. F. A. (1879). The flora of St. Croix and the Virgin Islands. Washington, DC: Government Printing Office.
Elsner, J. B. and Jagger, T. H. (2010). On the increasing intensity of the strongest Atlantic hurricanes. In: Elsner, J. B., Hodges, R. E. E., Malmstadt, J. C. C. and Scheitlin, K. N. N. (eds.), Hurricanes and Climate Change, Vol. 2, Dordrecht, The Netherlands: Springer Netherlands, p.175–190. [Online]. Available at: http://dx.doi.org/10.1007/978-90-481-9510-7_10.
Eriksson, T., Hibbs, M. S., Yoder, A. D., Delwiche, C. F. and Donoghue, M. J. (2003). The phylogeny of Rosoideae (Rosaceae) based on sequences of the Internal Transcribed Spacers (ITS) of nuclear ribosomal DNA and the trnL/F region of chloroplast DNA. International Journal of Plant Sciences, 164 (2), p.197–211. [Online]. Available at: doi:10.1086/346163.
Estrada Sánchez, J. (1995). Flora de Colombia, 14: Cordia subgenero Varronia (Boraginaceae). Santa Fé de Bogota, Columbia: Universidad Nacional de Colombia, Instituto de Ciencias Naturales, Instituto Colombiano de Cultura Hispanica.
Evanno, G., Regnaut, S. and Goudet, J. (2005). Detecting the number of clusters of individuals using the software STRUCTURE: A simulation study. Molecular Ecology, 14, p.2611–2620. [Online]. Available at: doi:10.1111/j.1365-294X.2005.02553.x.
Evans, R. C., Alice, L. A., Campbell, C. S., Kellogg, E. A. and Dickinson, T. A. (2000). The granule-bound starch synthase (GBSSI) gene in the Rosaceae: Multiple loci and phylogenetic utility. Molecular phylogenetics and evolution, 17 (3), p.388–400. [Online]. Available at: doi:10.1006/mpev.2000.0828 [Accessed: 15 August 2014].
Ewel, J. J. and Whitmore, J. L. (1973). The ecological life zones of Puerto Rico and the US Virgin Islands. U.S. Forest Service Research Paper No. IITF-18, IITF-18, Río Piedras Puerto Rico: International Institute of Tropical Forestry.
Excoffier, L. and Heckel, G. (2006). Computer programs for population genetics data analysis: A survival guide. 2006/08/23 ed. Nature Reviews Genetics, 7 (10), p.745–758. [Online]. Available at: doi:10.1038/nrg1904.
Excoffier, L. and Lischer, H. E. L. (2010). Arlequin suite ver 3.5: A new series of programs to perform population genetics analyses under Linux and Windows. Molecular Ecology Resources, 10 (3), p.564–567. [Online]. Available at: doi:10.1111/j.1755-0998.2010.02847.x.
Excoffier, L. and Lischer, H. E. L. (2011). Arlequin 3.5: An integrated software package for population genetics data analysis. Bern, Switzerland: Swiss Institute of Bioinformatics.
Excoffier, L., Smouse, P. E. and Quattro, J. M. (1992). Analysis of molecular variance inferred from metric distances among DNA haplotypes: Application to human mitochondrial DNA restriction data. Genetics, 131 (2), p.479–491. [Online]. Available at:

218
http://www.ncbi.nlm.nih.gov/pubmed/1644282.
Fairbanks, R. G. (1989). A 17,000-year glacio-eustatic sea level record: influence of glacial melting rates on the Younger Dryas event and deep-ocean circulation. Nature, 342 (6250), p.637–642. [Online]. Available at: doi:10.1038/342637a0.
Falush, D., Stephens, M. and Pritchard, J. K. (2003). Inference of population structure using multilocus genotype data: Linked loci and correlated allele frequencies. Genetics, 164 (August), p.1567–1587. [Online]. Available at: doi:10.1111/j.1471-8286.2007.01758.x.
Falush, D., Stephens, M. and Pritchard, J. K. (2007). Inference of population structure using multilocus genotype data: Dominant markers and null alleles. Molecular Ecology Notes, 7, p.574–578. [Online]. Available at: doi:10.1111/j.1471-8286.2007.01758.x.
Fay, M. F., Bone, R., Cook, P., Kahandawala, I., Greensmith, J., Harris, S., Pedersen, H. A., Ingrouille, M. J. and Lexer, C. (2009). Genetic diversity in Cypripedium calceolus (Orchidaceae) with a focus on north-western Europe, as revealed by plastid DNA length polymorphisms. 2009/05/21 ed. Annals of Botany, 104 (3), p.517–525. [Online]. Available at: doi:10.1093/aob/mcp116.
Fay, M. F., Swensen, S. M. and Chase, M. W. (1997). Taxonomic affinities of Medusagyne oppositifolia (Medusagynaceae). Kew Bulletin, 52 (1), p.111–120. [Online]. Available at: doi:10.2307/4117844 [Accessed: 15 August 2014].
Feliner, G. N. and Rosselló, J. A. (2007). Better the devil you know? Guidelines for insightful utilization of nrDNA ITS in species-level evolutionary studies in plants. Molecular Phylogenetics and Evolution, 44 (2), p.911–919. [Online]. Available at: doi:10.1016/j.ympev.2007.01.013.
Felsenstein, J. (1978). Cases in which parsimony or compatibility methods will be positively misleading. Syst. Zool., 27, p.401–410. [Online]. Available at: doi:10.2307/2412923.
Felsenstein, J. (1981). Evolutionary trees from DNA sequences: A maximum likelihood approach. Journal of Molecular Evolution, 17 (6), p.368–376. [Online]. Available at: doi:10.1007/BF01734359.
Felsenstein, J. (1985). Confidence limits on phylogenies: An approach using the bootstrap. Evolution, 39 (4), p.783–791. [Online]. Available at: doi:10.2307/2408678.
Fenty, F. D. (2015). Government engages Anegadians on protected areas. Press releases. [Online]. Available at: http://www.bvi.gov.vg/media-centre/government-engages-anegadians-protected-areas [Accessed: 1 August 2015].
Ferguson, D. M. (1998). Phylogenetic analysis and relationships in Hydrophyllaceae based on ndhF sequence data. Systematic Botany, 23 (3), p.253–268. [Online]. Available at: doi:10.2307/2419504 [Accessed: 15 August 2014].
Fernandez-Silva, I., Whitney, J., Wainwright, B., Andrews, K. R., Ylitalo-Ward, H., Bowen, B. W., Toonen, R. J., Goetze, E. and Karl, S. A. (2013). Microsatellites for next-generation ecologists: A post-sequencing bioinformatics pipeline. PLoS ONE, 8 (2), p.e55990. [Online]. Available at: doi:10.1371%2Fjournal.pone.0055990.
FGDC. (1997). National Vegetation Classification Standard. U.S. Geological Survey Professional Paper No. FGDC-STD-005, Reston, VA, USA: U.S. Geological Survey. [Online]. Available at: https://www.fgdc.gov/standards/projects/FGDC-standards-projects/vegetation/index_html.
Figueroa-Colón, J. C. (1996). Phytogeographical trends, centers of high species richness and endemism, and the question of extinctions in the native flora of Puerto Rico. Annals of the New York Academy of Sciences, 776, p.89–102.
Figueroa-Colón, J. C. and Woodbury, R. O. (1996). Rare and endangered plant species of Puerto Rico and the Virgin Islands: an annotated checklist. Annals of the New York Academy of

219
Sciences, 776, p.65–71. [Online]. Available at: http://dx.doi.org/10.1111/j.1749-6632.1996.tb17414.x.
Fischer, M., Husi, R., Prati, D., Peintinger, M., Kleunen, M. van and Schmid, B. (2000). RAPD variation among and within small and large populations of the rare clonal plant Ranunculus reptans (Ranunculaceae). American Journal of Botany, 87 (8), p.1128–1137. [Online]. Available at: http://www.jstor.org/stable/2656649.
Fishlock, W. C. (1912). The Virgin Islands, B.W.I.: A handbook of general information. Roadtown, Tortola: W.C. Fishlock.
Fitch, W. M. (1971). Toward defining the course of evolution: Minimum change for a specific tree topology. Systematic Biology, 20 (4), p.406–416. [Online]. Available at: doi:10.1093/sysbio/20.4.406.
Fitch, W. M. and Margoliash, E. (1967). Construction of phylogenetic trees. Science, 155 (3760), p.279–284. [Online]. Available at: doi:10.1126/science.155.3760.279.
Fleming, K., Johnston, P., Zwartz, D., Yokoyama, Y., Lambeck, K. and Chappell, J. (1998). Refining the eustatic sea-level curve since the Last Glacial Maximum using far- and intermediate-field sites. Earth and Planetary Science Letters, 163 (1-4), p.327–342. [Online]. Available at: doi:10.1016/S0012-821X(98)00198-8.
Flint-Garcia, S. A., Thornsberry, J. M. and Buckler IV, E. S. (2003). Structure of linkage disequilibrium in plants. Annual Review of Plant Biology, 54 (1), p.357–374. [Online]. Available at: doi:10.1146/annurev.arplant.54.031902.134907.
Franco̧is, O., Ancelet, S. and Guillot, G. (2006). Bayesian clustering using hidden Markov random fields in spatial population genetics. Genetics, 174 (2), p.805–816. [Online]. Available at: doi:10.1534/genetics.106.059923.
François, O. and Durand, E. (2010). Spatially explicit Bayesian clustering models in population genetics. Molecular Ecology Resources, 10 (5), p.773–784. [Online]. Available at: doi:10.1111/j.1755-0998.2010.02868.x.
Frankham, R., Ballou, J. D. and Briscoe, D. A. (2002). Introduction to conservation genetics. Cambridge, UK: Cambridge University Press.
Frankham, R., Ballou, J. D., Eldridge, M. D. B., Lacy, R. C., Ralls, K., Dudash, M. R. and Fenster, C. B. (2011). Predicting the probability of outbreeding depression. Conservation Biology, 25 (3), p.465–475. [Online]. Available at: doi:10.1111/j.1523-1739.2011.01662.x [Accessed: 13 July 2012].
Friesen, C. (1933). Les caractères essentiels de la famille des Sebestenaceae et révision du genre Varronia. Bull. Soc. Bot. Genève, 24, p.117–201.
Fritsch, P. W. and McDowell, T. D. (2003). Biogeography and phylogeny of Caribbean plants - Introduction. Systematic Botany, 28 (2), p.376–377. [Online]. Available at: doi:10.2307/3094006.
Frost, S. H., Harbour, J. L., Beach, D. K., Realini, M. J. and Harris, P. M. (1983). Oligocene reef tract development in southwestern Puerto Rico. Sedimenta, IX, p.1–141. [Online]. Available at: http://www.searchanddiscovery.com/documents/2009/60023frost/sedimenta9.pdf.
Gao, H., Williamson, S. and Bustamante, C. D. (2007). A Markov Chain Monte Carlo approach for joint inference of population structure and inbreeding rates from multilocus genotype data. Genetics, 176 (3), p.1635–1651. [Online]. Available at: doi:10.1534/genetics.107.072371.
Gardner, L., Smith-Abbott, J. and Woodfield, N. K. (2008). British Virgin Islands protected areas system plan 2007-2017. Roadtown, Tortola, BVI.

220
Gardner, M. G., Fitch, A. J., Bertozzi, T. and Lowe, A. J. (2011). Rise of the machines – Recommendations for ecologists when using next generation sequencing for microsatellite development. Molecular Ecology Resources, 11 (6), p.1093–1101. [Online]. Available at: doi:10.1111/j.1755-0998.2011.03037.x.
Gaviria, J. C. (1987). Die gattung Cordia in Venezuela. Mitteilungen der Botanischen Staatssammlung München, 23, Munich: H. Merxmüller, p.1–279. [Online]. Available at: http://www.biodiversitylibrary.org/item/53464 [Accessed: 20 September 2012].
Gielly, L. and Taberlet, P. (1994). The use of chloroplast DNA to resolve plant phylogenies: Noncoding versus rbcL sequences. Molecular Biology and Evolution, 11 (5), p.769–777. [Online]. Available at: http://mbe.oxfordjournals.org/content/11/5/769.abstract.
Gilman, E. F., Shober, A. L., Moore, K. A., Wiese, C., Paz, M. and Scheiber, S. M. (2009). Establishing shrubs in Florida landscapes. Extension Service Paper No. ENH1130, Gainesville, FL, USA. [Online]. Available at: http://edis.ifas.ufl.edu.
Glover III, L. and Mattson, P. H. (1973). Geologic map of the Rio Descalabrado Quadrangle, Puerto Rico. U.S. Geological Survey Numbered Series No. 735, Reston, VA, USA. [Online]. Available at: http://pubs.er.usgs.gov/publication/i735.
Glover III, L., Pease, M. H. and Arnow, T. (1977). Surficial geologic map of the Playa de Ponce and Santa Isabel quadrangles, Puerto Rico. U.S. Geological Survey Numbered Series No. 886, Reston, VA, USA. [Online]. Available at: http://pubs.er.usgs.gov/publication/mf886.
Golenberg, E. M., Bickel, A. and Weihs, P. (1996). Effect of highly fragmented DNA on PCR. Nucleic Acids Research, 24 (24), p.5026–5033. [Online]. Available at: doi:10.1093/nar/24.24.5026.
Gore, S. (2013). Anegada: An emergent Pleistocene reef island. In: Sheppard, C. R. C. (ed.), Coral Reefs of the United Kingdom Overseas Territories SE - 5, Coral Reefs of the World, 4, Dordrecht, The Netherlands: Springer Netherlands, p.47–60. [Online]. Available at: doi:10.1007/978-94-007-5965-7_5.
Gottschling, M. (2003). Phylogenetic analysis of selected Boraginales. PhD Thesis. Freien Universität Berlin. [Online]. Available at: http://www.diss.fu-berlin.de/diss/servlets/MCRFileNodeServlet/FUDISS_derivate_000000001181/00_kap0.pdf?hosts=.
Gottschling, M., Diane, N., Hilger, H. H. and Weigend, M. (2004). Testing hypotheses on disjunctions present in the primarily woody Boraginales: Ehretiaceae, Cordiaceae, and Heliotropiaceae, inferred from ITS1 sequence data. International Journal of Plant Sciences, 165 (S4), p.S123–S135. [Online]. Available at: doi:10.1086/421069.
Gottschling, M., Hilger, H. H., Wolf, M. and Diane, N. (2001). Secondary structure of the ITS1 transcript and its application in a reconstruction of the phylogeny of Boraginales. Plant Biology, 3 (6), p.629–636. [Online]. Available at: doi:10.1055/s-2001-19371.
Gottschling, M. and Miller, J. S. (2006). Clarification of the taxonomic position of Auxemma, Patagonula, and Saccellium (Cordiaceae, Boraginales). Systematic Botany, 31 (2), p.361–367. [Online]. Available at: doi:10.1600/036364406777585919.
Gottschling, M., Miller, J. S., Weigend, M. and Hilger, H. H. (2005). Congruence of a phylogeny of Cordiaceae (Boraginales) inferred from ITS1 sequence data with morphology, ecology, and biogeography. Annals of the Missouri Botanical Garden, 92 (3), p.425–437. [Online]. Available at: http://www.jstor.org/stable/40035480.
Goudet, J. (1995). FSTAT (Version 1.2): A computer program to calculate F-Statistics. Journal of Heredity, 86 (6), p.485–486. [Online]. Available at: http://jhered.oxfordjournals.org/content/86/6/485.short.

221
Gould, W. A., Alarcón, C., Fevold, B., Jiménez, M. E., Martinuzzi, S., Potts, G., Quiñones, M., Solórzano, M. and Ventosa, E. (2008). The Puerto Rico Gap Analysis Project. Volume 1: Land cover, vertebrate species distributions, and land stewardship. General Technical Report IITF-GTR-39, Río Piedras, Puerto Rico: U.S. Department of Agriculture, Forest Service, International Institute of Tropical Forestry.
Government of the Virgin Islands. (1981). Protection of endangered animals, plants and articles (removal and possession), CAP. 95. British Virgin Islands: BVI Department of Agriculture, p.1–3. [Online]. Available at: http://www.bvi.gov.vg/content/protection-endangered-animals-plants-and-articles-removal-and-possession-cap-95-1981.
Government of the Virgin Islands. (2004). Physical Planning Act, 2004 (No. 15 of 2004). British Virgin Islands, p.1–94. [Online]. Available at: http://www.ecolex.org/ecolex/ledge/view/RecordDetails;DIDPFDSIjsessionid=3E6A7EB4E2C2BD39599715558F9A324A?id=LEX-FAOC107520&index=documents.
Government of the Virgin Islands. (2005). National Parks Act, 2006. British Virgin Islands, p.1–60.
Goyder, D., Linsky, J., Bárrios, S., Hamilton, M., Woodfield-Pascoe, N. and Clubbe, C. (2014). 799. Metastelma anegadense. Curtis’s Botanical Magazine, 31 (4), p.321–332. [Online]. Available at: doi:10.1111/curt.12084.
Graham, A. (2003). Geohistory models and Cenozoic paleoenvironments of the Caribbean region. Systematic Botany, 28 (2), p.378–386. [Online]. Available at: doi:10.2307/3094007.
Greenwood, J. J. D. and Robinson, R. A. (2006). Principles of sampling. In: Sutherland, W. J. (ed.), Ecological census techniques, Cambridge, UK: Cambridge University Press, p.11–86. [Online]. Available at: doi:10.1017/CBO9780511790508.003.
Gregory, J. (2014). Projections of sea level rise. In: Stocker, T. F., Qin, D., Plattner, G.-K., Tignor, M., Allen, S. K., Boschung, J., Nauels, A., Xia, Y., Bex, V. and Midgley, P. M. (eds.), Climate change 2013: The physical science basis. Contribution of Working Group I to the Fifth Assessment Report of the Intergovernmental Panel on Climate Change, Cambridge, UK and New York, NY, USA: Cambridge University Press, p.1–16. [Online]. Available at: https://www.ipcc.ch/pdf/unfccc/cop19/3_gregory13sbsta.pdf.
Gregory, J. M., Church, J. a., Clark, P. U., Payne, A. J., Merrifield, M. a., Nerem, R. S., Nunn, P. D., Pfeffer, W. T. and Stammer, D. (2014). Comment on ‘Expert assessment of sea-level rise by AD 2100 and AD 2300’, by Horton et al. (2014). Quaternary Science Reviews, 97, p.193–194. [Online]. Available at: doi:10.1016/j.quascirev.2014.05.024.
Grinsted, A., Moore, J. C. and Jevrejeva, S. (2010). Reconstructing sea level from paleo and projected temperatures 200 to 2100 ad. Climate Dynamics, 34 (4), p.461–472. [Online]. Available at: doi:10.1007/s00382-008-0507-2.
Grisebach, A. H. R. (1859). Flora of the British West Indian islands. London, UK: L. Reeve & Co. [Online]. Available at: http://www.biodiversitylibrary.org/item/3740.
Guedj, B. and Guillot, G. (2011). Estimating the location and shape of hybrid zones. Molecular Ecology Resources, 11 (6), p.1119–1123. [Online]. Available at: doi:10.1111/j.1755-0998.2011.03045.x.
Guillot, G. (2008). Inference of structure in subdivided populations at low levels of genetic differentiation. The correlated allele frequencies model revisited. Bioinformatics, 24 (19), p.2222–2228. [Online]. Available at: doi:10.1093/bioinformatics/btn419.
Guillot, G. (2009). On the inference of spatial structure from population genetics data. Bioinformatics, 25 (14), p.1796–1801. [Online]. Available at: doi:10.1093/bioinformatics/btp267.

222
Guillot, G., Estoup, A., Mortier, F. and Cosson, J. F. (2005a). A spatial statistical model for landscape genetics. Genetics, 170 (3), p.1261–1280. [Online]. Available at: doi:10.1534/genetics.104.033803.
Guillot, G., Leblois, R., Coulon, A. and Frantz, A. C. (2009). Statistical methods in spatial genetics. Molecular Ecology, 18, p.4734–4756. [Online]. Available at: doi:10.1111/j.1365-294X.2009.04410.x.
Guillot, G., Mortier, F. and Estoup, A. (2005b). Geneland: A computer package for landscape genetics. Molecular Ecology Notes, 5 (3), p.712–715. [Online]. Available at: doi:10.1111/j.1471-8286.2005.01031.x.
Guillot, G., Renaud, S., Ledevin, R., Michaux, J. and Claude, J. (2012). A unifying model for the analysis of phenotypic, genetic, and geographic data. Systematic Biology, 61 (6), p.897–911. [Online]. Available at: doi:10.1093/sysbio/sys038.
Guillot, G. and Santos, F. (2009). A computer program to simulate multilocus genotype data with spatially autocorrelated allele frequencies. Molecular Ecology Resources, 9 (4), p.1112–1120. [Online]. Available at: doi:10.1111/j.1755-0998.2008.02496.x.
Guillot, G. and Santos, F. (2010). Using AFLP markers and the Geneland program for the inference of population genetic structure. Molecular Ecology Resources, 10 (6), p.1082–1084. [Online]. Available at: doi:10.1111/j.1755-0998.2010.02864.x.
Guillot, G., Santos, F. and Estoup, A. (2008). Analysing georeferenced population genetics data with Geneland: A new algorithm to deal with null alleles and a friendly graphical user interface. Bioinformatics, 24 (11), p.1406–1407. [Online]. Available at: doi:10.1093/bioinformatics/btn136.
Guo, S. W. and Thompson, E. A. (1992). Performing the exact test of Hardy-Weinberg proportion for multiple alleles. Biometrics, 48 (2), p.361–372. [Online]. Available at: http://www.ncbi.nlm.nih.gov/pubmed/1637966.
Gürke, M. (1893). Boraginaceae. In: Engler, A. and Prantl, K. (eds.), Die natürlichen Pflanzenfamilien IV, Leipzig, Germany: Engelmann, p.71–131.
Guzmán, B. and Vargas, P. (2005). Systematics, character evolution, and biogeography of Cistus L. (Cistaceae) based on ITS, trnL-trnF, and matK sequences. Molecular Phylogenetics and Evolution, 37 (3), p.644–660. [Online]. Available at: doi:10.1016/j.ympev.2005.04.026.
Hagemann, W. (1975). Eine mögliche strategie der vergleichenden morphologie zur phylogenetischen rekonstruktion. Bot. Jahrb. Syst., 96, p.107–124.
Hamilton, M. A. (2005). The role of propagation in conserving endangered endemic plants of the Virgin Islands. In: Proceedings of the International Plant Propagators Society, (55), 2005, p.235–239. [Online]. Available at: http://www.pubhort.org/ipps/54/48.htm.
Hamilton, M. A. (2008). Herbarium specimen and field data collection. Unpublished Kew UKOTs data collection manual, Richmond, Surrey, UK: Royal Botanic Gardens, Kew.
Hamilton, M. A., Corcoran, M. R., Clubbe, C. P. and Barrios, S. B. (2015a). UKOTs species and specimens database. Developing a Species and Specimens Database for the UKOTs Programme. [Online]. Available at: http://www.kew.org/science/directory/projects/SppSpecDatabaseUKOT.html [Accessed: 30 August 2015].
Hamilton, M., Clubbe, C., Corcoran, M. and Sanchez, M. (2015b). 814. Varronia rupicola. Curtis’s Botanical Magazine, 32 (2), p.144–161. [Online]. Available at: doi:10.1111/curt.12106.
Hammer, Ø., Harper, D. A. T. and Ryan, P. D. (2001). PAST: Paleontological statistics software package for education and data analysis. Palaeontologia Electronica, 4 (1), p.1–9. [Online].

223
Available at: http://palaeo-electronica.org/2001_1/past/issue1_01.htm.
Hansen, J., Sato, M., Kharecha, P., Russell, G., Lea, D. W. and Siddall, M. (2007). Climate change and trace gases. Philosophical Transactions of the Royal Society A: Mathematical, Physical and Engineering Sciences, 365 (1856), p.1925–1954. [Online]. Available at: doi:10.1098/rsta.2007.2052.
Hansen, M. C., Potapov, P. V., Moore, R., Hancher, M., Turubanova, S. A., Tyukavina, A., Thau, D., Stehman, S. V., Goetz, S. J., Loveland, T. R., Kommareddy, A., Egorov, A., Chini, L., Justice, C. O. and Townshend, J. R. G. (2013). High-resolution global maps of 21st-Century forest cover change. Science, 342 (6160), p.850–853. [Online]. Available at: doi:10.1126/science.1244693.
Hasegawa, M., Kishino, H. and Yano, T. (1985). Dating of the human-ape splitting by a molecular clock of mitochondrial DNA. Journal of Molecular Evolution, 22 (2), p.160–174. [Online]. Available at: doi:10.1007/BF02101694.
Hastings, W. K. (1970). Monte Carlo sampling methods using Markov chains and their applications. Biometrika, 57 (1), p.97–109. [Online]. Available at: doi:10.1093/biomet/57.1.97.
Haston, E., Richardson, J. E., Stevens, P. F., Chase, M. W. and Harris, D. J. (2009). The linear angiosperm phylogeny group (LAPG) III: A linear sequence of the families in APG III. Botanical Journal of the Linnean Society, 161 (2), p.128–131. [Online]. Available at: doi:10.1111/j.1095-8339.2009.01000.x.
Heath, T. A., Hedtke, S. M. and Hillis, D. M. (2008). Taxon sampling and the accuracy of phylogenetic analyses. Journal of Systematics and Evolution, 46, p.239–257. [Online]. Available at: doi:10.3724/SP.J.1002.2008.08016.
Heatwole, H. and MacKenzie, F. (1967). Herpetogeography of Puerto Rico. IV. Paleogeography, faunal similarity and endemism. Evolution, 21 (3), p.429–438.
Hedrick, P. W. (2005). A standardized genetic differentiation measure. Evolution, 59 (8), p.1633–1638. [Online]. Available at: doi:10.1111/j.0014-3820.2005.tb01814.x.
Helmer, E. H., Brandeis, T. A., Lugo, A. E. and Kennaway, T. A. (2008). Factors influencing spatial pattern in tropical forest clearance and stand age: Implications for carbon storage and species diversity. Journal of Geophysical Research, 113 (G2), p.1–14. [Online]. Available at: doi:10.1029/2007JG000568.
Helmer, E. H., Ramos, O., López, T. del M., Quiñones, M. and Díaz, W. (2002). Mapping the forest type and land cover of Puerto Rico, a component of the Caribbean diodiversity hotspot. Caribbean Journal of Science, 38 (3-4), p.165–183.
Helmer, E. H. and Ruefenacht, B. (2005). Cloud-free satellite image mosaics with regression trees and histogram matching. Photogrammetric Engineering & Remote Sensing, 71 (9), p.1079–1089. [Online]. Available at: doi:10.14358/PERS.71.9.1079.
Hennig, W. (1966). Phylogenetic systematics. Urbana, IL, USA: University of Illinois Press.
Heubl, G. R., Gaviria, J. C. and Wanner, G. (1990). A contribution to the taxonomy and evolution of Cordia (Boraginaceae) and allied genera. Botanische Jahrbücher für Systematik, Pflanzengeschichte und Pflanzengeographie, 112, p.129–165.
Heywood, V. H. and Iriondo, J. M. (2003). Plant conservation: Old problems, new perspectives. Biological Conservation, 113 (3), p.321–335. [Online]. Available at: doi:10.1016/s0006-3207(03)00121-6.
Higgins, D. and Lemey, P. (2009). Multiple sequence alignment. In: Lemey, P., Salemi, M. and Vandamme, A.-M. (eds.), The phylogenetic handbook: A practical approach to phylogenetic analysis and hypothesis testing, 2nd ed, Cambridge, England: Cambridge University Press, p.68–99.

224
Hoban, S. and Strand, A. (2015). Ex-situ seed collections will benefit from considering spatial sampling design and species’ reproductive biology. Biological Conservation, 187, p.182–191. [Online]. Available at: doi:10.1016/j.biocon.2015.04.023.
Horning, N., Robinson, J. A., Sterling, E. J., Turner, W. and Spector, S. (2010). Remote sensing for ecology and conservation: A handbook of techniques. Sutherland, W. J. (ed.). Oxford, UK: Oxford University Press.
Horton, B. P., Rahmstorf, S., Engelhart, S. E. and Kemp, A. C. (2014). Expert assessment of sea-level rise by AD 2100 and AD 2300. Quaternary Science Reviews, 84, p.1–6. [Online]. Available at: doi:10.1016/j.quascirev.2013.11.002.
Howard, J. (1970). Reconnaissance geology of Anegada Island. Caribbean Res. Inst. Spec. Geol. Publ., 1, p.1–19. [Online]. Available at: https://archive.org/details/reconnaissancege00unse.
Hubisz, M. J., Falush, D., Stephens, M. and Pritchard, J. K. (2009). Inferring weak population structure with the assistance of sample group information. Molecular Ecology Resources, 9, p.1322–1332. [Online]. Available at: doi:10.1111/j.1755-0998.2009.02591.x.
Huelsenbeck, J. P., Larget, B., van der Mark, P., Ronquist, F., Simon, D. and Teslenko, M. (2014). MrBayes: Bayesian Inference of Phylogeny. [Online]. Available at: http://www.molecularevolution.org/software/phylogenetics/mrbayes.
Huelsenbeck, J. P., Rannala, B. and Masly, J. P. (2000). Accommodating phylogenetic uncertainty in evolutionary studies. Science, 288 (5475), p.2349–2350. [Online]. Available at: doi:10.1126/science.288.5475.2349.
Huelsenbeck, J. P. and Ronquist, F. (2001). MRBAYES: Bayesian inference of phylogenetic trees. Bioinformatics, 17 (8), p.754–755. [Online]. Available at: doi:10.1093/bioinformatics/17.8.754.
Huggins, A., Chatwin, A., Keel, S., Kramer, P., Núñez, F., Schill, S., McPearson, M., Thurlow, K., Libby, M., Tingey, R., Palmer, M. and Seybert, R. (2007). Biodiversity conservation assessment of the insular Caribbean using the Caribbean decision support system, summary report. Arlington, VA, USA: The Nature Conservancy.
IPCC. (2012). Summary for policymakers. In: Field, C. B., Barros, V., Stocker, T. F., Qin, D., Dokken, D. J., Ebi, K. L., Mastrandrea, M. D., Mach, K. J., Plattner, G.-K., Allen, S. K., Tignor, M. and Midgley, P. M. (eds.), Managing the risks of extreme events and disasters to advance climate change adaptation. A Special Report of Working Groups I and II of the Intergovernmental Panel on Climate Change., Cambridge, UK, and New York, NY, USA: Cambridge University Press, p.1–19. [Online]. Available at: doi:10.1017/CBO9781139177245.
IPCC. (2013a). Annex II: Climate system scenario tables. In: Prather, M., Flato, G., Friedlingstein, P., Jones, C., Lamarque, J.-F., Liao, H. and Rasch, P. (eds.), Climate change 2013: The physical science basis. Contribution of Working Group I to the Fifth Assessment Report of the Intergovernmental Panel on Climate Change, Cambridge, UK and New York, NY, USA: Cambridge University Press, p.1395–1446. [Online]. Available at: doi:10.1017/CBO9781107415324.030.
IPCC. (2013b). Climate Change 2013: The physical science basis. Contribution of Working Group I to the Fifth Assessment Report of the Intergovernmental Panel on Climate Change. Stocker, T. F., Qin, D., Plattner, G.-K., Tignor, M., Allen, S. K., Boschung, J., Nauels, A., Xia, Y., Bex, V. and Midgley, P. M. (eds.). Cambridge, UK and New York, NY, USA: Cambridge University Press. [Online]. Available at: http://www.ipcc.ch/pdf/assessment-report/ar5/wg1/WG1AR5_ALL_FINAL.pdf.
IUCN/SSC. (2013). Guidelines for reintroductions and other conservation translocations. Gland, Switzerland: IUCN Species Survival Commission. [Online]. Available at: http://www.iucnsscrsg.org/images/new rsg reintro guidelines 2013.pdf.

225
Jaccard, P. (1901). Étude comparative de la distribuition florale dans une portion des Alpes et des Jura. Bull Soc Vandoise Sci Nat, 37, p.547–579.
Janzen, D. H. (1988). Tropical dry forest: The most endangered major tropical ecosystem. In: Wilson, E. O. (ed.), Biodiversity, Washington DC, USA: National Academic Press, p.130–137.
Johnson, J. B. and Omland, K. S. (2014). Model selection in ecology and evolution. Trends in Ecology & Evolution, 19 (2), p.101–108. [Online]. Available at: doi:10.1016/j.tree.2003.10.013.
Johnston, I. M. (1949). Studies in the Boraginaceae, XVII. Cordia section Varronia in Mexico and Central America. Journal of the Arnold Arboretum, 30, p.85–110. [Online]. Available at: http://biostor.org/reference/61899 [Accessed: 26 October 2012].
Joyce, J. (2009). Geologic and tectonic setting of the BVI. In: Origin of the Seismic Hazard, 2009, Roadtown, Tortola: BVI Dept. of Disaster Management, p.1–29. [Online]. Available at: http://www.bviddm.com/document-center/JJ Presentation BVI 1.pdf.
Jukes, T. H. and Cantor, C. R. (1969). Evolution of protein molecules. In: Munro, H. N. (ed.), Mammalian protein metabolism, New York: Academic Press, p.21–123.
Jung, Y.-H., Kwon, H.-M., Kang, S.-H., Kang, J.-H. and Kim, S.-C. (2005). Investigation of the phylogenetic relationships within the genus Citrus (Rutaceae) and related species in Korea using plastid trnL-trnF sequences. Scientia Horticulturae, 104 (2), p.179–188. [Online]. Available at: doi:10.1016/j.scienta.2004.08.008.
Kairo, M., Ali, B., Cheesman, O., Haysom, K. and Murphy, S. (2003). Invasive species threats in the Caribbean region. Unpublished report submitted to The Nature Conservancy, Arlington, VA, USA: The Nature Conservancy. [Online]. Available at: Invasive Species Threats in the Caribbean Region.
Kalinowski, S. T. (2004). Counting alleles with rarefaction: Private alleles and hierarchical sampling designs. Conservation Genetics, 5 (4), p.539–543. [Online]. Available at: doi:10.1023/B:COGE.0000041021.91777.1a.
Kang, J., Soog Lee, M. and Gorenstein, D. G. (2005). The enhancement of PCR amplification of a random sequence DNA library by DMSO and betaine: Application to in vitro combinatorial selection of aptamers. Journal of Biochemical and Biophysical Methods, 64 (2), p.147–151. [Online]. Available at: doi:10.1016/j.jbbm.2005.06.003.
Kaye, C. A. (1957). Notes on the structural geology of Puerto Rico. Geological Society of America Bulletin, 68 (1), p.103–118. [Online]. Available at: doi:10.1130/0016-7606(1957)68[103:NOTSGO]2.0.CO;2.
Keel, S. (2005). Caribbean ecoregional assessment Puerto Rico - Terrestrial biodiversity. In: Unpublished report submitted to The Nature Conservancy, San Juan, Puerto Rico: The Nature Conservancy, p.1–139.
Kelchner, S. A. (2002). Group II introns as phylogenetic tools: Structure, function, and evolutionary constraints. American Journal of Botany, 89 (10), p.1651–1669. [Online]. Available at: doi:10.3732/ajb.89.10.1651.
Kennaway, T. A., Helmer, E. H., Lefsky, M. A., Brandeis, T. A. and Sherrill, K. R. (2008). Mapping land cover and estimating forest structure using satellite imagery and coarse resolution lidar in the Virgin Islands. Journal of Applied Remote Sensing, 2 (023551), p.1–27. [Online]. Available at: doi:10.1117/1.3063939.
Kennaway, T. and Helmer, E. H. (2007). The forest types and ages cleared for land development in Puerto Rico. GIScience & Remote Sensing, 44 (4), p.356–382. [Online]. Available at: doi:10.2747/1548-1603.44.4.356.
Kimura, M. (1980). A simple method for estimating evolutionary rates of base substitutions

226
through comparative studies of nucleotide sequences. Journal of molecular evolution, 16 (2), p.111–120. [Online]. Available at: http://www.ncbi.nlm.nih.gov/pubmed/7463489 [Accessed: 31 July 2014].
Kocyan, A., Snijman, D. A., Forest, F., Devey, D. S., Freudenstein, J. V, Wiland-Szymańska, J., Chase, M. W. and Rudall, P. J. (2011). Molecular phylogenetics of Hypoxidaceae – Evidence from plastid DNA data and inferences on morphology and biogeography. Molecular Phylogenetics and Evolution, 60 (1), p.122–136. [Online]. Available at: doi:10.1016/j.ympev.2011.02.021.
Kopelman, N. M., Mayzel, J., Jakobsson, M., Rosenberg, N. A. and Mayrose, I. (2015). Clumpak: A program for identifying clustering modes and packaging population structure inferences across K. Molecular Ecology Resources, 15 (5), p.1179–1191. [Online]. Available at: doi:10.1111/1755-0998.12387.
Kopp, R. E., Hay, C. C., Little, C. M. and Mitrovica, J. X. (2015). Geographic variability of sea-level change. Current Climate Change Reports, 1 (3), p.192–204. [Online]. Available at: doi:10.1007/s40641-015-0015-5.
Koressaar, T. and Remm, M. (2007). Enhancements and modifications of primer design program Primer3. Bioinformatics, 23 (10), p.1289–1291. [Online]. Available at: doi:10.1093/bioinformatics/btm091.
Kramer, A. T. and Havens, K. (2009). Plant conservation genetics in a changing world. Trends in Plant Science, 14 (11), p.599–607. [Online]. Available at: doi:10.1016/j.tplants.2009.08.005.
Krushensky, R. D. and Monroe, W. H. (1975). Geologic map of the Ponce Quadrangle, Puerto Rico. U.S. Geological Survey Numbered Series No. 863, Reston, VA, USA. [Online]. Available at: http://pubs.er.usgs.gov/publication/i863.
Krushensky, R. D. and Monroe, W. H. (1978). Geologic map of the Penuelas and Punta Cuchara quadrangles, Puerto Rico. U.S. Geological Survey Numbered Series No. 1042, Reston, VA, USA: U.S. Geological Survey. [Online]. Available at: http://pubs.er.usgs.gov/publication/i1042.
Krushensky, R. D. and Monroe, W. H. (1979). Geologic map of the Yauco and Punta Verraco quadrangles, Puerto Rico. U.S. Geological Survey Numbered Series No. 1147, Reston, VA, USA. [Online]. Available at: http://pubs.er.usgs.gov/publication/i1147.
Kynast, R. G., Joseph, J. A., Pellicer, J., Ramsay, M. M. and Rudall, P. J. (2014). Chromosome behavior at the base of the angiosperm radiation: Karyology of Trithuria submersa (Hydatellaceae, Nymphaeales). American Journal of Botany, 101 (9), p.1447–1455. [Online]. Available at: doi:10.3732/ajb.1400050 [Accessed: 24 September 2014].
Lambeck, K., Esat, T. M. and Potter, E.-K. (2002a). Links between climate and sea levels for the past three million years. Nature, 419 (6903), p.199–206. [Online]. Available at: doi:10.1038/nature01089.
Lambeck, K., Yokoyama, Y. and Purcell, T. (2002b). Into and out of the Last Glacial Maximum: Sea-level change during Oxygen Isotope Stages 3 and 2. Quaternary Science Reviews, 21 (1-3), p.343–360. [Online]. Available at: doi:10.1016/S0277-3791(01)00071-3.
Larget, B. and Simon, D. L. (1999). Markov chain Monte Carlo algorithms for the Bayesian analysis of phylogenetic trees. Molecular Biology and Evolution, 16 (6), p.750–759. [Online]. Available at: http://mbe.oxfordjournals.org/content/16/6/750.short.
Learned, R. E., Grove, G. R. and Boissen, R. (1973). A geochemical reconnaissance of the Island of Vieques, Puerto Rico. U.S. Geological Survey Numbered Series No. 73-155, Reston, VA, USA. [Online]. Available at: http://pubs.er.usgs.gov/publication/ofr73155.
Leberg, P. L. (2002). Estimating allelic richness: Effects of sample size and bottlenecks.

227
Molecular Ecology, 11 (11), Blackwell Science Ltd, p.2445–2449. [Online]. Available at: doi:10.1046/j.1365-294X.2002.01612.x.
Leitch, I. J. and Bennett, M. D. (1997). Polyploidy in angiosperms. Trends in Plant Science, 2 (12), p.470–476. [Online]. Available at: doi:10.1016/S1360-1385(97)01154-0.
Levene, H. (1949). On a matching problem arising in genetics. The Annals of Mathematical Statistics, 20 (1), p.91–94. [Online]. Available at: Stable URL: http://www.jstor.org/stable/2236806.
Li, D.-Z. and Pritchard, H. W. (2009). The science and economics of ex situ plant conservation. Trends in Plant Science, 14 (11), p.614–621. [Online]. Available at: doi:10.1016/j.tplants.2009.09.005.
Li, S. (1996). Phylogenetic tree construction using Markov chain Monte Carlo. PhD Thesis. Ohio State University, Columbus, OH, USA. [Online]. Available at: http://web.stat.ufl.edu/~doss/Research/mc-trees.pdf.
Li, S., Pearl, D. K. and Doss, H. (2000). Phylogenetic tree construction using Markov chain Monte Carlo. Journal of the American Statistical Association, 95 (450), p.493–508. [Online]. Available at: doi:10.2307/2669394.
Liebhold, A. M. (1995). Invasion by exotic forest pests: A threat to forest ecosystems. Forest Science Monograph, 30, Bethesda, Maryland: The Society of American Foresters, p.1–49.
Linnaeus, C. (1753). Species Plantarum. 1st ed. Stockholm, Sweden: Salvius.
Linnaeus, C. (1762). Species Plantarum. 2nd ed. Stockholm, Sweden: Salvius.
Lischer, H. E. L. and Excoffier, L. (2012). PGDSpider: An automated data conversion tool for connecting population genetics and genomics programs. Bioinformatics, 28 (2), p.298–299. [Online]. Available at: doi:10.1093/bioinformatics/btr642.
Little, E. L., Woodbury, R. O. and Wadsworth, F. H. (1976). Flora of Virgin Gorda (British Virgin islands). Río Piedras, Puerto Rico: Forest Service: U.S. department of Agriculture.
Lomolino, M. V. (2010). Four Darwinian themes on the origin, evolution and preservation of island life. Journal of Biogeography, 37 (6), Blackwell Publishing Ltd, p.985–994. [Online]. Available at: doi:10.1111/j.1365-2699.2009.02247.x.
Lomolino, M. V, Riddle, B. R. and Brown, J. H. (2006). The science of biogeography. In: Biogeography, 3rd ed, Sunderland, MA: Sinauer Associates, Inc., p.4–12. [Online]. Available at: http://www.montana.edu/paleoecology/GEOG302/Supp_Readings/Lomolino_et_al_Chap_1.pdf.
Love, M. R., Sutherland, M., Beasley, L., Carignan, K. S. and Eakins, B. W. (2015). Digital elevation models of the U. S. Virgin Islands: Procedures, data sources and analysis. Boulder, CO, USA. [Online]. Available at: http://www.ngdc.noaa.gov/dem/squareCellGrid/download/5110.
Luebert, F. and Wen, J. (2008). Phylogenetic analysis and evolutionary diversification of Heliotropium sect. Cochranea (Heliotropiaceae) in the Atacama Desert. Syst. Bot., 33, p.390–402. [Online]. Available at: doi:10.1600/036364408784571635.
Lugo, A. E., Brown, S. L., Dodson, R., Smith, T. and Shugart, H. H. (1999). The Holdridge life zones of the conterminous United States in relation to ecosystem mapping. Journal of Biogeography, 26, p.1025–1038.
Lugo, A. E., Castro, L. M., Vale, A., López, T. del M., Prieto, E. H., Martinó, A. G., Rolón, A. R. P., Tossas, A. G., McFarlane, D. A., Miller, T., Rodriguez, A., Lundberg, J., Thomlinson, J. R., Colón, J., Schellekens, J. H., Ramos, O. and Helmer, E. H. (2001). Puerto Rican karst - a vital resource. San Juan, PR.
228
Lugo, A. E., Medina, E., Trejo-Torres, J. C. and Helmer, E. H. (2006). Botanical and ecological basis for the resilience of Antillean dry forests. In: Ratter, J. A. (ed.), Neotropical savannas and seasonally dry forests, plant diversity, biogeography, and conservation, Boca Raton, FL: CRC Press, p.359–381. [Online]. Available at: http://books.google.com/books?hl=en&lr=&id=iS66HT1Py-sC&oi=fnd&pg=PA359&dq=Botanical+and+ecological+basis+for+the+resilience+of+Antillean+dry+forests&ots=fStewHpTmW&sig=Qj4bWxe9QsrKHdxBKI7dl6ArLaE#PPA379,M1.
Lugo, A. E., Ramos, O., Molina, S. and Scatena, F. N. (1996). A fifty three-year record of land use change in the Guánica Forest Biosphere Reserve and its vicinity. Río Piedras, Puerto Rico: U.S. Department of Agriculture Forest Service, International Institute ofTropical Forestry and Fundación Puertoriqueña de Conservación.
Malone, C. L., Knapp, C. R., Taylor, J. F. and Davis, S. K. (2003). Genetic consequences of Pleistocene fragmentation: Isolation, drift, and loss of diversity in rock iguanas (Cyclura). Conservation Genetics, 4 (1), p.1–15. [Online]. Available at: doi:10.1023/A:1021885323539.
Malumphy, C., Hamilton, M. A., Manco, B. N., Green, P. W. C., Sanchez, M. D., Corcoran, M. and Salamanca, E. (2012). Toumeyella parvicornis (Hemiptera: Coccidae), causing severe decline of Pinus caribaea var. bahamensis in the Turks and Caicos Islands. Florida Entomologist, 95 (1), p.113–119. [Online]. Available at: doi:10.1653/024.095.0118.
Malumphy, C., Sanchez, M. D. and Hamilton, M. A. (2015). First report of lesser snow scale (Pinnaspis strachani (Cooley) (Hemiptera: Diaspididae) killing Varronia rupicola (Urb.) Britton in the British Virgin Islands. Entomologist’s Monthly Magazine, 151, p.285–288.
Mann, P. (2005). Introduction. In: Mann, P. (ed.), Special Paper 385: Active tectonics and seismic hazards of Puerto Rico, the Virgin Islands, and offshore areas, Boulder, Colorado: Geological Society of America, p.1–12. [Online]. Available at: doi:10.1130/0-8137-2385-X.1.
Mann, P., Hippolyte, J.-C., Grindlay, N. R. and Abrams, L. J. (2005). Neotectonics of southern Puerto Rico and its offshore margin. In: Mann, P. (ed.), Special Paper 385: Active tectonics and seismic hazards of Puerto Rico, the Virgin Islands, and offshore areas, Boulder, Colorado: Geological Society of America, p.173–214. [Online]. Available at: doi:10.1130/0-8137-2385-X.173.
Margulies, M., Egholm, M., Altman, W. E., Attiya, S., Bader, J. S., Bemben, L. A., Berka, J., Braverman, M. S., Chen, Y.-J., Chen, Z., Dewell, S. B., Du, L., Fierro, J. M., Gomes, X. V, Godwin, B. C., He, W., Helgesen, S., Ho, C. H., Irzyk, G. P., Jando, S. C., Alenquer, M. L. I., Jarvie, T. P., Jirage, K. B., Kim, J.-B., Knight, J. R., Lanza, J. R., Leamon, J. H., Lefkowitz, S. M., Lei, M., Li, J., Lohman, K. L., Lu, H., Makhijani, V. B., McDade, K. E., McKenna, M. P., Myers, E. W., Nickerson, E., Nobile, J. R., Plant, R., Puc, B. P., Ronan, M. T., Roth, G. T., Sarkis, G. J., Simons, J. F., Simpson, J. W., Srinivasan, M., Tartaro, K. R., Tomasz, A., Vogt, K. A., Volkmer, G. A., Wang, S. H., Wang, Y., Weiner, M. P., Yu, P., Begley, R. F. and Rothberg, J. M. (2005). Genome sequencing in microfabricated high-density picolitre reactors. Nature, 437 (7057), p.376–380. [Online]. Available at: doi:10.1038/nature03959.
Martín-Bravo, S., Meimberg, H., Luceño, M., Märkl, W., Valcárcel, V., Bräuchler, C., Vargas, P. and Heubl, G. (2007). Molecular systematics and biogeography of Resedaceae based on ITS and trnL-F sequences. Molecular Phylogenetics and Evolution, 44 (3), p.1105–1120. [Online]. Available at: doi:10.1016/j.ympev.2006.12.016.
Martinson, D. G., Pisias, N. G., Hays, J. D., Imbrie, J., Moore, T. C. and Shackleton, N. J. (1987). Age dating and the orbital theory of the ice ages: Development of a high-resolution 0 to 300,000-year chronostratigraphy. Quaternary Research, 27 (1), p.1–29. [Online]. Available at: doi:10.1016/0033-5894(87)90046-9.
Martinuzzi, S., Gould, W., Ramos-González, O. M. and Brook, E. E. (2007). Development of a

229
landforms model for Puerto Rico and its application for land cover change analysis. Caribbean Journal of Science, 43 (2), p.161–171.
Mason-Gamer, R. J., Weil, C. F. and Kellogg, E. A. (1998). Granule-bound starch synthase: Structure, function, and phylogenetic utility. Molecular biology and evolution, 15 (12), p.1658–1673. [Online]. Available at: http://www.ncbi.nlm.nih.gov/pubmed/9866201 [Accessed: 15 August 2014].
Masson, D. G. and Scanlon, K. M. (1991). The neotectonic setting of Puerto Rico. Geological Society of America Bulletin, 103 (1), p.144–154. [Online]. Available at: doi:10.1130/0016-7606(1991)103<0144:TNSOPR>2.3.CO;2.
Masson-Delmotte, V., Schulz, M., Abe-Ouchi, A., Beer, J., Ganopolski, A., Rouco, J. F. G., Jansen, E., Lambeck, K., Luterbacher, J., Naish, T., Osborn, T., Otto-Bliesner, B., Quinn, T., Ramesh, R., Rojas, M., Shao, X. and Timmermann, A. (2013). Information from paleoclimate archives. In: Stocker, T. F., Qin, D., Plattner, G.-K., Tignor, M., Allen, S. K., Boschung, J., Nauels, A., Xia, Y., Bex, V. and Midgley, P. M. (eds.), Climate change 2013: The physical science basis. Contribution of Working Group I to the Fifth Assessment Report of the Intergovernmental Panel on Climate Change, Cambridge, UK and New York, NY, USA: Cambridge University Press, p.383–464. [Online]. Available at: http://www.ipcc.ch/report/ar5/wg1/.
Mau, B., Newton, M. and Larget, B. (1999). Bayesian phylogenetic inference via Markov chain Monte Carlo methods. Biometrics, 55, p.1–12.
McGowan, A., Broderick, A. C., Clubbe, C. P., Gore, S., Godley, B. J., Hamilton, M. A., Lettsome, B., Smith-Abbott, J. and Woodfield, N. K. (2006a). Darwin Initiative action plan for the coastal biodiversity of Anegada, British Virgin Islands. In: Unpublished report submitted to Darwin Initiative, Falmouth, Cornwall, UK: University of Exeter, p.1–13. [Online]. Available at: http://www.seaturtle.org/mtrg/projects/anegada/.
McGowan, A., Broderick, A. C., Gore, S., Hilton, G., Woodfield, N. K. and Godley, B. J. (2006b). Breeding seabirds in the British Virgin Islands. Endangered Species Research, 2, p.15–20.
McLaren, K. P. and McDonald, M. A. (2003). The effects of moisture and shade on seed germination and seedling survival in a tropical dry forest in Jamaica. Forest Ecology and Management, 183 (1-3), p.61–75. [Online]. Available at: doi:10.1016/S0378-1127(03)00100-2.
McMullen, C. K. (2012). Pollination of the heterostylous Galápagos native, Cordia lutea (Boraginaceae). Plant Systematics & Evolution, 298 (3), p.569–579. [Online]. Available at: doi:10.1007/s00606-011-0567-3.
Medlin, L., Elwood, H. J., Stickel, S. and Sogin, M. L. (1988). The characterization of enzymatically amplified eukaryotic 16S-like rRNA-coding regions. Gene, 71 (2), p.491–499. [Online]. Available at: doi:10.1016/0378-1119(88)90066-2.
Meglécz, E., Costedoat, C., Dubut, V., Gilles, A., Malausa, T., Pech, N. and Martin, J.-F. (2010). QDD: A user-friendly program to select microsatellite markers and design primers from large sequencing projects. Bioinformatics, 26 (3), p.403–404. [Online]. Available at: doi:10.1093/bioinformatics/btp670.
Meinshausen, M., Smith, S. J., Calvin, K., Daniel, J. S., Kainuma, M. L. T., Lamarque, J.-F., Matsumoto, K., Montzka, S. A., Raper, S. C. B., Riahi, K., Thomson, A., Velders, G. J. M. and van Vuuren, D. P. P. (2011). The RCP greenhouse gas concentrations and their extensions from 1765 to 2300. Climatic Change, 109 (1-2), p.213–241. [Online]. Available at: doi:10.1007/s10584-011-0156-z.
Meirmans, P. G. (2006). Using the AMOVA framework to estimate a standardized genetic differentiation measure. Evolution, 60 (11), p.2399–2402. [Online]. Available at: http://www.jstor.org/stable/4134847.

230
Metropolis, N., Rosenbluth, A. W., Rosenbluth, M. N., Teller, A. H. and Teller, E. (1953). Equations of state calculations by fast computing machines. J. Chem. Phys., 21, p.1087–1091. [Online]. Available at: http://bayes.wustl.edu/Manual/EquationOfState.pdf.
Meyerhoff, H. A. (1926). Geology of the Virgin Islands, Culebra, and Vieques Part 1: Physiography. Scientific Survey of Porto Rico and the Virgin Islands, 4 (1), New York, NY, USA: New York Academy of Sciences, p.71–138.
Meyerhoff, H. A. (1927). Geology of the Virgin Islands, Culebra, and Vieques Part 2: Physiography (concluded). Scientific Survey of Porto Rico and the Virgin Islands, 4 (2), New York, NY, USA: New York Academy of Sciences, p.145–216.
Mez, C. (1890). Morphologische und anatomische studien über die gruppe der Cordieae. Bot. Jahrb. Syst., 12 (5), p.526–588.
Michel, F. and Dujon, B. (1983). Conservation of RNA secondary structures in two intron families including mitochondrial-, chloroplast- and nuclear-encoded members. EMBO Journal, 2 (1), p.33–38. [Online]. Available at: http://www.ncbi.nlm.nih.gov/pmc/articles/PMC555082/pdf/emboj00254-0033.pdf.
Michel, F., Umesono, K. and Ozeki, H. (1989). Comparative and functional anatomy of group II catalytic introns - A review. Gene, 82 (1), p.5–30. [Online]. Available at: http://www.ncbi.nlm.nih.gov/pubmed/2684776 [Accessed: 2 August 2014].
Milet-Pinheiro, P. and Schlindwein, C. (2010). Mutual reproductive dependence of distylic Cordia leucocephala (Cordiaceae) and oligolectic Ceblurgus longipalpis (Halictidae, Rophitinae) in the Caatinga. Annals of Botany, 106 (1), p.17–27. [Online]. Available at: doi:10.1093/aob/mcq077.
Miller, G. L. and Lugo, A. E. (2009). Guide to the ecological systems of Puerto Rico. General Technical Report IITF-GTR-35, San Juan, Puerto Rico: USDA Forest Service, International Instite of Tropical Forestry.
Miller, J. S. (1985). Systematics of the genus Cordia (Boraginaceae) in Mexico and Central America. PhD Thesis. St Louis University, St Louis, MO, USA.
Miller, J. S. and Gottschling, M. (2007). Generic classification in the Cordiaceae (Boraginales): Resurrection of the genus Varronia P. Br. Taxon, 56 (1), p.163–169. [Online]. Available at: doi:10.2307/25065747.
Miller, J. S. and Nowicke, J. W. (1989). Sectional placement of some problematic Cordia species (Boraginaceae). Systematic Botany, 14 (3), p.271–280. [Online]. Available at: http://www.jstor.org/stable/2418917.
Miller, J. S. and Porter Morgan, H. A. (2011). Assessing the effectiveness of Madagascar’s changing protected areas system: a case study of threatened Boraginales. Oryx, 45 (02), p.201–209. [Online]. Available at: doi:10.1017/S0030605310000803.
Miller, J. S. and Wood, J. R. I. (2008). New Boraginaceae from tropical America 6: A new species of Varronia from Bolivia. Novon, 18 (1), p.86–89. [Online]. Available at: doi:10.3417/2006004.
Mohammed, N. Z., Ghazi, A. and Mustafa, H. E. (2013). Positional accuracy testing of Google Earth. International Journal of Multidisciplinary Sciences and Engineering, 4 (6), p.6–9. [Online]. Available at: http://www.ijmse.org/Volume4/Issue6/paper2.pdf.
Molina Colón, S. and Lugo, A. E. (2006). Recovery of a subtropical dry forest after abandonment of different land uses. Biotropica, 38 (3), p.354–364.
Moncada, M. and Herrera-Oliver, P. (1988). Palynology of the genus Cordia (Angiosperm, Boraginaceae) in Cuba. Acta Botánica Cubana, 58, p.1–10.

231
Monroe, W. H. (1976). The karstland forms of Puerto Rico. U.S. Geological Survey Professional Paper No. 899, Reston, VA, USA.
Monroe, W. H. (1980). Geology of the middle Tertiary formations of Puerto Rico. U.S. Geological Survey Professional Paper No. 953, Reston, VA, USA. [Online]. Available at: http://pubs.er.usgs.gov/publication/pp953.
Monsegur, O. (2009). Vascular flora of the Guánica dry forest, Puerto Rico. MSc Thesis. Univerity of Puerto Rico, Mayagüez Campus, Puerto Rico.
Moore, M. J. and Jansen, R. K. (2006). Molecular evidence for the age, origin, and evolutionary history of the American desert plant genus Tiquilia (Boraginaceae). Molecular Phylogenetics and Evolution, 39 (3), p.668–687. [Online]. Available at: doi:10.1016/j.ympev.2006.01.020.
Morales, A. L. and Martinez, J. G. (2013). Introduction of an experimental population of Varronia rupicola within the Cabo Rojo National Wildlife Refuge. Unpublished report submitted to U.S. Fish and Wildlife Service, Boquerón, Puerto Rico: U.S. Fish and Wildlife Service.
Morgulis, A., Coulouris, G., Raytselis, Y., Madden, T. L., Agarwala, R. and Schäffer, A. A. (2008). Database indexing for production MegaBLAST searches. Bioinformatics, 24 (16), p.1757–1764. [Online]. Available at: doi:10.1093/bioinformatics/btn322.
Moritz, C. (1994). Defining ‘Evolutionarily Significant Units’ for conservation. Trends in Ecology & Evolution, 9 (10), p.373–375. [Online]. Available at: doi:10.1016/0169-5347(94)90057-4.
Moritz, C. (1999). Conservation units and translocations: Strategies for conserving evolutionary processes. Hereditas, 130 (3), p.217–228. [Online]. Available at: doi:10.1111/j.1601-5223.1999.00217.x.
Murphy, P. G. and Lugo, A. E. (1986). Structure and biomass of a subtropical dry forest in Puerto Rico. Biotropica, 18 (2), p.89–96.
Murphy, P. G. and Lugo, A. E. (1990). Dry forests of the tropics and subtropics: Guánica Forest in context. Acta Científica, 4 (1-3), p.15–24.
Murphy, P. G., Lugo, A. E., Murphy, A. J. and Nepsteded, D. C. (1995). The dry forests of Puerto Rico’s south coast. In: Lugo, A. E. and Lowe, C. (eds.), Tropical Forests: Management and Ecology, New York, NY, USA: Springer-Verlag, p.178–209.
Myers, N., Mittermeier, R. A., Mittermeier, C. G., da Fonseca, G. A. B. and Kent, J. (2000). Biodiversity hotspots for conservation priorities. Nature, 403, p.853–858. [Online]. Available at: doi:10.1038/35002501.
Navascués, M. and Emerson, B. C. (2005). Chloroplast microsatellites: Measures of genetic diversity and the effect of homoplasy. 2005/04/09 ed. Molecular Ecology, 14 (5), p.1333–1341. [Online]. Available at: doi:10.1111/j.1365-294X.2005.02504.x.
Nei, M. (1973). Analysis of gene diversity in subdivided populations. Proceedings of the National Academy of Sciences of the United States of America, 70 (12), p.3321–3323. [Online]. Available at: http://www.ncbi.nlm.nih.gov/pubmed/4519626.
Nei, M. (1977). F-statistics and analysis of gene diversity in subdivided populations. Annals of Human Genetics, 41 (2), p.225–233. [Online]. Available at: http://www.ncbi.nlm.nih.gov/pubmed/596830.
Nei, M. (1978). Estimation of average heterozygosity and genetic distance from a small number of individuals. Genetics, 89 (3), p.583–590. [Online]. Available at: http://www.genetics.org/cgi/content/abstract/89/3/583.
Nei, M. (1986). Definition and estimation of fixation indices. Evolution, 40 (3), p.643–645.

232
Nei, M. and Chesser, R. K. (1983). Estimation of fixation indices and gene diversities. Annals of Human Genetics, 47 (3), p.253–259. [Online]. Available at: doi:10.1111/j.1469-1809.1983.tb00993.x.
Nicholls, R. J. and Cazenave, A. (2010). Sea-level rise and its impact on coastal zones. Science, 328 (5985), p.1517–1520. [Online]. Available at: doi:10.1126/science.1185782.
Nicholls, R. J., Marinova, N., Lowe, J. A., Brown, S., Vellinga, P., de Gusmão, D., Hinkel, J. and Tol, R. S. J. (2011). Sea-level rise and its possible impacts given a ‘beyond 4°C world’ in the twenty-first century. Philosophical Transactions of the Royal Society A, 369 (1934), p.161–181. [Online]. Available at: doi:10.1098/rsta.2010.0291.
Norusis, M. J. (2008). SPSS 16.0- Statistical procedures. 1st ed. Upper Saddle River, New Jersey, USA: Prentice Hall Inc.
Nowicke, J. W. and Miller, J. S. (1990). Pollen morphology of the Cordioideae (Boraginaceae): Auxemma, Cordia, and Patagonula. Plant systematics and evolution, (5), p.103–121. [Online]. Available at: doi:10.1007/978-3-7091-9079-1_9?null.
Nowicke, J. W. and Ridgway, J. E. (1973). Pollen studies in the genus Cordia (Boraginaceae). American Journal of Botany, 60 (6), p.584–591. [Online]. Available at: http://www.jstor.org/stable/2441383.
Olmstead, R. G., Michaels, H. J., Scott, K. M. and Palmer, J. D. (1992). Monophyly of the Asteridae and identification of their major lineages inferred from DNA sequences of rbcL. Annals of the Missouri Botanical Garden, 79 (2), p.249–265. [Online]. Available at: doi:10.2307/2399768 [Accessed: 15 August 2014].
Opler, P. A., Baker, H. G. and Frankie, G. W. (1975). Reproductive biology of some Costa Rican Cordia species (Boraginaceae). Biotropica, 7 (4), p.234–247. [Online]. Available at: http://www.jstor.org/stable/2989736.
Ouborg, N. J., Pertoldi, C., Loeschcke, V., Bijlsma, R. and Hedrick, P. W. (2010). Conservation genetics in transition to conservation genomics. Trends in Genetics, 26 (4), p.177–187. [Online]. Available at: doi:10.1016/j.tig.2010.01.001.
Overpeck, J. T., Otto-Bliesner, B. L., Miller, G. H., Muhs, D. R., Alley, R. B. and Kiehl, J. T. (2006). Paleoclimatic evidence for future ice-sheet instability and rapid sea-level rise. Science, 311 (5768), p.1747–1750. [Online]. Available at: doi:10.1126/science.1115159.
Paetkau, D., Calvert, W., Stirling, I. and Strobeck, C. (1995). Microsatellite analysis of population structure in Canadian polar bears. Molecular ecology, 4 (3), p.347–354. [Online]. Available at: doi:10.1111/j.1365-294X.1995.tb00227.x.
Paetkau, D., Slade, R., Burden, M. and Estoup, A. (2004). Genetic assignment methods for the direct, real-time estimation of migration rate: A simulation-based exploration of accuracy and power. Molecular Ecology, 13 (1), p.55–65. [Online]. Available at: doi:10.1046/j.1365-294X.2004.02008.x.
Paetkau, D. and Strobeck, C. (1995). Genetic studies of bears using microsatellite analysis. Ursus, 10, p.299–306.
Papadopulos, A. S. T., Kaye, M., Devaux, C., Hipperson, H., Lighten, J., Dunning, L. T., Hutton, I., Baker, W. J., Butlin, R. K. and Savolainen, V. (2014). Evaluation of genetic isolation within an island flora reveals unusually widespread local adaptation and supports sympatric speciation. Philosophical Transactions of the Royal Society B: Biological Sciences, 369 (1648), p.1–10. [Online]. Available at: doi:10.1098/rstb.2013.0342.
Paredes-Hernández, C. U., Salinas-Castillo, W. E., Guevara-Cortina, F. and Martínez-Becerra, X. (2013). Horizontal positional accuracy of Google Earth’s imagery over rural areas: A study case

233
in Tamaulipas, Mexico. Boletim de Ciências Geodésicas, 19 (4), p.588–601. [Online]. Available at: doi:10.1590/S1982-21702013000400005.
Parsons, T. and Geist, E. L. (2009). Tsunami Probability in the Caribbean Region. In: Cummins, P. R., Satake, K. and Kong, L. S. L. (eds.), Tsunami Science Four Years after the 2004 Indian Ocean Tsunami, Basel, Switzerland: Birkhäuser, p.2089–2116. [Online]. Available at: doi:10.1007/978-3-0346-0057-6_7.
Paxton, J. (1838). A practical treatise on the cultivation of the Dahlia. London, UK: W.S. Orr & Company. [Online]. Available at: https://books.google.co.uk/books?id=T31GAAAAYAAJ.
Peakall, R. O. D. and Smouse, P. E. (2006). GenAlEx 6: Genetic analysis in Excel. Population genetic software for teaching and research. Molecular Ecology Notes, 6 (1), p.288–295. [Online]. Available at: doi:10.1111/j.1471-8286.2005.01155.x [Accessed: 9 July 2014].
Peakall, R. and Smouse, P. E. (2012a). GenAlEx 6.5: Genetic analysis in Excel. Population genetic software for teaching and research - an update. Bioinformatics, 28 (19), p.2537–2539. [Online]. Available at: doi:10.1093/bioinformatics/bts460.
Peakall, R. and Smouse, P. E. (2012b). GenAlEx 6.5: Quick start guide. Canberra, Australia: The Australian National University.
Petrov, D. and Wendel, J. F. (2006). Evolution of eukaryotic genome structure. In: Fox, C. W. and Wolf, J. B. (eds.), Evolutionary genetics: Concepts and case studies, New York, NY, USA: Oxford University Press, p.144–1156. [Online]. Available at: http://www.uky.edu/~cfox/EvolutionaryGenetics/Index.htm.
Pfeffer, W. T., Harper, J. T. and O’Neel, S. (2008). Kinematic constraints on glacier contributions to 21st-Century sea-level rise. Science, 321 (5894), p.1340–1343. [Online]. Available at: doi:10.1126/science.1159099.
Pickering, K. D. (2015). The welfare of the environment is our mandate. Speeches and statements. [Online]. Available at: http://www.bvi.gov.vg/media-centre/welfare-environment-our-mandate [Accessed: 1 August 2015].
Pirie, M. D., Vargas, M. P. B., Botermans, M., Bakker, F. T. and Chatrou, L. W. (2007). Ancient paralogy in the cpDNA trnL-F region in Annonaceae: Implications for plant molecular systematics. American Journal of Botany, 94 (6), p.1003–1016. [Online]. Available at: doi:10.3732/ajb.94.6.1003.
Pollard, B. J. and Clubbe, C. P. (2003). Status report for the British Virgin Islands’ plant species Red List. Unpublished report submitted to National Parks Trust of the Virgin Islands, Richmond, Surrey, UK: Royal Botanic Gardens, Kew.
Posada, D. (2008). jModelTest: Phylogenetic model averaging. Molecular Biology and Evolution, 25 (7), p.1253–1256. [Online]. Available at: doi:10.1093/molbev/msn083.
Posada, D. (2009). Selecting models of evolution. In: Lemey, P., Salemi, M. and Vandamme, A.-M. (eds.), The phylogenetic handbook: A practical approach to phylogenetic analysis and hypothesis testing, 2nd ed, Cambridge, England: Cambridge University Press, p.345–354.
Posada, D. and Buckley, T. R. (2004). Model selection and model averaging in phylogenetics: Advantages of Akaike information criterion and Bayesian approaches over likelihood ratio tests. Systematic Biology, 53 (5), p.793–808. [Online]. Available at: doi:10.1080/10635150490522304.
Potere, D. (2008). Horizontal positional accuracy of Google Earth’s high-resolution imagery archive. Sensors, 8 (12), p.7973–7981. [Online]. Available at: doi:10.3390/s8127973.
Powell, W., Machray, G. C. and Provan, J. (1996). Polymorphism revealed by simple sequence repeats. Trends in Plant Science, 1 (7), p.215–222. [Online]. Available at: doi:10.1016/1360-

234
1385(96)86898-1.
Pritchard, J. K., Stephens, M. and Donnelly, P. (2000). Inference of population structure using multilocus genotype data. Genetics, 155, p.945–959.
Proctor, G. R. (1991). Plantas de Puerto Rico de interés especial: estado y recomendaciones. Publicación Cientıífica Miscelánea No. 2, San Juan, PR: Departamento de Recursos Naturales de Puerto Rico.
Quandt, D. and Stech, M. (2004). Molecular evolution of the trnTUGU-trnFGAA region in Bryophytes. Plant Biology, 6 (5), p.545–554. [Online]. Available at: doi:10.1055/s-2004-821144 [Accessed: 2 August 2014].
Rahmstorf, S. (2007). A semi-empirical approach to projecting future sea-level rise. Science, 315 (5810), p.368–370. [Online]. Available at: doi:10.1126/science.1135456.
Ramjohn, I. A., Murphy, P. G., Burton, T. M. and Lugo, A. E. (2012). Survival and rebound of Antillean dry forests: Role of forest fragments. Forest Ecology and Management, 284, p.124–132. [Online]. Available at: doi:10.1016/j.foreco.2012.08.001.
Renken, R. R., Ward, W. C., Gill, I. P., Gómez-Gómez, F. and Rodríguez-Martínez, J. (2002). Geology and hydrogeology of the Caribbean islands aquifer system of the Commonwealth of Puerto Rico and the U.S. Virgin Islands. U.S. Geological Survey Professional Paper, Reston, VA, USA: US Geological Survey. [Online]. Available at: http://pubs.usgs.gov/pp/pp1419/pdf/BOOK.PDF.
Rhein, M., Rintoul, S. R., Aoki, S., Campos, E., Chambers, D., Feely, R. A., Gulev, S., Johnson, G. C., Josey, S. A., Kostianoy, A., Mauritzen, C., Roemmich, D., Talley, L. D. and Wang, F. (2013). Observations: Ocean. In: Stocker, T. F., Qin, D., Plattner, G.-K., Tignor, M., Allen, S. K., Boschung, J., Nauels, A., Xia, Y., Bex, V. and Midgley, P. M. (eds.), Climate change 2013: The physical science basis. Contribution of Working Group I to the Fifth Assessment Report of the Intergovernmental Panel on Climate Change, Cambridge, UK and New York, NY, USA: Cambridge University Press, p.255–315. [Online]. Available at: http://www.ipcc.ch/report/ar5/wg1/.
Robbins, A. M. J. (2006). Report on fires in the Caribbean and Mesoamerican regions. Fire management working paper No. FFM/12, Rome, Italy: Food and agriculture organization of the United Nations. [Online]. Available at: http://www.fao.org/docrep/009/j7568e/j7568e00.htm.
Robbins, A. M. J., Eckelmann, C.-M. and Quiñones, M. (2010). Forest fires in the Insular Caribbean. Ambio, 37 (7), p.528–534. [Online]. Available at: http://dx.doi.org/10.1579/0044-7447-37.7.528.
Rodríguez, F., Oliver, J. L., Marín, A. and Medina, J. R. (1990). The general stochastic model of nucleotide substitution. Journal of Theoretical Biology, 142 (4), p.485–501. [Online]. Available at: doi:10.1016/S0022-5193(05)80104-3.
Rodríguez–Trelles, F., Tarrío, R. and Ayala, F. J. (2006). Rates of molecular change. In: Fox, C. W. and Wolf, J. B. (eds.), Evolutionary genetics: Concepts and case studies, New York, NY, USA: Oxford University Press, p.119–132. [Online]. Available at: http://www.uky.edu/~cfox/EvolutionaryGenetics/Index.htm.
Ronquist, F. and Huelsenbeck, J. P. (2003). MrBayes 3: Bayesian phylogenetic inference under mixed models. Bioinformatics, 19 (12), p.1572–1574. [Online]. Available at: doi:10.1093/bioinformatics/btg180.
Rothberg, J. M. and Leamon, J. H. (2008). The development and impact of 454 sequencing. Nat Biotech, 26 (10), p.1117–1124. [Online]. Available at: doi:10.1038/nbt1485.
Rozen, S. and Skaletsky, H. (2000). Primer3 on the WWW for general users and for biologist

235
programmers. Methods in Molecular Biology, 132, p.365–386. [Online]. Available at: http://steverozen.net/papers/rozen-and-skaletsky-2000-primer3.pdf.
Saghai-Maroof, M. A., Soliman, K. M., Jorgensen, R. A. and Allard, R. W. (1984). Ribosomal DNA spacer-length polymorphisms in Barley: Mendelian inheritance, chromosomal location, and population dynamics. Proceedings of the National Academy of Sciences of the United States of America, 81 (24), p.8014–8018. [Online]. Available at: http://www.jstor.org/stable/24472.
Sah, J. P., Ross, M. S., Snyder, J. R. and Ogurcak, D. E. (2010). Tree mortality following prescribed fire and a storm surge event in slash pine (Pinus elliottii var. densa ) forests in the Florida Keys, USA. International Journal of Forestry Research, p.1–13. [Online]. Available at: doi:10.1155/2010/204795.
Sahay, S. K. (1979). On the pollen morphology of Ehretiaceae with reference to taxonomy. In: IV Int. Palynol. Conf., 1979, Lucknow (1976-77), p.471–479.
Samarakoon, T., Wang, S. Y. and Alford, M. H. (2013). Enhancing PCR amplification of DNA from recalcitrant plant specimens using a trehalose-based additive. Applications in Plant Sciences, 1 (1), p.1–3. [Online]. Available at: doi:10.3732/apps.1200236.
Sanchez, M. D., Ingrouille, M. J., Cowan, R. S., Hamilton, M. A. and Fay, M. F. (2014). Spatial structure and genetic diversity of natural populations of the Caribbean pine, Pinus caribaea var. bahamensis (Pinaceae), in the Bahaman archipelago. Botanical Journal of the Linnean Society, 174 (3), p.359–383. [Online]. Available at: doi:10.1111/boj.12146.
Sanderson, M. J. and Shaffer, H. B. (2002). Troubleshooting molecular phylogenetic analyses. Annual Review of Ecology and Systematics, 33, p.49–72. [Online]. Available at: doi:10.2307/3069256.
Sang, T., Crawford, D. and Stuessy, T. (1997). Chloroplast DNA phylogeny, reticulate evolution, and biogeography of Paeonia (Paeoniaceae). American Journal of Botany, 84 (8), p.1120–1136. [Online]. Available at: http://www.amjbot.org/content/84/8/1120.abstract.
Santiago-Valentín, E., Olmstead, R. G., Santiago-Valentin, E. and Olmstead, R. G. (2004). Historical biogeography of Caribbean plants: Introduction to current knowledge and possibilities from a phylogenetic perspective. Taxon, 53 (2), p.299–319. [Online]. Available at: doi:10.2307/4135610.
Särkinen, T., Staats, M., Richardson, J. E., Cowan, R. S. and Bakker, F. T. (2012). How to open the treasure chest? Optimising DNA extraction from herbarium specimens. PLoS ONE, 7 (8), p.e43808. [Online]. Available at: doi:10.1371/journal.pone.0043808.
Schlötterer, C. (2000). Evolutionary dynamics of microsatellite DNA. Chromosoma, 109 (6), p.365–371. [Online]. Available at: doi:10.1007/s004120000089.
Schomburgk, R. H. (1832). Remarks on Anegada. Journal of the Royal Geographical Society, 2, p.152–170. [Online]. Available at: http://www.seaturtle.org/PDF/Schomburgk_unkn_JRoyalGeogSocLond.pdf.
Schulenburg, J. H. G. V, Englisch, U. and Wagele, J. W. (1999). Evolution of ITS1 rDNA in the Digenea (Platyhelminthes: Trematoda): 3` end sequence conservation and its phylogenetic utility. Journal of Molecular Evolution, 48 (1), p.2–12. [Online]. Available at: doi:10.1007/PL00006441.
Segarra Carmona, A. E. and Ramírez-Lluch, A. (2007). Hypogeococcus pungens (Hemiptera: Pseucococcidae): A new threat to biodiversity in fragile dry subtropical forests. In: Reunión Anual de la Sociedad Puertorriqueña de Ciencias Agrícolas, 2007, p.1–23.
Segarra-Carmona, A. E., Ramírez-Lluch, A., Cabrera-Asencio, I. and Jiménez-López, A. N. (2010). First report of a new invasive mealybug, the Harrisia cactus mealy bug Hypogeococcus

236
pungens (Hemitera: Pseudococcidae). Journal of Agriculture of the University of Puerto Rico, 94 (1-2), p.183–187.
Selkoe, K. A. and Toonen, R. J. (2006). Microsatellites for ecologists: A practical guide to using and evaluating microsatellite markers. 2006/04/29 ed. Ecology Letters, 9 (5), p.615–629. [Online]. Available at: doi:10.1111/j.1461-0248.2006.00889.x.
Serra, C. A., Jorge, P. E., Abud-Antún, A. J., Alvarez, P. and Peguero, B. (2003). Invasive alien species in the Dominican Republic: Their impact and strategies to manage introduced pests. In: Proceedings of the Caribbean Food Crops Society, 39 (1), 2003, p.102–118.
Shaw, J., Lickey, E. B., Beck, J. T., Farmer, S. B., Liu, W., Miller, J., Siripun, K. C., Winder, C. T., Schilling, E. E. and Small, R. L. (2005). The tortoise and the hare II: Relative utility of 21 noncoding chloroplast DNA sequences for phylogenetic analysis. American Journal of Botany, 92 (1), p.142–166. [Online]. Available at: doi:10.3732/ajb.92.1.142.
Shaw, J., Lickey, E. B., Schilling, E. E. and Small, R. L. (2007). Comparison of whole chloroplast genome sequences to choose noncoding regions for phylogenetic studies in angiosperms: the tortoise and the hare III. American Journal of Botany, 94 (3), p.275–288. [Online]. Available at: doi:10.3732/ajb.94.3.275.
Siddall, M., Rohling, E. J., Almogi-Labin, A., Hemleben, C., Meischner, D., Schmelzer, I. and Smeed, D. A. (2003). Sea-level fluctuations during the last glacial cycle. Nature, 423 (6942), p.853–858. [Online]. Available at: doi:10.1038/nature01690.
Silvertown, J. and Charlesworth, D. (2001). Introduction to plant population biology. 4th ed. London, UK: Blackwell Science.
Sisson, S. A. (2005). Transdimensional Markov chains: A decade of progress and future perspectives. Journal of the American Statistical Association, 100 (471), p.1077–1089. [Online]. Available at: doi:10.1198/016214505000000664.
Slatkin, M. (1993). Isolation by distance in equilibrium and non-equilibrium populations. Evolution, 47 (1), p.264–279. [Online]. Available at: doi:10.2307/2410134.
Slatkin, M. (1994). Linkage disequilibrium in growing and stable populations. Genetics, 137 (1), p.331–336. [Online]. Available at: http://www.genetics.org/content/137/1/331.abstract.
Slatkin, M. (1995). A measure of population subdivision based on microsatellite allele frequencies. Genetics, 139 (1), p.457–462. [Online]. Available at: http://www.ncbi.nlm.nih.gov/pubmed/7705646.
Small, R. L., Ryburn, J. A., Cronn, R. C., Seelanan, T. and Wendel, J. F. (1998). The tortoise and the hare: Choosing between noncoding plastome and nuclear Adh sequences for phylogeny reconstruction in a recently diverged plant group. American Journal of Botany, 85 (9), p.1301–1315. [Online]. Available at: http://www.amjbot.org/content/85/9/1301.abstract.
Soltis, D. E., Gitzendanner, M. A., Stull, G., Chester, M., Chanderbali, A., Chamala, S., Jordon-thaden, I., Soltis, P. S., Schnable, P. S. and Barbazuk, W. B. (2013). The potential of genomics in plant systematics. Taxon, 62 (5), p.886–898. [Online]. Available at: doi:10.12705/625.13.
Soltis, D. E. and Soltis, P. S. (1999). Polyploidy: Recurrent formation and genome evolution. Trends in Ecology & Evolution, 14 (9), p.348–352. [Online]. Available at: doi:10.1016/S0169-5347(99)01638-9.
Soltis, D. E., Visger, C. J. and Soltis, P. S. (2014). The polyploidy revolution then...and now: Stebbins revisited. American Journal of Botany, 101 (7), p.1057–1078. [Online]. Available at: doi:10.3732/ajb.1400178.
Song, S., Dey, D. K. and Holsinger, K. E. (2006). Differentiation among populations with migration, mutation, and drift: Implications for genetic inference. Evolution, 60 (1), p.1–12.

237
[Online]. Available at: doi:10.1554/05-315.1.
Soulé, M. E. (1985). What is conservation biology? BioScience, 35 (11), p.734–737. [Online]. Available at: http://planet.botany.uwc.ac.za/nisl/Conservation Biology/Attachments/Soule1985.pdf.
Spiske, M. and Halley, R. B. (2014). A coral-rubble ridge as evidence for hurricane overwash, Anegada (British Virgin Islands). Advances in Geosciences, 38, p.9–20. [Online]. Available at: doi:10.5194/adgeo-38-9-2014.
Spoon, T. R. and Kesseli, R. V. (2008). Development of microsatellite markers in Cordia bifurcata (Boraginaceae) and cross-species amplification in Cordia inermis and Cordia pringlei. Molecular Ecology Resources, 8 (5), p.989–992. [Online]. Available at: doi:10.1111/j.1755-0998.2008.02131.x.
Stanek, K. P., Maresch, W. V and Pindell, J. L. (2009). The geotectonic story of the northwestern branch of the Caribbean Arc: Implications from structural and geochronological data of Cuba. Geological Society, London, Special Publications, 328 (1), p.361–398. [Online]. Available at: doi:10.1144/sp328.15.
de Stapf, M. N. S. (2010). Nomenclatural notes on Varronia (Boraginaceae s.l.) in Brazil. Rodriguésia, 61 (1), p.133–135.
Stevens, P. F. (2012). Boraginales. Angiosperm phylogeny website. Version 12, July 2012. [Online]. Available at: http://www.mobot.org/MOBOT/research/APweb/ [Accessed: 30 August 2015].
Stutzman, J. K., Lickey, E. B., Weeks, A. and McMullen, C. K. (2012). A taxonomic study of the Galápagos endemic Varronia (Cordiaceae) species with nomenclatural notes. Journal of the Botanical Research Institute of Texas, 6 (1), p.75–99.
Sullivan, J. and Joyce, P. (2005). Model selection in phylogenetics. Annual Review of Ecology, Evolution, and Systematics, 36, p.445–466. [Online]. Available at: doi:10.2307/30033812.
Syring, J., Willyard, A., Cronn, R. and Liston, A. (2005). Evolutionary relationships among Pinus (Pinaceae) subsections inferred from multiple low-copy nuclear loci. American Journal of Botany, 92 (12), p.2086–2100. [Online]. Available at: doi:10.3732/ajb.92.12.2086.
Taberlet, P., Gielly, L., Pautou, G. and Bouvet, J. (1991). Universal primers for amplification of three non-coding regions of chloroplast DNA. Plant Molecular Biology, 17 (5), p.1105–1109. [Online]. Available at: doi:10.1007/BF00037152.
Tamura, K. (1992). Estimation of the number of nucleotide substitutions when there are strong transition-transversion and G+C-content biases. Molecular Biology and Evolution, 9 (4), p.678–687. [Online]. Available at: http://mbe.oxfordjournals.org/content/9/4/678.abstract.
Tamura, K., Stecher, G., Peterson, D., Filipski, A. and Kumar, S. (2013). MEGA6: Molecular Evolutionary Genetics Analysis version 6.0. Molecular Biology and Evolution, 30 (12), p.2725–2729. [Online]. Available at: doi:10.1093/molbev/mst197.
Taroda, N. and Gibbs, P. (1986). Studies on the genus Cordia L. (Boraginaceae) in Brazil. 1. A new infrageneric classification and conspectus. Rev. Bras. Bot., 9, p.31–42.
Tateno, Y., Takezaki, N. and Nei, M. (1994). Relative efficiencies of the maximum-likelihood, neighbor-joining, and maximum-parsimony methods when substitution rate varies with site. Molecular Biology and Evolution, 11 (2), p.261–277. [Online]. Available at: http://mbe.oxfordjournals.org/content/11/2/261.abstract.
Tavare, S. (1986). Some probabilistic and statistical problems in the analysis of DNA sequences. Lectures on Mathematics in the Life Sciences, 17, p.57–86. [Online]. Available at: citeulike-article-id:4801403.

238
Taylor, L. A., Eakins, B. W., Carignan, K. S., Warnken, R. R., Sazonova, T. and Schoolcraft, D. C. (2008). Digital elevation models of Puerto Rico: Procedures, data sources and analysis. NOAA Technical Memorandum No. NESDIS NGDC- 13, Boulder, CO. [Online]. Available at: http://www.ngdc.noaa.gov/dem/squareCellGrid/download/1561.
The Ramsar Convention On Wetlands. (2013). United Kingdom RAMSAR sites. The Ramsar Sites Information Service (RSIS). [Online]. Available at: http://ramsar.wetlands.org/ [Accessed: 11 June 2013].
Thornton, J. (2006). New genes, new functions: Gene family evolution and phylogenetics. In: Fox, C. W. and Wolf, J. B. (eds.), Evolutionary genetics: Concepts and case studies, New York, NY, USA: Oxford University Press, p.157–172. [Online]. Available at: http://www.uky.edu/~cfox/EvolutionaryGenetics/Index.htm.
Traill, L. W., Perhans, K., Lovelock, C. E., Prohaska, A., McFallan, S., Rhodes, J. R. and Wilson, K. A. (2011). Managing for change: Wetland transitions under sea-level rise and outcomes for threatened species. Diversity and Distributions, 17 (6), p.1225–1233. [Online]. Available at: doi:10.1111/j.1472-4642.2011.00807.x.
U.S. Congress. (1973). Endangered Species Act of 1973. An act to provide for the conservation of endangered and threatened species of fish, wildlife, and plants, and for other purposes, USA, p.1–47. [Online]. Available at: http://www.epw.senate.gov/esa73.pdf.
U.S. Fish and Wildlife Service. (2007). Final comprehensive conservation plan/environmental impact statement for Vieques National Wildlife Refuge, Puerto Rico. Atlanta, GA, USA. [Online]. Available at: http://www.fws.gov/southeast/planning/PDFdocuments/ViequesFinalEng/Final CCP Vieques Sig Overs.pdf.
U.S. Fish and Wildlife Service. (2010). Cordia rupicola - 2010 candidate notice of review. Rivera, M. (ed.). Federal Register, Boquerón, PR, p.1–13. [Online]. Available at: http://www.fws.gov/ecos/ajax/docs/candforms_pdf/r4/Q0GP_P01.pdf.
U.S. Fish and Wildlife Service. (2013a). Cabo Rojo National Wildlife Refuge. Boquerón, Puerto Rico. [Online]. Available at: www.fws.gov/caribbean/refuges.
U.S. Fish and Wildlife Service. (2013b). ESA basics: 40 Years of conserving endangered species. Arlington, VA, USA.
U.S. Fish and Wildlife Service. (2014a). Endangered and threatened wildlife and plants; Designation of critical habitat for Agave eggersiana, Gonocalyx concolor, and Varronia rupicola; Final rule. Rivera, M. (ed.). Federal Register, 79 (174), p.53315–53344. [Online]. Available at: http://www.fws.gov/caribbean/es.
U.S. Fish and Wildlife Service. (2014b). Endangered and threatened wildlife and plants; Endangered species status for Agave eggersiana and Gonocalyx concolor, and threatened species status for Varronia rupicola; Final rule. Rivera, M. (ed.). Federal Register, 79 (174), p.53303–53315. [Online]. Available at: http://www.fws.gov/caribbean/es.
Udvardy, M. D. F. (1975). A classification of the biogeographical provinces of the World. IUCN Occassional Paper No. 18, Morges, Switzerland: International Union for Conservation of Nature.
Uhlarz, H. and Weberling, F. (1977). Ontogenetische untersuchungen an Cordia verbenaceae DC. (Boraginaceae), ein beitrag zur kenntnis der syndesmien. Ber Deutsch Bot Ges, 90, p.127–134.
UNESCO. (1989). Appendix III. British Virgin Islands Beach Data. Hurricane impact on beaches in the Eastern Caribbean Islands 1989-1995. [Online]. Available at: http://www.unesco.org/csi/act/cosalc/hur16.htm [Accessed: 11 June 2013].

239
Untergasser, A., Cutcutache, I., Koressaar, T., Ye, J., Faircloth, B. C., Remm, M. and Rozen, S. G. (2012). Primer3 - New capabilities and interfaces. Nucleic Acids Research, 40 (15), p.e115. [Online]. Available at: doi:10.1093/nar/gks596.
Urban, I. (1899). Symbolae Antillanae. London, UK: Berolini. [Online]. Available at: http://www.biodiversitylibrary.org/item/3751 [Accessed: 11 June 2013].
USDA ARS National Genetic Resources Program. (2015). Family: Boraginaceae Juss., nom. cons. Germplasm Resources Information Network - (GRIN) [Online Database], Beltsville, MD, USA: National Germplasm Resources Laboratory. [Online]. Available at: http://www.ars-grin.gov.4/cgi-bin/npgs/html/family.pl?160 [Accessed: 30 July 2015].
Vandamme, A.-M. (2009). Basic concepts of molecular evolution. In: Lemey, P., Salemi, M. and Vandamme, A.-M. (eds.), The phylogenetic handbook: A practical approach to phylogenetic analysis and hypothesis testing, 2nd ed, Cambridge, England: Cambridge University Press, p.1–30.
Veness, C. (2010). Calculate distance, bearing and more between latitude/longitude points. Movable Type Scripts. [Online]. Available at: http://www.movable-type.co.uk/scripts/latlong.html [Accessed: 30 August 2015].
Ventosa-Febles, E. A., Rodríguez, M. C., Llompart, J. L. C., Sustache, J. S. and Casanova, D. D. (2005). Puerto Rico Critical Wildlife Areas. San Juan, Puerto Rico: Departamento de Recursos Naturales de Puerto Rico.
Volckmann, R. P. (1984a). Geologic map of the Cabo Rojo and Parguera quadrangles, southwest Puerto Rico. U.S. Geological Survey Numbered Series No. 1557, Reston, VA, USA. [Online]. Available at: http://pubs.er.usgs.gov/publication/i1557.
Volckmann, R. P. (1984b). Geologic map of the Puerto Real Quadrangle, southwest Puerto Rico. U.S. Geological Survey Numbered Series No. 1559, Reston, VA, USA. [Online]. Available at: http://pubs.er.usgs.gov/publication/i1559.
Volckmann, R. P. (1984c). Geologic map of the San German Quadrangle, southwest Puerto Rico. U.S. Geological Survey Numbered Series No. 1558, Reston, VA, USA. [Online]. Available at: http://pubs.er.usgs.gov/publication/i1558.
van Vuuren, D. P., Edmonds, J., Kainuma, M., Riahi, K., Thomson, A., Hibbard, K., Hurtt, G. C., Kram, T., Krey, V., Lamarque, J.-F., Masui, T., Meinshausen, M., Nakicenovic, N., Smith, S. J. and Rose, S. K. (2011). The representative concentration pathways: An overview. Climatic Change, 109 (1-2), p.5–31. [Online]. Available at: doi:10.1007/s10584-011-0148-z.
Wang, C., Schroeder, K. B. and Rosenberg, N. a. (2012). A maximum-likelihood method to correct for allelic dropout in microsatellite data with no replicate genotypes. Genetics, 192 (October), p.651–669. [Online]. Available at: doi:10.1534/genetics.112.139519.
Wang, Y., Xiao, X., Zhang, J., Choudhury, R., Robertson, A., Li, K., Ma, M., Burge, C. B. and Wang, Z. (2013). A complex network of factors with overlapping affinities represses splicing through intronic elements. Nat Struct Mol Biol, 20 (1), p.36–45. [Online]. Available at: doi:10.1038/nsmb.2459.
Waples, R. S. and Gaggiotti, O. (2006). What is a population? An empirical evaluation of some genetic methods for identifying the number of gene pools and their degree of connectivity. Molecular Ecology, 15 (6), p.1419–1439. [Online]. Available at: doi:10.1111/j.1365-294X.2006.02890.x.
Wayne, M. L. and Miyamoto, M. M. (2006). Genetic variation. In: Fox, C. and Wolf, J. (eds.), Evolutionary genetics: Concepts and case studies, New York, NY, USA: Oxford University Press, p.14–31. [Online]. Available at: http://www.uky.edu/~cfox/EvolutionaryGenetics/Index.htm.

240
Weaver, P. L. and Schwagerl, J. J. (2009). U.S. Fish and Wildlife Service Refuges and other nearby reserves in southwestern Puerto Rico. General Technical Report IITF-40, San Juan, PR: International Institute of Tropical Forestry.
Weeks, A., Baird, K. E. and McMullen, C. K. (2010). Origin and evolution of endemic Galápagos Varronia species (Cordiaceae). Molecular Phylogenetics and Evolution, 57 (2), p.948–954. [Online]. Available at: doi:10.1016/j.ympev.2010.08.014.
Weir, B. S. (1996). Genetic data analysis II: Methods for discrete population genetic data. Sunderland, MA, USA: Sinauer Assoc., Inc.
Weir, B. S. and Cockerham, C. C. (1984). Estimating F-statistics for the analysis of population structure. Evolution, 38 (6), p.1358–1370. [Online]. Available at: http://www.jstor.org/stable/2408641.
Wenger, L., Corcoran, M. R., Hamilton, M. A. and Clubbe, C. P. (2010). Report on the status of Cordia rupicola Urban - Including a germination and cultivation protocol. Kew UKOTs Programme Horticultural Protocol No. 3, Richmond, Surrey, UK: UK Overseas Territories Programme, Royal Botanic Gardens. [Online]. Available at: http://www.kew.org/ucm/groups/public/documents/document/kppcont_047342.pdf.
Wetzel, F. T., Kissling, W. D., Beissmann, H. and Penn, D. J. (2012). Future climate change driven sea-level rise: Secondary consequences from human displacement for island biodiversity. Global Change Biology, 18 (9), p.2707–2719. [Online]. Available at: doi:10.1111/j.1365-2486.2012.02736.x.
Wheeler, D. A., Srinivasan, M., Egholm, M., Shen, Y., Chen, L., McGuire, A., He, W., Chen, Y.-J., Makhijani, V., Roth, G. T., Gomes, X., Tartaro, K., Niazi, F., Turcotte, C. L., Irzyk, G. P., Lupski, J. R., Chinault, C., Song, X., Liu, Y., Yuan, Y., Nazareth, L., Qin, X., Muzny, D. M., Margulies, M., Weinstock, G. M., Gibbs, R. A. and Rothberg, J. M. (2008). The complete genome of an individual by massively parallel DNA sequencing. Nature, 452 (7189), p.872–876. [Online]. Available at: doi:10.1038/nature06884.
White, T. J., Bruns, T., Lee, S. and Taylor, J. (1990). Amplification and direct sequencing of fungal ribosomal RNA genes for phylogenetics. In: Innis, M. A., Gelfand, D. H., Sninsky, J. . and White, T. J. (eds.), PCR Protocols: a Guide to Methods and Applications, New York, USA, p.315–322. [Online]. Available at: http://nature.berkeley.edu/brunslab/papers/white1990.pdf.
Whitlock, M. C. and McCauley, D. E. (1999). Indirect measures of gene flow and migration: FST not equal to 1/(4Nm + 1). Heredity, 82 (2), p.117–125. [Online]. Available at: doi:10.1038/sj.hdy.6884960.
Wikström, N., Kenrick, P. and Chase, M. (1999). Epiphytism and terrestrialization in tropical Huperzia (Lycopodiaceae). Plant Systematics and Evolution, 218 (3-4), p.221–243. [Online]. Available at: doi:10.1007/BF01089229.
Williams, S. J. (2013). Sea-level rise implications for coastal regions. Journal of Coastal Research, 63, p.184–196. [Online]. Available at: doi:10.2112/SI63-015.1.
Willingham, A. T. and Gingeras, T. R. (2006). TUF love for ‘junk’ DNA. Cell, 125 (7), p.1215–1220. [Online]. Available at: doi:10.1016/j.cell.2006.06.009.
Wolfe, B. (2009). Post-fire regeneration in subtropical dry forest of Puerto Rico. MSc Thesis. University of Puerto Rico, Mayagüez Campus, Puerto Rico.
Woodbury, R. O., Raffaele, H., Fram, M., Ríos, C., Liegel, L., Cumpiano, W., Sierra, A., Marrero, J. and Whelan, J. (1975). Rare and endangered plants in Puerto Rico - A committee report. Unpublished report submitted to the Government of Puerto Rico, Washington, D.C. and San Juan, Puerto Rico: U.S. Dept. of Agriculture, Soil Conservation Service and Dept. of Natural Resources of the Commonwealth of Puerto Rico. [Online]. Available at:

241
http://czic.csc.noaa.gov/czic/QK86.P9_W66_1975/4914.pdf.
Wright, S. (1943). Isolation by distance. Genetics, 28 (2), p.114–138. [Online]. Available at: http://www.ncbi.nlm.nih.gov/pmc/articles/PMC1209196/.
Wright, S. (1965). The interpretation of population structure by F-statistics with special regards to systems of mating. Evolution, 19, p.395–420.
Yackulic, C. B., Fagan, M., Jain, M., Jina, A., Lim, Y., Marlier, M., Muscarella, R., Adame, P., DeFries, R. and Uriarte, M. (2011). Biophysical and socioeconomic factors associated with forest transitions at multiple spatial and temporal scales. Ecology and Society, 16 (3), p.1–22. [Online]. Available at: doi:10.5751/ES-04275-160315.
Zhang, D.-X. and Hewitt, G. M. (2003). Nuclear DNA analyses in genetic studies of populations: Practice, problems and prospects. Molecular Ecology, 12 (3), p.563–584. [Online]. Available at: doi:10.1046/j.1365-294X.2003.01773.x.

242
Appendix 1: Varronia rupicola records The table below provides a complete list of Varronia rupicola records by year, location and type. Note that only
dated, georeferenced observations are listed; therefore, many literature references are excluded.
Year Collected Island Wild vouchers Cultivated vouchers Observations 1886 Puerto Rico 2 0 0 1902 Puerto Rico 1 0 0 1913 Anegada 1 0 0 1913 Puerto Rico 1 0 0 1915 Puerto Rico 1 0 0 1918 Anegada 1 0 0 1943 Puerto Rico 1 0 0 1959 Puerto Rico 1 0 0 1964 Puerto Rico 1 0 0 1970 Anegada 2 0 0 1971 Anegada 1 0 0 1972 Puerto Rico 1 0 0 1978 Vieques 1 0 0 1987 Anegada 1 0 0 1990 Anegada 1 0 0 1992 Anegada 1 0 0 1992 Puerto Rico 1 0 0 1993 Puerto Rico 2 0 0 1994 Puerto Rico 1 0 0 1995 Puerto Rico 2 0 0 1996 Puerto Rico 1 0 0 1999 Puerto Rico 1 0 0 2000 Anegada 2 0 0 2002 Anegada 1 0 0 2003 Anegada 1 0 0 2004 Anegada 1 0 174 2004 Puerto Rico 1 0 0 2005 Anegada 0 0 45 2005 Vieques 4 0 0 2005 Puerto Rico 2 0 0 2006 Puerto Rico 1 0 0 2008 Fairchild, USA 0 1 0 2010 Kew, UK 0 1 0 2011 Anegada 0 0 3 2011 Puerto Rico 0 0 1 2012 Kew, UK 0 58 0 2012 Puerto Rico 13 0 3 2012 Vieques 6 0 0 2012 Anegada 2 0 8 2013 Kew, UK 0 29 0 2013 Tortola, BVI 0 17 0 2013 Fairchild, USA 0 19 0 2013 Puerto Rico 97 55 43 2013 Vieques 0 0 6 2013 Anegada 148 0 327 2014 Puerto Rico 18 0 1 2014 Anegada 0 0 55 2015 Puerto Rico 0 0 4 2015 Anegada 3 0 114
Total 326 180 784

243
Voucher specimens4,5
Puerto Rico and Vieques
Vouchers from wild plants
Acevedo-Rodriguez, P. 7684, 12/10/1995, Guánica, Guánica Forest Reserve, (MAPR
[MAPR26677!], NY, UPRRP [031039!], US [US520897]).
Acevedo-Rodriguez, P. 7756, 16/01/1996, Ponce, Canas, Off Rd. 2 behind the Holiday Inn
Hotel, (NY [NY00842563!], UPRRP [031046!], US [US590489]).
Acevedo-Rodriguez, P. 10803, 29/01/1999, Guánica, Guánica Forest Reserve, along main road
to ranger station, (UPRRP [36630!], US [US614075]).
Ackerman, J.D. 3827, 10/09/2005, Vieques, Puerto Ferro, (UPR, UPRRP [044069!]).
Axelrod, F. 7060, 06/10/1993, Ponce Bo Canas, North off Rt 2 just before prison, (UPRRP
[026524!], MO [MO-878731]).
Axelrod, F. 13094, 22/07/2005, Vieques, US National Wildlife Refuge, along road to lighthouse
peninsula (Punta Coneja), 100 m before lighthouse, (UPRRP [UPRRP11321!]).
Breckon, G.J. 4507, 20/12/1994, El Peñon, E of Peñon de Ponce, (JBSD, MAPR [MAPR26676!],
NY, US).
Breckon, G.J. 7276, 23/06/2005, Vieques, US National Wildlife Refuge, East tract, Lighthouse
Peninsula; along Lighthouse Road, c. 100m north of old lighthouse, (MAPR [MAPR26675!],
UPRRP [41562]).
Breckon, G.J. 7516, 21/07/2005, Vieques, US National Wildlife Refuge, East tract, Lighthouse
Peninsula; along Lighthouse Road, ca. 100m north of old lighthouse, (MAPR [MAPR26674!]).
Cedeno, J.A. & Aponte, I.J. 368, 08/01/1995, El Peñon, Peñuelas, Bo. Encarnación, (MO [MO-
2256605!], SJ [SJ00251!]).
Gregory, L.E. 658, 12/02/1943, Guánica, (UPR [32944]).
Hamilton, M.A. 905, 18/07/2012, Bosque Estatal de Guánica, Guánica eastern tract, (K
[K000679885!]).
4 Voucher list compiled from an exhaustive search of literature and major herbaria of Europe and North America. Many of these specimens have not been listed in the literature previously. 5 An “!” immediately after a herbarium code/barcode/accession number (e.g. K! or K [K000679885!]), indicates that the specimen, physical or digital copy, has been seen by the author.

244
Hamilton, M.A. 945, 03/05/2013, Bosque Estatal de Guánica, Guánica eastern tract, (K
[K000679893!]).
Hamilton, M.A. 1044, 08/05/2013, Yauco, Barina, Catala Farm (K [K000679891!], MAPR!,
UPRRP!).
Hamilton, M.A. 1046, 08/05/2013, Yauco, Barina, Catala Farm (K [K000679892!]).
Heller, A.A. 6245 09/12/1902, Limestone hills along coast three miles west of Ponce, (NY
[NY00952750!], US [US971030]).
Kraus, F. s.n. 09/08/1992, Peñuelas, Ba. Encarnación, hills SE. of Tallaboa, just NW. of Peñon de
Ponce, (SJ [SJ00253!]).
Liogier, A.H. 10629, 03/01/1964, Guánica insular forest, (NY [NY00952748!], US [US970980]).
Monsegur, O. 202, 20/03/2004, Peñuelas, Ba. Encarnación, to the north of road # 2 on the
back area of an old junker to a small canyon, to the west of Carcel Las Cucharas, (MAPR
[MAPR26673!]).
Monsegur, O. 356, 12/07/2005, Guánica Forest Reserve, from road 334 taking Las Cobanas
trail, (MAPR [MAPR24899!]).
Monsegur, O. 467, 18/08/2005, Guánica Forest Reserve, El Fuerte Trail from DRNA office
always taking the trails to the northeast leading to road 334, El Maniel, Vereda El Fuerte,
(MAPR [MAPR29818!]).
Monsegur, O. 763, 17/06/2006, Peñuelas, Bo. Encarnación, North of highway 2, taking a
drainage to the north, close to the boundary with El Peñon de Ponce, behind a gas station,
(MAPR [MAPR30776!], UPPRP [045552!]).
Proctor, G.R. 48775, 14/04/1993, Peñuelas, Ba. Encarnación, hills SE. of Tallaboa, just NW. of
Peñon de Ponce, (SJ [SJ00252!]).
Shafer, J.A. 1989, 13/03/1913, Limestone hill, Peñon, Guayanilla to Tallaboa, (NY
[NY00952747!], US [US970971]).
Sintenis, P.E.E. 3731 (syntype), 10/02/1886 prope Guánica in declivibus umbrosis montis El
Maniel ad La Ballena versus, (B [destroyed], HBG [HBG507449!], JE [JE00000805!], K
[K000212605!, K000213358!], LD [LD1407637!, LD1407697!], MO [MO-694636!], NY
[NY01085777!], P [P03540816!, P03860090!, P03860089!], S [S12-18801!], US [US00110719!],
WU [WU0040311, W1900-0000177!], Z [Z-000001932!]).

245
Sintenis, P.E.E. 4879 (syntype), 29/07/1886, Inter Guayanilla et Barinas in declivibus ad Los
Indios, (B [destroyed], MPU [MPU019554!]).
Stevens, F.L. 9104, 29/07/1915, Guánica, (NY [NY00038089!]).
Woodbury, R.O. s.n., 18/09/1959, along road 116 east of Ensenada, (UPR [UPR02869]).
Woodbury, R.O. s.n., 1972, Guayanilla, (MO [MO-2158001!], NY [NY00952749!], UPR [28233]).
Woodbury, R.O. s.n., 25/06/1978, Vieques, Punta Jalova, (SJ [SJ00249!]).
DNA samples (georeferenced with field images – no voucher specimen)
Hamilton, M.A. 906, 907, 908, 909, 910, 912, 913, 914, 915, 916, 917, 918, 18/07/2012,
Bosque Estatal de Guánica, Guánica eastern tract.
Hamilton, M.A. 929 to 934, 30/07/2012, Eastern Vieques National Wildlife Refuge, Puerto
Ferro.
Hamilton, M.A. 943, 944, 946, 947, 03/05/2013, Bosque Estatal de Guánica, Guánica eastern
tract.
Hamilton, M.A. 951 to 960, 05/05/2013, Bosque Estatal de Guánica, Guánica eastern tract.
Hamilton, M.A. 995 to 1021, 07/05/2013, Bosque Estatal de Guánica, Guánica eastern tract.
Hamilton, M.A. 1043, 1045, 1047 to 1051, 08/05/2013, Yauco, Barina, Catala Farm.
Hamilton, M.A. 1054 to 1077, 09/05/2013, Ponce, Canas, Off Rd. 2 behind the Holiday Inn
Hotel.
Hamilton, M.A. 1078, 1079, 1081 to 1092, 10/05/2013, Peñuelas, Bo. Encarnación, N of
Highway 2.
Hamilton, M.A. 1093 to 1100, 11/05/2013, Bosque Estatal de Guánica, Guánica eastern tract.
Hamilton, M.A. 1349 to 1354, 03/03/2014, Bosque Estatal de Guánica, Guánica eastern tract.
Hamilton, M.A. 1356 to 1357, 04/03/2014, Ponce, Canas, Off Rd. 2 behind the Holiday Inn
Hotel.
Hamilton, M.A. 1359 to 1361, 04/03/2014, Bosque Estatal de Guánica, Guánica western tract.
Hamilton, M.A. 1362 to 1365, 06/03/2014, Peñuelas, Bo. Encarnación, N of Highway 2.
Hamilton, M.A. 1366 to 1368, 07/03/2014, Bosque Estatal de Guánica, Guánica eastern tract.

246
British Virgin Islands - Anegada
Vouchers from wild plants
Acevedo-Rodriguez, P. 10957, 10/4/2000, Anegada, N of Flamingo Pond, (MAPR [MAPR26743],
US [US711911]).
Acevedo-Rodriguez, P., 11542, 21/11/2000, Anegada, Middle Key, (UPRRP [39267], US
[US708421]).
Britton, N. L. & Fishlock, W. C. 955, 19/02/1913, Anegada, West End, (NY [NY01360743!], US
[US757425]).
D’Arcy, W.G. 4838, 31/07/1970, Anegada, Scattered plants around the sandy plain near West
End, (MO [MO-2158003!]).
D’Arcy, W.G. 4971, 04/08/1970, Near East End, (MO [MO-878732!]).
D’Arcy, W.G. 5077, 04/02/1971, Anegada, Ca. 1 mi. east of The Settlement on the limestone
plain, (A!, FAU, MO [MO-2158000!], SIU [SIU-09877!]).
Fishlock, W.C. 41, 10/1918, Anegada, junction of rocky and sandy parts, (NY [NY01360760!]).
Hamilton, M.A. 880, 04/07/2012, Anegada, Cow Wreck Bay, (BVI [OT0001334!], K
[K000816540!], MAPR!).
Hamilton, M.A. 881, 04/07/2012, Anegada, Cow Wreck Bay, (BVI [OT0001335!], K
[K000816543!], MAPR!).
Hamilton, M.A. 1192, 27/07/2013, Anegada, Pomato Point, (BVI [OT0001350!], K
[K000818120!], MAPR!).
Hamilton, M.A. 1194, 28/07/2013, Anegada, West End, (BVI [OT00001351!], K [K000818130!],
MAPR!).
Hamilton, M.A. 1196, 28/07/2013, Anegada, Flamingo Pond, (BVI [OT0001352!], K
[K000818129!], MAPR!).
Hamilton, M.A. 1198, 28/07/2013, Anegada, Bones Bight, (BVI [OT0001353!], K
[K000818128!], MAPR!).
Hamilton, M.A. 1213, 29/07/2013, Anegada, Keel Point, (BVI [OT0001354!], K [K000818127!],
MAPR!).

247
Hamilton, M.A. 1215, 29/07/2013, Anegada, Flamingo Pond, (BVI [OT0001355!], K
[K000818126!], MAPR!).
Hamilton, M.A. 1220, 29/07/2013, Anegada, Bones Low Point, (BVI [OT0001356!], K
[K000818132!], MAPR!).
Hamilton, M.A. 1225, 30/07/2013, Anegada, Warner, (K [K000818133!]).
Hamilton, M.A. 1253, 31/07/2013, Anegada, Pearl Point, (BVI [OT0001357!], K [K000818135!],
MAPR!).
Hamilton, M.A. 1269, 31/07/2013, Anegada, Saltheap Point, (BVI [OT0001362!], K
[K000818134!], MAPR!).
Hamilton, M.A. 1282, 01/08/2013, Anegada, Warner, (BVI [OT0001358!], K [K000818131!],
MAPR!).
Hamilton, M.A. 1289, 01/08/2013, Anegada, Windlass Low Point, (BVI [OT0001360!], K
[K000818136!], MAPR!).
Hamilton, M.A. 1309, 02/08/2013, Anegada, Middle Cay, (BVI [OT0001359!], K [K000817098!],
MAPR!).
Hamilton, M.A. 1503, 14/02/2015, Anegada, Warner, (K [K000819878!]).
Hamilton, M.A. 1506, 14/02/2015, Anegada, Warner, (K [K000819879!]).
Pollard, B.J. 1159, 28/11/2002, Anegada, Southern Dunes, 1km E of Anegada Reef Hotel, (K
[cited by Wenger et al. (2010), specimen not located]).
Pollard, B.J. 1266, 14/12/2002, Anegada, West End, along road from West End along northern
shore towards Bones Bight, (BVI [OT0001201!], K [K000367630!]).
Proctor, G.R. 43601, 30/05/1987, Anegada, West End, (SJ [SJ00250!]).
Proctor, G.R. 48393, 07/10/1992, Anegada, c. 0.3 mile SE of Bones Bight, (FTG [00067727!],
MO [MO-2158002], SJ [SJ00248!]).
Smith, D.N. s.n. 10/09/1990, Anegada, Growing at the Slob [Sambeal Slob], near the air-strip,
(FTG [00064942!]).
Walker, R. & Clubbe, C. 04, 21/11/2003, Anegada, Sambeal Slob, (K [K000297612!], BVI
[OT0001083!], UPRRP [UPPRP09266]).

248
Walker, R. 55, 22/12/2004, Anegada, Next to Botanic Garden along Settlement Road, (K
[K000297637!], BVI [OT0001091!]).
DNA samples (georeferenced with field images – no voucher specimen)
Hamilton, M.A. 1176-1191, 1193, 1195, 1197, 1199-1212, 1214, 1216-1219, 1221-1224, 1226-
1252, 1254-1268, 1270-1281, 1283-1288, 1290-1308, 1310-1322, collected between
26/07/2013 and 05/08/2013, across the island of Anegada.
Hamilton, M.A. 1503, 14/02/2015, Anegada, Warner.
Cultivated material held in ex-situ collections
Royal Botanic Gardens, Kew held 87 individuals in glasshouse facilities during the period of this
research.
Fairchild Tropical Botanic Garden, Dade County, Florida, USA held 19 individuals in outdoor
garden beds during the period of this research.
J.R. O'Neal Botanic Garden, Tortola, British Virgin Islands held 17 individuals in a shade house
nursery and outdoor garden beds during the period of this research.
Cabo Rojo National Wildlife Refuge, Cabo Rojo, Puerto Rico held 34 individuals in a shade
house nursery and field plots during the period of this research.
Department of Natural and Environmental Resources, Guánica State Forest, Guánica eastern
tract held 21 individuals in the forest shade house nursery during the period of this research.
Vouchers from cultivated plants
Abbott, J. 23959, 03/01/2008, Fairchild Tropical Botanic Garden, Dade County, Florida, USA
(FTG [00142361!]).
Bancroft, N. 006, 08/06/2010, Royal Botanic Gardens Kew, Tropical Nursery, (K
[K000703992!]).
Corcoran, M.R. UKOTsLC 0045, 05/07/2012, Royal Botanic Gardens Kew, Kew Quarantine
House, (K [K000816585!]).
Hamilton, M.A. 936, 24/03/2013, Royal Botanic Gardens Kew, Kew Quarantine House, (K
[K000679879!]).
Hamilton, M.A. 937, 24/03/2013, Royal Botanic Gardens Kew, Kew Quarantine House, (K
[K000679880!]).

249
Hamilton, M.A. 938, 24/03/2013, Royal Botanic Gardens Kew, Kew Quarantine House, (K
[K000679881!]).
Hamilton, M.A. 939, 24/03/2013, Royal Botanic Gardens Kew, Kew Quarantine House, (K
[K000679882!]).
Hamilton, M.A. 940, 24/03/2013, Royal Botanic Gardens Kew, Kew Quarantine House, (K –
wood sample [K000679883!]).
Hamilton, M.A. FTG 91544B, 14/08/2013, USA, Dade County, Fairchild Tropical Botanic Garden
(FTG!, K [K000818122!]).
Hamilton, M.A. FTG U-0067A, 14/08/2013, USA, Dade County, Fairchild Tropical Botanic
Garden (FTG!, K [K000818121!]).
Hamilton, M.A. 1118, 11/07/2013, Tortola, J.R. O'Neal Botanical Gardens National Park, (K
[K000818062!]).
Hamilton, M.A. 1119, 11/07/2013, Tortola, J.R. O'Neal Botanical Gardens National Park, (K
[K000818063!]).
Hamilton, M.A. 1120, 11/07/2013, Tortola, J.R. O'Neal Botanical Gardens National Park, (K
[K000817096!]).
Hamilton, M.A. 1121, 11/07/2013, Tortola, J.R. O'Neal Botanical Gardens National Park, (K
[K000817094!]).
Hamilton, M.A. 1122, 11/07/2013, Tortola, J.R. O'Neal Botanical Gardens National Park, (K
[K000818069!]).
Hamilton, M.A. 1123, 11/07/2013, Tortola, J.R. O'Neal Botanical Gardens National Park, (K
[K000818068!]).
Hamilton, M.A. 1124, 11/07/2013, Tortola, J.R. O'Neal Botanical Gardens National Park, (K
[K000817091!]).
Hamilton, M.A. 1125, 11/07/2013, Tortola, J.R. O'Neal Botanical Gardens National Park, (K
[K000817086!]).
Hamilton, M.A. 1126, 11/07/2013, Tortola, J.R. O'Neal Botanical Gardens National Park, (K
[K000817088!]).

250
Hamilton, M.A. 1127, 11/07/2013, Tortola, J.R. O'Neal Botanical Gardens National Park, (K
[K000817087!]).
Hamilton, M.A. 1128, 11/07/2013, Tortola, J.R. O'Neal Botanical Gardens National Park, (K
[K000818070!]).
Hamilton, M.A. 1129, 11/07/2013, Tortola, J.R. O'Neal Botanical Gardens National Park, (K
[K000817095!]).
Hamilton, M.A. 1130, 11/07/2013, Tortola, J.R. O'Neal Botanical Gardens National Park, (K
[K000818064!]).
Hamilton, M.A. 1131, 11/07/2013, Tortola, J.R. O'Neal Botanical Gardens National Park, (K
[K000817090!]).
Hamilton, M.A. 1132, 11/07/2013, Tortola, J.R. O'Neal Botanical Gardens National Park, (K
[K000818065!]).
Hamilton, M.A. 1133, 11/07/2013, Tortola, J.R. O'Neal Botanical Gardens National Park, (K
[K000818067!]).
Hamilton, M.A. 1134, 11/07/2013, Tortola, J.R. O'Neal Botanical Gardens National Park, (K
[K000817097!]).
Hamilton, M.A. 1323, 05/10/2013, Royal Botanic Gardens Kew, Kew Quarantine House, (K
[K000679920!]).
Hamilton, M.A. 1324, 05/10/2013, Royal Botanic Gardens Kew, Kew Quarantine House, (K
[K000679921!]).
Hamilton, M.A. 1329, 05/10/2013, Royal Botanic Gardens Kew, Kew Quarantine House, (K
[K000679922!]).
Hamilton, M.A. 1330, 05/10/2013, Royal Botanic Gardens Kew, Kew Quarantine House, (K
[K000679923!]).
Hamilton, M.A. 1332, 05/10/2013, Royal Botanic Gardens Kew, Kew Quarantine House, (K
[K000679924!]).
Hamilton, M.A. 1334, 05/10/2013, Royal Botanic Gardens Kew, Kew Quarantine House, (K
[K000679925!]).
251
Hamilton, M.A. 1336, 05/10/2013, Royal Botanic Gardens Kew, Kew Quarantine House, (K
[K000679926!]).
DNA samples (georeferenced with images – no voucher specimen)
Corcoran, M.R. s.n., 2012, one sample of plant grown from wild collected seed on Anegada
held under accession 2005-1557, Royal Botanic Gardens, Kew.
Corcoran, M.R. s.n., 2012, 48 samples of individual plants grown from seed collected from
cultivated plants held under accession 2009-2709, Royal Botanic Gardens, Kew.
Corcoran, M.R. s.n., 2012, two samples from individual plants held under accession 2008-3140;
seed collected from cultivated mother plant held under accession 2005-1557, Royal Botanic
Gardens, Kew.
Corcoran, M.R. s.n., 2012, four samples from individual plants held under accession 2011-
1273; seed collected from plants grown from wild seed collected on Anegada held under
various accessions, Royal Botanic Gardens, Kew.
Hamilton, M.A. 880A, 880B and 880-1 to 880-9, 24/03/2013, eleven samples from seedlings
grown from wild seed collected on Anegada.
Hamilton, M.A. 961 to 994, 06/05/2013, restoration plot [CULTIVATED], Cabo Rojo National
Wildlife Refuge.
Hamilton, M.A. 1022 to 1042, 07/05/2013, forest nursery [CULTIVATED], Bosque Estatal de
Guánica, Guánica eastern tract.
Hamilton, M.A. FTG91544A, FTG91544C, FTG91544D, FTG91544E, FTG91544F, FTG941068B,
FTG941068C, FTG941068E, FTG941068F, FTG941068G, FTG941068H, FTGVOL1, FTGVOL2,
FTGVOL3, FTGVOL4, FTGVOL5, FTGVOL6, 14/08/2013, Original seed source from Anegada with
subsequent collection from cultivated plants and volunteers in outdoor displays, USA, Dade
County, Fairchild Tropical Botanic Garden
Hamilton, M.A. 1325-1328, 1331, 1333, 1335, 1337 05/10/2013, leaf samples of plants grown
in the Kew Quarantine House, Royal Botanic Gardens Kew, from wild seed collected on Puerto
Rico.

252
Appendix 2: Survey points by substrate and regional habitat class The following table provides the total number of sampling points across the Puerto Rican Bank by island with presence/absence records per substrate type and percentage as well as per regional
habitat class based on Kennaway & Helmer (2007) for the country of Puerto Rico and Kennaway et al. (2008) for the U.S and British Virgin Islands and percentage. Pleistocene limestone and
Quaternary sand deposits occur on the island of Anegada. Pliocene limestone deposits occur on the island of Vieques. Miocene deposits of Juana Diaz and Ponce limestone occur on the island of
Puerto Rico. Note: ‘Semi-Deciduous and Drought Deciduous Forest on Karst (includes semi-evergreen forest)’ = ‘Deciduous forest on karst’; ‘Deciduous, Evergreen Coastal and Mixed Forest or
Shrubland with Succulents’ = ‘Mixed Forest’; ‘Pasture, Hay or Inactive Agriculture (e.g. abandoned sugar cane)’ = ‘Pasture’
Island Survey points Absence records Limestone % on limestone Other % on other High-Medium Density Urban
Low-Medium Density Urban Pasture
Mixed Forest
Deciduous forest on karst
Other habitats
Anegada 666
514 292 57% 222 43% 1 52 17 355 0 89
Presence records Limestone % on limestone Other % on other High-Medium Density Urban
Low-Medium Density Urban Pasture
Mixed Forest
Deciduous forest on karst
Other habitats
152 78 51% 74 49% 3 36 3 110 0 0
Vieques 514
Absence records Limestone % on limestone Other % on other High-Medium Density Urban
Low-Medium Density Urban Pasture
Mixed Forest
Deciduous forest on karst
Other habitats
513 47 9% 466 91% 0 65 136 1 103 208
Presence records Limestone % on limestone Other % on other High-Medium Density Urban
Low-Medium Density Urban Pasture
Mixed Forest
Deciduous forest on karst
Other habitats
1 1 100% 0 0% 0 0 0 0 1 0
Puerto Rico 760
Absence records Limestone % on limestone Other % on other High-Medium Density Urban
Low-Medium Density Urban Pasture
Mixed Forest
Deciduous forest on karst
Other habitats
734 424 58% 310 42% 56 64 107 49 268 190
Presence records Limestone % on limestone Other % on other High-Medium Density Urban
Low-Medium Density Urban Pasture
Mixed Forest
Deciduous forest on karst
Other habitats
26 26 100% 0 0% 0 0 0 0 26 0

253
Appendix 3: Varronia rupicola observations made between 2012 and 2015 The tables below show Varronia rupicola observations (presence and opportunistic records) made across the species’ native range between 2012 and 2015 divided by habitat and substrate per
island. Table A. Shows values for refined habitat types of Kennaway et al. (2008) for Anegada and Gould et al. (2008) for Puerto Rico and Vieques. Table B. Shows values for regional habitat types
of Kennaway & Helmer (2007) for the country of Puerto Rico and Kennaway et al. (2008) for the U.S and British Virgin Islands. Pleistocene limestone and Quaternary sand deposits occur on the
island of Anegada. Pliocene limestone deposits occur on the island of Vieques. Miocene deposits of Juana Diaz and Ponce limestone occur on the island of Puerto Rico.
A. Refined habitat types of Kennaway et al. (2008) for Anegada and Gould et al. (2008) for Puerto Rico and Vieques
Island Number of observations Refined habitats Limestone % Sand %
Anegada
479 Deciduous, Evergreen and Mixed Forest and Shrubland with or without Succulents 449 94% 30 6% 100 Evergreen Coastal Shrubland 26 26% 74 74% 59 Low Density Urban 12 20% 47 80% 9 Pasture, Hay, Abandoned Agriculture or Other Grassy Areas 7 78% 2 22%
4 High-Medium Density Urban 0 0% 4 100
% Vieques 6 Mature secondary lowland dry limestone semi-deciduous forest 6 100% 0 0%
Puerto Rico 159 Mature secondary lowland dry limestone semi-deciduous forest 159 100% 0 0%
6 Young secondary lowland dry limestone semi-deciduous forest 6 100% 0 0%
Total observations 822 Total observations by substrate and percentage 665 81% 157 19%

254
B. Regional habitat types of Kennaway & Helmer (2007) for the country of Puerto Rico and Kennaway et al. (2008) for the U.S and British Virgin Islands Island Number of observations Habitat Limestone % Sand %
Anegada
579 Deciduous, Evergreen Coastal and Mixed Forest or Shrubland with Succulents 475 82% 104 18% 59 Low Density Urban 12 20% 47 80% 9 Pasture, Hay or Inactive Agriculture 7 78% 2 22% 4 High-Medium Density Urban 0 0% 4 100%
Vieques 6 Semi-Deciduous and Drought Deciduous Forest on Karst (includes semi-evergreen forest) 6 100% 0 0% Puerto Rico 165 Semi-Deciduous and Drought Deciduous Forest on Karst (includes semi-evergreen forest) 165 100% 0 0% Total observations 822 Total observations by substrate and percentage 665 81% 157 19%

255
Appendix 4: New samples used for phylogenetic analysis The following table provides the species binomial (Genus, Species), Identification number (ID), voucher number
(Voucher) and source material (Source) for samples included in the five analyses undertaken, A-E, indicating if the
sample was included using plus (+) or minus (-). Source material abbreviations: Silica = Silica dried leaf material;
HS = leaf material from herbarium specimen. An asterisk (*) beside the specific epithet indicates type material.
A B C D E Genus Specific epithet ID Voucher Source + + + + + Cordia borinquensis 83 MAH924 Silica + + + + + Cordia collococca 137 MAH948 Silica + + + + + Cordia obliqua 138 MAH949 Silica + + + + + Cordia rickseckeri 72 MAH926 Silica + + + + + Cordia rickseckeri 241 MAH1052 Silica + + + - - Cordia rickseckeri 308 MAH875 Silica + + + + + Cordia rickseckeri 522 SB111 Silica + + + + + Varronia bahamensis 67 MAH863 Silica + - + - - Varronia bahamensis* 74 K000583257 HS + + + + + Varronia bahamensis 307 K000297743 HS
+ + + + + Varronia bahamensis 519 FTG2009-
0504A Silica + + + + + Varronia bahamensis 525 MAH861 Silica + + + + + Varronia bahamensis 526 FTG00151995 HS + - + + - Varronia bellonis 119 K000817006 HS + + + + + Varronia bellonis 120 K000817007 HS + + + + + Varronia bullata 69 MAH780 Silica + + + + + Varronia bullata 84 MAH925 Silica
+ + + + + Varronia bullata spp.
humilis 139 MAH950 Silica
+ - + + - Varronia bullata spp.
humilis 242 MAH1053 Silica + + + - - Varronia lima 85 MAH922 Silica + + + + + Varronia lima 86 MAH923 Silica + + + + + Varronia lucayana 309 MARC55 Silica + + + - - Varronia macrostachya 292 K1936-31901 Silica + + + + + Varronia nesophila 549 MAH773 Silica + + + + + Varronia polycephala 81 MAH927 Silica + + + + + Varronia polycephala 88 MAH920 Silica + + + + + Varronia polycephala 131 MAH941 Silica + + + + + Varronia polycephala 302 K000679889 HS + - + - - Varronia rupicola* 3 K000212605 HS + - + - - Varronia rupicola* 4 K000213358 HS + + + + + Varronia rupicola 6 MAH880 Silica + + + + + Varronia rupicola 7 MAH934 Silica + + + + + Varronia rupicola 96 MAH913 Silica
33 28 33 27 25 Total per analysis

256
Appendix 5: GenBank sequences used in phylogenetic analysis The following table provides the species binomial and GenBank number (GenBank #) for samples included in the
four analyses undertaken, A-E, by indicating if the sample was included using plus (+) or minus (-).
A B C D E Genus Specific epithet GenBank # + + - - - Cordia aberrans JF332090 + + - - - Cordia acutifolia JF332066 + + - - - Cordia alliodora JF332103 - - + - - Cordia americana KF158212 + + - - - Cordia anabaptista JF332088 + + - - - Cordia bicolor JF332068 + - - - - Cordia boissieri EU862046 + + - - - Cordia bordasii JF332105 + + - - - Cordia collococca JF332092 + + - - - Cordia correae JF332061 + - - - - Cordia croatii EU862048 + + - - - Cordia cymosa JF332083 - - + - - Cordia decandra EF688851 + + - - - Cordia decandra EF688903 + + - - - Cordia decipiens JF332070 + + - - - Cordia dentata JF332104 + + - - - Cordia dichotoma JF332093 + + - - - Cordia diversifolia JF332112 + + - - - Cordia dwyeri JF332079 + + - - - Cordia ecalyculata JF332057 + + - - - Cordia elaeagnoides JF332106 + + - - - Cordia exaltata JF332074 + + - - - Cordia gerascanthus JF332100 + + - - - Cordia glazioviana JF332109 + + - - - Cordia goeldiana JF332102 + + - - - Cordia guineensis JF332096 - - + - - Cordia guineensis KF158203 + + - - - Cordia incognita JF332110 + + - - - Cordia insignis JF332098 + + - - - Cordia lasiocalyx JF332081 + + - - - Cordia leslieae JF332062 + + - - - Cordia liesneri JF332063 + + - - - Cordia lucidula JF332082 - - + - - Cordia lutea KF158215 + + - - - Cordia megalantha JF332101 + + - - - Cordia monoica JF332095 - - + - - Cordia monoica KF158202 + + - - - Cordia myxa KC155288 + + - - - Cordia naidophila JF332071 - - + - - Cordia nevillii HQ412979 - - + - - Cordia nodosa HQ286269

257
A B C D E Genus Specific epithet GenBank # + + - - - Cordia nodosa JF332072 + + - - - Cordia oncocalyx JF332108 + + - - - Cordia panamensis JF332060 + + - - - Cordia panicularis JF332084 + + - - - Cordia pilosa JF332089 + + - - - Cordia porcata JF332080 + + - - - Cordia rufescens JF332086 + + - - - Cordia saccellia JF332111 - - + - - Cordia saccellia KF158208 + + - - - Cordia scabrifolia JF332067 + + - - - Cordia sebestena JF332107 - - + - - Cordia sebestena KC542482 + + - - - Cordia sellowiana JF332069 - - + - - Cordia sonorae KF158214 + + - - - Cordia sprucei JF332075 + + - - - Cordia superba JF332085 + + - - - Cordia taguahyensis JF332087 + + - - - Cordia tetrandra JF332076 + + - - - Cordia toqueve JF332059 + + - - - Cordia trachyphylla JF332078 + + - - - Cordia trichoclada JF332077 + + - - - Cordia trichotoma JF332099 + - - - - Cordia ucayaliensis JF332073 - - + - - Cordia weddellii KF158189 - - + + + Heliotropium angiospermum HQ286151 + + - - + Heliotropium angiospermum HQ286121 + - - - - Varronia ambigua EU862043 + - - - - Varronia anderssonii HM443749 + - - - - Varronia angustifolia AY321619 + - - - - Varronia bifurcata AF402575 + - - - - Varronia bonplandii AY321620 - - + - - Varronia bonplandii KC542473 + - - - - Varronia bullata AY176084 - - + - - Varronia bullata KF158211 + + - - - Varronia curassavica JF332114 + + - - - Varronia discolor JF332123 + + - - - Varronia glandulosa JF332115 + + - - - Varronia globosa JF332121 + - - - - Varronia guanacastensis EU862054 + + - - - Varronia harleyi JF332118 + - - - - Varronia inermis EU862055 + - - - - Varronia lauta AY321622 + - - - - Varronia lenis AF402577 + + - - - Varronia leucocephala JF332124 + + - - - Varronia leucomalloides JF332120

258
A B C D E Genus Specific epithet GenBank # + - - - - Varronia leucophlyctis HM443754 + - - - - Varronia lima AY321624 + - - - - Varronia longipedunculata AY321625 + - - - - Varronia macrocephala HM443757 + - - - - Varronia martinicensis EU862056 + + - - - Varronia mayoi JF332119 + + - - - Varronia multispicata JF332113 + - - - - Varronia oaxacana EU862058 + - - - - Varronia podocephala EU862060 + - - - - Varronia polycephala HM443762 + - - - - Varronia pringlei EU862062 + - - - - Varronia revoluta HM443764 + + - - - Varronia sessilifolia JF332116 + - - - - Varronia spinescens AY701587 + + - - - Varronia striata JF332122 + + - - - Varronia tarodaea JF332117
88 64 14 1 2 Total per analysis

259
Appendix 6: Population genetics samples The following table provides the Voucher number (Voucher), Identification number (Sample ID), Collection
location (Location), Population identifier (Population), Origin of source material (Origin) and Origin of material
for ex-situ material (Ex-situ origin) for 380 samples. If the sample was included or excluded in the three analysis
groups, A-C, it is indicated using plus (+) or minus (-), respectively.
Source material abbreviations: Wild = Silica dried leaf material; Cultivated = ex-situ material; HS = leaf material
from herbarium specimen; N/A = not applicable. Samples originate from extant ex-situ plants, extant wild plants
or herbarium specimens of dead plants. All wild and ex-situ plant material originated from silica dried leaf
samples. Herbarium specimen material originated from air-dried herbarium vouchers. Source material
abbreviations for ex-situ plants: BVI = Anegada source material; PR = Puerto Rico source material.
Population abbreviations for ex-situ plants: Cabo Rojo = Cabo Rojo National Wildlife Refuge, Puerto Rico; England
= Royal Botanic Gardens, Kew, UK; Florida = Fairchild Tropical Botanical Garden, Miami, Florida, USA; Guánica
nursery = Guánica State Forest nursery, Puerto Rico; Tortola = J.R. O’Neal Botanic Garden nursery, Road Town,
Tortola, BVI. Population abbreviations for wild plants: Anegada East = eastern Anegada, British Virgin Islands
including the localities of East End and Warner; Anegada West = western Anegada, British Virgin Islands including
the localities of Bones Bight, Bones Low Point, Bumber Well Cay, Capt. Auguste George Airport, Citron Bush, Cow
Wreck Bay, Flamingo Pond, Jack Bay, Keel Point, Low Cay, Middle Cay, North Raibin Slob, Nutmeg Point, Pearl
Point, Pomato Point, Sambeal Slob, Setting Point, Soldier East Point, Soldier Point, Saltheap Point, The
Settlement, Vagabond Pond, West End, Windlass Bight and Windlass Low Point; Guánica = the municipalities of
Guánica and Yauco on the island of Puerto Rico; Ponce = the municipalities of Peñuelas and Ponce on the island
of Puerto Rico; Vieques = the peninsula of Puerto Ferro on Vieques island.
A B C Voucher Sample ID Location Population Origin Ex-situ origin
+ + + MAH881 5 Anegada Anegada West Wild N/A
+ + + MAH880 6 Anegada Anegada West Wild N/A
+ + + MAH1176 311 Anegada Anegada West Wild N/A
+ + + MAH1177 312 Anegada Anegada West Wild N/A
+ + + MAH1178 313 Anegada Anegada West Wild N/A
+ + + MAH1179 314 Anegada Anegada West Wild N/A
+ + + MAH1180 315 Anegada Anegada West Wild N/A
+ + + MAH1181 316 Anegada Anegada West Wild N/A
+ + + MAH1182 317 Anegada Anegada West Wild N/A
+ + + MAH1183 318 Anegada Anegada West Wild N/A
+ + + MAH1184 319 Anegada Anegada West Wild N/A
+ + + MAH1185 320 Anegada Anegada West Wild N/A
+ + + MAH1186 321 Anegada Anegada West Wild N/A
+ + + MAH1187 322 Anegada Anegada West Wild N/A
+ + + MAH1188 323 Anegada Anegada West Wild N/A
+ + + MAH1189 324 Anegada Anegada West Wild N/A
+ + + MAH1190 325 Anegada Anegada West Wild N/A
+ + + MAH1191 326 Anegada Anegada West Wild N/A
+ + + MAH1192 327 Anegada Anegada West Wild N/A
+ + + MAH1193 328 Anegada Anegada West Wild N/A

260
A B C Voucher Sample ID Location Population Origin Ex-situ origin
+ + + MAH1194 329 Anegada Anegada West Wild N/A
+ + + MAH1195 330 Anegada Anegada West Wild N/A
+ + + MAH1196 331 Anegada Anegada West Wild N/A
+ + + MAH1197 332 Anegada Anegada West Wild N/A
+ + + MAH1198 333 Anegada Anegada West Wild N/A
+ + + MAH1199 334 Anegada Anegada West Wild N/A
+ + + MAH1200 335 Anegada Anegada West Wild N/A
+ + + MAH1201 336 Anegada Anegada West Wild N/A
+ + + MAH1202 337 Anegada Anegada West Wild N/A
+ + + MAH1203 338 Anegada Anegada West Wild N/A
+ + + MAH1204 339 Anegada Anegada West Wild N/A
+ + + MAH1205 340 Anegada Anegada West Wild N/A
+ + + MAH1206 341 Anegada Anegada West Wild N/A
+ + + MAH1207 342 Anegada Anegada West Wild N/A
+ + + MAH1208 343 Anegada Anegada West Wild N/A
+ + + MAH1209 344 Anegada Anegada West Wild N/A
+ + + MAH1210 345 Anegada Anegada West Wild N/A
+ + + MAH1211 346 Anegada Anegada West Wild N/A
+ + + MAH1212 347 Anegada Anegada West Wild N/A
+ + + MAH1213 348 Anegada Anegada West Wild N/A
+ + + MAH1214 349 Anegada Anegada West Wild N/A
+ + + MAH1215 350 Anegada Anegada West Wild N/A
+ + + MAH1216 351 Anegada Anegada West Wild N/A
+ + + MAH1217 352 Anegada Anegada West Wild N/A
+ + + MAH1219 354 Anegada Anegada West Wild N/A
+ + + MAH1221 356 Anegada Anegada West Wild N/A
+ + + MAH1222 357 Anegada Anegada East Wild N/A
+ + + MAH1223 358 Anegada Anegada East Wild N/A
+ + + MAH1224 359 Anegada Anegada East Wild N/A
+ + + MAH1225 360 Anegada Anegada East Wild N/A
+ + + MAH1226 361 Anegada Anegada East Wild N/A
+ + + MAH1227 362 Anegada Anegada East Wild N/A
+ + + MAH1228 363 Anegada Anegada East Wild N/A
+ + + MAH1229 364 Anegada Anegada East Wild N/A
+ + + MAH1231 366 Anegada Anegada East Wild N/A
+ + + MAH1232 367 Anegada Anegada East Wild N/A
+ + + MAH1233 368 Anegada Anegada East Wild N/A
+ + + MAH1234 369 Anegada Anegada West Wild N/A
+ + + MAH1235 370 Anegada Anegada West Wild N/A
+ + + MAH1236 371 Anegada Anegada West Wild N/A
+ + + MAH1237 372 Anegada Anegada West Wild N/A
+ + + MAH1238 373 Anegada Anegada West Wild N/A
+ + + MAH1239 374 Anegada Anegada West Wild N/A
+ + + MAH1240 375 Anegada Anegada West Wild N/A
+ + + MAH1242 377 Anegada Anegada West Wild N/A

261
A B C Voucher Sample ID Location Population Origin Ex-situ origin
+ + + MAH1243 378 Anegada Anegada West Wild N/A
+ + + MAH1244 379 Anegada Anegada West Wild N/A
+ + + MAH1245 380 Anegada Anegada West Wild N/A
+ + + MAH1246 381 Anegada Anegada West Wild N/A
+ + + MAH1247 382 Anegada Anegada West Wild N/A
+ + + MAH1248 383 Anegada Anegada West Wild N/A
+ + + MAH1249 384 Anegada Anegada West Wild N/A
+ + + MAH1250 385 Anegada Anegada West Wild N/A
+ + + MAH1251 386 Anegada Anegada West Wild N/A
+ + + MAH1252 387 Anegada Anegada West Wild N/A
+ + + MAH1253 388 Anegada Anegada West Wild N/A
+ + + MAH1254 389 Anegada Anegada West Wild N/A
+ + + MAH1255 390 Anegada Anegada West Wild N/A
+ + + MAH1257 392 Anegada Anegada West Wild N/A
+ + + MAH1258 393 Anegada Anegada West Wild N/A
+ + + MAH1260 395 Anegada Anegada West Wild N/A
+ + + MAH1261 396 Anegada Anegada West Wild N/A
+ + + MAH1262 397 Anegada Anegada West Wild N/A
+ + + MAH1263 398 Anegada Anegada West Wild N/A
+ + + MAH1264 399 Anegada Anegada West Wild N/A
+ + + MAH1265 400 Anegada Anegada West Wild N/A
+ + + MAH1266 401 Anegada Anegada West Wild N/A
+ + + MAH1267 402 Anegada Anegada West Wild N/A
+ + + MAH1268 403 Anegada Anegada West Wild N/A
+ + + MAH1269 404 Anegada Anegada West Wild N/A
+ + + MAH1270 405 Anegada Anegada West Wild N/A
+ + + MAH1271 406 Anegada Anegada West Wild N/A
+ + + MAH1272 407 Anegada Anegada West Wild N/A
+ + + MAH1273 408 Anegada Anegada West Wild N/A
+ + + MAH1274 409 Anegada Anegada West Wild N/A
+ + + MAH1275 410 Anegada Anegada West Wild N/A
+ + + MAH1276 411 Anegada Anegada East Wild N/A
+ + + MAH1277 412 Anegada Anegada East Wild N/A
+ + + MAH1278 413 Anegada Anegada East Wild N/A
+ + + MAH1279 414 Anegada Anegada East Wild N/A
+ + + MAH1280 415 Anegada Anegada East Wild N/A
+ + + MAH1281 416 Anegada Anegada East Wild N/A
+ + + MAH1282 417 Anegada Anegada East Wild N/A
+ + + MAH1283 418 Anegada Anegada East Wild N/A
+ + + MAH1284 419 Anegada Anegada East Wild N/A
+ + + MAH1285 420 Anegada Anegada West Wild N/A
+ + + MAH1286 421 Anegada Anegada West Wild N/A
+ + + MAH1287 422 Anegada Anegada West Wild N/A
+ + + MAH1288 423 Anegada Anegada West Wild N/A
+ + + MAH1289 424 Anegada Anegada West Wild N/A

262
A B C Voucher Sample ID Location Population Origin Ex-situ origin
+ + + MAH1290 425 Anegada Anegada West Wild N/A
+ + + MAH1291 426 Anegada Anegada West Wild N/A
+ + + MAH1292 427 Anegada Anegada West Wild N/A
+ + + MAH1293 428 Anegada Anegada West Wild N/A
+ + + MAH1294 429 Anegada Anegada West Wild N/A
+ + + MAH1295 430 Anegada Anegada West Wild N/A
+ + + MAH1296 431 Anegada Anegada West Wild N/A
+ + + MAH1297 432 Anegada Anegada West Wild N/A
+ + + MAH1298 433 Anegada Anegada West Wild N/A
+ + + MAH1299 434 Anegada Anegada West Wild N/A
+ + + MAH1300 435 Anegada Anegada West Wild N/A
+ + + MAH1301 436 Anegada Anegada West Wild N/A
+ + + MAH1302 437 Anegada Anegada West Wild N/A
+ + + MAH1303 438 Anegada Anegada West Wild N/A
+ + + MAH1304 439 Anegada Anegada West Wild N/A
+ + + MAH1305 440 Anegada Anegada West Wild N/A
+ + + MAH1306 441 Anegada Anegada West Wild N/A
+ + + MAH1307 442 Anegada Anegada West Wild N/A
+ + + MAH1308 443 Anegada Anegada West Wild N/A
+ + + MAH1309 444 Anegada Anegada West Wild N/A
+ + + MAH1310 445 Anegada Anegada West Wild N/A
+ + + MAH1311 446 Anegada Anegada West Wild N/A
+ + + MAH1312 447 Anegada Anegada West Wild N/A
+ + + MAH1313 448 Anegada Anegada West Wild N/A
+ + + MAH1314 449 Anegada Anegada West Wild N/A
+ + + MAH1315 450 Anegada Anegada West Wild N/A
+ + + MAH1316 451 Anegada Anegada West Wild N/A
+ + + MAH1317 452 Anegada Anegada West Wild N/A
+ + + MAH1318 453 Anegada Anegada East Wild N/A
+ + + MAH1319 454 Anegada Anegada East Wild N/A
+ + + MAH1320 455 Anegada Anegada East Wild N/A
+ + + MAH1321 456 Anegada Anegada East Wild N/A
+ + + MAH1322 457 Anegada Anegada East Wild N/A
+ + + MAH1241 530 Anegada Anegada West Wild N/A
- + + MAH961 150 Puerto Rico Cabo Rojo Cultivated PR
- + + MAH962 151 Puerto Rico Cabo Rojo Cultivated PR
- + + MAH963 152 Puerto Rico Cabo Rojo Cultivated PR
- + + MAH964 153 Puerto Rico Cabo Rojo Cultivated PR
- + + MAH965 154 Puerto Rico Cabo Rojo Cultivated PR
- + + MAH966 155 Puerto Rico Cabo Rojo Cultivated PR
- + + MAH967 156 Puerto Rico Cabo Rojo Cultivated PR
- + + MAH968 157 Puerto Rico Cabo Rojo Cultivated PR
- + + MAH969 158 Puerto Rico Cabo Rojo Cultivated PR - + + MAH970 159 Puerto Rico Cabo Rojo Cultivated PR
- + + MAH971 160 Puerto Rico Cabo Rojo Cultivated PR

263
A B C Voucher Sample ID Location Population Origin Ex-situ origin
- + + MAH972 161 Puerto Rico Cabo Rojo Cultivated PR
- + + MAH973 162 Puerto Rico Cabo Rojo Cultivated PR
- + + MAH974 163 Puerto Rico Cabo Rojo Cultivated PR
- + + MAH975 164 Puerto Rico Cabo Rojo Cultivated PR
- + + MAH976 165 Puerto Rico Cabo Rojo Cultivated PR
- + + MAH977 166 Puerto Rico Cabo Rojo Cultivated PR
- + + MAH978 167 Puerto Rico Cabo Rojo Cultivated PR
- + + MAH979 168 Puerto Rico Cabo Rojo Cultivated PR
- + + MAH980 169 Puerto Rico Cabo Rojo Cultivated PR
- + + MAH981 170 Puerto Rico Cabo Rojo Cultivated PR
- + + MAH982 171 Puerto Rico Cabo Rojo Cultivated PR
- + + MAH983 172 Puerto Rico Cabo Rojo Cultivated PR
- + + MAH984 173 Puerto Rico Cabo Rojo Cultivated PR
- + + MAH985 174 Puerto Rico Cabo Rojo Cultivated PR
- + + MAH986 175 Puerto Rico Cabo Rojo Cultivated PR
- + + MAH987 176 Puerto Rico Cabo Rojo Cultivated PR
- + + MAH988 177 Puerto Rico Cabo Rojo Cultivated PR
- + + MAH989 178 Puerto Rico Cabo Rojo Cultivated PR
- + + MAH990 179 Puerto Rico Cabo Rojo Cultivated PR
- + + MAH991 180 Puerto Rico Cabo Rojo Cultivated PR
- + + MAH992 181 Puerto Rico Cabo Rojo Cultivated PR
- + + MAH993 182 Puerto Rico Cabo Rojo Cultivated PR
- + + MAH994 183 Puerto Rico Cabo Rojo Cultivated PR
- + + 2005-1557_2 1 England England (BVI) Cultivated BVI
- + + MAH880A 300 England England (BVI) Cultivated BVI
- + + MAH880B 301 England England (BVI) Cultivated BVI
- + + MAH880-1 509 England England (BVI) Cultivated BVI
- + + MAH880-2 510 England England (BVI) Cultivated BVI
- + + MAH880-3 511 England England (BVI) Cultivated BVI
- + + MAH880-4 512 England England (BVI) Cultivated BVI
- + + MAH880-5 513 England England (BVI) Cultivated BVI
- + + MAH880-6 514 England England (BVI) Cultivated BVI
- + + MAH880-7 515 England England (BVI) Cultivated BVI
- + + MAH880-8 516 England England (BVI) Cultivated BVI
- + + MAH880-9 517 England England (BVI) Cultivated BVI
- + + MAH1323 494 England England (PR) Cultivated PR
- + + MAH1324 495 England England (PR) Cultivated PR
- + + MAH1325 496 England England (PR) Cultivated PR
- + + MAH1327 498 England England (PR) Cultivated PR
- + + MAH1328 499 England England (PR) Cultivated PR
- + + MAH1329 500 England England (PR) Cultivated PR
- + + MAH1330 501 England England (PR) Cultivated PR
- + + MAH1331 502 England England (PR) Cultivated PR
- + + MAH1332 503 England England (PR) Cultivated PR
- + + MAH1333 504 England England (PR) Cultivated PR

264
A B C Voucher Sample ID Location Population Origin Ex-situ origin
- + + MAH1334 505 England England (PR) Cultivated PR
- + + MAH1335 506 England England (PR) Cultivated PR
- + + MAH1336 507 England England (PR) Cultivated PR
- + + MAH1337 508 England England (PR) Cultivated PR
- + + FTG_91544-A 475 Florida Florida Cultivated BVI
- + + FTG_91544-B 476 Florida Florida Cultivated BVI
- + + FTG_91544-C 477 Florida Florida Cultivated BVI
- + + FTG_91544-D 478 Florida Florida Cultivated BVI
- + + FTG_91544-F 479 Florida Florida Cultivated BVI
- + + FTG_91544-E 480 Florida Florida Cultivated BVI
- + + FTG_941068-B 481 Florida Florida Cultivated BVI
- + + FTG_941068-C 482 Florida Florida Cultivated BVI
- + + FTG_941068-E 483 Florida Florida Cultivated BVI
- + + FTG_941068-F 484 Florida Florida Cultivated BVI
- + + FTG_941068-G 485 Florida Florida Cultivated BVI
- + + FTG_941068-H 486 Florida Florida Cultivated BVI
- + + FTG_U-0067-A 487 Florida Florida Cultivated BVI
- + + FTG_VOL1 488 Florida Florida Cultivated BVI
- + + FTG_VOL2 489 Florida Florida Cultivated BVI
- + + FTG_VOL3 490 Florida Florida Cultivated BVI
- + + FTG_VOL4 491 Florida Florida Cultivated BVI
- + + FTG_VOL5 492 Florida Florida Cultivated BVI
- + + FTG_VOL6 493 Florida Florida Cultivated BVI
- + + MAH1022 211 Puerto Rico Guánica nursery Cultivated PR
- + + MAH1023 212 Puerto Rico Guánica nursery Cultivated PR
- + + MAH1026 215 Puerto Rico Guánica nursery Cultivated PR
- + + MAH1027 216 Puerto Rico Guánica nursery Cultivated PR
- + + MAH1028 217 Puerto Rico Guánica nursery Cultivated PR
- + + MAH1029 218 Puerto Rico Guánica nursery Cultivated PR
- + + MAH1030 219 Puerto Rico Guánica nursery Cultivated PR
- + + MAH1031 220 Puerto Rico Guánica nursery Cultivated PR
- + + MAH1032 221 Puerto Rico Guánica nursery Cultivated PR
- + + MAH1033 222 Puerto Rico Guánica nursery Cultivated PR
- + + MAH1034 223 Puerto Rico Guánica nursery Cultivated PR
- + + MAH1035 224 Puerto Rico Guánica nursery Cultivated PR
- + + MAH1036 225 Puerto Rico Guánica nursery Cultivated PR
- + + MAH1037 226 Puerto Rico Guánica nursery Cultivated PR
- + + MAH1038 227 Puerto Rico Guánica nursery Cultivated PR
- + + MAH1039 228 Puerto Rico Guánica nursery Cultivated PR
- + + MAH1040 229 Puerto Rico Guánica nursery Cultivated PR
- + + MAH1041 230 Puerto Rico Guánica nursery Cultivated PR
+ + + MAH918 80 Puerto Rico Guánica Wild N/A
+ + + MAH905 89 Puerto Rico Guánica Wild N/A
+ + + MAH906 90 Puerto Rico Guánica Wild N/A
+ + + MAH907 91 Puerto Rico Guánica Wild N/A

265
A B C Voucher Sample ID Location Population Origin Ex-situ origin
+ + + MAH908 92 Puerto Rico Guánica Wild N/A
+ + + MAH909 93 Puerto Rico Guánica Wild N/A
+ + + MAH910 94 Puerto Rico Guánica Wild N/A
+ + + MAH912 95 Puerto Rico Guánica Wild N/A
+ + + MAH913 96 Puerto Rico Guánica Wild N/A
+ + + MAH914 97 Puerto Rico Guánica Wild N/A
+ + + MAH915 98 Puerto Rico Guánica Wild N/A
+ + + MAH916 99 Puerto Rico Guánica Wild N/A
+ + + MAH917 100 Puerto Rico Guánica Wild N/A
+ + + MAH943 132 Puerto Rico Guánica Wild N/A
+ + + MAH944 133 Puerto Rico Guánica Wild N/A
+ + + MAH945 134 Puerto Rico Guánica Wild N/A
+ + + MAH946 135 Puerto Rico Guánica Wild N/A
+ + + MAH947 136 Puerto Rico Guánica Wild N/A
+ + + MAH951 140 Puerto Rico Guánica Wild N/A
+ + + MAH952 141 Puerto Rico Guánica Wild N/A
+ + + MAH953 142 Puerto Rico Guánica Wild N/A
+ + + MAH954 143 Puerto Rico Guánica Wild N/A
+ + + MAH955 144 Puerto Rico Guánica Wild N/A
+ + + MAH956 145 Puerto Rico Guánica Wild N/A
+ + + MAH957 146 Puerto Rico Guánica Wild N/A
+ + + MAH958 147 Puerto Rico Guánica Wild N/A
+ + + MAH959 148 Puerto Rico Guánica Wild N/A
+ + + MAH960 149 Puerto Rico Guánica Wild N/A
+ + + MAH995 184 Puerto Rico Guánica Wild N/A
+ + + MAH996 185 Puerto Rico Guánica Wild N/A
+ + + MAH997 186 Puerto Rico Guánica Wild N/A
+ + + MAH998 187 Puerto Rico Guánica Wild N/A
+ + + MAH999 188 Puerto Rico Guánica Wild N/A
+ + + MAH1000 189 Puerto Rico Guánica Wild N/A
+ + + MAH1001 190 Puerto Rico Guánica Wild N/A
+ + + MAH1002 191 Puerto Rico Guánica Wild N/A
+ + + MAH1003 192 Puerto Rico Guánica Wild N/A
+ + + MAH1004 193 Puerto Rico Guánica Wild N/A
+ + + MAH1005 194 Puerto Rico Guánica Wild N/A
+ + + MAH1006 195 Puerto Rico Guánica Wild N/A
+ + + MAH1007 196 Puerto Rico Guánica Wild N/A
+ + + MAH1008 197 Puerto Rico Guánica Wild N/A
+ + + MAH1009 198 Puerto Rico Guánica Wild N/A
+ + + MAH1010 199 Puerto Rico Guánica Wild N/A
+ + + MAH1011 200 Puerto Rico Guánica Wild N/A
+ + + MAH1012 201 Puerto Rico Guánica Wild N/A
+ + + MAH1013 202 Puerto Rico Guánica Wild N/A
+ + + MAH1014 203 Puerto Rico Guánica Wild N/A
+ + + MAH1015 204 Puerto Rico Guánica Wild N/A

266
A B C Voucher Sample ID Location Population Origin Ex-situ origin
+ + + MAH1016 205 Puerto Rico Guánica Wild N/A
+ + + MAH1017 206 Puerto Rico Guánica Wild N/A
+ + + MAH1018 207 Puerto Rico Guánica Wild N/A
+ + + MAH1019 208 Puerto Rico Guánica Wild N/A
+ + + MAH1020 209 Puerto Rico Guánica Wild N/A
+ + + MAH1021 210 Puerto Rico Guánica Wild N/A
+ + + MAH1043 232 Puerto Rico Guánica Wild N/A
+ + + MAH1044 233 Puerto Rico Guánica Wild N/A
+ + + MAH1045 234 Puerto Rico Guánica Wild N/A
+ + + MAH1046 235 Puerto Rico Guánica Wild N/A
+ + + MAH1047 236 Puerto Rico Guánica Wild N/A
+ + + MAH1048 237 Puerto Rico Guánica Wild N/A
+ + + MAH1049 238 Puerto Rico Guánica Wild N/A
+ + + MAH1050 239 Puerto Rico Guánica Wild N/A
+ + + MAH1054 243 Puerto Rico Ponce Wild N/A
+ + + MAH1055 244 Puerto Rico Ponce Wild N/A
+ + + MAH1056 245 Puerto Rico Ponce Wild N/A
+ + + MAH1057 246 Puerto Rico Ponce Wild N/A
+ + + MAH1058 247 Puerto Rico Ponce Wild N/A
+ + + MAH1059 248 Puerto Rico Ponce Wild N/A
+ + + MAH1060 249 Puerto Rico Ponce Wild N/A
+ + + MAH1061 250 Puerto Rico Ponce Wild N/A
+ + + MAH1062 251 Puerto Rico Ponce Wild N/A
+ + + MAH1063 252 Puerto Rico Ponce Wild N/A
+ + + MAH1064 253 Puerto Rico Ponce Wild N/A
+ + + MAH1065 254 Puerto Rico Ponce Wild N/A
+ + + MAH1066 255 Puerto Rico Ponce Wild N/A
+ + + MAH1067 256 Puerto Rico Ponce Wild N/A
+ + + MAH1068 257 Puerto Rico Ponce Wild N/A
+ + + MAH1069 258 Puerto Rico Ponce Wild N/A
+ + + MAH1070 259 Puerto Rico Ponce Wild N/A
+ + + MAH1071 260 Puerto Rico Ponce Wild N/A
+ + + MAH1072 261 Puerto Rico Ponce Wild N/A
+ + + MAH1073 262 Puerto Rico Ponce Wild N/A
+ + + MAH1074 263 Puerto Rico Ponce Wild N/A
+ + + MAH1075 264 Puerto Rico Ponce Wild N/A
+ + + MAH1076 265 Puerto Rico Ponce Wild N/A
+ + + MAH1077 266 Puerto Rico Ponce Wild N/A
+ + + MAH1078 267 Puerto Rico Ponce Wild N/A
+ + + MAH1079 268 Puerto Rico Ponce Wild N/A
+ + + MAH1081 270 Puerto Rico Ponce Wild N/A
+ + + MAH1082 271 Puerto Rico Ponce Wild N/A
+ + + MAH1083 272 Puerto Rico Ponce Wild N/A
+ + + MAH1084 273 Puerto Rico Ponce Wild N/A
+ + + MAH1085 274 Puerto Rico Ponce Wild N/A

267
A B C Voucher Sample ID Location Population Origin Ex-situ origin
+ + + MAH1086 275 Puerto Rico Ponce Wild N/A
+ + + MAH1087 276 Puerto Rico Ponce Wild N/A
+ + + MAH1088 277 Puerto Rico Ponce Wild N/A
+ + + MAH1089 278 Puerto Rico Ponce Wild N/A
+ + + MAH1090 279 Puerto Rico Ponce Wild N/A
+ + + MAH1091 280 Puerto Rico Ponce Wild N/A
+ + + MAH1092 281 Puerto Rico Ponce Wild N/A
+ + + MAH1093 282 Puerto Rico Guánica Wild N/A
+ + + MAH1094 283 Puerto Rico Guánica Wild N/A
+ + + MAH1095 284 Puerto Rico Guánica Wild N/A
+ + + MAH1096 285 Puerto Rico Guánica Wild N/A
+ + + MAH1097 286 Puerto Rico Guánica Wild N/A
+ + + MAH1098 287 Puerto Rico Guánica Wild N/A
+ + + MAH1099 288 Puerto Rico Guánica Wild N/A
+ + + MAH1100 289 Puerto Rico Guánica Wild N/A
+ + + MAH1051 299 Puerto Rico Guánica Wild N/A
- + + MAH1118 458 Tortola Tortola Cultivated BVI
- + + MAH1119 459 Tortola Tortola Cultivated BVI
- + + MAH1120 460 Tortola Tortola Cultivated BVI
- + + MAH1121 461 Tortola Tortola Cultivated BVI
- + + MAH1122 462 Tortola Tortola Cultivated BVI
- + + MAH1123 463 Tortola Tortola Cultivated BVI
- + + MAH1124 464 Tortola Tortola Cultivated BVI
- + + MAH1125 465 Tortola Tortola Cultivated BVI
- + + MAH1126 466 Tortola Tortola Cultivated BVI
- + + MAH1127 467 Tortola Tortola Cultivated BVI
- + + MAH1128 468 Tortola Tortola Cultivated BVI
- + + MAH1129 469 Tortola Tortola Cultivated BVI
- + + MAH1130 470 Tortola Tortola Cultivated BVI
- + + MAH1131 471 Tortola Tortola Cultivated BVI
- + + MAH1132 472 Tortola Tortola Cultivated BVI
- + + MAH1133 473 Tortola Tortola Cultivated BVI
- + + MAH1134 474 Tortola Tortola Cultivated BVI
+ + + MAH934 7 Vieques Vieques Wild N/A
+ + + MAH933 8 Vieques Vieques Wild N/A
+ + + MAH932 9 Vieques Vieques Wild N/A
+ + + MAH931 10 Vieques Vieques Wild N/A
+ + + MAH929 12 Vieques Vieques Wild N/A
+ + + MAH930 305 Vieques Vieques Wild N/A
- - + SJ_00248 293 Anegada Anegada West HS N/A
- - + SJ_10111 295 Anegada Anegada West HS N/A
- - + SJ_15176 296 Puerto Rico Puerto Rico HS N/A
- - + SJ_10108 297 Puerto Rico Puerto Rico HS N/A
- - + SJ_10107 298 Puerto Rico Puerto Rico HS N/A
- - + SJ_10109 294 Vieques Vieques HS N/A

268
Appendix 7: Oligonucleotide testing The following table provides the microsatellite (Locus), identifier used in this study (Primer code), size of the PCR
product (PCR Product Size), description of the ability to determine the loci as monomorphic or polymorphic
(Mono/Polymorphic) and description of the interpreted behavior of alleles (Alleles) for primer pairs tested. The
selection of a locus for further investigation is indicated in the column ‘Loci selected’ using plus (+) for selected or
minus (-) for rejected.
Loci Selected? Locus
Primer code
PCR Product Size Mono/Polymorphic Alleles
+ VRgr3_2 P1.2 287 Polymorphic Diploid acting
- VRgr280_2 P3.4 223 Further optimization
required to assess N/A + VRBS43W P5.6 268 Polymorphic Diploid acting - VRgr48_2 P7.8 147 Monomorphic N/A + VRBREYV P9.10 287 Polymorphic Diploid acting
- VRA7EYM P11.12 166 Further optimization
required to assess N/A + VRA7EYM P13.14 221 Polymorphic Polyploid acting + VREDKKW P15.16 188 Polymorphic Polyploid acting - VRCB795 P17.18 141 Monomorphic N/A - VRC39CG P19.20 233 Monomorphic N/A - VRBSY0Y P21.22 234 Monomorphic N/A
- VRE111H P23.24 132 Further optimization
required to assess N/A - VRgr81_4 P25.26 295 Monomorphic N/A - VRgr109_2 P27.28 281 Monomorphic N/A + VRBL3FZ P29.30 203 Polymorphic Diploid acting + VRD2DN4 P31.32 179 Polymorphic Polyploid acting
- VRBC387 P33.34 204 Further optimization
required to assess N/A - VREZDWJ P35.36 206 Monomorphic N/A - VRBBWS9 P37.38 101 Monomorphic N/A
- VRDLD44 P39.40 143 Further optimization
required to assess N/A - VRAZXR2 P41.42 128 Monomorphic N/A - VREQIGY P43.44 251 Monomorphic N/A - VRCG2MT P45.46 258 Monomorphic N/A
- VRDXSVZ P47.48 108 Further optimization
required to assess N/A + VRB5M1O P49.50 223 Polymorphic Diploid acting
- VRCQS1L P51.52 263 Further optimization
required to assess N/A
- VRBFM20 P53.54 113 Further optimization
required to assess N/A + VR_gr271_2 P55.56 230 Polymorphic Diploid acting
- VRB6Q8H P57.58 275 Further optimization
required to assess N/A - VRC4F2A P59.60 247 Monomorphic N/A
- VR_gr103_3 P61.62 204 Further optimization
required to assess N/A

269
Loci Selected? Locus
Primer code
PCR Product Size Mono/Polymorphic Alleles
- VRCM6UB P63.64 258 Further optimization
required to assess N/A
- VRA7LYT P65.66 227 Further optimization
required to assess N/A + VRC00AE P67.68 124 Polymorphic Polyploid acting
- VRDLD44 P69.70 299 Further optimization
required to assess N/A
- VRCR6TK P71.72 279 Further optimization
required to assess N/A
- VR_gr186_2 P73.74 246 Further optimization
required to assess N/A
- VRCG2N5 P75.76 138 Further optimization
required to assess N/A
- VRCXMA7 P77.78 217 Further optimization
required to assess N/A - VR_gr230_3 P79.80 266 Monomorphic N/A + VRA5NLR P81.82 174 Polymorphic Diploid acting + VR_gr27_2 P83.84 256 Polymorphic Polyploid acting + VRE18LG P85.86 158 Polymorphic Diploid acting - VRDJFTL P87.88 224 Monomorphic N/A

270
Appendix 8: Microsatellite loci selections The following table provides results for microsatellite loci selection. The table shows the microsatellite (Locus),
identifier used in this study (Primer code), size of the PCR product (PCR Product Size), description of the
interpreted behavior of alleles (Alleles) per locus and repeat motif (Motif) of each locus. The selection of a locus
for further investigation or rejection due to an inability to interpret the alleles is indicated in the column
‘Selected’ using plus (+) for selected or minus (-) for rejected.
Locus Primer code PCR Product Size Alleles Motif Selected VRgr3_2 P1.2 287 Diploid acting AAC +
VRBS43W P5.6 268 Diploid acting AAT + VRBREYV P9.10 287 Diploid acting ACT + VRA7EYM P13.14 221 Not interpretable AAT - VREDKKW P15.16 188 Not interpretable AAT - VRBL3FZ P29.30 203 Diploid acting AG +
VRD2DN4 P31.32 179 Polyploid acting AC + VRB5M1O P49.50 223 Diploid acting AAT +
VR_gr271_2 P55.56 230 Diploid acting AAC + VRC00AE P67.68 124 Not interpretable AG - VRA5NLR P81.82 174 Diploid acting AAG +
VR_gr27_2 P83.84 256 Polyploid acting AC + VRE18LG P85.86 158 Diploid acting AG +
The following table provides the alleles identified per microsatellite loci selected for genotyping using the
manufacturer’s identification code (Sequence ID). A list of alleles by size is recorded for each locus in the fields
Allele 1, Allele 2, Allele 3, etc...
Locus Allele 1 Allele 2 Allele 3 Allele 4 Allele 5 Allele 6 Allele 7 Allele 8 Allele 9 VRgr3_2 271 274 277 285 288 291 294 297 300
VRBS43W 266 269 272 275 278 281 284 287 291 VRBREYV 274 283 286 289 292 295 298 301 304 VRA7EYM ~ ~ ~ ~ ~ ~ ~ ~ ~ VREDKKW ~ ~ ~ ~ ~ ~ ~ ~ ~ VRBL3FZ 214 216 218 220 222 224 ~ ~ ~
VRD2DN4 188 198 200 202 208 ~ ~ ~ ~ VRB5M1O 212 215 218 221 224 227 230 232 235
VR_gr271_2 256 259 265 268 271 274 277 ~ ~ VRC00AE ~ ~ ~ ~ ~ ~ ~ ~ ~ VRA5NLR 208 211 214 217 220 223 226 ~ ~
VR_gr27_2 288 290 296 300 308 312 322 324 328 VRE18LG 172 174 ~ ~ ~ ~ ~ ~ ~

271
Alleles identified per microsatellite loci selected (continued).
Locus Allele
10 Allele
11 Allele
12 Allele
13 Allele
14 Allele
15 Allele
16 Allele
17 Allele
18 VRgr3_2 303 309 312 315 318 321 324 330 ~
VRBS43W 294 297 300 319 341 344 ~ ~ ~ VRBREYV 307 310 313 316 ~ ~ ~ ~ ~ VRA7EYM ~ ~ ~ ~ ~ ~ ~ ~ ~ VREDKKW ~ ~ ~ ~ ~ ~ ~ ~ ~ VRBL3FZ ~ ~ ~ ~ ~ ~ ~ ~ ~
VRD2DN4 ~ ~ ~ ~ ~ ~ ~ ~ ~ VRB5M1O 238 241 244 247 250 253 256 259 262
VR_gr271_2 ~ ~ ~ ~ ~ ~ ~ ~ ~ VRC00AE ~ ~ ~ ~ ~ ~ ~ ~ ~ VRA5NLR ~ ~ ~ ~ ~ ~ ~ ~ ~
VR_gr27_2 330 ~ ~ ~ ~ ~ ~ ~ ~ VRE18LG ~ ~ ~ ~ ~ ~ ~ ~ ~
Alleles identified per microsatellite loci selected (continued).
Locus Allele 19 Allele 20 Allele 21 Allele 22 Allele 23 Allele 24 Allele 25 VRgr3_2 ~ ~ ~ ~ ~ ~ ~
VRBS43W ~ ~ ~ ~ ~ ~ ~ VRBREYV ~ ~ ~ ~ ~ ~ ~ VRA7EYM ~ ~ ~ ~ ~ ~ ~ VREDKKW ~ ~ ~ ~ ~ ~ ~ VRBL3FZ ~ ~ ~ ~ ~ ~ ~
VRD2DN4 ~ ~ ~ ~ ~ ~ ~ VRB5M1O 268 277 280 286 292 295 298
VR_gr271_2 ~ ~ ~ ~ ~ ~ ~ VRC00AE ~ ~ ~ ~ ~ ~ ~ VRA5NLR ~ ~ ~ ~ ~ ~ ~
VR_gr27_2 ~ ~ ~ ~ ~ ~ ~ VRE18LG ~ ~ ~ ~ ~ ~ ~

272
Appendix 9: Private alleles detected for microsatellite loci Private alleles were detected for ten microsatellite loci using Varronia rupicola analysis group C samples.
Summary data is divided by ‘Country’, ‘Island’ and ‘Population’ for microsatellites (Locus), private alleles (Allele),
and source of the samples (Origin) containing those alleles. Abbreviations: BVI = British Virgin Islands; WILD =
Found in extant wild samples; CULT = Found in extant ex-situ samples; HS = Found in herbarium specimen
samples; "*" = Lost from Puerto Rico, extant in Anegada; "^" = Only found in ex-situ and/or historical material;
"1" = Source population is unknown (likely from Anegada West).
Country Island Population Locus Allele Origin BVI Anegada Anegada West VRgr3_2 297 WILD BVI Anegada Anegada West VRgr3_2 300 WILD & CULT BVI Anegada Anegada East & West VRgr3_2 303 WILD & CULT BVI Anegada Anegada West VRgr3_2 309 WILD & CULT BVI Anegada Anegada West VRgr3_2 312^ CULT & HS BVI Anegada Anegada East & West VRgr3_2 315 WILD & CULT BVI Anegada Anegada East & West VRgr3_2 318 WILD & CULT BVI Anegada Anegada East VRgr3_2 321 WILD BVI Anegada Anegada West VRgr3_2 324 WILD BVI Anegada Anegada West VRBS43W 269 WILD BVI Anegada Anegada East VRBS43W 341 WILD BVI Anegada Anegada East VRBS43W 344 WILD BVI Anegada Anegada East & West VRBREYV 301 WILD BVI Anegada Anegada East & West VRBREYV 310 WILD & CULT BVI Anegada Anegada East & West VRBREYV 313 WILD BVI Anegada Anegada West VRBREYV 316 WILD & CULT BVI Anegada Provenance unknown1 VRBL3FZ 214^ CULT BVI Anegada Anegada East & West VRB5M1O 244 WILD & CULT BVI Anegada Anegada East VRB5M1O 262* WILD BVI Anegada Anegada West VR_gr271_2 265 WILD & CULT BVI Anegada Anegada East VR_gr271_2 277 WILD BVI Anegada Anegada East & West VRA5NLR 217 WILD & CULT BVI Anegada Anegada West VRA5NLR 223 WILD & CULT BVI Anegada Anegada West VRA5NLR 226 WILD & CULT BVI Anegada Anegada West VR_gr27_2 328 WILD & CULT Puerto Rico Puerto Rico Guánica & Ponce VRgr3_2 271 WILD & CULT Puerto Rico Puerto Rico Guánica & Ponce VRgr3_2 274 WILD & CULT Puerto Rico Puerto Rico Guánica VRgr3_2 285 WILD Puerto Rico Puerto Rico Guánica VRgr3_2 330 WILD Puerto Rico Puerto Rico Guánica VRBREYV 274 WILD & CULT Puerto Rico Puerto Rico Guánica & Ponce VRBREYV 286 WILD & CULT Puerto Rico Puerto Rico Guánica & Ponce VRBREYV 295 WILD & CULT Puerto Rico Puerto Rico & Vieques Guánica & Vieques VRB5M1O 212 WILD Puerto Rico Puerto Rico Guánica VRB5M1O 268 WILD Puerto Rico Puerto Rico Ponce VRB5M1O 277 WILD Puerto Rico Puerto Rico Ponce VRB5M1O 280 WILD

273
Country Island Population Locus Allele Origin Puerto Rico Puerto Rico Ponce VRB5M1O 286 WILD Puerto Rico Puerto Rico Ponce VRB5M1O 292 WILD Puerto Rico Puerto Rico Ponce VRB5M1O 295 WILD Puerto Rico Puerto Rico Ponce VRB5M1O 298 WILD Puerto Rico Puerto Rico Ponce VR_gr271_2 259 WILD Puerto Rico Vieques Vieques VRBS43W 266 WILD Puerto Rico Vieques Vieques VRBS43W 319 WILD Puerto Rico Vieques Vieques VRA5NLR 220 WILD Puerto Rico Puerto Rico & Vieques Ponce & Vieques VR_gr271_2 274 WILD Puerto Rico Puerto Rico Ponce VRB5M1O 262* HS

274
Appendix 10: Population assignment tests Results of population assignment tests undertaken in GenAlEx for analysis group A samples using the frequency
method test (Paetkau et al., 1995, 2004). Results reported as log-likelihood values per sample (Sample ID) against
each of five populations for analysis group A samples. The highest value indicates the most likely population and
is the least negative for negative values. Population assignments following cluster analyses using Structure and
Geneland software programmes are recorded under “Initial Population Assignment” per sample. Population
assignment following frequency method test is recorded under “Population Assignment Post-testing” per sample.
Re-assigned samples (n = 3) are highlighted using ‘bold italics’.
Sample ID
Initial Population Assignment
Population log-likelihood values Population Assignment Post-testing
Anegada East
Anegada West Guánica Ponce Vieques
357 Anegada East -5.945 -9.652 -11.497 -12.187 -14.079 Anegada East 358 Anegada East -5.311 -7.820 -7.473 -8.820 -9.362 Anegada East 359 Anegada East -7.555 -12.732 -17.284 -17.354 -22.158 Anegada East 360 Anegada East -6.661 -11.048 -14.749 -15.689 -20.079 Anegada East 361 Anegada East -7.183 -8.509 -16.695 -15.795 -19.903 Anegada East 362 Anegada East -10.236 -14.813 -13.316 -16.112 -19.556 Anegada East 363 Anegada East -6.294 -10.062 -15.150 -13.902 -15.857 Anegada East 364 Anegada East -8.293 -15.657 -12.978 -13.286 -13.334 Anegada East 366 Anegada East -5.122 -10.040 -11.826 -13.371 -10.028 Anegada East 367 Anegada East -5.757 -9.451 -12.508 -12.403 -13.362 Anegada East 368 Anegada East -11.442 -12.410 -12.479 -18.057 -24.459 Anegada East 411 Anegada East -5.914 -9.456 -13.991 -15.170 -14.158 Anegada East 412 Anegada East -6.448 -8.813 -15.447 -14.791 -16.158 Anegada East 413 Anegada East -8.969 -12.199 -14.429 -18.023 -19.653 Anegada East 414 Anegada East -7.307 -12.610 -13.691 -14.474 -12.760 Anegada East 415 Anegada East -6.320 -7.837 -13.887 -14.251 -16.079 Anegada East 416 Anegada East -4.930 -6.014 -10.517 -9.021 -14.459 Anegada East 417 Anegada East -6.408 -7.418 -11.614 -11.205 -14.760 Anegada East 418 Anegada East -8.353 -12.452 -17.897 -16.439 -20.000 Anegada East 419 Anegada East -8.388 -15.060 -18.353 -19.310 -17.778 Anegada East 453 Anegada East -7.176 -11.023 -13.157 -15.231 -13.806 Anegada East 454 Anegada East -7.129 -9.531 -13.835 -14.405 -14.584 Anegada East 455 Anegada East -8.936 -12.384 -14.590 -16.802 -19.556 Anegada East 456 Anegada East -7.655 -12.823 -19.208 -19.491 -22.477 Anegada East 457 Anegada East -7.460 -13.146 -16.267 -17.768 -21.699 Anegada East
5 Anegada West -14.253 -9.582 -16.730 -22.386 -24.176 Anegada West 6 Anegada West -11.646 -8.679 -11.477 -15.204 -24.000 Anegada West
311 Anegada West -13.777 -10.021 -14.245 -14.075 -23.699 Anegada West 312 Anegada West -9.918 -8.408 -16.030 -15.747 -20.760 Anegada West 313 Anegada West -11.941 -8.845 -15.292 -17.633 -19.903 Anegada West 314 Anegada West -11.958 -8.558 -14.841 -15.412 -19.778 Anegada West 315 Anegada West -8.177 -6.015 -11.074 -12.248 -18.079 Anegada West 316 Anegada West -10.162 -5.345 -12.206 -12.705 -15.857 Anegada West 317 Anegada West -7.958 -5.035 -11.614 -10.847 -15.477 Anegada West 318 Anegada West -11.659 -8.150 -12.335 -12.889 -17.556 Anegada West 319 Anegada West -13.015 -7.984 -18.488 -16.448 -19.255 Anegada West 320 Anegada West -9.894 -5.748 -14.723 -14.810 -21.477 Anegada West 321 Anegada West -8.868 -5.611 -12.430 -12.496 -21.778 Anegada West 322 Anegada West -7.650 -6.817 -13.594 -14.115 -19.778 Anegada West 323 Anegada West -10.414 -5.855 -11.509 -13.048 -15.778 Anegada West 324 Anegada West -6.707 -5.792 -15.295 -13.950 -19.778 Anegada West 325 Anegada West -11.600 -8.350 -13.905 -13.120 -19.097 Anegada West

275
Sample ID
Initial Population Assignment
Population log-likelihood values Population Assignment Post-testing
Anegada East
Anegada West Guánica Ponce Vieques
326 Anegada West -10.953 -6.258 -18.966 -15.565 -21.061 Anegada West 327 Anegada West -9.769 -7.917 -13.814 -14.238 -20.574 Anegada West 328 Anegada West -9.146 -7.263 -13.314 -15.335 -17.556 Anegada West 329 Anegada West -10.343 -8.192 -14.848 -15.015 -22.079 Anegada West 330 Anegada West -16.564 -10.266 -15.924 -12.569 -11.113 Anegada West 331 Anegada West -8.924 -5.815 -13.619 -13.241 -19.857 Anegada West 332 Anegada West -13.138 -6.903 -17.072 -17.501 -17.857 Anegada West 333 Anegada West -10.415 -6.099 -13.425 -15.356 -19.556 Anegada West 334 Anegada West -10.534 -6.832 -12.326 -11.305 -17.556 Anegada West 335 Anegada West -8.260 -6.407 -12.373 -12.674 -20.760 Anegada West 336 Anegada West -10.140 -6.486 -14.845 -11.162 -20.158 Anegada West 337 Anegada West -10.461 -9.249 -14.775 -12.890 -21.778 Anegada West 338 Anegada West -10.297 -6.761 -14.648 -12.960 -19.477 Anegada West 339 Anegada West -8.936 -6.780 -14.939 -10.238 -18.158 Anegada West 340 Anegada West -11.577 -9.001 -20.771 -19.639 -22.158 Anegada West 341 Anegada West -8.434 -6.580 -15.420 -15.765 -21.778 Anegada West 342 Anegada West -12.498 -9.506 -15.116 -15.217 -21.875 Anegada West 343 Anegada West -10.687 -6.374 -14.145 -13.687 -14.681 Anegada West 344 Anegada West -9.250 -6.823 -13.726 -11.574 -17.255 Anegada West 345 Anegada West -9.708 -6.817 -12.383 -9.542 -14.158 Anegada West 346 Anegada West -10.499 -5.454 -13.205 -14.029 -16.158 Anegada West 347 Anegada West -11.673 -6.375 -13.954 -9.516 -20.158 Anegada West 348 Anegada West -10.024 -6.095 -15.360 -17.063 -21.176 Anegada West 349 Anegada West -10.866 -7.084 -10.908 -9.903 -16.158 Anegada West 350 Anegada West -14.315 -8.406 -15.275 -16.119 -17.857 Anegada West 351 Anegada West -10.611 -8.090 -15.623 -13.593 -19.556 Anegada West 352 Anegada West -10.655 -6.348 -16.141 -17.598 -22.079 Anegada West 354 Anegada West -11.382 -7.392 -14.955 -17.780 -22.380 Anegada West 356 Anegada West -16.014 -10.745 -19.949 -22.367 -22.033 Anegada West 369 Anegada West -11.636 -8.975 -16.025 -10.607 -24.158 Anegada West 370 Anegada West -8.561 -7.590 -12.795 -15.215 -20.760 Anegada West 371 Anegada West -12.893 -11.079 -17.362 -19.632 -22.875 Anegada West 372 Anegada West -13.639 -9.386 -13.246 -13.696 -21.398 Anegada West 373 Anegada West -10.894 -6.204 -8.293 -6.705 -20.301 Anegada West 374 Anegada West -9.780 -6.407 -7.755 -7.239 -16.760 Anegada West 375 Anegada West -12.620 -9.988 -12.137 -13.646 -17.778 Anegada West 377 Anegada West -9.884 -7.654 -12.456 -10.817 -19.398 Anegada West 378 Anegada West -13.743 -10.508 -15.857 -10.457 -20.602 Ponce 379 Anegada West -8.234 -5.765 -10.910 -8.655 -19.778 Anegada West 380 Anegada West -8.896 -8.052 -16.200 -15.629 -17.857 Anegada West 381 Anegada West -9.971 -7.610 -16.653 -15.645 -19.857 Anegada West 382 Anegada West -18.008 -9.602 -15.971 -17.432 -25.699 Anegada West 383 Anegada West -12.853 -7.432 -15.052 -14.602 -19.255 Anegada West 384 Anegada West -10.744 -7.393 -12.071 -11.477 -17.255 Anegada West 385 Anegada West -11.155 -10.027 -13.769 -16.117 -21.477 Anegada West 386 Anegada West -10.980 -10.626 -15.647 -20.008 -23.857 Anegada West 387 Anegada West -14.104 -11.935 -13.222 -13.834 -20.574 Anegada West 388 Anegada West -14.798 -10.467 -18.274 -14.850 -21.699 Anegada West 389 Anegada West -13.845 -10.535 -15.883 -15.936 -25.097 Anegada West 390 Anegada West -14.284 -8.329 -15.234 -13.845 -24.796 Anegada West 392 Anegada West -15.179 -10.082 -16.411 -18.193 -22.796 Anegada West 393 Anegada West -16.630 -12.091 -19.204 -18.272 -25.778 Anegada West 395 Anegada West -11.754 -8.314 -14.212 -15.891 -24.301 Anegada West

276
Sample ID
Initial Population Assignment
Population log-likelihood values Population Assignment Post-testing
Anegada East
Anegada West Guánica Ponce Vieques
396 Anegada West -9.116 -5.919 -9.542 -9.698 -17.699 Anegada West 397 Anegada West -9.272 -9.088 -17.732 -17.728 -19.857 Anegada West 398 Anegada West -16.707 -14.148 -18.268 -16.045 -21.352 Anegada West 399 Anegada West -11.832 -10.092 -16.926 -16.793 -16.760 Anegada West 400 Anegada West -10.112 -7.584 -19.784 -15.450 -24.459 Anegada West 401 Anegada West -12.392 -8.878 -17.081 -14.943 -23.477 Anegada West 402 Anegada West -11.110 -9.483 -15.465 -15.046 -20.574 Anegada West 403 Anegada West -12.532 -10.942 -17.111 -18.225 -24.158 Anegada West 404 Anegada West -14.685 -6.919 -14.995 -15.930 -23.699 Anegada West 405 Anegada West -8.990 -7.607 -18.105 -17.608 -25.778 Anegada West 406 Anegada West -13.260 -8.466 -13.402 -12.938 -25.398 Anegada West 407 Anegada West -14.389 -7.262 -15.217 -15.658 -22.380 Anegada West 408 Anegada West -11.968 -7.846 -13.545 -14.055 -17.857 Anegada West 409 Anegada West -12.004 -7.781 -10.331 -13.474 -23.699 Anegada West 410 Anegada West -13.305 -7.791 -16.211 -16.146 -24.301 Anegada West 420 Anegada West -12.584 -6.072 -11.459 -9.238 -18.380 Anegada West 421 Anegada West -13.417 -6.643 -11.860 -10.198 -20.602 Anegada West 422 Anegada West -13.938 -6.905 -15.626 -16.275 -21.699 Anegada West 423 Anegada West -8.848 -6.482 -12.260 -13.697 -20.574 Anegada West 424 Anegada West -7.018 -5.747 -7.070 -8.301 -13.778 Anegada West 425 Anegada West -6.582 -5.659 -14.135 -12.299 -20.079 Anegada West 426 Anegada West -13.704 -7.024 -10.448 -15.045 -18.079 Anegada West 427 Anegada West -10.646 -6.455 -15.056 -12.247 -21.176 Anegada West 428 Anegada West -10.100 -5.969 -14.672 -11.077 -20.158 Anegada West 429 Anegada West -10.446 -6.078 -12.925 -12.887 -13.954 Anegada West 430 Anegada West -6.565 -4.697 -9.042 -7.241 -16.459 Anegada West 431 Anegada West -10.547 -7.882 -13.092 -13.012 -19.523 Anegada West 432 Anegada West -8.740 -6.947 -8.725 -9.319 -11.556 Anegada West 433 Anegada West -12.705 -8.495 -16.683 -15.440 -19.857 Anegada West 434 Anegada West -8.362 -6.770 -14.292 -13.927 -18.033 Anegada West 435 Anegada West -8.629 -6.074 -15.752 -13.960 -18.158 Anegada West 436 Anegada West -8.404 -5.648 -11.676 -12.819 -19.176 Anegada West 437 Anegada West -13.162 -7.459 -14.364 -14.324 -20.158 Anegada West 438 Anegada West -7.299 -5.521 -11.175 -12.554 -14.158 Anegada West 439 Anegada West -13.389 -10.337 -16.349 -19.111 -17.255 Anegada West 440 Anegada West -11.264 -7.021 -16.921 -12.295 -20.158 Anegada West 441 Anegada West -11.753 -8.451 -11.504 -13.640 -21.398 Anegada West 442 Anegada West -13.793 -8.509 -15.616 -15.228 -22.000 Anegada West 443 Anegada West -8.280 -7.043 -15.107 -16.714 -18.079 Anegada West 444 Anegada West -9.344 -6.790 -10.372 -6.296 -12.459 Ponce 445 Anegada West -12.099 -6.909 -15.084 -13.506 -20.760 Anegada West 446 Anegada West -11.582 -6.565 -13.079 -11.224 -19.778 Anegada West 447 Anegada West -9.010 -11.020 -9.394 -10.534 -13.010 Anegada East 448 Anegada West -9.794 -8.330 -15.025 -14.762 -20.334 Anegada West 449 Anegada West -12.193 -8.929 -16.178 -13.493 -23.255 Anegada West 450 Anegada West -9.246 -7.189 -17.041 -12.640 -20.875 Anegada West 451 Anegada West -12.054 -9.859 -15.087 -15.725 -22.875 Anegada West 452 Anegada West -8.146 -7.910 -11.719 -12.744 -17.556 Anegada West 530 Anegada West -13.521 -8.675 -14.241 -13.691 -24.000 Anegada West 80 Guánica -13.675 -13.336 -10.248 -14.690 -19.380 Guánica 89 Guánica -13.907 -16.883 -6.666 -12.903 -17.937 Guánica 90 Guánica -14.204 -11.528 -8.430 -8.494 -19.903 Guánica 91 Guánica -14.037 -14.244 -6.467 -10.351 -22.000 Guánica

277
Sample ID
Initial Population Assignment
Population log-likelihood values Population Assignment Post-testing
Anegada East
Anegada West Guánica Ponce Vieques
92 Guánica -14.400 -18.741 -5.807 -14.594 -17.044 Guánica 93 Guánica -16.722 -16.741 -8.541 -13.776 -23.699 Guánica 94 Guánica -12.663 -13.896 -5.498 -13.782 -17.727 Guánica 95 Guánica -11.565 -16.935 -5.526 -12.590 -11.771 Guánica 96 Guánica -14.097 -16.881 -5.055 -14.338 -20.551 Guánica 97 Guánica -12.026 -14.289 -5.833 -12.734 -17.949 Guánica 98 Guánica -9.034 -11.295 -6.523 -12.051 -14.584 Guánica 99 Guánica -17.536 -18.725 -6.591 -13.182 -21.505 Guánica
100 Guánica -13.782 -14.564 -7.530 -11.570 -18.255 Guánica 132 Guánica -16.010 -15.450 -7.285 -7.317 -22.982 Guánica 133 Guánica -12.541 -16.540 -7.378 -13.507 -19.061 Guánica 134 Guánica -12.460 -11.229 -7.733 -12.936 -19.857 Guánica 135 Guánica -11.991 -11.992 -6.824 -9.608 -17.556 Guánica 136 Guánica -11.830 -14.893 -5.085 -9.392 -15.061 Guánica 140 Guánica -11.830 -13.939 -5.200 -9.994 -16.283 Guánica 141 Guánica -14.563 -16.793 -6.701 -12.881 -20.857 Guánica 142 Guánica -11.529 -13.551 -5.453 -9.091 -15.982 Guánica 143 Guánica -11.796 -12.908 -5.309 -8.254 -16.505 Guánica 144 Guánica -12.061 -14.048 -4.801 -10.356 -17.602 Guánica 145 Guánica -13.730 -14.957 -6.107 -10.224 -16.125 Guánica 146 Guánica -13.392 -15.409 -5.158 -11.419 -16.329 Guánica 147 Guánica -13.392 -15.409 -5.158 -11.419 -16.329 Guánica 148 Guánica -11.888 -13.585 -6.310 -7.911 -16.635 Guánica 149 Guánica -14.841 -17.333 -5.771 -12.335 -20.459 Guánica 184 Guánica -14.736 -13.795 -8.074 -10.532 -24.903 Guánica 185 Guánica -11.675 -10.966 -7.264 -9.943 -19.176 Guánica 186 Guánica -9.886 -12.171 -9.811 -16.489 -17.061 Guánica 187 Guánica -12.327 -14.310 -5.794 -9.196 -17.204 Guánica 188 Guánica -11.301 -13.692 -6.004 -10.370 -17.158 Guánica 189 Guánica -13.239 -12.586 -6.380 -8.941 -18.158 Guánica 190 Guánica -13.709 -12.733 -7.677 -12.642 -20.857 Guánica 191 Guánica -12.010 -13.364 -6.450 -11.161 -17.903 Guánica 192 Guánica -13.877 -13.800 -6.252 -11.535 -19.857 Guánica 193 Guánica -11.469 -13.881 -4.958 -12.235 -16.283 Guánica 194 Guánica -12.034 -14.439 -5.316 -12.380 -17.982 Guánica 195 Guánica -11.673 -14.042 -7.138 -13.290 -18.158 Guánica 196 Guánica -11.469 -13.159 -7.120 -7.848 -16.937 Guánica 197 Guánica -10.857 -13.446 -4.744 -11.714 -15.727 Guánica 198 Guánica -12.372 -14.341 -5.564 -11.271 -16.635 Guánica 199 Guánica -12.372 -14.341 -5.564 -11.271 -16.635 Guánica 200 Guánica -11.592 -13.972 -5.556 -14.487 -19.824 Guánica 201 Guánica -7.611 -9.986 -7.342 -9.884 -12.238 Guánica 202 Guánica -17.746 -19.271 -5.815 -14.284 -23.061 Guánica 203 Guánica -13.053 -15.480 -7.378 -12.269 -18.477 Guánica 204 Guánica -12.071 -12.785 -5.609 -10.743 -17.539 Guánica 205 Guánica -13.744 -15.811 -7.416 -13.032 -20.158 Guánica 206 Guánica -13.443 -16.201 -7.621 -13.974 -20.760 Guánica 207 Guánica -16.683 -17.390 -5.483 -11.791 -19.840 Guánica 208 Guánica -11.469 -13.343 -6.492 -12.980 -16.937 Guánica 209 Guánica -8.877 -13.835 -5.070 -11.113 -12.919 Guánica 210 Guánica -11.097 -13.092 -6.678 -9.982 -18.556 Guánica 232 Guánica -14.604 -13.121 -10.400 -10.486 -21.556 Guánica 233 Guánica -10.505 -12.173 -7.277 -11.871 -15.982 Guánica

278
Sample ID
Initial Population Assignment
Population log-likelihood values Population Assignment Post-testing
Anegada East
Anegada West Guánica Ponce Vieques
234 Guánica -12.578 -15.569 -7.431 -14.223 -13.311 Guánica 235 Guánica -15.657 -15.157 -7.193 -15.613 -22.602 Guánica 236 Guánica -14.740 -13.499 -6.074 -13.916 -20.903 Guánica 237 Guánica -14.831 -12.665 -7.209 -12.755 -18.903 Guánica 238 Guánica -15.657 -15.157 -7.193 -15.613 -22.602 Guánica 239 Guánica -15.657 -15.157 -7.193 -15.613 -22.602 Guánica 282 Guánica -16.843 -17.488 -7.716 -14.278 -23.681 Guánica 283 Guánica -15.366 -18.603 -8.180 -17.647 -22.079 Guánica 284 Guánica -14.877 -13.891 -9.334 -10.875 -21.061 Guánica 285 Guánica -13.833 -12.221 -5.420 -10.310 -20.602 Guánica 286 Guánica -14.369 -15.308 -9.277 -11.099 -21.954 Guánica 287 Guánica -16.122 -15.059 -10.729 -15.586 -23.824 Guánica 288 Guánica -14.505 -15.897 -5.507 -12.030 -18.681 Guánica 289 Guánica -15.037 -16.800 -5.778 -12.326 -21.454 Guánica 299 Guánica -16.878 -15.513 -14.033 -15.478 -21.255 Guánica 243 Ponce -11.991 -10.236 -8.970 -3.758 -16.760 Ponce 244 Ponce -14.572 -14.761 -10.153 -6.987 -18.477 Ponce 245 Ponce -11.523 -10.093 -7.758 -5.358 -18.079 Ponce 246 Ponce -14.532 -11.545 -10.533 -4.139 -19.380 Ponce 247 Ponce -13.292 -13.374 -10.042 -6.295 -18.158 Ponce 248 Ponce -12.699 -11.611 -7.172 -4.676 -18.079 Ponce 249 Ponce -14.000 -11.276 -10.433 -3.481 -17.459 Ponce 250 Ponce -17.031 -15.654 -9.333 -5.582 -19.079 Ponce 251 Ponce -15.833 -13.451 -13.930 -3.914 -19.556 Ponce 252 Ponce -16.435 -15.242 -12.737 -4.425 -19.556 Ponce 253 Ponce -17.037 -16.900 -12.304 -4.766 -19.556 Ponce 254 Ponce -16.736 -15.934 -14.789 -4.927 -21.255 Ponce 255 Ponce -15.833 -13.854 -12.103 -4.993 -19.255 Ponce 256 Ponce -16.134 -13.228 -13.240 -3.843 -18.459 Ponce 257 Ponce -14.134 -12.065 -10.159 -6.003 -20.477 Ponce 258 Ponce -14.806 -13.309 -9.095 -4.991 -18.857 Ponce 259 Ponce -12.372 -11.655 -8.922 -4.924 -17.857 Ponce 260 Ponce -15.871 -13.782 -8.722 -6.825 -18.459 Ponce 261 Ponce -15.204 -14.840 -8.176 -5.580 -16.238 Ponce 262 Ponce -18.332 -16.183 -10.851 -6.660 -19.255 Ponce 263 Ponce -12.196 -12.471 -9.182 -5.587 -18.158 Ponce 264 Ponce -14.657 -12.807 -12.975 -5.779 -18.556 Ponce 265 Ponce -11.228 -11.883 -8.258 -7.083 -15.238 Ponce 266 Ponce -14.134 -11.814 -9.249 -4.256 -19.079 Ponce 267 Ponce -14.099 -13.355 -8.621 -5.238 -18.760 Ponce 268 Ponce -15.178 -13.619 -9.447 -5.861 -20.760 Ponce 270 Ponce -11.866 -10.170 -9.404 -6.290 -20.158 Ponce 271 Ponce -12.469 -12.142 -10.822 -7.185 -18.459 Ponce 272 Ponce -12.469 -9.483 -9.337 -4.631 -20.459 Ponce 273 Ponce -12.928 -8.942 -9.456 -4.635 -20.158 Ponce 274 Ponce -14.065 -11.672 -10.174 -6.522 -18.937 Ponce 275 Ponce -12.469 -9.483 -9.337 -4.631 -20.459 Ponce 276 Ponce -13.731 -13.606 -8.415 -6.060 -19.238 Ponce 277 Ponce -14.275 -13.311 -8.644 -6.181 -18.158 Ponce 278 Ponce -17.037 -15.667 -13.225 -7.683 -20.602 Ponce 279 Ponce -14.736 -12.937 -10.233 -5.899 -20.903 Ponce 280 Ponce -12.469 -11.727 -8.565 -4.877 -16.459 Ponce 281 Ponce -17.552 -17.853 -15.499 -10.803 -17.988 Ponce

279
Sample ID
Initial Population Assignment
Population log-likelihood values Population Assignment Post-testing
Anegada East
Anegada West Guánica Ponce Vieques
7 Vieques -19.244 -19.708 -21.062 -19.254 -4.396 Vieques 8 Vieques -16.536 -17.699 -16.656 -18.922 -2.317 Vieques 9 Vieques -19.661 -20.956 -20.232 -18.295 -5.225 Vieques
10 Vieques -13.526 -17.017 -16.656 -18.922 -1.965 Vieques 12 Vieques -13.253 -15.484 -14.665 -17.028 -2.141 Vieques
305 Vieques -12.049 -15.444 -14.966 -17.329 -2.266 Vieques