Effects - CORE
226
Effects of sublethal nitrite concentrations on the metabolism of the sea bass, Lates calcarifer. by Chiu Shui-fan B.Sc. (C.U.H.K.) Thesis submitted as partial fulfilment of the requirement for the degree of Master of Philosophy July, 1989 Division of Biology Graduate School The Chinese University of Hong Kong
-
Upload
khangminh22 -
Category
Documents
-
view
0 -
download
0
Transcript of Effects - CORE

Effects of sublethal nitrite concentrations on
the metabolism of the sea bass, Lates calcarifer.
by
Chiu Shui-fan B.Sc. (C.U.H.K.)
Thesis submitted as partial fulfilment
of the requirement for the degree of
Master of Philosophy
July, 1989
Division of Biology
Graduate School
The Chinese University of Hong Kong


1ABSTRACT
Chances In metabolism of an euryhaline teleost, Lates
calca1iler, in response to ambient nitrite exposure were studied.
Tcu.Le Loxi.city tests revealed that the 96 hour median lethal
conceiitraLions of ni trit.e for Lates calcarifer in fresh water, 15 °/00
sea water and 32 °/0o sea water were 14.5 mgl-1 NO2-N, 104 mgl-1 N02-N
and 93 mgl-1 N02-N respectively. Nitrite, at relatively low
concenLraL.ions, was shown to severely repress the growth of L.
calcarifer in 32 0/00sea water.
Exposure to nitrite-containing sea water resulted in
an elevation of blood nitrite which was accompanied by pronounced
methemoglobinemia. A decrease in total hemoglobin content was also
observed.
The blood of Lates calcarifer has a hyperbolic oxygen
dissociation curve and a moderately low oxygen affinity. The oxygen
dissociation curve of nitrite-treated fish shifts to the left,
indicating an increased blood oxygen affinity. Moreover, nitrite-
treated fish demonstrated a lowered arterial and venous blood oxygen
tension, arterial, and venous oxygen content, and blood oxygen
capacity. On the other hand, the erythrocytes of L. calcarifer was
found to possess the enzyme N11DII-methemoglobin reductase which can
convert methemoglobin back to hemoglobin. However, acute or prolonged
nitrite exposure did not induce any change in its activity.
Exposure to a nitrite concentration of 10 mgl-1 N0-N for 8

11
days induced an elevation in serum sodium, serum potassium, and serum
ammonia concentrations, and a decrease in serum lipid content.
However, the tissue Composition of liver, muscle, and brain was not
affected. Hypoxic symptoms including lactate accumulation and
glycogen depletion were observed upon exposure to nitrite at
concentrations of or higher than 30 mgl-1 N02-N.
Acute exposure to 50 mgl-1 N02- N resulted in a marked
decrease in liver ATP, ADP and AMP contents. Activities of branchial
Na+-K+-ATPase, hepatic glycogen phosphorylase, glutamate-oxaloacetate
trausaminase and glutamate dehydrogerrase were also decreased. In
nitrite-treated fish, there is evidence for enhanced ammonia
production probably via the purine nucleotide cycle. Considerable
amount of urea was also generated probably through uricolysis.
The results obtained in the present study hopefully can
contribute to mariculture and the understanding of the mechanisms of
nitrite toxicity in fish.

ACKNOWLEDGEMENTS
I would like to thank Dr. Norman Y. S. Woo, for initiating me
into the basic principles of scientific research and giving me
painstaking instruction and generous guidance. My gratitude is also
extended to Dr. K. II. Chu and Dr. C. K. Wong for their enthusiastic
support.
I would like to express my gratitude to Dr. Erika
Plisetskaya of the Department of Zoology, University of Washington,
Seattle, U. S. A. for her willingness to act as an External Examiner
in the thesis committee.
I am indebted to the staff of the Marine Science Laboratory,
The Chinese University of Hong Kong, for their help and support during
the entire course of this study. Particular thanks are extended to
Mr. W. K. Chu, Mr. K. C. Chung and Mr Y. C. Tarn for their help in the
purchase and keeping of the fish in the laboratory; to Mr. K. C. Au
for his precious opinions on the treatment and prevention of fish
disease and to Mr. M. K. Cheung for his technical help in the setting
up of a filter system for fish rearing. I would also like to thank
Mr. K. Ngan for his daily assistance in the Marine Science Laboratory.

TABLE OF CONTENTS
ACKNOWLEDGEMENTS
CHAPTER ONE GENERAL INTRODUCTION
CHAPTER TWO LITERATURE REVIEW
2.1 Introduction
2.2 Accumlation of uitrile in natural water sysioms
2.3 Nitrite uptake
2.3.1 chlofide cells
2.3.2. Nitrite uplake in freshwater fish
2.3.3. Nitrite uptake in scewater fish
2.4 Responses induced by nitrite toxicity in fish
3.4.1 Hematoloqical responses
2.4.1.1 Changes in methemoglobin content
2.4.1.2 Changes in lotal hemoglobin content
erythrocyte count and hematocrit
2.4.2. Biocchemical responses
2.4.2.1. Changes in piasnia or serum ion
Concentration
2.4.2.2. changes in blood and tissue
metabolite contents
2.4.2.3. Alteratious in mitochondrial
function
2.4.2.4 alterations in lysosomal function
2.4.2.5. changes in enzyme activities
2.4.3. Ultrastructural responses
2.4 .11 . Respiratory responses
2.4-5. Other responses
iv
iii
1
4
7
10
11
15
1
17
22
25
25
27
28
30
32
37

2.4.5.1. Growth suppression
2.4.5.2. Temperature tolerance
2.4.5.3. Swimming performance
,21 .5 . Toxicity mechanisms
2.6. Symptoms of nitrite toxicity
2.7. Factors of feccting the toxicity of nitrite
2.7.1. Biological factors
2.7.1.1. Fish size
2.7.1.2. Species-specific tolerance
2.7.2. Environmental factors
2.7.2.1. Chloride
2.7.2.2. Other anions
2.7.2.3. Cations
2.7.2.4. pH
2.7.2.5. Temperature
2.7.2.6. Oxygen
2.8. Treatment and prevention of nitrite toxicity
Ch AATER rI'IIREE DETERMINATION OF THE 96 HOUR MEDIAN LETHAL
CONCENTRATIONS OF NITRITE FOR LATE" CALCARIFER
IN FRESH WATER, 15 % SEA WATER AND 32%
SEA WATER
3.1. Summary
3.2. Introduction
3.3. Materials and Methods
3.3.1. Experimental animals
3.3.2. Determination of the 96 hour median lethal
concentrations
v
39
39
40
43
48
49
51
57
59
62
64
67
69
70
71
72
77
77

3.4. Results
3.5. Discussion
CHAPTER FOUR EFFECTS OF NITRITE ON THE SHORT-TERM GROWTH
OF LATES CALCARIFER
4.1. Summary
4.2. Introduction
4.3. Materials and Methods
4.3.1. Experimental animals
4.3.2. Determination of growth rate
4.4. Results
4.5. Discussion
CIIAPTER FIVE, CHANGES IN HEMATOLOGICAL PARAMETERS AND BLOOD
RESPIRATORY PROPERTIES OF LATES CALCARIFER IN
RESPONSE TO ACUTE AND PROLONGED NITRITE EXPOSUF
5.1. Summary
5.2. Introduction
5.3. Materials and Methods
5.3.1. Experimental animals
5.3.2. lematological and blood respiratory responses
5.3.3. Statistical analyses
5.4. Results
5.4.1. Changes in hematological parameters in response
to prolonged nitrite exposure
5.4.2. Changes in hematological parameters and venous
blood oxygen tension in response to acute
exposure of various nitrite concentrations
5.4.3. Changes in blood respiratory properties in
response to acute nitrite exposure
vi
79
86
88
89
91
91
93
96
98
100
102
102
106
107
108
109

5.5. Discussion
5.5.1.Changes in hematological parameters in response
to prolonged nitrite exposure
5.5.1.1. Fish mortality
5.5.1.2. Methemoglobin formation and total hemoglobin
reduction
5.5.2. Changes in hematological parameters and venous
blood oxygen tension in response to acute
exposure of various nitrite concentrations
5.5.2.1. Methemoglobin formation and total hemoglobin
reduction
5.5.2.2. Venous blood oxygen tension
5.5.3. Changes in blood respiratory properties in response
to acute nitrite exposure
5.5.3.1. Blood oxygen dissociation curve
5.5.3.2. Blood oxygen tension and oxygen content
5.5.3.3. Venous blood pll
CHAPTER SIX METABOLIC CHANGES OF LATES CALCARIFER IN RESPONSE TO
ACUTE AND PROLONGED NITRITE EXPOSURE
6.1. Summary
6.2. Introduction
6.3. Materials and Methods
6.3.1. Experimental animals
6.3.2. Experimental protocols
6.3.3. Chemical, and biochemical analyses
6.3.3.1. Metabolite and electrolyte contents
6.3.3.2. Branchial Na+-K+-ATPase acitivity
6.3.3.3. Hepatic enzyme activities
6.3.3.4. Blood NADII-methemoglobin reductase activity
vii
119
120
124
127
128
131
132
134
136
138
138
141
141
143
143
144

8
6 . 3 . 3 . 5 . W ater ammoniacontent1 4 5
6 . 3 . 4 . S tatistical analyses 1 4 5
6 . 4 . R esults
6 . 4 . 1 . C hangesin metabolitecontentin responseto 1 4 6
prolonged nitrite exposure
6 . 4 . 2 . C hangesin metabolitecontentin responseto 1 4 6
acute expoure of various nitrite concentrations
6 . 4 . 3 . C hangesin branchialN a ' 4 - - K 4 - - Y r P ase activity, 1 4 7
hepatic enzyme activities , and liver adenine
nucleotide levels in response to acute nitrite
exposure
6 . 4 . 4 . C hangesin ammoniaexcretionrate in responseto 1 4 8
acute nitrite exposure
6 . 4 . 5 . C hangesin W ood NADH- methemoglobinreducL ase 1 4 8
activity in response to acute and prolonged
nitrite exposure
6 . 5 . D iscussion
6 . 5 . 1 . S erum sodium and potassiumaccumulation1 5 8
6 . 5 . 2 . G lycogendepletionand lactate accumulation1 6 1
1 6 46 . 5 . 3 . S erum lipid and proteitldepletion
1 6 46 . 5 . 4 . S erum ammoniaand urea accumulation
1 6 86 . 5 . 5 . C hangesin hepaticenzymeactivitiesand
adenine nucleotide levels
6 . 5 . 6 . C hangesin NADII - methemoglobinreductaseacitivity1 7 5
1 7 86 . 5 . 7 . C onclusion
1 8 0CHAPTER SEVEN GENERAL CONCLUSION
1 8 6REFERENCES

Table 2.1. Names of fish species mentioned in the text and tables
Scientific Name Common Name
Anguilla anguilla
Brachydanio rerio
Brycon cf. melanopterum
Carpiodes cyprinus
Catostomus commersoni
Channa maculata (Ophiocephalus maculatus)
Chanos chanos
Clarias lazera
Clarias mossambicus
Cottus bairdi
Culaea inconstans
Cyprinus caprio
Dicentrarchus labrax
Kpinephalus akaara
Eptatretus stoutii
Gadus morhua
Gambusia affinis
Ictalurus pielas
Ictalurus punctatus
Laqodon rhomboides
Lates albertianus
Lates calcarifer
Lepomis macrochirus
Hicropterus salmoides
My1io macrocephalus
Oncorhynchus qorbuscha
Qncorhynchus kisutch
Oncorhynchus tschawytscha
Opsanus tau
European eel
Zebrafish
Quillback
White sucker
Snakehead
Milkfish
Mottled sculpin
Brook stickleback
Common carp
Red grouper
Hagfish
Atlantic cod
Mosquitofish
Black bullhead
Channel catfish
Pinfish
Sea bass
Bluegill
Largemouth bass
Black sea bream
Pink salmo
Coho salmo
Chinook salmon

10Table 2.1.-- continued
Scientifir Namp Cnmmnn Nmmp
Fercina caprodes Logperch.
Plioxinus laevis European minnow
Pimephales promelas Fathead minnow
Poecilia reticulata Guppy
Protopterus aethiopicus African lungfish
Salmo clarki Cutthroat trout
Rainbow (Steelhead) troutSalmo gairdneri
Salmo salar Atlantic salmo
Semaprochilodus insignis
Semotilus atromaculatus Creek chub
Tautogolabrus adspersus Cunner
Blue tilapiaTlapia aurea
Tilapia esculenta
Tilapia zilli

11
Table 2.2. Different units for nitrite
concentration and their equivalence
Units: 1. parts per million (ppm)
2. milligram per litre (mgl-1)
3. millimolar (mM)
lneir equivalence:
CHAPTER ONE GENERAL INTRODUCTION

1GENERAL INTRODUCTION
Nitrite is an intermediate product of nitrification in which
ammonia is converted to nitrate. It is not considered as a severe
environmental pollutant because of its trace amounts in most natural
water systems and rapid oxidation to nontoxic nitrate under aerobic
cotlditions. However, under some special circumstances such as water-
reuse system and intensive fish culture, the nitrite concentration in
the water may rise to a level which is toxic to aquatic animals.
i ccumulaL] on of Ill cri Le is one oI Lne most cri Llcal. proUlerE
frequently encountered by fish culturists employing water-reus
been used to reduce the concentration of ammonia, the primary
nitrogenous excretory product of fish, as well as to control the
environmental factors such as pIi, temperature and dissolved oxygen.
The nitrite level may increase significantly due to imbalances in the
relative abundances of the nitrifying bacteria Nitrosomonas and
Nitrobacter, posing serious hazard to fish growth and survival. The
increasing need to develop intensive fish culture coupled with
restricted availability of unpolluted water supplies have led to a
growing interest in employing closed water-reuse systems for fish
culture in many countries, the study of nitrite toxicity*to fish thus
becomes a relevant topic in the field of aquacultural sciences.
Nitrite toxicity has been studied in several fish species
systems to culture fish. Various types of biological filters have

2(eq. Smith and Williams, 1974 Russo and Thurston, 1977 Palachek
and Tomasso, 1984b Ililmy et al., 1987) and tetrapod larvae (eg. Iluey
and Beitinger, 1980a, b). Lethal levels expressed as 96 hour median
lethal concentrations (96 hr LC50s) for fishes range from 0.27 mgt-1
N02-N for rainbow trout (Russo et al., 1974) to 140 mgl-1 N02-N for
largemouth bass (Palachek and Tomasso, 1984b) and these values are
reported to be highly dependent upon water chemistry.
One major toxic effect of nitrite is the oxidation of
hemoglobin to methemoglobin, a derivative incapable of binding oxygen
(Bodansky, 1951). Unfortunately, the physiological and hematological
factors associated with this response are poorly understood. Until
present, no evidence has pointed methemoglobinemia as a direct cause
of death in nitrite-exposed fish. Some proposed that mortality in
nitrite-exposed. channel catfish was due to tissue anoxia induced by
methemoglobin (Iluey et al., 1980) while others concluded that death in
i:ainbow trout resulted from the toxic action of nitrite upon vital
organs and not methemoglobinemia per se (Smith and Williams, 1974).
Therefore, it is necessary to study more extensively the
biochemical, physiological and hematological parameters of nitrite-
exposed fish in order to deduce the real cause of death.
At present, the amount of published information on nitrite
toxicity to fish is limited, and much of the available data is derived
from tests on freshwater species such as rainbow trout and channel
catfish. The information on nitrite toxicity to marine or euryhaline

3fish remains sparse.
Re,,(ar ch on the importance of the effect of water Chemistry-
on nitrite Loxicity has received increasing attent:i.on over the past
few years. Increases in p11, chloride concentration, salinity and
hardness have been shown to decrease nitrite toxicity in- various
freslrwater fish species, however, data on the response of marine or
eurylraline fish. to such changes are unavailable.
Sea bass, Late s calcarifer, is an eurylialine t:eleost whic
is quite tolerant to a wide ranqe of sal.illitles and oxygen levels. I
was, chosen as the test. species because this species is an ecollomicall
iwporLant food fish that, is commonly clllt:ur ed in Ilong Kong and man
other South-east Isiah countries. However, no nitrite toxicit
iuformation on this species is available. The present research wa
conducted to obtain acute and chronic nitrite toxicity data for the
en Iryllaline teleost L. calcarif er and also outline its biochemical
hematological and physiological responses to nitrite exposure.
The data obtained in the study can give us a better
understanding of the underlying mechanisms of nitrite toxicity on
emryhaline fish and hopefully can contribute to the extension of
rearing euiyhallne or marine fish in a closed recirculating water
system.

CHAPTER TWO. LITERATURE REVIEW

42.1. INTRODUCTION
Ammonia (NIl3), nitrite (N02-) and nitrate (N03) are
important water quality parameters in the sustenance of aquatic life.
Ammonia is one of the most important pollutants in the aquatic
environment because of As relatively highly toxic nature (Colt and
`1'chobanoglous, 1978) and its ubiquity in surface water systems. It is
discharged in large quantities in industrial, municipal, and
agricultural waste waters. Nitrite is not considered such a severe
environmental problem because, although it is extremely toxic to
aquatic life (eg. Tomasso and Carmichael, 1986 Hilmy et al., 1987),
it does not usually occur in natural surface water systems at
concentrations considered deleterious to aquatic organisms. Although
nitrate can be found in relatively high concentrations in surface
waters, it poses a less serious environmental problem because it is
relatively nontoxic to aquatic organisms.
The three nitrogenous compounds are interrelated through the
process of n:i.trif:icatioll in the nitrogen cycle (Fi(j. 2.1). During
nitrification, ammonia is oxidized to nitrate in a two-step process by
two groups of aerobic chemoautotr.ophic bacteria (Stanier et al., 1970)
and nitrite is produced as an intermediate product. The nitrification
o[ ammonia can be summarized by the following steps:
Nitrosomonas

Lightningfixation
I ,Utmospheroy
NON03
Organic NIn fixers
Mltrogonfixing organisms
Denitrifyingbacteria
llycfrotlon andprecipitation
Decomposerclenmlnatlon
NMaNitrite bacteria
(Nitrosomonas)
nojJ Nitrate bacteria
(Nitrobactcr)
NOJ
T$
Decomposerdeamlnatlon
nitrificationUptake
Protein, etc.
32r4o3
cop2
d
NM3Nitrate reductaseeruymesystem
Nltrogerr In higherorganismsNOJ
Figure 2.1. Major processes of the nitrogen cycle
within the biosphere. Circular figures
indicate abiotic environmental pools,
rectangular figures biotlc pools.
Adapted from Collict et al. (1973).

Ni trnharfpr
In relatively stable oxygenated natural water systems the
oxidation ol nitrite to nitrate is rapid, but the conversion of
ammonia to nitrite is the rate limiting step in the overall process.
These chemical species can exist in ionized or un-ionized forms.
Ammonia gas is extremely soluble in water, forming the
ionized ammonium ion .
In water, nitrite forms un-ionized nitrous acid according to
the following equation:

2.,!. ACCUMULATION OF NITRITE IN NATURAL WATER SYSTEMS
Nil rite 1 s a naturally occurring anion in fresh and marine
wateis. Its concentration in oxygenated waters is typically less than
0.00b nig 1 NO-N (Lewis and Morris, 1986). Under some circumstances,
however, concentrations ol nitrite may be sufficiently high to be
toxic to aquatic organisms.
Two genera of bactot; i a N.i trosomonas and Nitrobac ter are
involved in the nitrification process and these two genera have
different sensitivities to various environmental factors. Therefore,
factors that affect these two genera differentially may lead to
accumulation of nitrite. For example, Nitrobacter spp. is more
sensitive to un-ionized ammonia than Nitrosomonas spp-. Un-ionized
ammonia inhibits the activity of nitrobacters at concentrations (0.1-
1.0 mgl1 Nil3) appreciably lower than those (10-150 mgl ) that
inhibit ni trosomonads (Anthonisen ejt al. , 1976). Acidity affects the
amount of un-ionized ammonia. Increase in pH results in increase in
concentration of un-ionized ammonia which, in turn, inhibit nitrate
formation and cause accumulation of nitrite. Other factors that
differentially affect these bacteria can also cause accumulation of
ni t rite.
Certain human activities increase the amount of nitrite in
aquatic systems. Several organic compounds found in industrial
effluents were shown to inhibit the nitrification process. Hockenbury

8
and Grady (19'17) found that dodecyclamine, aniline, and n-
methylaniline at concentrations less than 1 mgl-1 caused 50 %
inhibition of ammonia oxidation by Nitrosomonas; p-nitrobenzaldehyde,
p-nitroaniline, and n-methylaniline at 100 mgl-1 inhibited nitrite
oxidation by Nitrobacter. Loss of nitrification flora, resulting from
use of antibiotics, has also been mentioned (Patrick et al., 1979) as
a potential cause of large amounts of nitrite accumulating in natural
waters. Sewage effluents can contain high amounts of nitrite
(Mithonisen et al., 1976). Nitrite can also be produced in large
quantities by some types of aquaculture (Schwedler and Tucker, 1983).
Furthermore, fish culture .facilities using closed water reuse system
generally employ the nitrification process to reduce concentrations of
ammonia, the primary nitrogenous waste of fishes. Effectiveness of
the conversion process depends greatly on balances in the relative
abundance of nitrifying bacteria and some environmental factors
including pII, temperature, dissolved oxygen and concentrations of
inhibiting compounds. Unfavorable conditions may lead to imbalances
in the relative abundance of Nitrosomonas and Nitrobacter, resulting
in elevated nitrite levels in aquacultural systems. The amount of
nitrite discharged may raise the concentration of nitrite in the
receiving water to levels toxic to aquatic organisms.
In confined bodies of water such as lakes or ponds, large
quantities of nitrite can also accumulate due to the contamination by
unoff from surrounding land fertilized by nitrate and ammonia.

Nil), ite may also accumulate in the deep layers of lakes during
s 1 f.at.ification and subsequently appear at the lake surface when the
lake mixes (Infante et at., 1979; cited in Lewis and Morris, 1986).
Nitrite may thus be present at unusually high concentrations
under some circumstances in natural waters. Some field data are
available on environmental concentrations of nitrite. McCoy (1972)
found concentrations up to 7 3 mgl N0o-N in Wisconsin lakes andLi
_ 1streams. Kinglet (1957) reported nitrite concentrations 30 mgl
NOv-N in waters receiving effluents from metal, dye and celluloid..i
industries. During routine analysis of water quality in a 4.300-1 tank
employing closed seawater system for the culture of Lates calearlier
with a stocking density of 1.31 gl , Woo et_ al . ( 19 88 ) found
concentrations of nitrite rising from a negligible level to 8 rngl
N0o-N within 8 days._j

2.3. NITRITE UPTAKE
2.3.1. CHLORIDE CELLS
Based on I lie morphological description of gill epithelia in
fish by Lauren I and Dunel (1980), two main types of epithelia are
encountered in fish gill: the primary and the secondary gill
epithelia. The primary epithelium covers the primary lamellae
including the interlameI 1ar region and the secondary epithelium covers
the free part of the secondary lamellae. Chloride cells are
specialized ovoid-shaped cells that are located on the gill epithelia
and are responsible for ion regulation. Chloride cells are present in
both euryhaline and stenohaline species of freshwater or saltwater
fishes and exhibit specific significant characteristics in relation
with the respective milieu. The ultrastructural characteristics of
chloride cells are well studied (Doyle and Gorecki, 1961; Kikuchi,
19 7 7 ; Pisa m, 1981). Briefly, these cells dis p1 ay numerous
mitochondria associated with a densely branched tubular system that
opens on the basolateral plasma membrane. The apex of each cell has
microvilli and is firmly bound to the neighbouring pavement cells by a
long and tight junctional apparatus. Vesicles of various size are
concentrated in the apical region.
In marine species or seawater-adapted euryhaline species,
the distribution of chloride cells is usually limited to the primary
epithelium. Numerous studies have provided evidence for the view that

11Hie seawater chloride cell is involved 7.11 active excretion of unwanted
ions in a seawater elivironinellt (eq. Doyle and Gorecke, 1961 Maetz
and Bornancin, 1975 Foskett. et al., 1.983).
Ill f reshwa t.,er specie,, numerous chloride cells can be found
oveI: almost all. of the gill epithelia, particularly the secondary
EPithelium. It has been shown that rciinbow trout responds to a
hypotonic environment by producing chloride cells on the secondary
lamellae (Krous et. al.., 1982). Conditions that would tend to
exaggerate ion losses (such as skin wounds, external fungal
infections, or t lie transfer of fish f rorn fresh to de.ioni zed water)
have been shown to stimulate proliferation of lamellar chloride cells
(I„latent (1nt] llunel, 1980). 111 addition, Girard and Payui (1980) have
demonstrated that in freshwater trout, 24NaA and 36C1 enter the gill
only through the secondary lamellae. Therefore, the fresh water
chloride cells are believed to function in the inward transport of
ions in dilute media. Ili fresh water, the chloride cells can give off
ammonium or hydrogen inos in exchange for equal number of sodium ions
a11(1 can give off bicarbonate ions in exchange for an equivalent number
f chloride ions
2.3.2. NITRITE UPTAKB IN FRESHWATER FISH
Nitrile is a serious toxicant t.o freshwater fish even when
it is present in the environment in a relatively low concentration
because nitri Le can rapidly move from the water into the orcjanisrn, so

12reaching surprisingly high concentrations in blood and tissues
(Margiocco et al., 1983). Most freshwater fish take up nitrite
against a concentrat:ioii gradient nitrite concentrations in the blood
or blood plasma may reach 10 times the concentrations in the
surrounding medium (Bath and Eddy, 1980). Margiocco et al. (1983)
even found up to 60 Limes magnification of nitrite in blood, 30 times
in brain and liver of rainbow trout exposed to nitrite in fresh water.
An early explanation for nitrite uptake against a
concentration gradient has been of fered by Colt and Tchbanoglous
(1976) and Wedemeyer and Yasutake (1978) They proposed a passive
diffusion mechanism whereby nitrite diffuses across gill epithelium as
lipid-soluble nitrous acid (IINU.2). As mentioned in Section 2.1, some
nitrite in water can combine with hydrogen ions to form nitrous acid.
Within the pHt range of most natural waters, the nitrite ion is 4 to 5
orders of magnitude more concentrated than the nitrous acid with which
it is in e(luilibri.um. Because nitrotis acid has no electrical charge,
it would not'. be pumped into the body fluids through the chloride
cells, but it is soluble in lipids (Ilunn and Allen, 1974) and
therefore might enter the gills through epithelial cells. Inside the
fish, nitrous acid dissociates to nitrite and hydrogen ions. When the
level of nitrite ions in the plasma exceeds that in the environment,
the osmotic gradient reverses and nitrite ions diffuse back across the
gaill epithelia to the environment. However, nitrous acid can diffuse
into the fish at a rate faster than nitrite can diffuse out.

Moreover, I he nitrite ions inside the fish can be retained efficiently
by physiological mechanisms that prevent loss of ions. For example,
hemoglobin acts as a sink for nitrite ions, as is the case for oxygen.
According to this explanation, the build up of nitrite would be
especially pronounced when the pll of the fish (about 8.0 at the gills)
is higher than that of the surrounding medium.
Both nitrite toxicity and blood accumulation are known to be
lowered by environmental chloride and by inhibitors of chloride uptake
(Bath and Eddy, 1980). For this reason, it; lias also been suggested
that nitrite ions may be pumped across the gill epithelia of
freshwater fish by the anion exchange mechanism that are primarily
arranged for active chloride uptake in the chloride cells (Bath and
Eddy, 1980; Meade and Perrone, 1980; Krous et al. , 1 982; Eddy et
at., 1983). This hypothesis explains the strong hioaccumulation
characteristic of nitrite because it is presumed that nitrite is
Involved in a pump mechanism arranged for a physiological ion uptake
(Gaino el al., 1983). If nitrite ion and chloride ion compete for the
same site on the uptake mechanism in the freshwater chloride cells,
then in the absence of chloride ion or at low chloride concentration,
nitrite uptake will predominate and approach the rate at which
chloride would normally be transported. And this has been proved by
Eddy et al. (1983) who found that the rate of nitrite uptake appeared
lo be very similar to the rate of chloride uptake. Krous et al.
(1982) have demonstrated a direct correlation between plasma nitrite

14level and the number of lamellar chloride cell in rainbow trout.
Presence of nitrite in fresh water causes enlargement and rapid
turnover of chloride cells (Gaino et al., 1984). The fish apparently
maintain a fixed ,internal chloride concentration even when nitrite is
present in quantities that markedly inhibit the gill carbonic
anhydrase activity this may cause the chloride cells to do more work
when nitrite is present.
The literature, although not conclusive on the role of
nitrous acid, does strongly support the idea that the nitrite ion
enters fish through the chloride cells cromasso et al., 1980 Krous
et al., 1982). The recent discovery by Palachek and Tomasso (1984b)
that the largemouth bass, unlike other freshwater fishes, never had
plasma nitrite concentrations higher than those in test water is a
particularly persuasive argument against the theory of passive nitrite
accumulation through nitrous acid penetration of the gills. The
additional significance of nitrous acid has. to do largely with the
importance of environmental pH as a regulator of nitrite toxicity. If
nitrite enters fish primarily as nitrous acid, the relative internal
and external pH levels are of great importance. If nitrite enters as
ions primarily through the chloride cells, then the expected role of
pH is considerably smaller. This matter will be considered below in
connection with pH.

152.3.3. NITRITE UPTAKE IN SEAWATER FISH
The response of seawater fish to nitrite has not been
investigated in detail and the amount of published information
concerning how nitrite enters the seawater fish is very limited.
tudies so far revealed that seawater fish or seawater-adapted
eurylialine fish are less susceptible to nitrite toxicity and never had
plasma ui_trite concentrations higher than those in test water as did
their freshwater counterparts (Meade and Perrone, 1980 Eddy et al.
1.983 Scarano et al., 1984). The high chloride concentrations in sea
water should competitively inhibit nitrite uptake in fish exposed to
nitrite in sea water. Eddy et al. (1983) suggested that. nitrite entry
to the blood of seawater fish is by passive diffusion which would
continue until- equilibrium except that a lethal blood concentration is
first achieved. Since the p1I values of sea water and blood are more
similar, then at equilibrium hNO2 will exist in approximately equal
concentrations on either side of the gills and the-diffusion mechanism
described for freshwater, if operating, would not lead to large NO2
concentration gradients between blood and water.
In conclusion, the. passive diffusion mechanism, though it
remains a simple and attractive theory, it does not account for the
protective effect of environmental chloride ions. The active pumping
mechanism which has stronger experimental basis seems to outweigh the
diffusion mechanism to account for the nitrite uptake in fish body
However, it does not rule out the possibility that both mechanisms are

16operating at the same time to transport nitrite into the fish.

172.4. RESPONSES INDUCED BY NITRITE TOXICITY IN FISH
1.4.l. HEMATOLOGICAL RESPONSES
2.4.1.1. CHANGES IN METHEMOGLOBIN CONTENT
Although nitrite may have multiple modes of toxicity in
fish, the best investigated and thus understood is concerned with
hematology. Nitrite, being an oxidant, can diffuse into red blood
cells where it oxidizes hemoglobin to methemoglobin (ferri.hemoglobin)
which lacks the capacity to bind oxygen reversibly (Bodansky, 1951)
and thus impairs oxvaen Lransnort by blood.
The capacity of hemoglobin to bind and transport oxygen
greatly depends on the presence of a heme group which contains an iron
atom in the centre of the protoporphyrin ring (Fig. 2.2). The heme
iron in hemoglobin is present in the ferrous (Fe2+) state.
Hemoglobin combine, loosely Wlth oxygen to form the easily dissociated
compound oxyhemoglobin, in which the iron atom is still in the Fe2+
slate. Nitrite oxidizes the iron in hemoglobin to the ferric (Fe3+)
oxidation state to form methemoglobin. Methemoglobin unlike
oxyhemoglobi.n is a true oxidation product of hemoglobin and is
therefore incapable of transporting oxygen. Because it is unable to
act as an oxygen carrier, methemoglobin in significantly high
concentrations will seriously reduce the total oxygen carrying
capacity of the blood and cause hypoxia (Cameron, 1971a).
Methemoglobin gives the whole blood a characteristic brownish colour.

Mom©
(Fe-protoporphyrm IX)
Figure 2.2. Structure of the heme group.
Adapted from Strycr (1901).

Methemoyiobin forms spontaneously in normal erythrocytes,
although slowly, in the absence of nitrite. Thus fish blood
typically contains a measurable amount of methemoglobin even in the
absence of nitrite: reported values include 0.9 to 3.6 % for rainbow
trout (Cameron, 19la; Drown and McLeay, 1975; Smith and Russo,
1975), 10.9 % for prespawning pink salmon (Cameron, 1971a) and 2.2 %
for channel catfish (Huey et al., 1980). It is evident that the
presence of methemoglobin, even somewhat above 10 %, should not be
viewed as exceptional among fish. Graham (1986) reported a high
methemoglobin concentration of up to 27 % in the Atlantic cod. Fish
differ in this respect from mammals, whose methemoglobin levels seldom
exceed 1 % (Cameron, 1971a). The normal methemoglobin-hemoglobin
equilibrium can be affected by diseases or certain chemicals with high
oxidative or reductive potential such as nitrite, ascorbic acid, and
methylene blue. Factors affecting the state of energy metabolism of
the red cells such as overall nutrition, hypoxia, exercise or
erythrocyte age are also suggested to affect the equilibrium point
between hemoglobin and methemoglobin in fish (Cameron, 1971a).
Methemoglobin levels in some fishes such as cunner show significant
seasonal variation (Graham et al., 1986).
Most fish species form methemoglobin readily if exposed to
nitrite in waters of low chloride content (eg. Brown and McLeay, 1975;
Huey et al., 1980; Tucker and Schwedler, 1983; Dartlett et al_.,
1987; Hilmy e al., 1987). One exception is the largemouth bass,

which forms large amounts of rnetliemoglobin only in response to very
high nitrite concentrations (Palachek and Tomasso, 198-lb). Percent
methemoglobin can be predicted by exposed nitrite concentration. For
e x a m pie, W a t e 11 p a u g h et a j_. (1985) reported that the percent
rnetliemoglobin in treated channel catfish was highly and significantly
correlated with nitrite concentration by % rnethemoglobir
When the rnetliemoglobin content of blood exceeds 70 to 80 %
of the total hemoglobin, most fish species become torpid. This
behavioural response has been documented for European minnow
(Klingler, 1975), for chinook salmon (Westin, 1974), and for channel
catfish (Konikoff, 1975). As the rnetliemoglobin content of the blood
approaches 100 °g, fish typically become unresponsive and disoriented.
The actual stress of an equal amount of rnetliemoglobin in an
individual fish depends 011 many factors including behaviour, physical
conditions and environmental conditions. A fish exhibiting dominant
behaviour and a high degree of activity would generally have a higher
requirement for oxygen, possibly resulting in a decreased tolerance to
high levels of rnetliemoglobin (Smith and Williams, 1974). Inactive
fish have a very low oxygen demand and thus may not be immediately
threatened by severe methemoglobinemia (Crawford and Allen, 1977).
However, if a fish with elevated rnetliemoglobin is frightened, or is
otherwise forced to become active, it may die of anoxia (Huey et al. ,
1 980). Fish in good physical condition may be able to derive a
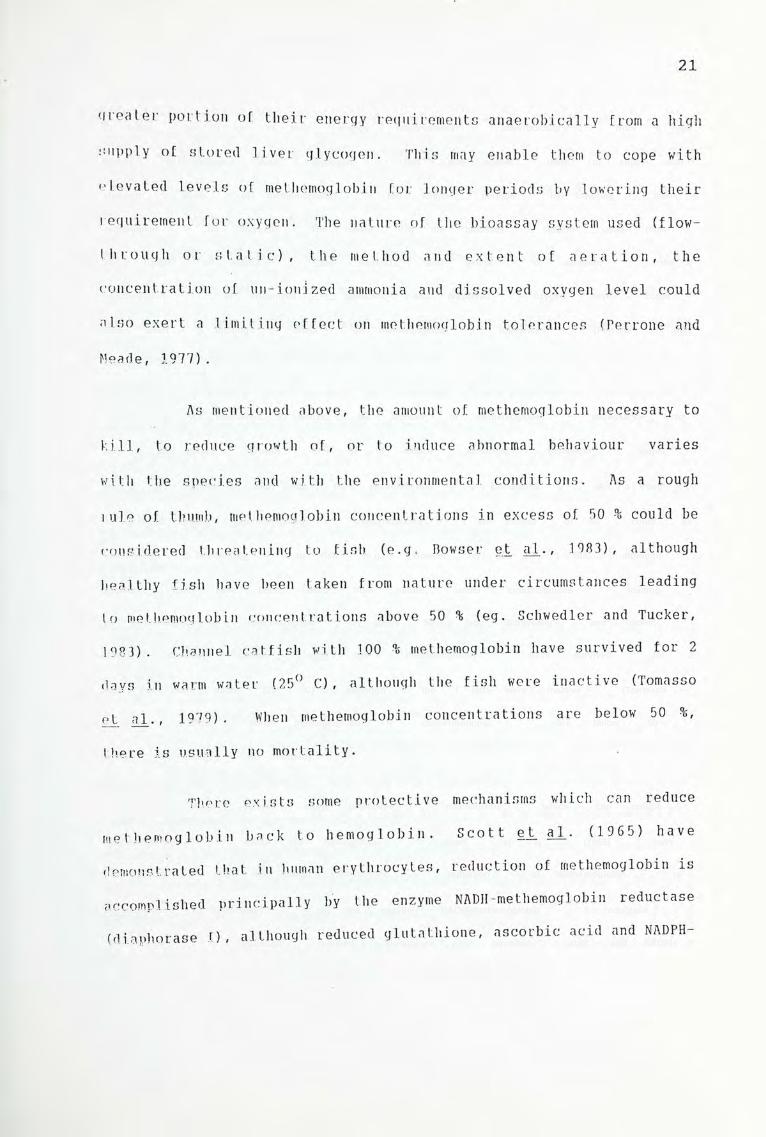
11 edtei. poi t ion of their energy requirements anaerobically from a high
supply of stored liver glycogen. This may enable them to cope with
elevated levels of methemoglobin for longer periods by lowering their
requirement for oxygen. The nature of the bioassay system used (flow-
Ill rough or static), the method and extent of aeration, the
concentration of un-ionized ammonia and dissolved oxygen level could
also exert a limiting effect on methemoglobin tolerances (Perrone and
Meade, 1977).
As mentioned above, the amount of methemoglobin necessary to
kill, to reduce growth of, or to induce abnormal behaviour varies
with the species and with the environmental conditions. As a rough
i ule of thumb, methemoglobin concentrations in excess of 50 % could be
considered threatening to fish (e.g. Bowser ej al_. , 1 983), although
healthy fish have been taken from nature under circumstances leading
to methemoglobin concentrations above 50 % (eg. Schwedler and Tucker,
1983). Channel catfish with 100 % methemoglobin have survived for 2
days in warm water (25° C) , although the f ish were inactive (Tomasso
et al. , 1979). When methemoglobin concentrations are below 50 %,
there is usually no mortality.
There exists some protective mechanisms which can reduce
methemoglobin back to hemoglobin. Scott ej aj_. (1965) have
demonstrated that in human erythrocytes, reduction of methemoglobin is
accomplished principally by the enzyme NADH-methemoglobin reductase
(diaphorase I), although reduced glutathione, ascoibic acid and NADPH

22methemoglobin dehydrogenase are all able to reduce methemoglobin to a
lesser extent. In red blood cells of fish, only NADII-methemoglobin
reductase system has been reported to reconvert methemoglobin to
hemoglobin (Cameron, 1971a Huey and Beitinger, 1982 Freeman et al.,
1982). NADII-methemoglobin reductase system is present in a variety of
fish. Out of thirteen phylogenetically diverse piscine species that
have been tested by Freeman et al. (1982), ten species demonstrate the
NADII-me themoglobin reductase activity. This enzyme system will
typically restore the normal. proportion of hemoglobin within 24-48
hours if a fish is transferred to water that lacks nitrite (Huey et
al., 1980). When nitrite is present, the ultimate level of
methemoglobin in the blood is a result of the balance between
methemoglobin formation and reconversion to hemoglobin by the
reductase.
2.4.1.2. CHANGES IN TOTAL HEMOGLOBIN CONTENT, ERYTHROCYTE COUNT
AND HEMATOCRIT
Literature concerning changes in total hemoglobin content
caused by nitrite exposure is rather inconsistent. A significant
reduction in total hemoglobin has been reported for rainbow trout in
fresh water after 96 hour exposure to 0.1 to 0.5 mgl-1 N02-N (Brown
and McLeay, 1.975 Margiocco et al., 1983), and for channel catfish in
fresh water after 96 hour exposure to 28-32 mgl-1 N02-N and an
extended period of 6 month exposure to 2.8-3.2 mgl-1 N02-N (Hilmy et
al., 1987). Hemoglobin decrease was observed in largemouth bass

23exposed to 150 mgl-1 N02-N for 96 hours in sea water but such decrease
was not observed in the first 24 hour exposure (Scarano et al., 1984).
On the other hand, hemoglobin reduction was not observed in rainbow
trout after 6 month exposure to 0.015-0.060 mgl-1 N02-N (Wedemeyer and
Yausutake, 1978), and was not reported in channel catfish exposed 24
hours to 5 mgl-1 N02-N (Huey et al., 1980), nor in bullfrog (Rana
catesbeiana) tadpoles exposed 24 hours to 1.0-50 mgl-1 N02-N (Huey and
Beitinger, 1980a). To sum it up, nitrite exposure appears to be able
to reduce total hemoglobin content on condition that exposure time is
sufficiently long or exposure concentration is sufficiently high.
Decreases in hematocrit (Eddy et al., 1983 Hilmy et al., 1987) and
erythrocyte count (Hilmy et al., 1987) have also been reported in fish
exposed to nitrite.
Nitrite exposure definitely causes reduction in functional
hemoglobin as a result of a combination of methemoglobin increase an(
total hemoglobin decrease. This may seriously impair the oxygen
transport capacity of blood and lead to hypoxia (Cameron, 1971a),
Previous papers (eg. Smit and Hattingh, 1978b) have stated that
hemoglobin and hematocrit values were increased as compensation foi
hypoxia and such increases were achieved by hemoconcentration anc
swelling of the red blood cells (Albers, 1970). It appears likell
that the decrease in the values of three hematological parameters
observed during nitrite exposure is due to the toxic effects of
nitrite rather than hypoxia. Scarano et al. (1984) suggested that

24during nitrite exposure, an adaptive mechanism occurred in red blood
cells of the fish. At nitrite concentrations high enough to induce
methemoglobinemia, metabolic energy would be utilized by erythrocytes
for methemoulobi.n reduction. Such a mechanism would reduce the half
life of the red blood cell pool. Red blood cells would probably be
destroyed by spleen and kidney macrophages. Histochemical analysis of
:spleens from trealed lish really demonstrated that macrophages were
engulfing red blood cells (Scarano et al., 1984).

252.4.2. BIOCHEMICAL RESPONSES
2.4.2.1. CHANGES IN PLASMA OR SERUM ION CONCENTRATION
Changes in ptasma or serum ion concentration in fish exposed
to nitrite can more or less give some idea on how nitrite intoxication
a[ f ects the osmoregnilat i.on of fish. Some studies in this area reported
that no significant changes were observed in concentrations of plasma
sodium (Bath and Eddy, 1980), plasma chloride (Bath and Eddy, 1980)
and blood chloride (Gaino et al. Margiocco et al., 1983) in nitrite-
exposed fish. No work has been done on the effect of nitrite on other
serum or plasma ion concentration such as potassium and calcium.
2.4.2.2. CHANGES IN BLOOD AND TISSUE METABOLITE CONTENTS
There are only a very limited number of studies that deal
with the biochemical responses of nitrite-exposed fish. An early
study by Colt et al. (1981) on channel catfish that 'had been held for
31 days at sublethal nitrite concentrations suggested that nitrite did
not have a significant effect on water content of the fish.
one detailed study was carried out by Arillo et al. (1984)
who investigated the main biochemical end-products of cerebral and
hepatic hypoxia in rainbow trout specimens exposed for 12, 24, 48, and
72 hours to nitrite (0.45 mgl-1 No2-N). They found that lactate,
glycerophospliate, and succinate increased in the liver of nitrite-

26treated trouts such increases reached high statistical significance
at different times from the beginning of the experiment: 72 and 24
hours for lactate and glycerophosphate respectively, while succinate
increase was statisically significant only in overturning trout. ATP
and sugars also decreased significantly in the treatment groups.
Lactate was significantly elevated in brains of overturned trout,
neither (-glycerophosptiate nor succinate showed any significant
changes. Sugars and ATP in the brain remained stable in even torpid
fish and decreased only in overturned ones. Blood lactate showed a
significant rise in torpid trout exposed 72 hours as well as in all
overturned fish, while blood glucose was lower only in overturned
fish. Lactate, glycerophosphate, glycogen, ATP and succinate are
biochemical indicators of hypoxia. Biochemical responses to hypoxia
or anoxia are well studied in several systematic groups including fish
(Jorgensen and Mustafa, 1980a, b). It is assumed that when glycogen
and ATP decrease, and at the same time there is an increase in
lactate, (-glycerophosphate, and succinate, an hypoxic (anoxic)
situation is occurring. On this basis, it is clear that the liver of
nitrite-treated trout shows a slightly hypoxic situation. In more
advanced stages of intoxication such as in those trout treated for as
long as 72 hours, the hypoxic situation becomes more typical. Only in
overturning specimens are biochemical data so altered as to indicate
a severe hypoxic state: here, in addition, succinate increases, so
illustrating an impairment,of mitochondri-al function. It can therfore
be concluded that, except for overturning animals, serious biochemical

smptonio of hypoxic damage are not detectable, even in those trouts
vdiit.h ate in veLy bad physiological condition and which otherwise show
sitjns of intoxication. The results also show clearly that in the
biain of normally swimming fish no significant symptom of hypoxia can
be found, and even in overturned specimens the hypoxic state is weak
and incomplete.
In another study, a decline in serum total protein levels
was recorded during acute and chronic exposure of CI arias lazera to
nitrite (Uilmy et aj. , 19 87). New comb ( 1974) reported a similar
decrease in serum protein concentration in juvenile steelhead trout
exposed to nitrogen supersaturation for 35 days. Besides, a great
variety of systemic stressors including toxicants also tend to
diminish the total blood protein, although these values recover during
the stage of resistance to stress (Selye, 1950). Therefore, the
decline in serum total protein may be a generalized stress response or
a result of hypoxia caused by methemoglobinemia.
2.4.2.3. ALTERATIONS IN MITOCHONDRIAL FUNCTION
A r i 11 o et_ al_. ( 1 9 8 4 ) have carried out in_ vitro
investigations on liver mitochondria incubated in a medium containing
15 ;igml_1 NOy-N, which is a nitrite concentration similar to that
~1found in the liver of rainbow trout treated in vivo to 0.45 mgl N02~
N. It was found that nitrite could markedly impair mitochondrial
function, respiratory control ratio (RCR) and oxygen consumption

bhowed a lelevant decrease when tlie toxicant is added, at least after
a 10-mi 11 preincubation. The decrease of index RCR was due both to an
activation in state 4 and to a decrease in state 3 oxygen consumption
a s reported 1 o r in a iri m alia n rn i t o c h o n d r i a (Inoue, 1 978 ). The
modification in state 4 might be interpreted as a consequence of some
membrane alteration, leading to an uncoupling-like effect. The
decrease in state 3 was probably due to a nitrite-induced inhibition
of cytochrome C oxidase, as reported for rat skeletal muscle
mitochondria (Walter and Taylor, 1963). Such an impairment of
mitochondrial function has an early in vivo effect on the liver ATP
stores. In vivo experiments carried out in the same study revealed
lliat the liver ATP concentration in treated specimens began to
decrease already after 12 hours treatment while the changes of other
biochemical parameters are much more moderate.
2.4.2.4. ALTERATIONS IN LYSOSOMAL FUNCTION
Recent investigation revealed that lysosomes are good
markers of stress. It is known that a variety of environmental
stressors can bring about alterations in lysosomal function. Some
chemical properties of nitrite suggest that it may affect lysosomal
behaviour. Nitrite is known to mediate, through some of its products
(nitrous acid and nitric oxide), the binding of thiol and amino groups
(Knowles et. al. , 1974; Ignarro and Gruetter, 1980), thus inducing
selective chemical modifications in both functional and structural

proteins. As a consequence, changes in the function of enzymes and in
the permeability of the lysosomal membrane may be expected. Mensi et
ski (1982) examined some parameters of liver lysosomal function in
rainbow trout exposed to 0.45 mgl1 N02~N (nearly 36 hr LC50) for
various exposure times (12-72 hours). In vivo both total proteolytic
activity and single protease activity of cathepsin D, cathepsin C, and
1eucy1aminopeptidase of liver were found to be inhibited , the
inhibition increasing willi the lengthening of exposure time. In vitro
no analogous effect was observed. These findings indicated that the
decrease in protease activity found in vivo is not primarily due to a
direct interaction with nitrite. Since the inhibition observed in
treated trout seemed to be proportional to the exposure time, the
authors suggested that nitrite caused an indirect time-dependent
impairment in protease synthesis. The mechanism that leads to this
impairment is unknown at present. However, since nitrite brings about
a relatively time-dependent decrease in ATP levels (Arillo e_t al.,
1984), it is reasonable that the energy-dependent synthesis of
lysosomal hydrolases is altered thus producing structurally inadequate
and consequently inactive enzymes. However, it does not rule out the
possibility that nitrite products, such as nitric oxide, may disturb
hydrolase synthesis per se by interfering in some steps in its
synthesis.
Another finding was that lysosomal membranes showed an
increased fragility in treated specimens. It was demonstrated that

nitrite affected membrane stability both by worsening the sensitivity
to osmotic shock and causing per se the rupture of organelles in iso-
osmotic suspension. Since results concerning lysosomal lability were
in line with the pattern followed by hepatic nitrite concentration,
I lie author suggested that nitrite directly affected lysosomal
integrity probably through the membrane structural modifications which
the toxin is able to mediate. In fact the interaction of amino and
thiol groups of membrane proteins with nitrous acid or nitric oxide
lead to alteration in the structure of proteins, thus varying the
integrity and the permeability properties of the membrane. Moreover,
nitrite has been shown to mediate lipid oxidation through its product
NC2 (Estefan el al., 1970). Therefore, the membrane may be further
damaged because of alterations in its phospholipids components.
2.4.2.5. CHANGES IN ENZYME ACTIVITIES
Nitrite was shown to markedly inhibit the activity of
-1branchial carbonic anhydrase in vitro in concentrations (5-40 ugl
N02-N) similar to those determined in various tissues of in_ vivo
treated rainbow trout (Gaino et_ aJ., 1984). The inhibition of
carbonic anhydrase should impair the osmoregulatory function of
chloride cells because of the decreased production of bicarbonate
(IICO-j—) , which is believed to exchange for chloride (Maetz and Garcia-
Romeu, 1964). There is no study concerning the effects of nitrite on
the activities of other branchial enzymes such as Na+-Ki-ATPase.

31Michael ct al. (1986) observed an increase in serum
q l I.I Lama mate- ox,i cot o Le (SCOT) and Lama Le-pyruva to transarninases
(EGTT) acLiv.it y in two sizes of juvenile Clarias lazera during chronic
exposure (6 months) to 2.8 and 3.2 my l -1 N02-N, which were one tenth
of the 96 hr LC5O values for the two size respectively. And there is
a good correlation between the rise in these enzyme acti vi. ties and the
severity of histological damage. SGOT and SGPT have been reported to
be responsive to l.-i ver injury in man and animals. Therefore, the
increases in both enzyme activities (luring nitrite exposure indicate
that. nitrite can induce hepatic damages in fish.
In vitro study on the effect of nitrite on lactate
dehydrogeuase and g1.ucose-'6-phosphate dehydrogenase was carried out by
Arillo et al. (1.984) who found that both enzymes did not undergo any
change in their activities even in the presence of high nitrite
concentrations a long incubation of the extract i.n the presence of
ni.t.rite concenLral.ions [our Lo f i.ve times IiLgher than those detected
in L he liver of the fish exposed in vivo caused no notable changes in
enzyme activities.

322.4.3. ULTRASTRUCTURAL RESPONSES
Wedorneyer and Yasutal:e (1978) examined tissues- of rainbow
trout. that had been held for 28 weeks at sublethal nitrite
concentrations. The kidneys, blood, and thymus did not, show damage
slight changes in t lie gill Lissues including minimal hypertrophy,
li vtierplasia, and tainetlair setparation, judged by the authors to be of
minimal importance, were observed after 3 weeks but had disappeared
alter the fish had been held 7 weeks. Alter 28 week exposure most of
the test fish had recovered and showed little or no lamella epithelial
change. Coln et al. (1981.) found no ct.il.l damage In channel catfish,
even at lethal concentrations of nitrite. Also Michael et al. (1986)
reported that kidneys from fish exposed to nitrite were not noticeably
different histologically from that of control fish. On the contrary,
there are studies demonstrating that nitrite can induce histological
changes in liver and gill tissues of fish.
Krorts eL al. (1982) found that the numbers of lamellae
chloride cells were directly correlated with plasma nitrite values ii
rainbow trout. Moreover, Gaino et, al. (1983) reported that nitrit(
induced an acceleration of chloride cell- turnover both producinc
hyper-activity in some cells enhancing their degenerating rates it
rainbow trout.. The gills of treated specimens, in comparison with
controls, had a great number of chloride cells at all stages of
development (active, degenerating and completely degenerated cells).
In particular, fully active cells, with intact: cytoplasm, of ten became

33
so hypertrophic as to completely project outside the ep_itheliutn: thi!
led to an euliancemettt of. the total surface area and probably to a
greater absorption o.[ dilute electrolytes from the surrounding medium,
In the same study, the authors also found that in the blood of the
treated trout the chloride concentration remained constant in sp:itE
of a considerable uptake of nitrite. In vitro observation also showed
that nitrite could markedly inhibit the activity of carbonic
anhydrase. Therefore, the hypertroph:ia in some gill chloride cell
could be a hyperactive response at:tempting to maintain physiological
chloride levels in the presence of nitrite and lowered bicarbonate
production. His topathologica.l study of gills of Clarias lazera
exposed chronically for six months to sublethal nitrite concentration
by Michael et al. (1986) found that n_i.tri to exposure induced lesions
such as hypertrophy and hperplasia in the epithelial surface of the
respiratory lamellae. Lifting of epitlieli.al cells was also prominent.
Necrotic respiratory lamellar epithelium was observed during the
fourth, fifth and sixth months.
Hype rtrophy, hyperpplasia and lamellar separation of gill
epithelium is commonly seen in fish exposed to almost any irritant.
For example, gill hyperplasia was observed in salmonids exposed to
ammonia (Larmoyeux and Piper, 1973). Thurston et al. (1978) found
that gills of cutthroat trout fry exhibited hypertrophy of lamellar
epithelium, some necrosis of epithelial cells and separation of
epithelium as a result of treatment with ammonia for 29 days. Abdel-

Aziz (1982) recorded hyperplasia and hypertrophy in lamellar epithelia
() Clar las 'nfi 111 apia zi 111 following acute exposure to zinc.
Swelling, hyperplasia and lifting of lamellar epithelium can serve a
defense function (Mallatt, 19813) as these alterations increase the
distance across which the toxicant must diffuse to reach the blood
stream. Mallatt (1985) has statistically reviewed fisli gill
structural changes induced by toxicants and other irritants and he
concludes that J rri tan t-induced gill alterations do not reflect
specific actions of irritants as much as they seem to reflect
physiological responses of fish. In addition to the specific
physiological responses of an organism to a stressor, a series of
nonspecific physiological responses referred to as the general
adaptation syndrome takes place (Selye, 1950). Part of the syndrome
is the release of corticosteroid hormones from the interrenal
glandular tissue. Scott and Rogers (1980) viewed irritant-induced
gill alterations as part of the general systemic response to stress
(general adaptation syndrome). Therefore, it may be concluded that
the observed alterations in gill lamellae, due to nitrite exposure,
can be considered as a defense response which may be partly brought
about by the release of corticosteroids into circulation. However,
research is needed in (his area to know the extent to which these
hormones may affect gill structure (Michael et. al. , 1986).
Aril 1 o e_t_ al_. ( 1984) made observations on liver
u 11rastrueture of rainbow trout exposed acutely to nitiite and they
found that mitochondrial damage was the most conspicuous of the

35hepatic ultrastructural effects. After 48 hour nitrite treatment the
major ultrastructural change in the liver consisted of a mitochondrial
vacuolization, which could be considered a morphological expression of
hypofunction of these organelles. The glycogen tended to accumulatE
near a pole of the cell rather than to disperse among the membranes of
the smooth endoplasmic reticulum, as it did in controls. ThE
mitochondrial situation got worse at 72 hour when the myelinic
degeneration appeared, in addition to vacuolization. In overturned
specimens hepatocytes showed a complete and clearly irreversible
destruction of the cellular structure. Glycogen decreased
dramatically and even disappeared. Mitochondria appeared to
degenerate so that very large vacuoles could be observed in the
hepatocytes of near-death trout. The development of the
ultrastructural changes in mitochondria as well as the modifications
in the glycogen granule arrangement were in line with the progressive
reduction of hepatic ATP and total sugar, and with the modifications
of the other biochemical indicators of hypoxia detected in vivo. The
agreement between biochemical and ultrastructural data was stressed by
the remarkable nitrite-induced impairment of the mitochondrial state 3
respiration found in the author's in vitro experiment, and by the
nitrite-induced decrease of the respiratory control ratio as described
before. Nitroso compounds have been reported to induce mitochondrial
swelling and elongation in rat liver hepatocytes (Rusu et al., 1980).
The nitrite-induced effects on mitochondrial function of rainbow trout
were certainly worse than those observed in mammals and led to a

36complete degeneration of mitochotidri.a and transformation into
vacuoles. Microscopic examination of the liver of Clarias lazera
indicated that exposure to nitrite Produced marked hepatic alterations
which was characterized by vacuolation of cells around the central
vein accompanied by fatty infiltration (Michael el al.., 1986).

372.4.4. RESPIRATORY RESPONSES
Respirometry may provide indirect insight into the mode of
toxicity of a chemical. oxygen consumption is one of the various
measures used to assess the effects of toxicants or irritants on
metabolic rates of animals. The conversion of hemoglobin to
methemoglobin in nitrite-exposed fish may reduce their oxygen uptake
capability, and thereby depress I-heir oxygen consumption rate and thus
metabolic rate.
Watenpaugh and Beitinger (1985a) demonstrated that acute
exposure of fathead minnow to nitrite reduced their weight specific
oxygen consumption by about 22 %. Routine oxygen consumption was also
measured in control and nitrite-treated Amazonian fish Brycon cf.
melanopterum and Semaprochilodus insignis by Bartlett et al.(1987) who
found that the initial. rates of oxygen consumption for both control
and treated fish were not significantly different. However, as the
oxygen content of water was below 20% saturation there was a marked
decrease in the rate of oxygen utilization in nitrite-treated as
rmmna rcd with control fish.
Although routine respiration rate determinations detected a
sublethal effect of nitrite on some fishes, such determinations are
usually insensitive indicators of changes in metabolic rate induced by
chemicals because the activity of fish is unregulated (Anderson et
al., 1980). Effects of chemicals on metabolic rate of organisms are

38letter evaluated with standard or active weight specific oxygen
consumption when possible.
Oxygen affinity was measured on samples of whole blood taken
from Semaprocliilodus insignis 1 hour after intraperitoneal
administration of 10 mgkg-1 of sodium nitrite, when the concentration
of methemoglobin was found to be about 30% (Bartlett et al., 1987).
The oxygen equilibria values found for control and nitrite-treated
fish, measured at different phi revealed that there was a significant
increase in the oxygen affinity of the blood of the fish with this
relatively mild methemoglobinemia, with a more pronounced Bohr effect,
as compared with the non-met:hemoglobinemic controls, which had a
methemoglobin concentration of less than 5%.
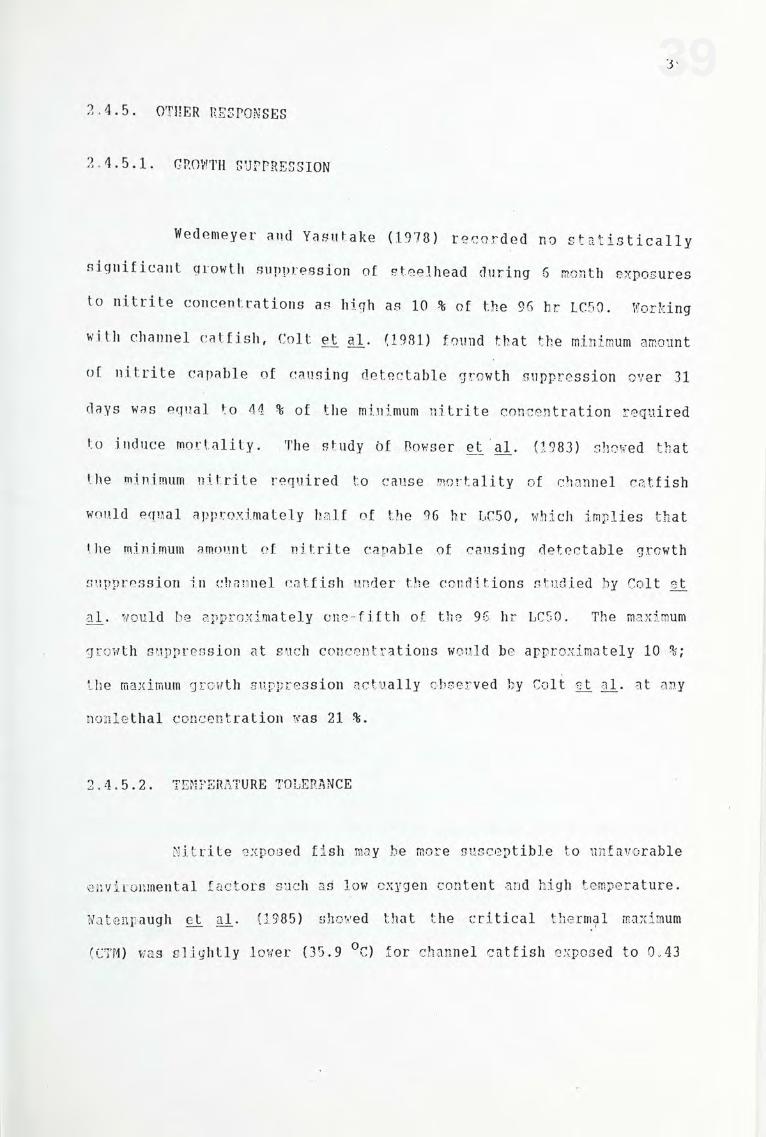
392.4.5. OTHER RESPONSES
2.4.5.1. GROWTH SUPPRESSTnN
Wedemeyer and Yasutake (1978) recorded no statistically
significant growth suppression of steelhead during 6 month exposures
to nitrite concentrations as high as 10% of the 96 hr LC50. Working
with channel catfish, Colt: et al. (1981) found that the minimum amount
of nitrite capable of causing detectable growth suppression over 31
days was equal to 44% of the minimum nitrite concentration required
to induce mortality. The study of Bowser et 'al. (1983) showed that
the minimum nitrite required to cause mortality of channel catfish
would equal approximately half of the 96 hr LC50, which implies that
the minimum amount of nitrite capable of causing detectable growth
suppression in channel catfish tinder the conditions studied by Colt et
al. would be approximately one-fifth of the 96 hr LC50. The maximum
growth suppression at such concentrations would be approximately 10%
the maximum growth suppression actually observed by Colt et al. at any
nonlethal concentration was 21 9s.
2.4.5.2. TEMPERATURE TOLERANCE
Nitrite exposed fish may be more susceptible to unfavorablE
environmental factors such as low oxygen content and high temperature.
Watenpaugh et al. (1985) showed that the critical thermal maximum
(CTM) was slightly lower (35.9 °C) for channel catfish exposed to 0.43

iiH 1 of N02 N than for control-; (38.0 °C) . This is consistent with
the concept that higher temperatures reduce the LC50 of nitrite by
raising the tissue oxygen demand. Interactions among temperature,
tissue hypoxia resulting from methemoglobinemia and possible changes
in blood distribution to alleviate tissue hypoxia may explain the
observed CTM decrease in nitrite-exposed channel catfish. It is
because elevated temperature increases the metabolic rate of
ertotherms and hence t lieir oxygen demand. Methemoglobin formation
most likely decreases oxygen transport to the tissue and the decreases
in oxygen carrying capacity would at least contribute to reduced
ability to tolerate increasing temperatures.
The lower tolerance to increasing temperature indicates that
nitrite-temperature interactions have the potential of adversely
affecting the productivity of high-density aguaculture of warmwater
fish such as channel catfish.
2.4.5.3. SWIMMING PERFORMANCE
Several investigators have identified swimming performance
as a potentially sensitive indicator of sublethal stress in fish (e g.
Schneider and Connors, 1082). Farlinger and Beamish (1977) subdivided
swimming performance of fish into three general categories: sustained
swimming that utilizes only aerobic metabolism and can continue
indefinitely, prolonged swimming that depends on both aerobic and
anaerobic metabolisms and cannot be sustained indefinitely, and burst
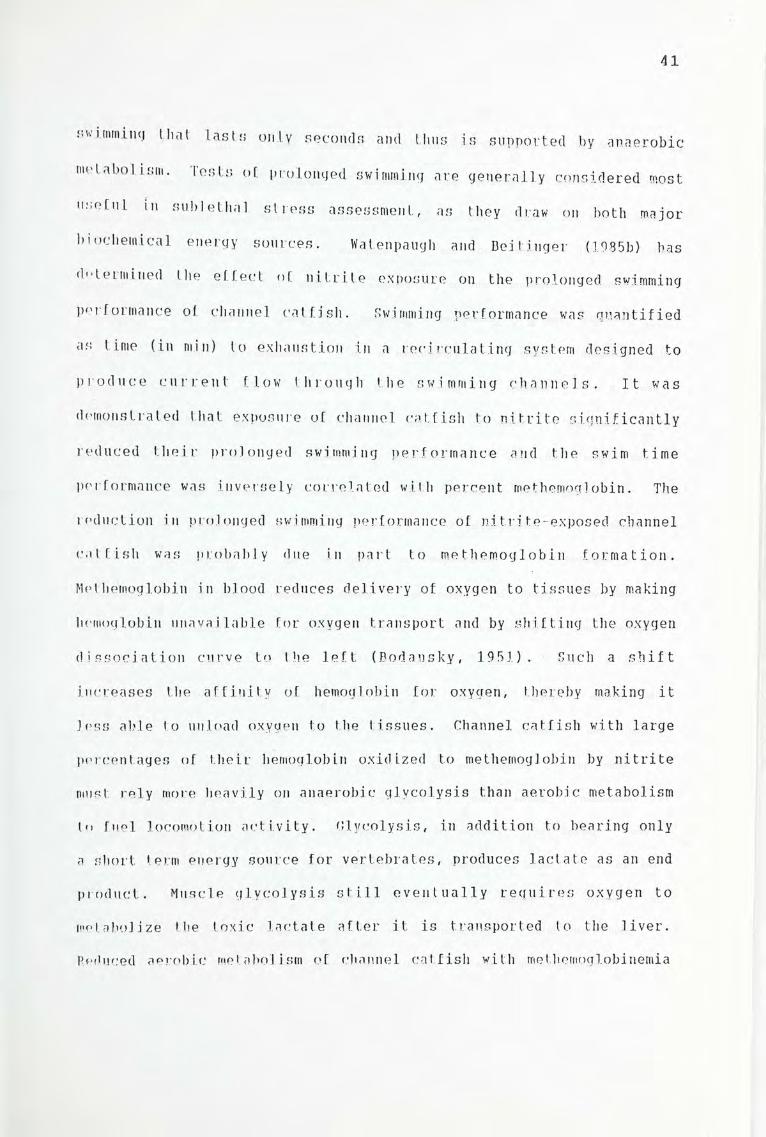
swimming 1 Iiat last s only seconds and thus is supported by anaerobic
iih tabol ism. lests of; prolonged swimining are generally considered most
useful in sublethal stress assessment, as they draw on both major
biochemical energy sources. Watenpaugh and Dei linger (1985b) has
d'leimined the effect of nitrite exposure on the prolonged swimming
performance of channel catfish. Swimming performance was quantified
as time (in min) to exhaustion in a recirculating system designed to
produce current flow through the swimming channels. It was
demonstrated that exposure of channel catfish to nitrite significantly
reduced their prolonged swimming performance and the swim time
performance was inversely correlated with percent methemoglobin. The
reduction in prolonged swimming performance of nitrite-exposed channel
catfish was probably due in part to methemoglobin formation.
Methemoglobin in blood reduces delivery of oxygen to tissues by making
hemoglobin unavailable for oxygen transport and by shifting the oxygen
dissociation curve to the left (Bodansky, 1951). Such a shift
increases I lie af f inity of hemoglobin for oxygen, thereby making it
less able to unload oxygen to the tissues. Channel catfish with large
percentages of their hemoglobin oxidized to methemoglobin by nitrite
must rely more heavily on anaerobic glycolysis than aerobic metabolism
to fuel locomotion activity. Glycolysis, in addition to bearing only
a short term energy source for vertebrates, produces lactate as an end
product. Muscle glycolysis still eventually requires oxygen to
metabolize the toxic lactate after it is transported to the liver.
Reduced aerobic metabolism of channel catfish with methemoglobinemia

42should limit prolonged swimming performance. In addition to
methemoglobinemia,other faclors such as intraspeeilic variation in
areobic and anaerobic capacity also infuluence the swimming
performanceof fish.

2.5. TOXICITY MECHANISMS
Studies concerning the effect of nitrite on fish have been
developed considerably along the toxicological viewpoint over the past
lew years. However, little data are available on the toxicity
mechanism of this pollutant.
As the prominent effect of nitrite to fish is the oxidation
of hemoglobin to form methemoglobin and therefore, methemoglobinemia
has been suggested as the primary toxicity mechanism of nitrite. Iluey
§JL al. (1980) proposed that methemoglobinemia and resulting anoxia
were apparently the primary cause of death in nitrite-exposed channel
catfish. However, no evidence lias yet related methemoglobinemia as
I he direct cause of death in nitrite-exposed fish. Many observations
reveal a lack of correspondence between the percent methemoglobin and
mortality, or physiological condition of treated animals. Smith and
Williams (1974) observed mortality of some rainbow trout with blood
methemoglobin levels lower than those of other rainbow trout that
survived, and this led them to suggest that the fish died from a toxic
reaction to nitrite itself rather than from methemoglobinemia.
Crawford and Allen (1977) observed that in sea water with added
nitrite, chinook salmon had high methemoglobin levels (74 %) but very
low mortality (10 %) ; in fresh water with added nitrite, lower
methemoglobin levels (44 40 were found in salmon, but 70 % mortality
occurred. They further observed that fish that died in fresh water
often had red gill lamellae, rather than the brown colour typically

caused by methemogiobi uenii a. Almendras (1987) reported a similar
result thai the mortality of milk fish with the same level of
met liemoylobin ( 75 %) was about twice as great in fresh water as in 16
V00 brackish water. These results indicate that the toxicity of
nil.lite in fiesh water may be attributable to some other mechanism or
•»
something in addition to methemoglobinemia. Tomasso et. aj. (1979)
reported that channel catfish, apparently not near death, possessed
very high met hemoglobin content (near to 100 %) . Perrone and Meade
(19) observed that generally a severe stress occurred with
mel hemoglobin levels as high as 86 - 95 °6, but some specimens could
tolerate, without any apparent stress, even 89 % of methemoglobin,
though showing brown blood and gill. It is suggested that such
discrepancies can be due to individual differences in tolerance to
anaerobic conditions; however, it also implies that some toxic
mechanisms other that methemoglobinemia is associated with mortality.
However, alternative mechanisms of nitrite induced mortality have as
yet not been well documented.
One mechanism that nitrite induces mortality can be gill
damage as gill hypertrophy, hyperplasia and lamellar separation have
been reported in nitrite exposed fish (Gaino et al., 1983; Michael et
al., 1986). However, there are findings that gills of fish exposed to
nitrite show either little or no damage (channel fish: Colt et al,
198J; rainbow trout: Wedemeyer and Yasutake, 1978). Smith and
Williams (1974) reported changes in the thymus of rainbow trout

exposed to nitrite, but only at lethal concentrations.
Working on rainbow trout exposed to 0.45 rngl 1 N0o~N for_!
vaii.ous pel tods ot time, Margiocco ejt al. (1983) found that treated
specimens possessed met hemoglobin levels neither correlaiable to their
physiological conditions, nor proportional to their blood nitrite
concentration. Nitrite accumulated in blood and tissues of fish to a
surprisingly high extent (up to 60 times the test concentration in
blood and 30 times in liver and brain) against increasing
concentration gradients. In the liver and brain of treated specimens,
there were great differences between apparently unstressed fish and
torpid, unreactive ones. The clear correlation between physiological
conditions and tissue concentration of nitrite, and the high
concentration detected in the organs of moribund fish have led the
authors to reach the conclusion that death following acute nitrite
intoxication was probably due to nitrite toxic action in vital organs
lather than to methemoglobinemia. The heavy nitrite accumulation into
vital organs (liver and brain) might well result in severe metabolic
damage: in fact, it is well known that nitrite strikingly reacts
through its derivatives with -NHo and -SII groups, thus being able to
inhibit several enzymes and to generate mutagenic compounds (Margiocco
et al, 1983) . Nitrite has been implicated in the formation of N-
iiitroso compounds (Archer et al., 1971; Wolff and Wasserman, 1972),
and nitrosamines have been shown to be carcinogenic in zebrafish,
rainbow trout, and guppy (Stanton, 1965; Ashley and Halver, 1968;
Sato et_ al., 1973). Nitrite was also reported to induce cancer in

rats directly, rather than through formation of nitrosamines
(Newberne, 1979).
Nitrite possesses several other toxic actions. Nitrite has
been reported to induce lysosomal alterations in fish with a
remarkable increase of the lability of these organelles (Mensi et_ al.,
1982), perhaps connected with modifications of the lipids of the
membrane. In mammals, for example, mitochondria and microsomes,
especially when oxygen is lacking, are particularly damaged by nitrite
(e.g. Walters and Taylor, 1965; Shertzer and Duthu, 1979). Arillo et
a 1 . (1984) also observed that nitrite could markedly impair
mitochondrial function in rainbow trout.
As mentioned in the Section 2.4.2.2, Arillo e_t aJL (1984)
has reported that nitrite exposure does not induce significant hypoxic
symptoms in liver and brain of rainbow trout. They suggested that
tissue hypoxia, due to the nitrite-induced high methemoglobinemia, is
loo low to be directly responsible for animal death. Nevertheless
liver hypoxia was thought to be at the root of nitrite acute toxicity
mechanism by producing suitable conditions for toxic potentialities.
The anatomic characteristics of the liver (in mammals and fish)
suggest that this organ is particularly sensitive to hypoxic
situations. The centrolobular area of the liver is generally in a
physiological hypoxic condition (Schumacher, 1957). Nitrite-induced
methemoglobinemia probably causes local hypoxic situations in
centrolobular areas; nevertheless in early stages, such an occurrence

47
is not detectable through biochemical tests, which provide mean value:
relative to the whole organ. The "local",production of lactate
together with the oxygen shortage might well create favorablh
conditions for nitrite to accomplish its toxic action. In fact, the
chemical equilibrium between nitrite and some of its derivatives is pf
regulated. It is through these derivatives that nitrite shows the
most toxic effect on the cell, because it can rapidly react with
lipids, in the cytoplasm as well as in the membranes, and with -NH2
and -SH groups of biologically fundamental molecules (Keefer and
Rolla, 1973 Ignarro and Gruetter, 1980 Knowles, 1974 Estefan et
al., 1970). While oxygen tension is decreasing (perhaps methemoglobin
level reaches 80%), new toxic mechanisms occur. Generally,
hemoproteins and cytochromes show more affinity for oxygen than for
nitrite but when oxygen falls below certain values, nitrite can act
directly on mitoclh.ondri.al cytochrome C and on microsomal P450 (Wolff
and Wasserman, 1972; Walter and Taylor, 1969) thus impairing
mitochondrial and microsomal functions. It is probably that at this
point, the severe hypoxic state becomes evident in the overturning
condition. Thus the irreversible and deadly hepatotoxic damages,
particularly at the mitochondrial level may partly account for the
death under nitrite intoxication.
In conclusion, the results of various studies suggest that
the toxicity mechanism of nitrite can be connected with different
effects on different organelles- independent or synergic- and that
methemoglobinemia is only one of these.

2.6. SYMPTOM6 OF NITRITE TOXICITY
Fish exposed to nitrite exhibit 110 unusual behaviour in the
early part of exposure (Knoiff, 1975). Later they become quiet and
lie motionless on the bottom of the tanks (Knoiff, 1975; Crawford and
Allen, 1977; Tomasso et. al, 1979). They may exhibit rapid opercular
movement (Weston, 1974) and laboured respiration (Hilmy et a1., 1987).
Occasionally some of the fish will suddenly become active, gulp at the
surface, swim in an erratic manner for a while and then die. Many of
the nitrite-exposed fish show changes in body colour. For example
nitrite-exposed chinook salmon changes from the normal silver-grey to
almost black (Westin, 1974), while Clarias lazera changes from the
normal dark grey lo a pale grey colour (Ililmy e_t aJL , 1987). Overall
anatomical examination of fish under nitrite intoxication reveals a
distinctive brown blood and gills (e.g. Knoiff, 1975; Margiocco,
1983).

492.7. FACTORS AFFECTING THE TOXICITY of NITRITE
2.7.1 BIOLOGICAL FACTORS
2.7.1.1. FISH SIZE
Fish size is an important consideration when evaluating
ni tri.te toxici t.y data. An early study by Smith and Williams (1974) on
uainbow trout showed that small fish were less sensitive to 24 hour
exposures of nitrite than were larger ones. Russo et al. (1974)
showed that. rainbow trout larvae were. slightly less susceptible to
nitrite than larger fish, and subsequent studies by Russo and Thurston
(1977) on rainbow trout also siiyyes ted that the larger fish are
slightly more sensitive to nitrite. Thurston et al. (1978) reported
noo difference in the sensitivity of cutthroat trout weighing 1 and 3g.
This, however, could be explained by the very small size range of the
fish. For rainbow trout over the range of 2 to 387 g, Russo (1980)
found no statistically significant relationship between size and
mortality over 96 hours. However, Russo's data showed that the four
highest LC50 values occurred in the first 5 of 20 size groups. Thus
the small fish were likely to have significantly higher LC50s than
the large fish.
Perrone and Meade (1977) showed that very small coho salmon
(0.65 g) were less susceptible to nitrite than yearlings (22 g). In
the only study demonstrating more resistance in larger fish, Wedemeyer
and Yasutake (1978) concluded that rainbow trout weighing 10 g were

50slightly less vulnerable to nitrite toxicity than rainbow trout
weighing 5 g, although standard errors for the 96 hr LC50 values
overlapped.
For warmwater fish, the only extensive study of the
relationship between size and nitrite toxicity is that of Palachek and
Tomasso (1984a). These authors concluded that fathead minnows
weighing between 0.3 and 0.8 g were more tolerant of nitrite than fish
weighing 0.9 to 3.3 g. The 96 hr LC50 for the smaller fish was about
50% higher than that of the larger fish.
From the presently available literature it is concluded that
small fish, even larvae, are unlikely to be more sensitive to nitrite
than larger fish of the same species. Furthermore, there is definite
evidence for some species that very small fish are less vulnerable to
toxicity than fish of intermediate or larger size.
The biological basis for the size difference in tolerance is
not totally understood. It has been well known that the blood of some
fish species, such as European eel and Altantic salmon, show different
types of hemoglobin components clearly distinct by physical, chemical
and functional properties during the course of development (Rizzotti
et al., 1977 Koch et al., 1966). Thus Russo et al. (1974)
proposed that if rainbow trout are dying from metherrioglobinemia, the
higher tolerance to nitrite by young trout may be attributable to the
higher oxygen affinity of the hemoglobin in larval and possibly

juvenile stages of rainbow trout when compared with adults. On the
other hand r Perrone and Meade (1977) citing Kiese (1974) suggested
that, young individuals might have a more active me t hemoglobin
reductase system which would counteract the methemoglobin forming
tendencies of nitrite allowing fry and smaller fish to withstand
increased concentration for a longer period of time.
2.7.1.2. SPECIES-SPECIFIC TOLERANCE
The literature suggests that the toxicity of nitrite varies
greatly among fish species. For example, 96 hr LC50 values range from
0.27 mql ' N0o N for rainbow trout (Russo et al. , 1974) to 140 rriglLi
N0o-N for largemouth bass (Palachek and Tomasso, 1984b). There also
appears to be toxicity variations within species. The reported 24 hr
_ 1LC90 values for channel catfish include 10.3 mgl N0o-N (Konikoff,
1975), 26.2 mgl N0o~N (Colt and Tchobanoglous, 1976) and 1.5 mglIj
NOo-N (Tomasso et al. , 1980). These interspecific and intraspecificLi
differences are probably attributable to the different water quality
characteristics that exist at the individual research facilities and
to genetically based differences in nitrite susceptibility among
species. The numbers and differential selectivity of chloride cells
to nitrite could also account for a portion of the differences in
nitrite toxicity among species.
In their literature review, Lewis and Morris (1986)
summarize published nitrite bioassay data for fish and give the

experimental conditions insofar as possible. They have converted all
of the LC50 data to a 96 hour basis and standardized the 96 hr LC50s
to a constant chloride concentration of; 20 mgl 1 (Table 2.3).
Actually considerably more data will be required before the
characteristics of individual species are known with confidence, but
the summary does show evidence of much Interspecific variation and
some clustering of taxa. Salmonids are among the most sensitive of
the taxa that have been studied, and show very little difference among
species. There is considerable variation among t lie warrriwater fish
taxa: c h a n n e 1 c a t f i s 11 a r e a s s e n s i t i. v e a s s a 1 in o n i. d s , and the
logperch brook stickleback, and blue tilapia seem to be similarly
sens i t i v e or on 1 y s light 1 y 1 ess so . The cy p r i n i d s , ca t os t omid s ,
mottled sculpin, and black bullhead are considerably less sensitive.
The centrarclrids are especially insensitive to nitrite toxicity.
Critical concentrations for the largemouth bass are quite high
because the blood plasma nitrite concentrations do not exceed those of
the environment.. Other insensitive taxa, including bluegill, mottled
sculpin, catostomids, and some of the least sensitive cyprinids,
should also be studied for blood plasma response to nitrite in the
environment.

Table 2.3. Summary of nitrite LC50 data (median lethal concentrations) for all fish species on which there
are published data
Species
Rainbow
trout
Source
(1)
(2)
I 3V I
(4)
(5)
(6)
CI
(mgl 1)
0.35
0.24
0.24
0.24
0.24
10
10
10
10
0.35
1.2
5.1
10.4
20.2
40.9
40.8
1.0
38
1.4
2+Ca
(mgl 1)
60
54
54
54
54
51
5r
51
51
50
50
50
50
50
50
50
4
4
8
Alkalinity
(CaCC3,
mgl 1)
176
164
139
174
186
174
177
188
184
177
177
177
177
177
177
177
25
Temper¬
ature
(°C)
10
11
12
11
11
12
12
12
12
10
10
10
10
10
10
10
10-
10
10
10
PH
7.9
7.3
7.2
7.9
8.6
7.5
7.9
8.5
8.6
7.8
7.9
8.0
7.9
7.8
7.7
7.7
7.0
7.0
6.2
LC50
NO2-N
0.24
0.27
0.15
0.26
0.70
3.74
3.54
4.35
5.34
0.25
0.46
2.36
3.54
6.69
12.20
12.60
3.7
9.8
1.6
0.5(0.9)
Time(hr)
for
LC50
96
96
96
96
96
96
96
96
96
96
96
96
96
96
96
96
96
96
24
96
LC50
adjusted
to 96 hr
0.24
0.27
0.15
0.26
0.70
3.74
3.54
4.35
5.34
0.25
0.46
2.36
3.54
6.69
12.20
12.60
3.7
9.8 .
0.8
0.5(0.9)
LC50
adjusted
to 96Jar,
20 mgl CI
5.90
8.06
7.94
8.05
8.49
6.62
6.42
7.23
8.22
8.02
5.88
6.65
6.31
6.63
6.18
6.61
9.4
4.6
5.9(6.3)

Table 2.3. — Continue
SDecies Source (wal fmcrl mal
Cl~ Alkaline
(CaCO..
Tempei LC50
NO -N
Time (h.
for
LC50
adjuste
LC50
adjusted
to 96 hr.
Chinook
salmor
Cutthroat
trout
Ictaluridae
Channel
catfish
Black
bullhead
Cyprinidae
Fathead
minnow
(7)
(8)
(9)
(io;
(11)
(12)
(13)
(14)
(3)
l.S
4.2
S.A
l.S
l.S
1
2
0.44
22
i n
0.35
0.35
1 f
4(
7(
If
If
If
3.
80
OA
53
5
10
30
5
5
6
i nc
65
220
177
177
10
10
10
10
10
10
15
13
9
23
22
13
6.8
7.2
7.8
6:c
7.C
7.!
8.'
8.0
0.5(1.9)
4.7(5.8)
10.3(12.]
0.3(1.4)
1.59
2.5(3.6)
0.88
9.2
5.75
7.6
12.8
•
2.99
96
96
96
96
96
96
96
24
48
96
96
yb
96
0.5(1.9)
4.7(5.8)
10.3(12.1
0.3(1.4)
1.5(2.3)
2.5(3.6)
0.88
4.7
4.6
7.6
12.8
2.99
5.7(7.1)
9.2(10.4)
13.6(15.4)
3.6(4.7)
4.8(5.6)
6.
42

Table 2.3. — Continued.
Species Source
CI 1
(mgl 1)
2+Ca
(mgl )
Alkalinity
(CaC03,
mgl 1)
Temper¬
ature
(°C)
?H LC50
no2-N
Time(hr)
for
LC50
LC50
adjusted
to 96 hr
LC50
adjusted
to 96_lr,_120 mgl AC1
European
minnow
Creek chub
Common carp
Catostomidae
White sucker
Quillback
Centrarchidae
Largemouth
bass
Bluegill
Other families
Mosquitofish
Blue tilapia
Logperch
(15)
(16)
(17)
(14)
(14)
(14)
(15)
(18)
(19)
(15.)
(14)
22
22
9
10
10
10
22
60
60
5
5
22
10
80
80
27
80
80
190
190
98
190
100
190
23
23
20
18
23
30
30
30
30
22
23
7.9
7.9
8.3
7.9
4.0
7.2
4.0
7.2
7.3
7.9
70
45
28
81
40
100
100
140
4.4
211.3.
4.6
282.0
1.5
16.0
5
96
96
96
24
28
48
24
96
24
24
24
24
96
96
24
70
45
28
41
32
80
80
140
2.4
108
2.4
144
1.5
16.0
3
66
41
63
52
100
100
140
108
144
15
9

Table 2.3. — Continued.
-1 2+C1 Ca Alkalinity Temper-
(CaC03, ature
PH LC50
no2-n
Time(hr) LC50
for adjusted
LC50 to 96 hr
LC50
adjusted
to 96_hr, _
20 mgl CISpecies Source (mgl 1) (mgl mgl (°C)
Brook (14)
stickleback
Mottled
sculpin
i y
Milkfish (20)
10
0.35 53 177
26.8
8884.2
49
253
13
27
27
8.1
8.0
8.2
5
67
12
675
24
154
48
48
3
67
9
106
(1)
(2)
(3)
(4)
(5)
(6)
(7)
(8)
(9)
(10)
(11)
(12)
(13)
(14)
(15)
(16)
(17)
(18)
(19)
(20)
Russo et al. (1974) ; chloride from Russo and Thurston (1977)
Russo et al. (1981) ; weighted means accorking to number of fish; pH treatments involve different
anion treatments.
Russo and Thurston (1977) ; calcium estimated from Thurston et al. (1978) .
Eddy et al. (1983).
Smith and Williams (1974).
Wedemeyer and Yasutake (1978); 5-g fish (10-g fish).
Westin (1974).
Perrone and Meade (1977) ; based on observed 50 % mortality, not a true LC50 analysis.
Crawford and Allen (1977).
Thurston et al. (1978).
Konikoff (1975).
Colt and Tchobanoglous (1976).
Palacheck and Tomasso (1984b); calcium estimated from hardness.
McCoy (1972) ; chloride values estimated from personal communication with city of Madison, Wisconsin.
Palacheck and Tomasso (1984a); higher LC50 is for fish of 0.30-0.83 g, lower for fish of 0.9-3.33g;calcium estimated from hardness.
Klingler (1957).
Gilette et al. (1952).
Huey et al. (1982) ; pH 4 probably unrealistic; 60 mgl Cl calculated from Cl : NO- ratio for 24 hr LC50.Wallen et al. (1957). ' 2-
Almendras (1987).
Adapted from Lewis and Morris (1986).

2.7.2. ENVIRONMENTAL FACTOR
2.7.2.1. CHLORID
Prior Io 1977, I lie literature on nitrite toxicity suggested
great random variation in the toxicity ol nitrite to fish, even within
the same species. In 1977, however, Crawford and Allen showed that
the toxicity of nitrite to small chinook salmon depended greatly on
the salinity of the water in which the nitrite exposure occurred;
mortality in sea water occurred at nitrite concentration 50 to 100
times higher than in fresh water. In the same year, Perrone and Meade
showed that chloride could protect coho salmon against nitrite
toxicity and proposed that chloride competes with nitrite for
transport across the gills (also see Russo and Thurston, 1977). The
effect of chloride on the toxicity of nitrite is now known to be so
great that experiments in which chloride concentrations are not
d o e u m ente d a re of v e r y 1 i. 11 1 e v a 1 u e 1) e c ause t. h e y c a n n o t be
meaningfully compared with the results of other studies.
Although several studies offer comparisons of toxicity at
two or three chloride levels (Crawford and Allen, 1977; Wedemeyer and
Yasutake, 197 8; A1 mendras, 1.987), very few are based on a
sufficiently large number of chloride concentrations that the complete
form of the relationship between chloride and toxicity can be
discerned. One of the best studies on salmonids is that of Russo and
Thurston (1977). who gave the results of nitrite toxicity tests at six

chloiide concenllat ions for rainbow trout. Nitrite toxicity decreases
i th increasing cli.lorj.de ion concentration, and the relationship
between them is linear. The slope of the regression line of the
relationship between 96 lir LC50 (Y, rngl-1 N0o~N) and chlorideZj
concentration (X, rngl 1) is 0.29: an increase of 1 rngl-1 in the
concentration of chloride raises the 96 hr LC50 by 0.29 rngl-1 NC-N.
Toniasso e_t a_l. (1979) compared methemoglobin levels of
channel catfish over a range of chloride and nitrite concentrations.
it is clear from the experiments that chloride concentration is very
important in governing methemoglobin formation. For example, channel
~ 1catfish in water containing 3.54 rngl chloride developed a 77 T
methemoglobin level in the presence of 1.5 rngl 1 N0o~N. In contrast,
in the presence of 60 rngl 1 chloride and the same amount of nitrite,
the methemoglobin level was indistinguishable from background (8.8 %) .
Schwedler and Tucker (1983) did a study similar to that of
Toamsso el_ al. (1979) . Combining their own data with those of Tomasso
e_t_ aJL. , they concluded that the relationship between percent
met hemoglobin (Y) and their molar ratio of nitrite to chloride (X) was
Y = 7.33 + 78.17 X. Dowser el al. (1983) found that the 96 hr LC50
for channel catfish corresponded approximately to 80 % (70 - 90 %)
methemoglobin, for which the molar ratio X is 0.94 according to the
equation. The implication of this relationship is that the addition
of 1 niM of chloride (35 rngl1) raises the 96 hr LC50 for nitrite by
_ 1
approximately 0.94 mM (13 rngl ).

Another relationship between chloride and nitrite can be
derived from the combined data of Palachek and Tomasso (J 984a), Russo
and riu.iLston (197), and McConnell (1.98b) for the fathead minnow. As
shown by McConnell (198b) from regression analysis of this combined
data set, 1 inM of chloride (3b mgl ') raises the 96 hr LC50 for
nitrite by 5.08 mM (70 mgl '). Among the three species for which a
chloride-toxicity relationship is available, rainbow trout and channel
cattish are the most sensitive and the fathead minnow is considerably
less sensitive. {he effect of chloride on LC50 for nitrite appears to
be inversely related to sensitivity of a fish species to nitrite: the
most sensitive species benefit least from chloride addition, although
the benefit is large even for sensitive fish. Possibly the less
sensitive fisli are able to discriminate to some degree against
nitrite, and thus chloride is more potent in offsetting nitrite
toxicity in these fish.
2.7.2.2. OTHER ANIONS
There is some information on the effects of anions other
than chloride on nitrite toxicity. Bromide, which is similar
chemically to chloride, was studied by Eddy et_ al. (1983), who found
that 80 mgl-1 bromide was enough to offset completely the presence of
32 mgl1 N0o~N for Atlantic salmon in fresh water. Although this
shows that chloride is not the only ion that can offset nitrite
toxicity, bromide is not normally a major constituent of fresh waters.

Bicarbonate, although chemically very different from
chloride, is of interest because it accounts for a high fraction of
the total anions in fresh waters. The studies by Eddy e_t al. (1983)
on Atlant ic salmon included a test of the effect of sodium bicarbonate
on nitrite toxicity. A concentration of 152 mgl-1 HCO did reduce
toxicity significantly, but not nearly so much as bromide at 80 mgl1.
Huey et al. (1980) showed for channel catfish that 610 mgl 1
HCO was sufficient to hold met hemoglobin levels at 8 T, the
background level, whereas controls without bicarbonate showed 60 %
methemoglobin at the experimental exposure of 0.76 mgl N09-N. C—I
Given the general relationship already described for channel catfish,
it is estimated that 2 mgl 1 (0.057 riiM) of chloride, which is the
amount required to offset 0.76 mgl 1 (0.054 inM) of NOo-N, would have
been required to hold methemoglobin levels near background. In
contrast, 610 mgl' (10 mM) was required to achieve almost complete
suppression of methemoglobinemia. Thus on a molar basis, the
bicarbonate ion in this case was approximately 0.54 % as effective as
the chloride ion.
Bath and Eddy (1980) showed that rainbow trout experiencing
90 mortality at 9.8 mgl1 N09-N (0.7 rnM) after 72 hr showed 50 %.j
survival under the same conditions in the presence of 152 mgl 1 (2.5
rnM) bicarbonate. This experiment, like the one already mentioned,
suggests that bicarbonate is effective, but not so effective as

chloride, in offsetting nitrite toxicity. Bowser et al. (1983) also
found that bicarbonate was less effective than chloride in preventing
methemoglobinemia. ft has been reported that freshwater fish give out
bicarbonate in exchange for chloride by the anion exchange mechanism,
llms chloride uptake from the medium is inhibited by bicarbonate and
bicarbonate may repress nitrite uptake by a similar mechanism.
Russo et al. (1981) documented a small nitrate repression of
nit jite toxicity. Divalent and t. rival en t anions that have been
studied in connection with nitrite toxicity include sulfate, phosphate
-1and borate. Huey et al. (1980) found that 1.42 gl of sodium sulfate
failed to reduce the methemoglobin percentages of channel catfish
exposed to 0.76 mgl N0o N. Eddy et al. (1.983) showed that magnesiumZJ
sulfate and potassium sulfate at sea water concentrations had very
little effect on the toxicity of nitrite to rainbow trout. Russo el
al. (1981) showed minimal effects of sulfate and phosphate on the
toxicity of nitrite to rainbow trout.
In summary, the literature presently shows that chloride and
brom 1.de are highly effective in reducing nitrite toxicity, that
bicarbonate and nitrate have detectable effects but are not nearly so
effective as chloride and bromide, and that divalent and irivalent
anions have very little effect on nitrite toxicity.

2.7.2.3. CATIONS
Calcium, magnesium, sodium, and potassium are typically
present in considerable quantities in fresh- or sea- waters. The
effects that these ions might have on nitrite toxicity are therefore
of interest, however, most of the available information on this
subject are concerned with calcium ion.
Crawford and Alien (1977) studied the effect of calcium and
sea water on nitrite toxicity to chinook salmon. They found that the
addition of calcium sulfate to fresh water and calcium-free artificial
sea water decreased the toxicity of nitrite. These observations
suggested that calcium is an important antagonist to nitrite toxicity
and may be responsible in part for the very high nitrite tolerance
seen in natural sea water experiments. However, the authors suggested
that another factor was also involved because they found that raising
the calcium concentration of the fresh water to the level of natural
sea water decreased the toxicity of nitrite but did not reduce
methemoglobinemia. Conversely, nitrite in calcium-free artificial sea
water was highly toxic but did not induce appreciable
methemoglobinemia. The dissociation of. methemoglobinemia from
mortality in the presence of calcium in these tests remains
unexplained and has not yet been reported in other studies.
Although Bath and Eddy (1980) gave additional evidence for a
possible connection between calcium and nitrite toxicity, they did not

separate the effect of calcium from that of anions (N03 ) added with
calcium, toi this reason, the results are inconclusive with regard to
c a 1 c i u m.
Bowser et a_L. (1983) found that sodium chloride and calcium
chloride provided equivalent protection against nitrite toxicity for
channel catfish, suggesting that the identity of the metal cation was
of little importance. Tomasso e_t_ al . (1980) provided similar
information for channel catfish. Wedeneyer and Yasutake (1978) found
nitrite to be markedly less toxic in the presence of calcium than of
sodium, but their results are difficult to interpret because the LC50
values are very different from the others reported in their paper or
elsewhere in the literature for similar chloride concentrations.
Calcium lias been reported to be able to reduce diffusion by altering
membrane permeability (Potts and Fleming, 1970). Krous e_t al. (1982)
also pointed out that high concentrations of calcium generally reduce
the efflux of chloride through the gills. Perrone and Meade (1977)
proposed that nitrite is actively pumped across the gills at the
chloride uptake sites (chloride cells). If this is the case, the
reduced branchial efflux of chloride, in turn, reduces the requirement
for uptake of chloride, which decreases the uptake of nitrite.
Conversely, reduced calcium concentration will stimulate chloride cell
proliferation and activity in response to ion efflux, resulting in a
higher uptake rate for chloride and available nitrite. Thus there are
theoretical reasons to expect that calcium ions will reduce the
toxicity of nitrite, although experimental work that lias been done

thus far suggests thai the effect is a weak one.
2.7.2.4. pH
The aqueous nitrite equilibrium N0o + LT — HN0o is pH-
dependent, however the effect of pH on toxicity of nitrite is still
very uncertain. Contributions to the literature on this subject
frequently are not definitive because they fail to separate the
possible effects of anions from those of acidity or they use pH ranges
outside the normal adaptive range of the fish.
Bath and Eddy (1980) reported for rainbow trout that acidity
of t lie water had no significant effect on nitrite toxicity except at
extreme pit Levels (below pll 5 and above pLI 10), but they did not give
details of their findings. Working with coho salmon at two different
chloride levels, Meade and Perrone (1980) showed that pH, which they
controlled by means of a tris buffer, affected the plasma nitrite
concentrations and plasma methemoglobin. Within a pH range of 6.5 to
8.0, they found that both methemoglobin and plasma nitrite were about
twice as high at pll 6.5 as at pll 8.0 (15 rrigl CI and 10 mgl NO 9-
N). The use of a buffer for manipulation of pH in such an experiment,
however, changes the anion background. Thus it is difficult to
separate the effects of changing anion background from the effects of
acidily.
For channel catfish, Huey et al. (1980) adjusted the holding

water to a pH ot 5.3 using a phosphate buffer and to a pH of 9.1 using
a sodium bicarbonate buffer. Channel catfish held at 0.76 mgl N0?-N
for 24 hour showed rnef.henioglobin levels of 11 1 at pH 9.1 and 76 % at
pll 5.3. Because experimental evidence suggests that bicarbonate
reduces t lie uptake of nitrite, the addition of 1,220 mgl-1 (20 mM)
bicarbonate, as in these experiments, might well result in reduced
met hemoglobin levels even in the absence of a pH change. Thus it is
difficult to interpret the experiments from the viewpoint of pH alone.
In other experiments, Huey e_t al. (1982) used pH 4 as the
lower end of a pH test range for bluegill. Although there was
substantial interaction between pH and nitrite toxicity because of a
lower LC50 at pll 4, the results are probably not very meaningful
because pH 4 is well outside the normal adaptive range of fish.
The strongest case for an pH effect is based on the work of
Wedemeyer and Yasutake (1978) with steelhead. In these experiments,
the pH of soft water was adjusted to 6, 7, and 8 with a weak phosphate
buffer. If results for pH 6, which is extreme for steelhead in view
of the unlikelihood that such a pH would occur in its natural
environment, are discounted, the results showed 96 hr LC50s of 1.5
rrtgl N0o-N at pH 7 and 2.5 mgl-1 N0o-N at pH 8 for fish weighing 5 g.L J
The LC50s were 2.3 mgl 1 at pH 7 and 3.6 mgl-1 N02N at pH 8 for fish
weighing 10 g. The pH effect, although statistically significant, was
small. Furthermore, it sliould be noted that pH adjustment of soft
water changes the bicarbonate content of the water by influencing the

atmospheric equilibrium of carbon dioxide with water.
Expe 1 i men t s by Rus so e t a 1 . (19 81) on r ai nbow t r ou t
demonstrated that over a pH range from 6.44 to 8.10, there was no
pattern in the 96 hr LC50 (correlation analysis; DO.05). Above pH
8.1, the authors added sodium hydroxide to maintain high pH, and the
96 hr LC50 began to show a pH response. However, a pH in excess of
8. J. might be outside the adaptive range in view of its rarity in
natural trout habitats; the experiments do not demonstrate a pH
effect within the most environmental pH range.
In summary, in spite of frequent references to the role of
pH in governing nitrite toxicity, there is no unequivocal evidence as
vet for an effect of- pH on nitrite toxicity over the normal
environmental pH range of freshwater or seawater fishes. The interest
of investigators in the importance of pH has been very high since the
suggestion, based on experiments by Colt and Tchobanoglous (1976),
that the amount of blood plasma nitrite of fishes is governed by the
entry of undissociated nitrous acid through the gills. For example,
Wedemeyer and Yasutake (1978) concluded that pH must have an important
effect because it controls the balance between nitrite and nitrous
acid, b o t h 1 n 111 e m e d 1 i m a n d i n side the fish. Ho w ever, the
proposition that nitrous acid is the main mode of entry of nitrite
into fish is still very much open to question. As mentioned before,
the weight of evidence at present favols the inteipietion that the
nitrite ion is pumped into the fish through the gills except in those

fish that are able to discriminate against nitrite (eg. largemouth
bass), and that (lie role of pH in governing the entry of uridissociated
11 i 1 1.0us acid is unimportant. This does not rule out some roles for
the hydrogen ion, however. For example, as pointed out by Meade and
Pei'rone ( 1 9 8 0 ) , a change in the pH could alter the uptake
characteristics of the ion-concentrating mechanisms in the gills,
leading to pH effects over very large pH ranges. Over the most likely
natural pH ranges, once the effects of different ionic backgrounds
have been taken into account, the effect of pit on nitrite toxicity
appears to be small.
2.7.2.5. TEMPERATURE
Temperature has multiple effects on agnatic ectotherms such
as fish. Not only can temperature directly cause death (i.e. act as a
lethal agent), nonlethal temperatures may influence the toxicity of
chemicals, or alternately the ability of a fish to resist a particular
chemical. Elevated temperature increases the diffusion of molecules
through water, gill permeability and metabolic rates. The latter
increases oxygen demand and hence gill lamellar blood flow. Increases
in the rate of these internal and external process enhance chemical
uptake, particularly in chemicals such as nitrite whose primary port-
of-entry is the gill surfaces. Also Bath and Eddy (1980) suggested
that fish can transport nitrite against a concentration gradient via a
brachial anion exchange mechanism. Thus it is expected that the

toxicity of nitrite increases with increasing temperature.
I he only experimental study of the relationship between
temperature and nitrite toxicity appears to be for channel catfish
(Colt and Tchobanoglous, 1976; Huey et al., 1984) Over a relatively
small range (22 - 30° C) , Colt; and Tchobanoglous (1976) showed no
significant relationship between nitrite toxicity and temperature. In
the study of Huey e_t al. (1984), channel catfish held at 30°C in the
presence of 0.91 mgl N0o-N over a period of 24 hours developed
met hemoglobin concentrations almost twice as high as those of fish
held at 10°C. The higher methemoglobin level, however, did not
necessarily indicate that greater lethality would occur at. 30°C. Huey
et al. (1984) found that the fish held at 30°C showed a more rapid
return to background methemoglobin levels following a 12 hour recovery
period in nitrite-free water. These data suggested that increases in
internal responses such as biochemical transformation and depuration
may serve to compensate for increase uptake rates at higher
temperature. The activity of the methernoglobin-reductase system is
optimized and result in greater loss of methemoglobin in the 30°C
acclimation group.
The higher amount of oxygen in water and the lower metabolic
rates of fish al lower temperatures might render nitrite a less potent
toxin at lower temperatures. However, given that lower temperatures
also reduce the efficiency of detoxification mechanisms, general

conclusions should be aDnroached win. r«;ni t i nn
I eiiipe l a 111 l e toxic 1t y re 1 a I i onshi ps a re comp 1 e x . Th i s
complexity exists because temperature can affect any or all of the
separate environmental, biochemical, physiological processes such as
chemical availability, uptake, internal processes may have its own
unique relationship with temperature. Since fish species appear to
possess different temperature optima, it is possible that temperature-
toxicity relationship may need to be studied on a chemical-by-chemical
and species-by-species bases.
2.7.2.6. OXYGEN
Oxygen can affect the toxicity of nitrite because nitrite
reduces the oxygen-carrying capacity of the blood; reduction of the
oxygen supply in the external medium will exacerbate the oxygen supply
problem within the fish. In the only published study that bears on
this qestion, Dowser et al. (1983) showed that an oxygen concentration
of r mgl , in tlie presence of nitrite, was not sufficient for channel
catfish, even though channel catfish normally tolerate oxygen
o one en t r;i 1 inns below this.

2.8. TREATMENT AND PREVENTION
Nitrite intoxication occasionally occurs and treatment will
be necessary. A number of compounds have been used to treat or
prevent methemoglobinemia, of them methylene blue and ascorbic acid
are most commonly used. Commercial fish farmers usually administer
high dietary ascorbic acid for the cultured fish to prevent
methemoglobinemia. Wedmeyer and Yasutake (1978) have demonstrated
-1that methylene blue at 0.1 or 1.0 rngl was effective in decreasing
acute nitrite toxicity. For alleviating methemoglobinemia, removing
_ 1
the fish to fresh water was about as effective as 0.1 mgl
treatments. However, 1 mgl methylene blue did dramatically reduce
the methemoglobinemia during the first few hours which would probably
be a critical advantage in treating severely poisoned fish.
The rapid prevention of nitrite - induced methemoglobinemia
and mortality provided by chloride and bicarbonate ions indicate that
nitrite crises encountered would include replacing contaminated water
with fresh water or the addition of monovalent anions. If these
methods can be administered with little disturbance of severely
stressed fish, recovery from methemoglobin should occur within 24
hours (Huey et al., 1980).

CHAPTER THREE DETERMINATION OF THE 96 HOUR MEDIAN LETHAL
CONCENTRATIONS OF NITRITE FOR LATES CALCARIFER
IN FRESH WATER, 15 000 SEA WATER AND
32 ° SEA WATER
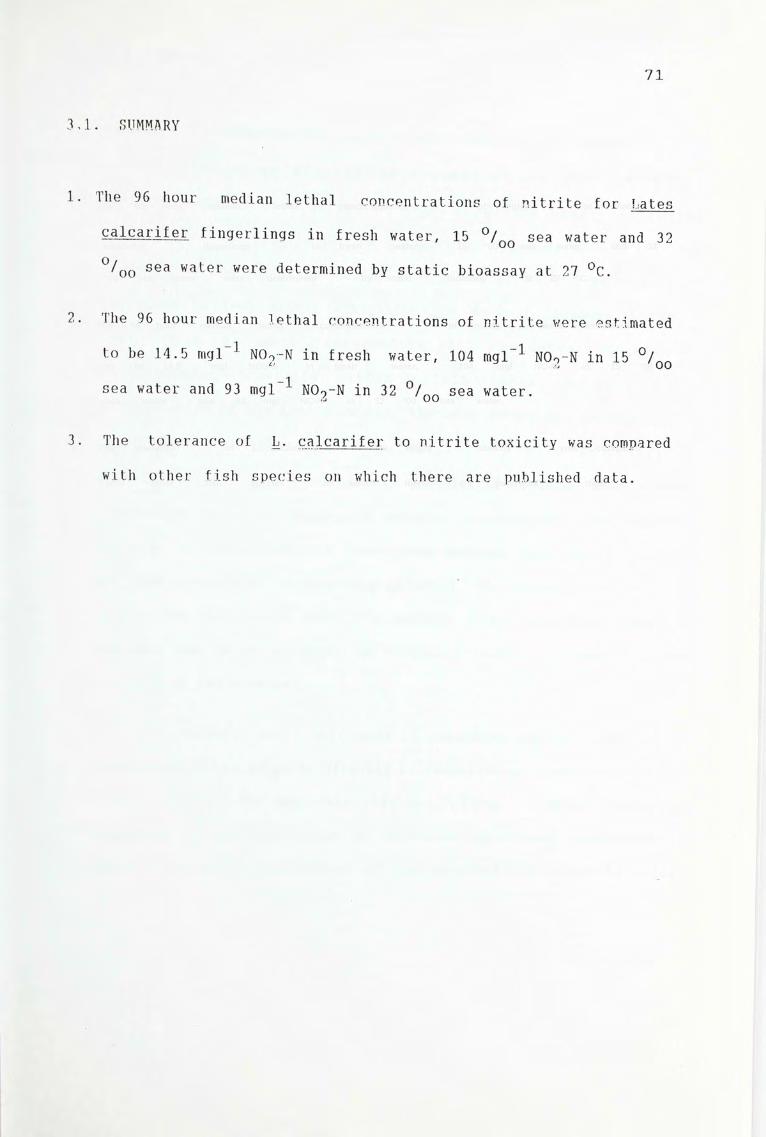
3.1. SUMMARY
1. The 96 hour median lethal concentrations of nitrite for hates
calcarifer fingerlings in fresh water, 15 °00 sea water and 32
°00 sea water were determined by static bioassay at 27 °C.
2. The 96 hour median lethal concentrations of nitrite were estimated
to be 14.5 mgl NOo-N in fresh water, 104 mgl NC-N in 15 °00i
sea water and 93 mgl NC-N in 32 °00 sea water.
3. The tolerance of L. calcarifer to nitrite toxicity was compared
with other fish species on which there are published data.

723.2. INTR0DUCTTON
in measuring the toxicity of a chemical, the objective is to
estimate Lite range of chemical concentrations that produce a
deleLerlous effect on groups of test organisms under controlled
condi Lions. The results of the exposure are plotted on a graph that
relates the concenLrat,fou of the Lest chemical to the percentage of
organisms in test. groups exhibiting the defined response. Such a
correlaLiou Is commonly referred to as a concentration-response
relationship. Generally, within certain limits, the greater the
concenLraL.ion of Lite tent chemical, Lite more severe the response. The
curve drawn to represent this relationship will generally be
asymptotic (Fig. 3.1.) since at all concentrations below some minimum
(threshold) value no measurable adverse response will be elicited,
while at all. concentrations above some maximum value most or all of
Lite Lest groups will be adversely affected. The concentration at which
50% of the individuals react (Lite median) after a specified length of
exposure (eg. 24 or 48 hours) is therefore used as a measure of the
toxicity of the chemical.
Toxieity tests with aquatie organisms can be conducted by
administering the material directly by injection or incorporation into
food. However, for materials that are soluble in water, tests are
conducted by exposing groups of organisms to several treatments in
which different concentrations of the material are mixed in water.
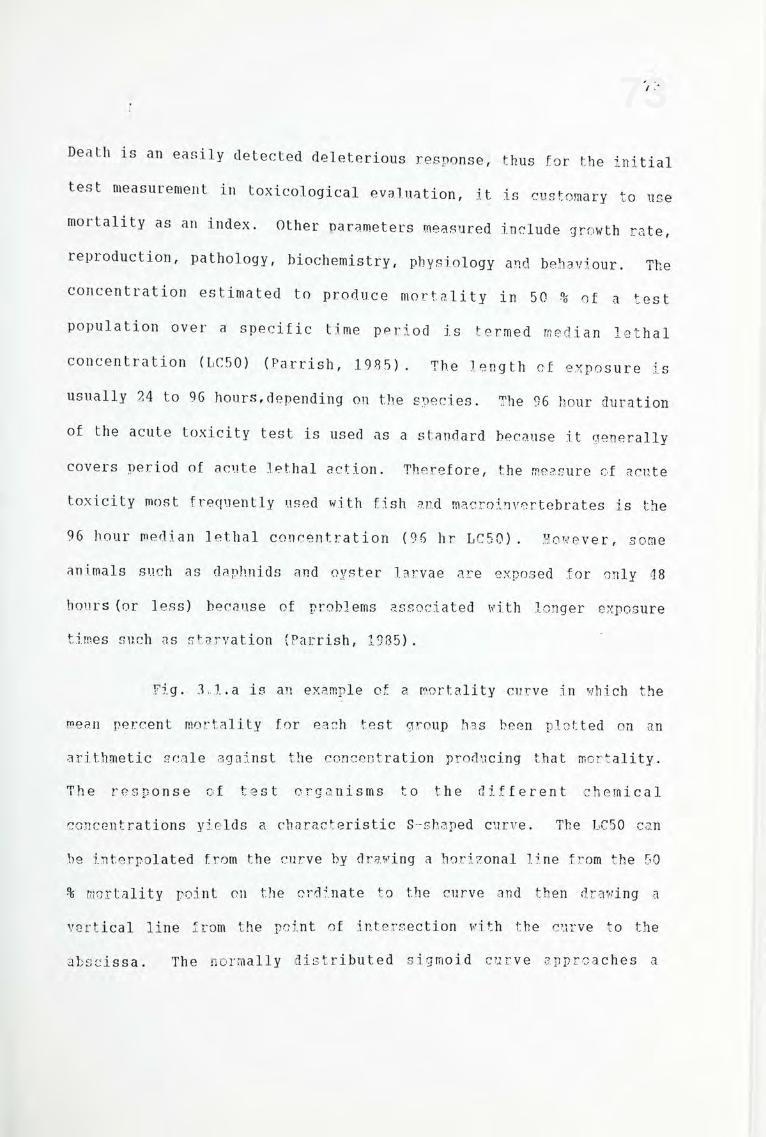
73Death is an easily detected deleterious response, thus for the initial
test measurement in toxicological evaluation, it is customary to use
mortality as an index. Other parameters measured include growth rate,
reproduction, pathology, biochemistry, physiology and behaviour. The
concentration estimated to produce mortality in 50% of a test
population over a specific time period is termed median lethal
concentration (LC50) (Parrish, 1985). The length of exposure is
usually 24 to 96 hours,depending on the species. The 96 hour duration
of the acute toxicity test is used as a. standard because it generally
covers period of acute lethal action. Therefore, the measure of acute
toxicity most frequently used with fish and macroinvertebrates is the
96 hour median lethal concentration (96 hr LC50). However, some
animals such as daphnids and oyster larvae are exposed for only 48
hours (or less) because of problems associated with longer exposure
times such as starvation (Parrish, 1985).
Fig. 3..1.a is an example of a mortality curve in which the
mean percent mortality for each test group has been plotted on an
arithmetic scale against the concentration producing that mortality.
The response of test organisms to the different chemical
concentrations yields a characteristic S-shaped curve. The LC50 can
be interpolated from the curve by drawing a horizonal line from the 50
mortality point on the ordinate to the curve and then drawing a
vertical line from the point of intersection with the curve to the
abscissa. The normally distributed sigmoid curve approaches a

mortality of 0 T, as the concentration is decreased and approaches 100
r as the concentration is increased. The middle portion of the curve,
in the region between 16 and 84 T, is almost linear. These values
represent the limits of 1 standard deviation (CD) of the mean (and the
median) in a normally distributed population of organisms. In a
normally distributed population, the mean + 1 81) represents 68.3 % of
the test population, the mean + 2 SD 96.5 °6 of the test population,
and the mean + 3 81) 99.7 % of the test population (Rand and
Petrocelli, 1985).
Fig. 3.1.1) is a plot of the data in Fig. 3.1.a, but with the
concentration shown on a logarithmic scale (transformed data). The
sigmoid shape is again evident but the curve approaches a straight
line. Fig. 3.1.c represents another transformation of the same data,
with the logarithm of concentration plotted against percent mortality
expressed as probits. The probit transformation adjusts mortality
data to an assumed normal population distribution, which results in a
straight line being the best fit curve. The LC50 is obtained by
drawing horizontal and vertical lines in the same manner described for
Fig. 3.1.a.
The 1ogarit 11mic conversioii was introduced by Krogh and
Hemmingsen (1928, cited in Rand and Petrocelli, 1985) and later by
Gadd urn ( 1 9 3 3, cited in Rand and Petrocelli, 1 98 5 ). Since
concentration-response data are normally distributed, the percent
response was converted to units of deviation from the mean or normal

75equivalent deviations (NEDs) by Gaddum (1933, cited in Rand and
Petrocelli, 1984). The NED for a 50 % response is zero and that for
an 84.1 % response is +1. Bliss (1934 a,b, cited in Rand and
Petrocelli, 1985) later suggested that 5 be added to the NED to
eliminate negative numbers. The converted units of NED plus 5 were
called probits. The LC50 estimated by graphical interpolation is
accurate and usually similar to the LC50 obtained by formal
statistical analysis (Rand and Petrocelli, 1985).
The toxicity of nitrite to aquatic animals has received
considerable attention over the past ten years. The median lethal
concentration of nitrite has been widely studied in many freshwater
fish species, but in only few euryhaline or seawater fish species
(Crawford and Allen, 1977).
The present study aims at determining the 96 hour median
lethal concentrations of nitrite for the euryhaline fish, Lates
calcarifer, in fresh water, 15 0/00 sea water and 32 0/00 sea water.
L. calcarifer is an economically important food fish in Hong Kong. In
recent years, intensive aquaculture of L. calcarifer has developed
very rapidly due to the economic feasibility of commercial production
of this food fish. The data derived from this study hopefully can
contribute to a better and efficient management of this species if
closed culture systems are employed.

I nr ln
7e:
cn
0 I T 7 ' rTlin Irti nnWUT1 rRr
[b)
20i
sni
1nn 200
£□
hCCO5h-zUJoa:uja
99.!tr)
on
QO
cr
ir
n 1 - I I nr
TI rcr
.c
- 7
—e
__e
—A
I -•
- 2
C)H5oa:a
E-jHcco
hZwuCCUla
CONCFNTnATlON (ma for nnm) OF TFST CHEMICA
Figure 3.1. Mortality in a fisti population exposed to a range of concentrations of a chemical Inwater, (a) Percent mortality versus concentration plotted on an arithmetic scale. (;) The samedataas in (a), but with mortality on an arithmetic scale and concentration on a logarithmic scale,(c) The samedata as in (a), but with mortality expressed as probits versus concentration on a log¬arithmic scale. The dotted lines on each side of the curve represeht the 95%confidence limits.
Adapted from Rand and Pctrocclli (1905)

773.3. Materials and Methods
3.3.1. Experimental animals
Sea. bass, Laces calcarifer, fingerlings were purchased from
Thailand. All fish were acclimated to dechlorinated tap water, 15
u/oo sea water or 32 o/oo sea water for at least 4 weeks prior to
testing in separate 400-1 fibreglass tanks. They were fed to
satiation twice daily with minced trash fish meat. Feeding was
cliscoiitinued 24 hours before fish were transferred into experimental
tanks to initiate the experiments.
3.3.2. Deletaniuation of the 96 hour median lethal concentrations
Fish (8.2+ 0.28 g), in groups of twelve, were transferred
aL random into 20-1 test tanks containing dechlorinated tap water, 15
0/00 sea water or 32 0/0O sea water. After adapation for 24 hours,
the water in each Lank was renewed and except the contrdl, each tank
was dosed with an appropriate amount of reagent grade sodium nitrite
to produce the required, test concentrations. The test water was
constantly aerated to maintain the dissolved oxygen content at
saturation. The tests were conducted at.26-28 0C. The pH of 15 0/00
and 32 0/00 sea water was 8.0, and the p11 of fresh water was adjusted
to 8.0 by the addition of sodium hydroxide. Water characteristics
and the nitrite concentrations were measured at the beginning and the
end of the tests and were found *to vary by less than 5%.

78Mortalities were monitored every 12 hours and totalled after
96 hours. The criteria for death are lack of gill movement and lack of
reaction to gentle prodding. Dead individuals were removed from the
tank, and death was confirmed by the inability to recover in nitrite-
free water. The 96 hour median lethal concentration were determined
according to the method of Litchfield and Wilcoxon (1949).
Test water nitrite concentrations were determined by the
Azo-dye method as described by Strickland and Parsons (1972). The pH
was measured with a research grade pH meter and the salinity with a
refractometer.

793.4. Results
The mortality curves of Lates calcarifer upon exposure to
nitrite in fresh water, 15 0/00 sea water and 32 0/00 sea water were
presented in Fig. 3.2, Fig. 3.3 and Fig. 3.4. In order to estimate
the 96 hour median lethal concentrations more accurately, the same
data were plotted on a probability graph with mortality expressed as
probits versus nitrite concentration on a logarithmic scale. The 96
hr LC50s were estimated to be 14.5 mgl-1 N02-N in fresh water (Fig.
3.5), 104/ mgl-1 N02-N in 15 0/00 sea water (Fig. 3.6) and 93 mgl-1
NO2-N in 32 0/00 sea water (Fia. 3-7).

100
00
iH
60cHy
)-i
401)44
20
fresh water
0 5 10 15 20 25 „ 30
Water nitrite concentration
Figure 3.2. CuLmulative percent mortality of fates calcarifcr
exposed to a range of concentrations of nitrite
for 96 hours in fresh water.

101
HO
GO
40
20
0 50 HO 100 15C 200
WATER NITRITE CONCENTRATION (mgl NON)
Figure 1.3. OnImulatIve percent mortal 1 l:y of Laics
caiuarlfor exposed to a range of coh-
cenlratlons of nitrite for 96 hours
In 15 %o sea water.
1S %0
HhhrttpioX
tl
u
PiPIP4

100
00
60
40
20
0 50 00 100 150 200-1
WATER NITRITE CONCENTRATION (mgl NO -N)
Figure Culmulatlve percent mortality of Latcs
calcarlfcr exposed to a range of con¬
centrations of nitrite for 96 hours
In 32 %. sea water.
3 a
HH
UOX
huPaPJPa
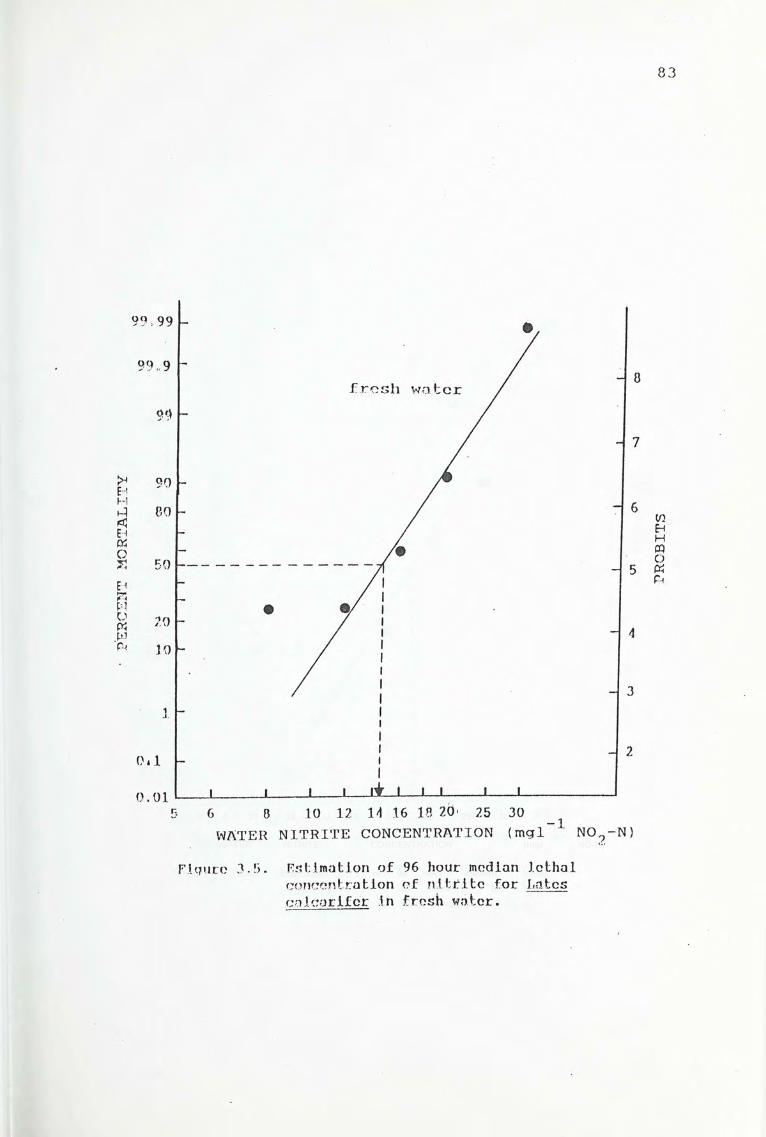
99.99
99.9
99
90
00
50
20
10
1
01
0.01
5 6 0 10 12 U 16 10 20 25 30-1
WATER NITRITE CONCENTRATION (mgl NO-N)
Figure 3.5. Estimation of 96 hour median lethal
concentration of nitrite for Latcs
calcarlfcr In fresh water.
fresh water
HH
EH«OX
EHftPIU«WP-
COEHHcqo
Ph

99.9
99.'
9'
9
0(
5(
2C
1C
1
0.1
0.01io 5n no loo 150 206
WATER NITRITE CONCENTRATION (mgl 1 NO -N)
Figure 3.6. Estimation of 96 hour median lethal
concentration of nitrite for Lates
calearlfcr in 1$ %o sea water ,
I 1
I r
6
1 5
4
3
2
IB %
I-H
Eh
Oj:
Eh£Wuwwp-
coEHHm
. o«a.

KVE-h
Vac7
I
XL(yup-
99.9
99.
9
9i
i
] OC
!!
: 5tii
I
i 2 C
I „I
1
0.1
0.01
30
3 2
50 00 100 1 cn onn
j
9
I (
J r
3
n
} W
HCQO
; Pi' Cj
WATER NITRITE CONCENTRATION
Figure 3.7. Estimation of 96 hour median lethal
concentration of nitrite for Latcs
calcarlfer In 32 %o sea water.

3 . r. DISCUSSION
Due to the different experimental conditions, it is quite
inappLopiate to compare all the results obtained in the present study
with those reviewed by Lewis and Morris (1986) (Table 2.3). However,
reasonable comparison can be made between the fresh water 96 hr LC50
0f kdkEll fLlLCHI iter and those of f reshwater f is 11 spec i es obta 1 ned
under similar experimental conditions. As far as we can see, the 96
hr LC50 in fresh water obtained for L. calcarifer is comparable to
that of t lie 1)1 ue tilapia but comparatively higher than those of
rainbow trout, cutthroat trout, chinook salmon and channel catfish.
That means L. calcarjfer is more resistant to nitrite in fresh water
than these fishes. On the other hand, L. calcarifer is more sensitive
to nitrite in fresh water when compared with other freshwater fish
species such as black bullhead, fathead minnow, European minnow and
largemouth bass. Overall speaking, L. calcarifer is moderately
resistant to nitrite in fresh water as compared to all fish species on
which there are published data.
As expected, the 96 hr LC50 values in 15 °Q0 and 32 °00
sea water were much higher than that in fresh water. This implies that
bates calcarifer is much less susceptible to nitrite toxicity in sea
water than in fresh water. The present study therefore provides
additional support 011 the protective effects of ions such as chloride,
bromide and calcium against nitrite toxicity as sea water contains a
lriqh quantity of these ions. The 96 hr LC50 value in 15 °00 sea

water was found to be higher than that in 32 °00 sea water. This may
be due to the fact that 15 °00 sea water is roughly isotonic with the
body fluid of the fish. It is possible that less energy is expended
in osmoregulatory work and thus more energy can be channelled to
resist the toxicity of nitrite. It is worth emphasizing that energy
savings in an isotonic medium are considerable as the metabolic work
of osmoregulation has been shown to be as high as 30 % of the total
energy budget (Rao, 1968) .

CHAPTER 4 EFFECTS OF NITRITE ON THE SHORT-TERM
GROWTH OF LATES CALCARIFER

4.J. SUMMARY
1 . The effects of nitrite on the growth of hat:es ca 1 carifer
fingerlings in 32 °n(J sea water were investigated.
2. The short term growth rate (on a wet weight basis) of the
fish was shown to be reduced at nitrite levels of 7 and 20
rngl N0o~N.
3. in spite of its great tolerance to high concentrations of
nitrite as reflected in the high value of 96 hr LC50,
comparative Low nitrite levels resulted in growth suppression in
the sea bass.
4. The growth response of the fish under nitrite intoxication was
variable and this could largely be attributable to the great
individual difference in susceptibility to nitrite toxicity.

4.2. INTRODUCTION
In the aquatic environment organisms are not usually exposed
to high, acutely toxic concentrations of chemicals unless they are
restricted to the vicinity of a chemical release site or spill area.
Beyond the initial impact area dilution and dispersion occur and thus
decreasing these acute concentrations to lower, sublethal levels.
Therefore, organisms are generally exposed to sublethal concentrations
of chemicals rather than to acutely toxic lethal concentrations. The
lower concentrations may not produce death, but they may have a
pronounced effect on the future survival of the organisms (Rand and
Petrocelli, 1985).
In aquaculture, an important sublethal effect of a toxicant
that warrants consideration will be its effect on growth. A toxicant
may not cause mortality which definitely results in great economical
loss, however, it may suppress the growth of cultured organisms
resulting in low yield and similar economical loss.
A review of the literature showed that studies concerning
the possible deleterious effects of nitrite on fish growth have only
been done on steelhead and channel catfish. The growth of the
juvenile channel catfish was found to be reduced at levels of 1.6
mgi~1 no9-N (one-fifth of the 96 hr LC50) and above (Colt et al.,Zi
1981). However, no significant growth suppression was observed in
steelhead at concentrations as high as 10 % of the 96 hr LC50

90(Wedemeyer and Yasutake, 1978).
The work reported here was undertaken to provide
information about the effects of nitrite on the short-term growth of
Lates calcarifer fingerlings in 32 0/00 seawater. To the best of the
author's knowledge, the toxic effect of nitrite on the growth of L.
calcarifer has not been hitherto reported.

914.3. MATERIALS AND METHODS
4.3.1. Experimental animals
Lates calcarifer fingerlings obtained from Thailand were
kept in well-aerated 32 0/00 sea water and were fed to satiation twice
daily with minced trash fish meat. The fish were acclimated for at
least 2 weeks prior to the start of the experiment.
4.3.2. Determination of growth rate
Eighteen fingerlings were randomly selected and individually
distributed to the growth chambers which were 20-1 fiberglass tanks
containing 32 0/00 sea water. The fingerlings were divided into two
groups: group A and group B. The initial wet weight of group A and
group B were 4.46+ 0.11 g and 3.61+ 0.12 g respectively. The fish
were fed minced trash fish meat equivalent to 8% of their body weight
per day. The wet weight of the fish was measured once every 10 days.
After a 40 day cultivation period, with group A serving as the
control, group B was exposed to a nitrite concentration of 20 mgl-1
N02-N( one-fifth of the 96 hr LC50 in 32 0/00 sea water). Similarly,
the fish of the control and test groups were weighed once every 10
days and the mean% increases in wet weight of the two groups were
compared.
During the whole experimental period, water temperature was

92Illai ntained at 25-28c. The dissolved oxygen was constantly kept at
dcturat ion by air pump. The 111 varied from 7.8-8.1 and the salinity
ranged from 31.-33 0/oo.

4.4. RESULTS
The ! esults derived from the growth experiment are presented
in lig. 4.1. F 01 the first 40 days of the culture period, the growth
rates of group A and B were very consistent and comparable. The mean
°6 increase in wet weight was found to be 215.27 + 12.60 % and 215.42 +
21.16 % in group A and B respectively at Day 40. The growth rates of
the two groups were not significantly different. After this 40 day
culture period, with group A serving as the control, group B was
immersed in 20 mgl ' NOn-N. In the first 3 days of nitrite exposureZ-j
(Day 13), treated finger] lugs did not show any abnormal behaviour
except that they lost their appetite. In the following days, the
response of the fish was quite variable. Dome of them seemed to adapt
to such a nitrite concentration and resumed their feeding, while
others exhibited some abnormal behaviour including darkening of body
colour, complete loss of appetite and irritant swimming. Using Day 0
as base line, the mean % increase in wet weight of group B at Day 50
was found to be 185.14 + 19.88% which was significantly lower than the
respective value (306.85 + 16.88 %) of the control group. This
indicates that during the 10 day nitrite exposure period (Day 40 - 50)
there was actually a decrease of 30.28 + 9.14 % in the wet weight of
group B. As time passed, the condition of some t Lea ted fish
deteriorated and 3 out of 9 fish in the treated group died between Day
52 and 54. Therefore, the comparison of the growth rate between group
A and B had to be terminated at Day 50 of the growth period.

94
In order to investigate the impacts of a lower concentration
of nitrite on growth, the growth rate of group A was monitored
continuously for a period of 80 days and this was found to be rather
consistent. Exposure to 7 mgl-1 N02-N was started at Day 81 and
continued for 20 days. The response of the fish was very similiar to
that encountered in the 20 mgl-1 N02-N exposure. Although this time
all of the treated fish could survive and some of them even gained
weight, the mean% increase in wet weight was reduced from 435.59+
31.89% at Day 80 to 388.21+ 39.39% at Day 100. After removal of
nitrite, the fish recovered very quickly and resumed their growth
unexpectedly well, though at a slower rate.

500
400
300
200
100
EHX0)H
g
1
fUH
W
u£H
53PIUXPIPM
group A
group B
0
10 20 30 40 50 60 70 80 90 100 110
O A Y
Figure 4.1. Effects of nitrite exposure on thefc~~tcirtn cjjrowlili of Lqf c s cQlcQirifcir
( n = 9 ) .
Values ore presented as mean i SEM

4.G. DISCUSSION
Willi reference to the high 96 hi; LC50 value in 32 °00 sea
watoL (93 my 1 NO N), a comparative high sublethal concentration of
20 mgl~ NO2--N (one-fifth of the 96 hr LiC50) was selected for the
growth experiment. This nitrite level not only resulted in serious
giowlh retardation hut; also significant mortality. A relative lower
nitrite Level of 7 myl~l N02-N (one-thirteenth of the 96 hr LC50)
similarly caused significant growth suppression. Therefore, in spite
of their great tolerance to high concentrations of nitrite in sea
water, comparative tow nitrite Levels resulted in growth suppression
in the sea bass. In the present study only two sublethal nitrite
levels were administered, thus the minimal nitrite levels that reduce
growth could not be determined.
Nitrite has been regarded as a slow-acting poision by some
researchers (Klinger, 1957). As mentioned before (see Section
2.7.2.1.), the liigh concentration of chloride ions in sea water can
provide protection ayainst nitrite uptake in fish. Therefore, nitrite
in sea water should require a considerably longer duration to exert
its toxicity. In acute toxicity test the duration is only 96 hours,
thus only sufficiently high concentrations of nitrite can exert lethal
effects such as mortality on organisms. This can account for the high
96 hr LC50 value of nitrite in sea water. On the other hand, growth
experiments usually extend over longei period of time, therefore a
comparative low dor,aye ot nitrite is enough to result in growth

97suppression or even mortality.
As a result of microbial oxidation of ammonia, the main
excretory product of fish, an intermediate product, nitrite i
produced. Accumulation of nitrite is one of the most critical
problems encountered in intensive aquaculture or in closed water reuse
systems for fish culture. Since a low dosage of nitrite is sufficient
to suppress fish growth and thus reducing fish yield, it is necessary
to keep the nitrite concentration as low as possible in order to
provide an optimal environment for fish growth and survival. For
example, in rearing salmonid fish by intensive methods in a closed
recirculating system, according to Westin (1974), a nitrite
concentration of 0.012 mg1-1 must not be exceeded to obtain optimal
growth of fish. Today in fish farming there exists a number of
different systems for removing metabolic end products, especially
nitrogenous compounds, and for reconditioning the water for reuse.
Various types of biological filters (eg. trickling type, submerged
type, updraft type, biodiscs, gravel bed, activated sludge type) have
been designed and are mainly used today, in addition to chemical and
physical methods of waste water treatment (Nagel, 1980).

CHAPTER FIVE CHANGES IN HEMATOLOGICAL PARAMETERS AND
BLOOD RESPIRATORY PROPERTIES OF LATES
CALCARIFER IN RESPONSE TO ACUTE AND
PROLONGED NITRITE EXPOSURE

985.1. SUMMAM
1. Changes in hematological parameters and blood
respiratory properties of Lates calcarifer in response to
acute and prolonged nitrite exposure were studied.
2. When L. calcarifer was subject to prolonged (8 day)
exposure of 10 mgl-1 N02-N, there were significant increases
in blood nitrite concentration and methemoglobin content. On the
contrary, a significant decrease in total hemoglobin was observed.
An increase in rnethemoglobin content together with a reduction in
total hemoglobin further decreased the functional hemoglobin
content. There was no significant change in hematocrit and red
blood cell count. The possible reasons for a lowered total
hemoglobin and its impact on the fish were discussed.
3. Hematological parameters and venous blood oxygen tension of L
calcarifer after acute (96 hour) exposure to 15, 20, 30, 50 and
80 mgl-1 N02- N were determined. Methemoglobin formation was
highly correlated with the test nitrite concentrations. The
methemoglobin content (as percent of total hemoglobin) of fish
immersed in concentration of 96 hr LC50 was estimated to be 83%.
Venous blood oxygen tension tended to decrease as nitrite
concentration increased. The decrease was probably due to a real
decrease in oxygen content of the blood or an enhancement in
metabolic requirement so that more oxygen would be depleted from
the blood stream.
4. Blood oxygen dissociation curve showed that L. calcarifer has a
relatively low oxygen affinity (P50 = 14.5 + 2.28 mmllg) with Hill
coefficient (n) of 1.46. Exposure of the fish to 50 mgl1 N02-N
resulted in a leftward and upward shift of blood oxygen
dissociation curve with P5Q = 5.93 + 1.64 mmHg and n = 0.99. The
increased blood oxygen affinity in treated fish can facilitate the
oxygen loading from water to the blood stream at the respiratory
surfaces.
5. Nitrite-treated fish had lowered arterial and venous blood oxygen
tension, arterial and venous oxygen content, and blood oxygen
capacity. However, no change in venous blood pH was observed
between control and nitrite-treated fish.
6. The hematological data suggested that a hypoxic state was not
evident in nitrite-treated Lates.

1005.2. IntrodticiIon
It is well known that both hematological parameters and
blood respitatory properties change when freshwater fish are exposed
to nitrite (Marglocco eL al., 1983 Iiilmy et al., 1987). Typically,
freshwater fish respond to nitrite exposure by methemoglobin formation
(eq. Brown and McLeay, 1975 Iluey et al., 1980 filmy et al., 1987).
OLher hematological responses reported include reductions in total
hemoglobin (Brown and Mc:t,eay, 1975 Margiocco et al., 1983 Iiilmy et
al., 1987), hemaLocri.t: (Eddy et al., 1983 IIilmy et al., 1987) and
erythrocyte count (Hilmy et al., 1987). In addition, the blood of
nitrite-exposed freshwater fish has a higher oxygen affinity and a
more pronounced Bohr effect (Bartlett et al., 1987). As methemoglobin
Is unable to bind with oxygen, methemoglobin formation can severely
reduce the blood oxygen carrying capacity (Bodansky, 1951). Some
authors (eg. Iluey et al., 1980 Iiilmy et al., 1987) have proposed
that heavy nitrite loads producing high methemoglobin contents may
cause death as a result of hypoxia or anoxia. It has been reported
that fish respond to hypoxia by an increase in hematocrit, hemoglobin
concenLratiou and blood oxygen capacity (Wood et al., 1975 Smit and
Hattiugh, 1978). Blood oxygen affinity is also increased by a
decrease of red cell. ATP concentration (Wood, 1980) Therefore, the
hematological responses triggered by nitrite exposure are unlikely due
to hypoxia per se.
Despite the well documentation of the effects of nitrite in

fIeshwater fish, similar studies on marine fish have been limited to
only one species (bicentrarchus labrax). In this marine species, as
nitrite exposure time or exposure concentration increased, total and
functional hemoglobin concentrations decreased while percent
methemoglobin increased (Scarano et al., 1984).
Since the hematological parameters and blood respiratory
responses of euryhaline fish to nitrite exposure are not well studied
compared with those of the freshwater fish, it is the objective of
this study to compare the hematological parameters (total hemoglobin
concentration, methemoglobin concentration, red blood cell count,
hematocrit) and some blood respiratory properties (blood oxygen
levels, blood oxygen dissociation curve) when the euryhaline fish,
Lates calcarifer is exposed to nitrite in 32 °OC). The present study
also aimed at evaluating whether hypoxic conditions occurred in
nitrite-exposed fish.

1025.3. MATERIALS AND METHODS
5.3.1. Experimental animals
The experiment,-1]_ fish (Cates calcarifer) used in the present
experiments were reared from fish try imported from Thailand. Fish
were fed to satiation twice daily with fish powder (Tai Seng Company
Ltd., }l. K.) which has been made into pellet form by mixing with water.
Fish( 90-200 g) were acclimated in 400-1 fibreglass tanks
containing 32 °/00 sea water for at least 4 weeks before the
i.nitiati.on. of the experiments. During the acclimation period and all
the subsequent: tests, water temperature was maintained at 26-28°C,
salinity was 32 °/0O and pII was 7.8-8.0. Oxygen concentration was
kept, at saturation. Feeding was discontinued 24 hours before fish
were transferred into experimental tanks to initiate the experiments.
5.3.2. Hematological parameters and blood respiratory properties
Three tests were conducted. In the first test, the effects
of prolonged nitrite exposure on Lates calcarifer were investigated.
Seventeen sea bass (145.5+ 7.8 g) were randomly selected and divided
into treated and control groups. The treated group (n=10) was exposed
for 8 days to 10 mg1_-1 N02-N in 400 litres of aerated sea water (32
0/00) while the control group (n=7) was exposed to sea water (32 0/00)
with nitrite concentrations less than 1 mgl-1 N02-N. After an 8 day

103immersion period, fish from both groups were removed from the tanks
and blood was collected from the severed caudal ped.unncle. Hematocrit
(Het) was determined immediately after blood collection. Total
hemoglobin concentration (Hb) was quantified by the cyanomethemoglobin
method (Sigma bulletin No. 525) and red blood cell count (RBC) by
counting in a hemocytometer (Neubauer). Methemoglobin concentration
(Mifb) (as percent of total hemoglobin) was determined by
spectrophotometric method outlined by Salvati and Tentori (1981) which
consists of measuring changes in absorbance after addition of cyanide
to' a diluted, heiriolysed blood sample. Blood nitrite content was
determined by a modification of Azo-dye method proposed by Shechter
and Shuval (1972).
The mean corpuscular hemoglobin concentration (MCHC), the
mean corpuscular hemoglobin (MCH), and the mean corpuscular volume
(MCV) were calculated from the Hct, Hb and RBC by the following
formulae (Canong, 1985):

104
A second test was performed to investigate the effects of
acute nitrite exposure on Lates calcarifer. Six groups with each
consisting of six fishes (95.1+ 3.2 g) were exposed for 96 hours to
sea water (32 0/00) containing 80, 50, 30, 20, 15 or 1 (control)
mgl-1 NO2,-N. After 96 hours of different exposures, samples of
blood collected from caudal peduncle were analysed for content of
hemoglobin, methemoglobin, and blood nitrite. Venous blood oxygen
tension (Pvo2) was also measured.
In the third test, some blood respiratory properties of
Lates calcarifer (188.5+ 6.7 g) after 96 hour exposure to 50 mgl-1
N02-N were determined. Venous blood was collected from the severed
caudal vein whereas arterial blood was sampled by making a cut at the
region of dorsal aorta. One point worth mentioning was that L.
calcarifer was very sensitive to stress caused by handling so that
considerable difficulties were faced in obtaining enough venous and
arterial blood from the same fish. Therefore in this experiment,
arterial and venous blood were sampled from different hatches of fish.
The parameters measured were arterial blood oxygen tension (Pao2),
venous blood oxygen tension (Pvo2), arterial blood oxygen content
(Cao2), venous blood oxygen content (Cvo2), venous blood pH and total
oxygen carrying capacity (Cto2).
The oxygen dissociation curves of blood from control and
treated fish were constructed by the mixing technique (Edwards and
Martin, 1966). Blood samples were collected from severed caudal

105peduncle and divided into two test tubes containing 0.5 M TRIS buffer
at pll 7.8. The blood to buffer ratio was kept constant at 10: 1. N2
and air were bubbled through water to obtain gases saturated with
water vapour to prevent dehydration of blood samples. Water-saturated
air was blown into one portion and humidified N2 into the other until
an equilibrium was reached. The two portions of blood were then mixed
in a progressively. decreasing proportion of oxygenated
blood: deoxygenated blood (i.e. 9:1, 8:2, 7:3 and so forth) in a 100 pl
syringe. The Fog of the mixed blood samples was then determined by an
Oxygen Meter (Model 781, Strathkelvin Instruments). Adjustment of
blood p11 to 7.8 was made because preliminary study has found that the
blood pH of L. calcarifer was roughly equal to this value.
Pot was measured with an Oxygen Meter (Model 781,
Strathkelvin Instruments) and blood pH was measured with an
electrode/analyzer system (Radiometer E5046/PHM71 MK2). Cot was
determined by the method of Tucker (1967). 20 jil of blood was
injected into a chamber containing degassed potassium ferricyanide,
which can liberate oxygen into the solution. The oxygen content of
the blood can be calculated from the change in the Po2 of the
solution, measured polarimetrically by a Biological Oxygen Monitor
(Model 5300, Yellow Spring Instrument Company Ltd.). Cto2 was
measured after the blood was equilibrated with humidified air until
there was no further increase in oxygen content.

1065.3.3. Statistical analyses
Data were Presented as mean+ standard error of mean (SEM).
For comparison between two groups, null hypothesis of no difference
was tested by Student's t-Lest. Null hypothesis of no difference
petween multiple groups was tested by One Way Analysis Of Variance
followed by Duncan's Multiple Range Test.

5.4. RESULTS
r'•1J • Changes in hematological parameters in response to prolongednitrite exposure
Five out ol ten fish in the treated group died during the
whole experimental period. Apparent gill damage was observed in those
dead [ish.
The hematological responses of Lates calcarlfer after 8 day
exposure to 10 mgl N0o N were shown in Table 5.1. Blood nitrite
concentration and methernoglobin content (as percent of total
hemoglobin) were significantly increased in treated fish when compared
wiI h coutro 1 fish. 0n t he cont rary , t rea ted g roup showed a
significant decrease in the total hemoglobin. Therefore, there
resulted in a significant reduction in the functional hemoglobin
content in the treated group. No significant difference was found in
the value of hematocrit and red blood cell count between the treated
and control fish.
Values of hematocrit, red blood cell count and total
hemoglobin were used to calculate the three parameters: mean
corpuscular volume (MCV) , mean corpuscular hemoglobin (MCI1) and mean
corpuscular hemoglobin concentration (MCHC). Calculation showed that
MCH and MCHC of the treated group were significantly lower than their
respective values of the control group while MCV showed no significant
difference between the treated and control fish (Tanle -) • )

S 4 °x-' •TT•Zl•Changes in hematological parameters and venous blood oxygen
tension in iespouse to acute exposure of various nitriteconcentrations
Lates calcarifer was exposed for 96 hours to sea water (32
°00) containing 80r 50, 30, 20, 15 or 1 (control) mgl-1- N02~N. No
mortality was observed during the whole experimental period except
when the exposure concentration increased up to 80 mgl1 N0o-N inZj
which case one out six fish died.
The results of acute exposure were very similar to that of
prolonged exposure. Figure 5.1 presents the blood nitrite levels and
methemoglobin contents (as % of total hemoglobin) of Lates exposed
to various nitrite concentrations. Both blood nitrite concentration
and % methemoglobin increased with exposure concentration of nitrite.
More than 70 % of total hemoglobin was oxidized to methemoglobin when
the exposure concentration increased up to 80 mgl N0o-N. TotalZj
hemoglobin concentrations in sea bass declined significantly as
_ 1external nitrite concentration increased above 50 mgl x N0o-N (TableZj
5.3). A combination of an increase in methemoglobin content and a
decrease in total hemoglobin led to a significant reduction in
-1functional hemoglobin in the groups immersed in 30, 50 and 80 mgl
no2-n.
Table 5.4 illustrates the venous blood oxygen tension (Pvo9)
of Lates calcarifer exposed to various nitrite concentrations. Pvo2
was found to significantly decline in fish exposed to nitrite

109concentrations above 30 mgl-1
5.4.3. Change:, in blood respiratory properties in response to acute
nitrite exposure
Some blood respiratory properties of Lates calcarifer after
96 hour exposure to 50 mgl-1 N02-N were investigated. Comparisons of
the blood oxygen tension (Po2), blood oxygen content (Co2), and blood
p11 were made between control and treated fish (Table 5.5). Arterial
and venous blood oxygen tension (Pao2 Pvo2), arterial and venous
oxygen content (Cao2 Cvo2), and blood oxygen carrying capacity
(Cto2) were all significantly lower in treated fish as compared with
their respective values in control fish. No significant difference
was found in venous blood pH between the treated and control fish.
Whole blood oxygen dissociation curves at pH 7.8 of control
and treated fish are presented in Figure 5.2. As shown in the
figure, the whole blood oxygen dissociation curve of treated fish has
shifted to the left. P50 (the oxygen tension when 50% of the
hemoglobin is saturated with oxygen) (Shappell and Lenfant, 1975) for
control fish was 14.47±2.28 mmHg which decreased to 5.93+ 1.64 mmHg
for treated fish. The Cot at 100% saturation changed from 16.46
+ 1.72 vols% for control fish to 8.33+ 1.35 vols% for treated
fish. There was a significant reduction in the total oxygen carrying
ranav,i tv. indicating a significant Root effect.
Figure 5.3 shows that the Hill coefficient (n) was

110significantly changed by nitrite eposure. The values of n are 1.46
and 0.99 for control and treated fish respectively.

Table 5.1. Changes in hematological parameters of Lates
calcarifer after prolonged (8-day) exposure
to 10 ragl-1 NO2-N
Control
(n = 7)
Treated
(n = 5)
Hematocrit
(%)
Total hemoglobin
(g 100 ml-1)
Methemoglobin
(%)
Functional hemoglobin
(g 100 ml1)
Red blood cell count
(106 il-1)
Blood nitrite content
(jag NO2-N ml1)
31.58 + 0.82
7.72 + 0.56
2.50 + 0.12
7.53 + 0.55
3.62 + 0.40
0.07 + 0.01
32.43 + 2.34
4.88 + 0.51
8.35 + 2.34
4.51 + 0.59
3.49 + 0.70
0.34 + 0.05
Values are presented as mean + SEM
Null hypothesis of no difference between control and
treated groups was rejected at p 0.05 (Student's t-test)

112
Table 5.2. Changes in values of MCV, MCH, and MCHC of red
blood cells of Lates calcarifer after prolonged(8-day) exposure to 10 mgl-1 N02 -N
Control Treated
(n= 5)(n=7)
Mean corpuscular volume 91.48+ 7.88 104.71+ 23.24
(MCV) (fl)
Mean corpuscular hemoglobin 23.12+ 3.2 14.96+ 1.77*
(MCH) (pg)
Mean corpuscular hemoglobin 24.72+ 2.32 15.14± 1.40*
concentration (MCHC) (g 100 ml-1)
Values are presented as mean± SEM
*Null hypothesis of no difference between control and treated
groups was rejected at p<0.05 (Student's t-test)

Table 5.2. Senatelogical responses of Lates calcarifer after acute (96 hour) exposure
Nitrite
concentration
(agl ~ NO -K)
Nnaber of
— :h Hematocrit
OO
Total
hearoglcbin
(g 100 -ml ~)
Mctheaoglobin
(%)
Functional
heaoglobin
(g 100 clT1}
Blood nitrite
content
(pg NC-N al
15
.20
30
50
0
r-»
rD
ro
6
—
23.36 = 2.15ab E.69 a 0.49a°
39.63 = 5.50b 8.15 ± 0.18bC
34.10 = 0.47ab 8.95 ± O.S8bC
21. 64 ± 1.75a 8.B6 = 0.16b
29.52 = 2.18a 6.97 ± 0.60aC
29.03 = 2.38a 6.70 ± 0.75c
1.82 _ 0.143 8.54 ± 0.493
15.00 ± 2.26b 6.93 -± 0.71
19.65 = 2.32b 7.22 -± 0.69ab
34.64 - 3.70c 5.80 - 0.37 b
51.51 = 4.86d 3.52 ± 0.43C
73.63 - 2.11e 2.09 ± 0.67°
0.06 ± 0.00 2 3
1.92 = 0.21b
2.25 a 0.43 b
3.82 - 0.19 c
6.52 - 0.27d
12.34 ± 1.08e
Values are presented as mean ± SFM
Values: with different alphabets are significantly different at p = 0.05
(One Way Analysis Of Variance followed by Duncan's Multiple Range Test)

114
Table 5.4. Venous blood oxygen tension of Lates
calcarifer after acute (96 hour)
exposure to various nitrite concentrations
Nitrite Number Venous blood
concentration of fish oxygen tension
(mgl-- i N02-N) (mmHg)
14.06+ 0.80061 (Control)
12.60+ 0.520615
n. d.620
b6.32+ 0.60630
5.65+ 0.56b650
b4.83+ 0.49J80
Values are presented as.mean± SEM.
Values with different alphabets are significantly
different: at p= 0.05 (One Way Analysis of Variance
followed by Duncan' s Multiple Range Test).
n.d.: value not determined

115
Table 5.5. Changes in respiratory properties of the blood of Lates
calcarifer after acute (96 hour) exposure to 50 mgl-1 N02-N
Control Treated
(n= 6) (n= 6)
Arterial blood oxygen tension (Paoz) 52.05+ 1.88 28.39+ 1.51*
(mmHg)
14.06+ 0.80Venous blood oxygen tension (Pvo2) 5.65+ 0.56*
(mmHg)
8.93+ 1.28 3.32+ 0.71*Arterial blood oxygen content (Caoz)
(vols%)
4.59+ 0.81 1.22+ 0.19*Venous blood oxygen content (Cvoz)
(vols%)
8.33+ 1.35*Total oxygen carrying.capacity (Ctoz) 16.46+ 1.72
(vols%)
7.84+ 0.13 7.78+ 0.11Venous blood pH (pHv)
Values are presented as mean± SEM
*Null hypothesis of no difference between control and treated
groups was rejected at p < 0.05 (Student's t-test)

ataHE-i
e
oo
:1Hin
a
8
Si
B0505
1
I
i
1
15.0
1 J. 5
U.O
10.5
9.0
7.5
6.0
4.5
3.0
1.5
n in ?n 'in 40 60 r»n 7n nn an mn
WATER NITRITE CONCENTRATION
figure 5.1. Blood nitrite concentration and percent: methc-
moglobln of Laics calcarlfor after 96 hour
(exposure to various nitrite concentrations.
Values are mean 1 5EM (n = 6). (Blood nitrite
concentration: solid circle, Percent mcthemo-
globlii! asterisk).
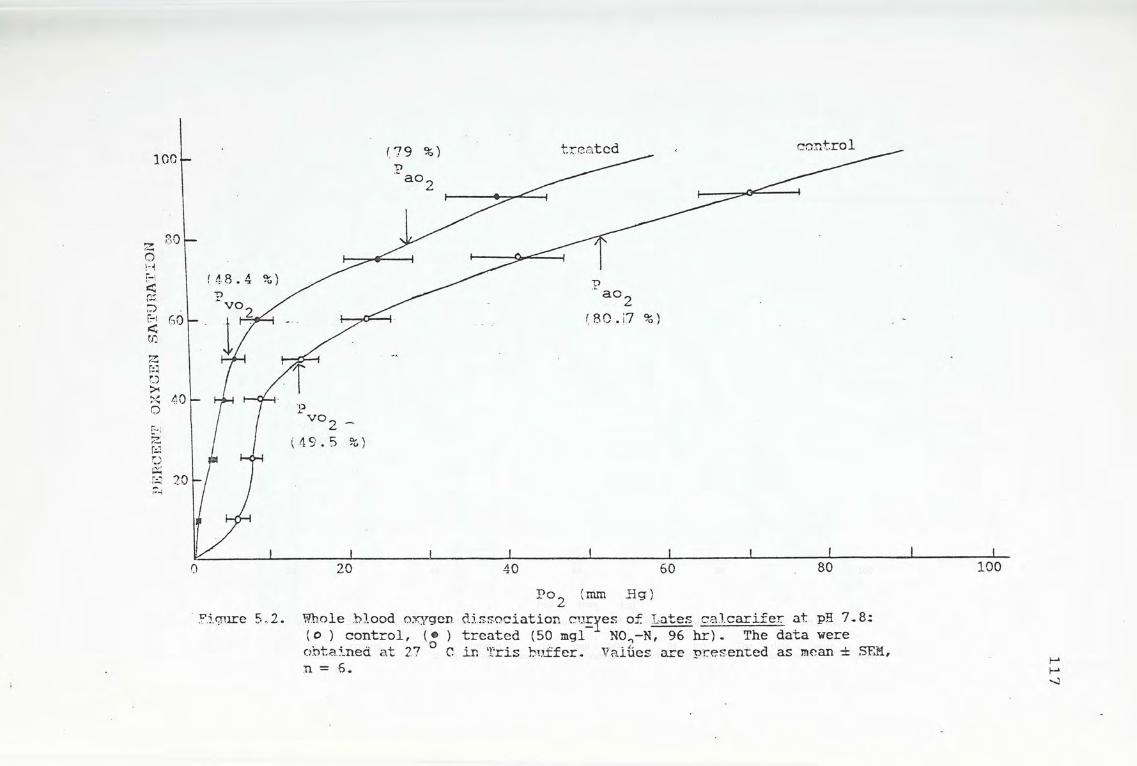
LOO
80
60
i
: 40)
HW
3)
3 2C
0 20 40 60 80 100
(48.4 %)
P
V°2
(79 %)
P
a°2
treated control
0
'V°2f AO Rft • w 'O ,
P
a°2
(80.17 %)
Po2 (mm Eg)
Figure 5.2. Whole blood oxygen dissociation curves of Lates calcarifer at pH 7,8:
(o ) control, (• ) treated (50 mgl N02~N, 96 hr)- The data wereobtained at 27 C in Tris buffer. Values are presented as mean ± SEM,
n = 6.
2OHEh
CZDEh
CO
2HO
Xo
Ph2ErjrvEp—

+2 J
+1.C
C
-l.C
-2.0
© n = 0.99 (r = 0.988)
O n = 1.46 (r = 0.969)
-0.5 0 1
log Po~
2
Figure 5.3. The Hill plot ',r the blood dissociation curves of Laics
calcarlfcr at pll 7.0; (O) control {6) treated (50 mgl
NO.-Nr 96 firj. n = Hill coefficient and r = correlationnnrffip innr fnr The lines drawn.

1195.5. DISCUSSION
5.5.1. Changes in hematological parameters in response to prolongednitrite exposure
5.5.1.1. Fish mortality
The exposure concentration 10 mgl-1_ NO2-N was relatively low
when compared to the 96 hr LC50 (93 mgl-1 N02-N), therefore, it was
unexpected that five out of ten treated fish died during the exposure
period. Nitrite has been regarded as a slow-acting fish poison
(Klinger, 1957), the exposure duration plays an important role in
determining its lethality. Since five out of ten fish died when
exposed for 8 days to 10 mgl-1 NO2-N, it might imply that the LC50 was
markedly lowered from 93 to 10 mgl -1 N02-N when the exposure duration
was extended from 4 days to 8 days. Because great difficulties were
encountered in obtaining blood samples from the dying fish, the
hematological parameters of those dying fish could not be determined.
The reasons for fish mortality was unclear, however, apparent gill
damage were observed in those dead fish. Also by the author's
observation, the dying fish did not exhibit brown blood symptom,
therefore it was unlikely that the fish died of methemoglobinemia.
Instead, gill failure might be one of the reasons for mortality. It
has been reported that nitrite exposure induced gill lesions in Salmo
gairdneri (Gaino et als., 1983) and Clarias lazera (Michael et al.,
1986).

1205.5.1.2. Methemoglobin formation and total hemoglobin reduction
Methemoglobin, which contains heme iron in Fe3+ state, in
contrast to hemoglobin, is unable to combine reversibly with oxygen
and so cannot be used for oxygen transport (Bodansky, 1951; Bartlett
et. al., 1987). Methemoglobin forms spontaneously in normal
erythrocytes, although slowly, in the absence of nitrite. In mammals,
the methemoglobin levels seldom exceed 1% (Cameron, 1971a) However,
under some special circumstances methemoglobin content may rise to a
level which is lethal to the organisms. In man clinically important.
methemoglobinemias can arise under several circumstances. For
example, methetrioglobinemia is produced by the inheritance of a defect
in the erythrocyte methemoglobin reductase enzyme system which
normally converts the small amount of methemoglobin continuouslly
formed back to hemoglobin (Schwartz et al., 1983). Methemoglobinemia
is also produced by the inheritance of so-called unstable
hemoglobins which are more susceptible than normal to auto-oxidation
to methemoglobin (Winslow and Anderson, 1983). Finally,
methemoglobinemia in man can result from the ingestion or inhalation
of a variety of chemical compounds, including many drugs, notably
nitrites (Beutler, 1983). In fish, rnethemoglobinemia usually results
from exposure to high concentrations of nitrite in their natural
habitats or culture systems. Unlike mammalian blood, fish blood
typically contains a measurable amount of methemoglobin. Reported
values for freshwater fish include: 0.9 to 3.6% for rainbow trout

121(Cameron, 1971a; Brown and McLeay, 1975 Smith and Russo, 1975
10.9% f o r prespawning pink salmon (Cameron, 1971a), and 2.2% for
channel catfish (lluey et al., 1980). Graham and Fletcher (1986) have
assayed the methemoglol)in levels in five species of temperate marine
teleosts and found that there was at least 7% of total hemoglobin in
the metliemoglobin-form in all species, and as high as 27% in one
species, the Atlantic cod.
In the present experiment, the methemoglobin level (as
percent of: total hemoglobin) of seawater-adapted euryhaline Lates
calcarifer was found to be 2.50+ 0.12% This value was relatively
low when compared to those reported for marine teleosts but comparable
to those reported for mammals or freshwater fish such as rainbow trout
and channel catfish. The basal level of methemoglobin in L.
calcarifer may indicate that this fish species is equipped with
an active methemoglobin reductase enzyme system in its red blood
cells. Further experiments would be conducted to assay for the
activity of this enzyme (See Section 6.3).
When the sea bass were exposed to the test water, nitrite
ions enter the fish body either through the passiv9 diffusion of
nitrous acid (Eddy et al., 1983) or through the anion exchange
mechanism in the lamellar chloride cells (Bath and Eddy, 1980 Meade
and Perrone, 1980 Krous et al., 1982) or both. It is well known
that chloride protect fish against nitrite toxicity (Crawford and
Allen, 1977 Perrone and Meade, 1977). Chloride competes with

122nitrite for transport across the gills (Crawford amd Allen, 1977;
Perrone and Meade, 1977 Russo and Thurston, 1977) and thus
inhibiting nitrite uptake by the fish. As shown in Table 5.1, blood
nitrite concentration of treated fish was found to be 5 fold of that
of control fish. However, unlike most freshwater fish in which blood
nitrite levels may reach up to 10 times (Bath and Eddy, 1980) or even
60 times (Margiocco et et., 1983) the nitrite concentrations of the
medium, the nitrite concentrations in blood of treated Lates
calcarifer never exceeded that of test water. Since 32 0/00 sea water
was employed in this study, it was expected that the high chloride
concentration in the test water could somewhat inhibit nitrite uptake
by the fish and thus preventing the strong bioaccumulation of nitrite
in the blood as usually occurred in freshwater fish.
Nitrite in the fish blood readily oxidizes the heme iron of
hemoglobin to form methemoglobin. Because blood nitrite concentration
in treated fish was only 0.34 ug N02-N ml-1 blood, a relatively small,
though significant, increase in percent methemoglobin was observed.
On the other hand, there was a significant reduction in the
total hemoglobin content in treated fish when compared with control
fish. Reduction in total hemoglobin content induced by nitrite
exposure has also been reported for freshwater fish Clarias lazera
(Hilmy et al., 1987) and seawater fish Dicentrarchus labrax (Scarano
et al., 1984). As a result of a decrease in total hemoglobin content

and an .increase in methemog1obiu level, the treated fish demonstrated
a s iguifleant decrease in functional hemoglobin concentration.
Decrease in lota I hemoglobin content may be caused by hemolysis of red
blood cells since it has been reported by Scarano et al. (1984) that
liibiochemical analysis of spleen tissues from fish exposed to nitrite
showed Fe originating from hemoglobin destruction and indicated
hemolytic anemia caused by spleen macrophages. If there was hemolysis
of red blood cells, erythrocyte count and hematocrit value should have
been dec] eased, but they were not. The present study found that
erythrocyte count and hematocrit value did not change significantly.
This indicated that decrease in total hemoglobin was not due to
decrease in red blood cell volume as seen from the unchanged value of
MCV. The observed decrease in total hemoglobin must have been the
result of a true reduction in the hemoglobin content of each red blood
cell. This interpretation was supported by a significant decrease in
the values of MCH and MCHC.
Methemoglobin formation was the most consistent
hematological responses so far reported when fish were exposed to
nitrite. Other hematological responses such as total hemoglobin,
hematocrit and red blood cell count varied considerably among
different studies (See Section 2.4.1.2.). It is likely that the
hematological responses to nitrite exposure depend on many fact.ois
such as species specificity, environmental condi tions and. nut i.itional
conditions of the fish. The mechanism by which nitiite leduces tne
total hemoglobin content in fish is unknown and no studies have been

124directed to this aspect. Short supply of iron has been proposed as a
possible cause of hemoglobin deficiency (Cameron and Wohlschlah,
1969). However, no studies have been devoted to investigate the
effect of nitrite on the supply or utilization of iron in fish.
Oxygen transport depends upon a number of factors. The
concentration of hemoglobin is one of them. Total hemoglobin level of
an animal can reflect its respiratory requirement. As the respiratory
requirements of animals vary over an enormous range, the total
hemoglobin levels vary concomitantly. At one extreme, the metabolic
requirements for oxygen are so low that an oxygen transport pigment is
unnecessary: sufficient oxygen is physically dissolved (Riggs, 1972).
Therefore the antarctic ice fish which live in cold highly oxygenated
waters and are of sluggish habits obviate the need for a respiratory
pigment (Cameron and Wohlschlag, 1969). At the other extreme,
metabolically active fish often have such large requirements for
oxygen that blood hemoglobin is not only necessary but even a slight
anemia may be serious disadvantage (Riggs, 1972). Cameron and
Wohlschlag (1969) studied the respiratory response of the pinfish
to experimentally induced anemia. They found that the resting
metabolism of the fish showed no significant difference related to
hemoglobin level, though anemic fish were slightly higher, and the
cardiac rates showed a compensatory increase in response to hemoglobin
reduction which accounted. for about 50 % of the predicted increase in
cardiac output. Concerning the role of hemoglobin, the authors

125concluded that "Hemoglobin allows the circulatory system under
ordinary conditions to operate at a much lower level of energy
expenditure than it could with it, thus providing a considerable
reserve for extra demands made by activity or other stress. Reduction
or inactivation of hemoglobin merely pushed the level of circulatory
operation up closer to the limits, so that the reserve is considerably
reduced". On this basis, it is reasonable to speculate that the
lowering hemoglobin levels caused by nitrite exposure rendered the
fish an immediate effect of increasing the maintenance metabolism
requirements (Cameron and Wohlschlag, 1969). In order to meet this
stress either the feeding rate would have to be increased or the
growth rate slowed correspondingly. The second effect of lowered
hemoglobin level is a restriction of activity levels.
Much literature describes that fish respond to hypoxia by an
increase in hematocrit and hemoglobin concentration (Wood et al.,
1975 Smit and Hattingh, 1978b). However, there is always no
corresponding increase in the red blood cell count. Therefore some
researchers proposed that the typical rise in hematocrit and
hemoglobin concentration seen during hypoxia was not due to new
erythrocyte synthesis (Cameron, 1971) but due to bemoconcent ration
(i.e. water loss) and swelling of the red blood cell (Albers, 1970).
Although nitrite has long been regarded as a strong chemical to induce
hypoxia, the hematological parameters of Lates calcarifer exposed for
8 days to nitrite did not reveal any hypoxic symptoms. The decrease
in the value of total hemoglobin observed during this study is due to

126
the toxic effect of nitrite itself rather than hypoxia.
5.5.2. Changes in hematological. parameters and venous blood oxygen
tension in response to acute exposure of various nitriteconcentrations
5.5.2.1. Methemoglobin formation and total hemoglobin reduction
Blood nitrite levels increased more or less proportionally
with the test concentrations of nitrite at the range of 15 to 50 mgl-1
N02-N. Blood nitrite level of fish exposed to 80 mgl-1 N02-N was
nearly 2 fold of that of fish exposed to 50 mgl-1 N02-N. It might be
that when fish were exposed to such a high concentration of nitrite,
those barrier such as the integument which initially restricted the
entry of nitrite was damaged so that nitrite could flux into the fish
body more easily. As shown in Figure 5.1, percent methemoglobin was
highly correlated (r= 0.994) with the exposure concentration of
nitrite. Percent methemoglobin reached more than 70% as exposure
concentrations increased up to 80 mgl-1 N02-N. Only 25% of total
hemoglobin remained as functional hemoglobin to transport oxygen.
This low functional hemoglobin level should confer considerable stress
on the cardiac energy output of the fish as suggested by Cameron and
Wohlschlag (1969). The 96 hr LC50 of nitrite for Lates calcarifer in
32 °/oo was found to be 93 mgl-1 N02-N in the previous study. In
Figure 5.1, the percent methemoglobin level at the 96 hr LC50 was
estimated to be 83 o which probably represented a lethal level for L.

127calcarifer. The total hemoglobin decreased significantly as external
nitrite concentrations increased up to 80 mgl-1 N02-N. Prolonged
exposure of fish to 10 mg1-1 N02-N for 8 days resulted in a reduction
in the total hemoglobin, however, no such decrease was observed in
fish exposed for 4 days to higher concentrations of nitrite (15, 20,
30 and 50 mgl-1 NO2-) This reflects that nitrite may require a
longer time to exert its effect on those physiological processes that
regulate the synthesis of hemoglobin. The hematological parameters of
L. calcarifer exposed to such high nitrite concentrations also did not
reveal any hypoxic symptoms. One possible reason is that L.
calcarifer is a species that is very tolerant to hypoxia. Wu (1988)
have demonstrated that L. calcarifer could survive without any stress
symptoms for 7 hours when subject to 1 mg 021-1. Biochemical analysis
of metabolites of nitrite-exposed sea bass can provide additional
information on the evaluation of whether nitrite exposure- induces
hypoxia in the fish. This aspect will he discussed in the next
chapter.
5.5.2.2. Venous blood oxygen tension
Treated sea bass except those subject to 15 mg1-1 N02-N
exhibited a significant reduction in their venous blood oxygen
tension. There are two implications for that. The first is that the
blood oxygen content of treated fish is really lowered. The second is
that the blood oxygen content is not lowered, but the metabolism is

128pumped up due to nitrite exposure so that more oxygen is depleted from
the blood stream, thus resulting in a lowered venous blood oxygen
tension in treated fish.
5.5.3. Changes in blood respiratory properties in response to acute
nitrite exposure
5.5.3.1. Blood oxygen dissociation curve
It is generally accepted that the shape of whole blood
dissociation curve determines the range of oxygen tensions for loading
and unloading oxygen. The shape of the curve and its slope in the
middle range segment are empirically defined by the coefficient n of
the Hill equation:
where P is oxygen pressure in mmHg, S is oxyhemoglobin saturation and
K is a constant (Shappell and Lenfant, 1975). The normal human blood
dissociation curve is sigmoid shape which results from the heme-to-
heme interactions within the hemoglobin molecule. The normal range of
n is 2.6-3.0 (Shappell. and Lenfant, 1975). The position of the curve
P50 is defined as the oxygen tension when 50% of the hemoglobin is
saturated with oxygen. P50 is used as an index of the hemoglobin
affinity for oxygen. In physiological terms, affinity is inversely
related to the pressure of oxygen required to assure a given oxygen
saturation. For instance, if the in vitro P50 is lower than the
129normal value, the hemoglobin affinity for oxygen is greater than
normal (Shappell and Lenfant, 1975). A shift of the blood
dissociation curve to the right or to the left of its normal position
could affect the delivery of oxygen to the tissues. For the same end
arterial oxygen tension, a rightward shift yields a lower oxygen
saturation at the venous level and thus a wider arteriovenous
difference in oxygen saturation (content). This will enhance oxygen
delivery, or maintain oxygen delivery while sparing myocardial work.
On the contrary, a leftward shift reduces oxygen delivery, or else
causes an increase in cardiac output (Shappell and Lenfant, 1975).
The blood oxygen dissociation curve at pH 7.8 of normal
Lates calcarifer is rather hyperbolic, with a Hill coefficient (n)
equals to 1.46 (Figure 5.2.). This is comparable to the generally
unsigmoidal curve of fishes (Grigg, 1974). However, active species
like trout (Cameron, 1971b) usually display a sigmoidal curve with n=
2.5-3.0, which is very similar to that of mammals. More sluggish
species like carps (Black, 1940) are characterized by a more
hyperbolic curve with n= 1.2-1.5 (Grigg, 1974). In species with a
monomeric hemoglobin (for example, the hagfish Eptatretus stoutii),
the curve assures a typical hyperbolic shape and n value of
approximately 1 (Shappell and Lenfant, 1975). The trend that sluggish
fish exhibit a more hyperbolic curve while active fish display a
sigmoidal curve is in agreement with our study because L. calcarifer
is a very sluggish species with restricted activity levels.

bates cLcarif_er blood lias a rvQ value of 14.17 + 4.28 mrnllg
which ls compat able lo I he respective value (17 nmiHg) of an related
freshwater species L. albertianus (Fish, 1.956) . L. caLcarifer has a
relatively high blood oxygen affinity as compared with those active
f i'h such as trout ((.arneron, 19 71b) . However, a comparison with the
dissociation curves obtained from other fish which survive well in
p o o r 1 y a e r a t e d w a t e r s i1 c 11 a s Channa mac ul a_ta_ (Y u an d W o o , 1987 ),
Ll J apia esc nl en ta (Fish, 1956), and CI arias mossambicus (Fish, 1 956)
shows that the hemoglobin in L. c a1ca rife r blood has a relatively low
affinity for oxygen. The competence of the L. calcarifer hemoglobin
as an oxygen collector is low, hut as a result, the gas is more
readily released in the body. Although bates has a relatively low
1) 1 ood oxygen a 1 f i.n i t y , i t can surv i ve well i n wa t e r o f d i sso 1 ved
oxygen as low as 1 mg 09 1 (Wu, 1988). When exposed to hypoxic
conditions, fish may regulate their blood oxygen affinity by changing
the blood pH or the organo-phosphate (ATP) levels in erythrocytes. It
has been well documented that increasing blood pH or decreasing the
organo-phosphate levels in erythrocytes can raise the blood oxygen
affinity which enable an easier loading of oxygen at gills when the
oxygen level of surrounding water is low (Riggs, 195, Smit and
Ilattingh, 1981a) .
The shape of the blood oxygen dissociation curve of treated
Lat.es calcariler becomes more hyperbolic with a Hill coefficient (n)
of 0.99. A comparison of the dissociation curves of treated and
control fish reveals that nitrite exposuie shifts tne dissociation

131curve to the left. Similar displacement of dissociation curve due to
conversion of hemoglobin to methemoglobin by nitrite has also been
reported in other fish (eg. Bartlett, et al., 1987). The P50 for
nitrite treated fish was 5.93+ 1.64 mmHg. This value is comparable
to those reported for fish species which can survive well in water of
low oxygen levels (Fish, 1956). The low P50 in treated fish indicated
that the blood of treated fish had a high affinity for oxygen.
5.5.3.2. Blood oxygen tension and oxygen content
When fish were exposed to 50 mgl-l N02-N, nearly 50% of
total hemoglobin was converted to methemoglobin which was incapable of
carrying oxygen. Conversion of hemoglobin to methemoglobin greatly
decreases the oxygen carrying capacity. As shown in Table 5.4., the
blood oxygen carrying capacity was significantly decreased from 16.46
vols% in control fish to 8.33 vols- in treated fish. The percent
decrease was about 50 which was in line with the percent conversion
of hemoglobin to methemoglobin. In order to compensate for the
decrease in oxygen carrying capacity, treated fish have to increase
their blood oxygen affinity to facilitate the loading of water oxygen
at the respiratory surfaces.
Higher blood oxygen affinity may hinder the loading of oxygen
from blood capillaries to tissues. Pao2 of control fish is 52.05 mmHg
(Table 5.4.) which represents 80.7% oxygen saturation of hemoglobin

132
2while Pao, of treated fish is 28.39 mmllg which represents 79% oxygen
saturation of hemoglobin. Pvo2 of control fish equals to 14.06 mmHg
which occupies the position of 49.5% of oxygen dissociation curve
while Pvo2 of treated fish is 5.65 mmllg which occupies a simlar
position of 48.4 of oxygen dissociation curve. The similar position
of Pao2 and Pvo2 of treated and control fish at their oxygen
dissociation curves implies that the oxygen delivery tendency from
blood capillaries to tissues are not significant different between
treated and control fish. The exact arteriovenous oxygen difference
(Cao2- Cvo2) cannot be calculated since the arterial and venous blood
were sampled from two different batches of fish. However, the data
(Table 5.4.) more or less reflect that treated fish have a lower
arteriovenous oxygen difference which means a lower oxygen
utilization. In conclusion, although nitrite exposure resulted in a
significant reduction in blood oxygen carrying capacity and a
significant increase in blood oxygen affinity, there was no evidence
however that oxygen transport and delivery are impaired. To the best
knowledge of the author, no literature has given direct evidence that
oxygen transport and delivery are impared in nitrite-exposed fish.
5.5.3.3. Venous blood pH
The unchanged blood pH value (Table 5.4.) of treated fish
when compared with control fish suggests that hypoxia unlikely
occurred in them even at a concentration of 50 mgl-1 N02-N (half of

133
the 96 hr hc 50). If hypoxia did occur, the lactate produced should
lower the blood pll. However, it cannot preclude the possibility that
the treated fish did produce considerable amount of lactic acid in the
blood because of hypoxia but that the lactate was neutralized by the
elevated amount of ammonia in blood. Therefore, the undetectable
changes in blood p11 per se cannot lead to a firm conclusion that
hypoxia (lid not occur in the treated fish. Additional information is
required for drawing a conclusion on this aspect.

CHAPTER SIX METABOLIC CHANGES OF LATES CALCARIFER IN
RESPONSE TO ACUTE AND PROLONGED NITRITE
EXPOSURE

6.1. SUMMARY
1. Metabolic responses of bates calcarifer to acute and
prolonged nitrite exposure were studied.
2. Prolonged (8 day) exposure to 10 m g 1 N0o~N caused an
i n c r e a s e i n s e r u m s o d i u m, pot a s s i u m a n d a m m o n i a
co n c e n 11: a t i o n s , a n d a d e c r e a s e i 11 1 i p i d c o n t e n t. 0 n the other
hand, no significant cliange was found in the tissue composition of
liver and muscle.
3. Acute (96 hour) exposure to 30, 50 and 80 rug] ' NOo-N resulted
in a decrease in serum protein concentration, and an increase in
serum lactate, ammonia and urea contents. Metabolic changes in
serum were most evident when nitrite concentration increased up to
80 mgl' N09-N. Decreases in liver glycogen and muscle lactatei-j
were also observed.
4. Fish subject to acute (96 hour) exposure of 50 mgl N0o-N Li
s ho w e d d e c r e as es in br a nc hia 1 N a - K - a c t i vate d a denosine
triphosphatase (Na' K' ATPase), hepatic glutarnate-oxaloacetate
transaminase (GOT), and glutamate dehydrogenae (GLDH) activities.
Contents of: liver adenosine triphosphate (ATP), adenosine
diphosphate (ADD, and adenosine monophosphate (AMP) were all
reduced in nitrite treated fish.
5. L. c a 1 c a r iter was found to possess the enzyme NADH

135methemoglobin reductase which is capable of converting
methemoglobin back to hemoglobin. However, acute or prolonged
nitrite exposure did not induce changes in its activity.
6. It was concluded that nitrite exposure did not trigger
remarkable metabolic symptoms of hypoxia in Lates unless the test
concentration reached as high as 80 mgl-1 NO2-N. However nitrite
exposure induced an increase in production and excretion of the
nitrogenous product, ammonia, as reflected by the elevated level
of ammonia in serum. In case of extreme high nitrite
intoxication, Lates resorted to produce an uncommon fish
nitrogenous product, urea, in addition to ammonia.

6.2. INTRODUCTION
D e s p LI e I h (i w e 11 d o c u m e n t a I i o n o I t h e h e rn a t o 1 o g i c: a 1
responses of freshwater fish to nitrite exposure (see Section 2.4.1),
limited studies have been devoted to investigate the metabolic changes
of n i t r i t e -11 e a t e d fish. One det ai 1 ed study carri.ed ont bv Ari 11 o e_t
a 1. (1981) f.ound that freshwater fish respond by decreases in blood
glucose, liver glycogen and ATP, and increases in liver and brain
lactate dining advanced stages of nitrite intoxication. Other
metabolic effects reported include reduction in serum protein level
(II 1 1 m y ej a 1. , 19 8 7), in vi t ro i n h i b 11 i o n of b r a n c h i a 1 c a r 1) o n i c
anii y d r a s e act i v i t v (G a i n o et_ al_. , 1 984 ), a n d i n c reas e s in s e r ii m
glutamate oxaloacetate and glutamate pyruvate transaminases activities
(Michael et a 1. , 19 86). Due to the conversion of hemoglobin to
rnethemoglobiu, a form which is incapable of carrying oxygen, some
authors (eg. Huey et_ a)., 1 980; Hilmy e_t al. , 1987) have proposed
that lieavy nitrite loads can confer hypoxia or anoxia in fish.
Typically, fish respond to hypoxia by decreases in liver glycogen and
ATP, and increases in liver lactate, d-glycerophosphate and succinate
(Jorgensen and Mustafa, 1980a, b; Yu and Woo, 1987). Elevated serum
Na K+ and Ca-' f concentrations were also observed when f ish were
exposed to extremely hypoxic conditions (1 mg 01 ) (Woo and Wu,
1981). Since not many studies have been directed towards elucidating
the metabolic effects of nitrite on fish, whether nitrite-treated fish
exhibit metabolic derangements in response to hypoxia is still subject

to argument.
.Since (lie me I a bo lie responses of euryhaline fish to nitrite
exposure have not been studied, it is the objective of this study to
compare the metabolic parameters (serum ions, blood metabolites such
as glucose, protein and lactate, liver and muscle metabolites such as
glycogen, protein, lipid and water content, and liver enzyme
activities) when the euryhaline fish bales ca.lcar.ifer is exposed to
nitrite. The present study also aims at. evaluating whether hypoxic
conditions occurs in nit rite-exposed fish.
Mammals including humans normally contain the NADH-
mo I hemoglobin reductase to reconvert me themog lob i 11 to hemoglobin
(Jaffe, 1964; Cameron, 197.1a). However, tills enzyme system does not
universally occur in fish (freeman e_t a J , 1983 ) . Therefore, the
present study is also devoted to determine whether bates calcarifer
possesses this enzyme.

1386.3. MATERIALS AND METHODS
6.3.1. Experimental animals
The experimental- fish (Lates calcarifer) used in the present
experiments were reared from fish fry imported from Thailand. For
experiments which studied the effects of prolonged nitrite exposure,
fish bought from the local market were also employed. Fish were fed
to satiation twice per day with fish powder (Tai Sang Company Ltd.,
H.K.) which has been made into pellet form by mixing with water. Fish
were acclimated in 400-1 fibreglass tanks containing 32 °/oo sea water
for at least 4 weeks before the initiation of the experiments. During
the acclimation period and all the subsequent tests, water temperature
was maintained at 26-28 °C, salinity was 32 0/00 and pH was 7.8-8.0.
oxygen concentration was kept at saturation. Feeding was discontinued
24 hours before fish were transferred into experimental tanks to
initiate the experiments.
6.3.2. Experimental protocols
Five tests were conducted in the present study. In the
first test, two trials have been carried out to investigate the
effects of prolonged nitrite exposure on the metabolite contents in
serum, liver and muscle of Lates calcarifer. In the first trial,
twelve fish (1000.5± 28.6g) bought from local market were randomly
divided into treated and control groups. The treated group (n= 6)
was exposed to 10 mc71-1 NO2-N for 8 days in 400 litres of aerated sea

139water while the control group (n= 6) was exposed to sea water with
nitrite concentration less than 1 mgl-1 N02-N. After an 8 day
immersion period, fish from both groups were removed from the tanks
and blood was rapidly collected from the severed caudal peduncle.
Whole blood was allowed to clot at room temperature for 45 minutes and
then centrifuged to obtain serum. The entire liver was excised to
obtain the hepatosomatic index (liver weight x 100 0/ body weight).
The liver, brain and a piece of epaxial muscle were rapidly collected
and frozen. All samples were subsequently frozen at -20°C until
further analysis. In the second trial, the fish employed were the
same as those used for hematological studies in Chapter 5 (See Section
5.3.2, 1st paragraph). The experimental procedure was the same as
described above.
A second test was carried out to investigate the effects of
acute nitrite exposure on the metabolite contents of Lates calcarifer.
The fish employed were the same as those used for hematological
studies in Chapter 5 (See Section 5.3.2., 2nd paragraph). Four groups
of fish were exposed to sea water containing 80, 50, 30 or 1
(control) mgl-1 N02-N. After subject to different exposures for 96
hours, whole blood collected from caudal peduncle was centrifuged to
obtain serum. The whole liver, brain and a piece of epaxial muscle
were rapidly removed and. subsequently frozen at -20 0 C until further
analysis.
In the third. test, branchial Na+-K+-ATPase, hepatic ATP,

U1 ( 'k enh at i nns , and some hepatic enzyme activities of
•,U1 6.7g) exposed to 50 rug I.1 X0? M for 96 hours.i
,v i 1 : ' v.oiw- i is]; were randomly selected and divided into
ct)llll°l an,l tin-a led groups. The treated group was immersed in sea
cat' i (30(y containing 50 mgl ' NOo-N whereas the control group
was exposed to sea water. After a 96 hour immersion period, the fish
0 f both groups were sae r i f i ced , (lie g i 11 and 1 i v e 1: we r e gui ck 1 v
removed and put into liquid nitrogen. All samples were subsequently
frozen at -20 °C until analysis.
the fourth test was undertaken to determine the effect of
nitrite exposure on t lie rate of ammonia excretion of Lates calcarifer.
Fish were randomly divided into treated and control groups. Control
group (205.1 y 5.3 g) was immersed in sea water (32 0on) while the
treated group (208.0 y 5.0 g) was exposed 96 hours to sea water
containing 50 mgl ' NO-,-X. After that f fish In both groups were
transferred into nitrite-free sea water of which the ammonia content
h a s 1.) e e n p r e v i o us] y m e a s u r e d . A t c e r tain t i m e in t e r v a 1 s , water
samples were taken for the analysis of ammonia content. llie average
rates of ammonia excretion for both groups were then calculated.
The final test was conducted to assay the blood NADH-
methemoglobi 11 reductase activity of Lat.es ca 1.ca 1 .ife 1 . Tae test also
aimed at evaluating whether acute or prolonged nitrite exposure had
effects 011 the activity of this enzyme. Fish (180.6 + 8.-1 g) were
divided into three groups. The first group was subject to acute (96

hour) cxposuro of 50 1 NO, N, the second group was sub ject to
prolonged (R !av) exposure of 10 mgl1 N0,-N while the last groupZj
seived as the control. After 96 hours, half of the control fish and
u tin acute exposed group were killed and blood was collected
from the severed caudal peduncle. The blood samples were used
immediately foi the determination of NADH met hemoglobin reductase. By
the end of t lie 8 day immersion period, the remaining control fish and
those from prolonged exposed group were sacrificed and the blood
samples collected from the severed caudal peduncle were immediately
assayed for the enzyme.
6 . J . 3 . Chemical and biochemical analyses
6.3.3.1. Metabolite and electrolyte contents
Serum sodium, potassium and calcium concentrations were
determined using flame photometry (ISA Biologie) after appropriate
dilution of tlir semm samp 1 es . Se rurn ch 1 or i d e concen t ra t: ion was
determined using a Corning Chloride Meter. Serum glucose was
estimated using a coupled glucose oxidase-peroxidase reaction
according to Sigma Procedure (No. 510) . Serum lactate level was
estimated using lactate dehydrogenase following the method of Hohorst
(1962). Serum protein content was determined according to Hartree
(1972), tota1 11pids according to the su1phurophosphovani 11 in method
of Woodman and Price (1972), cholesterol using enzymes cholesterol
oxidase and cholesterol esterase, coupled with 4-ami noantipyrine

diromogenic system according to Sigma Procedure (No.351), and free
amino acids according to the ninhydrin reaction as described by
Mat Miews e t a1. (1961). serum ammonia Ieve1 was determined 11si11g
glutnmate dehydrogenase for the reductive amination of 2- oxoglutarate
according to Sigma Procedure (No. 170--UV) and serum urea was
determined by the method outlined by Hunninghake and Grisolia (1966).
Liver and muscle samples were dried at 100 °C to constant
weight and then defatted using petroleum other (dearie, boiling range
60-00 JC) . the defatted samples were weighed and the percentages of
water a n d 1 i p i d in t h e t. i s s u e s were c a 1 c u late d u s i n g w e i g h t
d i f f. e r e n c e s .
Tissue samples were homogenized in distilled water (1:10;
wv) using an tiltra-Turrax Homogenizer. The whole homogenate was used
to determine tissue glycogen (Mural and Cerfarty, 1974) and protein
(Hartree, J 972) concentrat ions. For the determination of tissue
lactate content, tissues were homogenized in 1 M perchloric acid and
the supernatant was used f or the determinations. To quan ti f y tlie
content of liver ATP, frozen liver powder was homogenized in 6 °6
perchloric acid and the ATP content of the supernatant was determined
with hexokinase and glucose 6-phosphate according to the method of
Lamprecht and Trautschold (1974). To estimate the liver ADP and AMP
contents, frozen liver powder was homogenized in 0.9 M perchloric
acid. The ADP and AMP concentration of the supernatant was estimated
by using pyruvate kinase, lactate dehydrogenase and myokiuase as

143described by Jaworek (1974). The adenylate energy charge was
calculated from the ATP, ADP and AMP levels by the following formula
(Atkinson, 1968):
adenylate energy charge
6.3.3.2. Branchial Na+-K+-ATPase activity
Gill filaments were homogenized in cold solution containing
0.3 M sucrose, 1 mM EDTA and 0.1% sodium deoxycholate at pH 7.4 using
a Ultra-Turrax Homogenizer. Na+-K+-ATPase activity was measured in
the whole homogenate in the standard incubation medium: 100 mM NaCl,
20 mM KC1, 5 mM MgC12.6II20, 5 mM Na2ATP and 40 mM Tris-HC1 buffer at
pH 7.4. The reaction was allowed to proceed at 25 °C for 15 min and
stopped by the addition of 2 ml cold 10% trichloroacetic acid.
Inorganic phosphate liberated from ATP was determined according to
Harper (1965). Protein concentration of the gill homogenate was
determined according to Hartree(1972).
6.3.3.3. Hepatic enzyme activities
For enzyme determination, a portion of liver weighing about
100 mg was homogenized in 10 volumes of physiological saline (0.8%
NaCI). Enzymes in the homogenate were studied at 25 °C.

G 1 co (j on phos phorylase a (phosphory lase) activity was
assayed as described by Tmminger and Benziger (1975). Activities of
g I iKose-( -phospha I ase (OGPase) was determined according to Baginski et
--- VL VtdiiJc glutamate dehydrogenase (GLDH) according to King
Lactate dehydrogenase (LDH) , in the direction of pyruvate to
lactate, was assayed according to Bergmeyer and Be r lit. (1 974) . Assays
0 (' t t t a t e deli y d r o g e n a. so (I CI) II) an d g 1 u c o s e - G • p h o s p h a t e
delivdrogenase (G6PDH) activities were carried out as described by Chan
and Woo (1978). G1utamate-oxaloacet: ate transaminase and
glutamate-pyruvate transaminase activities were assayed according to
Sigma Procedure (No. 505).
6.3.3.1. Blood NADH-methemoglobin reductase activity
NADU-metliemoglobin reductase activity was determined by the
method of Scott (I960). Blood samples were centrifuged to obtain red
blood cells. The cells were washed with phosphate-buffered saline
solution (9 volumes 0.9 3; NaCl, 1 volume 0.1 M potassium phosphate, pH
7.3). To the cells was added an equal volume of phosphate buffered
saline solution containing 1 % sodium nitrite and the mixture was
shaken and. all owed to stand for 20 minutes. The cells were then
washed with phosphate-buffered saline solution to completely remove
the nitrite. The oxidized red blood cells were lysed b adurtion of
water containing 0.05 % Triton X-100 which was used foi complete
solubilization of the enzyme (Scott and Harrington, 1985). The

145methemoglobin of the hemolysate was estimated by measuring absorption
at 600 nm.
Ilemolysat.e equivalent to a fixed amount of methemoglobin was
added to a reaction mixture containing 1 M Tris at pH 7.6, 10 mM EDTA
and 1.2 mM DCIP (2,6-dichlorophenolindophenol, a dye that causes
fluorescence in the presence of NADH. Water was added instead of
hemolysate as the control. If the methemoglobin reductase system is
present in the blood, the reaction mixture produces NADH-methemoglobin
reductase that converts the methemoglobin to hemoglobin. NADH
oxidizes to NAD, which does not fluoresce. Therefore the enzyme
activity can be estimated by measuring the decrease in absorbance
corrected for the blank. Activity measurements were carried out at 23
0 C
6.3.3.5. Water ammonia content
Ammonia content in water is determined by phenolhypochlorite
method according to Strickland and Parsons (1972).
6.3.4. Statistical analyses
Data are presented as means+ standard error of mean (SEM).
For comparison between two groups, null hypothesis of no difference
was tested by Student's t-test.. Null hypothesis of no difference
between multiple groups was tested by One Way Analysis Of Variance
followed by Duncan's Multiple Range Test.

1466.4. RESULTS
6.4.1. Changes in metabolite content in response to prolongednitrite exposure
The results obtained in the two trials were grouped
together. Table 6.1 presents the serum Na+, K+, Ca2+ and Cl- levels
of Lates calcarifer after 8 day exposure to 10 mgl-1 N02-N. Both
serum Na+ and K+ concentrations in treated fish were significantly
higher than that of control fish. No significant difference was found
in serum Ca2+ and Cl- levels between treated and control fish.
As shown in Table 6.2, serum lipid significantly declined in
fisli exposed to nitrite but serum glucose, lactate, protein,
cholesterol, c -amino acid and urea concentrations were unchanged. On
the contrary, serum ammonia level was markedly elevated upon exposure
to nitrite. Tissue composition of liver, muscle, and brain did not
show any significant change (Table 6.3)
6.4.2. Changes in metabolite content in response to acute
exposure to various nitrite concentrations
There was a clear trend, of increasing serum lactate
concentration as Lates calcarifer were exposed to nitrite (Table 6.4).
The level was unproportionally high as test concentration increased up
to 80 mg1-1 N02-N. Serum protein levels were significantly lowered
only when the fish were subject to 80 mgl-1 NO2-N. Both serum ammonia
and urea contents were markedly elevated in nitrite-treated fish.

147Table 6.5 shows the tissue composition of Lates calcarifer
after 96 hour exposure to 30, 50 or 80 mgl-1 NO2. Similar to the
results of prolonged nitrite exposure, acute exposure to high nitrite
concentration induced slight changes in tissue composition. However,
a clear trend of decreasing liver glycogen was observed in treated
fish. In addition, muscle lactate content in fish exposed to 50 and
80 mgl-1 N02-N showed a significant decline as compared with the
values of control fish. Liver protein and lactate, and brain lactate
were not affected.
6.4.3. Changes in branchial Na+-Y+-ATPase activity, hepatic
enzyme activities, and liver adenine nucleotide levels in
response to acute nitrite exposure
Branchial Na+-K+-ATPase activity in nitrite-treated fish was
significantly lower than that of control fish (Table 6.6)
Significant decreases were also found in liver glycogen phosphorylase
a, glutamate-oxaloacetate transaminase and glutamate dehydrogenase
activities in treated fish as compared with control fish. There was
no significant difference in activities of lactate dehydrogenase,
isocitrate dehydrogenase, zglucose-6--phosphatase, glutamate-pyruvate
transaminase and glucose-6-phosphate dehydrogenase between control and
treated fish. (Table 6.6).
Changes in contents of liver ATP, ADP and AMP of Lates
calcarifer after 96 hour exposure to 50 mgl-1 N02-N are shown in Table

1486.7. We can see that ATP, ADP and AMP levels were all lower in
treated fish when compared with control fish, though the decrease was
significant only in ADP and AMP. Calculation showed that the
adenylate energy charge was not significantly different between
treated and control fish.
6.4.4. Changes in ammonia excretion rate in response to acutenitrite exposure
Figure 6.1 records the changes in ammonia content of the
water into which control and treated fish were transferred
respectively. Apparently, the ammonia content of the water into which
treated fish were transferred was consistently higher than that of the
water holding the control fish at all time intervals. The average
rates of ammonia excretion for control and treated fish were 6.04+
0.63 and 16.37+ 0.69 ug NH3-N g-1 h-1 respectively. Therefore,
nitrite exposure can trigger an increase in production and excretion
of ammonia in fish.
6.4.5. Changes in blood N11DH-methemoglobin reductase activity in
response to acute and prolonged nitrite exposure.
Lates calcarifer was found to possess the NADH-methemoglobin
reductase enzyme system. However, the activity of this enyzme was not
affected by acute or prolonged exposure to nitrite (Table 6.8).

149
Table 6.1. Changes in serum ion concentrations in
Lates calcarifer after prolonged(8-day) exposure to 10 mgl-1 N02 -N
Ion (mM) Control Treated
(n= 13) (n=10)
cl- 121.38+ 3.20 127.80+ 1.62
Na+ 198.15+ 3.70 218.55+ 6.58*
K+ 1.66+ 0.14 2.36+ 0.20*
Ca2+ 1.51+ 0.06 1.59+ 0.13
Values are presented as mean± SEM
*Null hypothesis of no difference between control and
treated groups was rejected at p 0.05 (Student's t-
test)

150
Table 6.2. Changes in serum metabolite concentrations in
Lates calcarifer after prolonged (8-day)exposure to 10 mgl-1 N02 -N
Control Treated
(n= 13) (n= 10)
Glucose (mg 100 ml-1) 41.13+ 6.0340.39+ 4.71
1.56+ 0.23 2.57+ 0.48Lactate (mM)
5.16+ 0.25 4.79+ 0.45Protein (g 100 ml-1)
0.10+ 0.01*0.15+ 0.01Lipid (g 100 ml-1)
0.24+ 0.020.26+ 0.02Cholesterol (g 100 ml-1)
90.20+ 8.5659.00+ 6.40of-Amino acid (mg 100 ml-1)
8.52+ 0.79*5.81+ 0.38Ammonia (Jug NH3-N ml-1)
1.57+ 0.151.29+ 0.11Urea (mM)
Values are presented as mean± SEM
*Nu11 hypothesis of no difference between controlana
treated groups was rejected at p <0.05 (Student's t-test)

151
Fable 6.3. Changes in tissue composition of Lates calcariferafter prolonged (8-day) exposure to 10 mgl-1 N02 -N
Control Treated
(n= 13) (n= 10)
Hiepatosomatic index 0.97+ 0.09 1.37+ 0.21
(% body wt)
Liver water 51.14+ 3.98 55.01+ 4.48
(% wet wt)
Liver lipid 63.04+ 5.14 54.17+ 7.91
(% dry wt)
14.45+ 2.11 17.53+ 2.38Liver glycogen
(mg g-1)
7.90+ 0.808.08+ 0.81Liver protein
(g 100 g-1)
4.32+ 0.353.94+ 0.40Liver lactate
(umol g-1)77.75+ 0.5277.46+ 0.29Muscle water
(% wet wt)3.51+ 0.822.66+ 0.55Muscle lipid
(% dry wt)42.18+ 5.8341.74+ 5.02Muscle lactate
(jpmol g- 1)50.62+ 3.8152.40+ 3.42Brain lactate
(utmol g-1)
Values are presented as mean± SEM

Table 5.4. Changes in serum metabolite concentrations in Lates calcarifer
after acute (96-hour) exposure to various nitrite concentrations
Control
(n = 5)
30 mgl-1 N02-N
(n = 6)
50 mgl1 NC2-N
(n = 0)
30 mgl-1 NO2-N
(11 = 5)
Glucose
(mg 100 ml1)
Lactate
(oM)
Protein
(g 100 ml1)
Ammonia
(ug NEs-N ml1)
Urea
(mH)
25.53 + 2.3S3
0.46 1 0.16 3
6.02 - O.IO3
5.87 -r 1.08
1.07 ± 0.123
21.60 ±.3.E7a
1.10 + 0.45°
5.96 x 0.133
n.d.
n.d.
16.35 ± 3.5ia
1.41 + 0.22c
6.20 -r- 0.28°
11.52 1 0.98 2
1.36 - 0.10d
16.54 -+• 2.76
5.03 + 0.69 b
5.06 + 0.35b
13.71 -1- 0.80b
1.88 + 0.26°
Values are presented as mean + S£E. n.d.: value not determined
Values with different alphabets are significantly different at p = 0.05
(One Way Analysis Of Variance followed by Duncan's Multiple Range Test).

Table 6.5. Changes in tissue composition of hates calcarifer after acute
(96-hour) exposure to various nitrite concentrations
Control
(n = 6)
30 mgl1 HOz-N
(n = 6)
50 mgl1 NO2-N
' (n =6)
80 mgl-1 NO2-N
(n = 5)
Liver glycogen
(mg g1)
Liver protein
(g 100 g1)
Liver lactate
{jmol g-1)
Muscle lactate
tool g~1)
Brain lactate
(pmol g-1)
18.31 ± 6.71°
a b
8.10 t 0.35
3.56 ± 0.29S
32.82 y 1.46 C
50.03 ± 3.77£
7.68 y- 1.42°
8.36 + 0.41°
2.75 ± 0.54S
29.66 ± 1.74DC
42.55 jr 2.51
6.96 1 2.22 3
E.31 ± 0.34B
2.68 1 0.35s
21.53 + 3 .09 e
48.08 ± 2.20C
3.89 1 0.96 D
8.65 + 0.23b
2.95 ±0.18°
25.18 + 1.58a E
47.96 ± 5.44a
Values are presented as mean ± SSK.
Values with different alphabets arc significantly different at p z 0.05
(One Way Analysis Of Variance followed by Duncan's Multiple Range Test).

Table 5.6. Effects cf acute (96-hcur) exposure to 50 mgl-1 NC-N on gill arc liver
enzymatic activities of hates calcarifer
Control
(n = 6)
Treated
(a = 5)
Gill:
Na+-jC+-.VT?ase (umcl ?i mg protein-1 h-1) 3.34 + 0.53 4.70 - 0.37
liver:
Pnosphorvlase a (umol G1P g protein-1 min-1!
LDH (amol g protein-1 min-1)
ICDH (made g- protein-1 min-1)
G6?ase (umole Pi g protein-1 min-1)
GPT (units mg protein-1)
GOT (units mg protein-1)
G6PDH (umole g protein-1 min-1)
G1DK (umole g protein-1 min-1)
100.13 + 3.06
34.31 + 7.96
211.02 + 13.23
23.25 + 3.60
97.19 + 6.32
46.97 ± 1.67
148.24 + 4.73
11.91 + 0.63
53.68 + 5.36
34.96 + 6.20
239.23 + 14.53
13.73 ± 3.68
108.36 ± 7.26
34.21 +-1.96
151.06 + 5.32
9.90 + 0.54
Values are presented as mean +; SUM
Null hypothesis of no difference between control, and treated groups, was rejected atV 0.05 (Student's t_-test)

Table 6.7. Changes in concentrations of liver adenosine
nucleotides of Lates calcarifer after
acute (96-hour) exposure to 50 mgl1 NO2-N
Control
(n = 6)
Treated
(n = 6)
Adenosine triphosphate (ATP)
(jimol g_1)
3.04 + 0.55 1.90 + 0.55
Adenosine diphosphate (ADP)
(jjmol g1)
1.83 + 0.26 0.82 + 0.17
Adenosine monophosphate (AMP)
(pmol g_1)
1.14 + 0.25 0.34 + 0.07
Adenylate energy charge (AEC) 0.65 + 0.06 0.74 + 0.03
Values are presented as mean + SEM
Null hypothesis of no difference between control and
treated groups was rejected at p 0.05 (Student's t-test)

156
Table 6.8. Changes in NADH-methemoglobin reductase
activity of Lates calcarifer in response
to acute and prolonged nitrite exposure
TreatedControl
(n= 4)(n= 4)
Acute exposure
(96 hours, 50 mgl-1 N02-N)
0.40+0.050.54+ 0.11NADH-methemoglobin reductase
(umol min-1 ml cell-1
Prolonged exposure
(8 days, 10 mgl-1 N02-N)
0.41+ 0.020.44+ 0.03NADH-methemoglobin reductase
Oamol min-1 ml cell-1)
Values are presented as mean+ SEM

10
M
n
; 10I1
1
j 0)f
))
i o
)A
I
I
2
treated
control
without fish
0i 2
1
3
TIME (hr)
Flgute 6.1. ClniKies In the ammonia concentration of the water (Vol.-20 1)
Into which control (O) °r treated (©) fish were
° ) without fish.
tr!(
to
0r-
Zcht1pt
cZct
Kbzc23

6.5. DISCUSSION
In the present study, we attempt to study the metabolic
eh amies i]1 kat. es (-'al earifer in response to acute and prolonged nitrite
exposure.
6.5.1. Serum sodium and potassium accumulation
Tel cost fish exhibit a remarkable ability to maintain the
ionic composition and osmolality of their body fluids at a relatively
constant levels regardless of their environmental salinity. Studies
over the last 50 years have led to a firm understanding or the general
p at tern o f o s in o r e g u 1 a t o r y m e c h a n i s m s , and the head region,
paiticularly the gills, clearly plays the key role in the salt
transport, processes required for ion and osmotic regulation (Doyle and
Gorecki, 1961; Maetz and Dornaucin, 1975; Foskett e_t al. , 1333).
The blood of seawater fish or seawat.er-adapt.ed euryhaline fish is
markedly hypotonic compared with their external milieux and therefore
they face tlie problems of dehydration and salt, influx. To be able to
survive in their hypertonic environments, seawater fish continuously
drink sea water and excrete salts by extrarenal means.
The so ca 11 ed e 1 i 1 oride cells in the gill epi 111e 1 i11iri of
marine or euryhaline fish have long been shown to be responsible for
the active excretion of salts into hypertonic environments (Doyle and
Gorecki 1 976; Ftida et_ al. , 1971) . Branchial Na -K -A I Base which is

159ioealize(i on the basolateral surface of the chloride cells has been
repeatedly shown to be involved in salinity adaptation in many
euryhaliiie species. Studies concerning the role of branchial Na+-K+-
ATPase generally held that this enzyme _is involved in the active
extrusion of NaC]. from the gill in fish adapted to sea water (Epstein
et, al., 1967; Sargent et al., 1975 Epstein et al., 1980)
Therefore, in many euryhaline fish species, Na+-K+-ATPase activity is
markedly elevated upon adaptation to high salinities (Epstein et al.,
1967 Utida et al., 1971 Sargent and Thomson, 1974; Ho and Chan,
1980 Woo and Tong, 1982).
In the present study, exposure of Lates calcarifer to 10
mgl-1 N02-N for 8 days resulted in increased serum Na+ and K+
concentrations. However, this was not accompanied by decrease in
hematocrit or tissue water content. Therefore, the elevated serum Na+
and K+ concentrations were certainly not due to body dehydration but
some defects in the ion extrusion mechanisms.
In order to further investigate the impact of nitrite on the
osriuoregulation of Lates calcarifer, a separate batch of fish was
subject to 96 hour exposure of 50 mg1-1 N02-N and the branchial Na+-
K+-ATPase activity was assayed. It was found that the branchial Na+-
K+--ATPase activity in nitrite-treated fish was markedly lower than
that of control fish. This finding indicates that nitrite can offset
the osmoregulation of fish by markedly inhibiting the activity of one
of the important branchial transport enzyme Na+-K+-ATPase. Since

160branchial Na+-K+-ATCase is responsible for the active extrusion of Na
and Cl across the dills, inhibition of the activity of this enzyme
should result in an accumulation of serum chloride in addition to
serum sodium. In fact., as shown in Table 6.1, the serum chloride
level tends to be Higher, though insignificantly, in treated fish as
compared with control fish. Lack of significance may be clue to the
small sample size or increased excretion of chloride ion through other
pathways (e.g. renal) or decreased absorption of chloride ion through
the gut. Serum calcium level was not elevated, presumably due to the
relatively small ionic gradient that exists between sea water and
serum. Also, there is no evidence that the gill participates in the
calcium excretion. Therefore, gill damage or branchial transport
enzyme inhibition may not interfere calcium level in the fish blood.
Inhibitory effects of nitrite on branchial transport enzyme
has not been reported for other marine or euryhaline fish. However,
for freshwater fish, nitrite has been shown to markedly inhibit the
activity of branchial carbonic anhydrase in vitro in rainbow trout
(Gaino et al., 1984). Carbonic anhydrase plays an important role in
the chloride absorption of freshwater fish. It catalyzes the
production of bicarbonate which is believed to exchange for chloride
in the external environment (Maetz and Garcia-Romeu, 1964).
Therefore, no matter in freshwater or seawater fish, nitrite
definitely confers osmoregulatory failure on them.

l'' ' • fclycogon depletion and lactate accumulation
An 8 'laV immersion in 10 mcjl1 X0o-X did not elicit markedA—.'
metabolic changes in bates calcarifer. Glycogen depletion and lactate
act nmulal ion appear to be the most irupictant phenomena which occurred
win a fish a re subject to hypoxia or anoxia (e.g. Heath and Pritchard,
1900; Walker and Johanson, 1977; Van den Tbillart et al . .. 1980; Woo
and Viu, 198-1; Yu and Woo, 1987). Tliese two responses, however, were
not observed in Lates subiect to prolonged nitrite exposure. However,
accumulation of sejurn lactate was evident when bates were exposed
for 96 hours to 80 nig I '• N00-N at which more than 70 T of the fish
hemoglobin was oxidized to methemoglobin. The lactate in serum may
be chanelled from other organs where anaerobiosis occurred or produced
locally by the red blood cells. It lias been argued that the brain is
the most vulnerable organ to oxygen deprivation (Robin et al . , 1964)
while white muscle is capable of prolonged anaerobiosis. In this
experiment, we did not observe an increase in brain lactate content in
fish exposed to any one of the test concentrations, back of increase
in liver lactate content was also observed in treated fish. Absence
0f elevation in lactate content in both brain and liver indicated that
t he se two organs did not suffer from oxy gen deprivation and
anaeiobiosis even when less than 30 6 of the hemoglobin was left fot
oxygen transport. At extreme high nitrite concentration (eg. 80 mgl 1
NOo X) physiological adjustments should have been made so that
adequate oxygen was provided to those essential organs including brain
1,U: 'i-ve' • (-U i 1 iarv dilatation may be one physiological adjustment
tli a I increases the perfusion of organs. Capillary dilatation in
response to hypoxia lias been demonstrated in brain of fish (Scheich et
aJL. , 197 2). L. calcarifer did not accumulate lactate in the white
muscle during nitrite exposure. Partly because of: the sluggish habit,
L- aic'ai fer shoved very low activity levels during the experimental
period. It. is well known that at very low activity levels white
muscles are not used in locomotion and therefore consume little
energy. The apparent absence of activation of anaerobic metabolism in
white muscle during nitrite exposure indicated that nitrite posed no
significant: increase in metabolic load on the muscle. Instead, the
fish subject to nitrite exposure became even more sluggish when
compared with control fish. One interesting finding was that there
was a tendency of decreasing muscle lactate content as exposure
concentration of nitrite increased and the decrease became significant
-1in fish exposed to 50 and 80 mgl N00--N. It is well known that
lactate is a dead end in metabolism. Lactate diffuses out of active
skeletal muscle into the blood and are carried out to the liver where
1acta t e is converted int o g1ucose bv g1uconeogenesis. Hepa tic
g 1 uconeogenesis from lactate lias been demonstrated in some teleosts
(Phillips and Hird, 1.97; Mosse, 1980; Renaud and Moon, 1980).
Glucose then enters the blood and is taken up by skeletal muscle or
o 11 i er tissues. A t se vere nitrit e into xication, 111 ere w a s a gre a t
demand for metabolic energy to resist the stress and therefore the
lactate in muscle was probably transported to the liver where it was

coneitecl to the metabolic fuel, glucose.
lul.LUAi caJ cir i tej' was shown to mobilize 1 iver glycogen
dating acute nitrite exposure. Glycogen mobilization in liver has
been demonstrated in the red grouper and the black sea bream during
hypoxic exposure (Woo and Wu, 1984). Increased glycogen breakdown in
liver should increase the serum glucose. However, this was not the
case .i.n the present experiments. The serum glucose concentrations in
treated fish ware not significantly different from that of control
fish. This cou 1 d pr(bab 1 y be a11 r1 hu t ed t o an inc reasod 11p!;ake of
glucose from the blood stream by various tissues in order to provide
f u e L f o r the ext r a m e t a b o 1 i c e n e r g v r e g u i r e m e ti t d u r i n g t h e
experimental period. In addition, increased consumption of glucose to
generate more energy by red blood cells may also account for the
unchanged level of serum glucose in treated fish. lire elevated serum
lactate suggest an enhanced anaerobi.Gs.is in the erythrocytes of L.
_ 1
calcarifer, at least, during acute exposure to 80 mgl ~ NOo-N.
Anaerobic metabolism was activated in red blood cells because of
oxygen deprivation which resulted from the high met hemoglobin
concentration. Besides, a large amount of ATP was urgently required
by the met hemoglobin reductase enzyme system to reduce methemoglobin
back to hemoglobin. Under enhanced nitrite intoxication, formation of
lactate through anaerobic pathway can produce considerable amount of
energy in a short period of time.

b.n.l. Serum lipid and protein depletion
Prolonged (8 day) exposure of. the fish to 10 rag 1 ] N0o~NZJ
caused no depletion of lipid in liver and muscle. However, a
depletion was observed in serum lipid content. Lipid is a major
metabolic fuel j ij animals. Considerable amount of: the serum lipid may
be broken down to tally acids and glycerol of which energy is readily
qenerat.ec] to meet the energy requirement of the red blood cells or
other 1 issues. On the other hand, the serum cholesterol content,
remained unchanged during prolonged nitrite exposure.
0eu e r a 11 v s pea k i ng , ni.tr i t e expos ur e d i d n o t el i c i t
pronounced effect on the protein content of the fish. Liver protein
remained unchanged after prolonged or acute nitrite exposure although
protein has been reported to he the major energy source in fish (Nagai
and Ikeda, 1971). Serum protein was significantly decreased only in
fish exposed I o 80 mg 1 ' N0o-N. A decline in serum total proteinZj
levels has also been recorded during the acute and chronic exposure of
CI arias lazera to nitrite (Hilmy ej_ al. , 1987). The decline in serum
protein may be a generalized stress response since a great variety of
s tr es sor s inc1uding t oxicants a 1 so tend t o diminish the t o t a I b 1 ood
p ro t ei t ) (Se1y e, 1950) .
G . 5 .4. Serum ammoni a and urea acciunul at i on
Prolonged and acute nitrite exposure caused an elevated serum

a,ll,'',i 'l] '11 .WvLVvi. a 1 carifor. The elevated serum ammonia suggests an
' 11 1 o a s» e i n !lt e e x e r e t 1 o n o f a mmo n i a i n t r e a t e d f j s I; . Th e
e x [ • i i in e n I (j on uu c ted to compare the rate of ammonia excretion of
nitrite treat ec. fish with that of control fish supported this
speculation. The average ammonia excretion rate of treated fish was
about 3 fold of that of control fish.
feleosteaii fish excrete the major part of their nitrogenous
waste in the form of ammonia. Ammonia accounts for 55-80 % of the
total nitrogen excreted (Wood, 1958; Fromrn, 1963). Relatively little
information is available about the pat ft ways of nitrogen metabolism in
fish. Most fish are carnivorous with a high dietary protein intake.
A relatively large part of their energy is derived from catabolism of
proteins and therefore protein is considered as the main source of
excreted nitrogen in fish (Walton and Cowey, 1977). Several metabolic
routes have been proposed as major mechanisms for amino acid
deamination in fish tissues, but none of them can be considered as
established, because no conclusive evidence has been presented about
their existence, maximal capacity and quantitative operation rn vivo
(Waarde, 1981). One of these mechanisms is the transrlearnina tion
scheme (Braunstein, .1957; cited in Waarde, 1981), in which amino
acids t ra11sami na te w i th o-ketoglu 1 arate t o f orrn g 1 utamate, wh 1 c 11 i s
subsequently deaminated in the mitochondrial matrix by the endergonic
glutamate dehydrogenase reaction. Another route is the cytosolic,
exergon if purine nucleotide cycle, proposed by Braunstein (1 957 )

'11 WiKn.de, 18.1) and Lowenstein (1972), in which AMP deaminase
(alalyes I lie deami n a I j.on of AMP to produce ammonia. Furthermore,
spot i a 1 i zed deami nat ion pathways may exist for the catabolisrn of
aspartate, cysteine and histidine (Salvatore et al., 1969), although
their quaiiI it at i ve importance in ammonia production must ho questioned
(Pequin and Serfaty, 1963).
The increased production of ammonia in treated fish may
result from an increase in protein degradation and amino acid
deuiuLiiation which can generate more energy for the resistance of
nitrite toxicity. However, a significant reduction in serum or liver
protein content was not evident in treated fish except those exposed
to 80 rug] ' NO-, N. Absence of measurable reduction in liver proteinj
strongly suggests the possibility that the purine nucleotide cycle is
activated in treated fish so that additional amount of ammonia arises
from the deaminat ion of AMP. This point will be further elaborated in
a subsequent section in combination with the results of liver enzyme
activities and adenine nucleotide levels.
It is generally held that fish do not have a complete urea
cycle. However, exceptional cases are not uncommon. For example, it
has been well established that the lungfish has a full complement of
oi nithi ne urea cycle enzymes in the liver and is shown to be able to
synthesize urea under condition of unfed and estivation (Janssens and
Cohen, 1967). Nevertheless, until quite recently, there was still
«t rong controversial opinions about the existence ot a functional

167
l)i n i. t hine urea cycLe in L e l e o s t s . Two enzymes of the c y c l e ,
ca rbniny 1 phosphate s yu the fane and ornithine t ranscai ;bamoyiasc; have been
imported lo be absent horn t el eost l iver (Brown and Cohen, 1960) .
Channel ca t f i s h lias shown to have an incomplete orni thine-urea cycle
(Wilson, 19/ 1) . However, Huqcj ins el a l . (1969) found s ignif i cant
levels of aJ 1 five enzymes of the urea cycle in several species of
leleosl .ean f i s h , both from f r es hwat er and marine h a b i t a t s . High
a c t i v i t i e s of a l l f i ve of l lie urea c y c l e enzymes have a l s o been
demonstrated in marine t e l eos t Ops an us tail (Read, 1971) .
The present study lias demonstrated t ha t the serum urea
content in t r ea t ed fish was higher than t hat of c o n t r o l f i s h .
Arginase, an enzyme of lhe urea cycle, lias been shown to be present in
the l i ver of Lates c a l ea r l i e r (Leo and Woo, unpublished). However,
another urea cycle enzyme, ornithine transcarbamylase could not be
delected. Therefoio, L. c a l c a r i f e r are unlikely to possess a complete
urea cycle and the urea found in the serum may ar ise from ur i col ysi s .
lisli exposed to n i t r i t e seemed to have an enhanced purine degradation
during which AMP is deaminated to IMP by AMP deaminase and ammonia is
evolved. Further breakdown of IMP resul ts in the formation of urea.
The increased producton of ammonia and urea by purine degradation may
account for the elevated serum ammonia and urea level in treated f ish.

168
Change level s
1,1 lieiial. i(- enzyme a c t i v i t i e s and adenine nucleotide
In order to lunve a clearer understanding of the underlying
a'd ion of nil r i l e , the ac t i v i t i e s of enzymes involved in several major
hiochem.iea 1 pathways in l iver were determined. Based on the available
data, fish exposed % hours to 50 m g l N 0 o N did not show markedl*changes in l iver metabolic contents. Tills was the same for hepatic
enzyme a c t i v i t i e s . Bignif\cant changes were only observed in
a c t i v i t i e s of phosphoiyIase, GOT and G1D1I. Absence of changes in
a c t i v i t i e s of ICDll, !,pii, GCf'DlI and GGPase suggests that, ni t r i t e seems
to have l i t t l e influence on the several biochemical pathways including
T (: A e y c 1. e , an a e r o h i o s i s , p e n t o s e p li o s p h a t e p a t h w a y a n d
q 1 ucoiieogenesi s .
i t i s w e 1 ] k n o w u t h a t p h o s p h o r ylasc e x i s t s in two
i nt er conver t i bl e Tonus: an ac t i ve phospliory 1 ase <a and a usual l y
inact ive phosphory1ase h. Only the a c t i v e form can c a t a l y z e the
glycogenolytic reaction. Conversion of the Inactive form to active
form involves a sequence of reactions which are catalyzed by a series
ot enzymes i n c l u d i n g a d e n y l a t e c y c l a s e , p r o t e i n ki nas e and
phosphorylasc kina.se. As shown in Table 6.5, the treated fish tended
to exhibi t a lower l i ver glycogen content when compared with the
control fish. However, the treated fish showed a decreased act ivi ty
ol l iver glycogen phosphorylase a. These two observations seemed to
be contradictory. The possible reason was that during the ini t i al

169period of nitrite exposure, glycogen breakdown was really enhanced in
treated fish in order to provide more energy for the resistance of
nitrite toxicity. However, after a certain period of nitrite
intoxication, one or more of those reactions that convert the
phosphorylase from inactive form to active form might be blocked by
nitrite so that a lower phosphorylase a activity resulted in the
treated fish. In addition, nitrite may exert its inhibitory effect on
glycogen phosphorylase a directly.
Glutamate-oxaloacetate transaminase (GOT) and glutamte-
pyruvate transaminase (GPT) catalyze the transaminatioti of aspartate
and alaniiie respectively with -ketoglutarate to form glutamate.
Since the liver glutamate dehydrogenase activity was significantly
lowered in treated fish, the glutamate concentration may rise to a
level which can inhibit the activities of GOT and GPT which catalyze
the formation of glutamate. Treated fish showed a significant
decrease in liver GOT activity. Absence of change in GPT activity may
due to the fact that GPT is responsible for the transamination of
alani.ne which serves as an intermediate product for the transamination
ofter -amino acids (Strver, 1975).
Glutamate deliydrogenase is generally held to play a central
role in amino acid deamination and nitrogen excretion by animals
(Walton and Cowey, 1977). Although, thermodynamically, the glutamate
dehydrogenase reaction favours reductive amination of -ketoglutarate
rather than oxidative deamination of glutamate, an equilibrium is

170
coin - idored l (.) <u iso j n_ v iyu which due to f ac t or s such as r e l a t i v e
l e v e l s () i uncle o t i. d e s a 11 d r e m oval o f r e a c t i. o n p r o d u c 1 s f <i von r s
glutamate ox i dal ion (Walton and Cowev, 1977) . Glutamate dehydrogenase
c a t a l y z e s the following r eac t i on :
glutamate + i\A!)(P) + i !b,0 <-------- > o(-kel og] ut ara te + NH+
■+ N A D (P) H H
An appai ent nn' iease is ammonia product i on was observed in t reated
f i s h . .1 l am mou ia oni v comes from the g l u t a rn a t e de hydr ogenas e
r e a c t i o n , the increased serum ammonia level in H.reated f i sh may imply
\ ].i a !' the act h i ‘ v of glutamate dehydrogenase i u the l i v e r of t reated
f j sh should .he higher. than that of cont rol f i sh. However, tills was
not the ease in the present study. The a c t i v i t y of 01Pi! in t reated
f ish was s i g n i f i c a n t l y lowered. This res ul t i n di r e c t l y confirms the
p o s s i b i l i t y that the addi t ional amount of ammonia found in t reated
f i sh a r i s e s from the purine nucleot ide cycle in which ATP deaminase
d e g i a d e s A M V to produc e i n o s 1 i i e rn o 11 o p 11 o s p 11 a t e (I H P) a m 1 a rn rn o n i a .
Nevertheless , from tlie present avai l abl e data, i t i s d i f f i c u l t to draw
a conclusion about the r e l a t i v e importance of the purine nucleotide
cy c i e and g 1 u t ama t e d ehyd rogen a s e r e a c t i on i n ammoni a prouuc 1 1 on
of the f i s h . In rat t i ssues AMP deaminase a c t i v i t y appears to be
in v e }'3 e 1 y ))r o por t 1 ona 1 1 o t nos e of g 1 ut amat e d ehv d r o g e n a s e
(lioweiistein, 1971) , and this is also true for trout (Walton and Cowev,
1977) and goldfish (Waardo, J 980) . A high a c t i v i t y of the former is
accompanied by a low a c t i v i t y of the l a t t e r , and \ i( e 'C)sa. The

171present experiments have not measured the AMP deaminase activity in
both control and treated fish. However, the increased degradation of
AMP suggests an enhanced activity of AMP deaminase in treated fish.
The enhanced activity of AMP deaminase may have an inhibitory effect
on those of glutamate dehydrogenase so that its activity becomes
significantly lowered in treated fish.
Tne aaenlne nucleotide pools have been proposed as a
system that responds rapidly and sensitively to stress to indicate
adverse conditions before they are irreversible in the organism
(Giesy, 1988). Stress including hypoxia, anoxia and heat have been
widely shown to affect the levels of adenine nucleotides in fish
(Van den Thillart et al., 1976 Van den Thillart et al., 1980
Giesy, 1988). Therefore, experiments were carried out to measure the
liver ATP, ADP and AMP levels in order to investigate whether nitrite
has any adverse effects on the energy pool of the treated fish.
As shown in Table 6.7, a significant decrease in liver ADP and AMP
concentrations could be observed in treated fish. Calculation showed
that the adenylate energy charge (AEC) which was defined by
Atkinson(1968) as (ATP+ 1/2 ADP)/ (ATP+ ADP+ AMP) are not
siunificantly different between treated and control fish.
Recent biomedical research has shown that various forms of
stress such as disease, injury or exposure to pollutants act in a

lat m,umt i |i ol iciting pliyr;j.o 1 ogical dctcn.se responses (Celye,
I )(). 13 (mm use of Mtr« metabolic activity associated with these
defenses, increased energy utilization occurs when an organism is
subject to a stressor. Therefore, it is within our expectation that
a dec lease occurs in liver ATP which is the primary source of
biochemical energy during nitrite immersion period. The decreased
•n a i. 1 a 1)i 1 i I y of All' tnqpthor with an increased demand f or energy to
I'csjsl I he stressor result in an inadequate energy supply to carry out
normal cellular (unci ion and maintain homeostasis. ATP is the
organisms' energy currency and its concentration can directly
increase the activity of some enzymes, while decreasing the activity
of others, lor example, at greater ATP concentrations, metabolism is
shifted toward q1u c o neo ge n os i s due to d ec teased a ctivit y of
phosphof i net ol; i nase. When ATP concentrations are small, metabolism is
shifted toward glycolytic degradation of glucose due to AMP inhibition
of fructose diphosphatase (Giesy, 1980).
An interesting phenomenon in treated fish could bo observed
with regard to liver APP and AMP cuncen t ra t ions: liver ADP and AMP
concentrations decreased as ATP concentration decreased. If ATP is
discharged directly to APP and AMP, decrease in ATP level should be
accompanied by a concomitant increase in ADP and AMP levels. However,
wo could see thai the total sum of liver ATP, ADP and AMP decreased; a
finding which indicated that adenine nucleotides disappeared in
nitrite-treated fish. With regard to the standard energy charge
model, Giesy (1988) stated that during short-term stress, the energy

1 7 3
atort vitj, ATT, vouUi |)0 u t i l i z e d so that the ATP concentration
would docriM!,,, Khil„ Ul(> RDP, and enbseqnentlv AMI’, concentrations
i " r l " 1s“ - T l „ . u n d e r short term stress, one would expect to
observe a iv* (.orreiation between both MM* and AMP concentrations
and l|,P i;o,"-r!n! ration ot ATP. Because the relat ive concentrations of
^'•'"Vlates are Ul011<jht to be closely regulated (Atkinson, 1 968), one
v,'or:id expect. ,ilal ,|.Klc,l. jong-term stress the concentration of AMP
would be r o d , , iV (lecjvadation in order to bring the adenylate energy
‘•'targe back lo |ui(iKM,;ll a ,■ U. values, while the t o t a l concentrat ion of
adenylates is rfi(Ju,,pfl. Decrease in total sum of ATP, ADP and AMP
levels has a l s o lippil , p,)ort ed i„ goldf i sh exposed to anoxia (Van den
Tin 11ai t e l a ] . , | 97G)
ftdeny l a l e energy char ge has been suggested as a measure of
the m e t a b o l i c enorgv a v a i l a b l e t o an organism from the ,i(len>3<.to
(Hava ami Waiwood, 19R1) and t h e o r e t i c a l l y it can uiage b e , « . u-
AMP! and 1 . 0 (,-,]] m p ) . Under opt imal c o n d i t i o n s the Alw oi. a c t i v e l .
me t a b o l i z i n g ,,P l l ; ; ami t i s s u e s or organisms from b a c t e r i a to mammals1 977)
ramies between q _ 7 9 alu] Q.99 (chapman et. hi - » 1 9 /1 ; Atknu.on,
While lower v.:,luer> in the range of 0.55 and 0.75 indicate stress
c o n d i t i o n s and below 0 . 5 0 death i s normul.ii imminent
M \ o i l • Beis and Newsholme, 1975, Atkinson,19/ 1; Montague and Dawes, 19 H , nri,.o
1977; Holmsen and bobbin. 1977). Energy charge i s highly r e g u l a t e a
(Atkinson, i^«> tmly ^ "l° Ved ^ot t he i r region of Homeostasis. For example, in goldfish exposed id

hours to anoxia, the energy charge of liver decreased from 0.60 to
0.11 (Van den Thi'llart et al, 1980). Adenylate energy charge is
kinetically important in the enzyme regulation of catabolic,
amphibolic and anabolic sequences (Atkinson, 1968; Ebberink et al,,
1976). Greater values cause increased anabolism, while lower ratios
induce increased catabolism.
The present study found that the adenylate energy charge of
treated and control fish were 0.65 and 0.74 respectively. Both values
are relatively lower than those of mammals (Kamiyama et al., 1976) but
quite comparable to those reported for goldfish (Van den Thillart et.
al., 1980), trout (Gras e_t al., 1967; cited in Van den Thillart et
al. , 1980), striped catfish (Yip, S. W., personal communication) and
Chinese mudskipper (Yip, S. W., personal communication). The two
values obtained fall in the range of 0.55 and 0.75 which indicates
stress conditions. Since control fish were unfed during the
experimental period, starvation might pose considerable stress in the
fish. Stabilization of adenylate energy charge in liver tissue of
treated fish can partly be achieved by an enhanced production of ATP
or an increased conversion of AMP into IMP. The concentration of
liver ATP in treated fish, however, was found to be unchanged.
Therefore, most likely treated fish decreased their liver AMP
concentrations by converting it into IMP in order to maintain their
adenylate energy charge at a relatively constant value. IMP probably
is the substance into which all adenosine-compounds are converted.

(Murray and Jones, 1957; Saito et al., 1959) but also after severe
exercise (Jones and Murray, 1960; Fraser ej al., 1966). The
accumulation of IMP results from action of the enzyme AMP deaminase.
which catalyses the reaction AMP This
enzyme has been described in carp, mackerel and cod muscle (Dingle and
nines, J 9G7; Hidaka and Saito, 1960) and proved to be highly active
The physiological significance of IMP-
accumulation was described by Tornheim and Lowenstein (1972) in rat
muscle. They found that the two antagonistic enzymes, AMP deaminase
and AMP synthetase, were regulated by the energy charge. At high
energy charge AMP was produced and at low energy charge AMP was
converted into IMP. According to the reaction mentioned above, we can
see than ammonia is also produced when AMP is degraded to IMP. It is
clear that increased degradation of AMP to IMP should lead to
concomitant increase in ammonia production. Probably this could also
explain the increase in ammonia production in fish exposed to nitrite.
6.5.6. Changes in NADH-methemoglobin reductase activity
Methemoglobin is continuously formed in normal erythrocytes.
Small amounts of methemoglobin (1 %) occur in mammalian red blood
cells (Beutler, 1968). In poikilotherms, erythrocytic methemoglobin
contents have been reported to be 2.9 % ill rainbow trout (Cameron,
.1971), 2.2 % in channel catfish (Huey e_t aJ. , 1980), and 5.7 % in Ran a
catesbiana tadpoles (Huey and Beitinger, 1980a).

1 7 6
1111 n i ,i! i :; nos serir; a in p f ] i e n> oq [ o b i. n - r o (1 u c t a s e s y s t e m c a i j a b J. o o f
convort i ng mothemeu !.obi.n to hemoglobin ( J a t f e , 1.961). lo o t t et a l .
( i f' ' 'p) lia vp I Pino a /: M ;i. t. cd t hat j n man red no t i o n j s accompl i shed
t ■ r 11 u • i )) a 11 v 1»\ Use on ? ym o N A Dll- m otlie m o g 1 o b 1 n r e 1 11 c t a s o (D i a pb o r a s e
1 ) < n !. i 'i < > a n !i i. e 1 u c p d q 1 u t a t Ii i o n e f a s c o r b i c a c i d , a n d X A D F H -
mot u Pinog] obi n i educt a no appear to reduce methemog] obin \ o a l e s s e r
p ' ii 1' . Fry t limey { i.e mo themoqlo b i n r e d u c t a s e act. i v i t v lias been
studied in se v e r a l common mammalian species (Agar and Harley, 1972) .
Huev et a t . ( L980) found that channel c a t f i s h recovered from
-•xtreme methemoql obi lr-mi a (80 l of total, hemoglobin) vi thin 24 hours
who ii tia.iu a C el r pd t 0 II1t r 1 1 e - f r e e w a t e r . Th i. s s u g g cs t s t h a t a
met hemog 1 o I)j 11 redact a 0 • f > system si mi l ar t o t n a t at’ t i v e in mammalian
e r v 1.111: o c v t 0 s 1 S o p e r a t i iKj i .u pa t f i sli . This li1y po Die s i s was f i r s t
pro posed I>v C-ameron (I 971) and[ supported experi men t a l l y by Huey and
Be i i. i n g e r (19 O r) O c.; ) . Fr e email e x itl- o 9 8 3 ) f ur■ t h *:■v c o n f i r me d the
pi e s e u c o <:)f I\A DM-met lu o tQ O H- n r e d a c t a s e s y s t Gill i n J 0 o f t b e 1 3
f m s h v/ a. t e r [if ;h s p e c :i e:a test ed Later , Scot t aaid Barr ington (1986)
del e rmiupd t he I p d u c i a s p a c i 1 v i Iv of rai;nbow trout and co he salmon and
Colemamd wi Hi l ii a 1 (t! h ufi'.a n . However, no si lull ar s rnd ji.es !iavo been
dir ected t o s t lidv trip I'educt ase• enzyme s ystcm of maimine or euryhaline
f is,h.
In the? pro so nt expei: imentr L<ites calc ! a r i ; er was found to
possssess the lAbH-meiiiemoglobin reductase system and the a c t i v i t y
me.inured at 21 '°C war. e-jual to 0 .4 3 Jlmol min"1 ml" ’ c e l l . The only

;i v a i l ii 1 U? in I ho lit ora lure on I lie aetivit 1 e rJ of NADH-
iiio I hemoy I. ol) i ii rod no l ;i no woro reported by Scott and Harrington (1985).
llioy found thai the Nf A D (I mothemoy I. obi n reductase activity of both the
ininbow front (0.03 0yjmol nriu ' in I cell) and colio salmon (0.059
miii ' hi I ' coll) was higher than that of human (0.031 yimol ruin-'
ml cel l ) al J 5 0. .Since the available data on the act ivities of NADH-
metlieiiioy lobin reductase were obtained at 15 °C, it was quite
inappropriate to compare the results obtained in the present study
with them. However, the NADH-methemoglobin reductase activity of
Lates ca tea l if or at 23°C was nearly ten fold of that of rainbow trout,
colio salmon and human measured at 15 °C. We can infer that 1.
cai c a r 1 f o l is equipped with a relatively high activity of NADII-
methemoglohin reduclase. This speculation is in line with tlie finding
that L. calcarifei: has a low basal methemoglobin level (See Section
5.5.1.2) . High reductase activity would be a distinct physiological
advantage because fish hemoglobins undergo autooxidation more readily
than mammalian hemoglobins (Boryese et al • 19; Harrington, 1982;
1983) .
Blood samples of fish differed from those of human in that
they required I he presence of a detergent, such as Triton X-100, for
solubilization of the rnethemoglobin reductase system (Scott and
Harrington, 1985). To assay the reductase activity of Lates
calcarifer, Triton X-100 should be added in the hemolysate, otherwise
little or no enzymatic activity was observed. This requirement for a

detergent is similar to that observed by Board et al. (1977) for
reductase activity in nucleated erythrocytes of reptiles and birds,
lieeman e a.. (1983) added saponin to tlie hemolysate preparations
piioL to carrying out enzyme essays in a series of phylogenetically
diverse fish species.
The NADU- methemoglobin reductase activity of Lates
calcarifer was not affected by acute or prolonged nitrite exposure.
One possibility is that the fish simply did not elevate their
reductase activity under the present combination of nitrite dosage and
exposure duration, a higher nitrite concentration or a longer exposure
period may be required to induce the activity. Other possible reason
is that the gene controlling the production of NADH-methemoglobin
reductase is no 11 inducible, 110 matter how high the substrate
(methemoglobin) concentration is. This may be a physiological
disadvantage for L. calcarifer to tackle the problems of
methemoglobinemia caused by nitrite.
6.5.7 Conclusion
In contrast to the pronounced effects on the hematology,
nitrite did not elicit marked changes in Lates calcarifer. Based
on the available data, it can be concluded that hypoxic symptoms were
certainly not elicited in fish exposed to nitrite concentration as low
as 10 mgl-1 N02-N. However, some hypoxic symptoms including lactate
accumulation, glycogen depletion and adenine nucleotides depletion

were evident in fish exposed to high concentrations of nitrite, at
least at concentrations of 50 and 80 mgl N0o~N. On the other hand,Zj
nitrite exposure definitely can induce an increase in ammonia
excretion in Lates.
CHAPTER SEVEN GENERAL CONCLUSION

180GENERAL CONCLUSION
With the expoiieiitial increase in world population, there is
a pressing need for the increased production of different types of
food. Fish is an important food which is a rich protein source and
therefore the demand on fish production, whether from natural capture
or fish farming, has become increasingly high. However, due to the
global deteriorating water quality arising from pollution and the
unmanaged exploitation of fishery resources, fish landing has seen a
marked decrease over the recent years. This highlights the greater
dependence on hitenslve fish farming to meet. the increasing demand for
fish
In the development of intensive fish farming, there is an
urgent need to develop effective, re--circulating closed systems because
considerable difficulty is involved in obtaining good quality water
for intensive culture in many parts of the world. Various types of
closed re-Circulating aquaculture systems for fish production have
been developed in recent years (Liao and Mayo, 1972, 1974 Lewis and
Buynak, 1976 Nagel, 1977, 1980 Muir, 1982 Provenzano arid
Winfield, 1987 Woo et al., 1988). In Hong Kong and other parts of
the world, intensive culture of freshwater fish by closed
recirculating systems has been attempted with some success. However,
in many areas including Hong Kong, the culture of marine food fish is
far from ideal in that fish are cultured in float: cages around coastal
waters (Woo et al, 1988). These culture systems are constantly

exposed to the environment and thus are adversely affected by many
eni1 oilmental conditions, such as red tide and accompanying hypoxia,
changes in salinity, pll and temperature, typhoons, disease organisms
and various pollutants. It is therefore desirable to develop a re¬
circulating sea water system for fish production in Hong Kong (Woo et
al., 1988).
All re-circulating systems involve the use of a biological
filter of some sort (eg. trickling type, submerged type, updraft
type, biodiscs, gravel bed, activiated sludge type) to remove the
waste products through bacterial action. Two nitrifying bacteria,
Ni t rosomonas and Nit robacter flourish 011 the filters and are
responsible for purifying the water. The principal nitrogenous waste,
ammonia, is oxidized to nitrite by Nitrosomonas and then subseqently
nitrite is oxidized to nitrate by N i t r 0 b a c t. e r . Imbalance in the
growth of these two genera of bacteria caused by adverse environmental
conditions such as high pH and ammonia concentration (Russo, 1985)
results in an accumulation of nitrite. Accumulation of nitrite is one
of the most critical alterations of water quality in intensive culture
systems. Although this may be a shorted-lived phenomenon because of
the rapid oxidation of nitrite to nitrate, the highly toxic nature of
nitrite to fishes warrants deeper consideration.
In t li e present study, the 96 hour median lethal
concentrations for Lates calcarifer in freshwater, 15 °00 sea water
and 32 °GO sea water have been established. L. calcarifer is a very

important food fish in Hong Kong. In recent years, aquaculture oi
this species has developed very rapidly due to the economic
feasibility of commercial production of this food fish. Its fast
growth rate and remarkable tolerance to fluctuations of some
environmental factors such as salinity and dissolved oxygen probably
contribute to its popularity in being selected as a cultured species.
A pilot experiment to evaluate the effectiveness of a closed biodisc
system in purifying sea water for the culture of Lates has been
initiated in Hong Kong (Woo e_t aJ. , 1.988). In that study, the
biodiscs were able to keep water nitrite concentration below
at a hi ah storkina rlensi tv of Since the LC50 of
nitrite for Lates in is considerably higher than the water
nitrite concentrations observed by Woo et_ al. (1988), intensive
culture of this species in closed system should not pose any problem
as far as nitrite toxicity is concerned. The LC50 data obtained in
the present study also serve as a guideline for the manipulation of
water chemistry to prevent nitrite toxicity. For example, it is most
feasible to cultivate Lates in 15 0Q0 sea water because it has the
highest tolerance to nitrite at this salinity.
Most literature concerning nitrite toxicity so far reported
mainly dealt with freshwater fish such as rainbow trout and channel
catfish. Limited data are available on the effects of nitrite on
seawater or euryhaline fish. The present study is the first attempt
to outline in detail some hematological and metabolic changes in a
seawater-adapted euryhaline fish, Lates calcarifer after prolonged and
183acute nitrite exposure.
Based on the available data, the underlying toxicity
mechanisms of nitrite cannot be fully worked out. However, the
experimental results did not support the commonly accepted speculation
that nitrite intoxicated fish died as a result of hypoxia induced by
severe methemoglobinemia (Huey et al., 1980). In the first place,
significant mortality was observed when Lates was exposed to
comparatively low nitrite concentration at which methemoglobinemia was
unlikely to occur. In the second place, hypoxic symptoms were not
evident in Lates exposed to low nitrite level (10 mgl-1 N02-N) under
which significant fish mortality was recorded. Remarkable hypoxic
symptoms were only observed in fish subject to extremely high nitrite
concentrations (up to 80 rngl-1 N02-N). It is speculated that other
observed toxic effects such as gill failure and subsequent
osmoregulation derangements probably play an important role in causing
fish mortality.
In addition to the practical contribution to mariculture,
academically, the present thesis also contributes to the general
understanding of the mechanisms of nitrite toxicity in fish.
Furthermore, the present study has laid a solid foundation and
established guidelines for further investigations on this topic.
Suggestions for further work are listed below:
(1) Elevation of serum sodium and potassium concentrations is

184coupled with in Inhibition in branchial Na+-K+ _ATPase.
Establishment of ultrastructural changes in gill tissue in
response to nitrite exposure deserves further investigation
in order to assess the impacts of nitrite on the
osmorequlator processes of fish.
(2) Increased production of ammonia was accompanied by a
decrease in the activity of liver glutamate dehydrogenase.
Assays of IMP level and AMP deaminase activity in both
control and nitrite-treated fish are required to further
confirm whether additional ammonia is produced by the
purine nucleotide cycle.
(3) A higher blood oxygen affinity and a more hyperbolic blood
oxygen dissociation curve in treated fish favour oxygen
uptake from surrounding water across the respiratory
surfaces. Higher blood oxygen affinity can arise from
changes in number and percentage composition of hemoglobin
fractions or erythrocyte ATP levels. Therefore,
experiments on hemoglobin electrophoresis and erythrocyte
organo-phosphate levels arc worth studying.
(4) In general, the blood and tissue of n1Lr1Le-exvuscu
freshwater Cisli accumulate nitrite so that the tissue
nitrite concentration becomes higher than nitrite
concentration in the water. However, this phenomenon is
tint observed in seawater fish. In seawater-adapted Lates,

185
the relatively small magnification of nitrite concentration
in its blood stream probably contributes to its remarkable
toletanee to nitrite toxicity as reflected by the high 96
hour LC5O value in sea water. however, the problem of
whether freshwater-adapted Lates can still restrict the
uptake of nitrite remains to be solved. In addition, the
hematological and metabolic changes of Lates in response
to nitrite exposure in fresh. water deserve invcsti-
gat.fon.
(5) Methemoglobin formation resulted in a reduction in blood
oxygen carrying capacity. The effect, if any, of decreased
blood oxygen capacity on the oxygen utilization of various
organs remains to be studied.

REFERENCES

REFERENCE!
Abdel-Aziz, H. 1982. Seasonal variation in the lethality of zinc to
benzic and pelagic freshwater teleosts, Clarias lazera and Tilapia
zilli• M. Sc. Thesis, Alexandria University. Evant.
Agar, S. N. and D. J. Ilarley. 1972. Erythrocytic methemoglobir
reductases of various mammalian species. Experimentia 15: 1248-1249.
Albers, C. 190. Acid-base balance. Di Fish Physiology (Edited by
W. S. Hoar and 1). J. Randall), Vol. 4, pp. 173-208. Academic Press,New York.
Almendras, J. M. E. 1987. Acute nitrite toxicity and methemoglobine¬
mia in juvenile inilkfish (Chanos chanos Forsskal). Aquaculture 61:33-40.
Anderson, K. A., T. L. Beitinger, L. C. Fitzpatrick, and E. G.
Zimmerman. 1980. Temperature effects on oxygen consumption in genie
MDH variants of red shiner (Notropis lutrensis) populations. Comp.
Diochem. Physiol. 67A: 497-500.
Anthonisen, A. C., R. C. Loehr, T. D. S. Parksam, and D. E.
Srinath. 1976. Inhibition of nitrification by ammonia and nitrous
acid. J. Water Poliut. Control Fed. 48: 835-852.
Archer, M. C., S. D. Clark, J. E. Thilly, and S. R. Tannenbaum.
1971. Environmental nitroso compounds: reaction of nitrite with
creatine and creatinine. Science 174: 1341-1343.
Arillo, A., E. Gaino, C. Margiocco, P. Mensi, and G. Schenone.
1984. Biochemical and ultrastructural effects of nitrite in rainbow
I rout: liver hypoxia as the root of the acute toxicity mechanism.
Environ. Res. 34: 135-154.
Ashley, L. M. and J. E. Halver. 1968. Dimethylnitrosamine-induced
hepatic cell carcinoma in rainbow trout. J. Natl. Cancer Inst. 41:r 1 r r o
Atkinson, D. E. 1968. The energy charge of the adenylate pool as a
regulatory parameter: Interaction with feedback modifiers. Biochem.
Atkinson, D. E. 1977. Cellular Energy Metabolism and its Regulation,noi nn Ar-afipml n Press. New York.
Baqinski E S., P. P- Eoa, and B. Zak. 1974. Glucose-6-phosphatase.
In Methods of Enzymatic Analysis (Edited by H. U. Bergmeyer ), pp.
876-880. Academic Press, New York.

Martlet t, G. R.f A. r. Schwantes, and A. L. Val. 1987. Studies or
I lie influence of nitrite on me themoglobin formation in Amazonian
fishes. Comp. Biocliem. Physiol. 86C: 449-456.
Bath, R. N., and F. D. Eddy. 1980. Transport of nitrite across fish
yills. J. Exp. Zool. 214: 119-121.
Be is, 1. and E. A. News hoi me. 1975. The contents of adenine
nucleotides, phosphacjens and some glycolytic intermediates in restingmuscles from vertebrates and invertebrates. Biochem. J. 152: 23-32.
Berymeyer, II. U. and E. Bernt. 1974. Lactate dehydrogenase, UV-assav
with pyruvate and NADII— - - — — j j — i — — — — —
Mptiioflci nf En7vm,ifir AnnlvniQ fFlrHforl hv
H. U. Berymeyer), pp. 574-579. Academic Press, New York
Beutler, E. 1968. Hereditary disorders of erythrocyte metabolism.
Grune and St rat ton. New York. NY.
Beutler, E. 1983. Glucose-6-phosphate dehydrogenase deficiency
Metabolic Basis of Inherited Disease, 5th ed. (Edited by J
Stanbury, et al), pp. 1629-1653. McGraw-Hill, New York.
Black, E. C. 1940. The transport of oxygen by the blood of
freshwater fish. Biol. Bull. 79: 215-219.
Bliss, C. I. 1934a. The method of probits. Science 79: 38-39
BLiss, C. I. 1934b. The method of probits - A correction. Science
7Q- 4oq-4lo.
Board, G. P., S. N. Agar, M. Gruca, and R. Shine. 1977
Me themoglobin and its reduction in nucleated erythrocytes froi
reptiles and birds. Comp. Biochem. Physiol. 57B: 265-267.
Bodansky, 0. 1951. Methemoglobinemia and methemoglobin-producinc
compounds. Pharmacol. Rev. 3: 144-196.
Borgese, T. A., «J. P. Harrington, and R. L. Nagel. 1977. Oxygen-
hemoglobin relationships in the killifish, Fundulus heteroclitus.
Biol. Bull. 153: 416-417.
Bowser, P. R., W. W. Falls, J. Vanzandt, N. Collier, and J. D.
Phillips. 1983. Methemoglobinemia in channel catfish: methods of
prevention. Prog. Fish Cult. 45: 154-158.
Braunstein, A. E. 1957. Les voies principales de 1'assimilation et
dissimilation de l'azote chez les animaux. Adv. Enzymol. 19: 335-377.
Brown D. A. and D. J. McLeay. 1975. Effect of nitrite on
methemoglobin and total hemoglobin of juvenile rainbow trout. Prog.

Fish Cult. 37: 36-38
Blown, G. W., Jr. and p. p. Cohen. 1960. Comparative biochemistry of
in ea synthesis -- 3. Activities of urea-cycle enzymes in various
higher and lower vertebrates. Biochem. J. 75: 82-91.
Cameron, J. N. 1971a. Methemoglobin in erythrocytes of rainbow trout,
Cotrip. Biochem. Physiol. 40A: 743-749.
Cameron, J. N. 1971b. Oxygen dissociation characteristics of the
blood of the rainbow trout (Salmon gairdneri) . Comp. Biochem.physiol. 38A: 699-704.
Cameron, J. N. and D. E. Wohlschlag. 1969. Respiratory response t(
experimentally induced anaemia in the pinfish (Lagodon rhornboides),
J. Exp. Biol. 50: 307-317.
Chan, I). K. 0. and N. Y. S. Woo. 1978. Effect oC hypophysectomy on
the chemical composition and intermediary metabolism of the Japanese
eel, Anguilla japonica. Gen. Comp. Endocrinol. 25: 96-104.
Chapman, A. G., L. Fall, and D. E. Atkinson. 1971. Adenylate energy
charge in Escherichia coli during growth and starvation. J.
Bacteriol. 108: 1072-1086.
Collier, B. D., G. W. Cox, A. W. Johnson, and P. C. Miller. 1973.
Dynamic Ecology. Prentice-Hall, Inc., Englewood Cliffs, N.J.
Colt, J., R. Ludwig, G. Tchobanoglous, and J. J. Cech, Jr. 1981. The
effects of nitrite on the short-term growth and survival of channel
catfish. Ictalurus Dunctatus. Aguaculture 24: 111-122.
Colt, J. and G. Tchobanoglous. 1976. Evaluation of the short-term
toxicity of nitrogenous compounds to channel catfish, Ictalurus
punctatus. Aguaculture 8: 209-224.
Crawford, R. E. and G. H. Allen. 1977. Seawater inhibition of
nitrite toxicity to chinook salmon. Trans. Amer. Fish. Soc. 106: 106-
109.
Dingle, J. and J. Hines. 1967. Extraction and some properties of
AMP-aminohydrolase from prerigor and postrigor muscle of cod. J.
Fish. Res. Bd. Can. 24: 1717-1730.
Doyle, W. L. and D. Gorecki. 1961. The so-called chloride cell of
the fish gill. Physiol. Zool. 34: 81-88.
Ebberink, R. H. M., A. DeZwann, and T. C. M. Wigman. 1976.
Regulation at the phosphoenolpyruvate branch-point by the adenylate
energy charge in Mvtilus edulis. Biochem. Soc. Trans. 4: 444-447.

Eddy, F. D.f P. A. Kunzl.ik, and R. N. Bath. 1983. Uptake and los
of nitrite from the blood of rainbow trout, Salmo gairdneri
Richardson, and Atlantic salmon, Salmo sa1ar L. in fresh water and in
dilute sea water. J. Fish. Biol. 23: 105-116.
Edwards, M. J. and R. J. Martin. 1966. Mixing technique for the
oxygen-hemoglobin equilibrium and Bohr effect. J. Appl. Physiol. 21:1098-1902.
Epstein, F. II., A. J. Katz, and G. E. Pickford. 1967. Sodium and
and potassium activated adenosine triphosphatase of gills: role in
adaptation of teleost to salt water. Science 156: 1245-1247.
Epstein, F. H., P. Silva, and G. Kormanik. 1980. Role of Na-K-ATPase
in chloride cell function. Amer. J. Physiol. 238: R246-R250.
Estefan, R. M., E. M. Gause, and J. R. Rowlands. 1970. Electron spin
resonance and optical studies of the interaction between N02 andunsaturated lipid components. Envir. Res. 3: 62-78.
Farlinger, S. and F. W. II. Beamish. 1977. Effects of time and
velocity increments on the critical swimming speed of largemouth bass
(Micropterus salmoides). Trans. Amer. Fish. Soc. 106: 436 -439.
Fish, G. R. 1956. Some aspects of the respiration of six species of
fish from Uganda. J. Exp. Biol. 33; 186-195.
Foskett, J. K., H. A. Bern, T, E. Machen, and M. Conner. 1983 .
Chloride cells and the hormonal control of teleost fish
osmoregulations. J. Exp. Biol. 106: 255-281.
Fraser, D., W. Dyer, H. Weinstein, J. Dingle, and J. Hines. 1966.
Glycolytic metabolites and their distribution at death in the white
and red muscle of cod following various degree of antemortem muscular
activity. Can. J. Biochem 44: 1015-1033.
Freeman,1 L., T. L. Beitinger, and D. W. Huey. 1983. Methemoglobin
reductase activity in pliylogenetically diverse piscine species. Comp.
Biochem. Physiol. 75B: 27-30.
Fromm P. 0. 1963. Effect of ambient ammonia on blood ammonia and
nitrogen excretion of rainbow trout. Comp. Biochem. Physiol. 10: 121-
128.
Gaddum, J. H. 1933. Reports on biological standards. III. Methods
of biological assay depending on quantal response. Medical Research
Council Special Report Series 183. London: H.M.S.O.

(ta i no, E., A. Aril io, and P. Mens!. 1984. Involvement of the gill
chloride cells of trout under acute nitrite intoxication. Comp.Biochem. Physiol. 77A: 611-617.
Oanong, W. F. 1985. Review of Medical Physiology. 12nd ed. 654 pp.
Maruzen Co., Ltd., Tokyo, Japan.
Giesy, J. p. 1988. Phosphoadenylate concentrations and adenylate
energy charge of largemouth 1) a s s (Micropterus salmoides) :
Relationship with condition factor and blood Cortisol. Comp. Biochem.
Physiol. 90A: 367-377.
Gillette, L. A., D. L. Miller, and H. E. Redman. 1952. Appraisal of
a chemical waste problem by fish toxicity tests. Sewage and Indust.
Wastes 24: 1397-1401.
Girard, J. P. and P. Payan. 1980. Ion exchanges through
respiratory and chloride cells in freshwater- and seawater- adapted
teleosteans. Arner. J. Physiol. 238: R260-268.
Graham, M. S. and G. L. Fletcher. 1986. High concentrations of
methemoglobin in five species of temperate marine teleosts. J. Exp.
Zool. 239: 139-142.
Gras, J., I). Gautheron, and J. C. Henry. 1 967. Fractions
phosphorylees et nucleotides libres de divers organes de la truite
arc-en-ciel, Salmo gairdneri Rich. C. R. Acad. Sci. Ser. D 265:
1547-1549.
Harper, A. E. 1965. Glucose-6-phosphatase. In_ Methods of Enzymatic
Analysis (Edited by H. U. Bergmeyer ), pp. 788-792. Academic Press,
New York.
Harrington, J. P. 1982. Thermostability of salmon hemoglobins.
Comp. Biochem. Physiol. 73B: 919-922.
Harrington, J. P. 1983. Differential effects of monovalent cations
and alkanols on tlie thermal denaturation of sockeye and coho
hemoglobins. Comp. Biochem. Physiol. 76B: 235-240.
Hartree E. F. 1972. Determination of protein: a modification of
the Low'ry method that gives a linear photometric response. Analyt.
Biochem. 48: 422-427.
Haya, K. and B. A. Waiwood. 1983. Adenylate energy charge and ATPase
activity: Potential biochemical indicators of sublethal effects
caused bv pollutants in aquatic organisms. In Aquatic Toxicology
(Edited by J. 0. Nriagu), pp. 307-333. John Wiley, New York.

Heath, A. G. and A. W. Pritchard. 1965. Effects of severe hypoxia on
c.albohydi.ate energy stores and metabolism in two species of freshwater
fish. Physiol. Zool. 30: 325-334.
Ilidaka, r. and K. Sal to. 1960. Studies on the biochemical change ii
fish muscle. X. On the AMP-deaminase activity of some fraction
prepared from fish muscle. Bull. Jap. Soc. Fish. 26: 1001-1005.
Hilmy, A. M., N. A. El-Domiaty, and K. Wershana. 1987. Acute and
chronic toxicity of nitrite to Clarias lazera. Comp. Biochem.Physiol. 86C: 247-253.
Ho, S. M. and I). K. 0. Chan. 1980. Branchial ATPases and ionic
transport in the eel, Anguilla japonica. 1. Na+-K+-ATPase. Comp.
Biochem. Physiol. 66B: 255-260.
Hockenbury, M. R., C. P. L. Grady, Jr. 1977. Inhibition of
nitrification - effects of selected organic compounds. J. Water
Pollut. Control Fed. 49: 768-777.
Hohorst, H. J. 1962. Determination of lactate with LDII. In Methods
of Enzymatic Analysis (Edited by H. U. Bergmeyer ), pp. 662-637.
Weinheim: Verlag Chemie.
Holmsen, H. and L. Robkin. 1977. Hydrogen peroxide lowers ATP levels
in platelets without altering adenylate energy charge and platelet
functions. J. Bio. Chem. 252: 1742-1757.
Ilsieh, H. S. and E. R. Jaffe. 1975. The metabolism of methe-
moglobin in human erythrocytes. In The Red Blood Cell, 2nd ed.
(Edited by N. Mac and D. Surgenor), pp. 799-823. Academic Press,
New York.
Huey, D. W. and T. L. Beitinger. 1980a. Hematological responses of
larval Rana catesbiana to sublethal nitrite exposures. Bull. Environ.
Contam. Toxicol. 25: 54-577.
Huey, D. W. and T. L. Beitinger. 1980b. Toxicity of nitrite to
larvae of the salamander Ambystoma texanum. Bull. Environ. Contam.
Toxicol. 25: 909-912.
Huey, D. W. and T. L. Beitinger. 1982. A methemoglobin reductase
system in channel catfish Ictalurus punctatus. Can. J. Zool. 60:
1511-1513.
Huey D W., T. L. Beitinger, and M. C. Wooten. 1984. Nitrite-
induced'methemoglobin formation and recovery in channel catfish
(Ictalurus punctatus) at three acclimation temperatures. Bull.
Environ. Contam. Toxicol. 32: 674-681.

lluey, I). W., B. A. Simco, and D. W. Criswell. 1980. Nitrite-induced
methemoglobin formation in channel catfish. Trans. Amer. Fish. Soc.109: 558-562.
lluey, I). W., M. c. Wooten, h. A. Freeman, and T. L. Beitinger.
1982. Effect of pM and chloride on nitrite-induced lethality in
bluegill (Lepomis macrochirus). Bull. Environ. Contam. Toxicol. 28:3-6.
Muggins, A. K., G. Skutsch, and E. Galdwin. 1969. Ornithine-urea
cycle enzymes in teleostean fish. Comp. Biochem. Physiol. 28: 587-602.
Hunn, J. B. and J. L. Allen. 1974. Movement of drugs across the
gills of fishes. Ann. Rev. Pharmacol. 14: 47-55.
Hunninghake, I), and S. Grisolia. 1966. A sensitive and convenient
inicromethod for estimation of urea, citrulline and carbamyl
derivatives. Analyt. Biochem. 16: 200-205.
Ignarro, L. J. and C. A. Gruetter. 1980. Requirement of thiols for
activation of coronary arterial guanylate cyclase by
g]yceryltrinitrate and sodium nitrite. Possible involvement of S-
nitrosothiols. Biochim. Biophys. Acta 631: 221-231.
Inoue, K. 1978. Effects of sodium nitrite (NaNC) and sodium
nitrate (NaNO) on the mitochondrial membrane. Okayama Igakkai Zasshi90: 257-263.
Jaffe, E. R. 1964. Metabolic processes involved in the formation and
reduction of methemoglobin in human erythrocytes. In The Red Blood
Cell (Edited by C. Bishop and D. M. Surgeonen) , pp. 397-422.
Academic Press, New York, N. Y.
Janssens, P. A. and P. P. Cohen. 1967. Biosynthesis of urea in the
estivating African lungfish and in Xenopus laevis under conditions of
water-shortage. Comp. Biochem. Physiol. 24: 887-898.
Jaworek, D., W. Gruber, and H. U. Bergmeyer. 1974. Adenosine-5'-
diphosphate and Adenosine-5'-monophosphate. In Methods of Enzymatic
Analysis (Edited by H. U. Bergmeyer), pp. 2127-2131. Academic Press,
New York.

Jones, N and J. Murray. 1960. The acid soluble nucleotides of
codling (Gadus callarias) muscle. Biochem J. 77: 567-575.
Jorgensen, J. B. and T. Mustafa. 1980a. The effect of hypoxia on
carbohydrate metabolism in flounder (Platichthys f1e s u s L .) . I.
Utilization of glycogen and accumulation of glycolytic end products invarious tissues. Comn. Binehpm. Plivcini 67r» - cma
Jorgensen, J. B. and T. Mustafa. 1980b. The effect of hypoxia on
carbohydrate metabolism in flounder (Platichthys flesus L.). II. High
energy phosphate compounds and the role of glycolytic and
gluconeogenetic enzymes. Comp. Biochem. Physiol. 67B: 249 - 256.
Kamiyama, Y., K. Ozawa, and I. Honjo. 1976. Changes in mitochondrial
phosphorylative activity and adenylate energy charge of regenerating
rabbit liver. J. Biochem. 80: 875-881.
Kaplan, J. C., A. M. Nicolas, A. H. Leroux, and E. Beutler. 1970. A
simple spot screening test for fast detection of red cell NADH
diaphorase deficiency. Blood 6: 330-333.
Keefer, L. K. and P. P. Roller. 1973. N-nitrosation by nitrite ion
in neutral and basic medium. Science 181: 1245-1247.
Kikuchi, S. 1977. Mitochondria-rich (chloride) cells in the gill
epithelia from four species of stenohaline fresh water teleosts. Cell
Tiss. Res. 180: 87-98.
King, J. 1974. Glutamate dehydrogenase, colorimetric assay. In
Methods of Enzymatic Analysis (Edited by H. U. Bergmeyer), pp 656-
659. Academic Press, New York.
Klingler, K. 1957. Natriumnitrit, ein langsamwirkendes fischgift
(Sodium nitrite, a slow-acting fish poison). Schweiz. Z. Hydrol. 19:
565-578. (English translation).
Knowles, M. E., D. J. McWeeny, L. Couchman, and M. Thorogood.
1974. 'interaction of nitrite with proteins at gastric pH. Nature
247: 288-289.
Koch, II. J. A., E. Bergstrom, and J. C. Evans. 1966. A size
correlated shift in the proportion of the hemoglobin components of the
Atlantic Salmon (Salmo salar L.) and of the sea trout (Salmo trutta
Ij.) . Mededel. Vlaamse Acad. Kl. Wet. 28. 1 20.
Konikoff, M. 1975. Toxicity of nitrite to channel catfish. Prog.
Fish Cult. 37: 96-98.

Krogh, A. and Hemminysen, A. M. 1928. The assay of insulin on
rabbits and mice. Del Kgl Danske Videnskebernes Selskab Biol. VTTT.
Krous, S. R., V. s. Blazer, and T. L. Meade. 1982. Effect of
acclimation time on nitrite movement across the gill epithelia of
rainbow trout: the role of chloride cells. Prog. Fish Cult. 44: 126-130.
Lamprecht, W. and I. Trautschold. 1974. Adenosine-5'-triphosphate,
determination with hexokinase and glucose-6-phosphate dehydrogenase.
In Methods of Enzymatic Analysis (Edited by Bergmeyer, H. U.), pp.
2101-2110. Academic Tress, New York.
Larmoyeux, J. D. and R. G. Piper (1973). Effects of water reuse on
rainbow trout hatcheries. Prog. Fish. Cult. 35: 2-8.
Laurent, P. and S. Dunel. 1980. Morphology of gill epithelia in
fish. Amer. J. Physiol. 238: R147-159.
Lewis, W. M. and G. L. Buynak. 1976. Evaluation of a revolving plate
type biofilter for use in recirculated fish production and holding
units. Trans. Amer. Fish. Soc. 105: 704-708.
I.ewis, Jr., W. M. and D. P. Morris. 1986. Toxicity of nitrite to
fish: a review. Trans. Am. Fish. Soc. 115: 183-195.
Lewis, W. M., J. H. Yopp, H. L. Schramm, Jr., and A. M. Brandenburg.
1978. Use of hydroponics to maintain quality of recirculated water in
a fish culture system. Trans. Amer. Fish. Soc. 107: 92-99.
Liao, P. B. and R. U. Mayo. 1972. Salmoid hatchery water reuse
svstems. Aquaculture 1: 317-355.
Liao, P. B. and R. D. Mayo. 1974. Intensified fish culture combining
water reconditioning with pollution abatement. Aquaculture 3: 61-85.
Litchfield, J. T. , Jr. and F. Wilcoxon. 1949. A simplified method
of evaluating dose-effect experiments. J. Pharmacol. Exp. Ther. 96:O O _ 1 1 1
Lowenstein, J. M. 1972. Ammonia production in muscle and other
tissues: the purine nucleotide cycle. Physiol. Rev. 52: 382-414.
Maetz, J. and M. Bornancin. 1975. Biochemical and biophysical
aspects of salt excretion by chloride cells in teleosts. Forsch.n n 11
Mallatt, J. 1985. Fish gill structural changes induced by toxicants
and other irritants: a statistical review. Can. J. Fish. Aquat. Sci.i').

Margiocco, C., A. Arillo, p. Mensi, and G. Schenone. 1983
Nitrite bioaccumulation in Salmo gairdneri Rich., and hematologicaCOnsemiencpc! . AmiaHn Tnvnl 1 . OCI.oin
Matthews, D. M., G. G. Muir, and D. N. Baron. 1964. Estimation o]
aLpha-amino nitrogen in plasma and urine of the colorimetric ninhydriireaction. J. cl 1n Path 17» mn-mi
McConnell, R. 1985. Toxicity of nitrite to the fathead minnow.
Colorado Department of Health File Report. Denver.
McCoy, E. F. 1972. The role of bacteria in the nitrogen cycle of
lakes. U. S. Environmental Protection Agency, Office of Research and
Monitoring, Water Pollution Control Research Series 16010EHR-03172.
Washington, D. C.
Meade, T. L. and S. J. Perrone. 1980. Effect of chloride ion
concentration and pH on the transport of nitrite across the gill
epithelia of coho salmon. Prog. Fish Cult. 42: 71-72.
Mensi, P., A. Arillo, C. Margiocco, and G. Schenone. 1982.
Lysosomal damage under nitrite intoxication in rainbow trout (Salmo
gairdneri Rich.). Comp. Biochem. Physiol. 73C: 161-165.
Michael, M. I., A. M. Hi'lmy, N. A. El-Domiaty, and K. Wershana.
1987. Serum transaminases activity and histopathological changes in
Clarias 1azera chronically exposed to nitrite. Comp. Biochem.
Physiol. 86C: 255-262.
Montague, M. D. and E. A. Dawes. 1974. The survival of Peptococcus
prevotii in relation to the adenylate energy charge. J. Gen.
Microbiol. 80: 291-299.
Mosse, P. R. Ij. 1980. An investigation of gluconeogenesis in marine
teleosts, and the effect of long-term exercise on hepatic
gluconeogenesis. Comp. Biochem. Physiol. 67B: 583-592.
Muir, J. F. 1982. Recirculated water systems in aquaculture. In
Recent Advances in Aquaculture (Edited by J. F. Muir and R. J.
Roberts), pp. 357-446. Croom Helm Ltd., London.
Murray, J. and N. Jones. 1957. Post mortem changes in acid soluble
nucleotides of rested codling muscle at 0 °C. Biochem. J. 68: 9-10.
Murat, J. C. and A. Serfaty. 1974. Simple enzymatic determination of
polysaccharide (glycogen content of animal tissues). Clin. Chem. 20:1576-1577.

Nagai, M., and S. Ikeda. 1971. Carbohydrate metabolism in fish — I.
effects of starvation and dietary composition on the blood glucose
level and the hepatopancreatic glycogen and lipid contents in carp.Dull. Jap. Soc. Sci. Fish. 37: 404-409.
Nagel, L. C. A. 1977. Combined production of fish and plants ii
leecirculating water. Aquaculture 10: 17-24.
Nagel, L. 1980. Water-reuse systems in aquaculture. Animal Research
and Development 1: 12-31.
Newcomb, T. W. 1974. Changes in the blood chemistry of juvenile
steelhead trout (Salmo gairdneri) following sublethal exposure to
nitrogen supersaturation. J. Fish. Res. Doard Can. 31: 1953-1957.
Newberne, P. M. 1979. Nitrite promotes lymphoma incidence in rats.
Science 204: 1079-1081.
Palachek, R. M. and J. R. Tomasso. 1984a. Nitrite toxicity to
fathead minnows: effect of fish weight. Bull. Environ. Contam.
Toxicol. 32: 238-242.
Palachek, R. M. and J. R. Tomasso. 1984b. Toxicity of nitrite to
channel catfish (Ictalurus punctatus), tilapia (Tilapia aurea), and
largemouth bass (Micropterus salmoides) : evidence for a nitrite
exclusion mechanism. Can. J. Fish. Aquat. Sci. 41: 1739-1744.
rarrish, P. R. 1985. Acute toxicity tests. In Fundamentals of Aquatic
Toxicology (Edited by G. M. Rand and S. R. Petrocelli), pp. 31-57.
Hemisphere Publishing Corporation.
Patrick, R., J. E. Colt, R. E. Crawford, D. A. Manny, R. C.
Russo, R. V. Thurston, and G. A. Wedemeyer. 1979. Nitrates,
nitrites. In A Review of the EPA Red Book: Quality Criteria for Water
(Edited by R. V. Thurston, R. C. Russo, C. M. Fetterolf, Jr., T.
A. Edsall, Y. M. Barber, Jr.), pp. 158-162. Bethesda, Md.: Water
Quality Section, American Fisheries Society.
Pequin, L. and A. Serfaty. 1963. L'excretion ammoniacale chez un
Teleosteen dulcicole (Cyprinus carpio L.). Cornp. Biochem. Physiol.1 n . 11 R_r)l
Perrone, S. J. and T. L. Meade. 1977. Protective effect of
chloride on nitrite toxicity to coho salmon (Oncorhynchus Kisutch).i tri all Roa Hnard Can. 34: 486-492.
Phillips, J. W. and F. J. R. Hird. 1977. Gluconeogenesis in
vertebrate livers. Comp. Biochem. Physiol. 57B: 127-131.
Pisam, M. 1981. Membranous systems in the chloride cell of
t eleostean f ish and their mod if ications in response to the salinity ofI he environment. Anal- Rpp. 9.no» An-AA
Iotts, W. r. W. and W. R. Fleming. 1970. The effects of
prolactin and divalent ions on the permeability to water of Fundulus
kansae J. Exp. Biol. 53: 317-327.
Movenzano, A. J. Jr. and J. G. Winfleld. 1987. Performance of a
recirculating fish production system stocked with tilapia hybrids.
Aquacultural Engineering 6: 15-26.
Rand, G. M. and S. R. Petrocelii. 1985. Introduction. Iji
Fundamentals of Aquatic Toxicology (Edited by G. M. Rand and S. R.
Petrocelii), pp. 1-28. Hemisphere Publishing Corporation.
Rao, G. M. M. 1968. Oxygen consumption of rainbow trout (Salmo
gairdneri) in relation to activity and salinity. Can. J. Zool. 46:
781-786.
Read, L. J. 1971. The presence of fish ornithine-Urea cycle enzyme
activity in the teleost Opsanus tau. Comp. Biochem. Physiol. 39B:
409-413.
Riggs, A. 1970. Properties ot fish hemoglobins. Iri Fish Physiology
(Edited by W. S. Hoar and Randall, D. J.), pp. 209-252. Academic
Press, New York.
Renaud, J. M. and T. W. Moon. 1980. Characterization of
gluconeogenesis in hepatocytes isolated from the American eel,
Anguilla rostrata LeSueur. J. Comp. Physiol. 135: 115-125.
Rizzotti, M. R., A. Comparini, and F. Rodino. 1977. The hemoglobins
of Anguilla anguilla (L.), ontogenetic variations. Comp. Biochem.
Physiol. 58A: 173-176.
Robin, E. D., J. W. Vester, H. V. Murdaugh, Jr., and J. E. Millen.
1964. Prolonged anaerobiosis in a vertebrate: anaerobic metabolism
in the freshwater turtle. J. Cell Comp. Physiol. 63: 287-297.
Rodkey, F. L. 1976. A mechanism for the conversion of oxy¬
hemoglobin to methemogiobin by nitrite. Clin. Chem.,22. 1986 1990.
Russo, R. C. 1985. Ammonia, nitrite and nitrate.' In Fundamentals of
Aquatic Toxicology (Edited by G. M. Rand and S. R.
Tetrocelli) , pp. 455 -471. Hemispliete Publishing Corporation.
Russo, R. C., C. E. Smith, and R. V. Thurston. 1974. Acute
toxicity of nitrite to rainbow trout (Salmo gairdneri) J. Fish. Res.
Hoard Can. 31: 1653-1655.

Russo, R. c., R. v. Thurston, and K. Emerson. 1981. Acute
toxicity of nitrite to rainbow trout (Salmo gairdneri): effects of pH,
nitrite species, and anion species. Can. J. Fish. Aquat. Sci. 38:387-393.
S a i t o, 1. , K. A r a j., and T. Yajima. 1959. Changes in purine
nucleotides of red lateral muscle of fish. Bull. Jap. Soc. Sci. Fish25: 573-575.
Salvati, A. M. and L. Tentori. 1981. Determination of aberrant
hemoglobin derivatives in human blood. In Methods in Enzyrnology, Vol.
76: Hemoglobins (Edited by E. Antonini, L. Rossi-Bernardi, and E.
Chiancone), pp. 715-731. Academic Tress.
Salvatore, F., V. Zappia, and C. Costa. 1965. Comparative
biochemistry of deamination of L-amino acids in Elasmobranch and
Teleost fish. Comn. Biochem. Phvsiol. 1 6: 303-309.
Sargent, J. R. and A. J. Thomson. 1974. The nature and properties of
t lie inducible sod 1 urn-pius-pot as slum ion-dependent adenosine
triphosphatase in the gills of eels (Anquilla anquilla) adapted to
freshwater and seawater. Biochem. J. 144: 69-75.
Sargent, J. R., A. J. Thomson, and M. Bornancin. 1975. Activities
and localization of succinic dehydrogenase and NaK-activated
adenosine triphosphatase in the gills of fresh water and sea water
eels (Anquilla anquilla) Comp. Biochem. Physiol. 51B: 75-79.
Sato, S., T. Matsushima, N. Tanaka., T. Sugimura, and F.
Takashima. 1973. Hepatic tumors in the guppy (Lebistes reticulatus)
induced by aflatoxin B, dimethylnitrosamine, and 2 -
acetvlaminofluorene. J. Natl. Cancer Inst. 50: 767-778.
Scarano, G., M. G. Saroglia, R. H. Gray, and E. Tibaldi. 1984.
Hematological responses of sea bass bicentrarchus labrax to sublethal
nitrite exposures. Trans. Amer. Fish. Soc. 113: 360-364.
Scheich, H., H. W. Honegger, D. A. Warrell, and G. Kennedy. 1972.
Capillary dilatation in response to hypoxia in the brain of a gobiid
fish. Resp. Physiol. 15: 87-95.
Schneider, M. J. and T. J. Connors. 1982. Effects of elevated water
temperature on the critical swim speeds of yearling rainbow trout,
Salmo qairdneri. J. Thermal. Biol. 7: 227-229.
Schwartz, J. M., A. L. Reiss, and E. R. Jaffe. 1983. Hereditary
methemoglobinemia with deficiency of NADH cytochrome b5 reductase. In
Metabolic Basis of Inherited Disease, 5th ed. (Edited by J. B
Stanbury, et al.), PP- 1654-1655. McGraw-Hill, New York.

ochwedler, I. E. and C. S. Tucker. 1983. Empirical relationshi
between percent methemoglobin in channel catfish and dissolved nitrit
and chloride in ponds. Trans. Amer. Fish. Soc. 112: 117-119.
Scott, E. M. 1960. The relation of diaphorase of huma
erythrocytes to inheritance of methemoglobinemia. J. clin. Invest39: 1176-1179.
Scott, E. M. , I. W. Duncan, and V. Ekstrand. 1965. The reduced
pyridine nucleotide dehydrogenases of human erythrocytes. J. Biol.Chem. 240: 481-485.
Scott, E. M. and J. P. Harrington. 1985. Methemoglobin reductas
activity in fisli erythrocytes. Comp. Biochem. Physiol. 82B: 511-513.
Selye, H. 1950. Stress. Acta Inc. Montreal
Selye, H. 1976. Stress in Health and Disease. 334 pp. Butterwortl
Boston.
Shappell, S. D. and C. J. M. Lenfant. 1975. Physiological role of
t he oxyhemoglobin dissociation curve. In The Red Blood Cell, 2nd ed.
(Edited by N. Mac. and D. Surgenor), Vol. II, pp. 841-871. Academic
Press, New York.
Shechter, H.f N. Gruener, and H. I. Shuval. 1972. A micromethod fo
the determination of nitrite in blood. Analyt. Chim. Acta 60: 93-99.
Shertzer, H. G. and G. S. Duthu. 1979. Nitrite binding to rabbit
liver microsomes and effects on aminopyrine demethylation. Biochem.
Pharmacol. 28: 873-879.
Shumaker, H. H. 1957. Histochemical distribution pattern of
respiratory enzymes in the liver lobule. Science 125: 501-502.
Smit, G. L. and J. Hattingh. 1978a. The effect of hypoxia on
hemoglobins and ATP levels in three freshwater fish species. Comp.
Biochem. Physiol. 68A: 519-521.
Smit, G. L. and J. Hattingh. 1978b. The effect of respiratory stress
on carp haemoglobin. Comp. Biochem. Physiol. 59A: 369-374.
Smith, C. E. and R. C. Russo. 1975. Nitrite-induced methemoglo-hinomin in rninhow trout. Prog. Fish Cult. 37. 150 1j2.
Smith, C. E. and W. G. Williams. 1974. Experimental nitrite
toxicity in rainbow trout and chinook salmon. Trans. Amer. Fish. Soc.
103i 389-390.

Stanier, R. v., n. Doudoroff, and E. A. Adelberg. 1970. The
microbial world. Prentice-IIall, New York, N. Y., 3rd ed 873pp.
.Stanton, M. F. 1965. Die thylni t rosamine - induced hepatii
degeneration and neoplasia in the aquarium fish, Brachvdanio rerio
d. Natl. Cancer Inst. 34: 117-130.
Stryer, L. 1975. Biochemistry. Yi Hsien Publishing Co., TaipeiTn wpin
Tii i Hart, G. van den, F. Kesbeke, and A. V. Waarde. 1976. Influenc
of anoxia on the energy metabolism of goldfish Carassius auratus (L.)
Comp. Biochem. Pliysiol. 55A: 329-336.
Thillart, G. van den, F. Kesbeke, and A. V. Waarde. 1980. Anaerobic
energy-metabolism of goldfish, Carassius auratus (L.). J. Comp.
Physiol. 136: 45-52.
Thurston, R. V. and R. C. Russo. 1978. Acute toxicity of ammonia and
nitrite to cutthroat trout fry. Trans. Amer. Fish. Soc. 107: 361-368.
Tomasso, J. R. and G. J. Carmichael. 1986. Acute toxicity of
ammonia, nitrite and nitrate to the guadalupe bass, Micropterus
treculi. Bull. Environ. Contam. Toxicol. 36: 866-870.
Tomasso, J. R., B. A. Simco, and K. B. Davis. 1979. Chloride
inhibition of nitrite-induced methemoglobinemia in channel catfisf
(Ictalurus punctatus). J. Fish. Res. Board Can. 36: 1141-1144.
Tomasso, J. R., M. I. Wright, B. A. Simco, and K. B. Davis. 1980.
Inhibition of nitrite-induced toxicity in channel catfish by calcium
chloride and sodium chloride. Prog. Fish Cult. 42: 144-146.
Tornheim, K. and J. M. Lowenstein. 1972. The purine nucleotide
cycle. The production of ammonia from aspartate by extracts of rat
skeletal muscle. J. Biol. Cliem. 247: 162-169.
Tucker, C. S. and T. E. Schwedler. 1983. Acclimation of channel
catfish (Ictalurus punctatus) to nitrite. Bull. Environ. Contam.
Toxicol. 30: 516-521.
Tucker, C. S., J. R. MacMillan, and T. E. Schwedler. 1984.
Influence of Edwards i ella ictaluri Septicemia on nitrite-induced
methemoglobinemia in channel catfish (Ictalurus punctatus). Bull.
Environ. Contam. Toxicol. 32: 669-673.
Utida, S., M. Kamiya, and N. Shirai. 1971. Relationship between the
activity of Na+-K+-activated adenosinetriphosphatase and the number of
chloride cells in eel gills with special reference to sea-water

adaptation. Comp. Biocliem. Physiol. 38A: 443-447.
Vmminger, B. C. and 1). Benziyer. 1975. In vitro stimulation of
hepatic glycogen phosphorylase activity by epinephrine and glucagon in
I lie brown bullhead, Ictalurus nebulosus. Gen. ComD. Endocrinol. 25:96-104.
Waarde, A. V. 1981. Nitrogen metabolism in goldfish, Carassius
auratus (It.) : Activities of transamination reactions, purine
nucleotide cycle and glutamate dehydrogenase in goldfish tissues.
Comp. Biochem. Physiol. 68B: 407-413.
Walker, R. M. and P. H. Johanson. 1977. Anaerobic metabolism in
yoldfish, Carassius auratus. Can. J. Zool. 55: 1304-1311.
Wallen, I. E., W. C. Green, and R. Lasater. 1957. Toxicity tc
Gambusia affinis of certain pure chemicals in turbid waters. Sewage
and Indust. Wastes 29: 695-711.
Walter, C. L. and Taylor, A. McM. 1965. The reduction of nitrite
by skeletal-muscle mitochondria. Biochim. Biophys. Acta 96: 522-524.
Walton, M. J. and C. B. Cowey. 1977. Aspects of ammoniogenesis in
rainbow trout, Salmo gairdneri. Comp. Biochem. Physiol. 57B: 143-149.
Watenpaugh, D. E. and T. L. Bellinger. 1985a. Nitrite exposure and
respiration rates in fathead minnows. Bull. Environ. Contam. Toxicol.
35: 106-111.
Watenpaugh, D. E. and T. L. Beitinger. 1985b. Swimming Perform-mance
of channel catfish (ictalurus punctatus) after nitrite exposure.
Bull. Environ. Contam. Toxicol. 34: 754-760.
Watenpaugh, D. E., T. L. Beitinger, and D. W. Huey. 1985.
Temperature tolerance of nitrite-exposed channel catfish. Trans.
Amer. Fish. Soc. 114: 274-278.I
Wedemeyer, G. A. and W. T. Yasutake. 1978. Prevention and
treatment of nitrite toxicity in juvenile steelhead trout (Salmo
gairdneri) . Fish. Res. Board Can. 35: 822-827.
Westin, D. T. 1974. Nitrate and nitrite toxicity to salmonoid
fishes. Proa. Fish Cult. 36: 86-89.
Williams, E. M. and F. 13. Eddy. 1987. Some effects of adrenaline on
anion transport and nitrite-induced methemoglobin formation m the
rainbow trout (Salmo gairdneri Richardson). J. Exp. Zool. 241: 269
273.

Wilson, R. r. 1973. Nitrogen metabolism in channel catfish,
-- II. Evidence for an apparent incomplete
onuthine-urea cycle. Comp. Biochem. Physiol. 46B: 625-634.
Winslow, R. m. and W. G. Anderson. 1983. The hemoglobinopathies. In
Metabolic Basis of Inherited Disease, 5th ed. (Edited by J. B.
Stanbury, ejal.), pp. 1666-1710. McGraw-Hill, New York.
Wolff, I. A. and A. E. Wasserman. 1972. Nitrates, nitrites, andnitrosamines. Science 177: 15-19.
Woo, N. Y. S., P. K. Wong, K. L. Tsang, and H. S. Chiu. 1988.
Evaluation of the effectiveness of a biodisc system for the
purification of seawater in a re-circulating fish tank: changes in
water quality and bacterial flora during operation. Iii Advances in
Applied Biology and Biotechnology (Edited by S. T. Chang, K. Y. Chan,
and N. Y. S. Woo), pp. 377-388. Chinese University Press.
Woo, N. Y. S. and R. S. S. Wu. 1984. Changes in biochemical
composition in the red grouper, E pin e p h a 1u s a k a a r a (Temminck and
Schlegel) and the black sea bream, Mylio macrocephalus (Basilewsky)
during hypoxic exposure. Comp. Biochem. Physiol. 77A: 475-482.
Woo, N. Y. S. and W. C. M. Tong. 1982. Salinity adaptation in the
snakehead, OphiocephaluS maculatus Lacepede: changes in oxygen
consumption, branchial Na4-K-ATPase and body composition. J. Fish
Biol. 20: 11-19.
Wood, J. D. 1958. Nitrocjen excretion in some marine teleosts. Can.
J. Biochem. Physiol. 36: 1237-1242.
Wood, S. C. 1980. Adaptation of red blood cell function to hypoxia
and temperature in ectothermic vertebrates. Amer. Zool. 20: 163-172.
Wood, S. C., K. Johansen, and R. E. Weber. 1975. Effects of ambient
Po2 on hemoglobin oxygen affinity and red cell ATP concentrations in abenthic fish, Pleuronectes platessa. Resp. Physiol. 25: 259-267.
Woodman, D. D. and C. P. Price. 1972. Estimation of serum total
lipids. Clin. Chim. Acta 38: 39-43.
Wurmli, R., S. Wolffram, and E. Scharrer. 1987. Influence of
nitrate and nitrite on electrolyte transport by the rat small and
large intestine. Comp. Biochem. Physiol. 88A: 127-129.
Wllf r. s. s. 1988. Environmental tolerance of some marine fish:
applications in mariculture management. Unpublished paper presented
at Symposium on Fish Toxicology, Fish Physiology and Fisheries
Management on September 14, 1988 in Zhongshan University, Guangzhou.

Yu, K. L. and N. Y. S. Woo. 1987. Changes in blood respiratory
properties and cardiovascular tunction during acute exposure to
hypoxic water in an air-breathing teleost, Channa maculata. J. Fish.
Biol. 30: 749-760.