Fractional-order Modeling of the Arterial Compliance - arXiv
Blood flow dynamics and arterial wall interaction in a saccularaneurysm model of the basilar artery
Alvaro Valencia *, Francisco Solis
Department of Mechanical Engineering, Universidad de Chile, Castilla Santiago, Chile
Abstract
Blood flow dynamics under physiologically realistic pulsatile conditions plays an important role in the growth, rupture and surgicaltreatment of intracranial aneurysms. This paper describes the flow dynamics and arterial wall interaction in a representative model of aterminal aneurysm of the basilar artery, and compares its wall shear stress, pressure, effective stress and wall deformation with those of ahealthy basilar artery. The arterial wall was assumed to be elastic or hyperelastic, isotropic, incompressible and homogeneous. The flowwas assumed to be laminar, Newtonian, and incompressible. The fully coupled fluid and structure models were solved with the finiteelements package ADINA. The intra-aneurysmal pulsatile flow shows single recirculation region during both systole and diastole.The pressure and shear stress on the aneurysm wall exhibit large temporal and spatial variations. The wall thickness, the Young’s mod-ulus in the elastic wall model and the hyperelastic Mooney–Rivlin wall model affect the aneurysm deformation and effective stress in thewall especially at systole.
Keywords: CFD; FSI; Intracranial aneurysm; WSS
1. Introduction
Intracranial aneurysms are lesions of the arterial wallcommonly located at branching points of the major arteriescoursing through the subarachnoid space, predominantlyat the circle of Willis in the base of the brain. Aneurysmsof the posterior circulation of the circle of Willis are mostfrequently located at the bifurcation of the basilar artery orat the junction of a vertebral artery and the posterior infe-rior cerebellar artery. The most common form of intracra-nial aneurysms is the saccular type [1].
The rupture of an intracranial aneurysm produces a sub-arachnoid hemorrhage (SAH) associated with high mortal-ity and morbidity rates, as SAH accounts for 1/4 ofcerebrovascular deaths. The rupture rate of asymptomaticsmall aneurysms is only 0.05% per annum in patients with
* Corresponding author. Tel.: +056 2 978 4386; fax: +056 2 698 8453.E-mail address: [email protected] (A. Valencia).
no prior SAH, but increases to 0.5% for large (>10 mmdiameter) aneurysms [2]. Aneurysms may be treated by sur-gical clipping or by interventional neuroradiology. Surgicalclipping of asymptomatic aneurysms has morbidity andmortality rates of 10.9 and 3.8%, respectively, [2]. Treat-ment of aneurysms by Guglielmi coils carries 4% morbidityand 1% mortality, but only achieves complete aneurysmocclusion in 52–78% of the cases. These treatments pro-mote blood coagulation inside the aneurysm avoidingimpinging blood flow on the vessel wall and, thus, imped-ing its rupture [2].
The pathogenesis and causes for expansion and eventualrupture of saccular aneurysms are not clear. It is generallyaccepted that unique structural features of the cerebral vas-culature contribute to the genesis of these aneurysms. Atypical saccular aneurysm has a very thin tunica mediaand the internal elastic lamina is absent in most cases [1].Thus, the arterial wall is composed of only intima andadventitia. Consequently, hemodynamics factors, such asblood velocity, wall shear stress, pressure, particle
Nomenclature
a basilar artery radiusci, D1, D2 Mooney–Rivlin material constantsd basilar artery diameterE Young’s modulusFSI fluid structure interactionf frequencyh arterial thicknessM–R Mooney–Rivlin modelRe Reynolds number = qUmd/lp pressureu velocityUm mean velocity at inletUi translationWSS wall shear stress
Greek symbols
a Womersley number = a(2pf/m)1/2
b angle; tilt of the aneurysm dome with respect tothe parent vessel
d arterial displacemente straink stretch ratiol fluid molecular viscositym fluid kinematic viscosity = l/qq densityr stresss shear stress
A. Valencia, F. Solis
residence time and flow impingement, play important rolesin the pathogenesis of aneurysms and thrombosis. Aneu-rysm hemodynamics is contingent on the aneurysm geom-etry and its relation to the parent vessel, its volume andaspect ratio (depth/neck width) [3]. For this reason, studiesof hemodynamics inside models of saccular aneurysms witharterial wall interaction are important to obtain quantita-tive criteria for their treatments.
Liou and Liou [4] presented a review of in vitro studiesof hemodynamics characteristics in terminal and lateralaneurysm models. They reported that with uneven branchflow, the flow dynamics inside a terminal aneurysm andthe shear stresses acting on the intra-aneurysmal wallincrease proportionally with the bifurcation angle. Imbesiand Kerber [5] have used in vitro models to study theflow dynamics in a wide-necked basilar artery aneurysm.They investigated the flow after placement of a stentacross the aneurysm neck and after placement of Gugli-elmi detachable coils inside the aneurysm sac throughthe stent.
Lieber et al. [6] used particle image velocimetry to studythe influence of stent design on the flow in a lateral saccu-lar aneurysm model, showing that stents can induce favor-able changes in the intra-aneurysmal hemodynamics.Tateshima et al. [7] studied the intra-aneurysmal flowdynamics in an acrylic model obtained using three-dimen-sional computerized tomography angiography. Theyshowed that the velocity structures were dynamicallyaltered throughout the cardiac cycle, particularly at theaneurysm neck.
Although aneurysm rupture is thought to be associatedwith a significant change in aneurysm size, there is stillgreat controversy regarding the size at which ruptureoccurs. The relationship between geometric features andrupture is closely associated with low flow conditions.The stagnation of blood flow in large aneurysms is com-monly observed with the use of cerebral angiography andis related to intra-aneurysmal thrombosis [8]. Aneurysm
geometry often dictates the success of coil embolization.Jou et al. [9] presented a compartment model for the esti-mate of intra-aneurysmal flow and hemodynamic forcesthat can be used to predict the outcome of coil emboliza-tion or possible aneurysm recurrence.
Foutrakis et al. [10] report on two-dimensional simula-tions of fluid flow in curved arteries and arterial bifurca-tions and the relationship to aneurysm formation andexpansion. They suggest that the shear stress and pressuredeveloped along the outer wall of a curved artery and at theapex of an arterial bifurcation create a hemodynamics statethat can promote aneurysm formation. Recently, Steinmanet al. [11] presented image-based computational simula-tions of the flow dynamics in a giant anatomically realistichuman intracranial aneurysm. Their analysis revealed highspeed flow entering the aneurysm at the proximal and distalends of the neck, promoting the formation of persistentand transient vortices within the aneurysm sac. Cebralet al. [12] developed a methodology for modeling patient-specific blood flows in cerebral aneurysms that combinesmedical image analysis and computational fluid dynamics(CFD). The flow analysis in six intracranial aneurysmsrevealed complex unsteady flows patterns.
Arterial compliance contributes to the mechanical load-ing and progressive expansion of a blood vessel [13]. Batheand Kamm [14] performed fluid–structure interaction (FSI)finite element analysis of pulsatile flow through compliantaxisymmetric stenotic arteries and found that severe steno-sis causes artery compression, negative flow pressure andhigh flow shear stress. This important effect has been con-sidered in few reported studies of hemodynamics in arterieswith aneurysms. Finol et al. [15] compare wall stress distri-butions in an abdominal aortic aneurysm obtained withtime dependent fluid–structure interaction and with staticwalls. Low et al. [16] examined in models of lateral aneu-rysms the effects of distensible arterial walls, they foundout that the increase and decrease of the flow velocityreflect the expansion and contraction of the aneurysm wall
A. Valencia, F. Solis
where the maximal wall displacement during systolic accel-eration is about 6% of the aneurysm diameter. Humphreyand Canham [17] modeled a saccular aneurysm as sphericalhyperelastic membrane surrounded by a viscous cerebro-spinal fluid; they showed that the aneurysm model doesnot exhibit dynamic instabilities in response to periodicloads.
The compliant aneurysm wall, which must withstandarterial blood pressure, is composed of layered collagen.Wall strength is related to both collagen fiber strengthand orientation. The main characteristic of the aneurysmwall is its multidirectional collagen fibers; with physiologi-cal pressures, they become straight and thereby govern theoverall stiffness of the lesion [18]. Fluid shear stress modu-lates endothelial cell remodeling via realignment and elon-gation, and the time variation of wall shear stress affectssignificantly the rates at which endothelial cells remodel[19]. The influence of non-Newtonian properties of bloodin an idealized arterial bifurcation model with a saccularaneurysm has been investigated in [20], in the regions withrelatively low velocities there is no essential difference in theresults with both fluid models.
Ma et al. [21] have recently performed a three-dimen-sional geometrical characterization of cerebral aneurysmsfrom computed tomography angiography data, recon-structing the geometry of non-ruptured human cerebralaneurysms. This geometry can be classified as hemisphere,ellipsoid, or sphere. Parlea et al. [22] presented a relativelysimple approach to characterizing the simple-lobed aneu-rysm shape and size using angiographic tracings. Theirmeasurements characterize the range of shapes and sizesassumed by these lesions, providing useful guidelines forthe development of models for numerical investigation ofhemodynamics in cerebral aneurysms.
In this work, we present detailed numerical simulationsof three-dimensional unsteady flow with arterial wall inter-action in a representative saccular aneurysm model andone healthy model of the basilar artery. The computationalgeometry of the saccular aneurysm was developed with rep-resentative dimensions as reported in [22]. The purpose ofthis paper is to report the effects of arterial wall thickness,the Young’s modulus in the elastic wall model and thehyperelastic Mooney–Rivlin aneurysm wall model on pres-sure, wall shear stress, effective stress in the wall and aneu-rysm deformation and to establish comparisons of thesevariables with a healthy basilar artery. The uniaxialstress–stretch response of human cerebral arteries can bereasonably modeled on an individual test basis using anexponential form, [23]. The effects of model the wall arteryas hyperelastic material, such as Mooney–Rivlin model, areinvestigated in detail.
The fully-coupled fluid–structure interaction reported inthis work for a saccular aneurysm of the basilar artery hasnot been reported previously in the literature and it canprovide valuable insight in the study of statistically repre-sentative aneurysms subject to physiologically realistic pul-satile loads.
2. Mathematical and numerical modeling
2.1. Fluid and solid models
For the fluid model, the flow was assumed to be laminar,Newtonian, and incompressible. The incompressibleNavier–Stokes equations with arbitrary Lagrangian–Eule-rian (ALE) formulation were used as the governing equa-tions which are suitable for problems with fluid structureinteraction (FSI) and frequent mesh adjustments. Flowvelocity at the flow–vessel interface was set to move withvessel wall.
Continuity:
r � u ¼ 0 ð1ÞEquation of Navier–Stokes:
qfðou=otþ ððu� ugÞ � rÞuÞ ¼ �rpþ lr2u ð2Þ
where qf is the fluid density, p is the pressure, u is the fluidvelocity vector, and ug is the moving coordinate velocity,respectively. In the ALE formulation, (u � ug) is the rela-tive velocity of the fluid with respect to the moving coordi-nate velocity. Blood is modeled to have a densityqf = 1050 kg/m3 and a dynamic viscosity l = 0.00319 kg/ms. The governing equation for the solid domain is themomentum conservation equation given by Eq. (3). In con-trast to the ALE formulation of the fluid equations, aLagrangian coordinate system is adopted:
r � rs ¼ qs _ug ð3Þ
where qs is the solid density, rs is the solid stress tensor,and _ug is the local acceleration of the solid. The artery wallwas assumed to be elastic or hyperelastic, isotropic, incom-pressible, and homogeneous with a density qs = 1050 kg/m3 and a Poisson’s ratio t = 0.45, [15,17].
The applied boundary conditions on the fluid domainare: (i) a time dependent uniform velocity at inlet and (ii)a zero normal traction at outlets. These are presented inmathematical form in Eqs. (4) and (5):
ujinlet ¼ UðtÞ ð4Þrnnjoutlet ¼ 0 ð5Þ
The boundary conditions on the FSI interfaces state that:(i) displacements of the fluid and solid domain must becompatible, (ii) tractions at these boundaries must be atequilibrium and (iii) fluid obeys the no-slip condition.These conditions are given in Eqs. (6)–(8):
ds ¼ df ð6Þrs � ns ¼ rf � nf ð7Þu ¼ ug ð8Þ
where d, r and n are displacements, stress tensors andboundary normals with the subscripts f and s indicating aproperty of the fluid and solid, respectively. An externalboundary condition of pressure is also applied:
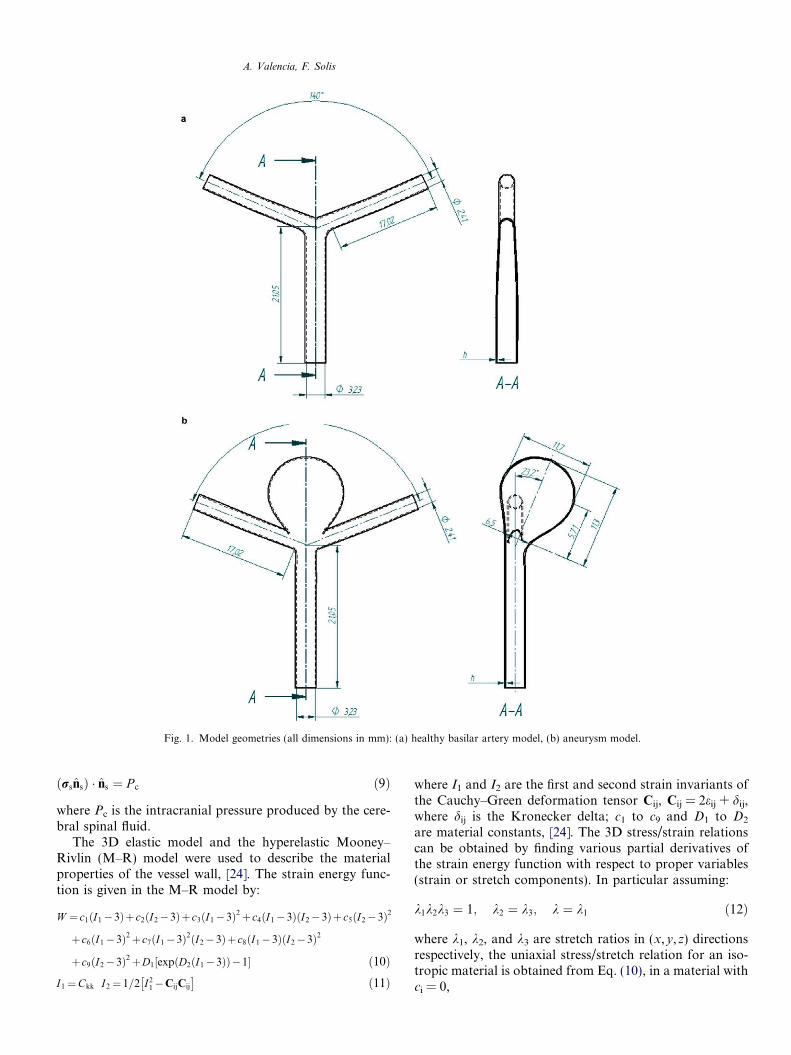
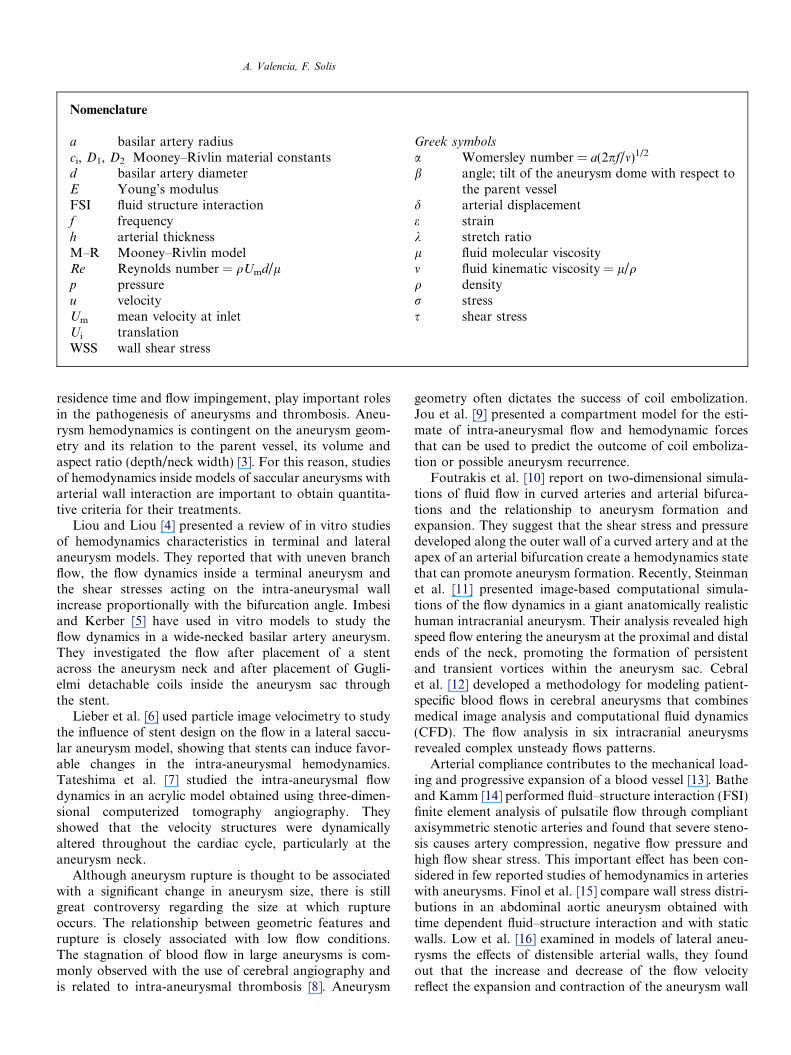
Fig. 1. Model geometries (all dimensions in mm): (a) healthy basilar artery model, (b) aneurysm model.
A. Valencia, F. Solis
ðrsnsÞ � ns ¼ P c ð9Þ
where Pc is the intracranial pressure produced by the cere-bral spinal fluid.
The 3D elastic model and the hyperelastic Mooney–Rivlin (M–R) model were used to describe the materialproperties of the vessel wall, [24]. The strain energy func-tion is given in the M–R model by:
W ¼ c1ðI1�3Þþc2ðI2�3Þþc3ðI1�3Þ2þc4ðI1�3ÞðI2�3Þþc5ðI2�3Þ2
þc6ðI1�3Þ2þc7ðI1�3Þ2ðI2�3Þþ c8ðI1�3ÞðI2�3Þ2
þc9ðI2�3Þ2þD1½expðD2ðI1�3ÞÞ�1� ð10ÞI1¼Ckk I2¼ 1=2 I2
1�CijCij
� �ð11Þ
where I1 and I2 are the first and second strain invariants ofthe Cauchy–Green deformation tensor Cij, Cij = 2eij + dij,where dij is the Kronecker delta; c1 to c9 and D1 to D2
are material constants, [24]. The 3D stress/strain relationscan be obtained by finding various partial derivatives ofthe strain energy function with respect to proper variables(strain or stretch components). In particular assuming:
k1k2k3 ¼ 1; k2 ¼ k3; k ¼ k1 ð12Þ
where k1, k2, and k3 are stretch ratios in (x,y,z) directionsrespectively, the uniaxial stress/stretch relation for an iso-tropic material is obtained from Eq. (10), in a material withci = 0,
1.6 A
A. Valencia, F. Solis
r ¼ oW =ok ¼ D1D2½2k� 2k�2� exp½D2ðk2 þ 2=k� 3Þ� ð13Þ
0.4
0.6
0.8
1.0
1.2
1.4
U(t)
[m/s
]
In this work, the following values were chosen to match theMooney–Rivlin uniaxial stress/stretch relation with exper-imental data obtained in [23] for a normal artery, ci = 0,D1 = 555560. Pa and D2 = 1.5. With these values the M–R model fits average uniaxial behavior of normal arteriesstretched in the experiments. The equivalent Young’s mod-ulus with these values is E = 5 MPa for small stretch, calcu-lated with the formula E = 6(D1D2), [24].
0.0 0.1 0.2 0.3 0.4 0.5 0.6 0.7 0.8 0.9 1.0t [s]
0.0
0.2
B
C
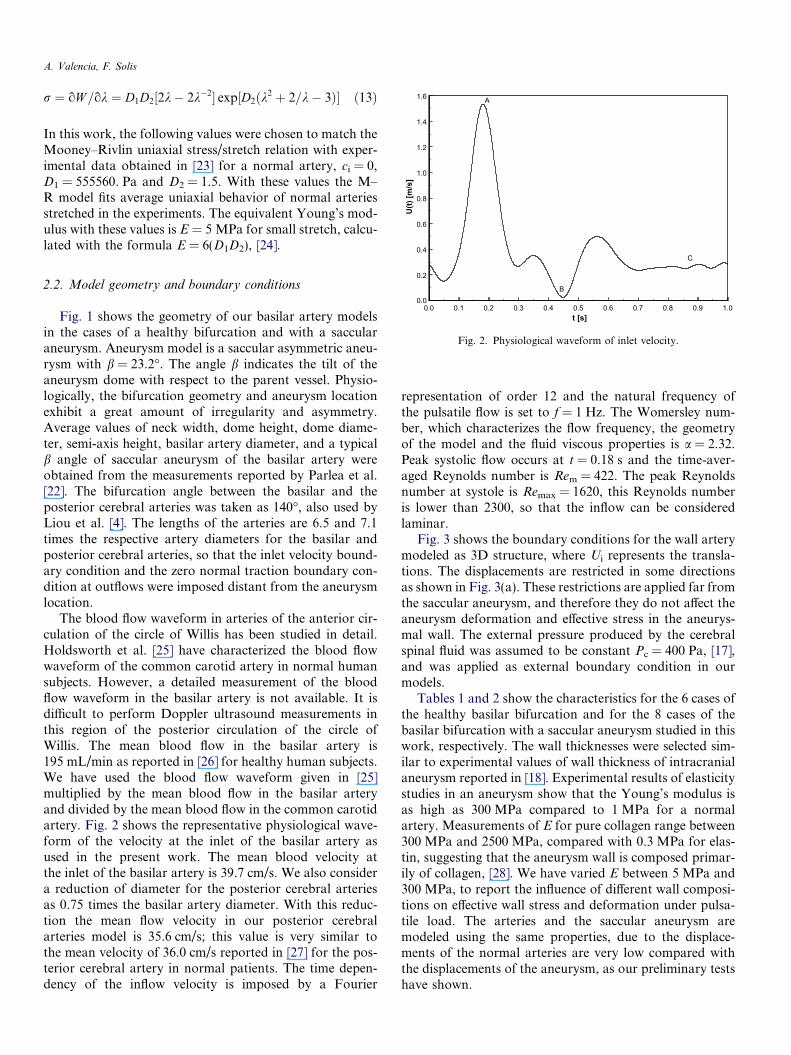
Fig. 2. Physiological waveform of inlet velocity.
2.2. Model geometry and boundary conditions
Fig. 1 shows the geometry of our basilar artery modelsin the cases of a healthy bifurcation and with a saccularaneurysm. Aneurysm model is a saccular asymmetric aneu-rysm with b = 23.2�. The angle b indicates the tilt of theaneurysm dome with respect to the parent vessel. Physio-logically, the bifurcation geometry and aneurysm locationexhibit a great amount of irregularity and asymmetry.Average values of neck width, dome height, dome diame-ter, semi-axis height, basilar artery diameter, and a typicalb angle of saccular aneurysm of the basilar artery wereobtained from the measurements reported by Parlea et al.[22]. The bifurcation angle between the basilar and theposterior cerebral arteries was taken as 140�, also used byLiou et al. [4]. The lengths of the arteries are 6.5 and 7.1times the respective artery diameters for the basilar andposterior cerebral arteries, so that the inlet velocity bound-ary condition and the zero normal traction boundary con-dition at outflows were imposed distant from the aneurysmlocation.
The blood flow waveform in arteries of the anterior cir-culation of the circle of Willis has been studied in detail.Holdsworth et al. [25] have characterized the blood flowwaveform of the common carotid artery in normal humansubjects. However, a detailed measurement of the bloodflow waveform in the basilar artery is not available. It isdifficult to perform Doppler ultrasound measurements inthis region of the posterior circulation of the circle ofWillis. The mean blood flow in the basilar artery is195 mL/min as reported in [26] for healthy human subjects.We have used the blood flow waveform given in [25]multiplied by the mean blood flow in the basilar arteryand divided by the mean blood flow in the common carotidartery. Fig. 2 shows the representative physiological wave-form of the velocity at the inlet of the basilar artery asused in the present work. The mean blood velocity atthe inlet of the basilar artery is 39.7 cm/s. We also considera reduction of diameter for the posterior cerebral arteriesas 0.75 times the basilar artery diameter. With this reduc-tion the mean flow velocity in our posterior cerebralarteries model is 35.6 cm/s; this value is very similar tothe mean velocity of 36.0 cm/s reported in [27] for the pos-terior cerebral artery in normal patients. The time depen-dency of the inflow velocity is imposed by a Fourier
representation of order 12 and the natural frequency ofthe pulsatile flow is set to f = 1 Hz. The Womersley num-ber, which characterizes the flow frequency, the geometryof the model and the fluid viscous properties is a = 2.32.Peak systolic flow occurs at t = 0.18 s and the time-aver-aged Reynolds number is Rem = 422. The peak Reynoldsnumber at systole is Remax = 1620, this Reynolds numberis lower than 2300, so that the inflow can be consideredlaminar.
Fig. 3 shows the boundary conditions for the wall arterymodeled as 3D structure, where Ui represents the transla-tions. The displacements are restricted in some directionsas shown in Fig. 3(a). These restrictions are applied far fromthe saccular aneurysm, and therefore they do not affect theaneurysm deformation and effective stress in the aneurys-mal wall. The external pressure produced by the cerebralspinal fluid was assumed to be constant Pc = 400 Pa, [17],and was applied as external boundary condition in ourmodels.
Tables 1 and 2 show the characteristics for the 6 cases ofthe healthy basilar bifurcation and for the 8 cases of thebasilar bifurcation with a saccular aneurysm studied in thiswork, respectively. The wall thicknesses were selected sim-ilar to experimental values of wall thickness of intracranialaneurysm reported in [18]. Experimental results of elasticitystudies in an aneurysm show that the Young’s modulus isas high as 300 MPa compared to 1 MPa for a normalartery. Measurements of E for pure collagen range between300 MPa and 2500 MPa, compared with 0.3 MPa for elas-tin, suggesting that the aneurysm wall is composed primar-ily of collagen, [28]. We have varied E between 5 MPa and300 MPa, to report the influence of different wall composi-tions on effective wall stress and deformation under pulsa-tile load. The arteries and the saccular aneurysm aremodeled using the same properties, due to the displace-ments of the normal arteries are very low compared withthe displacements of the aneurysm, as our preliminary testshave shown.
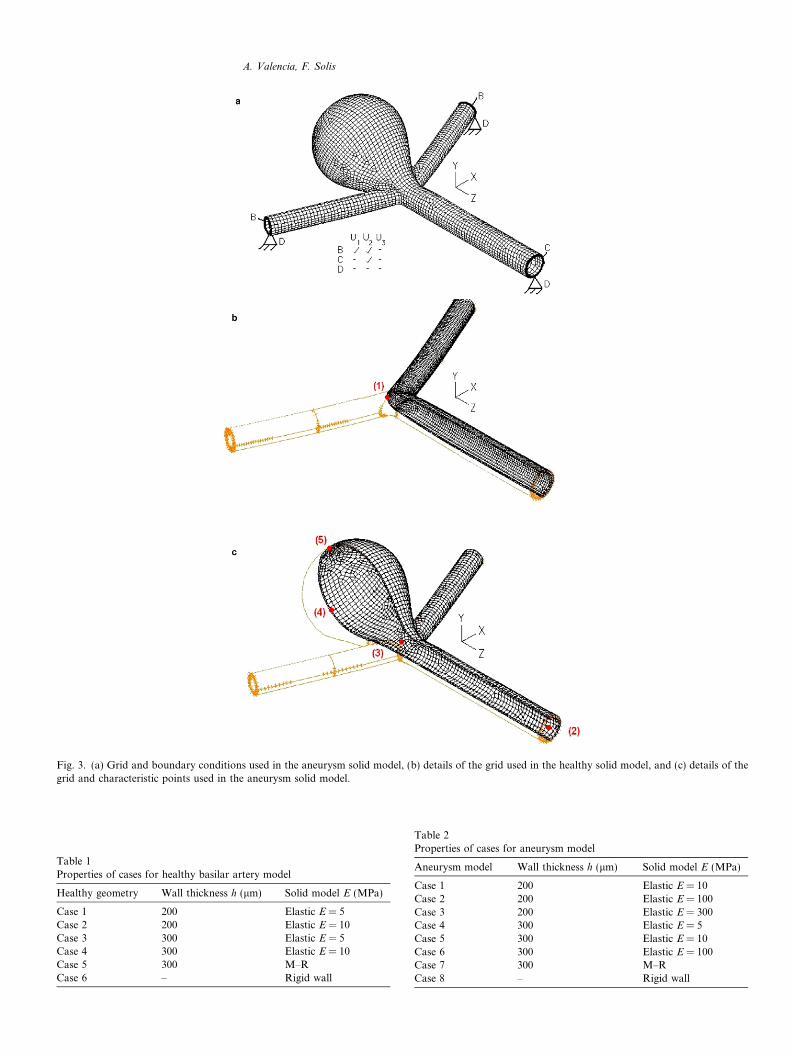
Fig. 3. (a) Grid and boundary conditions used in the aneurysm solid model, (b) details of the grid used in the healthy solid model, and (c) details of thegrid and characteristic points used in the aneurysm solid model.
Table 1Properties of cases for healthy basilar artery model
Healthy geometry Wall thickness h (lm) Solid model E (MPa)
Case 1 200 Elastic E = 5Case 2 200 Elastic E = 10Case 3 300 Elastic E = 5Case 4 300 Elastic E = 10Case 5 300 M–RCase 6 – Rigid wall
Table 2Properties of cases for aneurysm model
Aneurysm model Wall thickness h (lm) Solid model E (MPa)
Case 1 200 Elastic E = 10Case 2 200 Elastic E = 100Case 3 200 Elastic E = 300Case 4 300 Elastic E = 5Case 5 300 Elastic E = 10Case 6 300 Elastic E = 100Case 7 300 M–RCase 8 – Rigid wall
A. Valencia, F. Solis
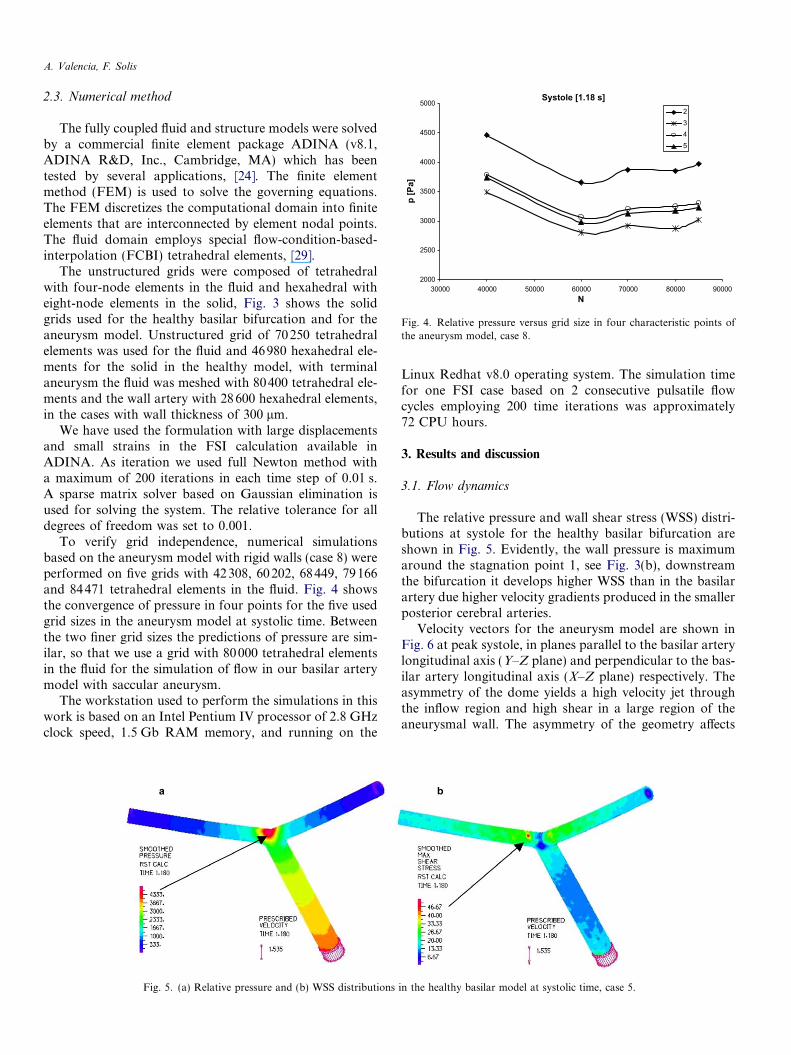
Systole [1.18 s]
2000
2500
3000
3500
4000
4500
5000
30000 40000 50000 60000 70000 80000 90000N
p [P
a]
2345
Fig. 4. Relative pressure versus grid size in four characteristic points ofthe aneurysm model, case 8.
A. Valencia, F. Solis
2.3. Numerical method
The fully coupled fluid and structure models were solvedby a commercial finite element package ADINA (v8.1,ADINA R&D, Inc., Cambridge, MA) which has beentested by several applications, [24]. The finite elementmethod (FEM) is used to solve the governing equations.The FEM discretizes the computational domain into finiteelements that are interconnected by element nodal points.The fluid domain employs special flow-condition-based-interpolation (FCBI) tetrahedral elements, [29].
The unstructured grids were composed of tetrahedralwith four-node elements in the fluid and hexahedral witheight-node elements in the solid, Fig. 3 shows the solidgrids used for the healthy basilar bifurcation and for theaneurysm model. Unstructured grid of 70250 tetrahedralelements was used for the fluid and 46980 hexahedral ele-ments for the solid in the healthy model, with terminalaneurysm the fluid was meshed with 80400 tetrahedral ele-ments and the wall artery with 28600 hexahedral elements,in the cases with wall thickness of 300 lm.
We have used the formulation with large displacementsand small strains in the FSI calculation available inADINA. As iteration we used full Newton method witha maximum of 200 iterations in each time step of 0.01 s.A sparse matrix solver based on Gaussian elimination isused for solving the system. The relative tolerance for alldegrees of freedom was set to 0.001.
To verify grid independence, numerical simulationsbased on the aneurysm model with rigid walls (case 8) wereperformed on five grids with 42308, 60202, 68449, 79166and 84471 tetrahedral elements in the fluid. Fig. 4 showsthe convergence of pressure in four points for the five usedgrid sizes in the aneurysm model at systolic time. Betweenthe two finer grid sizes the predictions of pressure are sim-ilar, so that we use a grid with 80000 tetrahedral elementsin the fluid for the simulation of flow in our basilar arterymodel with saccular aneurysm.
The workstation used to perform the simulations in thiswork is based on an Intel Pentium IV processor of 2.8 GHzclock speed, 1.5 Gb RAM memory, and running on the
Fig. 5. (a) Relative pressure and (b) WSS distributions
Linux Redhat v8.0 operating system. The simulation timefor one FSI case based on 2 consecutive pulsatile flowcycles employing 200 time iterations was approximately72 CPU hours.
3. Results and discussion
3.1. Flow dynamics
The relative pressure and wall shear stress (WSS) distri-butions at systole for the healthy basilar bifurcation areshown in Fig. 5. Evidently, the wall pressure is maximumaround the stagnation point 1, see Fig. 3(b), downstreamthe bifurcation it develops higher WSS than in the basilarartery due higher velocity gradients produced in the smallerposterior cerebral arteries.
Velocity vectors for the aneurysm model are shown inFig. 6 at peak systole, in planes parallel to the basilar arterylongitudinal axis (Y–Z plane) and perpendicular to the bas-ilar artery longitudinal axis (X–Z plane) respectively. Theasymmetry of the dome yields a high velocity jet throughthe inflow region and high shear in a large region of theaneurysmal wall. The asymmetry of the geometry affects
in the healthy basilar model at systolic time, case 5.
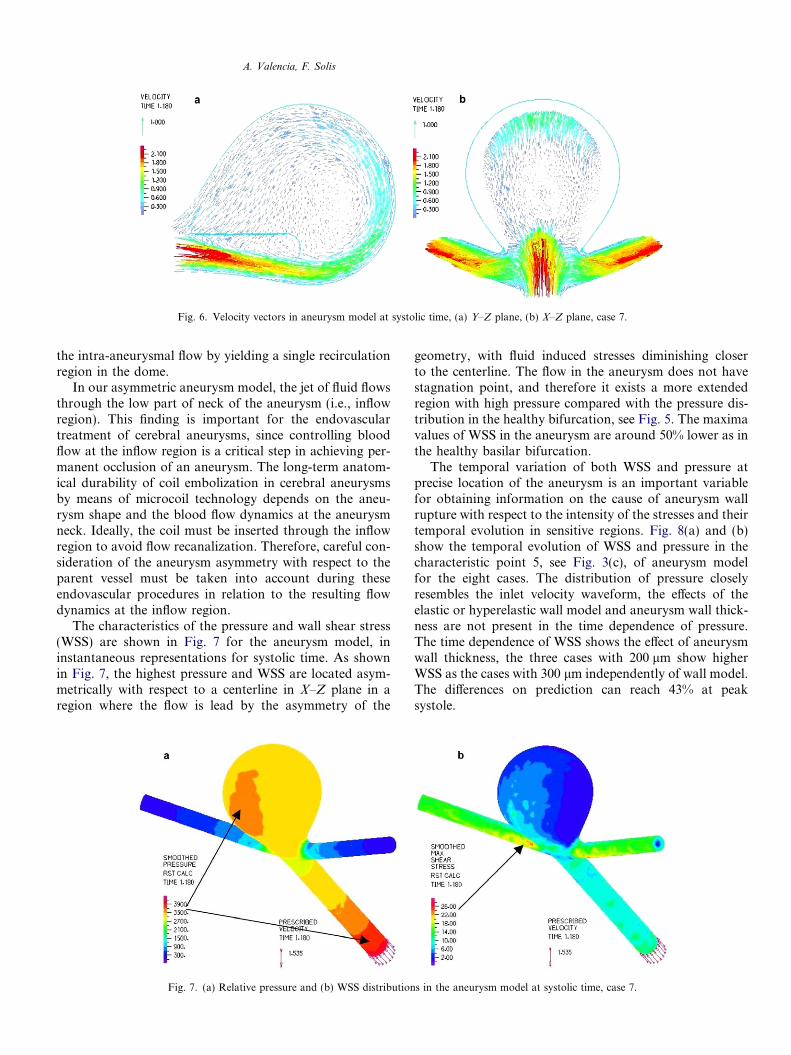
Fig. 6. Velocity vectors in aneurysm model at systolic time, (a) Y–Z plane, (b) X–Z plane, case 7.
A. Valencia, F. Solis
the intra-aneurysmal flow by yielding a single recirculationregion in the dome.
In our asymmetric aneurysm model, the jet of fluid flowsthrough the low part of neck of the aneurysm (i.e., inflowregion). This finding is important for the endovasculartreatment of cerebral aneurysms, since controlling bloodflow at the inflow region is a critical step in achieving per-manent occlusion of an aneurysm. The long-term anatom-ical durability of coil embolization in cerebral aneurysmsby means of microcoil technology depends on the aneu-rysm shape and the blood flow dynamics at the aneurysmneck. Ideally, the coil must be inserted through the inflowregion to avoid flow recanalization. Therefore, careful con-sideration of the aneurysm asymmetry with respect to theparent vessel must be taken into account during theseendovascular procedures in relation to the resulting flowdynamics at the inflow region.
The characteristics of the pressure and wall shear stress(WSS) are shown in Fig. 7 for the aneurysm model, ininstantaneous representations for systolic time. As shownin Fig. 7, the highest pressure and WSS are located asym-metrically with respect to a centerline in X–Z plane in aregion where the flow is lead by the asymmetry of the
Fig. 7. (a) Relative pressure and (b) WSS distribution
geometry, with fluid induced stresses diminishing closerto the centerline. The flow in the aneurysm does not havestagnation point, and therefore it exists a more extendedregion with high pressure compared with the pressure dis-tribution in the healthy bifurcation, see Fig. 5. The maximavalues of WSS in the aneurysm are around 50% lower as inthe healthy basilar bifurcation.
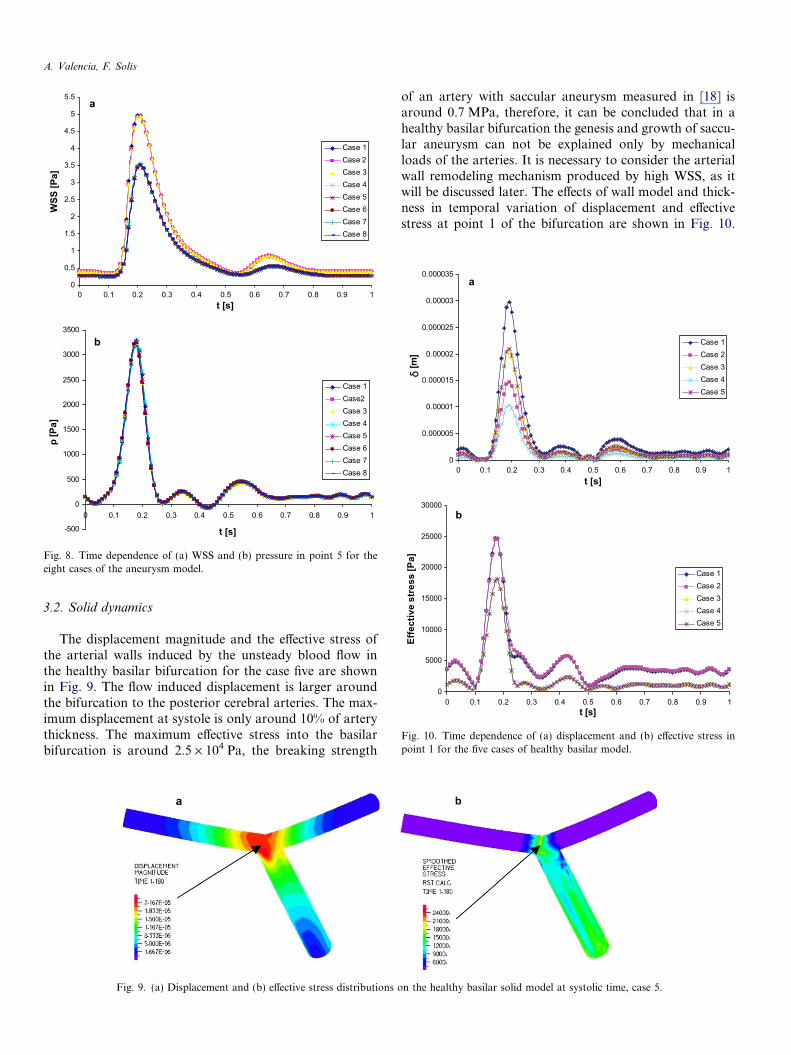
The temporal variation of both WSS and pressure atprecise location of the aneurysm is an important variablefor obtaining information on the cause of aneurysm wallrupture with respect to the intensity of the stresses and theirtemporal evolution in sensitive regions. Fig. 8(a) and (b)show the temporal evolution of WSS and pressure in thecharacteristic point 5, see Fig. 3(c), of aneurysm modelfor the eight cases. The distribution of pressure closelyresembles the inlet velocity waveform, the effects of theelastic or hyperelastic wall model and aneurysm wall thick-ness are not present in the time dependence of pressure.The time dependence of WSS shows the effect of aneurysmwall thickness, the three cases with 200 lm show higherWSS as the cases with 300 lm independently of wall model.The differences on prediction can reach 43% at peaksystole.
s in the aneurysm model at systolic time, case 7.
0
0.5
1
1.5
2
2.5
3
3.5
4
4.5
5
5.5
0 0.1 0.2 0.3 0.4 0.5 0.6 0.7 0.8 0.9 1t [s]
WSS
[Pa]
Case 1Case 2Case 3Case 4Case 5Case 6Case 7Case 8
-500
0
500
1000
1500
2000
2500
3000
3500
0 0.1 0.2 0.3 0.4 0.5 0.6 0.7 0.8 0.9 1
t [s]
p [P
a]
Case 1Case2Case 3Case 4Case 5Case 6Case 7Case 8
a
b
Fig. 8. Time dependence of (a) WSS and (b) pressure in point 5 for theeight cases of the aneurysm model.
0
0.000005
0.00001
0.000015
0.00002
0.000025
0.00003
0.000035
0 0.1 0.2 0.3 0.4 0.5 0.6 0.7 0.8 0.9 1t [s]
[m]
Case 1Case 2Case 3Case 4Case 5
0
5000
10000
15000
20000
25000
30000
0 0.1 0.2 0.3 0.4 0.5 0.6 0.7 0.8 0.9 1t [s]
Effe
ctiv
e st
ress
[Pa]
Case 1Case 2Case 3Case 4Case 5
a
b
Fig. 10. Time dependence of (a) displacement and (b) effective stress inpoint 1 for the five cases of healthy basilar model.
A. Valencia, F. Solis
3.2. Solid dynamics
The displacement magnitude and the effective stress ofthe arterial walls induced by the unsteady blood flow inthe healthy basilar bifurcation for the case five are shownin Fig. 9. The flow induced displacement is larger aroundthe bifurcation to the posterior cerebral arteries. The max-imum displacement at systole is only around 10% of arterythickness. The maximum effective stress into the basilarbifurcation is around 2.5 · 104 Pa, the breaking strength
Fig. 9. (a) Displacement and (b) effective stress distributions o
of an artery with saccular aneurysm measured in [18] isaround 0.7 MPa, therefore, it can be concluded that in ahealthy basilar bifurcation the genesis and growth of saccu-lar aneurysm can not be explained only by mechanicalloads of the arteries. It is necessary to consider the arterialwall remodeling mechanism produced by high WSS, as itwill be discussed later. The effects of wall model and thick-ness in temporal variation of displacement and effectivestress at point 1 of the bifurcation are shown in Fig. 10.
n the healthy basilar solid model at systolic time, case 5.
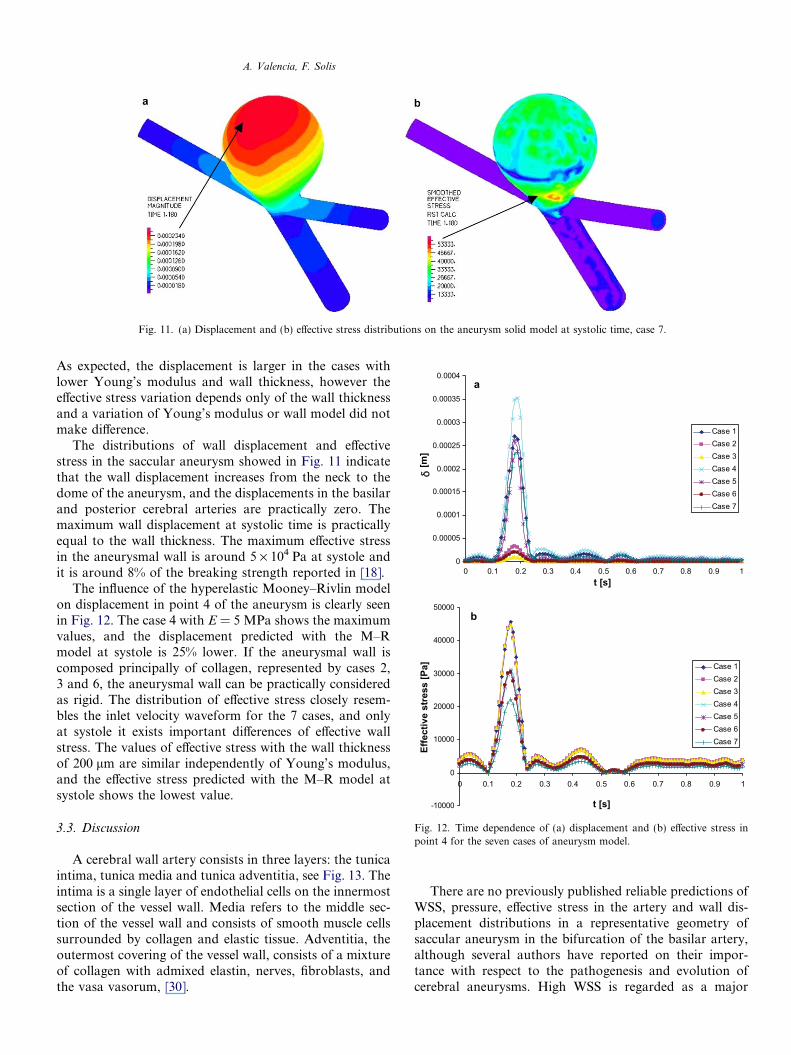
Fig. 11. (a) Displacement and (b) effective stress distributions on the aneurysm solid model at systolic time, case 7.
0
0.00005
0.0001
0.00015
0.0002
0.00025
0.0003
0.00035
0.0004
0 0.1 0.2 0.3 0.4 0.5 0.6 0.7 0.8 0.9 1t [s]
[m]
Case 1Case 2Case 3Case 4Case 5Case 6Case 7
-10000
0
10000
20000
30000
40000
50000
0 0.1 0.2 0.3 0.4 0.5 0.6 0.7 0.8 0.9 1
t [s]
Effe
ctiv
e st
ress
[Pa] Case 1
Case 2Case 3Case 4Case 5Case 6Case 7
a
b
Fig. 12. Time dependence of (a) displacement and (b) effective stress inpoint 4 for the seven cases of aneurysm model.
A. Valencia, F. Solis
As expected, the displacement is larger in the cases withlower Young’s modulus and wall thickness, however theeffective stress variation depends only of the wall thicknessand a variation of Young’s modulus or wall model did notmake difference.
The distributions of wall displacement and effectivestress in the saccular aneurysm showed in Fig. 11 indicatethat the wall displacement increases from the neck to thedome of the aneurysm, and the displacements in the basilarand posterior cerebral arteries are practically zero. Themaximum wall displacement at systolic time is practicallyequal to the wall thickness. The maximum effective stressin the aneurysmal wall is around 5 · 104 Pa at systole andit is around 8% of the breaking strength reported in [18].
The influence of the hyperelastic Mooney–Rivlin modelon displacement in point 4 of the aneurysm is clearly seenin Fig. 12. The case 4 with E = 5 MPa shows the maximumvalues, and the displacement predicted with the M–Rmodel at systole is 25% lower. If the aneurysmal wall iscomposed principally of collagen, represented by cases 2,3 and 6, the aneurysmal wall can be practically consideredas rigid. The distribution of effective stress closely resem-bles the inlet velocity waveform for the 7 cases, and onlyat systole it exists important differences of effective wallstress. The values of effective stress with the wall thicknessof 200 lm are similar independently of Young’s modulus,and the effective stress predicted with the M–R model atsystole shows the lowest value.
3.3. Discussion
A cerebral wall artery consists in three layers: the tunicaintima, tunica media and tunica adventitia, see Fig. 13. Theintima is a single layer of endothelial cells on the innermostsection of the vessel wall. Media refers to the middle sec-tion of the vessel wall and consists of smooth muscle cellssurrounded by collagen and elastic tissue. Adventitia, theoutermost covering of the vessel wall, consists of a mixtureof collagen with admixed elastin, nerves, fibroblasts, andthe vasa vasorum, [30].
There are no previously published reliable predictions ofWSS, pressure, effective stress in the artery and wall dis-placement distributions in a representative geometry ofsaccular aneurysm in the bifurcation of the basilar artery,although several authors have reported on their impor-tance with respect to the pathogenesis and evolution ofcerebral aneurysms. High WSS is regarded as a major

Fig. 13. Schematic cross-section of a typical cerebral artery.
A. Valencia, F. Solis
factor in the development and growth of cerebral aneu-rysms. The endothelial cells are sensitive to changes inWSS and regulate local vascular tone by releasing vasodi-lator and vasoconstrictor substances [7]. Consequently, ithas been suggested that WSS plays a major role in theadaptive dilation of arteries to a sustained increase in bloodflow. Localized stagnation of blood flow is known to resultin the aggregation of red blood cells, as well as the accumu-lation and adhesion of both platelets and leukocytes alongthe intimal surface. This occurs due to dysfunction of flow-induced nitric oxide, which is usually released by mechan-ical stimulation through increased shear stress. Thesefactors may cause intimal damage, lead to small thrombusformation and infiltration of white blood cells and fibrininside the aneurysm wall [8]. Damage to the endothelialcells is typically hypothesized as a contributing cause toaneurysm growth and rupture. Once the integrity of thislayer of cells lining the lumen is breached, subsequent dete-rioration of the structural fibers of the vessel may occur.Flow and solid dynamics are involved in the process lead-ing to vessel remodeling due to wall injury. It is assumedthat a WSS of �2 Pa is suitable for maintaining the struc-ture of the aneurysmal wall and a lower WSS will degener-ate endothelial cells, [31]. Our results show values lowerthan 2 Pa in large regions of the aneurysmal wall overone cardiac cycle. This low WSS may be one important fac-tor underlying the degeneration, indicating the structuralfragility of the aneurysmal wall. Our results suggest thatpotential endothelial damage occurs due to high amplitudestresses with fatigue playing a key role as a consequence offlow-induced wall stress gradients.
The zero normal traction boundary condition used inthe outlet produces that the pressure in this region isapproximately zero. From physiological point of view thecalculated pressure difference and WSS are correct. Thepressure inside the aneurysm is however underestimated,and therefore the reported wall stress and displacementare also underestimated. Another relevant outcome of thisinvestigation is the underlying relationship between thetemporal distributions of stress and displacement of theaneurysmal wall with respect to the flow waveformimposed at the model inlet. This is illustrated by the almostconstant WSS, pressure, effective stress and displacementobtained during diastole for the healthy basilar arteryand in the aneurysm model. This observation emphasizes
the importance of utilizing flow waveform measured inthe respective artery of the circle of Willis by means ofpulsed Doppler ultrasound, if patient-specific models ofterminal aneurysm are used to describe their three-dimen-sional unsteady flow with arterial wall interaction.
4. Conclusions
This paper presents a numerical investigation of thefluid solid interaction in a saccular aneurysm modeland in a healthy model of the basilar artery. The effectsof wall model and wall thickness are studied in detail withrespect to the spatial and temporal distributions of pres-sure, wall shear stress, effective wall stress and aneurysmdisplacement.
The flow dynamics in the aneurysm model shows anunsteady vortex structure. Large spatial and temporal vari-ations of pressure and shear stress are obtained on theaneurysmal wall. The aneurysmal wall displacement andeffective stress depend on wall thickness and wall modelespecially at systole. Further studies are necessary to inves-tigate the effects of arterial compliance on the development,growth, and rupture of patient-specific intracranial aneu-rysms of the basilar artery.
Acknowledgement
The financial support received from FONDECYTChile under grant number 1030679 is recognized andappreciated.
References
[1] Schievink WI. Intracranial aneurysms. New England J Med1997;336:28–40.
[2] Wardlaw JM, White PM. The detection and management ofunruptured intracranial aneurysms. Brain 2000;123:205–21.
[3] Weir B, Amidei C, Kongable G, Findlay JM, Kassell NF, et al. Theaspect ratio (dome/neck) of ruptured and unruptured aneurysms. JNeurosurg 2003;99:447–51.
[4] Liou TM, Liou SN. A review on in vitro studies of hemodynamiccharacteristics in terminal and lateral aneurysm models. Proc ofNational Science Council, Republic of China, Part B, Life Sciences1999;23:133–48.
[5] Imbesi SG, Kerber CW. Analysis of slipstream flow in a wide-neckedbasilar artery aneurysm: Evaluation of potential treatment regimens.Am J Neuroradiol 2001;22:721–4.
[6] Lieber BB, Livescu V, Hopkins LN, Wakhloo AK. Particle imagevelocimetry assessment of stent design influence on intra-aneurysmalflow. Ann Biomed Eng 2002;30:768–77.
[7] Tateshima S, Murayama Y, Villablanca JP, Morino T, Takahashi H,Yamauchi T, et al. Intraaneurysmal flow dynamics study featuringan acrylic aneurysm model manufactured using a computerizedtomography angiogram as a mold. J Neurosurg 2001;95:1020–7.
[8] Ujiie H, Tachibana H, Hiramatsu O, Hazel AL, Matsumoto T,Ogasawara Y, et al. Effects of size and shape (aspect ratio) on thehemodynamics of saccular aneurysms: a possible index for surgicaltreatment of intracranial aneurysms. Neurosurgery 1999;45:119–30.
[9] Jou LD, Saloner D, Higashida R. Determining intra-aneurysmal flowfor coiled cerebral aneurysms with digital fluoroscopy. Biomed Eng –Appl, Basis Commun 2004;16:43–8.
A. Valencia, F. Solis
[10] Foutrakis G, Yonas H, Sclabassi R. Saccular aneurysm formation incurved and bifurcating arteries. Am J Neuroradiol 1999;20:1309–17.
[11] Steinman DA, Milner JS, Norley CJ, Lownie SP, Holdsworth DW.Image-based computational simulation of flow dynamics in a giantintracranial aneurysm. Am J Neuroradiol 2003;24:559–66.
[12] Cebral JR, Hernandez M, Frangi AF. Computational analysis ofblood flow dynamics in cerebral aneurysms from CTA and 3Drotational angiography image data. In: Proc of International Con-gress on Computational Bioengineering, Spain, 2003.
[13] Ho PC, Melbin J, Nesto RW. Scholarly review of geometry andcompliance: Biomechanical perspectives on vascular injury andhealing. Am Soc Artif Internal Organs J 2002;48:337–45.
[14] Bathe M, Kamm RD. A fluid–structure interaction finite elementanalysis of pulsatile blood flow through a compliant stenotic artery.ASME J Biomech Eng 1999;121:361–9.
[15] Finol EA, Di Martino ES, Vorp DA, Amon CH. Fluid structureinteraction and structural analyses of an aneurysm model, 2003Summer ASME Bioengineering Conference, ASME 2003 BED-54,2003.
[16] Low M, Perktold K, Raunig R. Hemodynamics in rigid anddistensible saccular aneurysms: a numerical study of pulsatile flowcharacteristics. Biorheology 1993;30:287–98.
[17] Humphrey JD, Canham PB. Structure, mechanical properties, andmechanics of intracranial saccular aneurysms. J Elasticity2000;61:49–81.
[18] MacDonald DJ, Finlay HM, Canham PB. Directional wall strengthin saccular brain aneurysms from polarized light microscopy. AnnBiomed Eng 2000;28:533–42.
[19] Hsiai TK, Cho SK, Honda HM, Hama S, Navab M, Demer LL,et al. Endothelial cell dynamics under pulsating flows: Significance ofhigh versus low shear stress slew rates (os/ot). Ann Biomed Eng2002;30:646–56.
[20] Perktold K, Peter R, Resch M. Pulsatile non-Newtonian blood flowsimulation through a bifurcation with an aneurysm. Biorheology1989;26:1011–30.
[21] Ma B, Harbaugh RE, Raghavan ML. Three-dimensional geometricalcharacterization of Cerebral aneurysms. Ann Biomed Eng2004;32:264–73.
[22] Parlea L, Fahrig R, Holdsworth DW, Lownie SP. An analysis of thegeometry of saccular intracranial aneurysms. Am J Neuroradiol1999;20:1079–89.
[23] Monson K. Mechanical and failure properties of human cerebralblood vessels. Ph.D. Thesis. University of California, Berkeley, USA,2001.
[24] ADINA Theory and Modeling Guide. Volume I: ADINA. ADINAR& D, Inc. Watertown, MA, USA, 2004.
[25] Holdsworth DW, Norley CJD, Frayne R, Steinmam DA, Rutt BK.Characterization of common carotid artery blood-flow waveforms innormal human subjects. Physiol Meas 1999;20:219–40.
[26] Guppy KH, Charbel FT, Corsten LA, Zhao M, Debrum G.Hemodynamic evaluation of basilar and vertebral artery angioplasty.Neurosurgery 2002;51:327–33.
[27] Owega A, Klingelhofer J, Sabri O, Kunert HJ, Albers M, Saß H.Cerebral blood flow velocity in acute schizophrenic patients: Atranscranial Doppler ultrasonography study. Stroke 1998;29:1149–54.
[28] Drangova M, Holdsworth DW, Boyd CJ, Dunmore PJ, Roach MR,Fenster A. Elasticity and geometry measurements of vascularspecimens using a high-resolution laboratory CT scanner. PhysiolMeas 1993;14:277–90.
[29] Bathe KJ, Zhang H. Finite element developments for general fluidflows with structural interactions. Int J Numer Meth Eng2004;60:213–32.
[30] Humphrey JD. Cardiovascular Solid Mechanics. New York: Sprin-ger-Verlag; 2002. Chapter 7, pp. 249–364.
[31] Shojima M, Oshima M, Takagi K, Torii R, Hayakawa M, Katada K,et al. Magnitude and role of wall shear stress on cerebral aneurysmcomputational fluid dynamic study of 20 middle cerebral arteryaneurysms. Stroke 2004;35:2500–5.
Copyright © 2022 FDOKUMEN