Blended cement pastes Freeze–thaw Ice formation Percolation
11
This article appeared in a journal published by Elsevier. The attached copy is furnished to the author for internal non-commercial research and education use, including for instruction at the authors institution and sharing with colleagues. Other uses, including reproduction and distribution, or selling or licensing copies, or posting to personal, institutional or third party websites are prohibited. In most cases authors are permitted to post their version of the article (e.g. in Word or Tex form) to their personal website or institutional repository. Authors requiring further information regarding Elsevier’s archiving and manuscript policies are encouraged to visit: http://www.elsevier.com/authorsrights
-
Upload
independent -
Category
Documents
-
view
1 -
download
0
Transcript of Blended cement pastes Freeze–thaw Ice formation Percolation

This article appeared in a journal published by Elsevier. The attachedcopy is furnished to the author for internal non-commercial researchand education use, including for instruction at the authors institution
and sharing with colleagues.
Other uses, including reproduction and distribution, or selling orlicensing copies, or posting to personal, institutional or third party
websites are prohibited.
In most cases authors are permitted to post their version of thearticle (e.g. in Word or Tex form) to their personal website orinstitutional repository. Authors requiring further information
regarding Elsevier’s archiving and manuscript policies areencouraged to visit:
http://www.elsevier.com/authorsrights

Author's personal copy
Characterizing blended cement pastes under cyclic freeze–thaw actions by electrical resistivity
Zhendi Wang a, Qiang Zeng b, Ling Wang a, Yan Yao a,⇑, Kefei Li b
a State Key Laboratory of Green Building Materials, China Building Materials Academy, Beijing 100024, PR China b Institute of Building Materials, Civil Engineering Department, Tsinghua University, Beijing 100084, PR China
h i g h l i g h t s
�We measured the electrical resistivity of blended cement pastes under cyclic freeze–thaw actions. � We characterized the dep ercolation/
repercolation and the ice crystallizing/melting points during freezing/thawing.� We found logarithm plots of electrical
resistivity against temperat ure with two stages linear form. � We used the Pearson correlation
method to assess the correlation coefficient among the parameters. � The electrical resistivity responses to
F–T action for porous material open prospects in assessing its properties.
g r a p h i c a l a b s t r a c t
a r t i c l e i n f o
Article history: Received 25 December 2012 Received in revised form 19 February 2013 Accepted 25 February 2013
Keywords:Electrical resistivity Blended cement pastes Freeze–thawIce formation Percolation
a b s t r a c t
This paper presents the characterization of blended cement pastes under freeze–thaw (F–T) loading by electrical resistivity measurement. Silica fume, fly ash, ground granulated blast furnace slag and steel slag were used as the supplementa l materials blended with ordinary Portland cement. The electrical resistiv- ity of blended cement pastes was measured under cyclic F–T actions. The depercolation point and ice crystallizing point during freezing, and the repercolation point and ice melting point during thawing can be determined from the logarithm plots of electrical resistivity versus temperature. Both the plots before and after crystallizing points during freezing, and those before and after melting points have linear form. Using the Pearson correlation method, the correlations among eval uated parameters were assessed. The obtained results indicate that both the crystallizing temperature (hf) and the depercolation temper- ature (hDPT) increase with the F–T cycle number, wher eas both the melting temperature (hm) and reper- colation temperature (hRPT) decrease with the F–T cycle number. Most pairs of parameters have strong linear correlation with a coefficient of 0.8–1. Hence, the used approach may provide an alternative method to assess the structure alteration of cement-based materials by F–T action.
� 2013 Elsevier Ltd. All rights reserved.
1. Introduction
Electrical-bas ed methods (EBMs) are widely used to character- ize materials . In geophysics, electrical resistivity tomography or
electrical resistivity imaging can help image sub-surface structures from electrical measurements made at the surface [1,2], which is similar to the use of electrical impedance tomography [3] orelectrical capacity tomography [4,5]. In material engineering, elec- trical resistivity and percolation theory are combined to assess the propertie s of composites [6]. As complicated composite materials, cement-based materials (CBMs) can also be characterized using
0950-0618/$ - see front matter � 2013 Elsevier Ltd. All rights reserved. http://dx.doi.org/10.1016/j.conbuildmat.2013.02.042
⇑ Corresponding author. Tel.: +86 10 51167111. E-mail address: [email protected] (Y. Yao).
Construction and Building Materials 44 (2013) 477–486
Contents lists available at SciVerse ScienceDi rect
Construc tion and Buildi ng Materi als
journal homepage: www.elsevier .com/locate /conbui ldmat

Author's personal copy
EBMs. It is known that the electrical resistivity of a material is inti- mately related to the percolation of a conductibl e compound. This principle means that an EBM can assess related percolation pro- cesses. Li and coworkers showed that the setting and hardening behavior of fresh CBM can be characterized by characterist ic points on the curves of electrical resistivity versus time [7–9], which is, in fact, a result of the depercolation of conductible pore solution. It was thus concluded that electrical conductivi ty can be used as an indicator of the setting characteri stics and the structura l changes of the hardened paste [10]. Chung and coworkers used an EBM to monitor the evolution of damage in CBM induced by either static stress, dynamic stress, freeze–thaw (F–T) cycling, creep or drying shrinkage, which relies on the fact that the electrical resistivity of the CBM increases when damage breaks percolation paths for conduction [11–13]. Because the percolation properties of the pore structure of the CBM are intimately related to durability, the elec- trical resistivity or conductivity for a chloride-ion -concentrated CBM, obtained in what is known as the rapid chloride permeability test, is also an important indicator of durability [14,15]. An EBM was also used to characteri ze a CBM blended with conductible and/or semi-conductibl e fibers, such as steel fibers or carbon fibers[16,17].
F–T loading is of interest to researchers because of its possible damage to CBM. A number of articles on the damage mechanisms of F–T loading on CBM have been published , among which the hydraulic pressure [18] and crystallization pressure [19] have been recognized as the two main pressure sources for F–T damage. The physico-chem ical changes of pore solution in CBM during F–Tprocesses, however, have received less attention . Setzer indicated that the ice lens acts as a cryopump that attracts nearby capillary water and/or outside water [20]. The redistribution of water during F–T cycles causing water uptake for unsealed CBM samples has been verified extensively [21]. For sealed samples, the water redis- tribution during F–T cycles and the consequences have not yet been addressed clearly. In addition, the pore percolation character- istics due to ice during F–T cycles of CBM are an enigma. With this
background , this paper attempts to use electrical resistivity to characteri ze a CBM during F–T action.
2. Experiments and materials
2.1. Materials and mixture
The raw materials for blended cement pastes are ASTM Type I Portland cement, silica fume, fly ash, ground granulated blast furnace slag (GGBFS) and ground gran- ulated blast steel furnace slag (GGBSFS). The chemical composition and physical properties are presented in Table 1, and the used water-to-binder (W/B) ratio is 0.5. For all samples, 20% mass cement is replaced by the supplemental materials. The detailed material proportions and the nomenclatures are given in Table 2. Note that the GGBFS and GGBSFS with a mass fraction of 2:1 are blended with cement for CSS samples.
2.2. Sample preparation and experimental procedures
The materials with the mix proportions presented in Table 2 were mixed appro- priately to obtain fresh blended cement pastes, which were then cast in a prism with dimensions of 25 mm � 25 mm � 280 mm and placed in a room at 20 �C for primary curing. After 24 h’ curing, the hardened specimens were demolded and then immersed in water for further curing. At an age of 28 days, the specimens were taken out of water and each long specimen was cut into three shorter prisms (25 mm � 25 mm � 70 mm). The oven-drying (105 �C) procedures were performed to obtain the dried condition. However, the completely dried specimens are electri- cal insulators [22], and are thus unable to be measured employing an EBM. There- fore, the dried samples were immersed in water for 5 min. The masses of the saturated, dried and water-adsorbed samples were measured and are denoted as ms, md and mw. The porosity / can then be calculated as
/ ¼ ðms �mdÞ=qw
Vs; ð1Þ
and the saturation degree S can be evaluated as
S ¼ mw �md
ms �md; ð2Þ
where (ms �md) represents the total mass of pore water, Vs is the total volume of the specimen (43.75 ml), and (mw �md) denotes the mass of adsorbed water. The obtained porosity / and saturation degree S for all blended samples are given in Ta-ble 3. The porosities are much larger than the values normally obtained for ordinary Portland cement (OPC) at the same w/c; i.e., / � 0.4[23]. This may be because of the partial decomposition of ettringite [24] and partial loss of chemical bond water [25].
The surfaces of samples were then polished with sandpaper and clamped with brass wire. Electrically conducting carbon powder was placed between the sample and the brass wires to achieve better electrical conduction. The samples were then
Table 1Mass compositions and physical properties of cement, silica fume, fly ash, GGBFS and GGBSFS (LOI: loss of ignition, SSA: specific surface area).
Chemical composition Cement GGBFS Silica fume Fly ash GGBSFS
SiO 2 (%) 22.02 32.86 95.00 57.60 17.36 Al 2O3 (%) 4.00 16.38 0.30 21.90 6.98 Fe 2O3 (%) 3.48 0.97 0.80 2.70 18.96 CaO (%) 62.12 36.31 0.40 3.87 40.33 MgO (%) 2.58 9.37 0.30 1.68 5.90 SO 3 (%) 2.72 9.37 0.50 0.41 0.59 Na 2O (eq) (%) 0.53 – 0.90 4.05 –CaO (free) (%) 0.87 0.018 – – 0.55 Cl (%) 0.01 0.02 – – 0.024 LOI (%) 1.75 0.86 – 7.05 5.00 SSA (m2/kg) 343 449 20,000 355 332 Density (g/ml) 3.10 2.78 – 2.06 –
Table 2Mix proportions of used blended pastes (g/l).
Materials Cement Silica fume
Fly ash
GGBFS GGBSFS Water W/ B
OPC 450 – – – – 225 0.5 CSF 360 90 – – – 225 0.5 CFA 360 – 90 – – 225 0.5 CBFS 360 – – 90 – 225 0.5 CSS 360 – – 60 30 225 0.5
Table 3Porosity and saturation degree.
Materials Porosity / (%) Saturation degree S (%)
OPC 57 19 CSF 62 26 CFA 56 16 CBFS 59 18 CSS 55 15
Fig. 1. Schematic illustration of electrical resistivity measurement setup.
478 Z. Wang et al. / Construction and Building Materials 44 (2013) 477–486

Author's personal copy
covered with a layer of plastic film to avoid moisture exchange during F–T loading. The well-prepared samples were then assembled as illustrated in Fig. 1 and placed in an environmental chamber with a temperature range of 15 to �30 �C. An amme- ter (Keithley 2001) was used to record the electrical signal automatically.
3. Results and analysis
3.1. Electrical resistivity
The electrical resistivity in terms of testing time for OPC, CSF, CFA, CBFS and CSS, as well as the temperature are illustrate d in Fig. 2a. All samples have electrical resistivity of 1000 (X m), which is close to the results obtained for OPC concrete in a normal outside environm ent (20 �C, about 80% humidity), but lower than those ob- tained for OPC concrete in an indoor environment (20 �C, about 50% humidity) [26]. When electrical resistivity exceeds 2000 (X m), it suddenly becomes an infinitesimal large value (about9.9 � 1035 X m) and is thus neglected in this paper. The electrical resistivity and temperature in the interval of 160–300 min are magnified in Fig. 2b. It is found that the minimum electrical resis- tivity qmin appears at the highest temperature , while the highest measura ble value appears at some subzero temperature; these findings are associate d with the temperature-dep endent molecule mobilitie s and percolation variation due to ice formation.
Fig. 3 shows the minimum electrical resistivity qmin in terms of the F–T cycle for OPC, CSF, CFA, CBFS and CSS. Obviously, it con- forms that qCSF > qOPC > qCSS > qCFA > qCBFS. This may be because of the change in microstructur e and pore structure due to the sup- plementa l materials. Owing to the small size, spherical shape and high chemical activity, the silica fume has significant advantages in densifying the microstructure and thinning the pore structure, which has been verified by microstructur e analysis [27,28], diffu- sivity measurement and modeling [29]. The larger capillary forces induced by thinner pores increase the saturatio n degree as pre- sented in Table 3. Owing to the large specific surface area, most water was first adsorbed on the pore surface rather than condense in pores. The CSF thus had higher electrical resistivity. However, flyash, GGBFS and GGBSFS do not contribute to the densification of microstru cture and thinning of pore structure in cement pastes at an early age (cf [30]), but provide more benefits at later ages (curing age longer than 1 year) [31]. The CFA, CBFS and CSS pastes thus exhibit lower electrical resistivity. It is further depicted in Fig. 3 that qmin increases with the number of F–T cycles monoto- nously for OPC, CSF, CFA, CBFS and CSS. This may be because of the damage induced by F–T loading and the moisture redistribu- tion during freezing and thawing; see Section 4 for more detailed discussion.
Fig. 4 shows the relative electrical resistivity (fq) in terms of temperat ure in the freezing stage of the first F–T cycle for OPC, CSF, CFA, CBFS and CSS, where fq is defined as the ratio of electrical
Fig. 4. Relative electrical resistivity versus temperature in the freezing stage of the first F–T cycle for OPC, CSF, CFA, CBFS and CSS.
Fig. 2. (a) Electrical resistivity of OPC, CSF, CFA, CBFS and CSS, and the temperature in terms of testing time and (b) magnified for 160–300 min.
Fig. 3. Minimum electrical resistivity qmin in terms of the F–T cycles for OPC, CSF, CFA, CBFS and CSS.
Z. Wang et al. / Construction and Building Materials 44 (2013) 477–486 479

Author's personal copy
resistivity at the current temperature q(h) to that at the initial tem- perature q(h0), fq = q(h)/q(h0). Obviously , two stages of fq in terms of temperature can be determined: the slight and significant in- creases in electrical resistivity with decreasing temperat ure. The sudden change in electrical resistivity may be induced by ice formation. In the first stage, fq increases to 1.2–1.5 for all samples owing to the decrease in mobility of conductibl e molecules in the
pore solution with temperature ; in the second stage, fq increases to 3.8, 3.6 and 6 for CFA, CSS and CBFS respectivel y, which depicts somewhat the influence of ice growing through pores of the CBM; see Section 4.1 for more detailed discussion.
3.2. Characteri stic temperature
The plots of electrical resistivity against temperat ure reveal important information of ice action in pores. As an example, Fig. 5 shows the logarithmic plots of electrical resistivity against temperat ure in the first freezing and thawing stages for CFA. Again, the two stages of electrical resistivity in terms of temperature can be clearly determined . The sudden change in electrical resistivity from the first stage to the second stage can be identified as the freezing point, and the correspondi ng temperature is known as the ice formation temperat ure (hFT). The ice formation points can be important in understand ing both the physical principles of F–T for CBM [32] and the instantaneo us dilation induced by ice formatio n [33]. When the temperature decreases to below the depercolati on temperat ure (hDPT), the electrical resistivity becomes endless owing to the depercolation action of ice in pores. This point is defined as the depercolation point.
In the thawing stage, the similar two-stages plots of electrical resistivity against temperat ure can be depicted from Fig. 5. The point of the first measurable electrical resistivity is defined as the repercolation point, and the corresponding temperature is the repercolation temperat ure (hRPT). When the decrease in
Fig. 7. Freezing temperature hFT (a) and melting temperature hMT (b) in terms of the F–T cycle for OPC, CFA, CBFS and CSS.
Fig. 6. Depercolation temperature hDPT (a) and repercolation temperature hRPT (b) in terms of the F–T cycle for OPC, CSF, CFA, CBFS and CSS.
Fig. 5. Logarithm plots of electrical resistivity of CFA against temperature in the first F–T cycle.
480 Z. Wang et al. / Construction and Building Materials 44 (2013) 477–486

Author's personal copy
electrical resistivity with increasing temperature suddenly be- comes less significant, the transit point is defined as the melting point, which corresponds to the complete thawing of the pore ice. The correspondi ng temperature is the melting temperature (hMT). The detailed mechanisms of ice action are described in Sec- tion 4.1.
Fig. 6a and b show, respectively , the depercolation temperature hDPT and repercolation temperature hRPT in terms of F–T cycles for OPC, CSF, CFA, CBFS and CSS. It is found that hDPT( CSF) > hDPT
(OPC) > hDPT( CFA) � hDPT(CBFS) > hDPT(CSS) and hRPT(CSF) > hRPT
(OPC) P hRPT( CSS) > hRPT(CFA) > hRPT(CBFS). As the F–T cycle num- ber increases, hDPT increases but hRPT decreases progressively for
Fig. 8. Logarithm plots of electrical resistivity against temperature in the freezing stage of different F–T cycles for (a) OPC, (b) CSF, (C) CFA, (d) CBFS and (e) CSS.
Z. Wang et al. / Construction and Building Materials 44 (2013) 477–486 481

Author's personal copy
all blended cement pastes. These observations are, again, due to microstructur al altering of the supplemental materials and the ice action during F–T loading. Nevertheles s, the repercolation tem- perature can be lower than the depercolation temperature, i.e, the values of 5th and 6th F–T cycles for OPC and CBFS in Fig. 6a and b, and yet this observation occurs occasionally.
The freezing temperature hFT and the melting temperature hMT
in terms of F–T cycles for OPC, CSF, CFA, CBFS and CSS are illus- trated in Fig. 7a and b respectively . Note that the freezing and melting points for CSF samples are not plotted in Fig. 7a and b be- cause they cannot be determined from the plots of electrical resis- tivity against temperature. In addition, hFT is available for only the first three F–T cycles for OPC. The results show hFT(CFA) > hFT
(OPC) � hFT(CBFS) > hFT(CSS) and hMT(CSS) > hMT(CFA) > hMT(OPC) >hMT(CBFS). Analogous to the case for hDPT and hRPT shown in Fig. 6a and b, hFT increases but hMT decrease s with the number of F–T cycles increasing. Some data of hMT have positive values, which may be partially due to the thermal gradient distribution induced by the size effect of samples [34].
3.3. Plotting parameters
When plotting the electrical resistivity against temperature , the logarithm linear relations in the aforementione d first and second stages can be determined:
logðqÞ ¼ A � hþ B; ð3Þ
where h represents temperatur e (�C), and A and B are adjustable paramete rs, which represe nt the slope and the Y-intercept of log (q) vs h curves. The forms X and X0 represent the parameter s(X = A,B) for the first (from the initial point to the freezing/ melting point) and the second linear (from the freezing/ melting point to the deperco lation/reperco lation point) states, and the terms XF
and XT represent the parameter s at freezing and thawing stages respective ly.
3.3.1. Freezing stage The logarithm plots and fitting curves of electrical resistivity
against temperature in the freezing stage of different F–T cycles for OPC, CSF, CFA, CBFS and CSS are shown in Fig. 8. Obviously, Eq. (3) captures the plots of electrical resistivity against tempera- ture very well. For OPC, only the first (from the initial point to the freezing point) linear stage is available for all six F–T cycles; see Fig. 8a. For CSF, only the data in the first three F–T cycles for the first stage are detectable; see Fig. 8b. For CFA, CBFS and CSS, the first and second linear stages are available for all six F–T cycles; see Fig. 8c–e respectively. The figures confirm that the electrical resistivity increases with the number of F–T cycles. However,
depercolati on occurs once the electrical resistivity reaches approx- imately 2000 (X m) independent of the material or F–T cycle.
The paramete rs AF ;BF ;A0F and B0F for all samples are presented in
Table 4. The paramete r AF for OPC and CBFS first increased and then decrease d as the F–T cycle number increased, and that for CSF monoton ously increased in the (first three) F–T cycles, whereas that for CFA and CSS monoton ously decrease d as the F–T cycle number increased. The parameter A0F for CFA, CBFS and CSS in- creased roughly with F–T cycle number, and both the Y-interceptBF and B0F increased with F–T cycle number, which is consistent with the variation in qmin with the F–T cycle number.
3.3.2. Thawing stage In the thawing stage, similar two-stage logarithm plots of elec-
trical resistivity against temperat ure in different F–T cycles for OPC, CSF, CFA, CBFS and CSS are found; see Fig. 9. Again, the well fitted curves confirm the relation between electrical resistivity and temperat ure in Eq. (3). Because of the limited data, the curves of OPC and CSF do not show the two linear states for all six F–Tcycles; see Fig. 9a and b. For CFA, CBFS and CSS, both the firstand second linear stages are available for all six F–T cycles; see Figs. 9c and d and 8e respectively . From the figures, the decreases in hRPT and hMT with increasing F–T cycle number are observed directly.
Although the plots of electrical resistivity against temperat ure between freezing and thawing have similar shape, the fittedparamete rs are very different. As shown in Table 5, AT for OPC and CBFS first decreases and then increases with the F–T cycle number, but that for CFA and CSS monoton ously increase with the F–T cycle number, which are the complete opposite to the variation in AF during the freezing stage. The parameter A0T forCFA, CBFS and CSS increases roughly with the F–T cycle, which is consistent with the results for the A0F . The Y-intercept BT in-creases with the F–T cycle number for OPC, CSF, CFA and CBFS, while that for CSS is almost constant at around 3. The Y-interceptB0T increases with the number of F–T cycles for OPC and CBFS, whereas that for CSS decreases with the number of F–T cycles and that for CFA first decreases and then increases with the number of F–T cycles.
4. Discussion
4.1. Ice actions during F–T cycle
The results reported in Section 3 reveal that ice formation in pores, to some extent, influences the electrical resistivity of blended cement paste under F–T loading, but without explaining how ice acts in a porous medium. To illustrate the ice action during
Table 4Parameters AF ;BF ;A
0F and B0F evaluated from Eq. (3) in the freezing stage of differ ent F–T cycles for OPC, CSF, CFA, CFBS and CSS.
F–T cycle OPC CSF CFA CBFS CSS
1st AF[BF] �0.020[3.071] �0.017[3.189] �0.017[2.698] �0.023[2.561] �0.011[2.785]A0F B0F� � ⁄⁄ ⁄⁄ �0.137[2.029] �0.177[1.666] �0.104[2.064]
2nd AF[BF] �0.018[3.148] �0.014[3.263] �0.016[2.738] �0.023[2.605] �0.010[2.817]A0F B0F� � ⁄⁄ ⁄⁄ �0.127[2.124] �0.159[1.821] �0.107[2.057]
3rd AF[BF] �0.017[3.198] �0.013[3.318] �0.016[2.769] �0.023[2.641] �0.010[2.845]A0F B0F� � ⁄⁄ ⁄⁄ �0.128[2.177] �0.166[1.812] �0.131[1.927]
4th AF[BF] �0.018[3.271] ⁄⁄ �0.019[2.823] �0.024[2.704] �0.013[2.886]A0F B0F� � ⁄⁄ ⁄ ⁄ �0.107[2.425] �0.129[2.211] �0.098[2.263]
5th AF[BF] �0.019[3.301] ⁄⁄ �0.019[2.849] �0.024[2.732] �0.013[2.910]A0F B0F� � ⁄⁄ ⁄ ⁄ �0.092[2.577] �0.132[2.233] �0.086[2.400]
6th AF[BF] �0.021[3.320] ⁄⁄ �0.025[2.967] �0.024[2.855] �0.014[3.009]A0F B0F� � ⁄⁄ ⁄ ⁄ �0.076[2.839] �0.124[2.448] �0.076[2.628]
⁄ Undetectable data.
482 Z. Wang et al. / Construction and Building Materials 44 (2013) 477–486

Author's personal copy
Fig. 9. Logarithm plots of electrical resistivity against temperature in the thawing stage of different F–T cycles for (a) OPC, (b) CSF, (C) CFA, (d) CBFS and (e) CSS.
Z. Wang et al. / Construction and Building Materials 44 (2013) 477–486 483

Author's personal copy
F–T cycles, the thermod ynamic equilibrium is retained. The solidification temperature of pore water depends on the ’throat’ size percolating the pore [19], which is given by the Gibbs–Thom-son equation:
DT / j; ð4Þ
where DT is the supercooled temperat ure induced by the curvatur eeffect, j is the curvature of ice tips during freezing and sides during thawing. Assuming that the pores are cylindric al, and the ice tips penetrati ng in pores have a hemispher ical surface , it thus has, jfreez-
ing = 2jthawing. Combining the above relation and Eq. (4), it follows that
DT freezing ¼ 2DTthawing; ð5Þ
In the freezing stage, the electrical resistivit y before ice nucleation increases slightly to decrease temperatur e; here the mobilit y of pore water is lowered by decreasing temperatur e. Ice then forms in and occupies large pores, which partially breaks the routes for electrical conduct ion; see step (a) in Fig. 10 . As the temperat ure decreases further, more pores are occupied by ice, more routes for electrical conduction are broken, and the electrical resistivity in- creases significantly; see step (b) in Fig. 10 . Once ice occupies the critical pores, which are the smallest pores creating a connec ted path in a pore structure [35], depercolatio n occurs; see step (c) in Fig. 10 .
In the thawing stage, ice melts at the side of cylindrical pores, and the temperature required for melting is half of that for freezing [36]; see Eq. (5). Once the ice in critical pores melts, it repercolates; see step (d) in Fig. 10 . As temperature increases further, more ice melts, and the electrical resistivity decreases significantly; see steps (e) and (f) in Fig. 10 . After ice has melted completely, the electrical resistivity decrease s slightly and there is an increase in temperat ure again due to the pore water mobility being affected by a temperature change.
In addition, because of the cryosuction effect [19,20,37,38 ],more water confined in thin capillary pores transports to the ice site nucleating in large pores during freezing. During thawing, the water from ice melting is more likely to stay in the unsaturated large pores rather than to transport back to the nearby thin pores. This leads to an increase in saturatio n degree for large pores but adecrease in saturation degree for gel pores as the number of F–Tcycles increases. The moisture redistributi on, in addition to the possible frost damage, is likely to explain the increases in qmin, hDPT
and hFT with the F–T cycle number.
4.2. Correlatio ns among parameters
The variations in parameters with F–T cycles are consistent and/ or opposite, but to what extent the paramete rs are correlated re- mains unclear. The Pearson correlation coefficient r is therefore used to assess correlation among the parameters according to
r ¼P6
i¼1ðxi � �xÞðyi � �yÞP6
i¼1ðxi � �xÞ2ðyi � �yÞ2h i0:5 ; ð6Þ
where xi and yi are the two different paramete rs for one blended ce- ment paste, and �x and �y are the average values for the six F–T cycles.
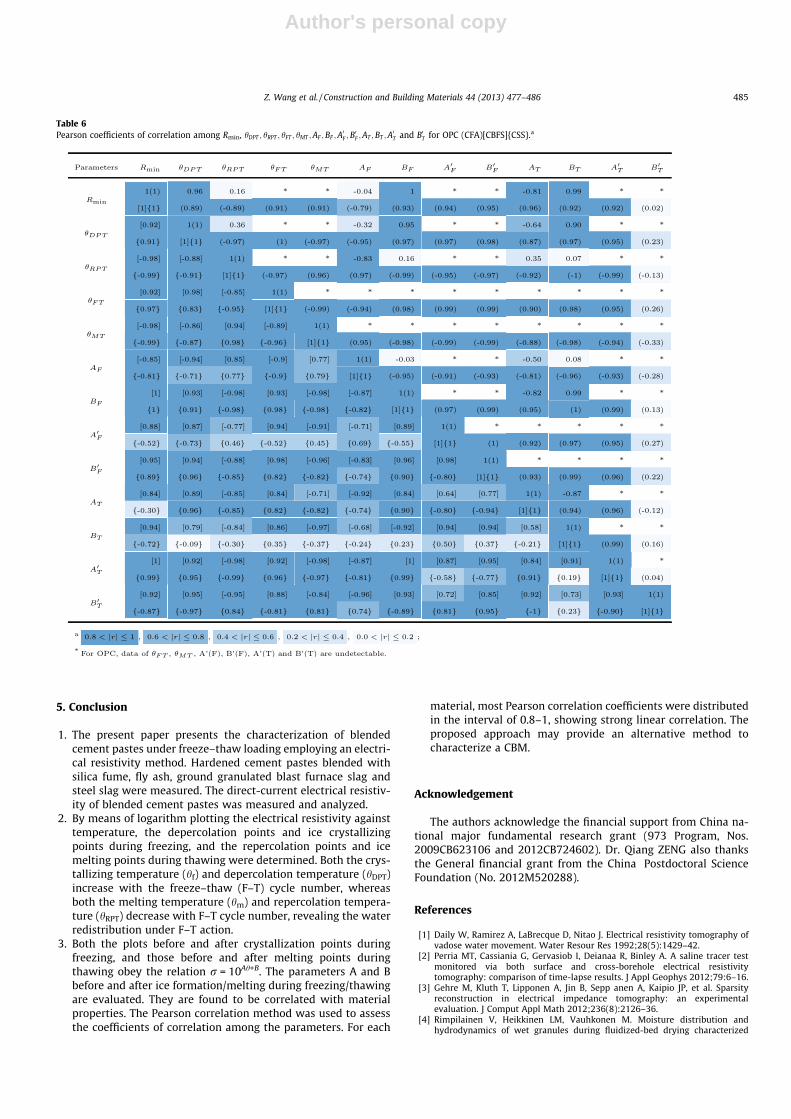
Table 6 shows the Pearson coefficients for correlation among qmin; hDPT ; hRPT ; hFT ; hMT ;AF ;BF ;A
0F ;B
0F ;AT ;BT ;A
0T and B0T for OPC, CFA,
CBFS and CSS, where jrj is grouped by the concentr ation of color. Owing to the lack of data, the correlation coefficients for CSF are not presente d in Table 6. For OPC, the paramete rs qmin, hDPT,BF,AT
and BT are strongly correlated with each other; the parameters hRPT
and AF show weak correlation with other available parameters, but are strongly correlated with each other (r = �0.83). B0T for CFA, and A0F and B0T for CSS, have weak correlation with other parameters, but almost all other paramete rs are strong correlate d (jrj 2 (0.8–1)). These observations indicate that all parameters are possible indicators for the characterizati on of the behaviors of blended cement pastes under F–T action.
Table 5Parameters AT ;BT ;A
0T and B0T evaluated from Eq. (3) in the thawing stage of different F–T cycles for OPC, CSF, CFA, CFBS and CSS.
F–T cycle OPC CSF CFA CBFS CSS
1st AT[BT] �0.007[3.039] �0.029[3.234] �0.029[2.746] �0.017[2.549] �0.076[2.995]A0T B0T� � �0.166[2.974] ⁄⁄ �0.163[2.779] �0.141[2.384] �0.145[3.057]
2nd AT[BT] �0.013[3.145] �0.033[3.312] �0.025[2.769] �0.021[2.599] �0.051[2.943]A0T B0T� � �0.144[3.024] ⁄⁄ �0.147[2.752] �0.133[2.363] �0.139[3.011]
3rd AT[BT] �0.014[3.199] �0.020[3.335] �0.020[2.783] �0.019[2.626] �0.036[2.922]A0T B0T� � �0.102[3.075] ⁄⁄ �0.133[2.715] �0.118[2.377] �0.122[2.973]
4th AT[BT] �0.017[3.264] ⁄⁄ �0.018[2.817] �0.016[2.666] �0.022[2.925]A0T B0T� � ⁄⁄ ⁄ ⁄ �0.127[2.674] �0.104[2.402] �0.113[2.944]
5th AT[BT] �0.015[3.286] ⁄⁄ �0.016[2.832] �0.018[2.685] �0.024[2.949]A0T B0T� � ⁄⁄ ⁄ ⁄ �0.117[2.712] �0.096[2.448] �0.110[2.953]
6th AT[BT] �0.014[3.298] ⁄⁄ �0.012[2.906] �0.009[2.769] �0.011[2.996]A0T B0T� � ⁄⁄ ⁄ ⁄ �0.078[2.740] �0.062[2.544] �0.078[2.924]
⁄ Undetectable data.
Fig. 10. Actions of ice formation and melting during a F–T cycle.
484 Z. Wang et al. / Construction and Building Materials 44 (2013) 477–486
Author's personal copy
5. Conclusion
1. The present paper presents the characterization of blended cement pastes under freeze–thaw loading employing an electri- cal resistivity method. Hardened cement pastes blended with silica fume, fly ash, ground granulated blast furnace slag and steel slag were measured. The direct-current electrical resistiv- ity of blended cement pastes was measured and analyzed .
2. By means of logarithm plotting the electrical resistivity against temperature , the depercolati on points and ice crystallizing points during freezing, and the repercolation points and ice melting points during thawing were determined. Both the crys- tallizing temperature (hf) and depercolation temperature (hDPT)increase with the freeze–thaw (F–T) cycle number, whereas both the melting temperature (hm) and repercolation tempera- ture (hRPT) decrease with F–T cycle number, revealing the water redistribution under F–T action.
3. Both the plots before and after crystallizati on points during freezing, and those before and after melting points during thawing obey the relation r = 10 Ah+B. The paramete rs A and Bbefore and after ice formatio n/melting during freezing/thawi ng are evaluated. They are found to be correlated with material properties. The Pearson correlation method was used to assess the coefficients of correlation among the parameters. For each
material, most Pearson correlation coefficients were distributed in the interval of 0.8–1, showing strong linear correlation. The proposed approach may provide an alternative method to characteri ze a CBM.
Acknowled gement
The authors acknowledge the financial support from China na- tional major fundamenta l research grant (973 Program, Nos. 2009CB623 106 and 2012CB724602). Dr. Qiang ZENG also thanks the General financial grant from the China Postdoctoral Science Foundati on (No. 2012M520288).
References
[1] Daily W, Ramirez A, LaBrecque D, Nitao J. Electrical resistivity tomography of vadose water movement. Water Resour Res 1992;28(5):1429–42.
[2] Perria MT, Cassiania G, Gervasiob I, Deianaa R, Binley A. A saline tracer test monitored via both surface and cross-borehole electrical resistivity tomography: comparison of time-lapse results. J Appl Geophys 2012;79:6–16.
[3] Gehre M, Kluth T, Lipponen A, Jin B, Sepp anen A, Kaipio JP, et al. Sparsity reconstruction in electrical impedance tomography: an experimental evaluation. J Comput Appl Math 2012;236(8):2126–36.
[4] Rimpilainen V, Heikkinen LM, Vauhkonen M. Moisture distribution and hydrodynamics of wet granules during fluidized-bed drying characterized
Table 6Pearson coefficients of correlation among Rmin, hDPT ; hRPT ; hFT ; hMT ;AF ;BF ;A
0F ;B
0F ;AT ;BT ;A
0T and B0T for OPC (CFA)[CBFS]{CSS}.a
Z. Wang et al. / Construction and Building Materials 44 (2013) 477–486 485

Author's personal copy
with volumetric electrical capacitance tomography. Chem Eng Sci 2012;75:220–34.
[5] Fabbri A, Fen-Chong T, Coussy O. Dielectric capacity, liquid water content, and pore structure of thawing–freezing materials. Cold Reg Sci Technol 2006;44:52–66.
[6] McLachlan DS, Blaszkiewicz M, Newnham RE. Electrical resistivity of composites. J Am Ceram Soc 1990;73(8):2187–203.
[7] Li Z, Wei X, Li W. Preliminary interpretation of Portland cement hydration process using resistivity measurements. ACI Mater J 2003;100(3):253–7.
[8] Xiao L, Li Z. Early-age hydration of fresh concrete monitored by non-contact electrical resistivity measurement. Cem Concr Res 2008;38:312–9.
[9] Wei X, Li Z. Study on hydration of Portland cement with fly ash using electrical measurement. Mater Struct 2005;38:411–7.
[10] El-Enein SAA, Kotkata MF, Hanna GB, Saad M, El Razek MMA. Electrical conductivity of concrete containing silica fume. Cem Concr Res 1995;25(8):1615–20.
[11] Cao JY, Chung DDL. Damage evolution during freeze–thaw cycling of cement mortar, studied by electrical resistivity measurement. Cem Concr Res 2002;32:1657–61.
[12] Chung DDL. Damage in cement-based materials, studied by electrical resistance measurement. Mater Sci Eng R 2003;42:1–40.
[13] Cao JY, Chung DDL. Defect dynamics and damage of concrete under repeated compression, studied by electrical resistance measurement. Cem Concr Res 2001;31:1639–42.
[14] Feldman RF, Prudencio LR, Chan G. Rapid chloride permeability test on blended cement and other concretes: correlations between charge, initial current and conductivity. Constr Build Mater 1999;13(3):149–54.
[15] Shi C. Effect of mixing proportions of concrete on its electrical conductivity and the rapid chloride permeability test (ASTM C1202 or ASSHTO T277) results. Cem Concr Res 2004;34(3):537–45.
[16] Banthia N, Djeridane S, Pigeon M. Electrical resistivity of carbon and steel micro-fiber reinforced cements. Cem Concr Res 1992;22(5):804–14.
[17] Che n PW, Chung DD L. Car bo n fiber re in force d co ncr et e for sma rt st ru ctu re sca pab le of non-de str uct ive flaw de tec ti on. Sm ar t Ma te r St ruc t 19 93; 2: 22 –30 .
[18] Powers TC. The air requirement of frost-resistant concrete. Highw Res Board Bull 1949;29:184–211.
[19] Scherer GW. Crystallization in pores. Cem Concr Res 1999;29:1347–58.[20] Setzer MJ. Micro-ice-Lens formation in porous solid. J Colloid Interf Sci
2001;243:193–201.[21] Jacobsen S. Liquid uptake mechanisms in wet freeze/thaw: review and
modelling. In: Janssen DJ, Setzer MJ, Snyder MB, editors. RILEM Proceedings PRO 25, Cachan, France; 2002. p. 41–51.
[22] Monfore GE. The electrical resistivity of concrete. J PCA Res Dev Lab 1968;10(1):35–47.
[23] Taylor HFW. Cement chemistry. London: Thomas Telforrd Service Ltd.; 1997. [24] Zhou Q, Glasser F. Thermal stability and decomposition mechanisms of
ettringite at <120 �C. Cem Concr Res 2001;31(9):1333–9.[25] Hover KC. The influence of water on the performance of concrete. Constr Build
Mater 2011;25(7):3003–13.[26] Polder R, Andrade C, Elsener B, Vennesland O, Gulikers J, Weidert R, et al. Test
methods for on site measurement of resistivity of concrete. Mater Struct 2000;33(10):603–11.
[27] Allen AJ, Livingston RA. Relationship between differences in silica fume additives and fine-scale microstructural evolution in cement based materials. Adv Cement Based Mater 1998;8(3–4):118–31.
[28] Gleize PJP, Müller A, Roman HR. Microstructural investigation of a silica fume–cement–lime mortar. Cem Concr Compos 2003;25(2):171–5.
[29] Bentz DP, Jensen OM, Coats AM, Glasser FP. Influence of silica fume on diffusivity in cement-based materials: I. Experimental and computer modeling studies on cement pastes. Cem Concr Res 2000;30(6):953–62.
[30] Zeng Q, Li K, Fen-Chong T, Dangla P. Pore structure characterization of cement pastes blended with high-volume fly-ash. Cem Concr Res 2012;42:194–204.
[31] Mehta PK, Monteiro PJM. Concrete, microstructure, properties and materials. London: McGraw-Hill; 2006.
[32] Wilson PW, Heneghan AF, Haymet ADJ. Ice nucleation in nature: supercooling point (SCP) measurements and the role of heterogeneous nucleation. Crobiology 2003;46:88–98.
[33] Grübl P, Stokin A. Rapid ice formation in hardened cement paste, mortar and concrete due to supercooling. Cem Concr Res 1980;10:333–45.
[34] Bishnoi S, Uomoto T. Strain-temperature hysteresis in concrete under cyclic freeze–thaw conditions. Cem Concr Compos 2008;30:374–80.
[35] Katz AZ, Thompson AJ. Quantitative prediction of permeability in porous rock. Phy Rev B 1985;34:8179–85.
[36] Sun Z, Scherer GW. Pore size and shape in mortar by themoporosimetry. Cem Concr Res 2010;40(5):740–951.
[37] Coussy O. Poromechanics of freezing materials. J Mech Phys Solids 2005;53:1689–718.
[38] Zeng Q, Fen-Chong T, Dangla P, Li K. A study of freezing behaviour of cementitious materials by poromechanical approach. Int J Solids Struct 2011;48:3267–73.
486 Z. Wang et al. / Construction and Building Materials 44 (2013) 477–486
Administrator
高亮
Administrator
高亮