Phase development in conventional and active belite cement pastes by Rietveld analysis and chemical...
10
Phase development in conventional and active belite cement pastes by Rietveld analysis and chemical constraints Antonio J.M. Cuberos a , Ángeles G. De la Torre a , M. Carmen Martín-Sedeño a , Laureano Moreno-Real a , Marco Merlini b , Luis M. Ordónez c , Miguel. A.G. Aranda a, ⁎ a Departamento de Química Inorgánica, Universidad de Málaga, 29071 Málaga, Spain b European Synchrotron Radiation Facility, ESRF, BP220 F-38043 Grenoble, France c Unidad Técnica de Investigación de Materiales, AIDICO, Avda. Benjamín Franklin, 17 Paterna, Valencia, Spain abstract article info Article history: Received 11 January 2009 Accepted 11 June 2009 Keywords: Alkali activated cement Hydration products X-ray diffraction Quantitative phase analysis High belite cements may be an alternative to reduce CO 2 emissions. Although CO 2 emissions may be depleted up to 10%, unfortunately, the hydration reactivity of belite phases is slow which leads to low mechanical strengths at early ages. In order to enhance their hydraulic reactivity, the activation of these cements by doping with alkaline oxides has been proposed. Here, we have synthesised a laboratory belite clinker without activation (47 wt.% of β- C 2 S and 19 wt.% of α H ′-C 2 S) and two alkaline oxide activated clinkers (one with 13 wt.% of β-C 2 S, 24 wt.% of α H ′- C 2 S and 19 wt.% of α-C 2 S; and the second with 12 wt.% of β-C 2 S, 42 wt.% of α H ′-C 2 S and 5 wt.% of α-C 2 S). We have also developed a methodology to analyse quantitatively the phase evolution of cement pastes and we have applied it to these high belite cements. Rietveld quantitative phase analysis of synchrotron X-ray powder diffraction data, together with chemical constraints, is used to determine the phase development up to 1 year of hydration in the belite cement pastes. β-C 2 S almost does not react during the first 3 months, meanwhile α H ′-C 2 S reacts on average more than 50% in the same period. Moreover, the degree of reaction of α-C 2 S is slightly larger (on average about 70% after three months) than that of α H ′-C 2 S. Full phase analyses are reported and discussed including the time evolution of amorphous phases and free water. © 2009 Elsevier Ltd. All rights reserved. 1. Introduction High belite cements (HBCs) were proposed as an alternative to deplete CO 2 emissions in the cement production process [1–4]. Cement nomenclature will be used hereafter, i.e. C=CaO, S=SiO 2 , A=Al 2 O 3 , F=Fe 2 O 3, S ̄ = SO 3 , C ̄ = CO 2 and H=H 2 O. These cements contain more than 50wt.% of C 2 S, also named belite. HBCs need less calcium than ordinary Portland cements (OPCs), releasing ∼ 0.50 tons of CO 2 per ton of clinker, instead of 0.54 tons of CO 2 . Furthermore, the optimum clinkerization temperature for HBCs production is roughly 100 ºC lower than that for OPCs, which also reduce CO 2 emissions from fuel burning [5]. However, HBCs are more difficult to mill and, chiefly, their slow reactivity leads to low mechanical strengths at early ages. In order to overcome these drawbacks, activation of these materials is highly desirable [6–9]. Most of these attempts to enhance HBCs hydraulic reactivity have concerned the stabilization of high-temperature poly- morphs of C 2 S (i.e. α forms) at room temperature which are more reactive [10–12]. Recently, the clinkerization process of these materials and the role of minor elements were investigated in-situ by SXRPD [13]. On the other hand, X-ray powder diffraction (XRPD) is the appro- priate technique to identify and quantify the crystalline phase(s) in mixtures. Applied research in this field has sky-rocketed by applying the Rietveld methodology [14] to XRPD data in order to obtain quantitative phase analyses (QPA). Examples of these research is the QPA of anhydrous cement materials [15–18], including the quantifica- tion of the amorphous fraction by adding a suitable standard [19,20].A step forward is the quantification of the hydration processes of cements using XRPD and the Rietveld method [21]. However, cement hydration process is very complex and the application of Rietveld methodology is not straightforward. Anhydrous cement may contain more than five crystalline components [22], i.e. Ca 3 SiO 5 or C 3 S, Ca 2 SiO 4 or C 2 S, Cement and Concrete Research 39 (2009) 833–842 ⁎ Corresponding author. Tel.: +34 952131874; fax: +34 952132000. E-mail address: [email protected] (M.A.G. Aranda). Table 1 Nominal dosages of clinkers, expressed as oxide, in weigh percent. CaO SiO 2 Al 2 O 3 Fe 2 O 3 K 2 O Na 2 O MgO TiO 2 SrO SO 3 P 2 O 5 B_ref 62.81 25.00 6.34 5.23 0.27 0.13 0.07 0.01 0.09 0.01 0.04 B_1.5Na 61.97 24.65 6.25 5.15 0.26 1.50 0.07 0.01 0.09 0.01 0.04 B_1S1NK 61.44 24.19 6.13 5.05 1.01 1.00 0.06 0.01 0.08 1.00 0.03 0008-8846/$ – see front matter © 2009 Elsevier Ltd. All rights reserved. doi:10.1016/j.cemconres.2009.06.017 Contents lists available at ScienceDirect Cement and Concrete Research journal homepage: http://ees.elsevier.com/CEMCON/default.asp
Transcript of Phase development in conventional and active belite cement pastes by Rietveld analysis and chemical...
Cement and Concrete Research 39 (2009) 833–842
Contents lists available at ScienceDirect
Cement and Concrete Research
j ourna l homepage: ht tp: / /ees.e lsev ie r.com/CEMCON/defau l t .asp
Phase development in conventional and active belite cement pastes by Rietveldanalysis and chemical constraints
Antonio J.M. Cuberos a, Ángeles G. De la Torre a, M. Carmen Martín-Sedeño a, Laureano Moreno-Real a,Marco Merlini b, Luis M. Ordónez c, Miguel. A.G. Aranda a,⁎a Departamento de Química Inorgánica, Universidad de Málaga, 29071 Málaga, Spainb European Synchrotron Radiation Facility, ESRF, BP220 F-38043 Grenoble, Francec Unidad Técnica de Investigación de Materiales, AIDICO, Avda. Benjamín Franklin, 17 Paterna, Valencia, Spain
⁎ Corresponding author. Tel.: +34 952131874; fax: +E-mail address: [email protected] (M.A.G. Aranda).
0008-8846/$ – see front matter © 2009 Elsevier Ltd. Adoi:10.1016/j.cemconres.2009.06.017
a b s t r a c t
a r t i c l e i n f oArticle history:Received 11 January 2009Accepted 11 June 2009
Keywords:Alkali activated cementHydration productsX-ray diffractionQuantitative phase analysis
High belite cements may be an alternative to reduce CO2 emissions. Although CO2 emissionsmay be depleted upto 10%, unfortunately, the hydration reactivity of belite phases is slowwhich leads to lowmechanical strengths atearly ages. In order to enhance their hydraulic reactivity, the activation of these cements by doping with alkalineoxides has beenproposed. Here, we have synthesised a laboratory belite clinker without activation (47 wt.% of β-C2S and 19 wt.% ofαH′-C2S) and two alkaline oxide activated clinkers (one with 13wt.% of β-C2S, 24wt.% of αH′-C2S and 19wt.% ofα-C2S; and the secondwith 12wt.% of β-C2S, 42wt.% ofαH′-C2S and 5wt.% ofα-C2S). We havealso developed a methodology to analyse quantitatively the phase evolution of cement pastes and we haveapplied it to these high belite cements. Rietveld quantitative phase analysis of synchrotron X-ray powderdiffraction data, together with chemical constraints, is used to determine the phase development up to 1 year ofhydration in the belite cement pastes. β-C2S almost does not react during the first 3 months, meanwhileαH′-C2Sreacts on average more than 50% in the same period. Moreover, the degree of reaction of α-C2S is slightly larger(on average about 70% after three months) than that of αH′-C2S. Full phase analyses are reported and discussedincluding the time evolution of amorphous phases and free water.
© 2009 Elsevier Ltd. All rights reserved.
Table 1Nominal dosages of clinkers, expressed as oxide, in weigh percent.
CaO SiO2 Al2O3 Fe2O3 K2O Na2O MgO TiO2 SrO SO3 P2O5
1. Introduction
High belite cements (HBCs) were proposed as an alternative todeplete CO2 emissions in the cement production process [1–4]. Cementnomenclature will be used hereafter, i.e. C=CaO, S=SiO2, A=Al2O3,F=Fe2O3, S̄=SO3, C̄=CO2 and H=H2O. These cements contain morethan 50wt.% of C2S, also named belite. HBCs need less calcium thanordinary Portland cements (OPCs), releasing ∼0.50 tons of CO2 per tonof clinker, instead of 0.54 tons of CO2. Furthermore, the optimumclinkerization temperature for HBCs production is roughly 100 ºC lowerthan that for OPCs, which also reduce CO2 emissions from fuel burning[5]. However, HBCs are more difficult to mill and, chiefly, their slowreactivity leads to low mechanical strengths at early ages. In order toovercome these drawbacks, activation of these materials is highlydesirable [6–9]. Most of these attempts to enhance HBCs hydraulicreactivity have concerned the stabilization of high-temperature poly-morphs of C2S (i.e. α forms) at room temperature which are morereactive [10–12]. Recently, the clinkerization process of these materialsand the role of minor elements were investigated in-situ by SXRPD [13].
34 952132000.
ll rights reserved.
On the other hand, X-ray powder diffraction (XRPD) is the appro-priate technique to identify and quantify the crystalline phase(s) inmixtures. Applied research in this field has sky-rocketed by applyingthe Rietveld methodology [14] to XRPD data in order to obtainquantitative phase analyses (QPA). Examples of these research is theQPA of anhydrous cement materials [15–18], including the quantifica-tion of the amorphous fraction by adding a suitable standard [19,20]. Astep forward is the quantification of the hydration processes of cementsusing XRPD and the Rietveld method [21]. However, cement hydrationprocess is very complex and the application of Rietveld methodology isnot straightforward. Anhydrous cement may contain more than fivecrystalline components [22], i.e. Ca3SiO5 or C3S, Ca2SiO4 or C2S,
B_ref 62.81 25.00 6.34 5.23 0.27 0.13 0.07 0.01 0.09 0.01 0.04B_1.5Na 61.97 24.65 6.25 5.15 0.26 1.50 0.07 0.01 0.09 0.01 0.04B_1S1NK 61.44 24.19 6.13 5.05 1.01 1.00 0.06 0.01 0.08 1.00 0.03

834 A.J.M. Cuberos et al. / Cement and Concrete Research 39 (2009) 833–842
Ca4Al2Fe2O10 or C4AF, Ca3Al2O6 or C3A and gypsum (CaSO4·2H2O orCS̄H2). Anhydrous cements may also contain a non-negligible amor-phous fraction depending on the cement type [20,23]. During the firsthours of hydration, aluminates will react with sulphate carriers, forinstance, C3A with gypsum. Ettringite [Ca3Al(OH)6·12H2O]2(SO4)3·2
Fig. 1. Illustrations of the SXRPD experimental setups. a) Translating mode and b) 2D f
(H2O) or C6A S̄3H32] (aka Aft) is formed from this first reaction. Silicatephases also react with water to give an amorphous phase (C–S–H gel)and crystalline Ca(OH)2 (or CH or Portlandite). However, C3S reactswith water muchmore rapidly than C2S does [22,24]. Depending on themineralogical composition of the cement, other chemical reactions take
ull pattern. On the right, the scanned images recorded at the image plate detector.

Table 2Final phase assemblage for the prepared clinkers and bibliographic information andICSD collection codes for all crystalline phases.
CB_ref/wt.%
CB_1.5Na/wt.%
CB_1S1NK/wt.%
Bibliog. ref. ICSD code
α-C2S – 18.7(2) 4.8(1) [37] 81099αH′-C2S 18.5(2) 23.7(3) 41.7(2) [37] 81097β-C2S 46.7(1) 13.0(1) 11.9(3) [37] 81096C3S 13.2(2) 22.4(1) 17.6(1) [38] 94742C3A 10.4(1) 13.0(2) 13.3(1) [39] 1841C4AF 11.5(1) 9.2(1) 10.7(1) [40] 9197CS̄H2 [41] 151692AFt [42] 155395CH [43] 15471AFm-type [44] 100138C2AH8 See text –
Tobermorite [45] 152489CC ̄ [46] 157997
835A.J.M. Cuberos et al. / Cement and Concrete Research 39 (2009) 833–842
place. From a chemical point of view, the amount and chemical natureof hydration products (crystalline and amorphous) and the amount offree water will determine final performances of the cement paste. Thus,great efforts have been made to develop analytical tools to quantifythese processes. Rietveld analysis results are given as the sum of thephases present normalized to 100% of the crystalline fraction. Therefore,the structural description of all the phases present must be known toperform accurate quantitative phase analysis using Rietveld methodol-ogy. If amorphous or non-published structural description or un-knownphases are present, this methodology needs the combination of otherstrategies. An internal standard is usually added prior to hydration inorder to quantify the amorphous phases appearing in the process[21,25].
A second step forward in the Rietveld QPA of hydration of cementpastes is the use of chemical constraints. This methodology is used inorder to normalize the phase analysis taking into accountwater boundto crystalline phases, amorphous fractions and free water [26,27].Furthermore, hydration process is time dependent so the use ofsynchrotron radiation is very valuable. The initial works were energy-dispersive [28] but these studies have low d-spacing resolution(meanwhile, high d-spacing resolution is needed for analysingquantitatively complex mixtures). However, the new detectors, i.e.area detectors, let to perform in-situ diffraction experiments with verygood angular and time-resolutions [29,30]. Therefore, the third stepforward is being the use of constant-wavelength in-situ synchrotronXRPD (SXRPD) working on transmission geometry which overcomesmost of the drawbacks of both laboratory X-ray diffraction and neutrondiffraction. Highly energetic synchrotron X-rays allow to analyse a bulksample enhancing particle statistics even on a short time scale.Conversely, neutron studies have low d-spacing resolution and requirethe use of D2O to reduce incoherent scattering, the effect of D2O oncement hydration chemistry being known to be significant [31].
The main aim of this work is to study in-situ the hydration of activebelite cement pastes by Rietveld methodology using constant-wavelength SXRPD data and chemical constraints. The main outcomesare the characterization of the different hydration behaviour of thestabilized C2S polymorphs. Finally, the different hydration reactionsare reported and correlated with calorimetric data.
2. Experimental section
2.1. Synthesis of belite clinkers
Clinkers preparation methodology has been previously reported[8,9]. Table 1 gives the nominal dosages expressed as oxides, andnominalmineralogical compositions, of the three compositions selectedto perform this study. One clinker is used as a reference material as it isnot activated, hereafter B_ref. The other two clinkers, B_1.5Na andB_1S1NK contain different amounts of activators, i.e. Na2O and/or K2Oand/or SO3, indicated in bold in Table 1. The final elemental compositionand phase assemblage of these clinkers were previously reported [8,9].
2.2. Preparation of high belite cements
Pure gypsumwas added to clinkers to obtain cements. The amountof gypsumwas determined by the methodology reported in reference[32]. This author made a study about the optimum amount of gypsumto be added to make cement as a function of alkaline oxides, andreported the following equation:
SO3 ¼ 0:093� C3A þ 1:7105� Na2O þ 0:9406� K2O þ 1:228
Where SO3, Na2O, K2O stand for weight percentages of these elementsexpressed as oxides and C3A stands for weight percentage of thisphase calculated with Bogue equations [33]. Hence, 5.5wt.% wasadded to B_ref and 9.4wt.% to B_1.5Na and B_1S1NK. The cements
weremilled to have similar Blaine fineness parameters 4160, 4450 and4320 cm2/g, respectively. Hereafter, the cements will be namedCB_ref, CB_1.5Na and CB_1S1NK.
2.3. In-situ synchrotron X-ray powder diffraction hydration data collection
In-situ SXRPD hydration study was performed in BM08 (GILDA)beamline at the European Synchrotron Radiation Facility, (ESRF,Grenoble, France). Diffraction data were collected with a parallelbeam in Debye–Scherrer geometry (transmission) by using awavelength of 0.68888 Å, determined using FIT2D [34] and the NBS-640b Si standard, a=5.43094(4) Å. An image plate (IP) detector [35]was used working in two configurations: i) translating modecollecting a small section of the 2D pattern; and ii) 2D full pattern.The translating image platemode is carried out in order to follow up to4 h of hydration with good time resolution. The IP moves behind twoslits with a constant speed and the diffraction pattern is recorded as afunction of time, see Fig. 1a. The slits select a vertical slice of thediffraction rings. The translation speed and the slit size can be chosento fit the experimental (resolution) requirements. The distance fromIP to the sample was 217.0 mm. CB_ref and CB_1.5Na have beenmeasured during the first 4 h using this strategy. The secondmode, 2Dfull pattern, was used for later ages (i.e. more than 4 h), where the slitsare removed yielding whole diffraction rings in 5 min, see Fig. 1b.Several patterns at different hydration ages were obtained for thethree cements. The images recorded (in both configurations) in the IPdetector were recovered using a Fuji BAS2500 laser scanner (16 bit/pixel with a minimum pixel size of 50×50 μm). The SXRPD patternsobtained in translating mode were extracted in 5 min slices usingoriginal software available at BM08. 49 patterns were obtained forCB_ref and CB_1.5Na. Powder patterns from 2D images were obtainedby integration of the IP using FIT2D software [34].
Pastes were prepared ex-situ by mixing the cements with waterwith aw/c ratio of 0.5. Pastes were immediately loaded in a cylindricalpolycarbonate sample holder (15.0 mm diameter×1.2 mm height)and covered with Kapton slices on both sides. The sample holder wasgently spun during data collection, see Fig. 1, to improve the particlestatistics and hence to obtain good QPA. The temperature within theexperimental hutch was 20±2 ºC.
2.4. Rietveld quantitative phase analysis, RQPA
SXRPD patterns were analyzed by the Rietveld method with X'PertHighscore Plus software (PANalytical B.V., version 2.2c). Peak shapeswere fitted by using the Voigt function [36]. This methodology requiresthe structural descriptions for all crystalline phases. Table 2 gives the

Fig. 2. Low angle region of the time-resolved SXRPD data for belite cement hydrationduring the first 4 h. The intensity of ettringite main diffraction peak (labeled with ⁎)increases with time, meanwhile the intensity of the main peak of gypsum (highlightedwith a dashed line) decreases.
836 A.J.M. Cuberos et al. / Cement and Concrete Research 39 (2009) 833–842
references and ICSD collection codes for all structural descriptions usedin this study. Backgrounds were manually established using the basepoint tool of the software. The refined overall parameters were: cellparameters, zero-shift error, W (Gaussian contribution) peak shape
Table 3Direct Rietveld QPA results for the hydration of CB_ref cement paste.
t0 t0.3 t1 t1.5 t2.3 t17
0 h 0.3 h 1 h 1.5 h 2.3 h 17 h
β-C2S 44.1(1) 47.5(5) 47.4(5) 47.0(5) 47.2(5) 48.6(4)αH′-C2S 17.5(2) 12.1(4) 12.0(4) 12.2(4) 11.9(4) 13.3(4)α-C2S – – – – – –
C3S 12.5(2) 14.9(3) 14.7(3) 14.8(3) 14.7(3) 8.1(3)C3A 9.5(1) 7.1(3) 6.9(3) 7.3(3) 7.0(3) –
C4AF 10.9(1) 10.7(2) 10.6(2) 10.5(2) 10.4(2) 10.4(2)CS ̄H2 5.5(–) 4.6(2) 4.1(2) 3.5(2) 3.6(2) –
AFt – 3.1(2) 4.3(2) 4.7(2) 5.3(2) 10.9(3)CH – – – – – 3.4(1)AFm-12 – – – – – 0.7(1)AFm-14 – – – – – 3.1(2)AFm-ss – – – – – 0.9(1)C2AH8 – – – – – 0.7(1)Tobermorite – – – – – –
AH3 – – – – –
CC ̄ – – – – – –
Table 4Direct Rietveld QPA results for the hydration of CB_1.5Na cement paste.
t0 t0.3 t1 t2 t4 t25
0.0 h 0.3 h 1 h 2 h 4 h 25 h
β-C2S 11.8(1) 13.8(5) 13.9(5) 15.2(5) 15.8(5) 18.3αH′-C2S 21.5(3) 24.4(6) 24.1(6) 24.2(5) 23.7(5) 20.6α-C2S 16.9(2) 14.1(4) 13.5(4) 13.3(4) 13.6(4) 10.3C3S 20.3(1) 16.6(4) 16.7(4) 16.3(3) 16.1(3) 5.3(C3A 11.9(2) 11.2(5) 11.4(5) 9.3(3) 8.9(3) 4.5(C4AF 8.3(1) 7.0(3) 7.1(3) 7.5(2) 7.7(2) 6.6(CS ̄H2 9.4(–) 8.3(2) 7.5(2) 7.4(2) 7.1(2) –
AFt – 4.6(2) 5.9(2) 6.8(2) 7.1(2) 27.7CH – – – – – 3.3(AFm-12 – – – – – 0.4(AFm-ss – – – – – 2.9(Tobermorite – – – – – –
CC ̄ – – – – – –
parameter and phase fractions. W value for β-C2S, αH′ -C2S and α-C2Swere constraint to be the same. The atomic parameters (positions,thermal factors and occupation factors) were not refined.
2.5. Isothermal calorimetric study
The isothermal calorimetric studywasperformed in aneight channelThermal Activity Monitor (TAM) instrument using glass ampoules.Pastes were prepared with a w/c ratio of 0.5, and the heat flow wascollected up to 144 h at 20 ºC.
3. Results and discussion
3.1. Rietveld quantitative phase analysis using SXRPD data
Fig. 2 shows time-resolved SXRPD patterns for CB_ref collected ontranslating mode during the first 4 h (49 patterns×5 min/pattern).Belite-cement hydration kinetic is slow, thus, small changes areobserved at very early ages and phase assemblage is almost constantduring the first 4 h of hydration. Thus, only selected Rietveld QPAresults for the first 4 h of hydration are shown in Tables 3 and 4. Theremaining QPA results shown in Tables 3–5 have been obtained from2D full patterns. Quantitative phase analyses were performed usingthe structural descriptions given in Table 2. However, these resultsneed to be normalized as amorphous phases are appearing, andfurthermore, free water is bounding to crystalline and amorphousphases. For instance, these reactions cause β-C2S fraction to increase‘apparently’ during hydration, see Tables 3–5, as the full phase
t23 t43 t67 t90 t114 t2300 t8760
23 h 43 h 67 h 90 h 114 h 2300 h 8760 h
48.5(5) 49.3(5) 52.7(5) 54.9(5) 55.2(5) 57.5(5) 49.5(4)14.2(4) 13.5(4) 11.2(4) 10.3(4) 11.2(4) 11.5(4) 9.5(4)– – – – – – –
7.6(3) 7.0(4) 4.5(3) 3.8(3) – – –
– – – – – – –
9.3(2) 8.6(2) 8.0(2) 8.0(2) 8.1(2) 7.8(2) 8.5(2)– – – – – – –
11.2(3) 10.0(3) 9.6(3) 8.8(3) 8.6(3) 7.1(3) 7.3(4)3.3(1) 4.4(1) 5.1(2) 4.6(1) 4.8(2) 5.4(2) 1.5(1)0.8(1) 0.7(1) 0.9(1) 3.0(2) 4.7(2) 4.4(2) 2.7(2)3.2(2) 3.9(2) 4.6(2) 3.6(2) – – –
1.2(1) 1.9(1) 2.5(2) 3.0(2) 3.5(2) 2.8(2) 1.2(1)0.7(1) 0.7(1) 0.8(1) – – – –
– – – – 3.8(2) 3.6(3) 4.5(1)– – – – – – 0.8(2)– – – – – – 14.5(3)
t36 t60 t83 t107 t2300 t8760
36 h 60 h 83 h 107 h 2300 h 8760 h
(5) 18.2(5) 18.7(5) 21.2(5) 20.8(5) 23.4(6) 15.1(7)(5) 19.6(5) 19.4(5) 18.3(6) 18.0(5) 21.6(7) 17.4(7)(3) 9.2(3) 7.9(3) 8.3(3) 7.8(3) 11.1(4) 14.5(6)3) 3.5(3) 2.3(3) 2.5(3) 2.7(3) – –
3) 5.0(2) 3.3(2) 3.0(3) 2.8(2) – –
2) 5.5(2) 4.7(2) 5.2(2) 5.3(2) 5.6(2) 3.8(3)– – – – – –
(3) 26.4(3) 25.2(3) 23.2(4) 23.9(3) 17.9(4) 21.2(6)1) 3.8(1) 6.4(2) 6.7(2) 6.0(1) 7.6(2) 9.2(3)1) 1.4(1) 1.1(2) 1.0(2) 3.9(2) 6.5(2) 11.3(4)2) 3.9(2) 5.7(2) 5.6(2) 5.4(2) – 2.4(1)
3.4(3) 5.3(3) 5.3(4) 3.4(3) 6.2(4) 3.2(1)– – – – – 1.9(3)
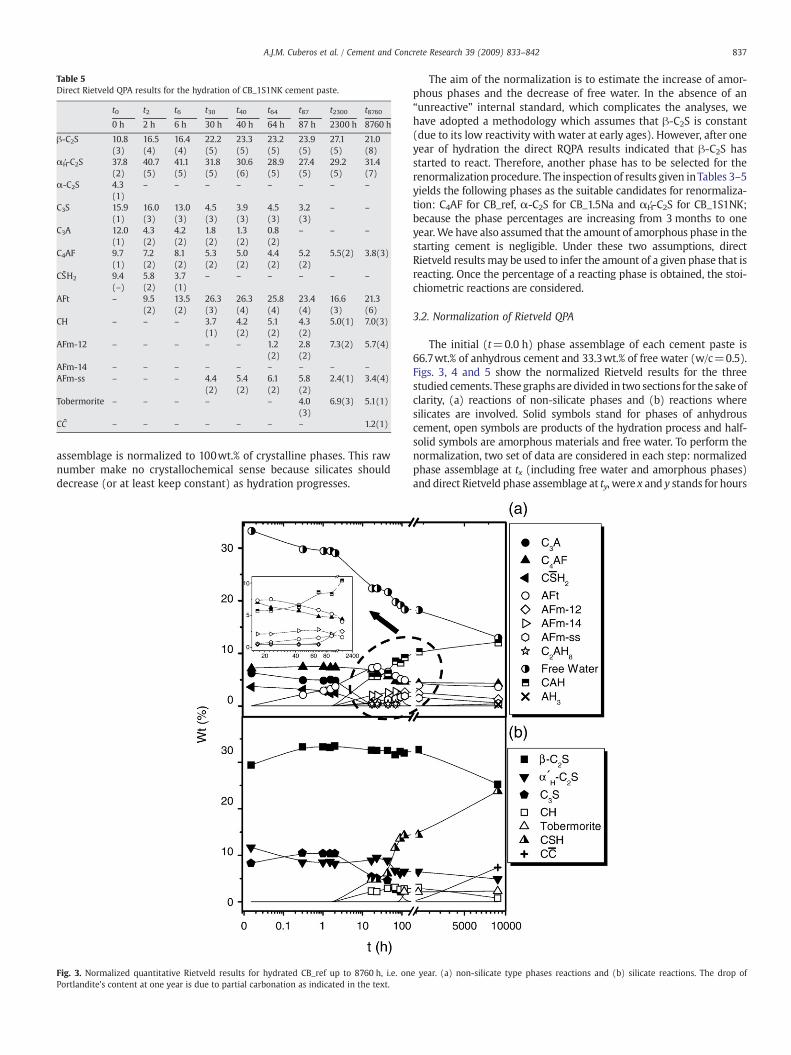
Table 5Direct Rietveld QPA results for the hydration of CB_1S1NK cement paste.
t0 t2 t6 t30 t40 t64 t87 t2300 t8760
0 h 2 h 6 h 30 h 40 h 64 h 87 h 2300 h 8760 h
β-C2S 10.8(3)
16.5(4)
16.4(4)
22.2(5)
23.3(5)
23.2(5)
23.9(5)
27.1(5)
21.0(8)
αH′-C2S 37.8(2)
40.7(5)
41.1(5)
31.8(5)
30.6(6)
28.9(5)
27.4(5)
29.2(5)
31.4(7)
α-C2S 4.3(1)
– – – – – – – –
C3S 15.9(1)
16.0(3)
13.0(3)
4.5(3)
3.9(3)
4.5(3)
3.2(3)
– –
C3A 12.0(1)
4.3(2)
4.2(2)
1.8(2)
1.3(2)
0.8(2)
– – –
C4AF 9.7(1)
7.2(2)
8.1(2)
5.3(2)
5.0(2)
4.4(2)
5.2(2)
5.5(2) 3.8(3)
CS ̄H2 9.4(–)
5.8(2)
3.7(1)
– – – – – –
AFt – 9.5(2)
13.5(2)
26.3(3)
26.3(4)
25.8(4)
23.4(4)
16.6(3)
21.3(6)
CH – – – 3.7(1)
4.2(2)
5.1(2)
4.3(2)
5.0(1) 7.0(3)
AFm-12 – – – – – 1.2(2)
2.8(2)
7.3(2) 5.7(4)
AFm-14 – – – – – – – – –
AFm-ss – – – 4.4(2)
5.4(2)
6.1(2)
5.8(2)
2.4(1) 3.4(4)
Tobermorite – – – – – 4.0(3)
6.9(3) 5.1(1)
CC̄ – – – – – – – 1.2(1)
837A.J.M. Cuberos et al. / Cement and Concrete Research 39 (2009) 833–842
assemblage is normalized to 100wt.% of crystalline phases. This rawnumber make no crystallochemical sense because silicates shoulddecrease (or at least keep constant) as hydration progresses.
Fig. 3. Normalized quantitative Rietveld results for hydrated CB_ref up to 8760 h, i.e. onPortlandite's content at one year is due to partial carbonation as indicated in the text.
The aim of the normalization is to estimate the increase of amor-phous phases and the decrease of free water. In the absence of an“unreactive” internal standard, which complicates the analyses, wehave adopted a methodology which assumes that β-C2S is constant(due to its low reactivity with water at early ages). However, after oneyear of hydration the direct RQPA results indicated that β-C2S hasstarted to react. Therefore, another phase has to be selected for therenormalizationprocedure. The inspection of results given inTables 3–5yields the following phases as the suitable candidates for renormaliza-tion: C4AF for CB_ref, α-C2S for CB_1.5Na and αH′-C2S for CB_1S1NK;because the phase percentages are increasing from 3 months to oneyear.We have also assumed that the amount of amorphous phase in thestarting cement is negligible. Under these two assumptions, directRietveld results may be used to infer the amount of a given phase that isreacting. Once the percentage of a reacting phase is obtained, the stoi-chiometric reactions are considered.
3.2. Normalization of Rietveld QPA
The initial (t=0.0 h) phase assemblage of each cement paste is66.7wt.% of anhydrous cement and 33.3wt.% of free water (w/c=0.5).Figs. 3, 4 and 5 show the normalized Rietveld results for the threestudied cements. These graphs are divided in two sections for the sake ofclarity, (a) reactions of non-silicate phases and (b) reactions wheresilicates are involved. Solid symbols stand for phases of anhydrouscement, open symbols are products of the hydration process and half-solid symbols are amorphous materials and free water. To perform thenormalization, two set of data are considered in each step: normalizedphase assemblage at tx (including free water and amorphous phases)and direct Rietveld phase assemblage at ty, were x and y stands for hours
e year. (a) non-silicate type phases reactions and (b) silicate reactions. The drop of

Fig. 4. Normalized quantitative Rietveld results for hydrated CB_1.5Na up to 8760 h, i.e. one year. (a) non-silicate type phases reactions and (b) silicate reactions.
838 A.J.M. Cuberos et al. / Cement and Concrete Research 39 (2009) 833–842
of hydration and always xby. Normalized t0 phase assemblage for all thecements are shown in Figs. 3, 4 and 5. For example, to obtain normalizedQPA at t0.3 of CB_ref, normalized QPA at t0 (the previous time) is used.Thus, normalized phase assemblage at t0 is: 29.4wt.% of β-C2S, 11.7wt.%of αH′-C2S, 8.3wt.% of C3S, 6.3wt.% of C3A, 7.2wt.% of C4AF, 3.7wt.% ofgypsum and 33.3wt.% of free water. On the other hand, t0.3 directRietveld results are given in Table 3. Analysing the data, it can beconcluded that only ettringite (AFt) is appearing according to thefollowing reaction (1):
C3A þ 3CS̄H2 þ 26H→ C6AS ̄3H32: ð1Þ
Thus, the amount of C3A reacting has to be calculated as followed:
β� C2Sðt0:3ÞRC3Aðt0:3ÞR
=β� C2Sðt0ÞNC3Aðt0ÞN−x
where β-C2S(t0.3)R and C3A(t0.3)R stand for Rietveld percentages ofthese phases at 0.3 h (Table 3), and β-C2S(t0)N and C3A(t0)N stand forpercentages of these phases at normalized t0, and x is the amount ofC3A reacting according to Eq. (1). In this example, x=1.9, thus theamount of water reacting is 3.5wt.%. Finally to normalize t0.3, directRietveld results are recalculated to include 29.8wt.% of freewater. Thisstrategy has to be followed to normalize each Rietveld QPA results, forthe three cements up to t8760. During the first hours, i.e. the inductionperiod, the main reaction is the formation of AFt.
The reactivity of C4AF, to form AFt phases, has been described [47]as follows(Eq. (2)):
C4AF + 4CSH2 +1063
H→43C6ðA0:75F0:25ÞS3H32 +
23FH3: ð2Þ
Although crystalline FH3 has not been identified by SXRPD, and it isnot possible to determine if AFt phase contains iron, the reactivity ofC4AF has also been inspected by the same strategy. The amount ofC4AF reacting at these times of hydration is negligible.
Figs. 3a, 4a and 5a showmineralogical evolution of phases involvedin reaction (1) as a function of time for CB_ref, CB_1.5Na andCB_1S1NK, respectively. The behaviour of AFt (open circle) at laterages will be discussed later. Fig. 6 shows the Rietveld plot of CB_ref att2.3, as an example of cement paste hydrated at early ages. Maindiffraction peaks of AFt, gypsum, C4AF, C3A, αH′-C2S and β-C2S areindicated.
After some hours of hydration, the acceleration period starts andsilicates begin to react [22], mainly C3S (Eq. (3)). The α-forms of C2Sreact with water (Eq. (4)) slower than C3S.
C3S þ 5:3H→ C1:7SH4 þ 1:3CH ð3Þ
C2S þ 4:3H→ C1:7SH4 þ 0:3CH ð4Þ
Reactions (3) and (4) give C1.7SH4, which is an amorphous gel, alsocalled C–S–H gel. The average composition, C1.7SH4, has been takenfrom [21], and it has been used to quantify the amorphous C–S–H gel

Fig. 5. Normalized quantitative Rietveld results for hydrated CB_1S1NK up to 8760 h, i.e. one year. (a) non-silicate type phases reactions and (b) silicate reactions.
839A.J.M. Cuberos et al. / Cement and Concrete Research 39 (2009) 833–842
that is appearing, and the diminution of water due to silicatehydration. Anhydrous C3S is present up to t90, t107 and t87 in CB_ref,CB_1.5Na and CB_1S1NK, respectively. To perform normalization, thesame strategy describe above has been used. Figs. 3b, 4b and 5b showthe evolution of silicate phases according to Eqs. (3) and (4).
In the acceleration period other reactions are taking place. Theformation of [Ca2Al(OH)6]2SO4·6(H2O) or C4AS̄H12 or AFm-12 phase,from C3A and AFt, is given in reaction (5):
2C3A þ C6AS̄3H32 þ 4H→ 3C4AS̄H12 ð5Þ
Kuzel [48] found an isostructural AFm-12 containing Fe3+.Recently, Meller et al. [49] have studied the C4AF hydration with andwithout gypsum. They described, that at certain experimentalconditions not only iron-AFt was formed but also an iron-AFm-typephase. Related to this iron-AFm-12 phase, the following reaction (6) isalso assumed to take place:
1:5C4AF þ C6AS̄3H32 þ 7H→ 3C4A0:5F0:5S ̄H12 þ AH3 ð6Þ
The formation of AFm-12 has been confirmed in the threecompositions studied. This phase has been quantified using thereported structural description [44]. We have used the crystallinephase ratios, similar to that expressed above, to elucidate thereactivity of C3A and C4AF to form AFm-12, according to Eqs. (5)and (6). However, XRD patterns of AFm-12 and iron-AFm-12 arealmost coincident, so it is only considered a global percentage of AFm-12. Reactions (5) and (6) are significant if the amount of gypsum is notoptimum. The formation of AFm phases may play a non-negligibleeffect in the lost of plasticity in the cement paste. In the absence of
calcium sulphates, AFm-type phases are formed which cause a quickset also known as “flash set” of the paste, associated with an intensiveliberation of heat. Moreover, mechanical strengths developed by suchpastes are usually reduced, probably due to a weakening of themicrostructure by the formation of these phases [50]. CB_ref containsless gypsum than active belite cements, so reactivity of remaining C3Aand C4AF with AFt and/or CH to form AFm-type phases is morecomplex. Fig. 7 shows the low angle region of the Rietveld plot ofSXRPD pattern for CB_ref at t67. Main peaks in this region have beenlabelled. Different basal d-spacings have been measured at thisregion: 10.4, 9.5, 8.9 and 8.4 Å. They have been assigned to AFm-type phases: C2AH8, AFm-14, AFm-12 and AFm-ss, respectively. It iswell known that C2AH8 is an AFm-type phase with an interplanarspace closed to 10.7 Å [24]. It has been described that AFm-14[C4AS̄H14] has the interlayer spacing at 9.5 Å [22]. On the other hand,AFm-type phases are layered structures with anions in the interlayerspaces. In AFm-12 or AFm-14, SO4
2− anions are located in the interlayerspace, and they can be partial or totally replaced by other anions. Inthese experimental conditions, it has been considered that 8.4 Å d-spacing value corresponds to an AFm-type, where half of the sulphateanions are replaced by OH−, i.e. [Ca2Al(OH)6]2[SO4,OH]·6(H2O), andhereafter called as AFm-ss [51]. In order to justify the presence ofthese phases the following reactions (7–9) have been considered:
2C3A þ 27H→ C2AH8 þ C4AH19 ð7Þ
2C3A þ C6AS̄3H32 þ 10H→ 3AFm� 14 ð8Þ
C3A þ CHþ AFm� 12 þ 12H→ AFm� ss ð9Þ

Fig. 7. Low angle detail of the Rietveld plot for CB_ref at t67. Points are the experimental scan, solid line is the calculated pattern and the difference curve is given at the bottom. Mainpeaks for AFt and AFm-type phases are labeled.
Fig. 6. Rietveld plot for CB_ref at t2.3 showing the experimental data as points, the calculated pattern as a solid line, and the difference curve at the bottom. Main peaks for key phaseshave been labeled.
840 A.J.M. Cuberos et al. / Cement and Concrete Research 39 (2009) 833–842
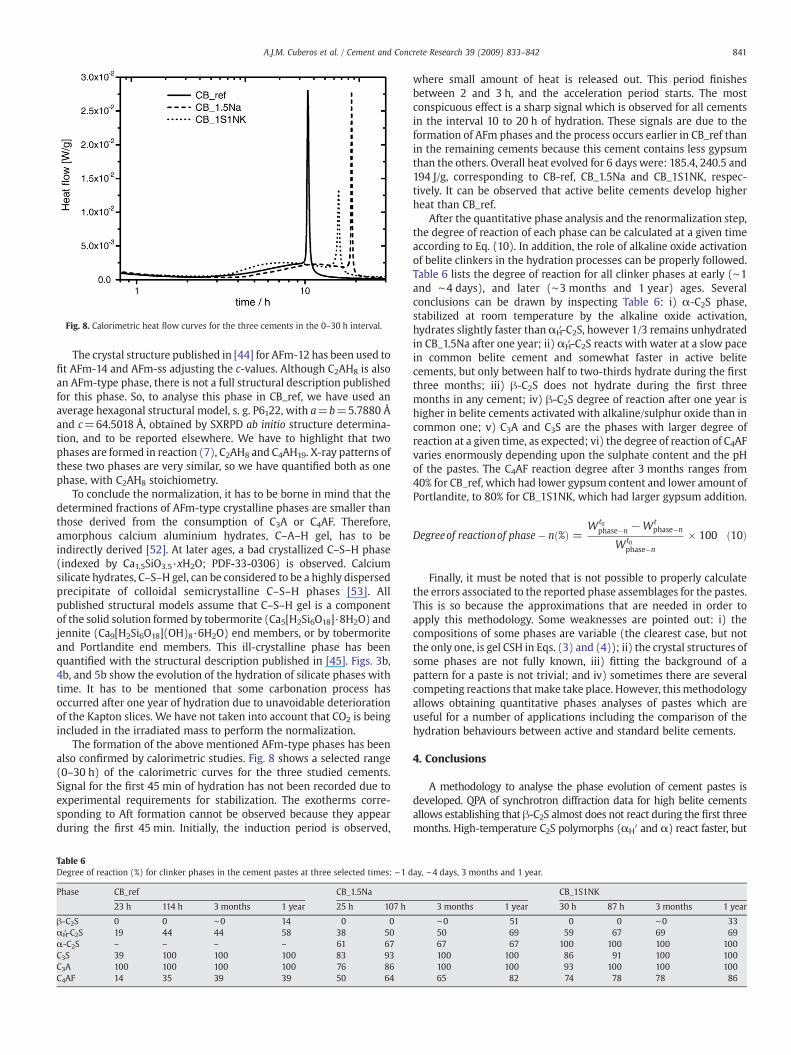
Fig. 8. Calorimetric heat flow curves for the three cements in the 0–30 h interval.
841A.J.M. Cuberos et al. / Cement and Concrete Research 39 (2009) 833–842
The crystal structure published in [44] for AFm-12 has been used tofit AFm-14 and AFm-ss adjusting the c-values. Although C2AH8 is alsoan AFm-type phase, there is not a full structural description publishedfor this phase. So, to analyse this phase in CB_ref, we have used anaverage hexagonal structural model, s. g. P6122, with a=b=5.7880 Åand c=64.5018 Å, obtained by SXRPD ab initio structure determina-tion, and to be reported elsewhere. We have to highlight that twophases are formed in reaction (7), C2AH8 and C4AH19. X-ray patterns ofthese two phases are very similar, so we have quantified both as onephase, with C2AH8 stoichiometry.
To conclude the normalization, it has to be borne in mind that thedetermined fractions of AFm-type crystalline phases are smaller thanthose derived from the consumption of C3A or C4AF. Therefore,amorphous calcium aluminium hydrates, C–A–H gel, has to beindirectly derived [52]. At later ages, a bad crystallized C–S–H phase(indexed by Ca1.5SiO3.5·xH2O; PDF-33-0306) is observed. Calciumsilicate hydrates, C–S–H gel, can be considered to be a highly dispersedprecipitate of colloidal semicrystalline C–S–H phases [53]. Allpublished structural models assume that C–S–H gel is a componentof the solid solution formed by tobermorite (Ca5[H2Si6O18]·8H2O) andjennite (Ca9[H2Si6O18](OH)8·6H2O) end members, or by tobermoriteand Portlandite end members. This ill-crystalline phase has beenquantified with the structural description published in [45]. Figs. 3b,4b, and 5b show the evolution of the hydration of silicate phases withtime. It has to be mentioned that some carbonation process hasoccurred after one year of hydration due to unavoidable deteriorationof the Kapton slices. We have not taken into account that CO2 is beingincluded in the irradiated mass to perform the normalization.
The formation of the above mentioned AFm-type phases has beenalso confirmed by calorimetric studies. Fig. 8 shows a selected range(0–30 h) of the calorimetric curves for the three studied cements.Signal for the first 45 min of hydration has not been recorded due toexperimental requirements for stabilization. The exotherms corre-sponding to Aft formation cannot be observed because they appearduring the first 45 min. Initially, the induction period is observed,
Table 6Degree of reaction (%) for clinker phases in the cement pastes at three selected times: ∼1 d
Phase CB_ref CB_1.5Na
23 h 114 h 3 months 1 year 25 h 107 h
β-C2S 0 0 ∼0 14 0 0αH′-C2S 19 44 44 58 38 50α-C2S – – – – 61 67C3S 39 100 100 100 83 93C3A 100 100 100 100 76 86C4AF 14 35 39 39 50 64
where small amount of heat is released out. This period finishesbetween 2 and 3 h, and the acceleration period starts. The mostconspicuous effect is a sharp signal which is observed for all cementsin the interval 10 to 20 h of hydration. These signals are due to theformation of AFm phases and the process occurs earlier in CB_ref thanin the remaining cements because this cement contains less gypsumthan the others. Overall heat evolved for 6 days were: 185.4, 240.5 and194 J/g, corresponding to CB-ref, CB_1.5Na and CB_1S1NK, respec-tively. It can be observed that active belite cements develop higherheat than CB_ref.
After the quantitative phase analysis and the renormalization step,the degree of reaction of each phase can be calculated at a given timeaccording to Eq. (10). In addition, the role of alkaline oxide activationof belite clinkers in the hydration processes can be properly followed.Table 6 lists the degree of reaction for all clinker phases at early (∼1and ∼4 days), and later (∼3 months and 1 year) ages. Severalconclusions can be drawn by inspecting Table 6: i) α-C2S phase,stabilized at room temperature by the alkaline oxide activation,hydrates slightly faster thanαH′-C2S, however 1/3 remains unhydratedin CB_1.5Na after one year; ii) αH′-C2S reacts with water at a slow pacein common belite cement and somewhat faster in active belitecements, but only between half to two-thirds hydrate during the firstthree months; iii) β-C2S does not hydrate during the first threemonths in any cement; iv) β-C2S degree of reaction after one year ishigher in belite cements activated with alkaline/sulphur oxide than incommon one; v) C3A and C3S are the phases with larger degree ofreaction at a given time, as expected; vi) the degree of reaction of C4AFvaries enormously depending upon the sulphate content and the pHof the pastes. The C4AF reaction degree after 3 months ranges from40% for CB_ref, which had lower gypsum content and lower amount ofPortlandite, to 80% for CB_1S1NK, which had larger gypsum addition.
Degreeof reactionof phase� nð%Þ =Wt0
phase�n −Wtphase�n
Wt0phase�n
× 100 ð10Þ
Finally, it must be noted that is not possible to properly calculatethe errors associated to the reported phase assemblages for the pastes.This is so because the approximations that are needed in order toapply this methodology. Some weaknesses are pointed out: i) thecompositions of some phases are variable (the clearest case, but notthe only one, is gel CSH in Eqs. (3) and (4)); ii) the crystal structures ofsome phases are not fully known, iii) fitting the background of apattern for a paste is not trivial; and iv) sometimes there are severalcompeting reactions thatmake take place. However, thismethodologyallows obtaining quantitative phases analyses of pastes which areuseful for a number of applications including the comparison of thehydration behaviours between active and standard belite cements.
4. Conclusions
A methodology to analyse the phase evolution of cement pastes isdeveloped. QPA of synchrotron diffraction data for high belite cementsallows establishing that β-C2S almost does not react during the first threemonths. High-temperature C2S polymorphs (αH′ and α) react faster, but
ay, ∼4 days, 3 months and 1 year.
CB_1S1NK
3 months 1 year 30 h 87 h 3 months 1 year
∼0 51 0 0 ∼0 3350 69 59 67 69 6967 67 100 100 100 100100 100 86 91 100 100100 100 93 100 100 10065 82 74 78 78 86

842 A.J.M. Cuberos et al. / Cement and Concrete Research 39 (2009) 833–842
after one year there is still between 29 and 42% unreacted αH′-C2S. Thehydration behaviour of different phases and polymorphs has beendetermined including the degree of reaction of all clinker phases.Activation with alkaline oxides increases only moderately the hydrationrate of belite phases.
Acknowledgments
We thank financial support from P06-FQM-01348 research grant(Junta de Andalucía, Spain). ESRF is thanked for the provision of X-raysynchrotron powder diffraction beam time.
References
[1] J.S. Damtoft, J. Lukasik, D. Herfort, D. Sorrentino, E.M. Gartner, Sustainabledevelopment and climate change initiatives, Cem. Concr. Res. 38 (2) (2008)115–127.
[2] A.K. Chatterjee, High belite cements. present status and future technologicaloptions: part I and part II, Cem. Concr. Res. 26 (8) (1996) 1213–1237.
[3] P.K. Mehta, Investigation on energy-saving cements,World Cem. Technol.11 (5) (1980)166–177.
[4] A.G. De la Torre, M.A.G. Aranda, A.H. De Aza, P. Pena, S. De Aza, Belite portland clinkers.Synthesis and mineralogical analysis, Bol. Soc. Esp. Ceram. V 44 (3) (2005) 185–191.
[5] C.D. Popescu, M. Muntean, J.H. Sharp, Industrial trial production of low energybelite cement, Cem. Concr. Composites 25 (7) (2003) 689–693.
[6] A. Gies, D. Knofel, Influence of alkalies on the composition of belite-rich cementclinkers and the technological properties of the resulting cements, Cem. Concr. Res.16(3) (1986) 411–422.
[7] G.S. Li, E.M. Gartner, High-belite sulfoaluminate clinker: fabrication process andbinder preparation, French patent application 04-51586 (publication 2873366),27/01/2006.
[8] K. Morsli, A.G. De la Torre, M. Zahir, M.A.G. Aranda, Mineralogical phase analysis ofalkali and sulfate bearing belite rich laboratory clinkers, Cem. Concr. Res. 37 (2007)639–646.
[9] K. Morsli, A.G. De la Torre, S. Stöber, A.J.M. Cuberos, M. Zahir, M.A.G. Aranda,Quantitative phase analysis of laboratory active belite clinkers by synchrotronpowder diffraction, J. Am. Ceram. Soc. 90 (10) (2007) 3205–3212.
[10] S.N. Ghosh, P.B. Rao, A.K. Paul, K. Raina, Review. The chemistry of dicalcium silicatemineral, J. Mater. Sci. 14 (1979) 1554–1566.
[11] I. Jelenic, A. Bezjak, M. Bujan, Hydration of B2O3-stabilized α′- and β-modificationsof dicalcium silicate, Cem. Concr. Res. 8 (2) (1978) 173–180.
[12] J. Bensted, Some hydration studies ofα-dicalcium silicate, Cem. Concr. Res. 9 (1) (1979)973-102.
[13] A.G. De la Torre, K. Morsli, M. Zahir, M.A.G. Aranda, In situ synchrotron powderdiffraction study of active belite clinkers, J. Appl. Crystallog. 40 (2007) 999–1007.
[14] H.M. Rietveld, A profile refinement method for nuclear and magnetic structures,J. Appl. Crystallogr. 2 (2) (1969) 65–71.
[15] A.G. De la Torre, A. Cabeza, A. Calvente, S. Bruque, M.A.G. Aranda, Full phaseanalysis of Portland clinker by penetrating synchrotron powder diffraction, Anal.Chem. 73 (2001) 151–156.
[16] N.V.Y. Scarlett, I.C. Madsen, C. Manias, D. Retallack, On-line X-ray diffraction forquantitative phase analysis: application in the Portland cement industry, PowderDiffr. 16 (2) (2001) 71–80.
[17] A.G. De la Torre, M.A.G. Aranda, Accuracy in Rietveld quantitative phase analysis ofPortland cements, J. Appl. Crystallogr. 36 (5) (2003) 1169–1176.
[18] V.K. Peterson, A.S. Ray, B.A. Hunter, A comparative study of Rietveld phase analysisof cement clinker using neutron, laboratory X-ray, and synchrotron data, PowderDiffr. 21 (1) (2006) 12–18.
[19] A.G. De la Torre, S. Bruque, M.A.G. Aranda, Rietveld quantitative amorphouscontent analysis, J. Appl. Crystallogr. 34 (2001) 196–202.
[20] P.M. Suherman, A.V. Riessen, B. O'connor, D. Li, D. Bolton, H. Fairhurst,Determination of amorphous phase levels in Portland cement clinker, PowderDiffr. 17 (3) (2002) 178–185.
[21] K.L. Scrivener, T. Fullmann, E. Gallucci, G. Walenta, E. Bermejo, Quantitative study ofPortland cement hydration by X-ray diffraction/Rietveld analysis and independentmethods, Cem. Concr. Res. 34 (9) (2004) 1541–1547.
[22] H.F.W. Taylor, Cement Chemistry, Thomas Telford Ltd, London, 1997.[23] A.G. De la Torre, A. Cabeza, E.R. Losilla, M.A.G. Aranda, Quantitative phase analysis
of ordinary Portland cements using synchrotron radiation powder diffraction, Z.Kristallogr. 23 (2006) 587–592.
[24] E.M. Gartner, J.F. Young, D.A. Damidot, I. Jawed, Hydration of Portland cement, in: J.Bensted, P. Barnes (Eds.), Structure and Performance of Cements, Spon Spress,London and New York, 2002.
[25] L.D. Mitchell, J.C. Margeson, P.S. Whitfield, Quantitative Rietveld analysis of hydratedcementitious systems, Powder Diffr. 21 (2) (2006) 111–113.
[26] J. Neubauer, F. Goetz-Neunhoeffer, U. Holland, D. Schmitt, P. Gaeberlein, M. Degenkolb,Crystal chemistry and microstructure of hydrated phases occurring during early OPChydration, Proceedings of the 12th International Congress of Cement Chemistry,Montreal, 2007, W1-06.3.
[27] N. Meller, C. Hall, K. Kyritsis, G. Giriat, Synthesis of cement based CaO–Al2O3–SiO2–H2O (CASH) hydroceramics at 200 and 250 C: ex-situ and in-situ diffraction,Cem. Concr. Res. 37 (6) (2007) 823–833.
[28] A.C. Jupe, X. Turrillas, P. Barnes, S.L. Colston, C. Hall, D. Häusermann, M. Hanfland,Fast in situ X-ray diffraction studies of chemical reactions: a synchrotron view ofthe hydration of tricalcium aluminate, Phys. Rev. B 53 (1996) R14697–R14700.
[29] M. Merlini, G. Artioli, C. Meneghini, T. Cerulli, A. Bravo, F. Cella, The early hydrationand the set of Portland cements: in situ X-ray powder diffraction studies, PowderDiffr. 22 (3) (2007) 201–208.
[30] A.C. Jupe, A.P. Wilkinson, K. Luke, G.P. Funkhouser, Slurry consistency and in situsynchrotron X-ray diffraction during the early hydration of portland cements withcalcium chloride, J. Am. Ceram. Soc. 90 (8) (2007) 2595–2602.
[31] S.M. Clark, P. Barnes, A comparison of laboratory, synchrotron and neutrondiffraction for the real time study of cement hydration, Cem. Concr. Res. 25 (1995)639–646.
[32] W.E. Haskell, Three factors govern optimum gypsum content of cement, rock products,April 1959, pp. 108–149.
[33] R.H. Bogue, Calculation of the compounds in Portland cement, Ind. Eng. Chem.Anal. Ed. 1 (4) (1929) 192–197.
[34] A.P. Hammersley, S.O. Svensson, M. Hanfland, A.N. Fitch, D. Häusermann, Two-dimensional detector software: from real detector to idealised image or two-thetascan, High Pressure Res. 14 (1996) 235–248.
[35] C. Meneghini, G. Artioli, A. Balerna, A.F. Gualtieri, P. Norby, Multipurpose imaging-plate camera for in-situ powder XRD at the GILDA beamline, J. Synchrotron Radiat.8 (2001) 1162–1166.
[36] P. Thompson, D.E. Cox, J.B. Hasting, Rietveld refinement of Debye–Scherrersynchrotron X-ray data from Al2O3, J. Appl. Crystallogr. 20 (2) (1987) 79–83.
[37] W.G. Mumme, R.J. Hill, G. Bushnell-Wye, E.R. Segnit, Rietveld structure refinement,crystal chemistry and calculated powder diffraction data for the polymorphs ofdicalcium silicate and related phases, Neues Jahrb. Mineral. Abh. 169 (1) (1995)35–68.
[38] A.G. De la Torre, S. Bruque, J. Campo, M.A.G. Aranda, The superstructure of C3S fromsynchrotron and neutron powder diffraction and its role in quantitative phaseanalyses, Cem. Concr. Res. 32 (9) (2002) 1347–1356.
[39] P. Mondal, J.W. Jeffery, The crystal structure of tricalcium aluminate, Ca3Al2O6, ActaCrystallogr. B31 (1975) 689–697.
[40] A.A. Coville, S. Geller, The crystal structure of brownmillerite, Ca2FeAlO5, ActaCrystallogr. B27 (1971) 2311–2315.
[41] A.G. De la Torre, M.G. López-Olmo, C. Alvarez-Rua, S. García-Granda, M.A.G.Aranda, Structure and microstructure of gypsum and its relevance to Rietveldquantitative phase analyses, Powder Diffr. 19 (3) (2004) 240–246.
[42] F. Goetz-Neunhoeffer, J. Neubauer, Refined ettringite (Ca6Al2(SO4)3(OH)12 26(H2O)) structure for quantitative X-ray diffraction analysis, Powder Diffr. 21 (1)(2006) 4–11.
[43] H.E. Petch, The hydrogen positions in portlandite, Ca(OH)2, as indicated by theelectron distribution, Acta Crystallogr. 14 (1961) 950–957.
[44] R. Allmann, Refinement of the hybrid layer structure (Ca2Al(OH)6)+
(0.5SO4·3H2O, Neues Jahrb. Mineral. Monatsh. (1977) 136–144.[45] E. Bonaccorsi, S. Merlino, A.R. Kampf, The crystal structure of tobermorite 14 Å
(plombierite), a C–S–H phase, J. Am. Ceram. Soc. 88 (3) (2005) 505–512.[46] B. Pokroy, J.S. Fieramosca, R.B. Von Dreele, A.N. Fitch, E.N. Caspi, E. Zolotoyabko,
Atomic structure of biogenic aragonite, Chem. Mater. 19 (2007) 3244–3251.[47] M. Fukuhara, S. Goto, K. Asaga, M. Daimon, R. Kondo, Mechanisms and kinetics of
C4AF hydration with gypsum, Cem. Concr. Res. 11 (3) (1981) 407–414.[48] H.J. Kuzel, Substitute of Al3+ by Cr3+ and Fe3+ in 3CaOAl2O3 CaCl2 nH2O and 3CaO
Al2O3 CaSO4 nH2O, Zem Kalk Gips 21 (12) (1968) 493–499.[49] N. Meller, C. Hall, A.C. Jupe, S.L. Colston, S.D.M. Jacques, P. Barnes, J. Phipps, The
paste hydration of brownmillerite with and without gypsum: a time resolvedsynchrotron diffraction study at 30, 70, 100 and 150 ºC, J. Mater. Chem. 14 (2004)428–435.
[50] I. Odler, Hydration, setting and hardening of Portland cement, Lea´s. Chemistry ofcement and concrete, Fourth Edition, 1998.
[51] T. Matschei, B. Lothenbach, F.P. Glasser, The AFm phase in Portland cement, Cem.Concr. Res. 37 (2) (2007) 118–130.
[52] J. Bensted, Calcium aluminate cements, in: J. Bensted, P. Barnes (Eds.), Structureand Performance of Cements, Spon Spress, London and New York, 2002.
[53] K. Garbev, G. Beuchle, M. Bornefeld, L. Black, P. Stemmermann, Cell dimensions andcomposition of nanocrystalline calcium silicate hydrate solid solutions. Part 1:synchrotron-based X-ray diffraction, J. Am. Ceram. Soc. 91 (9) (2008) 3005–3014.