The partial molar volume of carbon dioxide in peridotite partial ...
Upload
independentCategory
view
1download
0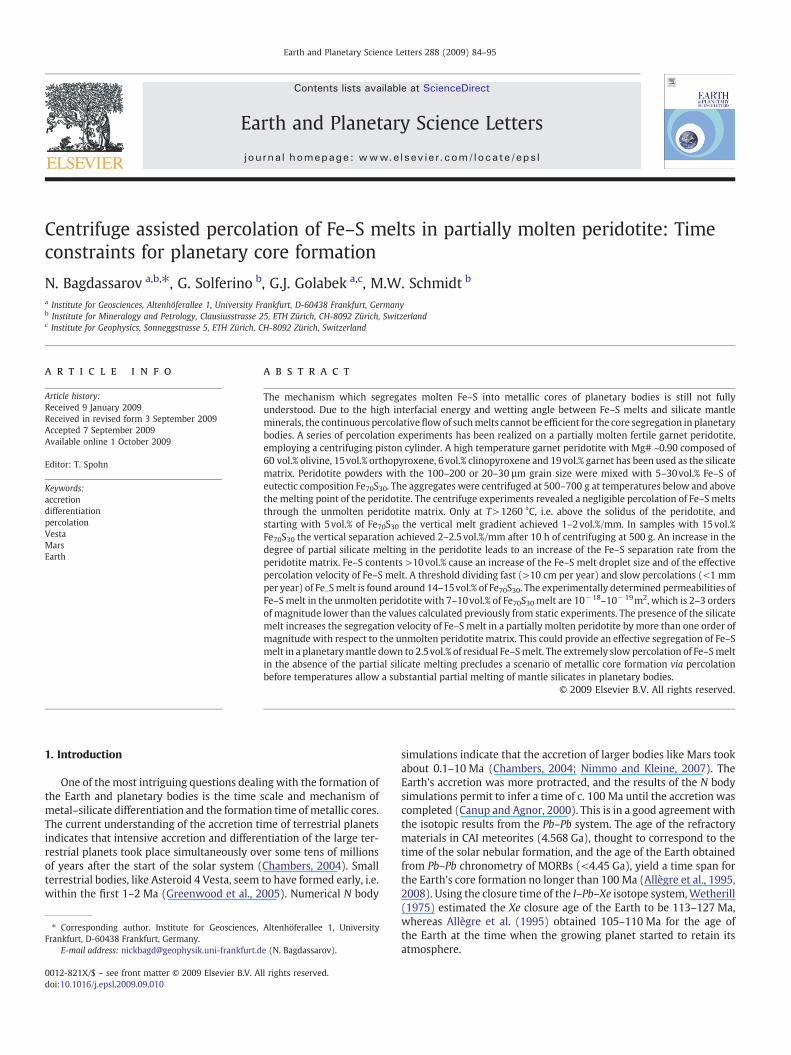
Earth and Planetary Science Letters 288 (2009) 84–95
Contents lists available at ScienceDirect
Earth and Planetary Science Letters
j ourna l homepage: www.e lsev ie r.com/ locate /eps l
Centrifuge assisted percolation of Fe–S melts in partially molten peridotite: Timeconstraints for planetary core formation
N. Bagdassarov a,b,⁎, G. Solferino b, G.J. Golabek a,c, M.W. Schmidt b
a Institute for Geosciences, Altenhöferallee 1, University Frankfurt, D-60438 Frankfurt, Germanyb Institute for Mineralogy and Petrology, Clausiusstrasse 25, ETH Zürich, CH-8092 Zürich, Switzerlandc Institute for Geophysics, Sonneggstrasse 5, ETH Zürich, CH-8092 Zürich, Switzerland
⁎ Corresponding author. Institute for Geosciences,Frankfurt, D-60438 Frankfurt, Germany.
E-mail address: [email protected]
0012-821X/$ – see front matter © 2009 Elsevier B.V. Adoi:10.1016/j.epsl.2009.09.010
a b s t r a c t
a r t i c l e i n f oArticle history:Received 9 January 2009Received in revised form 3 September 2009Accepted 7 September 2009Available online 1 October 2009
Editor: T. Spohn
Keywords:accretiondifferentiationpercolationVestaMarsEarth
The mechanism which segregates molten Fe–S into metallic cores of planetary bodies is still not fullyunderstood. Due to the high interfacial energy and wetting angle between Fe–S melts and silicate mantleminerals, the continuous percolativeflowof suchmelts cannot be efficient for the core segregation in planetarybodies. A series of percolation experiments has been realized on a partially molten fertile garnet peridotite,employing a centrifuging piston cylinder. A high temperature garnet peridotite with Mg# ~0.90 composed of60 vol.% olivine, 15vol.% orthopyroxene, 6vol.% clinopyroxene and 19vol.% garnet has been used as the silicatematrix. Peridotite powders with the 100–200 or 20–30 μm grain size were mixed with 5–30vol.% Fe–S ofeutectic composition Fe70S30. The aggregates were centrifuged at 500–700 g at temperatures below and abovethe melting point of the peridotite. The centrifuge experiments revealed a negligible percolation of Fe–S meltsthrough the unmolten peridotite matrix. Only at T>1260 °C, i.e. above the solidus of the peridotite, andstarting with 5vol.% of Fe70S30 the vertical melt gradient achieved 1–2vol.%/mm. In samples with 15vol.%Fe70S30 the vertical separation achieved 2–2.5vol.%/mm after 10 h of centrifuging at 500 g. An increase in thedegree of partial silicate melting in the peridotite leads to an increase of the Fe–S separation rate from theperidotite matrix. Fe–S contents >10vol.% cause an increase of the Fe–S melt droplet size and of the effectivepercolation velocity of Fe–S melt. A threshold dividing fast (>10 cm per year) and slow percolations (<1 mmper year) of Fe–Smelt is found around 14–15vol.% of Fe70S30. The experimentally determined permeabilities ofFe–Smelt in the unmolten peridotite with 7–10vol.% of Fe70S30 melt are 10−18–10−19m2, which is 2–3 ordersof magnitude lower than the values calculated previously from static experiments. The presence of the silicatemelt increases the segregation velocity of Fe–S melt in a partially molten peridotite by more than one order ofmagnitude with respect to the unmolten peridotite matrix. This could provide an effective segregation of Fe–Smelt in a planetarymantle down to 2.5vol.% of residual Fe–Smelt. The extremely slow percolation of Fe–Smeltin the absence of the partial silicate melting precludes a scenario of metallic core formation via percolationbefore temperatures allow a substantial partial melting of mantle silicates in planetary bodies.
Altenhöferallee 1, University
e (N. Bagdassarov).
ll rights reserved.
© 2009 Elsevier B.V. All rights reserved.
1. Introduction
One of the most intriguing questions dealing with the formation ofthe Earth and planetary bodies is the time scale and mechanism ofmetal–silicate differentiation and the formation time of metallic cores.The current understanding of the accretion time of terrestrial planetsindicates that intensive accretion and differentiation of the large ter-restrial planets took place simultaneously over some tens of millionsof years after the start of the solar system (Chambers, 2004). Smallterrestrial bodies, like Asteroid 4 Vesta, seem to have formed early, i.e.within the first 1–2 Ma (Greenwood et al., 2005). Numerical N body
simulations indicate that the accretion of larger bodies like Mars tookabout 0.1–10 Ma (Chambers, 2004; Nimmo and Kleine, 2007). TheEarth's accretion was more protracted, and the results of the N bodysimulations permit to infer a time of c. 100 Ma until the accretion wascompleted (Canup and Agnor, 2000). This is in a good agreement withthe isotopic results from the Pb–Pb system. The age of the refractorymaterials in CAI meteorites (4.568 Ga), thought to correspond to thetime of the solar nebular formation, and the age of the Earth obtainedfrom Pb–Pb chronometry of MORBs (<4.45 Ga), yield a time span forthe Earth's core formation no longer than 100 Ma (Allègre et al., 1995,2008). Using the closure time of the I–Pb–Xe isotope system,Wetherill(1975) estimated the Xe closure age of the Earth to be 113–127 Ma,whereas Allègre et al. (1995) obtained 105–110 Ma for the age ofthe Earth at the time when the growing planet started to retain itsatmosphere.

85N. Bagdassarov et al. / Earth and Planetary Science Letters 288 (2009) 84–95
Earlier results on the core formation in planetary bodies fromHf–W chronometry infer a much shorter time (Kleine et al. 2002;Kleine et al. 2004, 2005). The duration of the metallic core formationassumed as a single event has been estimated as 5, 13, and 33 Ma forVesta, Mars, and the Earth, respectively (Kleine et al., 2002). Newmeasurements of 142Nd/144Nd in chondrites and the revisited super-chondritic terrestrial ε142Nd of 20 may be explained by the presence ofa high Sm/Nd reservoir not later than 4.537 Ga ago, i.e. 30 Ma after thesolar system formation (Boyet and Carlson, 2005). The early timing ofthe Earth's core differentiation has been critically discussed by Woodand Halliday (2005), Wade and Wood (2005), Wood et al. (2006),Halliday (2008), and Allègre et al. (2008). The core formation timeof Kleine et al. (2002) is based on the assumption of a total equili-brium between an impactor material and the bulk silicate Earth (BSE).Such rapid equilibration of an incoming material in a planetary bodyassumes an effective percolation of iron melts in a permeable solidmatrix or a rapid sinking of molten iron in partially molten silicates.If the proto-Earth was not melted at the early accretion stage andthe incoming flux of molten metallic sulphide from the bombard-ment process was still substantial, the fast equilibration would implyan effective transport of the Fe–S melt through the silicate mantle ina grain size length scale. An isotopic equilibration requires that theiron and silicate phases are mixed at a small length scale and thattheir residence timescale is comparable with their diffusion timescale(Nimmo and Agnor, 2006). Consequently, equilibration of Hf–W be-tween the metal melt and BSE might not be fully achieved, if theirrelative motion is fast (~1 m/a). This could result in the observedexcess of 182W (εW~1.9) in the BSE relative to chondrites (εW~0).Hf–W chronometry would then indicate a time span intermediatebetween the segregation time of the iron melt in the projectilesand the true core formation timeof theEarth (Wood andHalliday, 2005;Allègre et al., 2008). The observed excesses of 182W in a planetary bodyare difficult to interpret, if the isotopic re-equilibration scenario ofimpactor and target is not knownprecisely (NimmoandAgnor, 2006). Afast merging of the impactor core and themantle into the target mantleand core, or a complete equilibration of the impactor with the targetmantle may result in a mantle excess of 182W, and consequently, thederived core formation time would then be underestimated (Nimmoand Agnor, 2006).
This argument is also based on the presumption that the mantlesilicates, even without partial melting, let the metallic melt segregatedue to a non-zero permeability at the early stage of accretion. Numer-ous dihedral angle measurements of the Fe–S melt in silicates (Leeand Agee, 1996; Minarik et al., 1996; Ballhaus and Ellis, 1996; Gaetaniand Grove, 1999; Terasaki et al., 2007; Walte et al., 2007), yieldedwetting angles larger than 60°. The dihedral angle varies from 90° at43 at.% of O+S to 60° at 53 at.% of O+S in a metallic melt at 3–4 GPa(Minarik et al. 1996). Recent experiments on dihedral angles betweenFe–S–Omelts and olivine crystals with theMg# of 0.90–0.76 (Terasakiet al., 2008) suggest a significant pressure dependence of the wettingproperties of Fe–S–O melts. At low pressures (<2–3 GPa) and oxi-dizing conditions (>25–20 at.% O) the wetting angle is <60°, whichallows the percolation flow of Fe–S–O melts in planetary bodies withrelatively small size (Terasaki et al., 2008). A decrease of the Mg#of olivine resulted in a small decrease of the wetting angle. At highpressures, even in oxidizing conditions, wetting angles remain higherthan the threshold for an interconnected network of the melt whichprecludes an effective percolation mechanism for the Fe–S transportinto the core.
Experimental support for a non-zero permeability of mantle sili-cates to the Fe–S melt flow has been obtained only from the electricalconductivity of olivine and Fe–S mixtures (Yoshino et al., 2003, 2004)indicating that even at about 6vol.% Fe–S and temperatures belowthe peridotite solidus Fe–S melts become interconnected. This resultis supported by a 3D synchrotron radiation tomography of staticallyannealed Fe–Ni–S alloys (Roberts et al., 2007). From the topology
of Fe–S melt pockets, the permeability of the silicate matrix wascalculated to be 10−18–10−19m2 at 1vol.% and to be 10−13m2 at13vol.% of Fe–S melt. In a partially molten peridotite, the inter-connectivity threshold of the Fe–S melt in a peridotite matrix hasbeen estimated to be 13±2vol.% Fe–S through electrical conductivitymeasurements (Yoshino et al. 2004). Walte et al. (2007) demonstrat-ed that an interconnected network of the Fe–Smelt in a silicatematrixis not stable due to the high dihedral angle of >60° and should pinchoff in long duration experiments. Walte et al. (2007) also show thatthe very limited mobility of high wetting angle liquid pockets ispossible only due to slight adjustments of the pocket shape and theshape of surrounding solid grains during textural maturation and therelated flow of the melt phase.
In this study we investigate the mechanism of the Fe–S meltsegregation in a silicatematrix and test the plausibility of a percolationflowwith a direct experimental simulation of this segregation processin peridotite+Fe–S samples. We performed a series of segregationexperiments with the centrifuging piston cylinder at ETH (Schmidtet al., 2006). The main goal was to achieve a gravitational separationof the molten Fe–S alloy from a silicate matrix and to measure meltsegregation velocities as a function of metal and silicate melt contentsin a peridotite matrix under compaction.
2. Theoretical background for the centrifuge experiments
Material flows in nature and in dynamic laboratory experimentsare similar, provided that they are geometrically similar and theirdimensionless numbers are close to each other. If a dynamic processmay be described by a functional dependency of one dimensionlessnumber on another, we can determine this relationship by performingexperiments on small scale objects in short time scale experiments andthen extrapolate our functional dependency to the geological lengthand time scales. Some parameters involved in dimensionless num-bers, such as mass and energy, are difficult to vary over a wide range.Gravitational acceleration however is involved inmany dimensionlessnumbers characterizing dynamic processes during the planetary ac-cretion, e.g. the percolation flow, droplets raining in a magma ocean,and the flow in intergranular channels. By imposing a centrifugalacceleration of 1000g on an experimental system, these segregationprocesses occur on a proportionally shorter time scale, as the cen-trifugal acceleration replaces gravity acceleration (Bagdassarov et al.,1996a,b).
The percolation rate of the metal melt in a peridotite matrix maybe calculated from the equation of mass conservation (McKenzie,1984; Yang, 2001). Assuming a time and depth independent meltdensity ρf and the conservation of Fe–S mass M, then
ρf∂φ∂t + ∇!⋅ðφ⋅ v!f Þ
� �=
dMdt
= 0; ð1Þ
where φ is the melt fraction, and vf the segregation velocity of themelt. Here and below φ is the melt fraction. For a one-dimensionalflow with a downward segregation direction z
∂φ∂t = −∂ðφ⋅vf Þ
∂z =∂ð½1−φ�⋅vsÞ
∂z : ð2Þ
In Eq. (2) vs is the solid matrix velocity. The z-coordinate in theexperiments described below is the coordinate along the axis of thecylindrical sample, which is parallel to the centrifugal force. In anatural system, this axis would correspond to the vertical direction(hence z) and the length of the sample along this axis is hithertoreferred to as the height of the sample. The centrifuge accelerationacts along the z-coordinate in the direction from the top to the bottom
86 N. Bagdassarov et al. / Earth and Planetary Science Letters 288 (2009) 84–95
of the centrifuged capsules. The conservation of momentum can bedescribed by the 1D Darcy's equation as follows
φ⋅ðvf−vsÞ⋅μκ
= η∂2vs∂z2
+ Δρ⋅g; ð3Þ
where k is the permeability of the solid matrix, µ is the shear viscosityof the percolating fluid phase, and η is the bulk viscosity of the matrix(McKenzie, 1984). In Eq. (3) the pressure difference between the solidand fluid phase has been replaced by a product of the matrix bulkviscosity and gradient of the solid phase velocity, i.e. the compactionof the solid matrix is assumed as a pure viscous mechanism (Sumitaet al., 1996). The left-hand side in Eq. (3) is the viscous friction offlow through the solid matrix, the first term in the right side is theviscous resistance to the matrix compaction and the second term isthe buoyancy (Sumita et al., 1996).
Let us assume a laboratory experiment on compaction of a solidmatrix and melt segregation with the centrifuge acceleration 1000g.For t=0, φ=φ0 is assumed to be constant and the melt fractiondistributed homogeneously over the height or a vertical z-axe of acylindrical sample which is directed along the radius of the samplegyration. In a laboratory sample the porosity at the barycentre re-mains equal to the initial or average porosity. In the case h≪δc theapproximate solutions of the 1D-compaction problem between thetwo impermeable boundaries are as follows vsðzÞ≈−ν0⋅φ⋅ z
δ2c⋅ h− z
2
� �,
and vs = − φ1−φ ⋅vf (McKenzie, 1984). The velocity v0 = κ
μ ⋅1−φφ ⋅Δρ⋅g
is the scale velocity which corresponds to the case δc=0 or Darcianflow with constant porosity and without compaction. Assuming ashear viscosity of the peridotite matrix of 1014Pa s at 1150 °C and thegrain size c. 20 μm (Zimmerman and Kohlstedt, 2004) is equal to thebulk viscosity η, the permeability k is of 10−15m² at 10% of meltporosity and 5×10⁻¹⁸m² at 1% of melt porosity (Roberts et al., 2007)and the viscosity µ of Fe–S melt of 10−2Pa s (Alfè and Gillan, 1998;Urakawa et al., 2001), the compaction length is about δc~0.2–1 m(Ricard et al., 2001). The typical size of the laboratory sample H is~2 mm, which is much smaller than the compaction length δc. Thepore-solid matrix deformation factor is H/δc~10−2–10−4. In realcentrifuge experiments, the condition of impermeable boundarieswas not realized. The samples were encapsulated in graphite andduring the experiment they were under 1 GPa of hydrostatic pressure.The inspection of samples after centrifuge experiments demonstratesthe absence of silicate melt collection on the top and Fe–S melt on thebottom and any noticeable deformation of sample was not observed.Thus, we may regard the resulting density driven flow realized incentrifuge experiments as a Darcian flow at a quasi constant meltpressure gradient. As the porosity and melt pressure gradients areconstant during a short time t (eτ0 = δc
v0⋅ð1−φÞ, McKenzie, 1984) afterthe start of the experiment, it follows that the melt velocity at thebarycentre is likewise constant, at least for the experimental timescale, vf=v0 ∙(1=φ) and vs=−v0 ∙φ.
The substitution of differentials by finite quotient differences inEq. (2) yields an equation that can be applied to measurements of theFe–S melt abundance in a sample having the height H after a time Δtof segregation,
vf =1
φ⋅Δt ∫H
0Δφ⋅dZ≈ Δφ⋅H
2⋅φ⋅Δt ; ð4Þ
where φ̄̄ is the average melt porosity at t=0. The factor 0.5 in Eq. (4)is due to the integration of a linear function Δφ(z). After the cen-trifugation during the time Δt, the difference Δφ can be determinedbetween the gravitational top and bottom of the centrifuged sample.Strictly speaking, the segregation velocity in Eq. (4) is the melt ve-locity relative to the barycentre and not the true physical velocity ofthe melt phase relative to the solid matrix. In the light of the relativelylarge error in evaluating vf from Eq. (4) and the short time of cen-
trifuging, the approximation that the physical flow velocity is equal tothe barycentre velocity in Eq. (4) is reasonable.
The questionwhat kind of a density drivenflow can be simulated incentrifuge experiments on rocks containing melts remains. A densitydriven percolative flow due to the compaction of a solid matrix can beeither due to a viscous compaction of a solid matrix (effective normalstress across the grain contacts is proportional to the creep rate ofa solid matrix) or due to a poroelastic relation, i.e. the relationshipbetween the effective pressure and porosity (Yang, 2001). The firstcase occurs at high pressures and over a long period of time, the secondcase can be realized due to pure mechanical grain displacements suchas sliding along grain contacts and grain rearrangements. By applying amoderatehydrostatic pressure andby increasing the pressure gradientΔρ ∙g by 2–3 orders of magnitude in centrifuge experiments with theaccelerations of 500–1000g, the simulated compaction flow can be acombination of the two mechanisms mentioned above. Walte et al.(2007) showed that due to (i) the large density contrast betweensilicates and iron, and (ii) the high dihedral angle of the Fe–S melt andthe rather low viscosity of Fe–S melts, the flow of Fe–S is dominantlyporoelastic. To discriminate these two types of flows from the verticaldistribution of the melt phase along a compacted sample is ratherdifficult. Nevertheless, for a poroelastic compaction the upper partof the samples is characterized by small porosity gradients and thebottom part—by very large porosity gradients. For a viscous compac-tion, large porosity gradients occur in the upper part and the bottomand middle parts are characterized by an almost constant and smallporosity gradient (Yang, 2001).
Mungall and Su (2005) discussed the mobility of Fe–S melts in apartially molten silicate framework. The entry of droplets into cap-illary throats depends on a product of the size of droplets L and thesize of a capillary throat r, and this product should be larger than a2,where a is the capillary constant and is given by a2=Δρ ∙g/γsl, whereγsl is the surface tension between the melt and solid phase. By per-forming centrifuge experiments, the capillary constant is decreased bythe factor (centrifuge acceleration/g)1/2. Thus, the estimated mobilityof Fe–S droplets from the centrifuge experiments may be larger thanthat under natural conditions and may be regarded as an upper limitof porous flow velocities.
Centrifuging of two phase aggregates in a rotating furnace has beensuccessfully used to model crystal-melt segregation processes at hightemperatures and atmospheric pressure (Campbell et al. 1978; Kadiket al. 1989, 1990; Bagdassarov et al., 1996a,b; Lebedev et al., 1999).Recent advances in a high pressure technique permit to centrifugea small piston cylinder and to quench samples within a few seconds(Schmidt et al., 2006), which makes the laboratory compaction sim-ulation with partially molten rocks much more realistic.
3. Experiments
3.1. Sample preparation
The starting materials used for all experiments were mixtures ofa natural fertile garnet peridotite (a xenolith from the Jericho kim-berlite, Northern Territories, Canada) with a eutectic mixture of Fe–S.The chemical composition and the equilibration conditions of 1190–1260 °C and 5.85–5.95 GPa for this xenolith were given by Kopylovaand Russell (2000). Oxygen fugacity relative to the QFM buffer hasbeen estimated to Δlog(fO2)=−3.2, the Fe3+/ΣFe in garnet is 0.107(McCammon and Kopylova, 2004), and the bulk Mg# is 0.896. Thexenolith consists of 60vol.% olivine, 15vol.% orthopyroxene, 6vol.%clinopyroxene and 19vol.% garnet (sample 23-5 fromMcCammon andKopylova, 2004). The choice of this peridotite sample was dictated byits low melting point of 1180–1200 °C at 1 GPa (Walter, 2003). Theperidotite was crushed and milled in a silicon-nitride mortar to agrain size of first 60–120 μm and after two experiments to 20–30 μm.The grain size distribution of powders has been measured with a laser
87N. Bagdassarov et al. / Earth and Planetary Science Letters 288 (2009) 84–95
particle analyzer, the Mastersizer 2000 (Malvern Instrument Ltd.).The composition of the Fe–S powder is that of the eutectic in the Fe–Ssystem, which is at Fe70S30 (wt.%) at 1 GPa (Brett and Bell, 1969). Thepowder has been prepared from Fe and FeS (99.99% ChemPu®),pressed into pellets, sealed in evacuated quartz tubes at 10−3bar,kept at 1200 °C for 5 h in a vertical furnace, and then quenched inwater. The pellets were then crushed and milled under ethanol for10 min. Final mixtures were prepared from fertile peridotite and Fe–Spowders with 7.5, 10, 15, 20 and 50 wt.% of Fe70S30 by groundingunder ethanol. The dried mixtures were agitated for 10 min to get amaximum of homogenization.
Two reasons led to use a eutectic Fe–S composition: (i) its lowmelting temperature compared to the silicate phases and (ii) thenecessity to have all Fe–S as liquid. (i): The experiments wereconducted at 1 GPa and we chose the eutectic composition of Fe–S(27 wt.% of S) corresponding to this pressure. With pressure, theeutectic temperature increases and the S content of the eutectic de-creases: at 21 and 40 GPa the melting temperatures are 1070 and1250 °C, and the eutectic compositions are 15 and 12 wt.% S, respec-tively (Usselman 1975, Li and Fei 2004, Stewart et al., 2007). Anyof these temperatures are more than 100 °C lower than the cor-responding solidus of a dry mantle peridotite. Qualitatively, removingS from Fe–S melt would increase the surface tension and the dihedralangle and thus, with increasing pressure, percolation of the Fe–Smelt in a silicate matrix becomes less probable (Terasaki et al., 2009).Nevertheless, by adding O to the Fe–S melt or by increasing the Fe-number of the peridotite matrix, the dihedral angle may decrease butwill still remain above 60° (Terasaki et al., 2007). (ii): A quantificationof the experimental results in the context of this study depends on themetal phase having a unique liquid state. A bulk Fe–S compositionwithin the two phase loop would lead to a silicate melt carrying bothrounded and rigid Fe grains and droplets of Fe–S melt, which wouldhave different mechanical properties and segregation behaviour. Fur-thermore, for a Fe–S composition within the two phase loop, the Fe–Smelt would strongly change the S-content with temperatures leadingto a further variable in the experiments.
The materials for the centrifuging experiments were sintered inan endloaded piston cylinder (Table 1) using NaCl–Pyrex–graphite–MgO assemblies. For this, the powders were pressed into cylindricalpellets 2 mm in diameter and 2.5 mm in height, encapsulated ingraphite, and kept during 65–70 h at 1 GPa and temperatures closeand above the melting point of fertile garnet peridotite at 1180–1200 °C (Hirschmann et al., 1999). Garnet is not stable at 1 GPa andrecrystallizes in spinel. A microscopic analysis of the sintered sam-ples indicates that this process does not affect the distribution of the
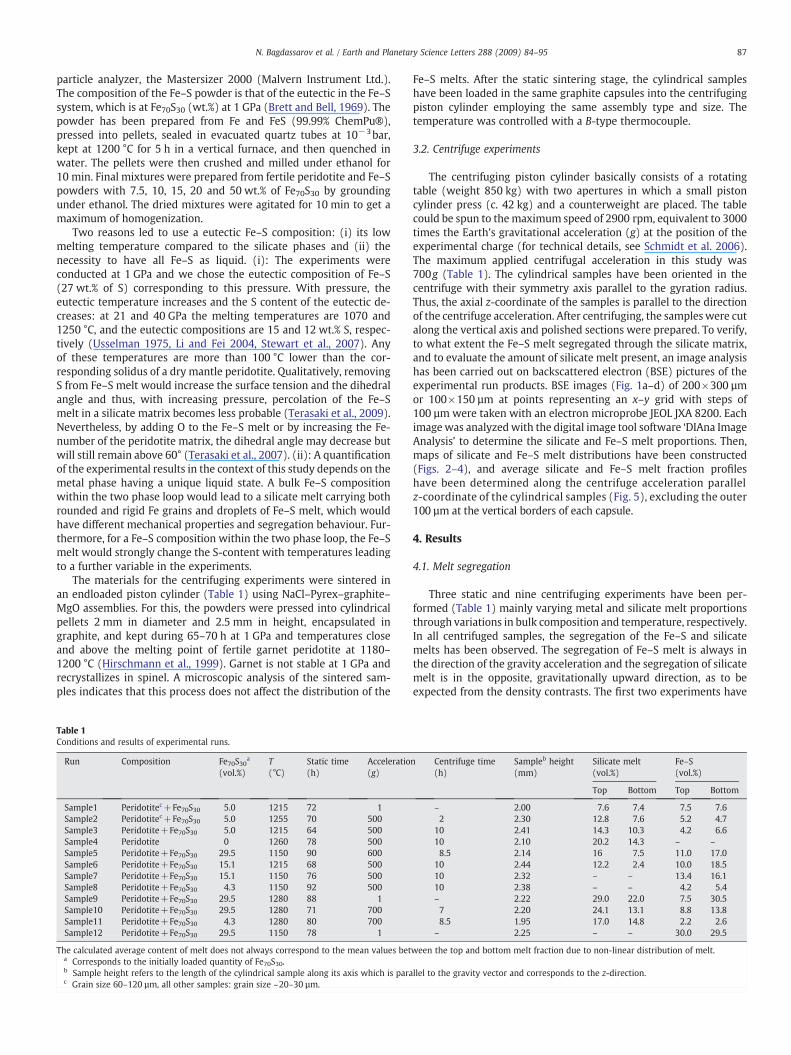
Table 1Conditions and results of experimental runs.
Run Composition Fe70S30a
(vol.%)T(°C)
Static time(h)
Acceleratio(g)
Sample1 Peridotitec+Fe70S30 5.0 1215 72 1Sample2 Peridotitec+Fe70S30 5.0 1255 70 500Sample3 Peridotite+Fe70S30 5.0 1215 64 500Sample4 Peridotite 0 1260 78 500Sample5 Peridotite+Fe70S30 29.5 1150 90 600Sample6 Peridotite+Fe70S30 15.1 1215 68 500Sample7 Peridotite+Fe70S30 15.1 1150 76 500Sample8 Peridotite+Fe70S30 4.3 1150 92 500Sample9 Peridotite+Fe70S30 29.5 1280 88 1Sample10 Peridotite+Fe70S30 29.5 1280 71 700Sample11 Peridotite+Fe70S30 4.3 1280 80 700Sample12 Peridotite+Fe70S30 29.5 1150 78 1
The calculated average content of melt does not always correspond to the mean values beta Corresponds to the initially loaded quantity of Fe70S30.b Sample height refers to the length of the cylindrical sample along its axis which is parac Grain size 60–120 μm, all other samples: grain size ~20–30 μm.
Fe–S melts. After the static sintering stage, the cylindrical sampleshave been loaded in the same graphite capsules into the centrifugingpiston cylinder employing the same assembly type and size. Thetemperature was controlled with a B-type thermocouple.
3.2. Centrifuge experiments
The centrifuging piston cylinder basically consists of a rotatingtable (weight 850 kg) with two apertures in which a small pistoncylinder press (c. 42 kg) and a counterweight are placed. The tablecould be spun to themaximum speed of 2900 rpm, equivalent to 3000times the Earth's gravitational acceleration (g) at the position of theexperimental charge (for technical details, see Schmidt et al. 2006).The maximum applied centrifugal acceleration in this study was700g (Table 1). The cylindrical samples have been oriented in thecentrifuge with their symmetry axis parallel to the gyration radius.Thus, the axial z-coordinate of the samples is parallel to the directionof the centrifuge acceleration. After centrifuging, the sampleswere cutalong the vertical axis and polished sections were prepared. To verify,to what extent the Fe–S melt segregated through the silicate matrix,and to evaluate the amount of silicate melt present, an image analysishas been carried out on backscattered electron (BSE) pictures of theexperimental run products. BSE images (Fig. 1a–d) of 200×300 μmor 100×150 μm at points representing an x–y grid with steps of100 μm were taken with an electron microprobe JEOL JXA 8200. Eachimagewas analyzedwith the digital image tool software ‘DIAna ImageAnalysis’ to determine the silicate and Fe–S melt proportions. Then,maps of silicate and Fe–S melt distributions have been constructed(Figs. 2–4), and average silicate and Fe–S melt fraction profileshave been determined along the centrifuge acceleration parallelz-coordinate of the cylindrical samples (Fig. 5), excluding the outer100 μm at the vertical borders of each capsule.
4. Results
4.1. Melt segregation
Three static and nine centrifuging experiments have been per-formed (Table 1) mainly varying metal and silicate melt proportionsthrough variations in bulk composition and temperature, respectively.In all centrifuged samples, the segregation of the Fe–S and silicatemelts has been observed. The segregation of Fe–S melt is always inthe direction of the gravity acceleration and the segregation of silicatemelt is in the opposite, gravitationally upward direction, as to beexpected from the density contrasts. The first two experiments have
n Centrifuge time(h)
Sampleb height(mm)
Silicate melt(vol.%)
Fe–S(vol.%)
Top Bottom Top Bottom
– 2.00 7.6 7.4 7.5 7.62 2.30 12.8 7.6 5.2 4.7
10 2.41 14.3 10.3 4.2 6.610 2.10 20.2 14.3 – –
8.5 2.14 16 7.5 11.0 17.010 2.44 12.2 2.4 10.0 18.510 2.32 – – 13.4 16.110 2.38 – – 4.2 5.4– 2.22 29.0 22.0 7.5 30.57 2.20 24.1 13.1 8.8 13.88.5 1.95 17.0 14.8 2.2 2.6
– 2.25 – – 30.0 29.5
ween the top and bottom melt fraction due to non-linear distribution of melt.
llel to the gravity vector and corresponds to the z-direction.

Fig. 1. a–d: BSE image of run products. Centrifuge acceleration is downward. White colour is FeS, dark grey colour is orthopyroxene, grey colour is olivine, and light grey colour isrecrystallized spinel. (a) and (b): Peridotite samples with initially ~29.5vol.% Fe–S. Under dynamic conditions the connectivity of Fe–S melt is much less than in a statically annealedsample. (a): Sample 12, statically annealed at Tmax=1150 °C for 78 h, with 30.2vol.% FeS (no centrifuging). (b): Sample 5, annealed at 1150 °C for 90 h and centrifuged during 8.5 hat 600g. (c): Sample 7, peridotite with ~15.1vol.% of Fe–S melt, but without silicate melt after 10 h of centrifuging at 1150 °C and 500g. The width of the image is ~2 mm, compare toFig. 4b. (d): Sample 2, partially molten peridotite with 5vol.% of Fe–S and 10.8vol.% silicate melt after 2 h of centrifuging at 1255 °C and 500g. The arrows show the path ofpercolation of metal melt to the lower boundary of the sample. These paths coincide with the large melt pools near grain boundaries. The mechanism of flow can be represented as acreep of small droplets in channels filled with silicate melt. The black lower part corresponds to the graphite capsule. In this image, the dark grey colour is the peridotite matrix andthe light grey colour is the silicate melt. The large white arrow shows the direction of the accelerative force.
88 N. Bagdassarov et al. / Earth and Planetary Science Letters 288 (2009) 84–95
been run with relatively coarse grained peridotite powders (60–120 μm). To improve texturalmaturation, all further experiments havebeen run with finer grained material (20 μm). The first experiment,
Fig. 2. Distribution of Fe–S liquid (left panel) and silicate melt (right panel) after 10 h of ce(~30 wtvol.%), the average silicate melt content is 8.6vol.%.
sample 1 (Table 1), which was not centrifuged after annealing at1215 °C in a static piston cylinder has been used as a reference of thevertical static silicate and Fe–S melt distribution. With the moderate
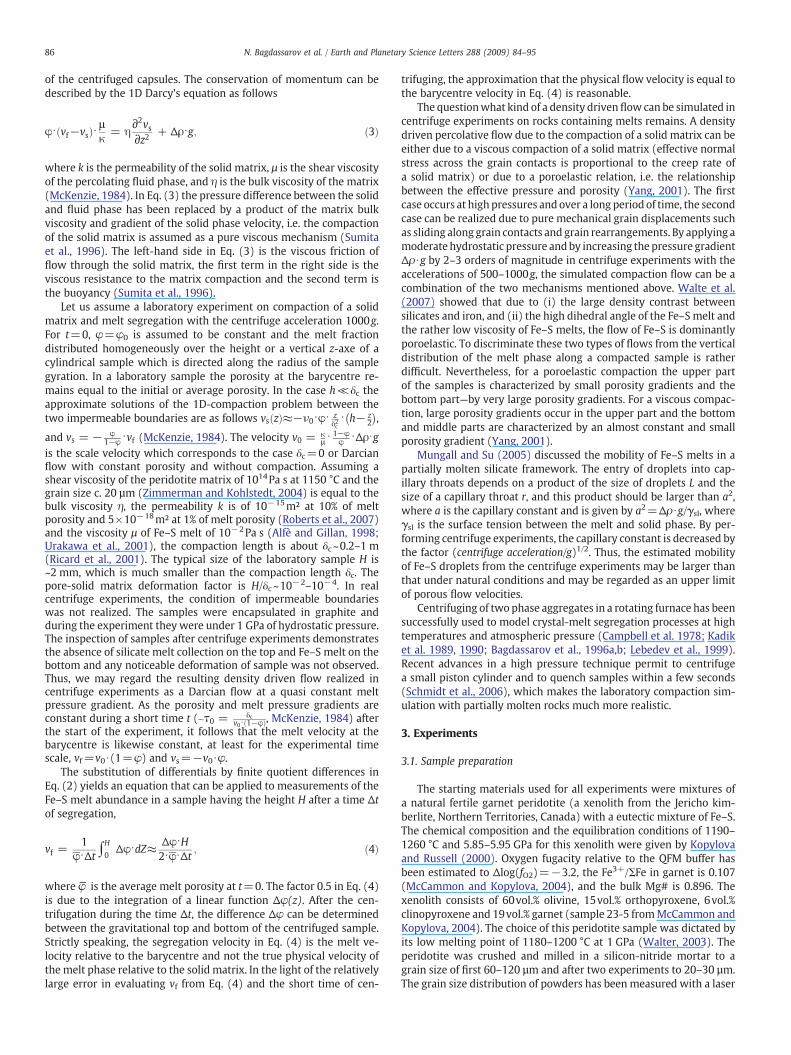
ntrifuging at 1215 °C and 500g (sample 6). The average Fe–S melt content is 14.4vol.%
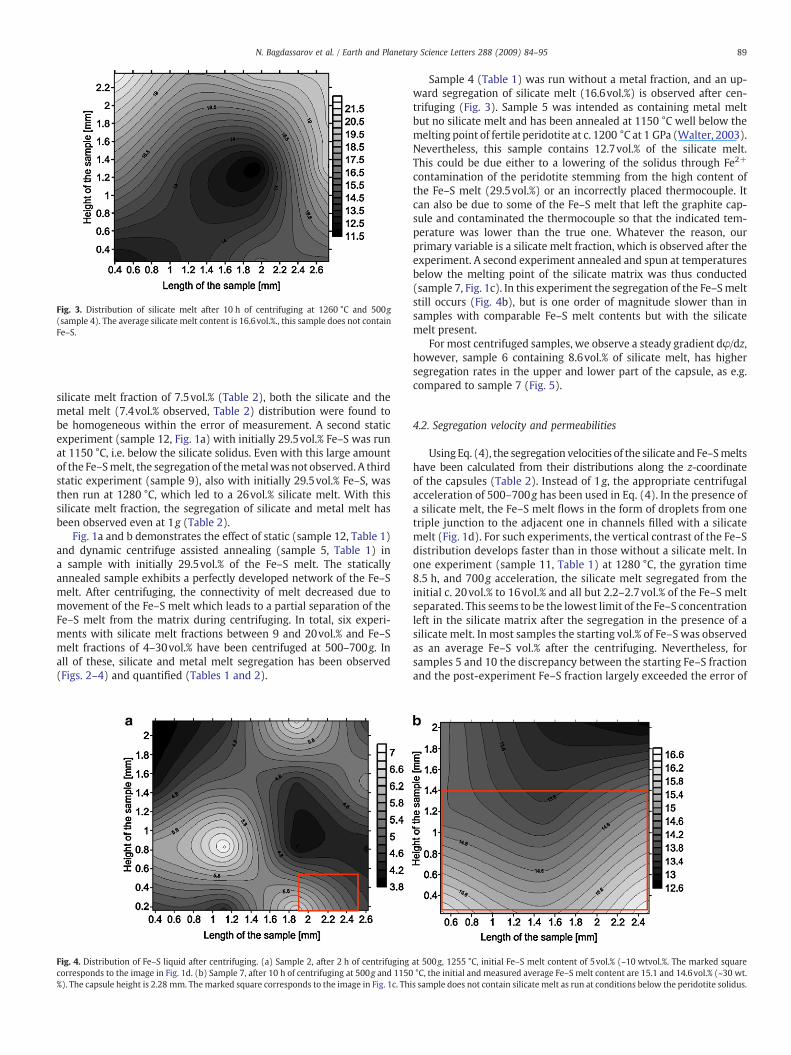
Fig. 3. Distribution of silicate melt after 10 h of centrifuging at 1260 °C and 500g(sample 4). The average silicate melt content is 16.6vol.%., this sample does not containFe–S.
89N. Bagdassarov et al. / Earth and Planetary Science Letters 288 (2009) 84–95
silicate melt fraction of 7.5vol.% (Table 2), both the silicate and themetal melt (7.4vol.% observed, Table 2) distribution were found tobe homogeneous within the error of measurement. A second staticexperiment (sample 12, Fig. 1a) with initially 29.5vol.% Fe–S was runat 1150 °C, i.e. below the silicate solidus. Even with this large amountof the Fe–Smelt, the segregation of themetalwas not observed. A thirdstatic experiment (sample 9), also with initially 29.5vol.% Fe–S, wasthen run at 1280 °C, which led to a 26vol.% silicate melt. With thissilicate melt fraction, the segregation of silicate and metal melt hasbeen observed even at 1g (Table 2).
Fig. 1a and b demonstrates the effect of static (sample 12, Table 1)and dynamic centrifuge assisted annealing (sample 5, Table 1) ina sample with initially 29.5vol.% of the Fe–S melt. The staticallyannealed sample exhibits a perfectly developed network of the Fe–Smelt. After centrifuging, the connectivity of melt decreased due tomovement of the Fe–S melt which leads to a partial separation of theFe–S melt from the matrix during centrifuging. In total, six experi-ments with silicate melt fractions between 9 and 20vol.% and Fe–Smelt fractions of 4–30vol.% have been centrifuged at 500–700g. Inall of these, silicate and metal melt segregation has been observed(Figs. 2–4) and quantified (Tables 1 and 2).
Fig. 4. Distribution of Fe–S liquid after centrifuging. (a) Sample 2, after 2 h of centrifugingcorresponds to the image in Fig. 1d. (b) Sample 7, after 10 h of centrifuging at 500g and 1150%). The capsule height is 2.28 mm. Themarked square corresponds to the image in Fig. 1c. Thi
Sample 4 (Table 1) was run without a metal fraction, and an up-ward segregation of silicate melt (16.6vol.%) is observed after cen-trifuging (Fig. 3). Sample 5 was intended as containing metal meltbut no silicate melt and has been annealed at 1150 °C well below themelting point of fertile peridotite at c. 1200 °C at 1 GPa (Walter, 2003).Nevertheless, this sample contains 12.7vol.% of the silicate melt.This could be due either to a lowering of the solidus through Fe2+
contamination of the peridotite stemming from the high content ofthe Fe–S melt (29.5vol.%) or an incorrectly placed thermocouple. Itcan also be due to some of the Fe–S melt that left the graphite cap-sule and contaminated the thermocouple so that the indicated tem-perature was lower than the true one. Whatever the reason, ourprimary variable is a silicate melt fraction, which is observed after theexperiment. A second experiment annealed and spun at temperaturesbelow the melting point of the silicate matrix was thus conducted(sample 7, Fig. 1c). In this experiment the segregation of the Fe–Smeltstill occurs (Fig. 4b), but is one order of magnitude slower than insamples with comparable Fe–S melt contents but with the silicatemelt present.
For most centrifuged samples, we observe a steady gradient dφ/dz,however, sample 6 containing 8.6vol.% of silicate melt, has highersegregation rates in the upper and lower part of the capsule, as e.g.compared to sample 7 (Fig. 5).
4.2. Segregation velocity and permeabilities
Using Eq. (4), the segregation velocities of the silicate and Fe–Smeltshave been calculated from their distributions along the z-coordinateof the capsules (Table 2). Instead of 1g, the appropriate centrifugalacceleration of 500–700g has been used in Eq. (4). In the presence ofa silicate melt, the Fe–S melt flows in the form of droplets from onetriple junction to the adjacent one in channels filled with a silicatemelt (Fig. 1d). For such experiments, the vertical contrast of the Fe–Sdistribution develops faster than in those without a silicate melt. Inone experiment (sample 11, Table 1) at 1280 °C, the gyration time8.5 h, and 700g acceleration, the silicate melt segregated from theinitial c. 20vol.% to 16vol.% and all but 2.2–2.7vol.% of the Fe–S meltseparated. This seems to be the lowest limit of the Fe–S concentrationleft in the silicate matrix after the segregation in the presence of asilicate melt. In most samples the starting vol.% of Fe–S was observedas an average Fe–S vol.% after the centrifuging. Nevertheless, forsamples 5 and 10 the discrepancy between the starting Fe–S fractionand the post-experiment Fe–S fraction largely exceeded the error of
at 500g, 1255 °C, initial Fe–S melt content of 5vol.% (~10 wtvol.%. The marked square°C, the initial and measured average Fe–S melt content are 15.1 and 14.6vol.% (~30 wt.s sample does not contain silicate melt as run at conditions below the peridotite solidus.
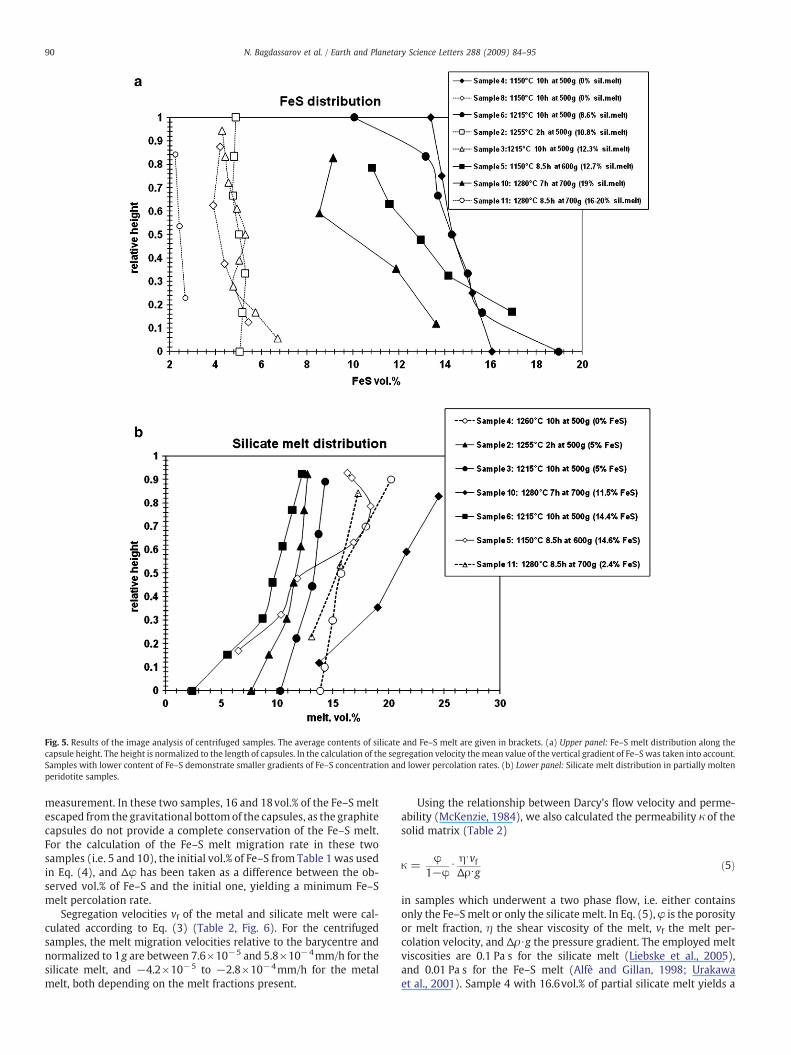
Fig. 5. Results of the image analysis of centrifuged samples. The average contents of silicate and Fe–S melt are given in brackets. (a) Upper panel: Fe–S melt distribution along thecapsule height. The height is normalized to the length of capsules. In the calculation of the segregation velocity themean value of the vertical gradient of Fe–S was taken into account.Samples with lower content of Fe–S demonstrate smaller gradients of Fe–S concentration and lower percolation rates. (b) Lower panel: Silicate melt distribution in partially moltenperidotite samples.
90 N. Bagdassarov et al. / Earth and Planetary Science Letters 288 (2009) 84–95
measurement. In these two samples, 16 and 18vol.% of the Fe–S meltescaped from the gravitational bottomof the capsules, as the graphitecapsules do not provide a complete conservation of the Fe–S melt.For the calculation of the Fe–S melt migration rate in these twosamples (i.e. 5 and 10), the initial vol.% of Fe–S from Table 1 was usedin Eq. (4), and Δφ has been taken as a difference between the ob-served vol.% of Fe–S and the initial one, yielding a minimum Fe–Smelt percolation rate.
Segregation velocities vf of the metal and silicate melt were cal-culated according to Eq. (3) (Table 2, Fig. 6). For the centrifugedsamples, the melt migration velocities relative to the barycentre andnormalized to 1g are between 7.6×10⁻⁵ and 5.8×10⁻⁴mm/h for thesilicate melt, and −4.2×10⁻⁵ to −2.8×10⁻⁴mm/h for the metalmelt, both depending on the melt fractions present.
Using the relationship between Darcy's flow velocity and perme-ability (McKenzie, 1984), we also calculated the permeability κ of thesolid matrix (Table 2)
κ =φ
1−φ⋅ η⋅vfΔρ⋅g ð5Þ
in samples which underwent a two phase flow, i.e. either containsonly the Fe–S melt or only the silicate melt. In Eq. (5), φ is the porosityor melt fraction, η the shear viscosity of the melt, vf the melt per-colation velocity, and Δρ ∙g the pressure gradient. The employed meltviscosities are 0.1 Pa s for the silicate melt (Liebske et al., 2005),and 0.01 Pa s for the Fe–S melt (Alfè and Gillan, 1998; Urakawaet al., 2001). Sample 4 with 16.6vol.% of partial silicate melt yields a
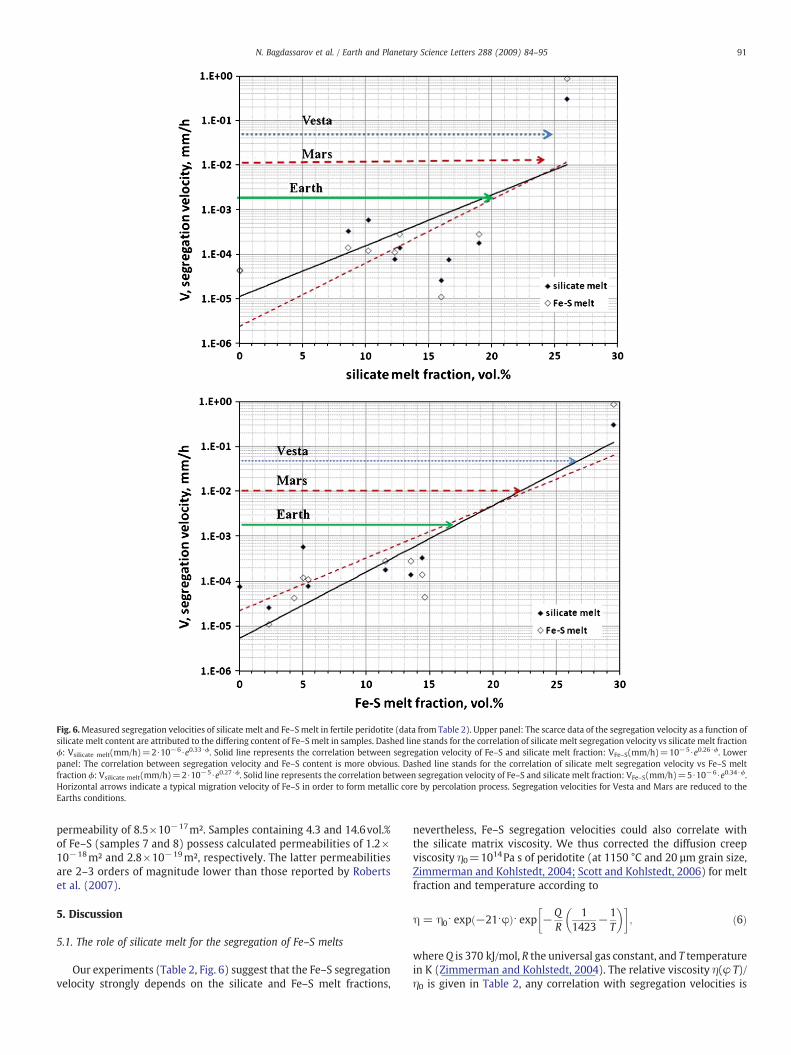
Fig. 6.Measured segregation velocities of silicate melt and Fe–S melt in fertile peridotite (data from Table 2). Upper panel: The scarce data of the segregation velocity as a function ofsilicate melt content are attributed to the differing content of Fe–S melt in samples. Dashed line stands for the correlation of silicate melt segregation velocity vs silicate melt fractionϕ: Vsilicate melt(mm/h)=2 ∙10−6 ∙e0.33 ∙ϕ. Solid line represents the correlation between segregation velocity of Fe–S and silicate melt fraction: VFe–S(mm/h)=10−5 ∙e0.26 ∙ϕ. Lowerpanel: The correlation between segregation velocity and Fe–S content is more obvious. Dashed line stands for the correlation of silicate melt segregation velocity vs Fe–S meltfraction ϕ: Vsilicate melt(mm/h)=2 ∙10−5 ∙e0.27 ∙ϕ. Solid line represents the correlation between segregation velocity of Fe–S and silicate melt fraction: VFe–S(mm/h)=5 ∙10−6 ∙e0.34 ∙ϕ.Horizontal arrows indicate a typical migration velocity of Fe–S in order to form metallic core by percolation process. Segregation velocities for Vesta and Mars are reduced to theEarths conditions.
91N. Bagdassarov et al. / Earth and Planetary Science Letters 288 (2009) 84–95
permeability of 8.5×10⁻¹⁷m². Samples containing 4.3 and 14.6vol.%of Fe–S (samples 7 and 8) possess calculated permeabilities of 1.2×10⁻¹⁸m² and 2.8×10⁻¹⁹m², respectively. The latter permeabilitiesare 2–3 orders of magnitude lower than those reported by Robertset al. (2007).
5. Discussion
5.1. The role of silicate melt for the segregation of Fe–S melts
Our experiments (Table 2, Fig. 6) suggest that the Fe–S segregationvelocity strongly depends on the silicate and Fe–S melt fractions,
nevertheless, Fe–S segregation velocities could also correlate withthe silicate matrix viscosity. We thus corrected the diffusion creepviscosity η0=1014Pa s of peridotite (at 1150 °C and 20 μm grain size,Zimmerman and Kohlstedt, 2004; Scott and Kohlstedt, 2006) for meltfraction and temperature according to
η = η0⋅ expð−21⋅φÞ⋅ exp −QR
11423
− 1T
� �� �; ð6Þ
whereQ is 370 kJ/mol, R the universal gas constant, and T temperaturein K (Zimmerman and Kohlstedt, 2004). The relative viscosity η(φ T)/η0 is given in Table 2, any correlation with segregation velocities is
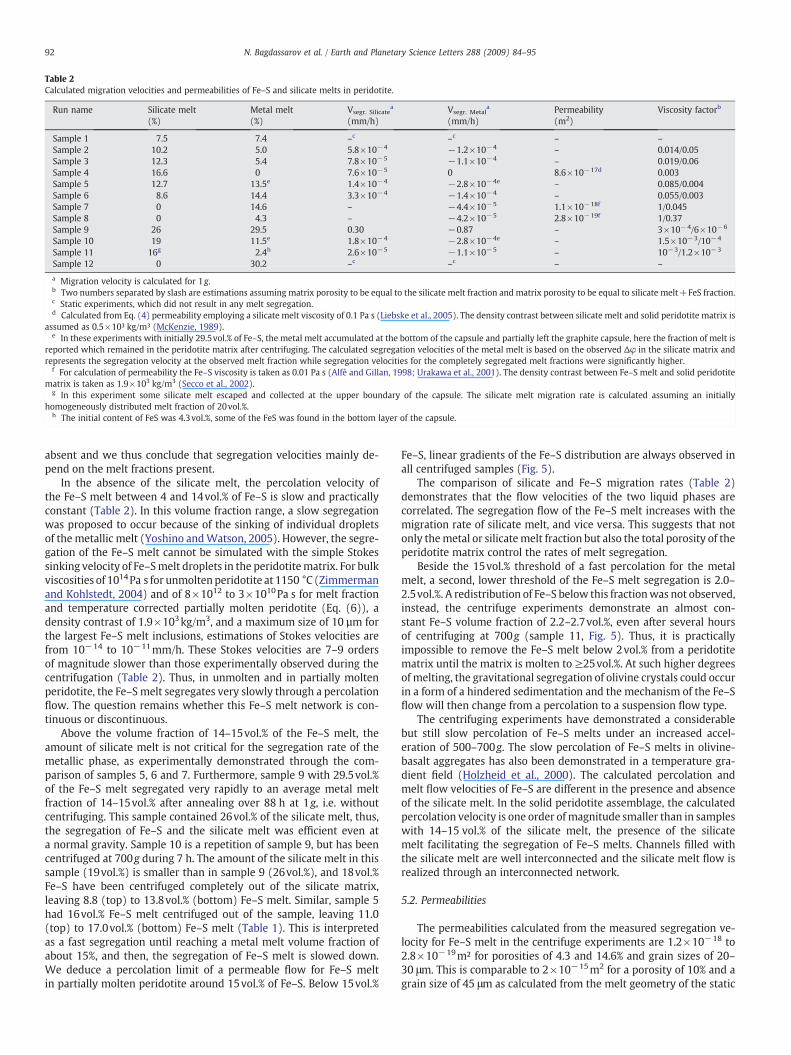
Table 2Calculated migration velocities and permeabilities of Fe–S and silicate melts in peridotite.
Run name Silicate melt(%)
Metal melt(%)
Vsegr. Silicatea
(mm/h)Vsegr. Metal
a
(mm/h)Permeability(m2)
Viscosity factorb
Sample 1 7.5 7.4 –c –c – –
Sample 2 10.2 5.0 5.8×10⁻⁴ −1.2×10⁻⁴ – 0.014/0.05Sample 3 12.3 5.4 7.8×10⁻⁵ −1.1×10⁻⁴ – 0.019/0.06Sample 4 16.6 0 7.6×10⁻⁵ 0 8.6×10⁻¹⁷d 0.003Sample 5 12.7 13.5e 1.4×10⁻⁴ −2.8×10⁻⁴e – 0.085/0.004Sample 6 8.6 14.4 3.3×10⁻⁴ −1.4×10⁻⁴ – 0.055/0.003Sample 7 0 14.6 – −4.4×10⁻⁵ 1.1×10⁻¹⁸f 1/0.045Sample 8 0 4.3 – −4.2×10⁻⁵ 2.8×10⁻¹⁹f 1/0.37Sample 9 26 29.5 0.30 −0.87 – 3×10⁻⁴/6×10−6
Sample 10 19 11.5e 1.8×10⁻⁴ −2.8×10⁻⁴e – 1.5×10⁻³/10−4
Sample 11 16g 2.4h 2.6×10⁻⁵ −1.1×10⁻⁵ – 10−3/1.2×10−3
Sample 12 0 30.2 –c –c – –
a Migration velocity is calculated for 1g.b Two numbers separated by slash are estimations assuming matrix porosity to be equal to the silicate melt fraction and matrix porosity to be equal to silicate melt+FeS fraction.c Static experiments, which did not result in any melt segregation.d Calculated from Eq. (4) permeability employing a silicate melt viscosity of 0.1 Pa s (Liebske et al., 2005). The density contrast between silicate melt and solid peridotite matrix is
assumed as 0.5×10³ kg/m³ (McKenzie, 1989).e In these experiments with initially 29.5vol.% of Fe–S, the metal melt accumulated at the bottom of the capsule and partially left the graphite capsule, here the fraction of melt is
reported which remained in the peridotite matrix after centrifuging. The calculated segregation velocities of the metal melt is based on the observed Δφ in the silicate matrix andrepresents the segregation velocity at the observed melt fraction while segregation velocities for the completely segregated melt fractions were significantly higher.
f For calculation of permeability the Fe–S viscosity is taken as 0.01 Pa s (Alfè and Gillan, 1998; Urakawa et al., 2001). The density contrast between Fe–S melt and solid peridotitematrix is taken as 1.9×10³ kg/m3 (Secco et al., 2002).
g In this experiment some silicate melt escaped and collected at the upper boundary of the capsule. The silicate melt migration rate is calculated assuming an initiallyhomogeneously distributed melt fraction of 20vol.%.
h The initial content of FeS was 4.3vol.%, some of the FeS was found in the bottom layer of the capsule.
92 N. Bagdassarov et al. / Earth and Planetary Science Letters 288 (2009) 84–95
absent and we thus conclude that segregation velocities mainly de-pend on the melt fractions present.
In the absence of the silicate melt, the percolation velocity ofthe Fe–S melt between 4 and 14vol.% of Fe–S is slow and practicallyconstant (Table 2). In this volume fraction range, a slow segregationwas proposed to occur because of the sinking of individual dropletsof the metallic melt (Yoshino andWatson, 2005). However, the segre-gation of the Fe–S melt cannot be simulated with the simple Stokessinking velocity of Fe–Smelt droplets in the peridotitematrix. For bulkviscosities of 1014Pa s for unmoltenperidotite at 1150 °C (Zimmermanand Kohlstedt, 2004) and of 8×10¹² to 3×10¹⁰Pa s for melt fractionand temperature corrected partially molten peridotite (Eq. (6)), adensity contrast of 1.9×10³kg/m3, and a maximum size of 10 μm forthe largest Fe–S melt inclusions, estimations of Stokes velocities arefrom 10−14 to 10−11mm/h. These Stokes velocities are 7–9 ordersof magnitude slower than those experimentally observed during thecentrifugation (Table 2). Thus, in unmolten and in partially moltenperidotite, the Fe–S melt segregates very slowly through a percolationflow. The question remains whether this Fe–S melt network is con-tinuous or discontinuous.
Above the volume fraction of 14–15vol.% of the Fe–S melt, theamount of silicate melt is not critical for the segregation rate of themetallic phase, as experimentally demonstrated through the com-parison of samples 5, 6 and 7. Furthermore, sample 9 with 29.5vol.%of the Fe–S melt segregated very rapidly to an average metal meltfraction of 14–15vol.% after annealing over 88 h at 1g, i.e. withoutcentrifuging. This sample contained 26vol.% of the silicate melt, thus,the segregation of Fe–S and the silicate melt was efficient even ata normal gravity. Sample 10 is a repetition of sample 9, but has beencentrifuged at 700g during 7 h. The amount of the silicate melt in thissample (19vol.%) is smaller than in sample 9 (26vol.%), and 18vol.%Fe–S have been centrifuged completely out of the silicate matrix,leaving 8.8 (top) to 13.8vol.% (bottom) Fe–S melt. Similar, sample 5had 16vol.% Fe–S melt centrifuged out of the sample, leaving 11.0(top) to 17.0vol.% (bottom) Fe–S melt (Table 1). This is interpretedas a fast segregation until reaching a metal melt volume fraction ofabout 15%, and then, the segregation of Fe–S melt is slowed down.We deduce a percolation limit of a permeable flow for Fe–S meltin partially molten peridotite around 15vol.% of Fe–S. Below 15vol.%
Fe–S, linear gradients of the Fe–S distribution are always observed inall centrifuged samples (Fig. 5).
The comparison of silicate and Fe–S migration rates (Table 2)demonstrates that the flow velocities of the two liquid phases arecorrelated. The segregation flow of the Fe–S melt increases with themigration rate of silicate melt, and vice versa. This suggests that notonly themetal or silicatemelt fraction but also the total porosity of theperidotite matrix control the rates of melt segregation.
Beside the 15vol.% threshold of a fast percolation for the metalmelt, a second, lower threshold of the Fe–S melt segregation is 2.0–2.5vol.%. A redistribution of Fe–S below this fractionwas not observed,instead, the centrifuge experiments demonstrate an almost con-stant Fe–S volume fraction of 2.2–2.7vol.%, even after several hoursof centrifuging at 700g (sample 11, Fig. 5). Thus, it is practicallyimpossible to remove the Fe–S melt below 2vol.% from a peridotitematrix until the matrix is molten to ≥25vol.%. At such higher degreesof melting, the gravitational segregation of olivine crystals could occurin a form of a hindered sedimentation and the mechanism of the Fe–Sflow will then change from a percolation to a suspension flow type.
The centrifuging experiments have demonstrated a considerablebut still slow percolation of Fe–S melts under an increased accel-eration of 500–700g. The slow percolation of Fe–S melts in olivine-basalt aggregates has also been demonstrated in a temperature gra-dient field (Holzheid et al., 2000). The calculated percolation andmelt flow velocities of Fe–S are different in the presence and absenceof the silicate melt. In the solid peridotite assemblage, the calculatedpercolation velocity is one order of magnitude smaller than in sampleswith 14–15 vol.% of the silicate melt, the presence of the silicatemelt facilitating the segregation of Fe–S melts. Channels filled withthe silicate melt are well interconnected and the silicate melt flow isrealized through an interconnected network.
5.2. Permeabilities
The permeabilities calculated from the measured segregation ve-locity for Fe–S melt in the centrifuge experiments are 1.2×10⁻¹⁸ to2.8×10−19m² for porosities of 4.3 and 14.6% and grain sizes of 20–30 μm. This is comparable to 2×10⁻¹⁵m2 for a porosity of 10% and agrain size of 45 μm as calculated from the melt geometry of the static
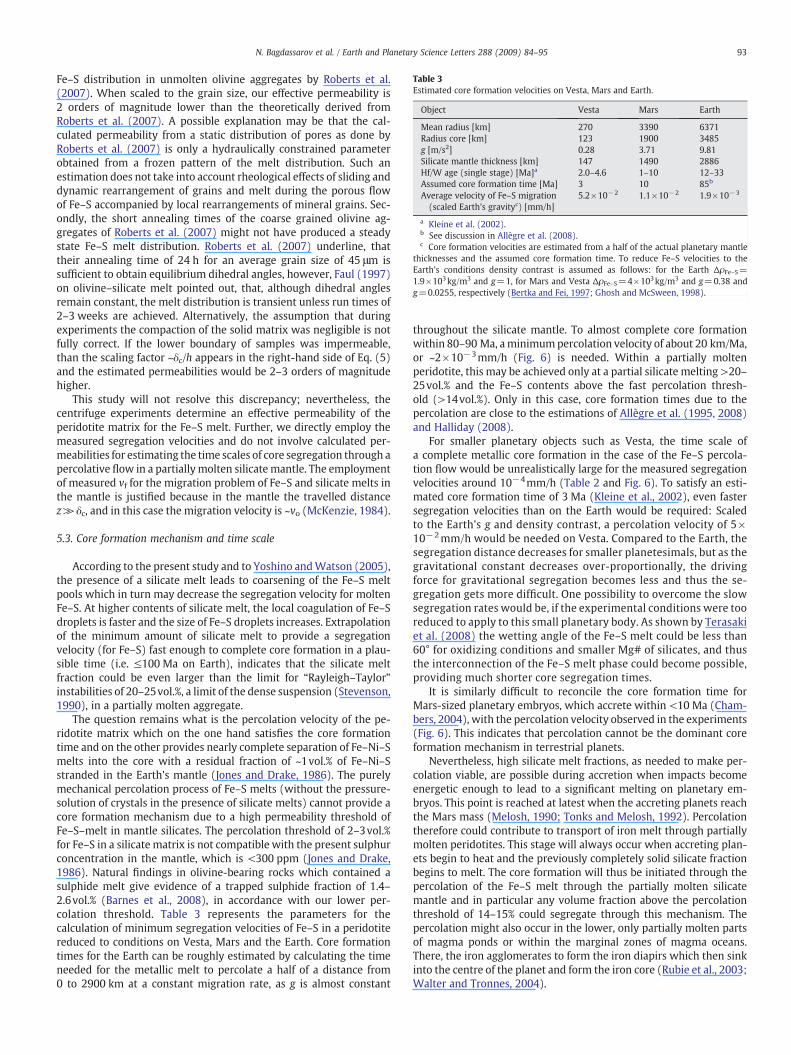
Table 3Estimated core formation velocities on Vesta, Mars and Earth.
Object Vesta Mars Earth
Mean radius [km] 270 3390 6371Radius core [km] 123 1900 3485g [m/s2] 0.28 3.71 9.81Silicate mantle thickness [km] 147 1490 2886Hf/W age (single stage) [Ma]a 2.0–4.6 1–10 12–33Assumed core formation time [Ma] 3 10 85b
Average velocity of Fe–S migration(scaled Earth's gravityc) [mm/h]
5.2×10⁻² 1.1×10⁻² 1.9×10⁻³
a Kleine et al. (2002).b See discussion in Allègre et al. (2008).c Core formation velocities are estimated from a half of the actual planetary mantle
thicknesses and the assumed core formation time. To reduce Fe–S velocities to theEarth's conditions density contrast is assumed as follows: for the Earth ΔρFe–S=1.9×10³kg/m3 and g=1, for Mars and Vesta ΔρFe–S=4×10³kg/m3 and g=0.38 andg=0.0255, respectively (Bertka and Fei, 1997; Ghosh and McSween, 1998).
93N. Bagdassarov et al. / Earth and Planetary Science Letters 288 (2009) 84–95
Fe–S distribution in unmolten olivine aggregates by Roberts et al.(2007). When scaled to the grain size, our effective permeability is2 orders of magnitude lower than the theoretically derived fromRoberts et al. (2007). A possible explanation may be that the cal-culated permeability from a static distribution of pores as done byRoberts et al. (2007) is only a hydraulically constrained parameterobtained from a frozen pattern of the melt distribution. Such anestimation does not take into account rheological effects of sliding anddynamic rearrangement of grains and melt during the porous flowof Fe–S accompanied by local rearrangements of mineral grains. Sec-ondly, the short annealing times of the coarse grained olivine ag-gregates of Roberts et al. (2007) might not have produced a steadystate Fe–S melt distribution. Roberts et al. (2007) underline, thattheir annealing time of 24 h for an average grain size of 45 μm issufficient to obtain equilibrium dihedral angles, however, Faul (1997)on olivine–silicate melt pointed out, that, although dihedral anglesremain constant, the melt distribution is transient unless run times of2–3 weeks are achieved. Alternatively, the assumption that duringexperiments the compaction of the solid matrix was negligible is notfully correct. If the lower boundary of samples was impermeable,than the scaling factor ~δc/h appears in the right-hand side of Eq. (5)and the estimated permeabilities would be 2–3 orders of magnitudehigher.
This study will not resolve this discrepancy; nevertheless, thecentrifuge experiments determine an effective permeability of theperidotite matrix for the Fe–S melt. Further, we directly employ themeasured segregation velocities and do not involve calculated per-meabilities for estimating the time scales of core segregation through apercolative flow in a partiallymolten silicatemantle. The employmentof measured vf for the migration problem of Fe–S and silicate melts inthe mantle is justified because in the mantle the travelled distancez≫δc, and in this case the migration velocity is ~vo (McKenzie, 1984).
5.3. Core formation mechanism and time scale
According to the present study and to Yoshino andWatson (2005),the presence of a silicate melt leads to coarsening of the Fe–S meltpools which in turn may decrease the segregation velocity for moltenFe–S. At higher contents of silicate melt, the local coagulation of Fe–Sdroplets is faster and the size of Fe–S droplets increases. Extrapolationof the minimum amount of silicate melt to provide a segregationvelocity (for Fe–S) fast enough to complete core formation in a plau-sible time (i.e. ≤100 Ma on Earth), indicates that the silicate meltfraction could be even larger than the limit for “Rayleigh–Taylor”instabilities of 20–25vol.%, a limit of the dense suspension (Stevenson,1990), in a partially molten aggregate.
The question remains what is the percolation velocity of the pe-ridotite matrix which on the one hand satisfies the core formationtime and on the other provides nearly complete separation of Fe–Ni–Smelts into the core with a residual fraction of ~1vol.% of Fe–Ni–Sstranded in the Earth's mantle (Jones and Drake, 1986). The purelymechanical percolation process of Fe–S melts (without the pressure-solution of crystals in the presence of silicate melts) cannot provide acore formation mechanism due to a high permeability threshold ofFe–S–melt in mantle silicates. The percolation threshold of 2–3vol.%for Fe–S in a silicate matrix is not compatible with the present sulphurconcentration in the mantle, which is <300 ppm (Jones and Drake,1986). Natural findings in olivine-bearing rocks which contained asulphide melt give evidence of a trapped sulphide fraction of 1.4–2.6vol.% (Barnes et al., 2008), in accordance with our lower per-colation threshold. Table 3 represents the parameters for thecalculation of minimum segregation velocities of Fe–S in a peridotitereduced to conditions on Vesta, Mars and the Earth. Core formationtimes for the Earth can be roughly estimated by calculating the timeneeded for the metallic melt to percolate a half of a distance from0 to 2900 km at a constant migration rate, as g is almost constant
throughout the silicate mantle. To almost complete core formationwithin 80–90 Ma, aminimumpercolation velocity of about 20 km/Ma,or ~2×10⁻³mm/h (Fig. 6) is needed. Within a partially moltenperidotite, this may be achieved only at a partial silicate melting >20–25vol.% and the Fe–S contents above the fast percolation thresh-old (>14vol.%). Only in this case, core formation times due to thepercolation are close to the estimations of Allègre et al. (1995, 2008)and Halliday (2008).
For smaller planetary objects such as Vesta, the time scale ofa complete metallic core formation in the case of the Fe–S percola-tion flow would be unrealistically large for the measured segregationvelocities around 10−4mm/h (Table 2 and Fig. 6). To satisfy an esti-mated core formation time of 3 Ma (Kleine et al., 2002), even fastersegregation velocities than on the Earth would be required: Scaledto the Earth's g and density contrast, a percolation velocity of 5×10⁻²mm/h would be needed on Vesta. Compared to the Earth, thesegregation distance decreases for smaller planetesimals, but as thegravitational constant decreases over-proportionally, the drivingforce for gravitational segregation becomes less and thus the se-gregation gets more difficult. One possibility to overcome the slowsegregation rates would be, if the experimental conditions were tooreduced to apply to this small planetary body. As shown by Terasakiet al. (2008) the wetting angle of the Fe–S melt could be less than60° for oxidizing conditions and smaller Mg# of silicates, and thusthe interconnection of the Fe–S melt phase could become possible,providing much shorter core segregation times.
It is similarly difficult to reconcile the core formation time forMars-sized planetary embryos, which accrete within <10 Ma (Cham-bers, 2004), with the percolation velocity observed in the experiments(Fig. 6). This indicates that percolation cannot be the dominant coreformation mechanism in terrestrial planets.
Nevertheless, high silicate melt fractions, as needed to make per-colation viable, are possible during accretion when impacts becomeenergetic enough to lead to a significant melting on planetary em-bryos. This point is reached at latest when the accreting planets reachthe Mars mass (Melosh, 1990; Tonks and Melosh, 1992). Percolationtherefore could contribute to transport of iron melt through partiallymolten peridotites. This stage will always occur when accreting plan-ets begin to heat and the previously completely solid silicate fractionbegins to melt. The core formation will thus be initiated through thepercolation of the Fe–S melt through the partially molten silicatemantle and in particular any volume fraction above the percolationthreshold of 14–15% could segregate through this mechanism. Thepercolation might also occur in the lower, only partially molten partsof magma ponds or within the marginal zones of magma oceans.There, the iron agglomerates to form the iron diapirs which then sinkinto the centre of the planet and form the iron core (Rubie et al., 2003;Walter and Tronnes, 2004).

94 N. Bagdassarov et al. / Earth and Planetary Science Letters 288 (2009) 84–95
From the present study three facts were established:
(1) For Fe–S fractions up to 15vol.%, the percolation is not fastwith or without silicate melt. Only at a threshold >15vol.% thisprocess could be responsible for an initial stage of core for-mation resulting in metal cores equal to a few percent of theplanetesimals volume.
(2) The effective permeability of silicate melt in a peridotite is10−16–10−17m2 at 10–15vol.% of a partial melting employ-ing the silicate melt viscosity 0.1 Pa s.
(3) In a peridotite matrix without a partial silicate melting, theeffective permeability of Fe–S liquids is 10−18–10−19m2 at 5–15vol.% Fe–S melt employing the viscosity of molten Fe–S of0.01 Pa s. This is in contrast in comparison with the resultsfrom static annealing experiments, where the permeability ofFe–S melts without partial silicate melting has been estimatedto 10−15m2 at 10vol.% of Fe–S (Roberts et al., 2007), but it isin a full agreement with the conclusions of Walte et al. (2007)on the low mobility of a melt phase in a solid matrix with highwetting angles.
The transport of Fe–S liquids occurs via sinking of small droplets inchannels already filled with a partial silicate melt. The sinking processis slow enough to equilibrate the Fe–S melt with the silicate melt. TheFe–S phase is not interconnected during the sinking process but stillmovable and raining through channels. Due to the counter flows ofthe buoyant silicate melt and sinking Fe–S droplets, the effectiveviscosity which dominates the viscous flow is the shear viscosity ofthe partial silicate melt. This may explain why the segregation ofsilicate and Fe–Smelts occurs on the same time scale, regardless of thedifference of their viscosities.
The experiments performed in this study confirm that either (i) ahigh degree of silicate melting on early formed planetesimals like Vestais needed for a complete core segregation to take place (Stevenson,1990; Taylor, 1992; Greenwood et al., 2005), a result confirmed numer-ically by Merk et al. (2002), or (ii) a high oxygen fugacity (Terasakiet al., 2008) is needed to allow the rapid metal–silicate segregation. Apossible alternative, at least for some initial segregation, is given by highshear stresses and deformation of a subsolidus silicate matrix, whichallows the Fe–Smelt tomigrate into cracks (Bruhn et al., 2000; Rushmeret al., 2005). However, this mechanism is feasible only for the shorttemperature interval between the Fe–S and silicate solidi, but couldhelpto initiate segregation through locally increased Fe–S fractions.
6. Conclusions
In the light of the presented results on the percolation velocitiesof Fe–S melts in peridotite and partially molten peridotite, the se-gregation via a percolation flow could contribute to the formation ofthe core on the Earth, Mars and on planetesimals like Vesta only at theearly accretion stage of the core segregation as suggested by Terasakiet al. (2008). The percolation flow of Fe–S alone is too slow to bethe dominant core formation mechanism in terrestrial planets; it cannevertheless initiate core formation.
1. The segregation of Fe–S melt through the percolation in an un-molten olivine-dominated silicate matrix is too slow to contributesignificantly to the core formation. Segregation within a partiallymolten silicate matrix is not fast enough to complete the coreformation in Mars- and Earth-sized planetary bodies within a rea-sonable time, butmay contribute considerably at the early accretionstage.
2. During the accretion of terrestrial planets, the percolation of Fe–Scould have played some role in the upper parts of the silicatemantle during the period of giant impacts when the degree of thepartial silicate melting was larger than 20–25vol.%. Independentof the final core forming mechanism, the first significant Fe–S
segregation may occur through the percolation of Fe–S melt drop-lets in a partially molten silicate matrix, as demonstrated in thisstudy.
3. The lower percolation threshold for the “peridotite plus iron–sulphur” with partial silicate melt is 2–3vol.%, and is almost com-patible with the calculated “residual” amount of trapped sulphidemelts in the Earth's mantle, which is around 1vol.% (~2.0–2.5 wt.%,Jones and Drake, 1986), and with the experimental results of me-chanical extraction of Fe–S melts under shear deformation ~1vol.%,(Hustoft and Kohlstedt 2006).
Acknowledgements
We thank Jamie Connolly and Jim Mungall for thoughtful and veryconstructive suggestions, which helped to clarify the manuscript. GSwas supported by ETH grant TH 20/03-2 and the centrifuge work bySNF grant 200020-111725-1.
References
Alfè, D., Gillan, M.J., 1998. First-principles simulations of liquid Fe–S under Earth's coreconditions. Phys. Rev., B 58, 8248–8256.
Allègre, C.J., Manhès, G., Göpel, C., 1995. The age of the Earth. Geochim. Cosmochim.Acta 59, 1445–1456.
Allègre, C.J., Manhès, G., Göpel, C., 2008. The major differentiation of the Earth at~4.45 Ga. Earth Planet. Sci. Lett. 267, 386–398. doi:10.1016/j.epsl.2007.11.056.
Bagdassarov, N., Dorfman, A., Dingwell, D.B., 1996a. Centrifuging of partially moltengranites at high temperature: I. Compaction vs. deformation. Geophys. J. Int. 127,616–626.
Bagdassarov, N., Dorfman, A., Dingwell, D.B., 1996b. Centrifuging of partially moltengranites at high temperature: II. Rayleigh–Taylor instability and Stokes sedimen-tation. Geophys. J. Int. 127, 627–634.
Ballhaus, Ch., Ellis, D.J., 1996. Mobility of core melts during Earth's accretion. EarthPlanet. Sci. Lett. 143, 137–145.
Barnes, S.J., Fiorentini, M.L., Austin, P., Gessner, K., Hough, R.M., Squelch, A.P., 2008.Three-dimensional morphology of magmatic sulfides sheds light on ore formationand sulphide melt migration. Geology 36, 655–658.
Bertka, C.M., Fei, Y., 1997. Mineralogy of theMartian interior up to core–mantle boundarypressures. J. Geophys. Res. 102, 5251–5264.
Boyet, M., Carlson, R.W., 2005. 142Nd evidence for early (>4.53 Ga) global differentiationof the silicate Earth. Science 309, 576–581. doi:10.1126/science.1113634.
Brett, R., Bell, P.M., 1969. Melting relations in the Fe-rich portion of the system Fe–FeS at30 kb pressure. Earth Planet. Sci. Lett. 6, 479–482.
Bruhn, D., Groebner, N., Kohlstedt, D.L., 2000. An interconnected network of coreforming melts produced by shear deformation. Nature 403, 883–886.
Campbell, I.H., Roeder, P.L., Dixon, J.M., 1978. Plagioclase buoyancy in basaltic liquids asdetermined with a centrifuge furnace. Contrib. Mineral. Petrol. 67, 369–377.
Canup, R.M., Agnor, C.B., 2000. Accretion of the terrestrial planets and the Earth–Moonsystem. In: Canup, R.M., Righter, K. (Eds.), Origin of the Earth and Moon. Univ. ofArizona Press, pp. 113–129.
Chambers, J.E., 2004. Planetary accretion in the inner Solar System. Earth Planet. Sci.Lett. 223, 241–252. doi:10.1016/j.epsl.2004.04.031.
Faul, U.H., 1997. Permeability of partially molten upper mantle rocks from experimentsand percolation theory. J. Geophys. Res. 102, 10299–10311.
Gaetani, G.A., Grove, T.L., 1999. Wetting of mantle olivine by sulphide melt: implicationfor Re/Os ratios inmantle peridotite and late-stage core formation. Earth Planet. Sci.Lett. 169, 147–163.
Ghosh, A., McSween, H.J., 1998. The thermal model for differentiation of asteroid 4Vesta, based on the radiogenic heating. Icarus 134, 187–206.
Greenwood, R.C., Franchi, I.A., Jambon, A., Buchanan, P.C., 2005.Widespreadmagmaoceanson asteroidal bodies in the early solar system. Nature 435, 916–918. doi:10.1038/nature03612.
Halliday, A.N., 2008. A young Moon-forming giant impact at 70–110 million yearsaccompanied by late-stage mixing, core formation and degassing of the Earth. Philos.Trans. R. Soc., A 366, 4163–4181. doi:10.1098/rsta.2008.0209.
Hirschmann, M.M., Asimow, P.D., Giorso, M.S., Stolper, E.M., 1999. Calculations ofperidotite partial melting from thermodynamic models of minerals and melts. III.Controls on isobaric melt production and the effect of water on melt production.J. Petrol. 40, 831–851.
Holzheid, A., Schmitz, M.D., Grove, T.L., 2000. Textural equilibria of iron sulfide liquidsin partly molten silicate aggregates and their relevance to core formation scenarios.J. Geophys. Res. 105 (B6), 13,555–13,567.
Hustoft, J.W., Kohlstedt, D.L., 2006. Metal–silicate segregation in deforming duniticrocks. Geochem. Geophys. Geosyst. 7, Q02001. doi:10.1029/2005GC001048.
Jones, J.H., Drake, M.J., 1986. Geochemical constraints on core formation in the Earth.Nature 322, 221–228.
Kadik, A.A., Lebedev, E.B., Dorfman, A.M., Bagdassarov, N.S., 1989. Simulating crystal–magma separation in a centrifuge. Geochem. Int. 26, 39–48.

95N. Bagdassarov et al. / Earth and Planetary Science Letters 288 (2009) 84–95
Kadik, A.A., Dorfman, A.M., Bagdassarov, N.S., Lebedev, E.B., 1990. Influence of pyroxeneson the melt distribution in the intergranular space in peridotites. Geochem. Int. 27,131–134.
Kleine, T., Münker, C., Mezger, K., Palme, H., 2002. Rapid accretion and early coreformation on asteroids and the terrestrial planets from Hf–W chronometry. Nature418, 952–955. doi:10.1038/nature00982.
Kleine, T., Mezger, K., Münker, C., Palme, H., Bischoff, A., 2004. 182Hf–182W isotopesystematics of chondrites, eucrites, and Martian meteorites: chronology of coreformation and early mantle differentiation in Vesta and Mars. Geochim. Cosmo-chim. Acta 68, 2935–2946. doi:10.1016/j.gca.2004.01.009.
Kleine, T., Palme,H.,Mezger,K., Halliday,A.N., 2005.Hf–Wchronometryof lunarmetals andthe age and early differentiation of the Moon. Science 310, 1671–1674. doi:10.1126/science.1118842.
Kopylova, M.G., Russell, J.K., 2000. Chemical stratification of cratonic lithosphere:constraints from Northern Slave Craton, Canada. Earth Planet. Sci. Lett. 181, 71–87.
Lebedev, E.B., Kadik, A.A., Kuskov, O.L., Dorfman, A.M., Lukanin, O.A., 1999. The motionof sulfide phases in a partially molten silicate material: application to the problemof the formation of planetary cores. Sol. Syst. Res. 33 (5), 346–350.
Lee, J., Agee, C.B., 1996. Geochemistry of mantle–core differentiation at high pressure.Nature 381, 686–689.
Li, J., Fei, Y., 2004. Experimental Constraints on CoreComposition. Treatise of Geochemistry,vol. 2. Elsevier, New York, pp. 521–546.
Liebske, C., Schmickler, B., Tersaki, H., Poe, B.T., Suzuki, A., Funakoshi, K.-i., Ando, R.,Rubie, D.C., 2005. Viscosity of peridotite liquid up to 13 GPa: implications formagma ocean viscosities. Earth Planet. Sci. Lett. 240, 589–604. doi:10.1016/j.epsl.2005.10.004.
Melosh, H.J., 1990. Giant impacts and the thermal state of the early Earth. In: Newsom,H.E., Jones, J.H. (Eds.), Origin of the Earth. Oxford Univ. Press, New York, pp. 69–83.
Merk, R., Breuer, D., Spohn, T., 2002. Numericalmodeling of 26Al-induced radioactivemeltingof asteroids considering accretion. Icarus 159, 183–191. doi:10.1006/icar.2002.6872.
McCammon,C., Kopylova,M.G., 2004.A redoxprofile of theSlavemantle andoxygen fugacitycontrol in the cratonicmantle. Contrib.Mineral. Petrol. 148, 55–68. doi:10.1007/s00410-004-0583-1.
McKenzie, D., 1984. The generation and compaction of partially molten rock. J. Petrol.25, 713–765.
McKenzie, D., 1989. Some remarks on the movement of small melt fractions in themantle. Earth Planet. Sci. Lett. 95, 53–72.
Minarik, W.G., Ryerson, F.J., Watson, E.B., 1996. Textural entrapment of core-formingmelts. Science 272, 530–533.
Mungall, J.E., Su, Sh., 2005. Interfacial tension between magmatic sulphide and silicateliquids: constraints on kinetics of sulphide liquation and sulphide migration throughsilicate rocks. Earth Planet. Sci. Lett. 234, 135–149. doi:10.1016/j.epsl.2005.02.035.
Nimmo, F., Agnor, C.B., 2006. Isotopic outcomes of N-body accretion simulation:constraints on equilibration processes during large impacts from Hf/W observa-tions. Earth Planet. Sci. Lett. 243, 26–43.
Nimmo, F., Kleine, T., 2007. How rapidly did Mars accrete? Uncertainties in the Hf–Wtiming of core formation. Icarus 191, 497–504. doi:10.1016/j.icarus.2007.05.002.
Ricard, Y., Bercovici, D., Schubert, G., 2001. A two-phase model for compaction anddamage. 2. Application to compaction, deformation, and the role of interfacialsurface tension. J. Geophys. Res. 106, 8907–8924.
Roberts, J.J., Kinney, J.H., Siebert, J., Ryerson, F.J., 2007. Fe–Ni–S melt permeability inolivine: implication for planetary core formation. Geophys. Res. Lett. 34, L14306.doi:10.1029/2007GL030497.
Rubie, D.C., Melosh, H.J., Reid, J.E., Liebske, C., Righter, K., 2003. Mechanism of metal–silicate equilibration in the terrestrial magma ocean. Earth Planet. Sci. Lett. 205,239–255.
Rushmer, T., Petford, N., Humayan, M., Campbell, A.J., 2005. Fe–liquid segregation indeforming planetesimals: coupling core-forming compositions with transportphenomena. Earth Planet. Sci. Lett. 239, 185–202.
Schmidt, M.W., Connolly, J.A.D., Günther, D., Bogaerts, M., 2006. Element partitioning:the role of melt structure and composition. Science 312, 1646–1650. doi:10.1126/science.1126690.
Scott, T.,Kohlstedt,D.L., 2006.Theeffectof largemelt fractionon thedeformationbehaviourof peridotite. Earth Planet. Sci. Lett. 246, 177–187. doi:10.1016/j.epsl.2006.04.027.
Secco, R.A., Rutter, M.D., Balog, S.P., Liu, H., Rubie, D.C., Uchida, T., Frost, D., Wang, Y.,Rivers, M., Sutton, S.R., 2002. Viscosity and density of Fe–S liquids at high pressures.J. Phys. Condens. Matter 14, 11325–11330.
Stevenson, D.J., 1990. Fluid dynamics of core formation. In: Newsom, H.E., Jones, J.H.(Eds.), Origin of the Earth. Oxford Univ. Press, Houston, pp. 231–249.
Stewart, A.J., Schmidt, M.W., van Westrenen, W., Liebske, C., 2007. Mars: a new corecrystallization regime. Science 316, 1323–1325.
Sumita, I., Yoshida, Sh., Kumazawa, M., Hamano, Y., 1996. A model for sedimentarycompaction of a viscous medium and its application to inner core growth. Geophys.J. Int. 124, 502–524.
Taylor, G.J., 1992. Core formation in asteroids. J. Geophys. Res. 97 (E9), 14717–14726.Terasaki, H., Frost, D.J., Rubie, D.C., Langenhorst, F., 2007. Interconnectivity of Fe–O–S
liquid in polycrystalline silicate perovskite at lower mantle conditions. Phys. EarthPlanet. Inter. 161, 170–176. doi:10.1016/j.pepi.2007.01.011.
Terasaki, H., Frost, D.J., Rubie, D.C., Langenhorst, F., 2008. Percolative core formation inplanetesimals. Earth Planet. Sci. Lett. doi:10.1016/j.epsl.2008.06.019.
Terasaki, H., Urakawa, S., Funakoshi, K., Nishiyama, N., Wang, Y., Nishida, K., Sakamaki,T., Suzuki, A., Ohtani, E., 2009. In situ measurements of interfacial tension of Fe–Sand Fe–P liquids under high pressure using X-ray radiography and tomographytechniques. Phys. Earth Planet. Inter. doi:10.1016/j.pepi.2009.01.004.
Tonks, W.B., Melosh, H.J., 1992. Core formation by giant impacts. Icarus 100, 326–346.Urakawa, S., Terasaki, H., Funakoshi, K., Kato, T., Suzuki, A., 2001. Radiographic study on
the viscosity of the Fe–FeS melts at the pressure of 5 to 7 GPa. Am. Mineral. 86 (4),578–582.
Usselman, T.M., 1975. Experimental approach to the state of the core: part I. Theliquidus relations of the Fe-rich portion of the Fe–Ni– S system from 30 to 100 kbar.Am. J. Sci. 275, 278–290.
Wade, J., Wood, B.J., 2005. Core formation and the oxidation state of the Earth. EarthPlanet. Sci. Lett. 236, 78–95. doi:10.1016/j.epsl.2005.05.017.
Walte, N.P., Becker, J.K., Bons, P.D., Rubie, D.C., Frost, D.J., 2007. Liquid-distribution andattainment of textural equilibrium in a partially-molten crystalline system with ahigh-dihedral-angle liquid phase. Earth Planet. Sci. Lett. 262, 517–532. doi:10.1016/j.epsl.2007.08.003.
Walter, M.J., 2003. Melt extraction and Compositional Variability inMantle Lithosphere.Treatise in Geochemistry. Elsevier, pp. 363–394. Chapter 2.08.
Walter, M.J., Tronnes, R.J., 2004. Early Earth differentiation. Earth Planet. Sci Lett. 225,253–269.
Wetherill, G.W., 1975. Radiometric chronology of the early solar system. Annu. Rev.Nuc. Sci. 25, 283–328.
Wood, B.J., Halliday, A.N., 2005. Cooling of the Earth and core formation after the giantimpact. Nature 437 (27), 1345–1348. doi:10.1038/nature04129.
Wood, B.J., Walter, M.J., Wade, J., 2006. Accretion of the Earth and segregation of itscore. Nature 441, 825–833. doi:10.1038/nature04763.
Yang, X.-s., 2001. Density driven compactional flow in porous media. J. Comput. Appl.Math. 130, 245–257.
Yoshino, T., Watson, E.B., 2005. Growth kinetics of FeS melt in partially molten peridotite:an analogue for core-forming processes. Earth Planet. Sci. Lett. 235, 453–468.doi:10.1016/j.epsl.2005.04.021.
Yoshino, T., Walter, M.J., Katsura, T., 2003. Core formation in planetesimals triggered bypermeable flow. Nature 422, 154–157. doi:10.1038/nature01459.
Yoshino, T., Walter, M.J., Katsura, T., 2004. Connectivity of molten Fe alloy in peridotitebased on in situ electrical conductivity measurements: implications for coreformation in terrestrial planets. Earth Planet. Sci. Lett. 222, 625–643. doi:10.1016/j.epsl.2004.03.010.
Zimmerman, M.E., Kohlstedt, D.L., 2004. Rheological properties of partially moltenlherzolite. J. Petrol. 45, 275–298.
Copyright © 2022 FDOKUMEN