The dry and hydrous viscosities of alkaline melts from Vesuvius and Phlegrean Fields
16
The dry and hydrous viscosities of alkaline melts from Vesuvius and Phlegrean Fields Claudia Romano a, * , Daniele Giordano b,1 , Paolo Papale c,2 , Valeria Mincione d,3 , Donald B. Dingwell b,4 , Mauro Rosi e,5 a Dipartimento di Scienze Geologiche, Universita ` Roma Tre, L.go S. L. Murialdo, 1, 00154 Rome, Italy b Department of Earth and Environmental Sciences, University of Munich, Theresienstr. 41/III, D-80333 Munich, Germany c Istituto Nazionale di Geofisica e Vulcanologia, sede di Pisa, via della Faggiola 32, I-56126 Pisa, Italy d Dipartimento di Scienze della Terra, Universita ` La Sapienza, P.le Aldo Moro, 5 00185 Rome, Italy e Dipartimento di Scienze della Terra, via S. Maria 53, 56126 Pisa, Italy Received 30 May 2002; accepted 4 June 2003 Abstract Sophisticated models of volcanic scenarios are increasingly sensitive to the accuracy of their input parameters and constitutive equations for magma properties. Viscosity is certainly one of the most important magma properties, but only recently systematic investigations on silicate liquids with natural compositions have started. We investigated the Newtonian viscosity of dry and hydrous phonolitic and trachytic melts from Vesuvius and Phlegrean Fields volcanic complexes, respectively. The analysed samples come from the deposits of the AD 1631 (Vesuvius) and ca. 4400 BPAgnano Monte Spina (AMS) (Phlegrean Fields) eruptions that are commonly taken as reference events for the most hazardous scenarios in case of reactivation of the two volcanoes. Samples were hydrated via piston cylinder synthesis at P = 10 kbar and T = 1600 jC. The dry high temperature and dry or hydrous low temperature viscosities were measured by a combination of micropenetration and concentric cylinder techniques, covering a total temperature range from about 400 to 1500 jC, water content range from virtually dry to 3.8 wt.%, and viscosity range from 10 2 to 10 12 Pa s. The viscosity data for each composition were fitted by a modified Tamman– Vogel –Fulcher equation, allowing viscosity calculations at eruption temperatures and for dissolved water contents in the range of those examined. The viscosity data and model calculations were used for a comparison with other natural or synthetic phonolitic and trachytic melts, as well as with rhyolitic melts, for which viscosities had been measured. At water contents less than 1 wt.%, a trend of increasing viscosity from phonolitic to trachytic to rhyolitic melts is found. At water contents larger than 1 wt.%, the viscosity of trachytic melts is close to that of rhyolitic melts, while the viscosity of phonolitic melts is one to two orders of magnitude lower. A compositional parameter given by the (Na + K + H)/(Si + Al) molar ratio is found to be linearly related to the low-T hydrous viscosity of the trachytic and phonolitic melts considered, either analysed in 0009-2541/$ - see front matter D 2003 Elsevier B.V. All rights reserved. doi:10.1016/S0009-2541(03)00208-0 * Corresponding author. Tel.: +39-6-54888018; fax: +39-6-54888201. E-mail addresses: [email protected] (C. Romano), [email protected] (D. Giordano), [email protected] (P. Papale), [email protected] (V. Mincione), [email protected] (D.B. Dingwell), [email protected] (M. Rosi). 1 Fax: +48-89-2180-4176. 2 Fax: +39-50-500675. 3 Fax: +39-6-4454729. 4 Fax: +49-89-2180-4176. 5 Fax: +39-50-500675. www.elsevier.com/locate/chemgeo Chemical Geology 202 (2003) 23 – 38
-
Upload
independent -
Category
Documents
-
view
4 -
download
0
Transcript of The dry and hydrous viscosities of alkaline melts from Vesuvius and Phlegrean Fields
www.elsevier.com/locate/chemgeo
Chemical Geology 202 (2003) 23–38
The dry and hydrous viscosities of alkaline melts from
Vesuvius and Phlegrean Fields
Claudia Romanoa,*, Daniele Giordanob,1, Paolo Papalec,2, Valeria Mincioned,3,Donald B. Dingwellb,4, Mauro Rosie,5
aDipartimento di Scienze Geologiche, Universita Roma Tre, L.go S. L. Murialdo, 1, 00154 Rome, ItalybDepartment of Earth and Environmental Sciences, University of Munich, Theresienstr. 41/III, D-80333 Munich, Germany
c Istituto Nazionale di Geofisica e Vulcanologia, sede di Pisa, via della Faggiola 32, I-56126 Pisa, ItalydDipartimento di Scienze della Terra, Universita La Sapienza, P.le Aldo Moro, 5 00185 Rome, Italy
eDipartimento di Scienze della Terra, via S. Maria 53, 56126 Pisa, Italy
Received 30 May 2002; accepted 4 June 2003
Abstract
Sophisticated models of volcanic scenarios are increasingly sensitive to the accuracy of their input parameters and
constitutive equations for magma properties. Viscosity is certainly one of the most important magma properties, but only
recently systematic investigations on silicate liquids with natural compositions have started. We investigated the Newtonian
viscosity of dry and hydrous phonolitic and trachytic melts from Vesuvius and Phlegrean Fields volcanic complexes,
respectively. The analysed samples come from the deposits of the AD 1631 (Vesuvius) and ca. 4400 BP Agnano Monte Spina
(AMS) (Phlegrean Fields) eruptions that are commonly taken as reference events for the most hazardous scenarios in case of
reactivation of the two volcanoes. Samples were hydrated via piston cylinder synthesis at P= 10 kbar and T= 1600 jC. The dryhigh temperature and dry or hydrous low temperature viscosities were measured by a combination of micropenetration and
concentric cylinder techniques, covering a total temperature range from about 400 to 1500 jC, water content range from
virtually dry to 3.8 wt.%, and viscosity range from 102 to 1012 Pa s. The viscosity data for each composition were fitted by a
modified Tamman–Vogel–Fulcher equation, allowing viscosity calculations at eruption temperatures and for dissolved water
contents in the range of those examined. The viscosity data and model calculations were used for a comparison with other
natural or synthetic phonolitic and trachytic melts, as well as with rhyolitic melts, for which viscosities had been measured. At
water contents less than 1 wt.%, a trend of increasing viscosity from phonolitic to trachytic to rhyolitic melts is found. At water
contents larger than 1 wt.%, the viscosity of trachytic melts is close to that of rhyolitic melts, while the viscosity of phonolitic
melts is one to two orders of magnitude lower. A compositional parameter given by the (Na +K+H)/(Si +Al) molar ratio is
found to be linearly related to the low-T hydrous viscosity of the trachytic and phonolitic melts considered, either analysed in
0009-2541/$ - see front matter D 2003 Elsevier B.V. All rights reserved.
doi:10.1016/S0009-2541(03)00208-0
* Corresponding author. Tel.: +39-6-54888018; fax: +39-6-54888201.
E-mail addresses: [email protected] (C. Romano), [email protected] (D. Giordano), [email protected] (P. Papale),
[email protected] (V. Mincione), [email protected] (D.B. Dingwell), [email protected] (M. Rosi).1 Fax: +48-89-2180-4176.2 Fax: +39-50-500675.3 Fax: +39-6-4454729.4 Fax: +49-89-2180-4176.5 Fax: +39-50-500675.

C. Romano et al. / Chemical Geology 202 (2003) 23–3824
this work or taken from literature. Differently, the rhyolitic melt shows significant variations from the trend found for phonolitic
and trachytic melts.
D 2003 Elsevier B.V. All rights reserved.
Keywords: Viscosity; Hydrous silicate melts; Trachytes; Phonolites
1. Introduction
During the last 10 years, significant efforts have
been made in modeling and simulating volcanic
processes (see the recent reviews in Gilbert and
Sparks, 1998; Freundt and Rosi, 1998). Recent fluid
dynamic models of volcanic eruptions, although still
incomplete, can reproduce several processes occurring
in magma chambers, along volcanic conduits, and in
the subaerial environment (Folch et al., 1998; Jaupart,
1998; Neri et al., 1998; Herzog et al., 1998; Papale,
2001). These studies account for a large number of
processes that contribute to determine the dynamics of
volcanic eruptions and the volcanic scenarios, and are
currently used for the evaluation of volcanic hazard at
many potentially dangerous volcanoes.
Fluid dynamic models need the definition of mag-
ma properties in the range of conditions encountered
from the deep regions of magma storage to the
surface. Among such properties, those related to
magma rheology play a critical role, with viscosity
variations well within the range of those occurring
during a single eruption resulting in significant
changes of the large-scale eruption dynamics (Neri
et al., 1998; Herzog et al., 1998; Papale et al., 1998).
Natural magmas are known to display a variety of
rheological behaviors depending on temperature,
composition, distribution of phases, and stress–strain
conditions (Webb and Dingwell, 1990; Stein and
Spera, 1992; Bagdassarov and Dingwell, 1993; Richet
and Bottinga, 1986, 1995; Smith, 1997; Webb, 1997;
Dingwell, 1998a,b). Unfortunately, even Newtonian
viscosities are still poorly known on a wide variety of
natural compositions. The well-known Shaw’s (1972)
model has provided a way to calculate such viscosity
as a function of composition, and has been extensively
used in many numerical applications (Webb and
Dingwell, 1990; Bagdassarov and Dingwell, 1993).
This model is now known to poorly estimate New-
tonian viscosities and bad trends of viscosity versus
dissolved water content over a large range of con-
ditions (Hess and Dingwell, 1996; Richet et al., 1996;
Giordano and Dingwell, 2003).
In this paper, we present the results of measure-
ments of the Newtonian viscosity of dry and hydrous
trachytic and phonolitic samples representative of the
glassy portion of pumice discharged during two
relevant eruptions of Vesuvius and Phlegrean Fields.
These are the AD 1631 (Vesuvius) and ca. 4400 BP
Agnano Monte Spina (Phlegrean Fields) eruptions.
The Vesuvius and Phlegrean Fields volcanoes are
among the most potentially dangerous in the world,
threatening the city of Naples and its densely
inhabited suburbs and represent a continuous menace
to more than one million people. We chose to focus
our attention on these two eruptions because both are
currently used as a reference for the most dangerous
possible eruptive scenarios at each volcano. Accord-
ingly, the reconstructed dynamics of such eruptions
and the associated pyroclast dispersal patterns are
used for the preparation of hazard maps and civil
defense plans (Rosi and Santacroce, 1984; Scandone
et al., 1991; Rosi et al., 1993).
Vesuvius and Phlegrean Fields belong to the po-
tassic alkaline province of Central Italy. The compo-
sition of magmas discharged during the two above
eruptions corresponds to phonolite (Vesuvius) and
trachyte (Phlegrean Fields). Current knowledge of
the viscosity of alkaline and peralkaline magmas is
at an early stage, and models that have been proposed
are limited to a very narrow compositional variety of
rocks (Dingwell et al., 1998; Giordano et al., 2000;
Whittington et al., 2000, 2001). Additionally, the
model accounting for the important non-Arrhenian
variation of viscosity of calc-alkaline magmas (Hess
and Dingwell, 1996) is proven to greatly fail for
alkaline magmas (Dingwell et al., 1998). Therefore,
there is a great need for viscosity measurements and
modeling pertaining to such compositions. With the
present work, we contribute to fill the existing gap.
The new viscosity data are used for a parameterization
of viscosity–temperature–water content relationships
C. Romano et al. / Chemical Geology 202 (2003) 23–38 25
by means of a modification of the well-known Tam-
man–Volgel–Fulcher (TVF) equation, that allows
calculation of the Newtonian viscosity in the range
of considered temperatures and water contents. Final-
ly, we make a comparison with viscosity determina-
tions from the literature pertaining to silicate liquids
with phonolitic, trachytic, and rhyolitic composition,
and discuss the complex role of compositional diver-
sities in determining Newtonian viscosities. Subse-
quent work will use the new viscosity equations in
conjunction with fluid dynamic modeling of magma
ascent and fragmentation (Papale, 2001), in order to
investigate the peculiarities of alkaline versus calc-
alkaline eruption dynamics and describe possible
future eruptive scenarios at Vesuvius and Phlegrean
Fields.
2. Analytical methods
Pumice samples were collected by hand-picking
from two separate fall-out layers within the deposits of
each investigated eruption. The layers correspond to
level B1 and D1 (De Vita et al., 1999) of the Agnano
Monte Spina (AMS) eruption of Phlegrean Fields, and
white and gray levels (Rosi et al., 1993) of the AD
1631 Vesuvius (V1631) eruption. Level B1 underlies
level D1, and white level underlies gray level in the
stratigraphy of the AMS and V1631 eruptions, respec-
Table 1
Dry composition (wt.%) of glassesa
Analysed in this work
AMS_B1 AMS_D1 V_1631_W V_1
SiO2 61.26 60.86 53.52 53.1
TiO2 0.38 0.39 0.60 0.
Al2O3 18.38 18.27 19.84 19.8
FeOb 3.50 3.88 4.80 4.
MnO 0.14 0.12 0.14 0.
MgO 0.74 0.90 1.76 1.
CaO 2.97 2.96 6.76 6.
Na2O 4.58 4.12 4.66 4.
K2O 8.04 8.50 7.91 8.
a AMS_B1 and AMS_D1: glasses of trachytic composition from the A
respectively. V1631_W and V1631_G: glasses of phonolitic compositio
respectively. W_Tr and W_Ph: synthetic glasses of trachytic and phonolit
glass of phonolitic composition from Teide volcano, from Giordano et al. (2
et al. (1996). Small amounts of P2O2 are neglected.b Total Fe as FeO.
tively. Samples corresponding to each one of the above
layers were processed and analysed separately.
Glasses were separated from the coarsely crushed
samples of the selected rocks with the aid of a
binocular microscope. The melts used in this study
were then generated by fusion and homogenisation by
stirring of the separated phonolitic and trachytic glass
matrices at room pressure and 1400–1650 jC. Melt
samples were then allowed to cool to room tempera-
ture in the crucible.
All glasses were checked by optical microscopy for
the possible presence of crystalline phases and were
found to be crystal-free. We also failed to find any
evidence of phase separation in the glasses. Cylinders
8 mm in diameter were drilled out of the cooled
glasses, and sawed into disks 3 mm long. The disks
were then polished on both sides and stored in a
desiccator until used in the micropenetration experi-
ments. The remaining glass from the same crucible
was broken and reloaded into a crucible which was
then reheated to the starting temperature for concen-
tric cylinder viscosity measurements. The high tem-
perature anhydrous viscosities were determined in a
temperature range between 1050 and 1500 jC and for
a log10 viscosity range (Pa s) from 1.9 to 4.8 using the
method described in Dingwell and Virgo (1988).
The anhydrous glass compositions were chemical-
ly analysed by electron microprobe (Table 1). The
nominally anhydrous glasses were assumed to have
Not analysed in this work
631_G W_Tr W_Ph T_Ph HPG8
4 64.44 58.82 60.72 78.69
59 0.50 0.79 0.56
4 16.71 19.42 18.89 12.51
72 3.32
13 0.20
77 2.92 1.87 0.36
75 5.36 2.35 0.68
77 6.70 9.31 9.80 4.60
28 3.37 7.44 5.47 4.20
gnano Monte Spina (Phlegrean Fields) pumice, levels B1 and D1,
n from the AD 1631 Vesuvius eruption, levels White and Gray,
ic composition, respectively, from Whittington et al. (2001). T_Ph:
000). HPG8: synthetic glass of rhyolitic composition, from Dingwell
Table 2
Infrared data and water contents of analysed samples
Sample Density
(kg/m3)
Thickness
(Am)
Absorbance H2O
(wt.%)
G 637 2595 50 0.64 1.26
G 638 2582 21 0.43 2.04
G 639 2546 27 0.82 3.07
G dry 2586
W 640 2558 50 0.58 1.17
W 642 2496 27 0.87 3.32
W 643 2541 24 0.52 2.21
W dry 2549
D1 643 2500 98 1.09 1.15
D1 639 2413 31 1.09 3.75
D1 641 2468 42 0.82 2.04
D1 641 2485 42 0.82 2.02
D1 640 2448 49 1.11 2.38
D1 dry 2475
B1 642 2503 82 0.63 0.79
B1 638 2560 49 0.58 1.19
B1 637 2396 31 1.09 3.78
B1 636 2588 97 1.23 1.26
B1 dry 2481
Uncertainties in density determinations are estimated at F 0.05 kg/
m3. Calibrated density equations:
Agnano Monte Spina (B1 and D1): q (kg/m3) = 2480.3 +
20.557wH2O� 11.024(wH2O
)2.
Vesuvius 1631 White: q (kg/m3) = 2548.8 + 20.945wH2O� 11.104
(wH2O)2.
Vesuvius 1631 Gray: q (kg/m3) = 2585.6 + 20.948wH2O� 11.107w
(wH2O)2. wH2O
is wt.% dissolved water.
C. Romano et al. / Chemical Geology 202 (2003) 23–3826
0.02 wt.% dissolved H2O based on previous IR
measurements on nominally dry glasses of similar
composition (Ohlhorst et al., 2001). After the concen-
tric cylinder experiments, the dry glass was retrieved
by drilling and used for the hydrous experiments. For
each composition, four to five glasses with different
water contents in the range 0.8–3.8 wt.% were
synthesised at T= 1600 jC and P= 10 kbar in a piston
cylinder apparatus for several hours, in order to ensure
dissolution and homogenisation of water into the melt.
The quenched hydrous glasses (isobaric quench rate
from dwell T to Tg on the order of 100 jC/s) were thenrecovered and prepared for micropenetration viscom-
etry and infrared spectroscopy.
The low temperature viscosities were measured
using a micropenetration technique. This involves de-
termining the rate at which an Ir indenter under a fixed
load moves into the melt surface. Details about the
experimental procedure are reported in Dingwell et al.
(1996) and Hess et al. (1995). The equilibration time at
dwell temperature before the viscosity measurements
was minimized to about 15 min, to prevent water
exsolution and crystallization. The measurement time
was also kept to a minimum (approximately 5 min).
Different sample plates from the same hydrous glasses
were used and only one viscosity measurement was
performed on each plate. The viscosity measurements
were performed in the viscosity range 108–1012 Pa s
and in the temperature range 404–814 jC. Reproduc-ibility of viscosity measurements is ensured within an
error of + 0.06 log units, based on prior calibrations
(Hess et al., 1995; Giordano and Dingwell, 2003).
The homogeneity and stability of water content
were checked by FTIR spectroscopy. Before and after
each viscosity measurement, the hydrous samples
were analysed to measure the total water content
and checked for water loss during viscometry. A
Bruker IFS 120 HR Fourier Transform Spectropho-
tometer was used to obtain transmission infrared
spectra in the NIR region (2500–8000 cm� 1), using
a W source, CaF2 beam splitter and MCT detector.
The H2O content of the samples was determined by
measuring the heights of the peaks at approximately
3570 cm� 1 attributed to the fundamental OH-stretch-
ing vibration (Nakamoto, 1997). Details about the
background subtraction procedure can be found in
Romano et al. (1995) and Behrens et al. (1996).
Uncertainty of the results is about 2% based on the
reproducibility of measurements and on the error
associated with the background subtraction procedure.
In order to calculate the water content from the
measured absorbances, thickness and density of each
sample were also measured (Table 2). The thickness
of each glass plate was measured with a digital
Mitutoyo micrometer (precision F 3 Am). Densities
of the dry glasses and of some of the hydrous glasses
were determined by weighing in air and in ethanol
using a Mettler Toledo AG 204 balance. Uncertainties
are estimated to be F 10 kg/m3. Polynomial expres-
sions for densities (reported in Table 2) have been
obtained by least-square regression.
For compositions varying from basalt to rhyolite
the molar absorptivity of the peak at 3500 cm� 1
ranges from 63 to 88� 10� 4 m2/mol (Carroll and
Holloway, 1994 and references therein). For compo-
sitions closer to those investigated here, the range
narrows down to values from 68 (Yamashita et al.,
1997, dacitic compositions) to 70� 10� 4 m2/mol
C. Romano et al. / Chemical Geology 202 (2003) 23–38 27
(Silver and Stolper, 1989, albitic compositions). We
have adopted here a molar absorptivity of 70� 10� 4
m2/mol. The total error expected on the calculated
water contents from the dependence of molar absorp-
tivities on composition is F 4%.
3. Results of viscosity measurements and data
modeling
Viscosity determinations for the dry (dissolved
water content of 0.02 wt.%) and hydrous melts are
presented in Tables 3 and 4 for the Phlegrean Fields
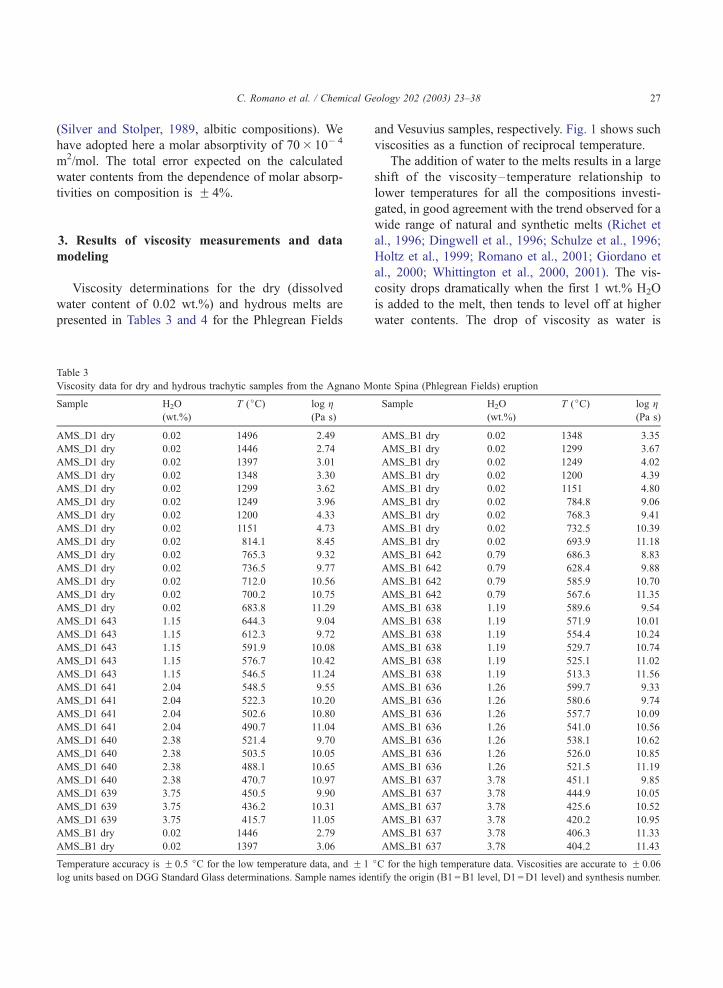
Table 3
Viscosity data for dry and hydrous trachytic samples from the Agnano M
Sample H2O
(wt.%)
T (jC) log g(Pa s)
AMS_D1 dry 0.02 1496 2.49
AMS_D1 dry 0.02 1446 2.74
AMS_D1 dry 0.02 1397 3.01
AMS_D1 dry 0.02 1348 3.30
AMS_D1 dry 0.02 1299 3.62
AMS_D1 dry 0.02 1249 3.96
AMS_D1 dry 0.02 1200 4.33
AMS_D1 dry 0.02 1151 4.73
AMS_D1 dry 0.02 814.1 8.45
AMS_D1 dry 0.02 765.3 9.32
AMS_D1 dry 0.02 736.5 9.77
AMS_D1 dry 0.02 712.0 10.56
AMS_D1 dry 0.02 700.2 10.75
AMS_D1 dry 0.02 683.8 11.29
AMS_D1 643 1.15 644.3 9.04
AMS_D1 643 1.15 612.3 9.72
AMS_D1 643 1.15 591.9 10.08
AMS_D1 643 1.15 576.7 10.42
AMS_D1 643 1.15 546.5 11.24
AMS_D1 641 2.04 548.5 9.55
AMS_D1 641 2.04 522.3 10.20
AMS_D1 641 2.04 502.6 10.80
AMS_D1 641 2.04 490.7 11.04
AMS_D1 640 2.38 521.4 9.70
AMS_D1 640 2.38 503.5 10.05
AMS_D1 640 2.38 488.1 10.65
AMS_D1 640 2.38 470.7 10.97
AMS_D1 639 3.75 450.5 9.90
AMS_D1 639 3.75 436.2 10.31
AMS_D1 639 3.75 415.7 11.05
AMS_B1 dry 0.02 1446 2.79
AMS_B1 dry 0.02 1397 3.06
Temperature accuracy is F 0.5 jC for the low temperature data, and F 1
log units based on DGG Standard Glass determinations. Sample names ide
and Vesuvius samples, respectively. Fig. 1 shows such
viscosities as a function of reciprocal temperature.
The addition of water to the melts results in a large
shift of the viscosity– temperature relationship to
lower temperatures for all the compositions investi-
gated, in good agreement with the trend observed for a
wide range of natural and synthetic melts (Richet et
al., 1996; Dingwell et al., 1996; Schulze et al., 1996;
Holtz et al., 1999; Romano et al., 2001; Giordano et
al., 2000; Whittington et al., 2000, 2001). The vis-
cosity drops dramatically when the first 1 wt.% H2O
is added to the melt, then tends to level off at higher
water contents. The drop of viscosity as water is
onte Spina (Phlegrean Fields) eruption
Sample H2O
(wt.%)
T (jC) log g(Pa s)
AMS_B1 dry 0.02 1348 3.35
AMS_B1 dry 0.02 1299 3.67
AMS_B1 dry 0.02 1249 4.02
AMS_B1 dry 0.02 1200 4.39
AMS_B1 dry 0.02 1151 4.80
AMS_B1 dry 0.02 784.8 9.06
AMS_B1 dry 0.02 768.3 9.41
AMS_B1 dry 0.02 732.5 10.39
AMS_B1 dry 0.02 693.9 11.18
AMS_B1 642 0.79 686.3 8.83
AMS_B1 642 0.79 628.4 9.88
AMS_B1 642 0.79 585.9 10.70
AMS_B1 642 0.79 567.6 11.35
AMS_B1 638 1.19 589.6 9.54
AMS_B1 638 1.19 571.9 10.01
AMS_B1 638 1.19 554.4 10.24
AMS_B1 638 1.19 529.7 10.74
AMS_B1 638 1.19 525.1 11.02
AMS_B1 638 1.19 513.3 11.56
AMS_B1 636 1.26 599.7 9.33
AMS_B1 636 1.26 580.6 9.74
AMS_B1 636 1.26 557.7 10.09
AMS_B1 636 1.26 541.0 10.56
AMS_B1 636 1.26 538.1 10.62
AMS_B1 636 1.26 526.0 10.85
AMS_B1 636 1.26 521.5 11.19
AMS_B1 637 3.78 451.1 9.85
AMS_B1 637 3.78 444.9 10.05
AMS_B1 637 3.78 425.6 10.52
AMS_B1 637 3.78 420.2 10.95
AMS_B1 637 3.78 406.3 11.33
AMS_B1 637 3.78 404.2 11.43
jC for the high temperature data. Viscosities are accurate to F 0.06
ntify the origin (B1 =B1 level, D1 =D1 level) and synthesis number.
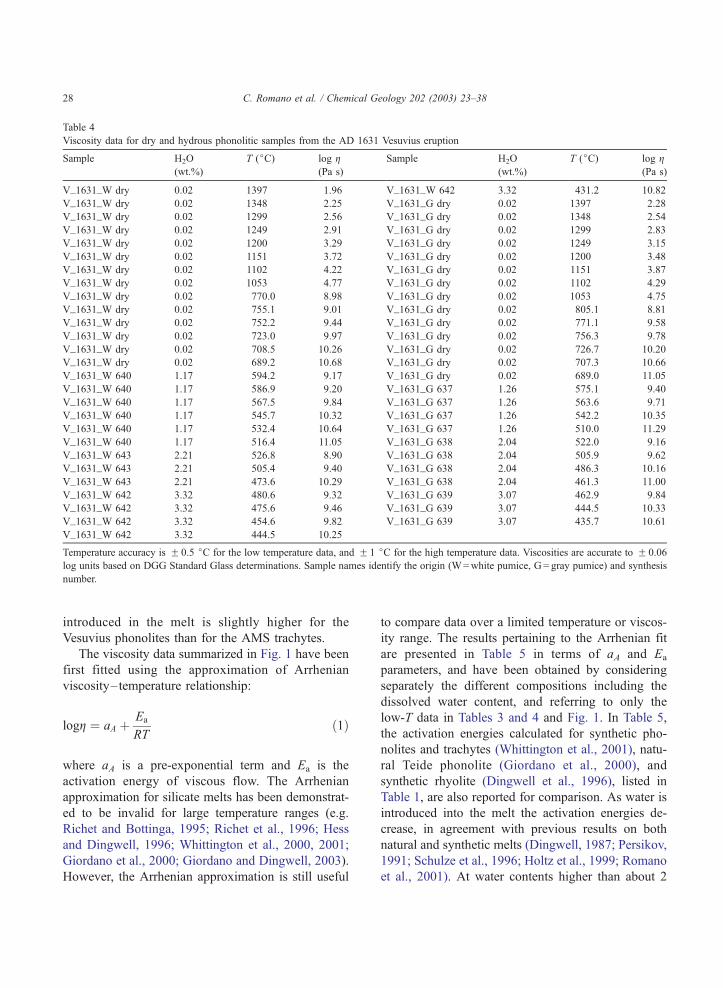
Table 4
Viscosity data for dry and hydrous phonolitic samples from the AD 1631 Vesuvius eruption
Sample H2O
(wt.%)
T (jC) log g(Pa s)
Sample H2O
(wt.%)
T (jC) log g(Pa s)
V_1631_W dry 0.02 1397 1.96 V_1631_W 642 3.32 431.2 10.82
V_1631_W dry 0.02 1348 2.25 V_1631_G dry 0.02 1397 2.28
V_1631_W dry 0.02 1299 2.56 V_1631_G dry 0.02 1348 2.54
V_1631_W dry 0.02 1249 2.91 V_1631_G dry 0.02 1299 2.83
V_1631_W dry 0.02 1200 3.29 V_1631_G dry 0.02 1249 3.15
V_1631_W dry 0.02 1151 3.72 V_1631_G dry 0.02 1200 3.48
V_1631_W dry 0.02 1102 4.22 V_1631_G dry 0.02 1151 3.87
V_1631_W dry 0.02 1053 4.77 V_1631_G dry 0.02 1102 4.29
V_1631_W dry 0.02 770.0 8.98 V_1631_G dry 0.02 1053 4.75
V_1631_W dry 0.02 755.1 9.01 V_1631_G dry 0.02 805.1 8.81
V_1631_W dry 0.02 752.2 9.44 V_1631_G dry 0.02 771.1 9.58
V_1631_W dry 0.02 723.0 9.97 V_1631_G dry 0.02 756.3 9.78
V_1631_W dry 0.02 708.5 10.26 V_1631_G dry 0.02 726.7 10.20
V_1631_W dry 0.02 689.2 10.68 V_1631_G dry 0.02 707.3 10.66
V_1631_W 640 1.17 594.2 9.17 V_1631_G dry 0.02 689.0 11.05
V_1631_W 640 1.17 586.9 9.20 V_1631_G 637 1.26 575.1 9.40
V_1631_W 640 1.17 567.5 9.84 V_1631_G 637 1.26 563.6 9.71
V_1631_W 640 1.17 545.7 10.32 V_1631_G 637 1.26 542.2 10.35
V_1631_W 640 1.17 532.4 10.64 V_1631_G 637 1.26 510.0 11.29
V_1631_W 640 1.17 516.4 11.05 V_1631_G 638 2.04 522.0 9.16
V_1631_W 643 2.21 526.8 8.90 V_1631_G 638 2.04 505.9 9.62
V_1631_W 643 2.21 505.4 9.40 V_1631_G 638 2.04 486.3 10.16
V_1631_W 643 2.21 473.6 10.29 V_1631_G 638 2.04 461.3 11.00
V_1631_W 642 3.32 480.6 9.32 V_1631_G 639 3.07 462.9 9.84
V_1631_W 642 3.32 475.6 9.46 V_1631_G 639 3.07 444.5 10.33
V_1631_W 642 3.32 454.6 9.82 V_1631_G 639 3.07 435.7 10.61
V_1631_W 642 3.32 444.5 10.25
Temperature accuracy is F 0.5 jC for the low temperature data, and F 1 jC for the high temperature data. Viscosities are accurate to F 0.06
log units based on DGG Standard Glass determinations. Sample names identify the origin (W=white pumice, G = gray pumice) and synthesis
number.
C. Romano et al. / Chemical Geology 202 (2003) 23–3828
introduced in the melt is slightly higher for the
Vesuvius phonolites than for the AMS trachytes.
The viscosity data summarized in Fig. 1 have been
first fitted using the approximation of Arrhenian
viscosity–temperature relationship:
logg ¼ aA þEa
RTð1Þ
where aA is a pre-exponential term and Ea is the
activation energy of viscous flow. The Arrhenian
approximation for silicate melts has been demonstrat-
ed to be invalid for large temperature ranges (e.g.
Richet and Bottinga, 1995; Richet et al., 1996; Hess
and Dingwell, 1996; Whittington et al., 2000, 2001;
Giordano et al., 2000; Giordano and Dingwell, 2003).
However, the Arrhenian approximation is still useful
to compare data over a limited temperature or viscos-
ity range. The results pertaining to the Arrhenian fit
are presented in Table 5 in terms of aA and Ea
parameters, and have been obtained by considering
separately the different compositions including the
dissolved water content, and referring to only the
low-T data in Tables 3 and 4 and Fig. 1. In Table 5,
the activation energies calculated for synthetic pho-
nolites and trachytes (Whittington et al., 2001), natu-
ral Teide phonolite (Giordano et al., 2000), and
synthetic rhyolite (Dingwell et al., 1996), listed in
Table 1, are also reported for comparison. As water is
introduced into the melt the activation energies de-
crease, in agreement with previous results on both
natural and synthetic melts (Dingwell, 1987; Persikov,
1991; Schulze et al., 1996; Holtz et al., 1999; Romano
et al., 2001). At water contents higher than about 2
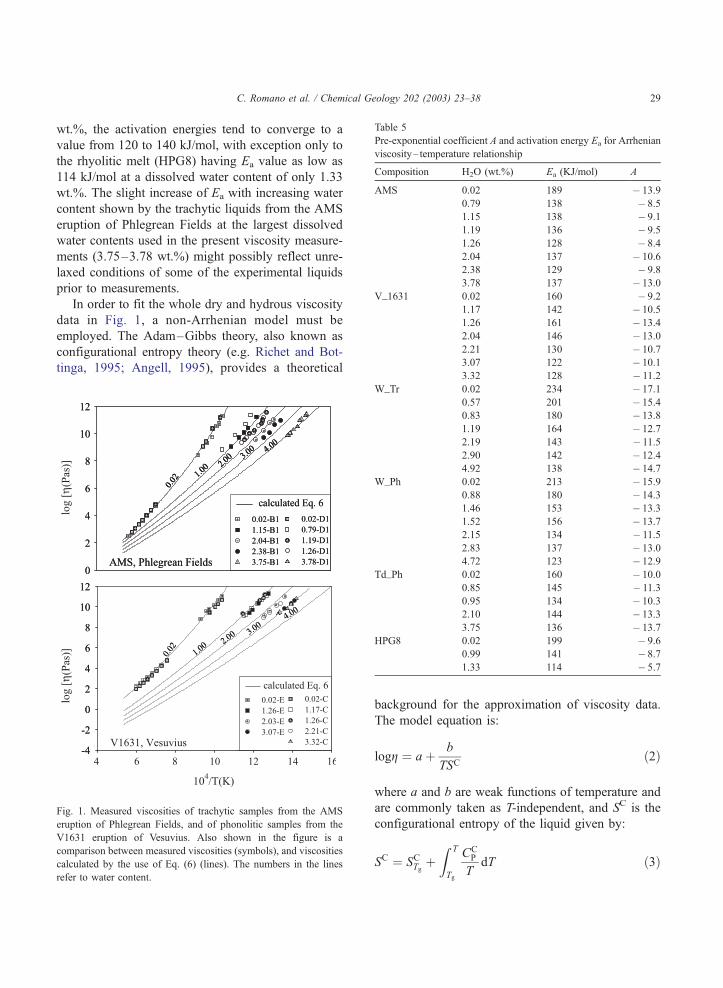
Table 5
Pre-exponential coefficient A and activation energy Ea for Arrhenian
viscosity– temperature relationship
Composition H2O (wt.%) Ea (KJ/mol) A
AMS 0.02 189 � 13.9
0.79 138 � 8.5
1.15 138 � 9.1
1.19 136 � 9.5
1.26 128 � 8.4
2.04 137 � 10.6
2.38 129 � 9.8
3.78 137 � 13.0
V_1631 0.02 160 � 9.2
1.17 142 � 10.5
1.26 161 � 13.4
2.04 146 � 13.0
2.21 130 � 10.7
3.07 122 � 10.1
C. Romano et al. / Chemical Geology 202 (2003) 23–38 29
wt.%, the activation energies tend to converge to a
value from 120 to 140 kJ/mol, with exception only to
the rhyolitic melt (HPG8) having Ea value as low as
114 kJ/mol at a dissolved water content of only 1.33
wt.%. The slight increase of Ea with increasing water
content shown by the trachytic liquids from the AMS
eruption of Phlegrean Fields at the largest dissolved
water contents used in the present viscosity measure-
ments (3.75–3.78 wt.%) might possibly reflect unre-
laxed conditions of some of the experimental liquids
prior to measurements.
In order to fit the whole dry and hydrous viscosity
data in Fig. 1, a non-Arrhenian model must be
employed. The Adam–Gibbs theory, also known as
configurational entropy theory (e.g. Richet and Bot-
tinga, 1995; Angell, 1995), provides a theoretical
Fig. 1. Measured viscosities of trachytic samples from the AMS
eruption of Phlegrean Fields, and of phonolitic samples from the
V1631 eruption of Vesuvius. Also shown in the figure is a
comparison between measured viscosities (symbols), and viscosities
calculated by the use of Eq. (6) (lines). The numbers in the lines
refer to water content.
3.32 128 � 11.2
W_Tr 0.02 234 � 17.1
0.57 201 � 15.4
0.83 180 � 13.8
1.19 164 � 12.7
2.19 143 � 11.5
2.90 142 � 12.4
4.92 138 � 14.7
W_Ph 0.02 213 � 15.9
0.88 180 � 14.3
1.46 153 � 13.3
1.52 156 � 13.7
2.15 134 � 11.5
2.83 137 � 13.0
4.72 123 � 12.9
Td_Ph 0.02 160 � 10.0
0.85 145 � 11.3
0.95 134 � 10.3
2.10 144 � 13.3
3.75 136 � 13.7
HPG8 0.02 199 � 9.6
0.99 141 � 8.7
1.33 114 � 5.7
background for the approximation of viscosity data.
The model equation is:
logg ¼ aþ b
TSCð2Þ
where a and b are weak functions of temperature and
are commonly taken as T-independent, and SC is the
configurational entropy of the liquid given by:
SC ¼ SCTg þZ T
Tg
CCP
TdT ð3Þ
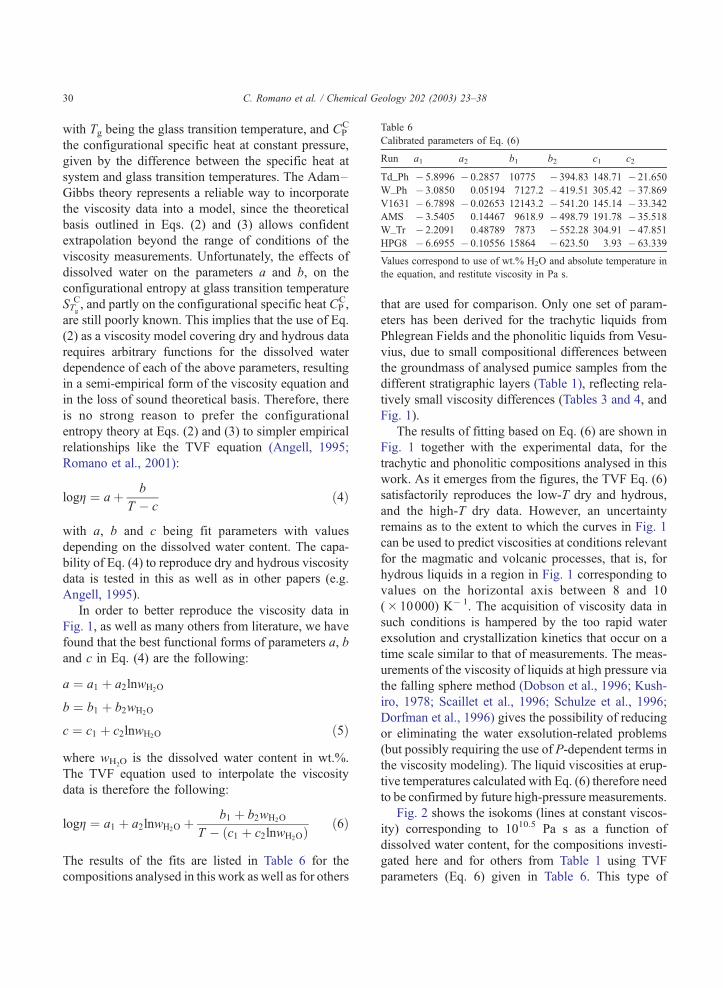
Table 6
Calibrated parameters of Eq. (6)
Run a1 a2 b1 b2 c1 c2
Td_Ph � 5.8996 � 0.2857 10775 � 394.83 148.71 � 21.650
W_Ph � 3.0850 0.05194 7127.2 � 419.51 305.42 � 37.869
V1631 � 6.7898 � 0.02653 12143.2 � 541.20 145.14 � 33.342
AMS � 3.5405 0.14467 9618.9 � 498.79 191.78 � 35.518
W_Tr � 2.2091 0.48789 7873 � 552.28 304.91 � 47.851
HPG8 � 6.6955 � 0.10556 15864 � 623.50 3.93 � 63.339
Values correspond to use of wt.% H2O and absolute temperature in
the equation, and restitute viscosity in Pa s.
C. Romano et al. / Chemical Geology 202 (2003) 23–3830
with Tg being the glass transition temperature, and CPC
the configurational specific heat at constant pressure,
given by the difference between the specific heat at
system and glass transition temperatures. The Adam–
Gibbs theory represents a reliable way to incorporate
the viscosity data into a model, since the theoretical
basis outlined in Eqs. (2) and (3) allows confident
extrapolation beyond the range of conditions of the
viscosity measurements. Unfortunately, the effects of
dissolved water on the parameters a and b, on the
configurational entropy at glass transition temperature
STg
C, and partly on the configurational specific heat CPC,
are still poorly known. This implies that the use of Eq.
(2) as a viscosity model covering dry and hydrous data
requires arbitrary functions for the dissolved water
dependence of each of the above parameters, resulting
in a semi-empirical form of the viscosity equation and
in the loss of sound theoretical basis. Therefore, there
is no strong reason to prefer the configurational
entropy theory at Eqs. (2) and (3) to simpler empirical
relationships like the TVF equation (Angell, 1995;
Romano et al., 2001):
logg ¼ aþ b
T � cð4Þ
with a, b and c being fit parameters with values
depending on the dissolved water content. The capa-
bility of Eq. (4) to reproduce dry and hydrous viscosity
data is tested in this as well as in other papers (e.g.
Angell, 1995).
In order to better reproduce the viscosity data in
Fig. 1, as well as many others from literature, we have
found that the best functional forms of parameters a, b
and c in Eq. (4) are the following:
a ¼ a1 þ a2lnwH2O
b ¼ b1 þ b2wH2O
c ¼ c1 þ c2lnwH2O ð5Þ
where wH2Ois the dissolved water content in wt.%.
The TVF equation used to interpolate the viscosity
data is therefore the following:
logg ¼ a1 þ a2lnwH2O þ b1 þ b2wH2O
T � ðc1 þ c2lnwH2OÞð6Þ
The results of the fits are listed in Table 6 for the
compositions analysed in this work as well as for others
that are used for comparison. Only one set of param-
eters has been derived for the trachytic liquids from
Phlegrean Fields and the phonolitic liquids from Vesu-
vius, due to small compositional differences between
the groundmass of analysed pumice samples from the
different stratigraphic layers (Table 1), reflecting rela-
tively small viscosity differences (Tables 3 and 4, and
Fig. 1).
The results of fitting based on Eq. (6) are shown in
Fig. 1 together with the experimental data, for the
trachytic and phonolitic compositions analysed in this
work. As it emerges from the figures, the TVF Eq. (6)
satisfactorily reproduces the low-T dry and hydrous,
and the high-T dry data. However, an uncertainty
remains as to the extent to which the curves in Fig. 1
can be used to predict viscosities at conditions relevant
for the magmatic and volcanic processes, that is, for
hydrous liquids in a region in Fig. 1 corresponding to
values on the horizontal axis between 8 and 10
(� 10000) K� 1. The acquisition of viscosity data in
such conditions is hampered by the too rapid water
exsolution and crystallization kinetics that occur on a
time scale similar to that of measurements. The meas-
urements of the viscosity of liquids at high pressure via
the falling sphere method (Dobson et al., 1996; Kush-
iro, 1978; Scaillet et al., 1996; Schulze et al., 1996;
Dorfman et al., 1996) gives the possibility of reducing
or eliminating the water exsolution-related problems
(but possibly requiring the use of P-dependent terms in
the viscosity modeling). The liquid viscosities at erup-
tive temperatures calculated with Eq. (6) therefore need
to be confirmed by future high-pressure measurements.
Fig. 2 shows the isokoms (lines at constant viscos-
ity) corresponding to 1010.5 Pa s as a function of
dissolved water content, for the compositions investi-
gated here and for others from Table 1 using TVF
parameters (Eq. 6) given in Table 6. This type of
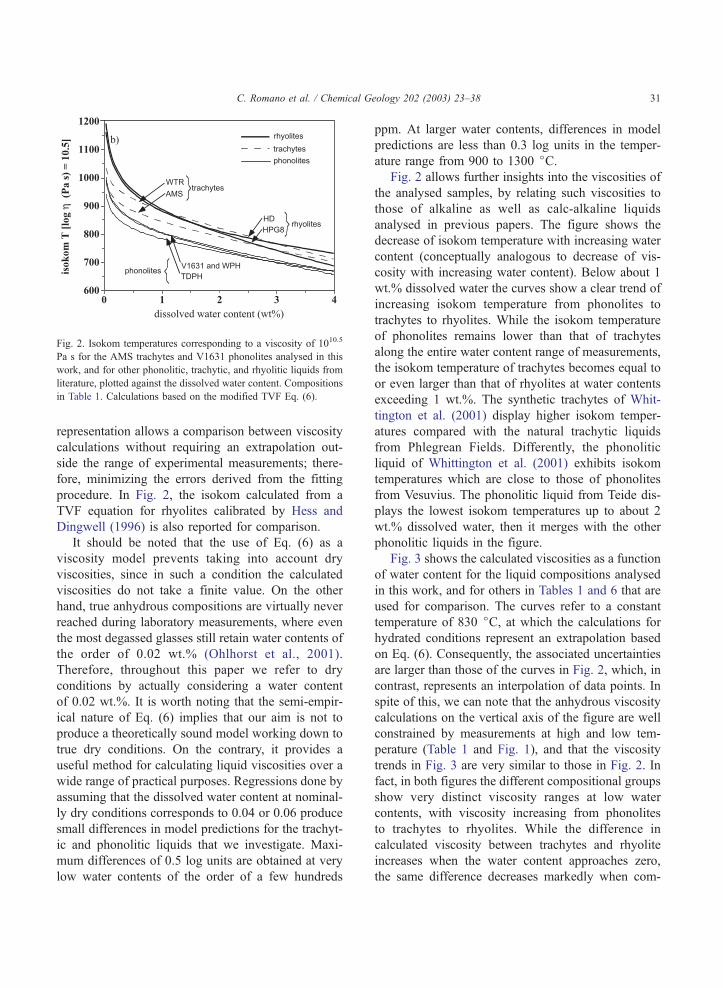
Fig. 2. Isokom temperatures corresponding to a viscosity of 1010.5
Pa s for the AMS trachytes and V1631 phonolites analysed in this
work, and for other phonolitic, trachytic, and rhyolitic liquids from
literature, plotted against the dissolved water content. Compositions
in Table 1. Calculations based on the modified TVF Eq. (6).
C. Romano et al. / Chemical Geology 202 (2003) 23–38 31
representation allows a comparison between viscosity
calculations without requiring an extrapolation out-
side the range of experimental measurements; there-
fore, minimizing the errors derived from the fitting
procedure. In Fig. 2, the isokom calculated from a
TVF equation for rhyolites calibrated by Hess and
Dingwell (1996) is also reported for comparison.
It should be noted that the use of Eq. (6) as a
viscosity model prevents taking into account dry
viscosities, since in such a condition the calculated
viscosities do not take a finite value. On the other
hand, true anhydrous compositions are virtually never
reached during laboratory measurements, where even
the most degassed glasses still retain water contents of
the order of 0.02 wt.% (Ohlhorst et al., 2001).
Therefore, throughout this paper we refer to dry
conditions by actually considering a water content
of 0.02 wt.%. It is worth noting that the semi-empir-
ical nature of Eq. (6) implies that our aim is not to
produce a theoretically sound model working down to
true dry conditions. On the contrary, it provides a
useful method for calculating liquid viscosities over a
wide range of practical purposes. Regressions done by
assuming that the dissolved water content at nominal-
ly dry conditions corresponds to 0.04 or 0.06 produce
small differences in model predictions for the trachyt-
ic and phonolitic liquids that we investigate. Maxi-
mum differences of 0.5 log units are obtained at very
low water contents of the order of a few hundreds
ppm. At larger water contents, differences in model
predictions are less than 0.3 log units in the temper-
ature range from 900 to 1300 jC.Fig. 2 allows further insights into the viscosities of
the analysed samples, by relating such viscosities to
those of alkaline as well as calc-alkaline liquids
analysed in previous papers. The figure shows the
decrease of isokom temperature with increasing water
content (conceptually analogous to decrease of vis-
cosity with increasing water content). Below about 1
wt.% dissolved water the curves show a clear trend of
increasing isokom temperature from phonolites to
trachytes to rhyolites. While the isokom temperature
of phonolites remains lower than that of trachytes
along the entire water content range of measurements,
the isokom temperature of trachytes becomes equal to
or even larger than that of rhyolites at water contents
exceeding 1 wt.%. The synthetic trachytes of Whit-
tington et al. (2001) display higher isokom temper-
atures compared with the natural trachytic liquids
from Phlegrean Fields. Differently, the phonolitic
liquid of Whittington et al. (2001) exhibits isokom
temperatures which are close to those of phonolites
from Vesuvius. The phonolitic liquid from Teide dis-
plays the lowest isokom temperatures up to about 2
wt.% dissolved water, then it merges with the other
phonolitic liquids in the figure.
Fig. 3 shows the calculated viscosities as a function
of water content for the liquid compositions analysed
in this work, and for others in Tables 1 and 6 that are
used for comparison. The curves refer to a constant
temperature of 830 jC, at which the calculations for
hydrated conditions represent an extrapolation based
on Eq. (6). Consequently, the associated uncertainties
are larger than those of the curves in Fig. 2, which, in
contrast, represents an interpolation of data points. In
spite of this, we can note that the anhydrous viscosity
calculations on the vertical axis of the figure are well
constrained by measurements at high and low tem-
perature (Table 1 and Fig. 1), and that the viscosity
trends in Fig. 3 are very similar to those in Fig. 2. In
fact, in both figures the different compositional groups
show very distinct viscosity ranges at low water
contents, with viscosity increasing from phonolites
to trachytes to rhyolites. While the difference in
calculated viscosity between trachytes and rhyolite
increases when the water content approaches zero,
the same difference decreases markedly when com-
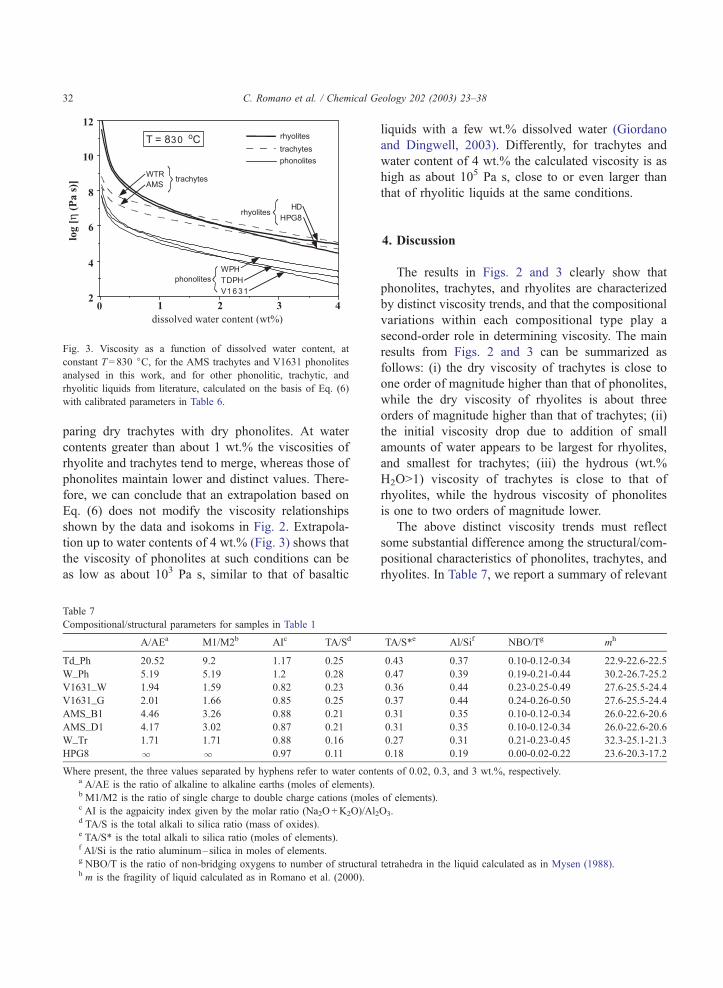
Fig. 3. Viscosity as a function of dissolved water content, at
constant T= 830 jC, for the AMS trachytes and V1631 phonolites
analysed in this work, and for other phonolitic, trachytic, and
rhyolitic liquids from literature, calculated on the basis of Eq. (6)
with calibrated parameters in Table 6.
C. Romano et al. / Chemical Geology 202 (2003) 23–3832
paring dry trachytes with dry phonolites. At water
contents greater than about 1 wt.% the viscosities of
rhyolite and trachytes tend to merge, whereas those of
phonolites maintain lower and distinct values. There-
fore, we can conclude that an extrapolation based on
Eq. (6) does not modify the viscosity relationships
shown by the data and isokoms in Fig. 2. Extrapola-
tion up to water contents of 4 wt.% (Fig. 3) shows that
the viscosity of phonolites at such conditions can be
as low as about 103 Pa s, similar to that of basaltic
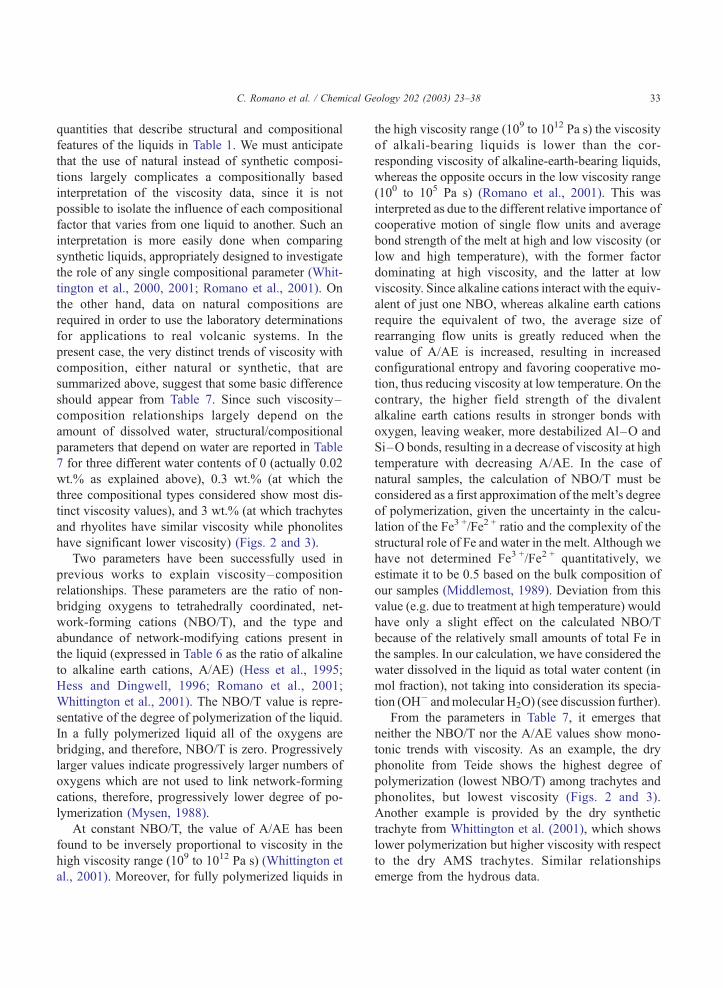
Table 7
Compositional/structural parameters for samples in Table 1
A/AEa M1/M2b AIc TA/Sd
Td_Ph 20.52 9.2 1.17 0.25
W_Ph 5.19 5.19 1.2 0.28
V1631_W 1.94 1.59 0.82 0.23
V1631_G 2.01 1.66 0.85 0.25
AMS_B1 4.46 3.26 0.88 0.21
AMS_D1 4.17 3.02 0.87 0.21
W_Tr 1.71 1.71 0.88 0.16
HPG8 l l 0.97 0.11
Where present, the three values separated by hyphens refer to water conta A/AE is the ratio of alkaline to alkaline earths (moles of elements).b M1/M2 is the ratio of single charge to double charge cations (molesc AI is the agpaicity index given by the molar ratio (Na2O +K2O)/Al2d TA/S is the total alkali to silica ratio (mass of oxides).e TA/S* is the total alkali to silica ratio (moles of elements).f Al/Si is the ratio aluminum–silica in moles of elements.g NBO/T is the ratio of non-bridging oxygens to number of structuralh m is the fragility of liquid calculated as in Romano et al. (2000).
liquids with a few wt.% dissolved water (Giordano
and Dingwell, 2003). Differently, for trachytes and
water content of 4 wt.% the calculated viscosity is as
high as about 105 Pa s, close to or even larger than
that of rhyolitic liquids at the same conditions.
4. Discussion
The results in Figs. 2 and 3 clearly show that
phonolites, trachytes, and rhyolites are characterized
by distinct viscosity trends, and that the compositional
variations within each compositional type play a
second-order role in determining viscosity. The main
results from Figs. 2 and 3 can be summarized as
follows: (i) the dry viscosity of trachytes is close to
one order of magnitude higher than that of phonolites,
while the dry viscosity of rhyolites is about three
orders of magnitude higher than that of trachytes; (ii)
the initial viscosity drop due to addition of small
amounts of water appears to be largest for rhyolites,
and smallest for trachytes; (iii) the hydrous (wt.%
H2O>1) viscosity of trachytes is close to that of
rhyolites, while the hydrous viscosity of phonolites
is one to two orders of magnitude lower.
The above distinct viscosity trends must reflect
some substantial difference among the structural/com-
positional characteristics of phonolites, trachytes, and
rhyolites. In Table 7, we report a summary of relevant
TA/S*e Al/Sif NBO/Tg mh
0.43 0.37 0.10-0.12-0.34 22.9-22.6-22.5
0.47 0.39 0.19-0.21-0.44 30.2-26.7-25.2
0.36 0.44 0.23-0.25-0.49 27.6-25.5-24.4
0.37 0.44 0.24-0.26-0.50 27.6-25.5-24.4
0.31 0.35 0.10-0.12-0.34 26.0-22.6-20.6
0.31 0.35 0.10-0.12-0.34 26.0-22.6-20.6
0.27 0.31 0.21-0.23-0.45 32.3-25.1-21.3
0.18 0.19 0.00-0.02-0.22 23.6-20.3-17.2
ents of 0.02, 0.3, and 3 wt.%, respectively.
of elements).
O3.
tetrahedra in the liquid calculated as in Mysen (1988).
C. Romano et al. / Chemical Geology 202 (2003) 23–38 33
quantities that describe structural and compositional
features of the liquids in Table 1. We must anticipate
that the use of natural instead of synthetic composi-
tions largely complicates a compositionally based
interpretation of the viscosity data, since it is not
possible to isolate the influence of each compositional
factor that varies from one liquid to another. Such an
interpretation is more easily done when comparing
synthetic liquids, appropriately designed to investigate
the role of any single compositional parameter (Whit-
tington et al., 2000, 2001; Romano et al., 2001). On
the other hand, data on natural compositions are
required in order to use the laboratory determinations
for applications to real volcanic systems. In the
present case, the very distinct trends of viscosity with
composition, either natural or synthetic, that are
summarized above, suggest that some basic difference
should appear from Table 7. Since such viscosity–
composition relationships largely depend on the
amount of dissolved water, structural/compositional
parameters that depend on water are reported in Table
7 for three different water contents of 0 (actually 0.02
wt.% as explained above), 0.3 wt.% (at which the
three compositional types considered show most dis-
tinct viscosity values), and 3 wt.% (at which trachytes
and rhyolites have similar viscosity while phonolites
have significant lower viscosity) (Figs. 2 and 3).
Two parameters have been successfully used in
previous works to explain viscosity–composition
relationships. These parameters are the ratio of non-
bridging oxygens to tetrahedrally coordinated, net-
work-forming cations (NBO/T), and the type and
abundance of network-modifying cations present in
the liquid (expressed in Table 6 as the ratio of alkaline
to alkaline earth cations, A/AE) (Hess et al., 1995;
Hess and Dingwell, 1996; Romano et al., 2001;
Whittington et al., 2001). The NBO/T value is repre-
sentative of the degree of polymerization of the liquid.
In a fully polymerized liquid all of the oxygens are
bridging, and therefore, NBO/T is zero. Progressively
larger values indicate progressively larger numbers of
oxygens which are not used to link network-forming
cations, therefore, progressively lower degree of po-
lymerization (Mysen, 1988).
At constant NBO/T, the value of A/AE has been
found to be inversely proportional to viscosity in the
high viscosity range (109 to 1012 Pa s) (Whittington et
al., 2001). Moreover, for fully polymerized liquids in
the high viscosity range (109 to 1012 Pa s) the viscosity
of alkali-bearing liquids is lower than the cor-
responding viscosity of alkaline-earth-bearing liquids,
whereas the opposite occurs in the low viscosity range
(100 to 105 Pa s) (Romano et al., 2001). This was
interpreted as due to the different relative importance of
cooperative motion of single flow units and average
bond strength of the melt at high and low viscosity (or
low and high temperature), with the former factor
dominating at high viscosity, and the latter at low
viscosity. Since alkaline cations interact with the equiv-
alent of just one NBO, whereas alkaline earth cations
require the equivalent of two, the average size of
rearranging flow units is greatly reduced when the
value of A/AE is increased, resulting in increased
configurational entropy and favoring cooperative mo-
tion, thus reducing viscosity at low temperature. On the
contrary, the higher field strength of the divalent
alkaline earth cations results in stronger bonds with
oxygen, leaving weaker, more destabilized Al–O and
Si–O bonds, resulting in a decrease of viscosity at high
temperature with decreasing A/AE. In the case of
natural samples, the calculation of NBO/T must be
considered as a first approximation of the melt’s degree
of polymerization, given the uncertainty in the calcu-
lation of the Fe3 +/Fe2 + ratio and the complexity of the
structural role of Fe and water in the melt. Although we
have not determined Fe3 +/Fe2 + quantitatively, we
estimate it to be 0.5 based on the bulk composition of
our samples (Middlemost, 1989). Deviation from this
value (e.g. due to treatment at high temperature) would
have only a slight effect on the calculated NBO/T
because of the relatively small amounts of total Fe in
the samples. In our calculation, we have considered the
water dissolved in the liquid as total water content (in
mol fraction), not taking into consideration its specia-
tion (OH� andmolecular H2O) (see discussion further).
From the parameters in Table 7, it emerges that
neither the NBO/T nor the A/AE values show mono-
tonic trends with viscosity. As an example, the dry
phonolite from Teide shows the highest degree of
polymerization (lowest NBO/T) among trachytes and
phonolites, but lowest viscosity (Figs. 2 and 3).
Another example is provided by the dry synthetic
trachyte from Whittington et al. (2001), which shows
lower polymerization but higher viscosity with respect
to the dry AMS trachytes. Similar relationships
emerge from the hydrous data.
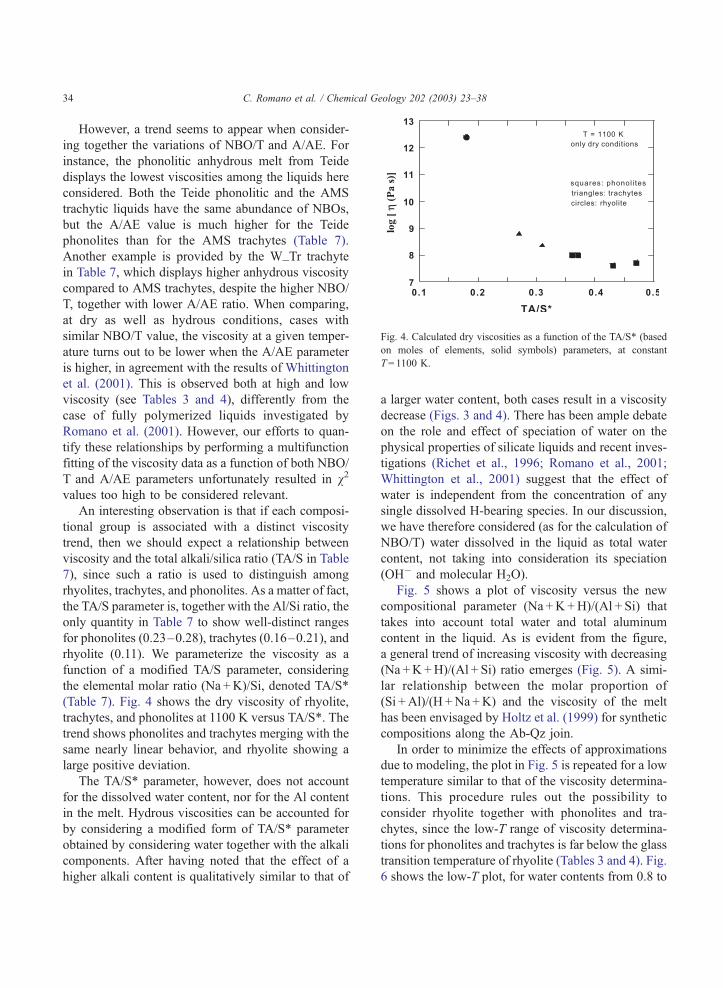
Fig. 4. Calculated dry viscosities as a function of the TA/S* (based
on moles of elements, solid symbols) parameters, at constant
T= 1100 K.
C. Romano et al. / Chemical Geology 202 (2003) 23–3834
However, a trend seems to appear when consider-
ing together the variations of NBO/T and A/AE. For
instance, the phonolitic anhydrous melt from Teide
displays the lowest viscosities among the liquids here
considered. Both the Teide phonolitic and the AMS
trachytic liquids have the same abundance of NBOs,
but the A/AE value is much higher for the Teide
phonolites than for the AMS trachytes (Table 7).
Another example is provided by the W_Tr trachyte
in Table 7, which displays higher anhydrous viscosity
compared to AMS trachytes, despite the higher NBO/
T, together with lower A/AE ratio. When comparing,
at dry as well as hydrous conditions, cases with
similar NBO/T value, the viscosity at a given temper-
ature turns out to be lower when the A/AE parameter
is higher, in agreement with the results of Whittington
et al. (2001). This is observed both at high and low
viscosity (see Tables 3 and 4), differently from the
case of fully polymerized liquids investigated by
Romano et al. (2001). However, our efforts to quan-
tify these relationships by performing a multifunction
fitting of the viscosity data as a function of both NBO/
T and A/AE parameters unfortunately resulted in v2
values too high to be considered relevant.
An interesting observation is that if each composi-
tional group is associated with a distinct viscosity
trend, then we should expect a relationship between
viscosity and the total alkali/silica ratio (TA/S in Table
7), since such a ratio is used to distinguish among
rhyolites, trachytes, and phonolites. As a matter of fact,
the TA/S parameter is, together with the Al/Si ratio, the
only quantity in Table 7 to show well-distinct ranges
for phonolites (0.23–0.28), trachytes (0.16–0.21), and
rhyolite (0.11). We parameterize the viscosity as a
function of a modified TA/S parameter, considering
the elemental molar ratio (Na +K)/Si, denoted TA/S*
(Table 7). Fig. 4 shows the dry viscosity of rhyolite,
trachytes, and phonolites at 1100 K versus TA/S*. The
trend shows phonolites and trachytes merging with the
same nearly linear behavior, and rhyolite showing a
large positive deviation.
The TA/S* parameter, however, does not account
for the dissolved water content, nor for the Al content
in the melt. Hydrous viscosities can be accounted for
by considering a modified form of TA/S* parameter
obtained by considering water together with the alkali
components. After having noted that the effect of a
higher alkali content is qualitatively similar to that of
a larger water content, both cases result in a viscosity
decrease (Figs. 3 and 4). There has been ample debate
on the role and effect of speciation of water on the
physical properties of silicate liquids and recent inves-
tigations (Richet et al., 1996; Romano et al., 2001;
Whittington et al., 2001) suggest that the effect of
water is independent from the concentration of any
single dissolved H-bearing species. In our discussion,
we have therefore considered (as for the calculation of
NBO/T) water dissolved in the liquid as total water
content, not taking into consideration its speciation
(OH� and molecular H2O).
Fig. 5 shows a plot of viscosity versus the new
compositional parameter (Na +K +H)/(Al + Si) that
takes into account total water and total aluminum
content in the liquid. As is evident from the figure,
a general trend of increasing viscosity with decreasing
(Na +K+H)/(Al + Si) ratio emerges (Fig. 5). A simi-
lar relationship between the molar proportion of
(Si +Al)/(H +Na +K) and the viscosity of the melt
has been envisaged by Holtz et al. (1999) for synthetic
compositions along the Ab-Qz join.
In order to minimize the effects of approximations
due to modeling, the plot in Fig. 5 is repeated for a low
temperature similar to that of the viscosity determina-
tions. This procedure rules out the possibility to
consider rhyolite together with phonolites and tra-
chytes, since the low-T range of viscosity determina-
tions for phonolites and trachytes is far below the glass
transition temperature of rhyolite (Tables 3 and 4). Fig.
6 shows the low-T plot, for water contents from 0.8 to

Fig. 5. Calculated hydrous viscosities as a function of the mole ratio
(Na +K+H)/(Si +Al), at constant T= 1100 K.
C. Romano et al. / Chemical Geology 202 (2003) 23–38 35
3 wt.% (lower water contents push the conditions
beyond the glass transition). As can be seen, a well-
defined linear trend emerges between log g and the
molar ratio (Na +K+H)/(Si +Al), for all the compo-
sitions including Phlegrean Fields trachytes, Vesuvius
and Teide phonolites, and the synthetic trachytic and
phonolitic liquids from Whittington et al. (2001).
The diagram in Fig. 6 shows that the different
viscosities of hydrous phonolites and trachytes at the
temperature of 800 K can be explained in terms of
Fig. 6. Calculated hydrous viscosities as a function of the mole ratio
(Na +K+H)/(Si +Al), at constant T= 800 K, for the AMS trachytes
and V1631 phonolites analysed in this work, and for other
phonolitic and trachytic liquids from literature. The line is the
linear least square fit to the points. The parameters of the regression
curve are also reported.
different abundance of Na, K, and H, relative to Si and
Al. As an example, a trachytic liquid with 3 wt.%
dissolved water at 800 K has a viscosity close to 109
Pa s. At the same temperature, phonolitic liquids have
the same viscosity with only 2 wt.% dissolved water.
In both cases, the (Na +K+H)/(Si +Al) molar ratio is
close to 0.5.
Fig. 5 shows a similar general trend, but a much
larger dispersion of points that might be due to a
larger role on viscosity of components other than
those included in the (Na +K+H)/(Si +Al) ratio at
higher temperature, or to the approximations intro-
duced by the viscosity modeling with Eq. (6). A
definite answer requires the production of dry as well
as hydrous viscosity data in the intermediate to high
temperature range.
The inclusion of rhyolites in a plot similar to that in
Fig. 6 can be done by considering isokom temper-
atures, instead of viscosities, as a function of the
(Na +K+H)/(Si +Al) ratio. This is shown in Fig. 7,
for conditions from dry to hydrous. As is evident from
the figure, the trachytic and phonolitic compositions
still display well-defined, very close (with the partial
exception of the synthetic phonolite from Whittington
et al., 2001), and essentially linear trends down to
water contents of at least 0.8 wt.%, below which a
steep increase of the isokom temperature is observed.
In contrast, the hydrous rhyolitic composition is
Fig. 7. Calculated isokom temperatures corresponding to a viscosity
of 1010.5 Pa s for the AMS trachytes and V1631 phonolites analysed
in this work, and for other phonolitic, trachytic, and rhyolitic liquids
from literature, plotted against the mole ratio (Na +K+H)/(Si +Al),
for dissolved water contents from 0 (0.02 wt.% as explained in the
text) to 4 wt.%.
C. Romano et al. / Chemical Geology 202 (2003) 23–3836
shifted toward lower isokom temperature at equal
(Na +K+H)/(Si +Al) ratio (or lower magma viscosity
at equal magma temperature and (Na + K + H)/
(Si +Al) ratio). As a conclusion, Fig. 7 shows that
at very high viscosity conditions the (Na +K+H)/
(Si + Al) ratio explains the different viscosities of
hydrous trachytes and phonolites, whereas the hy-
drous rhyolite follows a different trend. On the con-
trary, the hydrous rhyolites in Fig. 5, pertaining to
intermediate viscosity conditions (less constrained by
the viscosity data), show the same trend of trachytic
and phonolitic compositions.
The reason why rhyolitic liquids display different
trends at high viscosity compared with the trachytes
and phonolites can be complex. From Table 7, we can
observe that the HPG8 displays compositional fea-
tures quite different from those of the trachytic and
phonolitic liquids (NBO/T = 0, low Al/Si ratio, low
TA/S ratio, A/AE and M1/M2 =l). In such a case,
the mechanism of activation of viscous flow can be
different, for instance by breaking Al–O or Si–O
bonds (a nominally fully polymerized liquid does not
contain non-bridging oxygens). The lower Al/Si ratio
could also play a role in increasing viscosity, due to
higher strength of the liquid (Al destabilizes the
silicate framework by lengthening the average TO
distance and narrowing the average TOT angle, Nav-
rotsky et al., 1985), as well as due to lower Si/Al order
disorder and therefore lower configurational entropy
of the liquid (see Eq. (2)). Moreover, comparison of
synthetic (HPG8) versus natural (trachytes and pho-
nolites) compositions certainly introduces further
approximations and uncertainties in the calculation
of the above compositional features hampering possi-
ble correlations among them.
It seems therefore likely that in the case of liquids
with large differences in their structural/compositional
characteristics, several parameters should be taken
into account in order to understand the viscosity–
composition relationships and additional structural
information should be available in order to predict
the compositional variation of melt viscosity.
5. Conclusions
In this paper, we have presented the results of
measurements of the Newtonian viscosity of dry and
hydrous trachytic and phonolitic samples representa-
tive of two relevant eruptions of Vesuvius and Phle-
grean Fields. Trends of increasing viscosity from
phonolitic to trachytic to rhyolitic melts were found
at water contents of less than 1 wt.%. Interestingly, at
water contents greater than 1 wt.%, the viscosities of
trachytic melts were found to be close to those of
rhyolitic melts, greatly simplifying the tasks of pre-
dicting the behaviour of natural magmas of such
compositions, while the viscosity of phonolitic melts
was found to be one to two orders of magnitude lower.
A compositional parameter given by the (Na +K+H)/
(Si +Al) molar ratio was found to be linearly related
to the low-T hydrous viscosities of the trachytic and
phonolitic melts considered. This parameter was suc-
cessfully applied to trachytic and phonolitic melts
either analysed in this work or taken from literature.
Prediction of possible future eruptive scenarios and
the evaluation of the volcanic hazard at Vesuvius and
Phlegrean Fields areas is greatly aided by the acquired
knowledge of the viscosity behaviour of magmas
discharged from these volcanoes.
Acknowledgements
We wish to thank Hubert Schulze for technical
support during the preparation of experimental
materials. We are grateful for the very helpful
comments provided by A. Whittington and an
anonymous reviewer. [RR]
References
Angell, C.A., 1995. Formation of glasses from liquids and biopol-
ymers. Science 67, 1924–1935.
Bagdassarov, N.S., Dingwell, D.B., 1993. Frequency dependent
rheology of vesicular rhyolite. J. Geophys. Res. 98, 6477–6487.
Behrens, H., Romano, C., Nowak, M., Holtz, F., Dingwell, D.B.,
1996. Near infrared spectroscopic determination of water spe-
cies in glasses of the system Mal3SiO8 (M=Li, Na, K): an
interlaboratory study. Chem. Geol. 128, 41–63.
Carroll, M., Holloway, J.R., 1994. Volatiles in magmas. Mineral.
Soc. of Am., Rev. Mineral., Washington, DC, p. 30.
De Vita, S., Orsi, G., Civetta, L., Carandente, A., D’Antonio, M.,
Deino Di Cesare, A.T., Di Vito, M.A., Fisher, R.V., Isaia, R.,
Marotta, E., Necco, A., Ort, M., Pappalardo, L., Piochi, M.,
Southon, J., 1999. The Agnano-Monte Spina eruption (4100
years BP) in the restless Campi Flegrei caldera (Italy). J. Volca-
nol. Geotherm. Res. 91, 269–301.
C. Romano et al. / Chemical Geology 202 (2003) 23–38 37
Dingwell, D.B., 1987. Melt viscosities in the system NaAlSi3O8–
H2O–F2O-1. In: Mysen, B.O. (Ed.), Magmatic Processes:
Physicochemical Principles, Spec. Publ., vol. 1. The Geochem-
ical Society, Pennsylvania State University, University Park,
PA, pp. 423–433.
Dingwell, D.B., 1998a. Magma degassing and fragmentation. Re-
cent experimental advances. In: Gilbert, J.S., Sparks, R.S.J.
(Eds.), The Physics of Explosive Volcanic Eruptions, Special
Publications, vol. 145. Geological Society, London, pp. 9–26.
Dingwell, D.B., 1998b. Recent experimental progresses in the
physical description of silicic magma relevant to explosive vol-
canism. In: Gilbert, J.S., Sparks, R.S.J. (Eds.), The Physics of
Explosive Volcanic Eruptions, Special Publications, vol. 145.
Geological Society, London, pp. 9–26.
Dingwell, D.B., Virgo, D., 1988. Melt viscosities in the Na2O–
FeO–Fe2O3–SiO2 system and factors controlling the relative
viscosities of fully polymerized silicate melts. Geochim. Cos-
mochim. Acta 52, 395–403.
Dingwell, D.B., Romano, C., Hess, K.-U., 1996. The effect of water
on the viscosity of a haplogranitic melt under P–T–X condi-
tions relevant to silicic volcanism. Contrib. Mineral. Petrol. 124,
19–28.
Dingwell, D.B., Hess, K.-U., Romano, C., 1998. Extremely fluid
behaviour of hydrous peralkaline rhyolites. Earth Planet. Sci.
Lett. 158, 31–38.
Dobson, D.P., Jones, A.P., Robe, R., Sekine, T., Kurita, K., Tanigu-
chi, T., Kondo, T., Kato, T., Shinomura, O., Urakawa, S., 1996.
In situ measurement of viscosity and density of carbonatitic
melts at high pressure. Earth Planet. Sci. Lett. 143, 207–215.
Dorfman, A., Hess, K.-U., Dingwell, D.B., 1996. Centrifuge-assis-
ted falling-sphere viscometry. Eur. J. Mineral. 8, 507–514.
Folch, A., Marti, J., Codina, R., Vazquez, M., 1998. Numerical
model for temporal variations during explosive central vent
eruptions. J. Geophys. Res. 103, 20883–20899.
Freundt, A., Rosi, M., 1998. From Magma to Tephra—Modeling
Physical Processes of Explosive Volcanic Eruptions. Springer,
Berlin.
Gilbert, J.S., Sparks, R.S.J., 1998. The Physics of Explosive Vol-
canic Eruptions, Special Publications. Geological Society, Lon-
don, p. 145.
Giordano, D., Dingwell, D.B., 2003. Viscosity of hydrous Etna
basalt: implications to the modelling of Plinian basaltic erup-
tions. Bull. Volcanol. 65, 8–14.
Giordano, D., Dingwell, D.B., Romano, C., 2000. Viscosities of
Teide phonolites in the welding interval. J. Volcanol. Geotherm.
Res. 103, 239–245.
Herzog, M., Graf, H.F., Textor, C., Oberhuber, J.M., 1998. The
effect of phase changes of water on the development of volcanic
plumes. J. Volcanol. Geotherm. Res. 87, 55–74.
Hess, K.-U., Dingwell, D.B., 1996. Viscosities of hydrous leu-
cogranitic melts: a non-Arrhenian model. Am. Mineral. 81,
1297–1300.
Hess, K.-U., Dingwell, D.B., Webb, S.L., 1995. The influence of
excess alkalis on the viscosity of a haplogranitic melt. Am.
Mineral. 80, 297–304.
Holtz, F., Roux, J., Behrens, H., Pichanvant, M., 1999. Water sol-
ubility in SiO2–NaAlSi3O8 melts. Am. Mineral. 85, 682–686.
Jaupart, C., 1998. Gas loss from magmas through conduit walls
during eruption. In: Gilbert, J.S., Sparks, R.S.J. (Eds.), The
Physics of Explosive Volcanic Eruptions, Special Publications,
vol. 145. Geological Society, London, pp. 73–90.
Kushiro, I., 1978. Viscosity and structural changes of albite
(NaAlSi308) melt at high pressures. Earth Planet. Sci. Lett.
41, 87–90.
Middlemost, E.A.K., 1989. Iron oxidation ratios, norms and the
classification of volcanic rocks. Chem. Geol. 77, 19–26.
Mysen, B.O., 1988. Structure and Properties of Silicate Melts
Elsevier, Amsterdam.
Nakamoto, K., 1997. Infrared and Raman Spectra of Inorganic and
Coordination Compounds: Theory and Applications in Inor-
ganic Chemistry, 5th ed. Wiley, New York.
Navrotsky, A., Geisinger, K.L., McMillan, P., Gibbs, G.V., 1985.
The tetrahedral framework in glasses and melts: influence from
molecular orbital calculations and implications for structure,
thermodynamics, and physical properties. Phys. Chem. Miner.
11, 284–298.
Neri, A., Papale, P., Macedonio, G., 1998. The role of magma
composition and water content in explosive eruption: II. Py-
roclast dispersion dynamics. J. Volcanol. Geotherm. Res. 87,
95–115.
Ohlhorst, S., Behrens, H., Holtz, F., 2001. Compositional depend-
ence of molar absorptivities of near-infrared OH� and H2O
bands in rhyolitic to basaltic glasses. Chem. Geol. 174, 5–20.
Papale, P., 2001. Dynamics of magma flow in volcanic conduits
with variable fragmentation efficiency and nonequilibrium pum-
ice degassing. J. Geophys. Res. 106, 11043–11065.
Papale, P., Neri, A., Macedonio, G., 1998. The role of magma
composition and water content in explosive eruption: I. Conduit
ascent dynamics. J. Volcanol. Geotherm. Res. 87, 75–93.
Persikov, E.S., 1991. The viscosity of magmatic liquids: experi-
ment, generalized patterns. A model for calculation and predic-
tion. Applications. Adv. Phys. Geochem. 9, 1–40.
Richet, P., Bottinga, Y., 1986. Thermochemical properties of silicate
glasses and liquids: a review. Rev. Geophys. 24, 1–25.
Richet, P., Bottinga, Y., 1995. Rheology and configurational entro-
py of silicate melts. In: Stebbins, J.F., McMillan, P.F., Dingwell,
D.B. (Eds.), Structure, Dynamics and Properties of Silicate
Melts, vol. 32. Mineral. Soc. Am. Rev. Mineral., Washington,
DC, pp. 67–94.
Richet, P., Lejeune, A.M., Holtz, F., Roux, J., 1996. Water and the
viscosity of andesite melts. Chem. Geol. 128, 185–197.
Romano, C., Dingwell, D.B., Behrens, H., 1995. The temperature
dependence of the speciation of water in NaAlSi3O8–KAlSi3O8
melts: an application of fictive temperatures derived from syn-
thetic fluid inclusions. Contrib. Mineral. Petrol. 122, 1–10.
Romano, C., Hess, K.-U., Mincione, V., Poe, B.P., Dingwell, B.T.,
2001. The viscosities of dry and hydrous XAlSi3O8 (X =Li, Na,
K, Ca0.5, Mg0.5) melts. Chem. Geol. 174, 115–132.
Rosi, M., Santacroce, R., 1984. Volcanic hazard assessment in the
Phlegrean Fields: a contribution based on stratigraphic and his-
torical data. Bull. Volcanol. 47, 359–370.
Rosi, M., Principe, C., Vecci, R., 1993. The Vesuvius 1631 erup-
tion. A reconstruction based on historical and stratigraphical
data. J. Volcanol. Geotherm. Res. 58, 151–182.
C. Romano et al. / Chemical Geology 202 (2003) 23–3838
Scaillet, B., Holtz, F., Pichavant, M., Schmidt, M.O., 1996. The
viscosity of Himalayan leucogranites: implications for mecha-
nisms of granitic magma ascent. J. Geophys. Res. 101, 27691–
27699.
Scandone, R., Bellocci, F., Lirer, L., Rolandi, G., 1991. The struc-
ture of the Campanian Plain and the activity of Neapolitan
volcanoes (Italy). J. Volcanol. Geotherm. Res. 48, 1–31.
Schulze, F., Behrens, H., Holtz, F., Roux, J., Johannes, W., 1996.
The influence of water on the viscosity of a haplogranitic melt.
Am. Mineral. 81, 1155–1165.
Shaw, H.R., 1972. Viscosities of magmatic silicate liquids: an em-
pirical method of prediction. Am. J. Sci. 272, 870–893.
Silver, L.A., Stolper, E.M., 1989. Water in albitic glasses. J. Petrol.
30, 667–709.
Smith, J.V., 1997. Shear thickening dilatancy in crystal-rich flows.
J. Volcanol. Geotherm. Res. 79, 1–8.
Stein, D.J., Spera, F.J., 1992. Rheology and microstructure of mag-
matic emulsions: theory and experiments. J. Volcanol. Geo-
therm. Res. 49, 157–174.
Webb, S.L., 1997. Silicate melts: relaxation, rheology, and the glass
transition. Rev. Geophys. 35, 191–218.
Webb, S.L., Dingwell, D.B., 1990. Non-Newtonian rheology of
igneous melts at high stresses and strain rates: experimental
results for rhyolite, andesite, basalt, and nephelinite. J. Geophys.
Res. 95, 15695–15701.
Whittington, A., Richet, P., Holtz, F., 2000. Water and the viscosity
of hydrous depolymerized aluminosilicate melts. Geochim. Cos-
mochim. Acta 64, 3725–3736.
Whittington, A., Richet, P., Linard, Y., Holtz, F., 2001. The vis-
cosity of hydrous phonolites and trachytes. Chem. Geol. 174,
209–223.
Yamashita, S., Kitamura, T., Kusakabe, M., 1997. Infrared spectro-
scopy of hydrous glasses of arc magmas compositions. Geo-
chem. J. 31, 169–174.