The effect of H 2O on the viscosity of K-trachytic melts at magmatic temperatures
14
The effect of H 2 O on the viscosity of K-trachytic melts at magmatic temperatures Valeria Misiti a, ⁎ , Carmela Freda a , Jacopo Taddeucci a , Claudia Romano b , Piergiorgio Scarlato a , Antonella Longo c , Paolo Papale c , Brent T. Poe a,d a Istituto Nazionale di Geofisica e Vulcanologia, Sezione di Sismologia e Tettonofisica, Via di Vigna Murata 605, Rome, I-00143, Italy b Università degli Studi Roma Tre, Largo San Leonardo Murialdo 1, Rome, I-00146, Italy c Istituto Nazionale di Geofisica e Vulcanologia, Via della Faggiola 32 Pisa, I-56100, Italy d Università degli Studi G. D'Annunzio, Via dei Vestini 31, Chieti, I-66013, Italy Received 10 February 2006; received in revised form 26 June 2006; accepted 26 June 2006 Editor: R.L. Rudnick Abstract Viscosity of hydrous trachytes from the Agnano Monte Spina eruption (Phlegrean Fields, Italy) has been determined at 1.0 GPa and temperatures between 1200 and 1400 °C using the falling sphere method in a piston cylinder apparatus. The H 2 O content in the melts ranged from 0.18 to 5.81 wt.%. These high-temperature hydrous viscosities, along with previous ones determined at low-temperature (anhydrous and hydrous) and at high-temperature (anhydrous), at 1 atm on the same melt composition, represent the only complete viscosity data set available for K-trachytic melts, from magmatic to volcanic conditions. Viscosity decreases with increasing temperature and water content in the melt. At constant temperature, viscosity appears to significantly decrease when the first wt.% of H 2 O is added. At H 2 O content higher than 3 wt.% the effect of temperature on viscosity is slight. Moreover, the deviation from Arrhenian behaviour towards greater “fragility” occurs with increasing water content. We combined low- and high-temperature viscosities (also from literature) and parameterized them by the use of a modified Vogel–Fulcher–Tamman equation, which accommodates the non-Arrhenian temperature dependence of melt viscosity. Moreover, in order to explore the extent to which the improved knowledge of Agnano Monte Spina trachyte viscosity may affect simulation of volcanic eruption at Phlegrean Fields, we included our viscosity models in numerical simulations of magma flow and fragmentation along volcanic conduits. These simulations show that the new parameterizations (and hence the new equations) give stronger predictions in the temperature interval relevant for magmatic and eruptive processes. © 2006 Elsevier B.V. All rights reserved. Keywords: Viscosity; Trachyte; Falling sphere method; Vogel–Fulcher–Tamman equation 1. Introduction Viscosity is an important physical property of silicate melts controlling the kinetics of magmas from magma chamber to volcanic vent. This property is strongly influ- enced by temperature, amount of dissolved water, and chemical composition of magma (Pinkerton and Steven- son, 1992; Dingwell et al., 1993), while pressure, at least up to 2.0 GPa, does not influence viscosity significantly (Pinkerton and Stevenson, 1992; Dingwell et al., 1993). Water content, exerting a strong influence on the viscosity of silicate melts, is one of the most important parameters Chemical Geology 235 (2006) 124 – 137 www.elsevier.com/locate/chemgeo ⁎ Corresponding author. Tel.: +39 06 51860230; fax: +39 06 51860507. E-mail address: [email protected] (V. Misiti). 0009-2541/$ - see front matter © 2006 Elsevier B.V. All rights reserved. doi:10.1016/j.chemgeo.2006.06.007
-
Upload
independent -
Category
Documents
-
view
0 -
download
0
Transcript of The effect of H 2O on the viscosity of K-trachytic melts at magmatic temperatures
(2006) 124–137www.elsevier.com/locate/chemgeo
Chemical Geology 235
The effect of H2O on the viscosity of K-trachytic meltsat magmatic temperatures
Valeria Misiti a,⁎, Carmela Freda a, Jacopo Taddeucci a, Claudia Romano b,Piergiorgio Scarlato a, Antonella Longo c, Paolo Papale c, Brent T. Poe a,d
a Istituto Nazionale di Geofisica e Vulcanologia, Sezione di Sismologia e Tettonofisica, Via di Vigna Murata 605, Rome, I-00143, Italyb Università degli Studi Roma Tre, Largo San Leonardo Murialdo 1, Rome, I-00146, Italyc Istituto Nazionale di Geofisica e Vulcanologia, Via della Faggiola 32 Pisa, I-56100, Italy
d Università degli Studi G. D'Annunzio, Via dei Vestini 31, Chieti, I-66013, Italy
Received 10 February 2006; received in revised form 26 June 2006; accepted 26 June 2006
Editor: R.L. Rudnick
Abstract
Viscosity of hydrous trachytes from the Agnano Monte Spina eruption (Phlegrean Fields, Italy) has been determined at 1.0 GPa andtemperatures between 1200 and 1400 °C using the falling sphere method in a piston cylinder apparatus. The H2O content in the meltsranged from 0.18 to 5.81 wt.%. These high-temperature hydrous viscosities, along with previous ones determined at low-temperature(anhydrous and hydrous) and at high-temperature (anhydrous), at 1 atm on the same melt composition, represent the only completeviscosity data set available for K-trachyticmelts, frommagmatic to volcanic conditions. Viscosity decreases with increasing temperatureandwater content in themelt. At constant temperature, viscosity appears to significantly decreasewhen the first wt.%ofH2O is added.AtH2O content higher than 3 wt.% the effect of temperature on viscosity is slight. Moreover, the deviation from Arrhenian behaviourtowards greater “fragility” occurs with increasing water content. We combined low- and high-temperature viscosities (also fromliterature) and parameterized them by the use of a modified Vogel–Fulcher–Tamman equation, which accommodates the non-Arrheniantemperature dependence of melt viscosity. Moreover, in order to explore the extent to which the improved knowledge of AgnanoMonteSpina trachyte viscosity may affect simulation of volcanic eruption at Phlegrean Fields, we included our viscosity models in numericalsimulations of magma flow and fragmentation along volcanic conduits. These simulations show that the new parameterizations (andhence the new equations) give stronger predictions in the temperature interval relevant for magmatic and eruptive processes.© 2006 Elsevier B.V. All rights reserved.
Keywords: Viscosity; Trachyte; Falling sphere method; Vogel–Fulcher–Tamman equation
1. Introduction
Viscosity is an important physical property of silicatemelts controlling the kinetics of magmas from magma
⁎ Corresponding author. Tel.: +39 06 51860230; fax: +39 0651860507.
E-mail address: [email protected] (V. Misiti).
0009-2541/$ - see front matter © 2006 Elsevier B.V. All rights reserved.doi:10.1016/j.chemgeo.2006.06.007
chamber to volcanic vent. This property is strongly influ-enced by temperature, amount of dissolved water, andchemical composition of magma (Pinkerton and Steven-son, 1992; Dingwell et al., 1993), while pressure, at leastup to 2.0 GPa, does not influence viscosity significantly(Pinkerton and Stevenson, 1992; Dingwell et al., 1993).Water content, exerting a strong influence on the viscosityof silicate melts, is one of the most important parameters
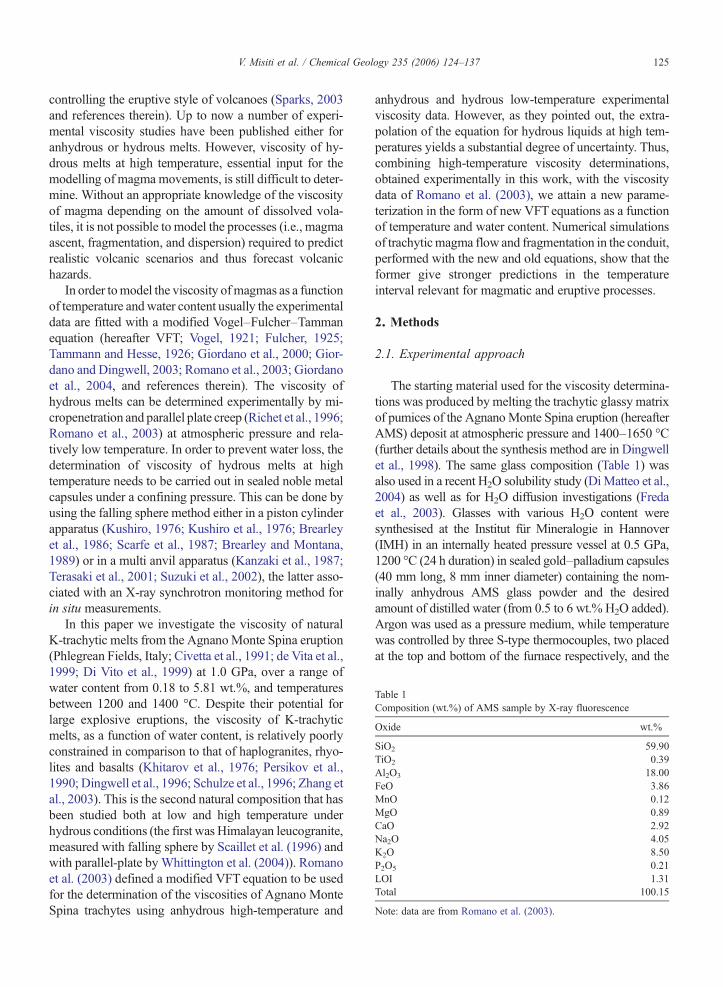
Table 1Composition (wt.%) of AMS sample by X-ray fluorescence
Oxide wt.%
SiO2 59.90TiO2 0.39Al2O3 18.00FeO 3.86MnO 0.12MgO 0.89CaO 2.92Na2O 4.05K2O 8.50P2O5 0.21LOI 1.31Total 100.15
Note: data are from Romano et al. (2003).
125V. Misiti et al. / Chemical Geology 235 (2006) 124–137
controlling the eruptive style of volcanoes (Sparks, 2003and references therein). Up to now a number of experi-mental viscosity studies have been published either foranhydrous or hydrous melts. However, viscosity of hy-drous melts at high temperature, essential input for themodelling of magma movements, is still difficult to deter-mine. Without an appropriate knowledge of the viscosityof magma depending on the amount of dissolved vola-tiles, it is not possible to model the processes (i.e., magmaascent, fragmentation, and dispersion) required to predictrealistic volcanic scenarios and thus forecast volcanichazards.
In order tomodel the viscosity ofmagmas as a functionof temperature andwater content usually the experimentaldata are fitted with a modified Vogel–Fulcher–Tammanequation (hereafter VFT; Vogel, 1921; Fulcher, 1925;Tammann and Hesse, 1926; Giordano et al., 2000; Gior-dano and Dingwell, 2003; Romano et al., 2003; Giordanoet al., 2004, and references therein). The viscosity ofhydrous melts can be determined experimentally by mi-cropenetration and parallel plate creep (Richet et al., 1996;Romano et al., 2003) at atmospheric pressure and rela-tively low temperature. In order to prevent water loss, thedetermination of viscosity of hydrous melts at hightemperature needs to be carried out in sealed noble metalcapsules under a confining pressure. This can be done byusing the falling sphere method either in a piston cylinderapparatus (Kushiro, 1976; Kushiro et al., 1976; Brearleyet al., 1986; Scarfe et al., 1987; Brearley and Montana,1989) or in a multi anvil apparatus (Kanzaki et al., 1987;Terasaki et al., 2001; Suzuki et al., 2002), the latter asso-ciated with an X-ray synchrotron monitoring method forin situ measurements.
In this paper we investigate the viscosity of naturalK-trachytic melts from the AgnanoMonte Spina eruption(Phlegrean Fields, Italy; Civetta et al., 1991; de Vita et al.,1999; Di Vito et al., 1999) at 1.0 GPa, over a range ofwater content from 0.18 to 5.81 wt.%, and temperaturesbetween 1200 and 1400 °C. Despite their potential forlarge explosive eruptions, the viscosity of K-trachyticmelts, as a function of water content, is relatively poorlyconstrained in comparison to that of haplogranites, rhyo-lites and basalts (Khitarov et al., 1976; Persikov et al.,1990; Dingwell et al., 1996; Schulze et al., 1996; Zhang etal., 2003). This is the second natural composition that hasbeen studied both at low and high temperature underhydrous conditions (the first was Himalayan leucogranite,measured with falling sphere by Scaillet et al. (1996) andwith parallel-plate by Whittington et al. (2004)). Romanoet al. (2003) defined a modified VFT equation to be usedfor the determination of the viscosities of Agnano MonteSpina trachytes using anhydrous high-temperature and
anhydrous and hydrous low-temperature experimentalviscosity data. However, as they pointed out, the extra-polation of the equation for hydrous liquids at high tem-peratures yields a substantial degree of uncertainty. Thus,combining high-temperature viscosity determinations,obtained experimentally in this work, with the viscositydata of Romano et al. (2003), we attain a new parame-terization in the form of new VFT equations as a functionof temperature and water content. Numerical simulationsof trachyticmagma flow and fragmentation in the conduit,performed with the new and old equations, show that theformer give stronger predictions in the temperatureinterval relevant for magmatic and eruptive processes.
2. Methods
2.1. Experimental approach
The starting material used for the viscosity determina-tions was produced by melting the trachytic glassy matrixof pumices of the AgnanoMonte Spina eruption (hereafterAMS) deposit at atmospheric pressure and 1400–1650 °C(further details about the synthesis method are in Dingwellet al., 1998). The same glass composition (Table 1) wasalso used in a recent H2O solubility study (DiMatteo et al.,2004) as well as for H2O diffusion investigations (Fredaet al., 2003). Glasses with various H2O content weresynthesised at the Institut für Mineralogie in Hannover(IMH) in an internally heated pressure vessel at 0.5 GPa,1200 °C (24 h duration) in sealed gold–palladium capsules(40 mm long, 8 mm inner diameter) containing the nom-inally anhydrous AMS glass powder and the desiredamount of distilled water (from 0.5 to 6 wt.% H2O added).Argon was used as a pressure medium, while temperaturewas controlled by three S-type thermocouples, two placedat the top and bottom of the furnace respectively, and the
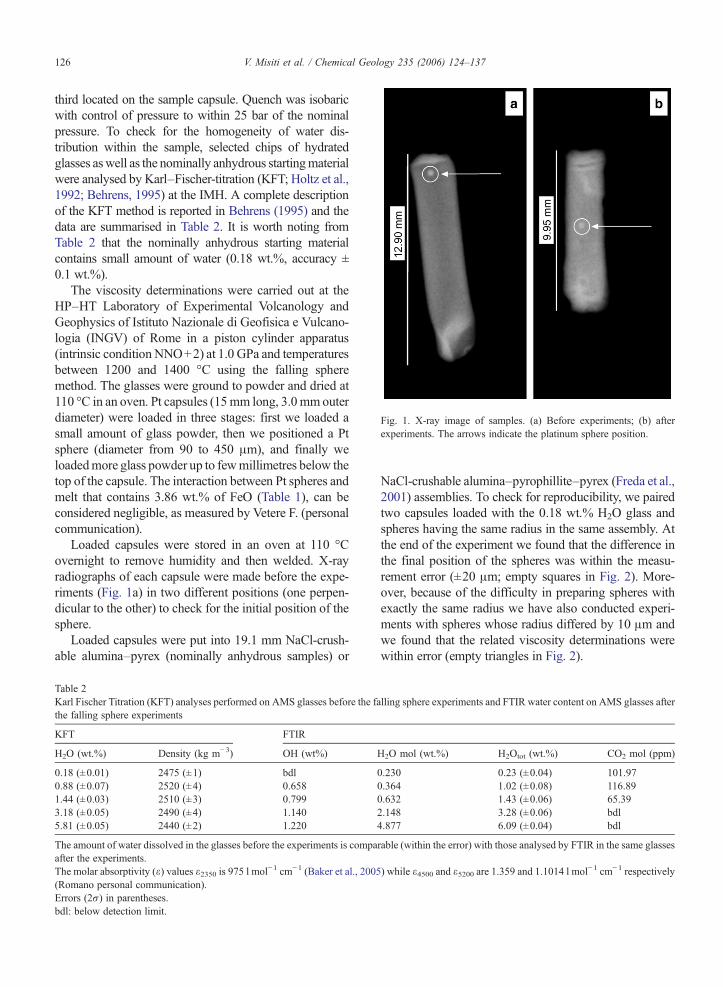
Fig. 1. X-ray image of samples. (a) Before experiments; (b) afterexperiments. The arrows indicate the platinum sphere position.
126 V. Misiti et al. / Chemical Geology 235 (2006) 124–137
third located on the sample capsule. Quench was isobaricwith control of pressure to within 25 bar of the nominalpressure. To check for the homogeneity of water dis-tribution within the sample, selected chips of hydratedglasses aswell as the nominally anhydrous startingmaterialwere analysed by Karl–Fischer-titration (KFT; Holtz et al.,1992; Behrens, 1995) at the IMH. A complete descriptionof the KFT method is reported in Behrens (1995) and thedata are summarised in Table 2. It is worth noting fromTable 2 that the nominally anhydrous starting materialcontains small amount of water (0.18 wt.%, accuracy ±0.1 wt.%).
The viscosity determinations were carried out at theHP–HT Laboratory of Experimental Volcanology andGeophysics of Istituto Nazionale di Geofisica e Vulcano-logia (INGV) of Rome in a piston cylinder apparatus(intrinsic condition NNO+2) at 1.0 GPa and temperaturesbetween 1200 and 1400 °C using the falling spheremethod. The glasses were ground to powder and dried at110 °C in an oven. Pt capsules (15mm long, 3.0mmouterdiameter) were loaded in three stages: first we loaded asmall amount of glass powder, then we positioned a Ptsphere (diameter from 90 to 450 μm), and finally weloadedmore glass powder up to fewmillimetres below thetop of the capsule. The interaction between Pt spheres andmelt that contains 3.86 wt.% of FeO (Table 1), can beconsidered negligible, as measured by Vetere F. (personalcommunication).
Loaded capsules were stored in an oven at 110 °Covernight to remove humidity and then welded. X-rayradiographs of each capsule were made before the expe-riments (Fig. 1a) in two different positions (one perpen-dicular to the other) to check for the initial position of thesphere.
Loaded capsules were put into 19.1 mm NaCl-crush-able alumina–pyrex (nominally anhydrous samples) or
Table 2Karl Fischer Titration (KFT) analyses performed on AMS glasses before the fathe falling sphere experiments
KFT FTIR
H2O (wt.%) Density (kg m−3) OH (wt%)
0.18 (±0.01) 2475 (±1) bdl0.88 (±0.07) 2520 (±4) 0.6581.44 (±0.03) 2510 (±3) 0.7993.18 (±0.05) 2490 (±4) 1.1405.81 (±0.05) 2440 (±2) 1.220
The amount of water dissolved in the glasses before the experiments is compaafter the experiments.The molar absorptivity (ε) values ε2350 is 975 l mol−1 cm−1 (Baker et al., 2005(Romano personal communication).Errors (2σ) in parentheses.bdl: below detection limit.
NaCl-crushable alumina–pyrophillite–pyrex (Freda et al.,2001) assemblies. To check for reproducibility, we pairedtwo capsules loaded with the 0.18 wt.% H2O glass andspheres having the same radius in the same assembly. Atthe end of the experiment we found that the difference inthe final position of the spheres was within the measu-rement error (±20 μm; empty squares in Fig. 2). More-over, because of the difficulty in preparing spheres withexactly the same radius we have also conducted experi-ments with spheres whose radius differed by 10 μm andwe found that the related viscosity determinations werewithin error (empty triangles in Fig. 2).
lling sphere experiments and FTIR water content on AMS glasses after
H2O mol (wt.%) H2Otot (wt.%) CO2 mol (ppm)
0.230 0.23 (±0.04) 101.970.364 1.02 (±0.08) 116.890.632 1.43 (±0.06) 65.392.148 3.28 (±0.06) bdl4.877 6.09 (±0.04) bdl
rable (within the error) with those analysed by FTIR in the same glasses
) while ε4500 and ε5200 are 1.359 and 1.1014 l mol−1 cm−1 respectively
127V. Misiti et al. / Chemical Geology 235 (2006) 124–137
In order to calculate the terminal fall velocity (seebelow), we performed at least three runs with the startingmaterial having the same water content at the sametemperature and different experimental duration (Table 3,Fig. 2).
Samples were first pressurised to 1.0 GPa (nominalpressure within 25 MPa of the actual pressure) and thenheated at a rate of 200 °C/min up to 20 °C below the setpoint. The last 20 °C were reached with a gradientof 40 °C/min. The temperature was controlled by aW95Re5–W74Re26 thermocouple and held within 3 °C ofthe experimental temperature. The thermocouple waspositioned such that its junction was coincident with thecylindrical axis of the furnace and the midpoint (length-wise) of the capsules, where the furnace hot spot isestimated to be approximately 8 mm in length. Quenchwas isobaric with an initial quench rate of 2000 °C/min.X-ray image of capsules weremade after the experiments(Fig. 1b) and the sinking distance of sphere wasmeasured (with an error of ±20 μm) by superimposingpre- and post-experiments images (Fig. 1a and b). Fromthe superimposition of the pre- and post-experimentimages, however, (Fig. 1a and b) some shortening of thecapsule due to compression can be observed. Becausethe sphere is likely to have begun its descent before theramp to experimental temperature was complete, it wasnecessary to perform more than one experiment at thesame P and T conditions but with varying duration. Infact, at least three experiments of varying duration wereperformed for each P, T condition to ensure that theterminal velocity of the descending sphere was reached,as indicated by a linear relationship between sphereposition and duration (time at experimental temperature)among all data points.
In order to verify that the shortening occurred duringcompression at room temperature, i.e. while the spherewas not descending, and also that compression did notaffect the initial position of the sphere and the measure-ment of the sinking distance, we performed a testexperiment. We inserted a film of Pt powder close to the
Fig. 2. Time vs. distance diagrams for all water content. The line outfitthrough the experimental points represent the constant sphere fallingvelocity (terminal fall velocity) that we used for the viscosity calculation.Symbols: squares, 1200 °C; triangles, 1300 °C; dots, 1400 °C. Emptysquares represent the reproducibility of themethod: two capsuleswith thesame sphere radius were put in the same run. The difference in the finalposition of the spheres is within themeasurement error (±20 μm). Emptytriangles represent experiment conducted with spheres whose radiusdiffer by 10 μm: the related viscosity values are within error. For watercontents higher than 3 wt.% the sphere attained the terminal fall velocitybefore the experiment reached the temperature set point. This can be seenin the last two pictures where t=0 gives a sphere position N0.
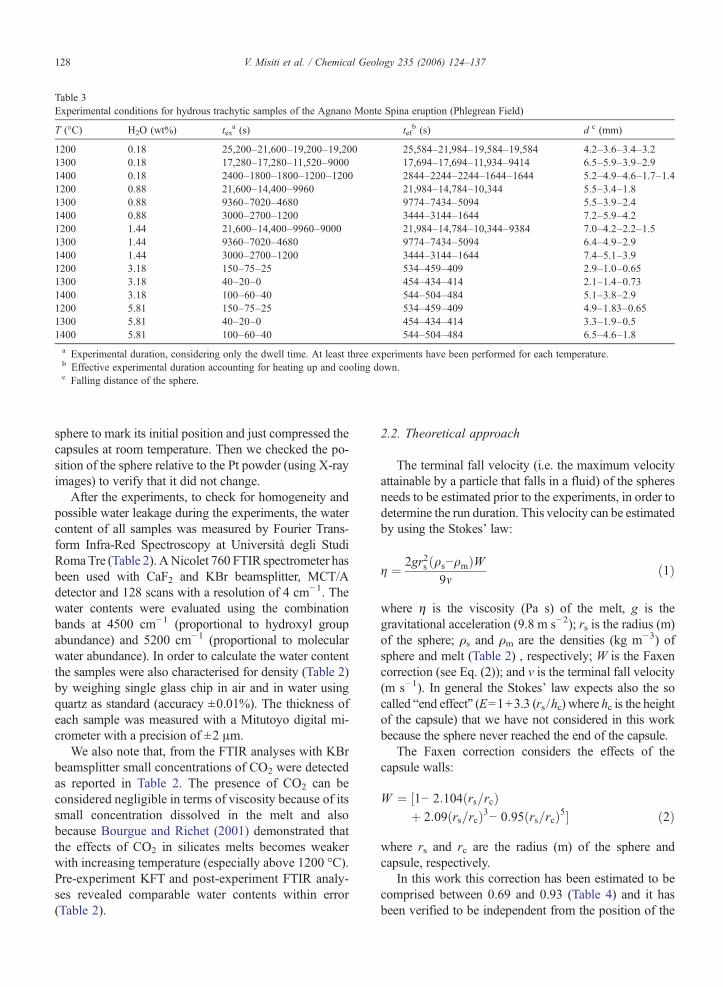
Table 3Experimental conditions for hydrous trachytic samples of the Agnano Monte Spina eruption (Phlegrean Field)
T (°C) H2O (wt%) texa (s) tef
b (s) d c (mm)
1200 0.18 25,200–21,600–19,200–19,200 25,584–21,984–19,584–19,584 4.2–3.6–3.4–3.21300 0.18 17,280–17,280–11,520–9000 17,694–17,694–11,934–9414 6.5–5.9–3.9–2.91400 0.18 2400–1800–1800–1200–1200 2844–2244–2244–1644–1644 5.2–4.9–4.6–1.7–1.41200 0.88 21,600–14,400–9960 21,984–14,784–10,344 5.5–3.4–1.81300 0.88 9360–7020–4680 9774–7434–5094 5.5–3.9–2.41400 0.88 3000–2700–1200 3444–3144–1644 7.2–5.9–4.21200 1.44 21,600–14,400–9960–9000 21,984–14,784–10,344–9384 7.0–4.2–2.2–1.51300 1.44 9360–7020–4680 9774–7434–5094 6.4–4.9–2.91400 1.44 3000–2700–1200 3444–3144–1644 7.4–5.1–3.91200 3.18 150–75–25 534–459–409 2.9–1.0–0.651300 3.18 40–20–0 454–434–414 2.1–1.4–0.731400 3.18 100–60–40 544–504–484 5.1–3.8–2.91200 5.81 150–75–25 534–459–409 4.9–1.83–0.651300 5.81 40–20–0 454–434–414 3.3–1.9–0.51400 5.81 100–60–40 544–504–484 6.5–4.6–1.8a Experimental duration, considering only the dwell time. At least three experiments have been performed for each temperature.b Effective experimental duration accounting for heating up and cooling down.c Falling distance of the sphere.
128 V. Misiti et al. / Chemical Geology 235 (2006) 124–137
sphere to mark its initial position and just compressed thecapsules at room temperature. Then we checked the po-sition of the sphere relative to the Pt powder (using X-rayimages) to verify that it did not change.
After the experiments, to check for homogeneity andpossible water leakage during the experiments, the watercontent of all samples was measured by Fourier Trans-form Infra-Red Spectroscopy at Università degli StudiRoma Tre (Table 2). ANicolet 760 FTIR spectrometer hasbeen used with CaF2 and KBr beamsplitter, MCT/Adetector and 128 scans with a resolution of 4 cm−1. Thewater contents were evaluated using the combinationbands at 4500 cm−1 (proportional to hydroxyl groupabundance) and 5200 cm−1 (proportional to molecularwater abundance). In order to calculate the water contentthe samples were also characterised for density (Table 2)by weighing single glass chip in air and in water usingquartz as standard (accuracy ±0.01%). The thickness ofeach sample was measured with a Mitutoyo digital mi-crometer with a precision of ±2 μm.
We also note that, from the FTIR analyses with KBrbeamsplitter small concentrations of CO2 were detectedas reported in Table 2. The presence of CO2 can beconsidered negligible in terms of viscosity because of itssmall concentration dissolved in the melt and alsobecause Bourgue and Richet (2001) demonstrated thatthe effects of CO2 in silicates melts becomes weakerwith increasing temperature (especially above 1200 °C).Pre-experiment KFT and post-experiment FTIR analy-ses revealed comparable water contents within error(Table 2).
2.2. Theoretical approach
The terminal fall velocity (i.e. the maximum velocityattainable by a particle that falls in a fluid) of the spheresneeds to be estimated prior to the experiments, in order todetermine the run duration. This velocity can be estimatedby using the Stokes' law:
g ¼ 2gr2s ðqs−qmÞW9m
ð1Þ
where η is the viscosity (Pa s) of the melt, g is thegravitational acceleration (9.8 m s−2); rs is the radius (m)of the sphere; ρs and ρm are the densities (kg m−3) ofsphere and melt (Table 2) , respectively; W is the Faxencorrection (see Eq. (2)); and v is the terminal fall velocity(m s−1). In general the Stokes' law expects also the socalled “end effect” (E=1+3.3 (rs /hc) where hc is the heightof the capsule) that we have not considered in this workbecause the sphere never reached the end of the capsule.
The Faxen correction considers the effects of thecapsule walls:
W ¼ ½1− 2:104ðrs=rcÞþ 2:09ðrs=rcÞ3− 0:95ðrs=rcÞ5� ð2Þ
where rs and rc are the radius (m) of the sphere andcapsule, respectively.
In this work this correction has been estimated to becomprised between 0.69 and 0.93 (Table 4) and it hasbeen verified to be independent from the position of the
129V. Misiti et al. / Chemical Geology 235 (2006) 124–137
sphere with respect to the centre of the capsule. Weperformed a run coupling two capsules (loaded with the0.18 wt.% H2O glass) in the same assembly: one capsulewith the sphere positioned in the centre and the othercapsule with the sphere close to the wall. At the end of theexperiments the spheres covered the same distance withinerror.
In our experiments we could not measure the fallingvelocity of the sphere in situ. Instead, for each experi-mental condition, we performed three to four runs withdifferent durations, measuring, for each run, the sinkingdistance of the sphere. Combination of these “snapshots”gave a time–distance profile from which we obtained theterminal fall velocity (Fig. 2). The terminal fall velocitythus measured was inserted in the Stoke's law to calculatemelt viscosity. We noted discrepancies between estimatedand measured viscosities that stem from the extrapolationof VFT parameters of Romano et al. (2003) from low tohigh temperatures, as discussed below.
3. Results and discussion
3.1. Effect of temperature, pressure, and water content
Experimental conditions and results are reported inTables 3 and 4 (Fig. 2). shows the sphere falling distanceversus time for all water contents and temperatures.Since a linear fit is generally consistent to all data points,
Table 4Viscosity data for hydrous trachytic samples of the Agnano Monte Spina eru
H2O (wt.%) T (°C) sr1) (m) v (m s−1)
0.18 1200 205×10−6 1.42×10⁻⁷
0.18 1300 225×10−6 3.94×10⁻⁷
0.18 1400 165×10−6 3.32×10⁻⁶
0.186) 1400 160×10−6 3.25×10⁻⁶
0.187) 1400 165×10−6 3.29×10⁻⁶
0.88 1200 150×10−6 3.17×10⁻⁷
0.88 1300 135×10−6 6.65×10⁻⁷
0.88 1400 95×10−6 1.51×10⁻⁶
1.44 1200 90×10−6 4.24×10⁻⁷
1.44 1300 95×10−6 7.50×10⁻⁷
1.44 1400 80×10−6 1.56×10⁻⁶
3.18 1200 150×10−6 1.85×10⁻⁵
3.18 1300 130×10−6 3.48×10⁻⁵
3.18 1400 135×10−6 3.69×10⁻⁵
5.81 1200 50×10−6 3.40×10⁻⁵
5.81 1300 50×10−6 7.09×10⁻⁵
5.81 1400 50×10−6 7.40×10⁻⁵
1)Radius of the spheres used in the falling sphere experiments.2)Faxen correction for the wall effects.3)Error (2σ) log unit, in parentheses.4)Pre-exponential factor, see Eq. (3) in the text.5)Activation energy, see Eq. (3) in the text.6) and 7) run coupling two capsules: one capsule with the sphere positioned
we assume that these linear fits represent the terminalfall velocities and we used their slopes to calculate theviscosities by using Eq. (1).
To evaluate the error in the viscosity determinations,all of the experimental data have been fitted assuming anArrhenian behaviour over the 1200–1400 °C relativelynarrow temperature range using the equation:
Log g ¼ Aþ Ea
RTð3Þ
where A is a pre-exponential term and Ea is the activationenergy in kJ mol−1. The addition of water to the meltsdecreases the activation energy (see Table 4) from 131 kJmol−1 (0.18 wt.% H2O) down to 25 kJ mol−1 (5.81 wt.%H2O). The decrease of activation energy with increasingwater content is in good agreement with previous resultson albitic melts (Dingwell, 1987; Persikov, 1991) and onalbitic and quartzofeldspathic melts (Shelby and McVay,1976; Schulze et al., 1996; Holtz et al., 1999) and is welldemonstrated combining the viscosity data from Romanoet al. (2003) and from this paper (Fig. 3). For each com-position and temperature we calculated the error using theequation of propagation error. For comparison purposeswe also computed the error for the experimental data ofRomano et al. (2003; see below).
As for several other natural and synthetic melts (cf.Dingwell and Virgo, 1988; Dingwell et al., 1996; Schulze
ption (Phlegrean Field)
W 2) log η 3) (Pa s) A4) Ea5) (kJ mol−1)
0.72 3.66 (±0.21) −6.64 1310.69 3.56 (±0.20) −6.64 1310.77 2.66 (±0.21) −6.64 1310.78 – – –0.77 – – –0.79 3.41 (±0.22) −5.14 1050.81 2.96 (±0.22) −5.14 1050.87 2.38 (±0.25) −5.14 1050.87 2.85 (±0.25) −2.74 690.87 2.64 (±0.25) −2.74 690.89 2.17 (±0.28) −2.74 690.79 1.57 (±0.21) −1.78 410.82 1.23 (±0.20) −1.78 410.81 1.19 (±0.18) −1.78 410.93 0.35 (±0.45) −1.66 250.93 0.21 (±0.40) −1.66 250.93 0.11 (±0.41) −1.66 25
in the centre and other capsule with the sphere close to the wall.
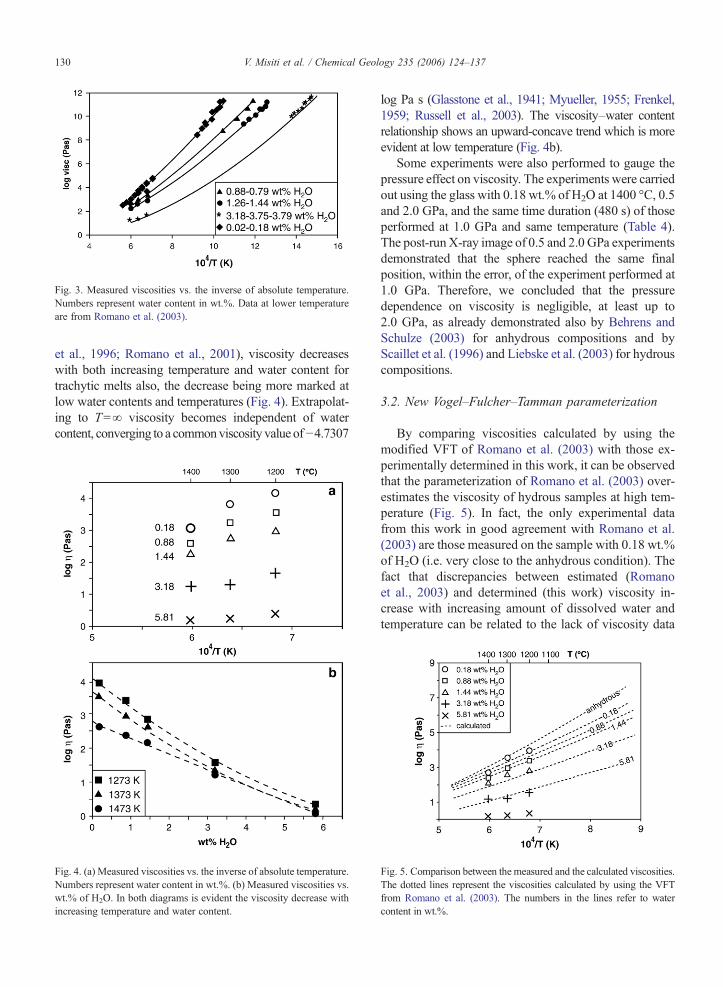
Fig. 3. Measured viscosities vs. the inverse of absolute temperature.Numbers represent water content in wt.%. Data at lower temperatureare from Romano et al. (2003).
130 V. Misiti et al. / Chemical Geology 235 (2006) 124–137
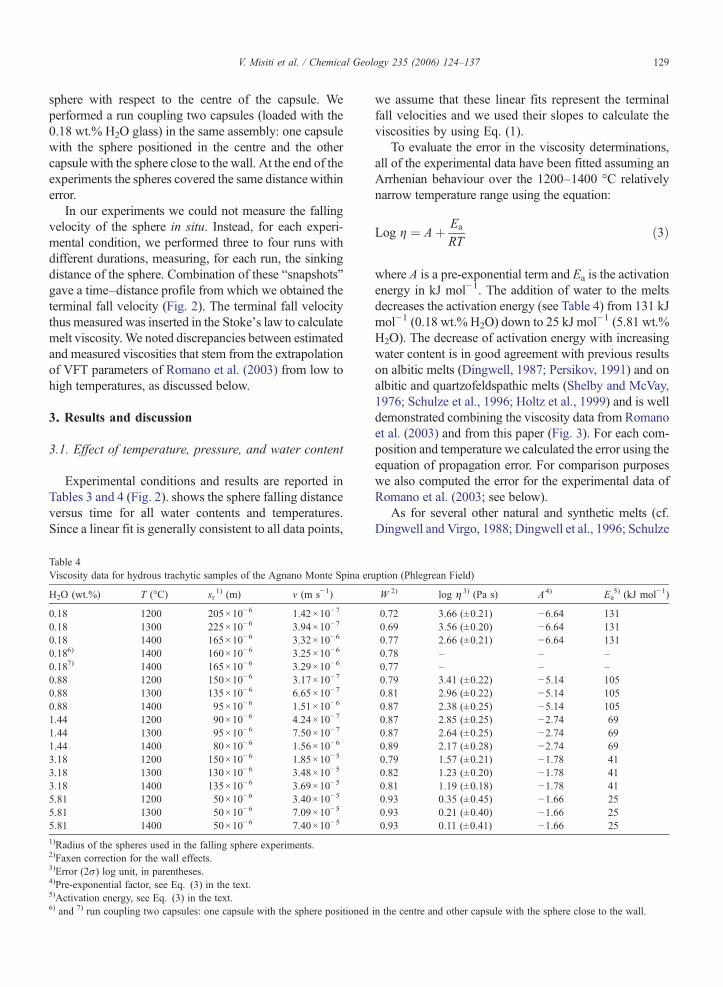
et al., 1996; Romano et al., 2001), viscosity decreaseswith both increasing temperature and water content fortrachytic melts also, the decrease being more marked atlow water contents and temperatures (Fig. 4). Extrapolat-ing to T=∞ viscosity becomes independent of watercontent, converging to a commonviscosity value of−4.7307
Fig. 4. (a) Measured viscosities vs. the inverse of absolute temperature.Numbers represent water content in wt.%. (b) Measured viscosities vs.wt.% of H2O. In both diagrams is evident the viscosity decrease withincreasing temperature and water content.
log Pa s (Glasstone et al., 1941; Myueller, 1955; Frenkel,1959; Russell et al., 2003). The viscosity–water contentrelationship shows an upward-concave trend which is moreevident at low temperature (Fig. 4b).
Some experiments were also performed to gauge thepressure effect on viscosity. The experiments were carriedout using the glass with 0.18 wt.% of H2O at 1400 °C, 0.5and 2.0 GPa, and the same time duration (480 s) of thoseperformed at 1.0 GPa and same temperature (Table 4).The post-runX-ray image of 0.5 and 2.0 GPa experimentsdemonstrated that the sphere reached the same finalposition, within the error, of the experiment performed at1.0 GPa. Therefore, we concluded that the pressuredependence on viscosity is negligible, at least up to2.0 GPa, as already demonstrated also by Behrens andSchulze (2003) for anhydrous compositions and byScaillet et al. (1996) and Liebske et al. (2003) for hydrouscompositions.
3.2. New Vogel–Fulcher–Tamman parameterization
By comparing viscosities calculated by using themodified VFT of Romano et al. (2003) with those ex-perimentally determined in this work, it can be observedthat the parameterization of Romano et al. (2003) over-estimates the viscosity of hydrous samples at high tem-perature (Fig. 5). In fact, the only experimental datafrom this work in good agreement with Romano et al.(2003) are those measured on the sample with 0.18 wt.%of H2O (i.e. very close to the anhydrous condition). Thefact that discrepancies between estimated (Romanoet al., 2003) and determined (this work) viscosity in-crease with increasing amount of dissolved water andtemperature can be related to the lack of viscosity data
Fig. 5. Comparison between the measured and the calculated viscosities.The dotted lines represent the viscosities calculated by using the VFTfrom Romano et al. (2003). The numbers in the lines refer to watercontent in wt.%.
Fig. 6. Measured vs. calculated viscosity using different VFTequations as discussed in the text. All the values are aligned showinga good correlation between the measured and calculated viscosities.
131V. Misiti et al. / Chemical Geology 235 (2006) 124–137
for hydrous melts at high temperature in Romano et al.(2003). For example the viscosities obtained in thiswork at 1200 °C and 1.44 and 3.18 wt.% of H2O are2.85 and 1.57 (log Pa s), respectively; while thosecalculated from Romano et al. (2003) are 3.58 and 3.16(log Pa s), respectively.
In order to extend the range of applicability of amodified VTF parameterization to high temperature andhydrous conditions, we combined the high-temperaturehydrous data from this work with the high-temperature(1150–1496 °C) anhydrous and low-temperature(415–814 °C) anhydrous and hydrous data fromRomanoet al. (2003). By doing this, we established new para-meters a, b, and c (reported in Table 5) to be used in themodified VTF equation (reported below, Eq. (4)):
Log g ¼ a1 þ a2 ln w H2O þ b1 þ b2 w H2O
T−ðc1 þ c2 lnwH2OÞð4Þ
where a1 and a2 are the logarithm of viscosity at infinitetemperature, b1 and b2 are the ratio between the activationenergy Ea and the gas constant R, c1 and c2 are thetemperatures (K) at which viscosity becomes infinity,w isthe amount of H2O (wt.%), and T is the absolutetemperature.
However, the above mentioned Eq. (4) cannot beused to estimate viscosity of anhydrous samples. Toovercome the limitation that the terms containing a2 andc2 approach zero at the anhydrous condition wH2O=0,and the term containing b2 approaches 1 we suggest thefollowing:
Log g ¼ a1 þ a2 ln ð1þ w H2OÞþ b1 þ b2ð1þ w H2OÞT−ðc1 þ c2 ln ð1þ w H2OÞÞ
ð5Þ
In Table 5 we report the values of the parameters andthe standard error of estimations of the global fit for Eqs.(4) and (5). We also tried to apply the Zhang et al. (2003)model to our data, but the standard error is bigger thanthat reported in Table 5.
Fig. 6 shows the measured vs. calculated viscosityusing the two different equations reported above. It is
Table 5Calibrated parameters for TVF equations
a1 a2 b1 b
Eq. (4) −4.731 (±0.581) −0.004 (±0.024) 10,788.93 (±1211.55) −Eq. (5) −4.764 (±0.182) −1.118 (±0.137) 11,187.60 (±1689.36)
Listed values correspond to use of wt.% of H2O, absolute temperature and redeviation for each value.⁎Represents the standard error of estimation of the global fit.
worthwhile noting that all of the data from the two equa-tions fall close to the zero deviation line. The largestdiscrepancies between measured and calculated viscosityappear in the low viscosity–high water content range.Despite the general good prediction capabilities of bothequations, specific differences do exist. Fig. 7 shows thedeviations between the experimentally determined vis-cosities and those predicted by each of the two equations.
3.3. Application of the new VFT equations
In order to explore the extent to which the improvedknowledge of AMS trachyte viscosity may affect thevolcanic eruption simulations at Phlegrean Fields, we haveperformed numerical simulations of magma flow andfragmentation along volcanic conduits. The simulationshave been done by using the CONDUIT4 code (Papale,2001), and have been repeated with either the viscosityparameterization of Romano et al. (2003) which does notaccount for high-T hydrous data, and the new parameter-ization given in this paper. A range of conditions covering aH2O content in magma of 2–6 wt.%, and a conduitdiameter of 30–90m, has been considered, for a total of 18numerical simulations. Three additional simulations have
2 c1 c2 Std error⁎
587.33 (±31.39) 173.56 (±52.67) −26.78 (±1.62) 0.221132.08 (±82.10) 241.38 (±72.37) −149.54 (±10.91) 0.262
stitute viscosity in Pa s. Numbers in parentheses represent the standard
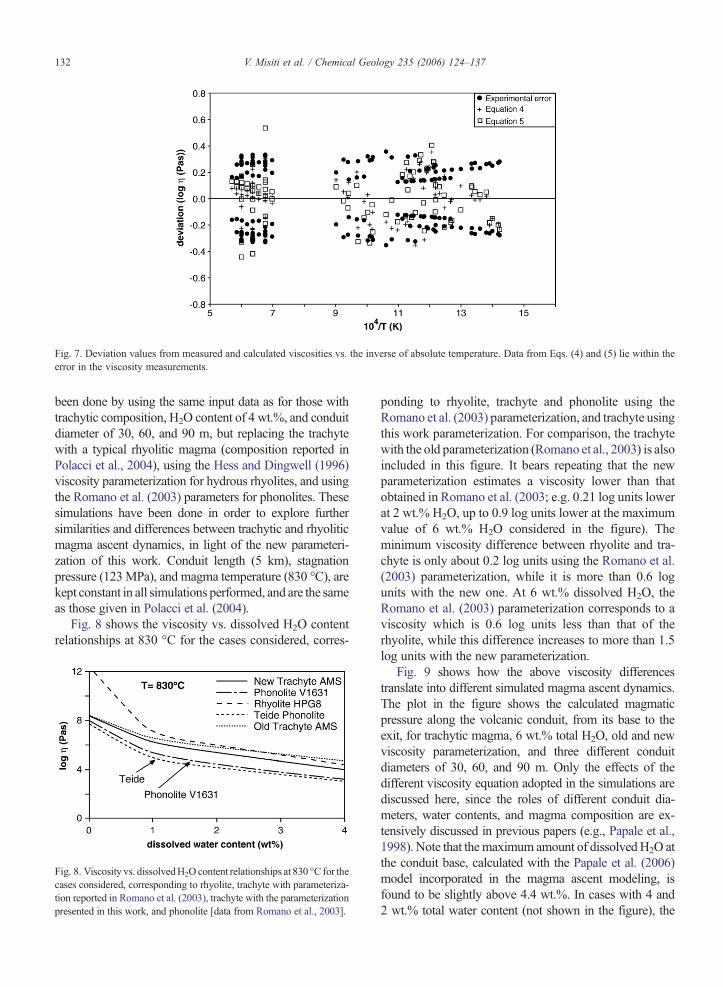
Fig. 7. Deviation values from measured and calculated viscosities vs. the inverse of absolute temperature. Data from Eqs. (4) and (5) lie within theerror in the viscosity measurements.
132 V. Misiti et al. / Chemical Geology 235 (2006) 124–137
been done by using the same input data as for those withtrachytic composition, H2O content of 4 wt.%, and conduitdiameter of 30, 60, and 90 m, but replacing the trachytewith a typical rhyolitic magma (composition reported inPolacci et al., 2004), using the Hess and Dingwell (1996)viscosity parameterization for hydrous rhyolites, and usingthe Romano et al. (2003) parameters for phonolites. Thesesimulations have been done in order to explore furthersimilarities and differences between trachytic and rhyoliticmagma ascent dynamics, in light of the new parameteri-zation of this work. Conduit length (5 km), stagnationpressure (123MPa), and magma temperature (830 °C), arekept constant in all simulations performed, and are the sameas those given in Polacci et al. (2004).
Fig. 8 shows the viscosity vs. dissolved H2O contentrelationships at 830 °C for the cases considered, corres-
Fig. 8. Viscosity vs. dissolvedH2O content relationships at 830 °C for thecases considered, corresponding to rhyolite, trachyte with parameteriza-tion reported in Romano et al. (2003), trachyte with the parameterizationpresented in this work, and phonolite [data from Romano et al., 2003].
ponding to rhyolite, trachyte and phonolite using theRomano et al. (2003) parameterization, and trachyte usingthis work parameterization. For comparison, the trachytewith the old parameterization (Romano et al., 2003) is alsoincluded in this figure. It bears repeating that the newparameterization estimates a viscosity lower than thatobtained in Romano et al. (2003; e.g. 0.21 log units lowerat 2 wt.% H2O, up to 0.9 log units lower at the maximumvalue of 6 wt.% H2O considered in the figure). Theminimum viscosity difference between rhyolite and tra-chyte is only about 0.2 log units using the Romano et al.(2003) parameterization, while it is more than 0.6 logunits with the new one. At 6 wt.% dissolved H2O, theRomano et al. (2003) parameterization corresponds to aviscosity which is 0.6 log units less than that of therhyolite, while this difference increases to more than 1.5log units with the new parameterization.
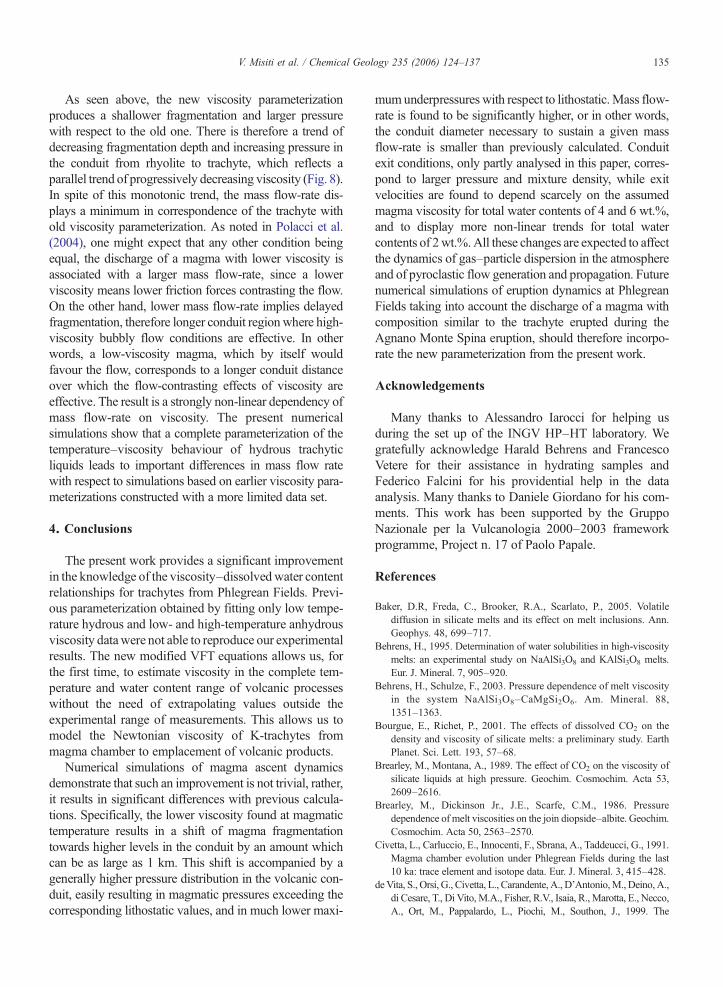
Fig. 9 shows how the above viscosity differencestranslate into different simulated magma ascent dynamics.The plot in the figure shows the calculated magmaticpressure along the volcanic conduit, from its base to theexit, for trachytic magma, 6 wt.% total H2O, old and newviscosity parameterization, and three different conduitdiameters of 30, 60, and 90 m. Only the effects of thedifferent viscosity equation adopted in the simulations arediscussed here, since the roles of different conduit dia-meters, water contents, and magma composition are ex-tensively discussed in previous papers (e.g., Papale et al.,1998). Note that themaximum amount of dissolvedH2O atthe conduit base, calculated with the Papale et al. (2006)model incorporated in the magma ascent modeling, isfound to be slightly above 4.4 wt.%. In cases with 4 and2 wt.% total water content (not shown in the figure), the
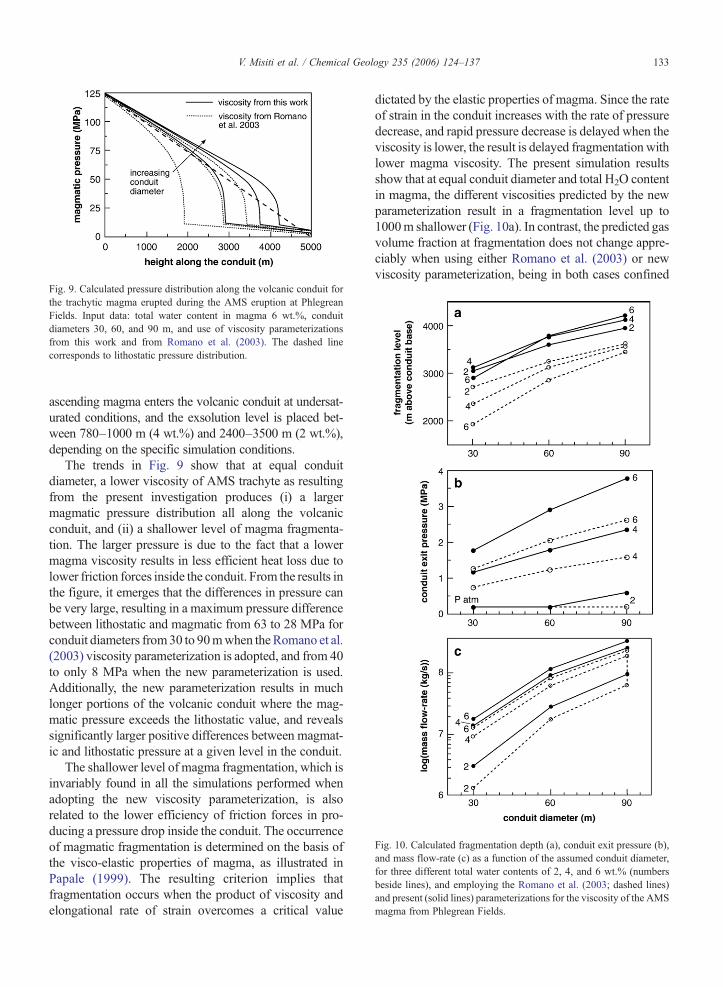
Fig. 9. Calculated pressure distribution along the volcanic conduit forthe trachytic magma erupted during the AMS eruption at PhlegreanFields. Input data: total water content in magma 6 wt.%, conduitdiameters 30, 60, and 90 m, and use of viscosity parameterizationsfrom this work and from Romano et al. (2003). The dashed linecorresponds to lithostatic pressure distribution.
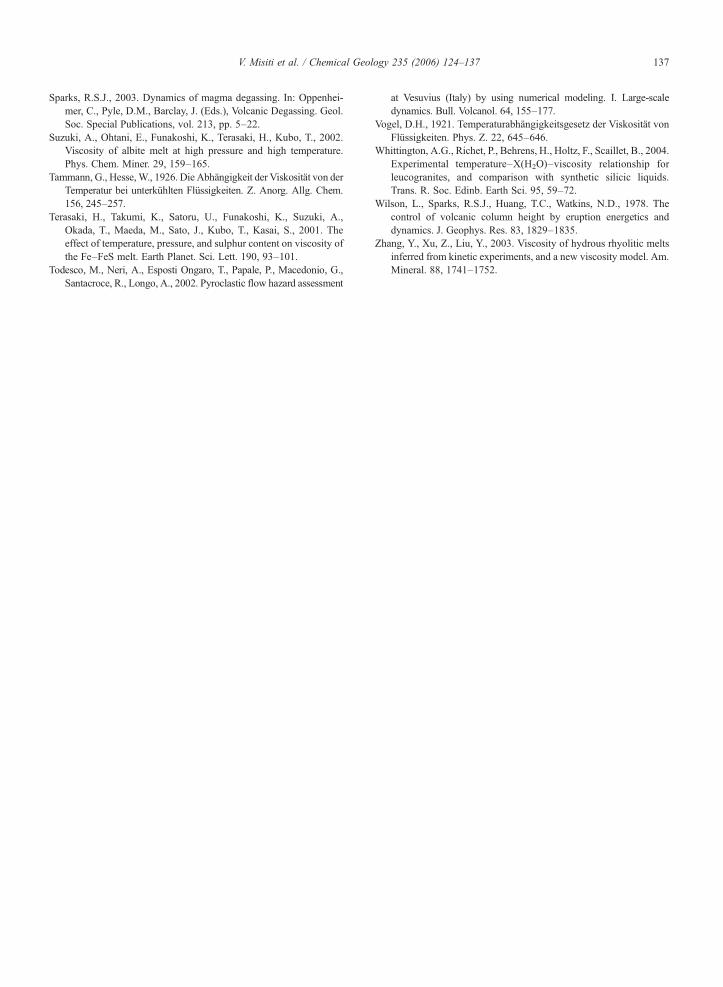
Fig. 10. Calculated fragmentation depth (a), conduit exit pressure (b),and mass flow-rate (c) as a function of the assumed conduit diameter,for three different total water contents of 2, 4, and 6 wt.% (numbersbeside lines), and employing the Romano et al. (2003; dashed lines)and present (solid lines) parameterizations for the viscosity of the AMSmagma from Phlegrean Fields.
133V. Misiti et al. / Chemical Geology 235 (2006) 124–137
ascending magma enters the volcanic conduit at undersat-urated conditions, and the exsolution level is placed bet-ween 780–1000 m (4 wt.%) and 2400–3500 m (2 wt.%),depending on the specific simulation conditions.
The trends in Fig. 9 show that at equal conduitdiameter, a lower viscosity of AMS trachyte as resultingfrom the present investigation produces (i) a largermagmatic pressure distribution all along the volcanicconduit, and (ii) a shallower level of magma fragmenta-tion. The larger pressure is due to the fact that a lowermagma viscosity results in less efficient heat loss due tolower friction forces inside the conduit. From the results inthe figure, it emerges that the differences in pressure canbe very large, resulting in a maximum pressure differencebetween lithostatic and magmatic from 63 to 28 MPa forconduit diameters from30 to 90mwhen theRomano et al.(2003) viscosity parameterization is adopted, and from 40to only 8 MPa when the new parameterization is used.Additionally, the new parameterization results in muchlonger portions of the volcanic conduit where the mag-matic pressure exceeds the lithostatic value, and revealssignificantly larger positive differences between magmat-ic and lithostatic pressure at a given level in the conduit.
The shallower level of magma fragmentation, which isinvariably found in all the simulations performed whenadopting the new viscosity parameterization, is alsorelated to the lower efficiency of friction forces in pro-ducing a pressure drop inside the conduit. The occurrenceof magmatic fragmentation is determined on the basis ofthe visco-elastic properties of magma, as illustrated inPapale (1999). The resulting criterion implies thatfragmentation occurs when the product of viscosity andelongational rate of strain overcomes a critical value
dictated by the elastic properties of magma. Since the rateof strain in the conduit increases with the rate of pressuredecrease, and rapid pressure decrease is delayed when theviscosity is lower, the result is delayed fragmentation withlower magma viscosity. The present simulation resultsshow that at equal conduit diameter and total H2O contentin magma, the different viscosities predicted by the newparameterization result in a fragmentation level up to1000m shallower (Fig. 10a). In contrast, the predicted gasvolume fraction at fragmentation does not change appre-ciably when using either Romano et al. (2003) or newviscosity parameterization, being in both cases confined

Fig. 11. Comparison between magma ascent dynamics for rhyolite andtrachyte from AMS, for an assumed conduit diameter of 60 m. (a)Pressure and gas volume fraction distributions for an assumed totalwater content of 4 wt.%. Simulation names (defined in the text) areplaced at the intersection between the corresponding curves. Thedashed line represents lithostatic pressure distribution. (b) Calculatedmass flow-rate as a function of total water content in magma.
134 V. Misiti et al. / Chemical Geology 235 (2006) 124–137
to a narrow range of 82–86% in the performed simula-tions. Fig. 10b shows the calculated conduit exit pressurefor all the performed simulations corresponding to trachy-ticmagma composition,withRomano et al. (2003; dashedlines and open symbols) and new viscosity parameteriza-tions. Conduit exit conditions are particularly importantsince they contribute substantially to determine thedynamics of the discharged gas–particle mixture in theatmosphere, and the buoyant versus collapsing style of thevolcanic column (Neri et al., 1998).
Calculated exit pressures of 1 atm in Fig. 10b for mostof the cases with 2 wt.% total water content means that theflow is equilibrated with the atmosphere. In all other caseswith exit pressure greater than atmospheric, the flowconditions are sonic and the flow is choked. Choking hasimportant implications in large scale eruption dynamics,since it implies that the depressurization dynamics in thecrater region and in general the processes occurring abovethe conduit exit plane do not affect the dynamics inside thevolcanic conduit. The results in the figure show that thenew viscosity parameterization extends the range ofconditions where the flow is choked. For a total H2Ocontent in magma of 2 wt.% and 90 m conduit diameter,the difference in conduit exit pressure calculated using thenew instead of the old Romano et al. (2003) viscosityparameterization is as large as 500%. In all other cases thisdifference is much less, yet still relevant, in the range45–65%, with the new parameterization producinggreater exit pressure.
Fig. 10c shows the calculated mass flow-rate for all thesimulations with trachytic composition, using bothRomano et al. (2003) and the new viscosity parameter-izations. Mass flow-rate is among the most criticalquantities characterizing explosive eruptions. An increasein mass flow-rate produces a volcanic column reachinghigher levels in the atmosphere (Wilson et al., 1978),therefore affecting wider areas with ash fallout, or pyro-clastic flows travelling faster and reaching larger run-outdistances (Todesco et al., 2002).
As shown in Fig. 10, the lower viscosity associatedwith the new parameterization produces, at equal conduitdiameter and total volatile content, a larger mass flow-rateof the eruption. Maximum differences are found for lowvolatile content and small conduit diameter. With a con-duit diameter of 30 m and 2 wt.% total water in magma,the mass flow-rate predicted by adopting the new visco-sity parameterization is nearly twice that obtainedwith theold parameterization. For all other considered cases, themass flow rate increases by 30–50%.
Fig. 11 shows a comparison between conditionspredicted for rhyolitic and trachytic magma ascent, byusing both the old and new parameterization for trachyte
viscosity and a conduit diameter of 60 m. All inputconditions for the simulations in Fig. 11 correspondingto equal total water content are the same, except com-position (rhyolite vs. trachyte), and adopted viscosityparameterization: Hess and Dingwell (1996) for runslabelled “rhyol”, Romano et al. (2003) for runs labelled“trach_old”, and present work for runs labelled “trach_new”.
Fig. 11a shows the gas volume fraction and pressuredistribution along the volcanic conduit for the three casesabove and total water content of 4 wt.%. The discharge oftrachytic magma results in shallower fragmentation andlarger magmatic pressure with respect to the rhyolitic case.Fragmentation occurs at a gas volume fraction around72% for rhyolite, and 82% for trachyte. Qualitatively, thecomparison between rhyolitic and trachytic magma ascentdynamics does not change when considering the old andnew viscosity parameterization for trachyte, and corre-sponds to that described in Polacci et al. (2004).Nonetheless, the old parameterization results in adecrease, and the new parameterization in an increase,of the mass flow-rate for the trachytic magma with respectto the rhyolitic magma (Fig. 11b).
135V. Misiti et al. / Chemical Geology 235 (2006) 124–137
As seen above, the new viscosity parameterizationproduces a shallower fragmentation and larger pressurewith respect to the old one. There is therefore a trend ofdecreasing fragmentation depth and increasing pressure inthe conduit from rhyolite to trachyte, which reflects aparallel trend of progressively decreasing viscosity (Fig. 8).In spite of this monotonic trend, the mass flow-rate dis-plays a minimum in correspondence of the trachyte withold viscosity parameterization. As noted in Polacci et al.(2004), one might expect that any other condition beingequal, the discharge of a magma with lower viscosity isassociated with a larger mass flow-rate, since a lowerviscosity means lower friction forces contrasting the flow.On the other hand, lower mass flow-rate implies delayedfragmentation, therefore longer conduit regionwhere high-viscosity bubbly flow conditions are effective. In otherwords, a low-viscosity magma, which by itself wouldfavour the flow, corresponds to a longer conduit distanceover which the flow-contrasting effects of viscosity areeffective. The result is a strongly non-linear dependency ofmass flow-rate on viscosity. The present numericalsimulations show that a complete parameterization of thetemperature–viscosity behaviour of hydrous trachyticliquids leads to important differences in mass flow ratewith respect to simulations based on earlier viscosity para-meterizations constructed with a more limited data set.
4. Conclusions
The present work provides a significant improvementin the knowledge of the viscosity–dissolvedwater contentrelationships for trachytes from Phlegrean Fields. Previ-ous parameterization obtained by fitting only low tempe-rature hydrous and low- and high-temperature anhydrousviscosity datawere not able to reproduce our experimentalresults. The new modified VFT equations allows us, forthe first time, to estimate viscosity in the complete tem-perature and water content range of volcanic processeswithout the need of extrapolating values outside theexperimental range of measurements. This allows us tomodel the Newtonian viscosity of K-trachytes frommagma chamber to emplacement of volcanic products.
Numerical simulations of magma ascent dynamicsdemonstrate that such an improvement is not trivial, rather,it results in significant differences with previous calcula-tions. Specifically, the lower viscosity found at magmatictemperature results in a shift of magma fragmentationtowards higher levels in the conduit by an amount whichcan be as large as 1 km. This shift is accompanied by agenerally higher pressure distribution in the volcanic con-duit, easily resulting in magmatic pressures exceeding thecorresponding lithostatic values, and in much lower maxi-
mumunderpressures with respect to lithostatic.Mass flow-rate is found to be significantly higher, or in other words,the conduit diameter necessary to sustain a given massflow-rate is smaller than previously calculated. Conduitexit conditions, only partly analysed in this paper, corres-pond to larger pressure and mixture density, while exitvelocities are found to depend scarcely on the assumedmagma viscosity for total water contents of 4 and 6 wt.%,and to display more non-linear trends for total watercontents of 2wt.%.All these changes are expected to affectthe dynamics of gas–particle dispersion in the atmosphereand of pyroclastic flow generation and propagation. Futurenumerical simulations of eruption dynamics at PhlegreanFields taking into account the discharge of a magma withcomposition similar to the trachyte erupted during theAgnano Monte Spina eruption, should therefore incorpo-rate the new parameterization from the present work.
Acknowledgements
Many thanks to Alessandro Iarocci for helping usduring the set up of the INGV HP–HT laboratory. Wegratefully acknowledge Harald Behrens and FrancescoVetere for their assistance in hydrating samples andFederico Falcini for his providential help in the dataanalysis. Many thanks to Daniele Giordano for his com-ments. This work has been supported by the GruppoNazionale per la Vulcanologia 2000–2003 frameworkprogramme, Project n. 17 of Paolo Papale.
References
Baker, D.R, Freda, C., Brooker, R.A., Scarlato, P., 2005. Volatilediffusion in silicate melts and its effect on melt inclusions. Ann.Geophys. 48, 699–717.
Behrens, H., 1995. Determination of water solubilities in high-viscositymelts: an experimental study on NaAlSi3O8 and KAlSi3O8 melts.Eur. J. Mineral. 7, 905–920.
Behrens, H., Schulze, F., 2003. Pressure dependence of melt viscosityin the system NaAlSi3O8–CaMgSi2O6. Am. Mineral. 88,1351–1363.
Bourgue, E., Richet, P., 2001. The effects of dissolved CO2 on thedensity and viscosity of silicate melts: a preliminary study. EarthPlanet. Sci. Lett. 193, 57–68.
Brearley, M., Montana, A., 1989. The effect of CO2 on the viscosity ofsilicate liquids at high pressure. Geochim. Cosmochim. Acta 53,2609–2616.
Brearley, M., Dickinson Jr., J.E., Scarfe, C.M., 1986. Pressuredependence of melt viscosities on the join diopside–albite. Geochim.Cosmochim. Acta 50, 2563–2570.
Civetta, L., Carluccio, E., Innocenti, F., Sbrana, A., Taddeucci, G., 1991.Magma chamber evolution under Phlegrean Fields during the last10 ka: trace element and isotope data. Eur. J. Mineral. 3, 415–428.
deVita, S., Orsi, G., Civetta, L., Carandente, A., D'Antonio,M., Deino, A.,di Cesare, T., Di Vito, M.A., Fisher, R.V., Isaia, R., Marotta, E., Necco,A., Ort, M., Pappalardo, L., Piochi, M., Southon, J., 1999. The

136 V. Misiti et al. / Chemical Geology 235 (2006) 124–137
Agnano-Monte Spina eruption (4100 years BP) in the restless CampiFlegrei caldera (Italy). J. Volcanol. Geotherm. Res. 91, 269–301.
Di Matteo, V., Carroll, M.R., Behrens, H., Vetere, F., Brooker, R.A.,2004.Water solubility in trachytic melts. Chem.Geol. 213, 187–196.
Di Vito,M.A., Isaia, R., Orsi, G., Southon, J., de Vita, S., D'Antonio,M.,Pappalardo, L., Piochi, M., 1999. Volcanism and deformation since12000 years at the Campi Flegrei caldera (Italy). J. Volcanol.Geotherm. Res. 91, 221–246.
Dingwell, D.B., 1987. Melt viscosities in the system NaAlSi3O8–H2O–F2O
−1. In: Mysen, B.O. (Ed.), Magmatic Processes: Physicochem-ical Principles. Geochemical Society, University Park, Pennsylvania,pp. 423–443.
Dingwell, D.B., Virgo, D., 1988. Melt viscosities in the Na2O–FeO–Fe2O3–SiO2 system and factors controlling the relative viscosities offully polymerized silicate melts. Geochim. Cosmochim. Acta 52,395–403.
Dingwell, D.B., Bagdassarov, N.S., Bussod, G.Y., Webb, S.L., 1993.Magma rheology. In: Luth, R.H. (Ed.), Short Course Handbook onExperiments at High Pressure and Applications to Earth's Mantle,vol. 21.
Dingwell, D.B., Romano, C., Hess, K.U., 1996. The effect of water onthe viscosity of a haplogranitic melt under P–T–X conditionsrelevant to silicic volcanism. Contrib. Mineral. Petrol. 124, 19–28.
Dingwell, D.B., Hess, K.U., Romano, C., 1998. Viscosity data forhydrous peraluminous granitic melts: comparison with a metalu-minous model. Am. Mineral. 83, 236–239.
Freda, C., Baker, D.B., Ottolini, L., 2001. Reduction of water loss fromgold palladium capsules during piston cylinder experiments by useof pyrophyllite powder. Am. Mineral. 86, 234–237.
Freda, C., Baker, D.R., Romano, C., Scarlato, P., 2003. Water diffusionin natural potassic melts. In: Oppenheimer, C., Pyle, D.M.,Barclay, J. (Eds.), Volcanic Degassing. Geol. Soc. SpecialPublications, vol. 213, pp. 53–62.
Frenkel, Y.I., 1959. The Kinetic Theory of Liquids, Selected Works.Vol 3, Izd. Akad. Nauk SSSR, Moscow-Leningrad. (in Russian).
Fulcher, G.S., 1925. Analysis of recent measurements of the viscosityof glasses. Am. Ceram. Soc. J. 8, 339–355.
Giordano, D., Dingwell, D.B., 2003. Non-Arrhenian multicomponentmelt viscosity: a model. Earth Planet. Sci. Lett. 208, 337–349.
Giordano, D., Dingwell, D.B., Romano, C., 2000. Viscosity of a Teidephonolite in the welding interval. J. Volcanol. Geotherm. Res. 103,239–245.
Giordano, D., Romano, C., Papale, P., Dingwell, D.B., 2004. Theviscosity of trachytes, and comparison with basalts, phonolites, andrhyolites. Chem. Geol. 213, 49–61.
Glasstone, S., Laidler, K., Eyring, H., 1941. Theory of Rate Processes.McGraw-Hill, New York.
Hess, K.U., Dingwell, D.B., 1996. Viscosities of hydrous leucograniticmelts: a non-Arrhenian model. Am. Mineral. 81, 1297–1300.
Holtz, F., Behrens, H., Dingwell, D.B., Taylor, R.P., 1992. Watersolubility in aluminosilicate melts of haplogranitic compositions at2 kbar. Chem. Geol. 96, 289–302.
Holtz, F., Roux, J., Ohlhorst, S., Behrens, H., Schulze, F., 1999. Theeffects of silica on the viscosity of hydrous quartzofeldspathicmelts. Am. Mineral. 84, 27–36.
Kanzaki, M., Kurita, K., Fujii, T., Kato, T., Shimomura, O., Akimoto, S.,1987. A new technique to measure the viscosity and density of silicatemelts at high pressure. In: Mahghnani, M.H., Shono, Y. (Eds.), HighPressure Research in Mineral Physics. Terrapub, AGU, pp. 195–200.
Khitarov, N.I., Lebedev, Y.B., Slutsky, A.M., Dorfman, A.M., Soldatov,I.A., Revin, N.I., 1976. The pressure dependence of the viscosity ofbasalts melts. Geochem. Int. 13, 126–133.
Kushiro, I., 1976. Changes in viscosity and structure of melt ofNaAlSi2O6 composition at high pressure. Geochim. Cosmochim.Acta 52, 283–293.
Kushiro, I., Yoder, H.S., Mysen, B.O., 1976. Viscosities of basaltand andesite melts at high pressure. J. Geophys. Res. 81,6351–6356.
Liebske, C., Behrens, H., Holtz, F., Lange, R.A., 2003. The influenceof pressure and composition on the viscosity of andesitic melts.Geochim. Cosmochim. Acta 67, 473–485.
Myueller, R.L., 1955. A valence theory of viscosity and fluidity forhigh-melting glass-forming materials in the critical temperaturerange. Zh. Prikl. Khim. 28, 1077–1087.
Neri, A., Papale, P., Macedonio, G., 1998. The role of magmacomposition and water content in explosive eruptions. II.Pyroclastic dispersion dynamics. J. Volcanol. Geotherm. Res. 87,95–115.
Papale, P., 1999. Strain-induced magma fragmentation in explosiveeruptions. Nature 397, 425–428.
Papale, P., 2001. Dynamics of magma flow in volcanic conduits withvariable fragmentation efficiency and nonequilibrium pumicedegassing. J. Geophys. Res. 106, 11043–11065.
Papale, P., Neri, A., Macedonio, G., 1998. The role of magmacomposition and water contents in explosive eruptions. I. Conduitascent dynamics. J. Volcanol. Geotherm. Res. 87, 75–93.
Papale, P., Moretti, R., Barbato, D., 2006. The compositionaldependence of the saturation surface of H2O+CO2 fluids insilicate melts. Chem. Geology. 229, 78–95.
Persikov, E.S., 1991. The viscosity of magmatic liquids: experiment,generalized patterns. A model for calculation and prediction.Applications. Adv. Phys. Geochem. 9, 1–40.
Persikov,E.S.,Zharikov,V.A.,Bukhtiyarov,P.G., 1990.Theeffect of volatileson the properties of magmatic melts. Eur. J. Mineral. 2, 621–642.
Pinkerton, H., Stevenson, R.J., 1992. Methods of determining therheological properties of magmas at sub-liquidus temperatures.J. Volcanol. Geotherm. Res. 53, 47–66.
Polacci, M., Papale, P., Del Seppia, D., Giordano, D., Romano, C., 2004.Dynamics of magma ascent and fragmentation in trachytic versusrhyolitic eruptions. J. Volcanol. Geotherm. Res. 131, 93–108.
Richet, P., Lejeune, A.M., Holtz, F., Roux, J., 1996. Water and theviscosity of andesite melts. Chem. Geol. 128, 185–197.
Romano, C., Hess, K.U., Mincione, V., Poe, B.T., Dingwell, D.B.,2001. The viscosities of the dry and hydrous XAlSi3O8 (X=Li, Na,K, Ca0.5, Mg0.5) melts. Chem. Geol. 174, 115–132.
Romano, C., Giordano, D., Papale, P., Mincione, V., Dingwell, D.B.,Rosi, M., 2003. The dry and hydrous viscosities of alkaline meltsfrom Vesuvius and Phlegrean Fields. Chem. Geol. 202, 23–38.
Russell, J.K., Giordano, D., Dingwell, D.B., 2003. High-temperaturelimits on viscosity of non-Arrhenian silicate melts. Am. Mineral.88, 1390–1394.
Scaillet, B., Holtz, F., Pichavant, M., Schmidt, M., 1996. Viscosity ofHimalayan leucogranites: implications for mechanism of graniticmagma ascent. J. Geophys. Res. 101, 27691–27699.
Scarfe, C.M., Mysen, B.O., Virgo, D., 1987. Pressure dependence ofthe viscosity of silicate melts. In: Mysen, B.O. (Ed.), MagmaticProcesses: Physicochemical Principles. Geochemical Society,University Park, Pennsylvania, pp. 59–67.
Schulze, F., Behrens, H., Holtz, F., Roux, J., Johannes, W., 1996. Theinfluence of water on the viscosity of a haplogranitic melt. Am.Mineral. 81, 1155–1165.
Shelby, J.E., McVay, G.L., 1976. Influence of water on the viscosityand thermal expansion of sodium trisilicate glasses. J. Non-Cryst.Solids 20, 439–449.
137V. Misiti et al. / Chemical Geology 235 (2006) 124–137
Sparks, R.S.J., 2003. Dynamics of magma degassing. In: Oppenhei-mer, C., Pyle, D.M., Barclay, J. (Eds.), Volcanic Degassing. Geol.Soc. Special Publications, vol. 213, pp. 5–22.
Suzuki, A., Ohtani, E., Funakoshi, K., Terasaki, H., Kubo, T., 2002.Viscosity of albite melt at high pressure and high temperature.Phys. Chem. Miner. 29, 159–165.
Tammann, G., Hesse,W., 1926. Die Abhängigkeit der Viskosität von derTemperatur bei unterkühlten Flüssigkeiten. Z. Anorg. Allg. Chem.156, 245–257.
Terasaki, H., Takumi, K., Satoru, U., Funakoshi, K., Suzuki, A.,Okada, T., Maeda, M., Sato, J., Kubo, T., Kasai, S., 2001. Theeffect of temperature, pressure, and sulphur content on viscosity ofthe Fe–FeS melt. Earth Planet. Sci. Lett. 190, 93–101.
Todesco, M., Neri, A., Esposti Ongaro, T., Papale, P., Macedonio, G.,Santacroce, R., Longo, A., 2002. Pyroclastic flow hazard assessment
at Vesuvius (Italy) by using numerical modeling. I. Large-scaledynamics. Bull. Volcanol. 64, 155–177.
Vogel, D.H., 1921. Temperaturabhängigkeitsgesetz der Viskosität vonFlüssigkeiten. Phys. Z. 22, 645–646.
Whittington, A.G., Richet, P., Behrens, H., Holtz, F., Scaillet, B., 2004.Experimental temperature–X(H2O)–viscosity relationship forleucogranites, and comparison with synthetic silicic liquids.Trans. R. Soc. Edinb. Earth Sci. 95, 59–72.
Wilson, L., Sparks, R.S.J., Huang, T.C., Watkins, N.D., 1978. Thecontrol of volcanic column height by eruption energetics anddynamics. J. Geophys. Res. 83, 1829–1835.
Zhang, Y., Xu, Z., Liu, Y., 2003. Viscosity of hydrous rhyolitic meltsinferred from kinetic experiments, and a new viscosity model. Am.Mineral. 88, 1741–1752.