Bioturbation on wildfire-affected southeast Australian hillslopes: Spatial and temporal variation
12
This article appeared in a journal published by Elsevier. The attached copy is furnished to the author for internal non-commercial research and education use, including for instruction at the authors institution and sharing with colleagues. Other uses, including reproduction and distribution, or selling or licensing copies, or posting to personal, institutional or third party websites are prohibited. In most cases authors are permitted to post their version of the article (e.g. in Word or Tex form) to their personal website or institutional repository. Authors requiring further information regarding Elsevier’s archiving and manuscript policies are encouraged to visit: http://www.elsevier.com/copyright
Transcript of Bioturbation on wildfire-affected southeast Australian hillslopes: Spatial and temporal variation
This article appeared in a journal published by Elsevier. The attachedcopy is furnished to the author for internal non-commercial researchand education use, including for instruction at the authors institution
and sharing with colleagues.
Other uses, including reproduction and distribution, or selling orlicensing copies, or posting to personal, institutional or third party
websites are prohibited.
In most cases authors are permitted to post their version of thearticle (e.g. in Word or Tex form) to their personal website orinstitutional repository. Authors requiring further information
regarding Elsevier’s archiving and manuscript policies areencouraged to visit:
http://www.elsevier.com/copyright

Author's personal copy
Bioturbation on wildfire-affected southeast Australian hillslopes: Spatial andtemporal variation
Paul J. Richards a,⁎, Geoff S. Humphreys a,1, Kerrie M. Tomkins a, Richard A. Shakesby b, Stefan H. Doerr b
a Department of Environment and Geography, Macquarie University, Sydney, Australiab Department of Geography, College of Science, Swansea University, UK
a b s t r a c ta r t i c l e i n f o
Article history:Received 26 August 2009Received in revised form 1 April 2011Accepted 1 May 2011
Keywords:BioturbationAphaenogasterBurrowsSoilsWildfireAustralia
The importance of bioturbation as an agent of soil and geomorphological change is well known but fewobservations have been made of spatial and temporal variations in bioturbation rates. We quantifiedvariations in surface bioturbation by ants (particularly Aphaenogaster longiceps) and vertebrates in thesandstone terrain of the Blue Mountains, southeast Australia. Following wildfire during the period late 2001–early 2002, wemonitored thirty-three 5 m2 plots positioned in six different slope units and in two catchmentsaffected by different wildfire severities. Measurements were made seasonally for six years. Overall, meanrates of ant mounding and surface scraping by vertebrates were similar (246±339 g m−2 yr−1 and 274±179 g m−2 yr−1, respectively). However, rates varied substantially according to slope unit, showing a markedmaximum for both ant mounding and total bioturbation on footslopes. Possible reasons for this spatialvariation are discussed. A complex response to various soil and ecological factors such as soil texture, soilmoisture and vegetation patterns is the most likely explanation. Associated estimates of topsoil (0–30 cmdepth) turnover times, based on ant mounding rates alone, ranged from 300 to 100,000 years for differentslope units. In contrast to previous findings, wildfire severity did not seem to affect bioturbation, possiblybecause of ant survival in deep nests and spatial patchiness of fire severity. There was likewise no clear linkbetween temporal changes in bioturbation and fire severity; high rates in the first two years after wildfirewere followed by lower rates for all burn severity types. There was also seasonal variability that was notdirectly related to rainfall. The results substantiate the importance of bioturbation in modifying soilcharacteristics and influencing soil erosion, especially following a major disturbance event like wildfire.
© 2011 Elsevier B.V. All rights reserved.
1. Introduction
Bioturbation can have a significant influence on the formation ofso-called texture-contrast soils (e.g. Paton et al., 1995; Phillips, 2007),on downslope soil transfer (e.g. Gabet et al., 2003; Heimsath et al.,2002), and on soil macroporosity and runoff generation (e.g.Cammeraat et al., 2002; Sobieraj et al., 2002). It also affects soilcarbon dynamics (see Wilkinson et al., 2009), and is relevant topalaeoenvironmental, ecological and evolutionary research (e.g.Hasiotis, 2003; Meysman et al., 2006). To date, soil bioturbation hasbeen mainly measured in terms of surface mounding rates. Estimateshave been made for various soil fauna in a wide range of settings (seePaton et al., 1995; Wilkinson et al., 2009), but only rarely have spatialand temporal variations been studied. For example, rates ofAphaenogaster ant mounding in Australia have been noted to fluctuatein response to soil moisture changes and other controls (see Richards,2009a). Bioturbation by this ant genus, and many others, is known to
affect soil properties and processes at the micro-scale but, because oflimited study of its spatial distribution, little is known of its impacts athillslope and catchment scales (Cammeraat and Risch, 2008).
This study builds on preliminary work reported by Shakesby et al.(2006). It explores variation in surface bioturbation – namely antmounding andvertebrate scraping–onnewlyburnt terrain in southeastAustralia over a six-year period. It focuses on the following aspects ofbioturbation: 1) differences in rates between slope units and betweenwildfire severities in two small catchments; 2) seasonal and annualchanges in rates over the monitoring period, particularly in response towildfire and rainfall; 3) the likely contribution of various soil andecological factors in explaining variations in rates; and 4) its impacts onsoil characteristics and geomorphological activity.
2. Background
The research was carried out in two small (b1 km2) catchmentswhere ant mounding – mostly by Aphaenogaster longiceps – andsurface scraping by vertebrates such as lyrebirds, bandicoots andwombats are abundant (Richards, 2009b). These catchments havebeen the focus of associated studies which have examined their
Catena 87 (2011) 20–30
⁎ Corresponding author. Tel.: +61 405 481320.E-mail address: [email protected] (P.J. Richards).
1 Deceased.
0341-8162/$ – see front matter © 2011 Elsevier B.V. All rights reserved.doi:10.1016/j.catena.2011.05.003
Contents lists available at ScienceDirect
Catena
j ourna l homepage: www.e lsev ie r.com/ locate /catena

Author's personal copy
hydro-geomorphological responses to different burn severities (highand low-moderate) following the Black Christmas wildfires ofDecember 2001 to January 2002 (e.g. Blake et al., 2008; Doerr et al.,2006; Shakesby et al., 2003, 2006, 2007). They are situatedapproximately 85 km southwest of the Sydney CBD in Nattai NationalPark (Fig. 1), on the sides of the gorge-like valley of Blue Gum Creek(Fig. 2), which is cut into near horizontally bedded sandstone.
The climate is humid temperate, with a mean annual rainfall of864 mm and no marked dry season (Tomkins et al., 2008). Thewildfire-prone vegetation is classified as open Sydney SandstoneGully Forest (Fisher et al., 1995). At Blue GumCreek, Eucalyptus crebra,E. deanei, E. piperita, E. punctata, Allocasuarina tortulosa and Corymbiaeximia are particularly common, with E. sieberi and Corymbiagummifera common on the ridge tops (Shakesby et al., 2003; Tomkinset al., 2004). Geomorphologically effective rainfall that triggers splashand sediment transport occurs in response to severe thunderstormsand low-pressure systems (Tomkins et al., 2008).
The catchment slopes can be divided into six slope units, from theridge-tops at an altitude of approximately 500 m to the valley floors atapproximately 300 m (Fig. 1). Shakesby et al. (2003, 2006), in theirexamination of post-fire soil water repellency, bioturbation and erosion,designated the slope units as: 1) ridge-top slopes (b5°); 2) upper mid-slopes (30–35°); 3) lowermid-slopes (20–25°); 4) lower slopes (5–15°);5) footslopes (b5°); and 6) valley floors (b5°). Just below the relativelyflat ridge tops (plateau) is a cliff line severalmetres in height. The slopesbelow the cliff line have a continuous colluvial soil mantle, whichextends for approximately 200 m down to the valley floor. Topsoiltextures mostly vary from loamy sand to sandy loam, but are alsodescribed as clay loams on the valley floor and where clay lenses areexposed near the surface (Shakesby et al., 2003; Tomkins et al., 2004).
Previous work in the study area has shown that surface bioturbationplays an important role inmodifying post-fire soil erosion and sedimentredistribution processes (Blake et al., 2008; Richards et al., 2011;Shakesby et al., 2003, 2006, 2007; Tomkins et al., 2008). Throughmeasurement of the same 33 plots as used in the present study,Shakesby et al. (2006) reported combined rates of ant and vertebratebioturbationmeasured in February 2003 (14 monthsafter thewildfires)ranging from 50 to 780 g m−2 yr−1. Ant mounding generally led tomore soil translocation in ridge-top and footslope units (≤ 5°) than inmid-slope (20–35°) locations, whereas the opposite was the case forvertebrate scraping. No major differences were found between the twosub-catchments affected by different fire severities. This contrasts withDragovich andMorris (2002),who found that differences infire severityaffected the geomorphological significance of ant mounding andvertebrate scraping at Faulconbridge; a site with similar soil and fireseverity characteristics elsewhere in the BlueMountains, approximately60 km north of Blue Gum Creek.
The present paper assesses such spatial variability in bioturbationrates over amuch longer timeframe (six years) than that reported on byShakesby et al. (2006), putting post-disturbance rates in the context oflonger-term changes including seasonal and annual variation. At nearbyCordeaux (Fig. 1), Humphreys (1981) made monthly collections of A.longiceps deposits for one year using twenty 5 m2 permanent quadrats,beginning seven months after a wildfire. Although seasonally variablewith a marked winter minimum, the overall rate of A. longicepsmounding was exceptionally high at 814 g m−2 yr−1 and much higherthan that of earthworm casting (133 g m−2 yr−1).
Aphaenogaster ants construct relatively erodible and ephemeral(type-I) surface mounds (Fig. 3) which are geomorphologicallysignificant, particularly for sediment availability (see Eldridge and
Fig. 1. Location of the Blue Gum Creek study area (top), and approximate positions of plots by slope unit (bottom). The bold line in the latter is a road on the ridge top, and the linelabelled ‘Blue Gum Creek’ is a road that runs just south of the creek itself. Plot numbering (1–5/1–6) corresponds to the description of slope units in Section 2.
21P.J. Richards et al. / Catena 87 (2011) 20–30

Author's personal copy
Myers, 1998; Humphreys and Mitchell, 1983; Paton et al., 1995;Richards, 2009a). Other common soil-nesting ants in the Nattai regioninclude Iridomyrmex, Myrmecia and Camponotus species, but they aremore likely to produce surface bioturbation without any collectabledeposit and/or type-IImounds (i.e. relatively large and semi-permanentstructures).
Vertebrate scrapes typically formshallowbut distinct excavations andloose accompanying depositions of soil, and are therefore similar in theirgeomorphic function to the type-I ant mounds. In southeast Australia,surfacedisturbance causedbywombats (Vombatus ursinus) is particularlyevident (e.g. Heimsath et al., 2000, 2002; Mitchell, 1988; Smith andDragovich, 2008). For Blue Gum Creek, other mammals that probablycontribute to scraping include bandicoots (Isoodon sp., Perameles sp.),marsupial mice (Antechinus sp.) and echidnas (Tachyglossus aculeatus),but the largest and most enduring scrapes identified in this study werecreated by lyrebirds (Menura novaehollandiae).
3. Methods
3.1. Data collection
Following the wildfires, the catchments were assessed as high fireseverity (catchmentH) and low tomoderatefire severity (catchment L),based on the degree of vegetal destruction (see Chafer et al., 2004;Shakesby et al., 2003). Apart from severity, the catchments are verysimilar, having comparable aspect, vegetation associations, soils andmorphologies.
Three bioturbation plots were located at each of six and five slopeunits in catchments H and L, respectively. For logistical reasons,catchment L lacks valley floor plots and its footslope site is relativelyisolated (Fig. 1). Each of the 33 plots (or quadrats), which were markedwith masonry nails, had an area of 5 m2. Only eight of the 33 were inplace for the first data collection in August 2002. The remaining plots
Fig. 2. The gorge-like valley of Blue Gum Creek, looking upstream.
Fig. 3. Ant mounds in Blue Gum Creek: a) in the first year following wildfire, and b) after rainfall, with newly excavated soil half-covering a compacted funnel form (length of spoon:32 cm).
22 P.J. Richards et al. / Catena 87 (2011) 20–30
Author's personal copy
were marked prior to the second data collection in February 2003; thecollection reported on by Shakesby et al. (2006). The initial eight plotswere located in all slope units other than the ridge-top sites and thecatchment L upper mid-slope. The first dataset is not included in ouranalysis of spatial and seasonal variation, but is used in our overallassessment of the influence of wildfire.
Measurements were made seasonally (spring, summer, autumn,winter). Ant mound material was conservatively collected andbagged. Mounded material was oven-dried at 105 °C for 24 h, sievedusing a b2 mm mesh size to remove coarse litter (which is unlikely tohave been moved directly by the ants), and weighed. This approach(see also Humphreys, 1981) provides greater accuracy of moundmassdetermination than measurements of mound dimensions (e.g. Lobryde Bruyn and Conacher, 1994). However, the latter was the onlyoption in the case of the vertebrate scrapes because their ejecta aremuch more difficult to define. Scrapes were judged to be eithertriangular or rectangular in form and the length, width and depth ofexcavations (not ejecta) were measured to calculate their volumes,which were converted to mass using soil bulk density data (Tomkinset al., 2004). Only clearly fresh depressions, and those indisputablycreated by vertebrates (distinguished from stone displacement orrainwash erosion), were included in the analysis.
Calculated rates of surface bioturbation are regarded as providingminimal estimates, given: 1) conservative determinations of moundand scrape volumes; 2) unquantified sporadic, type-II forms; and3) unknown changes to mounds and scrapes (particularly erosiveloss) occurring between collections. However, it is also possible that
the removal of ant mounds induced further mounding (Humphreysand Mitchell, 1983).
3.2. Data analysis
Therewere twenty field surveys in the period 2002–7 (thewinters of2003 and 2005 had not been monitored), including the survey reportedby Shakesby et al. (2006). ‘Ant mounding’, ‘vertebrate scraping’ and thetwo ‘combined’were treated as three separate categories in data analysis.The mass of soil displaced in the three bioturbation plots at each slopeunit was averaged, to derive a single value for each unit. Analysis oftemporal variation was conducted in terms of the mean mass ofbioturbated soil (g m−2) collected according to season or year. Analysisof spatial variation was conducted in terms of the mean mass ofbioturbated soil (g m−2) collected from the second to twentieth datacollections (i.e. 2003–7), according to slopeunit. In order to present thesespatial results in a form directly comparable with similar studies in theliterature, we took the additional step of estimating ‘annual’ bioturbationrates (g m−2 yr−1) by summing the mass of bioturbated soil for each ofthe ‘years’ (autumn to summer data collections) and calculating themean for the studyperiod. (Note that these annual rateswerenot used asthe basis of any graphical or statistical analyses.) Furthermore, as inprevious analysis of Aphaenogaster mounding (see Richards, 2009a,2009b), topsoil turnover timeswere estimated by dividing the volume ofa 30-cmdeep, 1 m2 area of topsoil by themounding rate, after convertingmass to volume using soil bulk density data.
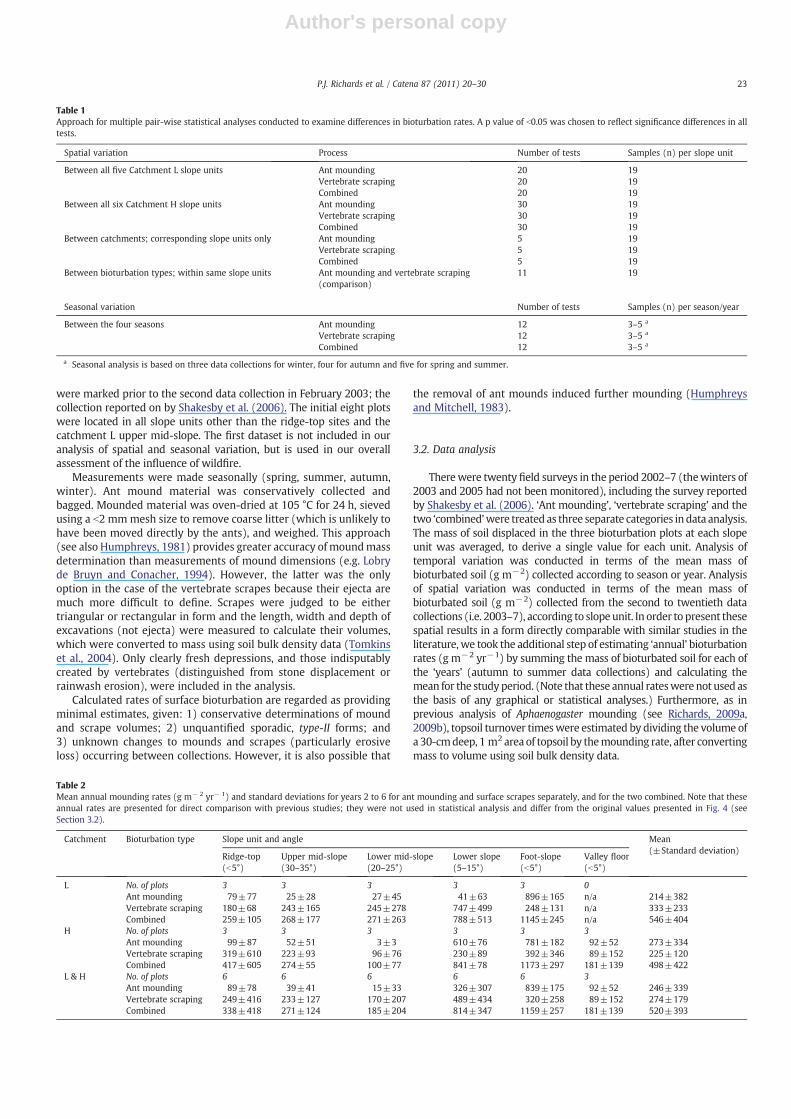
Table 1Approach for multiple pair-wise statistical analyses conducted to examine differences in bioturbation rates. A p value of b0.05 was chosen to reflect significance differences in alltests.
Spatial variation Process Number of tests Samples (n) per slope unit
Between all five Catchment L slope units Ant mounding 20 19Vertebrate scraping 20 19Combined 20 19
Between all six Catchment H slope units Ant mounding 30 19Vertebrate scraping 30 19Combined 30 19
Between catchments; corresponding slope units only Ant mounding 5 19Vertebrate scraping 5 19Combined 5 19
Between bioturbation types; within same slope units Ant mounding and vertebrate scraping(comparison)
11 19
Seasonal variation Number of tests Samples (n) per season/year
Between the four seasons Ant mounding 12 3–5 a
Vertebrate scraping 12 3–5 a
Combined 12 3–5 a
a Seasonal analysis is based on three data collections for winter, four for autumn and five for spring and summer.
Table 2Mean annual mounding rates (g m− 2 yr− 1) and standard deviations for years 2 to 6 for ant mounding and surface scrapes separately, and for the two combined. Note that theseannual rates are presented for direct comparison with previous studies; they were not used in statistical analysis and differ from the original values presented in Fig. 4 (seeSection 3.2).
Catchment Bioturbation type Slope unit and angle Mean(±Standard deviation)
Ridge-top(b5°)
Upper mid-slope(30–35°)
Lower mid-slope(20–25°)
Lower slope(5–15°)
Foot-slope(b5°)
Valley floor(b5°)
L No. of plots 3 3 3 3 3 0Ant mounding 79±77 25±28 27±45 41±63 896±165 n/a 214±382Vertebrate scraping 180±68 243±165 245±278 747±499 248±131 n/a 333±233Combined 259±105 268±177 271±263 788±513 1145±245 n/a 546±404
H No. of plots 3 3 3 3 3 3Ant mounding 99±87 52±51 3±3 610±76 781±182 92±52 273±334Vertebrate scraping 319±610 223±93 96±76 230±89 392±346 89±152 225±120Combined 417±605 274±55 100±77 841±78 1173±297 181±139 498±422
L & H No. of plots 6 6 6 6 6 3Ant mounding 89±78 39±41 15±33 326±307 839±175 92±52 246±339Vertebrate scraping 249±416 233±127 170±207 489±434 320±258 89±152 274±179Combined 338±418 271±124 185±204 814±347 1159±257 181±139 520±393
23P.J. Richards et al. / Catena 87 (2011) 20–30

Author's personal copy
Rainfall data from the nearest gauge, 68166 Buxton at Amaroo(annual average, 849 mm), were also analysed because of thepotentially key influence of rainfall over both the amount of antmoundmaterial collected and the volume of scrapes. The Buxton gaugeis located on the ridge top, approximately 2 km from catchment L and4 km fromcatchmentH, thus providing a reliable indication of rainfall inboth catchments. Rainfall events were defined as a minimum of 10 mmd−1 at one ormore gauges across the Nattai catchment, consistent withthemethods described in Tomkins et al. (2008). Rainfall was analysed asannual and seasonal averages, as total rainfall between bioturbationcollections, and as the total of themost recent rainfall eventprior to eachcollection.
Mann-Whitney-U tests, through multiple pairwise analyses, wereused to determine the statistical significance of mounding ratedifferences between plots and between seasons (Table 1). Kruskal-Wallis testswere used in the analysis of annual variation. The associationbetween ant mounding rate and rainfall was investigated usingregression analysis. Statistical significance is based on p=0.05 as thecritical value (Matthews, 1981).
4. Results
4.1. Average rates of bioturbation
Although spatially variable, the overall mean rate of surfacebioturbation for 2003–7 was 520±393 g m−2 yr−1 (equivalent to5.2 t ha−1 yr−1) or 558±381 gm−2 yr−1 excluding the first two datacollections. Ant mounds and vertebrate scrapes were of similarproportions (respectively, 52.7 and 47.3% of the combined total;Table 2), despite higher antmound than scrape densities onmost slopeunits (Table 3).
4.2. Spatial variation in rates of bioturbation
4.2.1. Variation according to slope unitThe lower slope and footslope units dominate total bioturbation
(Fig. 4). Antmoundingwas highest on the footslope in both catchmentsand high on the lower slope in catchment H. Scraping, otherwisesubordinate and significantly different (pb0.05) to ant mounding atthese units (Figs. 4; 5), was highest on the lower slope of catchment Lwhere rates of scraping were at least twice those of any other position(possibly because several wombat burrow entrances nearby promotedmore intense foraging in this vicinity). Rates of scraping were generallyless variable over the hillslope than rates of ant mounding, andconsistently higher than ant mounding in mid-slope and ridge-topunits (Fig. 4; Table 2). This difference is statistically significant (pb0.05)at the upper mid-slope units of both catchments and at the catchmentL lower mid-slope and lower slope (Fig. 5). On the lower mid-slope incatchment H, ant mounding was almost absent. The data, therefore,indicate a downslope switch in the dominant bioturbator, fromvertebrates on higher slopes to ants on the footslope, the transitionoccurring around the lower slope to lower mid-slope. However, ant
mounding and combined bioturbation on the valley floor is significantlyless active (pb0.05) than on the neighbouring footslope and lowerslope, and is not significantly different to the upper mid-slope or ridge-top plots (Fig. 5).
4.2.2. Variation between catchmentsCatchment L had a slightly higher but statistically indistinguishable
rate of combined mounding (546±404 g m−2 yr−1) when comparedwith catchmentH (498±422 gm−2 yr−1). Greater disparities betweenthecatchments are evidentwhenantmoundingandvertebrate scrapingare considered separately. The relative scarcity of ant mounding incatchment L is reflected in a significantly higher ant mounding rate incatchment H for all plots (pb0.05). Furthermore, omitting productivefootslope plots reduces the annual ant mounding rate for catchmentL from 214 to less than 50 g m−2 yr−1. Conversely, although highlyvariable, vertebrate scrapingwas generally slightly higher in catchmentL than H (Table 2) but not significantly so (pN0.05).
With regard to between-catchment differences for each slope unit,there are no significant differences for vertebrate scraping or combinedbioturbation (Fig. 5) and for ant mounding the only significantdifference was for the lower slopes (pb0.05). For combined bioturba-tion, the footslopes in particular show little difference (p=0.79) (seealso Table 2; Fig. 4).
Table 3Mean spatial density of ant mounds and vertebrate scrapes over the study period (n/m=not measured).
Slope Catchment L Catchment H
Unit Angle (°) No. of ant mounds per m2 No. of scrapes per m2 No. of ant mounds per m2 No. of scrapes per m2
Ridge-top b5 0.6 0.1 0.7 0.1Upper mid-slope 30–35 0.3 0.2 0.4 0.2Lower mid-slope 20–25 0.2 0.2 0.1 0.1Lower slope 5–15 0.2 0.5 2.6 0.3Footslope b5 2.9 0.3 3.4 0.5Valley floor b5 n/m n/m 0.5 0.1MEAN 0.8 0.3 1.3 0.2
Fig. 4. The mean mass of bioturbated soil (for years 2003–2007) for each slope unit incatchments H and L. Amounts are shown separately as bars for ant mounding andvertebrate scraping and as lines for combined totals.
24 P.J. Richards et al. / Catena 87 (2011) 20–30

Author's personal copy
4.3. Temporal variation in rates of bioturbation
4.3.1. Response to wildfireRates of both ant mounding and vertebrate scraping varied
significantly among the six years of the study period (pb0.0001 forboth bioturbation types). Rates were highest in the first year after
wildfire (Fig. 6). However, rates of scraping in this first year were threetimes larger for catchment L than for H. Furthermore, whereas antmounding rates remained relatively high in the second year (2003) andbecame more stable for both catchments in years 3–6 (2004–7), therewas no such trend in scraping (Fig. 6). Rates of scraping wereparticularly low in both catchments in years 2 (2003) and 6 (2007).
Fig. 5. Matrix showing outcomes of Mann-Whitney-U tests performed to detect significant differences in bioturbation rates between plot types. Catchment (L, H) and slope unitabbreviations are explained in Table 3.
Fig. 6. Annual variation in bioturbation in the six years following wildfire; box-plots show the annual mean mass of bioturbated soil displaced in ant mounds and vertebrate scrapesfor both catchments combined. Asterisks denote outlying results, and note differences in scale for the y-axes.
25P.J. Richards et al. / Catena 87 (2011) 20–30

Author's personal copy
4.3.2. Seasonal variationSome seasonal changes in ant mounding are apparent (Fig. 7),
although the only statistically significant difference for both antmounding and combined bioturbation occurs between summer andautumn (pb0.05). Ant mounding rates increase over this period,coinciding with an increase in scraping which results in an autumnmaximum for total bioturbation (Fig. 7). Ant mounding decreasesafter autumn, indicating a change in ant activity which was alsoapparent from general field observations; during winter, ant nestentrances and mounds were relatively scarce, less well formed, moreclosely associated with vegetation (mostly shrubs), and moreclustered than at other times of the year. Ant mounding is generallyat a minimum in winter, but in the fifth and sixth years (2006 and2007) it reached a minimum in spring. For both ant mounding and
combined bioturbation rates, winter and spring are indistinguishable(p=1). Rates of vertebrate scraping are generally lowest and leastvariable in summer (Fig. 7), but there are no statistically significantdifferences between any of the seasons.
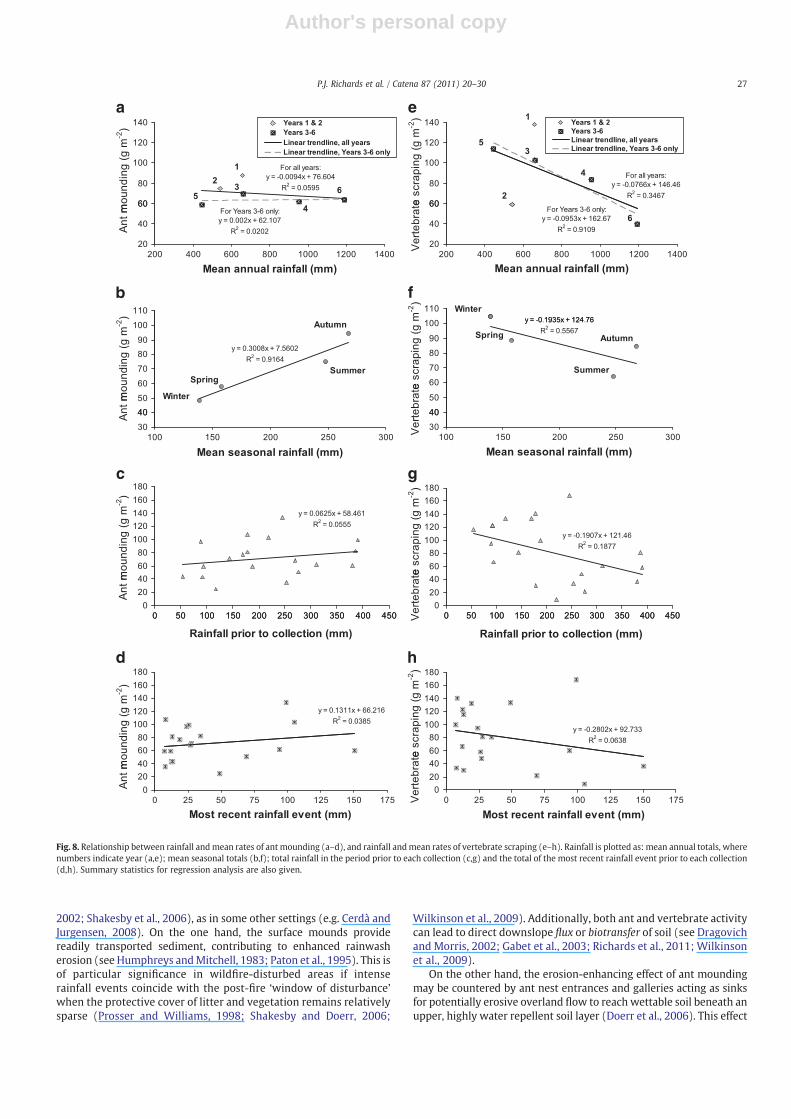
4.3.3. Response to rainfallCorrelations between rainfall and bioturbation rates are mostly
weak or non-existent (see Fig. 8). In particular, although it wasobserved that ant mounds frequently showed new soil particlesrapidly excavated onto older rainsplashed material (Fig. 3b), theamount of rainfall prior to sampling did not significantly affect fieldmeasurements. There is, however, a significant positive relationshipbetween the mean rates of ant mounding and mean rainfall for eachseason (R2=0.92; pb0.05) (Fig. 8b). Conversely, there is a negativebut non-significant relationship between the mean rates of scrapingand mean seasonal rainfall (R2=0.56; p=0.24). The correlation(R2=0.91; pb0.05) between annual rates of scraping and annualrainfall between years 3 (2004) and 6 (2007) is significant but not forall six years (Fig. 8e), because of the high variability in scraping in thefirst two post-fire years.
5. Discussion
5.1. Implications for soil and slope processes
5.1.1. Rates of topsoil turnoverThe mean annual rates of ant mounding (246 g m−2 yr−1) and
vertebrate scraping (274 g m−2 yr−1) are typical in comparison withthe general range reported worldwide (100 to 500 gm−2 yr−1) (Patonet al., 1995;Wilkinson et al., 2009). Our ant mounding rates are slightlylower than most recorded for Australian Aphaenogaster species, buthigher than those reported for other Australian genera, which aregenerallyb100 g m−2 yr−1 (see Paton et al., 1995; Richards, 2009a).Furthermore, with a mean of 896 g m−2 yr−1, rates of ant moundingon the catchment L footslope slightly exceed even the exceptionallyhigh values reported by Humphreys (1981) at Cordeaux (Fig. 1). Thebioturbation rate for vertebrates is comparable to estimates fromelsewhere, such as 250 g m−2 yr−1 for moles and voles in Luxembourg(Rice, 1977), 160–400 g m−2 yr−1 for small marsupials in WesternAustralia (Garkaklis et al., 2004), and 210 gm−2 yr−1 for porcupines inSouth Africa (Bragg et al., 2005). However, the estimate in the presentstudy probably represents the combined effect of different vertebratespecies, and does not include all soil transfer by vertebrates. Forexample, not included is the construction of lyrebird display mounds(which typically contain 24 kg of disturbed soil; see Adamson et al.,1983) and wombat burrows, which are common on these hillslopes.
Rates of mounding can be tentatively used to infer rates of topsoilturnover. The mean combined bioturbation rate (520 g m−2 yr−1) isequivalent to an average turnover period of 577 years for the top30 cm of soil, which is the approximate depth limit of A. longicepsbioturbation (though vertebrate scraping would rarely reach thisdepth). At Cordeaux, the combined result of A. longiceps andearthworm mounding would be a comparable turnover period of430 years for the top 30 cm (Humphreys, 1981). This figure increasesto 500 years based on mounding by A. longiceps, and 560 years byAphaenogaster barbigula in a semi-arid area of New South Wales(Eldridge and Pickard, 1994). Whilst the equivalent estimate based onthe mean A. longicepsmounding rate at Blue Gum Creek is 1220 years,the rate varies from 300 to 400 years on footslopes to 10,000 to 100000 years on lower mid-slopes.
5.1.2. Post-fire soil erosionIn addition to topsoil turnover and the creation of a biomantle (i.e.
a distinct, bioturbation-formed mobile zone in the upper soil;Johnson, 1990), nest-building by southeast Australian ants reportedlyhas contrasting effects following wildfire (Dragovich and Morris,
Fig. 7. Seasonal variation in bioturbation. Box-plots show mean seasonal quantities ofant mounding (top), vertebrate scraping (middle) and the two combined (lower) for allplots (i.e. all slope units and both catchments combined) over five years; the first threedata collections after the 2001 wildfires have been excluded. Note differences in scalefor the y-axes.
26 P.J. Richards et al. / Catena 87 (2011) 20–30
Author's personal copy
2002; Shakesby et al., 2006), as in some other settings (e.g. Cerdà andJurgensen, 2008). On the one hand, the surface mounds providereadily transported sediment, contributing to enhanced rainwasherosion (see Humphreys andMitchell, 1983; Paton et al., 1995). This isof particular significance in wildfire-disturbed areas if intenserainfall events coincide with the post-fire ‘window of disturbance’when the protective cover of litter and vegetation remains relativelysparse (Prosser and Williams, 1998; Shakesby and Doerr, 2006;
Wilkinson et al., 2009). Additionally, both ant and vertebrate activitycan lead to direct downslope flux or biotransfer of soil (see Dragovichand Morris, 2002; Gabet et al., 2003; Richards et al., 2011; Wilkinsonet al., 2009).
On the other hand, the erosion-enhancing effect of ant moundingmay be countered by ant nest entrances and galleries acting as sinksfor potentially erosive overland flow to reach wettable soil beneath anupper, highly water repellent soil layer (Doerr et al., 2006). This effect
a
b
c
d
e
f
g
h
Fig. 8. Relationship between rainfall andmean rates of ant mounding (a–d), and rainfall andmean rates of vertebrate scraping (e–h). Rainfall is plotted as: mean annual totals, wherenumbers indicate year (a,e); mean seasonal totals (b,f); total rainfall in the period prior to each collection (c,g) and the total of the most recent rainfall event prior to each collection(d,h). Summary statistics for regression analysis are also given.
27P.J. Richards et al. / Catena 87 (2011) 20–30

Author's personal copy
of the nests, rather than that of enhanced sediment provision, was themore apparent one in the study area. Footslope zones have the highestmounding rates and the largest macropore network provided by thenests, explaining why these slope units were associated with lowernet soil losses than expected (Blake et al., 2008; Shakesby et al., 2003,2006).
5.2. Causes of spatial and temporal variation
5.2.1. The importance of wildfireWhether the post-fire maximum in scraping rates, particularly in
catchment L, represents increased vertebrate numbers and/orchanges in vertebrate behaviour is unclear. A post-fire increase inthe ground-dwelling vertebrate population would contradict thegeneral view that numbers normally decline (Adamson et al., 1983;Dragovich and Morris, 2002; Newsome et al., 1975 Conceivably, thisdecline might have been delayed until the second year, when themarkedly low rate of scraping might have been a response to habitatdestruction and reduced food availability (Fox, 1990). Similarly, antpopulations did not seem to be adversely affected by the wildfire,possibly through A. longiceps nests being sufficiently deep (approx-imately 30 cm; see Richards, 2009a) to enable survival even whereexposed to the extreme temperatures reached beneath smoulderinglogs (Roberts, 1965). Indeed, post-fire ant mounding was actuallyparticularly active, as reported elsewhere in the Sydney region (e.g.Prosser and Williams, 1998). If wildfire intermittently acceleratedbioturbation rates, the turnover periods described in Section 5.1.1would be less, but more data are required of both wildfire frequencyand impact to quantify this effect.
Unexpectedly, fire severity differences seemed to have littleimpact on bioturbation rates. These findings contrast with thosereported by Dragovich and Morris (2002) at nearby Faulconbridge,where downslope biotransfer of soil (mostly by ant mounding and asmall proportion by vertebrate scraping) was found to be ten timesmore effective on terrain affected bymoderate than by low or high fireseverity. They attributed increased mounding activity to destructionof leaf litter but partial survival of the ant population. They alsoreferred to situationswhere other agents of disturbance had increasedmounding (e.g. roads, tracks and power lines). We suggest that thelack of a link between bioturbation and fire severity may be due to theconsiderable depth of Aphaenogaster ant nests, allowing the ants tosurvive even high fire severity, and to the spatial heterogeneity ofburn severity allowing vertebrates to repopulate high fire severitysites just as quickly as low-moderate sites.
5.2.2. Other factorsSeveral factors are equally or more important than wildfire in
causing spatial and temporal variation according to data in this studyand from elsewhere, particularly for mounding by A. longiceps (seeRichards, 2009a, 2009b and references therein). For example, in a20-ha area in southeast New South Wales, Nicholls and McKenzie(1994) found that A. longiceps nests were particularly common onwarm, exposed slopes but, contrary to the present study, uncommonon relatively flat sites. Gradient may be more important forvertebrates than for ants. For example, lyrebirds range widelywhen foraging but feeding takes place mainly on slopes of 10–30°(Adamson et al., 1983).
Although soil depth in the study area generally increasesdownslope (Tomkins et al., 2004), there is no evidence of thisaffecting ant mounding rates. More important for the presence of A.longiceps is sandy, relatively stone-free soil (see Nicholls andMcKenzie, 1994; Richards, 2009a). Given this preference, the sandytopsoils of the catchment H lower slopes and footslopes would beparticularly favourable for A. longiceps nest-building and, conversely,low ant mounding rates on steeper slope units might be partlyexplained by higher contents of clay or gravel. Shakesby et al. (2006)
noted a generally negative relationship between ant mounding andsurface gravel content at Blue Gum Creek (though not for vertebratescraping) and, over all six years, both the gravelly mid-slope colluvialmantle and the clay loams on the valley floor were generally devoid ofnests. In addition, the soils on the valley floor were relatively moistwith a high water table close to the creek (Tomkins et al., 2004) andA. longiceps reportedly avoid such conditions (Mitchell, 1988; Nichollsand McKenzie, 1994).
With regard to seasonal variability in moisture, Eldridge andPickard (1994) suggested that A. barbigula nest-building activity andmounding rates were correlated with an optimal though undefinedsoil moisture condition that is difficult to relate to standardmeteorological measurements. In the present study, a significantrelationship was only found between mean ant mounding rates andmean seasonal rainfall. However, it is likely that temporal variation inbioturbation is linked to other seasonal factors, in addition to soilmoisture. For example, a winter–spring increase in lyrebird biotur-bation coincides with their breeding season, when male lyrebirdsconstruct display mounds and young are being raised (Adamson et al.,1983). Similarly, seasonal changes in ant activity are complexresponses to factors such as food availability and inter-speciescompetition (Andersen, 1983; Briese and Macauley, 1980). Spatially,Aphaenogaster nest occurrence would be expected to be correlatedwith factors such as myrmecochorous plant species richness (seeMitchell et al., 2002; Richards, 2009a) and litter and understoreyabundance (see Nicholls and McKenzie, 1994; Richards, 2009a;Smallwood, 1982).
All these causal factors are interlinked to some degree and manymight have a reciprocal relationship with bioturbation. Bioturbatorsmodify their habitat conditions, including nutrient distribution,vegetation growth and soil particle size, through ecosystem engineer-ing (see Wilkinson et al., 2009). Aphaenogaster ants, for example,probably influence seed dispersal and enhance soil fertility (seeRichards, 2009a), whilst soil and debris mounds produced bylyrebirds can promote certain vegetation patterns and favourableconditions for renewal of invertebrate food resources (Adamson et al.,1983).
6. Conclusions
1. The average combined bioturbation rate of 520 g m−2 yr−1 for all33 plots is high, and the peak of approximately 1150 g m−2 yr−1
on the footslope is amongst the highest reported worldwide forsimilar fauna. Overall, mean rates of ant mounding and surfacescraping by vertebrates are similar (246±339 g m−2 yr−1 and274±179 g m−2 yr−1, respectively). Although these rates dem-onstrate that both ants and vertebrates are active in redistributingsurface soil, the geomorphological effectiveness of bioturbation isgreater on some parts of hillslopes than others. Whilst ant activityis most important on footslopes, vertebrate scraping is generally ofgreater geomorphological significance on steeper slopes. Estimatesof topsoil (0–30 cm depth) turnover times based on rates of antmounding alone range from 300 to 100,000 years for differentslope units.
2. To the authors’ knowledge, a lack of a relationship betweenwildfire severity and bioturbation is reported in this paper for thefirst time. This lack of a relationship is thought to result from theconsiderable depth of ant nests allowing the ants to survive evenhigh fire severity, and from the spatial ‘patchiness’ of fire severityenabling vertebrates to repopulate high fire severity sites asquickly as low-moderate sites. These findings and explanationsneed to be explored further to determine the extent to which theyhave wider applicability.
3. As regards change through time, the impact of wildfire onbioturbation rates was considerable but relatively short-lived. Byimplication, therefore, wildfire leads to accelerated rates of both
28 P.J. Richards et al. / Catena 87 (2011) 20–30

Author's personal copy
ant mounding and vertebrate scraping on an episodic basiscorresponding to post-fire ‘windows of disturbance’. Conversely,apart from a significant relationship between mean rates of antmounding (generally reaching a maximum in autumn) and meanseasonal rainfall, rainfall had little or no direct influence ontemporal trends in bioturbation.
4. Spatial and temporal variations are otherwise explained ascomplex responses to factors such as soil texture, soil moistureand vegetation patterns, but understanding the interplay betweenthese controls requires integrated research on fauna, soil andsurface processes at hillslope and catchment scales (Cammeraatand Risch, 2008).
5. Bioturbation has been a comparatively underrated agent of modifi-cation of soil characteristics and soil erosion.Our results demonstratethat it can be particularly important following disturbance, inthis case by wildfire. In the study area, nest-building by ants on thefootslopes provided important bypass routes for erosive overlandflow to reach wettable soil beneath a highly water-repellent surfacelayer. This was particularly relevant during the post-fire ‘window ofdisturbance’ when the protective vegetation and litter cover wasabsent or sparse. This erosion-limiting role of nest-building seems tohave beenmore important than one of erosion-enhancement causedby the provision of readily erodible sediment in the mounds(Shakesby et al., 2006).
Acknowledgements
This paper is sincerely dedicated to the memory of our friend andco-researcher, Geoff Humphreys, who led most data collections andsadly passed away before the study was complete. Paul Hesseprovided useful comments during analysis, and anonymous reviewersare thanked for their comments on the submitted manuscript whichgreatly improved the analysis. Many thanks also to Alana Mackay forher extensive assistance and to the many other colleagues andstudents who participated in field work. Field work was undertakenunder a scientific licence from the NSW National Parks and WildlifeService. It was aided by a grant from the Sydney Catchment Authorityand by Higher Degree Research funding from Macquarie University.RAS and SHD are grateful for funding provided by a NERC Urgencygrant (NER/AS/2002/00143).
References
Adamson, D., Selkirk, P.M., Mitchell, P.B., 1983. The role of fire and lyrebirds in thesandstone landscape of the Sydney Basin. In: Young, R.W., Nanson, G.C. (Eds.),Aspects of Australian sandstone landscapes. University of Wollongong, Wollon-gong, pp. 81–93.
Andersen, A.N., 1983. Species diversity and temporal distribution of ants in the semi-arid mallee region of northwestern Victoria. Australian Journal of Ecology 8,127–137.
Blake, W.H., Wallbrink, P.J., Wilkinson, S.N., Humphreys, G.S., Doerr, S.H., Shakesby, R.A.,Tomkins, K.M., 2008. Deriving hillslope sediment budgets in wildfire-affectedforests using fallout radionuclide tracers. Geomorphology 104, 105–116.
Bragg, C.J., Donaldson, J.D., Ryan, P.G., 2005. Density of Cape porcupines in a semi-aridenvironment and their impact on soil turnover and related ecosystem processes.Journal of Arid Environments 61, 261–275.
Briese, D.T., Macauley, B.J., 1980. Temporal structure of an ant community in semi-aridAustralia. Australian Journal of Ecology 5, 121–134.
Cammeraat, E.L.H., Risch, A.C., 2008. The impact of ants on mineral soil properties andprocesses at different spatial scales. Journal of Applied Entomology 132, 285–294.
Cammeraat, E.L.H., Willott, S.J., Compton, S.G., Incoll, L.D., 2002. The effects of ants’ nestson the physical, chemical and hydrological properties of a rangeland soil in semi-arid Spain. Geoderma 105 (1), 1–20.
Cerdà, A., Jurgensen, M.F., 2008. The influence of ants on soil and water losses from anorange orchard in eastern Spain. Journal of Applied Entomology 132 (4), 306–314.
Chafer, C.J., Noonan, M., Macnaught, E., 2004. The post-fire measurement of fire severityand intensity in the Christmas 2001 Sydney wildfires. International Journal ofWildland Fire 13, 227–240.
Doerr, S.H., Shakesby, R.A., Blake, W.H., Humphreys, G.S., Chafer, C., Wallbrink, P.J.,2006. Effects of contrasting wildfire severity on soil wettability in Australianeucalypt catchments. Journal of Hydrology 319, 295–311.
Dragovich, D., Morris, E., 2002. Fire intensity, slopewash and bio-transfer of sediment ineucalypt forest, Australia. Earth Surface Processes and Landforms 27, 1309–1319.
Eldridge, D.J., Myers, C.A., 1998. Enhancement of soil nutrients around nest entrances ofthe funnel ant Aphaenogaster barbigula (Myrmicinae) in semi-arid easternAustralia. Australian Journal of Soil Research 36 (6), 1009–1018.
Eldridge, D.J., Pickard, J., 1994. Effects of ants on sandy soils in semi-arid easternAustralia: II. Relocation of nest entrances and consequences for bioturbation.Australian Journal of Soil Research 32 (2), 323–333.
Fisher, M., Ryan, K., Lembit, R., 1995. The natural vegetation of the Burragorang1:100,000 Map Sheet. Cunninghamia 4, 143–215.
Fox, B.J., 1990. Changes in the structure of mammal communities over successionaltime scales. Oikos 59, 321–329.
Gabet, E.J., Reichman, O.J., Seabloom, E.W., 2003. The effects of bioturbation on soilprocesses and sediment transport. Annual Review of Earth and Planetary Sciences31, 249–273.
Garkaklis, M.J., Bradley, J.S., Wooller, R.D., 2004. Digging and soil turnover by amycophagous marsupial. Journal of Arid Environments 56, 569–578.
Hasiotis, S.T., 2003. Complex ichnofossils of solitary to social soil organisms:understanding their evolution and roles in terrestrial paleoecosystems. Palaeogeo-graphy, Palaeoclimatology, Palaeoecology 192, 259–320.
Heimsath, A.M., Chappell, J., Dietrich, W.E., Nishiizumi, K., Finkel, R.C., 2000. Soilproduction on a retreating escarpment in southeastern Australia. Geology 28 (9),787–790.
Heimsath, A.M., Chappell, J., Spooner, N.A., Questiaux, D.G., 2002. Creeping soil. Geology30 (2), 111–114.
Humphreys, G.S., 1981. The rate of ant mounding and earthworm casting near Sydney,New South Wales. Search 12, 129–131.
Humphreys, G.S., Mitchell, P.B., 1983. A preliminary assessment of the role ofbioturbation and rainwash on sandstone hillslopes in the Sydney Basin. In:Young, R.W., Nanson, G.C. (Eds.), Aspects of Australian Sandstone Landscapes.Australian and New Zealand Geomorphology Group, pp. 66–80.
Johnson, D.L., 1990. Biomantle evolution and the redistribution of earth materials andartifacts. Soil Science 149, 84–102.
Lobry de Bruyn, L.A., Conacher, A.J., 1994. The bioturbation activity of ants inagricultural and naturally vegetated habitats in semi-arid environments. AustralianJournal of Soil Research 32 (3), 555–570.
Matthews, J.A., 1981. Quantitative and statistical approaches to geography: a practicalmanual. Pergamon, Oxford.
Meysman, F.J.R., Middelburg, J.J., Heip, C.H.R., 2006. Bioturbation: a fresh look atDarwin's last idea. Trends in Ecology and Evolution 21 (12), 688–695.
Mitchell, C.E., Turner, M.G., Pearson, S.M., 2002. Effects of historical land use and forestpatch size on myrmecochores and ant communities. Ecological Applications 12,1364–1377.
Mitchell, P.B., 1988. The influences of vegetation, animals and micro-organisms on soilprocesses. In: Viles, H.A. (Ed.), Biogeomorphology. Basil Blackwell, Oxford, pp. 43–82.
Newsome, A.E., McIlroy, J., Catling, P., 1975. The effects of extensive wildfire onpopulations of twenty ground vertebrates in south-east Australia. Proceedings ofthe Ecological Society of Australia 9, 107–123.
Nicholls, A.O., McKenzie, N.J., 1994. Environmental control of the local-scaledistribution of funnel ants, Aphaenogaster longiceps. Memoirs of the QueenslandMuseum 36 (1), 165–172.
Paton, T.R., Humphreys, G.S., Mitchell, P.B., 1995. Soils: A New Global View. UCL Press,London.
Phillips, J.D., 2007. Development of texture contrast soils by a combination ofbioturbation and translocation. Catena 70 (1), 92–104.
Prosser, I.P., Williams, L., 1998. The impact of wildfire on runoff and erosion in nativeEucalyptus forest. Hydrological Processes 12, 251–265.
Rice, R.J., 1977. Fundamentals of geomorphology. Longman, New York.Richards, P.J., 2009a. Aphaenogaster ants as bioturbators in Australia: impacts on soil
and slope processes. Earth-Science Reviews 96, 92–106.Richards, P.J., 2009b. Quantification of bioturbation and its impacts on soil and slope
processes. Unpublished PhD thesis, Macquarie University, Sydney.Richards, P.J., Hohenthal, J.M., Humphreys, G.S., 2011. Bioturbation on a southeast
Australian hillslope: estimating contributions to soil flux. Earth Surface Processesand Landforms. doi:10.1002/esp.2149.
Roberts, W.B., 1965. Soil temperatures under a pile of burning logs. Australian ForestResearch 1, 21–25.
Shakesby, R.A., Blake, W.H., Doerr, S.H., Humphreys, G.S., Wallbrink, P.J., Chafer, C.J.,2006. Hillslope soil erosion and bioturbation following the Christmas 2001 forestfires near Sydney, Australia. In: Owens, P.N., Collins, A.J. (Eds.), Soil Erosion andSediment Redistribution in River Catchments: Measurement, Modelling andManagement. CAB International, Wallingford, pp. 51–61.
Shakesby, R.A., Chafer, C.J., Doerr, S.H., Blake, W.H., Wallbrink, P.J., Humphreys, G.S.,Harrington, B.A., 2003. Fire severity, water repellency characteristics and hydro-geomorphological changes following the Christmas 2001 Sydney Forest Fires.Australian Geographer 34 (2), 147–175.
Shakesby, R.A., Doerr, S.H., 2006. Wildfire as a hydrological and geomorphologicalagent. Earth-Science Reviews 74 (3–4), 269–307.
Shakesby, R.A., Wallbrink, P.J., Doerr, S.H., English, P.M., Chafer, C.J., Humphreys, G.S.,Blake, W.H., Tomkins, K.M., 2007. Distinctiveness of wildfire effects on soil erosionin south-east Australian eucalypt forests assessed in a global context. ForestEcology and Management 238 (1–3), 347–364.
Smallwood, J., 1982. The effect of shade and competition on relocation rate in the antAphaenogaster rudis. Ecology 63 (1), 124–134.
Smith, H.G., Dragovich, D., 2008. Post-fire hillslope erosion response in a sub-alpineenvironment, south-eastern Australia. Catena 73, 274–285.
29P.J. Richards et al. / Catena 87 (2011) 20–30

Author's personal copy
Sobieraj, J.A., Elsenbeer, H., Coelho, R.M., Newton, B., 2002. Spatial variability of soilhydraulic conductivity along a tropical rainforest catena. Geoderma 108 (1–2),79–90.
Tomkins, K.M., Humphreys, G.S., Gero, A.F., Shakesby, R.A., Doerr, S.H., Wallbrink, P.J.,Blake, W.H., 2008. Postwildfire hydrological response in an El Nino-SouthernOscillation-dominated environment. Journal of Geophysical Research – EarthSurface 113, F02023.
Tomkins, K.M., Humphreys, G.S., Skeen, H.J., Taylor, G.M., Farwig, V.J., Shakesby, R.A.,Doerr, S.H., Wallbrink, P.J., Blake, W.H., Chafer, C.J., 2004. Deciphering a colluvialmantle: Nattai catchment. Supersoil 2004: 3 rd Australian New Zealand SoilsConference, University of Sydney, NSW, Australia, 5–9 December.
Wilkinson, M.T., Richards, P.J., Humphreys, G.S., 2009. Breaking ground: pedological,geological, and ecological implications of soil bioturbation. Earth-Science Reviews97, 254–269.
30 P.J. Richards et al. / Catena 87 (2011) 20–30