Atlas of Climatic Controls of Wildfire in the Western United States
74
U.S. Department of the Interior U.S. Geological Survey Scientific Investigations Report 2006-5139 Atlas of Climatic Controls of Wildfire in the Western United States
-
Upload
khangminh22 -
Category
Documents
-
view
4 -
download
0
Transcript of Atlas of Climatic Controls of Wildfire in the Western United States
U.S. Department of the InteriorU.S. Geological Survey
Scientific Investigations Report 2006-5139
Atlas of Climatic Controls of Wildfire in the Western United States
Atlas of Climatic Controls of Wildfire in the Western United States
By S.W. Hostetler1, P.J. Bartlein2, J.O. Holman1
1U.S. Geological Survey, Corvallis, Oregon, 2Department of Geography, University of Oregon, Eugene, Oregon
Scientific Investigations Report 2006-5139
U.S. Department of the InteriorU.S. Geological Survey

U.S. Department of the InteriorDirk Kempthorne, Secretary
U.S. Geological SurveyP. Patrick Leahy, Acting Director
U.S. Geological Survey, Reston, Virginia: 2006
This product may be viewed and down loaded from the World WIde Web at persistent URL: http://pubs.usgs.gov/sir/2006/5139/
For product and ordering information: World Wide Web: http://www.usgs.gov/pubprod Telephone: 1-888-ASK-USGS
For more information on the USGS--the Federal source for science about the Earth, its natural and living resources, natural hazards, and the environment: World Wide Web: http://www.usgs.gov Telephone: 1-888-ASK-USGS
Any use of trade, product, or firm names is for descriptive purposes only and does not imply endorsement by the U.S. Government.
Suggested citation:Steven .W. Hostetler, P.J. Bartlein, J.O. Holman, 2006, Atlas of Climatic Controls of Wildfire in the Western United States: Place of publication (unless it is a corporate entity), U.S. Geological Survey Scientific Investigations Report 2006-5139, 67 p.

iii
Contents
Abstract ...........................................................................................................................................................1Introduction.....................................................................................................................................................1Wildfire and climate in the West .................................................................................................................1
Seasonal cycle of wildfire ...................................................................................................................1Seasonal cycle of climate variables .................................................................................................6Association of wildfire and climate ...................................................................................................9
Methods.........................................................................................................................................................20Fire and Climate Data Sets ................................................................................................................20
Fire data .......................................................................................................................................20Climate Research Unit (CRU) climate data ............................................................................20Regional climate model data ...................................................................................................20Standardizing climate and fire data ........................................................................................20Study subregions .......................................................................................................................27
Description of subregion graphics ..................................................................................................27Fire/climate rankings and correlations ..................................................................................27Wildfire and climate maps .......................................................................................................27
Summary........................................................................................................................................................28Acknowledgements .....................................................................................................................................28References Cited..........................................................................................................................................29The Pacific Coast Region ...........................................................................................................................30The Interior Northwest Region ..................................................................................................................35The Northern Rocky Mountain Region .....................................................................................................40The Central Rocky Mountain Region ........................................................................................................45The Southern Rocky Mountain Region ....................................................................................................50The Great Basin Region ..............................................................................................................................55The Southwest Region ................................................................................................................................60The Sierra Nevada Region .........................................................................................................................65

iv
FiguresFigure 1. Maps showing 1986-1996 annual and May-October area burned for lightning and
human-started wildfires. ............................................................................................................2Figure 2. Map showing the five Bailey composite ecoregions of the Western US. From
Bartlein et al (2003). ......................................................................................................................3Figure 3. Graph showing annual distribution of daily fire starts for the period 1986-1996. .........4Figure 4. Graph showing istributions of 1986-1996 daily fire starts within each Bailey compos-
ite ecoregion. ..............................................................................................................................5Figure 5. Graph showing simulated June- September, 1988, 6-hour values of sea level pres-
sure, vegetation temperature, precipitation, relative humidity, wind speed, sensible heat flux, and soil moisture levels over the Yellowstone National Park region. ..............7
Figure 6. Maps showing the seasonal cycle and intermonthly change in climate and surface variables compared with the seasonal cycle of wildfire occurrence for lightning and human ignition sources. .............................................................................................................8
Figure 7. Graph showing annual area burned by wildfire for the period 1921-2000 for selected western states. .........................................................................................................................10
Figure 8. NCEP anomalies for June, July, and August 1993(a) and 1996(b) (relative to a 1971-2000 base period). ....................................................................................................................13
Figure 10. Maps showing example of CRU temperature and precipitation for August, 1996. ...14Figure 11. Maps showing representation of the topography of western North America in A: the
NCEP AGCM, B: the RegCM, C: 5-minute DEM. ....................................................................15Figure 12. Map showing RegCM topography inset within the topography as represented by the
NCEP GCM. ...............................................................................................................................16Figure 13. Maps showing 500 hPa height and wind vectors and sea level pressure and wind
vectors. The larger area of the Northern hemisphere shows the 500 hPa and SLP fields for the NCEP model. The 500 hPa and SLP fields for the RegCM are plotted in the s 17
Figure 14. Maps showing examples of 2-m air temperature and precipitation as simulated by the RegCM for August, 1996. .....................................................................................................18
Figure 15. Graphs showing - Top: Standard normal distribution (mean of zero and standard deviation, s, of one.) of a SGI. .................................................................................................19
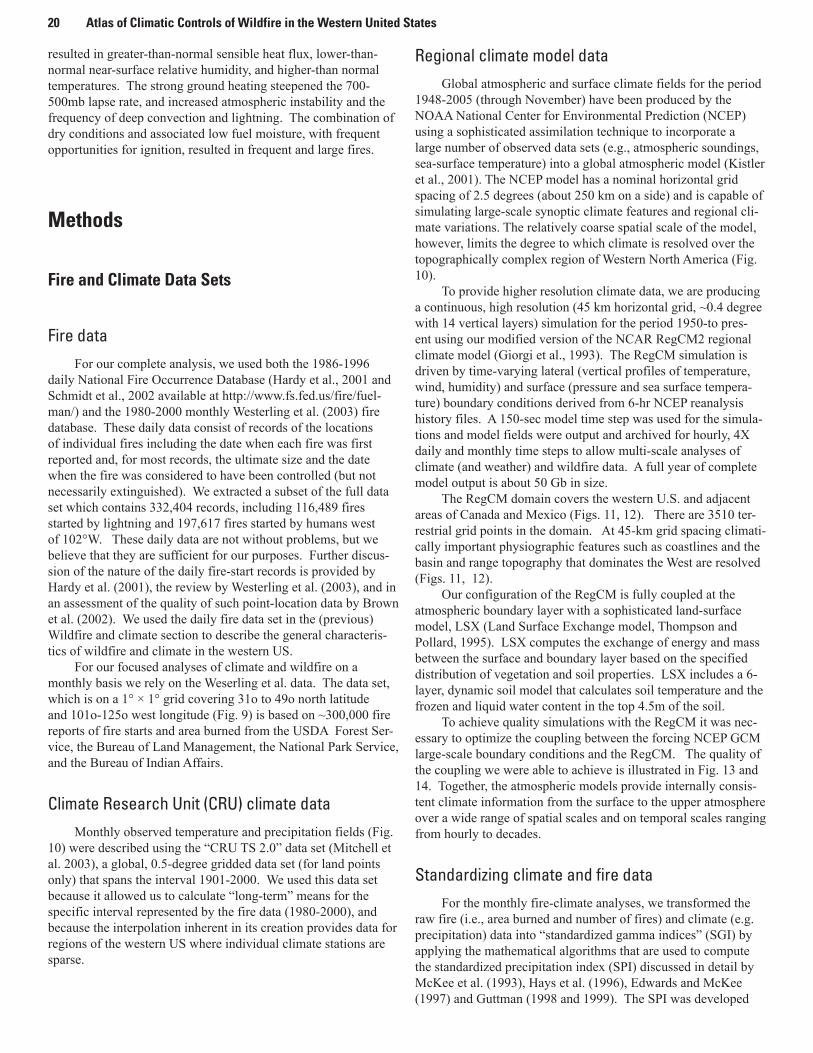
Figure 16. Map showing subregions used in the fire-climate analysis. . .......................................21Figure 17. Key diagram explaining the conventions for the ranking and correlations for each
region. . ........................................................................................................................................22Figure 18. Graphs showing correlations of 1-, 3-, 6-, and 12-month standardized lightning-set
fire count index (SGI) with the 1-, 3-, 6-, and 12-month CRU standardized temperature (STI), and precipitation (SPI) indices for each month of the year in a given ....................23
Figure 19. Graphs showing correlations of 1-, 3-, 6-, and 12-month standardized lightning-set fire count index (SGI) with the 1-, 3-, 6-, and 12-month RegCM standardized soil mois-ture (SMI) indices ......................................................................................................................24
Figure 20. Maps showing anomalies of standardized fire and climate index values. ................25Figure 21. Map showing comparison of the ranking and correlation tables for the 8 regions ...26
AbstractWildfire behavior depends on several factors including
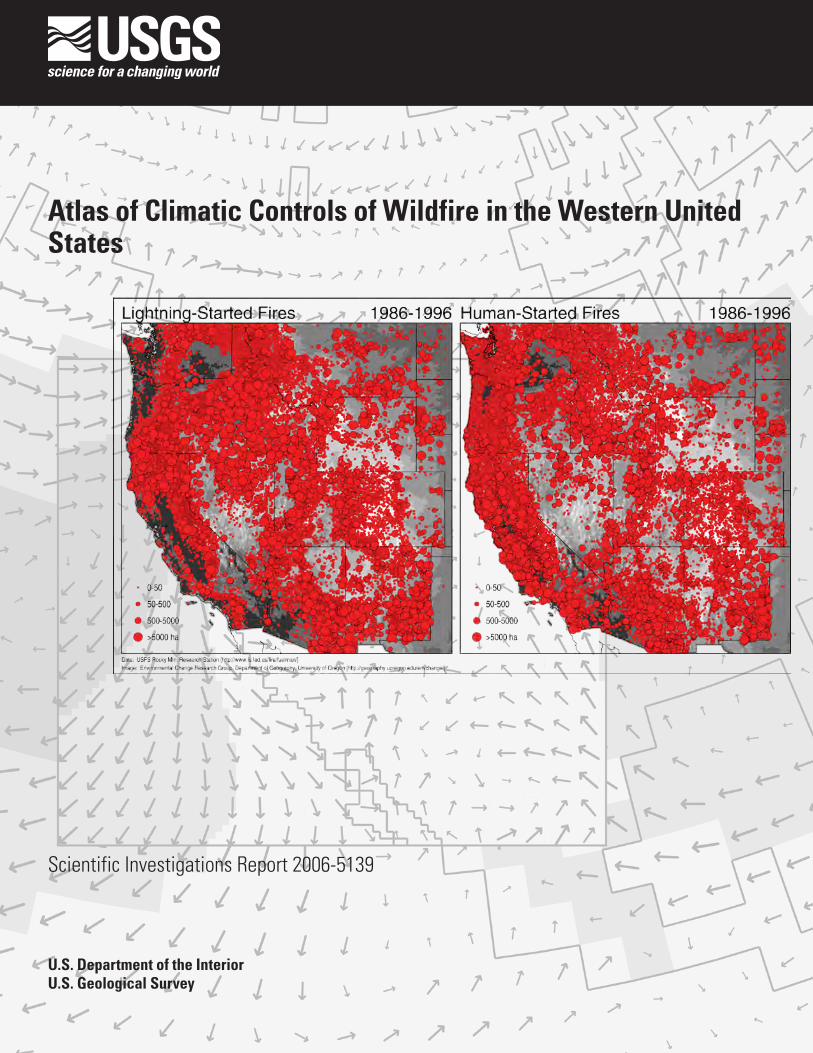
ecologic characteristics, near-term and antecedent climatic condi-tions, fuel availability and moisture level, weather, and sources of ignition (lightning or human). The variability and interplay of these factors over many spatial and temporal scales present an ongoing challenge to our ability to forecast a given wildfire season. Here we focus on one aspect of wildfire in the western US through a retrospective analysis of wildfire (starts and area burned) and climate over monthly time scales. We consider prefire conditions up to a year preceding fire outbreaks. For our analysis, we used daily and monthly wildfire records and a combination of observed and model-simulated atmospheric and surface climate data. The focus of this report is on monthly wildfire and climate for the period 1980-2000. Although a longer fire record is desirable, the 21-year record is the longest cur-rently available and it is sufficient for the purpose of a first-order regional analysis. We present the main results in the form of a wildfire-climate atlas for 8 subregions of the West that can be used by resource managers to assess current wildfire condi-tions relative to high, normal, and low fire years in the historical record. Our results clearly demonstrate the link between wildfire conditions and a small set of climatic variables, and our method-ology is a framework for providing near-real-time assessments of current wildfire conditions in the West.
IntroductionThe dependence of wildfire on weather conditions is rela-
tively well understood (Rothermel, 1972; Brown and Bevins, 1986; Pyne et al., 1996; Goens and Ferguson, 2000), and this understanding forms the basis of hourly to weekly prediction of fire behavior. In contrast, relations between climate (i.e., monthly- to- seasonal to multi-annual variations of atmospheric circulation) and fire are less well understood, although that understanding is improving (e.g., Westerling et al., 2003).
Here we focus on quantifying variations in climate that gov-ern the characteristics of the wildfire in the western United States on monthly, seasonal and intra-annual time scales. Our retro-spective analysis examines observed and simulated atmospheric and surface variables together with historical wildfire records using data-analytical procedures employed in climate-diagnostic studies. We relied on a combination of existing climate data sets, project-specific regional climate model simulations, and historical wildfire records to quantify the hierarchy of climatic controls that influence surface climate conditions prior to and during the fire seasons of western ecosystems and their fire related vegetation variables.
Wildfire and climate in the WestWe present a general overview of wildfire and climate and
their association using a combination of daily firestart data for the period 1986-1996, monthly firestart data for the period 1980-2000, and observed and model-simulated climate data. Details of the data sets used are discussed in the Methods section.
Seasonal cycle of wildfire
The annual and seasonal patterns of lightning and human caused wildfires (Fig. 1) are broadly associated with the major topographically and climatically determined Bailey ecoregions (Fig. 2). Wildfire from both ignition sources display an underly-ing reliance on climate, but the climatic and meteorologic influ-ence on a particular fire season or run of fire seasons is expressed more strongly for lightning-caused fires. Fire outbreaks occur earliest in the dry desert and semi-desert regions of the Southwest and Northwest and in the dry areas of Northern California and eastern slope of the Sierra Nevada. Summertime fire outbreaks intensify in these regions and progress into the other regions as conditions become favorable. After the summer peak, the pat-terns of fall fire outbreaks are similar to those of the spring. The general seasonal cycle of wildfire is evident in all years of the fire record, but the density and timing of the fires for any given season is strongly controlled by prevailing antecedent and con-temporaneous climate and weather conditions.
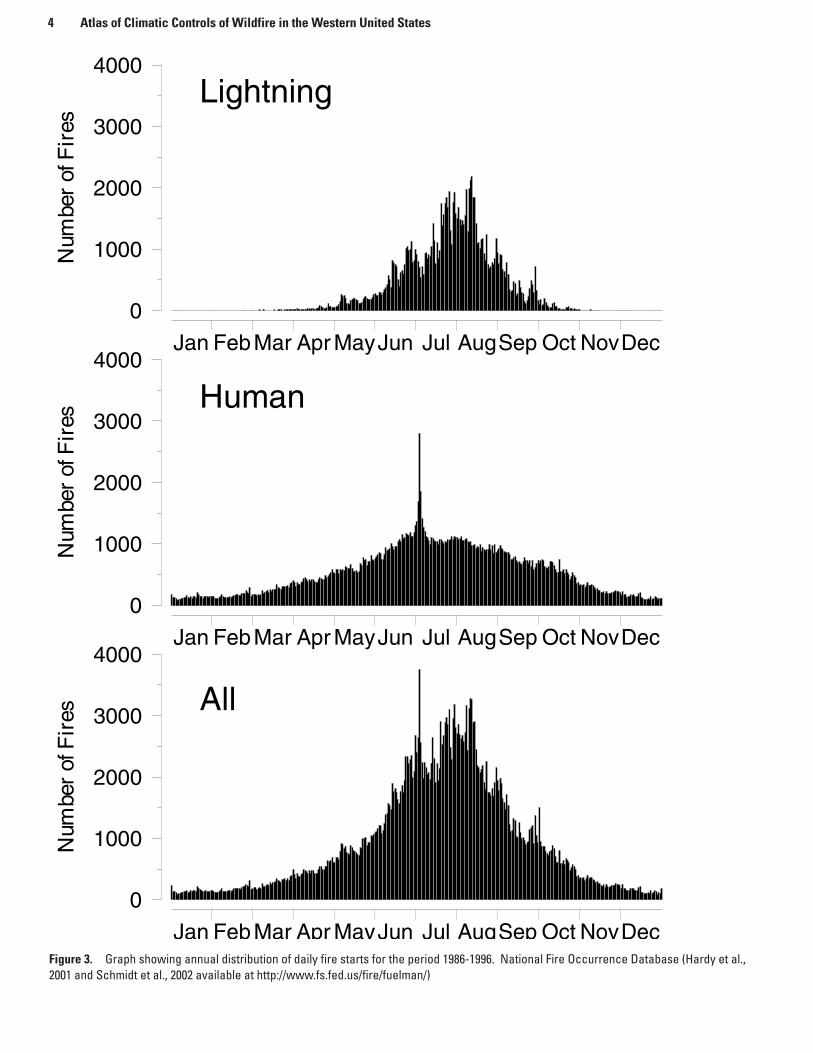
Plotted as a function of Julian day number, the total number of fires from all ignition sources for each day of the year (Fig. 3) resembles a Gaussian curve with annual maximum during the first half of August. Fires started by lightning are almost entirely restricted to the interval from late April through October, while those started by human causes occur during any month of the year. There is a prominent singularity in the frequency of human-started fires around the Fourth of July, when daily fire frequen-cies attain levels three times higher than those just before or after the holiday. High summertime levels of human-started fires tend to taper off gradually during the autumn, with a slight shoulder in the distribution marking the end of the summer outdoor-rec-reation season at the end of October. In general, the shape of the distribution of the total number of fires resembles that of the lightning-started fires more than that of the human-started fires; the latter act mainly to determine the shape of the distribution of all fires during the late autumn, winter, and early spring. Despite the large number of human-started fires, the variation in the total number of fires during the summer is strongly modulated by the number of lightning-started fires.
The time of year of peak incidence of fires from all sources varies both across the western U.S. and among the ecoregions (Figs. 1,2,4). Fires occur earlier in the southwestern desert and
Atlas of Climatic Controls of Wildfire in the Western United States
S.W. Hostetler, P.J. Bartlein, J.O. Holman
Wildfire and climate in the West 1

Figure 1. Maps showing 1986-1996 annual and May-October area burned for lightning (left column) and human-started (right column) wildfires.
2 Atlas of Climatic Controls of Wildfire in the Western United States

Southwestern Desert and Steppe
Temperate Steppe, Desert, and Mountains
Pacific Northwest / Northern Rocky Mountains
Mediterranean Division
Great Plains After Bailey (1995)
Composite Ecoregions
Figure 2. Map showing the five Bailey composite ecoregions of the Western US. From Bartlein et al (2003).
Wildfire and climate in the West 3
Jan FebMar Apr MayJun Jul AugSep Oct NovDec0
1000
2000
3000
4000
Num
ber o
f Fire
s
Lightning
Jan FebMar Apr MayJun Jul AugSep Oct NovDec0
1000
2000
3000
4000
Num
ber o
f Fire
s Human
Jan FebMar Apr MayJun Jul AugSep Oct NovDec0
1000
2000
3000
4000
Num
ber o
f Fire
s All
Jan FebMar Apr MayJun Jul AugSep Oct NovDec
0
1000
2000
3000
4000N
umbe
rof
Fir
esLightning
Jan FebMar Apr MayJun Jul AugSep Oct NovDec
0
1000
2000
3000
4000
Num
ber
ofF
ires
Human
Jan FebMar Apr MayJun Jul AugSep Oct NovDec
0
1000
2000
3000
4000
Num
ber
ofF
ires All
Data: USFS Rocky Mtn. Research Station [http://www.fs.fed.us/fire/fuelman]
Image: Environmental Change Research Group, Department of Geography, University of Oregon [http://geography.uoregon.edu/envchange]
Figure 3. Graph showing annual distribution of daily fire starts for the period 1986-1996. National Fire Occurrence Database (Hardy et al., 2001 and Schmidt et al., 2002 available at http://www.fs.fed.us/fire/fuelman/)
4 Atlas of Climatic Controls of Wildfire in the Western United States

0
500
1000
1500N
um
ber
of
Fire
s
0
500
1000
1500
Num
ber
of
Fire
s
0
500
1000
1500
Num
ber
of
Fire
s
0
500
1000
1500
Num
ber
of F
ires
0
500
1000
1500
Num
ber
of F
ires
Jan Feb Mar Apr May Jun Jul Aug Sep Oct Nov Dec Jan Feb Mar Apr May Jun Jul Aug Sep Oct Nov Dec Jan Feb Mar Apr May Jun Jul Aug Sep Oct Nov Dec
Lightning Human All
Mediterranean Division
Temperate Steppe, Desert and Mountains
Pacific Northwest / Northern Rocky Mtns.
Southwestern Desert and Steppe
Great Plains
Figure 4. Graph showing istributions of 1986-1996 daily fire starts within each Bailey composite ecoregion. National Fire Occurrence Database (Hardy et al., 2001 and Schmidt et al., 2002 available at http://www.fs.fed.us/fire/fuelman/)
Wildfire and climate in the West 5
steppe composite ecoregions (SW) (Fig. 4), and progress, in order, into the intermountain west and southern Rocky Moun-tains (the Temperate Steppe, Desert and Mountains composite ecoregion (TSDM)), the Pacific Northwest and northern Rocky Mountains (PNW & NRM), and California (i.e. the Mediter-ranean Division (MD) composite ecoregion). Wintertime fires in the western U.S. are almost exclusively restricted to the MD region. Human-started fires in the MD region increase in number earlier in the year than in the PNW & NRM region, reflecting the generally drier conditions and larger populations there.
With the exception of the Mediterranean Division (MD), the timing of the peak number of human-started fires and fires from all sources follow the progression of lightning-started fires. (The very small number of fires in the Great Plains (GP) com-posite ecoregion is an artifact of the fire-reporting process for non-federal lands (Westerling et al. 2003; Brown et al. 2002), and represents severe underreporting of fires there.)
Seasonal cycle of climate variables
The seasonal cycle of climate variables result from the sea-sonal cycle of incoming solar radiation (insolation) and its effect on the surface water and energy balances coupled with more indirect effects of atmospheric circulation, and hence, precipita-tion. For any surface (e.g., soil, water, snow), net radiation is determined by the budget of incoming and outgoing radiative components:
Rn = (1-α)•Фsw + Фld - Фlu (1)
where Rn is net radiation, α is the albedo or reflectivity of the surface to shortwave radiation, Фsw is incoming shortwave radiation, Фld is atmospheric longwave radiation, and Фlu is longwave radiation from the surface. Here, positive values are directed toward the surface. The sign of Rn varies seasonally from generally negative values during winter to generally posi-tive values during summer. When Rn >0, the excess radiation is expended through latent (evaporative) and sensible (temperature dependent) heating to the atmosphere and storage in the ground:
Rn = - qle - qh + qs (2)
where qle is latent heat flux, qh is sensible heat flux, qs is ground heat flux, and the direction of the fluxes is the same as Eq. 1. Substantial energy is used in the evaporative process (the energy required to evaporate 1 mm of water per day is 2.45 MJ m-2 day-1, roughly 10% of peak summertime insolation values). When sufficient moisture is available, evaporation and evapotranspiration occur which tends to attenuate or moderate surface temperatures (Fig. 5). If the moisture availibility is low, a greater portion of net radiation is expended in sensible heating which tends to amplify or increase surface air temperature and the temperature of fuels and vegetation. Thus, the seasonal cycle of insolation, soil moisture, and latent and sensible heat fluxes are first order controls of wildfire conditions.
Over the continent, the seasonal cycle of temperature (Fig. 6) clearly expresses and tracks insolation whereas the thermal
inertia of the oceans causes a lag in seasonal warming and cool-ing and thus in their influence on terrestrial climate. Monthly mean air temperatures peak in July (and in some locations, August), after the summer solstice. Intermonthly changes in temperature are greatest in the climate regions of continental inte-rior, and least along the west coast where oceanic influences are strong. The effects of elevation on temperature are clearly appar-ent throughout the year: month-to-month increases in temperature in spring in high-elevation areas remain relatively small until winter snowpack has melted.
The seasonal cycle of precipitation reflects the antiphasing of two dominant atmospheric circulation features that are driven by the seasonal cycle of insolation: the midlatitude westerlies, which guide predominately fall, winter, and spring storms off the eastern Pacific Ocean and the summertime southwestern or Mexican monsoon. The westerlies are strongest and farthest south during the winter, when the latitudinal temperature gradi-ent is steepest and the circumpolar vortex is at its greatest extent. Storm systems frequently form in the Gulf of Alaska in winter and move onshore, providing support for precipitation derived ultimately from moisture from subtropical Pacific sources. Pre-cipitation is greatest in winter along the west coast and in higher-elevation areas in the interior where it accumulates in winter snow pack. From winter into spring and summer, the westerlies retreat poleward as the temperature gradient is diminished, so that in summer (June, July, and August), westerly derived precipita-tion is confined to Canada.
The southwestern or Mexican monsoon is driven by dif-ferential heating of the continent and ocean in the summer. This differential heating generates low pressure over the continent, high pressure over the oceans, and consequent onshore flow of subtropical-Pacific moisture into the southern and southeastern part of the region from May through August (Fig. 6). A second monsoon-like surge of moisture from the Gulf of Mexico in spring is evident along the eastern edge of the region mapped in Fig. 6. The interplay and seasonal dominance of the westerlies and monsoons generates patterns in the intermonthly changes in precipitation that are more complicated than those of temperature.
The equatorward advance of the westerlies is quite evident in the month-to-month increases in precipitation along the west coast from September through December, subsequent retreat from January through July is more gradual. In contrast, the southwest-ern monsoon builds from May into August, but then diminishes rapidly in September and October. Throughout the year, the intermonthly changes in precipitation exhibit some form of oppo-sition between the Pacific Northwest and Southwest, a pattern that can be amplified or damped annually by climate variability and by interannual climate variations, such as those associated with the El Niño Southern Oscillation (ENSO).
During winter, soil moisture is generally high throughout the West due to a combination of supply by precipitation and minimum latent heating (evaporation). Through May, soil mois-ture levels decrease over nearly all of the West but, beginning in June, north-south soil moisture changes of opposite sign emerge as the north continues to dry and the south begins to be influ-enced by the monsoon. The relative importance of the supply and demand components of soil moisture balance can be inferred from the intermonthly changes. In general, intermonthly changes of soil moisture occur over a spatial scale that is more similar to temperature than precipitation, which suggests net radiation
6 Atlas of Climatic Controls of Wildfire in the Western United States

Figure 5. Graph showing simulated June- September, 1988, 6-hour values of sea level pressure, vegetation temperature, precipitation, relative humidity, wind speed, sensible heat flux, and soil moisture levels over the Yellowstone National Park region. Negative values of sensible heat indicate the flux is away (upward) from the surface. The values are the average of the 9 regional model grid cells surrounding the Park (see text for details about the model). The first part of the records, thru mid-June, indicate the presence of snowpack. The dates of major fire starts are indicated by the vertical red lines.
9901000101010201030
270280290300310
6/1/88 6/15/88 6/29/88 7/13/88 7/27/88 8/10/88 8/24/88 9/7/880
0.20.40.60.8
0
0.4
0.8
0
2
4
6
048
1216
-300-200-100
0100
Fra
ctio
nW
/m2
m/s
ecfr
actio
nm
m/h
ro C
hPa
soil moisture
sensible heat
wind speed
relative humidity
precipitation
vegetation temperature
sea level pressure
Wildfire and climate in the West 7
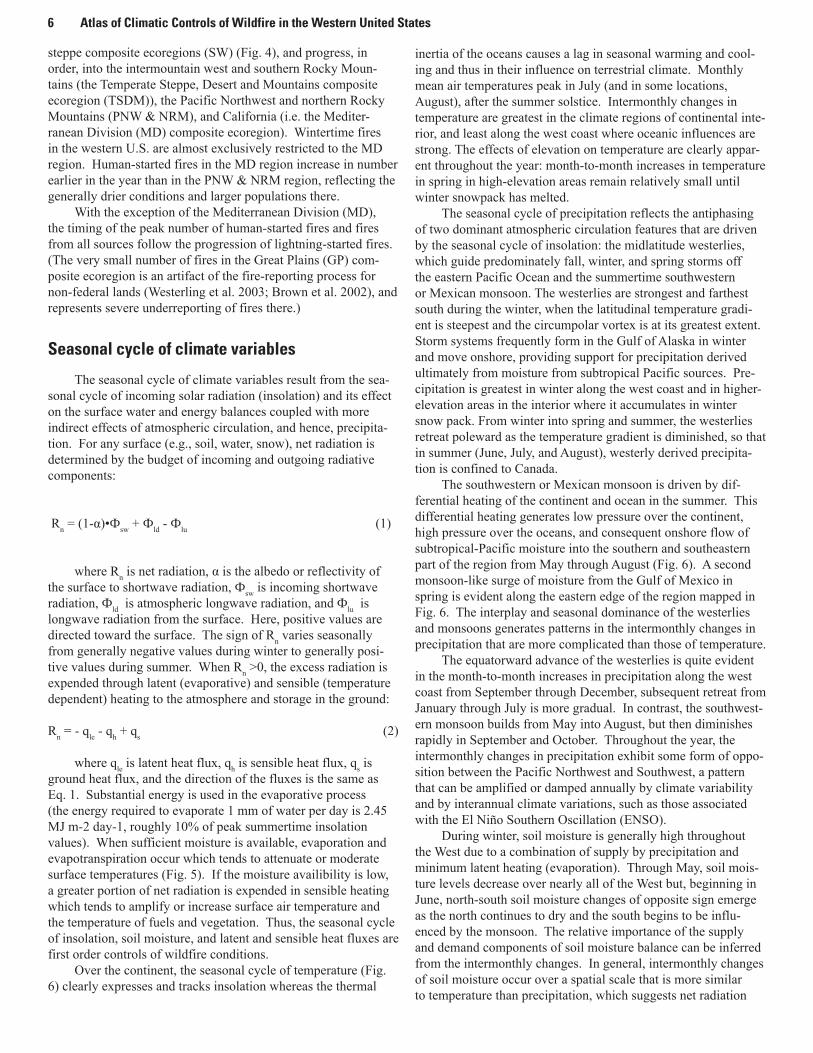
Figure 6. Maps showing the seasonal cycle and intermonthly change in climate and surface variables compared with the seasonal cycle of wildfire occurrence for lightning and human ignition sources. Intermonthly changes are the values of the long-term mean for the current month, minus the long-term mean for the previous month.
Figure 6. The seasonal cycle and intermonthly change in climate and surface variables compared with the seasonal cycle of wildfireoccurrence for lightning and human ignition sources. Intermonthly changes are the values of the long-term mean for the current month,minus the long-term mean for the previous month.
8 Atlas of Climatic Controls of Wildfire in the Western United States

(to which temperature is related) exerts a stronger effect on soil moisture than precipitation.
Among the broadscale patterns of intermonthly changes in soil moisture are smaller regions that have moisture changes that are opposite in sign to the broad-scale changes surrounding them. These features are particularly evident during winter and spring. In winter, below-freezing temperatures in upland areas result in the storage of moisture in snowpack and a consequent decrease in available soil moisture (as is evident in the December to January intermonthly change). During spring, moisture from snowmelt replenishes soil moisture as illustrated in the February-to-March intermonthly change.
Association of wildfire and climate
The seasonal cycles of net radiation, air temperature, precipitation, latent heating, sensible heating, and soil moisture reflect the direct and indirect effects of the seasonal cycle of insolation and are related to the spatial and temporal patterns of fire (Figs. 1, 6). Spatial and temporal variations in latent heat-ing, sensible heating and soil moisture reflect both energy and moisture availability. Seasonal and intermonthly variations in sensible heating are associated spatially with peak fire incidence in various ecoregions.
Intermonthly changes in latent and sensible heating and soil moisture together explain the spatial and temporal variations of fires started by humans and by lightning. The locations of the maximum incidence of fire tracks the area in which long-term average sensible heating rises and soil moisture falls continu-ously for several months. Human-started fires that extend the fire season later into winter and earlier in the spring occur in regions of generally low soil moisture.
The general patterns of soil moisture variations and their intermonthly changes throughout the year (Figs. 1 and 6) suggest an explanation for 1) the distribution of human- versus lightning-started wildfires, and 2) the temporal progression of higher levels of fire incidence from ecoregion to ecoregion. Human-started fires, which occur at low but still substantial numbers throughout the cool season (October to April), are generally confined to the regions of lowest soil moisture during this interval. Increases in human-started fires from February through April across the region (and in particular in southern California, Arizona, New Mexico and southern Colorado) correspond to areas of generally decreasing soil moisture over this interval.
In some areas, such as New Mexico and Colorado, precipi-tation increases from March through May, while soil moisture continues to decrease, reflecting the growing evaporative demand during spring. The general progression of the region of highest incidence of both lightning- and human-started fires from the SW composite ecoregion to the PNW & NRM ecoregion can be seen to track the area in which average soil moisture levels fall continuously over a two-to-three month period. A continuation of a high incidence of lightning-started fires in the SW in July and August despite increasing soil moisture can be explained by the frequent occurrence of monsoon-generated thunderstorms during those months; human-started fires abruptly decrease in frequency in July and August in that region. The end of the lighting-started fire season and the decrease in the rate of human-started fires in October accompanies the general increase in soil moisture
across the region in autumn, as winter precipitation commences and evaporative demand falls. These results suggest that the proximal controls of fire incidence are related to the variations in the surface water and energy balances, and consequently only indirectly to standard climate variables such as temperature and precipitation.
Considerable research has been focused on the teleconnec-tions between various modes of climate variability, such as the El Nino Southern Oscillation (ENSO), and associated responses in streamflow and snowpack dynamics. A natural extension would be to apply similar analyses to wildfire, but the application has resulted in limited success (e.g., Gedalof et al, 2005; Schoennagel et al, 2005). The reason for the lack of success is that, over the last 80 years, in the West both high and low wildfire years have occurred during the El Nino (warm) and La Nina (cold) phases of ENSO and some of the biggest extremes in the record occurred during neutral ENSO phases (Fig. 7.). There are localized excep-tions, but on a state and regional scale, there is very weak or no association between ENSO and wildfire occurrence. (Additional information is provided in the atlas section.)
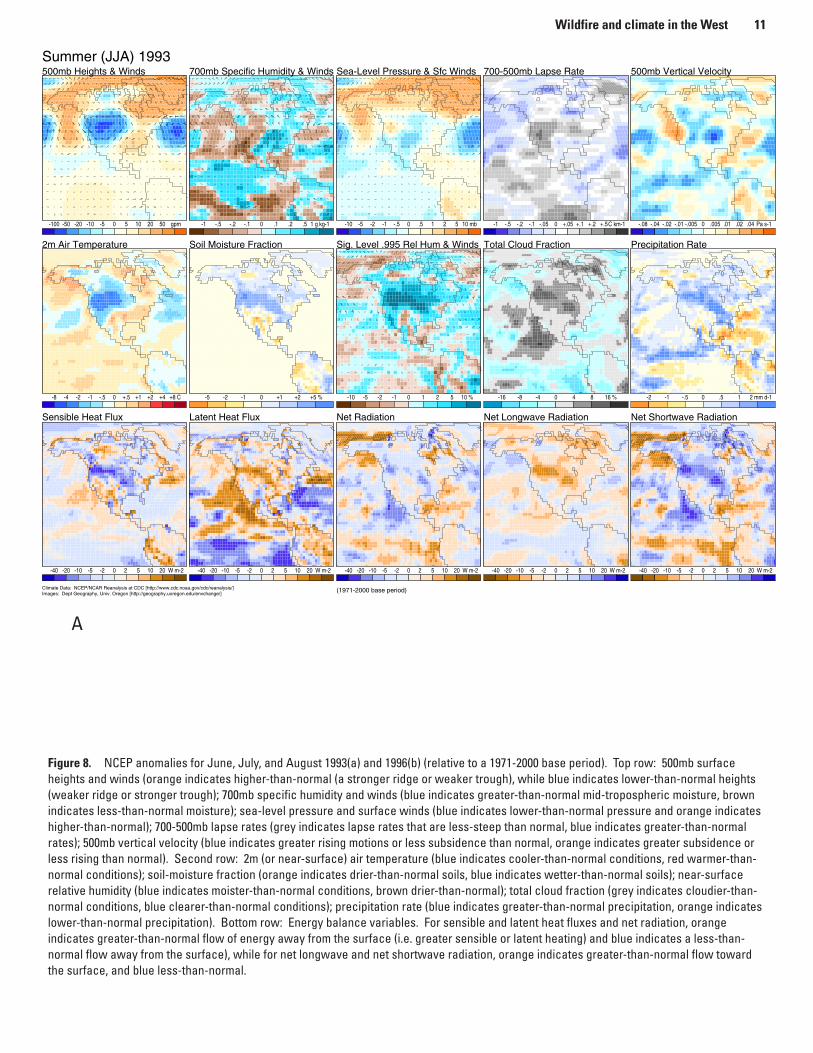
The role of large-scale atmospheric circulation anomalies in determining the nature of the summer fire season in the western U.S. can be seen by contrasting two extreme years, 1993 (low area burned, and low total number of fires) and 1996 (high area burned, and high total number of fires). The nature of the climate anomalies are illustrated using data from the NCEP (National Centers for Environmental Prediction) reanalysis data set (described below). This data set provides information on a range of atmospheric and surface water- and energy-balance variables on 2.5 and 1.875-degree grids respectively, and consequently can provide a broad overview of conditions during these extreme years.
In the summer (June, July and August) of 1993 (low-fire year), the customary ridge over western North America was weaker than normal, with consequently lower-than-normal 500mb heights (Fig. 8a). The counter-clockwise anomalous component of the circulation associated with this height anomaly resulted in stronger-than-normal onshore flow of air into the western U.S. The normal subsidence in summer associated with the ridge was weaker than normal (Fig. 8a, 500mb vertical veloc-ity), and consequently the region was cloudier than normal, while precipitation was greater than normal.
The increased cloudiness reduced incoming shortwave radiation and sensible heating across the region, and this, coupled with the onshore flow, produced cooler- and more-humid-than-normal conditions across the region. Soil moisture and latent heating through evapotranspiration were both greater than normal as a consequence. Overall, this circulation configuration and the attendant surface responses created cool, moist conditions over the region that were not conducive to fire.
In contrast, in the summer of 1996, the ridge over western North America was stronger than normal (Fig. 8b), with stronger-than-normal northwesterly flow into the interior of the conti-nent, and weaker onshore and stronger offshore flow along the southern half of the west coast of the U.S. Associated with this ridge, there was large-scale subsidence, and lower-than-normal cloudiness and precipitation and greater-than-normal net short-wave radiation across the western U.S. Lower-than-normal soil moisture (related ultimately to the lower-than-normal precipita-tion), reduced the opportunity for latent heating, and that in turn
Wildfire and climate in the West 9

Figure 7. Graph showing annual area burned by wildfire for the period 1921-2000 for selected western states. The logarithms of the raw areas have been normalized to a common scale. Red vertical lines are El Nino (warm) events and blue vertical lines are La Nina (cold) events. The data were compiled from a variety of state and federal reporting documents with different methods of reporting and different periods of record. The plotted data are thus representative of inter-annual variability for the period, but are not of the same quality and consistency of the other rigorously screened and compiled from wildfire data sets used in this report.
10 Atlas of Climatic Controls of Wildfire in the Western United States
-100 -50 -20 -10 -5 0 5 10 20 50 gpm
500mb Heights & Winds
-1 -.5 -.2 -.1 0 .1 .2 .5 1 g kg-1
700mb Specific Humidity & Winds
-10 -5 -2 -1 -.5 0 .5 1 2 5 10 mb
Sea-Level Pressure & Sfc Winds
-1 -.5 -.2 -.1 -.05 0 +.05 +.1 +.2 +.5 C km-1
700-500mb Lapse Rate
-.08 -.04 -.02 -.01 -.005 0 .005 .01 .02 .04 Pa s-1
500mb Vertical Velocity
-8 -4 -2 -1 -.5 0 +.5 +1 +2 +4 +8 C
2m Air Temperature
-5 -2 -1 0 +1 +2 +5 %
Soil Moisture Fraction
-10 -5 -2 -1 0 1 2 5 10 %
Sig. Level .995 Rel Hum & Winds
-16 -8 -4 0 4 8 16 %
Total Cloud Fraction
-2 -1 -.5 0 .5 1 2 mm d-1
Precipitation Rate
-40 -20 -10 -5 -2 0 2 5 10 20 W m-2
Sensible Heat Flux
-40 -20 -10 -5 -2 0 2 5 10 20 W m-2
Latent Heat Flux
-40 -20 -10 -5 -2 0 2 5 10 20 W m-2
Net Radiation
-40 -20 -10 -5 -2 0 2 5 10 20 W m-2
Net Longwave Radiation
-40 -20 -10 -5 -2 0 2 5 10 20 W m-2
Net Shortwave Radiation
Summer (JJA) 1993
Climate Data: NCEP/NCAR Reanalysis at CDC [http://www.cdc.noaa.gov/cdc/reanalysis/]Images: Dept Geography, Univ. Oregon [http://geography.uoregon.edu/envchange/]
(1971-2000 base period)
Figure 8. NCEP anomalies for June, July, and August 1993(a) and 1996(b) (relative to a 1971-2000 base period). Top row: 500mb surface heights and winds (orange indicates higher-than-normal (a stronger ridge or weaker trough), while blue indicates lower-than-normal heights (weaker ridge or stronger trough); 700mb specific humidity and winds (blue indicates greater-than-normal mid-tropospheric moisture, brown indicates less-than-normal moisture); sea-level pressure and surface winds (blue indicates lower-than-normal pressure and orange indicates higher-than-normal); 700-500mb lapse rates (grey indicates lapse rates that are less-steep than normal, blue indicates greater-than-normal rates); 500mb vertical velocity (blue indicates greater rising motions or less subsidence than normal, orange indicates greater subsidence or less rising than normal). Second row: 2m (or near-surface) air temperature (blue indicates cooler-than-normal conditions, red warmer-than-normal conditions); soil-moisture fraction (orange indicates drier-than-normal soils, blue indicates wetter-than-normal soils); near-surface relative humidity (blue indicates moister-than-normal conditions, brown drier-than-normal); total cloud fraction (grey indicates cloudier-than-normal conditions, blue clearer-than-normal conditions); precipitation rate (blue indicates greater-than-normal precipitation, orange indicates lower-than-normal precipitation). Bottom row: Energy balance variables. For sensible and latent heat fluxes and net radiation, orange indicates greater-than-normal flow of energy away from the surface (i.e. greater sensible or latent heating) and blue indicates a less-than-normal flow away from the surface), while for net longwave and net shortwave radiation, orange indicates greater-than-normal flow toward the surface, and blue less-than-normal.
A
Wildfire and climate in the West 11

Figure 8 continued. NCEP anomalies for June, July, and August 1993(a) and 1996(b) (relative to a 1971-2000 base period). Top row: 500mb surface heights and winds (orange indicates higher-than-normal (a stronger ridge or weaker trough), while blue indicates lower-than-normal heights (weaker ridge or stronger trough); 700mb specific humidity and winds (blue indicates greater-than-normal mid-tropospheric moisture, brown indicates less-than-normal moisture); sea-level pressure and surface winds (blue indicates lower-than-normal pressure and orange indicates higher-than-normal); 700-500mb lapse rates (grey indicates lapse rates that are less-steep than normal, blue indicates greater-than-normal rates); 500mb vertical velocity (blue indicates greater rising motions or less subsidence than normal, orange indicates greater subsidence or less rising than normal). Second row: 2m (or near-surface) air temperature (blue indicates cooler-than-normal conditions, red warmer-than-normal conditions); soil-moisture fraction (orange indicates drier-than-normal soils, blue indicates wetter-than-normal soils); near-surface relative humidity (blue indicates moister-than-normal conditions, brown drier-than-normal); total cloud fraction (grey indicates cloudier-than-normal conditions, blue clearer-than-normal conditions); precipitation rate (blue indicates greater-than-normal precipitation, orange indicates lower-than-normal precipitation). Bottom row: Energy balance variables. For sensible and latent heat fluxes and net radiation, orange indicates greater-than-normal flow of energy away from the surface (i.e. greater sensible or latent heating) and blue indicates a less-than-normal flow away from the surface), while for net longwave and net shortwave radiation, orange indicates greater-than-normal flow toward the surface, and blue less-than-normal.
-100 -50 -20 -10 -5 0 5 10 20 50 gpm
500mb Heights & Winds
-1 -.5 -.2 -.1 0 .1 .2 .5 1 g kg-1
700mb Specific Humidity & Winds
-10 -5 -2 -1 -.5 0 .5 1 2 5 10 mb
Sea-Level Pressure & Sfc Winds
-1 -.5 -.2 -.1 -.05 0 +.05 +.1 +.2 +.5 C km-1
700-500mb Lapse Rate
-.08 -.04 -.02 -.01 -.005 0 .005 .01 .02 .04 Pa s-1
500mb Vertical Velocity
-8 -4 -2 -1 -.5 0 +.5 +1 +2 +4 +8 C
2m Air Temperature
-5 -2 -1 0 +1 +2 +5 %
Soil Moisture Fraction
-10 -5 -2 -1 0 1 2 5 10 %
Sig. Level .995 Rel Hum & Winds
-16 -8 -4 0 4 8 16 %
Total Cloud Fraction
-2 -1 -.5 0 .5 1 2 mm d-1
Precipitation Rate
-40 -20 -10 -5 -2 0 2 5 10 20 W m-2
Sensible Heat Flux
-40 -20 -10 -5 -2 0 2 5 10 20 W m-2
Latent Heat Flux
-40 -20 -10 -5 -2 0 2 5 10 20 W m-2
Net Radiation
-40 -20 -10 -5 -2 0 2 5 10 20 W m-2
Net Longwave Radiation
-40 -20 -10 -5 -2 0 2 5 10 20 W m-2
Net Shortwave Radiation
Summer (JJA) 1996
Climate Data: NCEP/NCAR Reanalysis at CDC [http://www.cdc.noaa.gov/cdc/reanalysis/]Images: Dept Geography, Univ. Oregon [http://geography.uoregon.edu/envchange/]
(1971-2000 base period)
B
12 Atlas of Climatic Controls of Wildfire in the Western United States
2 5 10 100 1000 10000 100000
Area Burned
1 2 5 10 20 50 100 200
Number of Fires
-3.0 -2.0 -1.0 0.0 1.0 2.0 3.0
1-month SGI
-3.0 -2.0 -1.0 0.0 1.0 2.0 3.0
1-month SGI
-3.0 -2.0 -1.0 0.0 1.0 2.0 3.0
3-month SGI
-3.0 -2.0 -1.0 0.0 1.0 2.0 3.0
3-month SGI
-3.0 -2.0 -1.0 0.0 1.0 2.0 3.0
6-month SGI
-3.0 -2.0 -1.0 0.0 1.0 2.0 3.0
6-month SGI
-3.0 -2.0 -1.0 0.0 1.0 2.0 3.0
12-month SGI
-3.0 -2.0 -1.0 0.0 1.0 2.0 3.0
12-month SGIWestern U.S. Fires Aug 1996
Fire Data: Westerling et al. (2003) Bull. Amer. Met. Soc. [http://ulmo.ucsd.edu/~westerling/fire/]Images: Dept Geography, Univ. Oregon [http://geography.uoregon.edu/envchange/]
(1981-2000 base period)
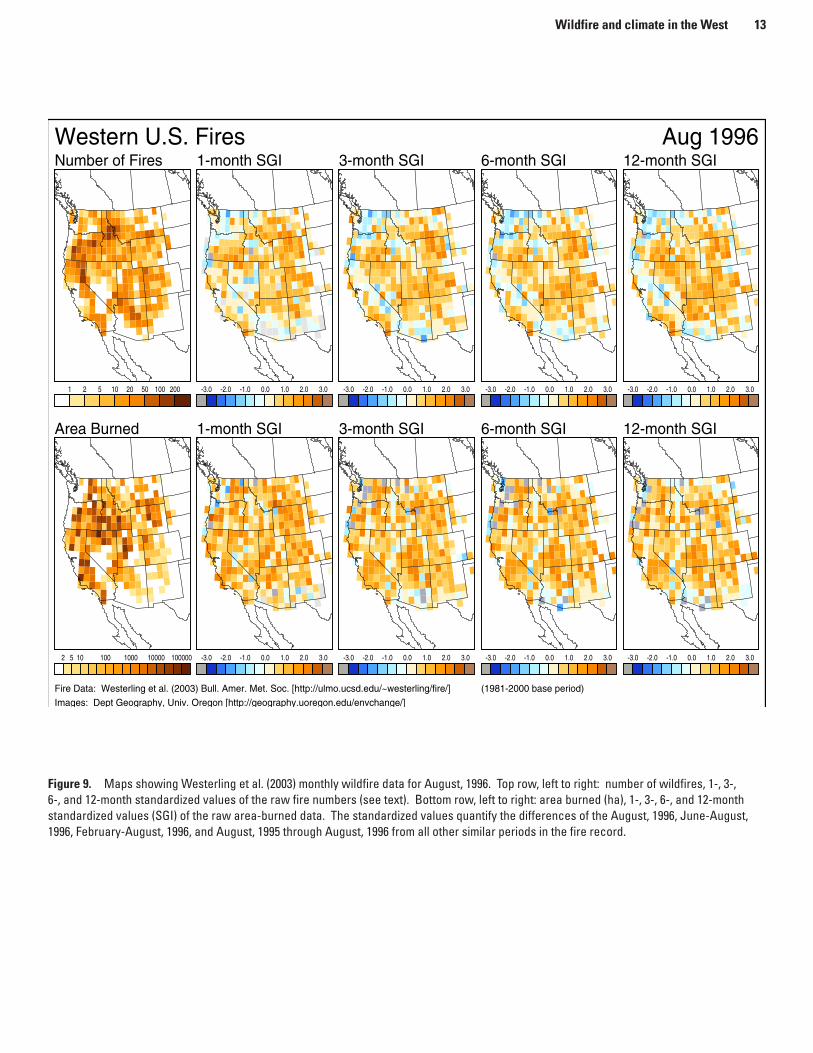
Figure 9. Maps showing Westerling et al. (2003) monthly wildfire data for August, 1996. Top row, left to right: number of wildfires, 1-, 3-, 6-, and 12-month standardized values of the raw fire numbers (see text). Bottom row, left to right: area burned (ha), 1-, 3-, 6-, and 12-month standardized values (SGI) of the raw area-burned data. The standardized values quantify the differences of the August, 1996, June-August, 1996, February-August, 1996, and August, 1995 through August, 1996 from all other similar periods in the fire record.
Wildfire and climate in the West 13

-40 -30 -20 -10 0 10 20 30 C
Long-Term Mean Temp-40 -30 -20 -10 0 10 20 30 C
Mean Temperature-8 -4 -2 -1 -.5 0 +.5 +1 +2 +4 +8 C
Anomaly
.5 1 2 4 8 16 mm/d
Long-Term Mean Precip Rate.5 1 2 4 8 16 mm/d
Mean Precip Rate-2 -1 -.5 0 .5 1 2
1-Month SPI
-2 -1 -.5 0 .5 1 2
3-Month SPI-2 -1 -.5 0 .5 1 2
6-Month SPI-2 -1 -.5 0 .5 1 2
12-Month SPI
CRU TS 2.0 Aug 1996
CRU Data: CRU TS 2.0 [http://www.cru.uea.ac.uk/]Animation: Dept Geography, Univ. Oregon [http://geography.uoregon.edu/envchange/]
(1971-2000 base period)
Figure 10. Maps showing example of CRU temperature and precipitation for August, 1996. Top row left to right: long term mean (1971-2000) August temperature, August, 1996 mean temperature, August, 1996 minus the long term mean for August. Middle row left to right precipitation long term mean (1971-2000), August, 1996 mean, and 1-month standardized precipitation index (SPI, see text). Bottom row: 3-, 6-, and 12-month SPIs.
14 Atlas of Climatic Controls of Wildfire in the Western United States
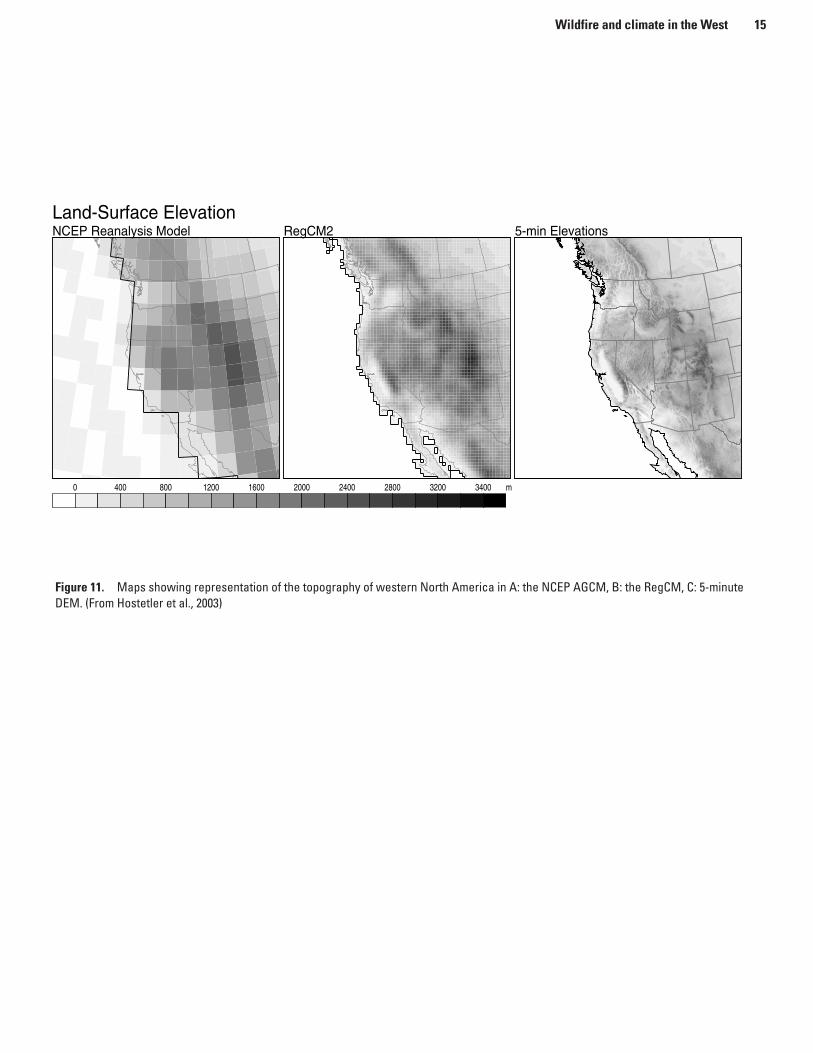
Figure 11. Maps showing representation of the topography of western North America in A: the NCEP AGCM, B: the RegCM, C: 5-minute DEM. (From Hostetler et al., 2003)
0 400 800 1200 1600 2000 2400 2800 3200 3400 m
Land-Surface ElevationNCEP Reanalysis Model RegCM2 5-min Elevations
Figure 4
Wildfire and climate in the West 15

0 200 400 800 1200 1600 2000 2400 2800 3200 m
RegCM Regional Climate ModelNCEP/NCAR Reanalysis Model
Climate Data: NCEP/NCAR Reanalysis at CDC [http://www.cdc.noaa.gov/cdc/reanalysis/]Illustration: Dept Geography, Univ. Oregon [http://geography.uoregon.edu/envchange/]
Figure 12. Map showing RegCM topography inset within the topography as represented by the NCEP GCM. The difference in model resolution of the topography is indicative of similar differences in resolution of atmospheric and surface fields simulated by the models.
16 Atlas of Climatic Controls of Wildfire in the Western United States
Sea-Level Pressure & Surface Winds 995 1005 1015 1025mb
500mb Surface Heights and Winds 5280 5440 5600 5760 5920m
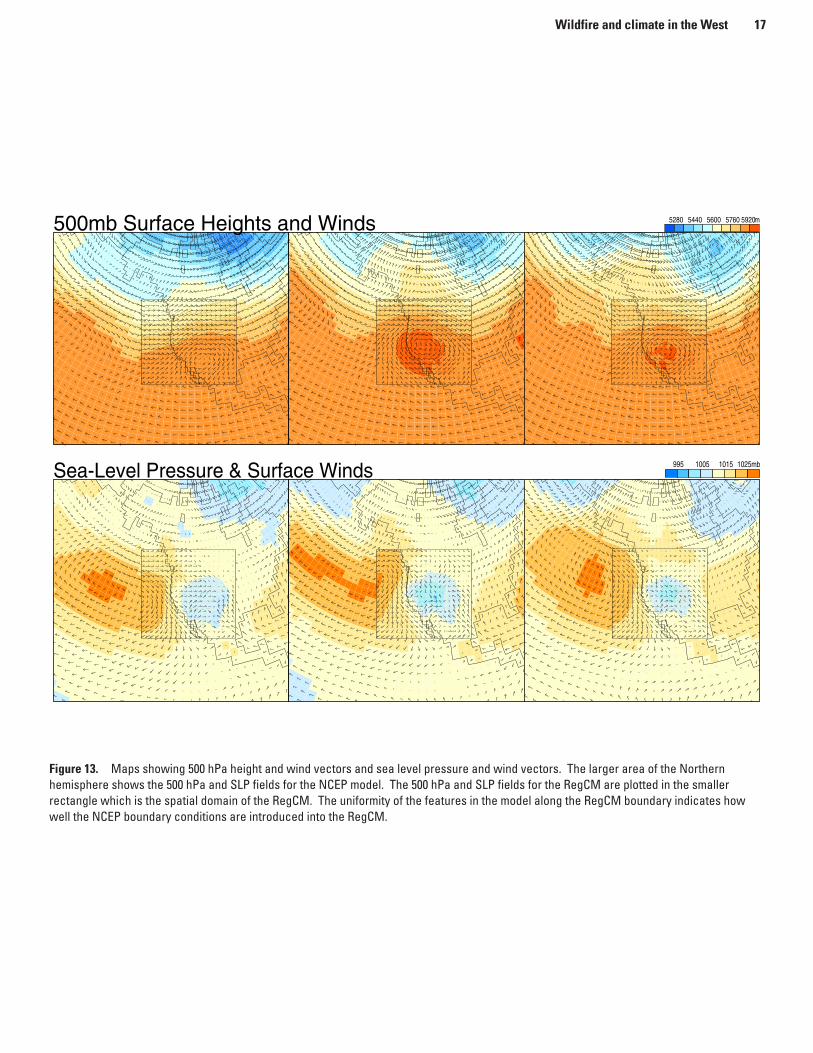
Figure 13. Maps showing 500 hPa height and wind vectors and sea level pressure and wind vectors. The larger area of the Northern hemisphere shows the 500 hPa and SLP fields for the NCEP model. The 500 hPa and SLP fields for the RegCM are plotted in the smaller rectangle which is the spatial domain of the RegCM. The uniformity of the features in the model along the RegCM boundary indicates how well the NCEP boundary conditions are introduced into the RegCM.
Wildfire and climate in the West 17

.5 1 2 4 8 16 mm d-1Precipitation Rate
-40 -30 -20 -10 0 10 20 30 C2m Air TemperatureNCEP & RegCM Aug 1996
NCEP Data: NCEP/NCAR Reanalysis at CDC [http://www.cdc.noaa.gov/cdc/reanalysis/]RegCM Data: US Geological Survey [http://geography.uoregon.edu/fireclim/]Image: Dept Geography, Univ. Oregon [http://geography.uoregon.edu/envchange/]
Figure 14. Maps showing examples of 2-m air temperature and precipitation as simulated by the RegCM for August, 1996. The RegCM domain is shown inside the larger NCEP model domain. All simulated RegCM atmospheric and surface fields are available for each grid point in the domain.
18 Atlas of Climatic Controls of Wildfire in the Western United States

-3 -2 -1 0 1 2 3SGI
-3 -2 -1 0 1 2 3SGI
0
0.2
0.4
0.6
0.8
1
Cum
ulat
ive
prob
abili
ty
Figure 15. Graphs showing - Top: Standard normal distribution (mean of zero and standard deviation, s, of one.) of a SGI. Vertical lines are at one standard deviation from the mean. Bottom: cumulative probability distribution for the normal distribution of SGI in the top figure. For reference, SGI values greater (less) than 1.0 s from the mean occur 15.8% of the time (so values 1 s or less occur ~68.3% of the time), values greater (less) than ~2 s standard deviations from the mean occur ~5.4% of the time, and values greater (less) than 3 s occur less than 0.4% of the time.
Wildfire and climate in the West 19
resulted in greater-than-normal sensible heat flux, lower-than-normal near-surface relative humidity, and higher-than normal temperatures. The strong ground heating steepened the 700-500mb lapse rate, and increased atmospheric instability and the frequency of deep convection and lightning. The combination of dry conditions and associated low fuel moisture, with frequent opportunities for ignition, resulted in frequent and large fires.
Methods
Fire and Climate Data Sets
Fire dataFor our complete analysis, we used both the 1986-1996
daily National Fire Occurrence Database (Hardy et al., 2001 and Schmidt et al., 2002 available at http://www.fs.fed.us/fire/fuel-man/) and the 1980-2000 monthly Westerling et al. (2003) fire database. These daily data consist of records of the locations of individual fires including the date when each fire was first reported and, for most records, the ultimate size and the date when the fire was considered to have been controlled (but not necessarily extinguished). We extracted a subset of the full data set which contains 332,404 records, including 116,489 fires started by lightning and 197,617 fires started by humans west of 102°W. These daily data are not without problems, but we believe that they are sufficient for our purposes. Further discus-sion of the nature of the daily fire-start records is provided by Hardy et al. (2001), the review by Westerling et al. (2003), and in an assessment of the quality of such point-location data by Brown et al. (2002). We used the daily fire data set in the (previous) Wildfire and climate section to describe the general characteris-tics of wildfire and climate in the western US.
For our focused analyses of climate and wildfire on a monthly basis we rely on the Weserling et al. data. The data set, which is on a 1° × 1° grid covering 31o to 49o north latitude and 101o-125o west longitude (Fig. 9) is based on ~300,000 fire reports of fire starts and area burned from the USDA Forest Ser-vice, the Bureau of Land Management, the National Park Service, and the Bureau of Indian Affairs.
Climate Research Unit (CRU) climate dataMonthly observed temperature and precipitation fields (Fig.
10) were described using the “CRU TS 2.0” data set (Mitchell et al. 2003), a global, 0.5-degree gridded data set (for land points only) that spans the interval 1901-2000. We used this data set because it allowed us to calculate “long-term” means for the specific interval represented by the fire data (1980-2000), and because the interpolation inherent in its creation provides data for regions of the western US where individual climate stations are sparse.
Regional climate model dataGlobal atmospheric and surface climate fields for the period
1948-2005 (through November) have been produced by the NOAA National Center for Environmental Prediction (NCEP) using a sophisticated assimilation technique to incorporate a large number of observed data sets (e.g., atmospheric soundings, sea-surface temperature) into a global atmospheric model (Kistler et al., 2001). The NCEP model has a nominal horizontal grid spacing of 2.5 degrees (about 250 km on a side) and is capable of simulating large-scale synoptic climate features and regional cli-mate variations. The relatively coarse spatial scale of the model, however, limits the degree to which climate is resolved over the topographically complex region of Western North America (Fig. 10).
To provide higher resolution climate data, we are producing a continuous, high resolution (45 km horizontal grid, ~0.4 degree with 14 vertical layers) simulation for the period 1950-to pres-ent using our modified version of the NCAR RegCM2 regional climate model (Giorgi et al., 1993). The RegCM simulation is driven by time-varying lateral (vertical profiles of temperature, wind, humidity) and surface (pressure and sea surface tempera-ture) boundary conditions derived from 6-hr NCEP reanalysis history files. A 150-sec model time step was used for the simula-tions and model fields were output and archived for hourly, 4X daily and monthly time steps to allow multi-scale analyses of climate (and weather) and wildfire data. A full year of complete model output is about 50 Gb in size.
The RegCM domain covers the western U.S. and adjacent areas of Canada and Mexico (Figs. 11, 12). There are 3510 ter-restrial grid points in the domain. At 45-km grid spacing climati-cally important physiographic features such as coastlines and the basin and range topography that dominates the West are resolved (Figs. 11, 12).
Our configuration of the RegCM is fully coupled at the atmospheric boundary layer with a sophisticated land-surface model, LSX (Land Surface Exchange model, Thompson and Pollard, 1995). LSX computes the exchange of energy and mass between the surface and boundary layer based on the specified distribution of vegetation and soil properties. LSX includes a 6-layer, dynamic soil model that calculates soil temperature and the frozen and liquid water content in the top 4.5m of the soil.
To achieve quality simulations with the RegCM it was nec-essary to optimize the coupling between the forcing NCEP GCM large-scale boundary conditions and the RegCM. The quality of the coupling we were able to achieve is illustrated in Fig. 13 and 14. Together, the atmospheric models provide internally consis-tent climate information from the surface to the upper atmosphere over a wide range of spatial scales and on temporal scales ranging from hourly to decades.
Standardizing climate and fire dataFor the monthly fire-climate analyses, we transformed the
raw fire (i.e., area burned and number of fires) and climate (e.g. precipitation) data into “standardized gamma indices” (SGI) by applying the mathematical algorithms that are used to compute the standardized precipitation index (SPI) discussed in detail by McKee et al. (1993), Hays et al. (1996), Edwards and McKee (1997) and Guttman (1998 and 1999). The SPI was developed
20 Atlas of Climatic Controls of Wildfire in the Western United States
Sierra Nevada
0 400 800 1200 1600 2000 2400 2800 3200 3400 m
Elevation
Mask
Southwest
Southern Rockies
Central Rockies
Northern RockiesPacific Northwest interiorPacific Northwest coast
Great Basin
Figure 16. Map showing subregions used in the fire-climate analysis. The underlying gray shaded pixels indicate the topography of the region as it is represented in the regional climate model at 45 km grid spacing.
Methods 21

Northern Rockies
High June T P SM01 SM03 SM06 SM12 ENSO ENSO-1
1988 2 -2 -2 -2 -2 -2 W W Correlations with SG011992 2 2 -1 -2 -2 -2 W N T01 T03 T06 T12 P01 P03 P06 P121994 2 -1 -2 -2 -2 -2 N N Jan -0.03 0.35 0.31 0.21 -0.32 -0.47 -0.40 -0.111985 1 -2 -2 -2 -2 1 N N Feb 0.14 0.17 0.18 -0.19 -0.28 0.14 0.151986 2 -1 -2 -1 -1 -1 N N Mar 0.40 0.41 0.52 0.42 -0.64 -0.42 -0.38 0.121987 2 -2 -2 -2 -2 -1 W N Apr 0.66 0.44 0.30 0.16 -0.53 -0.58 -0.63 -0.322000 1 -2 -2 -2 -2 -2 C W May 0.64 0.47 0.30 0.00 -0.17 -0.35 -0.46 -0.13
High July Jun 0.86 0.76 0.53 0.28 -0.47 -0.55 -0.61 -0.551994 2 -2 -2 -2 -2 -2 N N Jul 0.73 0.60 0.37 0.44 -0.67 -0.72 -0.74 -0.712000 2 -1 -2 -2 -2 -2 C W Aug 0.70 0.70 0.46 0.64 -0.69 -0.74 -0.55 -0.501989 2 -1 1 -1 -2 -2 C W Sep 0.67 0.64 0.53 0.73 -0.62 -0.61 -0.35 -0.361985 2 -2 1 -2 -2 1 N N Oct 0.47 0.31 0.30 0.38 -0.57 -0.66 -0.32 -0.431988 2 -2 -2 -2 -2 -2 W W Nov 0.71 0.62 0.30 0.39 -0.31 -0.73 -0.22 -0.161996 2 -2 1 2 2 2 N N Dec 0.14 0.46 0.26 0.10 -0.25 -0.36 -0.22 -0.121981 -1 -2 -2 2 2 2 N N
High August Correlations with SG01-121981 2 -2 2 1 2 2 N N SG/T01 SG/T03 T06 SG/T12 SG/P01 SG/P03 SG/P06 SG/P121996 1 -2 1 1 2 2 N N Jan -0.03 0.58 0.17 0.42 -0.32 -0.15 -0.30 -0.612000 2 -2 1 -2 -2 -2 C W Feb 0.14 0.23 0.35 -0.19 -0.20 -0.39 -0.581994 2 -2 -2 -2 -2 -2 N N Mar 0.40 0.38 0.36 0.29 -0.64 -0.50 -0.41 -0.521991 2 -1 1 -2 -1 -1 N N Apr 0.66 0.46 0.31 0.12 -0.53 -0.53 -0.58 -0.481988 1 -2 -2 -2 -2 -2 W W May 0.64 0.57 0.45 0.12 -0.17 -0.56 -0.78 -0.661999 2 2 1 -1 1 1 C W Jun 0.86 0.80 0.55 0.18 -0.47 -0.56 -0.68 -0.50
Jul 0.73 0.74 0.55 0.16 -0.67 -0.76 -0.78 -0.65Avg June Aug 0.70 0.81 0.69 0.59 -0.69 -0.87 -0.80 -0.78
1996 2 -2 1 2 2 2 N N Sep 0.67 0.64 0.68 0.63 -0.62 -0.83 -0.83 -0.821989 2 -2 -1 -1 -2 -2 C W Oct 0.47 0.56 0.62 0.66 -0.57 -0.65 -0.80 -0.801983 -1 2 2 1 1 2 W N Nov 0.71 0.64 0.49 0.58 -0.31 -0.59 -0.80 -0.751982 -1 1 2 2 2 2 N N Dec 0.14 0.58 0.35 0.51 -0.25 -0.43 -0.63 -0.681991 -2 2 -2 -2 1 -1 N N
1980 -1 1 2 -1 1 -2 N N
1999 -2 1 1 2 1 1 C WAvg July
1990 1 -1 -2 1 1 -1 N C
1991 1 -2 1 1 1 -1 N N
1999 -2 -2 -2 1 -1 1 C W
1992 -2 2 2 1 -1 -2 W N
1986 -2 1 -2 -2 -2 -1 N N
1998 2 2 2 2 2 2 W N
1987 -2 2 2 -2 -2 1 W NAvg August
1998 2 -2 2 2 2 2 W N
1992 -2 -2 1 2 -1 -2 W N
1986 1 1 -1 -2 -2 -2 N N
1984 1 2 2 2 2 2 N W
1990 1 2 -2 -1 1 -1 N C
1985 -2 1 -2 -2 -2 -1 N N
1989 -2 2 -2 -2 -1 -2 C WLow June
1990 -1 -2 1 2 2 1 N C
1993 -2 2 1 -1 -1 1 N W
1984 -2 1 2 2 2 2 N W
1995 -2 2 1 1 1 -2 N N
1997 -1 2 2 2 2 2 N N
1981 -2 1 2 1 2 2 N N
1998 -2 2 2 2 2 2 W NLow July
1980 1 -1 1 1 -1 -2 N N
1984 1 1 2 2 2 2 N W
1983 -2 2 2 2 1 2 W N
1995 -1 2 1 1 2 -2 N N
1982 -1 1 2 2 2 2 N N
1997 -2 2 2 2 2 2 N N
1993 -2 2 1 -1 -1 -1 N WLow August
1982 1 -1 1 2 2 2 N N
1983 2 2 2 2 2 2 W N
1980 -2 1 2 2 1 -1 N N
1997 1 2 2 2 2 2 N N
1995 -2 -1 -2 1 1 -1 N N
1987 -2 1 2 1 -2 1 W N
1993 -2 2 -2 -1 -2 -2 N W
Cell colors in the first column indicate rank of area burned for a given month and year. Or-ange: upper 33%, gray: middle 33%, blue: lower 33%.
Rank of monthly average climate variables for the given fire month and year. 2/orange: upper 33% (warmest/driest), +1/yellow: middle 33% with posi-tive sign (warm/dry), -1/light blue: middle 33% with negative sign (cool/wet), -2/dark blue: lower 33% (coolest/wettest).
High Fire Years
Low Fire Years
Greatest number of June fires
Fewest number of August fires
ENSO mode for current year (ENSO) and previous year (ENSO-1). W/red: warm phase (El Nino), N/gray: neutral phase, C/blue: cold phase (La Nina)
Correlations between standardized monthly fire numbers and 1, 3, 6, and 12-month standard-ized temperature and precipitation values. Blue shades are > 0.5 and yellow are < -0.5. The numbers indicate the correlations between monthly fire frequency and the indicated temperature and precipitation time periods.
Correlations between standardized 1, 3, 6, and 12 month fire numbers (SGI) and 1, 3, 6, and 12-month standardized temperature (STI) and precipi-tation (SPI) values. Blue shades are > 0.5 and yellow shades are < -0.5. The numbers indicate the correlations between monthly fire frequency and the indicated temperature and precipitation time periods.
Upper 33%
Middle 33%
Lower 33%
Figure 17. Key diagram explaining the conventions for the ranking and correlations for each region. This example is for the Northern Rockies region.
22 Atlas of Climatic Controls of Wildfire in the Western United States
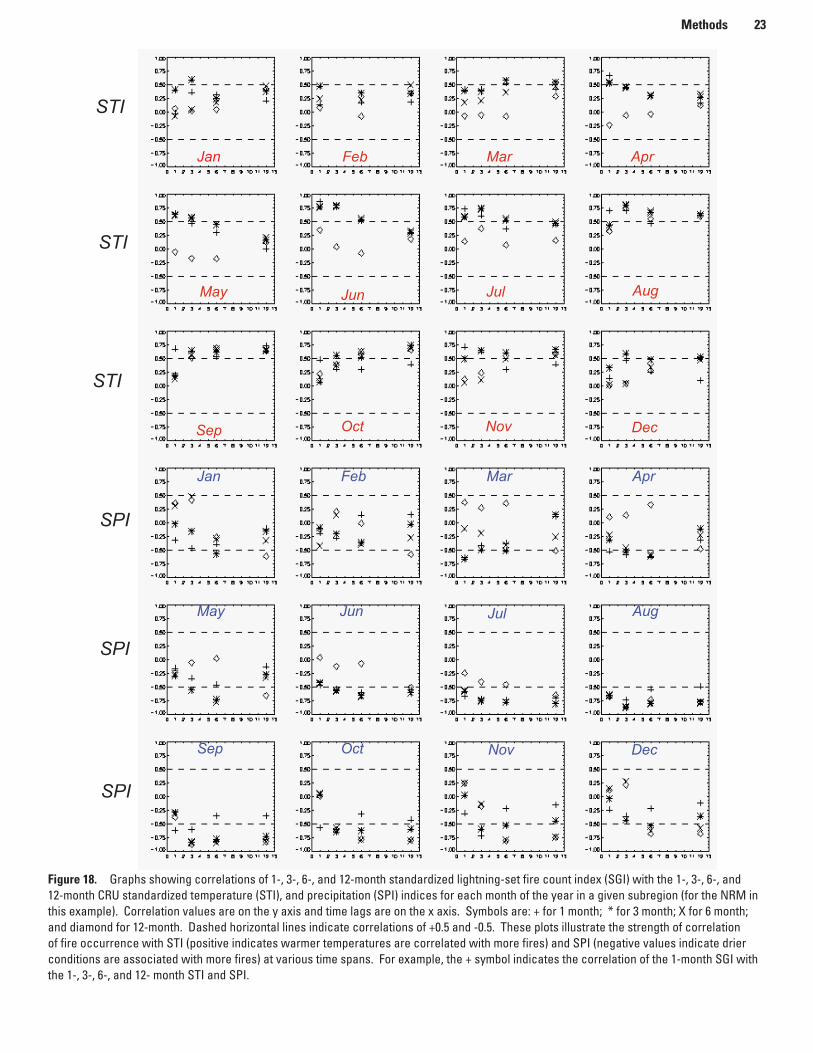
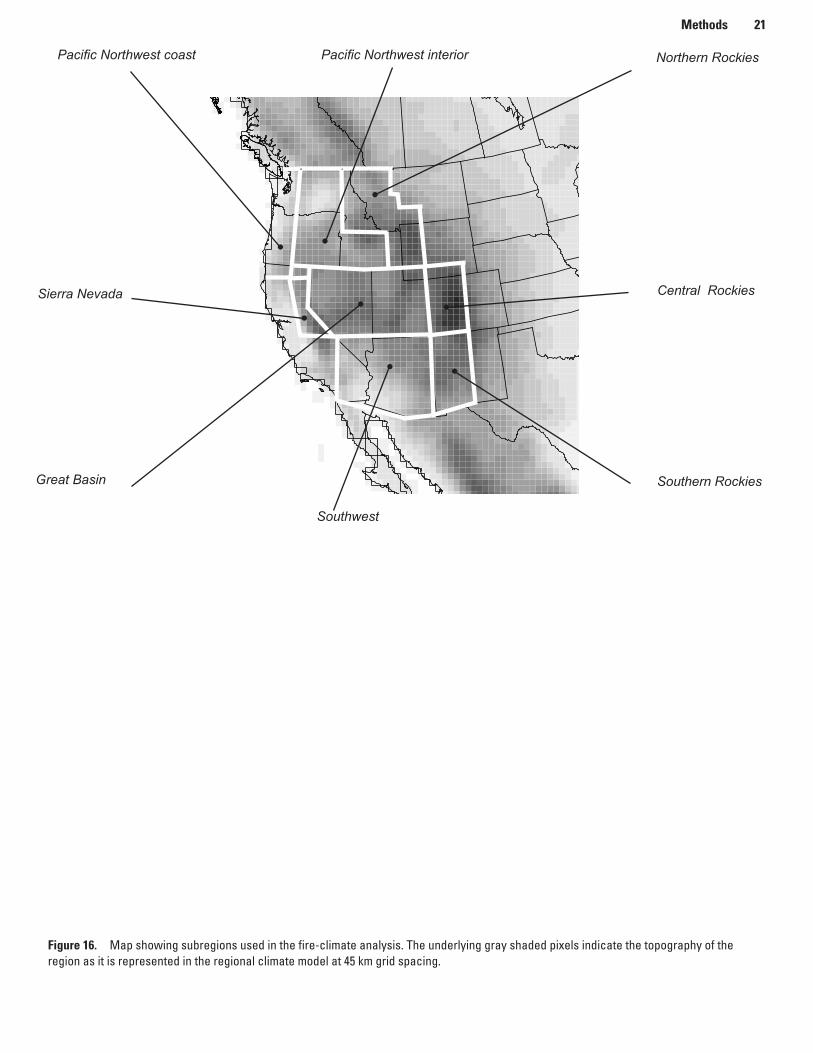
Figure 18. Graphs showing correlations of 1-, 3-, 6-, and 12-month standardized lightning-set fire count index (SGI) with the 1-, 3-, 6-, and 12-month CRU standardized temperature (STI), and precipitation (SPI) indices for each month of the year in a given subregion (for the NRM in this example). Correlation values are on the y axis and time lags are on the x axis. Symbols are: + for 1 month; * for 3 month; X for 6 month; and diamond for 12-month. Dashed horizontal lines indicate correlations of +0.5 and -0.5. These plots illustrate the strength of correlation of fire occurrence with STI (positive indicates warmer temperatures are correlated with more fires) and SPI (negative values indicate drier conditions are associated with more fires) at various time spans. For example, the + symbol indicates the correlation of the 1-month SGI with the 1-, 3-, 6-, and 12- month STI and SPI.
STI
STI
STI
SPI
SPI
SPI
Jan Feb Mar Apr
May
Sep
Jun
Oct Nov Dec
Jul Aug
Jan Feb Mar Apr
May Jun Jul Aug
Sep Oct Nov Dec
Methods 23
SMI
SMI
SMI
Jan Feb Mar Apr
May Jun Jul Aug
Sep Oct Nov Dec
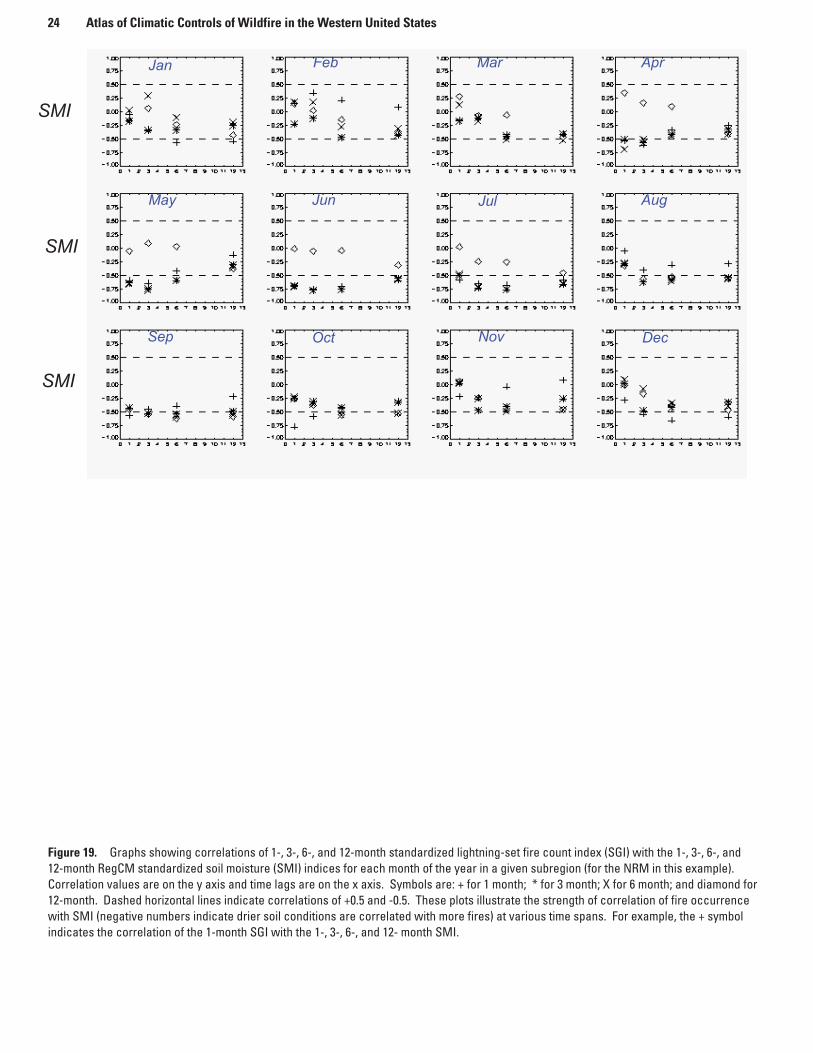
Figure 19. Graphs showing correlations of 1-, 3-, 6-, and 12-month standardized lightning-set fire count index (SGI) with the 1-, 3-, 6-, and 12-month RegCM standardized soil moisture (SMI) indices for each month of the year in a given subregion (for the NRM in this example). Correlation values are on the y axis and time lags are on the x axis. Symbols are: + for 1 month; * for 3 month; X for 6 month; and diamond for 12-month. Dashed horizontal lines indicate correlations of +0.5 and -0.5. These plots illustrate the strength of correlation of fire occurrence with SMI (negative numbers indicate drier soil conditions are correlated with more fires) at various time spans. For example, the + symbol indicates the correlation of the 1-month SGI with the 1-, 3-, 6-, and 12- month SMI.
24 Atlas of Climatic Controls of Wildfire in the Western United States

0 400 800 1200 1600 2000 2400 2800 3200 3400 m
Elevation
Mask
01 03 06 12 01 03 06 12
H500
SLP
Precip
Fire
Low-Normal High-Low
Smois
Tair
High-Normal 01 03 06 12
Figure 20. Maps showing anomalies of standardized fire and climate index values. This example is for August in the Northern Rockies region. H500: 500 hPa height, SLP: sea level pressure, Smois: 5 cm soil moisture, Tair: 2-meter air temperature, Precip: precipitation, and Fire: fire numbers.
High (upper tercile) minus Normal (middle tercile)
Low (lower tercile) minus Normal (middle tercile) High (upper tercile) minus
Low (lower tercile)
1, 3, 6, and 12-month time spans
Methods 25

Sierra Nevada
High June T P SM01 SM03 SM06 SM12 ENSO ENSO-1
1987 2 -2 2 2 1 1 W N Correlations with SG011992 2 2 1 1 -1 -1 W N T01 T03 T06 T12 P01 P03 P06 P121988 1 2 2 1 2 -1 W W Jan -0.3281986 2 -1 -2 -2 -2 1 N N Feb 0.48 -0.12 -0.01 0.18 -0.64 -0.49 -0.58 -0.571984 -2 1 1 2 2 2 N W Mar 0.41 0.03 0.28 0.15 -0.80 -0.64 -0.58 -0.581985 2 -2 -2 -2 -1 2 N N Apr 0.82 0.37 0.35 0.23 -0.57 -0.59 -0.74 -0.751981 2 -2 1 -2 -2 2 N N May 0.79 0.70 0.35 0.20 -0.53 -0.63 -0.63 -0.54
High July Jun 0.70 0.68 0.54 0.40 -0.27 -0.53 -0.55 -0.521988 2 -2 2 2 2 1 W W Jul 0.66 0.47 0.51 0.29 0.08 -0.02 -0.59 -0.581985 2 -2 2 -2 -2 2 N N Aug 0.05 0.15 0.26 0.30 0.03 -0.24 -0.26 -0.411990 2 2 1 -1 -1 -2 N C Sep 0.51 0.35 0.03 0.00 -0.30 -0.27 -0.22 -0.361984 2 2 2 2 2 2 N W Oct 0.74 0.61 0.47 0.28 -0.54 -0.69 -0.59 -0.511991 1 2 2 1 1 -1 N N Nov 0.38 0.25 0.05 0.07 -0.63 -0.65 -0.54 -0.071996 2 1 1 2 2 -2 N N Dec -0.13 0.34 0.35 0.15 -0.36 -0.53 -0.54 -0.361986 -2 -2 -2 -2 -2 -1 N N
High August
1990 -1 2 2 2 1 1 N C Correlations with SG01-121992 2 1 -1 -1 -1 -2 W N SG/T01 SG/T03 T06 SG/T12 SG/P01 SG/P03 SG/P06 SG/P121988 2 -2 2 2 1 1 W W Jan -0.14 0.27 -0.17 0.29 -0.31 -0.60 -0.34 -0.621989 -2 2 1 -2 -2 -2 C W Feb 0.48 -0.29 0.07 0.30 -0.64 -0.68 -0.52 -0.661987 1 -2 1 1 1 2 W N Mar 0.41 -0.05 0.30 0.23 -0.80 -0.69 -0.62 -0.471996 2 -1 1 1 2 -2 N N Apr 0.82 0.44 0.40 0.13 -0.57 -0.78 -0.81 -0.431999 -2 2 -2 -2 -2 -1 C W May 0.79 0.75 0.37 0.09 -0.53 -0.71 -0.76 -0.52
Jun 0.70 0.74 0.49 0.18 -0.27 -0.68 -0.71 -0.63Avg June Jul 0.66 0.66 0.70 0.16 0.08 -0.28 -0.67 -0.75
2000 2 -2 -1 -1 -1 -2 C W Aug 0.05 0.41 0.59 0.40 0.03 -0.24 -0.52 -0.751989 1 -1 -2 -2 -2 -2 C W Sep 0.51 0.40 0.58 0.52 -0.30 -0.21 -0.62 -0.801994 -1 -2 -2 -2 -2 -2 N N Oct 0.74 0.32 0.58 0.51 -0.54 -0.16 -0.47 -0.771982 -1 -1 2 2 2 2 N N Nov 0.38 0.36 0.43 0.40 -0.63 -0.14 -0.26 -0.651997 1 2 -2 -2 -2 -2 N N Dec -0.13 0.42 0.21 0.30 -0.36 -0.34 -0.27 -0.631996 2 -2 1 2 1 -2 N N
1983 -2 1 1 1 2 2 W NAvg July
1987 -2 2 -2 1 1 1 W N
1997 1 -1 -2 -2 -2 -2 N N
1992 -1 -1 -1 -1 -2 -2 W N
1994 2 -1 1 -2 -2 -2 N N
1980 -1 2 2 2 1 1 N N
1999 -1 -2 -1 -2 -1 1 C W
1995 -2 2 -2 2 1 -1 N NAvg August
1980 -2 -1 2 2 2 1 N N
1981 2 -2 2 2 2 2 N N
1984 1 2 2 2 2 2 N W
2000 1 -1 -2 -2 -2 -2 C W
1986 2 -2 -1 -2 -2 -1 N N
1982 -1 -1 1 1 2 2 N N
1991 1 1 2 2 2 -2 N N
Low June1991 -2 1 1 -1 -2 -2 N N
1999 -2 -1 -2 -2 -1 1 C W
1995 -2 2 2 2 2 -1 N N
1990 -1 -2 2 -1 -2 -2 N C
1980 -2 1 -2 1 -1 -1 N N
1993 -2 2 2 2 2 2 N W
1998 -1 2 2 2 2 2 W NLow July
1981 -1 -2 2 1 -1 2 N N
2000 -2 1 -2 -2 -2 -2 C W
1998 2 -2 1 2 2 2 W N
1989 2 -2 -2 -2 -2 -2 C W
1983 -2 1 -1 1 2 2 W N
1993 -2 -1 -2 2 2 2 N W
1982 -2 2 2 1 2 2 N NLow August
1993 -2 2 -2 1 1 2 N W
1985 -2 -1 -2 -2 -2 -1 N N
1998 2 -2 2 2 2 2 W N
1983 -1 2 -2 -1 -1 2 N W
1994 -2 -2 -2 -2 -2 -2 N N
1997 2 2 -1 -2 -2 -2 N N
1995 -2 -2 -2 -1 -1 -1 N N
Great Basin
High June T P SM01 SM03 SM06 SM12 ENSO ENSO-1
2000 2 -2 -2 -2 -2 -2 C W Correlations with SG011996 2 -2 -1 1 -1 -1 N N T01 T03 T06 T12 P01 P03 P06 P121988 2 1 1 -2 -2 -2 W W Jan1992 1 1 1 -2 -2 -1 W N Feb 0.40 0.56 0.40 0.32 0.01 -0.36 -0.17 -0.241986 2 -2 -1 -1 -1 1 N N Mar 0.46 0.18 0.28 0.14 -0.63 -0.56 -0.30 -0.151987 1 -2 1 2 -1 -2 W N Apr 0.73 0.48 0.31 0.30 -0.40 -0.19 -0.38 -0.401999 -1 2 -2 -1 1 2 C W May 0.82 0.64 0.17 0.07 -0.52 -0.77 -0.68 -0.36
High July Jun 0.73 0.73 0.55 0.53 -0.57 -0.58 -0.55 -0.471994 2 -2 -2 -2 -2 -2 N N Jul 0.89 0.70 0.45 0.35 -0.36 -0.47 -0.48 -0.571996 2 -1 1 -1 -1 -1 N N Aug 0.45 0.50 0.51 0.64 -0.35 -0.61 -0.58 -0.651985 2 2 2 -1 -1 2 N N Sep 0.17 0.06 -0.03 0.16 -0.44 -0.48 -0.13 -0.091989 2 -2 -1 -2 -2 -2 C W Oct 0.76 0.29 0.28 0.08 -0.68 -0.73 -0.61 -0.392000 2 -2 1 -2 -2 -2 C W Nov 0.57 0.26 0.16 -0.11 -0.41 -0.44 -0.34 -0.331988 2 -2 2 2 -2 -2 W W Dec1991 1 -2 2 1 -1 -1 N N
High August2000 2 2 -2 -1 -2 -2 C W
1992 1 -1 -1 -2 -2 -2 W N SG/T01 SG/T03 T06 SG/T12 SG/P01 SG/P03 SG/P06 SG/P121996 2 -2 1 1 1 -1 N N Jan 0.56 0.33 0.62 -0.33 -0.33 -0.451981 2 -2 2 2 2 2 N N Feb 0.40 0.50 0.52 0.64 0.01 -0.40 -0.10 -0.451999 -2 2 -1 -2 -1 2 C W Mar 0.46 0.21 0.39 0.67 -0.63 -0.50 -0.43 -0.461991 1 1 2 2 1 -1 N N Apr 0.73 0.48 0.44 0.59 -0.40 -0.39 -0.50 -0.451986 2 1 -2 -2 -2 -1 N N May 0.82 0.63 0.20 0.58 -0.52 -0.66 -0.64 -0.52
Jun 0.73 0.78 0.53 0.64 -0.57 -0.60 -0.61 -0.42Jul 0.89 0.87 0.68 0.59 -0.36 -0.56 -0.64 -0.67
Avg June Aug 0.45 0.80 0.76 0.69 -0.35 -0.71 -0.77 -0.761985 2 -2 -2 -2 -2 2 N N Sep 0.17 0.50 0.66 0.57 -0.44 -0.64 -0.73 -0.771994 2 -2 -2 -2 -2 -2 N N Oct 0.76 0.32 0.64 0.55 -0.68 -0.51 -0.68 -0.771981 2 -2 2 1 -1 2 N N Nov 0.57 0.41 0.48 0.52 -0.41 -0.58 -0.64 -0.731989 -1 -1 -2 -2 -2 -2 C W Dec 0.53 0.39 0.58 -0.44 -0.51 -0.641984 -2 2 2 2 2 2 N W
1982 -2 1 2 2 2 2 N N
1993 -2 2 2 -1 2 -1 N WAvg July
1998 2 2 1 2 2 2 W N
1990 1 -1 -1 -2 -2 -2 N C
1981 1 -2 2 2 2 2 N N
1984 1 2 2 2 2 2 N W
1997 -1 2 -2 -1 -1 1 N N
1986 -2 1 -2 -2 -2 -1 N N
1999 -1 -2 -1 -1 1 2 C WAvg August
1998 2 -2 2 2 2 2 W N
1994 2 -2 -2 -2 -2 -2 N N
1990 -2 -1 1 -1 -1 -2 N C
1985 -2 -2 -1 1 -1 2 N N
1993 -2 -1 -2 1 -2 -1 N W
1989 -2 2 -2 -2 -2 -2 C W
1988 1 -1 -2 1 -2 -2 W W
Low June1980 -2 -1 -2 1 2 -1 N N
1997 -1 2 1 2 1 1 N N
1990 1 1 -1 -2 -2 -2 N C
1995 -2 2 2 2 2 -1 N N
1983 -2 2 2 2 2 2 W N
1991 -1 1 -2 -1 -1 -2 N N
1998 -2 2 2 2 2 2 W NLow July
1980 1 2 2 1 2 -1 N N
1995 -2 1 -2 2 2 -1 N N
1987 -2 2 -2 1 1 -2 W N
1992 -2 1 -2 -2 -2 -2 W N
1983 -2 -1 2 2 2 2 W N
1982 -2 2 1 2 2 2 N N
1993 -2 -1 -2 -2 -1 -1 N WLow August
1995 1 -2 2 1 2 1 N N
1980 -2 -2 2 2 2 1 N N
1997 1 2 1 -2 -1 1 N N
1987 -2 -1 -2 -2 -1 -2 W N
1982 2 2 2 2 2 2 N N
1984 1 2 2 2 2 2 N W
1983 1 2 1 2 2 2 W N
Correlations with SG01-12
Southern RockiesHigh June T P SM01 SM03 SM06 SM12 ENSO ENSO-1
1994 2 -2 -2 -2 -2 -2 N N
1996 2 2 2 -2 -2 -2 N N Correlations with SG011990 2 -2 -2 -2 -2 -2 N C T01 T03 T06 T12 P01 P03 P06 P121989 1 -2 -1 -2 -2 -2 C W Jan 0.26 0.11 -0.06 0.03 -0.46 -0.30 -0.13 -0.221995 -2 -1 -1 -1 1 -1 N N Feb 0.01 -0.04 -0.06 -0.12 -0.48 -0.21 -0.27 -0.272000 2 2 2 1 -2 -2 C W Mar -0.34 0.10 0.04 -0.22 -0.31 -0.01 -0.40 -0.231981 2 2 2 1 1 1 N N Apr 0.53 0.37 0.32 0.20 -0.09 -0.33 -0.64 -0.66
High July May 0.25 0.26 -0.02 -0.01 -0.31 -0.54 -0.22 -0.151980 2 -2 2 1 2 -2 N N Jun 0.58 0.62 0.56 0.41 -0.29 -0.45 -0.58 -0.551994 2 -2 -2 -2 -2 -2 N N Jul 0.69 0.40 0.03 -0.04 -0.51 -0.62 -0.48 -0.431982 -1 -1 -1 2 1 2 N N Aug 0.57 0.56 0.34 0.38 -0.35 -0.66 -0.57 -0.572000 2 -2 -2 -1 -2 -2 C W Sep 0.47 0.45 0.30 0.35 -0.17 -0.52 -0.49 -0.481998 2 2 -1 -2 -1 1 W N Oct 0.04 0.21 -0.13 -0.13 -0.24 -0.38 -0.52 -0.201989 1 1 -1 -2 -2 -2 C W Nov 0.45 0.24 0.33 0.41 -0.60 -0.47 -0.65 -0.731984 1 1 2 2 -1 1 N W Dec
High August
2000 2 -2 -2 1 -2 -2 C W Correlations with SG01-121980 -1 -1 -2 -2 1 -2 N N SG/T01 SG/T03 T06 SG/T12 SG/P01 SG/P03 SG/P06 SG/P121995 2 -2 -2 -2 -2 -1 N N Jan 0.26 0.35 0.52 0.62 -0.46 -0.48 -0.26 -0.571994 2 1 -2 -2 -2 -2 N N Feb 0.01 0.18 0.44 0.63 -0.48 -0.42 -0.50 -0.551996 1 -2 -2 -2 -2 -1 N N Mar -0.34 0.30 0.50 0.62 -0.31 -0.40 -0.70 -0.551993 -2 2 -1 -1 -1 1 N W Apr 0.53 0.50 0.37 0.56 -0.09 -0.44 -0.64 -0.571984 1 1 2 2 1 1 N W May 0.25 0.44 0.27 0.53 -0.31 -0.45 -0.39 -0.64
Jun 0.58 0.61 0.58 0.52 -0.29 -0.50 -0.64 -0.72Avg June Jul 0.69 0.59 0.51 0.39 -0.51 -0.73 -0.73 -0.72
1993 -1 -2 1 -1 2 1 N W Aug 0.57 0.68 0.58 0.42 -0.35 -0.76 -0.68 -0.881985 2 -1 -2 -1 1 2 N N Sep 0.47 0.70 0.68 0.43 -0.17 -0.61 -0.63 -0.781991 -2 1 -2 -2 -2 -1 N N Oct 0.04 0.24 0.59 0.34 -0.24 -0.12 -0.64 -0.721980 2 -2 -2 -1 1 -2 N N Nov 0.45 -0.01 0.36 0.37 -0.60 -0.26 -0.57 -0.601984 -2 2 2 1 -1 1 N W Dec 0.29 0.38 0.50 -0.54 -0.46 -0.571997 -1 1 -2 2 1 -1 N N
1982 -2 -2 -1 2 2 2 N NAvg July
1993 -1 -2 -2 -1 1 1 N W
1997 -2 1 -2 1 1 -1 N N
1985 2 -1 1 -2 -1 2 N N
1983 1 1 -1 2 2 2 W N
1987 -2 -2 -2 2 2 2 W N
1990 -2 2 2 -2 -2 -2 N C
1996 2 -2 1 -1 -2 -2 N NAvg August
1992 -2 2 1 -2 2 1 W N
1981 -1 -1 -1 2 2 2 N N
1983 2 -2 2 2 2 2 W N
1982 2 2 2 -1 2 2 N N
1985 1 -2 -1 -1 1 2 N N
1986 2 1 2 2 2 2 N N
1998 2 -2 -1 -2 -2 1 W N
Low June1998 -2 -2 -2 -2 1 1 W N
1983 -2 1 2 2 2 2 W N
1986 1 2 2 2 2 2 N N
1987 -1 1 2 2 2 2 W N
1988 1 2 -1 2 2 2 W W
1992 -2 -1 -1 2 2 2 W N
1999 -1 2 -1 -2 -2 -2 C WLow July
1981 2 2 2 2 2 2 N N
1992 -2 2 -2 -1 2 1 W N
1991 -2 1 -1 -2 -2 -1 N N
1995 -1 -2 -2 -2 -1 -1 N N
1988 -1 2 2 2 2 2 W W
1999 -2 2 2 -1 -2 -2 C W1986 -2 2 2 2 2 2 N N
Low August1997 1 1 -2 -2 -1 -2 N N
1990 -2 2 1 -1 -1 -2 N C
1987 -2 2 -2 -2 2 2 W N
1991 -1 1 2 -1 -2 -1 N N
1989 -2 -2 2 -1 -2 -2 C W
1988 -2 2 -1 2 2 2 W W
1999 -2 2 2 2 -1 -2 C W
Southwest
High June T P SM01 SM03 SM06 SM12 ENSO ENSO-1
1995 -2 1 2 1 2 1 N N Correlations with SG011988 1 2 1 2 1 -1 W W T01 T03 T06 T12 P01 P03 P06 P121981 2 2 2 1 1 2 N N Jan 0.56 0.66 0.62 0.34 -0.60 -0.80 -0.78 -0.591994 2 -2 -2 -1 -1 1 N N Feb 0.21 0.41 0.49 0.22 -0.59 -0.81 -0.76 -0.581996 2 -2 -2 -2 -2 -2 N N Mar 0.57 0.41 0.50 0.29 -0.83 -0.82 -0.71 -0.661987 1 2 -1 2 1 1 W N Apr 0.66 0.75 0.58 0.45 -0.59 -0.43 -0.45 -0.481993 -2 -2 2 1 2 2 N W May 0.59 0.43 0.35 0.19 -0.22 -0.34 -0.14 -0.08
High July Jun 0.46 0.28 0.44 0.32 0.19 0.21 -0.05 -0.171994 2 -2 -2 -2 -2 1 N N Jul 0.67 0.21 0.16 0.10 -0.27 -0.33 -0.24 -0.131989 2 -2 -2 -2 -2 -2 C W Aug 0.55 0.47 0.46 0.42 -0.39 -0.73 -0.48 -0.241980 1 1 2 2 2 2 N N Sep 0.46 0.44 0.33 0.27 -0.29 -0.55 -0.58 -0.381985 2 2 2 1 -1 1 N N Oct 0.42 0.58 0.12 0.07 -0.26 -0.65 -0.69 -0.131996 2 -1 1 -2 -1 -2 N N Nov 0.58 0.53 0.44 0.31 -0.61 -0.71 -0.53 -0.291995 1 -2 -2 1 2 1 N N Dec 0.35 0.57 0.46 0.41 -0.56 -0.74 -0.61 -0.591988 2 -2 2 2 1 1 W W
High August Correlations with SG01-122000 2 2 1 1 -2 -2 C W SG/T01 SG/T03 T06 SG/T12 SG/P01 SG/P03 SG/P06 SG/P121994 2 -2 -2 -2 -2 -1 N N Jan 0.56 0.46 0.49 0.71 -0.60 -0.63 -0.52 -0.601993 -2 1 1 2 1 2 N W Feb 0.21 0.51 0.67 0.75 -0.59 -0.71 -0.53 -0.601995 2 -1 2 1 2 1 N N Mar 0.57 0.58 0.69 0.78 -0.83 -0.78 -0.63 -0.611996 2 -2 1 -1 -2 -2 N N Apr 0.66 0.76 0.67 0.75 -0.59 -0.70 -0.70 -0.611992 1 2 1 -2 2 2 W N May 0.59 0.66 0.63 0.72 -0.22 -0.59 -0.45 -0.611986 2 2 -2 1 1 1 N N Jun 0.46 0.48 0.67 0.66 0.19 -0.03 -0.36 -0.54
Jul 0.67 0.49 0.63 0.52 -0.27 -0.42 -0.62 -0.50Avg June Aug 0.55 0.62 0.64 0.53 -0.39 -0.80 -0.71 -0.46
1986 2 1 2 2 1 2 N N Sep 0.46 0.49 0.62 0.50 -0.29 -0.76 -0.71 -0.472000 2 1 2 -2 -2 -2 C W Oct 0.42 0.42 0.58 0.48 -0.26 -0.52 -0.77 -0.481999 -1 2 -1 -2 -2 -2 C W Nov 0.58 0.42 0.48 0.52 -0.61 -0.66 -0.76 -0.471992 -2 -1 -1 2 2 2 W N Dec 0.35 0.58 0.38 0.64 -0.56 -0.74 -0.70 -0.601980 -1 1 -2 2 2 2 N N
1985 2 -1 -1 -2 -1 1 N N
1984 -1 2 2 1 -2 1 N WAvg July
1981 1 2 2 2 2 2 N N
1997 -1 1 -2 -2 -2 -2 N N
2000 2 -2 -1 -1 -2 -2 C W
1991 -2 -2 2 1 -1 -2 N N
1983 -2 -1 2 2 2 2 W N
1998 2 2 -1 -1 2 1 W N1984 -1 2 2 2 -2 1 N W
Avg August1980 -1 -2 2 2 2 2 N N
1991 -1 -1 2 2 1 -2 N N
1981 1 -2 2 2 2 2 N N
1998 2 1 2 1 2 2 W N
1987 -2 -2 -2 -2 1 -1 W N
1990 -2 1 -2 -2 -2 -2 N C
1997 2 1 -2 -2 -2 -2 N N
Low June1989 1 -2 -2 -2 -2 -2 C W
1990 2 2 -2 -2 -2 -2 N C
1982 -2 -2 -1 2 2 2 N N
1997 -1 -2 -1 -1 -2 -2 N N
1983 -2 -2 2 2 2 2 W N
1998 -2 1 -2 1 2 1 W N1991 -2 2 -2 -2 -1 -2 N N
Low July1990 -1 2 1 -2 -2 -2 N N
1987 -2 -1 -2 -2 1 -1 W N
1992 -2 1 -2 -1 2 2 W N
1982 -2 1 1 2 2 2 N N
1993 -2 -2 -2 1 1 2 N W
1999 -1 2 1 -2 -2 -2 C W
1986 -2 2 1 2 1 2 N NLow August
1985 1 -2 2 2 -1 1 N N
1989 -2 -2 -2 -2 -2 -2 C W
1988 -2 2 1 2 1 1 W W
1983 -2 2 1 1 2 2 W N
1982 -1 2 -1 -1 2 2 N N
1984 -2 2 2 2 1 1 N W
1999 1 1 -2 -2 -2 -2 C W
Central Rockies
High June T P SM01 SM03 SM06 SM12 ENSO ENSO-1
1981 2 -2 1 -1 2 2 N N Correlations with SG011996 2 1 2 -1 1 2 N N T01 T03 T06 T12 P01 P03 P06 P121988 2 -2 -1 1 -2 -2 W W Jan -0.07 0.56 0.23 -0.07 -0.09 -0.43 -0.26 -0.141994 2 -2 -2 -2 -2 -2 N N Feb 0.23 0.42 0.12 -0.14 0.09 -0.30 0.011980 2 -2 -2 -1 1 1 N N Mar 0.20 0.30 0.19 0.26 -0.66 -0.64 -0.44 -0.192000 1 -2 -2 -2 -2 -2 C W Apr 0.63 0.46 0.37 0.52 -0.67 -0.58 -0.65 -0.541990 2 -2 -2 -2 -2 -2 N C May 0.69 0.47 0.15 0.21 -0.43 -0.67 -0.51 -0.37
High July Jun 0.71 0.81 0.47 0.46 -0.72 -0.68 -0.62 -0.781994 2 -2 -2 -2 -2 -2 N N Jul 0.41 0.55 0.13 0.08 -0.54 -0.71 -0.66 -0.541980 2 -2 -1 -1 -1 1 N N Aug 0.15 0.35 0.55 0.43 -0.57 -0.68 -0.49 -0.431997 -2 1 -2 -1 2 2 N N Sep 0.43 0.30 0.54 0.31 -0.48 -0.69 -0.63 -0.512000 2 -2 -2 -2 -2 -2 C W Oct 0.64 0.28 0.19 -0.04 -0.52 -0.66 -0.34 -0.221989 2 -2 -2 -2 -2 -2 C W Nov 0.43 0.44 0.47 0.27 -0.43 -0.70 -0.52 -0.501985 1 2 2 1 -2 1 N N Dec 0.24 0.13 0.18 -0.02 -0.36 -0.13 0.161988 2 -2 2 2 -1 -2 W W
High August
2000 2 1 -1 -2 -2 -2 C W Correlations with SG01-121996 2 -2 1 2 2 2 N N SG/T01 SG/T03 T06 SG/T12 SG/P01 SG/P03 SG/P06 SG/P121994 2 1 -2 -2 -2 -2 N N Jan -0.07 0.59 0.37 0.70 -0.09 -0.33 -0.57 -0.771980 -2 -2 2 -2 1 1 N N Feb 0.23 0.25 0.75 -0.14 -0.33 -0.64 -0.781986 1 1 -1 -1 1 -1 N N Mar 0.20 0.30 0.26 0.80 -0.66 -0.37 -0.37 -0.781995 2 -2 -1 2 2 1 N N Apr 0.63 0.43 0.26 0.72 -0.67 -0.52 -0.58 -0.781985 1 -2 -2 -1 -1 -1 N N May 0.69 0.52 0.27 0.62 -0.43 -0.56 -0.58 -0.70
Jun 0.71 0.80 0.49 0.63 -0.72 -0.71 -0.68 -0.63Jul 0.41 0.78 0.45 0.43 -0.54 -0.79 -0.86 -0.74
Avg June Aug 0.15 0.52 0.68 0.44 -0.57 -0.88 -0.83 -0.781992 -1 2 -1 -2 -1 -1 W N Sep 0.43 0.27 0.76 0.46 -0.48 -0.66 -0.82 -0.731989 -2 -1 -2 -2 -2 -2 C W Oct 0.64 0.28 0.66 0.45 -0.52 -0.65 -0.76 -0.721985 1 -1 -1 -2 -2 1 N N Nov 0.43 0.38 0.28 0.39 -0.43 -0.58 -0.75 -0.711993 -2 1 2 1 2 -2 N W Dec 0.48 0.20 0.46 -0.02 -0.39 -0.56 -0.671991 1 2 -2 -2 -2 -2 N N
1987 1 1 2 2 1 2 W N
1986 2 2 1 1 -1 -1 N NAvg July
1982 -1 2 -1 2 2 2 N N
1993 -2 -2 -2 -2 1 -1 N W
1996 2 -2 2 1 2 2 N N
1981 1 2 2 2 2 2 N N
1998 2 2 2 1 1 1 W N
1990 -2 2 -1 -2 -2 -2 N C
1987 -2 -1 -2 2 1 2 W NAvg August
1992 -2 1 -2 -2 -2 -2 W N
1993 -2 2 -1 -1 -2 -1 N W
1990 -1 -2 -2 -2 -2 -2 N C
1981 1 1 2 2 2 2 N N
1998 1 -2 2 2 2 2 W N
1987 -2 2 -2 -1 1 1 W N
1988 1 1 -2 -1 -2 -2 W W
Low June1999 -1 2 -2 -1 1 1 C W
1982 -2 -2 2 2 2 2 N N
1984 -2 2 2 2 2 2 N W
1997 1 1 1 2 2 2 N N
1998 -2 1 -1 2 1 1 W N
1995 -2 2 2 2 2 -1 N N
1983 -2 2 2 2 2 2 W NLow July
1992 -2 2 -2 -2 -2 -1 W N
1995 -2 1 -1 2 2 1 N N
1991 -1 1 -1 -2 -2 -2 N N
1984 1 2 2 2 2 2 N W
1999 1 -1 1 -1 -1 1 C W
1983 -1 1 2 2 2 2 W N
1986 -2 1 -1 -1 1 -2 N NLow August
1989 -2 -2 -2 -2 -2 -2 C W
1983 2 2 2 2 2 2 W N
1997 -2 2 1 -2 1 2 N N
1984 2 2 2 2 2 2 N W
1991 1 1 2 1 -1 -2 N N
1982 2 2 2 2 2 2 N N
1999 -2 2 1 -1 -1 1 C W
0 400 800 1200 1600 2000 2400 2800 3200 3400 m
Elevation
Mask
Northern Rockies
Southwest
Central Rockies
Southern Rockies
Great Basin
SierraNevada
PNW Interior
High June T P SM01 SM03 SM06 SM12 ENSO ENSO-1
1987 2 1 -1 -2 -1 1 W N Correlations with SG011992 2 2 -1 -2 -2 -2 W N T01 T03 T06 T12 P01 P03 P06 P121985 2 -2 -2 -2 -1 -2 N N Jan 0.61 0.32 0.39 0.13 -0.11 -0.37 -0.42 -0.401988 2 1 1 1 2 -2 W W Feb 0.59 0.30 0.27 0.17 -0.65 -0.35 -0.46 -0.311986 2 -2 -2 -2 -2 1 N N Mar 0.65 0.45 0.44 0.42 -0.19 -0.52 -0.60 -0.661982 1 2 2 2 2 2 N N Apr 0.68 0.70 0.52 0.33 -0.50 -0.63 -0.67 -0.522000 2 -2 -2 -2 -1 -2 C W May 0.84 0.75 0.54 0.43 -0.27 -0.63 -0.66 -0.46
High July Jun 0.64 0.40 0.30 0.26 -0.01 -0.07 -0.19 -0.111985 2 1 2 -2 -1 2 N N Jul 0.64 0.30 0.06 0.15 0.10 -0.19 -0.20 0.051996 2 -2 1 1 -1 -2 N N Aug 0.56 0.47 0.22 0.43 -0.37 -0.22 0.22 -0.041994 2 -2 -2 -2 -2 -2 N N Sep 0.43 0.39 0.13 0.23 -0.29 -0.53 -0.29 -0.091980 -1 -1 -1 -1 2 -1 N N Oct 0.01 0.13 -0.22 -0.21 -0.61 -0.72 -0.31 -0.081983 -2 2 2 2 2 2 W N Nov -0.08 -0.18 -0.25 -0.20 -0.24 -0.33 -0.26 -0.021989 1 -2 1 -2 -2 -2 C W Dec1995 -1 2 -2 -2 -2 -2 N N
High August
1999 1 2 1 -2 -1 -1 C W Correlations with SG01-121996 2 -2 2 1 1 -2 N N SG/T01 SG/T03 T06 SG/T12 SG/P01 SG/P03 SG/P06 SG/P121986 2 -1 -1 -2 -2 1 N N Jan 0.30 0.28 0.45 -0.33 0.15 -0.121984 1 2 2 2 2 2 N W Feb 0.61 0.54 0.32 -0.11 -0.03 -0.201981 2 -1 2 2 2 2 N N Mar 0.59 0.30 0.33 0.22 -0.65 -0.37 -0.24 -0.101991 2 -1 2 1 2 -1 N N Apr 0.65 0.60 0.59 0.13 -0.19 -0.55 -0.62 -0.061992 2 -2 1 1 -2 -2 W N May 0.68 0.75 0.57 0.23 -0.50 -0.66 -0.73 -0.19
Jun 0.84 0.77 0.56 0.40 -0.27 -0.62 -0.70 -0.22Avg June Jul 0.64 0.75 0.71 0.43 -0.01 -0.26 -0.46 -0.30
1994 1 -2 -2 -2 -2 -2 N N Aug 0.64 0.66 0.59 0.58 0.10 -0.50 -0.62 -0.411996 1 -2 -1 -1 -2 -2 N N Sep 0.56 0.51 0.43 0.57 -0.37 -0.20 -0.49 -0.401999 -1 -1 -2 -1 -1 1 C W Oct 0.43 0.32 0.38 0.57 -0.29 -0.15 -0.36 -0.341981 -1 1 1 2 -2 1 N N Nov 0.01 0.74 0.46 0.55 -0.61 -0.31 -0.13 -0.361997 -1 2 1 -1 -1 2 N N Dec -0.08 0.61 0.43 0.55 -0.24 -0.08 0.11 -0.281983 -2 -1 2 1 1 2 W N
1989 2 -2 -2 -2 -2 -2 C WAvg July
1997 -2 1 1 1 -1 1 N N
1998 2 1 -2 2 2 2 W N
2000 1 -1 -2 -2 -2 -2 C W
1984 1 2 2 2 2 2 N W
1990 2 1 -1 2 2 1 N C
1991 2 -2 2 2 2 -1 N N
1992 -1 2 2 -1 -2 -2 W NAvg August
1990 1 2 -1 2 2 1 N C
1998 2 -2 2 2 2 2 W N
1982 -1 -1 1 2 2 2 N N
1988 -2 -2 -2 1 1 -2 W W
1987 -2 -1 -1 1 -1 2 W N
1997 1 2 1 1 -1 1 N N
1989 -2 2 -2 -2 -2 -2 C W
Low June1990 -1 -2 2 2 2 1 N C
1984 -2 2 2 2 2 2 N W
1980 -2 1 2 2 2 -1 N N
1995 -2 2 1 -1 -2 -2 N N
1998 -2 1 2 2 2 2 W N
1991 -2 2 -2 2 1 -1 N N
1993 -2 2 2 1 2 2 N WLow July
1987 -2 2 2 -1 -1 2 W N
1981 -1 -2 1 2 -2 1 N N
1988 2 -2 -1 1 1 -2 W W
1982 -2 2 2 2 2 2 N N
1986 -2 -1 -2 -2 -2 1 N N
1999 -2 -2 -2 -2 -1 1 C W
1993 -2 -2 -2 -1 -1 2 N WLow August
2000 1 -2 -2 -2 -2 -2 C W
1983 1 2 2 2 1 2 W N
1994 -2 -2 -2 -2 -2 -2 N N
1980 -2 -2 2 2 2 -1 N N
1993 -2 2 -2 -1 -2 1 N W
1985 -2 -1 -2 -2 -1 2 N N
1995 -2 -1 -2 -2 -2 -2 N N
Northern Rockies
High June T P SM01 SM03 SM06 SM12 ENSO ENSO-1
1988 2 -2 -2 -2 -2 -2 W W Correlations with SG011992 2 2 -1 -2 -2 -2 W N T01 T03 T06 T12 P01 P03 P06 P121994 2 -1 -2 -2 -2 -2 N N Jan -0.03 0.35 0.31 0.21 -0.32 -0.47 -0.40 -0.111985 1 -2 -2 -2 -2 1 N N Feb 0.14 0.17 0.18 -0.19 -0.28 0.14 0.151986 2 -1 -2 -1 -1 -1 N N Mar 0.40 0.41 0.52 0.42 -0.64 -0.42 -0.38 0.121987 2 -2 -2 -2 -2 -1 W N Apr 0.66 0.44 0.30 0.16 -0.53 -0.58 -0.63 -0.322000 1 -2 -2 -2 -2 -2 C W May 0.64 0.47 0.30 0.00 -0.17 -0.35 -0.46 -0.13
High July Jun 0.86 0.76 0.53 0.28 -0.47 -0.55 -0.61 -0.551994 2 -2 -2 -2 -2 -2 N N Jul 0.73 0.60 0.37 0.44 -0.67 -0.72 -0.74 -0.712000 2 -1 -2 -2 -2 -2 C W Aug 0.70 0.70 0.46 0.64 -0.69 -0.74 -0.55 -0.501989 2 -1 1 -1 -2 -2 C W Sep 0.67 0.64 0.53 0.73 -0.62 -0.61 -0.35 -0.361985 2 -2 1 -2 -2 1 N N Oct 0.47 0.31 0.30 0.38 -0.57 -0.66 -0.32 -0.431988 2 -2 -2 -2 -2 -2 W W Nov 0.71 0.62 0.30 0.39 -0.31 -0.73 -0.22 -0.161996 2 -2 1 2 2 2 N N Dec 0.14 0.46 0.26 0.10 -0.25 -0.36 -0.22 -0.121981 -1 -2 -2 2 2 2 N N
High August Correlations with SG01-121981 2 -2 2 1 2 2 N N SG/T01 SG/T03 T06 SG/T12 SG/P01 SG/P03 SG/P06 SG/P121996 1 -2 1 1 2 2 N N Jan -0.03 0.58 0.17 0.42 -0.32 -0.15 -0.30 -0.612000 2 -2 1 -2 -2 -2 C W Feb 0.14 0.23 0.35 -0.19 -0.20 -0.39 -0.581994 2 -2 -2 -2 -2 -2 N N Mar 0.40 0.38 0.36 0.29 -0.64 -0.50 -0.41 -0.521991 2 -1 1 -2 -1 -1 N N Apr 0.66 0.46 0.31 0.12 -0.53 -0.53 -0.58 -0.481988 1 -2 -2 -2 -2 -2 W W May 0.64 0.57 0.45 0.12 -0.17 -0.56 -0.78 -0.661999 2 2 1 -1 1 1 C W Jun 0.86 0.80 0.55 0.18 -0.47 -0.56 -0.68 -0.50
Jul 0.73 0.74 0.55 0.16 -0.67 -0.76 -0.78 -0.65Avg June Aug 0.70 0.81 0.69 0.59 -0.69 -0.87 -0.80 -0.78
1996 2 -2 1 2 2 2 N N Sep 0.67 0.64 0.68 0.63 -0.62 -0.83 -0.83 -0.821989 2 -2 -1 -1 -2 -2 C W Oct 0.47 0.56 0.62 0.66 -0.57 -0.65 -0.80 -0.801983 -1 2 2 1 1 2 W N Nov 0.71 0.64 0.49 0.58 -0.31 -0.59 -0.80 -0.751982 -1 1 2 2 2 2 N N Dec 0.14 0.58 0.35 0.51 -0.25 -0.43 -0.63 -0.681991 -2 2 -2 -2 1 -1 N N
1980 -1 1 2 -1 1 -2 N N
1999 -2 1 1 2 1 1 C WAvg July
1990 1 -1 -2 1 1 -1 N C
1991 1 -2 1 1 1 -1 N N
1999 -2 -2 -2 1 -1 1 C W
1992 -2 2 2 1 -1 -2 W N
1986 -2 1 -2 -2 -2 -1 N N
1998 2 2 2 2 2 2 W N
1987 -2 2 2 -2 -2 1 W NAvg August
1998 2 -2 2 2 2 2 W N
1992 -2 -2 1 2 -1 -2 W N
1986 1 1 -1 -2 -2 -2 N N
1984 1 2 2 2 2 2 N W
1990 1 2 -2 -1 1 -1 N C
1985 -2 1 -2 -2 -2 -1 N N
1989 -2 2 -2 -2 -1 -2 C WLow June
1990 -1 -2 1 2 2 1 N C
1993 -2 2 1 -1 -1 1 N W
1984 -2 1 2 2 2 2 N W
1995 -2 2 1 1 1 -2 N N
1997 -1 2 2 2 2 2 N N
1981 -2 1 2 1 2 2 N N
1998 -2 2 2 2 2 2 W NLow July
1980 1 -1 1 1 -1 -2 N N
1984 1 1 2 2 2 2 N W
1983 -2 2 2 2 1 2 W N
1995 -1 2 1 1 2 -2 N N
1982 -1 1 2 2 2 2 N N
1997 -2 2 2 2 2 2 N N
1993 -2 2 1 -1 -1 -1 N WLow August
1982 1 -1 1 2 2 2 N N
1983 2 2 2 2 2 2 W N
1980 -2 1 2 2 1 -1 N N
1997 1 2 2 2 2 2 N N
1995 -2 -1 -2 1 1 -1 N N
1987 -2 1 2 1 -2 1 W N
1993 -2 2 -2 -1 -2 -2 N W
Pacific Coast
High June T P SM01 SM03 SM06 SM12 ENSO ENSO-1
1992 2 1 -1 -1 -2 2 W N Correlations with SG011982 2 1 -2 -2 -2 2 N N T01 T03 T06 T12 P01 P03 P06 P121987 2 -2 1 1 1 2 W N Jan -0.17 -0.24 -0.29 -0.25 -0.62 -0.36 -0.34 -0.331986 2 -2 -2 -2 -1 1 N N Feb 0.23 -0.31 -0.08 0.28 -0.37 -0.33 -0.44 -0.461995 1 2 1 1 1 -1 N N Mar 0.16 -0.04 0.09 0.17 -0.54 -0.18 -0.37 -0.381991 -2 -2 -2 -2 -2 -2 N N Apr 0.43 -0.19 -0.12 -0.17 -0.47 -0.38 -0.39 -0.351985 2 1 -2 -2 -2 1 N N May 0.49 0.36 0.29 0.16 -0.73 -0.46 -0.22 -0.21
High July Jun 0.59 0.31 0.37 0.18 -0.30 -0.45 -0.23 -0.181985 2 -2 -2 -2 -2 1 N N Jul 0.84 0.48 0.39 0.26 -0.38 -0.44 -0.62 -0.451994 2 -2 1 1 1 -2 N N Aug 0.30 0.21 0.35 0.34 -0.26 -0.40 -0.34 -0.281992 2 2 2 1 1 -2 W N Sep 0.58 0.53 0.47 0.34 -0.61 -0.58 -0.29 -0.561995 2 2 1 1 1 -1 N N Oct 0.56 0.38 0.32 0.13 -0.61 -0.71 -0.59 -0.631990 2 1 1 2 2 -1 N C Nov 0.28 0.40 0.29 0.19 -0.43 -0.49 -0.40 -0.171991 1 -2 1 -2 -2 -2 N N Dec -0.11 0.07 0.09 -0.06 -0.40 -0.23 -0.25 -0.281998 2 1 -2 1 1 2 W N
High August Correlations with SG01-121987 1 -2 2 1 1 2 W N SG/T01 SG/T03 T06 SG/T12 SG/P01 SG/P03 SG/P06 SG/P121988 -1 -1 2 2 2 -2 W W Jan -0.17 0.23 -0.05 0.23 -0.62 -0.33 -0.56 -0.481992 2 -1 1 1 1 -2 W N Feb 0.23 -0.13 0.08 0.31 -0.37 -0.49 -0.60 -0.521999 1 2 -1 -2 -2 -2 C W Mar 0.16 -0.05 0.23 0.30 -0.54 -0.41 -0.58 -0.451990 2 2 2 2 2 -1 N C Apr 0.43 -0.03 0.16 0.20 -0.47 -0.58 -0.56 -0.401983 1 2 2 2 2 2 W N May 0.49 0.36 0.07 0.21 -0.73 -0.60 -0.51 -0.371986 2 -2 -2 -2 -2 1 N N Jun 0.59 0.41 0.29 0.13 -0.30 -0.51 -0.28 -0.47
Jul 0.84 0.59 0.50 0.23 -0.38 -0.71 -0.58 -0.62Avg June Aug 0.30 0.63 0.50 0.27 -0.26 -0.33 -0.56 -0.57
1989 2 -2 -2 -2 -2 -2 C W Sep 0.58 0.55 0.52 0.36 -0.61 -0.47 -0.53 -0.611983 -1 1 1 -1 1 2 W N Oct 0.56 0.37 0.50 0.34 -0.61 -0.64 -0.53 -0.631994 -1 -2 1 1 1 2 N W Nov 0.28 0.25 0.30 0.22 -0.43 -0.50 -0.37 -0.661984 -2 2 2 2 2 2 N W Dec -0.11 0.25 0.06 0.26 -0.40 -0.38 -0.24 -0.421997 1 2 2 1 1 1 N N
1981 -2 2 2 2 2 2 N N
2000 2 1 2 2 2 -2 C WAvg July
1987 -2 1 1 1 1 2 W N
1984 1 -2 1 2 2 2 N W
1997 1 2 2 2 2 1 N N
1996 2 1 -2 -2 -2 -1 N N
1988 1 -2 2 2 2 -2 W W
1980 -1 -2 2 1 1 -1 N N
1999 -2 -1 -2 -2 -2 -2 C WAvg August
1994 1 -2 -2 1 1 -2 N N
1996 2 -2 -2 -2 -2 -1 N N
1998 2 -2 1 1 1 2 W N
1989 -2 -2 1 -2 -2 -2 C W
1984 -2 -2 2 2 2 2 N W
1993 1 -1 -2 2 2 2 N W
1982 -2 -1 1 -2 -2 1 N N
Low June1996 -2 -2 -2 -2 -2 -1 N N
1980 -2 1 1 1 -1 -1 N N
1990 1 2 2 2 2 -1 N C
1998 1 -2 1 2 2 2 W N
1999 -2 1 -2 -2 -2 -2 C W
1988 -2 2 2 2 2 -2 W W
1993 1 2 2 2 2 2 N WLow July
2000 -1 -1 -2 2 1 -2 C W
1982 -2 2 2 -2 -2 2 N N
1989 -2 1 1 -2 -2 -2 C W
1981 -1 -2 2 2 2 2 N N
1986 -2 2 -2 -2 -2 1 N N
1983 -2 2 2 1 2 2 W N
1993 -2 2 -2 2 2 2 N WLow August
2000 -2 -1 1 1 1 -2 C W
1981 2 -2 2 2 2 2 N N
1991 1 2 -2 -2 -2 -2 N N
1980 -2 -1 -2 -2 -2 -1 N N
1985 -2 1 -2 -2 -2 1 N N
1995 -2 2 -1 1 1 -1 N N
1997 2 2 2 2 2 2 N N
Pacific Northwest
CoastInterior
PNW
Rank and correlations for the 8 regions of the West
Figure 21. Map showing comparison of the ranking and correlation tables for the 8 regions. This display is intended to contrast the regions using patterns of color. In general, dark orange indicates high fire, warm air temperatures, low precipitation, and low soil moisture, whereas dark blue indicates opposite conditions. The first order similarities and dissimilarities among the regions are apparent and intuitive, e.g., wildfire conditions in the Rocky Mountain region are highly dependent on temperature and moisture conditions. Counterintuitive patterns are displayed in the Southwest where high fire years are associated with warm temperatures but wetter ranked conditions indicating the influence of high moisture levels on fuel supply and the association of lightning strikes with the summer monsoon.
26 Atlas of Climatic Controls of Wildfire in the Western United States

as an alternative to the Palmer Drought Severity Index (PDSI) to describe long-term precipitation anomalies and drought indica-tors in a way that allows comparisons to be made across different climate regions among which the underlying statistical distribu-tions of precipitation may vary widely (e.g. from negative-expo-nential distributions with many zeros to Gaussian-like symmetric distributions). Use of the SPI thus avoids serious, underlying questions associated with the computation, interpretation, and regionalization of the PDSI (Guttman, 1998, 1999).
Conceptually, the SPI is determined by first fitting a gamma distribution to the raw data, then calculating the cumulative density function (CDF) ordinate (i.e. probability) values for those data, and then calculating Gaussian (normal) probability density functions (PDF) abscissa values for the CDF-ordinate values. The computed standardized gamma value (SGI, or SPI in the case of precipitation) is thus a number with values that range between -3 and +3 that can be interpreted as standardized deviations from the long-term mean for a particular month or season (or z-scores) (Fig. 15). By generalizing the SPI method to compute SGI of fire and climate variables, the data are put onto a common scale of deviation that is independent of data type and its underlying distribution and units, thus allowing direct comparison and cor-relation among variables.
Another highly desirable strength of the SGI method lies in the ease with which index values spanning any specified run of months (e.g., over 1, 6, 12, 24, 48 months) can be computed. The 1-month index is simply a measure, in standard deviations, of how much the given month departs from the average or normal value of all other like months (e.g. how much the August, 1988 fire frequency departs from the average of all August fire fre-quencies in the record). The 3-month index indicates how much a given three-month span, e.g., June, July, August, 1988, departs from the average of all other June-August spans in the record, and so on. The family of indices thus underpins a straightforward approach for investigating how fire behavior depends on a range of contemporaneous and antecedent climatic conditions.
Study subregionsWe divided the western US into 8 subregions for the
monthly analysis (Fig. 16). These regions reflect important, basic climatological, topographic, ecological and wildfire char-acteristics and differences, and they are appropriate both for the spatial scale of regional climate simulations and the 1-degree, gridded fire data set.
Description of subregion graphics
We provide two graphics to summarize and compare the fire and climate data for each region. The first (Fig. 17) is a color-coded table of ranked fire and climate data for June, July, and August of the 21-year fire record. An accompanying table of correlations between the fire data and selected climate variables is also included in Fig. 17. The second and third presentations (Fig. 18 and 19) are monthly plots of correlations between the standardized lightning-started fire counts (SGI) and the standard-ized indices for temperature (STI), precipitation (SPI) and soil moisture (SMI).
The last presentation is comprised of series of maps for each region of the June, July, and August anomalies between high and normal, low and normal, and high and low fire years, together with the associated climate anomalies (Fig. 20). The map display is particularly useful for illustrating the strong association of fire frequency with climate on contemporaneous and multimonth time spans. Figure 20 illustrates the color-coded tables of ranked fire data for all subregions which provides a visual comparison of inter-regional controls of wildfire. Together, these graphics effectively portray the nature of fire-climate relations within each of the 8 regions, and they provide a wealth of information for comparing and contrasting inter-regional similarities and differ-ences.
Fire/climate rankings and correlationsTo organize the data in a meaningful way the 1980-2000
June, July and August monthly standardized fire number and climate indices for each subregion were ranked by the fire indices from the highest to lowest values, i.e. from the most positive to most negative departures from normal. The ranked fire index values, along with their associated climate variable indices, were then binned into high (upper 33%), medium (normal, middle 33%), and low (lowest 33%) terciles. For ease of interpret-ing the binned SGI values, arbitrary values of +2 and -2 were assigned to SGI values falling within the upper and lower terciles, respectively. For SGI values within the middle or normal tercile, a value of +1 was assigned to indices with positive sign; a value of -1 was assigned to indices with negative sign. This ranking and binning process resulted in a classification of high, normal, and low June, July and August wildfire numbers by year.
Correlations between standardized fire occurrence data (SGI) and CRU temperature (STI), CRU precipitation (SPI), and RegCM soil moisture (SMI) were computed for each subregion. The values and patterns of correlation provide insight into the dependence of wildfire to immediate and antecedent conditions within a subregion and facilitate inter-regional comparisons of this dependence. Additionally, the correlations suggest how persistence of fire-related climate and soil moisture anomalies might be expected to affect the primary wildfire season in a give subregion.
Wildfire and climate mapsFigure 16, which is for the Northern Rocky Mountains,
provides an annotated explanation of the ranking and correla-tion display for each of the 8 regions. The color coding in the (left-hand) ranked fire and climate table is selected so that dark orange is associated with high fire numbers and area, warm air temperatures, low precipitation, and dry soil. Dark blue is associ-ated with low fire numbers and area, cool air temperatures, high precipitation, and moist soil. Lighter shades of blue and orange are associated with conditions in the normal range, with the color indicating warm/dry normal (yellow) and cool/moist normal (light blue).
The fire numbers are grouped and ranked within each block of months, eg., the first year in the high-June block had the greatest number of fires in the 21-yr record and the last year in
Methods 27
the low-June block had the fewest number of fires in the 21-yr record. We also include information about the size of fires for each ranked month. Area information is indicated by the shading in the year and month ranked fire data cells. Orange indicates large area years (upper tercile), grey indicates normal area years (middle tercile), and blue indicates low area years (lower tercile).
There are two correlation tables in the upper right-hand-side of Fig. 17. The upper table lists the correlation between the monthly SGI01 fire number standardized index (i.e., the current month) and the 1, 3, 6, and 12-month standardized temperature and precipitation indices. Blue shading indicates correlations > 0.5 for temperature and yellow shading indicates correlations < -0.5. The lower table is similar, except that the correlations are between the 1, 3, 6, and 12 month SGI and the same spans for temperature and precipitation. The magnitude of the correlations and their patterns of persistence suggest the potential for using the variables for forecasting season-ahead fire conditions.
Figures 18 and 19 are additional plots of the correlations that depict the time dependency of wildfire occurrence on concurrent and antecedent air temperature, precipitation and soil moisture extending back to 12 months. In most regions, very few light-ning-set wildfires occur outside the primary fire season (May-September), so correlations in those months may be biased by small sample sizes and should therefore be viewed accordingly.
In the case of the Northern Rocky Mountain (NRM) sub-region, shown in Fig. 18, June through September SGI of 1, 3, and 6 month spans generally correlate above the +0.5 level with the 1, 3, and 6 month STI, indicating that relatively long-term persistence of wildfire occurrence anomalies are closely associ-ated with similar occurrence of warm temperature anomalies. Similar patterns (but with negative signs) are displayed with SGI and SPI, indicating the association between long-term wildfire occurrence and dry conditions. The dependence of SGI on soil moisture SMI, which integrates indirectly temperature and pre-cipitation (Fig. 19), also displays time-dependant structure to the various time periods. Both the pattern and the magnitude of the SGI correlatons with STI, SPI, and SMI vary among the subre-gions indicating the underlying climatic and ecological controls of wildfire within the regions.
Figure 20 provides an annotated explanation of the June, July, and August mapped anomalies of the fire and climate vari-ables. The three panels display the anomalies between high and normal fire years, low and normal fire years, and high and low fire years. Here again, the colors of the anomalies are selected so that reds and oranges indicate high fires and warm, dry condi-tions whereas blue colors indicate low fires and cool and moist conditions.
The suite of climate variables presented was selected as the smallest set that depicts the link between the atmosphere and wildfire. The 500 hPa height plots indicate atmospheric circulation in the mid-troposphere. Higher heights or ridges, are analogous to hills in a topographic map, and indicate a tendency for blocking storm tracks and precipitation in winter and a ten-dency for producing sinking air masses in summer which produce warm, dry air that favor fire conditions (e.g., Skinner et al., 1999). Persistence of winter and spring ridges leads to reduced occurrence of Pacific storms and drier conditions at the onset of the summer fire season. Lower heights, or troughs, are associ-ated with more frequent storms in winter and spring and lead to wetter conditions at the onset of the summer fire season. During
summer, ridges are associated with rising, unstable conditions that often produce precipitation. Interactions between ridges and troughs are important for producing summertime convection and lightning (Rorig and Ferguson, 1999, 2002).
Sea level pressure (SLP) is closely linked with 500 hPa height. High pressure at the surface, as a result of sinking air, is associated with warm, dry conditions that favor fire outbreaks. Low pressure is associated with upward motion and, during sum-mer, convection. Steep gradients between high and low pres-sure can produce strong surface winds. In Oregon, for example, high pressure east of the Cascade Mountains can result in strong easterly winds which lead to very dangerous fire conditions in Central and Western Oregon.
The soil moisture maps are for the upper 5cm of the soil zone as simulated by the RegCM. In addition to indicating soil moisture conditions, the maps can also be used to infer mois-ture content of live and dead fuels, particularly over longer time spans. Persistent (6-12 month) dry soil moisture anomalies may be associated with moisture conditions in larger fuel classes (e.g., 1000-hr) and thus an indication of the potential for very large and hot wildfires (Swetnam and Betancourt, 1998; Bessie and John-son, 1995; Harmon and Sexton, 1995).
SummaryThere is clear association of high, normal, and low wildfire
starts and climate within the 8 subregions (Fig. 18); although, there is also natural variability of wildfire associated with non-climatic factors. Over the West, regional patterns of wildfire behavior reflect both similarities and contrasts in the underly-ing climatic controls of fire. Additional information related to wildfire and climate would likely emerge if the West was further divided into more, smaller subregions associated, for example, with elevation and ecological province. However, the subdivi-sions and data used in our analysis are of sufficiently high resolu-tion to provide meaningful and useful near-real-time information to evaluate both inter- and intra-regional wildfire-climate condi-tions over the western US.
AcknowledgementsWe thank H. Lins, G. McCabe, S. Shafer, and D. Zahnle for
their helpful reviews. Funding for this research was provided by the Joint Fire Sciences Program under research grant 01-1-6-05. Computing resources were provided by the Environmental Com-puting Center, College of Atmospheric and Oceanic Sciences, Oregon State University.
28 Atlas of Climatic Controls of Wildfire in the Western United States

References Cited
Bartlein, P.J., S.W. Hostetler, S.L. Shafer, J.O. Holman, and A.M. Solomon, 2003: The seasonal cycle of wildfire and climate in the western United States, 5th Symposium on Fire and Forest Meteorology, Meteorological Society, paper P3.9.
Bessie, W.C. and E.A. Johnson, 1995: The relative importance of fuels and weather on fire behavior in subalpine forests. Ecol-ogy, 76(3):747-762.
Brown, J.K. and C.D. Bevins, 1986: Surface fuel loadings and predicted fire behavior for vegetation types in the Northern Rocky Mountains. USDA For. Serv. Res. Note INT-358, Inter-mountain For. and Range Expt. Sta., Ogden UT, 9 p.
Brown, T. J., B. L. Hall, C. R. Mohrle, and H. J. Reinbold, 2002: Coarse assessment of federal wildland fire occurrence data. Desert Research Institute, Program for Climate, Ecosystem and Fire Applications, Report CEFA 02-04, 31 pp., http://www.cefa.dri.edu/Publications/fireoccurrencereport.pdf (accessed August 24, 2003).
Gao, X., J.S. Pal and F. Giorgi. 2006: Projected changes in mean and extreme precipitation over the Mediterranean region from a high resolution double nested RCM simulation. Geophysi-cal Research Letters, 33, L03706, doi:10.1029/2005GL024954.
Gedalof, Z., D.L. Peterson, and N.J. Mantua 2005. Atmo-spheric, climatic, and ecological controls on extreme wildfire years in the northwestern United States. Ecological Applications 15:154-174.
Giorgi, F., M. R. Marinucci, and G. T. Bates, 1993: Development of a second-generation regional climate model (RegCM2). Part I: Boundary-layer and radiative transfer pro-cesses. Monthly Weather Review, 121:2794-2813.
Giorgi, F., X. Bi and J.S. Pal, 2004: Mean, interannual vari-ability and trends in a regional climate change experiment over Europe. I. Present-day climate (1961-1990). Climate Dynamics, 22, 733-756.
Goens, D.W. and S.A. Ferguson, eds., 2000: Third Sym-posium on Fire and Forest Meteorology Preprints, American Meteorological Society, 165p.
Guttman, N.B., 1998: Comparing the Palmer drought index and the standardized precipitation index. J. American Water Resources Association, 34(1):113-121.
Guttman, N.B., 1999: Accepting the standardized precipita-tion index: a calculation algorithm. J. American Water Resources Association, 35(2):331-322.
Harmon, M.E. and J. Sexton, 1995: Water balance in conifer logs in early stages of decomposition. Plant and Soil, 172:141-152.
Hostetler, S.W., P.J. Bartlein, J.O. Holman, A.M. Solomon, and S.L. Shafer, 2003: Using a regional climate model to diag-nose climatological and meteorological controls of wildfire in the Western United States, 5th Symposium on Fire and Forest Meteorology, American Meteorological Society, paper P1.3.
Kistler, R., E. Kalnay, W. Collins, S. Saha, G. White, J. Woollen, M. Chelliah, W. Ebisuzaki, M. Kanamitsu, V. Kousky, H. van den Dool, R. Jenne, and M. Fiorino, 2001: The NCEP-NCAR 50-year reanalysis: Monthly means CD-ROM and
documentation. Bulletin of the American Meteorological Society, 82:247-267.
Pyne, S.J., P.L. Andrews, and R.D. Laven, 1996: Introduc-tion to Wildland Fire. John Wiley and Sons, New York, NY. 769 pp.
Rorig, M.L. and S.A. Ferguson, 1999: Characteristics of lightning and wildland fire ignitions in the Pacific Northwest. J. of Applied Meteorology, 38:1565-1575.
Rorig, M.L. and S.A. Ferguson, 2002: The 2000 fire season: Lightning caused fires. J. of Applied Meteorology, 41:786-791.
Schoennagel, T., T.T. Veblen, W.H. Romme, J.S. Sibold, and E.R. Cook, 2005: ENSO and PDO variability affect drought-induced fire occurrence in Rocky Mountain subalpine forests. Ecological Applications 15:2000-2014.
Skinner, W.R., B.J. Stocks, D.L. Martell, D.L., B. Bonsal, and R. Shabbar, 1999: The association between circulation anomalies in the mid-troposphere and area burned by wildland fire in Canada. Theoretical and Applied Climatology 63: 89-105.
Swetnam, T. W. and J. L. Betancourt, 1998: Mesoscale dis-turbance and ecological response to decadal climatic variability in the American Southwest. Journal of Climate, 11:3128-3147.
Thompson, S. L. and D. Pollard, 1995: A global climate model (GENESIS) with a land-surface transfer scheme (LSX). Part I: present climate simulation. Journal of Climate, 8:732-761.
Westerling, A. L., A. Gershunov, T. J. Brown, D. R. Cayan, and M. D. Dettinger, 2003: Climate and wildfire in the western United States. Bulletin of the American Meteorological Society, 84:595-604.
References Cited 29
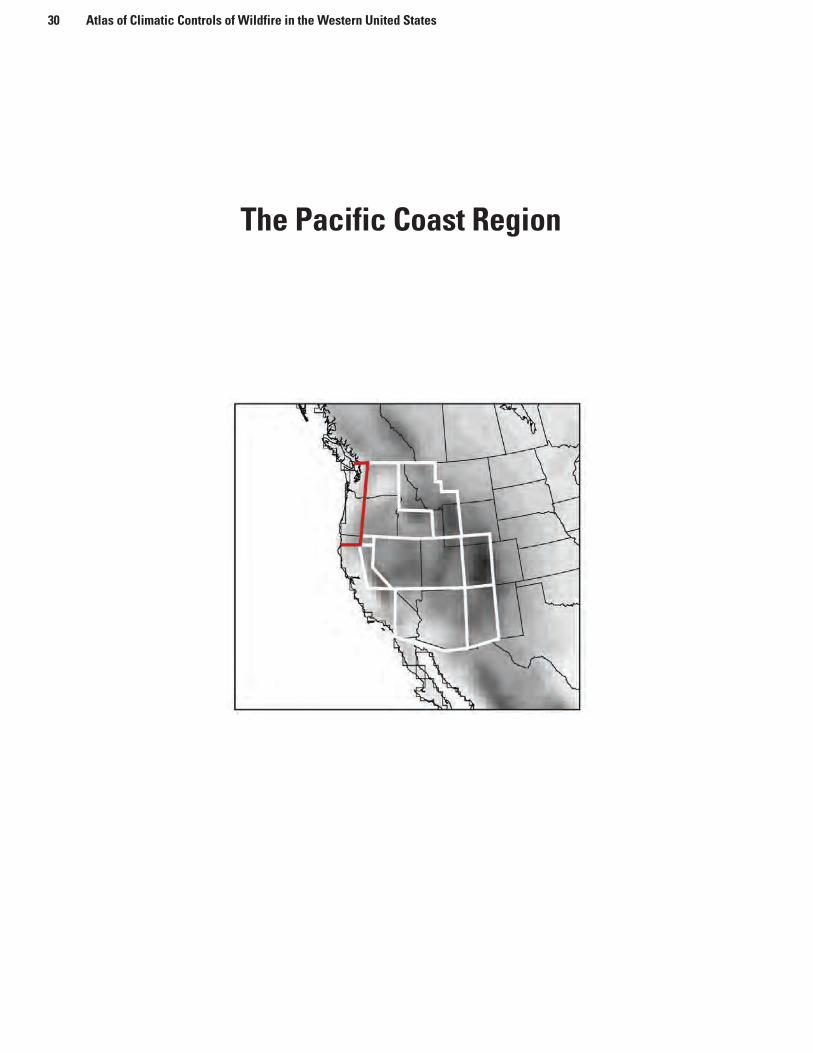
30 Atlas of Climatic Controls of Wildfire in the Western United States
The Pacific Coast Region

The Pacific Coast Region 31
Rank and correlation of monthly fire number data for 1980-2000 with CRU/RegCM climate variables over eight subregions of the west. The rankings are based on an im-posed 33/33/33% distribution of high, normal, and low fire numbers. Both the fire and climate data have been trans-formed and standardized using the method for computing the standardized precipitation index (SPI). The fires are ranked within each block of months, e.g. the first year in the high June group has the largest number of fires over the 20-yr record and the last year in the low June group has the lowest number. Orange years are also high area-burned years, grey are normal, and blue are low area burned years. The ranked climate variables for a specific fire year are temp, precip, and soil moisture anomalies for 1 (the current month), 3, 6, and 12 months. The colors are indicative of the sign of the rank. Light orange and light blue indicate the sign within the normal rank. ENSO is the current year, and ENSO-1 the previous year with warm phase years (W, El Nino) colored red, neutral phase (N) years colored gray and cold phase (C, La Nina) colored blue. The upper correlation table is the correlation between monthly fire numbers and the indicated variable. Blue shades are > 0.5 and yellow are < -0.5. The lower table is the same, except the correlations are between the 1, 3, 6, and 12 month fire number anomaly and the same lags for the climate data.
Pacific Coast
High June T P SM01 SM03 SM06 SM12 ENSO ENSO-1
1992 2 1 -1 -1 -2 2 W N Correlations with SG011982 2 1 -2 -2 -2 2 N N T01 T03 T06 T12 P01 P03 P06 P121987 2 -2 1 1 1 2 W N Jan -0.17 -0.24 -0.29 -0.25 -0.62 -0.36 -0.34 -0.331986 2 -2 -2 -2 -1 1 N N Feb 0.23 -0.31 -0.08 0.28 -0.37 -0.33 -0.44 -0.461995 1 2 1 1 1 -1 N N Mar 0.16 -0.04 0.09 0.17 -0.54 -0.18 -0.37 -0.381991 -2 -2 -2 -2 -2 -2 N N Apr 0.43 -0.19 -0.12 -0.17 -0.47 -0.38 -0.39 -0.351985 2 1 -2 -2 -2 1 N N May 0.49 0.36 0.29 0.16 -0.73 -0.46 -0.22 -0.21
High July Jun 0.59 0.31 0.37 0.18 -0.30 -0.45 -0.23 -0.181985 2 -2 -2 -2 -2 1 N N Jul 0.84 0.48 0.39 0.26 -0.38 -0.44 -0.62 -0.451994 2 -2 1 1 1 -2 N N Aug 0.30 0.21 0.35 0.34 -0.26 -0.40 -0.34 -0.281992 2 2 2 1 1 -2 W N Sep 0.58 0.53 0.47 0.34 -0.61 -0.58 -0.29 -0.561995 2 2 1 1 1 -1 N N Oct 0.56 0.38 0.32 0.13 -0.61 -0.71 -0.59 -0.631990 2 1 1 2 2 -1 N C Nov 0.28 0.40 0.29 0.19 -0.43 -0.49 -0.40 -0.171991 1 -2 1 -2 -2 -2 N N Dec -0.11 0.07 0.09 -0.06 -0.40 -0.23 -0.25 -0.281998 2 1 -2 1 1 2 W N
High August Correlations with SG01-121987 1 -2 2 1 1 2 W N SG/T01 SG/T03 T06 SG/T12 SG/P01 SG/P03 SG/P06 SG/P121988 -1 -1 2 2 2 -2 W W Jan -0.17 0.23 -0.05 0.23 -0.62 -0.33 -0.56 -0.481992 2 -1 1 1 1 -2 W N Feb 0.23 -0.13 0.08 0.31 -0.37 -0.49 -0.60 -0.521999 1 2 -1 -2 -2 -2 C W Mar 0.16 -0.05 0.23 0.30 -0.54 -0.41 -0.58 -0.451990 2 2 2 2 2 -1 N C Apr 0.43 -0.03 0.16 0.20 -0.47 -0.58 -0.56 -0.401983 1 2 2 2 2 2 W N May 0.49 0.36 0.07 0.21 -0.73 -0.60 -0.51 -0.371986 2 -2 -2 -2 -2 1 N N Jun 0.59 0.41 0.29 0.13 -0.30 -0.51 -0.28 -0.47
Jul 0.84 0.59 0.50 0.23 -0.38 -0.71 -0.58 -0.62Avg June Aug 0.30 0.63 0.50 0.27 -0.26 -0.33 -0.56 -0.57
1989 2 -2 -2 -2 -2 -2 C W Sep 0.58 0.55 0.52 0.36 -0.61 -0.47 -0.53 -0.611983 -1 1 1 -1 1 2 W N Oct 0.56 0.37 0.50 0.34 -0.61 -0.64 -0.53 -0.631994 -1 -2 1 1 1 2 N W Nov 0.28 0.25 0.30 0.22 -0.43 -0.50 -0.37 -0.661984 -2 2 2 2 2 2 N W Dec -0.11 0.25 0.06 0.26 -0.40 -0.38 -0.24 -0.421997 1 2 2 1 1 1 N N
1981 -2 2 2 2 2 2 N N
2000 2 1 2 2 2 -2 C WAvg July
1987 -2 1 1 1 1 2 W N
1984 1 -2 1 2 2 2 N W
1997 1 2 2 2 2 1 N N
1996 2 1 -2 -2 -2 -1 N N
1988 1 -2 2 2 2 -2 W W
1980 -1 -2 2 1 1 -1 N N
1999 -2 -1 -2 -2 -2 -2 C WAvg August
1994 1 -2 -2 1 1 -2 N N
1996 2 -2 -2 -2 -2 -1 N N
1998 2 -2 1 1 1 2 W N
1989 -2 -2 1 -2 -2 -2 C W
1984 -2 -2 2 2 2 2 N W
1993 1 -1 -2 2 2 2 N W
1982 -2 -1 1 -2 -2 1 N N
Low June1996 -2 -2 -2 -2 -2 -1 N N
1980 -2 1 1 1 -1 -1 N N
1990 1 2 2 2 2 -1 N C
1998 1 -2 1 2 2 2 W N
1999 -2 1 -2 -2 -2 -2 C W
1988 -2 2 2 2 2 -2 W W
1993 1 2 2 2 2 2 N WLow July
2000 -1 -1 -2 2 1 -2 C W
1982 -2 2 2 -2 -2 2 N N
1989 -2 1 1 -2 -2 -2 C W
1981 -1 -2 2 2 2 2 N N
1986 -2 2 -2 -2 -2 1 N N
1983 -2 2 2 1 2 2 W N
1993 -2 2 -2 2 2 2 N WLow August
2000 -2 -1 1 1 1 -2 C W
1981 2 -2 2 2 2 2 N N
1991 1 2 -2 -2 -2 -2 N N
1980 -2 -1 -2 -2 -2 -1 N N
1985 -2 1 -2 -2 -2 1 N N
1995 -2 2 -1 1 1 -1 N N
1997 2 2 2 2 2 2 N N

32 Atlas of Climatic Controls of Wildfire in the Western United States
01 03 06 12 01 03 06 12 01 03 06 12
H500
SLP
Precip
Fire
Low-Normal High-Low
Smois
Tair
JuneHigh-Normal
USGS-University of

The Pacific Coast Region 33
01 03 06 12 01 03 06 12 01 03 06 12
H500
SLP
Precip
Fire
Low-Normal High-Low
Smois
Tair
JulyHigh-Normal
USGS-University of

34 Atlas of Climatic Controls of Wildfire in the Western United States
01 03 06 12 01 03 06 12 01 03 06 12
Pre-
Low-Normal High-LowAugust
High-Nor-
USGS-University of
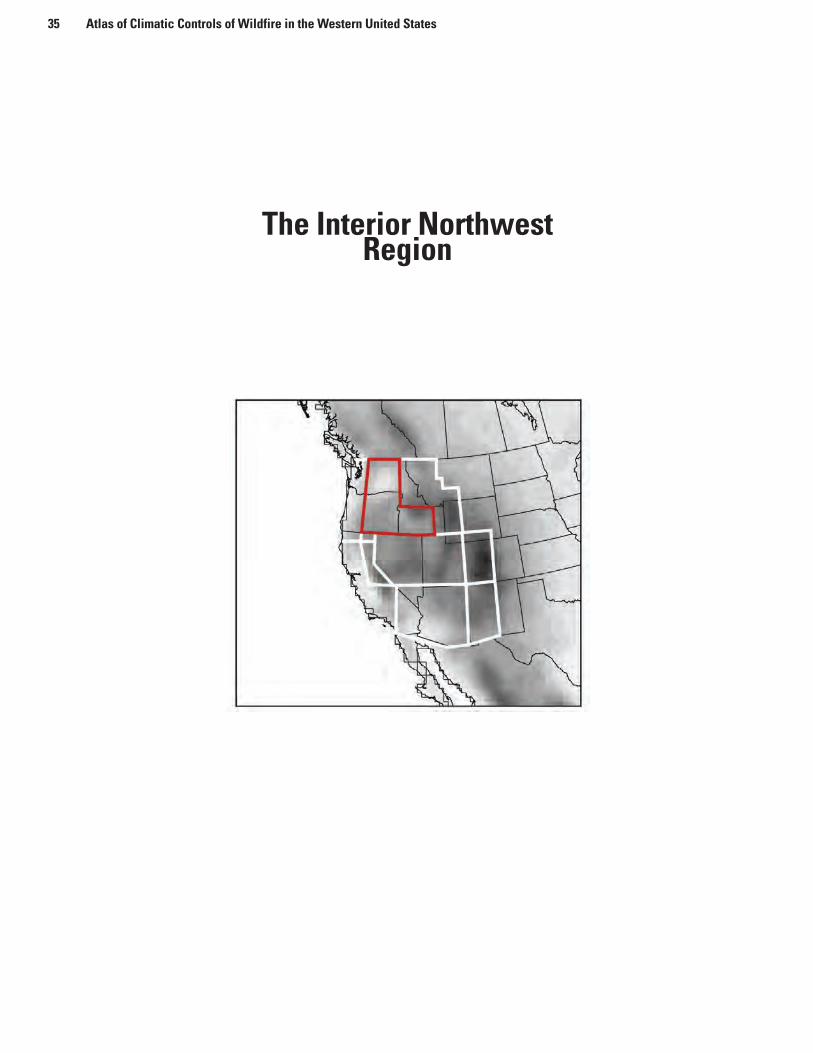
35 Atlas of Climatic Controls of Wildfire in the Western United States
The Interior Northwest Region

36 Atlas of Climatic Controls of Wildfire in the Western United States
Rank and correlation of monthly fire number data for 1980-2000 with CRU/RegCM climate variables over eight subregions of the west. The rankings are based on an imposed 33/33/33% distribution of high, normal, and low fire numbers. Both the fire and climate data have been transformed and stan-dardized using the method for computing the standardized pre-cipitation index (SPI). The fires are ranked within each block of months, e.g. the first year in the high June group has the largest number of fires over the 20-yr record and the last year in the low June group has the lowest number. Orange years are also high area-burned years, grey are normal, and blue are low area burned years. The ranked climate variables for a specific fire year are temp, precip, and soil moisture anomalies for 1 (the current month), 3, 6, and 12 months. The colors are indicative of the sign of the rank. Light orange and light blue indicate the sign within the normal rank. ENSO is the current year, and ENSO-1 the previous year with warm phase years (W, El Nino) colored red, neutral phase (N) years colored gray and cold phase (C, La Nina) colored blue. The upper correla-tion table is the correlation between monthly fire numbers and the indicated variable. Blue shades are > 0.5 and yellow are < -0.5. The lower table is the same, except the correlations are between the 1, 3, 6, and 12 month fire number anomaly and the same lags for the climate data.
PNW Interior
High June T P SM01 SM03 SM06 SM12 ENSO ENSO-1
1987 2 1 -1 -2 -1 1 W N Correlations with SG011992 2 2 -1 -2 -2 -2 W N T01 T03 T06 T12 P01 P03 P06 P121985 2 -2 -2 -2 -1 -2 N N Jan 0.61 0.32 0.39 0.13 -0.11 -0.37 -0.42 -0.401988 2 1 1 1 2 -2 W W Feb 0.59 0.30 0.27 0.17 -0.65 -0.35 -0.46 -0.311986 2 -2 -2 -2 -2 1 N N Mar 0.65 0.45 0.44 0.42 -0.19 -0.52 -0.60 -0.661982 1 2 2 2 2 2 N N Apr 0.68 0.70 0.52 0.33 -0.50 -0.63 -0.67 -0.522000 2 -2 -2 -2 -1 -2 C W May 0.84 0.75 0.54 0.43 -0.27 -0.63 -0.66 -0.46
High July Jun 0.64 0.40 0.30 0.26 -0.01 -0.07 -0.19 -0.111985 2 1 2 -2 -1 2 N N Jul 0.64 0.30 0.06 0.15 0.10 -0.19 -0.20 0.051996 2 -2 1 1 -1 -2 N N Aug 0.56 0.47 0.22 0.43 -0.37 -0.22 0.22 -0.041994 2 -2 -2 -2 -2 -2 N N Sep 0.43 0.39 0.13 0.23 -0.29 -0.53 -0.29 -0.091980 -1 -1 -1 -1 2 -1 N N Oct 0.01 0.13 -0.22 -0.21 -0.61 -0.72 -0.31 -0.081983 -2 2 2 2 2 2 W N Nov -0.08 -0.18 -0.25 -0.20 -0.24 -0.33 -0.26 -0.021989 1 -2 1 -2 -2 -2 C W Dec1995 -1 2 -2 -2 -2 -2 N N
High August
1999 1 2 1 -2 -1 -1 C W Correlations with SG01-121996 2 -2 2 1 1 -2 N N SG/T01 SG/T03 T06 SG/T12 SG/P01 SG/P03 SG/P06 SG/P121986 2 -1 -1 -2 -2 1 N N Jan 0.30 0.28 0.45 -0.33 0.15 -0.121984 1 2 2 2 2 2 N W Feb 0.61 0.54 0.32 -0.11 -0.03 -0.201981 2 -1 2 2 2 2 N N Mar 0.59 0.30 0.33 0.22 -0.65 -0.37 -0.24 -0.101991 2 -1 2 1 2 -1 N N Apr 0.65 0.60 0.59 0.13 -0.19 -0.55 -0.62 -0.061992 2 -2 1 1 -2 -2 W N May 0.68 0.75 0.57 0.23 -0.50 -0.66 -0.73 -0.19
Jun 0.84 0.77 0.56 0.40 -0.27 -0.62 -0.70 -0.22Avg June Jul 0.64 0.75 0.71 0.43 -0.01 -0.26 -0.46 -0.30
1994 1 -2 -2 -2 -2 -2 N N Aug 0.64 0.66 0.59 0.58 0.10 -0.50 -0.62 -0.411996 1 -2 -1 -1 -2 -2 N N Sep 0.56 0.51 0.43 0.57 -0.37 -0.20 -0.49 -0.401999 -1 -1 -2 -1 -1 1 C W Oct 0.43 0.32 0.38 0.57 -0.29 -0.15 -0.36 -0.341981 -1 1 1 2 -2 1 N N Nov 0.01 0.74 0.46 0.55 -0.61 -0.31 -0.13 -0.361997 -1 2 1 -1 -1 2 N N Dec -0.08 0.61 0.43 0.55 -0.24 -0.08 0.11 -0.281983 -2 -1 2 1 1 2 W N
1989 2 -2 -2 -2 -2 -2 C WAvg July
1997 -2 1 1 1 -1 1 N N
1998 2 1 -2 2 2 2 W N
2000 1 -1 -2 -2 -2 -2 C W
1984 1 2 2 2 2 2 N W
1990 2 1 -1 2 2 1 N C
1991 2 -2 2 2 2 -1 N N
1992 -1 2 2 -1 -2 -2 W NAvg August
1990 1 2 -1 2 2 1 N C
1998 2 -2 2 2 2 2 W N
1982 -1 -1 1 2 2 2 N N
1988 -2 -2 -2 1 1 -2 W W
1987 -2 -1 -1 1 -1 2 W N
1997 1 2 1 1 -1 1 N N
1989 -2 2 -2 -2 -2 -2 C W
Low June1990 -1 -2 2 2 2 1 N C
1984 -2 2 2 2 2 2 N W
1980 -2 1 2 2 2 -1 N N
1995 -2 2 1 -1 -2 -2 N N
1998 -2 1 2 2 2 2 W N
1991 -2 2 -2 2 1 -1 N N
1993 -2 2 2 1 2 2 N WLow July
1987 -2 2 2 -1 -1 2 W N
1981 -1 -2 1 2 -2 1 N N
1988 2 -2 -1 1 1 -2 W W
1982 -2 2 2 2 2 2 N N
1986 -2 -1 -2 -2 -2 1 N N
1999 -2 -2 -2 -2 -1 1 C W
1993 -2 -2 -2 -1 -1 2 N WLow August
2000 1 -2 -2 -2 -2 -2 C W
1983 1 2 2 2 1 2 W N
1994 -2 -2 -2 -2 -2 -2 N N
1980 -2 -2 2 2 2 -1 N N
1993 -2 2 -2 -1 -2 1 N W
1985 -2 -1 -2 -2 -1 2 N N
1995 -2 -1 -2 -2 -2 -2 N N

The Interior Northwest Region 37
01 03 06 12 01 03 06 12 01 03 06 12
Pre-
Low-Normal High-LowJune
High-Nor-

38 Atlas of Climatic Controls of Wildfire in the Western United States
01 03 06 12 01 03 06 12 01 03 06 12
H500
SLP
Precip
Fire
Low-Normal High-Low
Smois
Tair
JulyHigh-Normal
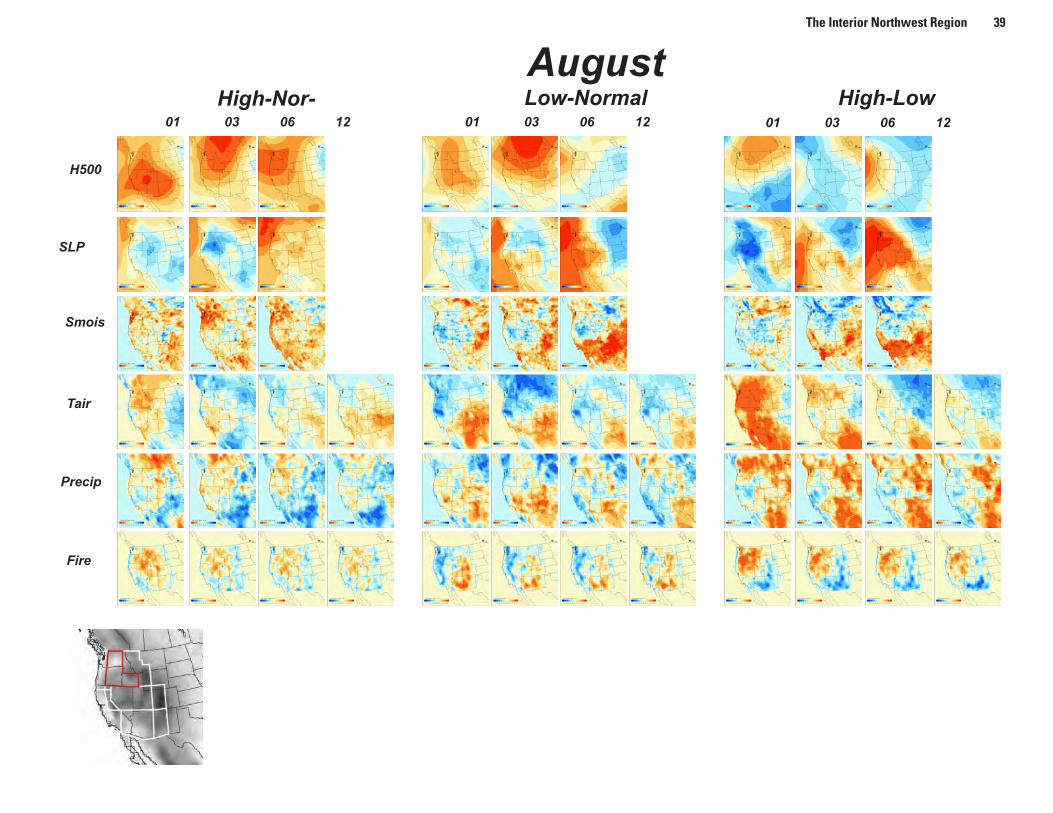
The Interior Northwest Region 39
01 03 06 12 01 03 06 12 01 03 06 12
H500
SLP
Precip
Fire
Low-Normal High-Low
Smois
Tair
AugustHigh-Nor-

The Northern Rocky Mountain Region
40 Atlas of Climatic Controls of Wildfire in the Western United States

The Northern Rocky Mountain Region 41
Rank and correlation of monthly fire number data for 1980-2000 with CRU/RegCM climate variables over eight subregions of the west. The rankings are based on an imposed 33/33/33% distribution of high, normal, and low fire numbers. Both the fire and climate data have been trans-formed and standardized using the method for computing the standardized precipitation index (SPI). The fires are ranked within each block of months, e.g. the first year in the high June group has the largest number of fires over the 20-yr record and the last year in the low June group has the lowest number. Orange years are also high area-burned years, grey are normal, and blue are low area burned years. The ranked climate variables for a specific fire year are temp, precip, and soil moisture anomalies for 1 (the current month), 3, 6, and 12 months. The colors are indicative of the sign of the rank. Light orange and light blue indicate the sign within the normal rank. ENSO is the current year, and ENSO-1 the previous year with warm phase years (W, El Nino) colored red, neutral phase (N) years colored gray and cold phase (C, La Nina) colored blue. The upper correlation table is the correlation between monthly fire numbers and the indicated variable. Blue shades are > 0.5 and yellow are < -0.5. The lower table is the same, except the correlations are between the 1, 3, 6, and 12 month fire number anomaly and the same lags for the climate data.
Northern Rockies
High June T P SM01 SM03 SM06 SM12 ENSO ENSO-1
1988 2 -2 -2 -2 -2 -2 W W Correlations with SG011992 2 2 -1 -2 -2 -2 W N T01 T03 T06 T12 P01 P03 P06 P121994 2 -1 -2 -2 -2 -2 N N Jan -0.03 0.35 0.31 0.21 -0.32 -0.47 -0.40 -0.111985 1 -2 -2 -2 -2 1 N N Feb 0.14 0.17 0.18 -0.19 -0.28 0.14 0.151986 2 -1 -2 -1 -1 -1 N N Mar 0.40 0.41 0.52 0.42 -0.64 -0.42 -0.38 0.121987 2 -2 -2 -2 -2 -1 W N Apr 0.66 0.44 0.30 0.16 -0.53 -0.58 -0.63 -0.322000 1 -2 -2 -2 -2 -2 C W May 0.64 0.47 0.30 0.00 -0.17 -0.35 -0.46 -0.13
High July Jun 0.86 0.76 0.53 0.28 -0.47 -0.55 -0.61 -0.551994 2 -2 -2 -2 -2 -2 N N Jul 0.73 0.60 0.37 0.44 -0.67 -0.72 -0.74 -0.712000 2 -1 -2 -2 -2 -2 C W Aug 0.70 0.70 0.46 0.64 -0.69 -0.74 -0.55 -0.501989 2 -1 1 -1 -2 -2 C W Sep 0.67 0.64 0.53 0.73 -0.62 -0.61 -0.35 -0.361985 2 -2 1 -2 -2 1 N N Oct 0.47 0.31 0.30 0.38 -0.57 -0.66 -0.32 -0.431988 2 -2 -2 -2 -2 -2 W W Nov 0.71 0.62 0.30 0.39 -0.31 -0.73 -0.22 -0.161996 2 -2 1 2 2 2 N N Dec 0.14 0.46 0.26 0.10 -0.25 -0.36 -0.22 -0.121981 -1 -2 -2 2 2 2 N N
High August Correlations with SG01-121981 2 -2 2 1 2 2 N N SG/T01 SG/T03 T06 SG/T12 SG/P01 SG/P03 SG/P06 SG/P121996 1 -2 1 1 2 2 N N Jan -0.03 0.58 0.17 0.42 -0.32 -0.15 -0.30 -0.612000 2 -2 1 -2 -2 -2 C W Feb 0.14 0.23 0.35 -0.19 -0.20 -0.39 -0.581994 2 -2 -2 -2 -2 -2 N N Mar 0.40 0.38 0.36 0.29 -0.64 -0.50 -0.41 -0.521991 2 -1 1 -2 -1 -1 N N Apr 0.66 0.46 0.31 0.12 -0.53 -0.53 -0.58 -0.481988 1 -2 -2 -2 -2 -2 W W May 0.64 0.57 0.45 0.12 -0.17 -0.56 -0.78 -0.661999 2 2 1 -1 1 1 C W Jun 0.86 0.80 0.55 0.18 -0.47 -0.56 -0.68 -0.50
Jul 0.73 0.74 0.55 0.16 -0.67 -0.76 -0.78 -0.65Avg June Aug 0.70 0.81 0.69 0.59 -0.69 -0.87 -0.80 -0.78
1996 2 -2 1 2 2 2 N N Sep 0.67 0.64 0.68 0.63 -0.62 -0.83 -0.83 -0.821989 2 -2 -1 -1 -2 -2 C W Oct 0.47 0.56 0.62 0.66 -0.57 -0.65 -0.80 -0.801983 -1 2 2 1 1 2 W N Nov 0.71 0.64 0.49 0.58 -0.31 -0.59 -0.80 -0.751982 -1 1 2 2 2 2 N N Dec 0.14 0.58 0.35 0.51 -0.25 -0.43 -0.63 -0.681991 -2 2 -2 -2 1 -1 N N
1980 -1 1 2 -1 1 -2 N N
1999 -2 1 1 2 1 1 C WAvg July
1990 1 -1 -2 1 1 -1 N C
1991 1 -2 1 1 1 -1 N N
1999 -2 -2 -2 1 -1 1 C W
1992 -2 2 2 1 -1 -2 W N
1986 -2 1 -2 -2 -2 -1 N N
1998 2 2 2 2 2 2 W N
1987 -2 2 2 -2 -2 1 W NAvg August
1998 2 -2 2 2 2 2 W N
1992 -2 -2 1 2 -1 -2 W N
1986 1 1 -1 -2 -2 -2 N N
1984 1 2 2 2 2 2 N W
1990 1 2 -2 -1 1 -1 N C
1985 -2 1 -2 -2 -2 -1 N N
1989 -2 2 -2 -2 -1 -2 C WLow June
1990 -1 -2 1 2 2 1 N C
1993 -2 2 1 -1 -1 1 N W
1984 -2 1 2 2 2 2 N W
1995 -2 2 1 1 1 -2 N N
1997 -1 2 2 2 2 2 N N
1981 -2 1 2 1 2 2 N N
1998 -2 2 2 2 2 2 W NLow July
1980 1 -1 1 1 -1 -2 N N
1984 1 1 2 2 2 2 N W
1983 -2 2 2 2 1 2 W N
1995 -1 2 1 1 2 -2 N N
1982 -1 1 2 2 2 2 N N
1997 -2 2 2 2 2 2 N N
1993 -2 2 1 -1 -1 -1 N WLow August
1982 1 -1 1 2 2 2 N N
1983 2 2 2 2 2 2 W N
1980 -2 1 2 2 1 -1 N N
1997 1 2 2 2 2 2 N N
1995 -2 -1 -2 1 1 -1 N N
1987 -2 1 2 1 -2 1 W N
1993 -2 2 -2 -1 -2 -2 N W
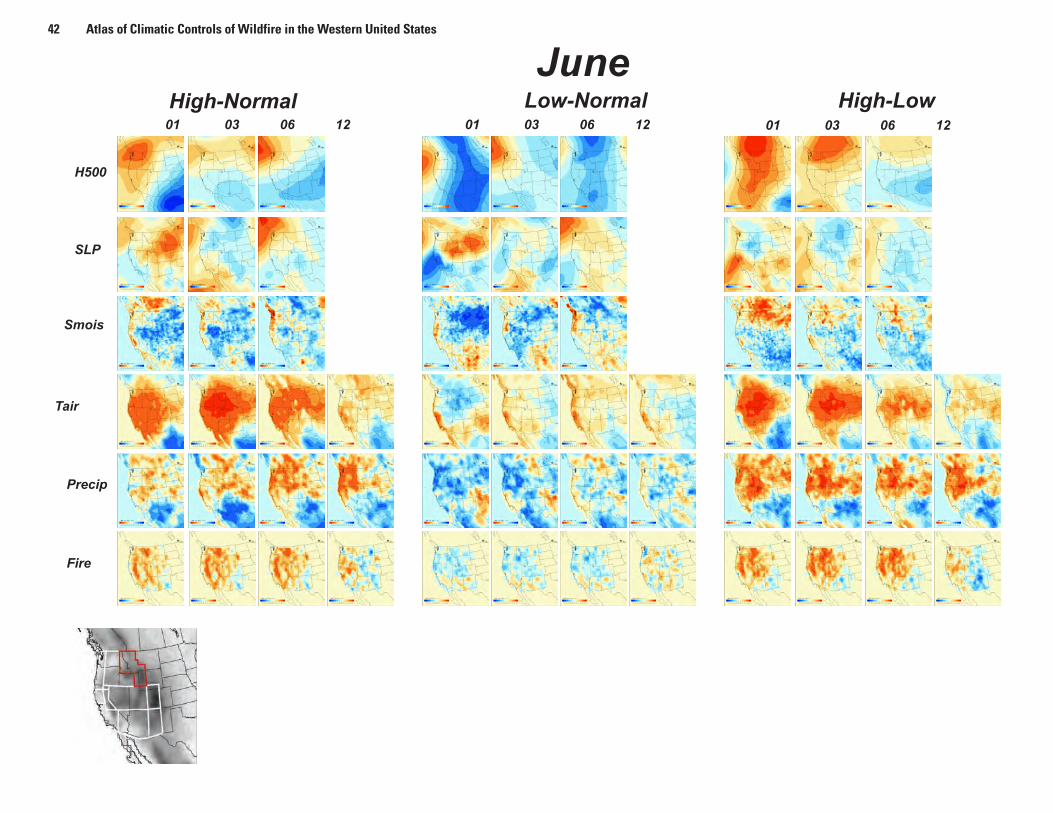
42 Atlas of Climatic Controls of Wildfire in the Western United States
01 03 06 12 01 03 06 12 01 03 06 12
H500
SLP
Precip
Fire
Low-Normal High-Low
Smois
Tair
JuneHigh-Normal
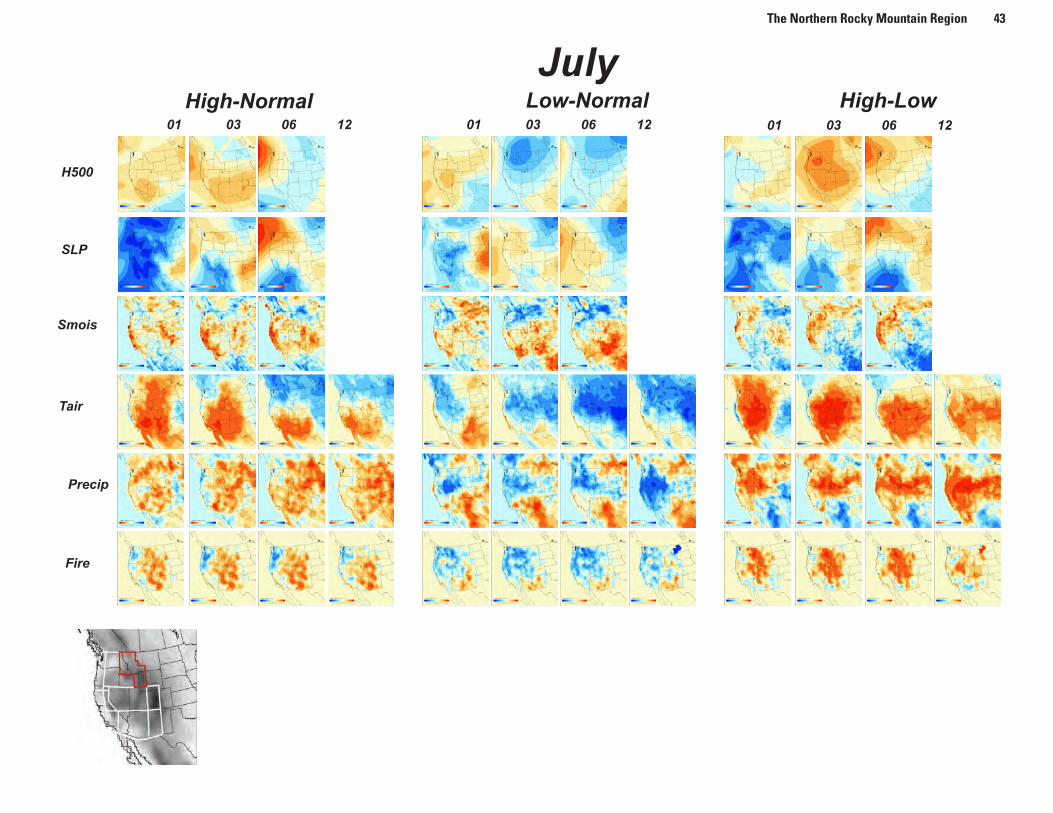
The Northern Rocky Mountain Region 43
01 03 06 12 01 03 06 12 01 03 06 12
H500
SLP
Precip
Fire
Low-Normal High-Low
Smois
Tair
JulyHigh-Normal
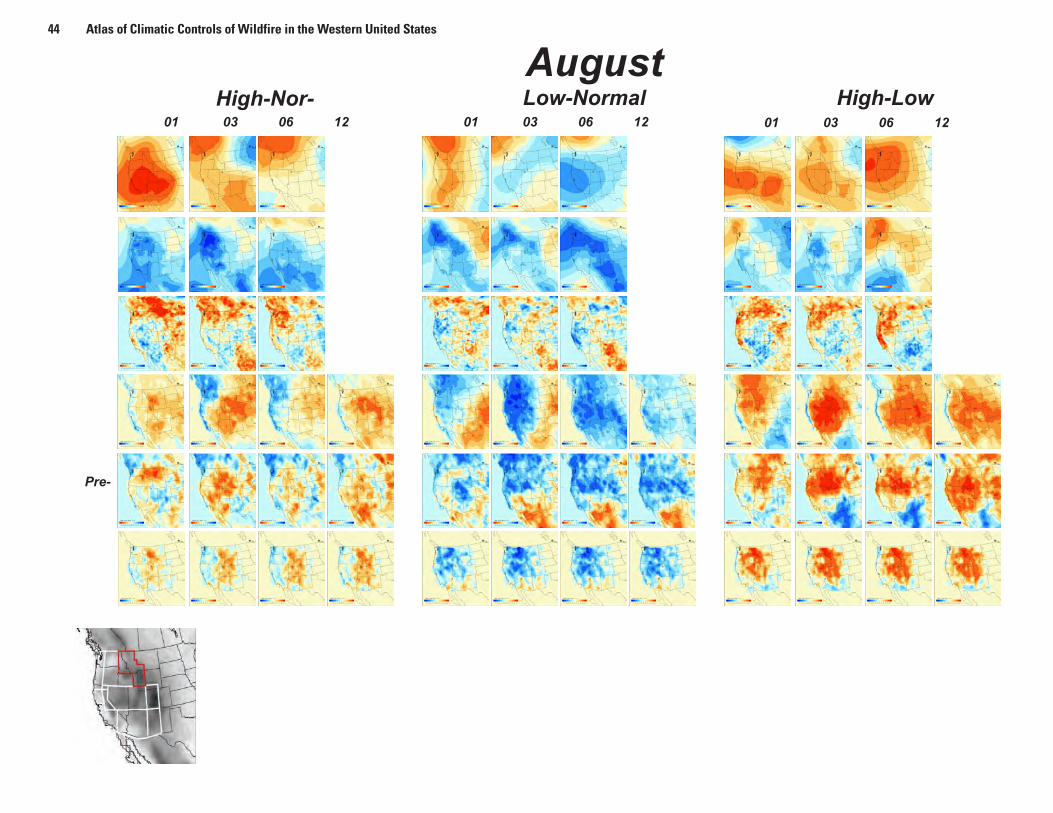
44 Atlas of Climatic Controls of Wildfire in the Western United States
01 03 06 12 01 03 06 12 01 03 06 12
Pre-
Low-Normal High-LowAugust
High-Nor-
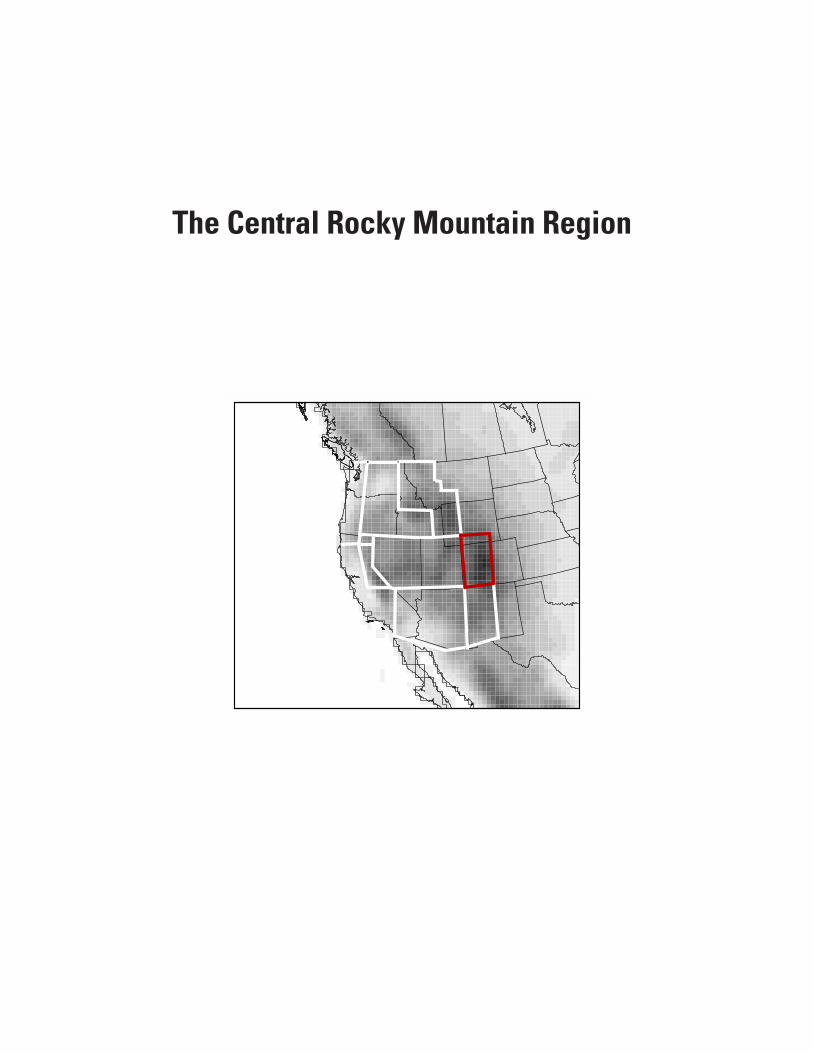
0 400 800 1200 1600 2000 2400 2800 3200 3400 m
Elevation
Mask
The Central Rocky Mountain Region

46 Atlas of Climatic Controls of Wildfire in the Western United States
Rank and correlation of monthly fire number data for 1980-2000 with CRU/RegCM climate variables over eight subregions of the west. The rankings are based on an imposed 33/33/33% distribution of high, normal, and low fire numbers. Both the fire and climate data have been transformed and stan-dardized using the method for computing the standardized pre-cipitation index (SPI). The fires are ranked within each block of months, e.g. the first year in the high June group has the largest number of fires over the 20-yr record and the last year in the low June group has the lowest number. Orange years are also high area-burned years, grey are normal, and blue are low area burned years. The ranked climate variables for a specific fire year are temp, precip, and soil moisture anomalies for 1 (the current month), 3, 6, and 12 months. The colors are indicative of the sign of the rank. Light orange and light blue indicate the sign within the normal rank. ENSO is the current year, and ENSO-1 the previous year with warm phase years (W, El Nino) colored red, neutral phase (N) years colored gray and cold phase (C, La Nina) colored blue. The upper correlation table is the correlation between monthly fire numbers and the indicated variable. Blue shades are > 0.5 and yellow are < -0.5. The lower table is the same, except the correlations are between the 1, 3, 6, and 12 month fire number anomaly and the same lags for the climate data.
0 400 800 1200 1600 2000 2400 2800 3200 3400 m
Elevation
Mask
Central Rockies
High June T P SM01 SM03 SM06 SM12 ENSO ENSO-1
1981 2 -2 1 -1 2 2 N N Correlations with SG011996 2 1 2 -1 1 2 N N T01 T03 T06 T12 P01 P03 P06 P121988 2 -2 -1 1 -2 -2 W W Jan -0.07 0.56 0.23 -0.07 -0.09 -0.43 -0.26 -0.141994 2 -2 -2 -2 -2 -2 N N Feb 0.23 0.42 0.12 -0.14 0.09 -0.30 0.011980 2 -2 -2 -1 1 1 N N Mar 0.20 0.30 0.19 0.26 -0.66 -0.64 -0.44 -0.192000 1 -2 -2 -2 -2 -2 C W Apr 0.63 0.46 0.37 0.52 -0.67 -0.58 -0.65 -0.541990 2 -2 -2 -2 -2 -2 N C May 0.69 0.47 0.15 0.21 -0.43 -0.67 -0.51 -0.37
High July Jun 0.71 0.81 0.47 0.46 -0.72 -0.68 -0.62 -0.781994 2 -2 -2 -2 -2 -2 N N Jul 0.41 0.55 0.13 0.08 -0.54 -0.71 -0.66 -0.541980 2 -2 -1 -1 -1 1 N N Aug 0.15 0.35 0.55 0.43 -0.57 -0.68 -0.49 -0.431997 -2 1 -2 -1 2 2 N N Sep 0.43 0.30 0.54 0.31 -0.48 -0.69 -0.63 -0.512000 2 -2 -2 -2 -2 -2 C W Oct 0.64 0.28 0.19 -0.04 -0.52 -0.66 -0.34 -0.221989 2 -2 -2 -2 -2 -2 C W Nov 0.43 0.44 0.47 0.27 -0.43 -0.70 -0.52 -0.501985 1 2 2 1 -2 1 N N Dec 0.24 0.13 0.18 -0.02 -0.36 -0.13 0.161988 2 -2 2 2 -1 -2 W W
High August
2000 2 1 -1 -2 -2 -2 C W Correlations with SG01-121996 2 -2 1 2 2 2 N N SG/T01 SG/T03 T06 SG/T12 SG/P01 SG/P03 SG/P06 SG/P121994 2 1 -2 -2 -2 -2 N N Jan -0.07 0.59 0.37 0.70 -0.09 -0.33 -0.57 -0.771980 -2 -2 2 -2 1 1 N N Feb 0.23 0.25 0.75 -0.14 -0.33 -0.64 -0.781986 1 1 -1 -1 1 -1 N N Mar 0.20 0.30 0.26 0.80 -0.66 -0.37 -0.37 -0.781995 2 -2 -1 2 2 1 N N Apr 0.63 0.43 0.26 0.72 -0.67 -0.52 -0.58 -0.781985 1 -2 -2 -1 -1 -1 N N May 0.69 0.52 0.27 0.62 -0.43 -0.56 -0.58 -0.70
Jun 0.71 0.80 0.49 0.63 -0.72 -0.71 -0.68 -0.63Jul 0.41 0.78 0.45 0.43 -0.54 -0.79 -0.86 -0.74
Avg June Aug 0.15 0.52 0.68 0.44 -0.57 -0.88 -0.83 -0.781992 -1 2 -1 -2 -1 -1 W N Sep 0.43 0.27 0.76 0.46 -0.48 -0.66 -0.82 -0.731989 -2 -1 -2 -2 -2 -2 C W Oct 0.64 0.28 0.66 0.45 -0.52 -0.65 -0.76 -0.721985 1 -1 -1 -2 -2 1 N N Nov 0.43 0.38 0.28 0.39 -0.43 -0.58 -0.75 -0.711993 -2 1 2 1 2 -2 N W Dec 0.48 0.20 0.46 -0.02 -0.39 -0.56 -0.671991 1 2 -2 -2 -2 -2 N N
1987 1 1 2 2 1 2 W N
1986 2 2 1 1 -1 -1 N NAvg July
1982 -1 2 -1 2 2 2 N N
1993 -2 -2 -2 -2 1 -1 N W
1996 2 -2 2 1 2 2 N N
1981 1 2 2 2 2 2 N N
1998 2 2 2 1 1 1 W N
1990 -2 2 -1 -2 -2 -2 N C
1987 -2 -1 -2 2 1 2 W NAvg August
1992 -2 1 -2 -2 -2 -2 W N
1993 -2 2 -1 -1 -2 -1 N W
1990 -1 -2 -2 -2 -2 -2 N C
1981 1 1 2 2 2 2 N N
1998 1 -2 2 2 2 2 W N
1987 -2 2 -2 -1 1 1 W N
1988 1 1 -2 -1 -2 -2 W W
Low June1999 -1 2 -2 -1 1 1 C W
1982 -2 -2 2 2 2 2 N N
1984 -2 2 2 2 2 2 N W
1997 1 1 1 2 2 2 N N
1998 -2 1 -1 2 1 1 W N
1995 -2 2 2 2 2 -1 N N
1983 -2 2 2 2 2 2 W NLow July
1992 -2 2 -2 -2 -2 -1 W N
1995 -2 1 -1 2 2 1 N N
1991 -1 1 -1 -2 -2 -2 N N
1984 1 2 2 2 2 2 N W
1999 1 -1 1 -1 -1 1 C W
1983 -1 1 2 2 2 2 W N
1986 -2 1 -1 -1 1 -2 N NLow August
1989 -2 -2 -2 -2 -2 -2 C W
1983 2 2 2 2 2 2 W N
1997 -2 2 1 -2 1 2 N N
1984 2 2 2 2 2 2 N W
1991 1 1 2 1 -1 -2 N N
1982 2 2 2 2 2 2 N N
1999 -2 2 1 -1 -1 1 C W
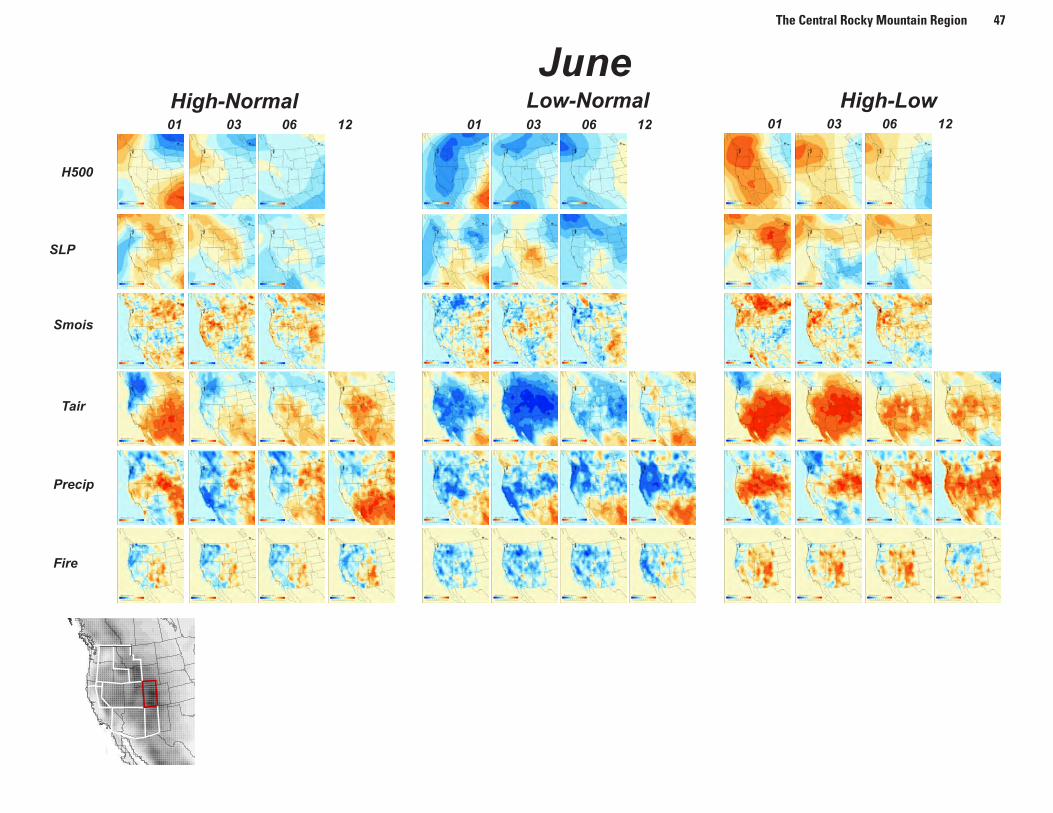
The Central Rocky Mountain Region 47
01 03 06 12 01 03 06 12 01 03 06 12
H500
SLP
Precip
Fire
Low-Normal High-Low
Smois
Tair
JuneHigh-Normal
0 400 800 1200 1600 2000 2400 2800 3200 3400 m
Elevation
Mask
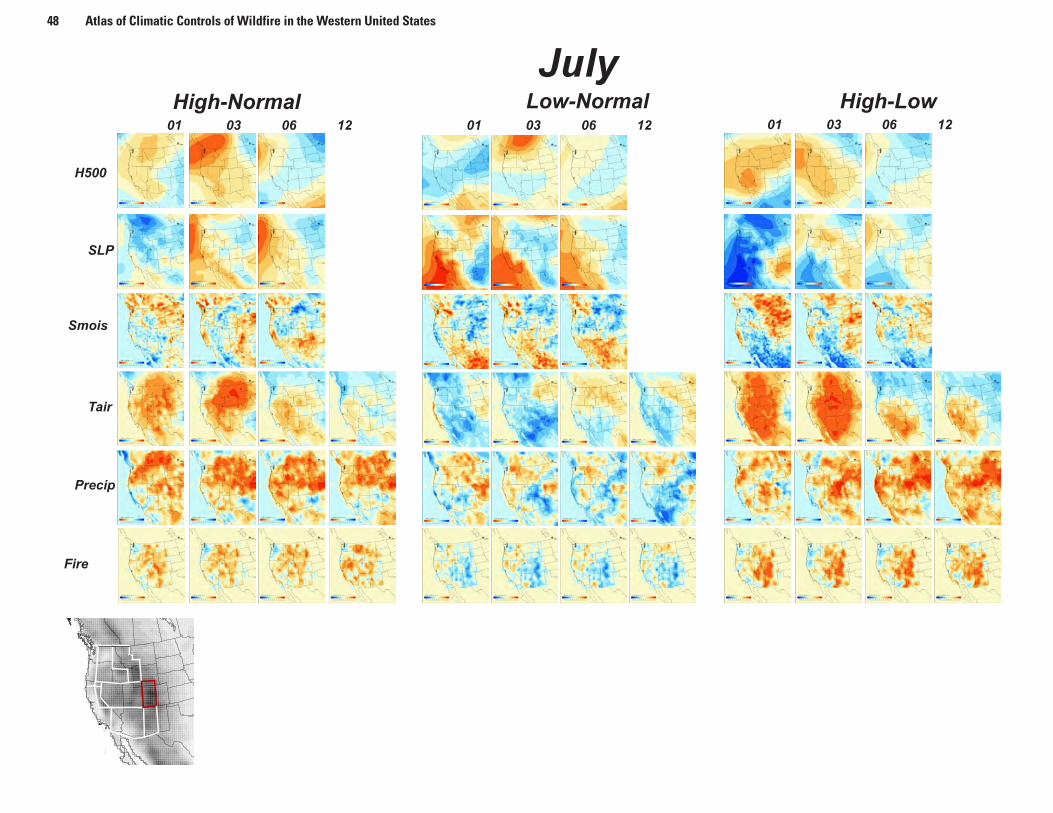
48 Atlas of Climatic Controls of Wildfire in the Western United States
01 03 06 12 01 03 06 12 01 03 06 12
H500
SLP
Precip
Fire
Low-Normal High-Low
Smois
Tair
JulyHigh-Normal
0 400 800 1200 1600 2000 2400 2800 3200 3400 m
Elevation
Mask

The Central Rocky Mountain Region 49
01 03 06 12 01 03 06 12 01 03 06 12
H500
SLP
Precip
Fire
Low-Normal High-Low
Smois
Tair
AugustHigh-Normal
0 400 800 1200 1600 2000 2400 2800 3200 3400 m
Elevation
Mask
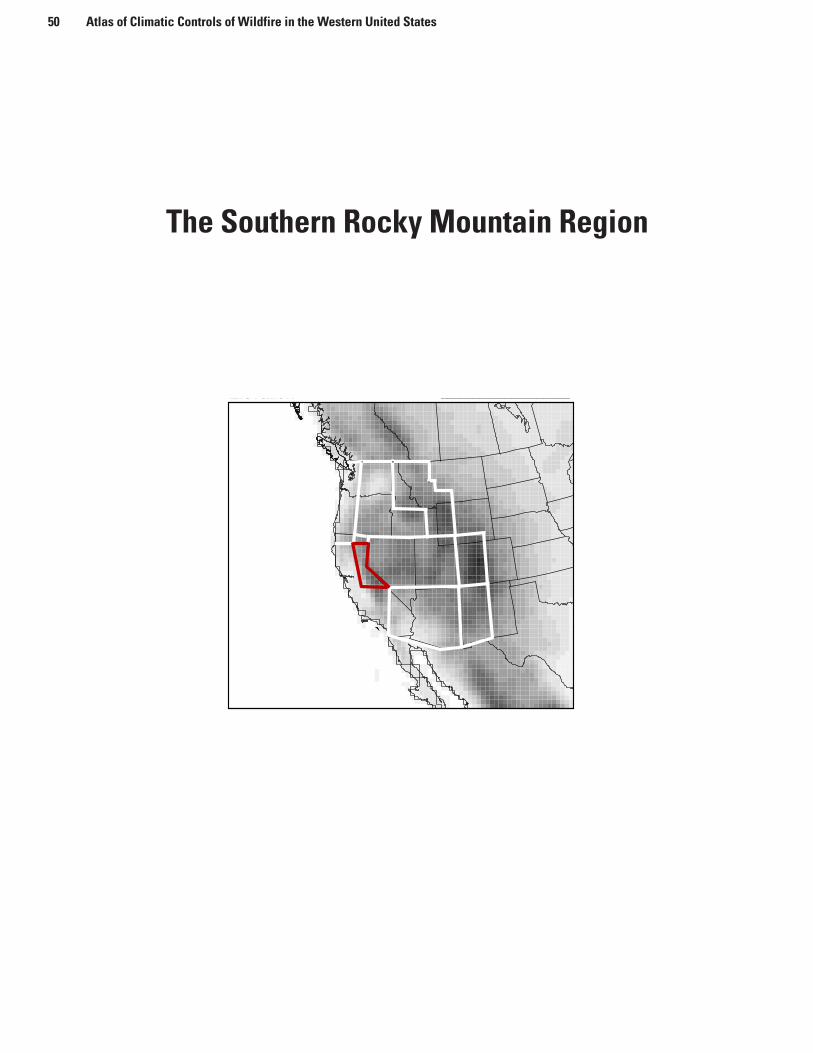
The Southern Rocky Mountain Region
0 400 800 1200 1600 2000 2400 2800 3200 3400 m
Elevation
Mask
50 Atlas of Climatic Controls of Wildfire in the Western United States
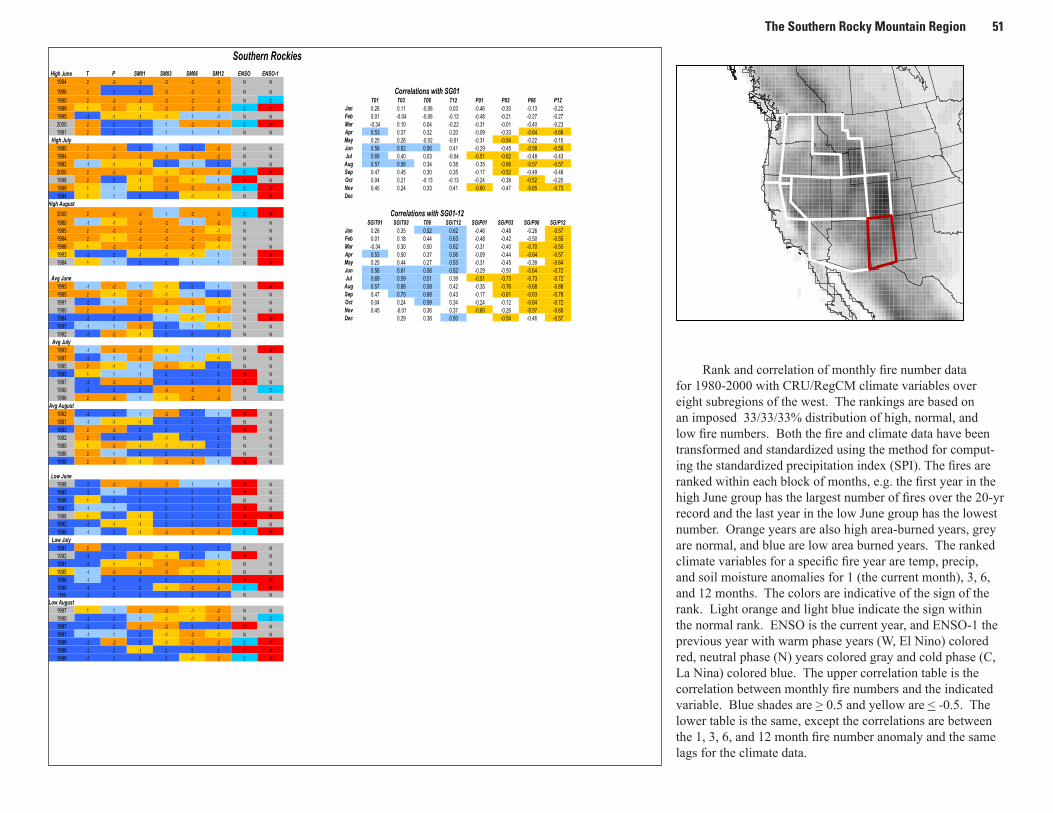
The Southern Rocky Mountain Region 51
Southern RockiesHigh June T P SM01 SM03 SM06 SM12 ENSO ENSO-1
1994 2 -2 -2 -2 -2 -2 N N
1996 2 2 2 -2 -2 -2 N N Correlations with SG011990 2 -2 -2 -2 -2 -2 N C T01 T03 T06 T12 P01 P03 P06 P121989 1 -2 -1 -2 -2 -2 C W Jan 0.26 0.11 -0.06 0.03 -0.46 -0.30 -0.13 -0.221995 -2 -1 -1 -1 1 -1 N N Feb 0.01 -0.04 -0.06 -0.12 -0.48 -0.21 -0.27 -0.272000 2 2 2 1 -2 -2 C W Mar -0.34 0.10 0.04 -0.22 -0.31 -0.01 -0.40 -0.231981 2 2 2 1 1 1 N N Apr 0.53 0.37 0.32 0.20 -0.09 -0.33 -0.64 -0.66
High July May 0.25 0.26 -0.02 -0.01 -0.31 -0.54 -0.22 -0.151980 2 -2 2 1 2 -2 N N Jun 0.58 0.62 0.56 0.41 -0.29 -0.45 -0.58 -0.551994 2 -2 -2 -2 -2 -2 N N Jul 0.69 0.40 0.03 -0.04 -0.51 -0.62 -0.48 -0.431982 -1 -1 -1 2 1 2 N N Aug 0.57 0.56 0.34 0.38 -0.35 -0.66 -0.57 -0.572000 2 -2 -2 -1 -2 -2 C W Sep 0.47 0.45 0.30 0.35 -0.17 -0.52 -0.49 -0.481998 2 2 -1 -2 -1 1 W N Oct 0.04 0.21 -0.13 -0.13 -0.24 -0.38 -0.52 -0.201989 1 1 -1 -2 -2 -2 C W Nov 0.45 0.24 0.33 0.41 -0.60 -0.47 -0.65 -0.731984 1 1 2 2 -1 1 N W Dec
High August
2000 2 -2 -2 1 -2 -2 C W Correlations with SG01-121980 -1 -1 -2 -2 1 -2 N N SG/T01 SG/T03 T06 SG/T12 SG/P01 SG/P03 SG/P06 SG/P121995 2 -2 -2 -2 -2 -1 N N Jan 0.26 0.35 0.52 0.62 -0.46 -0.48 -0.26 -0.571994 2 1 -2 -2 -2 -2 N N Feb 0.01 0.18 0.44 0.63 -0.48 -0.42 -0.50 -0.551996 1 -2 -2 -2 -2 -1 N N Mar -0.34 0.30 0.50 0.62 -0.31 -0.40 -0.70 -0.551993 -2 2 -1 -1 -1 1 N W Apr 0.53 0.50 0.37 0.56 -0.09 -0.44 -0.64 -0.571984 1 1 2 2 1 1 N W May 0.25 0.44 0.27 0.53 -0.31 -0.45 -0.39 -0.64
Jun 0.58 0.61 0.58 0.52 -0.29 -0.50 -0.64 -0.72Avg June Jul 0.69 0.59 0.51 0.39 -0.51 -0.73 -0.73 -0.72
1993 -1 -2 1 -1 2 1 N W Aug 0.57 0.68 0.58 0.42 -0.35 -0.76 -0.68 -0.881985 2 -1 -2 -1 1 2 N N Sep 0.47 0.70 0.68 0.43 -0.17 -0.61 -0.63 -0.781991 -2 1 -2 -2 -2 -1 N N Oct 0.04 0.24 0.59 0.34 -0.24 -0.12 -0.64 -0.721980 2 -2 -2 -1 1 -2 N N Nov 0.45 -0.01 0.36 0.37 -0.60 -0.26 -0.57 -0.601984 -2 2 2 1 -1 1 N W Dec 0.29 0.38 0.50 -0.54 -0.46 -0.571997 -1 1 -2 2 1 -1 N N
1982 -2 -2 -1 2 2 2 N NAvg July
1993 -1 -2 -2 -1 1 1 N W
1997 -2 1 -2 1 1 -1 N N
1985 2 -1 1 -2 -1 2 N N
1983 1 1 -1 2 2 2 W N
1987 -2 -2 -2 2 2 2 W N
1990 -2 2 2 -2 -2 -2 N C
1996 2 -2 1 -1 -2 -2 N NAvg August
1992 -2 2 1 -2 2 1 W N
1981 -1 -1 -1 2 2 2 N N
1983 2 -2 2 2 2 2 W N
1982 2 2 2 -1 2 2 N N
1985 1 -2 -1 -1 1 2 N N
1986 2 1 2 2 2 2 N N
1998 2 -2 -1 -2 -2 1 W N
Low June1998 -2 -2 -2 -2 1 1 W N
1983 -2 1 2 2 2 2 W N
1986 1 2 2 2 2 2 N N
1987 -1 1 2 2 2 2 W N
1988 1 2 -1 2 2 2 W W
1992 -2 -1 -1 2 2 2 W N
1999 -1 2 -1 -2 -2 -2 C WLow July
1981 2 2 2 2 2 2 N N
1992 -2 2 -2 -1 2 1 W N
1991 -2 1 -1 -2 -2 -1 N N
1995 -1 -2 -2 -2 -1 -1 N N
1988 -1 2 2 2 2 2 W W
1999 -2 2 2 -1 -2 -2 C W1986 -2 2 2 2 2 2 N N
Low August1997 1 1 -2 -2 -1 -2 N N
1990 -2 2 1 -1 -1 -2 N C
1987 -2 2 -2 -2 2 2 W N
1991 -1 1 2 -1 -2 -1 N N
1989 -2 -2 2 -1 -2 -2 C W
1988 -2 2 -1 2 2 2 W W
1999 -2 2 2 2 -1 -2 C W
Rank and correlation of monthly fire number data for 1980-2000 with CRU/RegCM climate variables over eight subregions of the west. The rankings are based on an imposed 33/33/33% distribution of high, normal, and low fire numbers. Both the fire and climate data have been transformed and standardized using the method for comput-ing the standardized precipitation index (SPI). The fires are ranked within each block of months, e.g. the first year in the high June group has the largest number of fires over the 20-yr record and the last year in the low June group has the lowest number. Orange years are also high area-burned years, grey are normal, and blue are low area burned years. The ranked climate variables for a specific fire year are temp, precip, and soil moisture anomalies for 1 (the current month), 3, 6, and 12 months. The colors are indicative of the sign of the rank. Light orange and light blue indicate the sign within the normal rank. ENSO is the current year, and ENSO-1 the previous year with warm phase years (W, El Nino) colored red, neutral phase (N) years colored gray and cold phase (C, La Nina) colored blue. The upper correlation table is the correlation between monthly fire numbers and the indicated variable. Blue shades are > 0.5 and yellow are < -0.5. The lower table is the same, except the correlations are between the 1, 3, 6, and 12 month fire number anomaly and the same lags for the climate data.
0 400 800 1200 1600 2000 2400 2800 3200 3400 m
Elevation
Mask

52 Atlas of Climatic Controls of Wildfire in the Western United States
01 03 06 12 01 03 06 12 01 03 06 12
H500
SLP
Precip
Fire
Low-Normal High-Low
Smois
Tair
JuneHigh-Normal
0 400 800 1200 1600 2000 2400 2800 3200 3400 m
Elevation
Mask
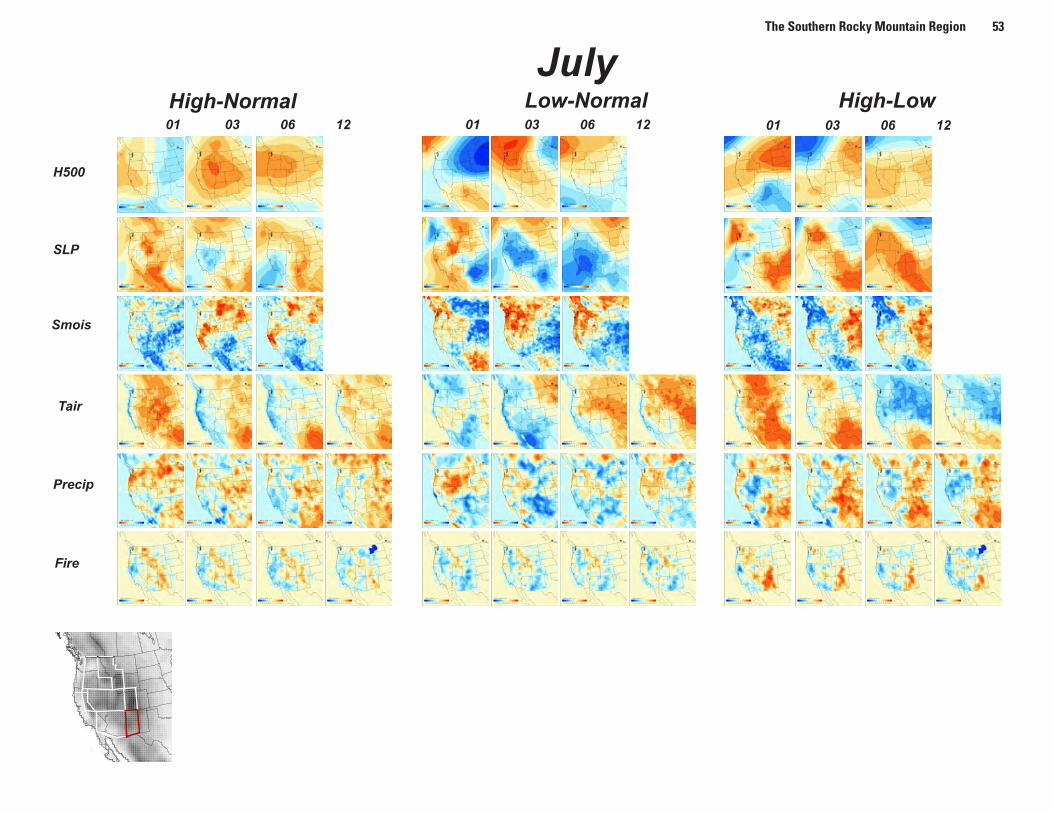
The Southern Rocky Mountain Region 53
01 03 06 12 01 03 06 12 01 03 06 12
H500
SLP
Precip
Fire
Low-Normal High-Low
Smois
Tair
JulyHigh-Normal
0 400 800 1200 1600 2000 2400 2800 3200 3400 m
Elevation
Mask
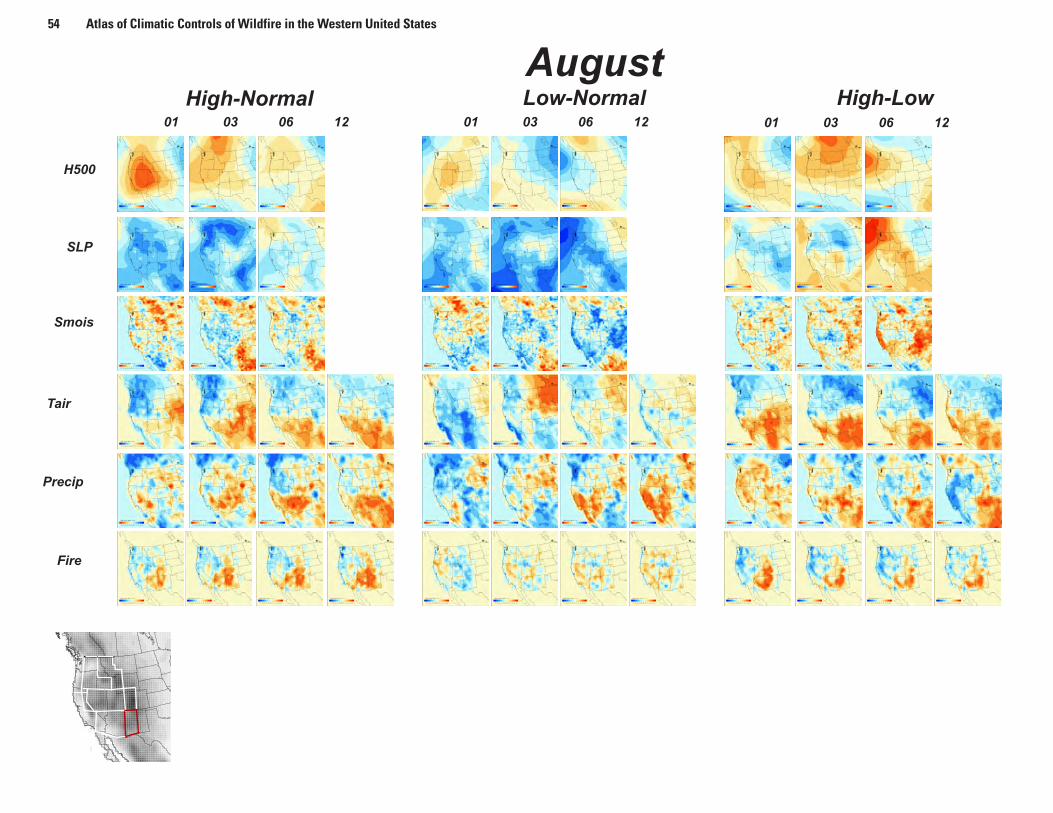
54 Atlas of Climatic Controls of Wildfire in the Western United States
01 03 06 12 01 03 06 12 01 03 06 12
H500
SLP
Precip
Fire
Low-Normal High-Low
Smois
Tair
AugustHigh-Normal
0 400 800 1200 1600 2000 2400 2800 3200 3400 m
Elevation
Mask
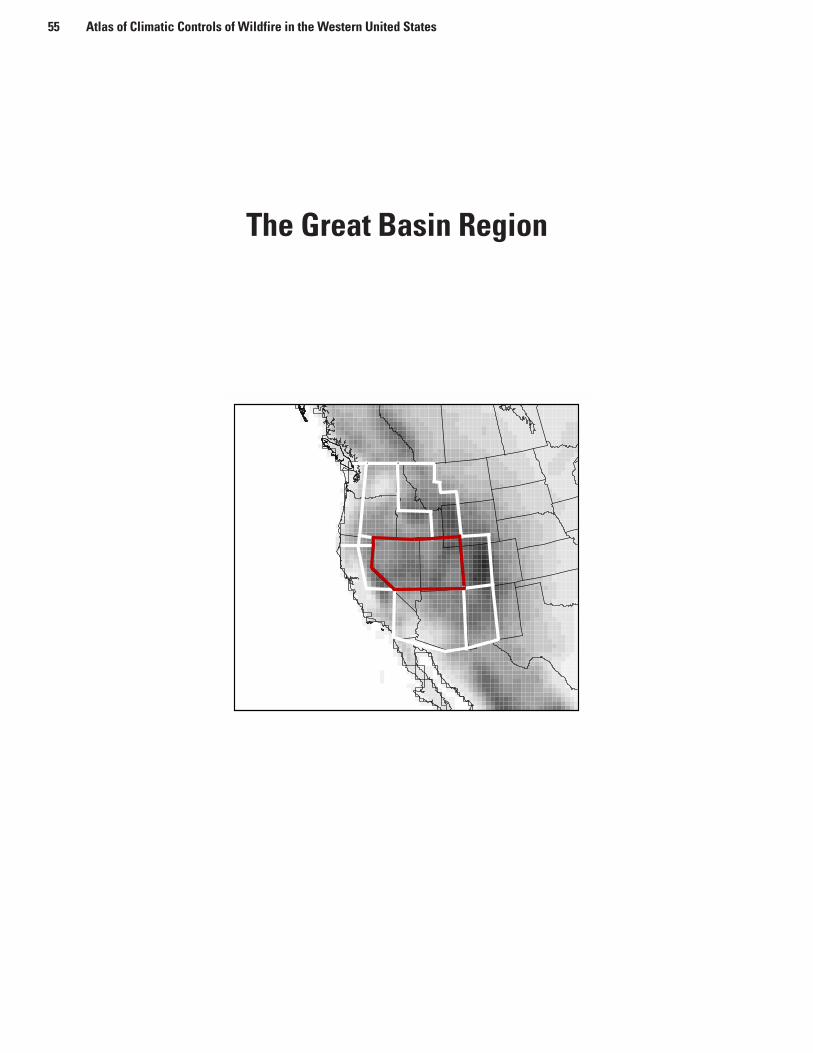
The Great Basin Region
0 400 800 1200 1600 2000 2400 2800 3200 3400 m
Elevation
Mask
55 Atlas of Climatic Controls of Wildfire in the Western United States
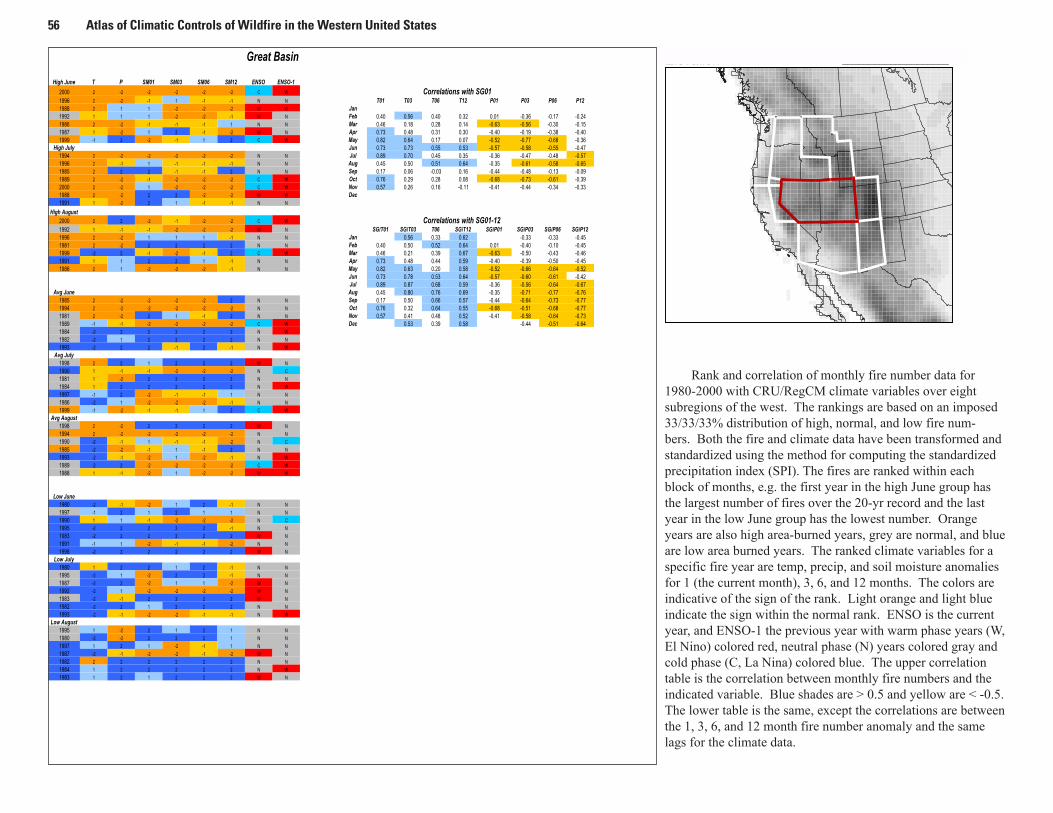
56 Atlas of Climatic Controls of Wildfire in the Western United States
Great Basin
High June T P SM01 SM03 SM06 SM12 ENSO ENSO-1
2000 2 -2 -2 -2 -2 -2 C W Correlations with SG011996 2 -2 -1 1 -1 -1 N N T01 T03 T06 T12 P01 P03 P06 P121988 2 1 1 -2 -2 -2 W W Jan1992 1 1 1 -2 -2 -1 W N Feb 0.40 0.56 0.40 0.32 0.01 -0.36 -0.17 -0.241986 2 -2 -1 -1 -1 1 N N Mar 0.46 0.18 0.28 0.14 -0.63 -0.56 -0.30 -0.151987 1 -2 1 2 -1 -2 W N Apr 0.73 0.48 0.31 0.30 -0.40 -0.19 -0.38 -0.401999 -1 2 -2 -1 1 2 C W May 0.82 0.64 0.17 0.07 -0.52 -0.77 -0.68 -0.36
High July Jun 0.73 0.73 0.55 0.53 -0.57 -0.58 -0.55 -0.471994 2 -2 -2 -2 -2 -2 N N Jul 0.89 0.70 0.45 0.35 -0.36 -0.47 -0.48 -0.571996 2 -1 1 -1 -1 -1 N N Aug 0.45 0.50 0.51 0.64 -0.35 -0.61 -0.58 -0.651985 2 2 2 -1 -1 2 N N Sep 0.17 0.06 -0.03 0.16 -0.44 -0.48 -0.13 -0.091989 2 -2 -1 -2 -2 -2 C W Oct 0.76 0.29 0.28 0.08 -0.68 -0.73 -0.61 -0.392000 2 -2 1 -2 -2 -2 C W Nov 0.57 0.26 0.16 -0.11 -0.41 -0.44 -0.34 -0.331988 2 -2 2 2 -2 -2 W W Dec1991 1 -2 2 1 -1 -1 N N
High August2000 2 2 -2 -1 -2 -2 C W
1992 1 -1 -1 -2 -2 -2 W N SG/T01 SG/T03 T06 SG/T12 SG/P01 SG/P03 SG/P06 SG/P121996 2 -2 1 1 1 -1 N N Jan 0.56 0.33 0.62 -0.33 -0.33 -0.451981 2 -2 2 2 2 2 N N Feb 0.40 0.50 0.52 0.64 0.01 -0.40 -0.10 -0.451999 -2 2 -1 -2 -1 2 C W Mar 0.46 0.21 0.39 0.67 -0.63 -0.50 -0.43 -0.461991 1 1 2 2 1 -1 N N Apr 0.73 0.48 0.44 0.59 -0.40 -0.39 -0.50 -0.451986 2 1 -2 -2 -2 -1 N N May 0.82 0.63 0.20 0.58 -0.52 -0.66 -0.64 -0.52
Jun 0.73 0.78 0.53 0.64 -0.57 -0.60 -0.61 -0.42Jul 0.89 0.87 0.68 0.59 -0.36 -0.56 -0.64 -0.67
Avg June Aug 0.45 0.80 0.76 0.69 -0.35 -0.71 -0.77 -0.761985 2 -2 -2 -2 -2 2 N N Sep 0.17 0.50 0.66 0.57 -0.44 -0.64 -0.73 -0.771994 2 -2 -2 -2 -2 -2 N N Oct 0.76 0.32 0.64 0.55 -0.68 -0.51 -0.68 -0.771981 2 -2 2 1 -1 2 N N Nov 0.57 0.41 0.48 0.52 -0.41 -0.58 -0.64 -0.731989 -1 -1 -2 -2 -2 -2 C W Dec 0.53 0.39 0.58 -0.44 -0.51 -0.641984 -2 2 2 2 2 2 N W
1982 -2 1 2 2 2 2 N N
1993 -2 2 2 -1 2 -1 N WAvg July
1998 2 2 1 2 2 2 W N
1990 1 -1 -1 -2 -2 -2 N C
1981 1 -2 2 2 2 2 N N
1984 1 2 2 2 2 2 N W
1997 -1 2 -2 -1 -1 1 N N
1986 -2 1 -2 -2 -2 -1 N N
1999 -1 -2 -1 -1 1 2 C WAvg August
1998 2 -2 2 2 2 2 W N
1994 2 -2 -2 -2 -2 -2 N N
1990 -2 -1 1 -1 -1 -2 N C
1985 -2 -2 -1 1 -1 2 N N
1993 -2 -1 -2 1 -2 -1 N W
1989 -2 2 -2 -2 -2 -2 C W
1988 1 -1 -2 1 -2 -2 W W
Low June1980 -2 -1 -2 1 2 -1 N N
1997 -1 2 1 2 1 1 N N
1990 1 1 -1 -2 -2 -2 N C
1995 -2 2 2 2 2 -1 N N
1983 -2 2 2 2 2 2 W N
1991 -1 1 -2 -1 -1 -2 N N
1998 -2 2 2 2 2 2 W NLow July
1980 1 2 2 1 2 -1 N N
1995 -2 1 -2 2 2 -1 N N
1987 -2 2 -2 1 1 -2 W N
1992 -2 1 -2 -2 -2 -2 W N
1983 -2 -1 2 2 2 2 W N
1982 -2 2 1 2 2 2 N N
1993 -2 -1 -2 -2 -1 -1 N WLow August
1995 1 -2 2 1 2 1 N N
1980 -2 -2 2 2 2 1 N N
1997 1 2 1 -2 -1 1 N N
1987 -2 -1 -2 -2 -1 -2 W N
1982 2 2 2 2 2 2 N N
1984 1 2 2 2 2 2 N W
1983 1 2 1 2 2 2 W N
Correlations with SG01-12
0 400 800 1200 1600 2000 2400 2800 3200 3400 m
Elevation
Mask
Rank and correlation of monthly fire number data for 1980-2000 with CRU/RegCM climate variables over eight subregions of the west. The rankings are based on an imposed 33/33/33% distribution of high, normal, and low fire num-bers. Both the fire and climate data have been transformed and standardized using the method for computing the standardized precipitation index (SPI). The fires are ranked within each block of months, e.g. the first year in the high June group has the largest number of fires over the 20-yr record and the last year in the low June group has the lowest number. Orange years are also high area-burned years, grey are normal, and blue are low area burned years. The ranked climate variables for a specific fire year are temp, precip, and soil moisture anomalies for 1 (the current month), 3, 6, and 12 months. The colors are indicative of the sign of the rank. Light orange and light blue indicate the sign within the normal rank. ENSO is the current year, and ENSO-1 the previous year with warm phase years (W, El Nino) colored red, neutral phase (N) years colored gray and cold phase (C, La Nina) colored blue. The upper correlation table is the correlation between monthly fire numbers and the indicated variable. Blue shades are > 0.5 and yellow are < -0.5. The lower table is the same, except the correlations are between the 1, 3, 6, and 12 month fire number anomaly and the same lags for the climate data.

The Great Basin Region 57
01 03 06 12 01 03 06 12 01 03 06 12
H500
SLP
Precip
Fire
Low-Normal High-Low
Smois
Tair
JuneHigh-Normal
0 400 800 1200 1600 2000 2400 2800 3200 3400 m
Elevation
Mask
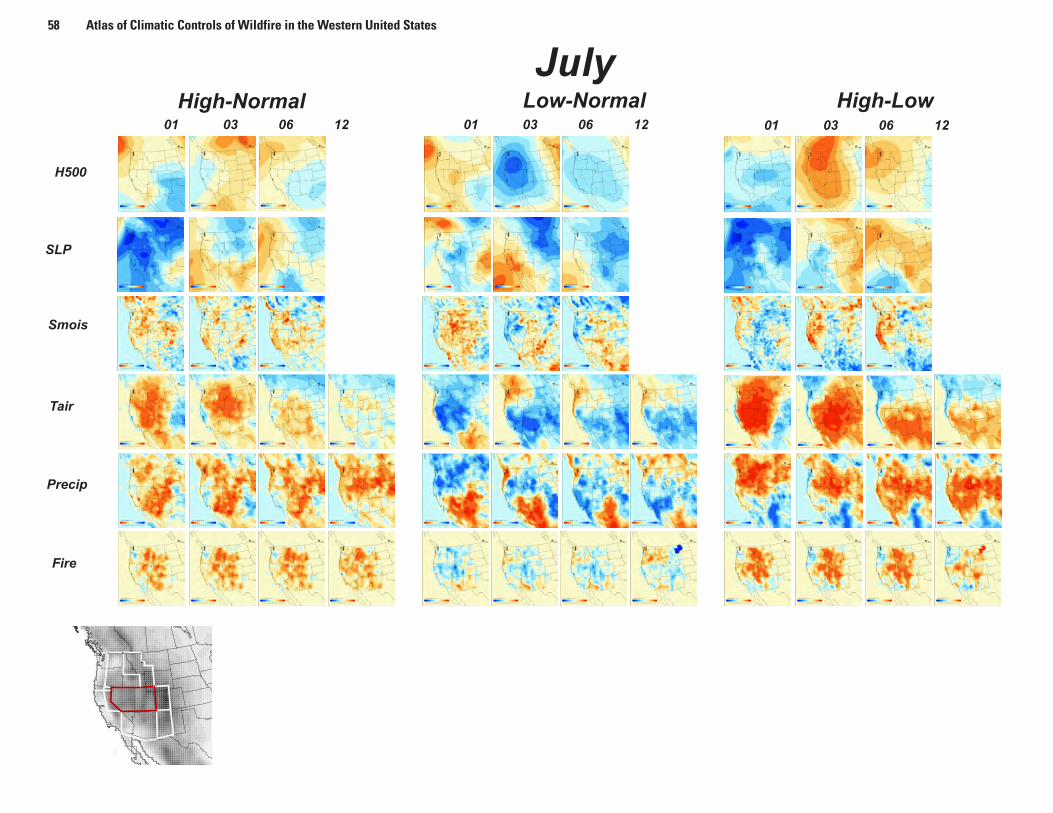
58 Atlas of Climatic Controls of Wildfire in the Western United States
01 03 06 12 01 03 06 12 01 03 06 12
H500
SLP
Precip
Fire
Low-Normal High-Low
Smois
Tair
JulyHigh-Normal
0 400 800 1200 1600 2000 2400 2800 3200 3400 m
Elevation
Mask

The Great Basin Region 59
01 03 06 12 01 03 06 12 01 03 06 12
H500
SLP
Precip
Fire
Low-Normal High-Low
Smois
Tair
AugustHigh-Normal
0 400 800 1200 1600 2000 2400 2800 3200 3400 m
Elevation
Mask

The Southwest Region
60 Atlas of Climatic Controls of Wildfire in the Western United States
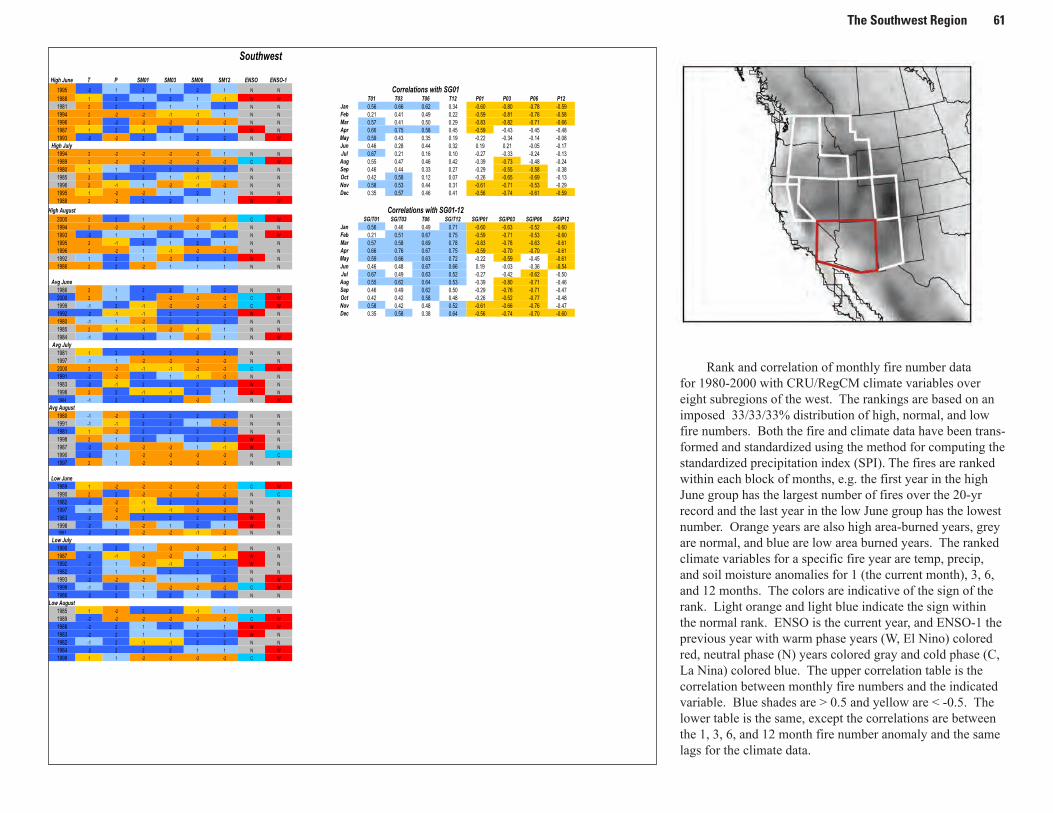
The Southwest Region 61
Rank and correlation of monthly fire number data for 1980-2000 with CRU/RegCM climate variables over eight subregions of the west. The rankings are based on an imposed 33/33/33% distribution of high, normal, and low fire numbers. Both the fire and climate data have been trans-formed and standardized using the method for computing the standardized precipitation index (SPI). The fires are ranked within each block of months, e.g. the first year in the high June group has the largest number of fires over the 20-yr record and the last year in the low June group has the lowest number. Orange years are also high area-burned years, grey are normal, and blue are low area burned years. The ranked climate variables for a specific fire year are temp, precip, and soil moisture anomalies for 1 (the current month), 3, 6, and 12 months. The colors are indicative of the sign of the rank. Light orange and light blue indicate the sign within the normal rank. ENSO is the current year, and ENSO-1 the previous year with warm phase years (W, El Nino) colored red, neutral phase (N) years colored gray and cold phase (C, La Nina) colored blue. The upper correlation table is the correlation between monthly fire numbers and the indicated variable. Blue shades are > 0.5 and yellow are < -0.5. The lower table is the same, except the correlations are between the 1, 3, 6, and 12 month fire number anomaly and the same lags for the climate data.
Southwest
High June T P SM01 SM03 SM06 SM12 ENSO ENSO-1
1995 -2 1 2 1 2 1 N N Correlations with SG011988 1 2 1 2 1 -1 W W T01 T03 T06 T12 P01 P03 P06 P121981 2 2 2 1 1 2 N N Jan 0.56 0.66 0.62 0.34 -0.60 -0.80 -0.78 -0.591994 2 -2 -2 -1 -1 1 N N Feb 0.21 0.41 0.49 0.22 -0.59 -0.81 -0.76 -0.581996 2 -2 -2 -2 -2 -2 N N Mar 0.57 0.41 0.50 0.29 -0.83 -0.82 -0.71 -0.661987 1 2 -1 2 1 1 W N Apr 0.66 0.75 0.58 0.45 -0.59 -0.43 -0.45 -0.481993 -2 -2 2 1 2 2 N W May 0.59 0.43 0.35 0.19 -0.22 -0.34 -0.14 -0.08
High July Jun 0.46 0.28 0.44 0.32 0.19 0.21 -0.05 -0.171994 2 -2 -2 -2 -2 1 N N Jul 0.67 0.21 0.16 0.10 -0.27 -0.33 -0.24 -0.131989 2 -2 -2 -2 -2 -2 C W Aug 0.55 0.47 0.46 0.42 -0.39 -0.73 -0.48 -0.241980 1 1 2 2 2 2 N N Sep 0.46 0.44 0.33 0.27 -0.29 -0.55 -0.58 -0.381985 2 2 2 1 -1 1 N N Oct 0.42 0.58 0.12 0.07 -0.26 -0.65 -0.69 -0.131996 2 -1 1 -2 -1 -2 N N Nov 0.58 0.53 0.44 0.31 -0.61 -0.71 -0.53 -0.291995 1 -2 -2 1 2 1 N N Dec 0.35 0.57 0.46 0.41 -0.56 -0.74 -0.61 -0.591988 2 -2 2 2 1 1 W W
High August Correlations with SG01-122000 2 2 1 1 -2 -2 C W SG/T01 SG/T03 T06 SG/T12 SG/P01 SG/P03 SG/P06 SG/P121994 2 -2 -2 -2 -2 -1 N N Jan 0.56 0.46 0.49 0.71 -0.60 -0.63 -0.52 -0.601993 -2 1 1 2 1 2 N W Feb 0.21 0.51 0.67 0.75 -0.59 -0.71 -0.53 -0.601995 2 -1 2 1 2 1 N N Mar 0.57 0.58 0.69 0.78 -0.83 -0.78 -0.63 -0.611996 2 -2 1 -1 -2 -2 N N Apr 0.66 0.76 0.67 0.75 -0.59 -0.70 -0.70 -0.611992 1 2 1 -2 2 2 W N May 0.59 0.66 0.63 0.72 -0.22 -0.59 -0.45 -0.611986 2 2 -2 1 1 1 N N Jun 0.46 0.48 0.67 0.66 0.19 -0.03 -0.36 -0.54
Jul 0.67 0.49 0.63 0.52 -0.27 -0.42 -0.62 -0.50Avg June Aug 0.55 0.62 0.64 0.53 -0.39 -0.80 -0.71 -0.46
1986 2 1 2 2 1 2 N N Sep 0.46 0.49 0.62 0.50 -0.29 -0.76 -0.71 -0.472000 2 1 2 -2 -2 -2 C W Oct 0.42 0.42 0.58 0.48 -0.26 -0.52 -0.77 -0.481999 -1 2 -1 -2 -2 -2 C W Nov 0.58 0.42 0.48 0.52 -0.61 -0.66 -0.76 -0.471992 -2 -1 -1 2 2 2 W N Dec 0.35 0.58 0.38 0.64 -0.56 -0.74 -0.70 -0.601980 -1 1 -2 2 2 2 N N
1985 2 -1 -1 -2 -1 1 N N
1984 -1 2 2 1 -2 1 N WAvg July
1981 1 2 2 2 2 2 N N
1997 -1 1 -2 -2 -2 -2 N N
2000 2 -2 -1 -1 -2 -2 C W
1991 -2 -2 2 1 -1 -2 N N
1983 -2 -1 2 2 2 2 W N
1998 2 2 -1 -1 2 1 W N1984 -1 2 2 2 -2 1 N W
Avg August1980 -1 -2 2 2 2 2 N N
1991 -1 -1 2 2 1 -2 N N
1981 1 -2 2 2 2 2 N N
1998 2 1 2 1 2 2 W N
1987 -2 -2 -2 -2 1 -1 W N
1990 -2 1 -2 -2 -2 -2 N C
1997 2 1 -2 -2 -2 -2 N N
Low June1989 1 -2 -2 -2 -2 -2 C W
1990 2 2 -2 -2 -2 -2 N C
1982 -2 -2 -1 2 2 2 N N
1997 -1 -2 -1 -1 -2 -2 N N
1983 -2 -2 2 2 2 2 W N
1998 -2 1 -2 1 2 1 W N1991 -2 2 -2 -2 -1 -2 N N
Low July1990 -1 2 1 -2 -2 -2 N N
1987 -2 -1 -2 -2 1 -1 W N
1992 -2 1 -2 -1 2 2 W N
1982 -2 1 1 2 2 2 N N
1993 -2 -2 -2 1 1 2 N W
1999 -1 2 1 -2 -2 -2 C W
1986 -2 2 1 2 1 2 N NLow August
1985 1 -2 2 2 -1 1 N N
1989 -2 -2 -2 -2 -2 -2 C W
1988 -2 2 1 2 1 1 W W
1983 -2 2 1 1 2 2 W N
1982 -1 2 -1 -1 2 2 N N
1984 -2 2 2 2 1 1 N W
1999 1 1 -2 -2 -2 -2 C W
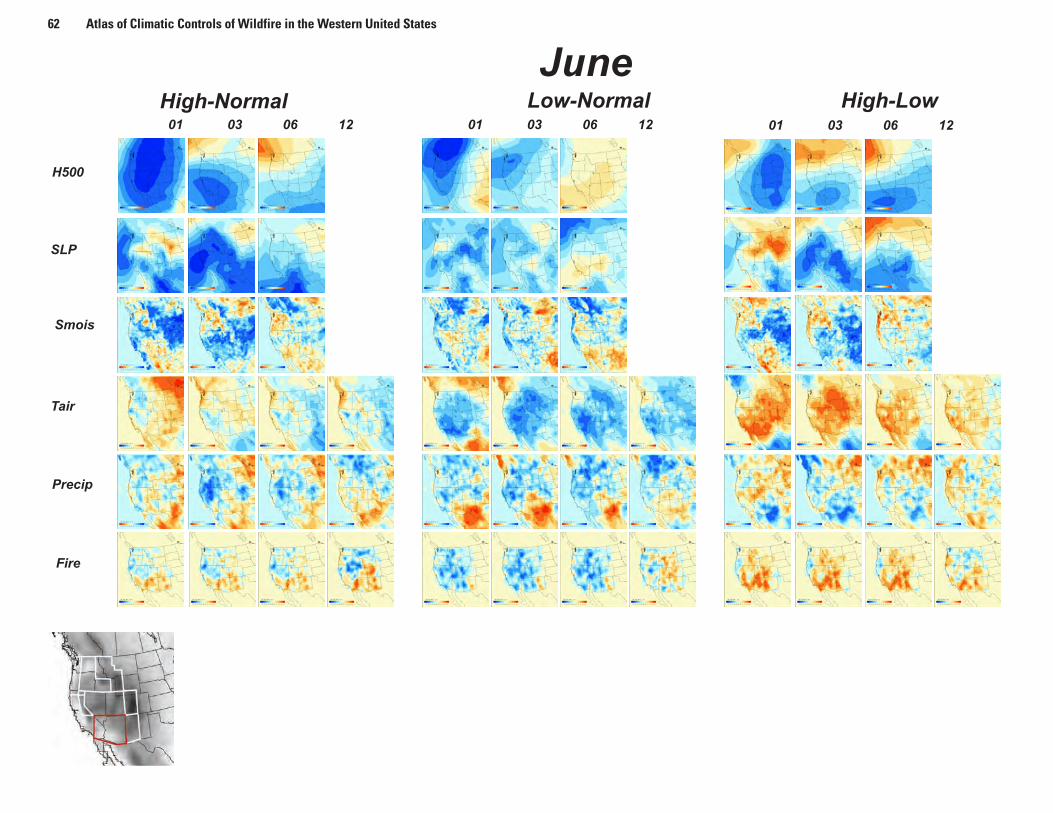
62 Atlas of Climatic Controls of Wildfire in the Western United States
01 03 06 12 01 03 06 12 01 03 06 12
H500
SLP
Precip
Fire
Low-Normal High-Low
Smois
Tair
JuneHigh-Normal
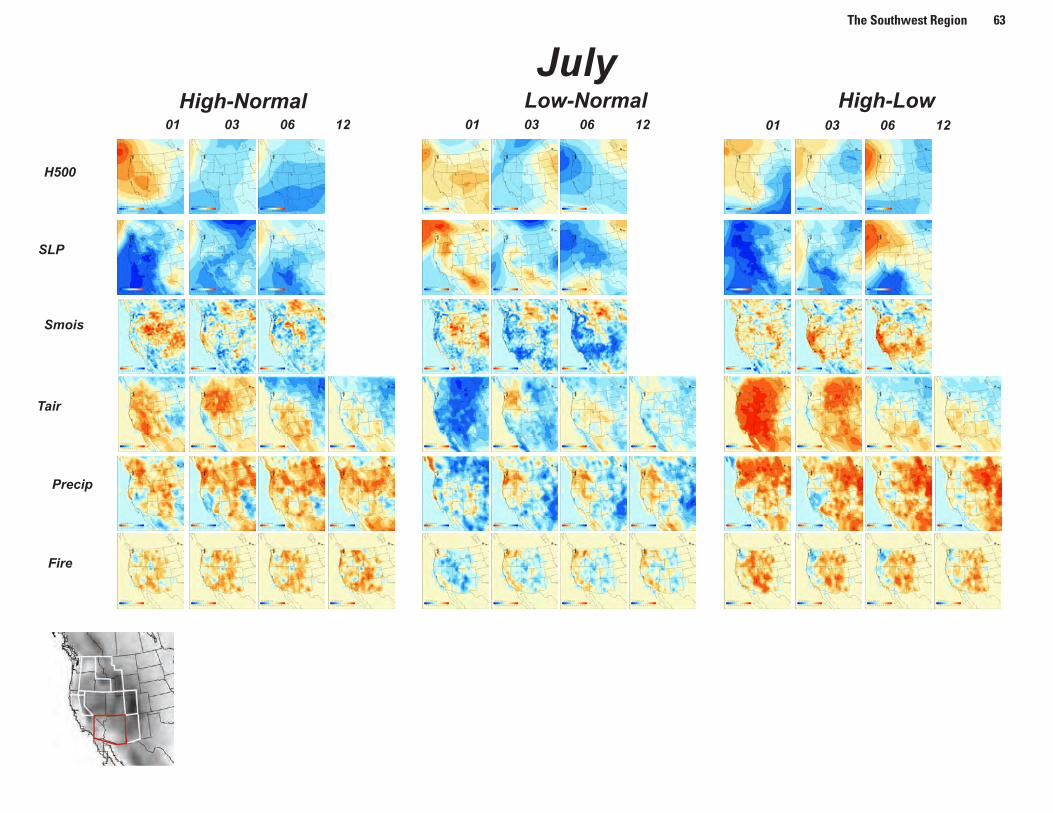
The Southwest Region 63
01 03 06 12 01 03 06 12 01 03 06 12
H500
SLP
Precip
Fire
Low-Normal High-Low
Smois
Tair
JulyHigh-Normal

64 Atlas of Climatic Controls of Wildfire in the Western United States
01 03 06 12 01 03 06 12 01 03 06 12
H500
SLP
Precip
Fire
Low-Normal High-Low
Smois
Tair
AugustHigh-Normal
The Sierra Nevada Region
0 400 800 1200 1600 2000 2400 2800 3200 3400 m
Elevation
Mask65 Atlas of Climatic Controls of Wildfire in the Western United States
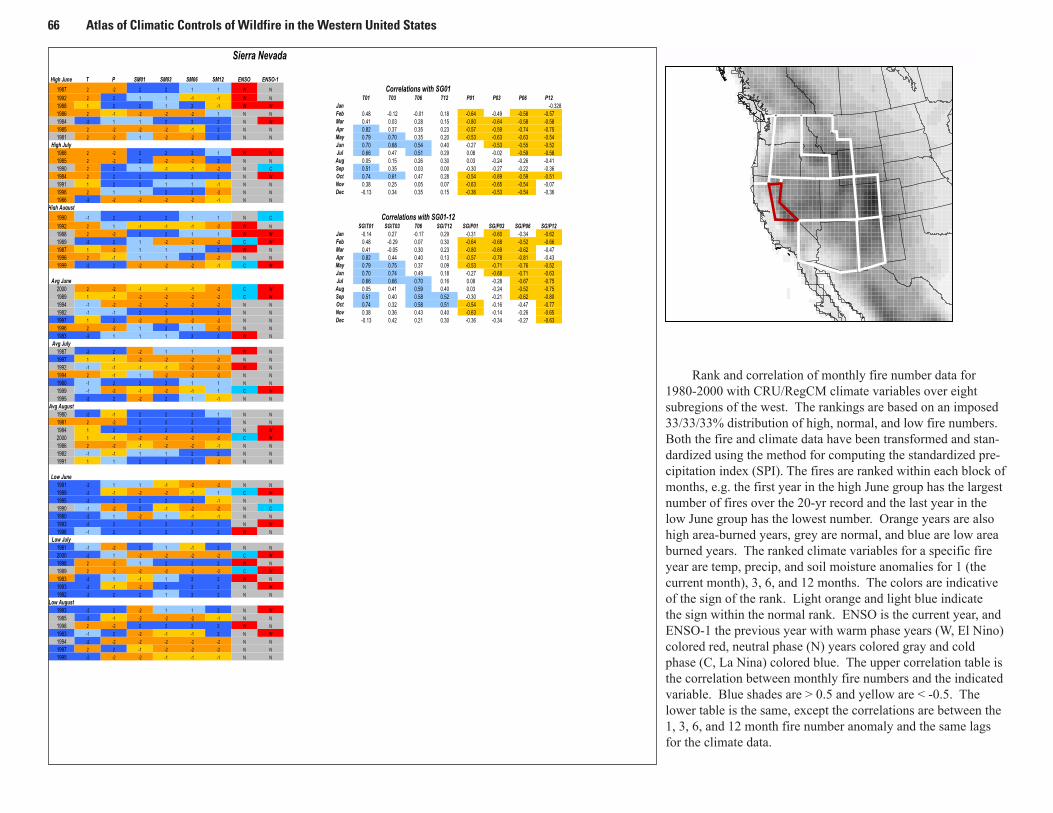
66 Atlas of Climatic Controls of Wildfire in the Western United States
Rank and correlation of monthly fire number data for 1980-2000 with CRU/RegCM climate variables over eight subregions of the west. The rankings are based on an imposed 33/33/33% distribution of high, normal, and low fire numbers. Both the fire and climate data have been transformed and stan-dardized using the method for computing the standardized pre-cipitation index (SPI). The fires are ranked within each block of months, e.g. the first year in the high June group has the largest number of fires over the 20-yr record and the last year in the low June group has the lowest number. Orange years are also high area-burned years, grey are normal, and blue are low area burned years. The ranked climate variables for a specific fire year are temp, precip, and soil moisture anomalies for 1 (the current month), 3, 6, and 12 months. The colors are indicative of the sign of the rank. Light orange and light blue indicate the sign within the normal rank. ENSO is the current year, and ENSO-1 the previous year with warm phase years (W, El Nino) colored red, neutral phase (N) years colored gray and cold phase (C, La Nina) colored blue. The upper correlation table is the correlation between monthly fire numbers and the indicated variable. Blue shades are > 0.5 and yellow are < -0.5. The lower table is the same, except the correlations are between the 1, 3, 6, and 12 month fire number anomaly and the same lags for the climate data.
Sierra Nevada
High June T P SM01 SM03 SM06 SM12 ENSO ENSO-1
1987 2 -2 2 2 1 1 W N Correlations with SG011992 2 2 1 1 -1 -1 W N T01 T03 T06 T12 P01 P03 P06 P121988 1 2 2 1 2 -1 W W Jan -0.3281986 2 -1 -2 -2 -2 1 N N Feb 0.48 -0.12 -0.01 0.18 -0.64 -0.49 -0.58 -0.571984 -2 1 1 2 2 2 N W Mar 0.41 0.03 0.28 0.15 -0.80 -0.64 -0.58 -0.581985 2 -2 -2 -2 -1 2 N N Apr 0.82 0.37 0.35 0.23 -0.57 -0.59 -0.74 -0.751981 2 -2 1 -2 -2 2 N N May 0.79 0.70 0.35 0.20 -0.53 -0.63 -0.63 -0.54
High July Jun 0.70 0.68 0.54 0.40 -0.27 -0.53 -0.55 -0.521988 2 -2 2 2 2 1 W W Jul 0.66 0.47 0.51 0.29 0.08 -0.02 -0.59 -0.581985 2 -2 2 -2 -2 2 N N Aug 0.05 0.15 0.26 0.30 0.03 -0.24 -0.26 -0.411990 2 2 1 -1 -1 -2 N C Sep 0.51 0.35 0.03 0.00 -0.30 -0.27 -0.22 -0.361984 2 2 2 2 2 2 N W Oct 0.74 0.61 0.47 0.28 -0.54 -0.69 -0.59 -0.511991 1 2 2 1 1 -1 N N Nov 0.38 0.25 0.05 0.07 -0.63 -0.65 -0.54 -0.071996 2 1 1 2 2 -2 N N Dec -0.13 0.34 0.35 0.15 -0.36 -0.53 -0.54 -0.361986 -2 -2 -2 -2 -2 -1 N N
High August
1990 -1 2 2 2 1 1 N C Correlations with SG01-121992 2 1 -1 -1 -1 -2 W N SG/T01 SG/T03 T06 SG/T12 SG/P01 SG/P03 SG/P06 SG/P121988 2 -2 2 2 1 1 W W Jan -0.14 0.27 -0.17 0.29 -0.31 -0.60 -0.34 -0.621989 -2 2 1 -2 -2 -2 C W Feb 0.48 -0.29 0.07 0.30 -0.64 -0.68 -0.52 -0.661987 1 -2 1 1 1 2 W N Mar 0.41 -0.05 0.30 0.23 -0.80 -0.69 -0.62 -0.471996 2 -1 1 1 2 -2 N N Apr 0.82 0.44 0.40 0.13 -0.57 -0.78 -0.81 -0.431999 -2 2 -2 -2 -2 -1 C W May 0.79 0.75 0.37 0.09 -0.53 -0.71 -0.76 -0.52
Jun 0.70 0.74 0.49 0.18 -0.27 -0.68 -0.71 -0.63Avg June Jul 0.66 0.66 0.70 0.16 0.08 -0.28 -0.67 -0.75
2000 2 -2 -1 -1 -1 -2 C W Aug 0.05 0.41 0.59 0.40 0.03 -0.24 -0.52 -0.751989 1 -1 -2 -2 -2 -2 C W Sep 0.51 0.40 0.58 0.52 -0.30 -0.21 -0.62 -0.801994 -1 -2 -2 -2 -2 -2 N N Oct 0.74 0.32 0.58 0.51 -0.54 -0.16 -0.47 -0.771982 -1 -1 2 2 2 2 N N Nov 0.38 0.36 0.43 0.40 -0.63 -0.14 -0.26 -0.651997 1 2 -2 -2 -2 -2 N N Dec -0.13 0.42 0.21 0.30 -0.36 -0.34 -0.27 -0.631996 2 -2 1 2 1 -2 N N
1983 -2 1 1 1 2 2 W NAvg July
1987 -2 2 -2 1 1 1 W N
1997 1 -1 -2 -2 -2 -2 N N
1992 -1 -1 -1 -1 -2 -2 W N
1994 2 -1 1 -2 -2 -2 N N
1980 -1 2 2 2 1 1 N N
1999 -1 -2 -1 -2 -1 1 C W
1995 -2 2 -2 2 1 -1 N NAvg August
1980 -2 -1 2 2 2 1 N N
1981 2 -2 2 2 2 2 N N
1984 1 2 2 2 2 2 N W
2000 1 -1 -2 -2 -2 -2 C W
1986 2 -2 -1 -2 -2 -1 N N
1982 -1 -1 1 1 2 2 N N
1991 1 1 2 2 2 -2 N N
Low June1991 -2 1 1 -1 -2 -2 N N
1999 -2 -1 -2 -2 -1 1 C W
1995 -2 2 2 2 2 -1 N N
1990 -1 -2 2 -1 -2 -2 N C
1980 -2 1 -2 1 -1 -1 N N
1993 -2 2 2 2 2 2 N W
1998 -1 2 2 2 2 2 W NLow July
1981 -1 -2 2 1 -1 2 N N
2000 -2 1 -2 -2 -2 -2 C W
1998 2 -2 1 2 2 2 W N
1989 2 -2 -2 -2 -2 -2 C W
1983 -2 1 -1 1 2 2 W N
1993 -2 -1 -2 2 2 2 N W
1982 -2 2 2 1 2 2 N NLow August
1993 -2 2 -2 1 1 2 N W
1985 -2 -1 -2 -2 -2 -1 N N
1998 2 -2 2 2 2 2 W N
1983 -1 2 -2 -1 -1 2 N W
1994 -2 -2 -2 -2 -2 -2 N N
1997 2 2 -1 -2 -2 -2 N N
1995 -2 -2 -2 -1 -1 -1 N N
0 400 800 1200 1600 2000 2400 2800 3200 3400 m
Elevation
Mask
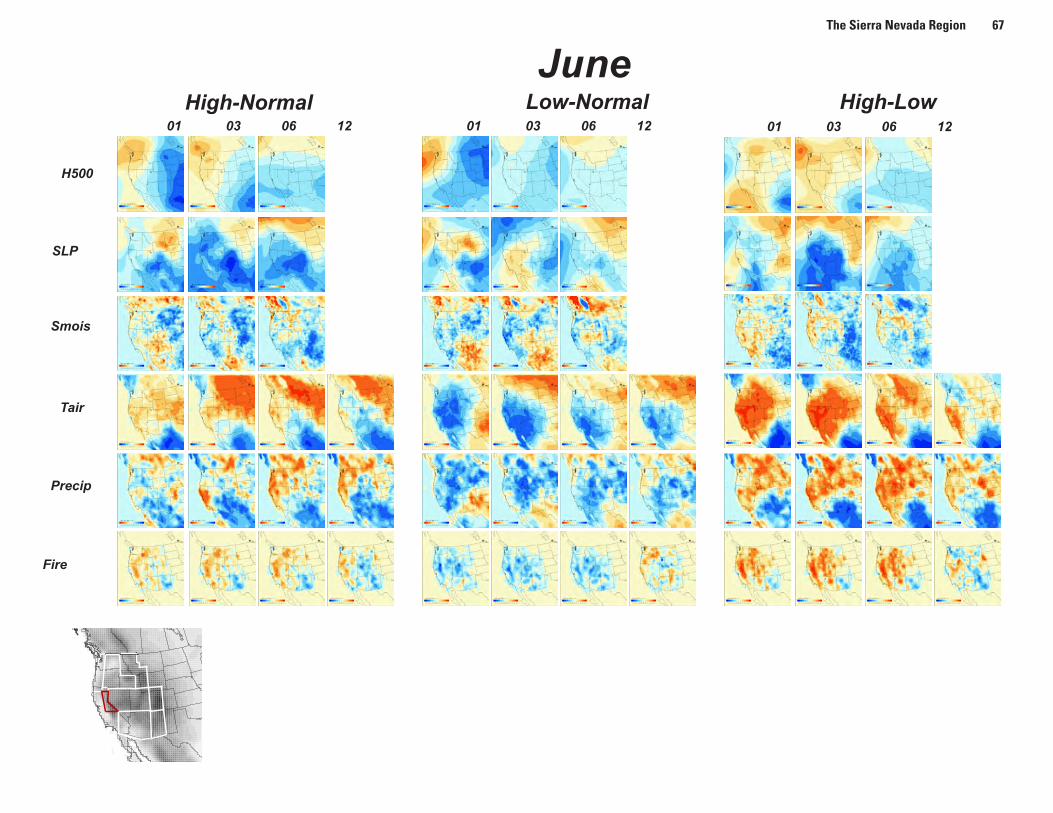
The Sierra Nevada Region 67
01 03 06 12 01 03 06 12 01 03 06 12
H500
SLP
Precip
Fire
Low-Normal High-Low
Smois
Tair
JuneHigh-Normal
0 400 800 1200 1600 2000 2400 2800 3200 3400 m
Elevation
Mask
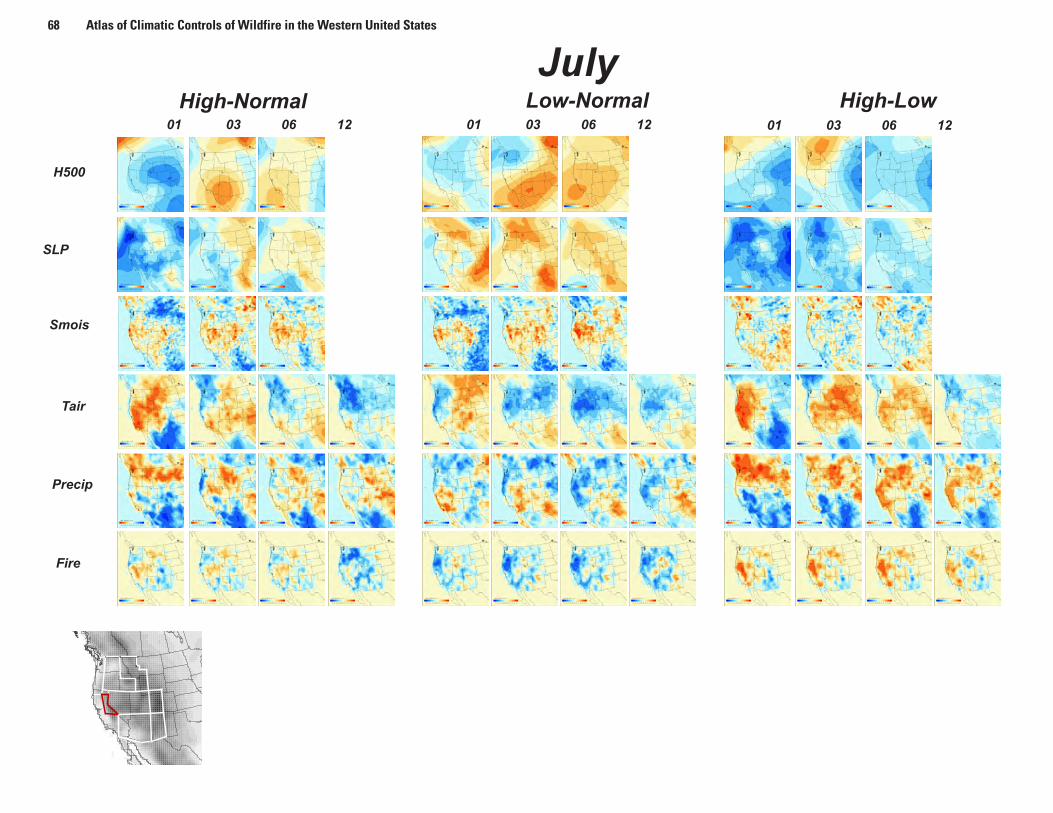
68 Atlas of Climatic Controls of Wildfire in the Western United States
01 03 06 12 01 03 06 12 01 03 06 12
H500
SLP
Precip
Fire
Low-Normal High-Low
Smois
Tair
JulyHigh-Normal
0 400 800 1200 1600 2000 2400 2800 3200 3400 m
Elevation
Mask
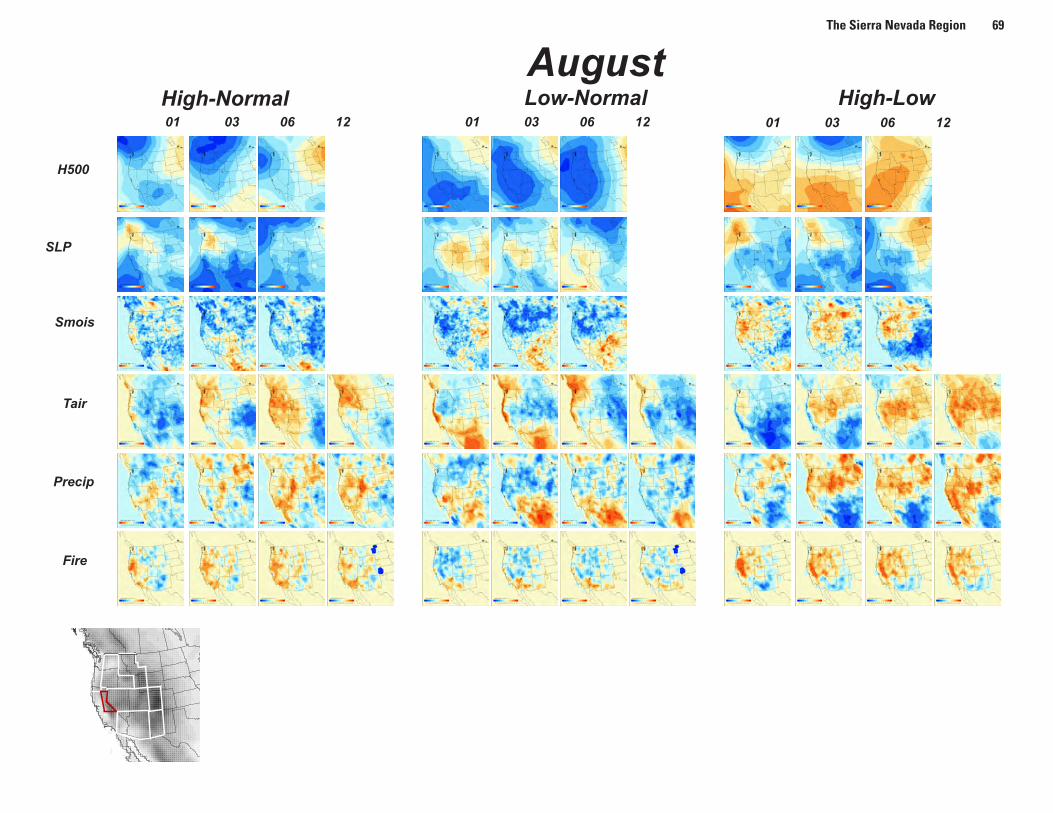
The Sierra Nevada Region 69
01 03 06 12 01 03 06 12 01 03 06 12
H500
SLP
Precip
Fire
Low-Normal High-Low
Smois
Tair
AugustHigh-Normal
0 400 800 1200 1600 2000 2400 2800 3200 3400 m
Elevation
Mask