Controls on the spatial pattern of wildfire ignitions in Southern California
13
Controls on the spatial pattern of wildfire ignitions in Southern California Nicolas Faivre A,C , Yufang Jin B , Michael L. Goulden A and James T. Randerson A A Department of Earth System Science, University of California, 2101 E Croul Hall, Irvine, CA 92697-3100, USA. B Department of Land, Air and Water Resources, University of California, Davis, CA 95616-8627, USA. C Corresponding author. Email: [email protected] Abstract. Wildfire ignition requires a combination of an open spark, and suitable weather and fuel conditions. Models of fire occurrence and burned area provide a good understanding of the physical and climatic factors that constrain and promote fire spread and recurrence, but information on how humans influence ignition patterns is still lacking at a scale compatible with integrated fire management. We investigated the relative importance of the physical, climatic and human factors regulating ignition probability across Southern California’s National Forests. A 30-year exploratory analysis of one-way relationships indicated that distance to a road, distance to housing and topographic slope were the major determinants of ignition frequency. We used logistic and Poisson regression analyses to model ignition occurrence and frequency as a function of the dominant covariates. The resulting models explained ,70% of the spatial variability in ignition likelihood and 45% of the variability in ignition frequency. In turn, predicted ignition probability contributed to some of the spatial variability in burned area, particularly for summer fires. These models may enable estimates of fire ignition risk for the broader domain of Southern California and how this risk may change with future population and housing development. Our spatially explicit predictions may also be useful for strategic fire management in the region. Additional keywords: biophysical drivers, fire frequency, fire ignition, human influence, Mediterranean ecosystems, spatial regression model, wildland fire risk. Received 21 August 2013, accepted 7 May 2014, published online 28 July 2014 Introduction Wildland fire regimes in Southern California are influenced by climate, ecosystem properties, the rate of human-caused ignition and fire suppression. More than 90% of the fires in Southern California are human ignited and rapid response often extin- guishes ignitions that could otherwise become large wildfires (Keeley 1982). Previous studies have reported that the fre- quency of small fires in coastal Southern California increased during the late 20th century (Keeley et al. 1999). Increasing population size and an expansion of housing into fire-prone wildland areas (Hammer et al. 2007) has increased ignition risk (Keeley and Fotheringham 2001), and when coupled with severe fire weather (e.g. Santa Ana winds), has resulted in several recent catastrophic fire episodes (Keeley et al. 2009). Most ignitions lead to small fires with relatively insignificant effects (Strauss et al. 1989). Approximately 90% of fire ignitions accounted for only 1% of the total area burned between 1980 and 2010 in Southern California, whereas only 3% of ignitions led to fires larger than 400 ha and accounted for 96% of area burned during this period (USDA Forest Service 2010). A combination of altered ignition frequencies, changing climate and expansion of housing near wildland areas has modified fire risk in Southern California and presents a serious threat to human lives and property (Syphard et al. 2012, 2013). Landscape-scale disturbances such as fire contribute to the distribution of vegetation and habitats across California (Callaway and Davis 1993). Fire is a natural process whose occurrence and magnitude are regulated by environmental and ignition agents. A location’s fire environment, as determined by fuel, weather and topography, affects the occurrence and spread of fire (Countryman 1972). Topographic factors such as eleva- tion, slope and aspect influence fuel characteristics including moisture content, and thus indirectly control fire occurrence and behaviour (Agee 1993; Pyne et al. 1996). Under normal weather conditions, the propensity to burn is fuel dependent and is controlled by the amount, arrangement and physical character- istics of vegetation (Whelan 1995). Extreme weather, including strong winds or extended periods with low humidity, over-ride this fuel dependency and dramatically increase fire risk in Southern California (Keeley and Zedler 2009; Moritz et al. 2010; Jin et al. 2014). Weather and climate, especially precipi- tation and temperature, affect moisture content and thus the flammability of both live and dead plant material (Verdu ´ et al. 2012). Wind speed, relative humidity and air temperature control fire spread rate and direction, and thus possible future changes in weather and climate have the potential to modify wildfire risk (Cayan et al. 2008). Climate models predict a hotter and drier climate throughout California by the mid to late 21st CSIRO PUBLISHING International Journal of Wildland Fire http://dx.doi.org/10.1071/WF13136 Journal compilation Ó IAWF 2014 www.publish.csiro.au/journals/ijwf
Transcript of Controls on the spatial pattern of wildfire ignitions in Southern California

Controls on the spatial pattern of wildfire ignitionsin Southern California
Nicolas FaivreAC Yufang JinBMichael L GouldenA and James T RandersonA
ADepartment of Earth System Science University of California 2101 E Croul Hall Irvine
CA 92697-3100 USABDepartment of Land Air and Water Resources University of California Davis CA 95616-8627 USACCorresponding author Email nfaivreuciedu
Abstract Wildfire ignition requires a combination of an open spark and suitable weather and fuel conditionsModels offire occurrence and burned area provide a good understanding of the physical and climatic factors that constrain andpromote fire spread and recurrence but information on how humans influence ignition patterns is still lacking at a scale
compatible with integrated fire managementWe investigated the relative importance of the physical climatic and humanfactors regulating ignition probability across Southern Californiarsquos National Forests A 30-year exploratory analysis ofone-way relationships indicated that distance to a road distance to housing and topographic slope were the major
determinants of ignition frequency We used logistic and Poisson regression analyses to model ignition occurrence andfrequency as a function of the dominant covariates The resulting models explained 70 of the spatial variability inignition likelihood and 45 of the variability in ignition frequency In turn predicted ignition probability contributed to
some of the spatial variability in burned area particularly for summer fires These models may enable estimates of fireignition risk for the broader domain of Southern California and how this risk may change with future population andhousing development Our spatially explicit predictions may also be useful for strategic fire management in the region
Additional keywords biophysical drivers fire frequency fire ignition human influence Mediterranean ecosystemsspatial regression model wildland fire risk
Received 21 August 2013 accepted 7 May 2014 published online 28 July 2014
Introduction
Wildland fire regimes in Southern California are influenced byclimate ecosystem properties the rate of human-caused ignition
and fire suppression More than 90 of the fires in SouthernCalifornia are human ignited and rapid response often extin-guishes ignitions that could otherwise become large wildfires
(Keeley 1982) Previous studies have reported that the fre-quency of small fires in coastal Southern California increasedduring the late 20th century (Keeley et al 1999) Increasing
population size and an expansion of housing into fire-pronewildland areas (Hammer et al 2007) has increased ignition risk(Keeley and Fotheringham2001) andwhen coupledwith severe
fire weather (eg Santa Ana winds) has resulted in severalrecent catastrophic fire episodes (Keeley et al 2009) Mostignitions lead to small fires with relatively insignificant effects(Strauss et al 1989) Approximately 90 of fire ignitions
accounted for only 1of the total area burned between 1980 and2010 in Southern California whereas only 3 of ignitions led tofires larger than 400 ha and accounted for 96 of area burned
during this period (USDA Forest Service 2010) A combinationof altered ignition frequencies changing climate and expansionof housing near wildland areas hasmodified fire risk in Southern
California and presents a serious threat to human lives andproperty (Syphard et al 2012 2013)
Landscape-scale disturbances such as fire contribute tothe distribution of vegetation and habitats across California(Callaway and Davis 1993) Fire is a natural process whose
occurrence and magnitude are regulated by environmental andignition agents A locationrsquos fire environment as determined byfuel weather and topography affects the occurrence and spread
of fire (Countryman 1972) Topographic factors such as eleva-tion slope and aspect influence fuel characteristics includingmoisture content and thus indirectly control fire occurrence and
behaviour (Agee 1993 Pyne et al 1996) Under normal weatherconditions the propensity to burn is fuel dependent and iscontrolled by the amount arrangement and physical character-
istics of vegetation (Whelan 1995) Extreme weather includingstrong winds or extended periods with low humidity over-ridethis fuel dependency and dramatically increase fire risk inSouthern California (Keeley and Zedler 2009 Moritz et al
2010 Jin et al 2014) Weather and climate especially precipi-tation and temperature affect moisture content and thus theflammability of both live and dead plant material (Verdu et al
2012) Wind speed relative humidity and air temperaturecontrol fire spread rate and direction and thus possible futurechanges in weather and climate have the potential to modify
wildfire risk (Cayan et al 2008) Climatemodels predict a hotterand drier climate throughout California by the mid to late 21st
CSIRO PUBLISHING
International Journal of Wildland Fire
httpdxdoiorg101071WF13136
Journal compilation IAWF 2014 wwwpublishcsiroaujournalsijwf
century (Cayan et al 2010 Pan et al 2011) and recent studieshave concluded that warmer temperatures are likely to increasethe duration and intensity of the wildfire season (Westerling
2006 Westerling and Bryant 2008)Existing models have emphasised the hydro-climate and
biophysical controls on fire (Bradstock et al 1998 Preisler
et al 2004 Spracklen et al 2009 Westerling et al 2009) andthere is a growing understanding of the relationship betweenhumans and ignitions patterns (Syphard et al 2008 Bar Massada
et al 2009 Narayanaraj and Wimberly 2012) SouthernCalifornia has an extensive wildlandndashurban interface (WUI)which accounts for nearly 60 of the landscape (Hammer et al2007) Humans influence fire in several ways including igni-
tion landscape fragmentation and fire suppression this com-plexity complicates efforts to predict fire risk (Perry 1998)Information on the relative importance of human v environ-
mental factors is currently inadequate for Southern Californiarsquoswildland fires (Pyne 2001 Haight et al 2004) Studies havereached a variety of divergent conclusions (Heyerdahl et al
2001 Keeley and Fotheringham 2001 Moritz 2003 Dicksonet al 2006) probably due in part to variation in fire character-istics at different temporal and spatial scales (Moritz et al 2005
Parisien and Moritz 2009 Jin et al 2014) Understanding thespatial distribution of ignition and the relative importance ofhuman v landscape controls will become increasingly impor-tant as climate changes theWUI expands and human influences
on fire regimes increase (Sugihara et al 2006 Westerling andBryant 2008)
Recent county-level studies in California found that ignition
frequency is significantly related to population density with thehighest number of fires observed at intermediate levels ofpopulation density and intermediate distances from the WUI
(Syphard et al 2007) Syphard et al (2008) analysed the spatialpatterns of fire ignitions in the Santa Monica Mountains andfound that ignition occurrence is correlated with distance tohuman infrastructure (ie to roads trails or housing develop-
ment) and slope and vegetation type whereas fire return intervalis explainedmainly by biophysical aspects related to climate andterrain (ie temperature aspect elevation and slope)
Further research is needed to quantify how human-relatedvariables and biophysical drivers constrain wildland fire at finespatial resolutions and over larger regional domains We per-
formed a spatial regression of a 30-year dataset of fire ignitionsusing human and biophysical explanatory variables Our speci-fic goals were to (i) assess the relative importance of possible
drivers (eg distance to roads or population density) on ignitionoccurrence and frequency (ii) develop statistical models of thespatial distribution of ignition occurrence and frequency and(iii) quantify howmuch of the spatial pattern of fire return times
can be explained by spatial variation in ignition Strategic fuelmanagement requires a better understanding of how landscapecharacteristics explain the likelihood of wildfires (Dellasala
et al 2004) Our results are intended to provide informationthat will help local fire management agencies identify andquantify ignition risk this information may prove useful for
optimising fire suppression resources or prevention planningOur results also carry ecological implications for the manage-ment of natural resources and protection of wildland ecosystems(Haidinger and Keeley 1993)
Data and methods
Study area
Our main study domain covers 23 500 km2 of wildland areaswithin USA National Forests in Santa Barbara Ventura LosAngeles San Bernardino Orange Riverside and San Diego
counties The United States Forest Service (USFS) has used theadministrative boundaries of National Forests as the spatialtemplate for recording fire ignition locations We therefore used
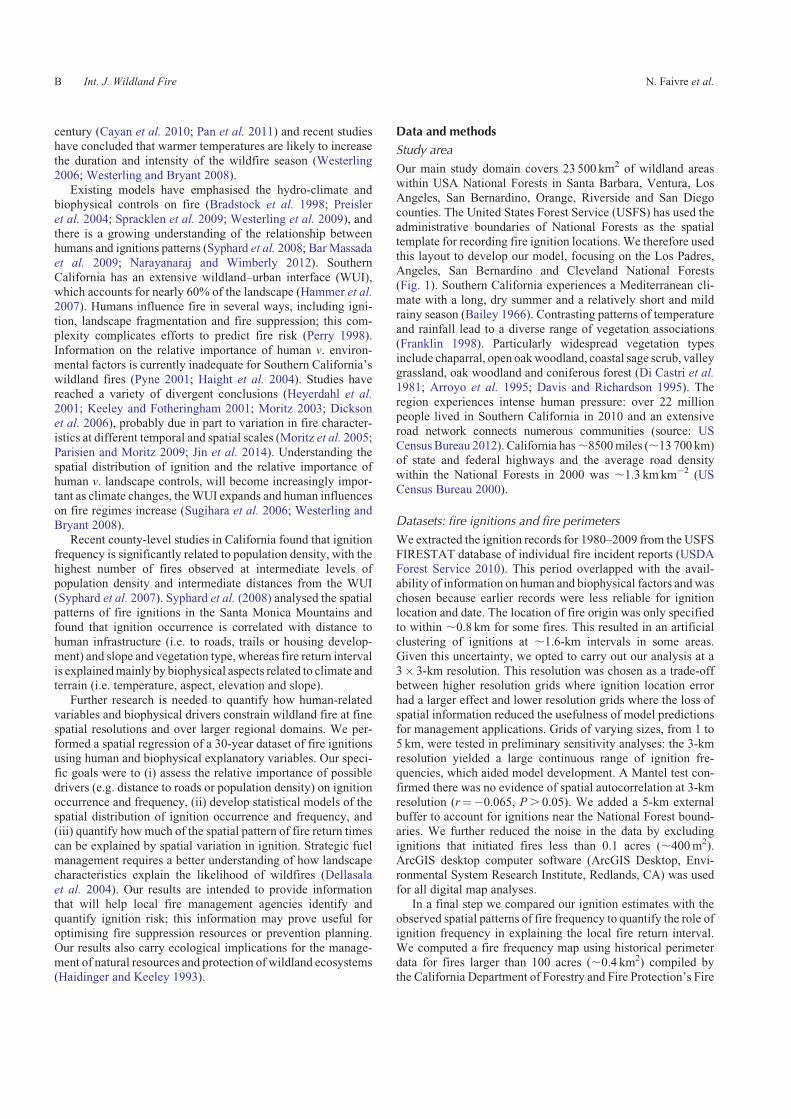
this layout to develop our model focusing on the Los PadresAngeles San Bernardino and Cleveland National Forests(Fig 1) Southern California experiences a Mediterranean cli-
mate with a long dry summer and a relatively short and mildrainy season (Bailey 1966) Contrasting patterns of temperatureand rainfall lead to a diverse range of vegetation associations
(Franklin 1998) Particularly widespread vegetation typesinclude chaparral open oakwoodland coastal sage scrub valleygrassland oak woodland and coniferous forest (Di Castri et al1981 Arroyo et al 1995 Davis and Richardson 1995) The
region experiences intense human pressure over 22 millionpeople lived in Southern California in 2010 and an extensiveroad network connects numerous communities (source US
CensusBureau 2012) California has8500miles (13700 km)of state and federal highways and the average road densitywithin the National Forests in 2000 was 13 kmkm2 (US
Census Bureau 2000)
Datasets fire ignitions and fire perimeters
We extracted the ignition records for 1980ndash2009 from the USFS
FIRESTAT database of individual fire incident reports (USDAForest Service 2010) This period overlapped with the avail-ability of information on human and biophysical factors andwas
chosen because earlier records were less reliable for ignitionlocation and date The location of fire origin was only specifiedto within 08 km for some fires This resulted in an artificialclustering of ignitions at 16-km intervals in some areas
Given this uncertainty we opted to carry out our analysis at a3 3-km resolution This resolution was chosen as a trade-offbetween higher resolution grids where ignition location error
had a larger effect and lower resolution grids where the loss ofspatial information reduced the usefulness of model predictionsfor management applications Grids of varying sizes from 1 to
5 km were tested in preliminary sensitivity analyses the 3-kmresolution yielded a large continuous range of ignition fre-quencies which aided model development A Mantel test con-
firmed there was no evidence of spatial autocorrelation at 3-kmresolution (rfrac140065 P 005) We added a 5-km externalbuffer to account for ignitions near the National Forest bound-aries We further reduced the noise in the data by excluding
ignitions that initiated fires less than 01 acres (400m2)ArcGIS desktop computer software (ArcGIS Desktop Envi-ronmental System Research Institute Redlands CA) was used
for all digital map analysesIn a final step we compared our ignition estimates with the
observed spatial patterns of fire frequency to quantify the role of
ignition frequency in explaining the local fire return intervalWe computed a fire frequency map using historical perimeterdata for fires larger than 100 acres (04 km2) compiled bythe California Department of Forestry and Fire Protectionrsquos Fire
B Int J Wildland Fire N Faivre et al
Resource Assessment Program (FRAP 2010) We calculatedfire frequency in each 3 3-km grid cell (ie number of fires
during the 1980ndash2009 period per square kilometre) weightingeach fire within a grid cell by its fractional burned area We alsoclassified these burns into Santa Ana and non-Santa Ana fires
based on the fire start date reported in the FRAP (2010) databaseand the time series of Santa Ana days following the approachdescribed by Jin et al (2014) Santa Ana days were identifiedwhen the north-easterly component of the daily mean wind
speed was greater than 6m s1 at the exit of the largest gapacross the Santa Monica Mountains (Hughes and Hall 2010)
Datasets human factors
Recent studies identified numerous predictors of the occurrenceof ignitions in densely populated areas (Syphard et al 2008Catry et al 2009 Martınez et al 2009) Fire ignitions recorded
over the last three decades tend to be clustered around trans-portation networks and near urban areas We therefore consid-ered five variables to describe the human footprint (1) distance
to a major road (2) distance to a minor road (3) road density(4) distance to low-density housing and (5) population density
We used the US Census Bureaursquos TIGER road data (Topo-logically Integrated Geographic Encoding and Referencing
US Census Bureau 2000) to estimate the road density per gridcell and the distance from cell centroid to nearest road High-ways and state roads were classified as major roads (Fig 2a)
whereas streets and vehicle trails were classified as minor
roads This differentiation helped account for traffic volumeas a controller of ignition
We computed average housing density for 1980ndash2009 basedon 1990 and 2000 US Census data (Hammer et al 2004 2007)(Fig 2b) The WUI is often defined as areas with less than 50
vegetation and at least one house per 40 acres (62 houses km2)that are located within 15miles (24 km) of an area over500 ha that is more than 75 vegetated (Stewart et al 2007)Assuming that ignitions most likely occur close to or within
interface and intermix communities (Syphard et al 2007 2008)we used the distance to the nearest housing area with a densitygreater than 62 housing units km2 as an indicator of the
proximity to the WUI (Fig 2b) In addition we used the WUIvector maps created by the USFS (Radeloff et al 2005) tocalculate the number of ignitions within and outside the WUI
areasFinally we used the best available fine-grained spatial
database on population demographics from the US CensusBureaursquos block group data for 2000 (US Census Bureau 2001)
to compute average population density per grid cell (Fig 2c)This variable captured the direct influence of human presencewithin and outside the National Forest boundaries All human
variables were summarised at 3-km resolution
Datasets biophysical factors
We considered ten variables that were related to topography
land cover and climate elevation slope south-westness forest
120W 119W 118W 117W 116W
35N
34N
33N
Fig 1 Study area in Southern California USA The broader domain encompasses seven counties (white lines) All ignition incidents
(red dots) recorded within National Forests boundaries (black dotted lines major model domain) during 1980ndash2009 were overlaid on a
30-m-resolution Landsat satellite image mosaic (source ESRI World Imagery database November 2012)
Modelling ignition patterns in Southern California Int J Wildland Fire C
cover shrubland cover grassland cover cover of other land
cover types annual average daily maximum temperatureannual average daily minimum temperature and cumulativewinter precipitation We used the 3-arc-second digital elevation
model from the US Geological Survey National ElevationDataset (NED) to calculate the slope and aspect for each3 3-km grid cell using ArcGIS software (Gesch et al 2002)
(Fig 2d ) Aspect was transformed trigonometrically to a south-facing index referred to as lsquosouth-westnessrsquo (cos(aspect ndash 2258))
following Beers et al (1966) This index provided a measure of
sun exposure and dryness within each grid cell Flat terrain witha slope of less than 58 was excluded from the aspect analysesWe assessed vegetation characteristics using themost recent and
comprehensive land cover dataset at 100-m resolution fromFRAP (2002) We classified the vegetation in the NationalForests into three major types lsquoshrublandrsquo (60 of the area)
lsquoforestwoodlandrsquo (22) and lsquograsslandrsquo (6) The remainingnon-vegetated land cover types were grouped as lsquootherrsquo and
Highways and state roads
Population density(residents km2)
Land use ndash Land cover
AgricultureBarren or otherDesertHardwoodndashconifer forestGrasslandShrublandUrbanWaterndashwetland
00ndash100100ndash500500ndash10001000ndash10 000
0 25 50 100 km
0 25 50 100 km
Housing density (1980ndash2009)(units km2)
Elevation (m)
75ndash00ndash500500ndash10001000ndash15001500ndash20002000ndash25002500ndash3000
0 25 50
Precipitation(mm SeptndashMarch)
0ndash150150ndash250250ndash350350ndash450450ndash550550ndash650
100 km
0 25 50 100 km
3000
0ndash5
(a) (b)
(c) (d )
(e) (f )
5ndash5050ndash750750ndash10 000
0 25 50 100 km0 25 50 100 km
Fig 2 Spatial maps of key human topographic and biophysical drivers including (a) major roads (b) housing density (c) population density
(d ) elevation (e) land cover and ( f ) mean annual winter (SeptemberndashMarch) precipitation
D Int J Wildland Fire N Faivre et al
included agricultural land urban desert wetland water andbarren (Fig 2e) We calculated the fraction of each class withineach 3 3-km grid cell The monthly averages of precipitation
and daily maximum andminimum temperature were taken fromthe gridded Parameter-Elevation Regressions on IndependentSlopes Model (PRISM) dataset at 800-m resolution (Daly et al
2002) In our analysis we summarised winter precipitation(SeptemberndashMarch Fig 2f ) and annual mean maximum andminimum temperatures for each 3 3-km cell over the 1981ndash2009 period
Model building logistic and Poisson regressions
Our input dataset consisted of the 15 explanatory variablesdescribed above which were spatially averaged within each3 3-kmgrid cell (Fig 3)We sought to determine the influence
of those predictors on two dependent variables (i) the occur-rence of ignition (presence or absence within a cell) and (ii) thefrequency of ignition (number of ignitions within a cell)
We used a logistic regression approach tomodel the presence
or absence of ignitions (Kleinbaum et al 2002 Hosmer andLemeshow 2005) Logistic regression has been used to success-fully model the probability of fire occurrence at a range of
geographic scales (Chou et al 1993 Chuvieco et al 1999Vasconcelos et al 2001) Logistic regression is expressed as
logitethpiTHORN frac14 lnpi
1 pi
frac14 a0 thorn b1x1i thorn thorn bjxji eth1THORN
where pi is the probability of an ignition in the cell i and xji is thevalue of the jth predictor in the cell i The underlying distributionis binomial and the logit function is defined as the natural
logarithm (ln) of the probability of ignition occurrenceWe found exponential relationships between the explanatory
variables and the number of ignitions (Fig 4) and thus used a
Poisson regression model (Agresti 2002) for ignition frequencyexpressed as
logethyTHORN frac14 a0 thorn b1x1i thorn thorn bjxji eth2THORN
Poisson models provide several advantages including the
ability to represent a skewed distribution and the restriction ofpredicted values to non-negative numbers (Gardner et al 1995)The Poisson probability distribution of observing any specific
count y for an outcome Y and where ı describes the average rateof ignitions is given by
PrethY frac14 yTHORN frac14 iyei
yeth3THORN
Model building variable selection and model validation
We sought to identify which variables were most important forcontrolling the spatial distribution of ignitions independent of
their interaction with other explanatory variables We firstexamined the correlation matrix among explanatory variables
11740W 11730W 11720W 11710W
3420N
3415N
3410N
San Bernardino
Legend
Housing density (units km2)
Land use ndash Land cover
Ignitions (1980ndash2009)
National forest boundaries
Major roads
Minor roads
0ndash5
5ndash50
50ndash750
750ndash10 000
Shrub
Tree
Desert
Urban
Agriculture
Other
Water
0 15 3 6 km
Fig 3 The distribution of ignitions roads and housing in the San Bernardino National Forest This subset of the study area shows the
3 3-km grid framework used to summarise ignitions data and associated predictors Observed ignitions (red triangles) between 1980
and 2009 were overlaid on GIS layers for roads housing density and land cover types
Modelling ignition patterns in Southern California Int J Wildland Fire E
for high pairwise correlations (Table 1) and then performedunivariate logistic and Poisson regressions for all predictorsusing the R statistical package (R Development Core Team2012 Table 2) We then developed logistic and Poisson
multiple regression models that included all significant terms(P 0001) based on the univariate regression analyses Theoriginal sample of 2625 grid cells (1483 with fire ignitions) was
randomly split into fitting and validation subsamples (70 30ratio) We sequentially selected the variables using a backwardstepwise selection procedure (R packageMASS Crawley 2005)
based on the Akaike Information Criterion (AIC Akaike 1974)The backward selection process started with the full model andsequentially excluded explanatory variables based initially onthe correlation with the response variable and other explanatory
variables We quantified the relative importance of retained
variables by estimating their percentage contribution to themodel goodness of fit (ie maximised log-likelihood)
Our goal was to develop simplified logistic and Poisson
models with a reduced set of explanatory variables as acompromise between model fit and model complexity Logisticnested models were compared and examined using inferential
and descriptive statistics We used the likelihood ratio test andthe Wald statistic to assess overall model fit and the respectivecontribution of individual predictors to fitted models Receiver
operating characteristic (ROC) analysis was performed to quan-tify the area under the curve (AUC) ndash ameasure of the predictivecapability of the logistic model to identify cells that had anignition eventWe also used the ROC curve to select the optimal
threshold probability or cut-off value for the probability thatan ignition would occur in a given cell Using the validationsamples we cross-validated the best multiple regression model
and built contingency tables of observed and expected responsesto evaluate model accuracy precision sensitivity and specific-ity (Hilbe 2009) As with the multiple logistic regression we
tested the significance of nested Poisson models and the signifi-cance of individual parameters using the likelihood ratio test andthe Wald statistic We also calculated Pearsonrsquos correlation
coefficients for validation samples between observed and pre-dicted values to assess model goodness of fit
Model building performance improvement
Poisson regression is a form of generalised linear models thatassumes the conditional variance to equal the conditional meanTherefore a Poisson model is usually too restrictive when
predicting count data which manifests as data over-dispersion(ie the variance exceeds the mean) or as estimates of consid-erably fewer zero counts than are actually observed in the
sample (Long 1997) As an alternative approach to Poissonregression we tested a negative binomial (NB) regression(Agresti 2002 Gelman and Hill 2007 Hardin and Hilbe 2007)which uses a dispersion parameter j to handle the variance
independent of the meanBased on their respective contributions to model fit we
restricted the number of predictors to a subset of four explana-
tory variables while ensuring model performance was notsignificantly altered We compared the performance of Poissonand NB models to ordinary linear regression using Pearsonrsquos
correlation coefficients the rootmean square error (RMSE) andthe percentage of bias between simulated and observed dataWe estimated how the four main predictors influenced
model performance by comparing the nested models to the4-parameters final model
Predictive ignition frequency mapping
We applied the resulting NB model to estimate the ignitionfrequency for all 3 3-km grids within the National Forest
boundaries and analysed the spatial distribution of the residualignition frequency We used the Pearson correlation coefficientto estimate how much of the spatial variability in fire frequencyderived from FRAP fire perimeter data was explained by the
predicted variability of ignitions within National Forestboundaries We also separately considered Santa Ana and non-Santa Ana fires following Jin et al (2014) to compare the
controls of ignition patterns on fire frequency for both fire types
0 5 10
Distance to infrastructure (km)
16
14
12
10
08
06
04
02
0
12
10
08
06
04
02
00 10 20 30 40 50 60 70 80 90 100
Slope percentage
Igni
tion
dens
ity (
num
ber
of ig
nitio
ns k
m
2 )
15
Housing
Major roads
Minor roads
20
(a)
(b)
Fig 4 Relationships between ignition density and (a) distance to human
infrastructure (major roads minor roads and low housing density) and
(b) slope percentage over the major study domain (ie National Forests)
Fig 4a was computed by averaging the distance between each ignition
location (FIRESTAT dataset) and the nearest human infrastructure within
each 3 3-km grid
F Int J Wildland Fire N Faivre et al
Results
Spatial distribution of fire ignitions
Most of the wildland fire ignitions in the National Forests during1980ndash2009 occurred nearmajor roads and close to urban housing(Figs 1ndash3) Ignition pointswere clustered around populated areasmajor infrastructure and highways implying a strong influence
by human factors (Fig 3) The WUI defined as areas wherehousing meets or intermingles with undeveloped wildlands(Stewart et al 2007) had particularly high ignition densities
(ie near the border of National Forests in Los Angeles San
Bernardino and Orange counties Figs 1ndash3) Ignitions were muchless frequent in sparsely populated areas such as Santa Barbaraand Ventura counties (Fig 1) The WUI covered only 5 of
National Forest area but accounted for 40 of ignitions Ignitiondensity was considerably higher within the WUI (06 ignitionskm2) than in more remote areas (003 ignitions km2)
A quantitative analysis of the relationship between ignitiondensity and human variables confirmed that ignitions were most
Table 1 Correlations among the 15 explanatory variables used in the analysis
The table indicates the Pearsonrsquos correlations between all independent variables Please refer to the main text for more information on individual variables
Interactions with significant correlations (P 0001) superior to 05 (inferior to 05 for negative correlations) are indicated in bold
dMajR
054 dminR
038 036 dHousing
042 043 036 Droad
022 018 022 08 Dpopulation
018 026 014 033 028 elevation
033 043 01 049 028 041 slope
003 007 015 009 015 016 001 south-westness
011 011 01 019 016 066 027 012 tree
025 019 013 042 031 016 031 019 2050 shrub
018 018 013 006 003 024 036 002 012 015 grass
032 025 031 066 052 032 046 013 029 2060 002 other
016 016 025 025 025 2081 011 016 2063 026 005 025 Tmin
018 025 014 031 021 2085 044 011 2067 016 017 038 069 Tmax
026 034 01 023 009 034 058 012 028 022 018 045 016 2051 Prec
Table 2 Univariate logistic and Poisson regression results for all variables influencing the occurrence and frequency of fire ignitions in Southern
California National Forests
Values and direction (ie positive or negative) of the coefficients indicate the influence of covariates (the driver variables) towards the response variables
(ignition occurrence or frequency)
Explanatory variable Fire occurrence (Logistic model) Fire frequency (Poisson model)
Binary response variable Continuous response variable
Coefficient P-value Coefficient P-value
Human accessibility
Distance to major roads (km) 011 0010 00001 015 0005 00001
Distance to minor roads (km) 032 0040 00001 041 0020 00001
Distance to housing (km) 005 0005 00001 007 0003 00001
Urban development
Population density (1000 persons km2) 0007 0004 009 0004 0001 001
Road density (km roads km2) 0006 0002 005 0017 0001 00001
Topography
Elevation (m) 044 0090 00001 001 0003 0001
Slope () 0007 0004 008 0004 0001 0001
South-westness (0ndash1) 014 0120 0225 007 004 005
Land cover types
Tree () 067 019 00001 03 006 0629
Shrub () 011 014 0436 012 004 005
Grass () 197 042 00001 146 018 0001
Others () 042 017 005 019 006 0001
Climate
Temperature maximum (8C) 003 001 005 002 0006 0001
Temperature minimum (8C) 004 002 005 004 0006 0001
Winter precipitation (mmyear1) 057 041 001 039 009 0001
Modelling ignition patterns in Southern California Int J Wildland Fire G
common near roadways and housing (Fig 4) Approximately60 of all ignitions occurred within 1 km of a major road andignition density declined with distance more rapidly fromminor
roads than from major roads (Fig 4) Approximately 75 ofignitions occurred within 5 km of areas with a density of housingunits greater than 62 km2 Ignition density peaked2 km and
decreased exponentially in areas further away from housing(Fig 4) Ignition density was highest in areas with intermediatelevels of topographic complexity with slopes between 20 and
40 (Fig 4)
Influence of human and biophysical variableson ignition occurrence
Univariate logistic regressions showed that all human-relatedvariables except population density were significant inexplaining ignition occurrence (P 005) (Table 2) Ignition
occurrence was positively correlated with road density andnegatively correlated with distance from major roads minorroads and low-density housing The presence or absence of
ignitions also was related to vegetation type with a significantlyhigher likelihood of ignition in forest and lower probability ingrassland and non-vegetated areas (Table 2) We estimated that
53 of 1980ndash2009 ignitions occurred in shrublands and 22 inforests (Fig 2e) Elevation was the only topographic variablesignificantly correlated with ignition occurrence the likelihoodof ignition increased with elevation Precipitation was signifi-
cantly correlated with ignition presence (Table 2)The final model based on stepwise backward selection had
10 significant variables (P 00001)
logitethpiTHORN frac14 465 012 dMajR thorn 0001 elev 003
dHousing thorn 204 shrub 022dminR thorn 188 treethorn 012
Tmax thorn 002 slopethorn 002 Droads 0002 Dpopulation
eth4THORNwhere dMajR is the distance tomajor roads (km) elev is elevation(m) dHousing is distance to nearest housing area with density
greater than 62 units km2 (km) shrub is the percentage coverof shrubland dminR is the distance to minor roads (km) tree isthe percentage cover of forest Tmax is the annual average dailymaximum temperature (8C) from 1980 to 2009 slope is the
percentage slopeDroads is road density (kilometres of roads persquare kilometre) and Dpopulation is population density (numberof persons per square kilometre) The analysis of modelled
variance indicated that not all variables contributed equally tothe model fit dMajR elev dHou shrub and dminR togetherexplained over 87 of the model variance (Fig 5a) The
variables tree slope Tmax and Tmin were highly correlatedwith elev (Table 1) and their contribution to the model mayhave been masked by the apparent strong influence ofelevation (Fig 5a) Likewise the contributions of Droads and
Dpopulation may have been masked by multicollinearities withdMajR dHousing shrub and dminR (Table 1 Fig 5a)
The ROC analysis using only the five strongest parameters
resulted in an AUC of 072 which indicated that the reducedmodel was reasonably able to distinguish where ignitions weremost likely to occur Our cross-validation demonstrated that the
model correctly predicted 67 of the observed distribution ofignition occurrence
Influence of human and biophysical variableson ignition frequency
We found that all variables related to human presence signifi-
cantly explained variability of ignition frequency (Table 2) Thevariables dMajR dHousing and dminR were the most influentialhuman factors for ignition frequency (Figs 5b 6) In contrast to
the logistic regression results all climate variables were sig-nificant and positively correlated with ignition frequencyIgnitions were more frequent in areas with warmer temperatures
and higher precipitation (Table 2) The slope and shrub coveralso had significant and positive influences on ignition fre-quency and contributed substantially to explaining the vari-
ability of ignition patterns (Table 2 Fig 5b) The final Poissonregression following backward selection retained all explana-tory variables (P 0001) except annual average daily mini-mum temperature
logethIgnitionsFREQTHORN frac14 438 014 dMajR 005 dHousing
thorn 002 slope 023 dminR thorn 113 shrubthorn 0001
elevthorn 015 Tmax thorn 002 Droads 0001 Dpopulation
thorn 084 precthorn 023 swindexthorn 067 tree
eth5THORN
(a)
40
30
Logistic model parameters
Con
trib
utio
n to
mod
el fi
t (
)
20
10
0
dMajR Elev
(b)
Poisson model parameters
50
40
30
20
10
50
0
dMaiR
dHou
sing
Slope
dminR
Shrub
ElevTm
ax
Droad
s
Dpopu
lation Pre
c
South
westn
ess
Tree
dHou
sing
Shrub
dminR Tre
eTm
ax
Slope
Droad
s
Dpopu
lation
Fig 5 Relative importance of explanatory variables as quantified by their
relative contribution tomodel ignition occurrence (a) and ignition frequency
(b) Variables are ranked by significance order estimated using automated
stepwise selection Significant variables included distance to major roads
(dMajR) distance to housing (dHousing) distance to minor roads (dminR)
population density (Dpopulation) road density (Droads) slope percentage
elevation tree and shrub cover annual average of daily maximum tempera-
ture (Tmax) cumulative winter precipitation (prec) and south-westness
index
H Int J Wildland Fire N Faivre et al
where dMajR dHousing slope dminR shrub elev Tmax Droad
Dpopulation and tree were defined as above prec is the annualaverage cumulative winter precipitation (SeptemberndashMarch)(mmyear1) and swindex is the south-westness index The
most influential predictors of ignitions frequency were dMajRdHousing slope and dminR these variables combined explained85 of model variance (Fig 5b) The comparison of Poisson
and NB models to a linear model showed a clear improvementof model performance with a reduced AIC value (Table 3) Thelinear model was inferior to the other models the estimatedcoefficients of linear regression showed significantly higher
standard errors (Table 3) Our results indicated that over-dispersion was better captured by the NB as the dispersionestimate was closer to 1 The NB model improved the fit
compared to the Poisson model with a significantly reducedbias while showing similar Pearson correlation and RMSEvalues (R2frac14 045 RMSEfrac14 279) (Fig 6) The form of the
model equation for NB regression was the same as that forPoisson regression
logethIgnitionsFREQTHORN frac14 097 011 dMajR 004 dHousing
thorn 003 slope 025 dminR
eth6THORN
The distance to major road alone explained 33 of the
observed spatial variance in ignition frequency distance tohousing and slope explained another 10 and distance tominorroads explained the remainder We caution that the primary
influence of the variables retained in the final Poisson modelmay be confounded bymulticollinearity (Table 1) For examplethe importance of slope may have been overestimated due to
implicit contributions from elev prec Tmax or land cover
Predictive mapping of ignition frequency
The spatial distribution of ignition frequency predicted using the
NB model showed good agreement with the observed ignitionpattern (R2frac14 045 Figs 6 7ab) The proximity to humaninfrastructure strongly determined ignition frequency (Fig 7b
Table 3) The model accurately captured the relative lack ofignitions in remote interior areas (eg Los Padres NationalForest) Likewise the model accurately predicted high ignition
frequency in many areas near major roads and housing (eg LosAngeles County) The model underestimated ignition frequencyalong high-traffic transportation corridors (eg Interstate 5) and
in close proximity to some populated urban areas (eg SanBernardino) (Fig 7c) Thus the variables used to predict igni-tion frequency (ie distance to major roads and distance tohousing) were insufficient for discriminating areas where
human pressure exceeded a certain threshold
Relationship between ignition frequency and fire frequency
We found a significant positive relationship between ignitionfrequency and fire frequency The gridded ignition frequencyobservations within National Forests explained 30 of the
spatial variance of observed fire frequency (P 0001nfrac14 2625) For this same domain the NBmodel explained 53of the observed fire frequency variance (P 0001) We foundthat many areas with a high potential risk of ignition did not burn
between 1980 and 2009 (Fig 8) indicating that a substantialcomponent of burned area variability was not explained by thedrivers of ignition
2
2
3
4
310
305
300
RM
SE
R2
Pea
rson
Bia
s
295
290
285
280
050
045
040
035
030
025
Linear Poisson Negative binomial
dMajR dHousing dMajR dHousing slope Full modeldMajR
1
1
0
(a)
(b)
(c)
Fig 6 Performance of reduced and full models with significant variables
successively added into linear Poisson and negative binomial regressions
Statistics shownwere (a) percentage bias relative to the observation (b) root
mean square error and (c) Pearson R2 Variables retained in the final models
included distance to major roads (dMajR) distance to housing (dHousing)
slope percentage and distance to minor roads (dminR)
Table 3 Summary of fitted regression models for ignition frequency
data
The top part of the table gives coefficient estimates (with standard errors) for
each explanatory variable The second portion of the table compares model
performance and reports the number of estimated parameters maximised
log-likelihood AIC criterion and estimates of dispersion after model fitting
Model predictors Linear model Generalised linear models
Poisson Negative binomial
(Intercept) 210 006 100 003 097 007
distance to major roads 083 008 014 0007 011 001
distance to housing 049 007 004 0003 004 0004
slope percentage 058 007 003 0001 003 0003
distance to minor roads 028 009 028 003 025 004
Degrees of freedom 5 5 6
log-likelihood 53223 41207 32234
AIC criterion 10 6567 82514 64467
Dispersion j ndash 343 078
Modelling ignition patterns in Southern California Int J Wildland Fire I
We repeated the previously described correlation analysis
separately for Santa Ana v non-Santa Ana fires (Jin et al 2014)Santa Ana fires accounted for 450 of total burned area acrossSouthern California and 180 of the number of fires over the
30-year study period For non-Santa Ana fires observed igni-tions explained 65 (P 0001) of observed fire frequency andthe estimated ignition patterns from the NB model explained
122 of fire frequency (P 0001)within theNational Forests
Ignitions were less important although significant in control-ling the spatial pattern of Santa Ana fires with observed andpredicted ignitions explaining 31 and 49 (P 0001) of
observed fire frequency
Discussion
Our modelling approach allowed us to identify the combinationof factors influencing the spatial distribution of ignitions Wefound that proximity to roads and housing were the dominant
controls for ignition frequency All variables describing humanaccessibility and urban development were significantly corre-lated with ignition frequency These results provided evidence
that human activities are the primary source of ignition inSouthern California and are consistent with studies that alsofound increased ignition frequency near transportation corridors
(Stephens 2005) and WUIs (Syphard et al 2007) Environ-mental variables resulted in a higher density of ignitions formid-level slopes and forest land cover types Past studies thatconsidered generalised linear models to predict the spatial dis-
tribution of ignition frequency arrived at similar conclusions(Yang et al 2007 Syphard et al 2008) Although topographicfeatures usually influence fire intensity (ie spread rate) and the
distribution of burns across the landscape (Beaty and Taylor2001 Alexander et al 2006) variations in elevation causevariations in fuel type moisture and phenology which in turn
control the conditions for fire ignition (Swetnam et al 2011)Our logistic approach confirmed that ignition occurrence ismoststrongly determined by distance to major roads and housing
elevation and the proportion of shrub cover Elevation may becapturing the secondary influence of temperature slope and treecover because these variables were collinear The logistic modelcaptured70 of ignition likelihood at 3-km resolution which
we considered satisfactory considering the heterogeneity andthe large area investigated Ignition occurrence was stronglyconditioned by fuel type with 75 of ignitions occurring in
forest and shrublandOur NB approach improved model performance over com-
monly used linear and Poisson models The NB model better
captured the clustering patterns of ignitions around urbandevelopment and transportation corridors with a reduced set of
(a) 120W
Observedignition frequency
0ndash0505ndash11ndash22ndash33ndash44ndash5
0 25 50 100 km
5
Predictedignition frequency
0ndash0505ndash11ndash22ndash33ndash44ndash55
Observed ndash predictedignition frequency
3ndash5
05ndash11ndash3
05ndash0505ndash11ndash33ndash5
119W 118W 117W 116W
(b) 120W 119W 118W 117W 116W
35N
34N
33N
35N
34N
33N
(c) 120W 119W 118W 117W 116W
35N
34N
33N
Fig 7 Spatial maps of ignition frequency in unit of numbers of ignitions
per grid cell across the National Forests at a 3-km resolution during 1980ndash
2009 as (a) recorded in the FIRESTAT database and (b) predicted by the
negative binomial model The residual ignition frequency (observation ndash
prediction) is shown in (c)
120W
Observed fire frequencynumber of fires per grid cell
0ndash0505ndash11ndash22ndash33ndash44ndash5
Major urban areas
0 25 50 100 km
5
119W 118W 117W 116W
35N
34N
33N
Fig 8 Historical area-weighted fire frequency in USFS lands based on
1980ndash2010 fire perimeters data (FRAP 2010)
J Int J Wildland Fire N Faivre et al
predictors Nevertheless locations with particularly high igni-tion frequency such as areas adjacent to major highways andparts of the WUI were underestimated It may be possible to
improve model accuracy in these areas by incorporating trafficvolume data as a proxy of human activity (wwwtraffic-countsdotcagov accessed 13 August 2013)
Besides the errors input to the underestimation of ignitionsfrequency two contrasting patterns of ignition merit discussiona peri-urban ignition pattern in counties with dense development
and a wildland ignition pattern in counties with sparse housingContrasting human influences on ignition patterns depending onhuman settlement density were reported by Badia-Perpinya andPallares-Barbera (2006) This partly explains why the scattered
patterns of ignition were more difficult to capture in more ruralareas Using a fragmentation index to describe the interspersionof human infrastructures within wildland areas may help to
refine model predictionsPredicted ignition frequency explained a small but signifi-
cant amount (ie 12) of the observed spatial patterns in non-
Santa Ana fire frequency within the National Forests Wildlandareas that are likely to experience greater numbers of ignitionscoincide with areas characterised by recurrent burning Never-
theless in more remote areas than the WUI such as Los PadresNational Forest where fuel fragmentation is not a limitingfactor fires tend to spread away from ignition sources and burnmore frequently (Syphard et al 2008) For Santa Ana fires the
lower correlation of ignition frequency to fire frequency sug-gested that the ignition controls on burned area patterns wereconsiderably weaker relative to other factors as compared to
non-Santa Ana fires As burned area per se is not a function ofignition probability only (Archibald et al 2009) additionalvariables related to fuel moisture fuel continuity fuel load
and wind speed (Moritz et al 2010) need to be considered formodelling burned area Similarly interactions between biophys-ical factors such as wind speed and precipitation or vegetationtype may need consideration given the environmental heteroge-
neity in the region Here we addressed single-term effects ofexplanatory variables as we sought to build a simplified modelof ignition frequency patterns Although we also investigated
quadratic and interactive terms between biophysical variablesand between human variables the results were not conclusiveAn important future step is to combine our estimates of ignition
frequency with other data sources to model the spatial distribu-tion of burned area using a similar framework
The predictive maps of ignition frequency generated in this
study are synthetic measures of the spatial influence of humanand environmental drivers on the current landscape An impor-tant related question is how ignition patterns will evolve duringfuture decades Increasing human influence through densifica-
tion and expansion of the WUI is expected to directly affect thewildland ignition regime (Hammer et al 2007 Radeloff et al2010) Californiarsquos population is projected to increase to 49
million in 2025 a 44 increase from 2000 Although mostpopulation growth will occur in urban centres housing densitywithin 10 km of wildlands is projected to increase by80 by
2030 in California (Miller et al 2011) We found distance tonearest housing area with density greater than 62 units km2
was the second most influential control of ignition risk As aconsequence of future housing growth at the periphery of rural
and wilderness areas it is likely that ignition risk will increaseTraffic trends are likely to follow the WUI expansion whichwould imply higher traffic volumes along fast-growing corri-
dors such as Ventura Orange and San Diego Counties (Craneet al 2002) Our analysis demonstrated that major roads carryhigher ignition risk than secondary roads As a result rising
traffic among highways such as Interstate 5 which crosses theLos Padres National Forest and Interstate 15 which contoursthe San Bernardino National Forest (Fig 3) will likely increase
the ignition rate in these areas Our approach may prove usefulfor both fire mitigation and urban planning For example it maybe used to project ignition risk based on projections of futureclimatic and human activity across Southern California
Acknowledgements
This study was supported by NASA Interdisciplinary Science grant
NNX10AL14G to the University of California Irvine We thank the USFS
and the California Department of Forestry and Fire Protection for providing
the compiled ignition and fire perimeter data We thank researchers from
UCIrsquos Earth System Science department for their comments on the earlier
version of the manuscript and two anonymous reviewers for their valuable
comments
References
Agee JK (1993) lsquoFire Ecology of Pacific Northwest Forestsrsquo (Island Press
Washington DC)
Agresti A (2002) lsquoCategorical Data Analysisrsquo (Wiley Hoboken NJ)
Akaike H (1974) A new look at the statistical model identification
Transactions on Automatic Control 19 716ndash723 doi101109TAC
19741100705
Alexander JD Seavy NE Ralph CJ Hogoboom B (2006) Vegetation and
topographical correlates of fire severity from two fires in the Klamathndash
Siskiyou region of Oregon and California International Journal of
Wildland Fire 15 237ndash245 doi101071WF05053
Archibald S RoyDP VanWilgenBW ScholesRJ (2009)What limits fire
An examination of drivers of burnt area in southern Africa Global
Change Biology 15 613ndash630 doi101111J1365-2486200801754X
Arroyo MTK Zedler PH Fox MD (1995) lsquoEcology and Biogeography
of Mediterranean Ecosystems in Chile California and Australiarsquo
(Springer London)
Badia-Perpinya A Pallares-Barbera M (2006) Spatial distribution of igni-
tions in Mediterranean periurban and rural areas the case of Catalonia
International Journal of Wildland Fire 15 187ndash196 doi101071
WF04008
Bailey HP (1966) lsquoThe Climate of Southern Californiarsquo (University of
California Press Berkeley CA)
Bar Massada A Radeloff VC Stewart SI Hawbaker TJ (2009) Wildfire
risk in the wildlandndashurban interface a simulation study in northwestern
Wisconsin Forest Ecology and Management 258 1990ndash1999
doi101016JFORECO200907051
Beaty RM Taylor AH (2001) Spatial and temporal variation of fire regimes
in a mixed conifer forest landscape Southern Cascades California
USA Journal of Biogeography 28 955ndash966 doi101046J1365-2699
200100591X
Beers TW Dress PE Wensel LC (1966) Aspect transformation in site
productivity research Journal of Forestry 64 691ndash692
BradstockRA Gill AM KennyBJ Scott J (1998) Bushfire risk at the urban
interface estimated from historical weather records consequences
for the use of prescribed fire in the Sydney region of south-eastern
Australia Journal of Environmental Management 52 259ndash271
doi101006JEMA19970177
Modelling ignition patterns in Southern California Int J Wildland Fire K
Callaway R Davis F (1993) Vegetation dynamics fire and the physical
environment in coastal central California Ecology 74 1567ndash1578
doi1023071940084
Catry FX Rego FC Bacao FL Moreira F (2009) Modeling and mapping
wildfire ignition risk in Portugal International Journal of Wildland Fire
18 921ndash931 doi101071WF07123
Cayan DR Maurer EP DettingerMD TyreeM Hayhoe K (2008) Climate
change scenarios for the California region Climatic Change 87 21ndash42
doi101007S10584-007-9377-6
Cayan DR Das T Pierce DW Barnett TP Tyree M Gershunov A (2010)
Future dryness in the southwest US and the hydrology of the early 21st
century droughtProceedings of the National Academy of Sciences of the
United States of America 107 21 271ndash21 276 doi101073PNAS
0912391107
ChouY MinnichR ChaseR (1993)Mapping probability of fire occurrence
in San JacintoMountains California USAEnvironmentalManagement
17 129ndash140 doi101007BF02393801
Chuvieco E Salas FJ Carvacho L Rodriguez-Silva F (1999) Integrated fire
riskmapping In lsquoRemote Sensing of LargeWildfiresrsquo (Ed E Chuvieco)
pp 61ndash100 (Springer Berlin)
Countryman CM (1972) The fire environment concept USDA Forest
Service Pacific Southwest Forest and Ranger Experiment Station
Technical Paper (Berkeley CA) Available at httpwwwfiremodels
orgdownloadsbehavepluspublicationsCountrymanCountryman_1972_
TheFireEnvironmentConcept_ocrpdf [Verified 13 August 2013]
Crane R Valenzuela A Jr Chatman D Schweitzer L Wong P (2002)
California Travel Trends and Demographics Study University of
California Los Angeles Institute of Transportation Studies School
of Public Policy and Social Research Final Report 74A0034
(Los Angeles CA)
Crawley MJ (2005) Multiple regression In lsquoStatistics An Introduction
using Rrsquo pp 195ndash208 (Wiley Hoboken NJ)
Daly C Gibson WP Taylor GH Johnson GL Pasteris P (2002) A
knowledge-based approach to the statisticalmapping of climateClimate
Research 22 99ndash113 doi103354CR022099
Davis GW Richardson DM (1995) lsquoMediterranean-type Ecosystems the
Function of Biodiversityrsquo (Springer London)
Dellasala DA Williams JE Williams CD Franklin JF (2004) Beyond
smoke and mirrors a synthesis of fire policy and science Conservation
Biology 18 976ndash986 doi101111J1523-1739200400529X
Di Castri F Goodall DW Specht RL (1981) lsquoMediterranean-type Shrub-
landsrsquo (Elsevier Amsterdam)
Dickson BG Prather JW Xu Y Hampton HM Aumack EN Sisk TD
(2006) Mapping the probability of large fire occurrence in northern
Arizona USA Landscape Ecology 21 747ndash761 doi101007S10980-
005-5475-X
Franklin J (1998) Predicting the distribution of shrub species in southern
California from climate and terrain-derived variables Journal of Vege-
tation Science 9 733ndash748 doi1023073237291
FRAP (2002) California Department of Forestry ndash Fire and Resource
Assessment ProgramMulti-source Land Cover data Available at http
frapcdfcagovdatafrapgisdatadownloadasprec=fveg02_2 [Verified
9 May 2013]
FRAP (2010) California Department of Forestry ndash Fire and Resource
Assessment ProgramGIS database of fire perimeter polygons Available
at httpfrapcdfcagovdatafrapgisdatadownloadasprec=fire [Veri-
fied 9 May 2013]
Gardner W Mulvey EP Shaw EC (1995) Regression analyses of counts
and rates Poisson overdispersed Poisson and negative binomial mod-
els Psychological Bulletin 118 392ndash404 doi1010370033-2909118
3392
Gelman A Hill J (2007) lsquoData Analysis using Regression and Multilevel
Hierarchical Modelsrsquo (Cambridge University Press Cambridge UK)
GeschD OimoenM Greenlee S Nelson C SteuckM Tyler D (2002) The
national elevation dataset Photogrammetric Engineering and Remote
Sensing 68 5ndash11
Haidinger TL Keeley JE (1993) Role of high fire frequency in destruction
of mixed chaparral Madrono 40 141ndash147
Haight RG Cleland DT Hammer RB Radeloff VC Rupp TS (2004)
Assessing fire risk in the wildland-urban interface Journal of Forestry
102 41ndash48
Hammer RB Stewart SI Winkler RL Radeloff VC Voss PR (2004)
Characterizing dynamic spatial and temporal residential density patterns
from 1940ndash1990 across the North Central United States Landscape and
Urban Planning 69 183ndash199 doi101016JLANDURBPLAN2003
08011
Hammer RB Radeloff VC Fried JS Stewart SI (2007) Wildlandndashurban
interface housing growth during the 1990s in California Oregon and
Washington International Journal of Wildland Fire 16 255ndash265
doi101071WF05077
Hardin JW Hilbe J (2007) lsquoGeneralized Linear Models and Extensionsrsquo
(StataCorp Press College Station TX)
Heyerdahl EK Brubaker LB Agee JK (2001) Spatial controls of historical
fire regimes a multiscale example from the interior west USA
Ecology 82 660ndash678 doi1018900012-9658(2001)082[0660
SCOHFR]20CO2
Hilbe JM (2009) lsquoLogistic Regression Modelsrsquo (Chapman amp HallCRC
Boca Raton FL)
Hosmer DW Lemeshow S (2005) Introduction to the Logistic Regression
Model In lsquoApplied Logistic Regressionrsquo 2nd edn pp 1ndash30 (Wiley
Hoboken NJ)
HughesM Hall A (2010) Local and synopticmechanisms causing Southern
Californiarsquos Santa Ana winds Climate Dynamics 34 847ndash857
doi101007S00382-009-0650-4
Jin Y Randerson JT Faivre N Capps S Hall A Goulden ML (2014)
Contrasting controls on wildland fires in Southern California during
periods with and without Santa Ana winds Journal of Geophysical
Research ndash Biogeosciences 119 432ndash450 doi1010022013JG002541
Keeley JE (1982) Distribution of lightning- and man-caused wildfires in
California In lsquoProceedings of the International Symposium on the
Dynamics and Management of Mediterranean Type Ecosystemsrsquo 22ndash
26 June 1981 San Diego CA (Eds CE Conrad WC Oechel) USDA
Forest Service Pacific Southwest Forest and Range Experiment Station
General Technical Report PSW-GTR-058 pp 431ndash437 (Berkeley CA)
Keeley J FotheringhamC (2001)Historic fire regime in southernCalifornia
shrublands Conservation Biology 15 1536ndash1548 doi101046J1523-
1739200100097X
Keeley JE Zedler PH (2009) Large high intensity fire events in southern
California shrublands debunking the fine-grained age-patch model
Ecological Applications 19 69ndash94 doi10189008-02811
Keeley J Fotheringham C Morais M (1999) Reexamining fire suppres-
sion impacts on brushland fire regimes Science 284 1829ndash1832
doi101126SCIENCE28454211829
Keeley JE Safford H Fotheringham CJ Franklin J Moritz M (2009) The
2007 Southern California wildfires lessons in complexity Journal of
Forestry 107 287ndash296
Kleinbaum DG Klein M Pryor ER (2002) lsquoLogistic Regression a Self-
Learning Textrsquo (Springer New York)
Long JS (1997) lsquoRegression models for categorical and limited dependent
variablesrsquo (SAGE Publications Inc Thousand Oaks CA)
Martınez J Vega-Garcia C Chuvieco E (2009) Human-causedwildfire risk
rating for prevention planning in Spain Journal of Environmental
Management 90 1241ndash1252 doi101016JJENVMAN200807005
Miller C Abatzoglou J Brown T Syphard A (2011) Wilderness Fire Manage-
ment in a Changing Environment In lsquoThe Landscape Ecology of Firersquo
(Eds D McKenzie C Miller DA Falk) pp 269ndash294 (Springer London)
L Int J Wildland Fire N Faivre et al
Moritz MA (2003) Spatiotemporal analysis of controls on shrubland fire
regimes age dependency and fire hazard Ecology 84 351ndash361
doi1018900012-9658(2003)084[0351SAOCOS]20CO2
Moritz MA Morais ME Summerell LA Carlson J Doyle J (2005)
Wildfires complexity and highly optimized tolerance Proceedings of
the National Academy of Sciences of the United States of America 102
17 912ndash17 917 doi101073PNAS0508985102
Moritz MA Moody TJ Krawchuk MA Hughes M Hall A (2010) Spatial
variation in extreme winds predicts large wildfire locations in chaparral
ecosystems Geophysical Research Letters 37 L04801 doi101029
2009GL041735
Narayanaraj G Wimberly MC (2012) Influences of forest roads on the
spatial pattern of human- and lightning-caused wildfire ignitions
Applied Geography 32 878ndash888 doi101016JAPGEOG201109004
Pan LL Chen SH Cayan D Lin MY Hart Q Zhang MH Liu YB Wang
JZ (2011) Influences of climate change on California and Nevada
regions revealed by a high-resolution dynamical downscaling study
Climate Dynamics 37 2005ndash2020 doi101007S00382-010-0961-5
ParisienMA MoritzMA (2009) Environmental controls on the distribution
of wildfire at multiple spatial scales Ecological Monographs 79
127ndash154 doi10189007-12891
Perry GLW (1998) Current approaches to modelling the spread of wildland
fire a review Progress in Physical Geography 22 222ndash245
doi101177030913339802200204
Preisler HK Brillinger DR Burgan RE Benoit JW (2004) Probability
based models for estimation of wildfire risk International Journal of
Wildland Fire 13 133ndash142 doi101071WF02061
Pyne SJ (2001) lsquoFire a Brief Historyrsquo (University of Washington Press
Washington DC)
Pyne SJ Andrews PJ Laven RD (1996) lsquoIntroduction to Wildland Firersquo
2nd edn (Wiley New York)
R Development Core Team (2012) lsquoR a Language and Environment for
Statistical Computingrsquo (RFoundation for Statistical ComputingVienna
Austria)
Radeloff VC Hammer RB Stewart SI Fried JS Holcomb SS McKeefry
JF (2005) The wildland-urban interface in the United States Ecological
Applications 15 799ndash805 doi10189004-1413
Radeloff VC Stewart SI Hawbaker TJ Gimmi U Pidgeon AM Flather
CH Hammer RB Helmers DP (2010) Housing growth in and near
United States protected areas limits their conservation value Proceed-
ings of the National Academy of Sciences of the United States of America
107 940ndash945 doi101073PNAS0911131107
Spracklen DV Mickley LJ Logan JA Hudman RC Yevich R Flannigan
MD Westerling AL (2009) Impacts of climate change from 2000 to
2050 on wildfire activity and carbonaceous aerosol concentrations in the
western United States Journal of Geophysical Research 114 D20301
doi1010292008JD010966
Stephens SL (2005) Forest fire causes and extent on United States Forest
Service lands International Journal of Wildland Fire 14 213ndash222
doi101071WF04006
Stewart SI Radeloff VC Hammer RB Hawbaker TJ (2007) Defining the
wildlandndashurban interface Journal of Forestry 105 201ndash207
Strauss D Bednar L Mees R (1989) Do one percent of forest fires cause
ninety-nine percent of the damage Forest Science 35 319ndash328
Sugihara NG VanWagtendonk JW Fites-Kaufman J Shaffer KE Thode
AE (2006) The Future of Fire in Californiarsquos Ecosystems In lsquoFire in
Californiarsquos Ecosystemsrsquo (Eds N Sugihara J Van Wagtendonk KE
Shaffer J Fites-Kaufman AE Thode) pp 538ndash543 (The University of
California Press Berkeley CA)
Swetnam T Falk D Hessl A Farris C (2011) Reconstructing Landscape
Pattern of Historical Fires and Fire Regimes In lsquoThe Landscape Ecology
of Firersquo (Eds D McKenzie C Miller DA Falk) pp 165ndash192 (Springer
London)
Syphard A Radeloff V Keeley J Hawbaker T Clayton M Stewart S
Hammer R (2007) Human influence on California fire regimes Eco-
logical Applications 17 1388ndash1402 doi10189006-11281
Syphard A Radeloff V Keuler N Taylor R Hawbaker T Stewart S
Clayton M (2008) Predicting spatial patterns of fire on a southern
California landscape International Journal of Wildland Fire 17
602ndash613 doi101071WF07087
Syphard AD Keeley JE Massada AB Brennan TJ Radeloff VC (2012)
Housing arrangement and location determine the likelihood of housing
loss due to wildfire PLoS ONE 7 e33954 doi101371JOURNAL
PONE0033954
Syphard AD Bar Massada A Butsic V Keeley JE (2013) Land use
planning and wildfire development policies influence future probability
of housing loss PLoS ONE 8(8) e71708 doi101371JOURNAL
PONE0071708
US Census Bureau (2000) lsquoCensus 2000 TIGERLine Filesrsquo (US Census
Bureau Washington DC)
US Census Bureau (2001) lsquoCensus 2001 Population and Housing Block
GroupsShape Filesrsquo (US Census Bureau Washington DC)
US Census Bureau (2012) 2010 Census of Population and Housing
Population and Housing Unit Counts CPH-2-6 California (US Govern-
ment Printing OfficeWashington DC) Available at httpwwwcensus
govprodcen2010cph-2-6pdf [Verified 3 June 2014]
USDA Forest Service (2010) FIRESTAT GIS database of fire origins from
the US Department of Agriculture and Forest Service Available at
httpwwwfsfedusr5rslprojectsfrdblayersfirehtml [Verified 15
April 2013]
Vasconcelos MJP Silva S Tome M Alvim M Pereira JC (2001) Spatial
prediction of fire ignition probabilities comparing logistic regression
and neural networks Photogrammetric Engineering and Remote Sens-
ing 67 73ndash81
Verdu F Salas J Vega-Garcıa C (2012) A multivariate analysis of
biophysical factors and forest fires in Spain 1991ndash2005 International
Journal of Wildland Fire 21 498ndash509 doi101071WF11100
Westerling AL (2006) Warming and earlier spring increase western US
forest wildfire activity Science 313 940ndash943 doi101126SCIENCE
1128834
Westerling A Bryant B (2008) Climate change and wildfire in California
Climatic Change 87 231ndash249 doi101007S10584-007-9363-Z
Westerling A Bryant B Preisler H Hidalgo H Das T Shrestha S (2009)
Climate change growth and California wildfire California Energy
Commission Draft Paper (Sacramento CA)
Whelan RJ (1995) lsquoThe Ecology of Firersquo (Cambridge University Press
Cambridge UK)
Yang J HeHS Shifley SR Gustafson EJ (2007) Spatial patterns of modern
period human-caused fire occurrence in the Missouri Ozark Highlands
Forest Science 53 1ndash15
wwwpublishcsiroaujournalsijwf
Modelling ignition patterns in Southern California Int J Wildland Fire M
century (Cayan et al 2010 Pan et al 2011) and recent studieshave concluded that warmer temperatures are likely to increasethe duration and intensity of the wildfire season (Westerling
2006 Westerling and Bryant 2008)Existing models have emphasised the hydro-climate and
biophysical controls on fire (Bradstock et al 1998 Preisler
et al 2004 Spracklen et al 2009 Westerling et al 2009) andthere is a growing understanding of the relationship betweenhumans and ignitions patterns (Syphard et al 2008 Bar Massada
et al 2009 Narayanaraj and Wimberly 2012) SouthernCalifornia has an extensive wildlandndashurban interface (WUI)which accounts for nearly 60 of the landscape (Hammer et al2007) Humans influence fire in several ways including igni-
tion landscape fragmentation and fire suppression this com-plexity complicates efforts to predict fire risk (Perry 1998)Information on the relative importance of human v environ-
mental factors is currently inadequate for Southern Californiarsquoswildland fires (Pyne 2001 Haight et al 2004) Studies havereached a variety of divergent conclusions (Heyerdahl et al
2001 Keeley and Fotheringham 2001 Moritz 2003 Dicksonet al 2006) probably due in part to variation in fire character-istics at different temporal and spatial scales (Moritz et al 2005
Parisien and Moritz 2009 Jin et al 2014) Understanding thespatial distribution of ignition and the relative importance ofhuman v landscape controls will become increasingly impor-tant as climate changes theWUI expands and human influences
on fire regimes increase (Sugihara et al 2006 Westerling andBryant 2008)
Recent county-level studies in California found that ignition
frequency is significantly related to population density with thehighest number of fires observed at intermediate levels ofpopulation density and intermediate distances from the WUI
(Syphard et al 2007) Syphard et al (2008) analysed the spatialpatterns of fire ignitions in the Santa Monica Mountains andfound that ignition occurrence is correlated with distance tohuman infrastructure (ie to roads trails or housing develop-
ment) and slope and vegetation type whereas fire return intervalis explainedmainly by biophysical aspects related to climate andterrain (ie temperature aspect elevation and slope)
Further research is needed to quantify how human-relatedvariables and biophysical drivers constrain wildland fire at finespatial resolutions and over larger regional domains We per-
formed a spatial regression of a 30-year dataset of fire ignitionsusing human and biophysical explanatory variables Our speci-fic goals were to (i) assess the relative importance of possible
drivers (eg distance to roads or population density) on ignitionoccurrence and frequency (ii) develop statistical models of thespatial distribution of ignition occurrence and frequency and(iii) quantify howmuch of the spatial pattern of fire return times
can be explained by spatial variation in ignition Strategic fuelmanagement requires a better understanding of how landscapecharacteristics explain the likelihood of wildfires (Dellasala
et al 2004) Our results are intended to provide informationthat will help local fire management agencies identify andquantify ignition risk this information may prove useful for
optimising fire suppression resources or prevention planningOur results also carry ecological implications for the manage-ment of natural resources and protection of wildland ecosystems(Haidinger and Keeley 1993)
Data and methods
Study area
Our main study domain covers 23 500 km2 of wildland areaswithin USA National Forests in Santa Barbara Ventura LosAngeles San Bernardino Orange Riverside and San Diego
counties The United States Forest Service (USFS) has used theadministrative boundaries of National Forests as the spatialtemplate for recording fire ignition locations We therefore used
this layout to develop our model focusing on the Los PadresAngeles San Bernardino and Cleveland National Forests(Fig 1) Southern California experiences a Mediterranean cli-
mate with a long dry summer and a relatively short and mildrainy season (Bailey 1966) Contrasting patterns of temperatureand rainfall lead to a diverse range of vegetation associations
(Franklin 1998) Particularly widespread vegetation typesinclude chaparral open oakwoodland coastal sage scrub valleygrassland oak woodland and coniferous forest (Di Castri et al1981 Arroyo et al 1995 Davis and Richardson 1995) The
region experiences intense human pressure over 22 millionpeople lived in Southern California in 2010 and an extensiveroad network connects numerous communities (source US
CensusBureau 2012) California has8500miles (13700 km)of state and federal highways and the average road densitywithin the National Forests in 2000 was 13 kmkm2 (US
Census Bureau 2000)
Datasets fire ignitions and fire perimeters
We extracted the ignition records for 1980ndash2009 from the USFS
FIRESTAT database of individual fire incident reports (USDAForest Service 2010) This period overlapped with the avail-ability of information on human and biophysical factors andwas
chosen because earlier records were less reliable for ignitionlocation and date The location of fire origin was only specifiedto within 08 km for some fires This resulted in an artificialclustering of ignitions at 16-km intervals in some areas
Given this uncertainty we opted to carry out our analysis at a3 3-km resolution This resolution was chosen as a trade-offbetween higher resolution grids where ignition location error
had a larger effect and lower resolution grids where the loss ofspatial information reduced the usefulness of model predictionsfor management applications Grids of varying sizes from 1 to
5 km were tested in preliminary sensitivity analyses the 3-kmresolution yielded a large continuous range of ignition fre-quencies which aided model development A Mantel test con-
firmed there was no evidence of spatial autocorrelation at 3-kmresolution (rfrac140065 P 005) We added a 5-km externalbuffer to account for ignitions near the National Forest bound-aries We further reduced the noise in the data by excluding
ignitions that initiated fires less than 01 acres (400m2)ArcGIS desktop computer software (ArcGIS Desktop Envi-ronmental System Research Institute Redlands CA) was used
for all digital map analysesIn a final step we compared our ignition estimates with the
observed spatial patterns of fire frequency to quantify the role of
ignition frequency in explaining the local fire return intervalWe computed a fire frequency map using historical perimeterdata for fires larger than 100 acres (04 km2) compiled bythe California Department of Forestry and Fire Protectionrsquos Fire
B Int J Wildland Fire N Faivre et al
Resource Assessment Program (FRAP 2010) We calculatedfire frequency in each 3 3-km grid cell (ie number of fires
during the 1980ndash2009 period per square kilometre) weightingeach fire within a grid cell by its fractional burned area We alsoclassified these burns into Santa Ana and non-Santa Ana fires
based on the fire start date reported in the FRAP (2010) databaseand the time series of Santa Ana days following the approachdescribed by Jin et al (2014) Santa Ana days were identifiedwhen the north-easterly component of the daily mean wind
speed was greater than 6m s1 at the exit of the largest gapacross the Santa Monica Mountains (Hughes and Hall 2010)
Datasets human factors
Recent studies identified numerous predictors of the occurrenceof ignitions in densely populated areas (Syphard et al 2008Catry et al 2009 Martınez et al 2009) Fire ignitions recorded
over the last three decades tend to be clustered around trans-portation networks and near urban areas We therefore consid-ered five variables to describe the human footprint (1) distance
to a major road (2) distance to a minor road (3) road density(4) distance to low-density housing and (5) population density
We used the US Census Bureaursquos TIGER road data (Topo-logically Integrated Geographic Encoding and Referencing
US Census Bureau 2000) to estimate the road density per gridcell and the distance from cell centroid to nearest road High-ways and state roads were classified as major roads (Fig 2a)
whereas streets and vehicle trails were classified as minor
roads This differentiation helped account for traffic volumeas a controller of ignition
We computed average housing density for 1980ndash2009 basedon 1990 and 2000 US Census data (Hammer et al 2004 2007)(Fig 2b) The WUI is often defined as areas with less than 50
vegetation and at least one house per 40 acres (62 houses km2)that are located within 15miles (24 km) of an area over500 ha that is more than 75 vegetated (Stewart et al 2007)Assuming that ignitions most likely occur close to or within
interface and intermix communities (Syphard et al 2007 2008)we used the distance to the nearest housing area with a densitygreater than 62 housing units km2 as an indicator of the
proximity to the WUI (Fig 2b) In addition we used the WUIvector maps created by the USFS (Radeloff et al 2005) tocalculate the number of ignitions within and outside the WUI
areasFinally we used the best available fine-grained spatial
database on population demographics from the US CensusBureaursquos block group data for 2000 (US Census Bureau 2001)
to compute average population density per grid cell (Fig 2c)This variable captured the direct influence of human presencewithin and outside the National Forest boundaries All human
variables were summarised at 3-km resolution
Datasets biophysical factors
We considered ten variables that were related to topography
land cover and climate elevation slope south-westness forest
120W 119W 118W 117W 116W
35N
34N
33N
Fig 1 Study area in Southern California USA The broader domain encompasses seven counties (white lines) All ignition incidents
(red dots) recorded within National Forests boundaries (black dotted lines major model domain) during 1980ndash2009 were overlaid on a
30-m-resolution Landsat satellite image mosaic (source ESRI World Imagery database November 2012)
Modelling ignition patterns in Southern California Int J Wildland Fire C
cover shrubland cover grassland cover cover of other land
cover types annual average daily maximum temperatureannual average daily minimum temperature and cumulativewinter precipitation We used the 3-arc-second digital elevation
model from the US Geological Survey National ElevationDataset (NED) to calculate the slope and aspect for each3 3-km grid cell using ArcGIS software (Gesch et al 2002)
(Fig 2d ) Aspect was transformed trigonometrically to a south-facing index referred to as lsquosouth-westnessrsquo (cos(aspect ndash 2258))
following Beers et al (1966) This index provided a measure of
sun exposure and dryness within each grid cell Flat terrain witha slope of less than 58 was excluded from the aspect analysesWe assessed vegetation characteristics using themost recent and
comprehensive land cover dataset at 100-m resolution fromFRAP (2002) We classified the vegetation in the NationalForests into three major types lsquoshrublandrsquo (60 of the area)
lsquoforestwoodlandrsquo (22) and lsquograsslandrsquo (6) The remainingnon-vegetated land cover types were grouped as lsquootherrsquo and
Highways and state roads
Population density(residents km2)
Land use ndash Land cover
AgricultureBarren or otherDesertHardwoodndashconifer forestGrasslandShrublandUrbanWaterndashwetland
00ndash100100ndash500500ndash10001000ndash10 000
0 25 50 100 km
0 25 50 100 km
Housing density (1980ndash2009)(units km2)
Elevation (m)
75ndash00ndash500500ndash10001000ndash15001500ndash20002000ndash25002500ndash3000
0 25 50
Precipitation(mm SeptndashMarch)
0ndash150150ndash250250ndash350350ndash450450ndash550550ndash650
100 km
0 25 50 100 km
3000
0ndash5
(a) (b)
(c) (d )
(e) (f )
5ndash5050ndash750750ndash10 000
0 25 50 100 km0 25 50 100 km
Fig 2 Spatial maps of key human topographic and biophysical drivers including (a) major roads (b) housing density (c) population density
(d ) elevation (e) land cover and ( f ) mean annual winter (SeptemberndashMarch) precipitation
D Int J Wildland Fire N Faivre et al
included agricultural land urban desert wetland water andbarren (Fig 2e) We calculated the fraction of each class withineach 3 3-km grid cell The monthly averages of precipitation
and daily maximum andminimum temperature were taken fromthe gridded Parameter-Elevation Regressions on IndependentSlopes Model (PRISM) dataset at 800-m resolution (Daly et al
2002) In our analysis we summarised winter precipitation(SeptemberndashMarch Fig 2f ) and annual mean maximum andminimum temperatures for each 3 3-km cell over the 1981ndash2009 period
Model building logistic and Poisson regressions
Our input dataset consisted of the 15 explanatory variablesdescribed above which were spatially averaged within each3 3-kmgrid cell (Fig 3)We sought to determine the influence
of those predictors on two dependent variables (i) the occur-rence of ignition (presence or absence within a cell) and (ii) thefrequency of ignition (number of ignitions within a cell)
We used a logistic regression approach tomodel the presence
or absence of ignitions (Kleinbaum et al 2002 Hosmer andLemeshow 2005) Logistic regression has been used to success-fully model the probability of fire occurrence at a range of
geographic scales (Chou et al 1993 Chuvieco et al 1999Vasconcelos et al 2001) Logistic regression is expressed as
logitethpiTHORN frac14 lnpi
1 pi
frac14 a0 thorn b1x1i thorn thorn bjxji eth1THORN
where pi is the probability of an ignition in the cell i and xji is thevalue of the jth predictor in the cell i The underlying distributionis binomial and the logit function is defined as the natural
logarithm (ln) of the probability of ignition occurrenceWe found exponential relationships between the explanatory
variables and the number of ignitions (Fig 4) and thus used a
Poisson regression model (Agresti 2002) for ignition frequencyexpressed as
logethyTHORN frac14 a0 thorn b1x1i thorn thorn bjxji eth2THORN
Poisson models provide several advantages including the
ability to represent a skewed distribution and the restriction ofpredicted values to non-negative numbers (Gardner et al 1995)The Poisson probability distribution of observing any specific
count y for an outcome Y and where ı describes the average rateof ignitions is given by
PrethY frac14 yTHORN frac14 iyei
yeth3THORN
Model building variable selection and model validation
We sought to identify which variables were most important forcontrolling the spatial distribution of ignitions independent of
their interaction with other explanatory variables We firstexamined the correlation matrix among explanatory variables
11740W 11730W 11720W 11710W
3420N
3415N
3410N
San Bernardino
Legend
Housing density (units km2)
Land use ndash Land cover
Ignitions (1980ndash2009)
National forest boundaries
Major roads
Minor roads
0ndash5
5ndash50
50ndash750
750ndash10 000
Shrub
Tree
Desert
Urban
Agriculture
Other
Water
0 15 3 6 km
Fig 3 The distribution of ignitions roads and housing in the San Bernardino National Forest This subset of the study area shows the
3 3-km grid framework used to summarise ignitions data and associated predictors Observed ignitions (red triangles) between 1980
and 2009 were overlaid on GIS layers for roads housing density and land cover types
Modelling ignition patterns in Southern California Int J Wildland Fire E
for high pairwise correlations (Table 1) and then performedunivariate logistic and Poisson regressions for all predictorsusing the R statistical package (R Development Core Team2012 Table 2) We then developed logistic and Poisson
multiple regression models that included all significant terms(P 0001) based on the univariate regression analyses Theoriginal sample of 2625 grid cells (1483 with fire ignitions) was
randomly split into fitting and validation subsamples (70 30ratio) We sequentially selected the variables using a backwardstepwise selection procedure (R packageMASS Crawley 2005)
based on the Akaike Information Criterion (AIC Akaike 1974)The backward selection process started with the full model andsequentially excluded explanatory variables based initially onthe correlation with the response variable and other explanatory
variables We quantified the relative importance of retained
variables by estimating their percentage contribution to themodel goodness of fit (ie maximised log-likelihood)
Our goal was to develop simplified logistic and Poisson
models with a reduced set of explanatory variables as acompromise between model fit and model complexity Logisticnested models were compared and examined using inferential
and descriptive statistics We used the likelihood ratio test andthe Wald statistic to assess overall model fit and the respectivecontribution of individual predictors to fitted models Receiver
operating characteristic (ROC) analysis was performed to quan-tify the area under the curve (AUC) ndash ameasure of the predictivecapability of the logistic model to identify cells that had anignition eventWe also used the ROC curve to select the optimal
threshold probability or cut-off value for the probability thatan ignition would occur in a given cell Using the validationsamples we cross-validated the best multiple regression model
and built contingency tables of observed and expected responsesto evaluate model accuracy precision sensitivity and specific-ity (Hilbe 2009) As with the multiple logistic regression we
tested the significance of nested Poisson models and the signifi-cance of individual parameters using the likelihood ratio test andthe Wald statistic We also calculated Pearsonrsquos correlation
coefficients for validation samples between observed and pre-dicted values to assess model goodness of fit
Model building performance improvement
Poisson regression is a form of generalised linear models thatassumes the conditional variance to equal the conditional meanTherefore a Poisson model is usually too restrictive when
predicting count data which manifests as data over-dispersion(ie the variance exceeds the mean) or as estimates of consid-erably fewer zero counts than are actually observed in the
sample (Long 1997) As an alternative approach to Poissonregression we tested a negative binomial (NB) regression(Agresti 2002 Gelman and Hill 2007 Hardin and Hilbe 2007)which uses a dispersion parameter j to handle the variance
independent of the meanBased on their respective contributions to model fit we
restricted the number of predictors to a subset of four explana-
tory variables while ensuring model performance was notsignificantly altered We compared the performance of Poissonand NB models to ordinary linear regression using Pearsonrsquos
correlation coefficients the rootmean square error (RMSE) andthe percentage of bias between simulated and observed dataWe estimated how the four main predictors influenced
model performance by comparing the nested models to the4-parameters final model
Predictive ignition frequency mapping
We applied the resulting NB model to estimate the ignitionfrequency for all 3 3-km grids within the National Forest
boundaries and analysed the spatial distribution of the residualignition frequency We used the Pearson correlation coefficientto estimate how much of the spatial variability in fire frequencyderived from FRAP fire perimeter data was explained by the
predicted variability of ignitions within National Forestboundaries We also separately considered Santa Ana and non-Santa Ana fires following Jin et al (2014) to compare the
controls of ignition patterns on fire frequency for both fire types
0 5 10
Distance to infrastructure (km)
16
14
12
10
08
06
04
02
0
12
10
08
06
04
02
00 10 20 30 40 50 60 70 80 90 100
Slope percentage
Igni
tion
dens
ity (
num
ber
of ig
nitio
ns k
m
2 )
15
Housing
Major roads
Minor roads
20
(a)
(b)
Fig 4 Relationships between ignition density and (a) distance to human
infrastructure (major roads minor roads and low housing density) and
(b) slope percentage over the major study domain (ie National Forests)
Fig 4a was computed by averaging the distance between each ignition
location (FIRESTAT dataset) and the nearest human infrastructure within
each 3 3-km grid
F Int J Wildland Fire N Faivre et al
Results
Spatial distribution of fire ignitions
Most of the wildland fire ignitions in the National Forests during1980ndash2009 occurred nearmajor roads and close to urban housing(Figs 1ndash3) Ignition pointswere clustered around populated areasmajor infrastructure and highways implying a strong influence
by human factors (Fig 3) The WUI defined as areas wherehousing meets or intermingles with undeveloped wildlands(Stewart et al 2007) had particularly high ignition densities
(ie near the border of National Forests in Los Angeles San
Bernardino and Orange counties Figs 1ndash3) Ignitions were muchless frequent in sparsely populated areas such as Santa Barbaraand Ventura counties (Fig 1) The WUI covered only 5 of
National Forest area but accounted for 40 of ignitions Ignitiondensity was considerably higher within the WUI (06 ignitionskm2) than in more remote areas (003 ignitions km2)
A quantitative analysis of the relationship between ignitiondensity and human variables confirmed that ignitions were most
Table 1 Correlations among the 15 explanatory variables used in the analysis
The table indicates the Pearsonrsquos correlations between all independent variables Please refer to the main text for more information on individual variables
Interactions with significant correlations (P 0001) superior to 05 (inferior to 05 for negative correlations) are indicated in bold
dMajR
054 dminR
038 036 dHousing
042 043 036 Droad
022 018 022 08 Dpopulation
018 026 014 033 028 elevation
033 043 01 049 028 041 slope
003 007 015 009 015 016 001 south-westness
011 011 01 019 016 066 027 012 tree
025 019 013 042 031 016 031 019 2050 shrub
018 018 013 006 003 024 036 002 012 015 grass
032 025 031 066 052 032 046 013 029 2060 002 other
016 016 025 025 025 2081 011 016 2063 026 005 025 Tmin
018 025 014 031 021 2085 044 011 2067 016 017 038 069 Tmax
026 034 01 023 009 034 058 012 028 022 018 045 016 2051 Prec
Table 2 Univariate logistic and Poisson regression results for all variables influencing the occurrence and frequency of fire ignitions in Southern
California National Forests
Values and direction (ie positive or negative) of the coefficients indicate the influence of covariates (the driver variables) towards the response variables
(ignition occurrence or frequency)
Explanatory variable Fire occurrence (Logistic model) Fire frequency (Poisson model)
Binary response variable Continuous response variable
Coefficient P-value Coefficient P-value
Human accessibility
Distance to major roads (km) 011 0010 00001 015 0005 00001
Distance to minor roads (km) 032 0040 00001 041 0020 00001
Distance to housing (km) 005 0005 00001 007 0003 00001
Urban development
Population density (1000 persons km2) 0007 0004 009 0004 0001 001
Road density (km roads km2) 0006 0002 005 0017 0001 00001
Topography
Elevation (m) 044 0090 00001 001 0003 0001
Slope () 0007 0004 008 0004 0001 0001
South-westness (0ndash1) 014 0120 0225 007 004 005
Land cover types
Tree () 067 019 00001 03 006 0629
Shrub () 011 014 0436 012 004 005
Grass () 197 042 00001 146 018 0001
Others () 042 017 005 019 006 0001
Climate
Temperature maximum (8C) 003 001 005 002 0006 0001
Temperature minimum (8C) 004 002 005 004 0006 0001
Winter precipitation (mmyear1) 057 041 001 039 009 0001
Modelling ignition patterns in Southern California Int J Wildland Fire G
common near roadways and housing (Fig 4) Approximately60 of all ignitions occurred within 1 km of a major road andignition density declined with distance more rapidly fromminor
roads than from major roads (Fig 4) Approximately 75 ofignitions occurred within 5 km of areas with a density of housingunits greater than 62 km2 Ignition density peaked2 km and
decreased exponentially in areas further away from housing(Fig 4) Ignition density was highest in areas with intermediatelevels of topographic complexity with slopes between 20 and
40 (Fig 4)
Influence of human and biophysical variableson ignition occurrence
Univariate logistic regressions showed that all human-relatedvariables except population density were significant inexplaining ignition occurrence (P 005) (Table 2) Ignition
occurrence was positively correlated with road density andnegatively correlated with distance from major roads minorroads and low-density housing The presence or absence of
ignitions also was related to vegetation type with a significantlyhigher likelihood of ignition in forest and lower probability ingrassland and non-vegetated areas (Table 2) We estimated that
53 of 1980ndash2009 ignitions occurred in shrublands and 22 inforests (Fig 2e) Elevation was the only topographic variablesignificantly correlated with ignition occurrence the likelihoodof ignition increased with elevation Precipitation was signifi-
cantly correlated with ignition presence (Table 2)The final model based on stepwise backward selection had
10 significant variables (P 00001)
logitethpiTHORN frac14 465 012 dMajR thorn 0001 elev 003
dHousing thorn 204 shrub 022dminR thorn 188 treethorn 012
Tmax thorn 002 slopethorn 002 Droads 0002 Dpopulation
eth4THORNwhere dMajR is the distance tomajor roads (km) elev is elevation(m) dHousing is distance to nearest housing area with density
greater than 62 units km2 (km) shrub is the percentage coverof shrubland dminR is the distance to minor roads (km) tree isthe percentage cover of forest Tmax is the annual average dailymaximum temperature (8C) from 1980 to 2009 slope is the
percentage slopeDroads is road density (kilometres of roads persquare kilometre) and Dpopulation is population density (numberof persons per square kilometre) The analysis of modelled
variance indicated that not all variables contributed equally tothe model fit dMajR elev dHou shrub and dminR togetherexplained over 87 of the model variance (Fig 5a) The
variables tree slope Tmax and Tmin were highly correlatedwith elev (Table 1) and their contribution to the model mayhave been masked by the apparent strong influence ofelevation (Fig 5a) Likewise the contributions of Droads and
Dpopulation may have been masked by multicollinearities withdMajR dHousing shrub and dminR (Table 1 Fig 5a)
The ROC analysis using only the five strongest parameters
resulted in an AUC of 072 which indicated that the reducedmodel was reasonably able to distinguish where ignitions weremost likely to occur Our cross-validation demonstrated that the
model correctly predicted 67 of the observed distribution ofignition occurrence
Influence of human and biophysical variableson ignition frequency
We found that all variables related to human presence signifi-
cantly explained variability of ignition frequency (Table 2) Thevariables dMajR dHousing and dminR were the most influentialhuman factors for ignition frequency (Figs 5b 6) In contrast to
the logistic regression results all climate variables were sig-nificant and positively correlated with ignition frequencyIgnitions were more frequent in areas with warmer temperatures
and higher precipitation (Table 2) The slope and shrub coveralso had significant and positive influences on ignition fre-quency and contributed substantially to explaining the vari-
ability of ignition patterns (Table 2 Fig 5b) The final Poissonregression following backward selection retained all explana-tory variables (P 0001) except annual average daily mini-mum temperature
logethIgnitionsFREQTHORN frac14 438 014 dMajR 005 dHousing
thorn 002 slope 023 dminR thorn 113 shrubthorn 0001
elevthorn 015 Tmax thorn 002 Droads 0001 Dpopulation
thorn 084 precthorn 023 swindexthorn 067 tree
eth5THORN
(a)
40
30
Logistic model parameters
Con
trib
utio
n to
mod
el fi
t (
)
20
10
0
dMajR Elev
(b)
Poisson model parameters
50
40
30
20
10
50
0
dMaiR
dHou
sing
Slope
dminR
Shrub
ElevTm
ax
Droad
s
Dpopu
lation Pre
c
South
westn
ess
Tree
dHou
sing
Shrub
dminR Tre
eTm
ax
Slope
Droad
s
Dpopu
lation
Fig 5 Relative importance of explanatory variables as quantified by their
relative contribution tomodel ignition occurrence (a) and ignition frequency
(b) Variables are ranked by significance order estimated using automated
stepwise selection Significant variables included distance to major roads
(dMajR) distance to housing (dHousing) distance to minor roads (dminR)
population density (Dpopulation) road density (Droads) slope percentage
elevation tree and shrub cover annual average of daily maximum tempera-
ture (Tmax) cumulative winter precipitation (prec) and south-westness
index
H Int J Wildland Fire N Faivre et al
where dMajR dHousing slope dminR shrub elev Tmax Droad
Dpopulation and tree were defined as above prec is the annualaverage cumulative winter precipitation (SeptemberndashMarch)(mmyear1) and swindex is the south-westness index The
most influential predictors of ignitions frequency were dMajRdHousing slope and dminR these variables combined explained85 of model variance (Fig 5b) The comparison of Poisson
and NB models to a linear model showed a clear improvementof model performance with a reduced AIC value (Table 3) Thelinear model was inferior to the other models the estimatedcoefficients of linear regression showed significantly higher
standard errors (Table 3) Our results indicated that over-dispersion was better captured by the NB as the dispersionestimate was closer to 1 The NB model improved the fit
compared to the Poisson model with a significantly reducedbias while showing similar Pearson correlation and RMSEvalues (R2frac14 045 RMSEfrac14 279) (Fig 6) The form of the
model equation for NB regression was the same as that forPoisson regression
logethIgnitionsFREQTHORN frac14 097 011 dMajR 004 dHousing
thorn 003 slope 025 dminR
eth6THORN
The distance to major road alone explained 33 of the
observed spatial variance in ignition frequency distance tohousing and slope explained another 10 and distance tominorroads explained the remainder We caution that the primary
influence of the variables retained in the final Poisson modelmay be confounded bymulticollinearity (Table 1) For examplethe importance of slope may have been overestimated due to
implicit contributions from elev prec Tmax or land cover
Predictive mapping of ignition frequency
The spatial distribution of ignition frequency predicted using the
NB model showed good agreement with the observed ignitionpattern (R2frac14 045 Figs 6 7ab) The proximity to humaninfrastructure strongly determined ignition frequency (Fig 7b
Table 3) The model accurately captured the relative lack ofignitions in remote interior areas (eg Los Padres NationalForest) Likewise the model accurately predicted high ignition
frequency in many areas near major roads and housing (eg LosAngeles County) The model underestimated ignition frequencyalong high-traffic transportation corridors (eg Interstate 5) and
in close proximity to some populated urban areas (eg SanBernardino) (Fig 7c) Thus the variables used to predict igni-tion frequency (ie distance to major roads and distance tohousing) were insufficient for discriminating areas where
human pressure exceeded a certain threshold
Relationship between ignition frequency and fire frequency
We found a significant positive relationship between ignitionfrequency and fire frequency The gridded ignition frequencyobservations within National Forests explained 30 of the
spatial variance of observed fire frequency (P 0001nfrac14 2625) For this same domain the NBmodel explained 53of the observed fire frequency variance (P 0001) We foundthat many areas with a high potential risk of ignition did not burn
between 1980 and 2009 (Fig 8) indicating that a substantialcomponent of burned area variability was not explained by thedrivers of ignition
2
2
3
4
310
305
300
RM
SE
R2
Pea
rson
Bia
s
295
290
285
280
050
045
040
035
030
025
Linear Poisson Negative binomial
dMajR dHousing dMajR dHousing slope Full modeldMajR
1
1
0
(a)
(b)
(c)
Fig 6 Performance of reduced and full models with significant variables
successively added into linear Poisson and negative binomial regressions
Statistics shownwere (a) percentage bias relative to the observation (b) root
mean square error and (c) Pearson R2 Variables retained in the final models
included distance to major roads (dMajR) distance to housing (dHousing)
slope percentage and distance to minor roads (dminR)
Table 3 Summary of fitted regression models for ignition frequency
data
The top part of the table gives coefficient estimates (with standard errors) for
each explanatory variable The second portion of the table compares model
performance and reports the number of estimated parameters maximised
log-likelihood AIC criterion and estimates of dispersion after model fitting
Model predictors Linear model Generalised linear models
Poisson Negative binomial
(Intercept) 210 006 100 003 097 007
distance to major roads 083 008 014 0007 011 001
distance to housing 049 007 004 0003 004 0004
slope percentage 058 007 003 0001 003 0003
distance to minor roads 028 009 028 003 025 004
Degrees of freedom 5 5 6
log-likelihood 53223 41207 32234
AIC criterion 10 6567 82514 64467
Dispersion j ndash 343 078
Modelling ignition patterns in Southern California Int J Wildland Fire I
We repeated the previously described correlation analysis
separately for Santa Ana v non-Santa Ana fires (Jin et al 2014)Santa Ana fires accounted for 450 of total burned area acrossSouthern California and 180 of the number of fires over the
30-year study period For non-Santa Ana fires observed igni-tions explained 65 (P 0001) of observed fire frequency andthe estimated ignition patterns from the NB model explained
122 of fire frequency (P 0001)within theNational Forests
Ignitions were less important although significant in control-ling the spatial pattern of Santa Ana fires with observed andpredicted ignitions explaining 31 and 49 (P 0001) of
observed fire frequency
Discussion
Our modelling approach allowed us to identify the combinationof factors influencing the spatial distribution of ignitions Wefound that proximity to roads and housing were the dominant
controls for ignition frequency All variables describing humanaccessibility and urban development were significantly corre-lated with ignition frequency These results provided evidence
that human activities are the primary source of ignition inSouthern California and are consistent with studies that alsofound increased ignition frequency near transportation corridors
(Stephens 2005) and WUIs (Syphard et al 2007) Environ-mental variables resulted in a higher density of ignitions formid-level slopes and forest land cover types Past studies thatconsidered generalised linear models to predict the spatial dis-
tribution of ignition frequency arrived at similar conclusions(Yang et al 2007 Syphard et al 2008) Although topographicfeatures usually influence fire intensity (ie spread rate) and the
distribution of burns across the landscape (Beaty and Taylor2001 Alexander et al 2006) variations in elevation causevariations in fuel type moisture and phenology which in turn
control the conditions for fire ignition (Swetnam et al 2011)Our logistic approach confirmed that ignition occurrence ismoststrongly determined by distance to major roads and housing
elevation and the proportion of shrub cover Elevation may becapturing the secondary influence of temperature slope and treecover because these variables were collinear The logistic modelcaptured70 of ignition likelihood at 3-km resolution which
we considered satisfactory considering the heterogeneity andthe large area investigated Ignition occurrence was stronglyconditioned by fuel type with 75 of ignitions occurring in
forest and shrublandOur NB approach improved model performance over com-
monly used linear and Poisson models The NB model better
captured the clustering patterns of ignitions around urbandevelopment and transportation corridors with a reduced set of
(a) 120W
Observedignition frequency
0ndash0505ndash11ndash22ndash33ndash44ndash5
0 25 50 100 km
5
Predictedignition frequency
0ndash0505ndash11ndash22ndash33ndash44ndash55
Observed ndash predictedignition frequency
3ndash5
05ndash11ndash3
05ndash0505ndash11ndash33ndash5
119W 118W 117W 116W
(b) 120W 119W 118W 117W 116W
35N
34N
33N
35N
34N
33N
(c) 120W 119W 118W 117W 116W
35N
34N
33N
Fig 7 Spatial maps of ignition frequency in unit of numbers of ignitions
per grid cell across the National Forests at a 3-km resolution during 1980ndash
2009 as (a) recorded in the FIRESTAT database and (b) predicted by the
negative binomial model The residual ignition frequency (observation ndash
prediction) is shown in (c)
120W
Observed fire frequencynumber of fires per grid cell
0ndash0505ndash11ndash22ndash33ndash44ndash5
Major urban areas
0 25 50 100 km
5
119W 118W 117W 116W
35N
34N
33N
Fig 8 Historical area-weighted fire frequency in USFS lands based on
1980ndash2010 fire perimeters data (FRAP 2010)
J Int J Wildland Fire N Faivre et al
predictors Nevertheless locations with particularly high igni-tion frequency such as areas adjacent to major highways andparts of the WUI were underestimated It may be possible to
improve model accuracy in these areas by incorporating trafficvolume data as a proxy of human activity (wwwtraffic-countsdotcagov accessed 13 August 2013)
Besides the errors input to the underestimation of ignitionsfrequency two contrasting patterns of ignition merit discussiona peri-urban ignition pattern in counties with dense development
and a wildland ignition pattern in counties with sparse housingContrasting human influences on ignition patterns depending onhuman settlement density were reported by Badia-Perpinya andPallares-Barbera (2006) This partly explains why the scattered
patterns of ignition were more difficult to capture in more ruralareas Using a fragmentation index to describe the interspersionof human infrastructures within wildland areas may help to
refine model predictionsPredicted ignition frequency explained a small but signifi-
cant amount (ie 12) of the observed spatial patterns in non-
Santa Ana fire frequency within the National Forests Wildlandareas that are likely to experience greater numbers of ignitionscoincide with areas characterised by recurrent burning Never-
theless in more remote areas than the WUI such as Los PadresNational Forest where fuel fragmentation is not a limitingfactor fires tend to spread away from ignition sources and burnmore frequently (Syphard et al 2008) For Santa Ana fires the
lower correlation of ignition frequency to fire frequency sug-gested that the ignition controls on burned area patterns wereconsiderably weaker relative to other factors as compared to
non-Santa Ana fires As burned area per se is not a function ofignition probability only (Archibald et al 2009) additionalvariables related to fuel moisture fuel continuity fuel load
and wind speed (Moritz et al 2010) need to be considered formodelling burned area Similarly interactions between biophys-ical factors such as wind speed and precipitation or vegetationtype may need consideration given the environmental heteroge-
neity in the region Here we addressed single-term effects ofexplanatory variables as we sought to build a simplified modelof ignition frequency patterns Although we also investigated
quadratic and interactive terms between biophysical variablesand between human variables the results were not conclusiveAn important future step is to combine our estimates of ignition
frequency with other data sources to model the spatial distribu-tion of burned area using a similar framework
The predictive maps of ignition frequency generated in this
study are synthetic measures of the spatial influence of humanand environmental drivers on the current landscape An impor-tant related question is how ignition patterns will evolve duringfuture decades Increasing human influence through densifica-
tion and expansion of the WUI is expected to directly affect thewildland ignition regime (Hammer et al 2007 Radeloff et al2010) Californiarsquos population is projected to increase to 49
million in 2025 a 44 increase from 2000 Although mostpopulation growth will occur in urban centres housing densitywithin 10 km of wildlands is projected to increase by80 by
2030 in California (Miller et al 2011) We found distance tonearest housing area with density greater than 62 units km2
was the second most influential control of ignition risk As aconsequence of future housing growth at the periphery of rural
and wilderness areas it is likely that ignition risk will increaseTraffic trends are likely to follow the WUI expansion whichwould imply higher traffic volumes along fast-growing corri-
dors such as Ventura Orange and San Diego Counties (Craneet al 2002) Our analysis demonstrated that major roads carryhigher ignition risk than secondary roads As a result rising
traffic among highways such as Interstate 5 which crosses theLos Padres National Forest and Interstate 15 which contoursthe San Bernardino National Forest (Fig 3) will likely increase
the ignition rate in these areas Our approach may prove usefulfor both fire mitigation and urban planning For example it maybe used to project ignition risk based on projections of futureclimatic and human activity across Southern California
Acknowledgements
This study was supported by NASA Interdisciplinary Science grant
NNX10AL14G to the University of California Irvine We thank the USFS
and the California Department of Forestry and Fire Protection for providing
the compiled ignition and fire perimeter data We thank researchers from
UCIrsquos Earth System Science department for their comments on the earlier
version of the manuscript and two anonymous reviewers for their valuable
comments
References
Agee JK (1993) lsquoFire Ecology of Pacific Northwest Forestsrsquo (Island Press
Washington DC)
Agresti A (2002) lsquoCategorical Data Analysisrsquo (Wiley Hoboken NJ)
Akaike H (1974) A new look at the statistical model identification
Transactions on Automatic Control 19 716ndash723 doi101109TAC
19741100705
Alexander JD Seavy NE Ralph CJ Hogoboom B (2006) Vegetation and
topographical correlates of fire severity from two fires in the Klamathndash
Siskiyou region of Oregon and California International Journal of
Wildland Fire 15 237ndash245 doi101071WF05053
Archibald S RoyDP VanWilgenBW ScholesRJ (2009)What limits fire
An examination of drivers of burnt area in southern Africa Global
Change Biology 15 613ndash630 doi101111J1365-2486200801754X
Arroyo MTK Zedler PH Fox MD (1995) lsquoEcology and Biogeography
of Mediterranean Ecosystems in Chile California and Australiarsquo
(Springer London)
Badia-Perpinya A Pallares-Barbera M (2006) Spatial distribution of igni-
tions in Mediterranean periurban and rural areas the case of Catalonia
International Journal of Wildland Fire 15 187ndash196 doi101071
WF04008
Bailey HP (1966) lsquoThe Climate of Southern Californiarsquo (University of
California Press Berkeley CA)
Bar Massada A Radeloff VC Stewart SI Hawbaker TJ (2009) Wildfire
risk in the wildlandndashurban interface a simulation study in northwestern
Wisconsin Forest Ecology and Management 258 1990ndash1999
doi101016JFORECO200907051
Beaty RM Taylor AH (2001) Spatial and temporal variation of fire regimes
in a mixed conifer forest landscape Southern Cascades California
USA Journal of Biogeography 28 955ndash966 doi101046J1365-2699
200100591X
Beers TW Dress PE Wensel LC (1966) Aspect transformation in site
productivity research Journal of Forestry 64 691ndash692
BradstockRA Gill AM KennyBJ Scott J (1998) Bushfire risk at the urban
interface estimated from historical weather records consequences
for the use of prescribed fire in the Sydney region of south-eastern
Australia Journal of Environmental Management 52 259ndash271
doi101006JEMA19970177
Modelling ignition patterns in Southern California Int J Wildland Fire K
Callaway R Davis F (1993) Vegetation dynamics fire and the physical
environment in coastal central California Ecology 74 1567ndash1578
doi1023071940084
Catry FX Rego FC Bacao FL Moreira F (2009) Modeling and mapping
wildfire ignition risk in Portugal International Journal of Wildland Fire
18 921ndash931 doi101071WF07123
Cayan DR Maurer EP DettingerMD TyreeM Hayhoe K (2008) Climate
change scenarios for the California region Climatic Change 87 21ndash42
doi101007S10584-007-9377-6
Cayan DR Das T Pierce DW Barnett TP Tyree M Gershunov A (2010)
Future dryness in the southwest US and the hydrology of the early 21st
century droughtProceedings of the National Academy of Sciences of the
United States of America 107 21 271ndash21 276 doi101073PNAS
0912391107
ChouY MinnichR ChaseR (1993)Mapping probability of fire occurrence
in San JacintoMountains California USAEnvironmentalManagement
17 129ndash140 doi101007BF02393801
Chuvieco E Salas FJ Carvacho L Rodriguez-Silva F (1999) Integrated fire
riskmapping In lsquoRemote Sensing of LargeWildfiresrsquo (Ed E Chuvieco)
pp 61ndash100 (Springer Berlin)
Countryman CM (1972) The fire environment concept USDA Forest
Service Pacific Southwest Forest and Ranger Experiment Station
Technical Paper (Berkeley CA) Available at httpwwwfiremodels
orgdownloadsbehavepluspublicationsCountrymanCountryman_1972_
TheFireEnvironmentConcept_ocrpdf [Verified 13 August 2013]
Crane R Valenzuela A Jr Chatman D Schweitzer L Wong P (2002)
California Travel Trends and Demographics Study University of
California Los Angeles Institute of Transportation Studies School
of Public Policy and Social Research Final Report 74A0034
(Los Angeles CA)
Crawley MJ (2005) Multiple regression In lsquoStatistics An Introduction
using Rrsquo pp 195ndash208 (Wiley Hoboken NJ)
Daly C Gibson WP Taylor GH Johnson GL Pasteris P (2002) A
knowledge-based approach to the statisticalmapping of climateClimate
Research 22 99ndash113 doi103354CR022099
Davis GW Richardson DM (1995) lsquoMediterranean-type Ecosystems the
Function of Biodiversityrsquo (Springer London)
Dellasala DA Williams JE Williams CD Franklin JF (2004) Beyond
smoke and mirrors a synthesis of fire policy and science Conservation
Biology 18 976ndash986 doi101111J1523-1739200400529X
Di Castri F Goodall DW Specht RL (1981) lsquoMediterranean-type Shrub-
landsrsquo (Elsevier Amsterdam)
Dickson BG Prather JW Xu Y Hampton HM Aumack EN Sisk TD
(2006) Mapping the probability of large fire occurrence in northern
Arizona USA Landscape Ecology 21 747ndash761 doi101007S10980-
005-5475-X
Franklin J (1998) Predicting the distribution of shrub species in southern
California from climate and terrain-derived variables Journal of Vege-
tation Science 9 733ndash748 doi1023073237291
FRAP (2002) California Department of Forestry ndash Fire and Resource
Assessment ProgramMulti-source Land Cover data Available at http
frapcdfcagovdatafrapgisdatadownloadasprec=fveg02_2 [Verified
9 May 2013]
FRAP (2010) California Department of Forestry ndash Fire and Resource
Assessment ProgramGIS database of fire perimeter polygons Available
at httpfrapcdfcagovdatafrapgisdatadownloadasprec=fire [Veri-
fied 9 May 2013]
Gardner W Mulvey EP Shaw EC (1995) Regression analyses of counts
and rates Poisson overdispersed Poisson and negative binomial mod-
els Psychological Bulletin 118 392ndash404 doi1010370033-2909118
3392
Gelman A Hill J (2007) lsquoData Analysis using Regression and Multilevel
Hierarchical Modelsrsquo (Cambridge University Press Cambridge UK)
GeschD OimoenM Greenlee S Nelson C SteuckM Tyler D (2002) The
national elevation dataset Photogrammetric Engineering and Remote
Sensing 68 5ndash11
Haidinger TL Keeley JE (1993) Role of high fire frequency in destruction
of mixed chaparral Madrono 40 141ndash147
Haight RG Cleland DT Hammer RB Radeloff VC Rupp TS (2004)
Assessing fire risk in the wildland-urban interface Journal of Forestry
102 41ndash48
Hammer RB Stewart SI Winkler RL Radeloff VC Voss PR (2004)
Characterizing dynamic spatial and temporal residential density patterns
from 1940ndash1990 across the North Central United States Landscape and
Urban Planning 69 183ndash199 doi101016JLANDURBPLAN2003
08011
Hammer RB Radeloff VC Fried JS Stewart SI (2007) Wildlandndashurban
interface housing growth during the 1990s in California Oregon and
Washington International Journal of Wildland Fire 16 255ndash265
doi101071WF05077
Hardin JW Hilbe J (2007) lsquoGeneralized Linear Models and Extensionsrsquo
(StataCorp Press College Station TX)
Heyerdahl EK Brubaker LB Agee JK (2001) Spatial controls of historical
fire regimes a multiscale example from the interior west USA
Ecology 82 660ndash678 doi1018900012-9658(2001)082[0660
SCOHFR]20CO2
Hilbe JM (2009) lsquoLogistic Regression Modelsrsquo (Chapman amp HallCRC
Boca Raton FL)
Hosmer DW Lemeshow S (2005) Introduction to the Logistic Regression
Model In lsquoApplied Logistic Regressionrsquo 2nd edn pp 1ndash30 (Wiley
Hoboken NJ)
HughesM Hall A (2010) Local and synopticmechanisms causing Southern
Californiarsquos Santa Ana winds Climate Dynamics 34 847ndash857
doi101007S00382-009-0650-4
Jin Y Randerson JT Faivre N Capps S Hall A Goulden ML (2014)
Contrasting controls on wildland fires in Southern California during
periods with and without Santa Ana winds Journal of Geophysical
Research ndash Biogeosciences 119 432ndash450 doi1010022013JG002541
Keeley JE (1982) Distribution of lightning- and man-caused wildfires in
California In lsquoProceedings of the International Symposium on the
Dynamics and Management of Mediterranean Type Ecosystemsrsquo 22ndash
26 June 1981 San Diego CA (Eds CE Conrad WC Oechel) USDA
Forest Service Pacific Southwest Forest and Range Experiment Station
General Technical Report PSW-GTR-058 pp 431ndash437 (Berkeley CA)
Keeley J FotheringhamC (2001)Historic fire regime in southernCalifornia
shrublands Conservation Biology 15 1536ndash1548 doi101046J1523-
1739200100097X
Keeley JE Zedler PH (2009) Large high intensity fire events in southern
California shrublands debunking the fine-grained age-patch model
Ecological Applications 19 69ndash94 doi10189008-02811
Keeley J Fotheringham C Morais M (1999) Reexamining fire suppres-
sion impacts on brushland fire regimes Science 284 1829ndash1832
doi101126SCIENCE28454211829
Keeley JE Safford H Fotheringham CJ Franklin J Moritz M (2009) The
2007 Southern California wildfires lessons in complexity Journal of
Forestry 107 287ndash296
Kleinbaum DG Klein M Pryor ER (2002) lsquoLogistic Regression a Self-
Learning Textrsquo (Springer New York)
Long JS (1997) lsquoRegression models for categorical and limited dependent
variablesrsquo (SAGE Publications Inc Thousand Oaks CA)
Martınez J Vega-Garcia C Chuvieco E (2009) Human-causedwildfire risk
rating for prevention planning in Spain Journal of Environmental
Management 90 1241ndash1252 doi101016JJENVMAN200807005
Miller C Abatzoglou J Brown T Syphard A (2011) Wilderness Fire Manage-
ment in a Changing Environment In lsquoThe Landscape Ecology of Firersquo
(Eds D McKenzie C Miller DA Falk) pp 269ndash294 (Springer London)
L Int J Wildland Fire N Faivre et al
Moritz MA (2003) Spatiotemporal analysis of controls on shrubland fire
regimes age dependency and fire hazard Ecology 84 351ndash361
doi1018900012-9658(2003)084[0351SAOCOS]20CO2
Moritz MA Morais ME Summerell LA Carlson J Doyle J (2005)
Wildfires complexity and highly optimized tolerance Proceedings of
the National Academy of Sciences of the United States of America 102
17 912ndash17 917 doi101073PNAS0508985102
Moritz MA Moody TJ Krawchuk MA Hughes M Hall A (2010) Spatial
variation in extreme winds predicts large wildfire locations in chaparral
ecosystems Geophysical Research Letters 37 L04801 doi101029
2009GL041735
Narayanaraj G Wimberly MC (2012) Influences of forest roads on the
spatial pattern of human- and lightning-caused wildfire ignitions
Applied Geography 32 878ndash888 doi101016JAPGEOG201109004
Pan LL Chen SH Cayan D Lin MY Hart Q Zhang MH Liu YB Wang
JZ (2011) Influences of climate change on California and Nevada
regions revealed by a high-resolution dynamical downscaling study
Climate Dynamics 37 2005ndash2020 doi101007S00382-010-0961-5
ParisienMA MoritzMA (2009) Environmental controls on the distribution
of wildfire at multiple spatial scales Ecological Monographs 79
127ndash154 doi10189007-12891
Perry GLW (1998) Current approaches to modelling the spread of wildland
fire a review Progress in Physical Geography 22 222ndash245
doi101177030913339802200204
Preisler HK Brillinger DR Burgan RE Benoit JW (2004) Probability
based models for estimation of wildfire risk International Journal of
Wildland Fire 13 133ndash142 doi101071WF02061
Pyne SJ (2001) lsquoFire a Brief Historyrsquo (University of Washington Press
Washington DC)
Pyne SJ Andrews PJ Laven RD (1996) lsquoIntroduction to Wildland Firersquo
2nd edn (Wiley New York)
R Development Core Team (2012) lsquoR a Language and Environment for
Statistical Computingrsquo (RFoundation for Statistical ComputingVienna
Austria)
Radeloff VC Hammer RB Stewart SI Fried JS Holcomb SS McKeefry
JF (2005) The wildland-urban interface in the United States Ecological
Applications 15 799ndash805 doi10189004-1413
Radeloff VC Stewart SI Hawbaker TJ Gimmi U Pidgeon AM Flather
CH Hammer RB Helmers DP (2010) Housing growth in and near
United States protected areas limits their conservation value Proceed-
ings of the National Academy of Sciences of the United States of America
107 940ndash945 doi101073PNAS0911131107
Spracklen DV Mickley LJ Logan JA Hudman RC Yevich R Flannigan
MD Westerling AL (2009) Impacts of climate change from 2000 to
2050 on wildfire activity and carbonaceous aerosol concentrations in the
western United States Journal of Geophysical Research 114 D20301
doi1010292008JD010966
Stephens SL (2005) Forest fire causes and extent on United States Forest
Service lands International Journal of Wildland Fire 14 213ndash222
doi101071WF04006
Stewart SI Radeloff VC Hammer RB Hawbaker TJ (2007) Defining the
wildlandndashurban interface Journal of Forestry 105 201ndash207
Strauss D Bednar L Mees R (1989) Do one percent of forest fires cause
ninety-nine percent of the damage Forest Science 35 319ndash328
Sugihara NG VanWagtendonk JW Fites-Kaufman J Shaffer KE Thode
AE (2006) The Future of Fire in Californiarsquos Ecosystems In lsquoFire in
Californiarsquos Ecosystemsrsquo (Eds N Sugihara J Van Wagtendonk KE
Shaffer J Fites-Kaufman AE Thode) pp 538ndash543 (The University of
California Press Berkeley CA)
Swetnam T Falk D Hessl A Farris C (2011) Reconstructing Landscape
Pattern of Historical Fires and Fire Regimes In lsquoThe Landscape Ecology
of Firersquo (Eds D McKenzie C Miller DA Falk) pp 165ndash192 (Springer
London)
Syphard A Radeloff V Keeley J Hawbaker T Clayton M Stewart S
Hammer R (2007) Human influence on California fire regimes Eco-
logical Applications 17 1388ndash1402 doi10189006-11281
Syphard A Radeloff V Keuler N Taylor R Hawbaker T Stewart S
Clayton M (2008) Predicting spatial patterns of fire on a southern
California landscape International Journal of Wildland Fire 17
602ndash613 doi101071WF07087
Syphard AD Keeley JE Massada AB Brennan TJ Radeloff VC (2012)
Housing arrangement and location determine the likelihood of housing
loss due to wildfire PLoS ONE 7 e33954 doi101371JOURNAL
PONE0033954
Syphard AD Bar Massada A Butsic V Keeley JE (2013) Land use
planning and wildfire development policies influence future probability
of housing loss PLoS ONE 8(8) e71708 doi101371JOURNAL
PONE0071708
US Census Bureau (2000) lsquoCensus 2000 TIGERLine Filesrsquo (US Census
Bureau Washington DC)
US Census Bureau (2001) lsquoCensus 2001 Population and Housing Block
GroupsShape Filesrsquo (US Census Bureau Washington DC)
US Census Bureau (2012) 2010 Census of Population and Housing
Population and Housing Unit Counts CPH-2-6 California (US Govern-
ment Printing OfficeWashington DC) Available at httpwwwcensus
govprodcen2010cph-2-6pdf [Verified 3 June 2014]
USDA Forest Service (2010) FIRESTAT GIS database of fire origins from
the US Department of Agriculture and Forest Service Available at
httpwwwfsfedusr5rslprojectsfrdblayersfirehtml [Verified 15
April 2013]
Vasconcelos MJP Silva S Tome M Alvim M Pereira JC (2001) Spatial
prediction of fire ignition probabilities comparing logistic regression
and neural networks Photogrammetric Engineering and Remote Sens-
ing 67 73ndash81
Verdu F Salas J Vega-Garcıa C (2012) A multivariate analysis of
biophysical factors and forest fires in Spain 1991ndash2005 International
Journal of Wildland Fire 21 498ndash509 doi101071WF11100
Westerling AL (2006) Warming and earlier spring increase western US
forest wildfire activity Science 313 940ndash943 doi101126SCIENCE
1128834
Westerling A Bryant B (2008) Climate change and wildfire in California
Climatic Change 87 231ndash249 doi101007S10584-007-9363-Z
Westerling A Bryant B Preisler H Hidalgo H Das T Shrestha S (2009)
Climate change growth and California wildfire California Energy
Commission Draft Paper (Sacramento CA)
Whelan RJ (1995) lsquoThe Ecology of Firersquo (Cambridge University Press
Cambridge UK)
Yang J HeHS Shifley SR Gustafson EJ (2007) Spatial patterns of modern
period human-caused fire occurrence in the Missouri Ozark Highlands
Forest Science 53 1ndash15
wwwpublishcsiroaujournalsijwf
Modelling ignition patterns in Southern California Int J Wildland Fire M
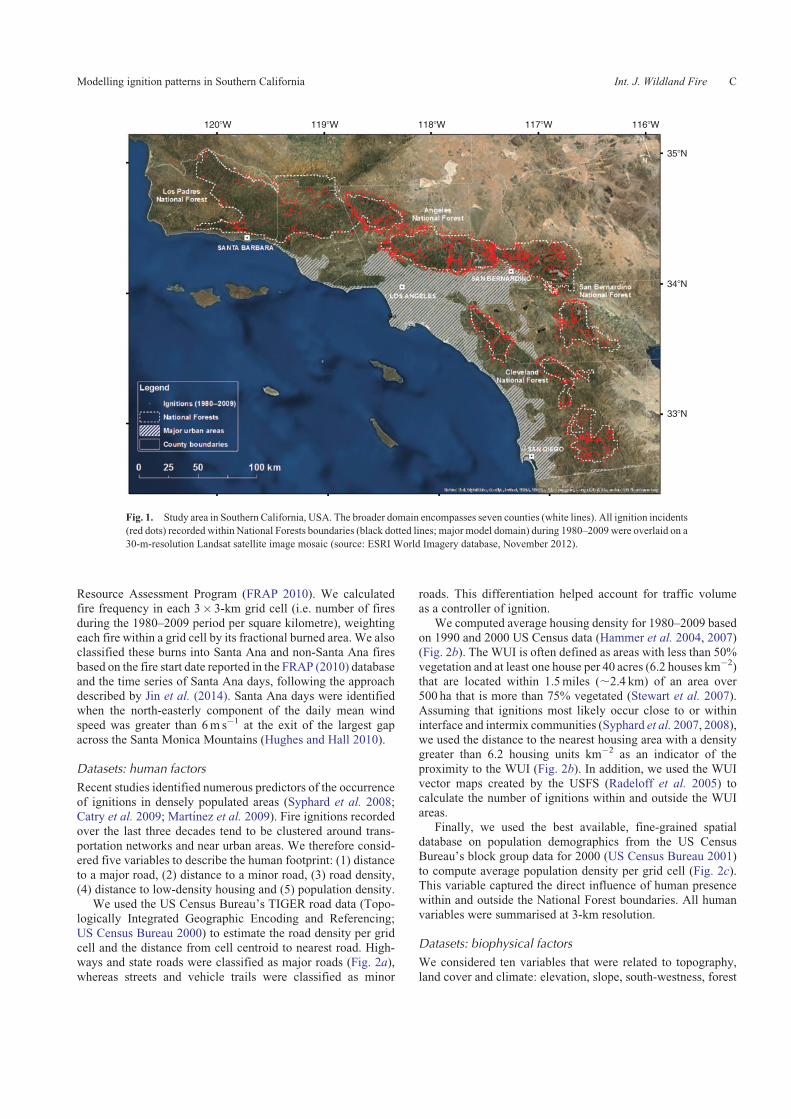
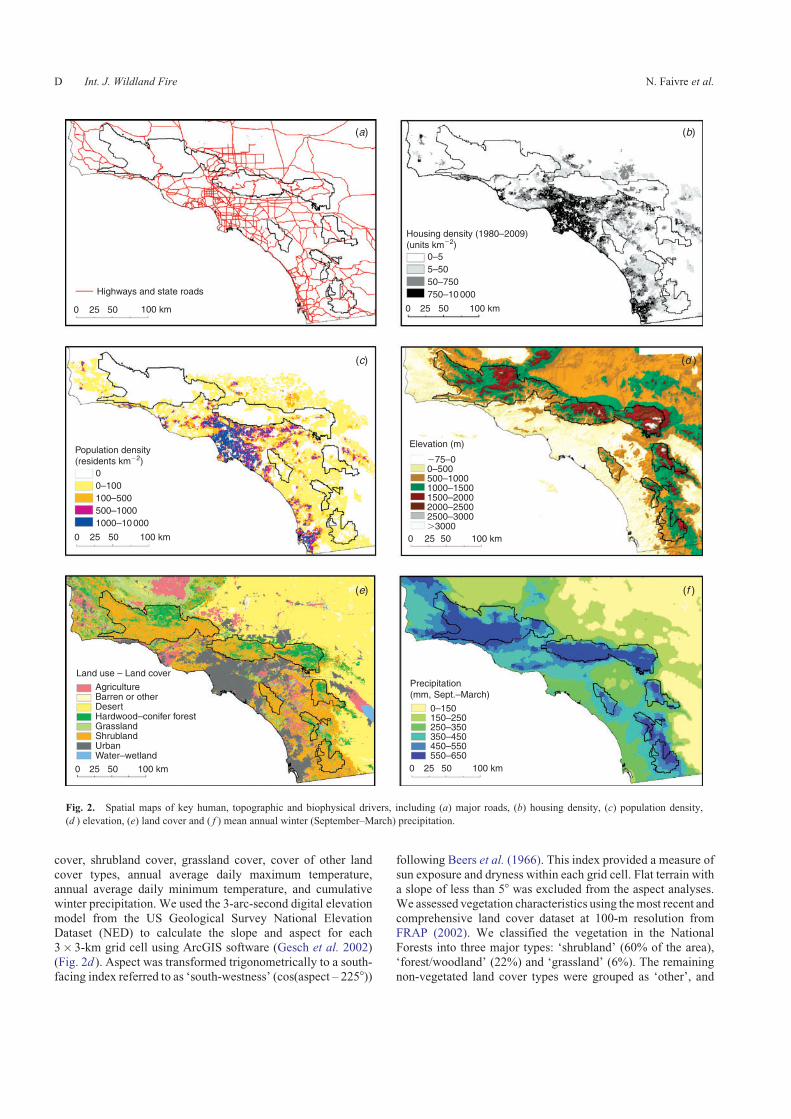
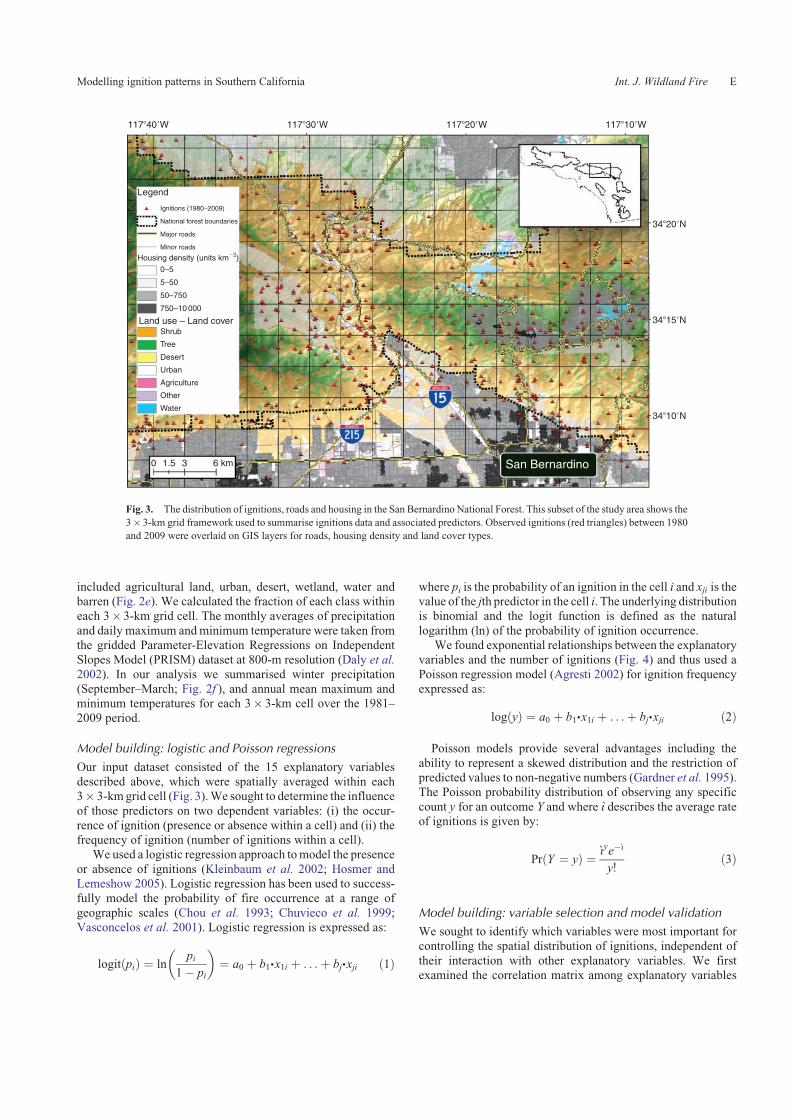
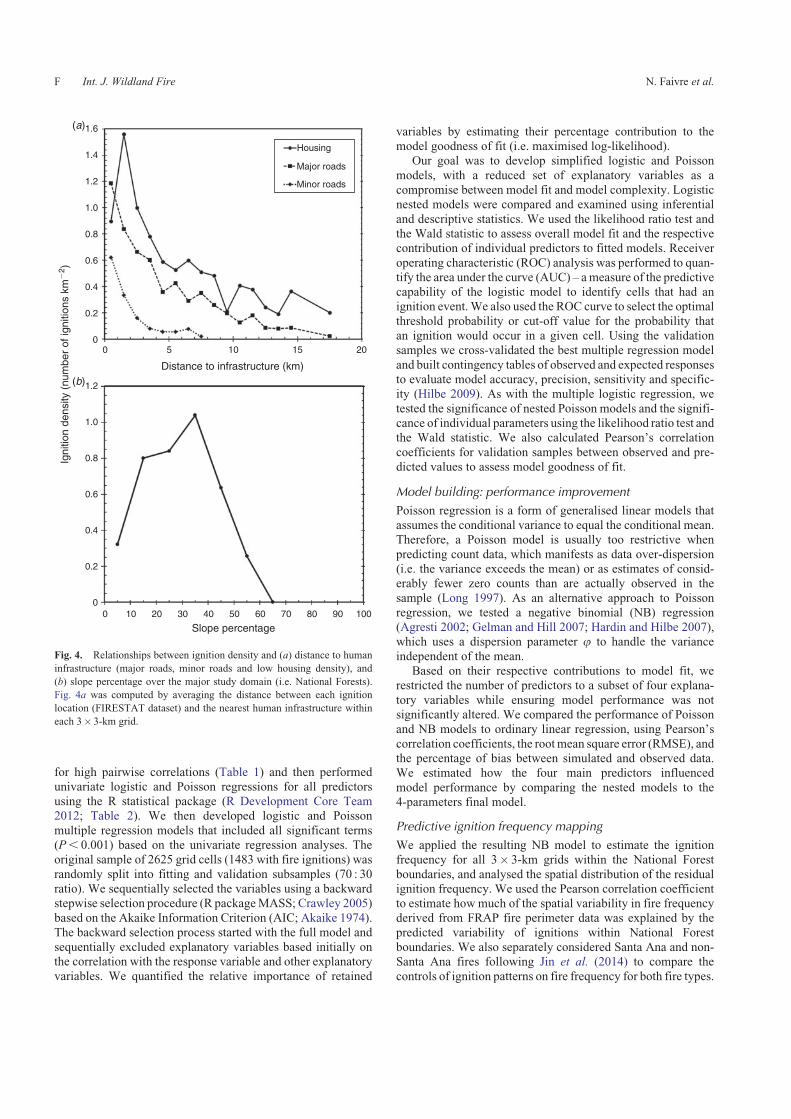
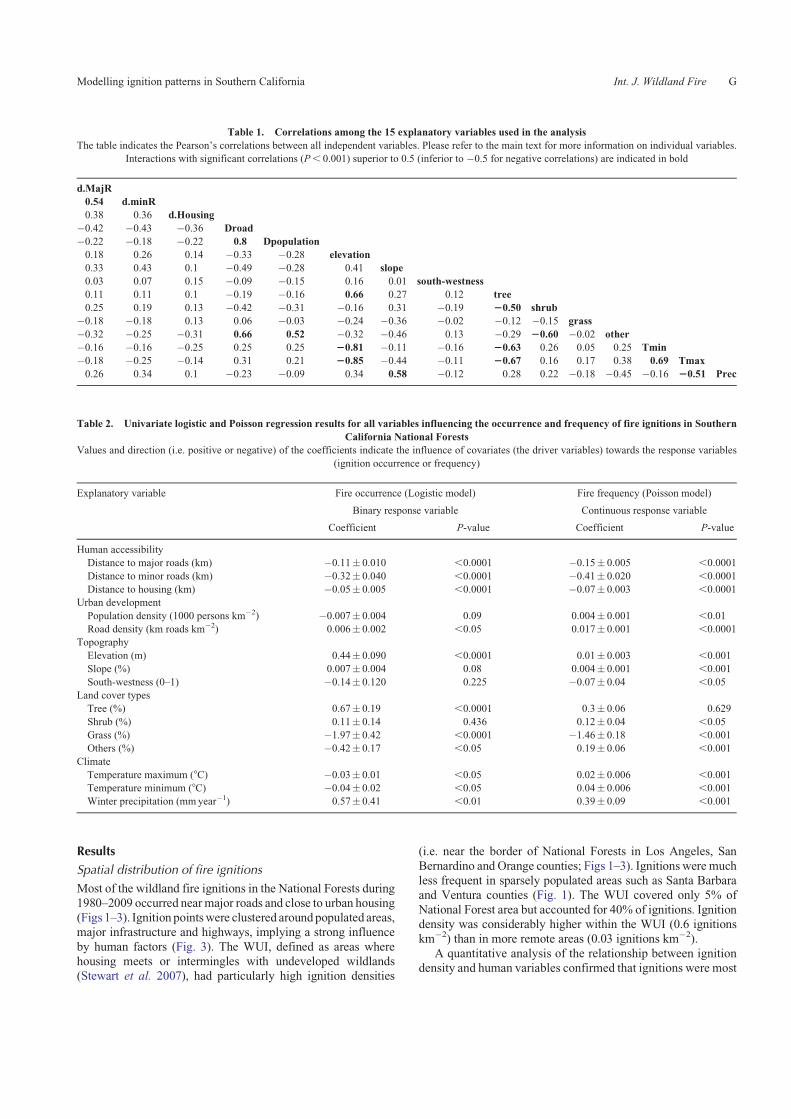
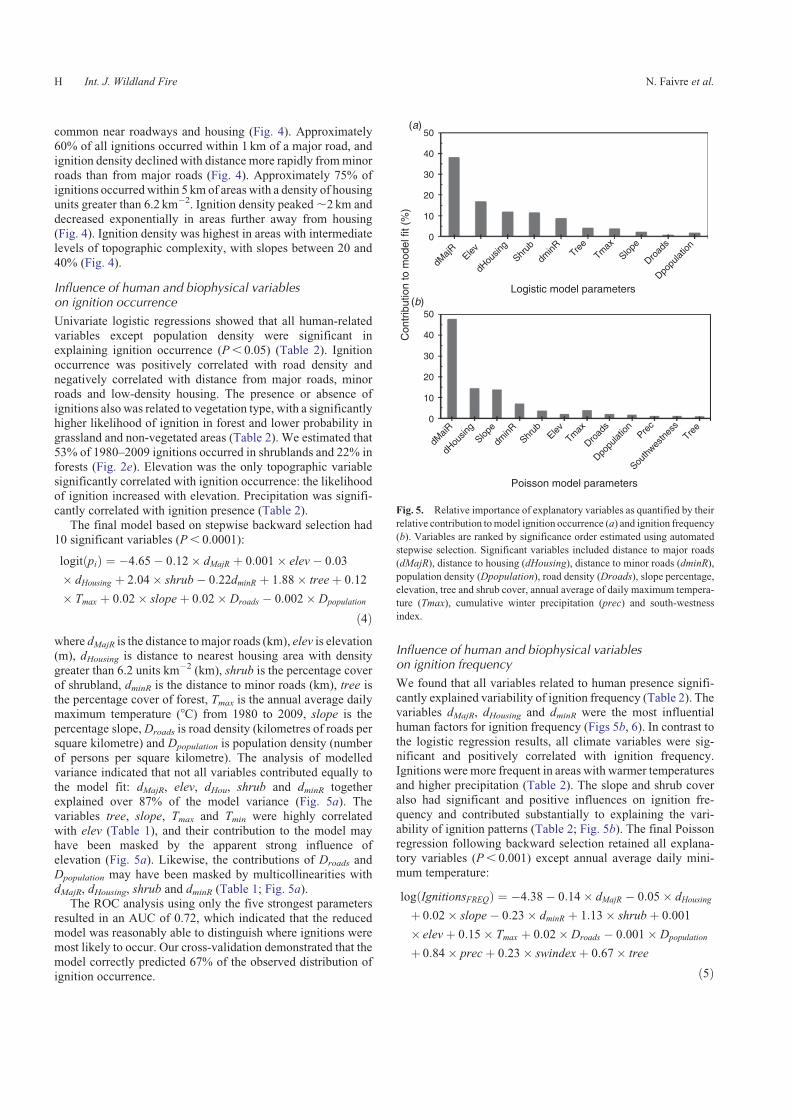
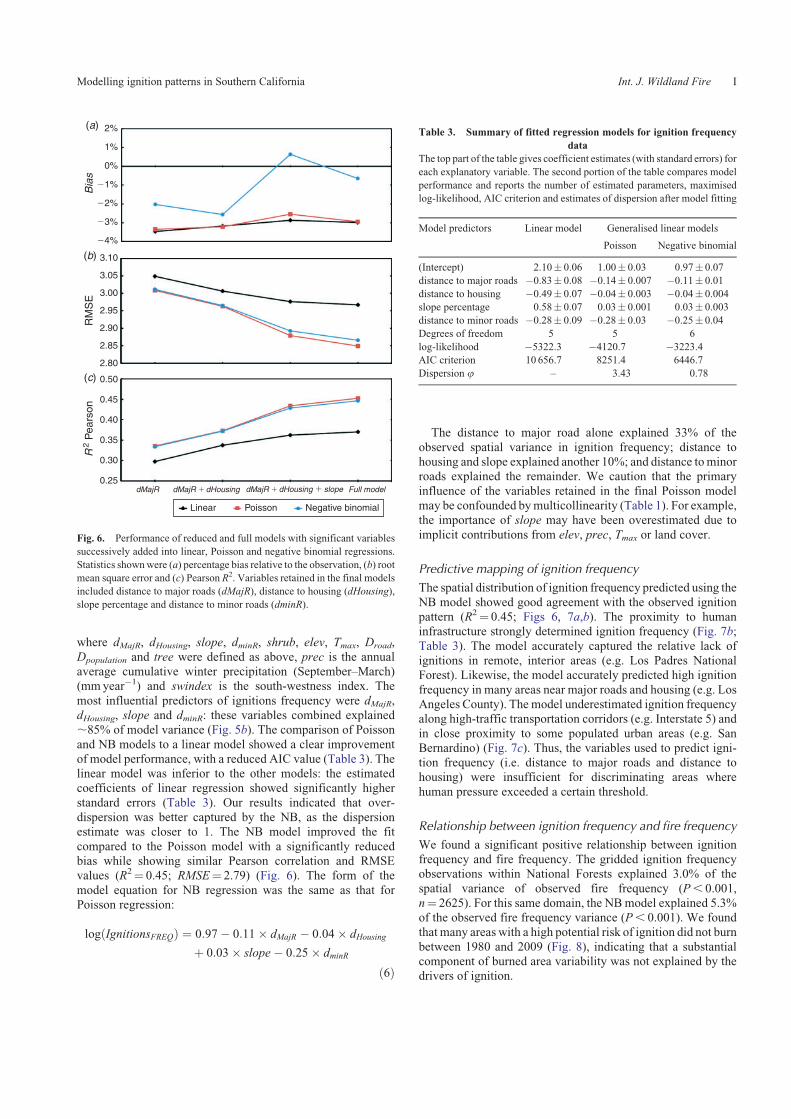
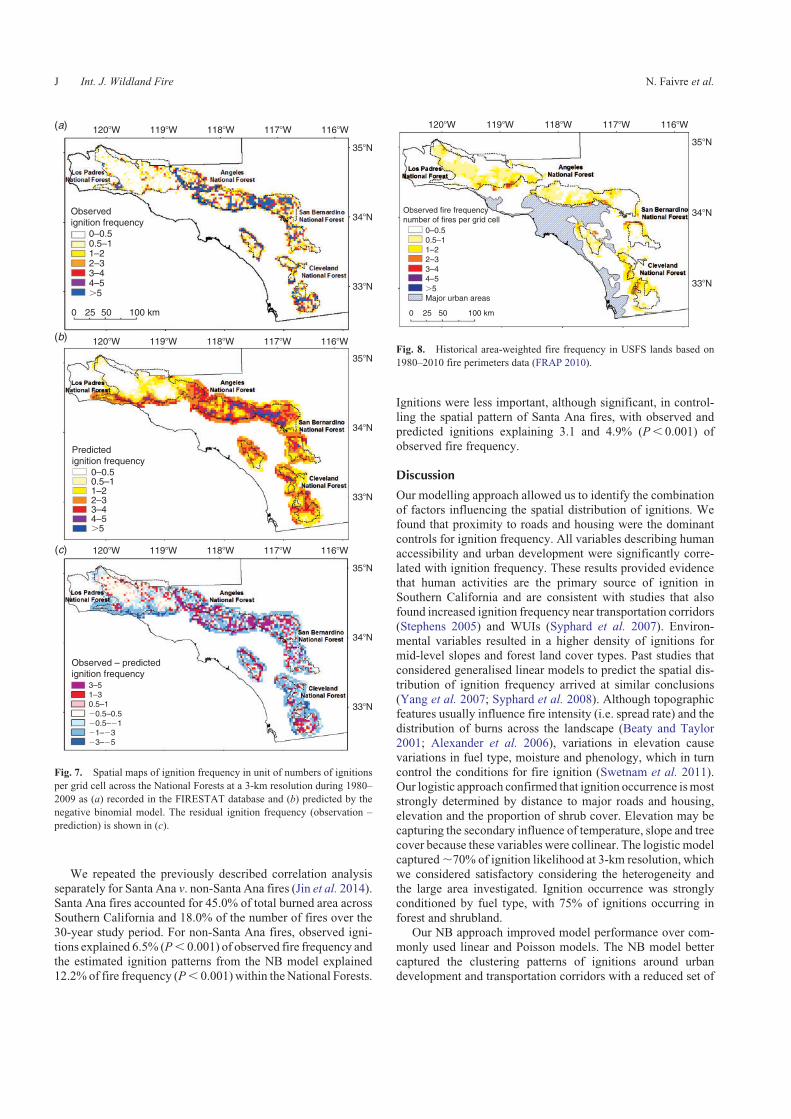
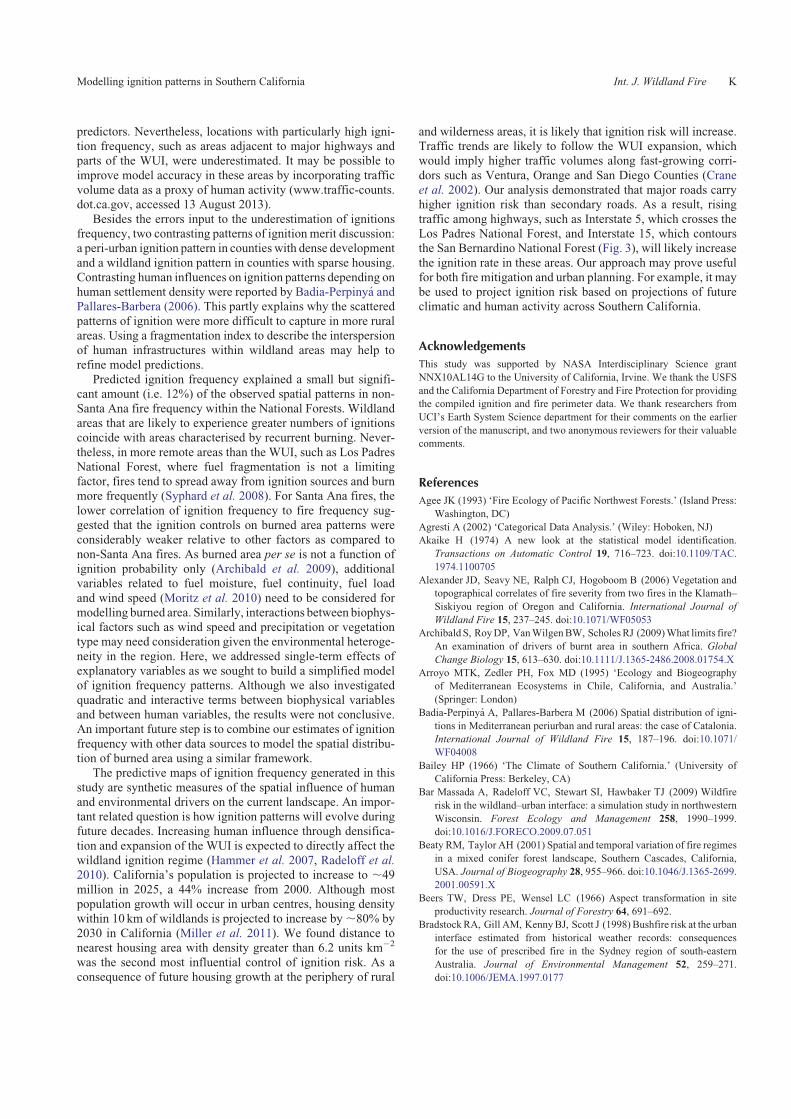
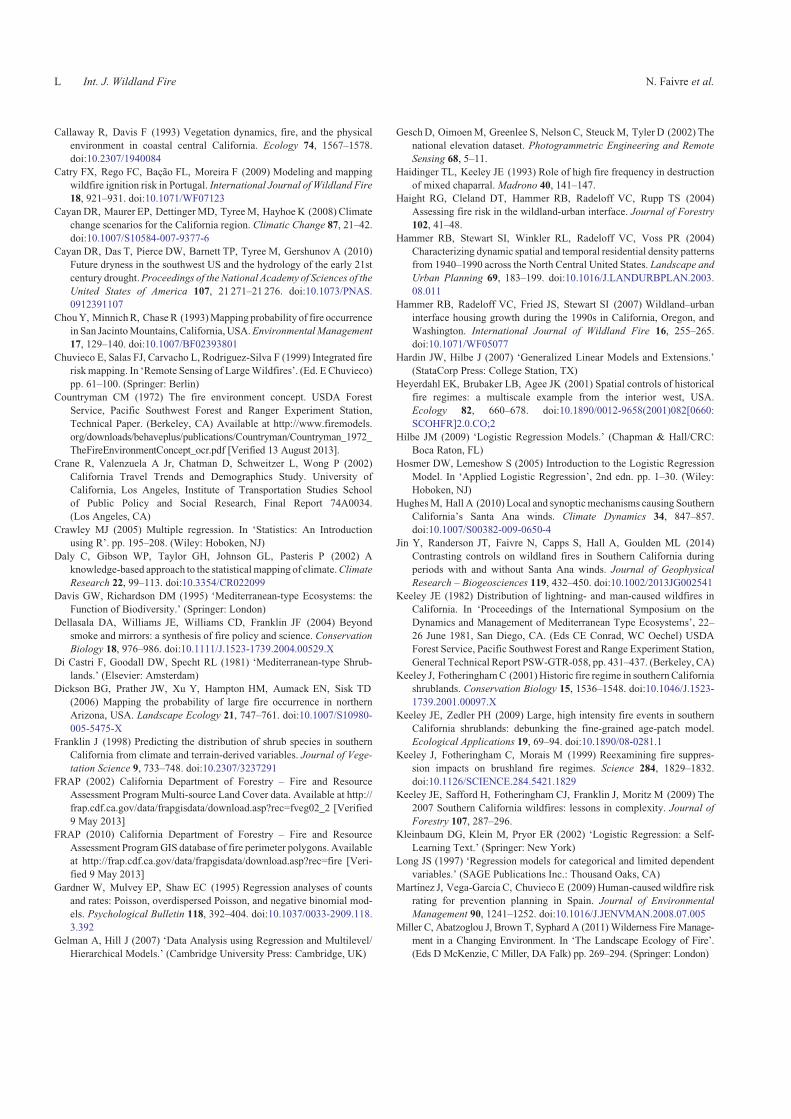